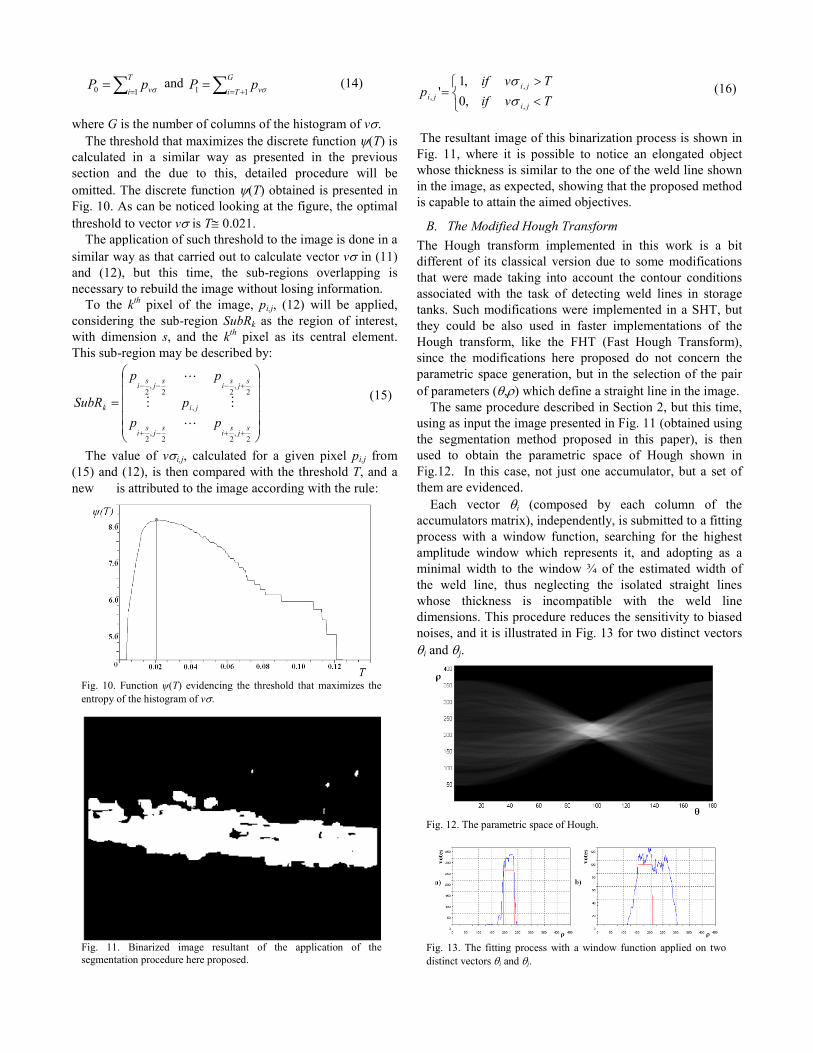
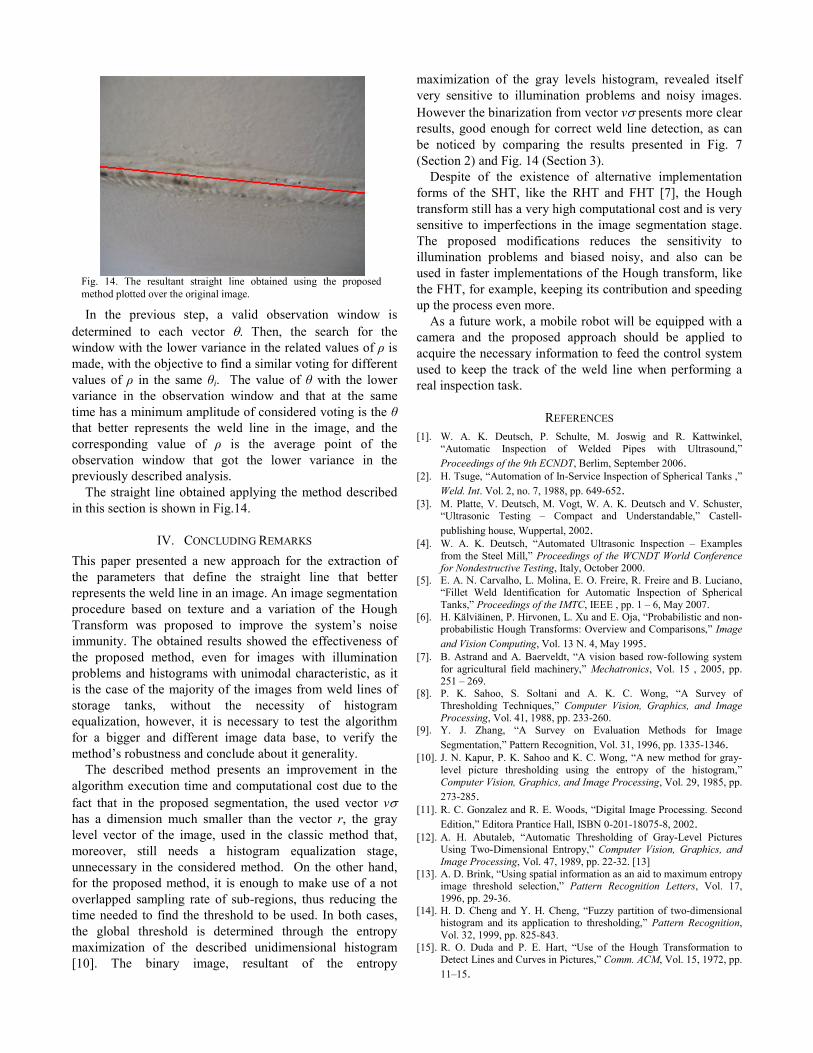
Abstract— The paper presents a Computer Vision System based on texture segmentation and on a variation of the Standard Hough Transform, in which the choice of the parameters that determine the straight line that better represents the image is based on the contour conditions of the particular case of weld line detection on fuel storage tanks, aiming to allow their correct detection by the computer vision system even in the absence of the reinforcement structure, usually found in those cases. The proposed vision system provides the necessary information to keep a set of ultrasonic sensors, used to inspect the weld line, in the necessary position in order to improve the inspection reliability. I. INTRODUCTION he increasing search for security in the industrial sector, together with the necessity of quality control, stimulates the accomplishment of great investments in inspection. In this context, automatic inspection systems had become a reality in this sector. They made possible a more trustworthy inspection, minimizing the human error and carrying out such processes faster and with lower costs [1], [2]. This need is even more critical when considering the inspection in storage tanks of harmful products to the health and the environment. To guarantee the security of the employees and to prevent aggressions to the environment, without affecting the health of the population that inhabits Manuscript received June 18, 2008. This work was supported in part by CENPES/PETROBRAS, CAPES and CNPq. Lucas Molina is with the Electrical Engineering Nucleus of Federal University of Sergipe – NEL/UFS, Av. Marechal Rondon, S/N, São Cristóvão-SE, Brazil, 49100-000. He is also a Masters student at the COPPE of the Federal University of Rio de Janeiro – COPPE/UFRJ, Cidade Universitária, Ilha do Fundão, Rio de Janeiro-RJ, Brazil, 21945-970 (e- mail:[email protected]). Elyson A. N. Carvalho is with the Electrical Engineering Nucleus of Federal University of Sergipe – NEL/UFS, Av. Marechal Rondon, S/N, São Cristóvão-SE, Brazil, 49100-000. He is also a PhD. student at the Electrical Engineering Departament of the Federal University of Campina Grande – DEE/UFCG, Av. Aprígio Veloso, 882, Bodocongó, Campina Grande-PB, Brazil, 58109-900 (e-mail: [email protected]). Eduardo O. Freire is with the Electrical Engineering Nucleus of Federal University of Sergipe – NEL/UFS, Av. Marechal Rondon, S/N, São Cristóvão-SE, Brazil, 49100-000 (phone: +55-79-2105-6834; fax: +55-79- 2105-6684; e-mail: [email protected]). Jugurta R. Montalvão Filho is with the Electrical Engineering Nucleus of Federal University of Sergipe – NEL/UFS, Av. Marechal Rondon, S/N, São Cristóvão-SE, Brazil, 49100-000 (phone: +55-79-2105-6834; fax: +55-79- 2105-6684; e-mail: [email protected]). Flávio de A. Chagas is with the Electrical Engineering Nucleus of Federal University of Sergipe – NEL/UFS, Av. Marechal Rondon, S/N, São Cristóvão-SE, Brazil, 49100-000. He is an under-graduate student at the NEL/UFS (e-mail: [email protected]). next to the industries, frequent inspections of such tanks are carried out, over all in its weld lines, as it is the case of the used spherical tanks in the gas storage. The inspection of such tanks must to be made inside and outside of them. When inspecting its interior, the professional in charge for it is exposed to an even bigger danger, as the environment may present traces of the previously stored substance, thus the risk of explosion may be imminent, and/or the environment atmosphere may be toxic or with an insufficient concentration of oxygen to support the human life. The spherical tanks usually have big dimensions, forcing the in-charged professional to work in high places, thus, making the job even more dangerous and thus increasing the costs to the company. One way to carry out the weld line inspection is based on the emission of high-frequency ultrasonic waves [3], [4]. The ultrasonic waves are emitted under different angles through the reservoir structure, and propagate themselves around it. When air bubbles are inside the weld, the wave is reflected, thus allowing for their detection. This kind of fail detection is already being used and is not the focus of this work. However, the reliability of this fail detection scheme is hardly affected when the correct positioning of the set of ultrasonic sensors is not guaranteed [3], [4]. This is the reason that makes the correct detection of the weld line a theme of major importance, and it is also the inspiration to the realization of this work. To carry out a reliable inspection it is necessary to exactly identify the weld line, thus obtaining the necessary data to position the inspection-sensor correctly. The selection of the sensing methods to be used to identify the weld line is of major importance to assure the inspection reliability. In [5], an autonomous system to keep the correct positioning of the inspection sensors with respect to the weld line is proposed. The weld line detection, in this case, is made based on the information provided by a linear arrangement of distance infrared sensors. In the absence of the reinforcement structure commonly found in weld line the proposed sensing scheme is strongly affected, but the weld line profile can still be correctly identified if visual information is used instead of distance measurements. In face of such necessity of the industrial sector, this paper presents a sensing system based on computer vision to allow the correct detection of the weld line even in the absence of reinforcement structures. A Robotic Vision System Using a Modified Hough Transform to Perform Weld Line Detection on Storage Tanks Lucas Molina, Elyson A. N. Carvalho, Eduardo O. Freire, Jugurta R. Montalvão-Filho, and Flávio de A. Chagas T
Transcript
Abstract— The paper presents a Computer Vision System
based on texture segmentation and on a variation of the
Standard Hough Transform, in which the choice of the
parameters that determine the straight line that better
represents the image is based on the contour conditions of the
particular case of weld line detection on fuel storage tanks,
aiming to allow their correct detection by the computer vision
system even in the absence of the reinforcement structure,
usually found in those cases. The proposed vision system
provides the necessary information to keep a set of ultrasonic
sensors, used to inspect the weld line, in the necessary position
in order to improve the inspection reliability.
I. INTRODUCTION
he increasing search for security in the industrial sector,
together with the necessity of quality control, stimulates
the accomplishment of great investments in inspection. In
this context, automatic inspection systems had become a
reality in this sector. They made possible a more trustworthy
inspection, minimizing the human error and carrying out
such processes faster and with lower costs [1], [2].
This need is even more critical when considering the
inspection in storage tanks of harmful products to the health
and the environment. To guarantee the security of the
employees and to prevent aggressions to the environment,
without affecting the health of the population that inhabits
Manuscript received June 18, 2008. This work was supported in part by
CENPES/PETROBRAS, CAPES and CNPq. Lucas Molina is with the Electrical Engineering Nucleus of Federal
University of Sergipe – NEL/UFS, Av. Marechal Rondon, S/N, São
Cristóvão-SE, Brazil, 49100-000. He is also a Masters student at the COPPE of the Federal University of Rio de Janeiro – COPPE/UFRJ, Cidade
Universitária, Ilha do Fundão, Rio de Janeiro-RJ, Brazil, 21945-970 (e-
mail:[email protected]). Elyson A. N. Carvalho is with the Electrical Engineering Nucleus of
Federal University of Sergipe – NEL/UFS, Av. Marechal Rondon, S/N, São
Cristóvão-SE, Brazil, 49100-000. He is also a PhD. student at the Electrical Engineering Departament of the Federal University of Campina Grande –
DEE/UFCG, Av. Aprígio Veloso, 882, Bodocongó, Campina Grande-PB,
Brazil, 58109-900 (e-mail: [email protected]). Eduardo O. Freire is with the Electrical Engineering Nucleus of Federal
University of Sergipe – NEL/UFS, Av. Marechal Rondon, S/N, São