A taste of sweet pepper: Volatile and non-volatile chemical composition of fresh sweet pepper (Capsicum annuum) in relation to sensory evaluation of taste P.M. Eggink a,d,⇑ , C. Maliepaard b , Y. Tikunov b,c , J.P.W. Haanstra a , A.G. Bovy b,c , R.G.F. Visser b a Rijk Zwaan Breeding B.V., P.O. Box 40, 2678 ZG De Lier, The Netherlands b Wageningen UR Plant Breeding, Wageningen University & Research Centre, P.O. Box 386, 6700 AJ Wageningen, The Netherlands c Centre for BioSystems Genomics, P.O. Box 98, 6700 AB Wageningen, The Netherlands d Graduate School Experimental Plant Sciences, Wageningen, The Netherlands article info Article history: Received 22 June 2011 Received in revised form 8 September 2011 Accepted 10 October 2011 Available online 31 October 2011 Keywords: Sensory evaluation Biochemical profiling Metabolomics SPME-GC–MS Multivariate analysis Random Forest abstract In this study volatile and non-volatile compounds, as well as some breeding parameters, were measured in mature fruits of elite sweet pepper (Capsicum annuum) lines and hybrids from a commercial breeding program, several cultivated genotypes and one gene bank accession. In addition, all genotypes were eval- uated for taste by a trained descriptive sensory expert panel. Metabolic contrasts between genotypes were caused by clusters of volatile and non-volatile compounds, which could be related to metabolic pathways and common biochemical precursors. Clusters of phenolic derivatives, higher alkanes, sesqui- terpenes and lipid derived volatiles formed the major determinants of the genotypic differences. Flavour was described with the use of 14 taste attributes, of which the texture related attributes and the sweet– sour contrast were the most discriminatory factors. The attributes juiciness, toughness, crunchiness, stickiness, sweetness, aroma, sourness and fruity/apple taste could be significantly predicted with com- bined volatile and non-volatile data. Fructose and (E)-2-hexen-1-ol were highly correlated with aroma, fruity/apple taste and sweetness. New relations were found for fruity/apple taste and sweetness with the compounds p-menth-1-en-9-al, (E)-b-ocimene, (Z)-2-penten-1-ol and (E)-geranylacetone. Based on the overall biochemical and sensory results, the perspectives for flavour improvement by breeding are discussed. Ó 2011 Elsevier Ltd. All rights reserved. 1. Introduction Sweet and hot peppers (Capsicum annuum) are cultivated worldwide and form important food ingredients. Fruits are com- monly used in diets because of their typical colour, pungency, taste and/or distinct aroma (Govindarajan, 1985). In particular, sweet peppers are consumed fresh or processed, as unripe (green or white) or ripe (e.g. red, yellow and orange) fruits. In the breeding process of pepper, production (yield) and quality, e.g. shelf life, firmness and disease resistance factors are of main interest. Con- sumers have, however, become more critical in the last decade, resulting in a need towards flavour as a more important quality parameter in pepper breeding (Verheul, 2008). Flavour of fruits and vegetables, as perceived during consumption, has been defined as the overall sensation provided by the interaction of taste, aroma, mouth feel, sight and sound (Luning et al., 1994b). Particularly the interplay among all these parameters in combination with differ- ent consumer preferences make flavour such a difficult property to quantify in an objective way. Literature about flavour of some fruit crops, like tomato, strawberry, kiwi or melon is abundant, however, specific research addressing sweet pepper flavour is limited. Studies have so far mainly focused on characterization of variation for volatile and/or non-volatile components in cultivated or wild species (Buttery, Seifert, Guadagni, & Ling, 1969; Jarret, Baldwin, Perkins, Bushway, & Guthrie, 2007; Rodriguez-Burruezo, Kollmannsberger, Gonzalez-Mas, Nitz, & Nuez, 2010). Correlations between biochemical compounds and sensory attributes scored by taste panels are generally missing. In the present study we characterized flavour in a broad germ- plasm panel from a commercial breeding program completed with few cultivated genotypes and a gene bank accession. Flavour was objectively quantified by thorough biochemical profiling in combi- nation with sensory evaluations by a trained expert panel. The overall results make it possible to link individual taste attributes to volatile and non-volatile compounds. Taking their effect on total yield into account, our results form a starting point towards direc- ted flavour breeding in pepper. 0308-8146/$ - see front matter Ó 2011 Elsevier Ltd. All rights reserved. doi:10.1016/j.foodchem.2011.10.081 ⇑ Corresponding author at: Rijk Zwaan Breeding B.V., P.O. Box 40, 2678 ZG De Lier, The Netherlands. Tel.: +31 174 53 23 65; fax: +31 174 51 78 40. E-mail address: [email protected](P.M. Eggink). Food Chemistry 132 (2012) 301–310 Contents lists available at SciVerse ScienceDirect Food Chemistry journal homepage: www.elsevier.com/locate/foodchem
Transcript
Food Chemistry 132 (2012) 301–310
Contents lists available at SciVerse ScienceDirect
A taste of sweet pepper: Volatile and non-volatile chemical composition offresh sweet pepper (Capsicum annuum) in relation to sensory evaluation of taste
P.M. Eggink a,d,⇑, C. Maliepaard b, Y. Tikunov b,c, J.P.W. Haanstra a, A.G. Bovy b,c, R.G.F. Visser b
a Rijk Zwaan Breeding B.V., P.O. Box 40, 2678 ZG De Lier, The Netherlandsb Wageningen UR Plant Breeding, Wageningen University & Research Centre, P.O. Box 386, 6700 AJ Wageningen, The Netherlandsc Centre for BioSystems Genomics, P.O. Box 98, 6700 AB Wageningen, The Netherlandsd Graduate School Experimental Plant Sciences, Wageningen, The Netherlands
a r t i c l e i n f o a b s t r a c t
Article history:Received 22 June 2011Received in revised form 8 September 2011Accepted 10 October 2011Available online 31 October 2011
In this study volatile and non-volatile compounds, as well as some breeding parameters, were measuredin mature fruits of elite sweet pepper (Capsicum annuum) lines and hybrids from a commercial breedingprogram, several cultivated genotypes and one gene bank accession. In addition, all genotypes were eval-uated for taste by a trained descriptive sensory expert panel. Metabolic contrasts between genotypeswere caused by clusters of volatile and non-volatile compounds, which could be related to metabolicpathways and common biochemical precursors. Clusters of phenolic derivatives, higher alkanes, sesqui-terpenes and lipid derived volatiles formed the major determinants of the genotypic differences. Flavourwas described with the use of 14 taste attributes, of which the texture related attributes and the sweet–sour contrast were the most discriminatory factors. The attributes juiciness, toughness, crunchiness,stickiness, sweetness, aroma, sourness and fruity/apple taste could be significantly predicted with com-bined volatile and non-volatile data. Fructose and (E)-2-hexen-1-ol were highly correlated with aroma,fruity/apple taste and sweetness. New relations were found for fruity/apple taste and sweetness withthe compounds p-menth-1-en-9-al, (E)-b-ocimene, (Z)-2-penten-1-ol and (E)-geranylacetone. Based onthe overall biochemical and sensory results, the perspectives for flavour improvement by breeding arediscussed.
� 2011 Elsevier Ltd. All rights reserved.
1. Introduction
Sweet and hot peppers (Capsicum annuum) are cultivatedworldwide and form important food ingredients. Fruits are com-monly used in diets because of their typical colour, pungency, tasteand/or distinct aroma (Govindarajan, 1985). In particular, sweetpeppers are consumed fresh or processed, as unripe (green orwhite) or ripe (e.g. red, yellow and orange) fruits. In the breedingprocess of pepper, production (yield) and quality, e.g. shelf life,firmness and disease resistance factors are of main interest. Con-sumers have, however, become more critical in the last decade,resulting in a need towards flavour as a more important qualityparameter in pepper breeding (Verheul, 2008). Flavour of fruitsand vegetables, as perceived during consumption, has been definedas the overall sensation provided by the interaction of taste, aroma,mouth feel, sight and sound (Luning et al., 1994b). Particularly the
ll rights reserved.
.V., P.O. Box 40, 2678 ZG De1 174 51 78 40.k).
interplay among all these parameters in combination with differ-ent consumer preferences make flavour such a difficult propertyto quantify in an objective way. Literature about flavour of somefruit crops, like tomato, strawberry, kiwi or melon is abundant,however, specific research addressing sweet pepper flavour islimited. Studies have so far mainly focused on characterization ofvariation for volatile and/or non-volatile components in cultivatedor wild species (Buttery, Seifert, Guadagni, & Ling, 1969; Jarret,Baldwin, Perkins, Bushway, & Guthrie, 2007; Rodriguez-Burruezo,Kollmannsberger, Gonzalez-Mas, Nitz, & Nuez, 2010). Correlationsbetween biochemical compounds and sensory attributes scored bytaste panels are generally missing.
In the present study we characterized flavour in a broad germ-plasm panel from a commercial breeding program completed withfew cultivated genotypes and a gene bank accession. Flavour wasobjectively quantified by thorough biochemical profiling in combi-nation with sensory evaluations by a trained expert panel. Theoverall results make it possible to link individual taste attributesto volatile and non-volatile compounds. Taking their effect on totalyield into account, our results form a starting point towards direc-ted flavour breeding in pepper.
In this study 24 non-pungent C. annuum accessions from thebroader collection of Capsicum genotypes described in Eggink,Haanstra, Tikunov, Bovy, and Visser (2010) were used. The panelconsisted of elite pepper breeding lines and hybrids (provided byRijk Zwaan), several cultivated genotypes (landraces or old hybrids)and one gene bank accession (Table 1). The pepper breeding linesand hybrids were chosen to roughly represent the flavour variationin the C. annuum germplasm of a typical commercial breeding pro-gram. The cultivated variety Piquillo was chosen as it is famous inthe Mediterranean region for its full taste and rich aroma. CultivarBuran was reported to be a very sweet lamuyo type (http://www.seedsavers.org) and cv. Vania and cv. Maor have been usedas parents in publicly available mapping populations (Lefebvreet al., 2003; Ben Chaim, Borovsky, Rao, Tanyolac, & Paran, 2003).Finally, PBC1405 was included because, according to the AVRDCgene bank (http://www.avrdc.org), it is a non-pungent C. baccatumaccession, which is rather unique as most accessions from wild Cap-sicum species are pungent.
In 2008, the genotypes were grown in soil in a greenhouse at RijkZwaan (De Lier, The Netherlands), according to standard Dutch pep-per management conditions with 2.5 plants/m2. Potential shadingeffects, because of the diverse nature of the genotypes, wereavoided by ordering the plants by (expected) plant height in thegreenhouse in 3 separate blocks (i.e. tall, intermediate and shortplants). All genotypes were grown in 3 plots of 5 plants, which wererandomized within the separate blocks. From the beginning of Mayuntil the end of September, 2008, all ripe (95–100% coloured) fruitswere harvested, counted and weighed (bi)weekly. The harvest ofMay 29 was used for biochemical measurements and sensory eval-uation. After harvesting, fruits were stored in a climate room at20 �C with 80% relative humidity for 4–5 days to optimize ripening.This is standard procedure to mimic the Dutch commercial system.From each individual repetition of the genotypes, a selection of 5–8fruits was pooled to make a representative fruit sample. Fruits were
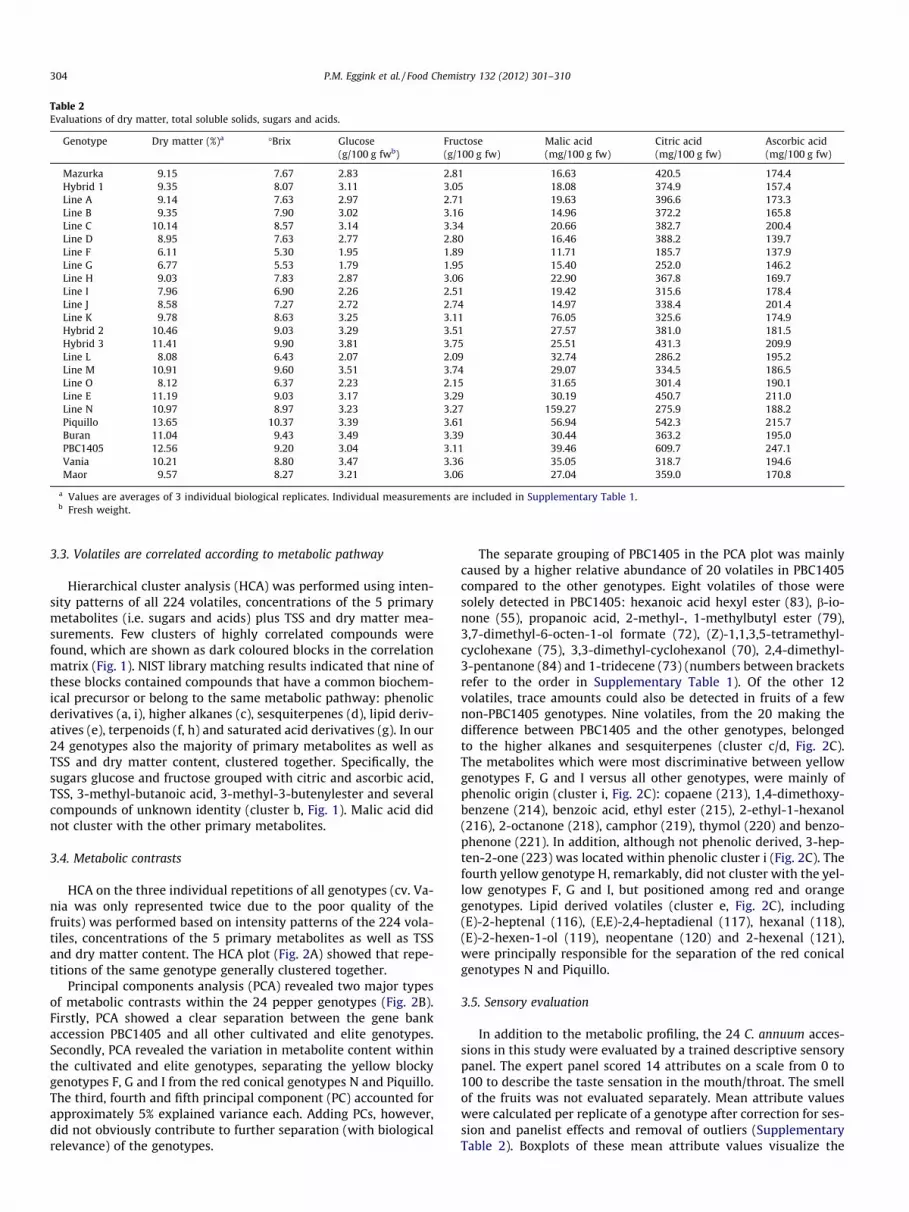
Table 1Description of Capsicum annuum genotypes evaluated for fruit quality attributes.
Genotype Origin Source country Fruit ty
Mazurkac Elite Netherlands BlockyHybrid 1 Elite Netherlands BlockyLine A Elite Netherlands BlockyLine B Elite Netherlands BlockyLine C Elite Netherlands BlockyLine D Elite Netherlands BlockyLine F Elite Netherlands BlockyLine G Elite Netherlands BlockyLine H Elite Netherlands BlockyLine I Elite Netherlands BlockyLine J Elite Netherlands BlockyLine K Elite Netherlands Mini blHybrid 2 Elite Italy Dulce iHybrid 3 Elite Italy Dulce iLine L Elite Italy Dulce iLine M Elite Italy Dulce iLine O Elite Italy Dulce iLine E Elite Turkey DolmaLine N Elite Turkey KapyaPiquillo Cultivated Spain ConicalBuran Cultivated Poland LamuyoPBC1405 Gene bank AVRDC, Taiwan ElongatVania Cultivated France LamuyoMaor Cultivated Spain Blocky
a Size is indicated by length �width.b Average yield and standard deviation in the harvesting period May through Septemc Standard variety (reference to e.g. Luning et al., 1994a and Luning et al., 1994b).
cut (top and bottom parts were discarded) in 1–2 cm pieces, mixedand seeds were removed. Half of the fruit pieces from each samplewere immediately frozen in liquid nitrogen, ground in an electricmill and stored at �80 �C, while the other half was used for flavourevaluation.
2.2. Sensory analysis
The 24 genotypes were subjected to sensory evaluation by atrained descriptive expert panel at Wageningen UR GreenhouseHorticulture (WUR-GH, Bleiswijk, The Netherlands). The sweetgenotypes were evaluated by, on average, 16 taste panelists in arandomized setup, split over 2 subsequent days. On both days, 2sessions with 6 genotypes and a reference (commercial red blockyC. annuum hybrid) were evaluated per panelist. Each panelistreceived 5 fruit pieces per sample. The setup was chosen in sucha way that each panelist evaluated one repetition of all genotypesand that each sample was evaluated by 5–6 panelists. The expertpanel evaluated 14 attributes on a scale from 0 to 100 to describethe taste sensation in the mouth/throat which were: crunchiness,stickiness of the skin, toughness, juiciness, sweetness, sourness,aroma intensity, grassiness, green bean taste, carrot taste, fruity/apple taste, perfume taste, petrochemical taste and musty taste.
2.3. Metabolic profiling
The profiling of volatile metabolites was performed using head-space SPME-GC–MS, as described by Tikunov and colleagues(2005). Frozen fruit powder (1 g) was weighed in a 5-ml screw-cap vial, closed and incubated at 30 �C for 10 min. An EDTA–NaOHwater solution was prepared by adjustment of 100 mM EDTA to pHof 7.5 with NaOH. Afterwards, 1 ml of the EDTA–NaOH solution wasadded to the sample to a final EDTA concentration of 50 mM. SolidCaCl2 was then immediately added to give a final concentration of5 M. The closed vials were then sonicated for 5 min. A 1 ml aliquotof this solution was transferred into a 10-ml crimp cap vial(Waters), capped and used for SPME-GC–MS analysis.
Volatiles were automatically extracted from the headspace andinjected into the GC–MS via a Combi PAL autosampler (CTC Analyt-ics AG). Headspace volatiles were extracted by exposing a 65 lmPDMS-DVB SPME fibre (Supelco) to the vial headspace for 20 minunder continuous agitation and heating at 50 �C. The fibre was in-serted into a GC 8000 (Fisons Instruments) injection port and vol-atiles were desorbed for 1 min at 250 �C. Chromatography wasperformed on an HP-5 (50 m � 0.32 mm � 1.05 lm) column withhelium as the carrier gas (37 kPa). The GC interface and MS sourcetemperatures were 260 and 250 �C, respectively. The GC tempera-ture program began at 45 �C (2 min), was then raised to 250 �C at arate of 5 �C/min and finally held at 250 �C for 5 min. The total runtime including oven cooling was 60 min. Mass spectra in the35–400 m/z range were recorded by an MD800 electron impactMS (Fisons Instruments) at a scanning speed of 2.8 scans/s andan ionization energy of 70 eV. The chromatography and spectraldata were evaluated using ‘‘Xcalibur™’’ software (http://www.thermo.com).
Clear supernatants of shortly centrifuged samples were used forrefractive index measurement of total soluble solids content (TSS;�Brix) and for an enzymatic determination of glucose, fructose andsucrose (Velterop & Vos, 2001). Anion exchange chromatographyon the same supernatants was used for citric, malic and ascorbicacid determination based on standard protocols (Dionex Corpora-tion, Sunnyvale, CA; http://www.dionex.com/ Application Note143 ‘‘Determination of Organic Acids in Fruit Juices’’). Dry mattercontent was calculated by drying weighed samples at 60–80 �Cfor up to 48 h in a standard oven.
2.4. GC–MS data processing
The GC–MS profiles derived using the SPME-GC–MS methodwere processed by the MetAlign™ software package (http://www.metalign.nl) for baseline correction, noise estimation andion-wise mass spectral alignment. The multivariate mass spectralreconstruction (MMSR) approach (Tikunov et al., 2005) was usedto reduce data to volatile compound mass spectra. Each compoundwas represented by a single selective ion fragment in the multivar-iate data analysis. The compounds (number of fragment ions in amass spectrum P5) were then subjected to a tentative identifica-tion using the NIST mass spectral library (http://www.nist.gov).Identities were assigned to compounds with a forward match fac-tor (fmf) P 700 and an identity probability rank P 2 (Mihaleva,Verhoeven, de Vos, Hall, & Van Ham, 2009). Identities of 21 vola-tiles were confirmed by authentic chemical standards.
2.5. Data analysis
The sensory data was analysed in Genstat version 12 (http://www.vsni.co.uk) using a linear mixed model REML (residual max-imum likelihood) analysis with genotype and replicate and theirinteraction as fixed terms. Sessions (tasting sessions) within repli-cate/genotype combinations and panelists within sessions weretaken as random terms. Mean values were calculated per genotypeper replicate after a correction for session and panelist effects andremoval of strong outliers (if the absolute value of a standardizedresiduals was larger than three residual standard deviations).
Principal components analysis (PCA) biplot visualization, asimplemented in GeneMaths XT version 2.0 (http://www.applied-maths.com), was used for showing relationships between andamong metabolites and attributes. For these analyses the metabo-lite data sets were log transformed and mean centered. Pearson’scorrelation coefficient was used as a measure for metabolite–metabolite correlation and for hierarchical clustering analysis(HCA) using the UPGMA algorithm.
Variance components of the sensory attributes were estimatedusing a variance components model with REML in Genstat version12 with the terms genotype, replicate, their interaction, and ses-sions within genotype/replicate combinations and taster withinsessions.
A Random Forest (Breiman, 2001) regression approach wasused to relate each sensory attribute (response) to the volatileand non-volatile data (predictors) and to determine importanceof the individual volatiles and non-volatiles. A double 10-foldcross-validation approach was used to optimize the number ofvariables for each decision rule in the Random Forest (the ‘mtry’variable in the R function to perform Random Forest) and to esti-mate the mean square error (on independent test samples). Theperformance of the models is expressed by the prediction R2, whichis calculated from the out-of-bag samples (Breiman, 2001). This R2
value therefore is not a goodness-of-fit of the data at hand, but anestimate of predictive accuracy on independent (left-out) samples.Variable importance was estimated by the increase in mean squareerror (MSE) after permutation (Breiman, 2001). Significance of theprediction R2 and variable importance was determined by anotherpermutation test, in which the attributes were permuted over thegenotypes while retaining the original metabolic values of thegenotypes. In this permuted situation, 100 new Random Forestmodels were constructed with calculation of the prediction R2
and increase in MSE to estimate variable importance. Significancethresholds were determined at P < 0.05.
3. Results
3.1. Genotypes
In correspondence to the genetic diversity in our collection of24 non-pungent C. annuum accessions, a high degree of variationwas found for fruit size and yield. Fruits ranged from 5–22 cm inlength and 2–8.5 cm in width, within the fruit types blocky, dulceitaliano, dolma, kapya, lamuyo, conical and elongated (Table 1).The majority of the genotypes were red, as this is the predominantcolour in cultivated material; yellow and orange genotypes wereless represented. Total yield was measured throughout the com-plete growth period (May through September) and ranged from6.6 to 15.3 kg/m2. Based on (flower) morphology, the plants grownfrom our PBC1405 seed lot turned out to belong to C. annuum,while it was reported by AVRDC to be a non-pungent C. baccatumaccession.
3.2. Identification of metabolites
The multivariate mass spectral reconstruction (MMSR) ap-proach (Tikunov et al., 2005) was used to reduce GC–MS data tovolatile compound mass spectra. In the set of 24 C. annuum geno-types, in total 224 molecular fragment clusters were obtained,putatively representing the mass spectra of 224 individual volatilecompounds. All compounds were subjected to a putative identifi-cation by matching their mass spectra to the NIST library and reli-able identities (mass spectra match factor P 700 and identityprobability rank P 2) could be assigned to 100 of them. Relativeintensity patterns of all 224 compounds are given in Supplemen-tary Table 1. In addition to the GC–MS measurements, the concen-tration of non-volatile flavour compounds, such as sugars (fructose,glucose and sucrose) and acids (malic, citric and ascorbic acid) wasmeasured, completed by dry matter content and total soluble sol-ids (TSS) determination (Table 2). Sucrose concentrations turnedout to be under the detection limit (0.3 g/100 g fresh weight) ofour enzymatic determination method.
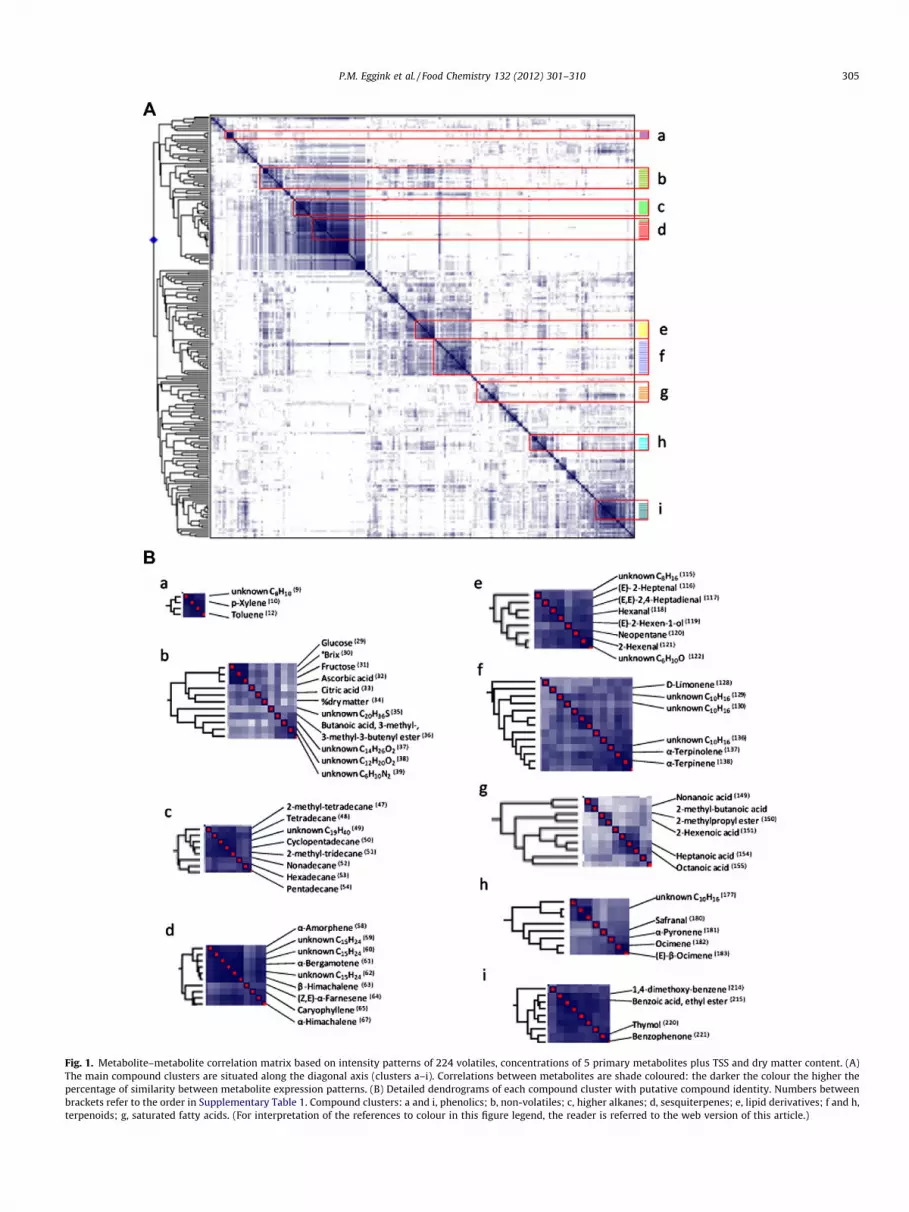
3.3. Volatiles are correlated according to metabolic pathway
Hierarchical cluster analysis (HCA) was performed using inten-sity patterns of all 224 volatiles, concentrations of the 5 primarymetabolites (i.e. sugars and acids) plus TSS and dry matter mea-surements. Few clusters of highly correlated compounds werefound, which are shown as dark coloured blocks in the correlationmatrix (Fig. 1). NIST library matching results indicated that nine ofthese blocks contained compounds that have a common biochem-ical precursor or belong to the same metabolic pathway: phenolicderivatives (a, i), higher alkanes (c), sesquiterpenes (d), lipid deriv-atives (e), terpenoids (f, h) and saturated acid derivatives (g). In our24 genotypes also the majority of primary metabolites as well asTSS and dry matter content, clustered together. Specifically, thesugars glucose and fructose grouped with citric and ascorbic acid,TSS, 3-methyl-butanoic acid, 3-methyl-3-butenylester and severalcompounds of unknown identity (cluster b, Fig. 1). Malic acid didnot cluster with the other primary metabolites.
3.4. Metabolic contrasts
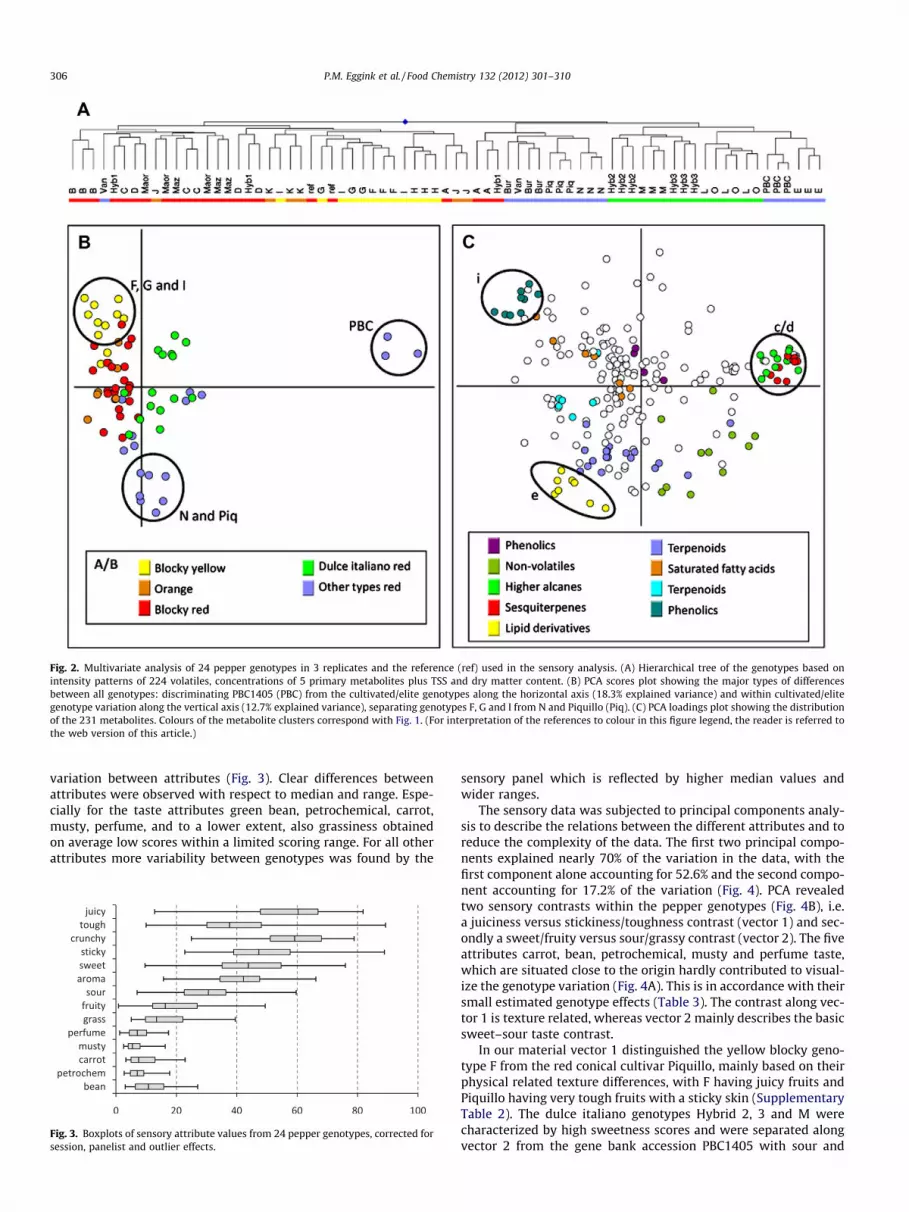
HCA on the three individual repetitions of all genotypes (cv. Va-nia was only represented twice due to the poor quality of thefruits) was performed based on intensity patterns of the 224 vola-tiles, concentrations of the 5 primary metabolites as well as TSSand dry matter content. The HCA plot (Fig. 2A) showed that repe-titions of the same genotype generally clustered together.
Principal components analysis (PCA) revealed two major typesof metabolic contrasts within the 24 pepper genotypes (Fig. 2B).Firstly, PCA showed a clear separation between the gene bankaccession PBC1405 and all other cultivated and elite genotypes.Secondly, PCA revealed the variation in metabolite content withinthe cultivated and elite genotypes, separating the yellow blockygenotypes F, G and I from the red conical genotypes N and Piquillo.The third, fourth and fifth principal component (PC) accounted forapproximately 5% explained variance each. Adding PCs, however,did not obviously contribute to further separation (with biologicalrelevance) of the genotypes.
The separate grouping of PBC1405 in the PCA plot was mainlycaused by a higher relative abundance of 20 volatiles in PBC1405compared to the other genotypes. Eight volatiles of those weresolely detected in PBC1405: hexanoic acid hexyl ester (83), b-io-none (55), propanoic acid, 2-methyl-, 1-methylbutyl ester (79),3,7-dimethyl-6-octen-1-ol formate (72), (Z)-1,1,3,5-tetramethyl-cyclohexane (75), 3,3-dimethyl-cyclohexanol (70), 2,4-dimethyl-3-pentanone (84) and 1-tridecene (73) (numbers between bracketsrefer to the order in Supplementary Table 1). Of the other 12volatiles, trace amounts could also be detected in fruits of a fewnon-PBC1405 genotypes. Nine volatiles, from the 20 making thedifference between PBC1405 and the other genotypes, belongedto the higher alkanes and sesquiterpenes (cluster c/d, Fig. 2C).The metabolites which were most discriminative between yellowgenotypes F, G and I versus all other genotypes, were mainly ofphenolic origin (cluster i, Fig. 2C): copaene (213), 1,4-dimethoxy-benzene (214), benzoic acid, ethyl ester (215), 2-ethyl-1-hexanol(216), 2-octanone (218), camphor (219), thymol (220) and benzo-phenone (221). In addition, although not phenolic derived, 3-hep-ten-2-one (223) was located within phenolic cluster i (Fig. 2C). Thefourth yellow genotype H, remarkably, did not cluster with the yel-low genotypes F, G and I, but positioned among red and orangegenotypes. Lipid derived volatiles (cluster e, Fig. 2C), including(E)-2-heptenal (116), (E,E)-2,4-heptadienal (117), hexanal (118),(E)-2-hexen-1-ol (119), neopentane (120) and 2-hexenal (121),were principally responsible for the separation of the red conicalgenotypes N and Piquillo.
3.5. Sensory evaluation
In addition to the metabolic profiling, the 24 C. annuum acces-sions in this study were evaluated by a trained descriptive sensorypanel. The expert panel scored 14 attributes on a scale from 0 to100 to describe the taste sensation in the mouth/throat. The smellof the fruits was not evaluated separately. Mean attribute valueswere calculated per replicate of a genotype after correction for ses-sion and panelist effects and removal of outliers (SupplementaryTable 2). Boxplots of these mean attribute values visualize the
Fig. 1. Metabolite–metabolite correlation matrix based on intensity patterns of 224 volatiles, concentrations of 5 primary metabolites plus TSS and dry matter content. (A)The main compound clusters are situated along the diagonal axis (clusters a–i). Correlations between metabolites are shade coloured: the darker the colour the higher thepercentage of similarity between metabolite expression patterns. (B) Detailed dendrograms of each compound cluster with putative compound identity. Numbers betweenbrackets refer to the order in Supplementary Table 1. Compound clusters: a and i, phenolics; b, non-volatiles; c, higher alkanes; d, sesquiterpenes; e, lipid derivatives; f and h,terpenoids; g, saturated fatty acids. (For interpretation of the references to colour in this figure legend, the reader is referred to the web version of this article.)
Fig. 2. Multivariate analysis of 24 pepper genotypes in 3 replicates and the reference (ref) used in the sensory analysis. (A) Hierarchical tree of the genotypes based onintensity patterns of 224 volatiles, concentrations of 5 primary metabolites plus TSS and dry matter content. (B) PCA scores plot showing the major types of differencesbetween all genotypes: discriminating PBC1405 (PBC) from the cultivated/elite genotypes along the horizontal axis (18.3% explained variance) and within cultivated/elitegenotype variation along the vertical axis (12.7% explained variance), separating genotypes F, G and I from N and Piquillo (Piq). (C) PCA loadings plot showing the distributionof the 231 metabolites. Colours of the metabolite clusters correspond with Fig. 1. (For interpretation of the references to colour in this figure legend, the reader is referred tothe web version of this article.)
variation between attributes (Fig. 3). Clear differences betweenattributes were observed with respect to median and range. Espe-cially for the taste attributes green bean, petrochemical, carrot,musty, perfume, and to a lower extent, also grassiness obtainedon average low scores within a limited scoring range. For all otherattributes more variability between genotypes was found by the
Fig. 3. Boxplots of sensory attribute values from 24 pepper genotypes, corrected forsession, panelist and outlier effects.
sensory panel which is reflected by higher median values andwider ranges.
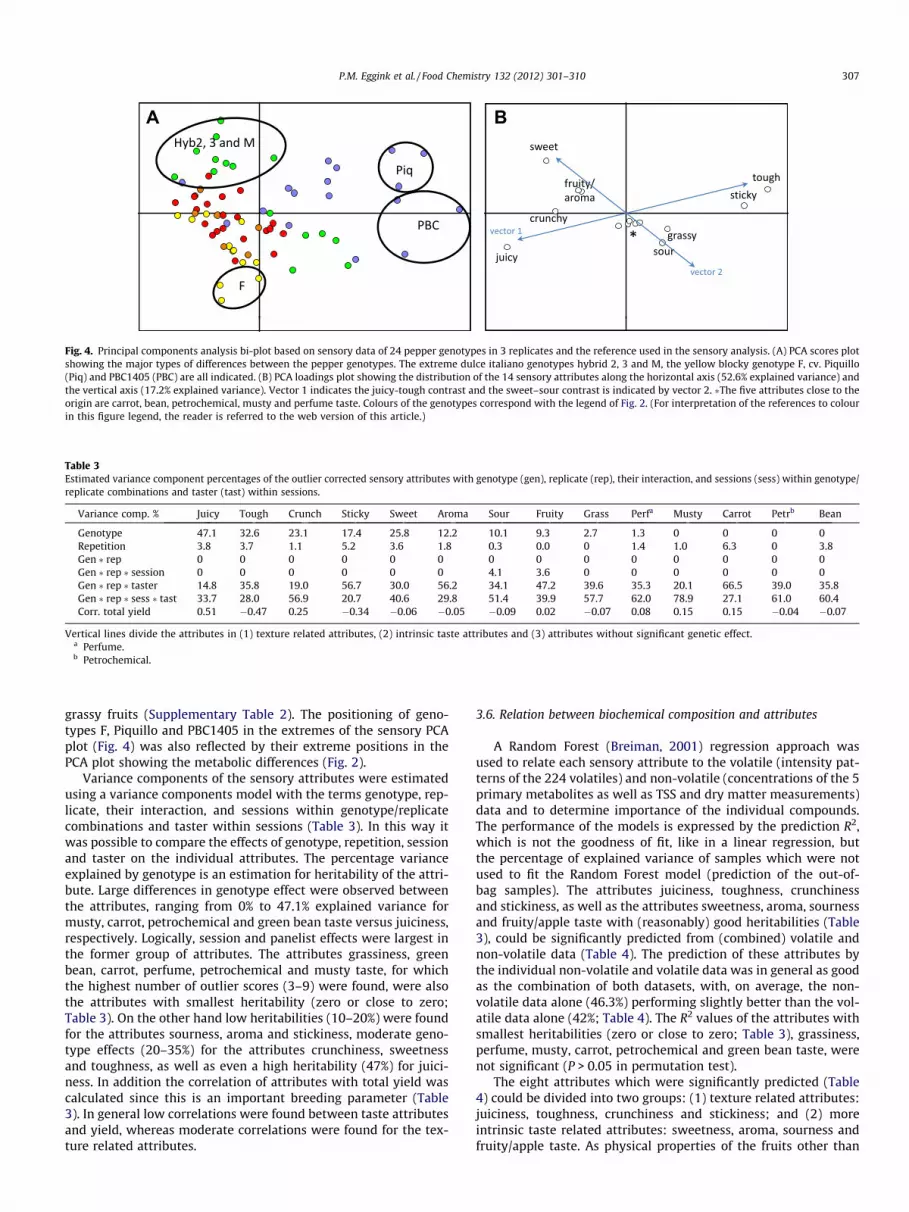
The sensory data was subjected to principal components analy-sis to describe the relations between the different attributes and toreduce the complexity of the data. The first two principal compo-nents explained nearly 70% of the variation in the data, with thefirst component alone accounting for 52.6% and the second compo-nent accounting for 17.2% of the variation (Fig. 4). PCA revealedtwo sensory contrasts within the pepper genotypes (Fig. 4B), i.e.a juiciness versus stickiness/toughness contrast (vector 1) and sec-ondly a sweet/fruity versus sour/grassy contrast (vector 2). The fiveattributes carrot, bean, petrochemical, musty and perfume taste,which are situated close to the origin hardly contributed to visual-ize the genotype variation (Fig. 4A). This is in accordance with theirsmall estimated genotype effects (Table 3). The contrast along vec-tor 1 is texture related, whereas vector 2 mainly describes the basicsweet–sour taste contrast.
In our material vector 1 distinguished the yellow blocky geno-type F from the red conical cultivar Piquillo, mainly based on theirphysical related texture differences, with F having juicy fruits andPiquillo having very tough fruits with a sticky skin (SupplementaryTable 2). The dulce italiano genotypes Hybrid 2, 3 and M werecharacterized by high sweetness scores and were separated alongvector 2 from the gene bank accession PBC1405 with sour and
BA
Fig. 4. Principal components analysis bi-plot based on sensory data of 24 pepper genotypes in 3 replicates and the reference used in the sensory analysis. (A) PCA scores plotshowing the major types of differences between the pepper genotypes. The extreme dulce italiano genotypes hybrid 2, 3 and M, the yellow blocky genotype F, cv. Piquillo(Piq) and PBC1405 (PBC) are all indicated. (B) PCA loadings plot showing the distribution of the 14 sensory attributes along the horizontal axis (52.6% explained variance) andthe vertical axis (17.2% explained variance). Vector 1 indicates the juicy-tough contrast and the sweet–sour contrast is indicated by vector 2. �The five attributes close to theorigin are carrot, bean, petrochemical, musty and perfume taste. Colours of the genotypes correspond with the legend of Fig. 2. (For interpretation of the references to colourin this figure legend, the reader is referred to the web version of this article.)
Table 3Estimated variance component percentages of the outlier corrected sensory attributes with genotype (gen), replicate (rep), their interaction, and sessions (sess) within genotype/replicate combinations and taster (tast) within sessions.
Vertical lines divide the attributes in (1) texture related attributes, (2) intrinsic taste attributes and (3) attributes without significant genetic effect.a Perfume.b Petrochemical.
grassy fruits (Supplementary Table 2). The positioning of geno-types F, Piquillo and PBC1405 in the extremes of the sensory PCAplot (Fig. 4) was also reflected by their extreme positions in thePCA plot showing the metabolic differences (Fig. 2).
Variance components of the sensory attributes were estimatedusing a variance components model with the terms genotype, rep-licate, their interaction, and sessions within genotype/replicatecombinations and taster within sessions (Table 3). In this way itwas possible to compare the effects of genotype, repetition, sessionand taster on the individual attributes. The percentage varianceexplained by genotype is an estimation for heritability of the attri-bute. Large differences in genotype effect were observed betweenthe attributes, ranging from 0% to 47.1% explained variance formusty, carrot, petrochemical and green bean taste versus juiciness,respectively. Logically, session and panelist effects were largest inthe former group of attributes. The attributes grassiness, greenbean, carrot, perfume, petrochemical and musty taste, for whichthe highest number of outlier scores (3–9) were found, were alsothe attributes with smallest heritability (zero or close to zero;Table 3). On the other hand low heritabilities (10–20%) were foundfor the attributes sourness, aroma and stickiness, moderate geno-type effects (20–35%) for the attributes crunchiness, sweetnessand toughness, as well as even a high heritability (47%) for juici-ness. In addition the correlation of attributes with total yield wascalculated since this is an important breeding parameter (Table3). In general low correlations were found between taste attributesand yield, whereas moderate correlations were found for the tex-ture related attributes.
3.6. Relation between biochemical composition and attributes
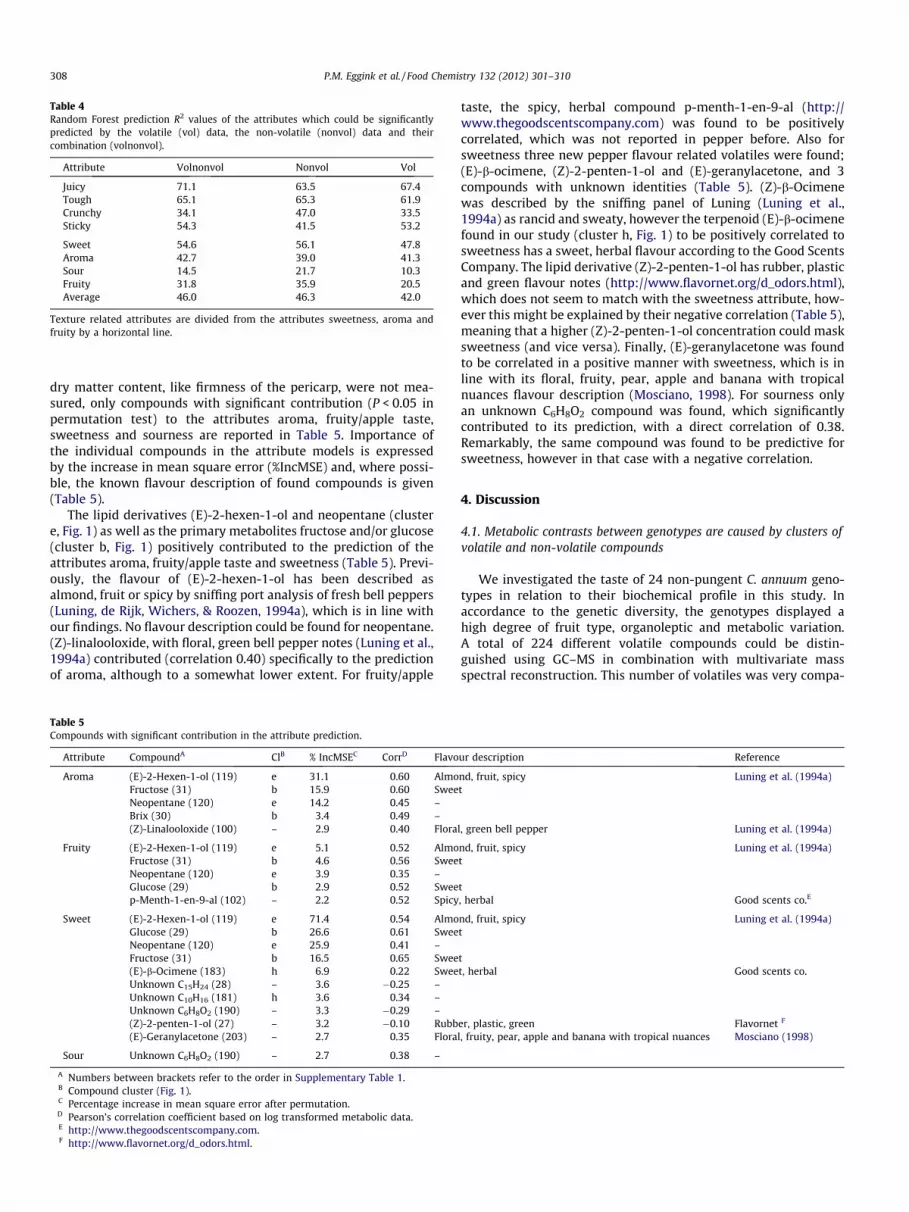
A Random Forest (Breiman, 2001) regression approach wasused to relate each sensory attribute to the volatile (intensity pat-terns of the 224 volatiles) and non-volatile (concentrations of the 5primary metabolites as well as TSS and dry matter measurements)data and to determine importance of the individual compounds.The performance of the models is expressed by the prediction R2,which is not the goodness of fit, like in a linear regression, butthe percentage of explained variance of samples which were notused to fit the Random Forest model (prediction of the out-of-bag samples). The attributes juiciness, toughness, crunchinessand stickiness, as well as the attributes sweetness, aroma, sournessand fruity/apple taste with (reasonably) good heritabilities (Table3), could be significantly predicted from (combined) volatile andnon-volatile data (Table 4). The prediction of these attributes bythe individual non-volatile and volatile data was in general as goodas the combination of both datasets, with, on average, the non-volatile data alone (46.3%) performing slightly better than the vol-atile data alone (42%; Table 4). The R2 values of the attributes withsmallest heritabilities (zero or close to zero; Table 3), grassiness,perfume, musty, carrot, petrochemical and green bean taste, werenot significant (P > 0.05 in permutation test).
The eight attributes which were significantly predicted (Table4) could be divided into two groups: (1) texture related attributes:juiciness, toughness, crunchiness and stickiness; and (2) moreintrinsic taste related attributes: sweetness, aroma, sourness andfruity/apple taste. As physical properties of the fruits other than
Table 4Random Forest prediction R2 values of the attributes which could be significantlypredicted by the volatile (vol) data, the non-volatile (nonvol) data and theircombination (volnonvol).
dry matter content, like firmness of the pericarp, were not mea-sured, only compounds with significant contribution (P < 0.05 inpermutation test) to the attributes aroma, fruity/apple taste,sweetness and sourness are reported in Table 5. Importance ofthe individual compounds in the attribute models is expressedby the increase in mean square error (%IncMSE) and, where possi-ble, the known flavour description of found compounds is given(Table 5).
The lipid derivatives (E)-2-hexen-1-ol and neopentane (clustere, Fig. 1) as well as the primary metabolites fructose and/or glucose(cluster b, Fig. 1) positively contributed to the prediction of theattributes aroma, fruity/apple taste and sweetness (Table 5). Previ-ously, the flavour of (E)-2-hexen-1-ol has been described asalmond, fruit or spicy by sniffing port analysis of fresh bell peppers(Luning, de Rijk, Wichers, & Roozen, 1994a), which is in line withour findings. No flavour description could be found for neopentane.(Z)-linalooloxide, with floral, green bell pepper notes (Luning et al.,1994a) contributed (correlation 0.40) specifically to the predictionof aroma, although to a somewhat lower extent. For fruity/apple
Table 5Compounds with significant contribution in the attribute prediction.
Attribute CompoundA ClB % IncMSEC CorrD Flavo
Aroma (E)-2-Hexen-1-ol (119) e 31.1 0.60 AlmoFructose (31) b 15.9 0.60 SweeNeopentane (120) e 14.2 0.45 –Brix (30) b 3.4 0.49 –(Z)-Linalooloxide (100) – 2.9 0.40 Flora
Fruity (E)-2-Hexen-1-ol (119) e 5.1 0.52 AlmoFructose (31) b 4.6 0.56 SweeNeopentane (120) e 3.9 0.35 –Glucose (29) b 2.9 0.52 Sweep-Menth-1-en-9-al (102) – 2.2 0.52 Spicy
Sweet (E)-2-Hexen-1-ol (119) e 71.4 0.54 AlmoGlucose (29) b 26.6 0.61 SweeNeopentane (120) e 25.9 0.41 –Fructose (31) b 16.5 0.65 Swee(E)-b-Ocimene (183) h 6.9 0.22 SweeUnknown C15H24 (28) – 3.6 �0.25 –Unknown C10H16 (181) h 3.6 0.34 –Unknown C6H8O2 (190) – 3.3 �0.29 –(Z)-2-penten-1-ol (27) – 3.2 �0.10 Rubb(E)-Geranylacetone (203) – 2.7 0.35 Flora
Sour Unknown C6H8O2 (190) – 2.7 0.38 –
A Numbers between brackets refer to the order in Supplementary Table 1.B Compound cluster (Fig. 1).C Percentage increase in mean square error after permutation.D Pearson’s correlation coefficient based on log transformed metabolic data.E http://www.thegoodscentscompany.com.F http://www.flavornet.org/d_odors.html.
taste, the spicy, herbal compound p-menth-1-en-9-al (http://www.thegoodscentscompany.com) was found to be positivelycorrelated, which was not reported in pepper before. Also forsweetness three new pepper flavour related volatiles were found;(E)-b-ocimene, (Z)-2-penten-1-ol and (E)-geranylacetone, and 3compounds with unknown identities (Table 5). (Z)-b-Ocimenewas described by the sniffing panel of Luning (Luning et al.,1994a) as rancid and sweaty, however the terpenoid (E)-b-ocimenefound in our study (cluster h, Fig. 1) to be positively correlated tosweetness has a sweet, herbal flavour according to the Good ScentsCompany. The lipid derivative (Z)-2-penten-1-ol has rubber, plasticand green flavour notes (http://www.flavornet.org/d_odors.html),which does not seem to match with the sweetness attribute, how-ever this might be explained by their negative correlation (Table 5),meaning that a higher (Z)-2-penten-1-ol concentration could masksweetness (and vice versa). Finally, (E)-geranylacetone was foundto be correlated in a positive manner with sweetness, which is inline with its floral, fruity, pear, apple and banana with tropicalnuances flavour description (Mosciano, 1998). For sourness onlyan unknown C6H8O2 compound was found, which significantlycontributed to its prediction, with a direct correlation of 0.38.Remarkably, the same compound was found to be predictive forsweetness, however in that case with a negative correlation.
4. Discussion
4.1. Metabolic contrasts between genotypes are caused by clusters ofvolatile and non-volatile compounds
We investigated the taste of 24 non-pungent C. annuum geno-types in relation to their biochemical profile in this study. Inaccordance to the genetic diversity, the genotypes displayed ahigh degree of fruit type, organoleptic and metabolic variation.A total of 224 different volatile compounds could be distin-guished using GC–MS in combination with multivariate massspectral reconstruction. This number of volatiles was very compa-
ur description Reference
nd, fruit, spicy Luning et al. (1994a)t
l, green bell pepper Luning et al. (1994a)
nd, fruit, spicy Luning et al. (1994a)t
t, herbal Good scents co.E
nd, fruit, spicy Luning et al. (1994a)t
tt, herbal Good scents co.
er, plastic, green Flavornet F
l, fruity, pear, apple and banana with tropical nuances Mosciano (1998)
rable to the number of volatiles found in 12 C. annuum genotypesby Rodriguez-Burruezo and colleagues (2010). Since non-volatilesare also important determinants of sensory perceived taste, theconcentration of sugars and acids was determined in addition tothe GC–MS measurements. The sucrose concentration in ripefruits turned out to be under the detection limit (0.3 g/100 g freshweight) of our enzymatic determination method, although it wasdetected at low concentration in green, turning and red fruits ofMazurka (0.31, 0.65 and 0.19 g/100 g fresh weight) by Luningand collegues (1994b). For both volatile and non-volatile com-pounds, highly correlated clusters were found by HCA, whichcould be related to metabolic pathways and common biochemicalprecursors. The specific grouping of the non-volatiles glucose,fructose, citrate and ascorbic acid with the volatile compound3-methyl-butanoic acid 3-methyl-3-butenylester and severalother volatiles of unknown identity (cluster b, Fig. 1) seemed tobe caused by population structure than by functional relationship.Metabolic contrasts between genotypes were caused by bothqualitative and quantitative differences in the metabolic clusters,with the phenolic derivatives, higher alkanes, sesquiterpenes andlipid derived volatiles forming the major determinants. Changesof genes (expression) in such pathways would probably changecomplete clusters of volatiles, thereby affecting individual attri-butes or even overall flavour (e.g. Lewinsohn et al., 2005; Tiemanet al., 2006).
4.2. 3-Hepten-2-one: a candidate carotenoid degradation product?
Separate clustering of the three yellow genotypes F, G and Ifrom the other orange and red genotypes by PCA (Fig. 2C) sug-gested a relation with fruit colour. However, the fourth yellowgenotype H positioned among red and orange genotypes andthe metabolites, which were most discriminative between bothgroups, were mainly of phenolic origin and could therefore notbe linked to fruit colour. We do nevertheless know, that pepperfruit colour is caused by specific carotenoids from which severalvolatiles, like 6-methyl-5-hepten-2-one or b-ionone, are derived(Krammer et al., 2001). In our material, however, this class ofcarotenoid derived volatiles was only found to a very limited ex-tent, with, for example, 6-methyl-5-hepten-2-one only formed atlow intensity in the red blocky genotype B (188, SupplementaryTable 1). By contrast, the C7H12O compound 3-hepten-2-one(223), with a very similar chemical structure as 6-methyl-5-hep-ten-2-one, was widely present in our panel. PCA revealed that3-hepten-2-one, although not of phenolic origin, located withinthe phenolic cluster i (Fig. 2C), which separated the yellow geno-types from the orange and red ones. Comparing the intensity of3-hepten-2-one between genotypes with different fruit colours,3-hepten-2-one was indeed found to be on average 1.6 timeshigher in the orange genotypes and even 1.9 times higher inthe yellow genotypes against the red fruited genotypes. Thesehigher expression levels are comparable with measurements inan orange tomato mutant tg, which accumulates the orange pig-ment prolycopene and in which 3-fold higher levels of 6-methyl-5-hepten-2-one were found in comparison to the wild-type redtomato (Lewinsohn et al., 2005). Based on its chemical structureand expression pattern it therefore seems interesting to study inmore detail whether 3-hepten-2-one, like 6-methyl-5-hepten-2-one, can be a true carotenoid degradation product, explainingits higher intensity in yellow and orange fruits.
4.3. A large role for texture and sweetness/sourness in pepper flavour
The variation in taste could be reduced into two major contrasts,which were a texture related contrast and the basic sweet–sourcontrast. In tomato a similar sweet/fruity against sour/watery
contrast has been found in both a study with 16 tomato cultivars(Sinesio et al., 2010) and a study with 94 tomato varieties(Hageman, Malosetti, & Van Eeuwijk, 2010), with a texture relatedcontrast in the second principal component, which for tomato de-scribed a firmness–mealiness contrast. Although we found similarsensory contrasts as in tomato, in pepper the texture contrast ex-plained the largest part of variation (52.6%), whereas in tomatothe sweet–sour contrast was most discriminative (�45% explainedvariation).
4.4. Towards a general pepper taste model
Physical properties of the fruits, like firmness and flexibility ofthe fruit flesh or skin, were generally not measured. So far the onlymeasured physical trait was dry matter content, which correlatedwell with the texture related attributes stickiness (0.57), toughness(0.65) and juiciness (�0.61). The correlation with crunchiness wasmuch smaller (�0.15). To complement our study it would there-fore be interesting to perform physical fruit measurements in rela-tion to the texture attributes. Additionally, consumer liking data ofour genotypes would make it possible to predict overall flavour(liking) instead of individual attribute prediction. Currently weare working on the development of such a general pepper tastemodel within a Dutch research consortium (TTI-GG).
4.5. Aroma, fruity/apple taste and sweetness can be well predicted bymetabolites
Expected relations between (non-)volatiles and attributes, likesweetness and sugars, were found in addition to some new rela-tions. Neopentane was found to contribute to both aroma and fru-ity/apple taste as well as sweetness, however no flavour descriptioncould be found. The most likely explanation for neopentane beingcorrelated was that it has a very similar expression as (E)-2-hex-en-1-ol (Fig. 1, cluster d), which seemed truly predictive based onits almond, fruit and spicy odour description (Luning et al.,1994a). For fruity/apple taste and sweetness, new relations werefound with the compounds p-menth-1-en-9-al, (E)-b-ocimene,(Z)-2-penten-1-ol and (E)-geranylacetone. Taking both the flavourdescription of these compounds and the direction of their correla-tion with either fruity/apple taste or sweetness into account, itseemed reasonable that all four compounds are really contributingto the involved attribute. In our analyses we did not find an effect onflavour attributes of the well known compound 2-isobuthyl-3-methoxypyrazine, which is commonly described in sniffing portanalyses as characteristic (green) bell pepper aroma (Luning et al.,1994a; Van Ruth, Roozen, Cozijnsen, & Posthumus, 1995;Rodriguez-Burruezo et al., 2010), indicating different sensitivity ofsniffing versus taste evaluations. It should also be emphasized thatthe lists of compounds with significant contribution in attributeprediction (Table 5) do not contain all compounds with high corre-lation to the attributes. This is due to the Random Forest multiplelinear regression technique we used. For this reason there are more(often correlated) compounds contributing to the attributes, butonly the best one or two predictors from such compound clustersare listed. For example, in the case of aroma, in addition to (E)-2-hexen-1-ol and neopentane, also 2-hexenal from the same lipidderivative cluster (cluster e, Fig. 1) is strongly correlated (0.52) toaroma, but not listed in Table 5. Overall it can be concluded thatsugars and several lipid derivates from cluster e (Fig. 1), as well as(Z)-2-penten-1-ol play a big role in pepper flavour determination,influencing at least the attributes, aroma, fruity/apple taste andsweetness.
4.6. Perspectives for flavour improvement by breeding
As mentioned, several attributes could be predicted by vola-tile and/or non-volatile compounds, making the discussed com-pounds interesting targets for breeding. Attributes like,grassiness, perfume, musty, carrot, petrochemical and green beantaste could however not be significantly predicted, which wascaused by small differences between genotypes and sometimeslarge variation within genotypes, resulting in low heritabilities.Variation in these attributes seems to be caused more by envi-ronmental variation and variation in panelists’ evaluations ratherthan by strong genetic effects. From the eight significantly pre-dicted attributes, sourness had the lowest Random Forest predic-tion R2 value of only 14.5%, just above the significance thresholdfound by permutation. The only compound with a significantcontribution to sourness was an unknown C6H8O2 compound.From the organic acids, citrate showed the best relation withsourness (with a correlation of 0.34), which was however notsignificant. Organic acids therefore seem not to play a role ofimportance in pepper sourness. In tomato, however, a correlationof 0.76 was found between titratable acids (mainly citric andmalic acid) and sourness (Tandon, Baldwin, Scott, & Shewfelt,2003), while the variation and concentration of organic acidsin that study were similar as in our pepper collection. An expla-nation for the low prediction R2 of sourness could be that the ef-fect of sour related metabolites is masked by other volatile andnon-volatile compounds or texture differences. This complexnature and its low heritability (10.1%) make sourness a difficultattribute to influence by breeding. Attributes, like sweetnessand the texture attributes, showing high heritability and a widescoring range are on the other hand very amenable traits forimprovement by breeding. Moreover, based on the genotypesin our panel it seems possible to increase juiciness, crunchinessand sweetness in pepper fruits without (too much) negativeinfluence on total yield. Another way to enrich commercialbreeding programs for flavour variation would be the use ofgene bank material, since in our case, gene bank accessionPBC1405 was extreme in both the metabolic and sensory analy-ses. With this study we made significant progress in the under-standing of pepper taste. This may eventually lead to moreeffective breeding strategies towards pepper varieties with im-proved taste.
Acknowledgements
The authors kindly acknowledge Harry Jonker and Yvonne Birn-baum at Plant Research International for performing the SPME-GC–MS analyses. In addition we thank Suzanne de Wit and GeraldFreymark for technical support and useful discussions. Finally weare grateful to Laure Flament, Femke Willeboordse, Sander Bos,Tineke Benning and Paula de Grauw for performing a massive jobon sample preparation and non-volatile measurements, and allother people at Rijk Zwaan who took care of perfect greenhousemanagement.
Appendix A. Supplementary data
Supplementary data associated with this article can be found, inthe online version, at doi:10.1016/j.foodchem.2011.10.081.
References
Ben Chaim, A., Borovsky, Y., Rao, G. U., Tanyolac, B., & Paran, I. (2003). fs3.1: A majorfruit shape QTL conserved in Capsicum. Genome, 46, 1–9.
Breiman, L. (2001). Random forests. Machine Learning, 45, 5–32.Buttery, R. G., Seifert, R. M., Guadagni, D. G., & Ling, L. C. (1969). Characterization of
some volatile constituents of bell peppers. Journal of Agricultural and FoodChemistry, 17, 1322–1327.
Eggink, P. M., Haanstra, J. P. W., Tikunov, Y., Bovy, A. G., & Visser, R. G. F. (2010).Characterization of volatile and non-volatile compounds of fresh pepper(Capsicum annuum). In Advances in genetics and breeding of Capsicum andEggplant (pp. 251–259). Spain: Editorial de la Universitat Politècnica deValència.
Govindarajan, V. S. (1985). Capsicum production, technology, chemistry andquality. Part I. History, botany, cultivation and primary processing. CRCCritical Reviews in Food Science & Nutrition, 22, 109–175.
Hageman, J. A., Malosetti, M., & Van Eeuwijk, F. A. (2010). Two-mode clustering ofgenotype by trait and genotype by environment data. Euphytica, 1, 11.
Jarret, R. L., Baldwin, E., Perkins, B., Bushway, R., & Guthrie, K. (2007). Diversity offruit quality characteristics in Capsicum frutescens. HortScience, 42, 16–19.
Krammer, G. E., Werkhoff, P., Sommer, H., Schmidt, C. O., Gatfield, I., & Bertram, H. J.(2001). Carotenoid degradation products in paprika powder. In P. Winterhalteret al. (Eds.), Carotenoid-derived aroma compounds (pp. 206–219). ACSSymposium Series. Washington, DC, Vol. 802 [chapter 15].
Lefebvre, V., Daubeze, A. M., Rouppe van der Voort, J., Peleman, J., Bardin, M., &Palloix, A. (2003). QTLs for resistance to powdery mildew in pepper undernatural and artificial infections. Theoretical and Applied Genetics, 107, 661–666.
Lewinsohn, E., Sitrit, Y., Bar, E., Azulay, Y., Ibdah, M., Meir, A., et al. (2005). Not justcolors – carotenoid degradation as a link between pigmentation and aroma intomato and watermelon fruit. Trends in Food Science and Technology, 16,407–415.
Luning, P. A., de Rijk, T., Wichers, H. J., & Roozen, J. P. (1994a). Gas chromatography,mass spectrometry, and sniffing port analyses of volatile compounds of freshbell peppers (Capsicum annuum) at different ripening stages. Journal ofAgricultural and Food Chemistry, 42, 977–983.
Luning, P. A., van der Vuurst de Vries, R., Yuksel, D., Ebbenhorst-Seller, T., Wichers,H. J., & Roozen, J. P. (1994b). Combined instrumental and sensory evaluation offlavor of fresh bell peppers (Capsicum annuum) harvested at three maturationstages. Journal of Agricultural and Food Chemistry, 42, 2855–2861.
Mihaleva, V. V., Verhoeven, H. A., de Vos, R. C. H., Hall, R. D., & Van Ham, R. C. H. J.(2009). Automated procedure for candidate compound selection in GC–MSmetabolomics based on prediction of Kovats retention index. Bioinformatics, 25,787–794.
Mosciano, G. (1998). Organoleptic characteristics of flavor materials. Perfumer andFlavorist, 23, 33–36.
Rodriguez-Burruezo, A., Kollmannsberger, H., Gonzalez-Mas, M. C., Nitz, S., & Nuez,F. (2010). HS-SPME comparative analysis of genotypic diversity in volatilefraction and aroma contributing compounds of Capsicum fruits from theannuum-chinense-frutescens complex. Journal of Agricultural and FoodChemistry, 58, 4388–4400.
Sinesio, F., Cammareri, M., Moneta, E., Navez, B., Peparaio, M., Causse, M., et al.(2010). Sensory quality of fresh French and Dutch market tomatoes: Apreference mapping study with Italian consumers. Journal of Food Science, 75,55–67.
Tandon, K. S., Baldwin, E. A., Scott, J. W., & Shewfelt, R. L. (2003). Linking sensorydescriptors to volatile and non-volatile components of fresh tomato flavor.Journal of Food Science, 68, 2366–2371.
Tieman, D. M., Zeigler, M., Schmelz, E. A., Taylor, M. G., Bliss, P., Kirst, M., et al.(2006). Identification of loci affecting flavor volatile emissions in tomato fruits.Journal of Experimental Botany, 57, 887–896.
Tikunov, Y., Lommen, A., de Vos, C. H. R., Verhoeven, H. A., Bino, R. J., Hall, R. D., et al.(2005). A novel approach for nontargeted data analysis for metabolomics.Large-scale profiling of tomato fruit volatiles. Plant Physiology, 139, 1125–1137.
Van Ruth, S. M., Roozen, J. P., Cozijnsen, J. L., & Posthumus, M. A. (1995). Volatilecompounds of rehydrated French beans, bell peppers and leeks. Part II. Gaschromatography/sniffing port analysis and sensory evaluation. Food Chemistry,54, 1–7.
Velterop, J. S., & Vos, F. (2001). A rapid and inexpensive microplate assay for theenzymatic determination of glucose, fructose, sucrose, L-malate and citrate intomato (Lycopersicon esculentum) extracts and in orange juice. PhytochemicalAnalysis, 12, 299–304.