198
Edited by Advances in Cereal Crops Breeding Igor G. Loskutov Printed Edition of the Special Issue Published in Plants www.mdpi.com/journal/plants
| Date post: | 24-Feb-2023 |
| Category: |
Documents |
| Upload: | khangminh22 |
| View: | 0 times |
| Download: | 0 times |
Edited by
Advances in Cereal Crops Breeding
Igor G. Loskutov
Printed Edition of the Special Issue Published in Plants
www.mdpi.com/journal/plants

Advances in Cereal Crops Breeding

Advances in Cereal Crops Breeding
Editor
Igor G. Loskutov
MDPI • Basel • Beijing • Wuhan • Barcelona • Belgrade • Manchester • Tokyo • Cluj • Tianjin
Editor
Igor G. Loskutov
N. I. Vavilov Institute of Plant
Genetic Resources (VIR)
Russia
Editorial Office
MDPI
St. Alban-Anlage 66
4052 Basel, Switzerland
This is a reprint of articles from the Special Issue published online in the open access journal
Plants (ISSN 2223-7747) (available at: https://www.mdpi.com/journal/plants/special issues/
Cereal Breeding Advance).
For citation purposes, cite each article independently as indicated on the article page online and as
indicated below:
LastName, A.A.; LastName, B.B.; LastName, C.C. Article Title. Journal Name Year, Volume Number,
Page Range.
ISBN 978-3-0365-2650-8 (Hbk)
ISBN 978-3-0365-2651-5 (PDF)
Cover image courtesy of Igor G. Loskutov
© 2021 by the authors. Articles in this book are Open Access and distributed under the Creative
Commons Attribution (CC BY) license, which allows users to download, copy and build upon
published articles, as long as the author and publisher are properly credited, which ensures maximum
dissemination and a wider impact of our publications.
The book as a whole is distributed by MDPI under the terms and conditions of the Creative Commons
license CC BY-NC-ND.
Contents
About the Editor . . . . . . . . . . . . . . . . . . . . . . . . . . . . . . . . . . . . . . . . . . . . . . vii
Preface to ”Advances in Cereal Crops Breeding” . . . . . . . . . . . . . . . . . . . . . . . . . . . ix
Igor G. Loskutov
Advances in Cereal Crops BreedingReprinted from: Plants 2021, 10, 1705, doi:10.3390/plants10081705 . . . . . . . . . . . . . . . . . . 1
Igor G. Loskutov and Elena K. Khlestkina
Wheat, Barley, and Oat Breeding for Health Benefit Components in GrainReprinted from: Plants 2021, 10, 86, doi:10.3390/plants10010086 . . . . . . . . . . . . . . . . . . . 5
Mohamed M. Kamara, Medhat Rehan, Khaled M. Ibrahim, Abdullah S. Alsohim, Mohsen
M. Elsharkawy, Ahmed M. S. Kheir, Emad M. Hafez and Mohamed A. El-Esawi
Genetic Diversity and Combining Ability of White Maize Inbred Lines under DifferentPlant DensitiesReprinted from: Plants 2020, 9, 1140, doi:10.3390/plants9091140 . . . . . . . . . . . . . . . . . . . 23
Elena Dubina, Pavel Kostylev, Margarita Ruban, Sergey Lesnyak, Elena Krasnova and Kirill
Azarin
Rice Breeding in Russia Using Genetic MarkersReprinted from: Plants 2020, 9, 1580, doi:10.3390/plants9111580 . . . . . . . . . . . . . . . . . . . 47
Ilya Kirov, Maxim Dudnikov, Pavel Merkulov, Andrey Shingaliev, Murad Omarov, Elizaveta
Kolganova, Alexandra Sigaeva, Gennady Karlov and Alexander Soloviev
Nanopore RNA Sequencing Revealed Long Non-Coding and LTR Retrotransposon-RelatedRNAs Expressed at Early Stages of Triticale SEED DevelopmentReprinted from: Plants 2020, 9, 1794, doi:10.3390/plants9121794 . . . . . . . . . . . . . . . . . . . 61
Arfang Badji, Lewis Machida, Daniel Bomet Kwemoi, Frank Kumi, Dennis Okii, Natasha
Mwila, Symphorien Agbahoungba, Angele Ibanda, Astere Bararyenya, Selma Ndapewa
Nghituwamhata, Thomas Odong, Peter Wasswa, Michael Otim, Mildred Ochwo-Ssemakula,
Herbert Talwana, Godfrey Asea, Samuel Kyamanywa and Patrick Rubaihayo
Factors Influencing Genomic Prediction Accuracies of Tropical Maize Resistance to FallArmyworm and WeevilsReprinted from: Plants 2021, 10, 29, doi:10.3390/plants10010029 . . . . . . . . . . . . . . . . . . . 81
Mahmoud M. Gaballah, Azza M. Metwally, Milan Skalicky, Mohamed M. Hassan, Marian
Brestic, Ayman EL Sabagh and Aysam M. Fayed
Genetic Diversity of Selected Rice Genotypes under Water Stress ConditionsReprinted from: Plants 2021, 10, 27, doi:10.3390/plants10010027 . . . . . . . . . . . . . . . . . . . 103
Jiajia Liu, Qi Zhang, Deyuan Meng, Xiaoli Ren, Hanwen Li, Zhenqi Su, Na Zhang, Liya Zhi,
Jun Ji, Junming Li, Fa Cui and Liqiang Song
QMrl-7B Enhances Root System, Biomass, Nitrogen Accumulation and Yield in Bread WheatReprinted from: Plants 2021, 10, 764, doi:10.3390/plants10040764 . . . . . . . . . . . . . . . . . . 123
v
Thao Duc Le, Floran Gathignol, Huong Thi Vu, Khanh Le Nguyen, Linh Hien Tran, Hien
Thi Thu Vu, Tu Xuan Dinh, Francoise Lazennec, Xuan Hoi Pham, Anne-Alienor Very, Pascal
Gantet and Giang Thi Hoang
Genome-Wide Association Mapping of Salinity Tolerance at the Seedling Stage in a Panel ofVietnamese Landraces Reveals New Valuable QTLs for Salinity Stress Tolerance Breeding inRiceReprinted from: Plants 2021, 10, 1088, doi:10.3390/plants10061088 . . . . . . . . . . . . . . . . . . 141
Shivani Saini, Navdeep Kaur, Deeksha Marothia, Baldev Singh, Varinder Singh, Pascal
Gantet and Pratap Kumar Pati
Morphological Analysis, Protein Profiling and Expression Analysis of Auxin HomeostasisGenes of Roots of Two Contrasting Cultivars of Rice Provide Inputs on Mechanisms Involvedin Rice Adaptation towards Salinity StressReprinted from: Plants 2021, 10, 1544, doi:10.3390/plants10081544 . . . . . . . . . . . . . . . . . . 165
vi
About the Editor
Igor G. Loskutov was born in 1956. In 1978, he graduated from Saint Petersburg State University
with a diploma of Agrochemistry and Soil Science. In 1985, he completed his Ph. D (plant breeding)
and in 2003, his D. Sc. (botany and plant breeding) from N.I. Vavilov Institute of Plant Genetic
Resources (VIR).
He has vast experience in different areas of Plant Genetic Resources: the theoretical, practical and
legislative aspects of collecting, evaluation and storage of plant genetic resources; botany, systematic,
evolution, distribution and diversity of cultivated and wild oats; genomic, genetics and breeding of
the main characters and properties of cereals.
At present, he is Head of the Department of Genetic Resources of Oat, Barley and Rye, N.I.
Vavilov Institute of Plant Genetic Resources (VIR), Russia; Professor of Department of Agrochemistry,
Biology Faculty, Sankt-Petersburg State University, Russia.
He was supervisor of 8 Bachelors and 3 Masters of Science Dissertations in St-Petersburg State
University and supervisor of 10 PhD Dissertations in Vavilov Institute of Plant Genetic Resources.
He has published 437 papers in Soviet/Russian national and international peer-reviewed
journals such as Euphytica, J. Bot., Genome, J. Agric. Food Chem., Gen. Res. Crop Evol., Rus. J. Gen.:
Appl. Res., Rus. J. Gen., Agronomy, Plants, Molecules, etc., and from different journals and book of
Springer. He is editorial board member of several International Journals. He has six monographs.
He has six Russian patents. Prof. Loskutov also played an instrumental role in different prestigious
Russian and internal collaborative research projects with USA, Germany, Italy, Switzerland, Sweden,
France, China, etc.
As a Visiting Professor, he made some lectures in Universities and Research Institutes in USA,
Germany, Italy, China, Brazil, Sweden, Tajikistan, Finland, France, UK, Turkey, Israel, etc.
vii

Preface to ”Advances in Cereal Crops Breeding”
This Special Issue presents some advances in the results of cereal crop breeding. These studies
address only some of the bottlenecks in the breeding of specific crops. At the same time, the advances
in the modern breeding of grain crops are multifaceted and diverse, occurring in different countries
and different continents of the world. At present, in the breeding of agricultural crops, the factor of
climate change and the associated changing conditions for the cultivation of many crops important
for humanity are becoming increasingly important. Climate change can lead to an excess and a sharp
shortage of precipitation, coupled with an increase in temperature, which will affect edaphic factors
of plant growth and development, expressed in the salinization/acidification or drying out of the
soil. On the other hand, this can lead to the emergence of new diseases and stronger epiphytoties of
already known diseases, or to a greater spread of agricultural pests. The above factors ultimately
affect the productivity and quality of the products obtained, on which the food security of each
country depends. In future, breeders of the world will be assisted in solving many of these problems,
along with the traditional ones, using recently developed “omix” genotyping technologies.
Igor G. Loskutov
Editor
ix

plants
Editorial
Advances in Cereal Crops Breeding
Igor G. Loskutov
Citation: Loskutov, I.G. Advances in
Cereal Crops Breeding. Plants 2021,
10, 1705. https://doi.org/10.3390/
plants10081705
Received: 9 August 2021
Accepted: 16 August 2021
Published: 19 August 2021
Publisher’s Note: MDPI stays neutral
with regard to jurisdictional claims in
published maps and institutional affil-
iations.
Copyright: © 2021 by the author.
Licensee MDPI, Basel, Switzerland.
This article is an open access article
distributed under the terms and
conditions of the Creative Commons
Attribution (CC BY) license (https://
creativecommons.org/licenses/by/
4.0/).
Federal Research Center the N.I. Vavilov All-Russian Institute of Plant Genetic Resources (VIR),St. Petersburg 190000, Russia; [email protected]
Cereals are the main food and feed crops on our planet, with wheat, rice, and maizeoccupying three-quarters of the total acreage. The vast majority of plant breeders andplant geneticists around the world are engaged in cereal breeding. The genetic resourcesfor crop genepools, including breeding and research materials, landraces, and wild croprelatives, which collectively are the pillars of modern plant breeding, are maintained ex situin gene banks. The main challenges or bottlenecks in the advanced breeding techniquescurrently used in cereals are connected with concerns related to climate change, withbreeding programs aiming to increase yield and tolerance to biotic and abiotic stresses(e.g., yield potential and resistance to main diseases and pets, as well as increased drought,heat tolerance, and nutrient efficiency). In the last few years, a trend has occurred incereal crop breeding aimed at combining high agronomic and biochemical parameters in asingle cultivar. Currently, traditional genetic and innovative molecular genetic methods arewidely used in the breeding of grain crops. The success of biotechnology approaches hasexpanded the breeding possibilities and allowed interspecies and intergenus hybrids to beobtained. The development of molecular biology and genomics has completely overcomethe barriers limiting the breeding of living organisms, while methods for genome editingof agricultural crops are still being improved to achieve higher levels of accuracy. Studiesaimed at finding genes and quantitative traits loci (QTLs) that affect the main breedingtraits and at identifying the desired allelic variants are currently relevant. In the fieldof genetic sequencing, genotyping by sequencing, also called GBS, is a method used todiscover single-nucleotide polymorphisms (SNP) in order to perform genotyping studies,such as genome-wide association studies (GWAS).
The acquisition of large-scale phenotypic data has become one of the major bottleneckshindering crop breeding and functional genomics studies. Nevertheless, recent technologi-cal advances have provided potential solutions to relieve such bottlenecks and to exploreadvanced methods for large-scale phenotyping, data acquisition, and data processing inthe coming years. The phenomics data generated are already beginning to be used toidentify genes and QTL through QTL mapping, association mapping, and genome-wideassociation studies (GWAS), in order to achieve crop improvements through genomics-assisted breeding (GAB). There is no doubt that accurate high-throughput phenotypingplatforms will accelerate improvements in plant genetics.
This Special Issue on ‘Advances in Cereal Crops Breeding’ comprises 9 papers coveringa wide array of aspects, ranging from the expression-level investigation of genes in terms ofsalinity stress adaptations and their relationships with proteomics in rice, the use of geneticanalysis to assess the general combining ability (GCA) and specific combining ability(SCA) in promising hybrids of maize, the use of DNA markers based on PCR in rice, theidentification of quantitative trait loci (QTLs) in wheat and simple sequence repeats (SSR)in rice, the use of single-nucleotide polymorphisms (SNP) in a genome-wide associationstudy (GWAS) in cereals, and Nanopore direct RNA sequencing of related with LTR RNAretrotransposon in triticale prior to genomic selection of heterotic maize hybrids.
In order to better understand the mechanisms involved in salinity stress adaptationsin rice, two contrasting rice cultivars were compared in a recent study—Luna Suvarna, asalt-tolerant cultivar, and IR64, a salt-sensitive cultivar. The expression-level investigation
Plants 2021, 10, 1705. https://doi.org/10.3390/plants10081705 https://www.mdpi.com/journal/plants
1
Plants 2021, 10, 1705
of auxin signaling pathway genes revealed increases in the transcript levels of several auxinhomeostasis genes in Luna Suvarna compared with IR64 under salinity stress. Furthermore,protein profiling showed 18 proteins that were differentially regulated between the roots oftwo cultivars, some of which were salinity-stress-responsive proteins found exclusively inthe proteome of Luna Suvarna roots, revealing the critical role of these proteins in impartingsalinity stress tolerance. The results show that Luna Suvarna involves a combination ofmorphological and molecular traits of the root system that could prime the plant to bettertolerate salinity stress [1].
The tolerance of rice to salinity stress involves diverse and complementary mecha-nisms, such as the regulation of genome expression, activation of specific ion transportsystems to manage excess sodium at the cell or plant level, and anatomical changes thatmitigate sodium penetration into the inner tissues of the plant. The identification of salinitytolerance QTLs associated with different mechanisms involved in salinity tolerance requiresthe greatest possible genetic diversity to be explored. In the investigation of genotypedrice landraces, SNP markers were used, with the aim of identifying new QTLs involvedin salinity stress tolerance via a genome-wide association study (GWAS). Twenty-oneidentified QTLs colocalized with known QTLs. Several genes within these QTLs have func-tions related to salinity stress tolerance and are mainly involved in gene regulation, signaltransduction, and hormone signaling. This study provides promising QTLs for breedingprograms to enhance salinity tolerance and identifies candidate genes that should be furtherfunctionally studied to better understand salinity tolerance mechanisms in rice [2].
In addition to water flooding and salinity, rice growers in some parts of the world arealso facing drought; thus, developing new rice genotypes tolerant to water scarcity is one ofthe best strategies to maximize yield potential and achieve water savings. In a recent study,rice genotypes were characterized for grain and agronomic parameters under normal anddrought stress conditions and genetic differentiation was determined via specific DNAmarkers related to drought tolerance using simple sequence repeats (SSR) and cultivargrouping, establishing their genetic relationships with different traits. All genotypes weregrouped into two major clusters with 66% similarity based on Jaccard’s similarity index.As a result of the study, genotypes were identified that could be included as appropriatematerials for developing a drought-tolerant breeding program. Genetic diversity is neededto grow new rice cultivars that combine drought tolerance with high grain yields, which isessential to maintaining food security [3].
Recent studies on the tolerance to biotic and abiotic stressors in rice hybrids withdonor lines of the genes of interest showed the effectiveness of such hybrids. As a resultof the studies carried out using molecular marking based on PCR in combination withtraditional breeding, early-maturing rice lines with genes resistant to salinity (SalTol) andflooding (Sub1A) were obtained, which are suitable for cultivation in southern Russia. Thedevelopment of resistant rice varieties and their introduction into production will allow usto avoid the epiphytotic development of the disease, preserving the biological productivityof rice and resulting in environmentally friendly agricultural products [4].
The combining ability and genetic diversity of plants are important prerequisites forthe development of outstanding hybrids that are tolerant to high plant density. A recentstudy was carried out to assess general combining ability (GCA) and specific combiningability (SCA), identify promising hybrids, estimate genetic diversity among the inbredlines, and correlate genetic distance (GD) to hybrid performance and SCA across differentplant densities. As a result, no significant correlation was found between GD and eitherhybrid performance or SCA for grain yield and other traits, proving to be of no predictivevalue. Nevertheless, SCA could be used to predict hybrid performance across all plantdensities. Overall, this study presents useful information regarding the inheritance ofmaize grain yield and other important traits under high plant density [5].
In addition to studying the productivity of plants and genes associated with generaladaptability, the genetic improvement of root systems is of interest as an efficient approachto improve the yield potential and nitrogen use efficiency (NUE) of crops. QMrl-7B is a
2
Plants 2021, 10, 1705
major stable quantitative trait locus (QTL) controlling the maximum root length in wheat.Two types of near isogenic lines (A-NILs with superior and B-NILs with inferior alleles)were used to specify the effects of QMrl-7B on root, grain output, and nitrogen-relatedtraits under both low-nitrogen (LN) and high-nitrogen (HN) environments. The QMrl-7BA-NILs manifested larger root systems compared to the B-NILs, which is favorable to Nuptake and accumulation, and eventually enhanced grain production. This study providesvaluable information for the genetic improvement of root traits and breeding of elite wheatvarieties with high yield potential [6].
Traditional plant breeding approaches supplemented with SNP markers used forgenome-wide associative studies (GWASs) and genetic editing, as well as high-throughputchemotyping techniques, are exploited to speed up the breeding of desired genotypes.To enrich cereal grains with functional components, the new breeding programs need asource of genes in order to improve the contents of the beneficial components. The sourcesof these valuable genes are plant genetic resources deposited in genebanks, includinglandraces, rare crop species, and even wild relatives of cultivated plants. Correlationsbetween the contents of certain bioactive compounds and the resistance to diseases ortolerance to certain abiotic stressors suggest that breeding programs aimed at increasingthe levels of health-benefiting components in cereal grain might at the same time allow thedevelopment of cultivars adapted to unfavorable environmental conditions [7].
Using Nanopore long-term forward RNA sequencing, functionally important but un-explored RNA molecules have been identified, including long non-coding RNAs (lncRNAs),as they are often associated with repeat-rich regions of genomes and transposon-derivedtranscripts expressed during early stages of seed development in triticale. Detailed analysisof the protein-coding potential of the RTE-RNAs showed that 75% of them carry openreading frames (ORFs) for a diverse set of GAG proteins, the main components of virus-like particles of LTR retrotransposons. This demonstrated experimentally that certainRTE-RNAs originate from autonomous LTR retrotransposons, with ongoing transpositionactivity during early stages of triticale seed development. Overall, these results providea framework for further exploration of the newly discovered lncRNAs and RTE-RNAsin functional and genome-wide association studies in triticale and wheat. The resultsalso demonstrate that Nanopore direct RNA sequencing is an indispensable tool for theelucidation of lncRNA and retrotransposon transcripts [8].
Genomic selection (GS) shows great promise in terms of strongly increasing ratesof genetic improvement in plant breeding programs. It allows for comparative largergains from selection by estimating all marker effects simultaneously, while the subsequentselection of genetically superior individuals is based on their genomic estimated breedingvalue (GEBV) instead of using a few significant markers, as is the case in classical marker-assisted selection (MAS). GS is ideal for complex traits with lower heritability and complexgenetic architectures.
Genomic selection (GS) can accelerate variety improvement when the training set(TS) size and its relationship with the breeding set (BS) are optimized for the predictionaccuracies (PAs) of genomic prediction (GP) models. Sixteen GP algorithms were run onphenotypic best linear unbiased predictors (BLUPs) and best linear unbiased estimators(BLUEs) of resistance to both fall armyworm (FAW) and maize weevil (MW) in a tropicalmaize panel. Random-based training sets (RBTS) and pedigree-based training sets (PBTSs)were designed to study biotic resistance. For PBTS, the FAW resistance PAs were generallyhigher than those for RBTS, except for one dataset. GP models generally showed similarPAs across individual traits, whilst the TS designation was determinant, since a positivecorrelation between TS size and PAs was observed for RBTS, while for the PBTS, thiscorrelation was negative. The resulting population could be of interest in future breedingactivities targeted at improving insect resistance in maize and could be potentially usefulfor GS of complex traits with low to moderate heritability. This study has pioneered theuse of GS for maize resistance to insect pests [9].
3
Plants 2021, 10, 1705
Advances in cereals breeding to develop new improved cultivars are some of themost important factors in agricultural production, playing an essential role in ensuringsustainable agriculture. Along with classical breeding goals, innovative, modern plantbreeding methodologies are applied here to create new cultivars of crops for current andfuture agriculture applications. This endeavor includes the development of cultivars forstress cultivation conditions to achieve sustainable agricultural production, increased foodquality, and increased security, and to supply raw materials for innovative industrialproducts and to meet the needs of mankind.
Funding: This research received no external funding.
Conflicts of Interest: The authors declare no conflict of interest.
References
1. Saini, S.; Kaur, N.; Marothia, D.; Singh, B.; Singh, V.; Gantet, P.; Pati, P. Morphological Analysis, Protein Profiling and ExpressionAnalysis of Auxin Homeostasis Genes of Roots of Two Contrasting Cultivars of Rice Provide Inputs on Mechanisms Involved inRice Adaptation towards Salinity Stress. Plants 2021, 10, 1544. [CrossRef]
2. Le, T.; Gathignol, F.; Vu, H.; Nguyen, K.; Tran, L.; Vu, H.; Dinh, T.; Lazennec, F.; Pham, X.; Véry, A.-A.; et al. Genome-WideAssociation Mapping of Salinity Tolerance at the Seedling Stage in a Panel of Vietnamese Landraces Reveals New Valuable QTLsfor Salinity Stress Tolerance Breeding in Rice. Plants 2021, 10, 1088. [CrossRef]
3. Gaballah, M.M.; Metwally, A.M.; Skalicky, M.; Hassan, M.M.; Brestic, M.; El Sabagh, A.; Fayed, A.M. Genetic Diversity of SelectedRice Genotypes under Water Stress Conditions. Plants 2021, 10, 27. [CrossRef]
4. Dubina, E.; Kostylev, P.; Ruban, M.; Lesnyak, S.; Krasnova, E.; Azarin, K. Rice Breeding in Russia Using Genetic Markers. Plants2020, 9, 1580. [CrossRef]
5. Kamara, M.M.; Rehan, M.; Ibrahim, K.M.; Alsohim, A.S.; Elsharkawy, M.M.; Kheir, A.M.S.; Hafez, E.M.; El-Esawi, M.A. GeneticDiversity and Combining Ability of White Maize Inbred Lines under Different Plant Densities. Plants 2020, 9, 1140. [CrossRef]
6. Liu, J.; Zhang, Q.; Meng, D.; Ren, X.; Li, H.; Su, Z.; Zhang, N.; Zhi, L.; Ji, J.; Li, J.; et al. QMrl-7B Enhances Root System, Biomass,Nitrogen Accumulation and Yield in Bread Wheat. Plants 2021, 10, 764. [CrossRef]
7. Loskutov, I.G.; Khlestkina, E.K. Wheat, Barley, and Oat Breeding for Health Benefit Components in Grain. Plants 2021, 10, 86.[CrossRef]
8. Kirov, I.; Dudnikov, M.; Merkulov, P.; Shingaliev, A.; Omarov, M.; Kolganova, E.; Sigaeva, A.; Karlov, G.; Soloviev, A. NanoporeRNA Sequencing Revealed Long Non-Coding and LTR Retrotransposon-Related RNAs Expressed at Early Stages of TriticaleSEED Development. Plants 2020, 9, 1794. [CrossRef]
9. Badji, A.; Machida, L.; Kwemoi, D.B.; Kumi, F.; Okii, D.; Mwila, N.; Agbahoungba, S.; Ibanda, A.; Bararyenya, A.; Nghituwamhata,S.N.; et al. Factors Influencing Genomic Prediction Accuracies of Tropical Maize Resistance to Fall Armyworm and Weevils.Plants 2021, 10, 29. [CrossRef]
4
plants
Review
Wheat, Barley, and Oat Breeding for Health BenefitComponents in Grain
Igor G. Loskutov * and Elena K. Khlestkina
Citation: Loskutov, I.G.; Khlestkina,
E.K. Wheat, Barley, and Oat Breeding
for Health Benefit Components in
Grain. Plants 2021, 10, 86. https://
doi.org/10.3390/plants10010086
Received: 3 December 2020
Accepted: 30 December 2020
Published: 3 January 2021
Publisher’s Note: MDPI stays neutral
with regard to jurisdictional clai-ms
in published maps and institutio-nal
affiliations.
Copyright: © 2021 by the authors.
Licensee MDPI, Basel, Switzerland.
This article is an open access article
distributed under the terms and
conditions of the Creative Commons
Attribution (CC BY) license (https://
creativecommons.org/licenses/by/
4.0/).
Federal Research Center the N.I. Vavilov All-Russian Institute of Plant Genetic Resources (VIR),St. Petersburg 190000, Russia; [email protected]* Correspondence: [email protected]
Abstract: Cereal grains provide half of the calories consumed by humans. In addition, they containimportant compounds beneficial for health. During the last years, a broad spectrum of new cerealgrain-derived products for dietary purposes emerged on the global food market. Special breedingprograms aimed at cultivars utilizable for these new products have been launched for both the mainsources of staple foods (such as rice, wheat, and maize) and other cereal crops (oat, barley, sorghum,millet, etc.). The breeding paradigm has been switched from traditional grain quality indicators (forexample, high breadmaking quality and protein content for common wheat or content of protein,lysine, and starch for barley and oat) to more specialized ones (high content of bioactive compounds,vitamins, dietary fibers, and oils, etc.). To enrich cereal grain with functional components whilegrowing plants in contrast to the post-harvesting improvement of staple foods with natural andsynthetic additives, the new breeding programs need a source of genes for the improvement of thecontent of health benefit components in grain. The current review aims to consider current trends andachievements in wheat, barley, and oat breeding for health-benefiting components. The sources ofthese valuable genes are plant genetic resources deposited in genebanks: landraces, rare crop species,or even wild relatives of cultivated plants. Traditional plant breeding approaches supplemented withmarker-assisted selection and genetic editing, as well as high-throughput chemotyping techniques,are exploited to speed up the breeding for the desired genotуpes. Biochemical and genetic bases forthe enrichment of the grain of modern cereal crop cultivars with micronutrients, oils, phenolics, andother compounds are discussed, and certain cases of contributions to special health-improving dietsare summarized. Correlations between the content of certain bioactive compounds and the resistanceto diseases or tolerance to certain abiotic stressors suggest that breeding programs aimed at raisingthe levels of health-benefiting components in cereal grain might at the same time match the task ofdeveloping cultivars adapted to unfavorable environmental conditions.
Keywords: barley; breeding; marker-assisted selection; genes; genetic resources; genome editing;health benefits; metabolomics; oat; QTL; wheat
1. Introduction
Cereal crops are the main food and feed sources worldwide, supplying more than halfof the calories consumed by humans [1]. An overwhelming majority of plant breeders andgeneticists work on no other crops but cereals. Breeding methods depend on the biologicalfeatures of a crop and on the genetic research standards, traditions, economic objectives,and levels of agricultural technologies in the country where plant breeding is underway.The general breeding trend of the past decades, however, was finding solutions to theproblem of higher yields in cereal crops; furthermore, special attention was paid in manycountries to increasing plant resistance against diseases and various abiotic stressors. Theconcentration of all efforts on these two targets and none other resulted in a certain declinein the genetic diversity in those plant characters that are associated with the biochemicalcomposition of cereal grain [2]. In the last few years, cereal crop breeding generated a trend
Plants 2021, 10, 86. https://doi.org/10.3390/plants10010086 https://www.mdpi.com/journal/plants
5
Plants 2021, 10, 86
aimed at combining high biochemical and agronomic parameters in one cultivar [3–5]. Inaddition to protein, cereal grains are rich in other chemical compounds, such as fats withtheir good assimilability by the organism and a well-balanced composition of chemicalconstituents, including fatty acids [6–10], vitamins of the B, A, Е, and F groups, organiccompounds of iron, calcium, phosphorus, manganese, copper, molybdenum, and othertrace elements [3], and diverse biologically active compounds–polysaccharides, phenoliccompounds, carotenoids, tocopherols, avenanthramides, etc.
In recent years, the world food market has seen the emergence of a wide range ofnew cereal crop products designed for dietetic purposes. Currently, available data confirmthe importance of biochemical composition in cereal crop grains since it underpins theirdietetic, prophylactic, and curative effect on the human organism [11]. Cereals are rich inprotein, starch, oils, vitamins, micronutrients, and various antioxidants. The research thatexamines the potential of a number of cereal crops for prophylactic or medicinal uses hasbeen expanding from year to year [12–16]. In addition to determining types of bioactivityfor different grain components, an important challenge is to concentrate further efforts ofresearchers on disclosing the mechanisms of their effect [17].
It is admitted that breeding techniques can help to increase the percentage of indi-vidual constituents in the grain to a very high level. An important role in promoting thisbreeding trend is played by the achievements in modern genetics of cereal crops and traitsassociated with the quality and dietary value of their products. New breeding programsimply that the developed high-yielding cultivars will combine maximum contents of theabovementioned components and optimal correlations among them with other grain qual-ity indicators and resistance to biotic stressors. Marker-assisted selection techniques areused more and more often to accelerate the development of cultivars enriched in usefulgrain components [4,18]. There are examples of the works employing genetic editingtechnologies for these purposes [19–21]. The current review aims to consider current trendsand achievements in wheat, barley, and oat breeding for health-benefiting components.
2. Major Dietary Components in Grain and Breeding Programs for Health Benefit
2.1. Micronutrients
The long-standing problem of micronutrient deficiencies in human diets is the mostsignificant for public healthcare worldwide. It is especially true for cereal-based diets:They are poor in both the number of micronutrients and their bioavailability for theorganism since breeding of these major food and feed crops primarily aims at developinghigher-yielding varieties to meet global demand. Due to dilution effects, an increase ingrain mass sometimes causes a reduction in micronutrient contents. In most countries,people eat meals produced from cereal crops with low micronutrient content; it is a seriousglobal problem invoked by the uniformity of different diets and may lead to significanthealth deteriorations [22,23]. Iron-deficiency anemia is one of the most widespread healthdisorders provoked by the worldwide deficit in micronutrients [24], while zinc deficiencyin food is faced on average by one-third of the world’s population [25]. Increasing thecontent of these trace elements in wheat by breeding techniques is considered one of theways to enhance the consumption of micronutrients with food [26].
It has been noticed that cereal crop cultivars can be enriched in the desired micronu-trients through the application of agricultural practices or by plant breeding [22,27–30].Such procedures, however, might lead to an increase in micronutrient content in leaves butnot in grain [31]. Methods combining breeding and agrochemical approaches were pro-posed to solve this problem: They helped accumulate micronutrients in the edible parts ofplants [27–29,32]. There are considerable variations in the concentration of micronutrientsin seeds or kernels of most crops [3,32]. Genetic variability in the micronutrient content isoften observed to be less expressed in fruit and more in leaves. Nevertheless, screeninglarge collections of staple cereal crops reveals extensive diversity of micronutrient concen-trations in their grains [26,32,33]. Increased content of most micronutrients was observed
6
Plants 2021, 10, 86
in local varieties and landraces of wheat and other cereals, compared with improvedcommercial cultivars [34].
The content of micronutrients in grain was analyzed in 65 commercial Russian cul-tivars of four major cereal crops: wheat, barley, rye, and oat. Statistically significantvariations were found in the content of all studied trace elements (Fe, Zn, and Mn). Thehighest levels were registered for barley and oat cultivars. Among barley genotypes, thecontent of Fe, Zn, and Mn varied with a 3-to 5.5-fold difference between the extremes(Table 1). Oat cultivars manifested a 7-fold difference between the extremes in the Zncontent and nearly 3-fold in Mn [3].
Table 1. Average values and ranges for the content of micronutrients (Fe, Mn, Zn) in caryopses ofcereal crops [3].
CropsContent, mg/kg
Fe Mn Zn
Winter soft wheat (Triticum aestivum L.) 21.8 (19−4) 4.3 (3.3−4.9) 17.1 (13−21)Spring soft wheat (T. aestivum) 17.5 (15−22) 3.3 (2.4−4.1) 19.2 (14−22)
Soft wheat (mean) 19.7 (15−24) 3.8 (2.4−4.9) 18.2 (13−22)Winter and spring rye (Secale cereale L.) 20.3 (14−30) 4.2 (2.6−7.0) 18.4 (15−24)
Spring barley (Hordeum vulgare L.) 33.2 (24−79) 10.1 (7−21) 10.6 (6−33)Oats (Avena sativa L.) 26.7 (19−37) 6.1 (3.5−9.9) 26.3 (10−70)
A detailed study of a set of commercial oat cultivars of different geographical originin the context of their micronutrient content and biochemical parameters showed thatgenotypic differences in the Fe and Zn levels in grain were small (1.9–2.7 times), but inMn, they were relatively high (10.5 times). A 1.8-fold difference was observed between thelowest (10.9%) and the highest (19.3%) protein content levels in oat grain [3]. A wide rangeof variation in oil content (2.7–8.1%) was found in all studied oat accessions. The amountsof protein, oil, oleic acid, and Zn in grain demonstrated statistically significant positivecorrelations among themselves [3]. The identified oat cultivars with high nutritive valuewill be included in breeding programs and used directly in high-quality food production.
Molecular-genetic research on 335 spring barley accessions was conducted for moreeffective utilization of the micronutrient diversity in cereal crop breeding. A genome-wideassociation study (GWAS) was employed for mapping quantitative trait loci (QTL) linkedto the content of macro- and micronutrients in grain (Fe, Zn, Ba, Ca, Cu, K, Mg, Mn, Na, P,S, Si, and Sr). The analyses of the tested populations helped to identify specific QTL foreach of the studied indicators and map them on chromosomes. The QTL identified arevaluable for the future development of barley cultivars with increased content of nutrients,especially Zn and Fe [35].
2.2. β-glucans
A physiologically important dietary component in the grain is (1,3;1,4)-β-D-glucan,or the non-starchy water-soluble polysaccharide β-glucan. This component is reportedto be typical of some species of the Poaceae family: its content varies within 3–11% inbarley, 1–2% in rye, and <1% in wheat, while in other cereals, it is present only in traceamounts [36]. At the same time, the content and composition of dietary fibers in variouscereal crop species are genetically determined. It means, as opined by many scientists, thatit is possible to produce new lines of such crops with different correlations between thelevels of β-glucan polysaccharides and arabinoxylans that would be optimal for varioususes [37–39]. Studying of the β-glucan content in oat and barley cultivars is associatedwith their uses for dietetic and medical purposes [37,38].
The β-glucans are not evenly distributed within a grain: its larger amount is foundin the endosperm cell walls, aleurone, and subaleurone layers, and its content variesfrom 1.8 to 7% [40,41]. The concentration of β-glucans in oat grain and their degree of
7
Plants 2021, 10, 86
polymerization depend not only on the cultivar but also on the conditions of cultivation,grain processing, and post-harvest storage [42].
The presence in the grain of a higher amount of β-glucans, which are dietary soluble fiber(or soluble non-starch polysaccharide), determines the viscosity of oat and barley broths, whichhave a beneficial effect on important functions of the human gastrointestinal tract, so they arewidely used in the food industry for dietetic and curative purposes [36,43]. Among numerousproducts of barley and oat biosynthesis, probably the most valuable for the human organismis soluble cellulose fibers and β-glucans first of all (also arabinoxylan, xyloglucan, and someother secondary cellulose components), as they can reduce the level of cholesterol in the bloodand noticeably mitigate the risk of cardiovascular diseases [38,44,45]. Multiple evidence of thebeneficial role played by β-glucans impelled the U.S. Food and Drug Administration (FDA)to make an official statement that soluble dietary fibers extracted from whole oat grain toproduce flakes, bran, or flour helped to reduce the risks of cardiovascular diseases [46].Insoluble fractions of dietary fiber are partly cellulose, xylose, and arabinose [39]. Insolubledietary fiber has general gastrointestinal effects and, in most cases, has an impact on weightloss. There is convincing evidence that β-glucans contained in oat grain are partiallyresponsible for decreasing the levels of glucose in the human blood and of cholesterol inserum [12]; it is associated with its physicochemical and rheological characteristics, such asmolecular weight, solubility in water, and a viscosity [42,47].
Genetic diversity of barley and oats in the content of β-glucans in their grain was eval-uated in the framework of two European Union (EU) programs. The HEALTHGRAIN Di-versity Screen project resulted in finding significant differences in the content of β-glucansand antioxidants in the grain of five tested oat cultivars [48]. The AVEQ project (Avenagenetic resources for quality in human consumption) analyzed 658 oat cultivars and con-firmed the contribution of both genetic and environmental aspects to the formation of thetested character [49]. It is worth mentioning that, compared with cultivated and other wilddi- and tetraploid oat species, higher contents of β-glucans and other antioxidants werefound in the hexaploid (wild) A. fatua, A. occidentalis, and (cultivated) A. byzantina, anddiploid (wild|) A. atlantica [38,39,49–51].
Measuring the content of β-glucans in oat grain in large and diverse sets of cultivarsand species showed that its values were significantly dispersed [37,38,49]. Naked oatforms demonstrated a higher total content of the analyzed polysaccharide than hulledones, but the latter contained more insoluble β-glucans in their grain [52–54]. Computermodeling helped to provide a ranking of the factors affecting the β-glucan content in hulledand naked oat cultivars during their cultivation. The analysis showed that the selectionof the cultivar is the most important parameter of the model for determining the finalβ-glucan accumulation in grain, among the other factors [55]. There are contradictory dataconcerning the results of comparative studies on naked and hulled barley as well. Someauthors failed to disclose significant differences between these two forms of the crop [56,57],while others found that naked barleys contained more β-glucans than hulled ones [43,58].Meanwhile, the group of Tibetan naked barleys was reported to have the highest contentof β-glucans in their grain [59].
In the meantime, the amount of β-glucans in oat grain is associated with protein andfat accumulation, grain volume weight, and grain productivity [60,61]. The content ofthese polysaccharides depended on meteorological conditions and agricultural practicesused in oat cultivation [61]. The content of β-glucans in barley grain is determined byboth the genotype and the growing conditions [43,59,62]; some authors insist that it isthe genotype that plays a decisive role [63,64], while others give preference to the envi-ronmental conditions [65,66]. When 33 barley cultivars and lines were tested in two aridareas in the United States, it was shown that the variability in the content of β-glucansin grain was determined by the genotype for 51% [64] to 66% [67]. At the same time, theprotein content in grain depended on environmental conditions for 69%, whereas yieldsize and the grain volume weight for 83 and 70%, respectively [64]. The study of 9 barleycultivars and 10 oat ones showed that cultivar-specific differences in the β-glucan content
8
Plants 2021, 10, 86
persisted across the years [63]. The content of β-glucans in the grain is also influencedby plant development phases. It was reported that the content of β-glucans graduallyincreased in the process of grain formation, and in the maturation phase, it either reachedthe plateau or decreased [57]. At present, there are contradictory data concerning thelinkage of β-glucan accumulation in barley grain with 1000 grain weight, protein content,or starch content [56,62]. Some authors did not find any interplay between these characters,while others reported a positive correlation. When the content of β-glucans was measuredin the grain of six-row and two-row barley cultivars, no differences between these twocultivar groups were reported [43].
The 1700 oat lines with mutations induced by TILLING of high-frequency mutagenesishave been produced for breeding purposes with molecular-based, high precision selectionmethods from cv. ‘Belinda’ (Sweden) to evaluate the variability of β-glucans content in thiscrop [68]. Their assessment resulted in identifying 10 lines with β-glucan concentrationsin their grain higher than 6.7% and 10 lines with the content of β-glucans less than 3.6%(β-glucan concentration in cv. ‘Belinda’ was 4.9%). The maximum range of variation inthe content of these polysaccharides was from 1.8 to 7.5% [69]. The comparatively recentidentification of genes participating in the biosynthesis of β-glucans in cereals [70] andtheir first genetic map open new opportunities for genetic improvement of grain qualityindicators and resulting food products, which is very important for human health [71].
Three markers (Adh8, ABG019, and Bmy2) significantly linked to β-glucan contentregulation were identified in barley grain, and a group of HvCslF genes was mapped: Atleast two of them were in the region of barley chromosome 2H explained by the QTL for(1,3;1,4)-β-glucan near the Bmy2 marker [72]. A genome-wide association study (GWAS)employing oat germplasm of worldwide origin from the American Gene Bank was aimedat the identification of QTL linked to β-glucan content in grain and resulted in finding threeindependent markers closely associated with the target character. A comparison of theseresults with the data obtained for rice showed that one of the described markers, localizedon rice chromosome 7, was adjacent to the CslF gene family responsible for β-glucansynthesis in grain. Thus, GWAS in oat can be a successful QTL detection technique withthe future development of higher-density markers [73].
By now, the GWAS approach has already started to be used to analyze the associationbetween the genotype and the content of β-glucans and fatty acids in oats. Researchershave identified four loci contributing to changes in the fatty acid composition and contentin oat grain. However, genome regions conducive to changing the content of proteins,oils, saccharic and uronic acids, which, in their turn, produce a direct effect on grainquality, remain unexplored [74]. Furthermore, positive correlations were demonstrated inbarley between 1000 grain weight and tocol concentration, between dietary fiber contentand phenolic compounds, and between husk weight and total antioxidants in hulledbarley [38,50].
2.3. Antioxidants
Cereal crop grains are known to have high nutritive value and contain diverse chemicalcompounds with antioxidant properties. Research efforts have been undertaken in recentyears to study the content of antioxidants in the grain of various cultivated cereals [50,75–79].
Starting in the mid-1930s, oat flour has been used as a natural antioxidant. Later,more in-depth research was done to assess the antioxidative properties of oat flour versusthose of chemical antioxidants. It was ascertained that adding sterols extracted from oat toheated soybean oil significantly decelerated its oxidation compared with the reference. Atpresent, along with the extensive utilization of synthetic antioxidants, oat flour has foundits stable niche as a natural ingredient in eco-friendly food products [7].
A comparison of bakery products made from wheat that synthesized such antioxidantcompounds as anthocyanins with those from an anthocyanin-free wheat line demonstratedthat the presence of anthocyanins increased the shelf life of bakery products and theirresistance to molding under provocative conditions [80]. Cereal crops contain secondary
9
Plants 2021, 10, 86
metabolites with antioxidant activity belonging to three groups: phenolic compounds,carotenoids, and tocopherols [81].
2.4. Phenolic Compounds and Avenanthramides
Oat and barley grains contain a considerable amount of various phenolic compoundsexhibiting biological activity, including antioxidative, anti-inflammatory, and antiprolif-erative (preventive activity against cancerous and cardiac diseases) effects [50]. One ofthe most abundant and powerful antioxidants found in nature, the flavonoid quercetin,has been found in wheat. It is characterized by numerous biological effects, includingantithrombotic activity [82].
Many published studies testify that a major part of phenolic compounds in grainoccurs in a bound form: Their content in oat and wheat grains reaches 75% [83,84]. Phenolicacids, like most flavonoids in cereal crops, are concentrated in structures bound to the cellwall: 93% of the total flavonoid content in wheat and 61% in oats [83]. The highest levelof total flavonoids is characteristic of maize grain, followed by wheat, oats, and rice [83].Phenolic acids are the most widespread phenolic compounds in oats, especially ferulic acid(250 mg/kg), which is present mainly inbound forms linked through ester or ether bondsto cell wall components but also exists in the free form [85].
Bioactive chemical compounds are unevenly distributed within the grain. Grains offour naked barley cultivars were divided into five layers to measure the total phenoliccontent and total antioxidant activity. The total content of soluble phenolic compoundswas observed to decrease from the outer layer (2.8–7.7 μg/g) towards the inner endospermstructures (0.87–1.35 μg/g) [78,86]. It has been proven that most antioxidants contained inwhole grain are located in the bran and germ fractions of the grain. For example, whole-grain wheat flour was found to contain in its bran/germ fraction 83% of the total phenoliccontent in grain and 79% of total flavonoids [87].
In the study of molecular mechanisms of ‘melanin-like’ black seed pigments knownto be strong antioxidants, comparative transcriptome analysis of two near-isogenic linesdiffering by the allelic state of the Blp (black lemma and pericarp) locus revealed that blackseed color is related to the increased level of ferulic acid and other phenolic compounds [88].The melanic nature of the purified black pigments was confirmed by a series of solubilitytests and Fourier transform infrared spectroscopy, while intracellular pigmented structureswere described to appear in chloroplast-derived plastids designated “melanoplasts” [89].The most frequently mentioned flavonoids of cereal crops are the flavonols kaempferol andquercetin, the flavanone naringenin and its glycosylated forms, catechin, and epicatechinin barley [90–93].
Pigmentation of the grain’s outer coating can be analyzed as an important indicator ofantioxidant activity. A barley cultivar with purple grain contained 11 anthocyanins, whileonly one anthocyanin was observed in black and yellow barley grains. The purple barleybran extract had the highest total antioxidant activity [94]. Another study of naked barleydemonstrated the presence of higher antioxidant activity in pigmented grains compared withnon-pigmented ones [78]. A study of naked and hulled oats showed that naked oat cultivarshad significantly higher values of total antioxidant activity. Among hulled oat cultivars, thesevalues were higher in dark-hulled forms compared with white-hulled oats [50].
Differences between naked and hulled oats and barleys, generated a perfect modelinteresting for comparative analyses: the mutant barley line for the Nud gene (nakedness),derived by gene editing from cv. ‘Golden Promise’ [21]. Using this model will help todistinguish the pleiotropic effects of the Nud gene on the grain’s biochemical compositionfrom the influence of closely linked genes.
Analyzing grain extracts of wheat lines with different combinations of the Ba (Bluealeurone) and Pp (Purple pericarp) genes on the genetic background of elite cultivars demon-strated a higher diversity of flavonoid compounds in the carriers of dominant alleles ofBa and Pp genes. Comparing the products made from the grain of a purple-grained linewith those from an anthocyanin-free isogenic line revealed significant differences, which
10
Plants 2021, 10, 86
was also true for the samples that had passed a full processing cycle, including bakingat elevated temperatures [80,95]. The analysis of anthocyanin extracts obtained underconditions simulating those of food digestion by a human organism showed that ingesting100 g of bread crisps or biscuits made from flour with added purple wheat grain bran raisedthe assimilation of anthocyanins to 1.03 and 0.83 mg, respectively, i.e., 100 g of bran wouldsupply the organism with up to 3.32 g of anthocyanins. Besides, purple-grained wheatmatched or even exceeded the reference line in the quality and taste of its products [95].
Recently, new high-yielding wheat cultivars, resistant to fungal diseases and havinghigh anthocyanin content in grain have been developed [4]. The efficiency of the breedingstrategy lasting only three years from the first cross until the state cultivar competitivetesting has been demonstrated. The strategy is based on marker-assisted selection (MAS) [4].MAS also demonstrated its efficacy in creating barley with certain alleles of anthocyaninregulatory genes [18]. For breeding blue-grained wheat, besides molecular markers, FISHor C-banding are needed since the Ba gene is alien for wheat and can be inherited fromwheat lines with either 4B or 4D chromosome substituted by the Thinopyrum ponticumchromosome 4 [96,97]. Unlike bread wheat, barley has its own Ba gene. Recent findingsof regulatory features of anthocyanin biosynthesis in barley [98] are useful for both MAS-based and genetic editing-based breeding strategies.
Interestingly, 30 years ago, the purple- and blue-grain characters were regardedas having “a limited practical use from a scientific point” [99]. Since that time, somestudies demonstrating the health benefit of plant anthocyanins, including those fromwheat grain [16], have been carried out, denying the old point of view and provingthese traits to be economically important. Commercial cultivars of wheat with increasedanthocyanin content have been released in Canada, China, Japan, and several Europeancountries [100,101].
The class of phenolics with antioxidative effect and bioactivity includes avenan-thramides (AVA), a class of hydroxycinnamoyl anthranilate alkaloids contained onlyin oats. Twenty-five components of these compounds were detected in kernels, andtwenty in hulls [102]. The most widespread in oats are AVA-A (2p), AVA-B (2f), andAVA-C (2c) [9,103,104]. There is documented evidence that avenanthramides demonstrateantioxidant, anti-inflammatory, antiatherogenic, and antiproliferative activity [105–107].
It has been shown that oat cultivars differed in the AVA content in grain. The cultivateddiploid species A. strigosa had a very high AVA content reaching 4.1 g/kg, and the hexaploidA. byzantina contained 3.0 g/kg. Contrariwise, wild oat species with different ploidylevels were characterized by relatively low AVA content values (240–1585 mg/kg) [108].Analyzing a representative set of cultivated and wild oat species revealed an even widerdiversity of the AVA content in grain [109]. A conclusion has been made that wild oatspecies are an important source of diversity for breeding programs, which dictates thenecessity of further studies into the pattern of AVA content and composition variabilityacross the genus Avena L. Wild oat species might incorporate a unique AVA composition,promising for crosses with cultivated oats.
2.5. Tocols
The health benefits of oats are also associated with the presence of several antioxidantcompounds known as tocols, specifically tocopherols and tocotrienols. The fat-solublevitamin E contains tocopherols and tocotrienols [110], which make the oil more resistant tooxidation. Both tocopherols and tocotrienols have several isomeric forms designated as α,β, γ, and δ [111]. All in all, vitamin E can comprise eight isomers, with prevailing α-isomers(70–85%) and δ-isomers not exceeding 1%. The total tocopherol content in oat cultivars canreach 2.6–3.2 mg/100 g, which is many times lower than in barley [101]. Tocopherols aremainly present in the germ fraction of grain, while tocotrienols are found in the pericarpand endosperm. Tocotrienols prevail in oats, barley, and wheat; their concentrations varyfrom 40 to 60 μg/g depending on the crop [112].
11
Plants 2021, 10, 86
Eight isomers of tocols have been found in barley grain oil (four tocopherols andfour tocotrienols). They play an exceptionally important role, regulating cholesterol inhuman blood. Tocols also demonstrate very high activity as antioxidants, blocking harmfulperoxidation of lipids in cell membranes [101]. Tocols (16–94 mg/kg) consist of a polarchromanol ring linked to an isoprenoid-derived hydrocarbon chain. They are powerfulscavengers of free radicals, also demonstrating an ability to inhibit the proliferation ofsome cancer cells [108].
Furthermore, positive correlations were demonstrated in barley between 1000 grainweight and tocol concentration, between dietary fiber content and phenolic compounds,and between husk weight and total antioxidants in hulled barley [38,50]. Presently,molecular-genetic studies of this type of antioxidant are based on simple-sequence re-peats (SSR) markers. It is worth mentioning that the naked barley with the Waxy gene andzero amylase content in starch has higher contents of both β-glucans and tocols [113].
2.6. Sterols
Sterols are important components of vegetable oils. Their content in oat grain varies, ac-cording to different sources, from 0.1% to 9.3% of the total fatty acid content. This indicatoroften depends not only on the oat genotype but also on the extraction technique. Cultivarsof rye, wheat, barley, and oats grown in the same year and same location were compared,the highest plant sterol content was observed in rye (mean content 95.5 mg/100 g, wb),whereas the total sterol contents (mg/100 g, wb) of wheat, barley, and oats were 69.0, 76.1,and 44.7, respectively [114]. Among the six components of sterol content, the main one issitosterol, whose content reaches 70% of the total sterol content; additionally, about 20%are allocated to campesterol and stigmasterol [7,101]. The content of sterols in oats canreach 447 mg/kg and include, in addition to the abovementioned, D-5 and D-7 avenas-terols [114] and phytic acid (5.6–8.7 mg/g); the latter manifests antioxidant activity due toits ability to chelate metal ions, thus making them catalytically inactive and inhibiting themetal-mediated formation of free radicals. However, this chelating activity reduced thebioavailability of major minerals [110].
2.7. Carotenoids
Carotenoids (yellow, orange, and red pigments) relating to isoprenoids are amongthe most widespread plant antioxidants. Carotenoid content in oat grain can reach1.8 μg/g [86]; besides, lutein is considered the main xanthophyll in wheat, barley, andoat grains, and zeaxanthin is the secondary one [115].
Comparative investigation of four groups of wheat genotypes (spelt wheat, landraces,old cultivars, and primitive wheat) for carotenoid content and composition in grain re-vealed a high level of variation among the genotypes and the groups in the content ofcarotenoids. Lutein contributed 70–90% of the carotenoids in the grain [116]. In durumwheat, which is used for the production of pasta, carotenoid content is also an importanttechnological and market indicator. In semolina and pasta, a yellow color is desirable, andit depends on the carotenoid accumulation in kernels. Genetic dissection of the carotenoidcontent character showed quantitative trait loci (QTL) on all wheat chromosomes [117].The major QTL, responsible for 60% of heritability, is located on the long arms of chromo-somes 7A and 7B. Variability in these QTL is explained by allelic variations of the phytoenesynthase (PSY) genes. Molecular markers for MAS-based breeding programs aimed at theenrichment of durum wheat grain with carotenoid content are available [117].
2.8. Other Antioxidant Compounds
Oat is the only cereal grass that contains saponins, steroidal glycosides known asavenocosides A and B (65.5 and 377.5 mg/kg, respectively), which exhibit anticanceractivity at the expense of diverse, complex mechanisms, including inhibition of neoplasmcell growth through cell cycle arrest and, inter alia, stimulation of cancer cell apoptosis [13].Oat also accommodates two classes of saponins: avenocosides (steroid-linked saccharides)
12
Plants 2021, 10, 86
and avenacides (triterpenoid-linked saccharides), which were shown to drop the cholesterollevel, stimulate the immune system, and demonstrate anticancer properties [14]. Targetedbreeding for increased content of these compounds in oat lines has not yet been attempted,but interline and interspecies differences in this indicator have already been identified [118].Grains of five Finnish barley cultivars grown in 2006–2008 were analyzed for their totalcontent of folic acid. It was noted that the external and germ-containing grain layers hadthe highest levels of this compound (up to 1710 ng/g) [77,79].
3. Assessment of Cereal Crop Genetic Resources According to the Diversity andConcentration of Health-Friendly Dietary Grain Components
Secondary metabolites associated with quality traits in the released and processedproducts are presently identified using metabolomic profiling or chemotyping. Such anapproach enables researchers to evaluate plant genetic resources according to these traits,including varieties of cultivated species and populations of wild ones. Chemotyping thegrain of cultivated and wild Avena L. spp. showed that the range of variability in themetabolomic profile of improved cultivars was significantly narrower than that of wildspecies. Metabolites, the content of which may have been reduced in the process of domes-tication and breeding in comparison to wild oats, are identified [2]. Presumably, it mightbe connected with the selection during oat domestication and a decline of metabolomediversity while “domestication syndrome” traits were shaped [119]. The diversity ofmetabolomic profiles may be lost in the process of selection when highly specialized single-line intensive-type cultivars are developed because this process is always accompanied bya decrease in genetic polymorphism in a breeding object compared with the metagenomeof numerous ecotypes, local varieties, and natural races of dozens of wild species [2,119].A study of naked and hulled oat forms disclosed differences in their metabolites, whichserves as an additional justification of the differentiation between these subspecies ofcommon oat [2]. Landraces, which are plant varieties selected and grown regionally butnot officially tested and released as registered varieties, are a source of special geneticcharacteristics derived by (many years of) adaptation to the respective territory. Such localvarieties are often more resistant to biotic and abiotic stresses typical for their environment.In addition, such varieties may be a source for special phytochemicals (also known asbioactives) considered as health-beneficial, while the content of these compounds may belower in commercial cultivar [2,120].
The bands of secondary metabolites in oat accessions exposed to Fusarium infectionwere analyzed, and correlations between metabolites and resistance were disclosed. High-protein oat forms with increased content of certain secondary metabolites demonstratedless damage from Fusarium, accumulated fewer toxins, and were more adaptable to thebiotic stress [121].
Matthews et al. [122] used metabolite profiling to compare 45 lines of tetraploid andhexaploid wheat. The extracts were analyzed by the ultraperformance liquid chromatogra-phy coupled with time-of-flight mass spectrometry (UPLC-TOF-MS). Two different speciesof bread and durum wheat formed two distinct groups differing in sterols, fatty acids, andphospholipids, while T. aestivum L. split into two groups (corresponding to hard and softbread wheat) according to differences in heterocyclic amines and polyketides. This andsimilar studies underpin the use of chemotyping in breeding both for desired agronomictraits and for higher contents of health-benefiting compounds in cereal grain.
Information obtained with the molecular metabolomic approach on mQTL (metabo-lite quantitative trait loci) and mGWAS (metabolome-based GWAS) ensures a new levelfor qualitative and quantitative characterization of secondary metabolites interesting forbreeding. Such analyses can provide knowledge about the interactions among metabolitesthemselves and between them and important breeding indicators. It may lead to thedevelopment of more rational models linking a certain metabolite with such charactersas plant productivity or end-product quality. Even more promising is the possibility toexamine the interplay between quantitative variation in metabolites and changes in theplant phenotype [123].
13
Plants 2021, 10, 86
Due to the genetic potential of grain crops through the directed formation of theproperties and structure of the kernel in the process of ontogenesis, when developing newcultivars, it is possible to attend to the target component composition of the final product.Wider application of chemotyping, chemical research methods, metabolomic analysisof grain quality, and searching for high content of rare beneficial (dietary or curative)components will result in the release of new crop cultivars, thus promoting next-generationbreeding trends and technologies [50].
4. The Effect of Dietary Components in Grain on Life Functions of Plants Themselves
Content of all biochemical components in the grain of cereal crops there are variationsin the composition of it. These variations arise from differences between environments,variation in the genotype of the crop, and interactions between biotic and abiotic factorsand genotype. Biotic and abiotic factors change depending on climate change, soil, andvarious stressors affecting plants. The genotypic variation includes the differences betweenindividual genotypes.
4.1. Biotic Stress Resistance
Generally, an explanation why grain in the soil is not affected by microorganismsdespite the environmental conditions favorable for infection was given by the presenceof antimicrobial flavonoid compounds in extracts from barley and wheat grains soakedin water [124]. Higher disease resistance of plants with enhanced flavonoid biosynthe-sis has been described in rye, barley, and wheat [125]. In vitro infection of developingbarley caryopses of wild type and proanthocyanidin-free mutants with fungal pathogensFusarium poae, F. culmorum, and F. graminearum revealed mutants to be more sensitive toFusarium attack than wild-type plants [126].
Considering the available data on interactions between compounds with antioxidantproperties in cereal crop kernels and Fusarium spp., it seems appropriate to suppose thatsome of the former could significantly contribute to the grain’s protection mechanismagainst toxicogenic fungi and mycotoxin accumulation. It has been proven that the crucialrole in Fusarium Head Blight (FHB) resistance is played by five main classes of antioxidantmetabolites: phenolic acids, flavonoids, carotenoids, tocopherols, and benzoxazinoids [127].
Cereal crop diseases caused by pathogenic and toxicogenic species of the Fusarium genus(FHB) inflict serious economic losses worldwide. Therefore, the development of sustainablestrategies to prevent FHB contamination and mycotoxin accumulation has become a targetof intensive research in recent years, and the use of FHB-resistant genotypes has been chosenas one of the prioritized trends in breeding practice [121,128,129]. Even now, however, theknowledge of complex mechanisms regulating resistance in cereal crops is still insufficient,and selecting resistant genotypes remains a difficult task for breeders. It has been establishedthat, in addition to their fungicidal properties, a number of antioxidant secondary metabolitesin cereals can regulate mycotoxin production by various pathogenic fungi [127].
The first weighty general argument in favor of phenolic compounds, carotenoids,and tocopherols is their ability to suppress reactive oxygen species (ROS), thus protectingbiological cells. Besides, tocopherols and carotenoids can entrap free radicals of lipidperoxides and, therefore, arrest lipid peroxidation chain development [130]. Cinnamicacid derivatives, such as sinapic, caffeic, p-coumaric, chlorogenic, and ferulic acids, areeffective inhibitors of F. graminearum and F. culmorum development, while benzoic acidderivatives, except syringic acid, produce an antiactivating effect [131,132]. There is anopinion that cereal crop metabolites with antioxidant activity suppress toxigenic actionof a fungal infection. Numerous research works demonstrated the efficiency of phenoliccompounds [133,134], carotenoids [135], tocopherols, and even benzoxazinoids [136] inrestraining the growth and mycotoxin production of toxigenic Fusarium fungi. Finally,phenolic compounds partaking in plant structure enforcement are known to contribute tobuilding a physical barrier against pathogenic infection. There is a positive interrelationbetween the content of phenolic acids, both free and bound to the cell wall, and FHB
14
Plants 2021, 10, 86
resistance in wheat [137]. A high level of FHB resistance in barley with the black-pigmentedgrain is supposedly associated with increased content of phenolic compounds [133].
High-protein oat forms were observed to be less affected by Fusarium head blightand accumulate fewer toxins; they are more adaptable to biotic stress. A relationship wasidentified between FHB resistance and accumulation of pipecolic acid, monoacylglycerols,tyrosine, galactinol, certain phytosterols, saccharides, and adenosine [121].
There were, however, many unproven assumptions on the participation of metabolitesin the FHB resistance mechanism in cereals. Although the genetic architecture that supportssecondary metabolite synthesis and regulation in cereal crops is exceptionally intricate, suchproof may be retrieved in the process of comprehensive genetic and functional genomicstudies [127].
Accumulation of avenanthramides in oats is also associated with the penetration of afungal infection. Avenanthramides are mostly contained in oat grain, but under an attack bycrown rust or leaf blotch, they start to synthesize in leaves as a means of protection againstdisease agents [110]. The fact that the amount of avenanthramides in grain significantlyincreases during imbibition [138], plant development [139], steeping [140], and storage [141]is also related to plant protection against potential susceptibility to pathogenic flora.
4.2. Abiotic Stress Resistance
Polyphenolic compounds in grain may protect seeds from unfavorable abiotic envi-ronmental conditions. Some of these compounds may act as sunscreens against potentiallydamaging UV-B radiation [142]. This may explain the presence of a purple grain color andother parts of the plant in tetraploid wheat T. aethiopicum Jakubz. [143] adapted to intensivesolar UV-B radiation in highland areas in Ethiopia. Studies of near-isogenic wheat linesdiffering in the anthocyanin content in the pericarp and coleoptile under various stressconditions showed that both pericarp and coleoptile anthocyanins protected seedlings fromosmotic stress [144], while protection of seedlings under a moderate irradiation dose (pre-treatment of dry seeds with 50 Gy before sowing) or moderate Cd toxicity (25 μM CdCl2)was due to the coleoptile’s anthocyanins only [145,146]. Flavonoid substances can preventnegative effects of excessive moisture, such as pre-harvest seed sprouting by reducing thepermeability of seed coat to water [147], inhibiting α-amylase (an enzyme whose activity isdirectly related to seed germination of grain) [148], or inactivating dehydrogenase requiredfor the initial phase of respiration in ripening grain and young shoots [149].
Avenanthramide accumulation in oat grain is affected by weather and geographicconditions under which the studied material is cultivated [109,150–153]. Changes in theconcentration of avenanthramides in response to salinity stress in CBF3 transgenic oatdemonstrated that these compounds might have a potential role in enhancing abiotic stresstolerance in oats [154]. Havrlentova et al. [155] suggested that oats with higher β-D-glucancontent may have thicker and, therefore, more insulating cell walls, better adapted to heatstress conditions. The same conclusion between higher content of β-D-glucan and greatercell wall thickness has been reported in barley [156]. Sterol might be important for coldacclimation of wheat [157,158] and oat [159]. Thus, breeding programs aimed at an increasein the content of health benefit components in cereal grain are at the same time eligible tosolve the task of cultivar adaptability to unfavorable environmental conditions.
5. Conclusions
Each of the abovementioned natural components (dietary or curative) is promisingfor use as a food additive or an ingredient of pharmaceutical and cosmetic products. Theyare expected to play an ever-growing role in food industries, expanding the assortmentof healthy food for the population. The demand for such products has already instigatedplant breeders to launch new breeding programs aimed at the development of cereal cropcultivars with higher contents of bioactive components in grain. Such programs have oftenbeen based on molecular breeding techniques from the very beginning. Screening promis-ing cultivars and hybrids for the content of antioxidants and other bioactive compounds in
15
Plants 2021, 10, 86
the grain is required to expand and promote this breeding trend. It also seems expedient toapply simple, undamaging and, as a rule, indirect techniques of plant genotype assessmentfor the levels of antioxidants in the grain to increase the performance and efficiency ofsuch screening, employing the entire genetic diversity of cereal crops for identificationof contrasting initial sources for breeding food and feed cultivars. The results obtainedin the process of studying already existing cereal cultivars and the achievements of plantbreeding in releasing new high-yielding and high-quality cultivars enable producers touse them in the development of a wide assortment of health-friendly dietary productscontributing to the physical fitness of the human organism.
Author Contributions: Conceptualization, I.G.L., E.K.K.; writing, I.G.L., E.K.K. All authors haveread and agreed to the published version of the manuscript.
Funding: This research received no external funding.
Acknowledgments: The article was made with the support of the Ministry of Science and HigherEducation of the Russian Federation under agreement № 075-15-2020-911 date 16.11.2020 on provid-ing a grant in the form of subsidies from the Federal budget of the Russian Federation. The grantwas provided for state support for the creation and development of a World-class Scientific Center“Agrotechnologies for the Future”.
Conflicts of Interest: The authors declare no conflict of interest.
References
1. FAO Save and Grow. Available online: http://www.fao.org/ag/save-and-grow/MRW/index_en.html (accessed on12 December 2020).
2. Loskutov, I.G.; Shelenga, T.V.; Rodionov, A.V.; Khoreva, V.I.; Blinova, E.V.; Konarev, A.V.; Gnutikov, A.A.; Konarev, A.V.Application of metabolomic analysis in exploration of plant genetic resources. Proc. Latv. Acad. Sci. 2019, 73, 494–501. [CrossRef]
3. Bityutskii, N.; Loskutov, I.; Yakkonen, K.; Konarev, A.; Shelenga, T.; Khoreva, V.; Blinova, E.; Rymin, A. Screening of Avena sativacultivars for iron, zinc, manganese, protein and oil contents and fatty acid composition in whole grains. Cereal Res. Commun.2019, 48. [CrossRef]
4. Gordeeva, E.; Shamanin, V.; Schoeva, O.; Khlestkina, E. The strategy for marker-assisted breeding of anthocyanin-rich springbread wheat (Triticum aestivum L.) cultivars in West Siberia. Agronomy 2020, 10, 1603. [CrossRef]
5. Morgounov, A.; Karaduman, Y.; Akin, B.; Aydogan, S.; Baenziger, S.; Bhatta, M.; Chudinov, V.; Dreisigacker, S.; Govindan, V.;Güler, S.; et al. Yield and quality in purple grain wheat isogenic lines. Agronomy 2020, 10, 86. [CrossRef]
6. Leonova, S.; Shelenga, T.; Hamberg, M.; Konarev, A.V.; Loskutov, I.; Carlsson, A.S. Analysis of oil composition in cultivars andwild species of oat (Avena sativa). J. Agric. Food Chem. 2008, 56, 7983–7991. [CrossRef]
7. Marshall, H.G. Oats Science and Technology (Agronomy); Sorrells, M.E., Ed.; American Society of Agronomy: Madison, WI, USA,1992; p. 846.
8. Olson, R.A. Nutritional Quality of Cereals Grains: Genetic and Agronomic Improvement; Frey, K.J., Ed.; American Society of Agronomy:Madison, WI, USA, 1987.
9. Peterson, D.M. Oat–a Multifunctional Grain. In Proceedings of the 7th International Oats Conference, Helsinki, Finland, 28 July2004; pp. 21–26.
10. Rasmusson, D.C. Nutritional Quality of Barley; American Society of Agronomy: Madison, WI, USA, 1985.11. Malaguti, M.; Dinelli, G.; Leoncini, E.; Bregola, V.; Bosi, S.; Cicero, A.F.G.; Hrelia, S. Bioactive peptides in cereals and legumes:
Agronomical, biochemical and clinical aspects. Int. J. Mol. Sci. 2014, 15, 21120–21135. [CrossRef]12. Zou, Y.; Liao, D.; Huang, H.; Li, T.; Chi, H. A systematic review and meta-analysis of beta-glucan consumption on glycemic
control in hypercholesterolemic individuals. Int. J. Food Sci. Nutr. 2015, 66, 355–362. [CrossRef]13. Yang, J.; Wang, P.; Wu, W.; Zhao, Y.; Idehen, E.; Sang, S. Steroidal saponins in oat bran. J. Agric. Food Chem. 2016, 64, 1549–1556.
[CrossRef]14. Sang, S.; Chu, Y. Whole grain oats, more than just a fiber: Role of unique phytochemicals. Mol. Nutr. Food Res. 2017, 61, 1600715.
[CrossRef]15. Kumar, K.; Chauhan, D.; Kumar, S. Barley: A potential source of functional food ingredients. In Proceedings of the Conference:
National Seminar on Technological Interventions in Food Processing and Preservation, Jaipur, India, 17 November 2017.16. Tikhonova, M.; Shoeva, O.; Tenditnik, M.; Ovsyukova, M.; Akopyan, A.; Dubrovina, N.; Amstislavskaya, T.G.; Khlestkina, E. Eval-
uating the effects of grain of isogenic wheat lines differing in the content of anthocyanins in mouse models of neurodegenerativedisorders. Nutrients 2020, 12, 3877. [CrossRef]
17. Martınez-Villaluenga, C.; Penas, E. Health benefits of oat: Current evidence and molecular mechanisms. Curr. Opin. Food Sci.2017, 14, 26–31. [CrossRef]
16
Plants 2021, 10, 86
18. Gordeeva, E.I.; Glagoleva, A.Y.; Kukoeva, T.V.; Khlestkina, E.K.; Shoeva, O.Y. Purple-grained barley (Hordeum vulgare L.):Marker-assisted development of NILs for investigating peculiarities of the anthocyanin biosynthesis regulatory network. BMCPlant Biol. 2019, 19, 52. [CrossRef] [PubMed]
19. Sánchez-León, S.; Gil-Humanes, J.; Ozuna, C.V.; Giménez, M.J.; Sousa, C.; Voytas, D.F.; Barro, F. Low-gluten, nontransgenic wheatengineered with CRISPR/Cas9. Plant Biotechnol. J. 2018, 16, 902–910. [CrossRef] [PubMed]
20. Jouanin, A.; Schaart, J.G.; Boyd, L.A.; Cockram, J.; Leigh, F.J.; Bates, R.; Wallington, E.J.; Visser, R.G.F.; Smulders, M.J.M. Outlookfor coeliac disease patients: Towards bread wheat with hypoimmunogenic gluten by gene editing of α- and γ-gliadin genefamilies. BMC Plant Biol. 2019, 19, 333. [CrossRef] [PubMed]
21. Gerasimova, S.; Hertig, C.; Korotkova, A.; Kolosovskaya, E.; Otto, I.; Hiekel, S.; Kochetov, A.; Khlestkina, E.; Kumlehn, J.Conversion of hulled into naked barley by Cas endonuclease-mediated knockout of the NUD gene. BMC Plant Biol. 2020, 20, 255.[CrossRef] [PubMed]
22. Kennedy, G.; Nantel, G.; Shetty, P. The scourge of “hidden hunger”: Global dimensions of micronutrient deficiencies. Food Nutr.Agric. 2003, 32, 8–16.
23. Bhullar, N.K.; Gruissem, W. Nutritional enhancement of rice for human health: The contribution of biotechnology. Biotechnol.Adv. 2013, 31, 50–57. [CrossRef]
24. WHO. The World Health Report: 2002: Reducing Risks, Promoting Healthy Life; World Health Organization: Geneva, Switzerland, 2002.25. Hotz, C.; Brown, K.H. Assessment of the risk of zinc deficiency in populations and options for its control. Food Nutr. Bull. 2004,
25, 94–204.26. Morgounov, A.; Gomez-Becerra, H.F.; Abugalieva, A.; Dzhunusova, M.; Yessimbekova, M.; Muminjanov, H.; Zelenskiy, Y.;
Ozturk, L.; Cakmak, I. Iron and zinc grain density in common wheat grown in Central Asia. Euphytica 2007, 155, 193–203.[CrossRef]
27. Bouis, H.E. Micronutrient fortification of plants through plant breeding: Can it improve nutrition in man at low cost? Proc. Nutr.Soc. 2003, 62, 403–411. [CrossRef]
28. Graham, R.D.; Welch, R.M.; Bouis, H.E. Addressing micronutrient malnutrition through enhancing the nutritional quality ofstaple foods: Principles, perspectives and knowledge gaps. Adv. Agron. 2001, 70, 77–142.
29. Kutman, U.B.; Yidiz, B.; Ozturk, L.; Cakmak, I. Biofortification of durum wheat with zinc through soil and foliar application ofnitrogen. Cereal Chem. 2010, 87, 1–9. [CrossRef]
30. Rengel, Z.; Graham, R.D. Importance of seed Zn content for wheat growth on Zn-deficient soil. Plant Soil 1995, 173, 259–266.[CrossRef]
31. Frossard, E.; Bucher, M.; Machler, F.; Mozafar, A.; Hurell, R. Potential for increasing the content and bioavailability of Fe, Zn andCa in plants for human nutrition. J. Sci. Food Agric. 2000, 80, 861–879. [CrossRef]
32. White, P.; Broadley, M.R. Biofortifying crops with essential mineral elements. Trends Plant Sci. 2005, 10, 586–593. [CrossRef]33. White, P.; Broadley, M.R. Physiological limits to Zn biofortification of edible crops. Front. Plant Sci. 2011, 2, 1–11. [CrossRef]34. Frankin, S.; Kunta, S.; Abbo, S.; Sela, H.; Goldberg, B.Z.; Bonfil, D.J.; Levy, A.A.; Ragolsky, A.-N.; Nashef, K.; Roychowdhury, R. In
Focus: The 1st International Conference of Wheat Landraces for Healthy Food. J. Sci. Food Agric. 2018, 100. [CrossRef]35. Gyawali, S.; Otte, M.L.; Chao, S.; Jilal, A.; Jacob, D.L.; Amezrou, R.; Verma, R.P.S. Genome wide association studies (GWAS) of
element contents in grain with a special focus on zinc and iron in a world collection of barley (Hordeum vulgare L.). J. Cereal Sci.2017, 77, 266–274. [CrossRef]
36. Wood, P.J.; Beer, M.U. Functional oat products. In Functional Foods: Biochemical and Processing Aspects; Mazza, G., Ed.; TechnomicPublishing Company Inc.: Lancaster, PA, USA, 1998; pp. 1–37.
37. Toole, G.A.; Gall, G.L.; Colquhoun, I.J.; Drea, S.; Opanowicz, M.; Bed, Z.; Shewry, P.R.; Mills, E.N.C. Spectroscopic analysisof diversity in the spatial distribution of arabinoxylan structures in endosperm cell walls of cereal species in the health graindiversity collection. J. Cereal Sci. 2012, 56, 134–141. [CrossRef]
38. Loskutov, I.G.; Polonskiy, V.I. Content of β-glucans in oat grain as a perspective direction of breeding for health products andfodder. Agric. Biol. 2017, 52, 646–657. [CrossRef]
39. Welch, R.W.; Leggett, J.M.; Lloyd, J.D. Variation in the kernel (1 3)(1 4)-β-D-glucan content of oat cultivars and wild Avena speciesand its relationship to other characteristics. J. Cereal Sci. 1991, 13, 173–178. [CrossRef]
40. Havrlentová, M.; Hlinková, A.; Ofajová, A.; Kovácik, P.; Dvoncová, D.; Deáková, A. Effect of fertilization on b-D-glucan contentin oat grain (Avena sativa L.). Agriculture 2013, 59, 111–119. [CrossRef]
41. Decker, E.A.; Rose, D.J.; Stewart, D. Processing of oats and the impact of processing operations on nutrition and health benefits.Br. J. Nutr. 2014, 112, 58–64. [CrossRef] [PubMed]
42. Clemens, R.; Van Klinken, B.J.W. The future of oats in the food and health continuum. Br. J. Nutr. 2014, 112, 75–79. [CrossRef][PubMed]
43. Fastnaught, C.E.; Berglund, P.T.; Holm, E.T.; Fox, G.J. Genetic and environmental variation in β-glucan content and qualityparameters of barley for food. Crop. Sci. 1996, 36, 941–946. [CrossRef]
44. Dzyubenko, N.; Zwer, P.; Loskutov, I. Abstracts of Oral and Poster Presentation. In Proceedings of the 10th International OatConference: Innovation for Food and Health “OATS 2016”, St Petersburg, Russia, 11–15 July 2016.
45. Tiwari, U.; Cummins, E. Meta-analysis of the effect of beta-glucan intake on blood cholesterol and glucose levels. Nutrition 2011,27, 1008–1016. [CrossRef] [PubMed]
17
Plants 2021, 10, 86
46. Joyce, S.A.; Kamil, A.; Fleige, L.; Gahan, C.G. The cholesterol-lowering effect of oats and oat beta glucan: Modes of action andpotential role of bile acids and the microbiome. Front. Nutr. 2019, 6, 171. [CrossRef]
47. Wood, P.J. Oat and rye beta-glucan: Properties and function. Cereal Chem. 2010, 87, 315–330. [CrossRef]48. Piironen, V.; Anna-Maija, L.; Laura, N.; Li, L.; Mariann, R.; Anna, F.; Danuta, B.; Kurt, G.; Courtin, C.; Delcour, J.; et al.
Phytochemical and fiber components in oat varieties in the Healthgrain diversity screen. J. Agr. Food Chem. 2008, 56, 9777–9784.[CrossRef]
49. Redaelli, R.; Frate, V.D.; Bellato, S.; Terracciano, G.; Ciccoritti, R.; Germeier, C.U.; Stefanis, E.D.; Sgrulletta, D. Genetic andenvironmental variability in total and soluble β-glucan in European oat genotypes. J. Cereal Sci. 2013, 57, 193–199. [CrossRef]
50. Polonskiy, V.; Loskutov, I.; Sumina, A. Biological role and health benefits of antioxidant compounds in cereals. Biol. Commun.2020, 65, 53–67. [CrossRef]
51. Welch, R.W.; Brown, J.C.W.; Leggett, J.M. Interspecific and intraspecific variation in grain and groat characteristics of wild oat(Avena) species: Very high groat (1 3), (1 4)-β-D-glucan in an Avena atlantica genotype. J. Cereal Sci. 2000, 31, 273–279. [CrossRef]
52. Saastamoinen, M.; Plaami, S.; Kumpulainen, J. Genetic and environmental variation in β-glucan content of oats cultivated ortested in Finland. J. Cereal Sci. 1992, 16, 279–290. [CrossRef]
53. Havrlentová, M.; Bieliková, M.; Mendel, L.; Kraic, J.; Hozlár, P. The correlation of (1–3) (1–4)-β-d-glucan with some qualitativeparameters in the oat grain. Agriculture 2008, 54, 65–71.
54. Gajdošová, A.; Petruláková, Z.; Havrlentová, M.; Cervená, V.; Hozová, B.; Šturdík, E.; Kogan, G. The content of water-soluble andwater-insoluble β-d-glucans in selected oats and barley varieties. Carbohydr. Polym. 2007, 70, 46–52. [CrossRef]
55. Tiwari, U.; Cummins, E. Simulation of the factors affecting β-glucan levels during the cultivation of oats. J. Cereal Sci. 2009, 50,175–183. [CrossRef]
56. Griffey, C.; Brooks, W.; Kurantz, M.; Thomason, W.; Taylor, F.; Obert, D.; Moreau, R.; Flores, R.; Sohn, M.; Hicks, K.; et al. Graincomposition of Virginia winter barley and implications for use in feed, food, and biofuels production. J. Cereal Sci. 2010, 51, 41–49.[CrossRef]
57. Knutsen, S.H.; Holtekjilen, A.K. Preparation and analysis of dietary fibre constituents in whole grain from hulled and hull-lessbarley. Food Chem. 2007, 102, 707–715. [CrossRef]
58. Huth, M.; Dongowski, G.; Gebhart, E.; Flamme, W. Functional properties of dietary fibre enriched exudates from barley. J. CerealSci. 2002, 32, 115–117. [CrossRef]
59. Zhang, G.; Wang, J.; Chen, J. Analysis of β-glucan content in barley cultivars from different locations of China. Food Chem. 2002,79, 251–254. [CrossRef]
60. Cox, T.S.; Frey, K.J. Complementarity of genes for high groat-protein percentage from Avena sativa L. and A. sterilis L. Crop. Sci.1985, 25, 106–109. [CrossRef]
61. Peterson, D.M.; Wesenberg, D.M.; Burrup, D.E. β-Glucan content and its relationship to agronomic characteristics in elite oatgermplasm. Crop. Sci. 1995, 35, 965–970. [CrossRef]
62. Yalcin, E.; Celik, S.; Akar, T.; Sayim, I.; Koksel, H. Effects of genotype and environment on β-glucan and dietary fibre contents ofhull-less barleys grown in Turkey. Food Chem. 2007, 101, 171–176. [CrossRef]
63. Lee, C.J.; Horsley, R.D.; Manthey, F.A.; Schwarz, P.B. Comparison of β-glucan content of barley and oat. Cereal Chem. 1997, 74,571–575. [CrossRef]
64. Hang, A.; Obert, D.; Gironella, A.I.N.; Burton, C.S. Barley amylase and β-glucan: Their relationships to protein, agronomic traits,and environmental factors. Crop. Sci. 2007, 47, 1754–1760. [CrossRef]
65. Zhang, G.; Chen, J.; Wang, J.; Ding, S. Cultivar and environmental effects on (1–3, 1–4)-β-glucan and protein content in maltingbarley. J. Cereal Sci. 2001, 34, 295–301. [CrossRef]
66. Rey, J.I.; Hayes, P.M.; Petrie, S.E.; Corey, A.; Flowers, M.; Ohm, J.B.; Ong, C.; Rhinhart, K.; Ross, A.S. Production of dryland barleyfor human food: Quality and agronomic performance. Crop. Sci. 2009, 49, 347–355. [CrossRef]
67. Aman, P.; Graham, H.; Tilley, A. Content and solubility of mixed-linked (1–3;1–4)-β-glucan in barley and oats during kerneldevelopment and storage. J. Cereal Sci. 1989, 10, 45–50. [CrossRef]
68. Chawade, A.; Sikora, P.; Brautigam, M.; Larsson, M.; Vivekanand, V.; Nakash, M.A.; Chen, T.; Olsson, O. Development andcharacterization of an oat TILLING-population and identification of mutations in lignin and β-glucan biosynthesis genes. BMCPlant Biol. 2010, 10, 86–99. [CrossRef]
69. Sikora, P.; Tosh, S.M.; Brummer, Y.; Olsson, O. Identification of high β-glucan oat lines and localization and chemical characteriza-tion of their seed kernel β-glucans. Food Chem. 2013, 137, 83–91. [CrossRef]
70. Collins, H.M.; Burton, R.A.; Topping, D.L.; Liao, M.-L.; Bacic, A.; Fincher, G.B. Variability in fine structures of noncellulosic cellwall polysaccharides from cereal grains: Potential importance in human health and nutrition. Cereal Chem. 2010, 87, 272–282.[CrossRef]
71. Song, G.; Huo, P.; Wu, B.; Zhang, Z. A genetic linkage map of hexaploid naked oat constructed with SSR markers. Crop. J. 2015, 3,353–357. [CrossRef]
72. Burton, R.A.; Wilson, S.M.; Hrmova, M.; Harvey, A.J.; Shirley, N.J.; Medhurst, A.; Fincher, G.B. Cellulose synthase-like CslF genesmediate the synthesis of cell wall (1–3;1–4)-β-D-glucans. Science 2006, 311, 1940–1942. [CrossRef] [PubMed]
73. Newell, M.A.; Asoro, F.G.; Scott, V.P.; White, P.J.; Beavis, W.D.; Jannink, J.-L. Genome-wide association study for oat(Avena sativa L.) beta-glucan concentration using germplasm of worldwide origin. Appl. Genet. 2012, 125, 1687–1696. [CrossRef]
18
Plants 2021, 10, 86
74. Carlson, M.O.; Montilla-Bascon, G.; Hoekenga, O.A.; Tinker, N.A.; Poland, J.; Baseggio, M.; Sorrells, M.E.; Jannink, J.-L.; Gore,M.A.; Yeats, T.H.; et al. Multivariate genome-wide association analyses reveal the genetic basis of seed fatty acid composition inoat (Avena sativa L.). G3 GenesGenomesGenet 2019, 9, 2963–2975. [CrossRef]
75. Andersson, A.A.M.; Lampi, A.M.; Nyström, L.; Piironen, V.; Li, L.; Ward, J.L.; Gebruers, K.; Courtin, C.M.; Delcour, J.A.; Boros, D.;et al. Phytochemical and dietary fiber components in barley varieties in the healthgrain diversity screen. J. Agric. Food Chem.2008, 56, 9767–9776. [CrossRef]
76. Do, T.D.T.; Cozzolino, D.; Muhlhausler, B.; Box, A.; Able, A.J. Antioxidant capacity and vitamin E in barley: Effect of genotypeand storage. Food Chem. 2015, 187, 65–74. [CrossRef]
77. Edelmann, M.; Kariluoto, S.; Nyström, L.; Piironen, V. Folate in barley grain and fractions. J. Cereal Sci. 2013, 58, 37–44. [CrossRef]78. Gong, L.X.; Jin, C.; Wu, L.J.; Wu, X.Q.; Zhang, Y. Tibetan hullless Barley (Hordeum vulgare L.) as a potential source of antioxidants.
Cereal Chem. 2012, 89, 290–295. [CrossRef]79. Edelmann, M.; Kariluoto, S.; Nyström, L.; Piironen, V. Folate in oats and its milling fractions. Food Chem. 2012, 135, 1938–1947.
[CrossRef]80. Khlestkina, E.К.; Usenko, N.I.; Gordeeva, E.I.; Stabrovskaya, O.I.; Sharfunova, I.B.; Otmakhova, Y.S. Evaluation of wheat products
with high flavonoid content: Justification of importance of marker-assisted development and production of flavonoid-rich wheatcultivars. Vavilovskii Zhurnal Genetiki Selektsii 2017, 21, 545–553. [CrossRef]
81. Boutigny, A.-L.; Richard-Forget, F.; Barreau, C. Natural mechanisms for cereal resistance to the accumulation of Fusariumtrichothecenes. Eur. J. Plant Pathol. 2008, 121, 411–423. [CrossRef]
82. Brankovic, G.; Dragicevic, V.; Dodig, D.; Zoric, M.; Kneževic, D.; Žilic, S.; Dencic, S.; Šurlan, G. Genotype × environmentinteraction for antioxidants and phytic acid contents in bread and durum wheat as influenced by climate. Chilean J. Agric. Res.2015, 75, 139–146.
83. Adom, K.K.; Liu, R.H. Antioxidant activity of grains. J. Agric. Food Chem. 2002, 50, 6182–6187. [CrossRef] [PubMed]84. Boz, H. Ferulic acid in cereals-a review. Czech J. Food Sci. 2015, 33, 1–7. [CrossRef]85. Mattila, P.; Pihlava, J.M.; Hellstrom, J. Contents of phenolic acids, alkyl- and alkenylresorcinols, and avenanthramides in
commercial grain products. J. Agric. Food Chem. 2005, 53, 8290–8295. [CrossRef]86. Ndolo, V.U.; Beta, T. Comparative studies on composition and distribution of phenolic acids in cereal grain botanical fractions.
Cereal Chem. 2014, 91, 522–530. [CrossRef]87. Liu, R.H. Whole grain phytochemicals and health. J. Cereal Sci. 2007, 46, 207–219. [CrossRef]88. Glagoleva, A.Y.; Shmakov, N.V.; Shoeva, O.Y.; Vasiliev, G.V.; Shatskaya, N.V.; Börner, A.; Afonnikov, D.A.; Khlestkina, E.K.
Metabolic pathways and genes identified by RNA-seq analysis of barley near-isogenic lines differing by allelic state of the blacklemma and pericarp (Blp) gene. BMC Plant Biol. 2017, 17, 182. [CrossRef]
89. Shoeva, O.Y.; Mursalimov, S.R.; Gracheva, N.V.; Glagoleva, A.Y.; Börner, A.; Khlestkina, E.K. Melanin formation in barley grainoccurs within plastids of pericarp and husk cells. Nat. Sci. Rep. 2020, 10, 179. [CrossRef]
90. Bollina, V.; Kumaraswamy, G.K.; Kushalappa, A.C.; Choo, T.M.; Dion, Y.; Rioux, S.; Faubert, D.; Hamzehzarghani, H. Massspectrometry-based metabolomics application to identify quantitative resistance-related metabolites in barley against FusariumHead blight. Mol. Plant Pathol. 2010, 11, 769–782. [CrossRef] [PubMed]
91. Bollina, V.; Kushalappa, A.C.; Choo, T.M.; Dion, Y.; Rioux, S. Identification of metabolites related to mechanisms of resistance inbarley against Fusarium graminearum, based on mass spectrometry. Plant Mol. Biol. 2011, 77, 355–370. [CrossRef] [PubMed]
92. Zilic, S.; Sukalovic, V.H.T.; Dodig, D.; Maksimovic, V.; Maksimovic, M.; Basic, Z. Antioxidant activity of small grain cereals causedby phenolics and lipid soluble antioxidants. J. Cereal Sci. 2011, 54, 417–424. [CrossRef]
93. Dykes, L.; Rooney, L.W. Phenolic compounds in cereal grains and their health benefits. Cereal Foods World 2007, 52, 105–111.[CrossRef]
94. Lee, C.; Han, D.; Kim, B.; Bae, N.; Baik, B.K. Antioxidant and anti-hypertensive activity of anthocyaninrich extracts from hullesspigmented barley cultivars. Int. J. Food Sci. Technol. 2013, 48, 984–991. [CrossRef]
95. Usenko, N.I.; Khlestkina, E.К.; Asavasanti, S.; Gordeeva, E.I.; Yudina, R.S.; Otmakhova, Y.S. Possibilities of enriching foodproducts with anthocyanins by using new forms of cereals. Foods Raw Mater. 2018, 6, 128–135. [CrossRef]
96. Arbuzova, V.S.; Badaeva, E.D.; Efremova, T.T.; Osadchaya, T.S.; Trubacheeva, N.V.; Dobrovolskaya, O.B. A cytogenetic study ofthe blue-grain line of the common wheat cultivar Saratovskaya 29. Rus. J. Genet. 2012, 4, 785–791. [CrossRef]
97. Gordeeva, E.; Badaeva, E.; Yudina, R.; Shchukina, L.; Shoeva, O.; Khlestkina, E. Marker-assisted development of a blue-grainedsubstitution line carrying the Thinopyrum ponticum Chromosome 4Th(4D) in the spring bread wheat saratovskaya 29 background.Agronomy 2019, 9, 723. [CrossRef]
98. Strygina, K.V.; Börner, A.; Khlestkina, E.K. Identification and characterization of regulatory network components for anthocyaninsynthesis in barley aleurone. BMC Plant Biol. 2017, 17, 184. [CrossRef]
99. Zeven, A.C. Wheats with purple and blue grains: A review. Euphytica 1991, 56, 243–258. [CrossRef]100. Syed Jaafar, S.N.; Baron, J.; Siebenhandl-Ehn, S.; Rosenau, T.; Böhmdorfer, S.; Grausgrube, H. Increased anthocyanin content in
purple pericarp × blue aleurone wheat crosses. Plant Breed. 2013, 132, 546–552. [CrossRef]101. King, C. New Possibilities with Purple Wheat. Available online: https://www.topcropmanager.com/new-possibilities-with-
purple-wheat-20050/ (accessed on 29 October 2020).
19
Plants 2021, 10, 86
102. Welch, R.W. The chemical composition of oats. In The Oat Crop: Production and Utilization; Welch, R.W., Ed.; Chapman & Hall:London, UK, 1995; pp. 279–320.
103. Collins, F.W. Oat phenolics: Avenanthramides, novel substituted N-cinnamoylanthranilate alkaloids from oat groats and hulls. J.Agric. Food Chem. 1989, 37, 60–66. [CrossRef]
104. Jastrebova, J.; Skoglund, M.; Dimberg, L.H. Selective and sensitive LC–MS determination of avenanthramides in oats. Chro-matographia 2006, 63, 419–423. [CrossRef]
105. Fu, J.; Zhu, Y.; Yerke, A.; Wise, M.L.; Johnson, J.; Chu, Y.; Sang, S. Oat avenanthramides induce heme oxygenase-1 expression viaNrf2-mediated signaling in HK-2 cells. Mol. Nutr. Food Res. 2015, 59, 2471–2479. [CrossRef] [PubMed]
106. Pellegrini, G.G.; Morales, C.C.; Wallace, T.C.; Plotkin, L.I.; Bellido, T. Avenanthramides prevent osteoblast and osteocyte apoptosisand induce osteoclast apoptosis in vitro in an Nrf2-independent manner. Nutrients 2016, 8. [CrossRef]
107. Tripathi, V.; Mohd, A.S.; Ashraf, T. Avenanthramides of oats: Medicinal importance and future perspectives. Pharmacogn. Rev.2018, 12, 66–71. [CrossRef]
108. Redaelli, R.; Dimberg, L.; Germeier, C.U.; Berardo, N.; Locatelli, S.; Guerrini, L. Variability of tocopherols, tocotrienols andavenanthramides contents in European oat germplasm. Euphytica 2016, 207, 273–292. [CrossRef]
109. Leonova, S.; Gnutikov, A.; Loskutov, I.; Blinova, E.; Gustafsson, K.-E.; Olsson, O. Diversity of avenanthramide content in wildand cultivated oats. Proc. Appl. Bot. Genet. Breed. 2020, 181, 30–47. [CrossRef]
110. Peterson, D.M. Oat antioxidants. J. Cereal Sci. 2001, 33, 115–129. [CrossRef]111. Gutierrez-Gonzalez, J.J.; Wise, M.L.; Garvin, D.F. A developmental profile of tocol accumulation in oat seeds. J. Cereal Sci. 2013,
57, 79–83. [CrossRef]112. Falk, J.; Krahnstover, A.; van der Kooij, T.A.W.; Schlensog, M.; Krupinska, K. Tocopherol and tocotrienol accumulation during
development of caryopses from barley (Hordeum vulgare L.). Phytochemistry 2004, 65, 2977–2985. [CrossRef] [PubMed]113. Tohno-oka, T.; Kavada, N.; Yoshioka, T. Relationship between grain hardness and endosperm cell wall polysaccharides in barley.
Czech. J. Genet. Plant. Breed. 2004, 40, 116.114. Piironen, V.; Toivo, J.; Lampi, A.M. Plant sterols in cereals and cereal products. Cereal Chem. 2002, 79, 148–154. [CrossRef]115. Ndolo, V.U.; Beta, T. Distribution of carotenoids in endosperm, germ, and aleurone fractions of cereal grain kernels. Food Chem.
2013, 139, 663–671. [CrossRef] [PubMed]116. Hussain, A.; Larsson, H.; Kuktaite, R.; Olsson, M.E.; Johansson, E. Carotenoid content in organically produced wheat: Relevance
for human nutritional health on consumption. Int. J. Environ. Res. Public Health. 2015, 2, 14068–14083. [CrossRef] [PubMed]117. Colasuonno, P.; Marcotuli, I.; Blanco, A.; Maccaferri, M.; Condorelli, G.E.; Tuberosa, R.; Parada, R.; de Camargo, A.C.; Schwember,
A.R.; Gadaleta, A. Carotenoid pigment content in durum wheat (Triticum turgidum L. var durum): An overview of quantitativetrait loci and candidate genes. Front. Plant Sci. 2019, 7, 1347. [CrossRef]
118. Carraro-Lemes, C.F.; Scheffer-Basso, S.M.; Deuner, C.; Berghahn, S. Analysis of genotypic variability in Avena spp. regardingallelopathic potentiality. Planta Daninha 2019, 37, 1–12. [CrossRef]
119. Beleggia, R.; Rau, D.; Laido, G.; Platani, C.; Nigro, F.; Fragasso, M.; de Vita, P.; Scossa, F.; Fernie, A.R.; Nikoloski, Z.; et al.Evolutionary metabolomics reveals domestication-associated changes in tetraploid wheat kernels. Mol. Biol. Evol. 2016, 33,1740–1753. [CrossRef]
120. Berni, R.; Cantini, C.; Romi, M.; Hausman, J.-F.; Guerriero, G.; Cai, G. Agrobiotechnology goes wild: Ancient local varieties assources of bioactives. Int. J. Mol. Sci. 2018, 19, 2248. [CrossRef]
121. Loskutov, I.G.; Shelenga, T.V.; Konarev, A.V.; Khoreva, V.I.; Shavarda, A.L.; Blinova, E.V.; Gnutikov, A.A. Biochemical aspects ofinteractions between fungi and plants: A case study of Fusarium in oats. Agric. Biol. 2019, 54, 575–588. [CrossRef]
122. Matthews, S.B.; Santra, M.; Mensack, M.M.; Wolfe, P.; Byrne, P.F.; Thompson, H.J. Metabolite profiling of a diverse collection ofwheat lines using ultraperformance liquid chromatography coupled with time-of-flight mass spectrometry. PLoS ONE 2012, 7, e44179.[CrossRef] [PubMed]
123. Carreno-Quintero, N.; Bouwmeester, H.J.; Keurentjes, J.J. Genetic analysis of metabolome–phenotype interactions: From model tocrop species. Trends Genet. 2013, 29, 41–50. [CrossRef] [PubMed]
124. Novotelnov, N.V.; Ezhov, I.S. About antibiotic and antioxidant properties of grain yellow pigments. Proc. Acad. Sci. USSR 1954,99, 297–300.
125. Khlestkina, E.K. The adaptive role of flavonoids: Emphasis on cereals. Cereal Res. Commun. 2013, 41, 185–198. [CrossRef]126. Skadhauge, B.; Thomsen, K.; von Wettstein, D. The role of barley test a layer and its flavonoid content in resistance to fusarium
infections. Hereditas 1997, 126, 147–160. [CrossRef]127. Atanasova-Penichon, V.; Barreau, C.; Richard-Forget, F. Antioxidant secondary metabolites in cereals: Potential involvement in
resistance to fusarium and mycotoxin accumulation. Front. Microbiol. 2016, 7, 566. [CrossRef]128. Haikka, H.; Manninen, O.; Hautsalo, J.; Pietilä, L.; Jalli, M.; Veteläinen, M. Genome-wide association study and genomic prediction
for Fusarium graminearum resistance traits in nordic oat (Avena sativa L.). Agronomy 2020, 10, 174. [CrossRef]129. Polišenská, I.; Jirsa, O.; Vaculová, K.; Pospíchalová, M.; Wawroszova, S.; Frydrych, J. Fusarium mycotoxins in two hulless oat and
barley cultivars used for food purposes. Foods 2020, 9, 1037. [CrossRef]130. Das, K.; Roychoudhury, A. Reactive oxygen species (ROS) and response of antioxidants as ROS-scavengers during environmental
stress in plants. Front. Environ. 2014, 2, 53. [CrossRef]
20
Plants 2021, 10, 86
131. Boutigny, A.-L.; Barreau, C.; Atanasova-Penichon, V.; Verdal-Bonnin, M.-N.; Pinson-Gadais, L.; Richard-Forget, F. Ferulic acid, anefficient inhibitor of type B trichothecene biosynthesis and tri gene expression in fusarium liquid cultures. Mycol. Res. 2009, 113,746–753. [CrossRef]
132. Gauthier, L.; Bonnin-Verdal, M.-N.; Marchegay, G.; Pinson-Gadais, L.; Ducos, C.; Richard-Forget, F.; Penichon, V.A. Fungalbiotransformation of chlorogenic and caffeic acids by Fusarium graminearum: New insights in the contribution of phenolic acids toresistance to deoxynivalenol accumulation in cereals. Int. J. Food Microbiol. 2016, 221, 61–68. [CrossRef] [PubMed]
133. Choo, T.M.; Vigier, B.; Savard, M.E.; Blackwell, B.; Martin, R.; Wang, J.M.; Yang, J.; el-Sayed, M.A.-A. Black barley as a means ofmitigating deoxynivalenol contamination. Crop. Sci. 2015, 55, 1096–1103. [CrossRef]
134. Ferruz, E.; Atanasova-Pénichon, V.; Bonnin-Verdal, M.-N.; Marchegay, G.; Pinson-Gadais, L.; Ducos, C.; Lorán, S.; Ariño, A.;Barreau, C.; Richard, F.-F.; et al. Effects of phenolic acids on the growth and production of T-2 and HT-2 toxins by Fusariumlangsethiae and Fsporotrichioides. Molecules 2016, 21. [CrossRef] [PubMed]
135. Kumaraswamy, G.K.; Kushalappa, A.C.; Choo, T.M.; Dion, Y.; Rioux, S. Differential metabolic response of barley genotypes,varying in resistance, to trichothecene-producing and -nonproducing(tri5-) isolates of Fusarium graminearum. Plant Pathol. 2012,61, 509–521. [CrossRef]
136. Søltoft, M.; Jørgensen, L.N.; Svensmark, B.; Fomsgaard, I.S. Benzoxazinoid concentrations show correlation with fusarium headblight resistance in Danish wheat varieties. Biochem. Syst. Ecol. 2008, 36, 245–259. [CrossRef]
137. Siranidou, E.; Kang, Z.; Buchenauer, H. Studies on symptom development, phenolic compounds and morphological defenceresponses in wheat cultivars differing in resistance to Fusarium Head Blight. J. Phytopathol. 2002, 150, 200–208. [CrossRef]
138. Matsukawa, T.; Isobe, T.; Ishihara, A.; Iwamura, H. Occurrence of avenanthramides and hydroxycinnamoylCoA: Hydroxyan-thranilate N-hydroxycinnamoyltransferase activity in oat seeds. Zeitschrift Naturforschung C 2000, 55, 30–36. [CrossRef]
139. Peterson, D.M.; Dimberg, L.H. Avenanthramide concentrations and hydroxycinnamoyl-CoA: Hydroxyanthranilate N-hydroxycinnamoyltransferase activities in developing oats. J. Cereal Sci. 2008, 47, 101–108. [CrossRef]
140. Bryngelsson, S.; Ishihara, A.; Dimberg, L.H. Levels of avenanthramides and activity of hydroxycinnamoylCoA: Hydroxyan-thranilate N-Hydroxycinnamoyl transferase (HHT) in steeped or germinated oat samples. Cereal Chem. 2003, 80, 356–360.[CrossRef]
141. Dimberg, L.H.; Molteberg, E.L.; Solheim, R.; Frølich, W. Variation in oat groats due to variety, storage and heat treatment I:Phenolic compounds. J. Cereal Sci. 1996, 24, 263–272. [CrossRef]
142. Gould, K.S. Nature’s Swiss army knife: The diverse protective roles of anthocyanins in leaves. J. Biomed. Biotech. 2004, 5, 314–320.[CrossRef] [PubMed]
143. Dorofeev, V.F.; Yakubtsiner, M.M.; Rudenko, M.I.; Migushova, E.F.; Udachin, R.A.; Merejko, A.F.; Semenova, L.V.; Novikova, M.V.;Gradchaninova, O.D.; Shitova, I.P. Wheat of the World; Kolos: Leningrad, Russia, 1976.
144. Shoeva, O.Y.; Gordeeva, E.I.; Arbuzova, V.S.; Khlestkina, E.K. Anthocyanins participate in protection of wheat seedlings fromosmotic stress: A case study of near isogenic lines. Cereal Res. Commun. 2017, 45, 47–56. [CrossRef]
145. Gordeeva, E.I.; Shoeva, O.Y.; Yudina, R.S.; Kukoeva, T.V.; Khlestkina, E.K. Effect of seed pre-sowing gamma-irradiation treatmentin bread wheat lines differing by anthocyanin pigmentation. Cereal Res. Commun. 2018, 46, 41–53. [CrossRef]
146. Shoeva, O.Y.; Khlestkina, E.K. Anthocyanins participate in the protection of wheat seedlings against cadmium stress. Cereal Res.Commun. 2018, 46, 242–252. [CrossRef]
147. Marbach, I.; Meyer, A.M. Permeability of seed coats to water as related to drying conditions and metabolism of phenolics. PlantPhysiol. 1974, 54, 817–820. [CrossRef] [PubMed]
148. Strumeyer, D.H.; Malin, M.J. Condensed tannins in grain sorghum. Isolation, fractionation, and characterization. J. Agric. FoodChem. 1975, 23, 909–914. [CrossRef]
149. Gelman, N.S. Wheat grain dehydrogenases: Grain Biochemistry. Sbornik Acad. Sci. USSR 1951, 17–33.150. Dimberg, L.H.; Gissén, C.; Nilsson, J. Phenolic compounds in oat grains (Avena sativa L.) grown in conventional and organic
systems. Ambio 2005, 34, 331–337. [CrossRef]151. Emmons, C.; Peterson, D.M. Antioxidant activity and phenolic content of oat as affected by cultivar and location. Crop. Sci. 2001,
41, 1676–1681. [CrossRef]152. Peterson, D.M.; Wesenberg, D.M.; Burrup, D.E.; Erikson, C.A. Relationships among agronomic traits and grain composition in oat
genotypes grown in different environments. Crop. Sci. 2005, 45, 1249–1255. [CrossRef]153. Wise, M.L.; Doehlert, D.C.; McMullen, M.S. Association of avenanthramide concentration in oat (Avena sativa L.) grain with
crown rust incidence and genetic resistance. Cereal Chem. 2008, 85, 639–641. [CrossRef]154. Oraby, H.F.; El-Tohamy, M.F.; Kamel, A.M.; Ramadan, M.F. Changes in the concentration of avenanthramides in response to
salinity stress in CBF3 transgenic oat. J. Cereal Sci. 2017, 76, 263–270. [CrossRef]155. Havrlentová, M.; Deáková, L.; Kraic, J.; Žofajová, A. Can β-D-glucan protect oat seeds against a heat stress? Nova Biotechnologica
Chimica 2016, 15, 107. [CrossRef]156. Bhatty, R.S.; Macgregor, A.W.; Rossnagel, B.G. Total and acid-soluble β-glucan content in hulless and its relationship to acid-extract
viscosity. Cereal Chem. 1991, 68, 221–227.157. Bohn, M.; Lüthje, S.; Sperling, P.; Heinz, E.; Dörffling, K. Plasma membrane lipid alterations induced by cold acclimation and
abscisic acid treatment of winter wheat seedlings differing in frost resistance. J. Plant. Physiol. 2007, 164, 146–156. [CrossRef][PubMed]
21

Plants 2021, 10, 86
158. Valitova, J.; Renkova, A.; Mukhitova, F.; Dmitrieva, S.; Beckett, R.P.; Minibayeva, F.V. Membrane sterols and genes of sterolbiosynthesis are involved in the response of Triticum aestivum seedlings to cold stress. Plant. Physiol. Biochem. 2019, 142, 452–459.[CrossRef]
159. Takahashi, D.; Imai, H.; Kawamura, Y.; Uemura, M. Lipid profiles of detergent resistant fractions of the plasma membrane in oatand rye in association with cold acclimation and freezing tolerance. Cryobiology 2016, 72, 123–134. [CrossRef]
22
plants
Article
Genetic Diversity and Combining Ability of WhiteMaize Inbred Lines under Different Plant Densities
Mohamed M. Kamara 1, Medhat Rehan 2,3, Khaled M. Ibrahim 4, Abdullah S. Alsohim 3,
Mohsen M. Elsharkawy 5, Ahmed M. S. Kheir 6, Emad M. Hafez 1 and Mohamed A. El-Esawi 7,*
1 Department of Agronomy, Faculty of Agriculture, Kafrelsheikh University, Kafr El-Sheikh 33516, Egypt;[email protected] (M.M.K.); [email protected] (E.M.H.)
2 Department of Genetics, Faculty of Agriculture, Kafrelsheikh University, Kafr El-Sheikh 33516, Egypt;[email protected]
3 Department of Plant Production and Protection, College of Agriculture and Veterinary Medicine, QassimUniversity, Burydah 51452, Saudi Arabia; [email protected]
4 Agronomy Department, Faculty of Agriculture, New Valley University, El-Kharga 72511, Egypt;[email protected]
5 Department of Agricultural Botany, Faculty of Agriculture, Kafrelsheikh University,Kafr Elsheikh 33516, Egypt; [email protected]
6 Soils, Water and Environment Research Institute, Agricultural Research Center, Giza 12112, Egypt;[email protected]
7 Botany Department, Faculty of Science, Tanta University, Tanta 31527, Egypt* Correspondence: [email protected]
Received: 7 August 2020; Accepted: 31 August 2020; Published: 3 September 2020
Abstract: Knowledge of combining ability and genetic diversity are important prerequisites for thedevelopment of outstanding hybrids that are tolerant to high plant density. This work was carried outto assess general combining ability (GCA) and specific combining ability (SCA), identify promisinghybrids, estimate genetic diversity among the inbred lines and correlate genetic distance to hybridperformance and SCA across different plant densities. A total of 28 F1 hybrids obtained by crossingeight adverse inbred lines (four local and four exotic) were evaluated under three plant densities59,500 (D1), 71,400 (D2) and 83,300 (D3) plants ha−1 using spilt plot design with three replications attwo locations during 2018 season. Increasing plant density from D1 to D3 significantly decreasedleaf angle (LANG), chlorophyll content (CHLC), all ear characteristics and grain yield per plant(GYPP). Contrarily, days to silking (DTS), anthesis–silking interval (ASI), plant height (PLHT), earheight (EHT), and grain yield per hectare (GYPH) were significantly increased. Both additive andnon-additive gene actions were involved in the inheritance of all the evaluated traits, but additive geneaction was predominant for most traits. Inbred lines L1, L2, and L5 were the best general combiners forincreasing grain yield and other desirable traits across research environments. Two hybrids L2 × L5
and L2 × L8 were found to be good specific combiners for ASI, LANG, GYPP and GYPH. Furthermore,these hybrids are ideal for further testing and promotion for commercialization under high plantdensity. Genetic distance (GD) among pairs of inbred lines ranged from 0.31 to 0.78, with an averageof 0.61. Clustering based on molecular GD has effectively grouped the inbred lines according to theirorigin. No significant correlation was found between GD and both hybrid performance and SCAfor grain yield and other traits and proved to be of no predictive value. Nevertheless, SCA could beused to predict the hybrid performance across all plant densities. Overall, this work presents usefulinformation regarding the inheritance of maize grain yield and other important traits under highplant density.
Keywords: maize; density tolerance; combining ability; gene effects; genetic diversity
Plants 2020, 9, 1140; doi:10.3390/plants9091140 www.mdpi.com/journal/plants23
Plants 2020, 9, 1140
1. Introduction
Maize (Zea mays L.) is one of the main economic crops that subsidize global food security. It iswidely used for food, animal feed, edible oil and fuel worldwide [1]. In Egypt, maize is consideredthe second most important crop, with the annual production of the grain reaching about 7.30 Mtfrom approximately 0.94 Mha in 2018 [2]. This production is insufficient to meet the demands of afast-growing population. The gap between production and consumption is approximately 45% [3].This gap could be narrowed by further increase in the hybrids yield potential and total yield productionfrom unit area. [4]. Increasing planting density is required to increase grain yield production inmaize [5]. The average density of intense maize cultivation in the USA is 97,500 plants ha−1 [6]. Therecommended planting density in Egypt is 53,533 plants ha−1 [7], which is around half the amountused in the USA. The use of lower plant densities decreases light interception, leading to high grainproduction per plant but low grain production per unit area [8]. The yield production could bemaximized by growing maize hybrids that can tolerate high plant density up to 100,000 plants ha−1.However, high plant densities enhance interplant competition for light, nutrients, and water [9].Additionally, it increases the anthesis–silking interval [10], thereby increasing kernel abortion [11] andreducing single plant yield. Al-Naggar et al. [12] showed that with increased planting density, plantand ear heights increased, whereas chlorophyll content, grains per ear and thousand grain weightsdecreased. The tolerance of the current Egyptian maize hybrids to high plant densities is low. Thisprobably attributed to their tallness, decumbent leaf, one-eared and large size [7,13]. Conversely,modern maize hybrids in developed countries are characterized by early silking, short anthesis–silkinginterval and prolificacy, which are essential adaptive traits to high plant density tolerance [10,14–16].
Breeding programs should be directed towards the development of hybrids that are not onlyhigh yielding, but also show enhanced adaptability to high plant density tolerance. The successfulidentification of desirable hybrid combinations depends on the combining ability of the parents andthe gene effects involved in the expression of target trait [17]. Furthermore, knowledge of geneaction is important to devise an appropriate breeding strategy [18]. General combining ability (GCA)and specific combining ability (SCA) are widely used in selection of good parents and hybrids,respectively [19]. Among different biometrical approaches, the diallel mating design is commonlyused by maize breeders to estimate GCA and SCA effects [20–22]. GCA is associated with additivegene effects, whereas SCA is typically associated with non-additive gene effects [23]. Both additiveand non-additive gene actions were reported to be important in the inheritance of maize grain yieldunder high plant density [24]. However, the grain yield and other assessed traits under different plantdensities among selected maize inbred lines were mostly controlled by additive gene action [7,25].
The assessment of the diversity and genetic distance in the available maize inbreds is important fora hybrid breeding program, in order to identify inbreds that would produce crosses with good levels ofheterosis without testing all hybrids combinations [26,27]. Different types of DNA markers are availableto estimate genetic distance. The simple sequence repeat (SSR) markers or microsatellites have beenconsidered as the markers of choice owing to their co-dominant, high polymorphic, multi-allelic natureand high reproducibility [28–30]. However, contradictory results have been reported with respect to therelationship between genetic distance and hybrid performance in maize. Significant correlations werereported between molecular marker-based GD and F1 hybrid grain yield in maize [31,32]. Whereas,other studies reported no significant correlation [33,34]. The objectives of this study were (i) to estimateGCA of the inbred lines and SCA of the hybrids under different plant densities; (ii) to determine themode of gene action controlling grain yield and other important agronomic traits; (iii) to identifypromising hybrids that yield well at high plant density; and (iv) to assess genetic diversity among theeight inbred lines and correlate genetic distance to hybrid performance and SCA.
24

Plants 2020, 9, 1140
2. Results
2.1. Analysis of Variance
The analysis of variance (ANOVA) revealed highly significant mean squares for locations (L),densities (D), hybrids (H) and their interactions (L × D, H × L, H × D and H × D × L) for all the studiedcharacteristics (Table 1). Moreover, general combining ability (GCA) and specific combining ability(SCA) mean squares were highly significant for all the measured traits. The magnitude of GCA meansquares was higher than that of SCA mean squares (the ratio of GCA/SCA was higher than the unity)for all the studied traits, except number of kernels per row (NKPR) trait. Significant mean squares ofGCA × L, SCA × L, GCA × D, SCA × D, GCA × L × D, SCA × L × D interactions were detected for allthe studied traits, except GCA × L and GCA × L × D for leaf angle (LANG) and chlorophyll content(CHLC), GCA × D for ear diameter (ED) and SCA × D for EHT, LANG and ED were not significant.
Table 1. Analysis of variance for the evaluated crosses under three plant densities combined acrosstwo locations for all the studied traits.
SOV DF DTS ASI PLHT EHT LANG CHLC
Locations (L) 1 1114.26 ** 12.87 ** 16,592.96 ** 6489.21 ** 108.64 * 400.29 **Rep (L) 4 15.14 0.58 325.06 138.65 14.87 10.84
Densities (D) 2 1899.48 ** 73.14 ** 23,422.30 ** 9384.04 ** 603.65 ** 1585.67 **L × D 2 308.23 ** 22.39 ** 9852.25 ** 5708.38 ** 27.17 ** 180.79 **
Error a 8 1.07 0.19 121.77 53.15 3.33 2.34Hybrids (H) 27 28.04 ** 7.89 ** 6842.02 ** 2056.81 ** 425.82 ** 119.32 **
GCA 7 57.16 ** 12.03 ** 11,397.27 ** 2447.44 ** 836.14 ** 162.00 **SCA 20 17.85 ** 6.44 ** 5247.69 ** 1920.08 ** 282.20 ** 104.38 **
H × L 27 61.66 ** 0.83 ** 796.40 ** 362.93 ** 4.15 ** 3.61 **GCA × L 7 52.48 ** 0.88 ** 915.53 ** 309.35 ** 3.16 3.57SCA × L 20 64.88 ** 0.81 ** 754.71 ** 381.68 ** 4.49 ** 3.62 *
H × D 54 5.01 ** 0.31 ** 254.88 ** 60.51 ** 4.57 ** 10.19 **GCA × D 14 4.54 ** 0.30 ** 212.94 ** 78.99 * 6.63 ** 19.13 **SCA × D 40 5.18 ** 0.31 ** 269.56 ** 54.03 3.85 7.06 **
H × D × L 54 63.25 ** 0.88 ** 592.24 ** 397.54 ** 4.11 * 4.30 **GCA × L × D 14 64.03 ** 0.86 ** 544.25 ** 363.40 ** 3.90 2.64SCA × L × D 40 62.97 ** 0.88 ** 609.03 ** 409.48 ** 4.19 * 4.88 **
Error b 324 0.81 0.14 84.07 42.33 2.69 1.93GCA/SCA 3.20 1.87 2.17 1.27 2.96 1.55
SOV DF ED NRPE NKPR TKW GYPP GYPH
Locations (L) 1 2.09 * 36.35 ** 353.21 ** 8232.88 ** 12,079.40 ** 40.40 **Rep (L) 4 0. 26 1.35 12.53 225.52 285.31 0.78
Densities (D) 2 21.93 ** 88.74 ** 2229.25 ** 91,176.13 ** 50,563.13 ** 58.38 **L × D 2 1.78 ** 6.33 ** 331.20 ** 3151.63 ** 14,971.59 ** 54.39 **
Error a 8 0.18 0.52 3.09 192.11 56.68 0.30Hybrids (H) 27 1.01 ** 8.75 ** 56.88 ** 10,944.20 ** 9941.33 ** 49.21 **
GCA 7 1.07 ** 16.50 ** 41.59 ** 12,835.71 ** 13,527.67 ** 67.17 **SCA 20 0.99 ** 6.04 ** 62.24 ** 10,282.17 ** 8686.11 ** 42.93 **
H × L 27 1.25 ** 18.90 ** 21.01 ** 2126.28 ** 1230.60 ** 4.24 **GCA × L 7 1.56 ** 20.27 ** 17.14 ** 2328.04 ** 1621.69 ** 5.61 **SCA × L 20 1.14 ** 18.42 ** 22.36 ** 2055.67 ** 1093.72 ** 3.75 **
H × D 54 0.20 ** 0.98 ** 8.77 ** 360.55 ** 187.93 ** 0.71 **GCA × D 14 0.24 1.45 ** 10.49 ** 560.46 ** 166.93 ** 0.73 **SCA × D 40 0.19 0.82 ** 8.17 ** 290.58 ** 195.28 ** 0.70 **
H × D × L 54 1.27 ** 13.20 ** 16.84 ** 621.87 ** 1517.64 ** 5.45 **GCA × L × D 14 1.45 ** 11.20 ** 19.16 ** 529.08 ** 1951.52 ** 6.99 **SCA × L × D 40 1.21 ** 13.89 ** 16.02 ** 654.34 ** 1365.78 ** 4.91 **
Error b 324 0.15 0.38 2.41 143.75 45.22 0.25GCA/SCA 1.08 2.73 0.67 1.25 1.56 1.57
* and ** significant at 0.05 and 0.01 levels of probability, respectively. DTS: days to 50% silking, ASI: anthesis–silkinginterval, PLHT: plant height, EHT: ear height, LANG: leaf angle, CHLC: chlorophyll content, ED: ear diameter,NRPE: number of rows per ear, NKPR: number of kernels per row, TKW: thousand kernel weight, GYPP: grain yieldper plant and GYPH: grain yield per hectare.
25
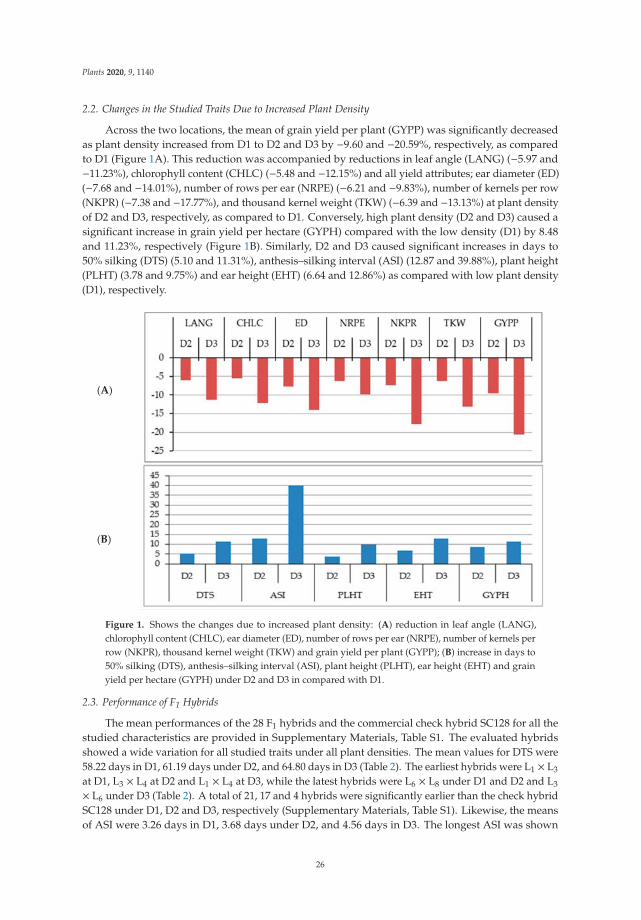
Plants 2020, 9, 1140
2.2. Changes in the Studied Traits Due to Increased Plant Density
Across the two locations, the mean of grain yield per plant (GYPP) was significantly decreasedas plant density increased from D1 to D2 and D3 by −9.60 and −20.59%, respectively, as comparedto D1 (Figure 1A). This reduction was accompanied by reductions in leaf angle (LANG) (−5.97 and−11.23%), chlorophyll content (CHLC) (−5.48 and −12.15%) and all yield attributes; ear diameter (ED)(−7.68 and −14.01%), number of rows per ear (NRPE) (−6.21 and −9.83%), number of kernels per row(NKPR) (−7.38 and −17.77%), and thousand kernel weight (TKW) (−6.39 and −13.13%) at plant densityof D2 and D3, respectively, as compared to D1. Conversely, high plant density (D2 and D3) caused asignificant increase in grain yield per hectare (GYPH) compared with the low density (D1) by 8.48and 11.23%, respectively (Figure 1B). Similarly, D2 and D3 caused significant increases in days to50% silking (DTS) (5.10 and 11.31%), anthesis–silking interval (ASI) (12.87 and 39.88%), plant height(PLHT) (3.78 and 9.75%) and ear height (EHT) (6.64 and 12.86%) as compared with low plant density(D1), respectively.
(A)
(B)
Figure 1. Shows the changes due to increased plant density: (A) reduction in leaf angle (LANG),chlorophyll content (CHLC), ear diameter (ED), number of rows per ear (NRPE), number of kernels perrow (NKPR), thousand kernel weight (TKW) and grain yield per plant (GYPP); (B) increase in days to50% silking (DTS), anthesis–silking interval (ASI), plant height (PLHT), ear height (EHT) and grainyield per hectare (GYPH) under D2 and D3 in compared with D1.
2.3. Performance of F1 Hybrids
The mean performances of the 28 F1 hybrids and the commercial check hybrid SC128 for all thestudied characteristics are provided in Supplementary Materials, Table S1. The evaluated hybridsshowed a wide variation for all studied traits under all plant densities. The mean values for DTS were58.22 days in D1, 61.19 days under D2, and 64.80 days in D3 (Table 2). The earliest hybrids were L1 × L3
at D1, L3 × L4 at D2 and L1 × L4 at D3, while the latest hybrids were L6 × L8 under D1 and D2 and L3
× L6 under D3 (Table 2). A total of 21, 17 and 4 hybrids were significantly earlier than the check hybridSC128 under D1, D2 and D3, respectively (Supplementary Materials, Table S1). Likewise, the meansof ASI were 3.26 days in D1, 3.68 days under D2, and 4.56 days in D3. The longest ASI was shown
26
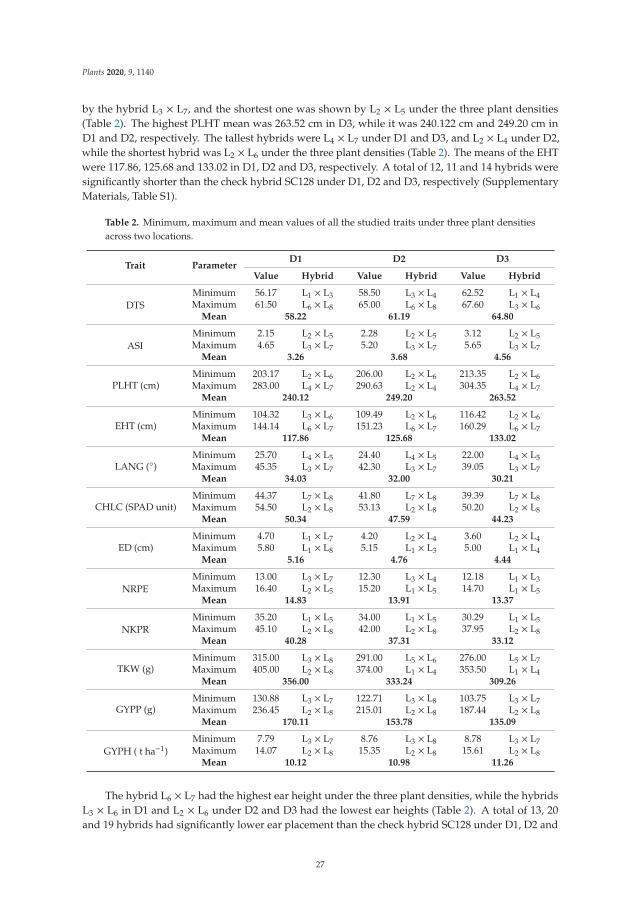
Plants 2020, 9, 1140
by the hybrid L3 × L7, and the shortest one was shown by L2 × L5 under the three plant densities(Table 2). The highest PLHT mean was 263.52 cm in D3, while it was 240.122 cm and 249.20 cm inD1 and D2, respectively. The tallest hybrids were L4 × L7 under D1 and D3, and L2 × L4 under D2,while the shortest hybrid was L2 × L6 under the three plant densities (Table 2). The means of the EHTwere 117.86, 125.68 and 133.02 in D1, D2 and D3, respectively. A total of 12, 11 and 14 hybrids weresignificantly shorter than the check hybrid SC128 under D1, D2 and D3, respectively (SupplementaryMaterials, Table S1).
Table 2. Minimum, maximum and mean values of all the studied traits under three plant densitiesacross two locations.
Trait ParameterD1 D2 D3
Value Hybrid Value Hybrid Value Hybrid
DTSMinimum 56.17 L1 × L3 58.50 L3 × L4 62.52 L1 × L4Maximum 61.50 L6 × L8 65.00 L6 × L8 67.60 L3 × L6
Mean 58.22 61.19 64.80
ASIMinimum 2.15 L2 × L5 2.28 L2 × L5 3.12 L2 × L5Maximum 4.65 L3 × L7 5.20 L3 × L7 5.65 L3 × L7
Mean 3.26 3.68 4.56
PLHT (cm)Minimum 203.17 L2 × L6 206.00 L2 × L6 213.35 L2 × L6Maximum 283.00 L4 × L7 290.63 L2 × L4 304.35 L4 × L7
Mean 240.12 249.20 263.52
EHT (cm)Minimum 104.32 L3 × L6 109.49 L2 × L6 116.42 L2 × L6Maximum 144.14 L6 × L7 151.23 L6 × L7 160.29 L6 × L7
Mean 117.86 125.68 133.02
LANG (◦)Minimum 25.70 L4 × L5 24.40 L4 × L5 22.00 L4 × L5Maximum 45.35 L3 × L7 42.30 L3 × L7 39.05 L3 × L7
Mean 34.03 32.00 30.21
CHLC (SPAD unit)Minimum 44.37 L7 × L8 41.80 L7 × L8 39.39 L7 × L8Maximum 54.50 L2 × L8 53.13 L2 × L8 50.20 L2 × L8
Mean 50.34 47.59 44.23
ED (cm)Minimum 4.70 L1 × L7 4.20 L2 × L4 3.60 L2 × L4Maximum 5.80 L1 × L8 5.15 L1 × L3 5.00 L1 × L4
Mean 5.16 4.76 4.44
NRPEMinimum 13.00 L3 × L7 12.30 L3 × L4 12.18 L1 × L3Maximum 16.40 L2 × L5 15.20 L1 × L5 14.70 L1 × L5
Mean 14.83 13.91 13.37
NKPRMinimum 35.20 L1 × L5 34.00 L1 × L5 30.29 L1 × L5Maximum 45.10 L2 × L8 42.00 L2 × L8 37.95 L2 × L8
Mean 40.28 37.31 33.12
TKW (g)Minimum 315.00 L3 × L8 291.00 L5 × L6 276.00 L5 × L7Maximum 405.00 L2 × L8 374.00 L1 × L4 353.50 L1 × L4
Mean 356.00 333.24 309.26
GYPP (g)Minimum 130.88 L3 × L7 122.71 L3 × L8 103.75 L3 × L7Maximum 236.45 L2 × L8 215.01 L2 × L8 187.44 L2 × L8
Mean 170.11 153.78 135.09
GYPH ( t ha−1)Minimum 7.79 L3 × L7 8.76 L3 × L8 8.78 L3 × L7Maximum 14.07 L2 × L8 15.35 L2 × L8 15.61 L2 × L8
Mean 10.12 10.98 11.26
The hybrid L6 × L7 had the highest ear height under the three plant densities, while the hybridsL3 × L6 in D1 and L2 × L6 under D2 and D3 had the lowest ear heights (Table 2). A total of 13, 20and 19 hybrids had significantly lower ear placement than the check hybrid SC128 under D1, D2 and
27
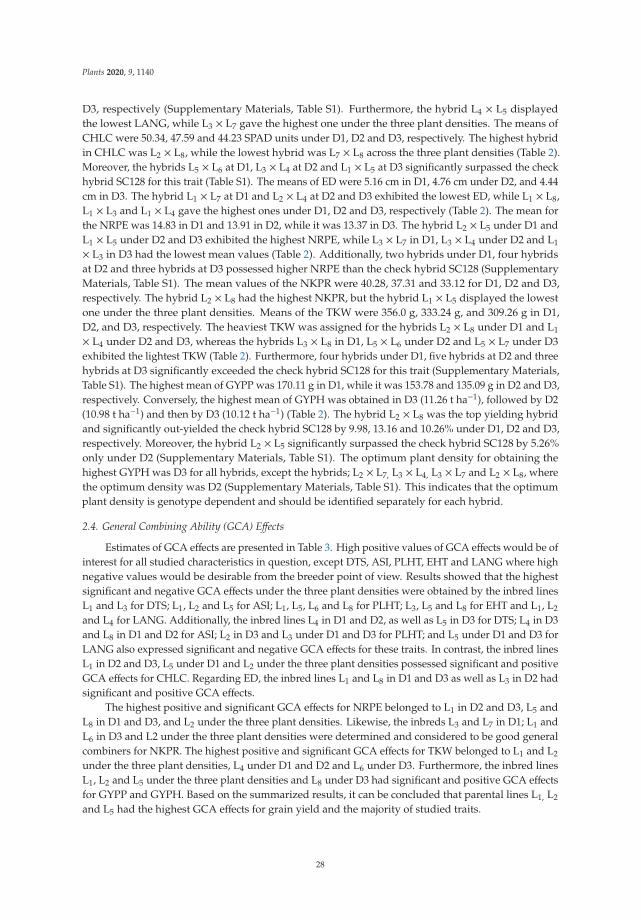
Plants 2020, 9, 1140
D3, respectively (Supplementary Materials, Table S1). Furthermore, the hybrid L4 × L5 displayedthe lowest LANG, while L3 × L7 gave the highest one under the three plant densities. The means ofCHLC were 50.34, 47.59 and 44.23 SPAD units under D1, D2 and D3, respectively. The highest hybridin CHLC was L2 × L8, while the lowest hybrid was L7 × L8 across the three plant densities (Table 2).Moreover, the hybrids L5 × L6 at D1, L3 × L4 at D2 and L1 × L5 at D3 significantly surpassed the checkhybrid SC128 for this trait (Table S1). The means of ED were 5.16 cm in D1, 4.76 cm under D2, and 4.44cm in D3. The hybrid L1 × L7 at D1 and L2 × L4 at D2 and D3 exhibited the lowest ED, while L1 × L8,L1 × L3 and L1 × L4 gave the highest ones under D1, D2 and D3, respectively (Table 2). The mean forthe NRPE was 14.83 in D1 and 13.91 in D2, while it was 13.37 in D3. The hybrid L2 × L5 under D1 andL1 × L5 under D2 and D3 exhibited the highest NRPE, while L3 × L7 in D1, L3 × L4 under D2 and L1
× L3 in D3 had the lowest mean values (Table 2). Additionally, two hybrids under D1, four hybridsat D2 and three hybrids at D3 possessed higher NRPE than the check hybrid SC128 (SupplementaryMaterials, Table S1). The mean values of the NKPR were 40.28, 37.31 and 33.12 for D1, D2 and D3,respectively. The hybrid L2 × L8 had the highest NKPR, but the hybrid L1 × L5 displayed the lowestone under the three plant densities. Means of the TKW were 356.0 g, 333.24 g, and 309.26 g in D1,D2, and D3, respectively. The heaviest TKW was assigned for the hybrids L2 × L8 under D1 and L1
× L4 under D2 and D3, whereas the hybrids L3 × L8 in D1, L5 × L6 under D2 and L5 × L7 under D3exhibited the lightest TKW (Table 2). Furthermore, four hybrids under D1, five hybrids at D2 and threehybrids at D3 significantly exceeded the check hybrid SC128 for this trait (Supplementary Materials,Table S1). The highest mean of GYPP was 170.11 g in D1, while it was 153.78 and 135.09 g in D2 and D3,respectively. Conversely, the highest mean of GYPH was obtained in D3 (11.26 t ha−1), followed by D2(10.98 t ha−1) and then by D3 (10.12 t ha−1) (Table 2). The hybrid L2 × L8 was the top yielding hybridand significantly out-yielded the check hybrid SC128 by 9.98, 13.16 and 10.26% under D1, D2 and D3,respectively. Moreover, the hybrid L2 × L5 significantly surpassed the check hybrid SC128 by 5.26%only under D2 (Supplementary Materials, Table S1). The optimum plant density for obtaining thehighest GYPH was D3 for all hybrids, except the hybrids; L2 × L7, L3 × L4, L3 × L7 and L2 × L8, wherethe optimum density was D2 (Supplementary Materials, Table S1). This indicates that the optimumplant density is genotype dependent and should be identified separately for each hybrid.
2.4. General Combining Ability (GCA) Effects
Estimates of GCA effects are presented in Table 3. High positive values of GCA effects would be ofinterest for all studied characteristics in question, except DTS, ASI, PLHT, EHT and LANG where highnegative values would be desirable from the breeder point of view. Results showed that the highestsignificant and negative GCA effects under the three plant densities were obtained by the inbred linesL1 and L3 for DTS; L1, L2 and L5 for ASI; L1, L5, L6 and L8 for PLHT; L3, L5 and L8 for EHT and L1, L2
and L4 for LANG. Additionally, the inbred lines L4 in D1 and D2, as well as L5 in D3 for DTS; L4 in D3and L8 in D1 and D2 for ASI; L2 in D3 and L3 under D1 and D3 for PLHT; and L5 under D1 and D3 forLANG also expressed significant and negative GCA effects for these traits. In contrast, the inbred linesL1 in D2 and D3, L5 under D1 and L2 under the three plant densities possessed significant and positiveGCA effects for CHLC. Regarding ED, the inbred lines L1 and L8 in D1 and D3 as well as L3 in D2 hadsignificant and positive GCA effects.
The highest positive and significant GCA effects for NRPE belonged to L1 in D2 and D3, L5 andL8 in D1 and D3, and L2 under the three plant densities. Likewise, the inbreds L3 and L7 in D1; L1 andL6 in D3 and L2 under the three plant densities were determined and considered to be good generalcombiners for NKPR. The highest positive and significant GCA effects for TKW belonged to L1 and L2
under the three plant densities, L4 under D1 and D2 and L6 under D3. Furthermore, the inbred linesL1, L2 and L5 under the three plant densities and L8 under D3 had significant and positive GCA effectsfor GYPP and GYPH. Based on the summarized results, it can be concluded that parental lines L1, L2
and L5 had the highest GCA effects for grain yield and the majority of studied traits.
28
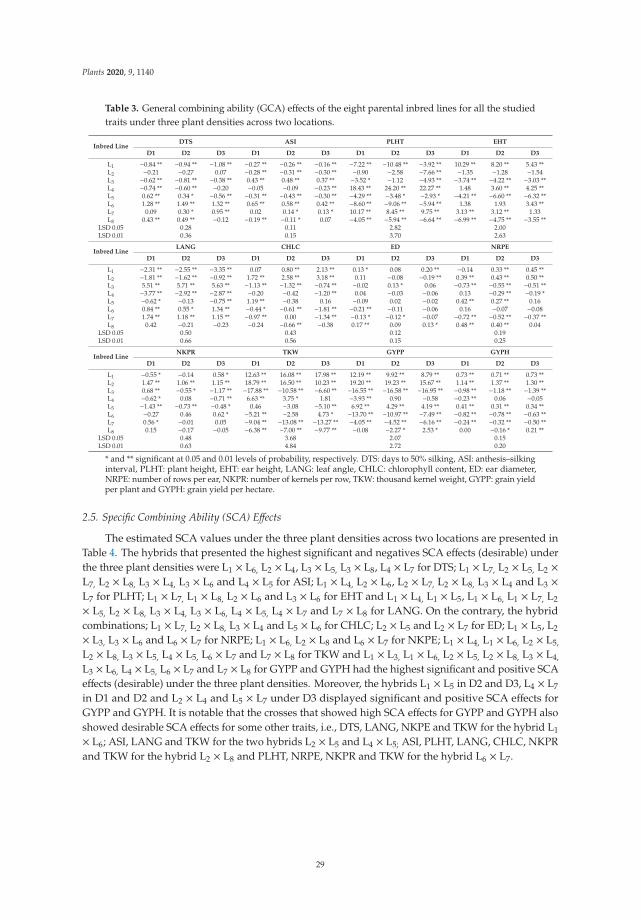
Plants 2020, 9, 1140
Table 3. General combining ability (GCA) effects of the eight parental inbred lines for all the studiedtraits under three plant densities across two locations.
Inbred LineDTS ASI PLHT EHT
D1 D2 D3 D1 D2 D3 D1 D2 D3 D1 D2 D3
L1 −0.84 ** −0.94 ** −1.08 ** −0.27 ** −0.26 ** −0.16 ** −7.22 ** −10.48 ** −3.92 ** 10.29 ** 8.20 ** 5.43 **L2 −0.21 −0.27 0.07 −0.28 ** −0.31 ** −0.30 ** −0.90 −2.58 −7.66 ** −1.35 −1.28 −1.54L3 −0.62 ** −0.81 ** −0.38 ** 0.43 ** 0.48 ** 0.37 ** −3.52 * −1.12 −4.93 ** −3.74 ** −4.22 ** −3.03 **L4 −0.74 ** −0.60 ** −0.20 −0.05 −0.09 −0.23 ** 18.43 ** 24.20 ** 22.27 ** 1.48 3.60 ** 4.25 **L5 0.62 ** 0.34 * −0.56 ** −0.31 ** −0.43 ** −0.30 ** −4.29 ** −3.48 * −2.93 * −4.21 ** −6.60 ** −6.32 **L6 1.28 ** 1.49 ** 1.32 ** 0.65 ** 0.58 ** 0.42 ** −8.60 ** −9.06 ** −5.94 ** 1.38 1.93 3.43 **L7 0.09 0.30 * 0.95 ** 0.02 0.14 * 0.13 * 10.17 ** 8.45 ** 9.75 ** 3.13 ** 3.12 ** 1.33L8 0.43 ** 0.49 ** −0.12 −0.19 ** −0.11 * 0.07 −4.05 ** −5.94 ** −6.64 ** −6.99 ** −4.75 ** −3.55 **
LSD 0.05 0.28 0.11 2.82 2.00LSD 0.01 0.36 0.15 3.70 2.63
Inbred LineLANG CHLC ED NRPE
D1 D2 D3 D1 D2 D3 D1 D2 D3 D1 D2 D3
L1 −2.31 ** −2.55 ** −3.35 ** 0.07 0.80 ** 2.13 ** 0.13 * 0.08 0.20 ** −0.14 0.33 ** 0.45 **L2 −1.81 ** −1.62 ** −0.92 ** 1.72 ** 2.58 ** 3.18 ** 0.11 −0.08 −0.19 ** 0.39 ** 0.43 ** 0.50 **L3 5.51 ** 5.71 ** 5.63 ** −1.13 ** −1.32 ** −0.74 ** −0.02 0.13 * 0.06 −0.73 ** −0.55 ** −0.51 **L4 −3.77 ** −2.92 ** −2.87 ** −0.20 −0.42 −1.20 ** 0.04 −0.03 −0.06 0.13 −0.29 ** −0.19 *L5 −0.62 * −0.13 −0.75 ** 1.19 ** −0.38 0.16 −0.09 0.02 −0.02 0.42 ** 0.27 ** 0.16L6 0.84 ** 0.55 * 1.34 ** −0.44 * −0.61 ** −1.81 ** −0.21 ** −0.11 −0.06 0.16 −0.07 −0.08L7 1.74 ** 1.18 ** 1.15 ** −0.97 ** 0.00 −1.34 ** −0.13 * −0.12 * −0.07 −0.72 ** −0.52 ** −0.37 **L8 0.42 −0.21 −0.23 −0.24 −0.66 ** −0.38 0.17 ** 0.09 0.13 * 0.48 ** 0.40 ** 0.04
LSD 0.05 0.50 0.43 0.12 0.19LSD 0.01 0.66 0.56 0.15 0.25
Inbred LineNKPR TKW GYPP GYPH
D1 D2 D3 D1 D2 D3 D1 D2 D3 D1 D2 D3
L1 −0.55 * −0.14 0.58 * 12.63 ** 16.08 ** 17.98 ** 12.19 ** 9.92 ** 8.79 ** 0.73 ** 0.71 ** 0.73 **L2 1.47 ** 1.06 ** 1.15 ** 18.79 ** 16.50 ** 10.23 ** 19.20 ** 19.23 ** 15.67 ** 1.14 ** 1.37 ** 1.30 **L3 0.68 ** −0.55 * −1.17 ** −17.88 ** −10.58 ** −6.60 ** −16.55 ** −16.58 ** −16.95 ** −0.98 ** −1.18 ** −1.39 **L4 −0.62 * 0.08 −0.71 ** 6.63 ** 3.75 * 1.81 −3.93 ** 0.90 −0.58 −0.23 ** 0.06 −0.05L5 −1.43 ** −0.73 ** −0.48 * 0.46 −3.08 −5.10 ** 6.92 ** 4.29 ** 4.19 ** 0.41 ** 0.31 ** 0.34 **L6 −0.27 0.46 0.62 * −5.21 ** −2.58 4.73 * −13.70 ** −10.97 ** −7.49 ** −0.82 ** −0.78 ** −0.63 **L7 0.56 * −0.01 0.05 −9.04 ** −13.08 ** −13.27 ** −4.05 ** −4.52 ** −6.16 ** −0.24 ** −0.32 ** −0.50 **L8 0.15 −0.17 −0.05 −6.38 ** −7.00 ** −9.77 ** −0.08 −2.27 * 2.53 * 0.00 −0.16 * 0.21 **
LSD 0.05 0.48 3.68 2.07 0.15LSD 0.01 0.63 4.84 2.72 0.20
* and ** significant at 0.05 and 0.01 levels of probability, respectively. DTS: days to 50% silking, ASI: anthesis–silkinginterval, PLHT: plant height, EHT: ear height, LANG: leaf angle, CHLC: chlorophyll content, ED: ear diameter,NRPE: number of rows per ear, NKPR: number of kernels per row, TKW: thousand kernel weight, GYPP: grain yieldper plant and GYPH: grain yield per hectare.
2.5. Specific Combining Ability (SCA) Effects
The estimated SCA values under the three plant densities across two locations are presented inTable 4. The hybrids that presented the highest significant and negatives SCA effects (desirable) underthe three plant densities were L1 × L6, L2 × L4, L3 × L5, L3 × L8, L4 × L7 for DTS; L1 × L7, L2 × L5, L2 ×L7, L2 × L8, L3 × L4, L3 × L6 and L4 × L5 for ASI; L1 × L4, L2 × L6, L2 × L7, L2 × L8, L3 × L4 and L3 ×L7 for PLHT; L1 × L7, L1 × L8, L2 × L6 and L3 × L6 for EHT and L1 × L4, L1 × L5, L1 × L6, L1 × L7, L2
× L5, L2 × L8, L3 × L4, L3 × L6, L4 × L5, L4 × L7 and L7 × L8 for LANG. On the contrary, the hybridcombinations; L1 × L7, L2 × L8, L3 × L4 and L5 × L6 for CHLC; L2 × L5 and L2 × L7 for ED; L1 × L5, L2
× L3, L3 × L6 and L6 × L7 for NRPE; L1 × L6, L2 × L8 and L6 × L7 for NKPE; L1 × L4, L1 × L6, L2 × L5,
L2 × L8, L3 × L5, L4 × L5, L6 × L7 and L7 × L8 for TKW and L1 × L3, L1 × L6, L2 × L5, L2 × L8, L3 × L4,
L3 × L6, L4 × L5, L6 × L7 and L7 × L8 for GYPP and GYPH had the highest significant and positive SCAeffects (desirable) under the three plant densities. Moreover, the hybrids L1 × L5 in D2 and D3, L4 × L7
in D1 and D2 and L2 × L4 and L5 × L7 under D3 displayed significant and positive SCA effects forGYPP and GYPH. It is notable that the crosses that showed high SCA effects for GYPP and GYPH alsoshowed desirable SCA effects for some other traits, i.e., DTS, LANG, NKPE and TKW for the hybrid L1
× L6; ASI, LANG and TKW for the two hybrids L2 × L5 and L4 × L5; ASI, PLHT, LANG, CHLC, NKPRand TKW for the hybrid L2 × L8 and PLHT, NRPE, NKPR and TKW for the hybrid L6 × L7.
29
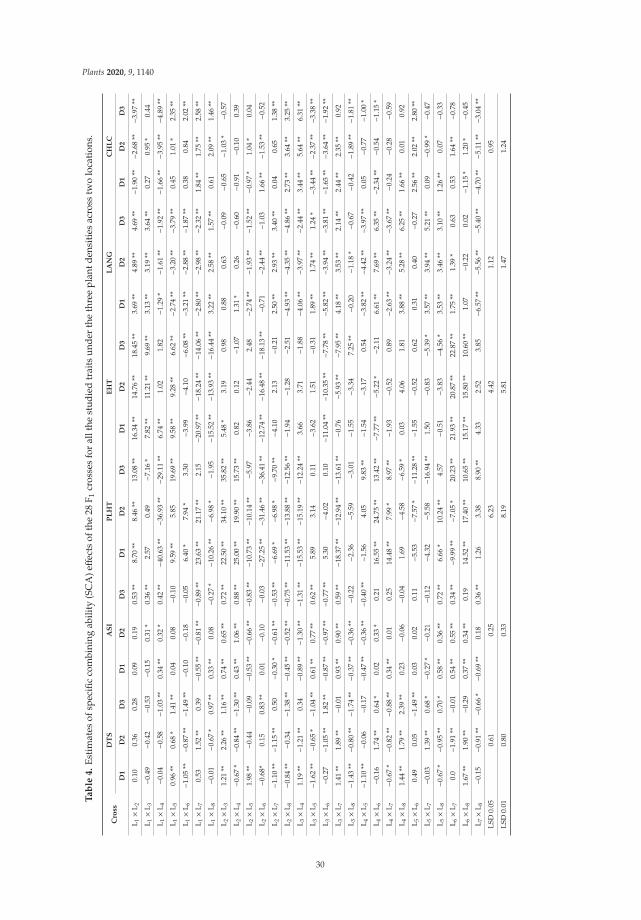
Plants 2020, 9, 1140
Ta
ble
4.
Esti
mat
esof
spec
ific
com
bini
ngab
ility
(SC
A)eff
ects
ofth
e28
F 1cr
osse
sfo
ral
lthe
stud
ied
trai
tsun
der
the
thre
epl
antd
ensi
ties
acro
sstw
olo
cati
ons.
Cro
ssD
TS
AS
IP
LH
TE
HT
LA
NG
CH
LC
D1
D2
D3
D1
D2
D3
D1
D2
D3
D1
D2
D3
D1
D2
D3
D1
D2
D3
L 1×L
20.
100.
360.
280.
090.
190.
53**
8.70
**8.
46**
13.0
8**
16.3
4**
14.7
6**
18.4
5**
3.69
**4.
89**
4.69
**−1
.90
**−2
.68
**−3
.97
**
L 1×L
3−0
.49
−0.4
2−0
.53
−0.1
50.
31*
0.36
**2.
570.
49−7
.16
*7.
82**
11.2
1**
9.69
**3.
13**
3.19
**3.
64**
0.27
0.95
*0.
44
L 1×L
4−0
.04
−0.5
8−1
.03
**0.
34**
0.32
*0.
42**
−40.
63**
−36.
93**
−29.
11**
6.74
**1.
021.
82−1
.29
*−1
.61
**−1
.92
**−1
.66
**−3
.95
**−4
.89
**
L 1×L
50.
96**
0.68
*1.
41**
0.04
0.08
−0.1
09.
59**
5.85
19.6
9**
9.58
**9.
28**
6.62
**−2
.74
**−3
.20
**−3
.79
**0.
451.
01*
2.35
**
L 1×L
6−1
.05
**−0
.87
**−1
.49
**−0
.10
−0.1
8−0
.05
6.40
*7.
94*
3.30
−3.9
9−4
.10
−6.0
8**
−3.2
1**
−2.8
8**
−1.8
7**
0.38
0.84
2.02
**
L 1×L
70.
531.
52**
0.39
−0.5
5**
−0.8
1**
−0.8
9**
23.6
3**
21.1
7**
2.15
−20.
97**
−18.
24**
−14.
06**
−2.8
0**
−2.9
8**
−2.3
2**
1.84
**1.
75**
2.58
**
L 1×L
8−0
.01
−0.6
7*
0.97
**0.
33**
0.08
−0.2
7*
−10.
26**
−6.9
8*
−1.9
5−1
5.52
**−1
3.93
**−1
6.44
**3.
22**
2.58
**1.
57**
0.61
2.09
**1.
46**
L 2×L
31.
21**
2.26
**1.
16**
0.74
**0.
65**
0.72
**22
.50
**34
.10
**35
.82
**5.
48*
3.19
0.98
0.88
0.63
−0.0
9−0
.65
−1.0
3*
−0.5
7
L 2×L
4−0
.67
*−0
.84
**−1
.30
**0.
43**
1.06
**0.
88**
25.0
0**
19.9
0**
15.7
3**
0.82
0.12
−1.0
71.
31*
0.26
−0.6
0−0
.91
−0.1
00.
39
L 2×L
51.
98**
−0.4
4−0
.09
−0.5
3**
−0.6
6**
−0.8
3**
−10.
73**
−10.
14**
−5.9
7−3
.86
−2.4
42.
48−2
.74
**−1
.93
**−1
.52
**−0
.97
*1.
04*
0.04
L 2×L
6−0
.68*
0.15
0.83
**0.
01−0
.10
−0.0
3−2
7.25
**−3
1.46
**−3
6.41
**−1
2.74
**−1
6.48
**−1
8.13
**−0
.71
−2.4
4**
−1.0
31.
66**
−1.5
3**
−0.5
2
L 2×L
7−1
.10
**−1
.15
**0.
50−0
.30
*−0
.61
**−0
.53
**−6
.69
*−6
.98
*−9
.70
**−4
.10
2.13
−0.2
12.
50**
2.93
**3.
40**
0.04
0.65
1.38
**
L 2×L
8−0
.84
**−0
.34
−1.3
8**
−0.4
5**
−0.5
2**
−0.7
5**
−11.
53**
−13.
88**
−12.
56**
−1.9
4−1
.28
−2.5
1−4
.93
**−4
.35
**−4
.86
**2.
73**
3.64
**3.
25**
L 3×L
41.
19**
−1.2
1**
0.34
−0.8
9**
−1.3
0**
−1.3
1**
−15.
53**
−15.
19**
−12.
24**
3.66
3.71
−1.8
8−4
.06
**−3
.97
**−2
.44
**3.
44**
5.64
**6.
31**
L 3×L
5−1
.62
**−0
.65
*−1
.04
**0.
61**
0.77
**0.
62**
5.89
3.14
0.11
−3.6
21.
51−0
.31
1.89
**1.
74**
1.24
*−3
.44
**−2
.37
**−3
.38
**
L 3×L
6−0
.27
−1.0
5**
1.82
**−0
.87
**−0
.97
**−0
.77
**5.
30−4
.02
0.10
−11.
04**
−10.
35**
−7.7
8**
−5.8
2**
−3.9
4**
−3.8
1**
−1.6
5**
−3.6
4**
−1.9
2**
L 3×L
71.
41**
1.89
**−0
.01
0.93
**0.
90**
0.59
**−1
8.37
**−1
2.94
**−1
3.61
**−0
.76
−5.9
3**
−7.9
5**
4.18
**3.
53**
2.14
**2.
44**
2.35
**0.
92
L 3×L
8−1
.43
**−0
.80
**−1
.74
**−0
.37
**−0
.36
**−0
.22
−2.3
6−5
.59
−3.0
1−1
.55
−3.3
47.
25**
−0.2
0−1
.18
*−0
.67
−0.4
2−1
.89
**−1
.81
**
L 4×L
5−1
.10
**−0
.06
−0.1
7−0
.47
**−0
.36
**−0
.40
**−1
.56
4.05
9.83
**−1
.54
−3.1
70.
54−3
.82
**−4
.42
**−3
.97
**0.
05−0
.77
−1.0
0*
L 4×L
6−0
.16
1.74
**0.
64*
0.02
0.33
*0.
2116
.55
**24
.75
**13
.42
**−7
.77
**−5
.22
*−2
.11
6.61
**7.
69**
6.35
**−2
.34
**−0
.54
−1.1
5*
L 4×L
7−0
.67
*−0
.82
**−0
.88
**0.
34**
0.01
0.25
14.4
8**
7.99
*8.
97**
−1.9
3−0
.52
0.89
−2.6
3**
−3.2
4**
−3.6
7**
−0.2
4−0
.28
−0.5
9
L 4×L
81.
44**
1.79
**2.
39**
0.23
−0.0
6−0
.04
1.69
−4.5
8−6
.59
*0.
034.
061.
813.
88**
5.28
**6.
25**
1.66
**0.
010.
92
L 5×L
60.
490.
05−1
.49
**0.
030.
020.
11−5
.53
−7.5
7*
−11.
28**
−1.5
5−0
.52
0.62
0.31
0.40
−0.2
72.
56**
2.02
**2.
80**
L 5×L
7−0
.03
1.39
**0.
68*
−0.2
7*
−0.2
1−0
.12
−4.3
2−5
.58
−16.
94**
1.50
−0.8
3−5
.39
*3.
57**
3.94
**5.
21**
0.09
−0.9
9*
−0.4
7
L 5×L
8−0
.67
*−0
.95
**0.
70*
0.58
**0.
36**
0.72
**6.
66*
10.2
4**
4.57
−0.5
1−3
.83
−4.5
6*
3.53
**3.
46**
3.10
**1.
26**
0.07
−0.3
3
L 6×L
70.
0−1
.91
**−0
.01
0.54
**0.
55**
0.34
**−9
.99
**−7
.05
*20
.23
**21
.93
**20
.87
**22
.87
**1.
75**
1.39
*0.
630.
531.
64**
−0.7
8
L 6×L
81.
67**
1.90
**−0
.29
0.37
**0.
34**
0.19
14.5
2**
17.4
0**
10.6
5**
15.1
7**
15.8
0**
10.6
0**
1.07
−0.2
20.
02−1
.15
*1.
20*
−0.4
5
L 7×L
8−0
.15
−0.9
1**
−0.6
6*
−0.6
9**
0.18
0.36
**1.
263.
388.
90**
4.33
2.52
3.85
−6.5
7**
−5.5
6**
−5.4
0**
−4.7
0**
−5.1
1**
−3.0
4**
LSD
0.05
0.61
0.25
6.23
4.42
1.12
0.95
LSD
0.01
0.80
0.33
8.19
5.81
1.47
1.24
30
Plants 2020, 9, 1140
Ta
ble
4.
Con
t.
Cro
ssE
DN
RP
EN
KP
RT
KW
GY
PP
GY
PH
D1
D2
D3
D1
D2
D3
D1
D2
D3
D1
D2
D3
D1
D2
D3
D1
D2
D3
L 1×L
2−0
.13
−0.1
7−0
.14
−0.0
5−0
.16
−0.3
1−0
.74
−0.4
7−1
.83
**13
.26
**6.
923.
060.
63−1
.34
−2.0
50.
04−0
.10
−0.1
6
L 1×L
30.
210.
17−0
.19
−0.6
9**
−0.8
8**
−1.1
2**
−1.3
4*
0.43
1.38
*3.
932.
00−6
.11
16.4
2**
10.9
9**
10.0
6**
0.98
**0.
78**
0.82
**
L 1×L
40.
32*
0.19
0.42
**0.
200.
76**
0.50
*0.
960.
970.
0327
.43
**21
.67
**24
.48
**−2
4.25
**−2
2.70
**−1
8.21
**−1
.44
**−1
.62
**−1
.51
**
L 1×L
5−0
.34
**−0
.07
0.11
0.42
*0.
69**
0.73
**−3
.04
**−2
.34
**−1
.39
**−3
3.40
**−2
4.50
**−1
6.11
**2.
8110
.32
**12
.43
**0.
170.
74**
1.04
**
L 1×L
60.
030.
160.
12−0
.18
−0.3
6−0
.30
2.61
**2.
77**
2.93
**25
.26
**25
.00
**22
.06
**33
.52
**28
.56
**22
.11
**1.
99**
2.04
**1.
85**
L 1×L
7−0
.45
**−0
.13
−0.2
6*
0.25
0.29
0.15
−0.6
3−2
.06
**−1
.10
*−9
.90
*−1
0.50
*−6
.94
−18.
98**
−21.
89**
−18.
42**
−1.1
3**
−1.5
6**
−1.5
5**
L 1×L
80.
35**
−0.1
4−0
.06
0.05
−0.3
30.
352.
19**
0.70
−0.0
3−2
6.57
**−2
0.58
**−2
0.44
**−1
0.14
**−3
.94
−5.9
2*
−0.6
0**
−0.2
8−0
.49
**
L 2×L
3−0
.05
0.08
−0.3
1*0.
74**
0.82
**1.
05**
2.53
**0.
28−2
.66
**−1
2.24
**−7
.42
1.14
−15.
69**
−15.
14**
−6.3
2**
−0.9
3**
−1.0
8**
−0.5
4**
L 2×L
4−0
.51
**−0
.46
**−0
.59
**−1
.02
**−0
.04
0.02
−2.0
7**
−1.5
6**
−0.0
2−1
2.74
**−9
.75
*−1
4.77
**−4
.15
2.88
8.81
**−0
.25
0.21
0.74
**
L 2×L
50.
42**
0.29
*0.
57**
0.79
**0.
390.
180.
001.
13*
1.03
18.4
3**
22.5
8**
14.6
4**
25.9
6**
23.9
9**
18.5
5**
1.54
**1.
71**
1.55
**
L 2×L
6−0
.05
−0.0
80.
01−0
.73
**−0
.96
**−1
.18
**−4
.42
**−3
.73
**−1
.99
**−1
8.90
**−1
4.42
**−6
.69
−33.
57**
−30.
75**
−29.
77**
−2.0
0**
−2.2
0**
−2.4
7**
L 2×L
70.
36**
0.43
**0.
63**
0.33
−0.3
1−0
.30
1.45
**0.
441.
60**
−25.
07**
−25.
92**
−23.
69**
−21.
99**
−25.
20**
−24.
60**
−1.3
1**
−1.8
0**
−2.0
7**
L 2×L
8−0
.04
−0.0
8−0
.17
−0.0
50.
270.
54*
3.26
**3.
90**
3.88
**37
.26
**28
.00
**26
.31
**48
.82
**45
.56
**35
.39
**2.
90**
3.25
**2.
95**
L 3×L
4−0
.18
−0.0
60.
16−0
.41
−0.7
6**
−0.4
7*
0.62
−0.3
41.
78**
10.9
3**
7.33
−17.
94**
21.4
1**
20.9
9**
9.83
**1.
27**
1.50
**0.
80**
L 3×L
5−0
.05
0.08
0.12
−0.4
9*
−0.1
20.
192.
83**
2.38
**0.
6027
.10
**15
.17
**22
.98
**−1
5.18
**−1
7.28
**−1
4.84
**−0
.90
**−1
.23
**−1
.25
**
L 3×L
6−0
.12
−0.0
90.
36**
1.07
**0.
72**
0.93
**−0
.33
−0.9
1−1
.05
−2.2
44.
675.
1416
.68
**10
.35
**14
.54
**0.
99**
0.74
**1.
20**
L 3×L
7−0
.01
−0.1
8−0
.12
−0.3
6−0
.03
0.11
−2.8
6**
−0.3
5−0
.18
−11.
40**
−10.
83**
−0.8
6−1
7.02
**1.
01−6
.99
**−1
.01
**0.
07−0
.48
**
L 3×L
80.
190.
01−0
.02
0.14
0.25
−0.6
9**
−1.4
4**
−1.4
9**
0.12
−16.
07**
−10.
92**
−4.3
6−6
.61
**−1
0.93
**−6
.29
**−0
.39
*−0
.78
**−0
.54
**
L 4×L
50.
190.
14−0
.06
−0.0
40.
380.
06−0
.57
−0.6
61.
09*
22.6
0**
29.8
3**
38.5
6**
31.5
4**
18.2
3**
14.7
9**
1.88
**1.
30**
1.24
**
L 4×L
60.
220.
180.
080.
210.
46*
0.11
0.67
0.15
−2.0
1**
3.26
2.33
8.73
*−9
.18
**−6
.02
**−5
.72
*−0
.55
**−0
.43
*−0
.47
**
L 4×L
7−0
.07
−0.1
6−0
.11
0.78
**0.
210.
291.
84**
1.72
**0.
26−2
3.90
**−2
2.17
**−1
9.27
**12
.90
**5.
74*
0.74
0.77
**0.
41*
0.05
L 4×L
80.
030.
180.
090.
28−1
.01
**−0
.52
*−1
.44
**−0
.27
−1.1
4*
−27.
57**
−29.
25**
−19.
77**
−28.
26**
−19.
12**
−10.
25**
−1.6
8**
−1.3
7**
−0.8
5**
L 5×L
6−0
.05
−0.1
8−0
.36
**−0
.38
−0.9
1**
−0.2
31.
38*
0.87
1.30
*−3
2.57
**−3
5.83
**−3
1.86
**−2
1.29
**−1
0.90
**−1
2.19
**−1
.27
**−0
.78
**−1
.01
**
L 5×L
70.
06−0
.07
−0.1
4−0
.90
**−0
.86
**−0
.91
**−1
.65
**−1
.07
*−2
.07
**−2
.74
−5.3
3−1
4.36
**−4
.05
0.14
4.58
*−0
.24
0.01
0.36
*
31
Plants 2020, 9, 1140
Ta
ble
4.
Con
t.
Cro
ssE
DN
RP
EN
KP
RT
KW
GY
PP
GY
PH
D1
D2
D3
D1
D2
D3
D1
D2
D3
D1
D2
D3
D1
D2
D3
D1
D2
D3
L 5×L
8−0
.24
−0.1
8−0
.24
0.60
**0.
43*
−0.0
21.
06*
−0.3
1−0
.57
0.60
−1.9
2−1
3.86
**−1
9.79
**−2
4.51
**−2
3.32
**−1
.18
**−1
.75
**−1
.94
**
L 6×L
70.
19−0
.04
−0.3
1*
0.46
*0.
69**
0.49
*2.
79**
2.35
**2.
28**
32.9
3**
29.1
7**
17.8
1**
23.5
1**
18.0
1**
22.6
6**
1.40
**1.
29**
1.87
**
L 6×L
8−0
.21
0.05
0.09
−0.4
5*
0.37
0.18
−2.6
9**
−1.5
0**
−1.4
7**
−7.7
4−1
0.92
**−1
5.19
**−9
.67
**−9
.25
**−1
1.64
**−0
.58
**−0
.66
**−0
.96
**
L 7×L
8−0
.09
0.16
0.31
*−0
.57
**0.
020.
16−0
.93
−1.0
3−0
.79
40.1
0**
45.5
8**
47.3
1**
25.6
4**
22.1
9**
22.0
3**
1.53
**1.
58**
1.82
**
LSD
0.05
0.26
0.42
1.06
8.15
4.57
0.34
LSD
0.01
0.34
0.55
1.39
10.7
16.
010.
45
*an
d**
sign
ifica
ntat
0.05
and
0.01
leve
lsof
prob
abili
ty,r
espe
ctiv
ely.
DT
S:d
ays
to50
%si
lkin
g,A
SI:a
nthe
sis–
silk
ing
inte
rval
,PL
HT:
plan
thei
ght,
EH
T:ea
rhe
ight
,LA
NG
:lea
fang
le,
CH
LC:c
hlor
ophy
llco
nten
t,ED
:ear
diam
eter
,NR
PE:n
umbe
rof
row
spe
rea
r,N
KPR
:num
ber
ofke
rnel
spe
rro
w,T
KW
:tho
usan
dke
rnel
wei
ght,
GY
PP:g
rain
yiel
dpe
rpl
anta
ndG
YPH
:gr
ain
yiel
dpe
rhe
ctar
e.
32
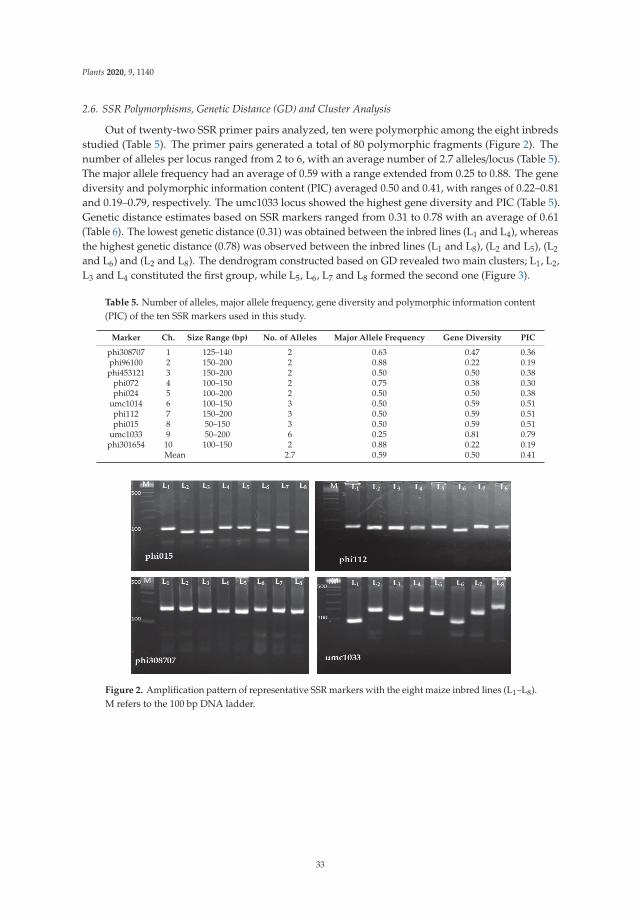
Plants 2020, 9, 1140
2.6. SSR Polymorphisms, Genetic Distance (GD) and Cluster Analysis
Out of twenty-two SSR primer pairs analyzed, ten were polymorphic among the eight inbredsstudied (Table 5). The primer pairs generated a total of 80 polymorphic fragments (Figure 2). Thenumber of alleles per locus ranged from 2 to 6, with an average number of 2.7 alleles/locus (Table 5).The major allele frequency had an average of 0.59 with a range extended from 0.25 to 0.88. The genediversity and polymorphic information content (PIC) averaged 0.50 and 0.41, with ranges of 0.22–0.81and 0.19–0.79, respectively. The umc1033 locus showed the highest gene diversity and PIC (Table 5).Genetic distance estimates based on SSR markers ranged from 0.31 to 0.78 with an average of 0.61(Table 6). The lowest genetic distance (0.31) was obtained between the inbred lines (L1 and L4), whereasthe highest genetic distance (0.78) was observed between the inbred lines (L1 and L8), (L2 and L5), (L2
and L6) and (L2 and L8). The dendrogram constructed based on GD revealed two main clusters; L1, L2,L3 and L4 constituted the first group, while L5, L6, L7 and L8 formed the second one (Figure 3).
Table 5. Number of alleles, major allele frequency, gene diversity and polymorphic information content(PIC) of the ten SSR markers used in this study.
Marker Ch. Size Range (bp) No. of Alleles Major Allele Frequency Gene Diversity PIC
phi308707 1 125–140 2 0.63 0.47 0.36phi96100 2 150–200 2 0.88 0.22 0.19
phi453121 3 150–200 2 0.50 0.50 0.38phi072 4 100–150 2 0.75 0.38 0.30phi024 5 100–200 2 0.50 0.50 0.38
umc1014 6 100–150 3 0.50 0.59 0.51phi112 7 150–200 3 0.50 0.59 0.51phi015 8 50–150 3 0.50 0.59 0.51
umc1033 9 50–200 6 0.25 0.81 0.79phi301654 10 100–150 2 0.88 0.22 0.19
Mean 2.7 0.59 0.50 0.41
Figure 2. Amplification pattern of representative SSR markers with the eight maize inbred lines (L1–L8).M refers to the 100 bp DNA ladder.
33
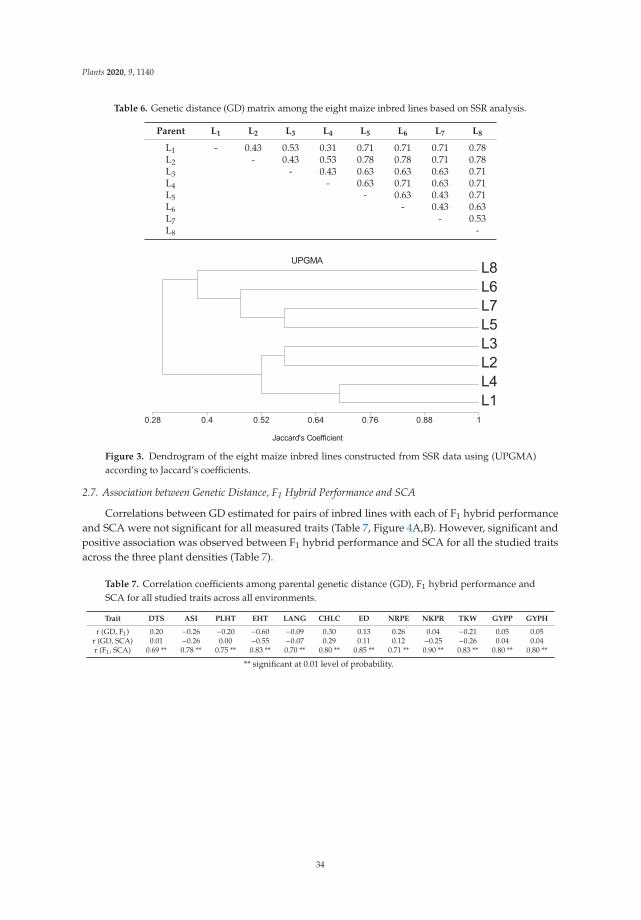
Plants 2020, 9, 1140
Table 6. Genetic distance (GD) matrix among the eight maize inbred lines based on SSR analysis.
Parent L1 L2 L3 L4 L5 L6 L7 L8
L1 - 0.43 0.53 0.31 0.71 0.71 0.71 0.78L2 - 0.43 0.53 0.78 0.78 0.71 0.78L3 - 0.43 0.63 0.63 0.63 0.71L4 - 0.63 0.71 0.63 0.71L5 - 0.63 0.43 0.71L6 - 0.43 0.63L7 - 0.53L8 -
Figure 3. Dendrogram of the eight maize inbred lines constructed from SSR data using (UPGMA)according to Jaccard’s coefficients.
2.7. Association between Genetic Distance, F1 Hybrid Performance and SCA
Correlations between GD estimated for pairs of inbred lines with each of F1 hybrid performanceand SCA were not significant for all measured traits (Table 7, Figure 4A,B). However, significant andpositive association was observed between F1 hybrid performance and SCA for all the studied traitsacross the three plant densities (Table 7).
Table 7. Correlation coefficients among parental genetic distance (GD), F1 hybrid performance andSCA for all studied traits across all environments.
Trait DTS ASI PLHT EHT LANG CHLC ED NRPE NKPR TKW GYPP GYPH
r (GD, F1) 0.20 −0.26 −0.20 −0.60 −0.09 0.30 0.13 0.26 0.04 −0.21 0.05 0.05r (GD, SCA) 0.01 −0.26 0.00 −0.55 −0.07 0.29 0.11 0.12 −0.25 −0.26 0.04 0.04r (F1, SCA) 0.69 ** 0.78 ** 0.75 ** 0.83 ** 0.70 ** 0.80 ** 0.85 ** 0.71 ** 0.90 ** 0.83 ** 0.80 ** 0.80 **
** significant at 0.01 level of probability.
34
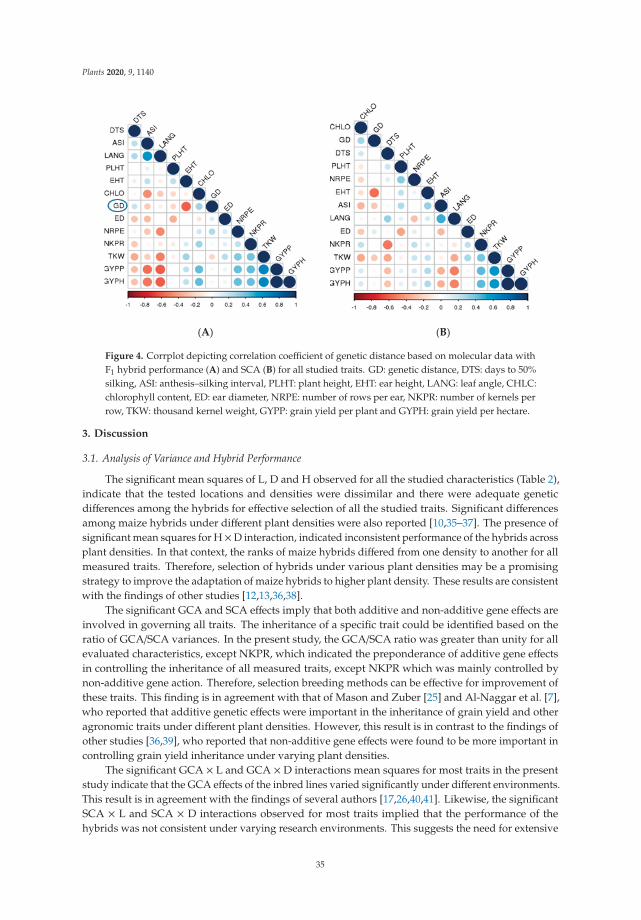
Plants 2020, 9, 1140
(A) (B)
Figure 4. Corrplot depicting correlation coefficient of genetic distance based on molecular data withF1 hybrid performance (A) and SCA (B) for all studied traits. GD: genetic distance, DTS: days to 50%silking, ASI: anthesis–silking interval, PLHT: plant height, EHT: ear height, LANG: leaf angle, CHLC:chlorophyll content, ED: ear diameter, NRPE: number of rows per ear, NKPR: number of kernels perrow, TKW: thousand kernel weight, GYPP: grain yield per plant and GYPH: grain yield per hectare.
3. Discussion
3.1. Analysis of Variance and Hybrid Performance
The significant mean squares of L, D and H observed for all the studied characteristics (Table 2),indicate that the tested locations and densities were dissimilar and there were adequate geneticdifferences among the hybrids for effective selection of all the studied traits. Significant differencesamong maize hybrids under different plant densities were also reported [10,35–37]. The presence ofsignificant mean squares for H×D interaction, indicated inconsistent performance of the hybrids acrossplant densities. In that context, the ranks of maize hybrids differed from one density to another for allmeasured traits. Therefore, selection of hybrids under various plant densities may be a promisingstrategy to improve the adaptation of maize hybrids to higher plant density. These results are consistentwith the findings of other studies [12,13,36,38].
The significant GCA and SCA effects imply that both additive and non-additive gene effects areinvolved in governing all traits. The inheritance of a specific trait could be identified based on theratio of GCA/SCA variances. In the present study, the GCA/SCA ratio was greater than unity for allevaluated characteristics, except NKPR, which indicated the preponderance of additive gene effectsin controlling the inheritance of all measured traits, except NKPR which was mainly controlled bynon-additive gene action. Therefore, selection breeding methods can be effective for improvement ofthese traits. This finding is in agreement with that of Mason and Zuber [25] and Al-Naggar et al. [7],who reported that additive genetic effects were important in the inheritance of grain yield and otheragronomic traits under different plant densities. However, this result is in contrast to the findings ofother studies [36,39], who reported that non-additive gene effects were found to be more important incontrolling grain yield inheritance under varying plant densities.
The significant GCA × L and GCA × D interactions mean squares for most traits in the presentstudy indicate that the GCA effects of the inbred lines varied significantly under different environments.This result is in agreement with the findings of several authors [17,26,40,41]. Likewise, the significantSCA × L and SCA × D interactions observed for most traits implied that the performance of thehybrids was not consistent under varying research environments. This suggests the need for extensive
35
Plants 2020, 9, 1140
evaluation of the hybrids in multiple environments in order to identify high yielding and most stablehybrids tolerant to high plant densities [39].
The highest GYPP of all evaluated hybrids in this study was observed under low density (D1),where competition between plants is minimum [12]. As planting density increases, resources to eachplant (water, nutrients and light interception) decrease, increasing plant–plant competition and inturn reducing the assimilated supply to developing cobs and, consequently, resulting in a reduction ingrain yield per plant [42–44]. The observed reduction in GYPP due to elevating plant density from D1to D2 and D3 in this study could be a result of the reduction in all yield attributesED, NRPE, NKPRand TKW. These results are consistent with Tang et al. [45], who stated that increasing plant density inmaize leads to a reduction in ear diameter, grains per ear, thousand kernels weight and finally singleplant yield. Hashemi et al. [46] also demonstrated that grain yield per plant and all yield componentslinearly decreased with increasing plant density. Moreover, increasing plant density also reducedLANG and CHLC. The decrease in the leaf angle and chlorophyll content in response to high plantdensity has also been reported previously in maize [13,47,48].
On the other hand, high plant density (D3) caused significant increases in DTS, ASI, PLHT,EHT and GYPH compared with the low density (D1). Delayed silking and increased ASI period, assymptoms of intense interplant competition for growth resources, can be associated with significantyield reductions [15,49]. Increasing plant density initiated greater stress during pollination that canlead to increasing kernel abortions and decreasing grain fill [8,11]. These two traits (early DTS andshort ASI) could be effective indicators for selecting high density tolerance hybrids [50]. The increasedvalues of PLHT and EHT might be related to the stress imposed on maize plants due to competitionfor light resulting from elevated plant density which potentially increase stem elongation [51,52]. Theincrease in GYPH with increasing plant density is largely attributed to the higher number of plantsper unit area. This suggested that the increase in GYPH due to increased plant density may offset thereduction in GYPP due to competition between plants. These results are in accordance with the resultsreported in other studies [10,12,53,54].
The two hybrids L2 × L5 and L2 × L8 had the highest GYPP and GYPH under three plant densities,and could be considered the most highly responsive and tolerant to high plant density. Interestingly,the hybrid L2 × L8 significantly outyielded the check hybrid SC128 under all densities; moreover, ithad outstanding features, such as short ASI, short plant and ear position, erect leaf under high plantdensity. Therefore, this hybrid should be tested extensively in multilocation trials and promoted foradoption to high plant density tolerance. Similar to our results, Al-Naggar et al. [12] reported that theselection of hybrids with high grain yield, better plant and ear heights, short ASI, and erect leaf underhigh plant density stress is important for the development of tolerant hybrids to high plant densities.
3.2. GCA and SCA Estimates
Combining ability analysis helps in the identification of parents with good GCA effects andhybrids with good SCA effects [23]. Selection of parents giving good-performing hybrids is one ofthe challenges facing breeders. Parents with desirable GCA effect for the target traits can be usedto accumulate favorable alleles by recombination and selection [55]. In the current study, high GCAvalues for the evaluated traits were scattered among the eight inbred lines and changed across plantdensities, demonstrating the effects of plant densities on GCA values. Moreover, none of the inbredlines exhibited significant GCA effects for all the measured traits under any of the testing densities.Similar results were reported by other researchers [56,57]. The significant and negative GCA effectswere displayed by the inbreds L1 and L3 for DTS and L1, L2 and L5 for ASI across the three plantdensities, indicating that, these inbreds could be good combiners and possessed favorable allelestowards earliness. Likewise, inbred lines L5 and L8 were the best general combiners for reduced plantand ear heights which are important for lodging tolerance especially under high plant density. Theinbred line L2 had the highest positive GCA values for CHLC, NRPE, NKPR and TKW suggesting thatthis line could be good combiner for improving these traits. Moreover, the best general combiners for
36
Plants 2020, 9, 1140
GYPP and GYPH were L1, L2, and L5 under the three plant densities and L8 under D3. These inbredscould transfer desirable alleles for improved grain yield to their progenies to develop hybrids tolerantto high plant density. The superiority of these inbreds in GCA effects for grain yield was associatedwith their superiority in GCA effects for some other traits. Interestingly, the inbred line L1, whichhad desirable GCA effects for GYPP and GYPH, was also found to be good a general combiner forearliness, short ASI, short PLHT, reduced LANG and increased TKW. Previous findings proved thatpositive GCA effects for grain yield and negative GCA effects for DTS, PLHT, and LANG traits are agood indicator of high plant density tolerance [13]. Thus, the inbred line L1 has potential to be used toimprove maize grain yield under high plant density.
Estimates of SCA effects provide important information about the non-additive gene effects(dominance and epistatic interaction), which can also be related to hybrid vigor, assisting in theselection of the best hybrid combinations [58]. The highly positive and significant SCA effects forgrain yield and its components indicated that the produced hybrids were good specific combiners fordeveloping high-yielding hybrids [1]. In the present study, the most promising specific combinersfor grain yield (GYPP or GYPH) and some of its components were L1 × L3, L1 × L6, L2 × L5, L2 × L8,L4 × L5 and L7 × L8 under the three plant densities. These hybrids involved at least one high GCAparent, which could be exploited by conventional breeding procedures. This finding is in line with theresult reported in other studies [56,59]. In their studies, high SCA was observed in cross combinationsinvolving one line with high GCA and another with low GCA effects.
Two hybrids, L2 × L5 and L2 × L8, had desirable significant positive SCA coupled with high meangrain yield under the three plant densities, revealing good correspondence between mean grain yieldand SCA effects [1]. Regardless of their significant SCA effects, three crosses L3 × L4, L3 × L6 and L6
× L7, constituted from parents with low × low GCA effects for GYPP and GYPH were not favorabledue to insufficient additive variance. This indicates that both GCA and SCA should be taken intoconsideration in the selection of elite parents for the development of heterotic hybrids [18]. It is notablethat none of the hybrids exhibited significant SCA effects for all the traits. However, the hybrids L2
× L5, L2 × L8 and L4 × L5 were found to be good specific combiners for more than one trait, such asASI, LANG, TKW, GYPP and GYPH. Accordingly, these hybrids would be useful to increase maizegrain yield under high plant density for their complementary characteristics, including, short ASI,erect leaf and high grain yield under high plant density. In concordance with the findings reportedhere, desirable significant SCA under high plant density for ASI, LANG and grain yield has previouslybeen reported by Al-Naggar et al. [13].
3.3. SSR Polymorphisms, Genetic Distance (GD) and Cluster Analysis
The mean number of alleles (2.7) per locus obtained in this study was close to the values reportedby other researchers [26,27,34], who detected averages of 2.9, 2.57 and 3.0 alleles per locus, respectively.However, it was lower than the 6.21 alleles/locus reported by Oppong et al. [60] or the 5.7 alleles/locusfound by Oyekunle et al. [61] in maize inbred lines using SSR markers. The differences in the means ofalleles among different studies could be attributed to the differences in sample size, repeat length andnumber of the SSR markers involved in the studies [27]. The lower values observed in this study couldarise from the small number of lines used for genotyping.
The PIC demonstrates the informativeness of the SSR loci and their potential to detect differencesamong the inbred lines based on their genetic relationships [62]. Informative markers can be categorizedas highly informative (PIC > 0.5), reasonably informative (0.5 < PIC < 0.25) and slightly informative(PIC < 0.25), as reported by Botstein et al. [63]. Accordingly, four markersumc1014, phi112, phi015 andumc1033 with high PIC values, and hence high discriminatory power, were identified. The averagegene diversity (0.50) detected among the tested inbred lines in this study indicated high levels ofpolymorphisms within the inbred lines. This result is in close agreement with the findings reportedin other studies [30,64]. The frequency of the most common (major) alleles had an average of 0.59,suggesting that 59.0% of the studied inbreds shared a common major allele at any of the tested loci.
37
Plants 2020, 9, 1140
Assessing the genetic diversity is essential for enhancing the yield and conservation strategies ofmain crops [65–70], such as maize that has high an economic importance [71]. The average geneticdiversity existing among all the inbred lines was relatively high (0.61). This indicated that there wasconsiderable genetic diversity among the inbreds based on the microsatellite markers analysis [72].The largest GD in this study was between the Egyptian (local) and CIMMYT (exotic) inbred lines.The relatively large genetic distance between local and exotic lines, suggesting the opportunity touse these lines for the development of high-yielding and stress-tolerant hybrids. Indeed, the twohigh-yielding hybrids (L2 × L5 and L2 × L8) under the three plant densities consisted of local × exoticline combinations. This indicates that novel and complementary alleles existing in the germplasmfrom the two countries can be exploited for superior maize hybrid development and populationimprovement [73]. Moreover, it implies the potential benefits of exchanging germplasm betweenbreeding programs for the development of high yielding and density tolerant hybrids.
The dendrogram constructed using the UPGMA clustering grouped the inbred lines into twomain clusters, which generally agreed with their origin. One cluster was composed of CIMMYTinbred lines, while the other consisted of local inbreds. This result is consistent with the findings ofMageto et al. [17], who reported that clustering based on GD grouped maize inbred lines according totheir origin. Similarly, [34,64] revealed the effectiveness of SSR markers for classifying maize inbredsaccording to their origin in their studies.
3.4. Association between Genetic Distance, F1 Hybrid Performance and SCA
Our results showed that GD of the parental inbreds was not significantly correlated with the meanof F1 hybrids for any of the evaluated traits across the tested environments. This implied that theSSR-based GD could not be used to predict the performance of F1 hybrids in this study. This resultis consistent with those reported by [26,33,34,40]. Bernardo [74] attributed this poor correlation tothe lack of linkage between genes controlling the trait and markers used to estimate GD, inadequategenome coverage and different levels of dominance among hybrids. Contrary to the current finding, asignificant correlation was reported between molecular GD and F1 hybrid performance [32,75]. Therewas no significant correlation between GD and SCA for all the traits, suggesting that SSR-based GDmight not be effective in predicting SCA effects in the studied materials. Similarly, non-significantassociation between genetic distances and SCA was reported by [40,76]. However, Betran et al. [75]reported a significant correlation between GD and SCA for maize grain yield. Furthermore, our resultsshowed that SCA effects were significantly correlated with F1 hybrid performance for all the traits. Thisindicated that SCA could be used to predict the performance of F1 hybrids. This result is in agreementwith the findings of [17,26].
4. Conclusions
This study revealed a considerable variability among F1 hybrids for all traits under different plantdensities. Additive and non-additive gene effects are involved in the genetic control of all traits, with apredominance of the additive gene action for most traits. Selection of potential hybrids for densitytolerance breeding programs should be based on both GCA and SCA effects. The inbred lines L1 andL3 were identified as excellent combiners for earliness, L5 and L8 for reduced plant and ear heights andL1, L2, and L5 for increased grain yield under varying plant densities. The best hybrids L2 × L5 and L2
× L8 for grain yield and other multiple traits were identified for further evaluation. The estimated GDbased on SSR markers in this study could not be used to predict the hybrids performance and SCAeffects. Nevertheless, SCA could be used to predict the hybrids performance across all plant densities.Although SSR determined that GD was not useful in predicting hybrid performance and SCA effects, itwas effective in classifying the inbred lines according to their origin, signifying the efficiency of SSRmarker for diversity and clustering analyses. The findings of the present study might have importantimplications for breeding programs designed to improve density tolerance in maize.
38
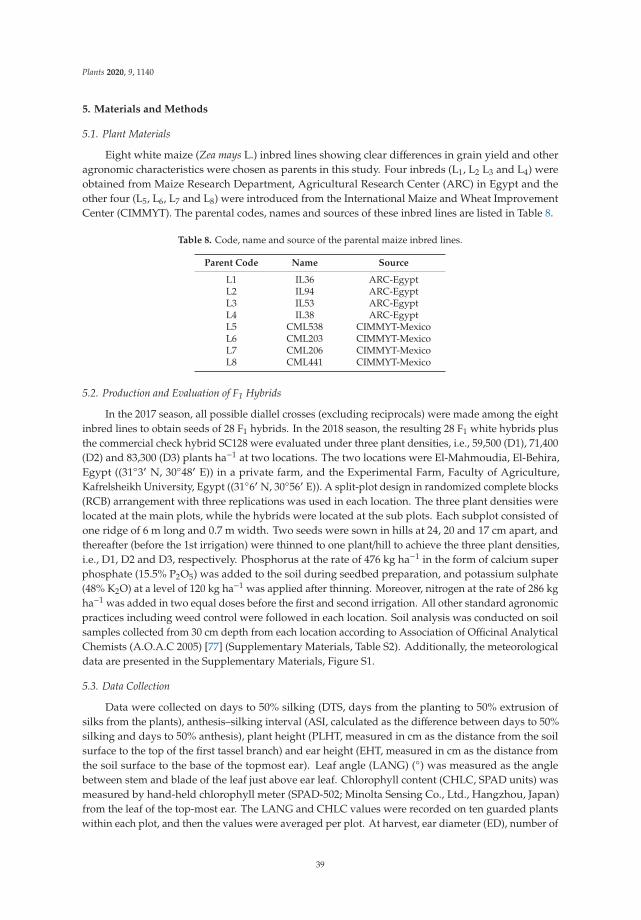
Plants 2020, 9, 1140
5. Materials and Methods
5.1. Plant Materials
Eight white maize (Zea mays L.) inbred lines showing clear differences in grain yield and otheragronomic characteristics were chosen as parents in this study. Four inbreds (L1, L2 L3 and L4) wereobtained from Maize Research Department, Agricultural Research Center (ARC) in Egypt and theother four (L5, L6, L7 and L8) were introduced from the International Maize and Wheat ImprovementCenter (CIMMYT). The parental codes, names and sources of these inbred lines are listed in Table 8.
Table 8. Code, name and source of the parental maize inbred lines.
Parent Code Name Source
L1 IL36 ARC-EgyptL2 IL94 ARC-EgyptL3 IL53 ARC-EgyptL4 IL38 ARC-EgyptL5 CML538 CIMMYT-MexicoL6 CML203 CIMMYT-MexicoL7 CML206 CIMMYT-MexicoL8 CML441 CIMMYT-Mexico
5.2. Production and Evaluation of F1 Hybrids
In the 2017 season, all possible diallel crosses (excluding reciprocals) were made among the eightinbred lines to obtain seeds of 28 F1 hybrids. In the 2018 season, the resulting 28 F1 white hybrids plusthe commercial check hybrid SC128 were evaluated under three plant densities, i.e., 59,500 (D1), 71,400(D2) and 83,300 (D3) plants ha−1 at two locations. The two locations were El-Mahmoudia, El-Behira,Egypt ((31◦3′ N, 30◦48′ E)) in a private farm, and the Experimental Farm, Faculty of Agriculture,Kafrelsheikh University, Egypt ((31◦6′ N, 30◦56′ E)). A split-plot design in randomized complete blocks(RCB) arrangement with three replications was used in each location. The three plant densities werelocated at the main plots, while the hybrids were located at the sub plots. Each subplot consisted ofone ridge of 6 m long and 0.7 m width. Two seeds were sown in hills at 24, 20 and 17 cm apart, andthereafter (before the 1st irrigation) were thinned to one plant/hill to achieve the three plant densities,i.e., D1, D2 and D3, respectively. Phosphorus at the rate of 476 kg ha−1 in the form of calcium superphosphate (15.5% P2O5) was added to the soil during seedbed preparation, and potassium sulphate(48% K2O) at a level of 120 kg ha−1 was applied after thinning. Moreover, nitrogen at the rate of 286 kgha−1 was added in two equal doses before the first and second irrigation. All other standard agronomicpractices including weed control were followed in each location. Soil analysis was conducted on soilsamples collected from 30 cm depth from each location according to Association of Officinal AnalyticalChemists (A.O.A.C 2005) [77] (Supplementary Materials, Table S2). Additionally, the meteorologicaldata are presented in the Supplementary Materials, Figure S1.
5.3. Data Collection
Data were collected on days to 50% silking (DTS, days from the planting to 50% extrusion ofsilks from the plants), anthesis–silking interval (ASI, calculated as the difference between days to 50%silking and days to 50% anthesis), plant height (PLHT, measured in cm as the distance from the soilsurface to the top of the first tassel branch) and ear height (EHT, measured in cm as the distance fromthe soil surface to the base of the topmost ear). Leaf angle (LANG) (◦) was measured as the anglebetween stem and blade of the leaf just above ear leaf. Chlorophyll content (CHLC, SPAD units) wasmeasured by hand-held chlorophyll meter (SPAD-502; Minolta Sensing Co., Ltd., Hangzhou, Japan)from the leaf of the top-most ear. The LANG and CHLC values were recorded on ten guarded plantswithin each plot, and then the values were averaged per plot. At harvest, ear diameter (ED), number of
39
Plants 2020, 9, 1140
rows per ear (NKPR), number of kernels per row (NKPR), thousand kernel weight (TKW), grain yieldper plant (GYPP, in g plant−1) and grain yield per hectare (GYPH, in ton ha−1) were estimated. Plotswere hand-harvested, and the weight of the shelled grain (adjusted to 15.5% grain moisture content)was used to calculate GYPP and GYPH. Grain moisture at harvest was measured using a hand-heldmoisture meter.
5.4. Molecular Analysis
5.4.1. DNA Isolation
Leaves were sampled from 10 to 15 seedlings of each inbred line after twenty days from planting.Genomic DNA was isolated using CTAB method [78]. DNA quantity as well as quality was assessedusing NanoDrop spectrophotometer (ND-1000, USA).
5.4.2. SSR Primers and PCR Amplification
Twenty-two SSR markers were randomly selected from the MaizeGDB database (www.maizegdb.org). The 22 primer pairs were tested to identify the polymorphic ones. Only ten markers were foundto be polymorphic and they used for the SSR analysis (Supplementary Materials, Table S3). PCR wasperformed in a volume of 10 μL reaction mixture containing 1 μL of 20 ng/μL genomic DNA template,1 unit Taq DNA polymerase (Promega, Madison, WI, USA), 2 mM MgCl2, 0.2 mM dNTPs and 0.5μM of reverse and forward primer. The PCR reaction was initially started by denaturation at 94 ◦Cfor 2 min, followed by 35 cycles consisting of denaturation at 94 ◦C for 30 sec, 30 sec of annealing at55 ◦C, 30 sec of extension at 72 ◦C and a final extension of 3 min at 72 ◦C. Amplified products wereelectrophoresed on 1.5% agarose gel. The gels were stained with ethidium bromide and then distainedwith tap water and photographed using gel documentation system (UVITEC, Cambridge, UK).
5.5. Statistical Analysis
Analysis of variance (ANOVA) was computed for all data using SAS software (SAS Institute Inc,2008). Combined analysis of variance of the split-plot design across the two locations was performed ifthe homogeneity test was non-significant. Least significant difference (LSD) values were calculated totest the significance of differences between means according to Steel et al. [79]. General combiningability (GCA) effects of the parents and specific combining ability (SCA) effects of the hybrids aswell as their mean squares were computed according to Griffing’s method 4 model I [80], using theDIALLEL-SAS program [81]. The testing of significance of GCA and SCA effects was done at 5% and1% probability. Pearson’s coefficients of correlation (r) were calculated and plotted using the packagecorrplot [82]. Based on the mean of each trait the reduction or increase due to increased plant densitywas calculated as follow:
Change% = 100(D2 or D3 − D1)/D1
5.6. SSR Data Analysis
The amplified bands were scored for each SSR marker based on the presence or absence of bands,generating a binary data matrix of (1) and (0) for each marker. The number of alleles per locus, majorallele frequency, gene diversity and polymorphic information content (PIC) were calculated to assessallele diversity of each marker. The value of polymorphic information content (PIC) of each SSR markerwas determined as described by Botstein et al. [63] as follows:
1−n∑
i=1
P2j −
n−1∑
i=1
n∑
j=i+1
2P2i P2
j
where Pi and Pj are the frequencies of the ith and jth allele of a given marker, respectively.
40
Plants 2020, 9, 1140
Genetic distances between pairs of inbred lines were calculated according to [83], using thePAST program. The dendrogram tree was generated with the unweighted pair group method usingarithmetic averages (UPGMA) by the computational package MVSP version 3.1.
Supplementary Materials: The following are available online at http://www.mdpi.com/2223-7747/9/9/1140/s1.Table S1: Mean performance of the 28 F1 crosses and the check hybrid SC128 for all the studied traits under thethree plant densities across the two locations. Table S2: Physical and chemical soil properties for the two locationsduring 2018 season. Table S3: List of SSR primers and their sequences used in the present study. Figure S1: Dailymaximum temperature (T max), minimum temperature (T min) and solar radiation (SRAD) for the two locationsduring 2018 season.
Author Contributions: M.M.K., M.R., K.M.I., A.S.A., M.M.E., A.M.S.K., M.A.E.-E., and E.M.H. designed the study,performed the experiments, analyzed the data and wrote the manuscript. All authors have read and agreed to thepublished version of the manuscript.
Funding: This research received no external funding.
Acknowledgments: Faculty of agriculture, Kafrelsheikh University, Egypt, is thankfully acknowledged forcarrying out this work. Tanta University in Egypt is also thankfully acknowledged for the support provided forconducting this work. The Agricultural Research Center (ARC) in Egypt and the International Maize and WheatImprovement Center (CIMMYT), are thankfully acknowledged for providing us the seeds of the inbred lines usedin this study.
Conflicts of Interest: The authors declare no conflict of interest.
References
1. Elmyhun, M.; Liyew, C.; Shita, A.; Andualem, M. Combining ability performance and heterotic grouping ofmaize (Zea mays) inbred lines in testcross formation in Western Amhara, North West Ethiopia. Cogent FoodAgric. 2020, 6, 1727625. [CrossRef]
2. FAOSTAT. Food and Agriculture Organization of the United Nations Statistics Division. Available online:http://faostat.fao.org/site/567/DesktopDefault.aspx (accessed on 23 February 2020).
3. Zohry, A.; Ouda, S.; Noreldin, T. Solutions for maize production consumption gap in Egypt. In Proceedingsof the 4th African Regional ICID Conference, Aswan, Egypt, 26–28 April 2016; pp. 24–28.
4. Abdelaal, H.S.A.; McFadden, D.T. Grains production prospects and long run food security in Egypt.Sustainability 2019, 11, 4457. [CrossRef]
5. Shao, H.; Shi, D.; Shi, W.; Ban, X.; Chen, Y.; Ren, W.; Chen, F.; Mi, G. Nutrient accumulation and remobilizationin relation to yield formation at high planting density in maize hybrids with different senescent characters.Arch. Agron. Soil Sci. 2020, 1–17. [CrossRef]
6. Zhao, J.R.; Wang, R.H. Factors promoting the steady increase of American maize production and theirenlightenments for China. J. Maize Sci. 2009, 17, 156–159.
7. Al-Naggar, A.; Atta, M. Elevated plant density effects on performance and genetic parameters controllingmaize (Zea mays L.) agronomic traits. J. Adv. Biol. Biotechnol. 2017, 12, 1–20. [CrossRef]
8. Andrade, F.H.; Vega, C.R.; Uhart, S.; Cirilo, A.; Cantarero, M.; Valentinuz, O. Kernel number determinationin maize. Crop. Sci. 1999, 39, 453–459. [CrossRef]
9. Edmeades, G.O.; Bolaños, J.; Elings, A.; Ribaut, J.M.; Banziger, M.; Westgate, M.E.; Westgate, M.; Boote, K.The role and regulation of the anthesis-silking interval in maize. Physiol. Model. Kernel Set Maize 2015, 29,43–73. [CrossRef]
10. Sangoi, L.; Gracietti, M.; Rampazzo, C.; Bianchetti, P. Response of Brazilian maize hybrids from different erasto changes in plant density. Field Crop. Res. 2002, 79, 39–51. [CrossRef]
11. Echarte, L.; Luque, S.L.; Andrade, F.H.; Sadras, V.; Cirilo, A.; Otegui, M.E.; Vega, C.R. Response of maizekernel number to plant density in Argentinean hybrids released between 1965 and 1993. Field Crop. Res.2000, 68, 1–8. [CrossRef]
12. Al-Naggar, A.; Shabana, R.A.; Atta, M.M.; Al-Khalil, T.H.; Al-Naggar, A.M.M. Maize response to elevatedplant density combined with lowered N-fertilizer rate is genotype-dependent. Crop. J. 2015, 3, 96–109.[CrossRef]
13. Al-Naggar, A.M.M.; Atta, M.M.; Ahmed, M.; Younis, A. Mean performance, heterobeltiosis and combiningability of corn (Zea mays L.) agronomic and yield traits under elevated plant density. J. Appl. Life Sci. Int.2016, 7, 1–20. [CrossRef] [PubMed]
41
Plants 2020, 9, 1140
14. Hammer, G.L.; Dong, Z.; McLean, G.; Doherty, A.; Messina, C.; Schussler, J.; Zinselmeier, C.; Paszkiewicz, S.;Cooper, M. Can changes in canopy and/or root system architecture explain historical maize yield trends inthe U.S. corn belt? Crop. Sci. 2009, 49, 299–312. [CrossRef]
15. Tokatlidis, I.; Koutroubas, S. A review of maize hybrids’ dependence on high plant populations and itsimplications for crop yield stability. Field Crop. Res. 2004, 88, 103–114. [CrossRef]
16. Ruffo, M.L.; Gentry, L.; Henninger, A.S.; Seebauer, J.R.; Below, F.E. Evaluating management factorcontributions to reduce corn yield gaps. Agron. J. 2015, 107, 495–505. [CrossRef]
17. Mageto, E.K.; Makumbi, D.; Njoroge, K.; Nyankanga, R. Genetic analysis of early-maturing maize (Zea maysL.) inbred lines under stress and nonstress conditions. J. Crop. Improv. 2017, 31, 560–588. [CrossRef]
18. Kamara, M.M.; El-Degwy, I.S.; Koyama, H. Estimation combining ability of some maize inbred lines usingline x tester mating design under two nitrogen levels. Aust. J. Crop Sci. 2014, 8, 1336.
19. Carena, M.J.; Hallauer, A.R.; Filho, J.M. Quantitative Genetics in Maize Breeding; Springer: New York, NY,USA, 2010.
20. Henry, W.B.; Blanco, M.H.; Rowe, D.E.; Windham, G.L.; Murray, S.C.; Williams, W.P. Diallel analysis ofdiverse maize germplasm lines for agronomic characteristics. Crop. Sci. 2014, 54, 2547–2556. [CrossRef]
21. Sughroue, J.R.; Hallauer, A.R. Analysis of the diallel mating design for maize inbred lines. Crop. Sci. 1997,37, 400–405. [CrossRef]
22. Zhang, Y.; Fan, X.; Yao, W.; Piepho, H.P.; Kang, M.S. Diallel analysis of four maize traits and a modifiedheterosis hypothesis. Crop. Sci. 2016, 56, 1115–1126. [CrossRef]
23. Sprague, G.F.; Tatum, L.A. General vs. specific combining ability in single crosses of corn1. Agron. J. 1942, 34,923–932. [CrossRef]
24. Al-Naggar, A.; Atta, M.; Shabana, R.; Al-Khalil, T. Heterosis and type of gene action for some adaptive traitsto high plant density in maize. Egypt. J. Plant. Breed. 2014, 18, 189–209. [CrossRef]
25. Mason, L.; Zuber, M.S. Diallel analysis of maize for leaf angle, leaf area, yield, and yield components 1. Crop.Sci. 1976, 16, 693–696. [CrossRef]
26. Badu-Apraku, B.; Oyekunle, M.; Fakorede, M.A.B.; Vroh, I.; Akinwale, R.O.; Aderounmu, M. Combiningability, heterotic patterns and genetic diversity of extra-early yellow inbreds under contrasting environments.Euphytica 2013, 192, 413–433. [CrossRef]
27. Akinwale, R.; Badu-Apraku, B.; Fakorede, M.; Vroh-Bi, I. Heterotic grouping of tropical early-maturingmaize inbred lines based on combining ability in Striga-infested and Striga-free environments and the use ofSSR markers for genotyping. Field Crop. Res. 2014, 156, 48–62. [CrossRef]
28. Akaogu, I.C.; Badu-Apraku, B.; Adetimirin, V.O.; Vroh-Bi, I.; Oyekunle, M.; Akinwale, R.O. Genetic diversityassessment of extra-early maturing yellow maize inbreds and hybrid performance in Striga-infested andStriga-free environments. J. Agric. Sci. 2013, 151, 519–537. [CrossRef]
29. Nyaligwa, L.; Hussein, S.; Amelework, B.; Ghebrehiwot, H. Genetic diversity analysis of elite maize inbredlines of diverse sources using SSR markers. Maydica 2015, 60, M29.
30. Sserumaga, J.P.; Ji, H.; Njoroge, K.; Muthomi, J.; Chemining’wa, G.; Si-myung, L.; Kim, H.; Asea, G.;Makumbi, D. Molecular characterization of tropical maize inbred lines using microsatellite DNA markers.Maydica 2014, 59, 267–274.
31. Phumichai, C.; Doungchan, W.; Puddhanon, P.; Jampatong, S.; Grudloyma, P.; Kirdsri, C.; Chunwongse, J.;Pulam, T. SSR-based and grain yield-based diversity of hybrid maize in Thailand. Field Crop. Res. 2008, 108,157–162. [CrossRef]
32. Singh, P. Genetic distance, heterosis and combing ability studies in maize for predicting F1 hybrid performance.Sabrao J. Breed. Genet. 2015, 47, 21–28.
33. Dhliwayo, T.; Pixley, K.; Menkir, A.; Warburton, M. Combining ability, genetic distances, and heterosisamong elite CIMMYT and IITA tropical maize inbred lines. Crop. Sci. 2009, 49, 1201–1210. [CrossRef]
34. Menkir, A.; Melake-Berhan, A.; The, C.; Ingelbrecht, I.; Adepoju, A. Grouping of tropical mid-altitude maizeinbred lines on the basis of yield data and molecular markers. Theor. Appl. Genet. 2004, 108, 1582–1590.[CrossRef] [PubMed]
35. Lashkari, M.; Madani, H.; Ardakani, M.R.; Golzardi, F.; Zargari, K. Effect of plant density on yield and yieldcomponents of different corn (Zea mays L.) hybrids. Am-Euras J. Agric. Environ. Sci. 2011, 10, 450–457.
36. Mansfield, B.D.; Mumm, R.H. Survey of plant density tolerance in U.S. maize germplasm. Crop. Sci. 2014,54, 157–173. [CrossRef]
42
Plants 2020, 9, 1140
37. Trachsel, S.; Vicente, F.M.S.; Suarez, E.A.; Rodriguez, C.S.; Atlin, G.N. Effects of planting density and nitrogenfertilization level on grain yield and harvest index in seven modern tropical maize hybrids (Zea mays L.). J.Agric. Sci. 2015, 154, 689–704. [CrossRef]
38. Kamara, A.Y.; Menkir, A.; Abubakar, A.W.; Tofa, A.I.; Ademulegun, T.D.; Omoigui, L.O.; Kamai, N. Maizehybrids response to high plant density in the Guinea savannah of Nigeria. J. Crop. Improv. 2020, 1–20.[CrossRef]
39. Abd El-Aty, M.; El-Hity, M.; Amer, E.; El-Mouslhy, T. Selection of maize (Zea mays) hybrids for plant densitytolerance. Indian J. Agric. Sci. 2019, 89, 951–957.
40. Makumbi, D.; Betrán, J.F.; Bänziger, M.; Ribaut, J.M. Combining ability, heterosis and genetic diversity intropical maize (Zea mays L.) under stress and non-stress conditions. Euphytica 2011, 180, 143–162. [CrossRef]
41. Badu-Apraku, B.; Oyekunle, M. Genetic analysis of grain yield and other traits of extra-early yellow maizeinbreds and hybrid performance under contrasting environments. Field Crop. Res. 2012, 129, 99–110.[CrossRef]
42. Liu, W.; Tollenaar, M. Response of yield heterosis to increasing plant density in maize. Crop. Sci. 2009, 49,1807–1816. [CrossRef]
43. Tollenaar, M.; Wu, J. Yield improvement in temperate maize is attributable to greater stress tolerance. Crop.Sci. 1999, 39, 1597–1604. [CrossRef]
44. Van Averbeke, W.; Marais, J.N. Maize response to plant population and soil water supply: I. Yield of grainand total above-ground biomass. S. Afr. J. Plant. Soil 1992, 9, 186–192. [CrossRef]
45. Tang, L.; Ma, W.; Noor, M.A.; Li, L.; Hou, H.; Zhang, X.; Zhao, M. Density resistance evaluation of maizevarieties through new “Density–Yield Model” and quantification of varietal response to gradual plantingdensity pressure. Sci. Rep. 2018, 8, 1–16. [CrossRef] [PubMed]
46. Hashemi, A.M.; Herbert, S.J.; Putnam, D.H. Yield response of corn to crowding stress. Agron. J. 2005, 97,839–846. [CrossRef]
47. Ren, B.; Liu, W.; Zhang, J.; Dong, S.; Liu, P.; Zhao, B. Effects of plant density on the photosynthetic andchloroplast characteristics of maize under high-yielding conditions. Sci. Nat. 2017, 104, 12. [CrossRef]
48. Gou, L.; Xue, J.; Qi, B.; Ma, B.; Zhang, W. Morphological variation of maize cultivars in response to elevatedplant densities. Agron. J. 2017, 109, 1443–1453. [CrossRef]
49. Sangoi, L. Understanding plant density effects on maize growth and development: An important issue tomaximize grain yield. Ciência Rural 2001, 31, 159–168. [CrossRef]
50. Al-Naggar, A.; Shabana, R.; Hassanein, M.S.; Elewa, T.A.; Younis, A.; Metwally, A. Secondary traits andselection environment of plant density tolerance in maize inbreds and testcrosses. J. Adv. Biol. Biotechnol.2017, 14, 1–13. [CrossRef]
51. Gyenes-Hegyi, Z.; Pók, I.; Kizmus, L.; Al, E. Plant height and height of the main ear in maize (Zea mays L.) atdifferent locations and different plant densities. Acta Agron. Hung. 2002, 50, 75–84. [CrossRef]
52. Carena, M.; Cross, H. Plant density and maize germplasm improvement in the northern Corn Belt. Maydica2003, 48, 105–111.
53. Tollenaar, M.; Lee, E. Yield potential, yield stability and stress tolerance in maize. Field Crop. Res. 2002, 75,161–169. [CrossRef]
54. Duvick, D.N. The Contribution of Breeding to Yield Advances in maize (Zea mays L.). Adv. Agron. 2005, 86,83–145. [CrossRef]
55. Obeng-Bio, E.; Badu-Apraku, B.; Ifie, B.E.; Danquah, A.; Blay, E.T.; Annor, B. Genetic analysis of grain yieldand agronomic traits of early provitamin A quality protein maize inbred lines in contrasting environments. J.Agric. Sci. 2019, 157, 413–433. [CrossRef]
56. Chiuta, N.E.; Charles, M.S. Combining ability of quality protein maize inbred lines for yield andmorpho-agronomic traits under optimum as well as combined drought and heat-stressed conditions.Agronomy 2020, 10, 184. [CrossRef]
57. Gissa, D.W.; Zelleke, H.; Labuschagne, M.T.; Hussien, T.; Singh, H. Heterosis and combining ability for grainyield and its components in selected maize inbred lines. S. Afr. J. Plant. Soil 2007, 24, 133–137. [CrossRef]
58. Reif, J.C.; Gumpert, F.M.; Fischer, S.; Melchinger, A.E. Impact of interpopulation divergence on additive anddominance variance in hybrid populations. Genetics 2007, 176, 1931–1934. [CrossRef]
59. Ejigu, Y.G.; Tongoona, P.B.; Ifie, B.E. General and specific combining ability studies of selected tropical whitemaize inbred lines for yield and yield related traits. Int. J. Agric. Res. Innov. Technol. 2017, 7, 381–396.
43
Plants 2020, 9, 1140
60. Oppong, A.; Bedoya, C.A.; Ewool, M.B.; Asante, M.D.; Thomson, R.N.; Adu-Dapaah, H.; Lamptey, J.N.;Ofori, K.; Offei, S.K.; Warburton, M.L. Bulk genetic characterization of Ghanaian maize landraces usingmicrosatellite markers. Maydica 2014, 59, 1–8.
61. Oyekunle, M.; Badu-Apraku, B.; Hearne, S.; Franco, J. Genetic diversity of tropical early-maturing maizeinbreds and their performance in hybrid combinations under drought and optimum growing conditions.Field Crop. Res. 2015, 170, 55–65. [CrossRef]
62. Legesse, B.W.; Myburg, A.; Pixley, K.V.; Botha, A. Genetic diversity of African maize inbred lines revealed bySSR markers. Hereditas 2007, 144, 10–17. [CrossRef]
63. Botstein, D.; White, R.L.; Skolnick, M.; Davis, R.W. Construction of a genetic linkage map in man usingrestriction fragment length polymorphisms. Am. J. Hum. Genet. 1980, 32, 314–331.
64. Adu, G.B.; Awuku, F.; Amegbor, I.; Haruna, A.; Manigben, K.; Aboyadana, P. Genetic characterization andpopulation structure of maize populations using SSR markers. Ann. Agric. Sci. 2019, 64, 47–54. [CrossRef]
65. El-Esawi, M.; Germaine, K.J.; Bourke, P.; Malone, R. AFLP analysis of genetic diversity and phylogeneticrelationships of Brassica oleracea in Ireland. Comptes Rendus Biol. 2016, 339, 163–170. [CrossRef] [PubMed]
66. El-Esawi, M.; Alaraidh, I.A.; Alsahli, A.A.; Ali, H.M.; Alayafi, A.A.; Witczak, J.; Ahmad, M. Genetic variationand alleviation of salinity stress in barley (Hordeum vulgare L.). Molecules 2018, 23, 2488. [CrossRef] [PubMed]
67. El-Esawi, M.; Al-Ghamdi, A.A.; Ali, H.M.; Alayafi, A.A.; Witczak, J.; Ahmad, M. Analysis of genetic variationand enhancement of salt tolerance in French pea (Pisum sativum L.). Int. J. Mol. Sci. 2018, 19, 2433. [CrossRef][PubMed]
68. El-Esawi, M. Genetic diversity and evolution of Brassica genetic resources: From morphology to novelgenomic technologies—A review. Plant. Genet. Resour. 2016, 15, 388–399. [CrossRef]
69. El-Esawi, M.; Sammour, R. Karyological and phylogenetic studies in the genus Lactuca L. (Asteraceae).Cytologia 2014, 79, 269–275. [CrossRef]
70. El-Esawi, M.; Al-Ghamdi, A.A.; Ali, H.M.; Ahmad, M. Overexpression of AtWRKY30 transcription factorenhances heat and drought stress tolerance in wheat (Triticum aestivum L.). Genes 2019, 10, 163. [CrossRef]
71. Vwioko, E.; Adinkwu, O.; El-Esawi, M.A. Comparative physiological, biochemical, and genetic responses toprolonged waterlogging stress in okra and maize given exogenous ethylene priming. Front. Physiol. 2017, 8,632. [CrossRef]
72. Xia, X.; Reif, J.; Hoisington, D.; Melchinger, A.; Frisch, M.; Warburton, M. Genetic diversity among CIMMYTmaize inbred lines investigated with SSR markers. Crop. Sci. 2004, 44, 2230–2237. [CrossRef]
73. Adebayo, M.A.; Menkir, A.; Gedil, M.; Blay, E.; Gracen, V.; Danquah, E.; Funmilayo, L. Diversity assessmentof drought tolerant exotic and adapted maize (Zea mays L.) inbred lines with microsatellite markers. J. Crop.Sci. Biotechnol. 2015, 18, 147–154. [CrossRef]
74. Bernardo, R. Relationship between single-cross performance and molecular marker heterozygosity. Theor.Appl. Genet. 1992, 83, 628–634. [CrossRef] [PubMed]
75. Betran, F.; Beck, D.; Bänziger, M.; Edmeades, G. Genetic analysis of inbred and hybrid grain yield understress and nonstress environments in tropical maize. Crop Sci. 2003, 43, 807–817. [CrossRef]
76. Parentoni, S.; Magalhães, J.; Pacheco, C.; Santos, M.; Abadie, T.; Gama, E.; Guimarães, P.; Meirelles, W.;Lopes, M.; Vasconcelos, M.; et al. Heterotic groups based on yield-specific combining ability data andphylogenetic relationship determined by RAPD markers for 28 tropical maize open pollinated varieties.Euphytica 2001, 121, 197–208. [CrossRef]
77. AOAC, C.A. Official Methods of Analysis of the Association of Analytical Chemists International; Official Methods:Gaithersburg, MD, USA, 2005.
78. Doyle, J. DNA Protocols for plants. In Molecular Techniques in Taxonomy; Springer Science and Business MediaLLC: New York, NY, USA, 1991; pp. 283–293.
79. David, F.N.; Steel, R.G.D.; Torrie, J.H. Principles and Procedures of Statistics, A Biometrical Approach, 3rd ed.;McGraw Hill Inc. Book Co.: New York, NY, USA, 1997; pp. 352–358.
80. Griffing, B. Concept of general and specific combining ability in relation to diallel crossing systems. Aust. J.Biol. Sci. 1956, 9, 463–493. [CrossRef]
81. Zhang, Y.; Kang, M.S.; Lamkey, K.R. DIALLEL-SAS05: A comprehensive program for griffing’s andgardner-eberhart analyses. Agron. J. 2005, 97, 1097–1106. [CrossRef]
44

Plants 2020, 9, 1140
82. Wei, T.; Simko, V.; Levy, M.; Xie, Y.; Jin, Y.; Zemla, J. Corrplot: Visualization of a Correlation Matrix. Availableonline: https://github.com/taiyun/corrplot (accessed on 15 December 2019).
83. Jaccard, P. Nouvelles recherches sur la distribution florale. Bull. Soc. Vaud. Sci. Nat. 1908, 44, 223–270.
© 2020 by the authors. Licensee MDPI, Basel, Switzerland. This article is an open accessarticle distributed under the terms and conditions of the Creative Commons Attribution(CC BY) license (http://creativecommons.org/licenses/by/4.0/).
45

plants
Article
Rice Breeding in Russia Using Genetic Markers
Elena Dubina 1, Pavel Kostylev 2,*, Margarita Ruban 1, Sergey Lesnyak 1, Elena Krasnova 2
and Kirill Azarin 3
1 Federal Scientific Rice Centre, Belozerny, 3, 350921 Krasnodar, Russia; [email protected] (E.D.);[email protected] (M.R.); [email protected] (S.L.)
2 Agrarian Research Center “Donskoy”, Nauchny Gorodok, 3, 347740 Zernograd, Russia;[email protected]
3 Department of Genetics, Southern Federal University, 344006 Rostov-on-Don, Russia; [email protected]* Correspondence: [email protected]
Received: 17 October 2020; Accepted: 12 November 2020; Published: 15 November 2020
Abstract: The article concentrates on studying tolerance to soil salinization, water flooding, and blastin Russian and Asian rice varieties, as well as hybrids of the second and third generations from theircrossing in order to obtain sustainable paddy crops based on domestic varieties using DNA markers.Samples IR 52713-2B-8-2B-1-2, IR 74099-3R-3-3, and NSIC Rc 106 were used as donors of the SalToltolerance gene. Varieties with the Sub1A locus were used as donors of the flood resistance gene:Br-11, CR-1009, Inbara-3, TDK-1, and Khan Dan. The lines C101-A-51 (Pi-2), C101-Lac (Pi-1, Pi-33),IR-58 (Pi-ta), and Moroberekan (Pi-b) were used to transfer blast resistance genes. Hybridizationof the stress-sensitive domestic varieties Novator, Flagman, Virazh, and Boyarin with donor linesof the genes of interest was carried out. As a result of the studies carried out using molecularmarking based on PCR in combination with traditional breeding, early-maturing rice lines with genesfor resistance to salinity (SalTol) and flooding (Sub1A), suitable for cultivation in southern Russia,were obtained. Introgression and pyramiding of the blast resistance genes Pi-1, Pi-2, Pi-33, Pi-ta,and Pi-b into the genotypes of domestic rice varieties were carried out. DNA marker analysis revealeddisease-resistant rice samples carrying 5 target genes in a homozygous state. The created rice varietiesthat carry the genes for blast resistance (Pentagen, Magnate, Pirouette, Argamac, Kapitan, and Lenaris)were submitted for state variety testing. The introduction of such varieties into production will allowus to avoid epiphytotic development of the disease, preserving the biological productivity of rice andobtaining environmentally friendly agricultural products.
Keywords: rice; salinity; submergence tolerance; blast; SSR markers; PCR analysis
1. Introduction
Rice (Oryza sativa L.) is the most important food crop for more than half of the world’s population(China, Japan, India, Bangladesh, etc.). Biotic and abiotic stressors are the main obstacles to increasingglobal crop production and expanding rice production. It was found that only about 10% of the world’sagricultural land is located in areas that do not suffer from stress factors [1].
Decreased rice yields in adverse climatic conditions threaten global food security. Genetic locithat ensure productivity in difficult conditions exist in the germplasm of cultivated plants, their wildrelatives, and species adapted to extreme conditions [2].
One-fifth of the world’s irrigated land (North Africa, Central and South-East Asia, etc.) is adverselyaffected by high soil salinity [3]. About 45 million hectares in the world are subject to soil salinization [4].In the Russian Federation, rice is grown on an area of about 200 thousand hectares, of which about80 thousand hectares are saline [5]. The decline in productivity on saline soils can be overcome bydeveloping rice varieties tolerant to salinity and introducing them into agricultural production. Several
Plants 2020, 9, 1580; doi:10.3390/plants9111580 www.mdpi.com/journal/plants47
Plants 2020, 9, 1580
non-allelic genes provide tolerance to salinity during ontogenesis [6]. The main locus of salt toleranceis SalTol, which was first identified in some rice varieties [7,8]. This locus is mapped on chromosome 1and its main function is to control the balance of Na+/K+ ions in rice plants [9].
One of the serious abiotic stress factors for rice, which inhibits plant growth and affects cropyield, is prolonged submersion of plants under water, which often happens to large areas of land inthe rice-growing regions of South-East Asia [5]. Rice dies if total flooding lasts more than two weeks.A negative effect on the growth and development of rice plants at this time is exerted by a lack ofoxygen (O2) and limited diffusion of carbon dioxide (CO2). Lack of light due to turbid flood water inthe rice paddies during this period limits the ability of plants to photosynthesize and can even lead totheir death [4–6].
Scientists in Asia have found the Sub1A gene, which regulates the response of plant cells toethylene and gibberellin, leading to restriction of carbohydrate intake and dormancy of shoots underwater, which contributes to tolerance to immersion [10,11]. In Russia, this gene can be used to developvarieties resistant to a large layer of water during the germination phase, which will become an effectiveway to protect rice from weeds without herbicides. Most weeds die under water without oxygen,and rice can survive. To develop such varieties, it is necessary to combine in one genotype geneswith increased energy of initial growth, the ability to anaerobic germination, resistance to prolongedflooding and lodging.
In all countries of the world, including Russia, blast is among the most dangerous fungal diseasesof rice and causes large yield losses in the years of epiphytoty. The most effective way to protectrice without fungicides is to grow blast-resistant varieties. More than 50 genes of resistance to thispathogen are known: Pi-1, Pi-2, Pi-33, Pi-b, Pi-ta, Pi-z, etc. [12]. Combining several effective resistancegenes with their contribution on the genetic basis of the best varieties is an effective breeding strategyfor resistance to variable fungal pathogens. Lines with a combination of 3–5 resistance genes show anincrease and broadening of the spectrum of blast resistance in comparison with lines with separategenes. A number of successful breeding programs have already been carried out abroad to developblast-resistant rice varieties by the gene pyramiding method using marker breeding [13].
Resistance to various biotic and abiotic factors is one of the traits that are difficult to assess whenthe assessment of the breeding material is possible only in the presence of an appropriate stress factor.At present, during the breeding of agricultural plants for resistance, the splitting population obtainedfrom the crossing of resistance sources with genotypes that have productivity is tested against a naturalbackground, or artificial infection is carried out under controlled conditions. This procedure, althoughit gives excellent results, is quite lengthy and costly. In addition, there are always susceptible plantsthat have escaped damage [14].
The use of DNA markers allows us to speed up the assessment and conduct selection withoutphenotypic assessment, at an early stage, regardless of the external conditions. In recent years,great progress has been made in the development of molecular marking technologies and theirapplication to control complex agronomic traits using marker breeding [15]. The technology ofmolecular marking of resistance loci makes it possible to quickly select plant forms with target geneswithout using provocative backgrounds [16]. The identification of molecular markers linked to genesof resistance to these factors facilitates breeding work. The use of DNA markers brings the breeding ofagricultural plants to a qualitatively new level, making it possible to evaluate genotypes directly andnot through phenotypic manifestations, which, ultimately, is realized in the accelerated developmentof varieties with a complex of valuable traits [14]. Therefore, it is relevant to develop new rice varietiesby marking [17].
The purpose of the study was the development of initial rice material using DNA markersfor breeding highly productive varieties resistant to biotic and abiotic environmental stress factors:soil salinity, prolonged flooding, and blast.
48
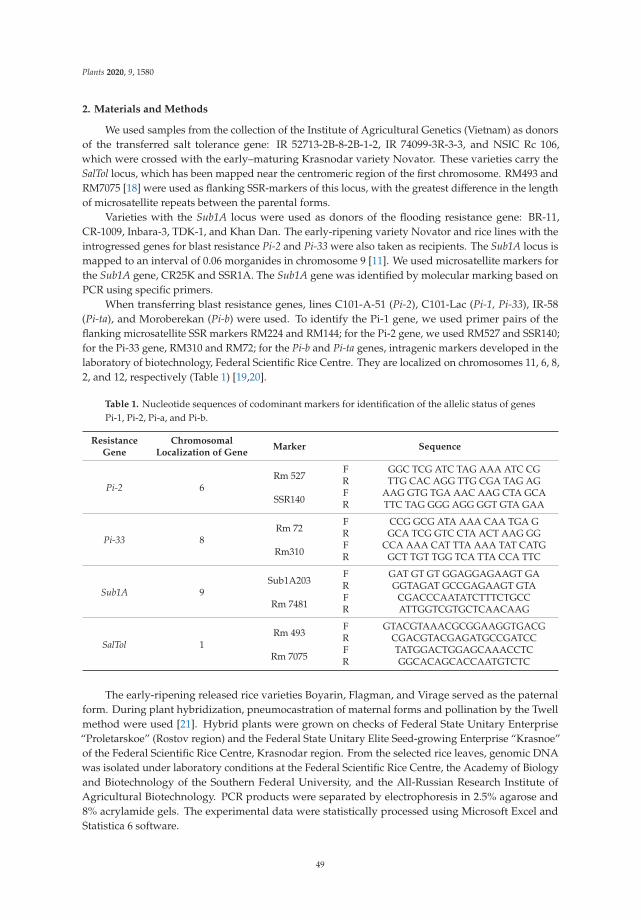
Plants 2020, 9, 1580
2. Materials and Methods
We used samples from the collection of the Institute of Agricultural Genetics (Vietnam) as donorsof the transferred salt tolerance gene: IR 52713-2B-8-2B-1-2, IR 74099-3R-3-3, and NSIC Rc 106,which were crossed with the early–maturing Krasnodar variety Novator. These varieties carry theSalTol locus, which has been mapped near the centromeric region of the first chromosome. RM493 andRM7075 [18] were used as flanking SSR-markers of this locus, with the greatest difference in the lengthof microsatellite repeats between the parental forms.
Varieties with the Sub1A locus were used as donors of the flooding resistance gene: BR-11,CR-1009, Inbara-3, TDK-1, and Khan Dan. The early-ripening variety Novator and rice lines with theintrogressed genes for blast resistance Pi-2 and Pi-33 were also taken as recipients. The Sub1A locus ismapped to an interval of 0.06 morganides in chromosome 9 [11]. We used microsatellite markers forthe Sub1A gene, CR25K and SSR1A. The Sub1A gene was identified by molecular marking based onPCR using specific primers.
When transferring blast resistance genes, lines C101-A-51 (Pi-2), C101-Lac (Pi-1, Pi-33), IR-58(Pi-ta), and Moroberekan (Pi-b) were used. To identify the Pi-1 gene, we used primer pairs of theflanking microsatellite SSR markers RM224 and RM144; for the Pi-2 gene, we used RM527 and SSR140;for the Pi-33 gene, RM310 and RM72; for the Pi-b and Pi-ta genes, intragenic markers developed in thelaboratory of biotechnology, Federal Scientific Rice Centre. They are localized on chromosomes 11, 6, 8,2, and 12, respectively (Table 1) [19,20].
Table 1. Nucleotide sequences of codominant markers for identification of the allelic status of genesPi-1, Pi-2, Pi-a, and Pi-b.
ResistanceGene
ChromosomalLocalization of Gene
Marker Sequence
Pi-2 6Rm 527
F GGC TCG ATC TAG AAA ATC CGR TTG CAC AGG TTG CGA TAG AG
SSR140F AAG GTG TGA AAC AAG CTA GCAR TTC TAG GGG AGG GGT GTA GAA
Pi-33 8Rm 72
F CCG GCG ATA AAA CAA TGA GR GCA TCG GTC CTA ACT AAG GG
Rm310F CCA AAA CAT TTA AAA TAT CATGR GCT TGT TGG TCA TTA CCA TTC
Sub1A 9Sub1A203
F GAT GT GT GGAGGAGAAGT GAR GGTAGAT GCCGAGAAGT GTA
Rm 7481F CGACCCAATATCTTTCTGCCR ATTGGTCGTGCTCAACAAG
SalTol 1Rm 493
F GTACGTAAACGCGGAAGGTGACGR CGACGTACGAGATGCCGATCC
Rm 7075F TATGGACTGGAGCAAACCTCR GGCACAGCACCAATGTCTC
The early-ripening released rice varieties Boyarin, Flagman, and Virage served as the paternalform. During plant hybridization, pneumocastration of maternal forms and pollination by the Twellmethod were used [21]. Hybrid plants were grown on checks of Federal State Unitary Enterprise“Proletarskoe” (Rostov region) and the Federal State Unitary Elite Seed-growing Enterprise “Krasnoe”of the Federal Scientific Rice Centre, Krasnodar region. From the selected rice leaves, genomic DNAwas isolated under laboratory conditions at the Federal Scientific Rice Centre, the Academy of Biologyand Biotechnology of the Southern Federal University, and the All-Russian Research Institute ofAgricultural Biotechnology. PCR products were separated by electrophoresis in 2.5% agarose and8% acrylamide gels. The experimental data were statistically processed using Microsoft Excel andStatistica 6 software.
49
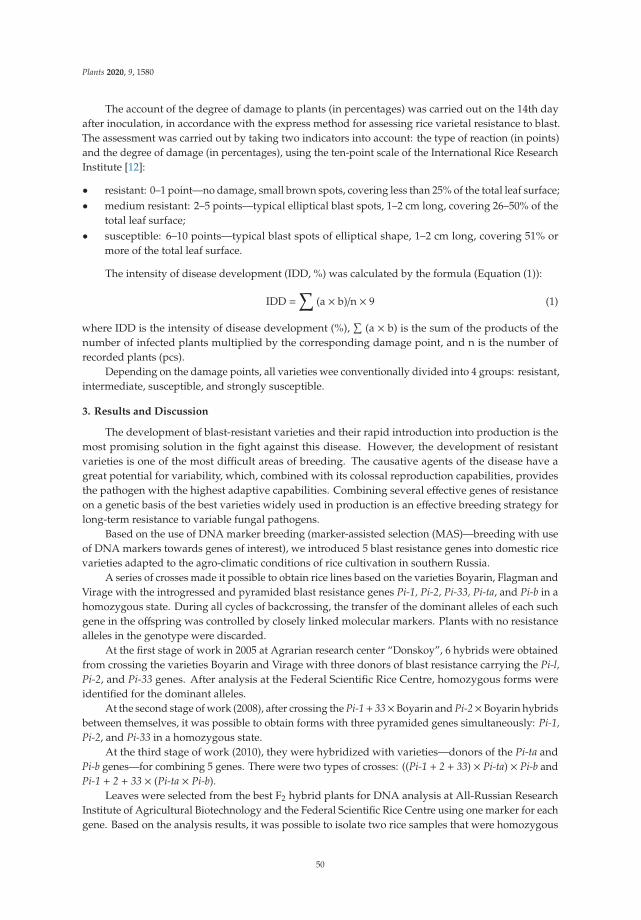
Plants 2020, 9, 1580
The account of the degree of damage to plants (in percentages) was carried out on the 14th dayafter inoculation, in accordance with the express method for assessing rice varietal resistance to blast.The assessment was carried out by taking two indicators into account: the type of reaction (in points)and the degree of damage (in percentages), using the ten-point scale of the International Rice ResearchInstitute [12]:
• resistant: 0–1 point—no damage, small brown spots, covering less than 25% of the total leaf surface;• medium resistant: 2–5 points—typical elliptical blast spots, 1–2 cm long, covering 26–50% of the
total leaf surface;• susceptible: 6–10 points—typical blast spots of elliptical shape, 1–2 cm long, covering 51% or
more of the total leaf surface.
The intensity of disease development (IDD, %) was calculated by the formula (Equation (1)):
IDD =∑
(a × b)/n × 9 (1)
where IDD is the intensity of disease development (%),∑
(a × b) is the sum of the products of thenumber of infected plants multiplied by the corresponding damage point, and n is the number ofrecorded plants (pcs).
Depending on the damage points, all varieties wee conventionally divided into 4 groups: resistant,intermediate, susceptible, and strongly susceptible.
3. Results and Discussion
The development of blast-resistant varieties and their rapid introduction into production is themost promising solution in the fight against this disease. However, the development of resistantvarieties is one of the most difficult areas of breeding. The causative agents of the disease have agreat potential for variability, which, combined with its colossal reproduction capabilities, providesthe pathogen with the highest adaptive capabilities. Combining several effective genes of resistanceon a genetic basis of the best varieties widely used in production is an effective breeding strategy forlong-term resistance to variable fungal pathogens.
Based on the use of DNA marker breeding (marker-assisted selection (MAS)—breeding with useof DNA markers towards genes of interest), we introduced 5 blast resistance genes into domestic ricevarieties adapted to the agro-climatic conditions of rice cultivation in southern Russia.
A series of crosses made it possible to obtain rice lines based on the varieties Boyarin, Flagman andVirage with the introgressed and pyramided blast resistance genes Pi-1, Pi-2, Pi-33, Pi-ta, and Pi-b in ahomozygous state. During all cycles of backcrossing, the transfer of the dominant alleles of each suchgene in the offspring was controlled by closely linked molecular markers. Plants with no resistancealleles in the genotype were discarded.
At the first stage of work in 2005 at Agrarian research center “Donskoy”, 6 hybrids were obtainedfrom crossing the varieties Boyarin and Virage with three donors of blast resistance carrying the Pi-l,Pi-2, and Pi-33 genes. After analysis at the Federal Scientific Rice Centre, homozygous forms wereidentified for the dominant alleles.
At the second stage of work (2008), after crossing the Pi-1+ 33× Boyarin and Pi-2× Boyarin hybridsbetween themselves, it was possible to obtain forms with three pyramided genes simultaneously: Pi-1,Pi-2, and Pi-33 in a homozygous state.
At the third stage of work (2010), they were hybridized with varieties—donors of the Pi-ta andPi-b genes—for combining 5 genes. There were two types of crosses: ((Pi-1 + 2 + 33) × Pi-ta) × Pi-b andPi-1 + 2 + 33 × (Pi-ta × Pi-b).
Leaves were selected from the best F2 hybrid plants for DNA analysis at All-Russian ResearchInstitute of Agricultural Biotechnology and the Federal Scientific Rice Centre using one marker for eachgene. Based on the analysis results, it was possible to isolate two rice samples that were homozygous
50
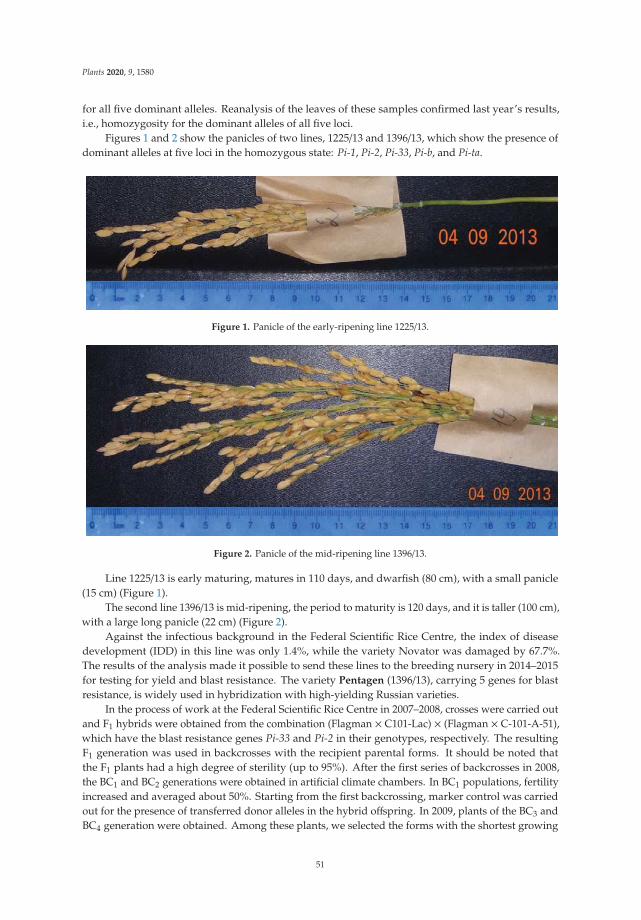
Plants 2020, 9, 1580
for all five dominant alleles. Reanalysis of the leaves of these samples confirmed last year’s results,i.e., homozygosity for the dominant alleles of all five loci.
Figures 1 and 2 show the panicles of two lines, 1225/13 and 1396/13, which show the presence ofdominant alleles at five loci in the homozygous state: Pi-1, Pi-2, Pi-33, Pi-b, and Pi-ta.
Figure 1. Panicle of the early-ripening line 1225/13.
Figure 2. Panicle of the mid-ripening line 1396/13.
Line 1225/13 is early maturing, matures in 110 days, and dwarfish (80 cm), with a small panicle(15 cm) (Figure 1).
The second line 1396/13 is mid-ripening, the period to maturity is 120 days, and it is taller (100 cm),with a large long panicle (22 cm) (Figure 2).
Against the infectious background in the Federal Scientific Rice Centre, the index of diseasedevelopment (IDD) in this line was only 1.4%, while the variety Novator was damaged by 67.7%.The results of the analysis made it possible to send these lines to the breeding nursery in 2014–2015for testing for yield and blast resistance. The variety Pentagen (1396/13), carrying 5 genes for blastresistance, is widely used in hybridization with high-yielding Russian varieties.
In the process of work at the Federal Scientific Rice Centre in 2007–2008, crosses were carried outand F1 hybrids were obtained from the combination (Flagman × C101-Lac) × (Flagman × C-101-A-51),which have the blast resistance genes Pi-33 and Pi-2 in their genotypes, respectively. The resultingF1 generation was used in backcrosses with the recipient parental forms. It should be noted thatthe F1 plants had a high degree of sterility (up to 95%). After the first series of backcrosses in 2008,the BC1 and BC2 generations were obtained in artificial climate chambers. In BC1 populations, fertilityincreased and averaged about 50%. Starting from the first backcrossing, marker control was carriedout for the presence of transferred donor alleles in the hybrid offspring. In 2009, plants of the BC3 andBC4 generation were obtained. Among these plants, we selected the forms with the shortest growing
51
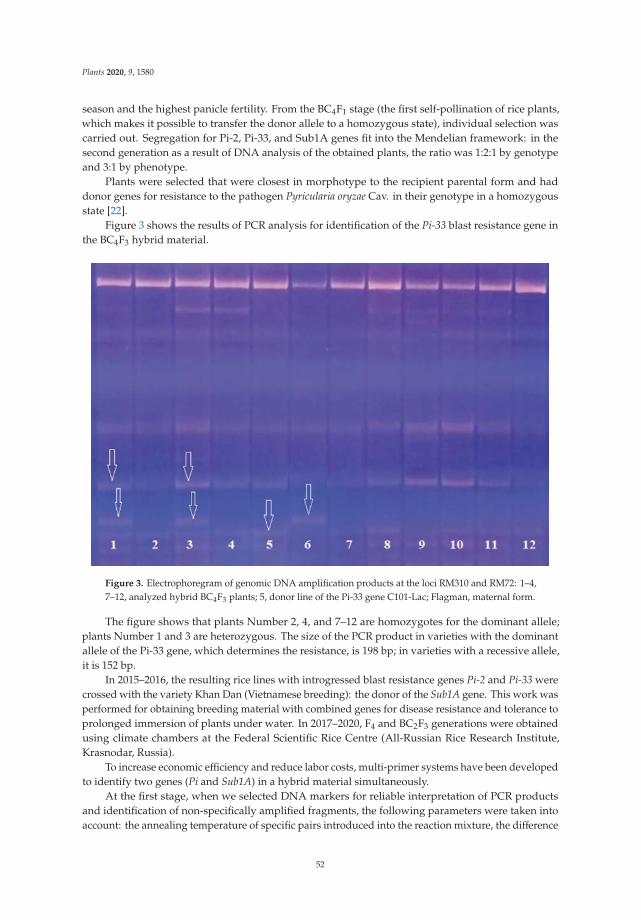
Plants 2020, 9, 1580
season and the highest panicle fertility. From the BC4F1 stage (the first self-pollination of rice plants,which makes it possible to transfer the donor allele to a homozygous state), individual selection wascarried out. Segregation for Pi-2, Pi-33, and Sub1A genes fit into the Mendelian framework: in thesecond generation as a result of DNA analysis of the obtained plants, the ratio was 1:2:1 by genotypeand 3:1 by phenotype.
Plants were selected that were closest in morphotype to the recipient parental form and haddonor genes for resistance to the pathogen Pyricularia oryzae Cav. in their genotype in a homozygousstate [22].
Figure 3 shows the results of PCR analysis for identification of the Pi-33 blast resistance gene inthe BC4F3 hybrid material.
Figure 3. Electrophoregram of genomic DNA amplification products at the loci RM310 and RM72: 1–4,7–12, analyzed hybrid BC4F3 plants; 5, donor line of the Pi-33 gene C101-Lac; Flagman, maternal form.
The figure shows that plants Number 2, 4, and 7–12 are homozygotes for the dominant allele;plants Number 1 and 3 are heterozygous. The size of the PCR product in varieties with the dominantallele of the Pi-33 gene, which determines the resistance, is 198 bp; in varieties with a recessive allele,it is 152 bp.
In 2015–2016, the resulting rice lines with introgressed blast resistance genes Pi-2 and Pi-33 werecrossed with the variety Khan Dan (Vietnamese breeding): the donor of the Sub1A gene. This work wasperformed for obtaining breeding material with combined genes for disease resistance and tolerance toprolonged immersion of plants under water. In 2017–2020, F4 and BC2F3 generations were obtainedusing climate chambers at the Federal Scientific Rice Centre (All-Russian Rice Research Institute,Krasnodar, Russia).
To increase economic efficiency and reduce labor costs, multi-primer systems have been developedto identify two genes (Pi and Sub1A) in a hybrid material simultaneously.
At the first stage, when we selected DNA markers for reliable interpretation of PCR productsand identification of non-specifically amplified fragments, the following parameters were taken intoaccount: the annealing temperature of specific pairs introduced into the reaction mixture, the difference
52
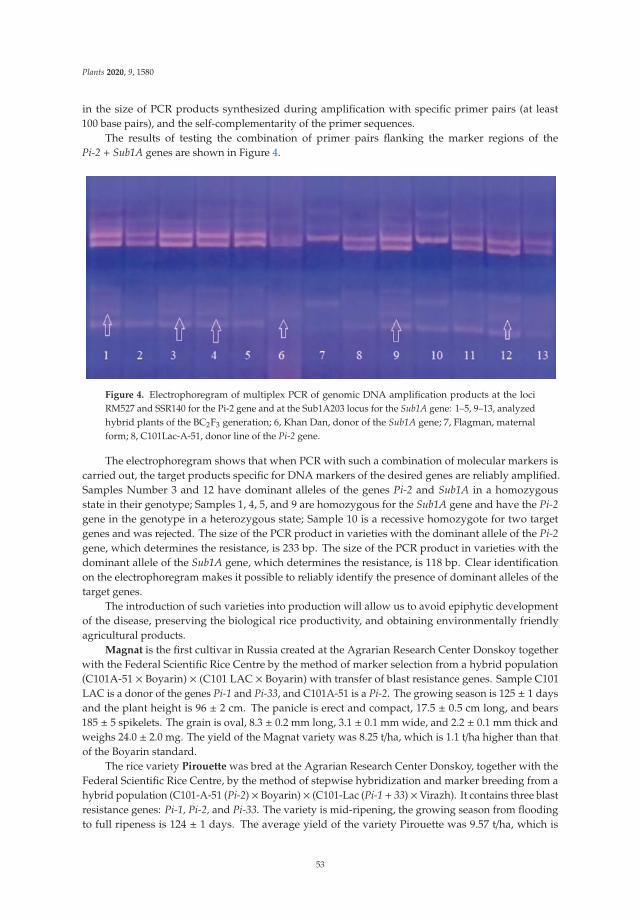
Plants 2020, 9, 1580
in the size of PCR products synthesized during amplification with specific primer pairs (at least100 base pairs), and the self-complementarity of the primer sequences.
The results of testing the combination of primer pairs flanking the marker regions of thePi-2 + Sub1A genes are shown in Figure 4.
Figure 4. Electrophoregram of multiplex PCR of genomic DNA amplification products at the lociRM527 and SSR140 for the Pi-2 gene and at the Sub1A203 locus for the Sub1A gene: 1–5, 9–13, analyzedhybrid plants of the BC2F3 generation; 6, Khan Dan, donor of the Sub1A gene; 7, Flagman, maternalform; 8, C101Lac-A-51, donor line of the Pi-2 gene.
The electrophoregram shows that when PCR with such a combination of molecular markers iscarried out, the target products specific for DNA markers of the desired genes are reliably amplified.Samples Number 3 and 12 have dominant alleles of the genes Pi-2 and Sub1A in a homozygousstate in their genotype; Samples 1, 4, 5, and 9 are homozygous for the Sub1A gene and have the Pi-2gene in the genotype in a heterozygous state; Sample 10 is a recessive homozygote for two targetgenes and was rejected. The size of the PCR product in varieties with the dominant allele of the Pi-2gene, which determines the resistance, is 233 bp. The size of the PCR product in varieties with thedominant allele of the Sub1A gene, which determines the resistance, is 118 bp. Clear identificationon the electrophoregram makes it possible to reliably identify the presence of dominant alleles of thetarget genes.
The introduction of such varieties into production will allow us to avoid epiphytic developmentof the disease, preserving the biological rice productivity, and obtaining environmentally friendlyagricultural products.
Magnat is the first cultivar in Russia created at the Agrarian Research Center Donskoy togetherwith the Federal Scientific Rice Centre by the method of marker selection from a hybrid population(C101A-51 × Boyarin) × (C101 LAC × Boyarin) with transfer of blast resistance genes. Sample C101LAC is a donor of the genes Pi-1 and Pi-33, and C101A-51 is a Pi-2. The growing season is 125 ± 1 daysand the plant height is 96 ± 2 cm. The panicle is erect and compact, 17.5 ± 0.5 cm long, and bears185 ± 5 spikelets. The grain is oval, 8.3 ± 0.2 mm long, 3.1 ± 0.1 mm wide, and 2.2 ± 0.1 mm thick andweighs 24.0 ± 2.0 mg. The yield of the Magnat variety was 8.25 t/ha, which is 1.1 t/ha higher than thatof the Boyarin standard.
The rice variety Pirouette was bred at the Agrarian Research Center Donskoy, together with theFederal Scientific Rice Centre, by the method of stepwise hybridization and marker breeding from ahybrid population (C101-A-51 (Pi-2) × Boyarin) × (C101-Lac (Pi-1 + 33) ×Virazh). It contains three blastresistance genes: Pi-1, Pi-2, and Pi-33. The variety is mid-ripening, the growing season from floodingto full ripeness is 124 ± 1 days. The average yield of the variety Pirouette was 9.57 t/ha, which is
53
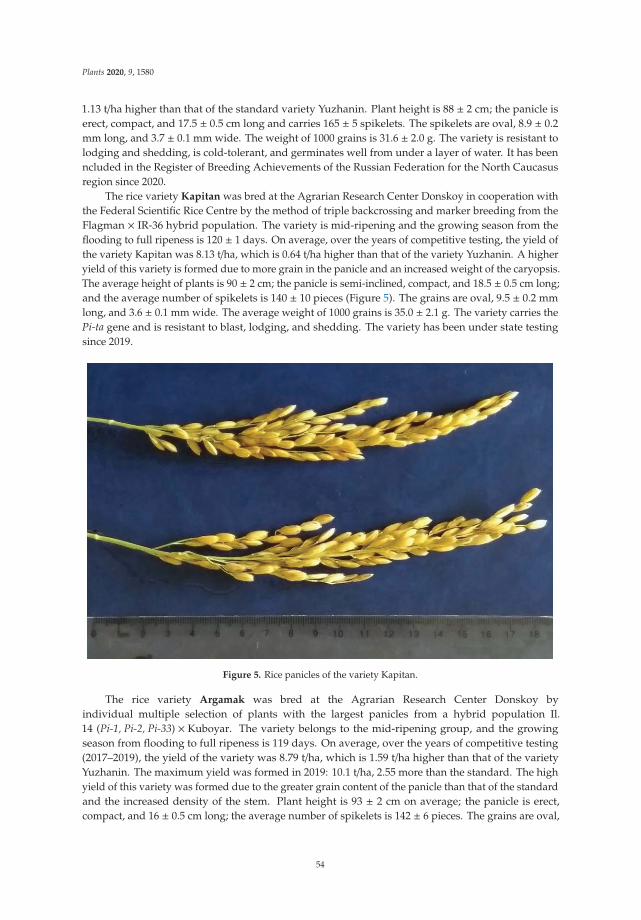
Plants 2020, 9, 1580
1.13 t/ha higher than that of the standard variety Yuzhanin. Plant height is 88 ± 2 cm; the panicle iserect, compact, and 17.5 ± 0.5 cm long and carries 165 ± 5 spikelets. The spikelets are oval, 8.9 ± 0.2mm long, and 3.7 ± 0.1 mm wide. The weight of 1000 grains is 31.6 ± 2.0 g. The variety is resistant tolodging and shedding, is cold-tolerant, and germinates well from under a layer of water. It has beenncluded in the Register of Breeding Achievements of the Russian Federation for the North Caucasusregion since 2020.
The rice variety Kapitan was bred at the Agrarian Research Center Donskoy in cooperation withthe Federal Scientific Rice Centre by the method of triple backcrossing and marker breeding from theFlagman × IR-36 hybrid population. The variety is mid-ripening and the growing season from theflooding to full ripeness is 120 ± 1 days. On average, over the years of competitive testing, the yield ofthe variety Kapitan was 8.13 t/ha, which is 0.64 t/ha higher than that of the variety Yuzhanin. A higheryield of this variety is formed due to more grain in the panicle and an increased weight of the caryopsis.The average height of plants is 90 ± 2 cm; the panicle is semi-inclined, compact, and 18.5 ± 0.5 cm long;and the average number of spikelets is 140 ± 10 pieces (Figure 5). The grains are oval, 9.5 ± 0.2 mmlong, and 3.6 ± 0.1 mm wide. The average weight of 1000 grains is 35.0 ± 2.1 g. The variety carries thePi-ta gene and is resistant to blast, lodging, and shedding. The variety has been under state testingsince 2019.
Figure 5. Rice panicles of the variety Kapitan.
The rice variety Argamak was bred at the Agrarian Research Center Donskoy byindividual multiple selection of plants with the largest panicles from a hybrid population Il.14 (Pi-1, Pi-2, Pi-33) × Kuboyar. The variety belongs to the mid-ripening group, and the growingseason from flooding to full ripeness is 119 days. On average, over the years of competitive testing(2017–2019), the yield of the variety was 8.79 t/ha, which is 1.59 t/ha higher than that of the varietyYuzhanin. The maximum yield was formed in 2019: 10.1 t/ha, 2.55 more than the standard. The highyield of this variety was formed due to the greater grain content of the panicle than that of the standardand the increased density of the stem. Plant height is 93 ± 2 cm on average; the panicle is erect,compact, and 16 ± 0.5 cm long; the average number of spikelets is 142 ± 6 pieces. The grains are oval,
54
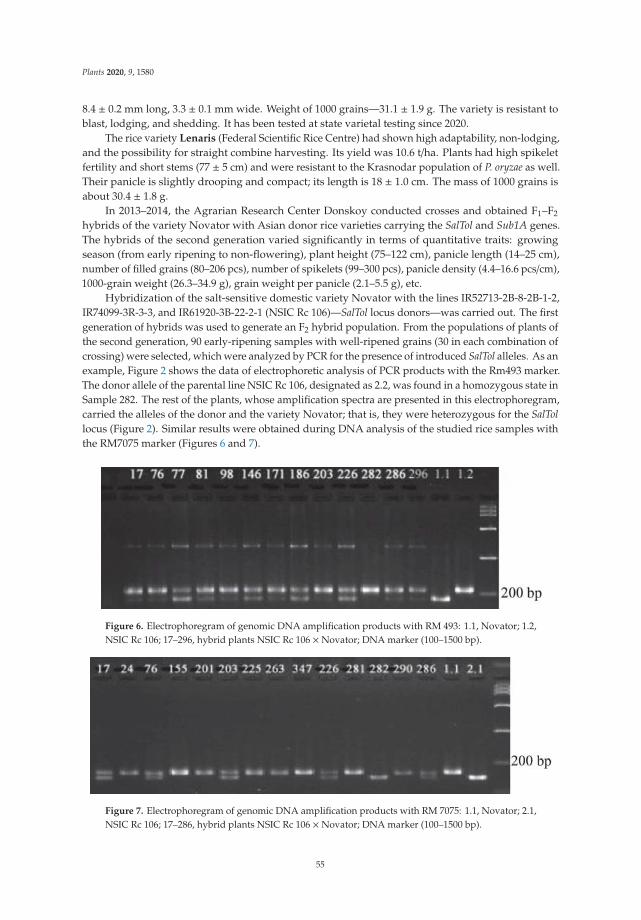
Plants 2020, 9, 1580
8.4 ± 0.2 mm long, 3.3 ± 0.1 mm wide. Weight of 1000 grains—31.1 ± 1.9 g. The variety is resistant toblast, lodging, and shedding. It has been tested at state varietal testing since 2020.
The rice variety Lenaris (Federal Scientific Rice Centre) had shown high adaptability, non-lodging,and the possibility for straight combine harvesting. Its yield was 10.6 t/ha. Plants had high spikeletfertility and short stems (77 ± 5 cm) and were resistant to the Krasnodar population of P. oryzae as well.Their panicle is slightly drooping and compact; its length is 18 ± 1.0 cm. The mass of 1000 grains isabout 30.4 ± 1.8 g.
In 2013–2014, the Agrarian Research Center Donskoy conducted crosses and obtained F1–F2
hybrids of the variety Novator with Asian donor rice varieties carrying the SalTol and Sub1A genes.The hybrids of the second generation varied significantly in terms of quantitative traits: growingseason (from early ripening to non-flowering), plant height (75–122 cm), panicle length (14–25 cm),number of filled grains (80–206 pcs), number of spikelets (99–300 pcs), panicle density (4.4–16.6 pcs/cm),1000-grain weight (26.3–34.9 g), grain weight per panicle (2.1–5.5 g), etc.
Hybridization of the salt-sensitive domestic variety Novator with the lines IR52713-2B-8-2B-1-2,IR74099-3R-3-3, and IR61920-3B-22-2-1 (NSIC Rc 106)—SalTol locus donors—was carried out. The firstgeneration of hybrids was used to generate an F2 hybrid population. From the populations of plants ofthe second generation, 90 early-ripening samples with well-ripened grains (30 in each combination ofcrossing) were selected, which were analyzed by PCR for the presence of introduced SalTol alleles. As anexample, Figure 2 shows the data of electrophoretic analysis of PCR products with the Rm493 marker.The donor allele of the parental line NSIC Rc 106, designated as 2.2, was found in a homozygous state inSample 282. The rest of the plants, whose amplification spectra are presented in this electrophoregram,carried the alleles of the donor and the variety Novator; that is, they were heterozygous for the SalTollocus (Figure 2). Similar results were obtained during DNA analysis of the studied rice samples withthe RM7075 marker (Figures 6 and 7).
Figure 6. Electrophoregram of genomic DNA amplification products with RM 493: 1.1, Novator; 1.2,NSIC Rc 106; 17–296, hybrid plants NSIC Rc 106 × Novator; DNA marker (100–1500 bp).
Figure 7. Electrophoregram of genomic DNA amplification products with RM 7075: 1.1, Novator; 2.1,NSIC Rc 106; 17–286, hybrid plants NSIC Rc 106 × Novator; DNA marker (100–1500 bp).
55
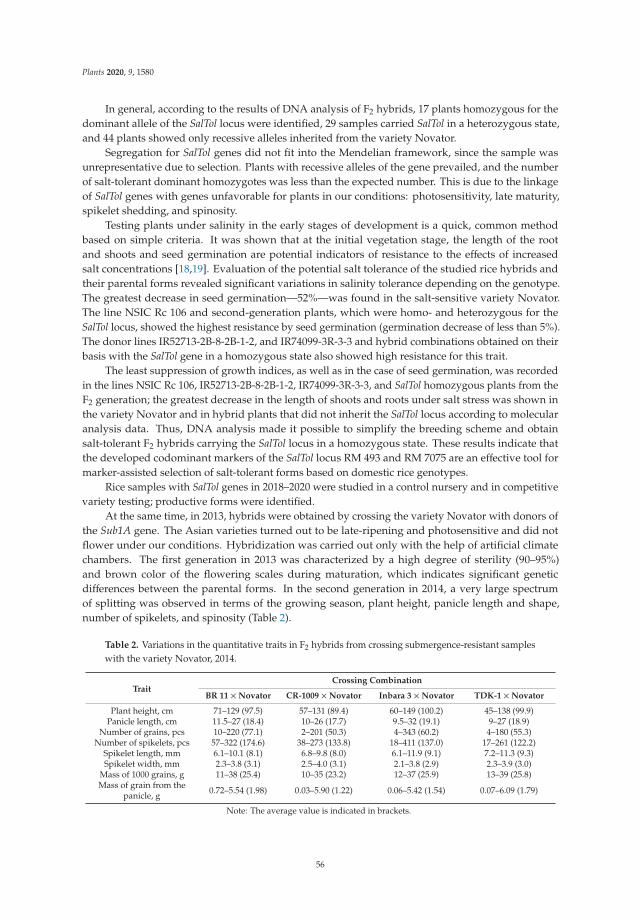
Plants 2020, 9, 1580
In general, according to the results of DNA analysis of F2 hybrids, 17 plants homozygous for thedominant allele of the SalTol locus were identified, 29 samples carried SalTol in a heterozygous state,and 44 plants showed only recessive alleles inherited from the variety Novator.
Segregation for SalTol genes did not fit into the Mendelian framework, since the sample wasunrepresentative due to selection. Plants with recessive alleles of the gene prevailed, and the numberof salt-tolerant dominant homozygotes was less than the expected number. This is due to the linkageof SalTol genes with genes unfavorable for plants in our conditions: photosensitivity, late maturity,spikelet shedding, and spinosity.
Testing plants under salinity in the early stages of development is a quick, common methodbased on simple criteria. It was shown that at the initial vegetation stage, the length of the rootand shoots and seed germination are potential indicators of resistance to the effects of increasedsalt concentrations [18,19]. Evaluation of the potential salt tolerance of the studied rice hybrids andtheir parental forms revealed significant variations in salinity tolerance depending on the genotype.The greatest decrease in seed germination—52%—was found in the salt-sensitive variety Novator.The line NSIC Rc 106 and second-generation plants, which were homo- and heterozygous for theSalTol locus, showed the highest resistance by seed germination (germination decrease of less than 5%).The donor lines IR52713-2B-8-2B-1-2, and IR74099-3R-3-3 and hybrid combinations obtained on theirbasis with the SalTol gene in a homozygous state also showed high resistance for this trait.
The least suppression of growth indices, as well as in the case of seed germination, was recordedin the lines NSIC Rc 106, IR52713-2B-8-2B-1-2, IR74099-3R-3-3, and SalTol homozygous plants from theF2 generation; the greatest decrease in the length of shoots and roots under salt stress was shown inthe variety Novator and in hybrid plants that did not inherit the SalTol locus according to molecularanalysis data. Thus, DNA analysis made it possible to simplify the breeding scheme and obtainsalt-tolerant F2 hybrids carrying the SalTol locus in a homozygous state. These results indicate thatthe developed codominant markers of the SalTol locus RM 493 and RM 7075 are an effective tool formarker-assisted selection of salt-tolerant forms based on domestic rice genotypes.
Rice samples with SalTol genes in 2018–2020 were studied in a control nursery and in competitivevariety testing; productive forms were identified.
At the same time, in 2013, hybrids were obtained by crossing the variety Novator with donors ofthe Sub1A gene. The Asian varieties turned out to be late-ripening and photosensitive and did notflower under our conditions. Hybridization was carried out only with the help of artificial climatechambers. The first generation in 2013 was characterized by a high degree of sterility (90–95%)and brown color of the flowering scales during maturation, which indicates significant geneticdifferences between the parental forms. In the second generation in 2014, a very large spectrumof splitting was observed in terms of the growing season, plant height, panicle length and shape,number of spikelets, and spinosity (Table 2).
Table 2. Variations in the quantitative traits in F2 hybrids from crossing submergence-resistant sampleswith the variety Novator, 2014.
TraitCrossing Combination
BR 11 ×Novator CR-1009 ×Novator Inbara 3 ×Novator TDK-1 ×Novator
Plant height, cm 71–129 (97.5) 57–131 (89.4) 60–149 (100.2) 45–138 (99.9)Panicle length, cm 11.5–27 (18.4) 10–26 (17.7) 9.5–32 (19.1) 9–27 (18.9)
Number of grains, pcs 10–220 (77.1) 2–201 (50.3) 4–343 (60.2) 4–180 (55.3)Number of spikelets, pcs 57–322 (174.6) 38–273 (133.8) 18–411 (137.0) 17–261 (122.2)
Spikelet length, mm 6.1–10.1 (8.1) 6.8–9.8 (8.0) 6.1–11.9 (9.1) 7.2–11.3 (9.3)Spikelet width, mm 2.3–3.8 (3.1) 2.5–4.0 (3.1) 2.1–3.8 (2.9) 2.3–3.9 (3.0)
Mass of 1000 grains, g 11–38 (25.4) 10–35 (23.2) 12–37 (25.9) 13–39 (25.8)Mass of grain from the
panicle, g 0.72–5.54 (1.98) 0.03–5.90 (1.22) 0.06–5.42 (1.54) 0.07–6.09 (1.79)
Note: The average value is indicated in brackets.
56
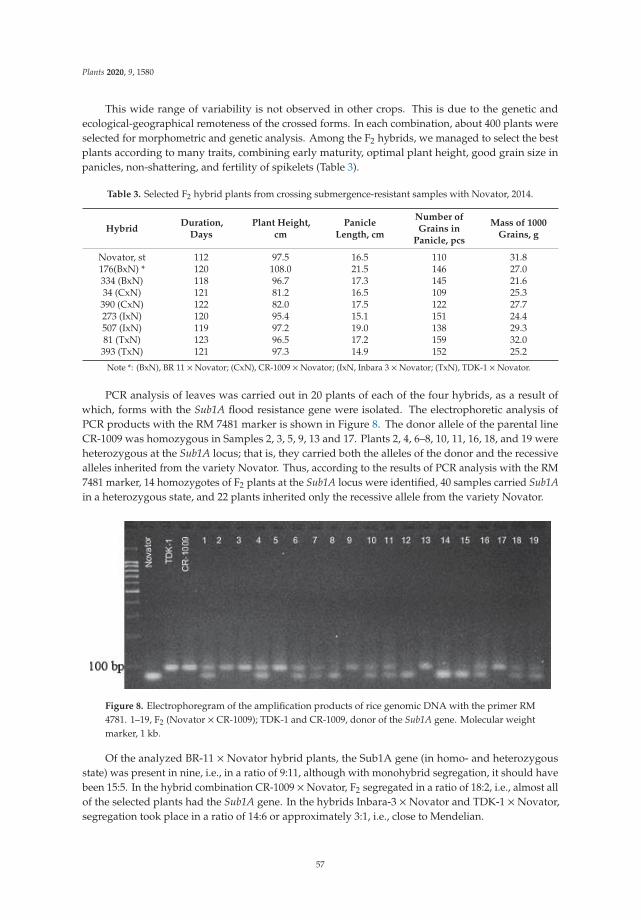
Plants 2020, 9, 1580
This wide range of variability is not observed in other crops. This is due to the genetic andecological-geographical remoteness of the crossed forms. In each combination, about 400 plants wereselected for morphometric and genetic analysis. Among the F2 hybrids, we managed to select the bestplants according to many traits, combining early maturity, optimal plant height, good grain size inpanicles, non-shattering, and fertility of spikelets (Table 3).
Table 3. Selected F2 hybrid plants from crossing submergence-resistant samples with Novator, 2014.
HybridDuration,
DaysPlant Height,
cmPanicle
Length, cm
Number ofGrains in
Panicle, pcs
Mass of 1000Grains, g
Novator, st 112 97.5 16.5 110 31.8176(BxN) * 120 108.0 21.5 146 27.0334 (BxN) 118 96.7 17.3 145 21.634 (CxN) 121 81.2 16.5 109 25.3390 (CxN) 122 82.0 17.5 122 27.7273 (IxN) 120 95.4 15.1 151 24.4507 (IxN) 119 97.2 19.0 138 29.381 (TxN) 123 96.5 17.2 159 32.0393 (TxN) 121 97.3 14.9 152 25.2
Note *: (BxN), BR 11 × Novator; (CxN), CR-1009 × Novator; (IxN, Inbara 3 × Novator; (TxN), TDK-1 × Novator.
PCR analysis of leaves was carried out in 20 plants of each of the four hybrids, as a result ofwhich, forms with the Sub1A flood resistance gene were isolated. The electrophoretic analysis ofPCR products with the RM 7481 marker is shown in Figure 8. The donor allele of the parental lineCR-1009 was homozygous in Samples 2, 3, 5, 9, 13 and 17. Plants 2, 4, 6–8, 10, 11, 16, 18, and 19 wereheterozygous at the Sub1A locus; that is, they carried both the alleles of the donor and the recessivealleles inherited from the variety Novator. Thus, according to the results of PCR analysis with the RM7481 marker, 14 homozygotes of F2 plants at the Sub1A locus were identified, 40 samples carried Sub1Ain a heterozygous state, and 22 plants inherited only the recessive allele from the variety Novator.
Figure 8. Electrophoregram of the amplification products of rice genomic DNA with the primer RM4781. 1–19, F2 (Novator × CR-1009); TDK-1 and CR-1009, donor of the Sub1A gene. Molecular weightmarker, 1 kb.
Of the analyzed BR-11 × Novator hybrid plants, the Sub1A gene (in homo- and heterozygousstate) was present in nine, i.e., in a ratio of 9:11, although with monohybrid segregation, it should havebeen 15:5. In the hybrid combination CR-1009 ×Novator, F2 segregated in a ratio of 18:2, i.e., almost allof the selected plants had the Sub1A gene. In the hybrids Inbara-3 ×Novator and TDK-1 ×Novator,segregation took place in a ratio of 14:6 or approximately 3:1, i.e., close to Mendelian.
57
Plants 2020, 9, 1580
The deviations in segregation of the two combinations can be explained by the influence ofselection and gene linkage. A total of 55 plants with the target gene in the homo- and heterozygousstate were isolated from 80 plants of four hybrids. The selected samples with the Sub1A gene in2015 were reproduced in the Federal State Unitary Enterprise “Proletarskoye”of the Rostov Region,where the best F3 plants were selected from them for DNA analysis.
In F3 plants, significant morphological and biological segregation continued. Significant variationwas noted for the growing season, plant height, size of panicles and caryopses, fertility, grain shedding,etc. The best forms were selected from them and leaves were taken for DNA analysis. At the next stageof work, in 2016–2020, constant lines carrying the Sub1A gene in a homozygous state were selected andtested for yield and resistance to prolonged water flooding. As a result, rice varieties for herbicide-freetechnologies will be developed, vigorously overcoming a deep layer of water in the germination phasewith minimal seed loss.
4. Conclusions
1. As a result of the studies carried out using molecular marking based on PCR in combinationwith traditional breeding, early-maturing rice lines with genes for resistance to salinization (SalTol)and to flooding (Sub1A), which are suitable for cultivation in the south of Russia, were isolated.
2. Rice lines have been developed, the genotype of which contains five effective blast resistancegenes (Pi-1, Pi-2, Pi-33, Pi-ta, and Pi-b). The introduction of such varieties into production will allow usto avoid epiphytotic development of the disease, preserving the biological productivity of rice andobtaining environmentally friendly agricultural products.
3. Samples of the F4 and BC2F3 generations were obtained with combined blast resistance (Pi)and prolonged flooding tolerance (Sub1A) genes as a factor in the control of weeds in the homo- andheterozygous state, which was confirmed by the data of their DNA analysis. The testing of the obtainedrice breeding resources for submergence tolerance under laboratory conditions made it possible toselect tolerant rice forms that will be studied in the breeding process for a complex of agronomicallyvaluable traits. Their use will reduce the use of chemical plant protection products against diseasesand weeds, thereby increasing the ecological status of the rice-growing industry.
The research was carried out with the financial support of the Kuban Science Foundation in theframework of the scientific project№ 20.1/1.
Author Contributions: Conceptualization, P.K.; methodology, E.D. and K.A.; validation, P.K.; formal analysis,E.D.; investigation, E.D., P.K., M.R., S.L. and E.K.; resources, E.D.; writing—original draft preparation, E.D., P.K.and K.A.; project administration, E.D.; funding acquisition, E.D. All authors have read and agreed to the publishedversion of the manuscript.
Funding: This research was funded by Federal Scientific Rice Centre.
Conflicts of Interest: The authors declare no conflict of interest.
References
1. Kumar, V.; Bhagwat, S.G. Microsatellite (SSR) Based Assessment of Genetic Diversity among the Semi-dwarfMutants of Elite Rice Variety WL112. Int. J. Plant Breed. Genet. 2012, 6, 195–205. [CrossRef]
2. Singh, S.; Mackill, D.; Ismail, A. Responses of Sub1 rice introgression lines to submergence in the field:Yield and grain quality. Field Crops Res. 2009, 113, 23. [CrossRef]
3. Negrao, S.; Courtois, B.; Ahmadi, N.; Abreu, I.; Saibo, N.; Oliveira, M.M. Recent updates on salinity stress inrice: From physiological to molecular responses. Crit. Rev. Plant Sci. 2011, 30, 329–377. [CrossRef]
4. Food and Agriculture Organization. Report of Salt Affected Agriculture. Available online: http://www.fao.org/ag/agl/agll/spush (accessed on 16 October 2010).
5. Ladatko, N.A. The growth of rice plants under conditions of chloride salinity. Rice Breed. 2006, 9, 37–41.6. Mekawy, A.M.; Assaha, D.V.; Yahagi, H.; Tada, Y.; Ueda, A.; Saneoka, H. Growth, physiological adaptation,
and gene expression analysis of two Egyptian rice cultivars under salt stress. Plant Physiol. Biochem. 2011,187, 17–25. [CrossRef] [PubMed]
58
Plants 2020, 9, 1580
7. Ren, Z.H.; Gao, J.P.; Li, L.G.; Cai, X.L.; Huang, W.; Chao, D.Y.; Zhu, M.Z.; Wang, Z.Y.; Luan, S.; Lin, H.X. A ricequantitative trait locus for salt tolerance encodes a so-dium transporter. Nat. Genet. 2005, 37, 1141–1146.[CrossRef] [PubMed]
8. Takehisa, H.; Shimodate, T.; Fukuta, Y.; Ueda, T.; Yano, M.; Yamaya, T.; Kameya, T.; Sato, T. Identification ofquantitative trait loci for plant growth of rice in paddy field flooded with salt water. Field Crops Res. 2004, 89,85–95. [CrossRef]
9. Platten, J.D.; Egdane, J.A.; Ismail, A.M. Salinity tolerance, Na+ exclusion and allele mining of HKT1; 5 inOryza sativa and O. glaberrima: Many sources, many genes, one mechanism? BMC Plant Biol. 2013, 13, 2–16.[CrossRef] [PubMed]
10. Xu, K.; Mackill, D.J. A major locus for submergence tolerance mapped on rice chromosome 9. Mol. Breed.1996, 2, 219–224. [CrossRef]
11. Xu, K.; Xu, X.; Fukao, T.; Canlas, P.; Maghirang-Rodriguez, R.; Heuer, S.; Ismail, A.M.; Bailey-Serres, J.;Ronald, P.C.; Mackill, D.J. Sub1A is an ethylene-response-factor like gene that confers submergence toleranceto rice. Nature 2006, 442, 705–708. [CrossRef] [PubMed]
12. Kovalenko, E.D.; Gorbunov, Y.B.; Kovalyova, A.A.; Dudenko, V.P.; Kolomiec, T.M. Guidelines for Assessing theResistance of Rice Varieties to the Blast Causative Agent; VASKHNIL: Moscow, Russia, 1988; 30p.
13. Choi, H.C.; Kim, Y.G.; Hong, H.C.; Hwang, H.G.; Ahn, S.N.; Han, S.S.; Ryu, J.D.; Moon, H.P. Developmentof blast-resistant rice multi-line cultivars and their stability to blast resistance and yield performance.Korean J. Breed. 2006, 38, 83–89.
14. Mukhina, Z.M. Using DNA Markers to Study the Genetic Diversity of Plant Resources: Monographic;Education-South: Krasnodar, Russian, 2008; p. 84.
15. Singh, D.; Kumar, A.; Kumar, A.S.; Chauhan, P.; Kumar, V.; Kumar, N.; Singh, A.; Mahajan, N.; Sirohi, P.;Chand, S.; et al. Marker assisted selection and crop management for salt tolerance: A review. Afr. J. Biotechnol.2011, 10, 14694–14698. [CrossRef]
16. Sabouri, H.; Rezai, A.M.; Moumeni, A.; Kavousi, A.; Katouzi, M.; Sabouri, A. QTLs mapping of physiologicaltraits related to salt tolerance in young rice seedlings. Biol. Plant 2009, 53, 657–662. [CrossRef]
17. Kostylev, P.I.; Redkin, A.A.; Krasnova, E.V.; Dubina, E.V.; Ilnitskaya, E.T.; Yesaulova, L.V.; Mukhina, Z.M.;Kharitonov, E.M. Creating rice varieties, resistant to pirikulariosis by means of DNA markers. Vestn. Russ.Acad. Agric. Sci. 2014, 1, 26–28.
18. Linh, L.H.; Xuan, T.D.; Ham, L.H.; Ismail, A.M.; Khanh, T.D. Molecular Breeding to Improve Salt Tolerance ofRice (Oryza sativa L.) in the Red River Delta of Vietnam. Int. J. Plant Genom. 2012, 2012. [CrossRef] [PubMed]
19. Fukuta, Y.; Xu, D.; Kobayashi, N. Genetic characterization of universal differential varieties for blast resistancedeveloped under the IRRI-Japan Collaborative Reseaarch Project using DNA markers in rice (Oryza sativa L.).JIRCAS Work. Rep. 2009, 63, 35–68.
20. Kostylev, P.I. Methods of Breeding, Seed Farming Techniques and High-Quality Rice: Monographic; Rostov-on-Don:Zernograd, Russia, 2011; 267p.
21. Dubina, E.; Kostylev, P.; Garkusha, S.; Ruban, M.; Pischenko, D. Marker assisted rice breeding for resistanceto biotic and abiotic stressors. In Proceedings of the BIO Web of Conference, XI International Scientific andPractical Conference “Biological Plant Protection is the Basis of Agroecosystems Stabilization”, Krasnodar,Russia, 21–24 September 2020. [CrossRef]
22. Dubina, E.; Mukhina, Z.; Kharitonov, E.; Shilovskiy, V.; Kharchenko, E.; Esaulova, L.; Korkina, N.;Maximenko, E.; Nikitina, I. Creation of blast disease-resistant rice varieties with modern DNA-markers.Russ. J. Gen. 2015, 8, 752–756. [CrossRef]
Publisher’s Note: MDPI stays neutral with regard to jurisdictional claims in published maps and institutionalaffiliations.
© 2020 by the authors. Licensee MDPI, Basel, Switzerland. This article is an open accessarticle distributed under the terms and conditions of the Creative Commons Attribution(CC BY) license (http://creativecommons.org/licenses/by/4.0/).
59

plants
Article
Nanopore RNA Sequencing Revealed LongNon-Coding and LTR Retrotransposon-Related RNAsExpressed at Early Stages of TriticaleSEED Development
Ilya Kirov 1,2,*, Maxim Dudnikov 1,2, Pavel Merkulov 1, Andrey Shingaliev 1, Murad Omarov 1,3,
Elizaveta Kolganova 1, Alexandra Sigaeva 1, Gennady Karlov 1 and Alexander Soloviev 1
1 Laboratory of Marker-Assisted and Genomic Selection of Plants, All-Russia Research Institute ofAgricultural Biotechnology, Timiryazevskaya str. 42, 127550 Moscow, Russia;[email protected] (M.D.); [email protected] (P.M.); [email protected] (A.S.);[email protected] (M.O.); [email protected] (E.K.); [email protected] (A.S.);[email protected] (G.K.); [email protected] (A.S.)
2 Kurchatov Genomics Center of ARRIAB, All-Russia Research Institute of Agricultural Biotechnology,Timiryazevskaya Street, 42, 127550 Moscow, Russia
3 Faculty of Computer Science, National Research University Higher School of Economics, Pokrovsky Boulvar,11, 109028 Moscow, Russia
* Correspondence: [email protected]
Received: 24 November 2020; Accepted: 15 December 2020; Published: 17 December 2020
Abstract: The intergenic space of plant genomes encodes many functionally important yet unexploredRNAs. The genomic loci encoding these RNAs are often considered “junk”, DNA as they are frequentlyassociated with repeat-rich regions of the genome. The latter makes the annotations of these loci andthe assembly of the corresponding transcripts using short RNAseq reads particularly challenging.Here, using long-read Nanopore direct RNA sequencing, we aimed to identify these “junk” RNAmolecules, including long non-coding RNAs (lncRNAs) and transposon-derived transcripts expressedduring early stages (10 days post anthesis) of seed development of triticale (AABBRR, 2n = 6x = 42),an interspecific hybrid between wheat and rye. Altogether, we found 796 lncRNAs and 20 LTRretrotransposon-related transcripts (RTE-RNAs) expressed at this stage, with most of them beingpreviously unannotated and located in the intergenic as well as intronic regions. Sequence analysis ofthe lncRNAs provide evidence for the frequent exonization of Class I (retrotransposons) and classII (DNA transposons) transposon sequences and suggest direct influence of “junk” DNA on thestructure and origin of lncRNAs. We show that the expression patterns of lncRNAs and RTE-relatedtranscripts have high stage specificity. In turn, almost half of the lncRNAs located in Genomes A andB have the highest expression levels at 10–30 days post anthesis in wheat. Detailed analysis of theprotein-coding potential of the RTE-RNAs showed that 75% of them carry open reading frames (ORFs)for a diverse set of GAG proteins, the main component of virus-like particles of LTR retrotransposons.We further experimentally demonstrated that some RTE-RNAs originate from autonomous LTRretrotransposons with ongoing transposition activity during early stages of triticale seed development.Overall, our results provide a framework for further exploration of the newly discovered lncRNAsand RTE-RNAs in functional and genome-wide association studies in triticale and wheat. Our studyalso demonstrates that Nanopore direct RNA sequencing is an indispensable tool for the elucidationof lncRNA and retrotransposon transcripts.
Plants 2020, 9, 1794; doi:10.3390/plants9121794 www.mdpi.com/journal/plants61
Plants 2020, 9, 1794
Keywords: long non-coding RNAs; seed development; Nanopore sequencing; retrotransposons;triticale
1. Introduction
Long non-coding RNAs (lncRNAs) are a diverse set of RNAs longer than 200 bp with no or verylittle coding potential. Traditionally, lncRNAs are considered to be protein non-coding, althoughmany of them carry small open reading frames and encode functional peptides in different plants [1].A broad range of functionality has been described for lncRNAs in plants, including the miRNA sponge,protein scaffolding, and post-transcriptional regulation of target genes via antisense pairing followedby mRNA decoy [2]. Based on their genomic localization regarding other genes, lncRNAs are broadlygrouped into different classes: (1) lincRNAs or long non-coding intergenic RNAs; (2) NAT lncRNAs ornatural anti-sense lncRNAs; (3) intronic lncRNAs, located in the introns; and (4) sense lncRNAs [3].LncRNAs have been identified in many plant species and their expression in response to variousabiotic and biotic stresses has been investigated, although our knowledge about lncRNA functions isstill very limited [4–9]. However, the catalogue of lncRNAs for some plants with complex polyploidyand repeat-rich genomes, including wheat (Triticum aestivum L.), remains mainly underexplored [10].
Intergenic space and introns are frequently sources of lncRNA origin, although these genomicregions are enriched by insertions or remnants of transposable elements (TEs) [11]. Corroborating this,lncRNA sequences are more often associated with TEs than protein-coding genes and the bulk of thempossess TE-related sequences [11–16]. For example, up to 75% of human lncRNAs have at least one exonwith sequences originating from TEs [12,17]. A similar trend was demonstrated in some plant species,including maize, where 65% of lncRNAs had similarities to TEs [18]. More intriguingly, the TE-derivedsequences may trigger the origin of new lncRNAs, providing a positive feedback loop with theevolution of lncRNAs [11,19]. TE-derived lncRNAs can have important and conserved biologicalfunctions [20]. For example, the rice lncRNA MIKKI is derived from LTR retrotransposons and has beenshown to sequestrate miR171 and prevent degradation of its targets, mRNAs of SCARECROW-Like(SCL) transcription factors, in roots [20]. It is important to note that TEs can become transcriptionallyand transpositionally active under certain circumstances, including stressful conditions, and in somedevelopmental stages (e.g., microsporogenesis) and tissues (e.g., developing endosperm) [21–23].However, individual TE transcripts and their coding potential have only been studied episodicallyin plants. The association of lncRNAs with repeat sequences like TEs makes the annotation of manylncRNAs challenging because of the ambiguity in the mapping of repeat-derived short RNAseqreads. RNAseq reads with multiple mapping positions in the genome sequence are frequentlydiscarded from further analysis. Although some tools have been developed so far to overcome theseobstacles, most of the lncRNA identification pipelines still ignore ambiguously mapped reads [24,25].Thus, long-read sequencing technologies provide a great opportunity for transcriptome exploration,including the identification of transcribed repeats (e.g., transposable elements) or repeat-relatedtranscripts [26]. Moreover, Panda and Slotkin [26] showed that by using Nanopore long cDNAreads, it is even possible to trace the expression of individual TEs from multicopy families inArabidopsis and maize. The application of long-read technologies to the exploration of the lncRNArepertoire in plants has been demonstrated for several plant species, including Oryza sativa L. ssp.japonica [27], Populus simonii [28], P. qiongdaoensis [29], poplar “Nanlin 895” [30], Trifolium pratense [31],Cardamine violifolia [32], and Vigna angularis [33]. These studies demonstrated that long-read sequencingcan be used to obtain a comprehensive catalogue of lncRNAs.
Grain development is one of the most important and practically relevant biological processes.It involves massive biochemical, physiological, and transcriptomic changes [34–36]. Wheat graindevelopment is divided into five stages: (i) undifferentiated embryo and cellularization of theendosperm (0–7 days post anthesis (dpa)); (ii) embryo differentiation the embryo with formation of
62
Plants 2020, 9, 1794
the main cell types (transfer cells, aleurone, starchy endosperm and the surrounding cells) (7–14 dpa);(iii) root and leaf primordia differentiation, full kernel development and the milk-ripe stage (14–21 dpa);(iv) further growth and differentiation of primary and lateral roots, and the dough stage of endosperm(21–31 dpa); (v) fully differentiated embryo (31–50 dpa) [34]. Studies of the transcriptome duringwheat seed development have been extensively elucidated using RNAseq sequencing [35,37–43].Global transcriptome analysis of developing seeds has shown that the expression of protein-coding genesis highly dynamic. Recently, Madhavan et al. (2020) used publicly available Illumina RNAseq readsand identified 443 lncRNAs expressed during the grain filling stage (14 and 30 dpa) [44]. It is currentlyunknown which types of lncRNA are expressed during other stages of wheat seed development.
Here, we used Nanopore long-read sequencing to discover lncRNAs, TE transcripts, and TE-relatedlncRNAs that are specifically expressed during the cell proliferation stage of seed development (10 dpa)in triticale (× Triticosecale Wittmack, AABBRR genome, 2n = 6x = 42) an interspecific hybrid betweenwheat and rye (Secale cereale L.). We identified 796 lncRNAs and 20 LTR retrotransposon-derivedtranscripts, with most of them being previously unannotated. The majority of the detectedretrotransposon RNAs had a single intron, carried open reading frames (ORFs) encoding for adiverged set of GAG proteins, and were encoded by potentially autonomous and non-autonomousretrotransposons. The lncRNAs were also expressed during wheat seed development and had highstage specificity. Moreover, we found that lncRNA loci were biased toward frequent TE sequenceexonization and were mainly located in the intergenic regions of A and B genomes of triticale. Our workexplored the lncRNA landscape during the early stage of wheat and triticale seed development andprovides a unique dataset for further functional studies of lncRNA and TEs, and their implicationsfor seed development. Finally, the identified lncRNAs can be further incorporated into genome-wideassociation studies for marker-assisted improvement of the bread quality of modern triticale genotypes.
2. Material and Methods
2.1. Plant Material and DNA Isolation
For this study, the spring triticale line “L8665” obtained from the Department of Genetics, RussianState Agrarian University, was used. For DNA isolation, seeds of this line were germinated in the dark(room temperature) during 5–7 days and genomic DNA was isolated by the cetyltrimethylammoniumbromide (CTAB) protocol [45].
2.2. Sample Collection and RNA Isolation
Plants of the spring triticale line “L8665” were grown in a greenhouse under natural lightconditions. Developing seeds at 10 days post anthesis and flag leaves were dissected and placedinto liquid nitrogen. RNA was isolated by the ExtractRNA kit (Evrogen, Moscow, Russia) followingthe manufacturer’s instructions. The RNA concentration and integrity were estimated by Nanodrop(Nanodrop Technologies, Wilmington, CA, USA) and gel electrophoresis using an 1.2% agarose gelwith ethidium bromide staining.
2.3. RT-PCR
For RT-PCR, RNA was treated by DNAse I (Qiagen, Hilden, Germany, Q-79254) following themanufacturer’s instruction and used for cDNA synthesis. cDNA was synthesized using the MMLV RTkit (Evrogen, Moscow, Russia). Primers used for RT-PCR and the expected fragment lengths are listedin Table 1. The CDC (Cell division control protein, AAA-superfamily of ATPases; Ta54227) gene wasused as a reference because of its high expression stability as shown by a previous study [46].
63
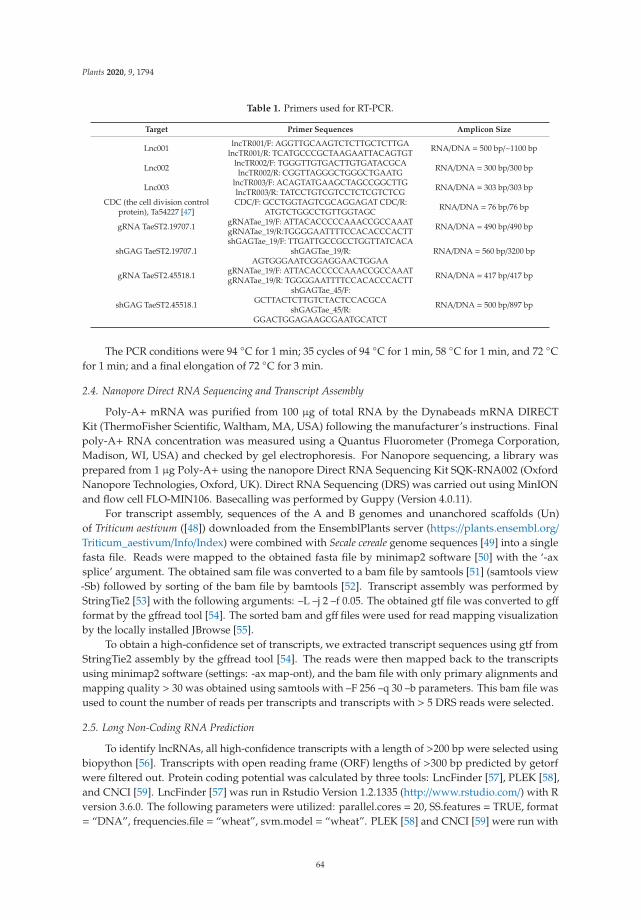
Plants 2020, 9, 1794
Table 1. Primers used for RT-PCR.
Target Primer Sequences Amplicon Size
Lnc001 lncTR001/F: AGGTTGCAAGTCTCTTGCTCTTGAlncTR001/R: TCATGCCCGCTAAGAATTACAGTGT RNA/DNA = 500 bp/~1100 bp
Lnc002 lncTR002/F: TGGGTTGTGACTTGTGATACGCAlncTR002/R: CGGTTAGGGCTGGGCTGAATG RNA/DNA = 300 bp/300 bp
Lnc003 lncTR003/F: ACAGTATGAAGCTAGCCGGCTTGlncTR003/R: TATCCTGTCGTCCTCTCGTCTCG RNA/DNA = 303 bp/303 bp
CDC (the cell division controlprotein), Ta54227 [47]
CDC/F: GCCTGGTAGTCGCAGGAGAT CDC/R:ATGTCTGGCCTGTTGGTAGC RNA/DNA = 76 bp/76 bp
gRNA TaeST2.19707.1 gRNATae_19/F: ATTACACCCCCAAACCGCCAAATgRNATae_19/R:TGGGGAATTTTCCACACCCACTT RNA/DNA = 490 bp/490 bp
shGAG TaeST2.19707.1shGAGTae_19/F: TTGATTGCCGCCTGGTTATCACA
shGAGTae_19/R:AGTGGGAATCGGAGGAACTGGAA
RNA/DNA = 560 bp/3200 bp
gRNA TaeST2.45518.1 gRNATae_19/F: ATTACACCCCCAAACCGCCAAATgRNATae_19/R: TGGGGAATTTTCCACACCCACTT RNA/DNA = 417 bp/417 bp
shGAG TaeST2.45518.1
shGAGTae_45/F:GCTTACTCTTGTCTACTCCACGCA
shGAGTae_45/R:GGACTGGAGAAGCGAATGCATCT
RNA/DNA = 500 bp/897 bp
The PCR conditions were 94 ◦C for 1 min; 35 cycles of 94 ◦C for 1 min, 58 ◦C for 1 min, and 72 ◦Cfor 1 min; and a final elongation of 72 ◦C for 3 min.
2.4. Nanopore Direct RNA Sequencing and Transcript Assembly
Poly-A+ mRNA was purified from 100 μg of total RNA by the Dynabeads mRNA DIRECTKit (ThermoFisher Scientific, Waltham, MA, USA) following the manufacturer’s instructions. Finalpoly-A+ RNA concentration was measured using a Quantus Fluorometer (Promega Corporation,Madison, WI, USA) and checked by gel electrophoresis. For Nanopore sequencing, a library wasprepared from 1 μg Poly-A+ using the nanopore Direct RNA Sequencing Kit SQK-RNA002 (OxfordNanopore Technologies, Oxford, UK). Direct RNA Sequencing (DRS) was carried out using MinIONand flow cell FLO-MIN106. Basecalling was performed by Guppy (Version 4.0.11).
For transcript assembly, sequences of the A and B genomes and unanchored scaffolds (Un)of Triticum aestivum ([48]) downloaded from the EnsemblPlants server (https://plants.ensembl.org/Triticum_aestivum/Info/Index) were combined with Secale cereale genome sequences [49] into a singlefasta file. Reads were mapped to the obtained fasta file by minimap2 software [50] with the ‘-axsplice’ argument. The obtained sam file was converted to a bam file by samtools [51] (samtools view-Sb) followed by sorting of the bam file by bamtools [52]. Transcript assembly was performed byStringTie2 [53] with the following arguments: –L –j 2 –f 0.05. The obtained gtf file was converted to gffformat by the gffread tool [54]. The sorted bam and gff files were used for read mapping visualizationby the locally installed JBrowse [55].
To obtain a high-confidence set of transcripts, we extracted transcript sequences using gtf fromStringTie2 assembly by the gffread tool [54]. The reads were then mapped back to the transcriptsusing minimap2 software (settings: -ax map-ont), and the bam file with only primary alignments andmapping quality > 30 was obtained using samtools with –F 256 –q 30 –b parameters. This bam file wasused to count the number of reads per transcripts and transcripts with > 5 DRS reads were selected.
2.5. Long Non-Coding RNA Prediction
To identify lncRNAs, all high-confidence transcripts with a length of >200 bp were selected usingbiopython [56]. Transcripts with open reading frame (ORF) lengths of >300 bp predicted by getorfwere filtered out. Protein coding potential was calculated by three tools: LncFinder [57], PLEK [58],and CNCI [59]. LncFinder [57] was run in Rstudio Version 1.2.1335 (http://www.rstudio.com/) with Rversion 3.6.0. The following parameters were utilized: parallel.cores = 20, SS.features = TRUE, format= “DNA”, frequencies.file = “wheat”, svm.model = “wheat”. PLEK [58] and CNCI [59] were run with
64
Plants 2020, 9, 1794
the default settings. Only transcripts identified by all three tools as non-coding and without similarityto Pfam domains were classified as lncRNAs.
To identify lncRNAs with exons overlapping the annotated TEs, we intersected CLARITE TEannotation (https://urgi.versailles.inra.fr/download/iwgsc/IWGSC_RefSeq_Annotations/v1.0/) with thegenomic coordinates of the assembled exons.
2.6. Retrotransposon-Related Transcript Annotation
LTR retrotransposons (RTEs) were predicted in the genome using LTRharvest 1.5.10 with thedefault parameters [60] and LTRdigest 1.5.10 [61] with the following parameters: -aaout yes -pptlen 1030 -pbsoffset 0 3 -pdomevalcutoff 0.001. Hidden markov model (HMM) profiles of RTE domains weredownloaded from the GyDB database [62]. The gff3 file from the LTRdigest analysis was treated by acustom Python script (https://github.com/Kirovez/LTR-RTE-analysis/blob/master/LtrDiParser_v2.2.py)to extract sequences of LTR retrotransposons possessing similarity to any RTE domains including GAG,reverse transcriptase, RNAse H, aspartic protease, and integrase. To identify retrotransposon-relatedtranscripts, the TEsorter tool (parameters: -eval 0.00001 -db gydb) was run with the set of allhigh-confidence transcripts. The transcripts with a similarity to RTE domains were manually checkedin the locally installed JBrowse [55]. TEsorter data were also used for RTE classification. We also ranTEsorter with confident transcripts and the RExDB [63] database (-db rexdb) to identify the transcriptsof Class II transposons but no transcripts were detected.
2.7. GAG Protein Analysis
To find GAG proteins, ORFs were predicted for RTE transcripts and Blastp with correspondingproteins was run followed. GAG proteins were aligned by MAFFT [64] with the standard parametersand a phylogenetic tree was constructed using iTOL [65]. The multiple alignment visualization wascarried out in Jalview version 2.11.1.3 [66]. RNA-binding motifs (CX2CX4HX4C, where X is any aminoacid) were identified by a custom Python script (https://github.com/Kirovez/LTR-RTE-analysis/blob/master/RBM_GAG_screen.py).
2.8. Gene Ontology Enrichment
Gene ontology (GO) enrichment analyses was performed using ShinyGO v0.61 [67] (http://bioinformatics.sdstate.edu/go/) with an false discovery rate (FDR) <0.01.
2.9. Expression Analysis
For RNA-Seq analysis of lncRNA and RTE transcript expression in different organs anddevelopment stages, publicly available data were used (Table 2). Reads were mapped on thede novo assembled transcriptome by Hisat2 [68] with the default options. The obtained files withalignments were used to calculate RPM (read per million reads) values for every transcript. For thispurpose, we used Salmon v0.8.1 [69] and the quant command with the default parameters.
Table 2. Publicly available RNAseq data used in this study.
SRA Accession Number of Reads Development Stage/Organs Reference
ERR392055 26,791,465 10 dpa/seed [39]ERR392076 29,714,230 20 dpa/seed [39]ERR392069 31,433,795 30 dpa/seed [39]
SRR10522394 39,611,224 Leaves [70]SRR1175868 64,825,850 Pistils [71]
65
Plants 2020, 9, 1794
2.10. Extrachromosomal Circular DNA Isolation
Extrachromosomal circular DNA (eccDNA) was isolated and amplified according to the protocolof Lanciano et al. [72] with several modifications. Briefly, 5 μg of genomic DNA was treated byPlasmid-Safe ATP-Dependent DNAse (Epicenter, Madison, WI, USA) for 48 h according to themanufacturer’s instructions. DNA precipitation was carried out by 0.1 volume 3 M sodium acetateand 2.5 volume absolute ethanol, followed by overnight incubation at −20 ◦C. After centrifugation,the eccDNA pellet was obtained and exposed to the rolling circle amplification (RCA) reaction by theIllustra TempliPhi 100 Amplification Kit (GE Healthcare, Chicago, IL, USA) for 65 h at 28 ◦C. Detectionof the eccDNA of LTR retrotransposon TaeST2.45518.1 (named ‘MIG’, location in wheat genome: 7B:312,336,869 . . . 312,341,902 (5 kb)) was performed by inverse PCR with specific primers: Forward:CACACCACTAGCAACCTCCA ; Reverse: TGCTTGTGACAAGATGGGCA. The PCR conditions were94 ◦C for 1 min; 35 cycles of 94 ◦C for 1 min, 58 ◦C for 1 min, 72 ◦C for 1 min; and final elongation at72 ◦C for 3 min.
2.11. Statistics and Visualization
Statistical analysis was done in Rstudio Version 1.2.1335 (http://www.rstudio.com/) with R version3.6.0. Bar plots, density plots, and box plots were drawn by ggplot2 [73]. Heatmaps were constructedby the ComplexHeatmap [74] R package.
3. Results
3.1. Direct Oxford Nanopore RNA Sequencing
Total RNA was isolated from whole spikes of hexaploid triticale (AABBRR) cv. L8665 at 10 dayspost anthesis (dpa). This RNA was used for direct RNA sequencing by MinION (Oxford Nanopore).In total, 1,100,000 direct RNA sequencing (DRS) reads with N50~1.1 kb were obtained (Figure 1).To assemble the transcripts, reads were mapped to the genome sequence created artificially bycombining the A and B genome sequences of the wheat chromosome-level assembly and rye draftgenome contigs. Overall, 82,785 transcripts from 74,904 loci were assembled with 47,378 and 26,169loci located in genomes A/B (AB lncRNAs) and R. A total of 36,490 transcripts had >5 mapped DRSreads, representing a set of transcripts with high confidence that was used for further analysis.
To estimate the triticale seed development phase used for Nanopore sequencing, we determinedthe expression values (reads per million mapped reads (RPM)) of the key genes involved in starchbiosynthesis (expression started at Phase 1), the genes of storage proteins (high molecular weightglutenins and gliadins), and those of the wbm protein (Table 3), which are expressed during the grainfilling stage. We identified the expression of starch biosynthesis genes, while no genes of storageproteins or the wbm protein were expressed. This suggests that the seeds used for Nanopore sequencingwere in the early stages of seed development (before 14 dpa).
Thus, using direct Nanopore RNA sequencing, we assembled a high-confidence transcriptome oftriticale seed at the early development stage and detected the expression of key genes known to beinvolved in the biological process (starch biosynthesis) occurring at this stage.
3.2. Long Non-Coding RNA Prediction
The assembled high-confidence set of transcripts was used for long non-coding RNA (lncRNA)prediction. The following criteria were applied to distinguish lncRNAs from protein-coding transcripts:(1) transcript length of >200 bp; (2) transcripts with an ORF length of <300 bp; (3) transcripts classifiedas non-coding by three tools including LncFinder [57], PLEK [58], and CNCI [59]; and (4) transcriptswith no similarity to any Pfam domains. Using these criteria, we identified 796 triticale lncRNAs(Supplementary Files S1 and S2) encoded by 780 loci in Genomes A (167 lncRNAs), B (212 lncRNAs),and R (410 lncRNAs) and in unanchored wheat scaffolds (seven lncRNAs) (Figure 1A). Most of thelncRNAs had lengths of <1000 bp (Figure 1B). LncRNAs (386 transcripts) encoded by the loci of
66
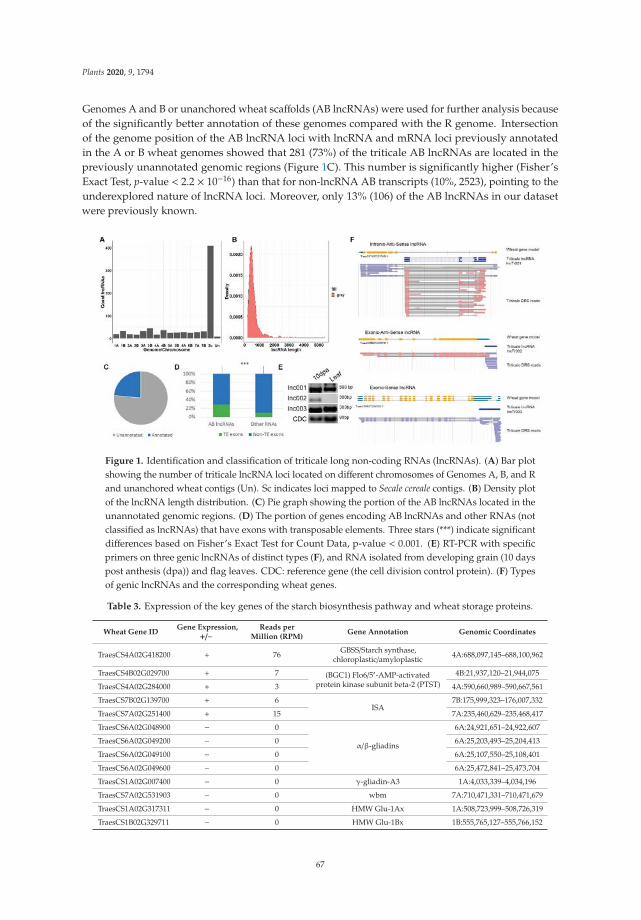
Plants 2020, 9, 1794
Genomes A and B or unanchored wheat scaffolds (AB lncRNAs) were used for further analysis becauseof the significantly better annotation of these genomes compared with the R genome. Intersectionof the genome position of the AB lncRNA loci with lncRNA and mRNA loci previously annotatedin the A or B wheat genomes showed that 281 (73%) of the triticale AB lncRNAs are located in thepreviously unannotated genomic regions (Figure 1C). This number is significantly higher (Fisher’sExact Test, p-value < 2.2 × 10⁻¹⁶) than that for non-lncRNA AB transcripts (10%, 2523), pointing to theunderexplored nature of lncRNA loci. Moreover, only 13% (106) of the AB lncRNAs in our datasetwere previously known.
Figure 1. Identification and classification of triticale long non-coding RNAs (lncRNAs). (A) Bar plotshowing the number of triticale lncRNA loci located on different chromosomes of Genomes A, B, and Rand unanchored wheat contigs (Un). Sc indicates loci mapped to Secale cereale contigs. (B) Density plotof the lncRNA length distribution. (C) Pie graph showing the portion of the AB lncRNAs located in theunannotated genomic regions. (D) The portion of genes encoding AB lncRNAs and other RNAs (notclassified as lncRNAs) that have exons with transposable elements. Three stars (***) indicate significantdifferences based on Fisher’s Exact Test for Count Data, p-value < 0.001. (E) RT-PCR with specificprimers on three genic lncRNAs of distinct types (F), and RNA isolated from developing grain (10 dayspost anthesis (dpa)) and flag leaves. CDC: reference gene (the cell division control protein). (F) Typesof genic lncRNAs and the corresponding wheat genes.
Table 3. Expression of the key genes of the starch biosynthesis pathway and wheat storage proteins.
Wheat Gene IDGene Expression,
+/−Reads per
Million (RPM)Gene Annotation Genomic Coordinates
TraesCS4A02G418200 + 76 GBSS/Starch synthase,chloroplastic/amyloplastic 4A:688,097,145–688,100,962
TraesCS4B02G029700 + 7 (BGC1) Flo6/5′-AMP-activatedprotein kinase subunit beta-2 (PTST)
4B:21,937,120–21,944,075
TraesCS4A02G284000 + 3 4A:590,660,989–590,667,561
TraesCS7B02G139700 + 6ISA
7B:175,999,323–176,007,332
TraesCS7A02G251400 + 15 7A:235,460,629–235,468,417
TraesCS6A02G048900 − 0
α/β-gliadins
6A:24,921,651–24,922,607
TraesCS6A02G049200 − 0 6A:25,203,493–25,204,413
TraesCS6A02G049100 − 0 6A:25,107,550–25,108,401
TraesCS6A02G049600 − 0 6A:25,472,841–25,473,704
TraesCS1A02G007400 − 0 γ-gliadin-A3 1A:4,033,339–4,034,196
TraesCS7A02G531903 − 0 wbm 7A:710,471,331–710,471,679
TraesCS1A02G317311 − 0 HMW Glu-1Ax 1A:508,723,999–508,726,319
TraesCS1B02G329711 − 0 HMW Glu-1Bx 1B:555,765,127–555,766,152
67
Plants 2020, 9, 1794
LncRNAs are frequently associated with transposons. We found that 111 (29%) AB lncRNAs hadexons that had transposon sequences with a length of >50 bp (Figure 1D). This was significantly morethan that expected by chance (10%, Fisher’s exact test, p-value< 2.2× 10⁻¹⁶). Of the TE-related lncRNAs,61, 47, and 3 lncRNAs had exons with similarity to Class I, Class II, and unclassified TEs, respectively.
The AB lncRNAs were classified regarding the position of the annotated wheat protein-codinggenes, resulting in 17 genic lncRNAs. Gene ontology analysis revealed that the genes overlappingwith genic lncRNAs were significantly enriched (FDR < 0.01) in several Gene Ontology categoriesincluding “vesicle-mediated transport”, “lipid modification”, “ATPase activity”, and “hydrolaseactivity”. The genic lncRNAs were of different types, with Intronic-antisense (two lncRNAs, Figure 1F(top)), exonic-anti-sense (five lncRNAs, Figure 1F (middle)), and exonic-sense (nine lncRNAs, Figure 1F(bottom)) transcripts being the most common types. In addition, exonic (sense and anti-sense) lncRNAswere found. The expression levels of three types of genic lncRNA (depicted in Figure 1F) belongedto the distinct types estimated in developing grain (10 dpa) and flag leaves (Figure 1E). The RT-PCRresults suggested that two lncRNAs (lnc001 and lnc003) were expressed in both samples, while theexpression of one type of lncRNA (lnc002) only occurred in developing grain (10 dpa).
Altogether, we identified hundreds of previously unknown genic and intergenic lncRNAsof triticale and showed that they frequently possess the remnants of Class I and Class IItransposable elements.
3.3. AB lncRNAs Are Prone to Tissue-Specific Expression
To find lncRNAs with possible specific roles during seed development, we used wheat RNAseqdata to estimate lncRNA expression in several seed developmental stages, leaf tissues, and pistilsof wheat.
A non-zero expression value in at least one condition was obtained for 351 AB lncRNAs. To estimateany biases in AB lncRNA expression compared with all high-confidence transcripts assembled fromDRS reads, we calculated the tissue-specificity index (TSI). The results showed that the TSI wassignificantly (according to the Wilcoxon rank sum test with continuity correction, p-value < 2.2 × 10⁻¹⁶)higher for lncRNAs, suggesting high tissue specificity of lncRNA expression (Figure 2A). We furtherfound that 46% of the lncRNAs had their highest level of expression at 10, 20 or 30 dpa, with 107lncRNAs having their maximum expression level at 10 dpa; this is in accordance with the type of ourtriticale sample (10 dpa) used for RNA isolation (Figure 2B). Moreover, we identified 95 AB lncRNAsfor which >90% of the sum of RPKM (reads per kilobases per million reads) values across all thesamples accounted for the 10, 20, and 30 DPA stages (Figure 2C).
Thus, the expression pattern of the identified lncRNAs was found to be tissue-specific, with almosthalf of the lncRNAs demonstrating the maximum expression level during seed development.
3.4. Retrotransposon-Related Transcripts Encoding GAG Proteins Are Expressed during Early SeedDevelopment in Triticale
Early embryonic and endosperm development may be accompanied by the activation oftransposable element (TE) activity [22]. Therefore, we analyzed the assembled transcripts for thepresence of open reading frames encoding TE-related proteins. We focused on the transcripts ofGenomes A/B because of the high quality of wheat genome assembly and annotation comparedwith the rye genome. No transcripts corresponding to DNA transposons were detected. However,we found 20 transcripts (RTE-RNAs) carrying a single ORF with similarities to distinct proteins ofLTR retrotransposons. Surprisingly, we found no transcripts encoding for the full set of RTE proteins(GAG and POL). To check whether any RTE-RNAs were encoded by LTR retrotransposons withdetectable LTR sequences (RTEs), we predicted RTEs in Genomes A and B. The results showed that 5and 10 RTE-RNAs (15) were transcribed from full-length (potentially autonomous) or non-complete(one or more RTE domains were not detected while both LTRs were present) RTEs, respectively.Thus, almost 25% of the RTE-RNAs were found to be transcribed from potentially autonomous RTEs.
68
Plants 2020, 9, 1794
For five RTE-RNAs, no associated RTEs were predicted, but 75% (15) of the RTE-RNAs were foundto carry an ORF encoding a single GAG protein (GAG-RNAs). Of those, eight (53%) and five (33%)GAG-RNAs were encoded by full-length (Figure 3A) and non-complete copies of LTR retrotransposons,respectively. For two (14%) GAG-RNAs, no corresponding RTEs were identified (Table 4). It shouldbe noted that four GAG-RNA genes were found to be located in the introns of three annotatedprotein-coding genes in the sense or anti-sense orientation, including TraesCS2B02G261900 (senseand anti-sense), TraesCS5A02G298800 (anti-sense), and TraesCS1B02G222500 (sense). Two GAG-RNAgenes (TaeST2.11597.1 and TaeST2.11598.1) were found to be located in the introns of the same gene(TraesCS2B02G261900).
Figure 2. Expression patterns of triticale AB lncRNAs based on wheat RNAseq data. (A) Boxplot of thetissue-specificity index (TSI) for lncRNAs and all AB high-confidence transcripts assembled from directRNA sequencing (DRS) reads (TSI values close to 1 represent high tissue specificity). Stars indicatesignificant differences estimated by the Wilcoxon rank sum test with continuity correction (p-value <2.2 × 10⁻¹⁶). (B) Bar plot showing the number of AB lncRNAs with the maximum expression (reads perkilobases per million reads, RPKM) level at a specific stage of wheat development (10, 20, and 30 dayspost anthesis (dpa)) or tissue (leaves and pistils). (C) Heatmap of expression values (log(RPKM)) ofAB lncRNAs with >90% of RPKM values based on wheat RNAseq data (10, 20, and 30 dpa; pistilsand leaves).
69
Plants 2020, 9, 1794
Figure 3. Identification, phylogenetic analysis, and expression pattern of RTE-related transcripts.(A) Full-length LTR retrotransposons of Tork (TaeST2.19707.1) and Retrofit (TaeST2.45518.1) lineagesexpressing a short isoform encoding the GAG protein (shGAG). The dark blue rectangles show ORFsencoding all retrotransposon proteins (genome scheme) and the GAG protein (isoform scheme). Orangecolor indicates untranslated regions (UTRs). The Nanopore direct RNA read alignment on the LTRretrotransposon genome sequence is also shown. (B) Neighbor-joining phylogenetic tree built from 15GAG proteins. Red and gray highlight the GAG proteins expressed from RTEs without one or moreencoded proteins and from loci without predicted RTEs, respectively. Red stars indicate GAG proteinswith <300 aa. The vertical red line indicates a group of GAGs encoded by truncated retrotransposonspossessing only GAG ORFs. (C) Multiple alignment of Ty1/Copia GAG proteins. Green and redhighlight variable regions between the Tork and Retrofit regions. Gray shows the RNA-binding motif(CX2CX4HX4C, where X is any amino acid). (D) Heatmap of the log(RPKM) expression of isoformsencoding GAG proteins in wheat leaves and pistils, and during seed development.
70
Plants 2020, 9, 1794
Table 4. Number of retrotransposon-related transcripts (RTE-RNAs) in different groups based oncompleteness of associated LTR retrotransposons (RTEs) and the type of predicted RTE proteins encodedby open reading frames (ORFs) (reverse transcriptase, RT; aspartic protease, AP; RNAse H).
RTE Group
Encoded proteinsFull-length RTEs(all domains are
detectable)
Non-completeRTEs (one or morecanonical proteindomains are not
detectable)
No associated RTEsidentified
Total numberof RTE-RNAs
GAG 8 5 2 15Other RTE proteins(AP, RT, RNAse H) 1 1 3 5
Total number ofRTE-RNAs
9 6 5 20
We further focused on GAG-encoding RTE-RNAs (GAG-RNAs) as the most represented group.Oxford Nanopore RNA sequencing provides a unique opportunity to analyze the exon–intron structureof GAG-RNA-encoded loci and predict the deduced full GAG protein sequences. Classification ofthe deduced GAG proteins showed that 85% (14) and 15% (1) of them belong to Ty1/Copia andTy3/Gypsy elements, respectively. Based on the information from the transcript assembly, we groupedall GAG-RNAs into three categories based on the number of introns they possessed: (1) a single intron,(2) two introns, and (3) no introns. The vast majority (86%, 13) of GAG-RNAs were found to carrya single intron (Figure 3A), while one GAG-RNA from Ty3/Gypsy had no introns, showing that theexon–intron structure may differ between the two LTR retrotransposon superfamilies. To understandthe functional role of splicing in the generation of GAG-RNA transcripts, we also predicted ORFs forunspliced RNA variants corresponding to the regions between two LTRs. We observed that unsplicedtranscripts expressed from the whole RTEs had significantly longer ORFs, resulting in GAG proteinsbeing fused with other RTE proteins. Additionally, for two GAG-RNA encoding RTEs (TaeST2.19707.1and TaeST2.45518.1, Figure 3A), only one very long ORF (>4000 bp) was predicted, while other RTEswere found to have two or three ORFs encoding distinct proteins. Thus, we showed that the splicing ofthe GAG-RNA isoform is critical to ensure the production of the entire GAG protein.
We next performed a comparison and phylogenetic analysis of the amino acid sequences of the15 GAG proteins. The multiple alignment revealed significant differences between one Ty3/Gypsy GAG(TaeST2.45979, GAG length 514 aa) and the Ty1/Copia GAG proteins. We compared the Ty1/CopiaGAG sequences and found that Ty1/Copia GAGs originated from two RTE lineages, Tork (sevensequences) and Retrofit (seven sequences). Phylogenetic tree analysis revealed three and two groupsof highly similar (up to 99%) GAG proteins in the Retrofit and Tork lineages, respectively (Figure 3B).In addition, we detected pronounced sequence divergence between the GAG proteins of Tork andRetrofit lineages. The GAG protein of the Retrofit lineage has a ~50 aa-specific C-end which is notfound in the Tork GAG sequences (Figure 3C). In turn, Tork GAGs have specific amino acid sequencesbefore the RNA-binding motif (RBM) site. These differences are also reflected in the phylogenetic tree’stopology, where the branches corresponding to the Tork and Retrofit Ty1/Copia lineages are readilydistinguishable (Figure 3B).
In addition, we noticed that the divergence of groups in a single lineage correlated well with thecompleteness of the RTEs expressing corresponding GAG-RNAs; the most diverged group of GAGwas the one with the Tork lineage and encoded by truncated retrotransposons (Figure 3B) that had asingle ORF-encoding GAG.
We then analyzed the GAG protein sequences in more detail. In particular, we estimated thepresence of the RNA-binding motif (RBM)(CX2CX4HX4C, where X is any amino acids), a specificpart of GAG proteins, which is responsible for GAG–RNA interactions. We found that RBM couldbe identified in all except three GAG proteins, including one Ty3/Gypsy (TaeST2.45979.1) and two
71
Plants 2020, 9, 1794
Ty1/Copia elements (TaeST2.14377.1, TaeST2.16660.1) of the Tork lineage. The Ty1/Copia GAG-RNAswithout the CX2CX3GHX4X motif (TaeST2_14377 and TAeST_16660) are truncated GAG proteins withsmaller protein lengths (175 aa and 182 aa vs >300 aa for the full-length Ty1/GAG protein) and probablyvery limited functionality. Altogether, the results of the phylogenetic analysis suggest that a divergentset of GAG proteins, including truncated GAGs with no RNA-binding capacity, is expressed duringtriticale seed development.
We then estimated the expression patterns of the GAG-RNAs in several seed developmentalstages and in leaf tissues and pistils of wheat. Nine of the 15 GAG-RNA loci had a specific expressionpattern with maximum expression levels at early developmental stages or in pistils. For two GAG-RNAloci (TaeST2.14377.1 and TaeST2.44075.1), the expression level was too low, indicating a possibletriticale-specific expression pattern (Figure 3D). Thus, the expression data showed that most of theidentified triticale GAG-RNAs were also expressed during wheat seed development, and some RTEsexpressed genomic RNA (gRNA) as well as a short isoform (shGAG) carrying ORF for GAG protein.
Overall, our results suggested that tens of transcripts encoded by full-length and truncated LTRretrotransposon copies are expressed at early stages of triticale seed development. Three-fourths ofthese RNAs carry ORFs for encoding a set of GAG proteins of variable length and phylogenetic diversity.
3.5. A Full-Length Ty1/Copia LTR Retrotransposon Is Active in Triticale Seeds
To transpose in the genome, RTEs need to express the full-length genomic RNA (gRNA). Althoughwe did not detect gRNA for the RTEs expressing TaeST2.19707.1 (RTE3B, location in wheat genome:3B:555,156,557 . . . 555,163,131 (6.58 kb)) and TaeST2.45518.1 (named ‘MIG’, location in wheat genome:7B:312,336,869 . . . 312,341,902 (5 kb)) shGAG RNAs by Nanopore sequencing (Figure 3A), we performedRT-PCR with primer pairs designed to detect (a) shGAG isoforms and (b) gRNA isoforms. The RT-PCRanalysis resulted in detection of the expression levels of shGAG and gRNAs in developing triticaleseeds (10 dpa) and flag leaves, although the gRNA expression level was lower (Figure 4A). Next, weassessed whether the RTEs were capable of transposing. To answer this question, we determinedthe generation of the extrachromosomal circular DNA (eccDNA) by these RTEs using inverted PCR.EccDNAs are byproducts of RTE activity in plants [71]. We first determined that inverted PCR withthe designed primers did not produce PCR products with genomic DNA. Unfortunately, the primerson RTE3B produced PCR fragments with genomic DNA; therefore, the activity of RTE3B could not beassessed by inverted PCR. We continued eccDNA detection only for MIG (Supplementary File S3).For this, we enriched the eccDNA fraction by exonuclease treatment of total genomic DNA using anenzyme that specifically cut linear DNA while leaving circular DNA molecules intact. The productwas then amplified by rolling circle amplification, and inverted PCR was carried out. We enrichedeccDNA in genomic DNA isolated from developing grain at 10 dpa, as well as glume and lemma tissue.The specific products were detected only for eccDNA isolated from developing grain, and no productswere obtained with eccDNA of glume and lemma tissues. Thus, our results showed that RTE MIGexpresses both shGAG RNA and gRNA isoforms and has transposition activity.
Here, we provide experimental evidence suggesting that some detected RTE-RNAs originate fromautonomous LTR retrotransposons with ongoing transposition activity in triticale at early stages ofseed development.
72
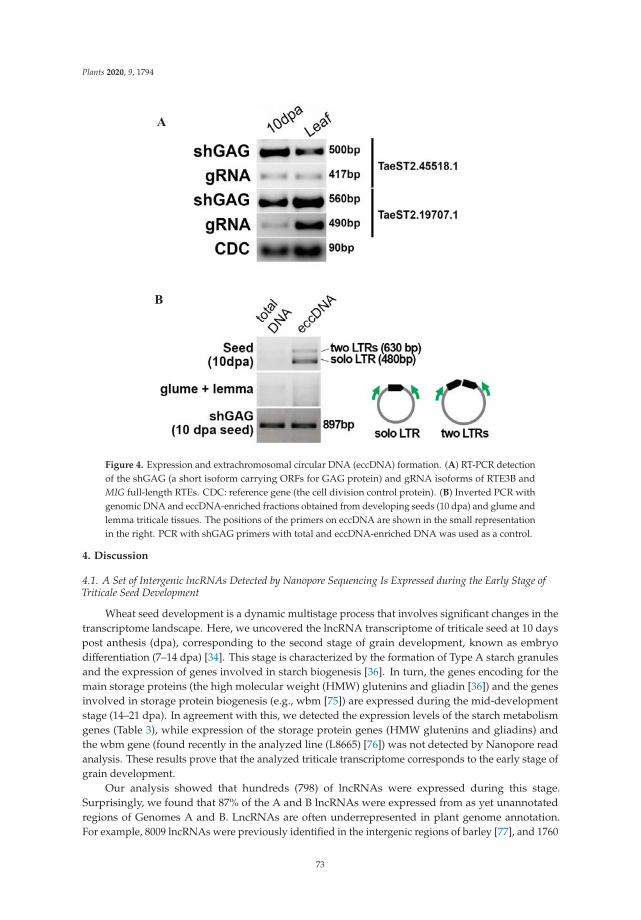
Plants 2020, 9, 1794
Figure 4. Expression and extrachromosomal circular DNA (eccDNA) formation. (A) RT-PCR detectionof the shGAG (a short isoform carrying ORFs for GAG protein) and gRNA isoforms of RTE3B andMIG full-length RTEs. CDC: reference gene (the cell division control protein). (B) Inverted PCR withgenomic DNA and eccDNA-enriched fractions obtained from developing seeds (10 dpa) and glume andlemma triticale tissues. The positions of the primers on eccDNA are shown in the small representationin the right. PCR with shGAG primers with total and eccDNA-enriched DNA was used as a control.
4. Discussion
4.1. A Set of Intergenic lncRNAs Detected by Nanopore Sequencing Is Expressed during the Early Stage ofTriticale Seed Development
Wheat seed development is a dynamic multistage process that involves significant changes in thetranscriptome landscape. Here, we uncovered the lncRNA transcriptome of triticale seed at 10 dayspost anthesis (dpa), corresponding to the second stage of grain development, known as embryodifferentiation (7–14 dpa) [34]. This stage is characterized by the formation of Type A starch granulesand the expression of genes involved in starch biogenesis [36]. In turn, the genes encoding for themain storage proteins (the high molecular weight (HMW) glutenins and gliadin [36]) and the genesinvolved in storage protein biogenesis (e.g., wbm [75]) are expressed during the mid-developmentstage (14–21 dpa). In agreement with this, we detected the expression levels of the starch metabolismgenes (Table 3), while expression of the storage protein genes (HMW glutenins and gliadins) andthe wbm gene (found recently in the analyzed line (L8665) [76]) was not detected by Nanopore readanalysis. These results prove that the analyzed triticale transcriptome corresponds to the early stage ofgrain development.
Our analysis showed that hundreds (798) of lncRNAs were expressed during this stage.Surprisingly, we found that 87% of the A and B lncRNAs were expressed from as yet unannotatedregions of Genomes A and B. LncRNAs are often underrepresented in plant genome annotation.For example, 8009 lncRNAs were previously identified in the intergenic regions of barley [77], and 1760
73
Plants 2020, 9, 1794
unannotated lncRNAs were identified in foxtail millet [78]. The annotation of the lncRNAs expressedfrom the intergenic space can be challenging because of the biological properties of lncRNAs, includingtheir high tissue- and stage-specificity. Indeed, we identified a high tissue-specificity index for triticalelncRNAs, suggesting that a large number of lncRNAs are expressed during a narrow time window.Additionally, lncRNAs often possess exons containing transposon-similar multicopy sequences thatmake the transcript assembly difficult because of unambiguity in short RNAseq read mapping. Here,we found that almost 30% of the triticale lncRNAs possessed exons with similarity to TEs. This isin accordance with previous reports on rice [79], where 73% lncRNAs were found to overlap withdifferent TEs. Furthermore, 9.18% of sunflower lncRNAs have TE-related exons [80]. In these terms,RNAseq-based lncRNA identification can underestimate the number of lncRNAs in a cell or lead totranscript misassembly, because short reads from the repeat regions are often mismapped or discardedfrom the analysis [25]. However, notably, the study of plant lncRNAs and transposon-derivedtranscripts has mostly been limited by short read RNAseq data. Here, to escape lncRNA identificationbiases because of the short length of the RNAseq reads, we applied Nanopore direct RNA sequencing.This approach allowed us to precisely determine the transcribed regions in a complex wheat genome.In addition, Nanopore direct RNA sequencing is strand-specific and can be used to identify naturalanti-sense lncRNAs. The application of third-generation sequencing could help to illuminate “the darkside” of developing seed transcriptomes involving lncRNAs and transposon-derived loci, therebyovercoming the obstacles in lncRNA discovery by short RNAseq reads. It will be especially usefulfor crop plants where lncRNA loci can be included into genome-wide association studies (GWAS) todetermine which of them can influence key agronomical traits. Notably, lncRNA loci have not beenwell used for GWAS analysis so far [81]. We believe that the triticale lncRNAs identified in this studycould act as valuable new targets for marker-assisted selection.
4.2. Transcripts Encoding Diverse GAG Proteins Are Expressed during the Early Stage of Seed Development
Seed development is accompanied by epigenetic relaxation, which may trigger retrotransposon(RTE) activity [21–23]. Here, we identified 20 transcripts with similarities to RTE proteins. Interestingly,we found that 75% of the RTE-related transcripts carry ORFs encoding GAG proteins, the maincomponent of the RTE virus-like particle. It is known that during their lifecycle, RTEs have to producesignificantly more GAG proteins that other RTE proteins. To ensure that there are excess GAG proteinscompared with other RTE proteins, an Arabidopsis RTE called EVD encodes a special isoform (shGAG)encoding the GAG protein [82]. Because almost no systematic studies of RTE transcripts have beencarried out at the single isoform level in crop plants, it was not previously clear whether shGAGtranscript production is a common pattern for plant species. In this study, we detected isoformproduction for several full-length triticale RTEs and showed their transcription in wheat, implyingthat shGAG is a very common pattern for plants. Moreover, we showed that one of the full-lengthRTEs, TaeST2.45518.1, is capable of producing extrachromosomal circular DNAs (eccDNA), which area byproduct of RTE activity and have been used to isolate transpositionally active RTEs [74]. Whetherthis RTE is active in the triticale embryo and can produce copies that are transmitted to the nextgeneration or whether it is active in other tissues of developing grains (e.g., endosperm) warrantsfurther investigation.
Based on the knowledge of splicing patterns of GAG-encoding isoforms, we were able to predictthe GAG protein sequence and analyze it in more detail. Our results point to the existence of adivergent group of GAG proteins expressing during triticale and wheat seed development. TheseGAG proteins and the RTEs encoding them have several distinct features: (1) the RTEs encodingthese GAG proteins are non-autonomous elements and possess no similarity to POL proteins; (2) thelengths of most of these GAG proteins (169–270 aa) are less than that of the conventional GAG protein(>300 aa); and (3) half of these GAG proteins lack the RNA-binding motif and cannot interact withRTE RNAs. The elements encoding GAG-RNA consist of two LTRs and the internal part is similarto the GAG protein. This structure makes these elements very similar to the previously described
74
Plants 2020, 9, 1794
TR-GAG elements (terminal repeat with GAG domain) ([83]) found in many angiosperm species.However, the TR-GAG elements described in the current paper are classified as Ty1/Copia, while GAGproteins of previously identified TR-GAG elements are similar to both Ty1/Copia and the Ty3/Gypsysuperfamily. While further functional and evolutionary studies are required, we suggest that theseGAG loci are intermediate products of RTE diversification or “domestication”. The “domestication”of GAG proteins has been documented in animals and insects [84–87]. Because of the short lengthsof these GAG proteins, it can be also suggested that they may be involved in control of the activityof functional RTEs via incorporation into their virus-like particles. The mechanism of copy numbercontrol of RTEs via virus-like particles (VLP) misassembly, which is caused by a truncated GAG form,known as dominant-negative factor, has been well described for yeast [88,89]. No such exampleshave been described in plants. In the future, it will be intriguing to check whether TR-GAG proteinsare capable of interacting with normal GAG proteins of full-length RTEs, which, as we showed here,are expressed in the same developmental stage.
Previously, Nanopore long-read sequencing of transcriptomes was used to annotate expressedtransposons in Arabidopsis mutants lacking key systems of TE suppression, resulting in elevatedexpression of transposons [26]. The authors detected the expression of almost 1300 TEs. However,elucidation of transposon expression a “wild-type” genetic background would provide a uniqueopportunity to trace natural evolutionary forces shaping plant retrotranscriptome and to more deeplyunderstand the features of host–transposon interactions. Recent studies on maize and sunflower [26,90]and our current results point to the great advantage of Nanopore RNA sequencing to decipher RTEexpression in crop plants, even those with complex genomes such as triticale. Together with thegrowing number of publicly available long-read RNA sequencing datasets, this opens a broad avenuefor studies of transposon expression in plants on the isoform-based level.
5. Conclusions
Here, using Nanopore direct RNA sequencing, we identified hundreds of previously unknownlncRNAs and LTR retrotransposon-derived transcripts that are expressed in the early stages of triticaleand wheat seed development. We showed that triticale lncRNAs often possess similar sequences totransposons and their expression has high stage and tissue specificity, with half of the lncRNAs havingthe highest expression level at 10–30 days post anthesis in wheat. In addition, we found that most of thedetected retrotransposon-related RNAs have a single intron, carry ORFs encoding for a divergent setof GAG proteins, and are encoded by potentially autonomous and non-autonomous retrotransposons.Of these, we identified one Ty1/Copia LTR retrotransposon that produces extrachromosomal circularDNA, and we suggest that it has transposition activity in developing triticale seeds. Finally, this studyidentified a unique set of lncRNAs and LTR retrotransposons expressed in the early stages of seeddevelopment, which we believe will be useful for further exploration of their functional potential andthe association with phenotypic variation in triticale and wheat.
Supplementary Materials: The following are available online at http://www.mdpi.com/2223-7747/9/12/1794/s1,Supplementary File S1: Genomic location and overlapped genes for 976 Triticale IncRNAs, Supplementary file S2.Fasta sequences of 796 lncRNAs, Supplementary file S3. Sequence of RTE7B LTR retrotransposon that is expressedand produce eccDNA in triticale developing seed at 10 dpa.
Author Contributions: Conceptualization, I.K. and A.S. (Alexander Soloviev); methodology, I.K.; formal analysis,I.K., M.D., P.M., A.S. (Andrey Shingaliev), M.O., E.K., and A.S. (Alexandra Sigaeva); writing—original draftpreparation, I.K.; writing—review and editing, I.K., A.S., and G.K.; funding acquisition, A.S. and G.K. All authorshave read and agreed to the published version of the manuscript.
Funding: This research was funded by the Ministry of Education and Science of Russian Federation (GoszadanieNo 0431-2019-0005).
Conflicts of Interest: The authors declare no conflict of interest.
Data Availability Statement: Nanopore data produced for this study are available in Sequence Read Archive(SRA) NCBI under Bioproject Accession PRJNA683988.
75
Plants 2020, 9, 1794
References
1. Fesenko, I.; Kirov, I.; Kniazev, A.; Khazigaleeva, R.; Lazarev, V.; Kharlampieva, D.; Grafskaia, E.; Zgoda, V.;Butenko, I.; Arapidi, G.; et al. Distinct types of short open reading frames are translated in plant cells.Genome Res. 2019, 29, 1464–1477. [CrossRef]
2. Rai, M.I.; Alam, M.; Lightfoot, D.A.; Gurha, P.; Afzal, A.J. Classification and experimental identification ofplant long non-coding RNAs. Genomics 2019, 111, 997–1005. [CrossRef]
3. Ma, L.; Bajic, V.B.; Zhang, Z. On the classification of long non-coding RNAs. Rna Biol. 2013, 10, 925–933.[CrossRef]
4. Szczesniak, M.W.; Rosikiewicz, W.; Makałowska, I. CANTATAdb: A Collection of Plant Long Non-CodingRNAs. Plant Cell Physiol. 2015, 57, e8. [CrossRef]
5. Paytuví Gallart, A.; Hermoso Pulido, A.; Anzar Martínez de Lagrán, I.; Sanseverino, W.; Aiese Cigliano, R.GREENC: A Wiki-based database of plant lncRNAs. Nucleic Acids Res. 2016, 44, D1161–D1166. [CrossRef]
6. Xuan, H.; Zhang, L.; Liu, X.; Han, G.; Li, J.; Li, X.; Liu, A.; Liao, M.; Zhang, S.J.G. PLNlncRbase: A resourcefor experimentally identified lncRNAs in plants. Gene 2015, 573, 328–332. [CrossRef]
7. Jin, J.; Lu, P.; Xu, Y.; Li, Z.; Yu, S.; Liu, J.; Wang, H.; Chua, N.-H.; Cao, P. PLncDB V2.0: A comprehensiveencyclopedia of plant long noncoding RNAs. Nucleic Acids Res. 2020. [CrossRef]
8. Jha, U.C.; Nayyar, H.; Jha, R.; Khurshid, M.; Zhou, M.; Mantri, N.; Siddique, K.H.M. Long non-coding RNAs:Emerging players regulating plant abiotic stress response and adaptation. BMC Plant Biol. 2020, 20, 466.[CrossRef]
9. Lucero, L.; Ferrero, L.; Fonouni-Farde, C.; Ariel, F. Functional classification of plant long noncoding RNAs:A transcript is known by the company it keeps. New Phytol. 2020. [CrossRef]
10. Budak, H.; Kaya, S.B.; Cagirici, H.B. Long Non-coding RNA in Plants in the Era of Reference Sequences.Front. Plant Sci. 2020, 11. [CrossRef]
11. Palazzo, A.F.; Koonin, E.V. Functional Long Non-coding RNAs Evolve from Junk Transcripts. Cell 2020.[CrossRef]
12. Kapusta, A.; Kronenberg, Z.; Lynch, V.J.; Zhuo, X.; Ramsay, L.; Bourque, G.; Yandell, M.; Feschotte, C.Transposable elements are major contributors to the origin, diversification, and regulation of vertebrate longnoncoding RNAs. PLoS Genet. 2013, 9, e1003470. [CrossRef]
13. Liu, J.; Jung, C.; Xu, J.; Wang, H.; Deng, S.; Bernad, L.; Arenas-Huertero, C.; Chua, N.H. Genome-wide analysisuncovers regulation of long intergenic noncoding RNAs in Arabidopsis. Plant Cell 2012, 24, 4333–4345.[CrossRef]
14. Kelley, D.; Rinn, J. Transposable elements reveal a stem cell-specific class of long noncoding RNAs. Genome Biol.2012, 13, R107. [CrossRef]
15. Zhao, T.; Tao, X.; Feng, S.; Wang, L.; Hong, H.; Ma, W.; Shang, G.; Guo, S.; He, Y.; Zhou, B.; et al. LncRNAs inpolyploid cotton interspecific hybrids are derived from transposon neofunctionalization. Genome Biol. 2018,19, 195. [CrossRef]
16. De Quattro, C.; Pe, M.E.; Bertolini, E. Long noncoding RNAs in the model species Brachypodium distachyon.Sci. Rep. 2017, 7, 11252. [CrossRef]
17. Ramsay, L.; Marchetto, M.C.; Caron, M.; Chen, S.H.; Busche, S.; Kwan, T.; Pastinen, T.; Gage, F.H.; Bourque, G.Conserved expression of transposon-derived non-coding transcripts in primate stem cells. BMC Genom.2017, 18, 214. [CrossRef]
18. Lv, Y.; Hu, F.; Zhou, Y.; Wu, F.; Gaut, B.S. Maize transposable elements contribute to long non-coding RNAsthat are regulatory hubs for abiotic stress response. BMC Genom. 2019, 20, 864. [CrossRef]
19. Xue, L.; Wu, H.; Chen, Y.; Li, X.; Hou, J.; Lu, J.; Wei, S.; Dai, X.; Olson, M.S.; Liu, J.; et al. Evidences for a roleof two Y-specific genes in sex determination in Populus deltoides. Nat. Commun. 2020, 11, 5893. [CrossRef]
20. Cho, J.; Paszkowski, J. Regulation of rice root development by a retrotransposon acting as a microRNAsponge. eLife 2017, 6, e30038. [CrossRef]
21. Warman, C.; Panda, K.; Vejlupkova, Z.; Hokin, S.; Unger-Wallace, E.; Cole, R.A.; Chettoor, A.M.; Jiang, D.;Vollbrecht, E.; Evans, M.M.S.; et al. High expression in maize pollen correlates with genetic contributions topollen fitness as well as with coordinated transcription from neighboring transposable elements. PLoS Genet.2020, 16, e1008462. [CrossRef]
76
Plants 2020, 9, 1794
22. Anderson, S.N.; Stitzer, M.C.; Zhou, P.; Ross-Ibarra, J.; Hirsch, C.D.; Springer, N.M. Dynamic Patterns ofTranscript Abundance of Transposable Element Families in Maize. G3 Genes|Genomes|Genet. 2019, 9, 3673.[CrossRef]
23. Slotkin, R.K.; Vaughn, M.; Borges, F.; Tanurdžic, M.; Becker, J.D.; Feijó, J.A.; Martienssen, R.A. EpigeneticReprogramming and Small RNA Silencing of Transposable Elements in Pollen. Cell 2009, 136, 461–472.[CrossRef]
24. Slotkin, R.K. The case for not masking away repetitive DNA. Mob. DNA 2018, 9, 15. [CrossRef]25. Lanciano, S.; Cristofari, G. Measuring and interpreting transposable element expression. Nat. Rev. Genet.
2020, 21, 721–736. [CrossRef]26. Panda, K.; Slotkin, R.K. Long-Read cDNA Sequencing Enables a “Gene-Like” Transcript Annotation of
Transposable Elements. Plant Cell 2020, 32, 2687–2698. [CrossRef]27. Zhang, G.; Sun, M.; Wang, J.; Lei, M.; Li, C.; Zhao, D.; Huang, J.; Li, W.; Li, S.; Li, J.; et al. PacBio full-length
cDNA sequencing integrated with RNA-seq reads drastically improves the discovery of splicing transcriptsin rice. Plant J. 2019, 97, 296–305. [CrossRef]
28. Xu, J.; Du, R.; Meng, X.; Zhao, W.; Kong, L.; Chen, J. Third-Generation Sequencing Indicated that LncRNACould Regulate eIF2D to Enhance Protein Translation under Heat Stress in Populus simonii. Plant Mol.Biol. Rep. 2020. [CrossRef]
29. Xu, J.; Zheng, Y.; Pu, S.; Zhang, X.; Li, Z.; Chen, J. Third-generation sequencing found LncRNA associatedwith heat shock protein response to heat stress in Populus qiongdaoensis seedlings. BMC Genom. 2020,21, 572. [CrossRef]
30. Chao, Q.; Gao, Z.-F.; Zhang, D.; Zhao, B.-G.; Dong, F.-Q.; Fu, C.-X.; Liu, L.-J.; Wang, B.-C. The developmentaldynamics of the Populus stem transcriptome. Plant Biotechnol. J. 2019, 17, 206–219. [CrossRef]
31. Chao, Y.; Yuan, J.; Li, S.; Jia, S.; Han, L.; Xu, L. Analysis of transcripts and splice isoforms in red clover(Trifolium pratense L.) by single-molecule long-read sequencing. BMC Plant Biol. 2018, 18, 300. [CrossRef]
32. Rao, S.; Yu, T.; Cong, X.; Xu, F.; Lai, X.; Zhang, W.; Liao, Y.; Cheng, S. Integration analysis of PacBioSMRT- and Illumina RNA-seq reveals candidate genes and pathway involved in selenium metabolism inhyperaccumulator Cardamine violifolia. BMC Plant Biol. 2020, 20, 492. [CrossRef]
33. Zhu, Z.; Chen, H.; Xie, K.; Liu, C.; Li, L.; Liu, L.; Han, X.; Jiao, C.; Wan, Z.; Sha, A. Characterization ofDrought-Responsive Transcriptome During Seed Germination in Adzuki Bean (Vigna angularis L.) by PacBioSMRT and Illumina Sequencing. Front. Genet. 2020, 11, 996. [CrossRef]
34. Rogers, S.O.; Quatrano, R.S. Morphological Staging of Wheat Caryopsis Development. Am. J. Bot. 1983, 70,308–311. [CrossRef]
35. Rangan, P.; Furtado, A.; Henry, R.J. The transcriptome of the developing grain: A resource for understandingseed development and the molecular control of the functional and nutritional properties of wheat. BMC Genom.2017, 18, 766. [CrossRef]
36. Wan, Y.; Poole, R.L.; Huttly, A.K.; Toscano-Underwood, C.; Feeney, K.; Welham, S.; Gooding, M.J.; Mills, C.;Edwards, K.J.; Shewry, P.R.; et al. Transcriptome analysis of grain development in hexaploid wheat.BMC Genom. 2008, 9, 121. [CrossRef]
37. Pellny, T.K.; Lovegrove, A.; Freeman, J.; Tosi, P.; Love, C.G.; Knox, J.P.; Shewry, P.R.; Mitchell, R.A.C. CellWalls of Developing Wheat Starchy Endosperm: Comparison of Composition and RNA-Seq Transcriptome.Plant Physiol. 2012, 158, 612–627. [CrossRef]
38. Wei, L.; Wu, Z.; Zhang, Y.; Guo, D.; Xu, Y.; Chen, W.; Zhou, H.; You, M.; Li, B. Transcriptome analysis ofwheat grain using RNA-Seq. Front. Agric. Sci. Eng. 2014, 1, 214–222. [CrossRef]
39. Pfeifer, M.; Kugler, K.G.; Sandve, S.R.; Zhan, B.; Rudi, H.; Hvidsten, T.R.; Mayer, K.F.X.; Olsen, O.-A. Genomeinterplay in the grain transcriptome of hexaploid bread wheat. Science 2014, 345, 1250091. [CrossRef]
40. Yu, Y.; Zhu, D.; Ma, C.; Cao, H.; Wang, Y.; Xu, Y.; Zhang, W.; Yan, Y. Transcriptome analysis reveals keydifferentially expressed genes involved in wheat grain development. Crop J. 2016, 4, 92–106. [CrossRef]
41. Gillies, S.A.; Futardo, A.; Henry, R.J. Gene expression in the developing aleurone and starchy endosperm ofwheat. Plant Biotechnol. J. 2012, 10, 668–679. [CrossRef]
42. Yamasaki, Y.; Gao, F.; Jordan, M.C.; Ayele, B.T. Seed maturation associated transcriptional programsand regulatory networks underlying genotypic difference in seed dormancy and size/weight in wheat(Triticum aestivum L.). BMC Plant Biol. 2017, 17, 154. [CrossRef]
77
Plants 2020, 9, 1794
43. Guan, Y.; Li, G.; Chu, Z.; Ru, Z.; Jiang, X.; Wen, Z.; Zhang, G.; Wang, Y.; Zhang, Y.; Wei, W. Transcriptomeanalysis reveals important candidate genes involved in grain-size formation at the stage of grain enlargementin common wheat cultivar “Bainong 4199”. PLoS ONE 2019, 14, e0214149. [CrossRef]
44. Madhawan, A.; Sharma, A.; Bhandawat, A.; Rahim, M.S.; Kumar, P.; Mishra, A.; Parveen, A.; Sharma, H.;Verma, S.K.; Roy, J. Identification and characterization of long non-coding RNAs regulating resistant starchbiosynthesis in bread wheat (Triticum aestivum L.). Genomics 2020, 112, 3065–3074. [CrossRef]
45. Rogers, S.O.; Bendich, A.J. Extraction of DNA from milligram amounts of fresh, herbarium and mummifiedplant tissues. Plant Mol. Biol. 1985, 5, 69–76. [CrossRef]
46. Paolacci, A.R.; Tanzarella, O.A.; Porceddu, E.; Ciaffi, M. Identification and validation of reference genes forquantitative RT-PCR normalization in wheat. BMC Mol. Biol. 2009, 10, 11. [CrossRef]
47. Ryan, P.R.; Dong, D.; Teuber, F.; Wendler, N.; Mühling, K.H.; Liu, J.; Xu, M.; Salvador Moreno, N.; You, J.;Maurer, H.-P.; et al. Assessing How the Aluminum-Resistance Traits in Wheat and Rye Transfer to Hexaploidand Octoploid Triticale. Front. Plant Sci. 2018, 9. [CrossRef]
48. International Wheat Genome Sequencing, C. A chromosome-based draft sequence of the hexaploid breadwheat (Triticum aestivum) genome. Science 2014, 345, 1251788. [CrossRef]
49. Bauer, E.; Schmutzer, T.; Barilar, I.; Mascher, M.; Gundlach, H.; Martis, M.M.; Twardziok, S.O.; Hackauf, B.;Gordillo, A.; Wilde, P.; et al. Towards a whole-genome sequence for rye (Secale cereale L.). Plant J. CellMol. Biol. 2017, 89, 853–869. [CrossRef]
50. Li, H. Minimap2: Pairwise alignment for nucleotide sequences. Bioinformatics 2018, 34, 3094–3100. [CrossRef]51. Li, H.; Handsaker, B.; Wysoker, A.; Fennell, T.; Ruan, J.; Homer, N.; Marth, G.; Abecasis, G.; Durbin, R.;
Genome Project Data Processing, S. The Sequence Alignment/Map format and SAMtools. Bioinformatics 2009,25, 2078–2079. [CrossRef]
52. Barnett, D.W.; Garrison, E.K.; Quinlan, A.R.; Stromberg, M.P.; Marth, G.T. BamTools: A C++ API and toolkitfor analyzing and managing BAM files. Bioinformatics 2011, 27, 1691–1692. [CrossRef]
53. Kovaka, S.; Zimin, A.V.; Pertea, G.M.; Razaghi, R.; Salzberg, S.L.; Pertea, M. Transcriptome assembly fromlong-read RNA-seq alignments with StringTie2. Genome Biol. 2019, 20, 278. [CrossRef]
54. Pertea, G.; Pertea, M. GFF Utilities: GffRead and GffCompare. F1000Research 2020, 9. [CrossRef]55. Buels, R.; Yao, E.; Diesh, C.M.; Hayes, R.D.; Munoz-Torres, M.; Helt, G.; Goodstein, D.M.; Elsik, C.G.;
Lewis, S.E.; Stein, L.; et al. JBrowse: A dynamic web platform for genome visualization and analysis.Genome Biol. 2016, 17, 66. [CrossRef]
56. Cock, P.J.; Antao, T.; Chang, J.T.; Chapman, B.A.; Cox, C.J.; Dalke, A.; Friedberg, I.; Hamelryck, T.; Kauff, F.;Wilczynski, B.; et al. Biopython: Freely available Python tools for computational molecular biology andbioinformatics. Bioinformatics 2009, 25, 1422–1423. [CrossRef]
57. Han, S.; Liang, Y.; Ma, Q.; Xu, Y.; Zhang, Y.; Du, W.; Wang, C.; Li, Y. LncFinder: An integrated platform forlong non-coding RNA identification utilizing sequence intrinsic composition, structural information andphysicochemical property. Brief Bioinform. 2019, 20, 2009–2027. [CrossRef]
58. Li, A.; Zhang, J.; Zhou, Z. PLEK: A tool for predicting long non-coding RNAs and messenger RNAs basedon an improved k-mer scheme. BMC Bioinform. 2014, 15, 311. [CrossRef]
59. Sun, L.; Luo, H.; Bu, D.; Zhao, G.; Yu, K.; Zhang, C.; Liu, Y.; Chen, R.; Zhao, Y. Utilizing sequence intrinsiccomposition to classify protein-coding and long non-coding transcripts. Nucleic Acids Res. 2013, 41, e166.[CrossRef]
60. Ellinghaus, D.; Kurtz, S.; Willhoeft, U. LTRharvest, an efficient and flexible software for de novo detection ofLTR retrotransposons. BMC Bioinform. 2008, 9, 18. [CrossRef]
61. Steinbiss, S.; Willhoeft, U.; Gremme, G.; Kurtz, S. Fine-grained annotation and classification of de novopredicted LTR retrotransposons. Nucleic Acids Res. 2009, 37, 7002–7013. [CrossRef]
62. Llorens, C.; Futami, R.; Covelli, L.; Dominguez-Escriba, L.; Viu, J.M.; Tamarit, D.; Aguilar-Rodriguez, J.;Vicente-Ripolles, M.; Fuster, G.; Bernet, G.P.; et al. The Gypsy Database (GyDB) of mobile genetic elements:Release 2.0. Nucleic Acids Res. 2011, 39, D70–D74. [CrossRef]
63. Neumann, P.; Novák, P.; Hoštáková, N.; Macas, J. Systematic survey of plant LTR-retrotransposons elucidatesphylogenetic relationships of their polyprotein domains and provides a reference for element classification.Mobile DNA 2019, 10, 1. [CrossRef]
64. Katoh, K.; Rozewicki, J.; Yamada, K.D. MAFFT online service: Multiple sequence alignment, interactivesequence choice and visualization. Brief. Bioinform. 2017, 20, 1160–1166. [CrossRef]
78
Plants 2020, 9, 1794
65. Letunic, I.; Bork, P. Interactive Tree Of Life (iTOL) v4: Recent updates and new developments. Nucleic Acids Res.2019, 47, W256–W259. [CrossRef]
66. Waterhouse, A.M.; Procter, J.B.; Martin, D.M.; Clamp, M.; Barton, G.J. Jalview Version 2—A multiple sequencealignment editor and analysis workbench. Bioinformatics 2009, 25, 1189–1191. [CrossRef]
67. Ge, S.X.; Jung, D.; Yao, R. ShinyGO: A graphical gene-set enrichment tool for animals and plants. Bioinformatics2019, 36, 2628–2629. [CrossRef]
68. Kim, D.; Langmead, B.; Salzberg, S.L. HISAT: A fast spliced aligner with low memory requirements.Nat. Methods 2015, 12, 357–360. [CrossRef]
69. Patro, R.; Duggal, G.; Love, M.I.; Irizarry, R.A.; Kingsford, C. Salmon provides fast and bias-awarequantification of transcript expression. Nat. Methods 2017, 14, 417–419. [CrossRef]
70. Xiao, B.; Lu, H.; Li, C.; Bhanbhro, N.; Cui, X.; Yang, C. Carbohydrate and plant hormone regulate the alkalistress response of hexaploid wheat (Triticum aestivum L.). Environ. Exp. Bot. 2020, 175, 104053. [CrossRef]
71. Yang, Z.; Peng, Z.; Wei, S.; Liao, M.; Yu, Y.; Jang, Z. Pistillody mutant reveals key insights into stamen andpistil development in wheat (Triticum aestivum L.). BMC Genom. 2015, 16, 211. [CrossRef]
72. Lanciano, S.; Carpentier, M.C.; Llauro, C.; Jobet, E.; Robakowska-Hyzorek, D.; Lasserre, E.; Ghesquiere, A.;Panaud, O.; Mirouze, M. Sequencing the extrachromosomal circular mobilome reveals retrotransposonactivity in plants. PLoS Genet 2017, 13, e1006630. [CrossRef]
73. Wickham, H. ggplot2. Wiley Interdiscip. Rev. Comput. Stat. 2011, 3, 180–185. [CrossRef]74. Gu, Z.; Eils, R.; Schlesner, M. Complex heatmaps reveal patterns and correlations in multidimensional
genomic data. Bioinformatics 2016, 32, 2847–2849. [CrossRef]75. Furtado, A.; Bundock, P.C.; Banks, P.M.; Fox, G.; Yin, X.; Henry, R.J. A novel highly differentially expressed
gene in wheat endosperm associated with bread quality. Sci. Rep. 2015, 5, 10446. [CrossRef]76. Kirov, I.; Pirsikov, A.; Milyukova, N.; Dudnikov, M.; Kolenkov, M.; Gruzdev, I.; Siksin, S.; Khrustaleva, L.;
Karlov, G.; Soloviev, A.J.A. Analysis of Wheat Bread-Making Gene (wbm) Evolution and Occurrence inTriticale Collection Reveal Origin via Interspecific Introgression into Chromosome 7AL. Agronomy 2019, 9,854. [CrossRef]
77. Unver, T.; Tombuloglu, H. Barley long non-coding RNAs (lncRNA) responsive to excess boron. Genomics2020, 112, 1947–1955. [CrossRef]
78. Wang, T.; Song, H.; Wei, Y.; Li, P.; Hu, N.; Liu, J.; Zhang, B.; Peng, R. High throughput deep sequencingelucidates the important role of lncRNAs in Foxtail millet response to herbicides. Genomics 2020, 112,4463–4473. [CrossRef]
79. Li, X.; Shahid, M.Q.; Wen, M.; Chen, S.; Yu, H.; Jiao, Y.; Lu, Z.; Li, Y.; Liu, X. Global identification and analysisrevealed differentially expressed lncRNAs associated with meiosis and low fertility in autotetraploid rice.BMC Plant Biol. 2020, 20, 82. [CrossRef]
80. Flórez-Zapata, N.M.V.; Reyes-Valdés, M.H.; Martínez, O. Long non-coding RNAs are major contributorsto transcriptome changes in sunflower meiocytes with different recombination rates. BMC Genom. 2016,17, 490. [CrossRef]
81. Gupta, P.K.; Kulwal, P.L.; Jaiswal, V. Chapter Two—Association mapping in plants in the post-GWASgenomics era. In Advances in Genetics; Kumar, D., Ed.; Academic Press: Cambridge, MA, USA, 2019;Volume 104, pp. 75–154.
82. Oberlin, S.; Sarazin, A.; Chevalier, C.; Voinnet, O.; Marí-Ordóñez, A. A genome-wide transcriptome andtranslatome analysis of Arabidopsis transposons identifies a unique and conserved genome expressionstrategy for Ty1/Copia retroelements. Genome Res. 2017, 27, 1549–1562. [CrossRef]
83. Chaparro, C.; Gayraud, T.; de Souza, R.F.; Domingues, D.S.; Akaffou, S.; Laforga Vanzela, A.L.; Kochko, A.;Rigoreau, M.; Crouzillat, D.; Hamon, S.; et al. Terminal-repeat retrotransposons with GAG domain in plantgenomes: A new testimony on the complex world of transposable elements. Genome Biol. Evol. 2015, 7,493–504. [CrossRef]
84. Campillos, M.; Doerks, T.; Shah, P.K.; Bork, P.J.T.i.G. Computational characterization of multiple Gag-likehuman proteins. Trends Genetics 2006, 22, 585–589. [CrossRef]
85. Nefedova, L.N.; Kuzmin, I.V.; Makhnovskii, P.A.; Kim, A.I. Domesticated retroviral GAG gene in Drosophila:New functions for an old gene. Virology 2014, 450–451, 196–204. [CrossRef]
86. Ashley, J.; Cordy, B.; Lucia, D.; Fradkin, L.G.; Budnik, V.; Thomson, T. Retrovirus-like Gag Protein Arc1 BindsRNA and Traffics across Synaptic Boutons. Cell 2018, 172, 262–274.e11. [CrossRef]
79
Plants 2020, 9, 1794
87. Makhnovskii, P.; Balakireva, Y.; Nefedova, L.; Lavrenov, A.; Kuzmin, I.; Kim, A.J.G. Domesticated gagGene of Drosophila LTR Retrotransposons Is Involved in Response to Oxidative Stress. Genes 2020, 11, 396.[CrossRef]
88. Saha, A.; Mitchell, J.A.; Nishida, Y.; Hildreth, J.E.; Ariberre, J.A.; Gilbert, W.V.; Garfinkel, D.J. A trans-dominantform of Gag restricts Ty1 retrotransposition and mediates copy number control. J. Virol. 2015, 89, 3922–3938.[CrossRef]
89. Tucker, J.M.; Larango, M.E.; Wachsmuth, L.P.; Kannan, N.; Garfinkel, D.J. The Ty1 Retrotransposon RestrictionFactor p22 Targets Gag. PLoS Genet. 2015, 11, e1005571. [CrossRef]
90. Kirov, I.; Omarov, M.; Merkulov, P.; Dudnikov, M.; Gvaramiya, S.; Kolganova, E.; Komakhin, R.; Karlov, G.;Soloviev, A. Genomic and Transcriptomic Survey Provides New Insight into the Organization andTransposition Activity of Highly Expressed LTR Retrotransposons of Sunflower (Helianthus annuus L.). Int. J.Mol. Sci. 2020, 21, 9331. [CrossRef]
Publisher’s Note: MDPI stays neutral with regard to jurisdictional claims in published maps and institutionalaffiliations.
© 2020 by the authors. Licensee MDPI, Basel, Switzerland. This article is an open accessarticle distributed under the terms and conditions of the Creative Commons Attribution(CC BY) license (http://creativecommons.org/licenses/by/4.0/).
80
plants
Article
Factors Influencing Genomic Prediction Accuracies of TropicalMaize Resistance to Fall Armyworm and Weevils
Arfang Badji 1,*, Lewis Machida 2, Daniel Bomet Kwemoi 3,*, Frank Kumi 4, Dennis Okii 1, Natasha Mwila 1,
Symphorien Agbahoungba 5, Angele Ibanda 1, Astere Bararyenya 1, Selma Ndapewa Nghituwamhata 1,
Thomas Odong 1, Peter Wasswa 1, Michael Otim 3, Mildred Ochwo-Ssemakula 1, Herbert Talwana 1,
Godfrey Asea 3, Samuel Kyamanywa 1 and Patrick Rubaihayo 1
Citation: Badji, A.; Machida, L.; Kwemoi,
D.B.; Kumi, F.; Okii, D.; Mwila, N.;
Agbahoungba, S.; Ibanda, A.;
Bararyenya, A.; Nghituwamhata, S.N.;
Odong, T.; et al. Factors Influencing
Genomic Prediction Accuracies of
Tropical Maize Resistance to Fall
Armyworm and Weevils. Plants 2021,
10, 29. https://dx.doi.org/10.3390/
plants10010029
Received: 13 July 2020
Accepted: 14 September 2020
Published: 24 December 2020
Publisher’s Note: MDPI stays neu-
tral with regard to jurisdictional claims
in published maps and institutional
affiliations.
Copyright: © 2020 by the authors. Li-
censee MDPI, Basel, Switzerland. This
article is an open access article distributed
under the terms and conditions of the
Creative Commons Attribution (CC BY)
license (https://creativecommons.org/
licenses/by/4.0/).
1 Department of Agricultural Production, Makerere University, Kampala P.O. Box 7062, Uganda;[email protected] (D.O.); [email protected] (N.M.); [email protected] (A.I.);[email protected] (A.B.); [email protected] (S.N.N.); [email protected] (T.O.);[email protected] (P.W.); [email protected] (M.O.-S.); [email protected] (H.T.);[email protected] (S.K.); [email protected] (P.R.)
2 Alliance Bioversity-CIAT, Africa-Office, Kampala P.O. Box 24384, Uganda; [email protected] National Crops Resource Research Institute, Kampala P.O. Box 7084, Uganda;
[email protected] (M.O.); [email protected] (G.A.)4 Department of Crop Science, University of Cape Coast, Cape Coast PMB, Ghana; [email protected] Laboratory of Applied Ecology, University of Abomey-Calavi, Cotonou 01BP 526, Benin;
[email protected]* Correspondence: [email protected] (A.B.); [email protected] (D.B.K.)
Abstract: Genomic selection (GS) can accelerate variety improvement when training set (TS) sizeand its relationship with the breeding set (BS) are optimized for prediction accuracies (PAs) ofgenomic prediction (GP) models. Sixteen GP algorithms were run on phenotypic best linear unbiasedpredictors (BLUPs) and estimators (BLUEs) of resistance to both fall armyworm (FAW) and maizeweevil (MW) in a tropical maize panel. For MW resistance, 37% of the panel was the TS, and the BSwas the remainder, whilst for FAW, random-based training sets (RBTS) and pedigree-based trainingsets (PBTSs) were designed. PAs achieved with BLUPs varied from 0.66 to 0.82 for MW-resistancetraits, and for FAW resistance, 0.694 to 0.714 for RBTS of 37%, and 0.843 to 0.844 for RBTS of 85%,and these were at least two-fold those from BLUEs. For PBTS, FAW resistance PAs were generallyhigher than those for RBTS, except for one dataset. GP models generally showed similar PAs acrossindividual traits whilst the TS designation was determinant, since a positive correlation (R = 0.92***)between TS size and PAs was observed for RBTS, and for the PBTS, it was negative (R = 0.44**). Thisstudy pioneered the use of GS for maize resistance to insect pests in sub-Saharan Africa.
Keywords: prediction accuracy; mixed linear and Bayesian models; machine learning algorithms;training set size and composition; parametric and nonparametric models
1. Introduction
Insect damage on maize plants and stored grains potentially impedes food securityin Africa [1–3]. The fall armyworm (FAW) and stem borers in the field, and the maizeweevils (MWs) in storage facilities, are some of the most devastating insect pests on thecontinent. These insect pests cause yield losses ranging from 10–90% leading to loss ofgrain marketability, and consumer health concerns due to the possible contamination of thegrain with mycotoxins, such as aflatoxins [3–6]. In Africa, tremendous efforts were madeduring the last two decades to build host plant resistance to insect pests in maize throughtraditional pedigree (phenotypic)-based selection (PS) with substantial desirable results.Several Africa-adapted maize lines were developed and successfully tested for resistance toMW damage on grains [7–12]. Some of the success stories are from the International Centerfor Maize and Wheat Improvement (CIMMYT) of Kenya through the Insect Resistant Maize
Plants 2021, 10, 29. https://dx.doi.org/10.3390/plants10010029 https://www.mdpi.com/journal/plants
81
Plants 2021, 10, 29
for Africa project (IRMA) that produced several storage pest and stem borer resistant maizelines [7,8,13–15]. On the other hand, the FAW is a new pest on the continent, first reportedin 2016 in West and Central African countries [16], from where it spread throughout theAfrican continent [17]. Hence, although efforts to develop FAW resistant varieties areunderway at several institutions, including CIMMYT, published reports of FAW resistantvarieties are not yet available [18,19].
The complex nature of insect resistance traits makes PS slow and expensive, and thus,difficult to implement, especially for resource-constrained breeding programs [20]. Appli-cation of traditional marker-assisted selection (MAS) is hampered by the necessity to firstdiscover resistance-associated genomic regions through genetic linkage and genome-wideassociation mapping methods, both with several shortcomings, especially for complextraits [21–23]. In addition, genetic linkage and genome-wide association mapping studieshave seldom been explored in African germplasm [8,24], which further impedes the ap-plication of MAS in the development of insect resistance maize germplasm in Africa. Ina previous study, we discovered several quantitative trait nucleotides and genes that areputatively associated with FAW and MW resistance, confirming the quantitative nature ofthese traits, hence the difficulty in improving these traits through MAS [25]. An alternativeto both PS and MAS is genomic selection (GS), which uses whole-genome markers to per-form genomic prediction (GP) of breeding values of unphenotyped genotypes, from whichone can select superior candidate genotypes for crossing to produce hybrids or to advanceto the next generation [26]. GS was reported to achieve up to threefold annual geneticgain in maize improvement when compared to MAS, due to a more efficient accounting oftrait-associated quantitative trait loci (QTL), faster selection cycles, and lower phenotypingcosts [27–33].
Several statistical and machine learning GP models with various strengths and weak-nesses have been developed to adapt to different contexts that are partly influenced bythe genetic architecture of traits (number and effect size of QTL, proportions of additiveand non-additive genetic effects) and reproductive classes of plants (allogamous vs. auto-gamous vs. clonally propagated) [34–36]. Therefore, to effectively implement GS in cropimprovement programs, it is necessary to employ a holistic approach to determine thebest GP strategy for particular breeding targets for given crop species [31,37]. Statisticalmodels for GS vary in their prior assumptions and treatment of marker effects [31]. Para-metric models focus on parameter estimates rather than prediction, while nonparametricalgorithms give priority to prediction and have fewer assumptions [38]. Some parametricmethods assume the SNP effects follow a normal distribution with equal variance for allloci, which seems unrealistic in practice.
Representative parametric methods are ridge regression best linear unbiased predic-tors (RR-BLUP) [39] and genomic BLUP (GBLUP) [40]. GBLUP was the first GP methodto be developed, and it replaced the traditional pedigree-based relationship matrix with agenomic information-based matrix to improve prediction accuracies (PAs) [41]. Parametricmethods BayesA [26] and weighted Bayesian shrinkage regression (wBSR) [42], on theother hand, consider a prior distribution of effect with a higher probability of moderateto large effects. Regarding parametric models such as BayesB [43] and BayesCπ [44], as-sumptions are made that consider the effects of some SNPs to be zero. The Bayesian leastabsolute shrinkage and selection operator (Bayesian LASSO) assumes that the effects of allmarkers follow a double exponential distribution [45], whilst the Bayesian sparse linearmixed model (BSLMM), a parametric method developed by Zhou et al. [46], combines thehypotheses of both GBLUP and Bayesian methods and achieves higher PAs than BayesCπ
and BayesLASSO. Nonparametric or semi-parametric approaches such as random forestand reproducing kernel Hilbert space (RKHS) [47,48] are better suited for accounting fornon-additive genetic effects (37,38), in contrast with parametric genomic prediction mod-els [23,38,47,49]. Several studies compared the performances of GP models under differentconditions. In a simulation study, Meuwissen et al. [26] found that while GBLUP achievedPAs of up to 73.2%, BayesA and BayesB comparatively provided additional increases of
82
Plants 2021, 10, 29
around 9% and 16%, respectively. However, when a population is composed of close rela-tives and the target traits are controlled by several small effect genes, the different methodsperform similarly [50–52]. On the contrary, BayesB and BayesCπ are better when dealingwith distant relatives and traits affected by a small number of large-effect loci [23]. Kernelmethods such as RKHS are robust in predicting non-additive effects and in solving complexmulti-environment multi-trait models [53,54]. Compared to the above-mentioned paramet-ric methods, deep learning techniques such as support vector regression (SVR), multilayerperceptron, and convolutional neural networks models performed poorly in some stud-ies [55,56]. However, there are also instances where RKHS outperformed one or severalof the parametric methods, for instance, GBLUP, rrBLUP, and Bayesian algorithms, interms of several traits in several crops including maize [51,57–59]. These results were mostlikely because nonparametric GS models capture more adequately the non-additive geneticcomponents which are an essential characteristic of complex traits [23,37,38] and hencecould be good candidate tools for the prediction of FAW and MW-resistance traits which arecontrolled by both additive and non-additive gene action [21,23,31,41,60]. Therefore, sinceGP for maize resistance to insect pests such as FAW and MW is not yet well explored, it ispivotal to compare performances of several available prediction algorithms to inform betterfuture GS programs. Therefore, the Genomic Prediction 0.2.6 plugin of the KDCompute1.5.2. beta (https://kdcompute.igss-africa.org/kdcompute/home), an online databasedeveloped by Diversity Array Technologies (DArT, https://www.diversityarrays.com)for the analysis of DArT marker data, presents great interest for this purpose. It hostsa suite of parametric, semiparametric, and nonparametric GP methods that can be runsimultaneously on genotype-phenotype datasets.
Additional factors that influence PAs are the different sizes of the training sets (TSs)and breeding sets (BS) and their genetic relationships, the number of markers used toestimate genomic estimated breeding values (GEBV) of lines, the population structure,and the extent of linkage disequilibrium [21,23,31,41,60]. Since phenotyping is the currentbottleneck in plant breeding and one of the disadvantages of GP is the requirement oflarge TSs for high PAs to be achieved, determination of effective TS composition and sizeis critical for effective implementation of GS in crop improvement programs [21,61–64].Additionally, the best TS determination will depend on the genetic architecture and theextent of population structure of the trait targeted for GP [63], two parameters that aresubstantially variable among plant breeding traits. Another factor that is a determinant ofthe predictive ability is the kinship between the TS and the BS (63). Several methods areused for TS optimization and these generally fall into two categories—namely, untargetedand targeted approaches. For the untargeted approach, the TS is determined independentlyof its genomic information, whereas the targeted method considers the genomic relationshipbetween the TS and the BS as a means of maximizing PAs [65]. However, deciding on thebest TS selection method is not straightforward and depends on context [66].
Furthermore, in maize, GPs were previously conducted using either genotypic bestlinear unbiased estimators (BLUEs) [67–69] or best linear unbiased predictors (BLUPs) [31,41,70] as means of phenotypic correction [70]. BLUEs are obtained by treating the genotypiceffect of a mixed linear model as fixed effects and provide an estimated mean for eachindividual of a population equal to its true value. On the other hand, BLUPs generatedby considering the genotypic factors as random and allowing for the shrinkage of themeans towards the population mean [71]. Whether to use BLUPs or BLUEs in GP isdebatable. Phenotypic BLUEs allow avoiding double penalization which BLUPs sufferfrom. With phenotypic BLUPs, this double penalization is, however, compensated throughmaximization of the correlation between predicted and true line values, while phenotypicBLUEs do not rely on this shrinkage [70]. However, the shrinkage in the BLUP procedureaccounts better for outliers and environmental variabilities [72], permitting better estimatesof individual genetic effects than BLUEs [71], and therefore, it usually yields more accu-rate predictions of phenotypic performance [70,72,73]. Furthermore, BLUPs are better inhandling unbalanced data, wherein, for example, the number of individuals is not the
83
Plants 2021, 10, 29
same in different locations or in the different replications of an experiment [49,70]. On thatbasis, the current study was conducted to evaluate the efficacies of different parametric,semiparametric, and nonparametric methods from both statistical and machine learningGP models in generating prediction accuracies (PAs) for maize resistance to FAW and MWin a diverse panel using both genotypic BLUEs and BLUPs.
2. Material and Methods
2.1. Genetic Material and Field Experiments
The panel used in this study consisted of 358 maize lines with diverse genetic andgeographic backgrounds, and they were sourced from the National Crop Resources Re-search Institute (NaCRRI/Namulonge, Uganda), the International Institute for TropicalAgriculture (IITA/Ibadan, Nigeria), and The International Maize and Wheat ImprovementCenter (CIMMYT/Nairobi, Kenya). The panel consisted of 71 inbred lines developed forvarious purposes at NaCRRI; 28 and five stem borer (SB)-resistant inbred lines from CIM-MYT [6,13,14] and IITA, respectively; 19 storage pest (SP)-resistant inbred lines [7,8]; and adoubled haploid (DH) panel of 235 lines developed at CIMMYT using six parents—threeof which were stem borer-resistant, one was a storage pest-resistant inbred line (these werealso included in the population), and two were CML elite lines (one, CML132 was includedin the panel) (Supplementary Materials Table S1).
The panel was planted and evaluated in three environments, at Mubuku IrrigationExperimental Station in Kasese, western Uganda in 2017 (316 lines) during the second rainyseason (2017B) and the National Crop Resources Research Institute (NaCRRI), Namulonge,central Uganda in 2018 (92 lines) and 2019 (252 lines) both during the first rainy seasons(2018A and 2019A, respectively). Detailed information on these locations is presentedin Table 1.
Table 1. Geographical, climatic, and soil characteristics of the planting locations [74].
LocationsGeographicalCoordinates
Altitude aboveSea Level
MinimumRainfall
SoilCharacteristics
Kasese 0◦16′10” N30◦6′9” E 1330 m asl 1000 mm Sandy loam soils
with a pH of 5.68
Namulonge 0◦31′30” N32◦36′54” E 1160 m asl 1300 mm Oxisols with a
pH of 5.8
Each combination of location and season was considered an environment, resultingin a total of three environments. An augmented experimental design was adopted in allthree environments using six checks in 2017B, two in 2018A, and four in 2019A replicatedin all the blocks. The experiments in 2017B, 2018A, and 2019A consisted of twelve, five,and ten blocks, respectively, containing the replicated checks and unreplicated lines andthe experiment in 2018A was replicated twice.
2.2. Genotyping, Quality Control, and Imputation for Genomic Prediction Analyses
Genotyping of the panel and SNP quality were described in our previous study [25].In brief, maize leaves at the sixth-leaf stage of development were harvested from 341 of the358 lines of the panel (5–10 plants per line) in 2017B and 2018A (for lines not captured in2017B). The leaf samples were oven-dried overnight at 36 degrees Celsius and shipped tothe Biosciences east and central Africa (BecA) Laboratory of the International LivestockResearch Institute (ILRI, Nairobi, Kenya) for DNA extraction and genotyping. DiversityArray Technology (DArT) genotyping facilities (44) were used to successfully identify34,509 SNPs from 341 of the 358 lines composing the panel; hence, only these lines wereconsidered for the GP analyses. Duplicate SNPs were first removed using the R packageDartR (45), leaving 28,919 unique SNPs (DRSNP) distributed across all the 10 chromosomesof the entire maize genome.
84
Plants 2021, 10, 29
The DRSNP dataset was imputed before GP using KDCompute 1.5.2. beta (https://kdcompute.igss-africa.org/kdcompute/home), an online database developed by DiversityArray Technologies (DArT, https://www.diversityarrays.com) for the analysis of DArTmarker data. KDCompute uses a suit of imputation methods to impute the SNP datasetand scores the imputation results by calculating simple matching coefficient (SMC). Themethod with the highest SMC is considered as optimal and used to impute the originalgenotypic dataset.
2.3. FAW and MW Resistance Phenotyping
After germination, plants were left unprotected to allow sufficient natural pressureof fall armyworm (FAW) population to build up. FAW damage scoring in all the threeenvironments was carried out two months after planting when adequate natural FAWinfestation levels had manifested, and scoring was based on a visual assessment using ascale of 1 (no or minor leaf damage) to 9 (all leaves highly damaged) [75], illustrated inFigure S1 [18].
Rearing of and bioassays for MW were performed as described in previous experi-ments carried out at NaCRRI [76,77]. Weevils were reared prior to the MW bioassay toobtain enough insects aged between 0 to 7 days for infestation. During rearing, standardconditions were provided for weevils to ensure proper acclimatization during the exper-iment. Rearing was carried out by preparing a weevil-maize grain culture of 300–400unsexed insects and 1.5 kg of grains contained in 3000 cm3 plastic jars incubated for 14 daysin the laboratory at a temperature of 28 ± 2 ◦C and relative humidity of 70% ± 5%, toenhance oviposition. The lids of the jars were perforated and a gauze-wire mesh with apore size smaller than one mm was fitted on each lid to allow proper ventilation whilepreventing the weevils from escaping.
After harvesting and shelling, grains of each line were bulked across environments.Then, samples of 30 g were weighed from each grain bulk, aiming to produce threereplicates per line for the MW bioassay experiment. However, due to the lack of anadequate amount of grains for most of the lines of the panel, only 64, 123, and 132 linescould generate three, two, and one replicates, respectively, and were therefore consideredfor the MW bioassay experiment. Each of these samples was wrapped in polythene bagsand kept at −20 ◦C for 14 days to eliminate any weevil infestation prior to the start of theexperiment. After this disinfestation process, samples were left to thaw and transferredinto 250 cm3 glass jars and infested with 32 unsexed weevils. After 10-days of incubationto allow oviposition, all dead and living adult insects were removed. One month afterinfestation (MAI), each sample was removed from its jar, and the grains and the flourwere isolated and their weights were recorded. The total number of holes inflicted bythe weevils on the grains was counted along with the number of grains affected by suchdamages. Additionally, the numbers of dead and living weevils were recorded. Afterthese measurements were collected, the grains were returned to their respective jars and allthe measurements were repeated at two and three MAI. The collected data were used toinfer, for each sample, the cumulative grain weight loss (GWL), the cumulative number ofemerged adult weevil progenies (AP), and the final number of damage-affected kernels(AK).
2.4. Statistical Analyses of the Phenotypic Data
Both best linear unbiased estimators (BLUEs) and predictors (BLUPs) were generatedusing the general linear model with only phenotype option of the software Trait Associationthrough Evolution and Linkage (TASSEL) [78] and the ranef function of the R package [79]lme4 [80], respectively. The mixed linear model for generating BLUEs (all factors consideredas fixed) and BLUPs (all factors considered as random) for MW traits (GWL, AP, AK, NH,and FP) was as follows:
Y = μ + Replication + Genotype + Error
85
Plants 2021, 10, 29
The mixed model for generating BLUEs (all factors considered as fixed) and BLUPs(with all factors considered as random) for FAW damage scores across environments modelwas:
Y = μ + Location + Block + Genotype + Location : Genotype + Error
where μ in the two equations is the intercept.
2.5. Strategies for TS and BS Determination2.5.1. MW Resistance Traits
Due to inadequate amount of seeds, only 37% (126 out of 341 that had genotypic data)of lines from the panel had phenotypic data on grain weight loss (GWL), adult progenyemergence (AP), and number of affected kernels (AK). Therefore, to estimate GP accuraciesfor MW resistance, these 126 lines were used as the TS and the remaining 215 lines withonly genotypic data constituted the breeding set (BS).
2.5.2. FAW Damage Resistance
The GP analyses for FAW resistance were carried out on the 341 lines of the panelthat were genotyped and phenotyped for FAW damage resistance. To determine TS andBS sizes and compositions for the evaluation of maize resistance to FAW damage, twostrategies, namely, random-based TS (RBTS) and pedigree-based TS (PBTS), were used.
2.5.3. Random-Based TS Determination
For the RBTS, 126 (37%) lines used for GPs of MW-resistance traits were used as theTS for FAW to predict the GEBVs of the remaining 215 lines first. To build the second TS forFAW, the 215 (63%) lines used earlier as BS were considered as a TS. Then to determine thethird and fourth TSs for FAW, random selections of 75 and 85% of the lines in the entire panelwere performed through the Excel formula “=INDEX($A:$A,RANDBETWEEN(1,COUNTA($A:$A)),1)” and dragging until the adequate number of lines for each percentage deter-mined above was obtained.
2.5.4. Pedigree-Based TS Determination
The four datasets determined based on the pedigrees of the lines in the panel (PBTSstrategy) are presented in Table 2. For the first dataset (FAW.Ped1), the 235 (68.91%)CIMMYT doubled haploid (DH) lines were used as a TS and the remainder (106 lines)as a BS. Regarding the second dataset, the TS and BS were switched to consider the TSin FAW.Ped1 as BS, and BS in FAW.Ped1 as the TS. The third dataset, FAW.Ped3, hada TS composed of the 294 that were neither stem borer (SB) resistant nor storage pest(SP)-resistant lines from CIMMYT, whilst the 28 SB and 19 SP-resistant lines from CIMMYTconstituted the BS. In the last dataset, FAW.Ped4, the 235 DH lines, the 28 SB and 19 SP-resistant lines from CIMMYT, and the five SB-resistant lines from IITA amounting to 287(84.16%) genotypes were considered as the TS and the remaining 54 lines from NaCRRIlines were considered as the BS (Table 2).
Table 2. Compositions of the pedigree-based test sets (TSs) for fall armyworm (FAW) datasets.
FAW Datasets FAW.Ped1 FAW.Ped2 FAW.Ped3 FAW.Ped4
TS composition 235 DHCIMMYT lines
106 Non-DHlines
294Non-CIMMYT
SB and SPresistant lines
287 DH andCIMMYT and
IITA SB and SPlines
TS/Panel (%) 68.91 31.09 86.22 84.16
DH = doubled haploid; FAW, fall armyworm; FAW.Ped1 to 4, FAW datasets 1–4 with TS basedon pedigree information of the lines in the panel; SB, stem borer; SP, storage pest; TS, training set;CIMMYT, International Center for Maize and Wheat Improvement; IITA, International Institute forTropical Agriculture.
86
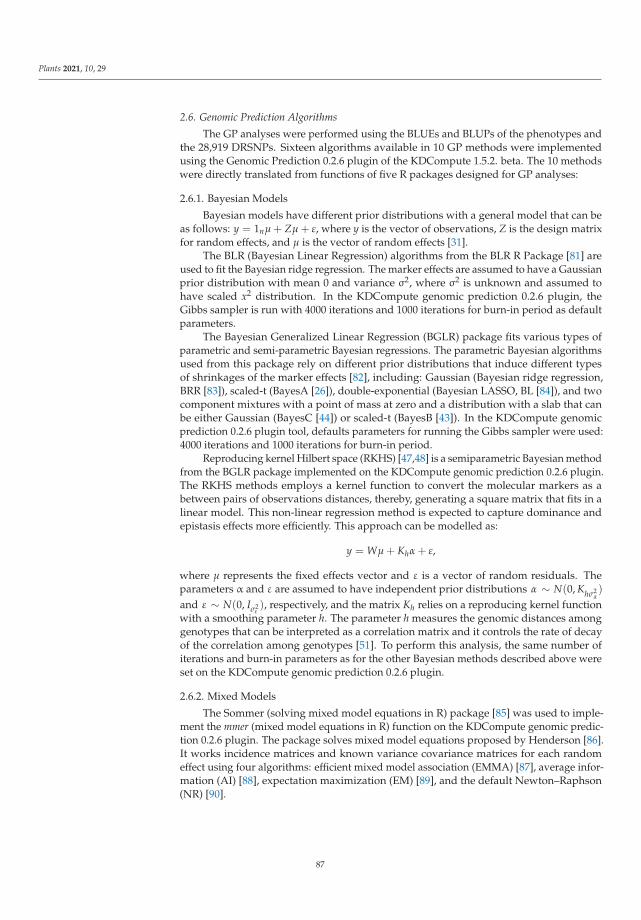
Plants 2021, 10, 29
2.6. Genomic Prediction Algorithms
The GP analyses were performed using the BLUEs and BLUPs of the phenotypes andthe 28,919 DRSNPs. Sixteen algorithms available in 10 GP methods were implementedusing the Genomic Prediction 0.2.6 plugin of the KDCompute 1.5.2. beta. The 10 methodswere directly translated from functions of five R packages designed for GP analyses:
2.6.1. Bayesian Models
Bayesian models have different prior distributions with a general model that can beas follows: y = 1nμ + Zμ + ε, where y is the vector of observations, Z is the design matrixfor random effects, and μ is the vector of random effects [31].
The BLR (Bayesian Linear Regression) algorithms from the BLR R Package [81] areused to fit the Bayesian ridge regression. The marker effects are assumed to have a Gaussianprior distribution with mean 0 and variance σ2, where σ2 is unknown and assumed tohave scaled x2 distribution. In the KDCompute genomic prediction 0.2.6 plugin, theGibbs sampler is run with 4000 iterations and 1000 iterations for burn-in period as defaultparameters.
The Bayesian Generalized Linear Regression (BGLR) package fits various types ofparametric and semi-parametric Bayesian regressions. The parametric Bayesian algorithmsused from this package rely on different prior distributions that induce different typesof shrinkages of the marker effects [82], including: Gaussian (Bayesian ridge regression,BRR [83]), scaled-t (BayesA [26]), double-exponential (Bayesian LASSO, BL [84]), and twocomponent mixtures with a point of mass at zero and a distribution with a slab that canbe either Gaussian (BayesC [44]) or scaled-t (BayesB [43]). In the KDCompute genomicprediction 0.2.6 plugin tool, defaults parameters for running the Gibbs sampler were used:4000 iterations and 1000 iterations for burn-in period.
Reproducing kernel Hilbert space (RKHS) [47,48] is a semiparametric Bayesian methodfrom the BGLR package implemented on the KDCompute genomic prediction 0.2.6 plugin.The RKHS methods employs a kernel function to convert the molecular markers as abetween pairs of observations distances, thereby, generating a square matrix that fits in alinear model. This non-linear regression method is expected to capture dominance andepistasis effects more efficiently. This approach can be modelled as:
y = Wμ + Khα + ε,
where μ represents the fixed effects vector and ε is a vector of random residuals. Theparameters α and ε are assumed to have independent prior distributions α ∼ N(0, Khσ2
α)
and ε ∼ N(0, Iσ2ε), respectively, and the matrix Kh relies on a reproducing kernel function
with a smoothing parameter h. The parameter h measures the genomic distances amonggenotypes that can be interpreted as a correlation matrix and it controls the rate of decayof the correlation among genotypes [51]. To perform this analysis, the same number ofiterations and burn-in parameters as for the other Bayesian methods described above wereset on the KDCompute genomic prediction 0.2.6 plugin.
2.6.2. Mixed Models
The Sommer (solving mixed model equations in R) package [85] was used to imple-ment the mmer (mixed model equations in R) function on the KDCompute genomic predic-tion 0.2.6 plugin. The package solves mixed model equations proposed by Henderson [86].It works incidence matrices and known variance covariance matrices for each randomeffect using four algorithms: efficient mixed model association (EMMA) [87], average infor-mation (AI) [88], expectation maximization (EM) [89], and the default Newton–Raphson(NR) [90].
87
Plants 2021, 10, 29
The model by Sommer can be formulated as [85]: y = Xβ + Zμ + ε with varianceV(y) = V(Zμ + ε) = ZGZ′ + R Additionally, the mixed model equations for this modelare: [
X′R−1X X′R−1ZZ′R−1X Z′R−1Z + G−1
]−1[ X′R−1yZ′R−1y
]=
[βμ
]
where G = Kσ2ω is the variance covariance matrix of the random effect μ, from a multi-
variate normal distribution μ ∼ MVN(0, Kσ2μ), K is the additive or genomic relationship
matrix (A or Ag) in the genomics context, X and Z are incidence matrices for fixed andrandom effects, respectively, and R is the matrix for residuals (here Iσ2
e ). A mixed modelwith a single variance component other than the error (σ2
e ) can be used to estimate the ge-netic variance (σ2
μ) along with genotype BLUPs to exploit the genetic relationships betweenindividuals coded in K(A). The genomic relationship matrix was constructed according toVanRaden where K = ZZ′/2 ∑ pi(1 − pi) [91].
The ridge regression best linear unbiased predictor (rrBLUP) packages can eitherestimate marker effects by ridge regression, or alternatively, BLUPs can be calculated basedon an additive relationship matrix or a Gaussian kernel. Additionally, using the rrBLUPpackage, the mixed model solution (MMS) that calculates the maximum-likelihood (ML)or restricted-ML (REML) solutions for mixed models to perform GP [92] was fitted in theKDCompute genomic prediction 0.2.6 plugin.
The mixed models fitted by rrBLUP can be formulated as:
y = Xβ + Zμ + ε,
where β is a vector of fixed effects and μ is a vector of random effects with varianceVar[μ] = Kσ2
μ. The residual variance is Var[ε] = Iσ2
ε. This class of mixed models, in which
there is a single variance component other than the residual error, has a close relationshipwith ridge regression (ridge parameter λ = σ2
ε /σ2μ) (https://kdcompute.igss-africa.org/
kdcompute/home).
2.6.3. Machine Learning Algorithms
The R package RandomForest that implements Breiman’s random forest algorithmfor classification and regression [93] was used on the KDCompute genomic prediction0.2.6 plugin to fit the function missForest. Random forest is a non-linear machine learningalgorithm that uses a two-layer randomization process to build decorrelated bootstrappedtrees. As a first randomization layer, it builds multiple trees using a bootstrap sampleof the marker data in the training. Then, a second randomization process is carried atthe novel nodes to grow final trees. The random forest method selects at each node ofeach tree, a random subset of variables, and only those variables are used as candidatesto find the best split for the node [94]. To predict the breeding value of a line in the TS,predictions over trees for which the given observation was not used to build the tree areaveraged [51]. On the KDCompute 1.5.2. beta platform, both options for the mtry, squareroot and regression (sqrt(p) and p/3, respectively, where p is number of variables in x), forthe classification of the number of variables randomly sampled as candidates at each splitwere implemented in this study. Additionally, the trees to grow (ntree) was set to 10, whilenode size (minimum size of terminal nodes) and max nodes (maximum number of terminalnodes trees in the forest can have) were set to 5 and 10, respectively. The 16 methods usedin this study and their statistical characteristics are presented in Table 3.
88
Plants 2021, 10, 29
Table 3. Genomic prediction methods used for the analysis of the different traits and datasets.
GP Algorithms Abbreviations Method Type
1 Sommer with Average Information(AI) mmer_AI Parametric/Mixed model
2 Sommer with ExpectationMaximization (EM) mmer_EM Parametric/Mixed model
3 Sommer with Efficient Mixed ModelAssociation (EMMA) mmer_EMMA Parametric/Mixed model
4 Sommer with defaultNewton-Raphson (NR) mmer-NR Parametric/Mixed model
5 Ridge-regression Best linear unbiasedPredictor rrBLUP Parametric/Mixed model
6 Mixed Model solution withMaximum Likelihood (ML) mms_ML Parametric/Mixed model
7 Mixed Model solution with RestrictedMaximum Likelihood (REML) mms_REML Parametric/Mixed model
8 BayesB BayesB Parametric/Bayesian9 BayesA BayesA Parametric/Bayesian
10 BayesC BayesC Parametric/Bayesian
11 Bayesian least absolute shrinkage andselection operator (LASSO) BL Parametric/Bayesian
12 Bayesian Ridge Regression BRR Parametric/Bayesian13 Bayesian Linear Regression BLR Parametric/Bayesian14 Reproducible kernel Hilbert space RKHS Semi-parametric/Bayesian15 Random Forest with Square root missForest_Sqt Nonparametric/Machine Learning16 Random Forest with Regression missForest_Reg Nonparametric/Machine Learning
2.7. Cross-Validations and PA Estimation
To calculate the predictive accuracies of each of the 17 methods, a cross-validationapproach was performed using the data for the TS with 10 folds and five repetitionsamounting to 50 replications. The PAs were estimated as the correlation coefficient (R2)averaged across the 50 cross-validation replications between the observed phenotypicvalues and the predicted genomic-estimated breeding values (GEBV) (https://kdcompute.igss-africa.org/kdcompute/plugins).
3. Results
3.1. Higher PAs Achieved for FAW and MW-Resistance Traits with BLUPs when Compared toBLUEs across GP Algorithms
Both genotypic BLUEs and BLUPs for resistance to FAW and MW traits such as AK,AP, and GWL were used in GPs. In general, BLUPs produced better predictions than BLUEsby at least two orders of magnitude in terms of PAs (Figure 1). The PAs realized withBLUEs (Figure S2) varied from −0.246 for FAW (mms_ML) to 0.299 for AP (BayesB), whilePAs for BLUPs ranged from 0.668 for AP (mmer_NR) to 0.823 for AP (missForest_Reg).The differences in terms of accuracies between BLUEs and BLUPs were high, despite thehighly significant (p < 0.001) correlations between BLUEs and BLUPs for each trait rangingfrom 0.93 for FAW to close to 1 for AP, AK, and GWL (presented in Figure 1); therefore,only results for BLUPs will be presented hereafter.
89
Plants 2021, 10, 29
Figure 1. Boxplot of PAs (prediction accuracies) for best linear unbiased estimators(BLUEs) (in pink) and predictors (BLUPs) (in blue) of maize resistance to FAW and MWacross prediction models and correlations (r) between BLUEs and BLUPs for each trait.FAW, fall armyworm; GWL, grain weight loss; AP, adult progeny emergence; AK, numberof affected kernels. *** significant at p < 0.001.
3.2. PAs for MW Resistance Traits Using BLUPs
The PAs were generally high for the tested MW traits, mostly above 0.668 across the12 GP models that were successfully run on the datasets (Figure 2); however, RKHS failed towork for AK. The highest PAs were achieved for AP with missForest_reg (0.823), followedby BRR (0.805), and RKHS (0.804), whilst mmer_NR algorithm had the lowest predictionaccuracy of 0.667 (Figure 2). The PAs achieved for GWL ranged from 0.742 for missFor-est_Sqt to 0.795 for mmer_NR, while for AK, they varied from 0.749 for missForest_sqrtto 0.779 for BRR (Figure 2). In general, Bayesian models predicted better than both mixedmodel and machine learning methods, although the differences were small (Figure S3).
90
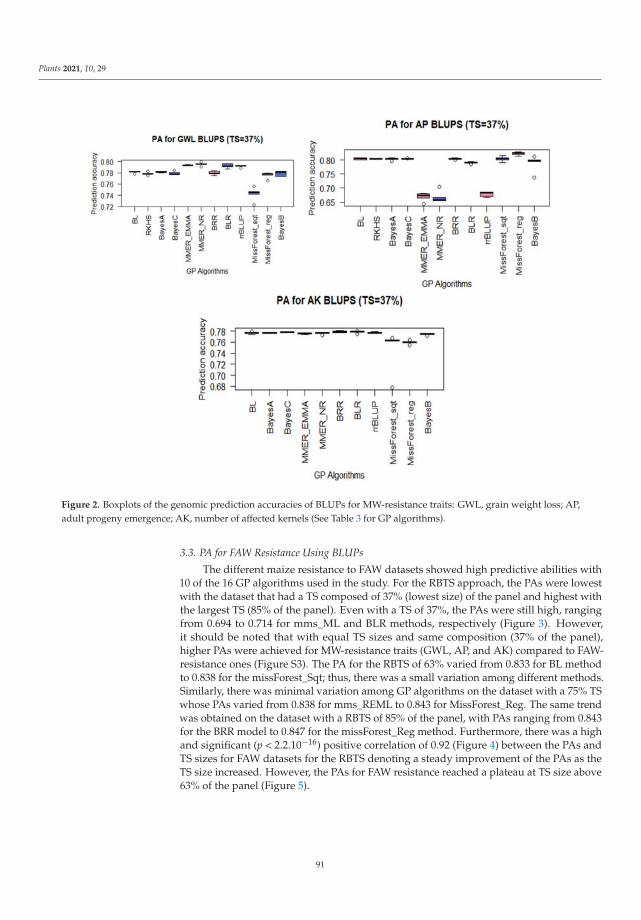
Plants 2021, 10, 29
Figure 2. Boxplots of the genomic prediction accuracies of BLUPs for MW-resistance traits: GWL, grain weight loss; AP,adult progeny emergence; AK, number of affected kernels (See Table 3 for GP algorithms).
3.3. PA for FAW Resistance Using BLUPs
The different maize resistance to FAW datasets showed high predictive abilities with10 of the 16 GP algorithms used in the study. For the RBTS approach, the PAs were lowestwith the dataset that had a TS composed of 37% (lowest size) of the panel and highest withthe largest TS (85% of the panel). Even with a TS of 37%, the PAs were still high, rangingfrom 0.694 to 0.714 for mms_ML and BLR methods, respectively (Figure 3). However,it should be noted that with equal TS sizes and same composition (37% of the panel),higher PAs were achieved for MW-resistance traits (GWL, AP, and AK) compared to FAW-resistance ones (Figure S3). The PA for the RBTS of 63% varied from 0.833 for BL methodto 0.838 for the missForest_Sqt; thus, there was a small variation among different methods.Similarly, there was minimal variation among GP algorithms on the dataset with a 75% TSwhose PAs varied from 0.838 for mms_REML to 0.843 for MissForest_Reg. The same trendwas obtained on the dataset with a RBTS of 85% of the panel, with PAs ranging from 0.843for the BRR model to 0.847 for the missForest_Reg method. Furthermore, there was a highand significant (p < 2.2.10−16) positive correlation of 0.92 (Figure 4) between the PAs andTS sizes for FAW datasets for the RBTS denoting a steady improvement of the PAs as theTS size increased. However, the PAs for FAW resistance reached a plateau at TS size above63% of the panel (Figure 5).
91
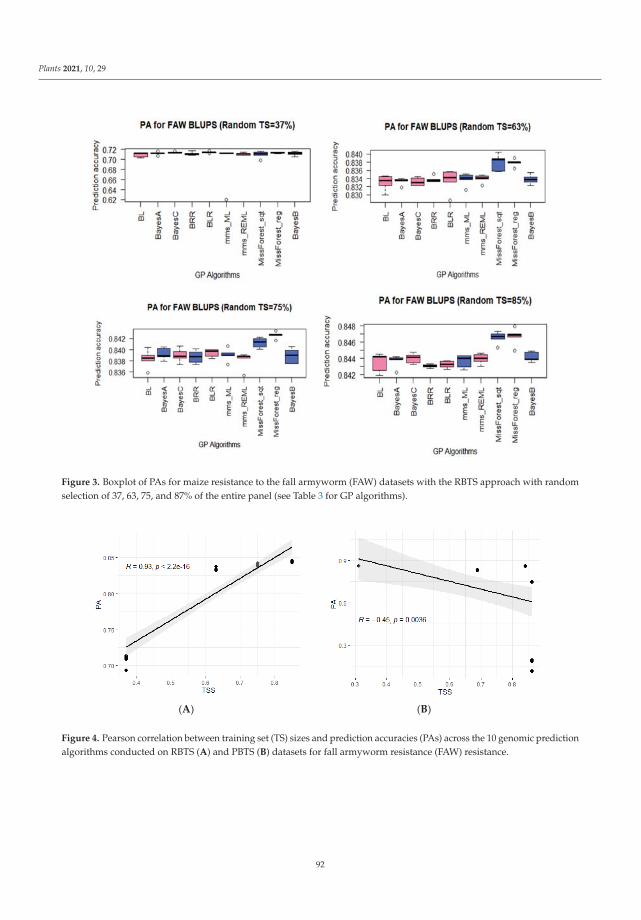
Plants 2021, 10, 29
Figure 3. Boxplot of PAs for maize resistance to the fall armyworm (FAW) datasets with the RBTS approach with randomselection of 37, 63, 75, and 87% of the entire panel (see Table 3 for GP algorithms).
(A) (B)
Figure 4. Pearson correlation between training set (TS) sizes and prediction accuracies (PAs) across the 10 genomic predictionalgorithms conducted on RBTS (A) and PBTS (B) datasets for fall armyworm resistance (FAW) resistance.
92
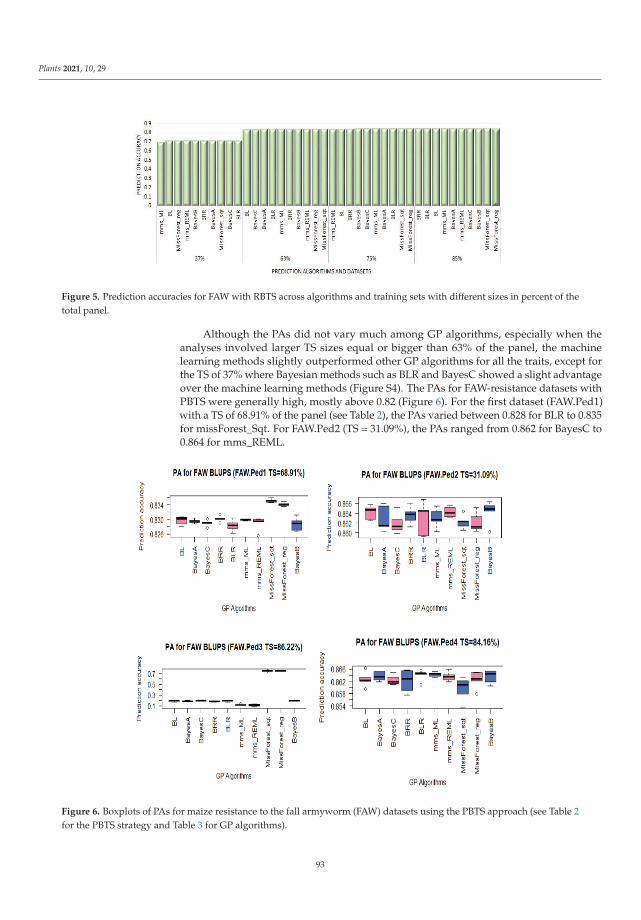
Plants 2021, 10, 29
Figure 5. Prediction accuracies for FAW with RBTS across algorithms and training sets with different sizes in percent of thetotal panel.
Although the PAs did not vary much among GP algorithms, especially when theanalyses involved larger TS sizes equal or bigger than 63% of the panel, the machinelearning methods slightly outperformed other GP algorithms for all the traits, except forthe TS of 37% where Bayesian methods such as BLR and BayesC showed a slight advantageover the machine learning methods (Figure S4). The PAs for FAW-resistance datasets withPBTS were generally high, mostly above 0.82 (Figure 6). For the first dataset (FAW.Ped1)with a TS of 68.91% of the panel (see Table 2), the PAs varied between 0.828 for BLR to 0.835for missForest_Sqt. For FAW.Ped2 (TS = 31.09%), the PAs ranged from 0.862 for BayesC to0.864 for mms_REML.
Figure 6. Boxplots of PAs for maize resistance to the fall armyworm (FAW) datasets using the PBTS approach (see Table 2for the PBTS strategy and Table 3 for GP algorithms).
93
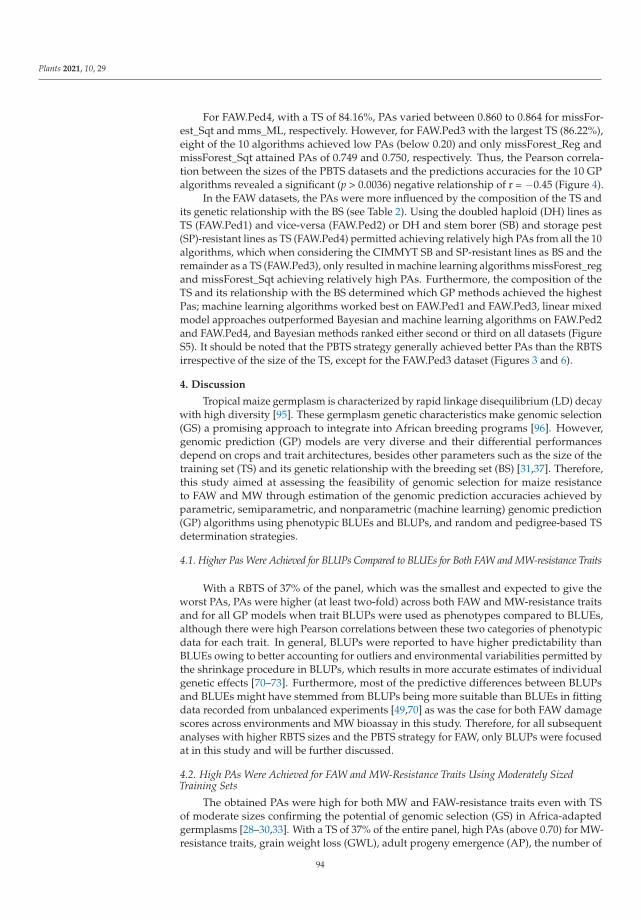
Plants 2021, 10, 29
For FAW.Ped4, with a TS of 84.16%, PAs varied between 0.860 to 0.864 for missFor-est_Sqt and mms_ML, respectively. However, for FAW.Ped3 with the largest TS (86.22%),eight of the 10 algorithms achieved low PAs (below 0.20) and only missForest_Reg andmissForest_Sqt attained PAs of 0.749 and 0.750, respectively. Thus, the Pearson correla-tion between the sizes of the PBTS datasets and the predictions accuracies for the 10 GPalgorithms revealed a significant (p > 0.0036) negative relationship of r = −0.45 (Figure 4).
In the FAW datasets, the PAs were more influenced by the composition of the TS andits genetic relationship with the BS (see Table 2). Using the doubled haploid (DH) lines asTS (FAW.Ped1) and vice-versa (FAW.Ped2) or DH and stem borer (SB) and storage pest(SP)-resistant lines as TS (FAW.Ped4) permitted achieving relatively high PAs from all the 10algorithms, which when considering the CIMMYT SB and SP-resistant lines as BS and theremainder as a TS (FAW.Ped3), only resulted in machine learning algorithms missForest_regand missForest_Sqt achieving relatively high PAs. Furthermore, the composition of theTS and its relationship with the BS determined which GP methods achieved the highestPas; machine learning algorithms worked best on FAW.Ped1 and FAW.Ped3, linear mixedmodel approaches outperformed Bayesian and machine learning algorithms on FAW.Ped2and FAW.Ped4, and Bayesian methods ranked either second or third on all datasets (FigureS5). It should be noted that the PBTS strategy generally achieved better PAs than the RBTSirrespective of the size of the TS, except for the FAW.Ped3 dataset (Figures 3 and 6).
4. Discussion
Tropical maize germplasm is characterized by rapid linkage disequilibrium (LD) decaywith high diversity [95]. These germplasm genetic characteristics make genomic selection(GS) a promising approach to integrate into African breeding programs [96]. However,genomic prediction (GP) models are very diverse and their differential performancesdepend on crops and trait architectures, besides other parameters such as the size of thetraining set (TS) and its genetic relationship with the breeding set (BS) [31,37]. Therefore,this study aimed at assessing the feasibility of genomic selection for maize resistanceto FAW and MW through estimation of the genomic prediction accuracies achieved byparametric, semiparametric, and nonparametric (machine learning) genomic prediction(GP) algorithms using phenotypic BLUEs and BLUPs, and random and pedigree-based TSdetermination strategies.
4.1. Higher Pas Were Achieved for BLUPs Compared to BLUEs for Both FAW and MW-resistance Traits
With a RBTS of 37% of the panel, which was the smallest and expected to give theworst PAs, PAs were higher (at least two-fold) across both FAW and MW-resistance traitsand for all GP models when trait BLUPs were used as phenotypes compared to BLUEs,although there were high Pearson correlations between these two categories of phenotypicdata for each trait. In general, BLUPs were reported to have higher predictability thanBLUEs owing to better accounting for outliers and environmental variabilities permitted bythe shrinkage procedure in BLUPs, which results in more accurate estimates of individualgenetic effects [70–73]. Furthermore, most of the predictive differences between BLUPsand BLUEs might have stemmed from BLUPs being more suitable than BLUEs in fittingdata recorded from unbalanced experiments [49,70] as was the case for both FAW damagescores across environments and MW bioassay in this study. Therefore, for all subsequentanalyses with higher RBTS sizes and the PBTS strategy for FAW, only BLUPs were focusedat in this study and will be further discussed.
4.2. High PAs Were Achieved for FAW and MW-Resistance Traits Using Moderately SizedTraining Sets
The obtained PAs were high for both MW and FAW-resistance traits even with TSof moderate sizes confirming the potential of genomic selection (GS) in Africa-adaptedgermplasms [28–30,33]. With a TS of 37% of the entire panel, high PAs (above 0.70) for MW-resistance traits, grain weight loss (GWL), adult progeny emergence (AP), the number of
94
Plants 2021, 10, 29
affected kernels (AK), and FAW resistance were achieved in agreement with the moderateto high heritability values for these traits as, reported earlier [21,31,41]. These results aresignificantly important considering that one of the disadvantages of GS is the requirementof large TS which negatively impacts the reduction of phenotyping cost [62,64].
The PAs increased up to above 0.85 in proportion to the increase in TS (RBTS approach)size for FAW resistance which was the only trait phenotyped for all the lines of the panel.It would be interesting to phenotype other lines of the panel that were not evaluatedfor MW-resistance traits to establish larger TS which may improve the PAs [31,65,97,98].Very few reports of GP are available for maize resistance to biotic stresses. High PAswere achieved for maize resistance to chlorotic mottle virus (up to 0.95) and maize lethalnecrosis (reaching 0.87) in tropical germplasm [67]. However, lower PAs of up to 0.59 wereobtained in a study that assessed the predictability of maize resistance to the Europeancorn borer [99] in temperate germplasm. Additionally, Gowda et al. (69) reported moderatePAs (close to 0.60) for maize resistance to a biotic stress, maize lethal necrosis in tropicalmaize populations.
4.3. GP Algorithms Performed Differently on FAW and MW Maize Resistance Traits
In this study, several GP models that included statistical and machine learning al-gorithms from parametric, semi-parametric, and nonparametric approaches were usedto predict FAW and MW-resistance traits. These GP algorithms, as expected, performeddifferently on the different traits although the predictive variations were generally min-imal, especially when large TS were involved, similarly to earlier model benchmarkingreports [100,101]. Bayesian models (parametric: BLR and BRR, and semi-parametric: RKHS)performed better on MW traits, GWL, AP, and AK, while nonparametric machine learningalgorithms (missForest, here), and to a lesser extent, the linear mixed model (especially inthe PBTS approach), achieved the highest PAs on FAW datasets. The differential perfor-mances of the different GP algorithms on the insect resistance traits evaluated in this studycould be due to differences in the genetic structures (extent of additive vs. non-additivegene action) of the respective traits [23,38,47,49]. Maize resistance to FAW, which wasmoderately heritable across environments [25], would be expected to be controlled byboth additive and non-additive genetic factors, including epistasis [102–104], whereas,MW-resistance traits such as GWL, AP, and AK with heritability values above 90% [25]were most likely characterized by a prevalence of additive gene action [105,106] in thecurrent panel.
This supposed genetic architecture difference between FAW and MW-resistance traitcould be the reason for non-linear methods such as random forest performing better atpredicting FAW resistance, since these are more capable of integrating epistasis in thestatistical modelling [27,51]. However, the RKHS algorithm, also a non-linear GP approachknown to efficiently handle epistatic genetic relation [51,59], did not successfully run onFAW dataset, although it was among the best models for predicting MW-resistance traits,except BLUPs for the number of affected kernels (AK), for which the RKHS algorithm didnot run successfully. In this study, the reasons for some GP algorithms failing to run eitheron MW or FAW-resistance datasets are unclear, but this could be related to the BLUPSstructure of the datasets that failed to run. It should be noted that all the algorithms ransuccessfully on phenotypic BLUEs datasets with the smallest TS (37% of the panel) beingused to compare PAs between BLUPs and BLUEs in this study. However, the two tothree-fold predictive ability gain with BLUPs compared to BLUEs would be an incentiveto consider BLUPs in future GS activities for maize resistance to MW and FAW. Overall,future GS efforts for maize resistance to MW and FAW are recommended to focus more onBayesian and machine learning algorithms such as random forest, BayesA, BayesB, BayesC,BRR, and BLR which outperformed mixed linear models for most datasets considered inthe current study.
95
Plants 2021, 10, 29
4.4. Influences of the Sizes and the Compositions of TS and BS on PAs
Two factors, the relative sizes of the TS and BS (RBTS approach) and their geneticrelationship (PBTS approach), influenced the levels of PAs across FAW-resistance datasets,corroborating earlier reports [31,63,65,97,98,107,108]. A net increase in PAs for maizeresistance to FAW was realized when the size of the TS was increased from 37% (0.694 to0.714) to 63% (0.833 to 0.838), similar to earlier reports on wheat yield [109]. This increasewas followed by a slight gain in predictability at 75% (0.837 to 0.843) and 85% (0.843 to0.847), and thus, the PAs plateaued when TS sizes above 63% were considered in thisstudy as reported earlier in other studies [21,64,109–111]. Thus, future GS programs formaize resistance to FAW could be designed around TS composed of a minimum of 60% ofthe entire breeding germplasm to achieve high genetic gains. These results were furthersupported by the highly significant (p > 2.2.10−16) positive correlation (R = 0.92) betweenTS size and PAs. Similarly, positive correlations between the number of lines in the TS andthe PAs, and plateau for the PAs were also reported by Edwards et al. [109].
The composition of the TS and its relationship with the BS are determinant factorsfor the genomic predictability of complex traits [63,112–114]. In the current study, usingthe PBTS approach, these two parameters were more important than the size of the TSsince higher PAs were achieved in FAW.Ped2 (0.862 to 0.864) with a TS of 31.09% comparedto all other FAW PBTS datasets, including FAW.Ped3 (0.114 to 0.750), with the largest TSof 66.22%. In fact, FAW.Ped3 achieved the lowest PAs among all the PBTS FAW datasets.These results were further illustrated by the significantly (p < 0.0036) negative correlation(R = −0.45) between the sizes of the PBTS and the achieved PAs.
However, it is not very clear why the predictions for the BS FAW.Ped3 (47 CIMMYTSB and SP-resistant lines) and the TS (DH, IITA SB, and NaCRRI lines) led to lower PAs forFAW.Ped3. A possible explanation could be that these two sets were distantly related sinceonly two and one CIMMYT SB and SP-resistant lines, respectively, were used as parents todevelop the DH lines. Spindel et al. [111] argued that high PAs can be achieved with small-sized TS when lines in the TS and the BS are closely related, since such TS would samplethe full genetic diversity of the population. However, the more distantly related the TS andthe BS are, the larger the required TS size to reach high PAs [111]. Using the CIMMYT SBand SP-resistant lines as a TS would most likely lead to lower PAs since such a TS would beadditionally disadvantaged by its small size (47 lines). The DH lines in the current studyare involved as a TS in most of the best performing GP datasets evaluated in the currentstudy (both in the RBTS and PBTS approaches) and as unique lines in the BS of the bestperforming pedigree-based BS (FAW.Ped2). This DH population could be of interest infuture breeding activities targeted at improving insect resistance in maize [23,115–117] andpotentially useful for GS of complex traits with low to moderate heritability [118].
5. Conclusions
This study assessed prediction accuracies of genomic-estimated breeding valuesfor fall armyworm (FAW) and maize weevil (MW)-resistance traits in a diverse Africa-adapted maize panel using several parametric, semi-parametric, and non-parametricgenomic prediction models. Prediction accuracies for maize resistance to FAW and MWtraits were relatively high, even with a moderate training set size. For FAW resistance,although the prediction accuracies were positively correlated with the size of the trainingset, the composition and the relationship of the training set with the breeding set weremore influential in predicting line performance. Additionally, TS determination-relatedparameters were more important than the type of genomic prediction models in predictingFAW and MW-resistance traits. However, Bayesian models on MW-resistance traits andmachine learning models on FAW damage resistance outperformed mixed linear modelsin almost all the datasets used in this study. Therefore, future genomic selection programsfor maize resistance to insect pests such as FAW and MW in Africa should put more effortinto designing effective training sets and use selected Bayesian and machine learning GPalgorithms to improve genetic gains, shorten breeding cycles, and accelerate variety release.
96
Plants 2021, 10, 29
Such programs could greatly benefit from using the genetically diverse maize panel usedin this study as a base population, since it consists of lines adapted to several Africanagro-ecologies.
Supplementary Materials: The following are available online at https://www.mdpi.com/2223-7747/10/1/29/s1, Figure S1: Rating of maize plants based on foliar damage by FAW, Figure S2: Boxplotof PA for best linear unbiased estimators (BLUEs) of maize resistance to the fall armyworm (FAW) andmaize weevil (MW) with identical training set size (37%) and compositions, Figure S3: Comparisonsof genomic prediction accuracies of the three best algorithms for best linear unbiased predictors(BLUPs) of maize weevil resistance traits: number of affected kernels (AK), adult progeny emergence(AP), and grain weight loss (GWL) vs., fall armyworm resistance dataset with identical TS, FigureS4: Genomic prediction accuracies of the three best algorithms for each fall armyworm resistanceBLUPs datasets with RBTS of 37, 62, 75, and 85% of the entire dataset, Figure S5: Genomic predictionaccuracies of the three best algorithms for each fall armyworm resistance BLUPs datasets with PBTS,Table S1: Descriptions of parents and crosses that constituted the doubled-haploid population.
Author Contributions: Conceptualization, A.B. (Arfang Badji), P.R., S.K., M.O., D.B.K., and L.M.;methodology, A.B. (Arfang Badji), D.B.K., and L.M.; investigation, A.B. (Arfang Badji) and D.B.K.;formal analysis, A.B. (Arfang Badji) and L.M.; resources, A.B. (Arfang Badji), G.A., M.O., D.B.K., andL.M.; visualization, A.B. (Arfang Badji); supervision, P.R., S.K., M.O., and L.M.; project administration,P.R. and M.O.; funding acquisition, A.B. (Arfang Badji), M.O., G.A., D.B.K., and P.R.; writing—originaldraft preparation, A.B. (Arfang Badji); writing—review and editing, all authors (A.B. (Arfang Badji),L.M., D.B.K., F.K., D.O., N.M., S.A., A.I., A.B. (Astere Bararyenya), S.N.N., T.O., P.W., M.O., M.O.-S.,H.T., G.A., S.K., P.R.). All authors have read and agreed to the published version of the manuscript.
Funding: This research was funded by the capacity building competitive grant training the nextgeneration of scientists provided by Carnegie Cooperation of New York through the RegionalUniversities Forum for Capacity Building in Agriculture (RUFORUM: RU/2016/Intra-ACP/RG/001).A. Badji received a Ph.D. scholarship from the Intra- ACP Academic mobility for Crop Scientists forAfrica Agriculture (CSAA) project. Genotyping of the lines was carried out through a project of D.B.K.thanks to the Integrated Genotyping Service and Support (IGSS) coordinated by the InternationalLivestock Research Institute (ILRI) and Bioscience east and central Africa (BecA), grant number:IGSS-DL0274. The National Crops Resources Research Institute (NaCRRI) of Namulonge, UGANDAthrough a grant of the USAID Feed-the-Future Uganda, Agriculture Research Activity/Maize paidthe article processing charges. Further, NaCRRI financially and logistically supported field andlaboratory activities of this research.
Acknowledgments: The authors thank all the technicians for experimental setup and data collectionin the fields and laboratories of NaCRRI at Namulonge and Kasese, UGANDA. The authors ac-knowledge NaCRRI, the International Maize and Wheat Improvement Center (CIMMYT) of Nairobi,KENYA, and the International Institute of Tropical Agriculture (IITA) of Ibadan, NIGERIA for pro-viding the original germplasm used for this research. The authors thank Clay SNELLER of the OhioState University and all the personnel of ILRI and BecA who provided the genotyping support atBecA/ILRI.
Conflicts of Interest: The authors declare no conflict of interest.
References
1. Demissie, G.; Tefera, T.; Tadesse, A. Importance of husk covering on field infestation of maize by Sitophilus zeamais Motsch(Coleoptera: Curculionidea) at Bako, Western Ethiopia. Afr. J. Biotechnol. 2008, 7, 3777–3782.
2. Shiferaw, B.; Prasanna, B.M.; Hellin, J.; Bänziger, M. Crops that feed the world 6. Past successes and future challenges to the roleplayed by maize in global food security. Food Secur. 2011, 3, 307–327. [CrossRef]
3. Awata, L.A.O.; Tongoona, P.; Danquah, E.; Ifie, B.E.; Suresh, L.M.; Jumbo, M.B.; Marchelo-D’ragga, P.W.; Sitonik, C. Understandingtropical maize (Zea mays L.): The major monocot in modernization and sustainability of agriculture in sub-Saharan Africa. Int. J.Adv. Agric. Res. 2019, 7, 32–77.
4. Nyukuri, R.W.; Wanjala, F.M.; Kirui, S.C.; Cheramgoi, E.; Chirchir, E.; Mwale, R. Damage of stem borer species to Zea maysL.,Sorghum bicolor L. and three refugia graminae. Adv. Agric. Biol. 2014, 1, 37–45.
5. Tefera, T.; Goftishu, M.; Ba, M.; Rangaswamy, M. A Guide to Biological Control of Fall Armyworm in Africa Using Egg Parasitoids,1st ed.; ICIPE: Nairobi, Kenya, 2019.
97
Plants 2021, 10, 29
6. Munyiri, S.W.; Mugo, S.N.; Otim, M.; Mwololo, J.K.; Okori, P. Mechanisms and sources of resistance in tropical maize inbred linesto Chilo partellus stem borers. J. Agric. Sci. 2013, 5, 51–60. [CrossRef]
7. Mwololo, J.K.; Mugo, S.; Okori, P.; Tefera, T.; Otim, M.; Munyiri, S.W. Sources of resistance to the maize weevil Sitophilus zeamaisin tropical maize. J. Agric. Sci. 2012, 4, 206–215.
8. Mwololo, J.K. Resistance in Tropical Maize to the Maize Weevil and Larger Grain Borer. Ph.D. Thesis, Makerere University,Kampala, Uganda, 2013.
9. Kasozi, L.C.; Derera, J.; Tongoona, P.; Tukamuhabwa, P.; Muwonge, A.; Asea, G. Genotypic variation for maize weevil resistancein eastern and southern Africa maize inbred lines. Uganda J. Agric. Sci. 2016, 17, 83–97. [CrossRef]
10. Tende, R.; Derera, J.; Mugo, S.; Oikeh, S. Estimation of genetic diversity of germplasm used to develop insect-pest resistant maize.Maydica 2016, 61, 1–8.
11. Khakata, S.; Mbute, F.N.; Chemining’wa, G.N.; Mwimali, M.; Karanja, J.; Harvey, J.; Mwololo, J.K. Post-harvest evaluation ofselected inbred lines to maize weevil Sitophilus zeamais resistance. J. Plant Breed. Crop Sci. 2018, 10, 105–114. [CrossRef]
12. Sodedji, F.K.A.; Kwemoi, D.B.; Kasozi, C.L.; Asea, G.; Kyamanywa, S. Genetic analysis for resistance to Sitophilus zeamais(Motschulsky) among provitamin-A maize germplasm. Maydica 2018, 63, 8. Available online: https://journals-crea.4science.it/index.php/maydica/article/view/1698 (accessed on 13 November 2019).
13. Munyiri, W.S.; Mugo, N.S.; Otim, M.; Tefera, T.; Beyene, Y.; Mwololo, K.J.; Okori, P. Responses of tropical maize landraces todamage by Chilo partellus stem borer. Afr. J. Biotechnol. 2013, 12, 1229–1235.
14. Munyiri, S.W.; Mugo, S.N.; Mwololo, J.K. Mechanisms and levels of resistance in hybrids, open pollinated varieties and landracesto Chilo partellus maize stem borers. Int. Res. J. Agric. Sci. Soil Sci. 2015, 5, 81–90.
15. Mwololo, J.K.; Munyiri, S.W.; Semagn, K.; Mugo, S. Genetic diversity analysis in tropical maize germplasm for stem borer andstorage pest resistance using molecular markers and phenotypic traits. Mol. Plant Breed. 2015, 6, 1–22.
16. Goergen, G.; Kumar, P.L.; Sankung, S.B.; Togola, A.; Tamò, M. First report of outbreaks of the fall armyworm Spodoptera frugiperda(JE Smith) (Lepidoptera, Noctuidae), a new alien invasive pest in West and Central Africa. PLoS ONE 2016, 11, e0165632.[CrossRef]
17. Padhee, A.K.; Prassanna, B.M. The emerging threat of Fall Armyworm in India. Indian Farming 2019, 69, 51–54.18. Prasanna, B.M.; Huesing, J.E.; Eddy, R.; Peschke, V.M.; Regina, E.; Virginia, M.P. Fall Armyworm in Africa: A Guide for Integrated
Pest Management, 1st ed.; West Africa Regional Training of Trainers and Awareness Generation Workshop on Fall ArmywormManagement, IITA, Cotonou, Bénin; Prasanna, B.M., Regina, E., Virginia, M.P., Eds.; CIMMYT: Queretaro, Mexico, 2018.
19. Gedil, M.; Menkir, A. An integrated molecular and conventional breeding scheme for enhancing genetic gain in maize in Africa.Front. Plant Sci. 2019, 10, 1–17. [CrossRef] [PubMed]
20. Murenga, M.; Derera, J.; Mugo, S.; Tongoona, P. A review of genetic analysis and response to selection for resistance to Busseolafusca and Chilo partellus, stem borers in tropical maize germplasm: A Kenyan perspective. Maydica 2016, 61, 1–11.
21. Crossa, J.; Pérez-Rodríguez, P.; Cuevas, J.; Montesinos-López, O.; Jarquín, D.; de los Campos, G.; Burgueno, J.; Gonzales-Camacho,J.M.; Perez-Elizade, S.; Beyene, Y.; et al. Genomic selection in plant breeding: Methods, models, and perspectives. Trends Plant Sci.2017, 22, 1–15. [CrossRef]
22. Roorkiwal, M.; Jarquin, D.; Singh, M.K.; Gaur, P.M.; Bharadwaj, C.; Rathore, A.; Howard, R.; Srinivasan, S.; Jain, A.; Garg, V.; et al.Genomic-enabled prediction models using multi-environment trials to estimate the effect of genotype × environment interactionon prediction accuracy in chickpea. Sci. Rep. 2018, 8, 1–11. [CrossRef]
23. Robertsen, C.D.; Hjortshøj, R.L.; Janss, L.L. Genomic selection in cereal breeding. Agronomy 2019, 9, 95. [CrossRef]24. Munyiri, S.W.; Mugo, S.N. Quantitative trait loci for resistance to spotted and African maize stem borers (Chilo partellus and
Busseola fusca) in a tropical maize (Zea mays L.) population. Afr. J. Biotechnol. 2017, 16, 1579–1589. [CrossRef]25. Badji, A.; Kwemoi, D.B.; Machida, L.; Okii, D.; Mwila, N.; Agbahoungba, S.; Kumi, F.; Ibanda, A.; Bararyenya, A.; Solemangey,
M.; et al. Genetic basis of maize resistance to multiple-insect pests: Integrated genome-wide comparative mapping and candidate.Genes 2020, 11, 689. [CrossRef] [PubMed]
26. Meuwissen, T.H.E.; Hayes, B.J.; Goddard, M.E. Prediction of total genetic value using genome-wide dense marker maps. Genetics2001, 157, 1819–1829. [PubMed]
27. Jannink, J.; Lorenz, A.J.; Iwata, H. Genomic selection in plant breeding: From theory to practice. Brief. Funct. Genom. 2010, 9,166–177. [CrossRef]
28. Massman, J.M.; Jung, H.J.G.; Bernardo, R. Genomewide selection versus marker-assisted recurrent selection to improve grainyield and stover-quality traits for cellulosic ethanol in maize. Crop Sci. 2013, 53, 58–66. [CrossRef]
29. Beyene, Y.; Semagn, K.; Mugo, S.; Tarekegne, A.; Babu, R.; Meisel, B.; Sehabiague, P.; Makumbi, D.; Magorokosho, C.; Oukeh, S.;et al. Genetic gains in grain yield through genomic selection in eight bi-parental maize populations under drought stress. CropSci. 2015, 55, 154–163. [CrossRef]
30. Vivek, B.S.; Krishna, G.K.; Vengadessan, V.; Babu, R.; Zaidi, P.H.; Kha, L.Q.; Mandal, S.S.; Grudloyma, P.; Takalkar, S.; Krothapalli,K.; et al. Use of genomic estimated breeding values results in rapid genetic gains for drought tolerance in maize. Plant Genome2017, 10, 1–8. [CrossRef]
31. Liu, X.; Wang, H.; Wang, H.; Guo, Z.; Xu, X.; Liu, J.; Wang, S.; Li, W.-X.; Zou, C.; Prasanna, B.M.; et al. Factors affecting genomicselection revealed by empirical evidence in maize. Crop J. 2018, 6, 341–352. [CrossRef]
98
Plants 2021, 10, 29
32. Yuan, Y.; Scheben, A.; Batley, J.; Edwards, D. Using genomics to adapt crops to climate change. In Sustainable Solutions for FoodSecurity; Springer International Publishing: Cham, Switzerland, 2019; pp. 91–109.
33. Zhang, X.; Pérez-Rodríguez, P.; Burgueño, J.; Olsen, M.; Buckler, E.; Atlin, G.; Prasanna, B.M.; Vargas, M.; San Vicente, F.; Crossa,J. Rapid cycling genomic selection in a multiparental tropical maize population. G3 Genes Genomes Genet. 2017, 7, 2315–2326.[CrossRef]
34. Hassen, M.B.; Bartholomé, J.; Valè, G.; Cao, T.V.; Ahmadi, N. Genomic prediction accounting for genotype by environmentinteraction offers an effective framework for breeding simultaneously for adaptation to an abiotic stress and performance undernormal cropping conditions in rice. G3 Genes Genomes Genet. 2018, 8, 2319–2332. [CrossRef]
35. Muleta, K.T.; Pressoir, G.; Morris, G.P. Optimizing genomic selection for a sorghum breeding program in Haiti: A simulationstudy. G3 Genes Genomes Genet. 2019, 9, 391–401. [CrossRef]
36. Suontama, M.; Klápšte, J.; Telfer, E.; Graham, N.; Stovold, T.; Low, C.; McKinley, R.; Dungey, H. Efficiency of genomic predictionacross two Eucalyptus nitens seed orchards with different selection histories. Heredity 2019, 122, 370–379. [CrossRef] [PubMed]
37. Voss-Fels, K.P.; Cooper, M.; Hayes, B.J. Accelerating crop genetic gains with genomic selection. Appl. Genet. 2019, 132, 669–686.[CrossRef] [PubMed]
38. Kadam, D.C.; Lorenz, A.J. Evaluation of nonparametric models for genomic prediction of early-stage single crosses in maize.Crop Sci. 2019, 59, 1411–1423. [CrossRef]
39. Whittaker, J.C.; Thompson, R.; Denham, M.C. Marker-assisted selection using ridge regression. Genet. Res. 2000, 75, 249–252.[CrossRef] [PubMed]
40. Clark, S.A.; van der Werf, J. Genomic Best Linear Unbiased Prediction (gBLUP) for the Estimation of Genomic Breeding Values; Springer:Berlin/Heidelberg, Germany, 2013; pp. 321–330.
41. Zhang, H.; Yin, L.; Wang, M.; Yuan, X.; Liu, X. Factors affecting the accuracy of genomic selection for agricultural economic traitsin maize, cattle, and pig populations. Front. Genet. 2019, 10, 1–10. [CrossRef] [PubMed]
42. Hayashi, T.; Iwata, H. EM algorithm for Bayesian estimation of genomic breeding values. BMC Genet. 2010, 11, 3. [CrossRef]43. Meuwissen, T.H.; Solberg, T.R.; Shepherd, R.; Woolliams, J.A. A fast algorithm for BayesB type of prediction of genome-wide
estimates of genetic value. Genet. Sel. Evol. 2009, 41, 1–10. [CrossRef]44. Habier, D.; Fernando, R.L.; Kizilkaya, K.; Garrick, D.J. Extension of the bayesian alphabet for genomic selection. BMC Bioinform.
2011, 12, 186. [CrossRef]45. De Los Campos, G.; Naya, H.; Gianola, D.; Crossa, J.; Legarra, A.; Manfredi, E.; Weigel, K.; Cotes, J.M. Predicting quantitative
traits with regression models for dense molecular markers and pedigree. Genetics 2009, 182, 375–385. [CrossRef]46. Zhou, X.; Carbonetto, P.; Stephens, M. Polygenic Modeling with Bayesian Sparse Linear Mixed Models. PLoS Genet. 2013, 9,
e1003264. [CrossRef] [PubMed]47. Gianola, D.; Fernando, R.L.; Stella, A. Genomic-assisted prediction of genetic value with semiparametric procedures. Genetics
2006, 173, 1761–1776. [CrossRef] [PubMed]48. Gianola, D.; de los Campos, G.; González-Recio, O.; Long, N.; Okut, H.; Rosa, G.J.M.; Weigel, K.A.; Wu, X.-L. Statistical learning
methods for genome-based analysis of quantitative traits. In Proceedings of the 9th World Congress on Genetics Applied toLivestock Production, Leipzig, Germany, 1–6 August 2010; Gesellschaft für Tierzuchtwissenschaften eV: Neustadt am Rübenberge,Germany, 2010; Volume 14, pp. 1–6.
49. Howard, R.; Carriquiry, A.L.; Beavis, W.D. Parametric and nonparametric statistical methods for genomic selection of traits withadditive and epistatic genetic architectures. G3 Genes Genomes Genet. 2014, 4, 1027–1046. [CrossRef] [PubMed]
50. De los Campos, G.; Hickey, J.M.; Pong-Wong, R.; Daetwyler, H.D.; Calus, M.P.L. Whole-genome regression and predictionmethods applied to plant and animal breeding. Genetics 2013, 193, 327–345. [CrossRef] [PubMed]
51. Heslot, N.; Yang, H.P.; Sorrells, M.E.; Jannink, J.L. Genomic selection in plant breeding: A comparison of models. Crop Sci. 2012,52, 146–160. [CrossRef]
52. Maltecca, C.; Parker, K.L.; Cassady, J.P.; Maltecca, C.; Parker, K.L.; Cassady, J.P. Application of multiple shrinkage methods togenomic predictions. J. Anim. Sci. 2014, 90, 1777–1787. [CrossRef]
53. E Sousa, M.B.; Cuevas, J.; de Oliveira Couto, E.G.; Pérez-Rodríguez, P.; Jarquín, D.; Fritsche-Neto, R.; Burgueno, J.; Crossa, J.Genomic-enabled prediction in maize using Kernel models with genotype × environment interaction. G3 Genes Genomes Genet.2017, 7, 1995–2014.
54. Cuevas, J.; Granato, I.; Fritsche-Neto, R.; Montesinos-Lopez, O.A.; Burgueño, J.; e Sousa, M.B.; Crossa, J. Genomic-enabledprediction Kernel models with random intercepts for multi-environment trials. G3 Genes Genomes Genet. 2018, 8, 1347–1365.[CrossRef]
55. Bellot, P.; de los Campos, G.; Pérez-Enciso, M. Can deep learning improve genomic prediction of complex human traits? Genetics2018, 210, 809–819. [CrossRef]
56. Montesinos-López, O.A.; Martín-Vallejo, J.; Crossa, J.; Gianola, D.; Hernández-Suárez, C.M.; Montesinos-López, A.; Juliana,P.; Singh, R. A benchmarking between deep learning, support vector machine and Bayesian threshold best linear unbiasedprediction for predicting ordinal traits in plant breeding. G3 Genes Genomes Genet. 2019, 9, 601–618. [CrossRef]
57. Crossa, J.; Beyene, Y.; Semagn, K.; Pérez, P.; Hickey, J.M.; Chen, C.; de los Campos, G.; Burgueno, J.; Windhausen, V.S.;Buckler, E.; et al. Genomic prediction in maize breeding populations with genotyping-by-sequencing. G3 Genes Genomes Genet.2013, 3, 1903–1926. [CrossRef] [PubMed]
99
Plants 2021, 10, 29
58. Pérez-Rodríguez, P.; Gianola, D.; González-Camacho, J.M.; Crossa, J.; Manès, Y.; Dreisigacker, S. Comparison between linearand non-parametric regression models for genome-enabled prediction in wheat. G3 Genes Genomes Genet. 2012, 2, 1595–1605.[CrossRef] [PubMed]
59. De Andrade, L.R.B.; Bandeira e Sousa, M.; Oliveira, E.J.; de Resende, M.D.V.; Azevedo, C.F. Cassava yield traits predicted bygenomic selection methods. PLoS ONE 2019, 14, e0224920. [CrossRef] [PubMed]
60. Hickey, J.M.; Chiurugwi, T.; Mackay, I.; Powell, W. Genomic prediction unifies animal and plant breeding programs to formplatforms for biological discovery. Nat. Genet. 2017, 49, 1297–1303. [CrossRef] [PubMed]
61. Akdemir, D.; Isidro-sánchez, J. Design of training populations for selective phenotyping in genomic prediction. Sci. Rep. 2019, 9,1–15. [CrossRef]
62. Gosal, S.S.; Wani, S.H. (Eds.) Accelerated Plant Breeding, Volume 1: Cereal Crops; Springer Nature; Springer International Publishing:Cham, Switzerland, 2020; Volume 1.
63. Sarinelli, J.M.; Murphy, J.P.; Tyagi, P.; Holland, J.B.; Johnson, J.W.; Mergoum, M.; Mason, R.E.; Babar, A.; Harrison, S.; Sut-ton, R.; et al. Training population selection and use of fixed effects to optimize genomic predictions in a historical USA winterwheat panel. Theor. Appl. Genet. 2019, 132, 1247–1261. [CrossRef]
64. Cericola, F.; Jahoor, A.; Orabi, J.; Andersen, J.R.; Janss, L.L.; Jensen, J. Optimizing training population size and genotyping strategyfor genomic prediction using association study results and pedigree information. A case of study in advanced wheat breedinglines. PLoS ONE 2017, 12, e0169606. [CrossRef]
65. Isidro, J.; Jannink, J.L.; Akdemir, D.; Poland, J.; Heslot, N.; Sorrells, M.E. Training set optimization under population structure ingenomic selection. Theor. Appl. Genet. 2015, 128, 145–158. [CrossRef]
66. Andres, R.J.; Dunne, J.C.; Samayoa, L.F.; Holland, J.B. Enhancing Crop Breeding Using Population Genomics Approaches; Springer:Berlin/Heidelberg, Germany, 2020.
67. Sitonik, C.; Suresh, L.M.; Beyene, Y.; Olsen, M.S.; Makumbi, D.; Oliver, K.; Das, B.; Bright, J.M.; Mugo, S.; Crossa, J.; et al. Geneticarchitecture of maize chlorotic mottle virus and maize lethal necrosis through GWAS, linkage analysis and genomic prediction intropical maize germplasm. Theor. Appl Genet. 2019, 132, 2381–2399. [CrossRef]
68. Nyaga, C.; Gowda, M.; Beyene, Y.; Muriithi, W.T.; Makumbi, D.; Olsen, M.S.; Suresh, L.M.; Bright, J.M.; Das, B.; Prasanna, B.M.Genome-wide analyses and prediction of resistance to mln in large tropical maize germplasm. Genes 2020, 11, 16. [CrossRef]
69. Gowda, M.; Das, B.; Makumbi, D.; Babu, R.; Semagn, K.; Mahuku, G.; Olsen, M.S.; Bright, J.M.; Beyene, Y.; Prasanna, B.M.Genome-wide association and genomic prediction of resistance to maize lethal necrosis disease in tropical maize germplasm.Theor. Appl Genet. 2015, 128, 1957–1968. [CrossRef] [PubMed]
70. Galli, G.; Lyra, D.H.; Alves, F.C.; Granato, Í.S.C.; e Sousa, M.B.; Fritsche-Neto, R. Impact of phenotypic correction method andmissing phenotypic data on genomic prediction of maize hybrids. Crop Sci. 2018, 58, 1481–1491. [CrossRef]
71. Molenaar, H.; Boehm, R.; Piepho, H.P. Phenotypic selection in ornamental breeding: It’s better to have the BLUPs than to havethe BLUEs. Front. Plant Sci. 2018, 871, 1–14. [CrossRef] [PubMed]
72. Piepho, H.P.; Möhring, J.; Melchinger, A.E.; Büchse, A. BLUP for phenotypic selection in plant breeding and variety testing.Euphytica 2008, 161, 209–228. [CrossRef]
73. Piepho, H.P.; Möhring, J. Selection in cultivar trials—Is it ignorable? Crop Sci. 2006, 46, 192–201. [CrossRef]74. Dramadri, I.O.; Nkalubo, S.T.; Kelly, J.D. Identification of QTL Associated with drought tolerance in Andean common bean. Crop
Sci. 2019, 59, 1007–1020. [CrossRef]75. Williams, W.P.; Buckley, P.M.; Davis, F.M. Combining ability for resistance in corn to fall armyworm and southwestern corn borer.
Crop Sci. 1989, 29, 913–915. [CrossRef]76. Sodedji, F.A.K.; Kwemoi, D.B.; Asea, G.; Kyamanywa, S. Response of provitamin—A maize germplasm to storage weevil
Sitophilus zeamais (Motschulsky). Int. J. Agron. Agric. Res. 2016, 9, 1–13.77. Kasozi, L.C.; Derera, J.; Tongoona, P.; Zziwa, S.; Foundation, M.G.; Box, P.O. Comparing the effectiveness of the “weevil
warehouse” and “laboratory bioassay” as techniques for screening maize genotypes for weevil resistance. J. Food Secur. 2018, 6,170–177.
78. Bradbury, P.J.; Zhang, Z.; Kroon, D.E.; Casstevens, T.M.; Ramdoss, Y.; Buckler, E.S. TASSEL: Software for association mapping ofcomplex traits in diverse samples. Bioinformatics 2007, 23, 2633–2635. [CrossRef]
79. R Development Core Team. R: A Language and Environment for Statistical Computing; R Development Core Team, Ed.; R Foundationfor Statistical Computing: Vienna, Austria, 2011; Volume 1, p. 409.
80. Bates, D.M.; Maechler, M.; Bolker, B.; Walker, S. Fitting linear mixed-effects models using lme4. J. Stat. Softw. 2015, 67, 1–48.[CrossRef]
81. De los Campos, G.; Pérez, P.; Vazquez, A.I.; Crossa, J. Genome-enabled prediction using the BLR (Bayesian linear regression)R-package. In Methods in Molecular Biology; Springer: Berlin/Heidelberg, Germany, 2013; pp. 299–320.
82. Pérez, P.; de los Campos, G. BGLR: A statistical package for whole genome regression and prediction. Genetics 2014, 198, 483–495.[CrossRef] [PubMed]
83. Pérez, P.; de los Campos, G.; Crossa, J.; Gianola, D. Genomic-enabled prediction based on molecular markers and pedigree usingthe bayesian linear regression package in R. Plant Genome J. 2010, 3, 106. [CrossRef]
84. Park, T.; Casella, G. The Bayesian Lasso. J. Am. Stat. Assoc. 2008, 103, 681–686. [CrossRef]
100
Plants 2021, 10, 29
85. Covarrubias-Pazaran, G. Genome-assisted prediction of quantitative traits using the R package sommer. PLoS ONE 2016, 11,e0156744. [CrossRef]
86. Henderson, C.R.; Henderson, A.C.R. Best linear unbiased estimation and prediction under a selection model published by:International biometric society stable. Biometrics 1975, 31, 423–447. [CrossRef]
87. Kang, H.M.; Zaitlen, N.A.; Wade, C.M.; Kirby, A.; Heckerman, D.; Daly, M.J.; Eskin, E. Efficient control of population structure inmodel organism association mapping. Genetics 2008, 178, 1709–1723. [CrossRef]
88. Gilmour, A.R.; Thompson, R.; Cullis, B.R. Average information REML: An efficient algorithm for variance parameter estimationin linear mixed models. Biometrics 1995, 51, 1440–1450. [CrossRef]
89. Searle, S.R. Applying the EM algorithm to calculating ML and REML estimates of variance components. In Proceedings of theAmerican Statistical Association Meetings, San Francisco, CA, USA, 8–12 August 1993; pp. 1–9.
90. Tunnicliffe, G.W. On the use of marginal likelihood in time series model estimation. JRSS 1989, 51, 15–27.91. Vanraden, P.M. Efficient methods to compute genomic predictions. J. Dairy Sci. 2008, 91, 4414–4423. [CrossRef]92. Endelman, J.B. Ridge regression and other kernels for genomic selection with R package rrBLUP. Plant Genome J. 2011, 4, 250.
[CrossRef]93. Stekhoven, D.J.; Bühlmann, P. Missforest—Non-parametric missing value imputation for mixed-type data. Bioinformatics 2012, 28,
112–118. [CrossRef] [PubMed]94. Chen, X.; Ishwaran, H. Genomics random forests for genomic data analysis. Genomics 2012, 99, 323–329. [CrossRef] [PubMed]95. Romay, M.C.; Millard, M.J.; Glaubitz, J.C.; Peiffer, J.A.; Swarts, K.L.; Casstevens, T.M.; Elshire, R.J.; Acharya, C.B.; Mitchell, S.E.;
Flint-Garcia, S.A.; et al. Comprehensive genotyping of the USA national maize inbred seed bank. Genome Biol. 2013, 14, R55.[CrossRef]
96. Peiffer, J.A.; Flint-Garcia, S.A.; De Leon, N.; McMullen, M.D.; Kaeppler, S.M.; Buckler, E.S. The genetic architecture of maize stalkstrength. PLoS ONE 2013, 8, e67066. [CrossRef]
97. Lorenz, A.J.; Smith, K.P.; Jannink, J.L. Potential and optimization of genomic selection for Fusarium head blight resistance insix-row barley. Crop Sci. 2012, 52, 1609–1621. [CrossRef]
98. Arruda, M.P.; Brown, P.J.; Lipka, A.E.; Krill, A.M.; Thurber, C.; Kolb, F.L. Genomic selection for predicting fusarium head blightresistance in a wheat breeding program. Plant Genome 2015, 8, 1–12. [CrossRef]
99. Foiada, F.; Westermeier, P.; Kessel, B.; Ouzunova, M.; Wimmer, V.; Mayerhofer, W.; Presterl, T.; Dilger, M.; Kreps, R.; Eder, J.; et al.Improving resistance to the European corn borer: A comprehensive study in elite maize using QTL mapping and genome-wideprediction. Theor. Appl Genet. 2015, 128, 875–891. [CrossRef]
100. Riedelsheimer, C.; Technow, F.; Melchinger, A.E. Comparison of whole-genome prediction models for traits with contrastinggenetic architecture in a diversity panel of maize inbred lines. BMC Genom. 2012, 13, 452. [CrossRef]
101. Azodi, C.B.; Bolger, E.; McCarren, A.; Roantree, M.; de Los Campos, G.; Shiu, S.H. Benchmarking parametric and MachineLearning models for genomic prediction of complex traits. G3 Genes Genomes Genet. 2019, 9, 3691–3702. [CrossRef]
102. Drouaillet, B.E.; Mendez, C.A.R. Combinatorial aptitude and resistance to leaf damage of Spodoptera frugiperda (J.E. Smith) inmaize germplasm native to Tamaulipas. Rev. Mex. Cienc. Agríc. 2018, 9, 81–93.
103. Alvarez, P.; Branco, J.; Filho, D.M. Diallel crossing among miaze populations for resistance to fall armyworm. Sci. Agric. 2002, 59,731–741. [CrossRef]
104. Viana, P.A.; Guimarães, P.E.O. Maize resistance to the lesser cornstalk borer and fall armyworm in Brazil. In Embrapa Milho eSorgo-Artigo em Anais de Congresso (ALICE), Proceedings of the International Symposium on Insect Resistant Maize: Recent Advances andUtilization, Mexico City, Mexico, 27 November–3 December 1994; Centro Internacional de Mejoramiento de Maiz y Trigo (CIMMYT):Mexico City, Mexico, 1997.
105. Musundire, L.; Dari, S.; Derera, J.; Co-Zimbabwe, S.; Wgt, P.O.B. Genetic analysis of grain yield performance and weevil [Sitophiluszeamais (Motschulsky)] resistance in southern African maize hybrids. Maydica 2015, 60, M35.
106. Dhliwayo, T.; Pixley, K.V.; Kazembe, V. Combining ability for resistance to maize weevil among 14 southern African maize inbredlines. Crop Sci. 2005, 45, 662–667. [CrossRef]
107. Asoro, F.G.; Newell, M.A.; Beavis, W.D.; Scott, M.P.; Jannink, J.-L. Accuracy and training population design for genomic selectionon quantitative traits in elite North American oats. Plant Genome J. 2011, 4, 132. [CrossRef]
108. Lenz, P.R.N.; Beaulieu, J.; Mansfield, S.D.; Clément, S.; Desponts, M.; Bousquet, J. Factors affecting the accuracy of genomicselection for growth and wood quality traits in an advanced-breeding population of black spruce (Picea mariana). BMC Genom.2017, 18, 1–17. [CrossRef]
109. Edwards, S.M.K.; Buntjer, J.B.; Jackson, R.; Bentley, A.R.; Lage, J.; Byrne, E.; Burt, C.; Jack, P.; Berry, S.; Flatman, E.; et al. Theeffects of training population design on genomic prediction accuracy in wheat. Theor. Appl Genet. 2019, 132, 1943–1952. [CrossRef]
110. Wang, W.; Cao, X.H.; Miclau, M.; Xu, J.; Xiong, W. The promise of agriculture genomics. Int. J. Genom. 2017, 2017. [CrossRef]111. Spindel, J.; Iwata, H. Genomic selection in rice breeding. In Rice Genomics, Genet Breed; Springer: Singapore, 2018; pp. 473–496.112. Crossa, J.; Pérez, P.; Hickey, J.; Burgueño, J.; Ornella, L.; Cerón-Rojas, J.; Zhang, X.; Dreisigacker, S.; Babu, R.; Li, Y.; et al. Genomic
prediction in CIMMYT maize and wheat breeding programs. Heredity 2014, 112, 48–60. [CrossRef]113. Ou, J.H.; Liao, C.T. Training set determination for genomic selection. Theor. Appl. Genet. 2019, 132, 2781–2792. [CrossRef]114. Mangin, B.; Rincent, R.; Rabier, C.E.; Moreau, L.; Goudemand-Dugue, E. Training set optimization of genomic prediction by
means of EthAcc. PLoS ONE 2019, 14, e0205629. [CrossRef] [PubMed]
101

Plants 2021, 10, 29
115. Albrecht, T.; Wimmer, V.; Auinger, H.J.; Erbe, M.; Knaak, C.; Ouzunova, M.; Simianer, H.; Schon, C.-C. Genome-based predictionof testcross values in maize. Theor. Appl. Genet. 2011, 123, 339–350. [CrossRef] [PubMed]
116. Hickey, J.M.; Dreisigacker, S.; Crossa, J.; Hearne, S.; Babu, R.; Prasanna, B.M.; Grondona, M.; Zambelli, A.; Windhausen, V.S.;Mathews, K.; et al. Evaluation of genomic selection training population designs and genotyping strategies in plant breedingprograms using simulation. Crop Sci. 2014, 54, 1476–1488. [CrossRef]
117. Krchov, L.-M.; Bernardo, R. Relative efficiency of genomewide selection for testcross performance of doubled haploid lines in amaize breeding program. Crop Sci. 2015, 55, 2091–2099. [CrossRef]
118. Mayor, P.J.; Bernardo, R. Genomewide selection and marker-assisted recurrent selection in doubled haploid versus F2 populations.Crop Sci. 2009, 49, 1719–1725. [CrossRef]
102
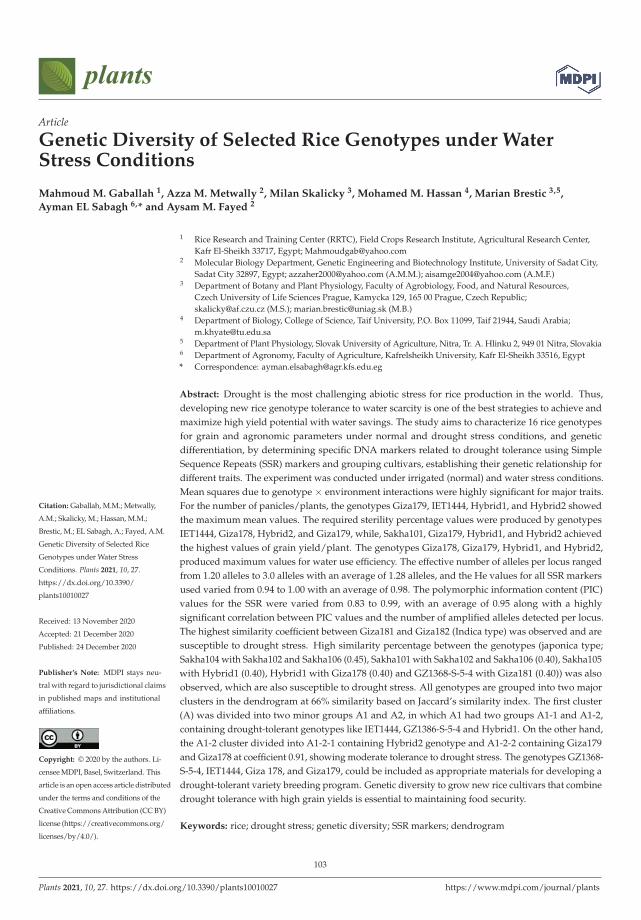
plants
Article
Genetic Diversity of Selected Rice Genotypes under WaterStress Conditions
Mahmoud M. Gaballah 1, Azza M. Metwally 2, Milan Skalicky 3, Mohamed M. Hassan 4, Marian Brestic 3,5,
Ayman EL Sabagh 6,* and Aysam M. Fayed 2
Citation: Gaballah, M.M.; Metwally,
A.M.; Skalicky, M.; Hassan, M.M.;
Brestic, M.; EL Sabagh, A.; Fayed, A.M.
Genetic Diversity of Selected Rice
Genotypes under Water Stress
Conditions. Plants 2021, 10, 27.
https://dx.doi.org/10.3390/
plants10010027
Received: 13 November 2020
Accepted: 21 December 2020
Published: 24 December 2020
Publisher’s Note: MDPI stays neu-
tral with regard to jurisdictional claims
in published maps and institutional
affiliations.
Copyright: © 2020 by the authors. Li-
censee MDPI, Basel, Switzerland. This
article is an open access article distributed
under the terms and conditions of the
Creative Commons Attribution (CC BY)
license (https://creativecommons.org/
licenses/by/4.0/).
1 Rice Research and Training Center (RRTC), Field Crops Research Institute, Agricultural Research Center,Kafr El-Sheikh 33717, Egypt; [email protected]
2 Molecular Biology Department, Genetic Engineering and Biotechnology Institute, University of Sadat City,Sadat City 32897, Egypt; [email protected] (A.M.M.); [email protected] (A.M.F.)
3 Department of Botany and Plant Physiology, Faculty of Agrobiology, Food, and Natural Resources,Czech University of Life Sciences Prague, Kamycka 129, 165 00 Prague, Czech Republic;[email protected] (M.S.); [email protected] (M.B.)
4 Department of Biology, College of Science, Taif University, P.O. Box 11099, Taif 21944, Saudi Arabia;[email protected]
5 Department of Plant Physiology, Slovak University of Agriculture, Nitra, Tr. A. Hlinku 2, 949 01 Nitra, Slovakia6 Department of Agronomy, Faculty of Agriculture, Kafrelsheikh University, Kafr El-Sheikh 33516, Egypt* Correspondence: [email protected]
Abstract: Drought is the most challenging abiotic stress for rice production in the world. Thus,developing new rice genotype tolerance to water scarcity is one of the best strategies to achieve andmaximize high yield potential with water savings. The study aims to characterize 16 rice genotypesfor grain and agronomic parameters under normal and drought stress conditions, and geneticdifferentiation, by determining specific DNA markers related to drought tolerance using SimpleSequence Repeats (SSR) markers and grouping cultivars, establishing their genetic relationship fordifferent traits. The experiment was conducted under irrigated (normal) and water stress conditions.Mean squares due to genotype × environment interactions were highly significant for major traits.For the number of panicles/plants, the genotypes Giza179, IET1444, Hybrid1, and Hybrid2 showedthe maximum mean values. The required sterility percentage values were produced by genotypesIET1444, Giza178, Hybrid2, and Giza179, while, Sakha101, Giza179, Hybrid1, and Hybrid2 achievedthe highest values of grain yield/plant. The genotypes Giza178, Giza179, Hybrid1, and Hybrid2,produced maximum values for water use efficiency. The effective number of alleles per locus rangedfrom 1.20 alleles to 3.0 alleles with an average of 1.28 alleles, and the He values for all SSR markersused varied from 0.94 to 1.00 with an average of 0.98. The polymorphic information content (PIC)values for the SSR were varied from 0.83 to 0.99, with an average of 0.95 along with a highlysignificant correlation between PIC values and the number of amplified alleles detected per locus.The highest similarity coefficient between Giza181 and Giza182 (Indica type) was observed and aresusceptible to drought stress. High similarity percentage between the genotypes (japonica type;Sakha104 with Sakha102 and Sakha106 (0.45), Sakha101 with Sakha102 and Sakha106 (0.40), Sakha105with Hybrid1 (0.40), Hybrid1 with Giza178 (0.40) and GZ1368-S-5-4 with Giza181 (0.40)) was alsoobserved, which are also susceptible to drought stress. All genotypes are grouped into two majorclusters in the dendrogram at 66% similarity based on Jaccard’s similarity index. The first cluster(A) was divided into two minor groups A1 and A2, in which A1 had two groups A1-1 and A1-2,containing drought-tolerant genotypes like IET1444, GZ1386-S-5-4 and Hybrid1. On the other hand,the A1-2 cluster divided into A1-2-1 containing Hybrid2 genotype and A1-2-2 containing Giza179and Giza178 at coefficient 0.91, showing moderate tolerance to drought stress. The genotypes GZ1368-S-5-4, IET1444, Giza 178, and Giza179, could be included as appropriate materials for developing adrought-tolerant variety breeding program. Genetic diversity to grow new rice cultivars that combinedrought tolerance with high grain yields is essential to maintaining food security.
Keywords: rice; drought stress; genetic diversity; SSR markers; dendrogram
Plants 2021, 10, 27. https://dx.doi.org/10.3390/plants10010027 https://www.mdpi.com/journal/plants
103
Plants 2021, 10, 27
1. Introduction
Rice is the most diversified crop, which is grown under diverse ecological conditions.It is the staple food for more than 50% of the world’s population and is the world’s mostimportant food in terms of a natural calorie source [1]. It occupies almost one-fifth ofthe total land area covered under cereals [2]. Due to the changing climate, the frequentoccurrence of many extreme events contributes to different abiotic stresses, limiting theproductivity of rice globally. Among them, drought is one of the most critical abioticstresses that continually threatens the world’s food security [3]. The severity of the droughtdepends on many factors, such as the occurrence and distribution of rainfall, evaporativedemands, and moisture-retaining capacity of the soils [4]. Therefore, it is imperativeto find out the genotypes that can grow under water-scarce conditions to expand rice-growing areas in water-limited lands. It can be helpful to meet the challenge of ever-increasing global food demand [5]. Different rice varieties of a distinct genetic structurepromise a future improvement of rice cultivars against drought stress [6]. Hence, theassessment of genetic diversity becomes important in establishing relationships amongdifferent cultivars [7]. The first step towards determining the magnitude of these risksis to evaluate the genetic diversity in improved rice genotypes as the success of a cropimprovement program depends on the importance of genetic variability and how thedesirable characters are heritable [8]. This identification of genotypes and their inter-relationships is important. The development of new biotechnological techniques providesincreased support to evaluate genetic variation in both phenotypic and genotypic levels.The results derived from analyses of genetic diversity at the DNA level could be used fordesigning effective breeding programs aiming to broaden the genetic basis of commerciallygrown varieties.
Molecular marker technology is a powerful tool for determining genetic variation inrice varieties. In contrast to morphological traits, molecular markers can reveal large differ-ences among genotypes at the DNA level, providing a more direct, reliable, and efficienttool for germplasm characterization, conservation, and management and untouched byenvironmental influence [9]. SSR markers can detect a high level of allelic diversity, andthey have been extensively used to identify genetic variation among rice subspecies [10].Simple sequence repeats (SSR) markers are efficient in detecting genetic polymorphismsand discriminating among genotypes from germplasms of various sources; even they cannotice the finer level of variation among closely related breeding materials within the samevariety [11]. Several quantitative trait loci (QTLs) in rice with consistent effects on grainyield under water-limited conditions were reported [12]. Among them, DTY1.1, located inchromosome 1 of the rice genome, was identified from rice variety N22 and successfullytransferred to susceptible genotypes line IR64 and MTU1010 [13]. Besides this, two othermajor-effect QTLs viz. DTY3.1 and DTY2.1 were also identified, which explains about30% and 15% of the phenotypic variance, respectively [14]. Later, Shamshudin et al. [15]reported another two QTLs, DTY2.2 ad DTY12.1, for reproductive stage drought toler-ance in rice. However, as mentioned earlier, all of these QTLs are derived from stablegrain yield under drought conditions. Because of the low heritability of grain yield underdrought stress, selection for secondary traits was more effective than grain yield traits.Due to the lack of a useful trait selection index related to drought tolerance, it is essentialto find a molecular marker associated with drought tolerance in rice [16]. Many SSRmarkers have been reported to be linked to drought tolerance traits in rice, such as yieldunder drought [13,17,18]. Although several investigations have researched rice germplasmcharacterization and diversity analysis, variability studies of the common landraces andcultivars grown are limited. Therefore, the study was conducted based on three main goals;(i) morphological characterization of the genotypes for grain and agronomic parametersunder normal and drought stress conditions; (ii) genetic differentiation of 16 rice cultivarsby determination of specific DNA markers related to drought tolerance using SSR markers
104
Plants 2021, 10, 27
and; (iii) grouping of cultivars according to their genotypes and subsequent decision theirgenetic relationship for different traits.
2. Materials and Methods
2.1. Experiment Site
The field experiment was conducted in Rice Research and Training Center Farm, SakhaResearch Station, Agricultural Research Center, Egypt, in consecutive two rice growingseasons during 2018 and 2019 to investigate morphological traits and genetic diversityof 16 rice genotypes. The soil’s physical and chemical properties in the Sakha ResearchStation in 2018 and 2019 years are illustrated in Table 1.
Table 1. Physical and chemical properties of soil at Sakha Research Station in 2018 and 2019 years(the soil was collected before starting the field preparation in each season).
Soil Physical and Chemical PropertiesSakha, Kafr El-Sheikh
2018 2019
Clay % 55 55Silt % 32.4 32.4Sand % 12.6 12.6Texture Clayey ClayeyOrganic Matter 1.39 1.39pH 8.1 8.2Ec (Ds/m) 3.30 3.33Total N (ppm) 512 518Available P (ppm) 15.09 16.03Co3
− - -Hco3
− 5.55 5.56Mg++ 4.3 5Na+ 1.88 1.69K+ 16 16Fe++ 4.55 4.55Mn++ 3.1 3.5
2.2. Treatments and Design
The sixteen rice genotypes origin, pedigree, salience, and feature are shown in Table 2.All selected rice materials were grown under full irrigated (normal) and water stress condi-tions (flush irrigation every twelve days and exposed after fifteen days from transplanting)in a randomized complete block design with three replications.
2.3. Experimental Procedures
Seeds of all cultivars were sown in a nursery on 5 May and transplanted into themain field after 30 days in both years (2018 and 2019). A single seedling of each genotypewas transplanted in 5 rows having 20 by 20 cm space (between rows and within rowdistance). Data were recorded from 10 randomly selected plants from each genotype. Forcharacterization of root structure, large iron cylinders of 20 cm diameters and 60 cm heightwere used. They were buried inside the soil with a hammer, dug out with a spade, andpulled out using hooks. The roots were separated from the soil by thorough washing in aspecial washing facility. After taking the quantitative data, the shoot was separated fromthe root using a sharp knife and dried in an oven at 70 ◦C for five days. Root length (cm)was measured by the length of the root from the base of the plant to the tip of the longestroot, root volume was determined by measuring the volume of water displaced by the plantroot system (mm3), root thickness, the average diameter (mM) of the tip portion (about1 cm from the tip) of three random secondary roots at the middle position of the root/plant,the number of roots/plant were estimated by the account roots at the maximum tilleringstage and root: shoot ratio the ratio of the root dry weight (g) to the shoot dry weight (g) atmaximum tillering stage was measured. Days to heading was recorded after flowering by
105
Plants 2021, 10, 27
the daily count of panicle exertion. The physiological maturity dates were recorded when80% grains turn into golden yellow color. The leaf rolling scores were estimated by visualestimation, and the susceptible varieties and lines first started the rolling symptoms in themorning. Highly sensitive lines did not unroll at early morning hours and were recordedbased on methods proposed by (De Data et al. 1988). The flag leaf area (cm2) was measuredusing a leaf area meter (LI-3100 (LI-COR Inc., Lincoln, NE, USA), plant height (cm) wasmeasured in (cm), from the soil surface to the tip of the tallest panicle of each plant, relativewater content (%) was measured using the formula (Fw − Dw) × 100/(Tw − Dw) where,Fw is fresh leaf weight, Dw is leaf dry weight, and Tw is turgid leaf weight. A numberof panicles/plant were recorded at harvest by counting the number of panicles/plant,100-grain weight (g) was recorded as the weight of 100 random chosen filled grains/plant,sterility percentage (%) was calculated by the divided number of unfilled spikelets/panicleon a number of total spikelets/panicle, grain yield/plant (g) was recorded by collectingthe filled grains from all the tillers in a single plant and their weight recorded, water useefficiency was calculated as economic yield/total water consumed during the crop growthperiod.
All cultural practices were applied as recommended. Nitrogenous fertilizer was usedin three splits as top dressing; phosphorus and potash were applied in full dose at sowing.Insect and weed control was used as and when required.
2.4. Statistical Analysis
A combined analysis of variance for the two years was carried out for the yield andyield components. Phenotypic correlation between yield and yield-related traits was donefollowing Steel et al. [19], and the data were analyzed using the Co-State software program.
2.5. Genomic DNA Extraction
Ten seeds of each advanced genotype were placed into a Petri dish with filter papersoaked in distilled water for germination under aseptic conditions. Then, germinatedseeds were grown into labeled pots. Genomic DNA was extracted from the healthy portionof young leaves harvested from 21 days old seedlings. DNA isolation was carried outusing a mini preparation modified CTAB (cetyltrimethylammonium bromide) method,which did not require liquid nitrogen, and only a minimal amount of tissue samples wereneeded [20]. Leaf tissues were cut into small pieces, homogenized, and digested withextraction buffer (1 M Tris, 0.5 M Na 2EDTA, 5 M NaCl, and distilled Hybrid 2O, pH 8.0)and 20% SDS. Following incubation of leaf extracts for 10 min at 65 ◦C in a water-bath, 100μL of 5M NaCl was added and mixed well by gentle inversion. Then 100 μL 10 × CTABwas added and again incubated for 10 min at 65 ◦C in a water-bath. After that, 900 μL of amixture of chloroform and isoamyl alcohol (24:1) was added and centrifuged for 8 min at11,000 rpm in a microcentrifuge. Then, 500 μL of the upper aqueous layer was separated,and 600 μL of ice-cold isopropanol was added to it, mixed, and centrifuged for 12 minat 13,200 rpm. A small pellet was visible, and the supernatant was decanted. The pelletwas then washed with 200 μL cold 70% ethanol and centrifuged at 13,200 rpm for 12 min.After removing ethanol followed by air drying, the DNA pellets were re-suspended into100 μL of 1× TE buffer and dissolved the pellet by warming in a 65 ◦C water bath for upto 1 h (with frequent mixing or flicking the tube with finger). Then the pellet was storedat −20 ◦C in an ultra-freezer. The quality of DNA was estimated by agarose gel (0.8%)electrophoresis and visualized with UV light.
106
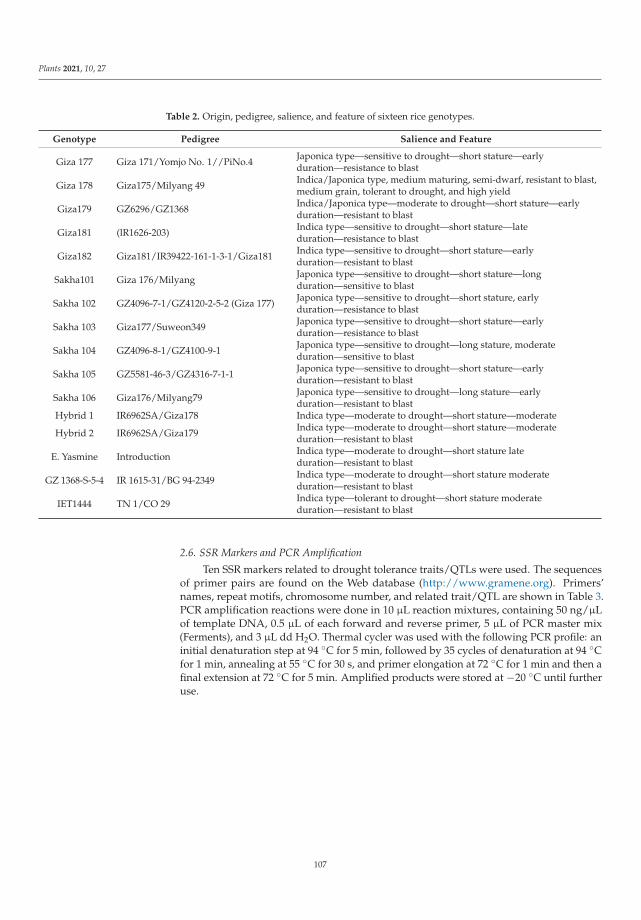
Plants 2021, 10, 27
Table 2. Origin, pedigree, salience, and feature of sixteen rice genotypes.
Genotype Pedigree Salience and Feature
Giza 177 Giza 171/Yomjo No. 1//PiNo.4 Japonica type—sensitive to drought—short stature—earlyduration—resistance to blast
Giza 178 Giza175/Milyang 49 Indica/Japonica type, medium maturing, semi-dwarf, resistant to blast,medium grain, tolerant to drought, and high yield
Giza179 GZ6296/GZ1368 Indica/Japonica type—moderate to drought—short stature—earlyduration—resistant to blast
Giza181 (lR1626-203) Indica type—sensitive to drought—short stature—lateduration—resistance to blast
Giza182 Giza181/IR39422-161-1-3-1/Giza181 Indica type—sensitive to drought—short stature—earlyduration—resistant to blast
Sakha101 Giza 176/Milyang Japonica type—sensitive to drought—short stature—longduration—sensitive to blast
Sakha 102 GZ4096-7-1/GZ4120-2-5-2 (Giza 177) Japonica type—sensitive to drought—short stature, earlyduration—resistance to blast
Sakha 103 Giza177/Suweon349 Japonica type—sensitive to drought—short stature—earlyduration—resistance to blast
Sakha 104 GZ4096-8-1/GZ4100-9-1 Japonica type—sensitive to drought—long stature, moderateduration—sensitive to blast
Sakha 105 GZ5581-46-3/GZ4316-7-1-1 Japonica type—sensitive to drought—short stature—earlyduration—resistant to blast
Sakha 106 Giza176/Milyang79 Japonica type—sensitive to drought—long stature—earlyduration—resistant to blast
Hybrid 1 IR6962SA/Giza178 Indica type—moderate to drought—short stature—moderate
Hybrid 2 IR6962SA/Giza179 Indica type—moderate to drought—short stature—moderateduration—resistant to blast
E. Yasmine Introduction Indica type—moderate to drought—short stature lateduration—resistant to blast
GZ 1368-S-5-4 IR 1615-31/BG 94-2349 Indica type—moderate to drought—short stature moderateduration—resistant to blast
IET1444 TN 1/CO 29 Indica type—tolerant to drought—short stature moderateduration—resistant to blast
2.6. SSR Markers and PCR Amplification
Ten SSR markers related to drought tolerance traits/QTLs were used. The sequencesof primer pairs are found on the Web database (http://www.gramene.org). Primers’names, repeat motifs, chromosome number, and related trait/QTL are shown in Table 3.PCR amplification reactions were done in 10 μL reaction mixtures, containing 50 ng/μLof template DNA, 0.5 μL of each forward and reverse primer, 5 μL of PCR master mix(Ferments), and 3 μL dd H2O. Thermal cycler was used with the following PCR profile: aninitial denaturation step at 94 ◦C for 5 min, followed by 35 cycles of denaturation at 94 ◦Cfor 1 min, annealing at 55 ◦C for 30 s, and primer elongation at 72 ◦C for 1 min and then afinal extension at 72 ◦C for 5 min. Amplified products were stored at −20 ◦C until furtheruse.
107
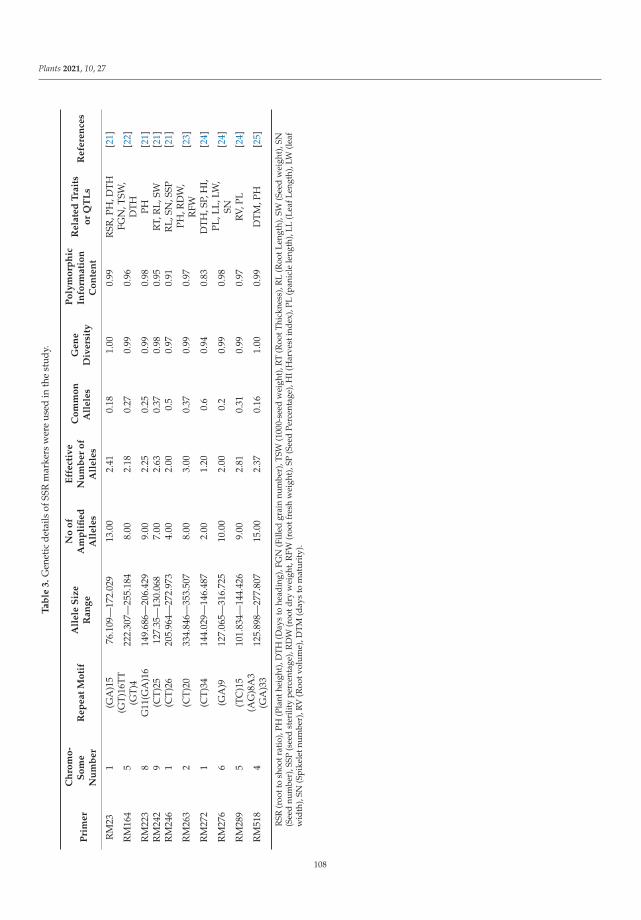
Plants 2021, 10, 27
Ta
ble
3.
Gen
etic
deta
ilsof
SSR
mar
kers
wer
eus
edin
the
stud
y.
Pri
me
r
Ch
rom
o-
So
me
Nu
mb
er
Re
pe
at
Mo
tif
All
ele
Siz
eR
an
ge
No
of
Am
pli
fie
dA
lle
les
Eff
ect
ive
Nu
mb
er
of
All
ele
s
Co
mm
on
All
ele
sG
en
eD
ive
rsit
y
Po
lym
orp
hic
Info
rma
tio
nC
on
ten
t
Re
late
dT
rait
so
rQ
TL
sR
efe
ren
ces
RM
231
(GA
)15
76.1
09—
172.
029
13.0
02.
410.
181.
000.
99R
SR,P
H,D
TH[2
1]
RM
164
5(G
T)16
TT(G
T)4
222.
307—
255.
184
8.00
2.18
0.27
0.99
0.96
FGN
,TSW
,D
TH
[22]
RM
223
8G
11(G
A)1
614
9.68
6—20
6.42
99.
002.
250.
250.
990.
98PH
[21]
RM
242
9(C
T)25
127.
35—
130.
068
7.00
2.63
0.37
0.98
0.95
RT,
RL,
SW[2
1]R
M24
61
(CT)
2620
5.96
4—27
2.97
34.
002.
000.
50.
970.
91R
L,SN
,SSP
[21]
RM
263
2(C
T)20
334.
846—
353.
507
8.00
3.00
0.37
0.99
0.97
PH,R
DW
,R
FW[2
3]
RM
272
1(C
T)34
144.
029—
146.
487
2.00
1.20
0.6
0.94
0.83
DT
H,S
P,H
I,[2
4]
RM
276
6(G
A)9
127.
065—
316.
725
10.0
02.
000.
20.
990.
98PL
,LL,
LW,
SN[2
4]
RM
289
5(T
C)1
510
1.83
4—14
4.42
69.
002.
810.
310.
990.
97R
V,PL
[24]
RM
518
4(A
G)8
A3
(GA
)33
125.
898—
277.
807
15.0
02.
370.
161.
000.
99D
TM
,PH
[25]
RSR
(roo
tto
shoo
trat
io),
PH(P
lant
heig
ht),
DTH
(Day
sto
head
ing)
,FG
N(F
illed
grai
nnu
mbe
r),T
SW(1
000-
seed
wei
ght)
,RT
(Roo
tThi
ckne
ss),
RL
(Roo
tLen
gth)
,SW
(See
dw
eigh
t),S
N(S
eed
num
ber)
,SSP
(see
dst
erili
type
rcen
tage
),R
DW
(roo
tdry
wei
ght,
RFW
(roo
tfre
shw
eigh
t),S
P(S
eed
Perc
enta
ge),
HI(
Har
vest
inde
x),P
L(p
anic
lele
ngth
),LL
(Lea
fLen
gth)
,LW
(lea
fw
idth
),SN
(Spi
kele
tnum
ber)
,RV
(Roo
tvol
ume)
,DTM
(day
sto
mat
urit
y).
108
Plants 2021, 10, 27
2.7. Electrophoretic Separation and Visualization of Amplified Products
Five μL of PCR amplified product was loaded into each well of 3% agarose gelsupplemented with ethidium bromide. The TAE 1× was used as a running buffer, anda 50 bp DNA ladder (0.5 μg/μL, ferments) was used to estimate the molecular size ofthe amplified fragments. Electrophoresis was conducted at 60 Volts for 2 h. Gels werethen visualized and photographed using a Biometra gel documentation unit (Bio-Doc,Biometra, Germany).
2.8. SSR Data Analysis
The amplified SSR DNA bands representing different alleles were scored as differentgenotypes. For each marker, allelic bands were compared against a 100 bp DNA ladder.Then, fragment data was converted into the binary encoded allelic data to apply themultivariate analyses. Genetic distance, the ratios of shared DNA bands, and geneticsimilarities were estimated from the allele binary formatted data set using Nei and Li’scoefficient [26]. Genetic distance was calculated as follows:
GDn = 1 − [2N11/(2N11 + N10 + N01)]
where N (1,1) is the number of loci having bands present in both accession, N (1,-) is thenumber of loci having a band present in the first accession, N (-, 1) is the number of locihaving a band present in the second accession.
The accessions were clustered based on the matrix of genetic similarities using theunweighted pair group method with arithmetic averages (UPGMA). Polymorphic infor-mation content (PIC) values were calculated for each microsatellite based on the allelicfrequency detected in the accessions studied using this formula.
Where, Pij is the frequency of the j-th allele for the i-th marker, and summation extendsover n alleles. Polymorphic loci were defined as those whose most frequent allele had afrequency of less than 0.95.
Genetic diversity of the entries/populations (based on a set of measured moleculardata) was estimated using diversity parameters other than PIC [27]. These are calculatedas follows: percentage of polymorphic loci (PPL):
P = (k/n) × 100%
where k is the number of polymorphic loci, n is the total number of loci investigated. Theaverage number of alleles per locus (A):
A = Σ Ai/n
where Ai is the number of alleles at the i-th locus and n is the total number of loci investi-gated. The average number of alleles per polymorphic locus (Ap):
Ap =ΣApi/np
where, Api is the number of alleles at a certain polymorphic locus, np is the total numberof polymorphic loci investigated.
Percentage of polymorphic alleles (PPA)
PPA = (Σ Api/Σ Ai) × 100%
The similarity matrix using [26] genetic distance for SSR characterization was alsoused for principal coordinate analysis (PCoA) with the Dcenter, Eigen, Output, and Mxplotsubprograms in NTSYS-PC.
109
Plants 2021, 10, 27
3. Results and Discussion
The analyses of variance in Table 4; Table 5 showed that the mean squares due toyears were significant for major studied traits, except for days to heading, which wouldindicate overall vast differences among the genotypes studied annually. Abdallah et al. [28]observed the ordinary analysis of variance showed highly significant differences amongenvironments, genotypes, and environments × genotype interaction for root and shoottraits in both treatments (normal and drought). The variation due to interaction betweenyear and variety was not significant for all measures [29]. Mean squares due to environ-ments were highly significant for all traits studied, indicating that all environments showedsignificant differences. Mean squares due to genotype × environment interactions werehighly significant for all traits except, root thickness, flag leaf area, plant height, relativewater content, number of panicles/plant, 100-grain weight, sterility percentage, and grainyield/plant, which indicated that the tested genotypes varied from the environment toenvironment and ranked differently from the normal condition. Raman et al. [30] recordedthat the variance analysis for grain yield indicated a highly significant genotype x degreeof stress severity interaction. Mean squares due to genotype × year interactions weresignificant for all traits studied, except root length, root volume, root thickness, number ofroots/plants, root: shoot ratio, and leaf rolling.
Some genotypes surpassed the others once the mean squares of genotypes were highlysignificant than the interaction G × Y mean squares and identified the most superiorgenotypes. Genotype × environment × year mean squares were not significant for all thestudied traits, except, days to heading and leaf rolling, indicating that each genotype’sperformance in one environment will be changed from one year to another. The significantdifferences among rice genotypes in this investigation revealed genetic variability in thestudied material and provided an excellent yield improvement opportunity. Grain yieldand other characteristics exhibited stability across the seasons as significant genotype ×environment interaction, which indicated the differences among genotypes were apparent(Table 4; Table 5). This research shows that further improvement through the selectionof all studied characteristics could be effective. Genotype characteristics that confer anadvantage in some water stress environments may prove useless or may even be a liabilityin other environments. This is reflected in the large G × E interactions in drought trialsand the difficulty of identifying drought-tolerant check cultivars Zhang et al. [31].
3.1. Performance Across Environments
The ordinary analysis of variance indicated highly significant differences amonggenotypes for all traits studied in Table 4; Table 5 in the combined data. The studiedgenotypes’ mean performances at the combined data over environments are presented inTables 6–8. For root length, the genotypes showing high values were IET1444, Sakha101,Sakha106, and Hybrid 2 (26.39, 25.88, 25.73, and 25.01cm, respectively), while the lowestvalues were obtained from Sakha102, Giza178, Sakha104, and Sakha103 (21.94, 21.42, 19.83and 18.71cm, respectively). The genotypes Giza178, Hybrid 1, IET1444, and Sakha101gave the superior values for root volume, 64.06, 57.66, 54.84, and 52.28 mm3, respectively;otherwise, the genotypes Giza177, Giza182, Sakha105, and Sakha103 gave the lowest one103, 35.00, 29.88, 27.27, and 16.50 mm3, respectively. Concerning the root thickness, thegenotypes E. Yasmine, Hybrid 1, IET1444, and Hybrid 2 had increased values of 1.08, 1.08,1.07, and 0.97 mM. On the other hand, Giza178, Sakha102, Sakha104, and Giza182 resultedin the decreased values of 0.58, 0.56, 0.46, and 0.41 mM, respectively (Table 6).
110
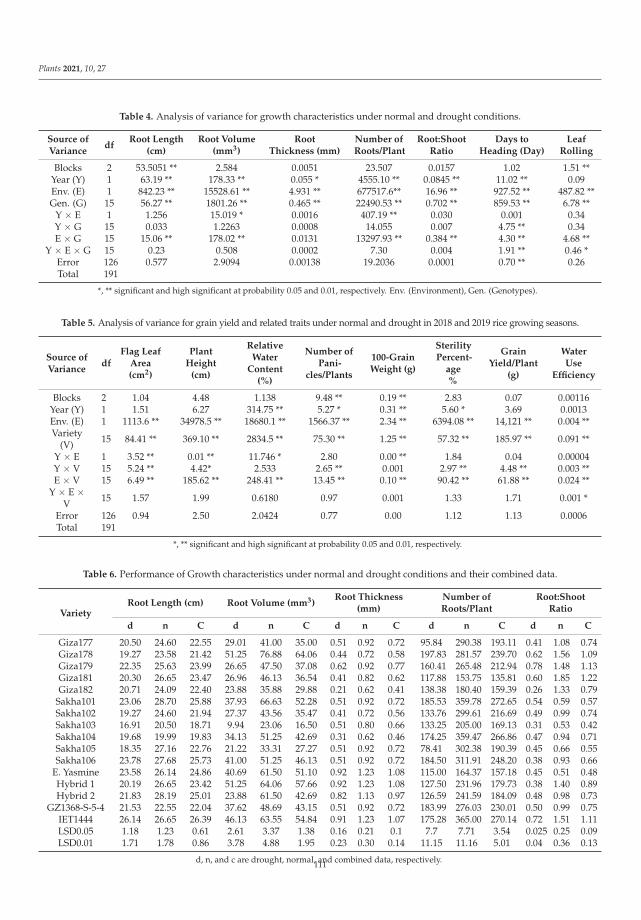
Plants 2021, 10, 27
Table 4. Analysis of variance for growth characteristics under normal and drought conditions.
Source ofVariance
dfRoot Length
(cm)Root Volume
(mm3)Root
Thickness (mm)Number ofRoots/Plant
Root:ShootRatio
Days toHeading (Day)
LeafRolling
Blocks 2 53.5051 ** 2.584 0.0051 23.507 0.0157 1.02 1.51 **Year (Y) 1 63.19 ** 178.33 ** 0.055 * 4555.10 ** 0.0845 ** 11.02 ** 0.09Env. (E) 1 842.23 ** 15528.61 ** 4.931 ** 677517.6** 16.96 ** 927.52 ** 487.82 **Gen. (G) 15 56.27 ** 1801.26 ** 0.465 ** 22490.53 ** 0.702 ** 859.53 ** 6.78 **
Y × E 1 1.256 15.019 * 0.0016 407.19 ** 0.030 0.001 0.34Y × G 15 0.033 1.2263 0.0008 14.055 0.007 4.75 ** 0.34E × G 15 15.06 ** 178.02 ** 0.0131 13297.93 ** 0.384 ** 4.30 ** 4.68 **
Y × E × G 15 0.23 0.508 0.0002 7.30 0.004 1.91 ** 0.46 *Error 126 0.577 2.9094 0.00138 19.2036 0.0001 0.70 ** 0.26Total 191
*, ** significant and high significant at probability 0.05 and 0.01, respectively. Env. (Environment), Gen. (Genotypes).
Table 5. Analysis of variance for grain yield and related traits under normal and drought in 2018 and 2019 rice growing seasons.
Source ofVariance
dfFlag Leaf
Area(cm2)
PlantHeight
(cm)
RelativeWater
Content(%)
Number ofPani-
cles/Plants
100-GrainWeight (g)
SterilityPercent-
age%
GrainYield/Plant
(g)
WaterUse
Efficiency
Blocks 2 1.04 4.48 1.138 9.48 ** 0.19 ** 2.83 0.07 0.00116Year (Y) 1 1.51 6.27 314.75 ** 5.27 * 0.31 ** 5.60 * 3.69 0.0013Env. (E) 1 1113.6 ** 34978.5 ** 18680.1 ** 1566.37 ** 2.34 ** 6394.08 ** 14,121 ** 0.004 **Variety
(V) 15 84.41 ** 369.10 ** 2834.5 ** 75.30 ** 1.25 ** 57.32 ** 185.97 ** 0.091 **
Y × E 1 3.52 ** 0.01 ** 11.746 * 2.80 0.00 ** 1.84 0.04 0.00004Y × V 15 5.24 ** 4.42* 2.533 2.65 ** 0.001 2.97 ** 4.48 ** 0.003 **E × V 15 6.49 ** 185.62 ** 248.41 ** 13.45 ** 0.10 ** 90.42 ** 61.88 ** 0.024 **
Y × E ×V 15 1.57 1.99 0.6180 0.97 0.001 1.33 1.71 0.001 *
Error 126 0.94 2.50 2.0424 0.77 0.00 1.12 1.13 0.0006Total 191
*, ** significant and high significant at probability 0.05 and 0.01, respectively.
Table 6. Performance of Growth characteristics under normal and drought conditions and their combined data.
VarietyRoot Length (cm) Root Volume (mm3)
Root Thickness(mm)
Number ofRoots/Plant
Root:ShootRatio
d n C d n C d n C d n C d n C
Giza177 20.50 24.60 22.55 29.01 41.00 35.00 0.51 0.92 0.72 95.84 290.38 193.11 0.41 1.08 0.74Giza178 19.27 23.58 21.42 51.25 76.88 64.06 0.44 0.72 0.58 197.83 281.57 239.70 0.62 1.56 1.09Giza179 22.35 25.63 23.99 26.65 47.50 37.08 0.62 0.92 0.77 160.41 265.48 212.94 0.78 1.48 1.13Giza181 20.30 26.65 23.47 26.96 46.13 36.54 0.41 0.82 0.62 117.88 153.75 135.81 0.60 1.85 1.22Giza182 20.71 24.09 22.40 23.88 35.88 29.88 0.21 0.62 0.41 138.38 180.40 159.39 0.26 1.33 0.79
Sakha101 23.06 28.70 25.88 37.93 66.63 52.28 0.51 0.92 0.72 185.53 359.78 272.65 0.54 0.59 0.57Sakha102 19.27 24.60 21.94 27.37 43.56 35.47 0.41 0.72 0.56 133.76 299.61 216.69 0.49 0.99 0.74Sakha103 16.91 20.50 18.71 9.94 23.06 16.50 0.51 0.80 0.66 133.25 205.00 169.13 0.31 0.53 0.42Sakha104 19.68 19.99 19.83 34.13 51.25 42.69 0.31 0.62 0.46 174.25 359.47 266.86 0.47 0.94 0.71Sakha105 18.35 27.16 22.76 21.22 33.31 27.27 0.51 0.92 0.72 78.41 302.38 190.39 0.45 0.66 0.55Sakha106 23.78 27.68 25.73 41.00 51.25 46.13 0.51 0.92 0.72 184.50 311.91 248.20 0.38 0.93 0.66
E. Yasmine 23.58 26.14 24.86 40.69 61.50 51.10 0.92 1.23 1.08 115.00 164.37 157.18 0.45 0.51 0.48Hybrid 1 20.19 26.65 23.42 51.25 64.06 57.66 0.92 1.23 1.08 127.50 231.96 179.73 0.38 1.40 0.89Hybrid 2 21.83 28.19 25.01 23.88 61.50 42.69 0.82 1.13 0.97 126.59 241.59 184.09 0.48 0.98 0.73
GZ1368-S-5-4 21.53 22.55 22.04 37.62 48.69 43.15 0.51 0.92 0.72 183.99 276.03 230.01 0.50 0.99 0.75IET1444 26.14 26.65 26.39 46.13 63.55 54.84 0.91 1.23 1.07 175.28 365.00 270.14 0.72 1.51 1.11LSD0.05 1.18 1.23 0.61 2.61 3.37 1.38 0.16 0.21 0.1 7.7 7.71 3.54 0.025 0.25 0.09LSD0.01 1.71 1.78 0.86 3.78 4.88 1.95 0.23 0.30 0.14 11.15 11.16 5.01 0.04 0.36 0.13
d, n, and c are drought, normal, and combined data, respectively.111
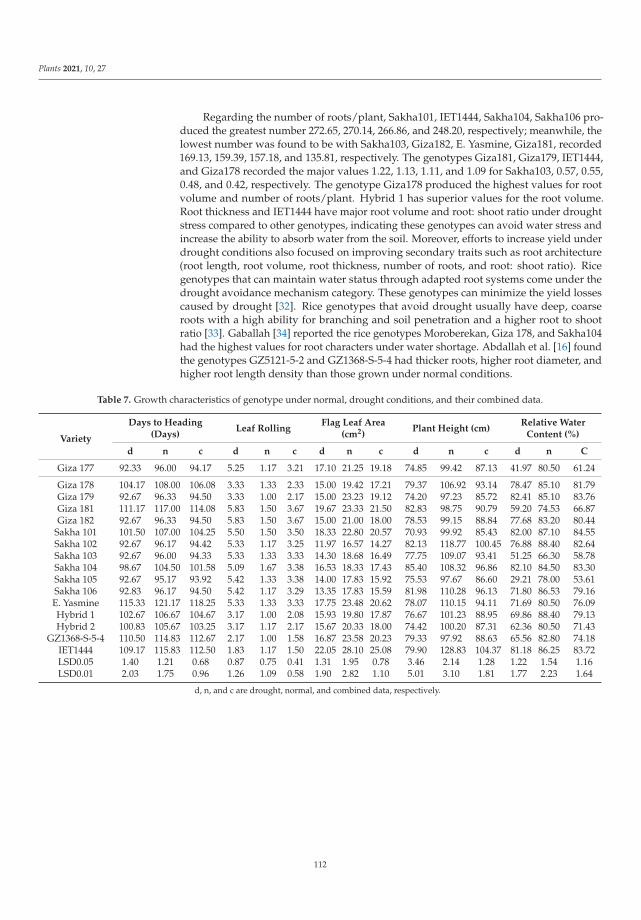
Plants 2021, 10, 27
Regarding the number of roots/plant, Sakha101, IET1444, Sakha104, Sakha106 pro-duced the greatest number 272.65, 270.14, 266.86, and 248.20, respectively; meanwhile, thelowest number was found to be with Sakha103, Giza182, E. Yasmine, Giza181, recorded169.13, 159.39, 157.18, and 135.81, respectively. The genotypes Giza181, Giza179, IET1444,and Giza178 recorded the major values 1.22, 1.13, 1.11, and 1.09 for Sakha103, 0.57, 0.55,0.48, and 0.42, respectively. The genotype Giza178 produced the highest values for rootvolume and number of roots/plant. Hybrid 1 has superior values for the root volume.Root thickness and IET1444 have major root volume and root: shoot ratio under droughtstress compared to other genotypes, indicating these genotypes can avoid water stress andincrease the ability to absorb water from the soil. Moreover, efforts to increase yield underdrought conditions also focused on improving secondary traits such as root architecture(root length, root volume, root thickness, number of roots, and root: shoot ratio). Ricegenotypes that can maintain water status through adapted root systems come under thedrought avoidance mechanism category. These genotypes can minimize the yield lossescaused by drought [32]. Rice genotypes that avoid drought usually have deep, coarseroots with a high ability for branching and soil penetration and a higher root to shootratio [33]. Gaballah [34] reported the rice genotypes Moroberekan, Giza 178, and Sakha104had the highest values for root characters under water shortage. Abdallah et al. [16] foundthe genotypes GZ5121-5-2 and GZ1368-S-5-4 had thicker roots, higher root diameter, andhigher root length density than those grown under normal conditions.
Table 7. Growth characteristics of genotype under normal, drought conditions, and their combined data.
Variety
Days to Heading(Days)
Leaf RollingFlag Leaf Area
(cm2)Plant Height (cm)
Relative WaterContent (%)
d n c d n c d n c d n c d n C
Giza 177 92.33 96.00 94.17 5.25 1.17 3.21 17.10 21.25 19.18 74.85 99.42 87.13 41.97 80.50 61.24
Giza 178 104.17 108.00 106.08 3.33 1.33 2.33 15.00 19.42 17.21 79.37 106.92 93.14 78.47 85.10 81.79Giza 179 92.67 96.33 94.50 3.33 1.00 2.17 15.00 23.23 19.12 74.20 97.23 85.72 82.41 85.10 83.76Giza 181 111.17 117.00 114.08 5.83 1.50 3.67 19.67 23.33 21.50 82.83 98.75 90.79 59.20 74.53 66.87Giza 182 92.67 96.33 94.50 5.83 1.50 3.67 15.00 21.00 18.00 78.53 99.15 88.84 77.68 83.20 80.44
Sakha 101 101.50 107.00 104.25 5.50 1.50 3.50 18.33 22.80 20.57 70.93 99.92 85.43 82.00 87.10 84.55Sakha 102 92.67 96.17 94.42 5.33 1.17 3.25 11.97 16.57 14.27 82.13 118.77 100.45 76.88 88.40 82.64Sakha 103 92.67 96.00 94.33 5.33 1.33 3.33 14.30 18.68 16.49 77.75 109.07 93.41 51.25 66.30 58.78Sakha 104 98.67 104.50 101.58 5.09 1.67 3.38 16.53 18.33 17.43 85.40 108.32 96.86 82.10 84.50 83.30Sakha 105 92.67 95.17 93.92 5.42 1.33 3.38 14.00 17.83 15.92 75.53 97.67 86.60 29.21 78.00 53.61Sakha 106 92.83 96.17 94.50 5.42 1.17 3.29 13.35 17.83 15.59 81.98 110.28 96.13 71.80 86.53 79.16E. Yasmine 115.33 121.17 118.25 5.33 1.33 3.33 17.75 23.48 20.62 78.07 110.15 94.11 71.69 80.50 76.09Hybrid 1 102.67 106.67 104.67 3.17 1.00 2.08 15.93 19.80 17.87 76.67 101.23 88.95 69.86 88.40 79.13Hybrid 2 100.83 105.67 103.25 3.17 1.17 2.17 15.67 20.33 18.00 74.42 100.20 87.31 62.36 80.50 71.43
GZ1368-S-5-4 110.50 114.83 112.67 2.17 1.00 1.58 16.87 23.58 20.23 79.33 97.92 88.63 65.56 82.80 74.18IET1444 109.17 115.83 112.50 1.83 1.17 1.50 22.05 28.10 25.08 79.90 128.83 104.37 81.18 86.25 83.72LSD0.05 1.40 1.21 0.68 0.87 0.75 0.41 1.31 1.95 0.78 3.46 2.14 1.28 1.22 1.54 1.16LSD0.01 2.03 1.75 0.96 1.26 1.09 0.58 1.90 2.82 1.10 5.01 3.10 1.81 1.77 2.23 1.64
d, n, and c are drought, normal, and combined data, respectively.
112
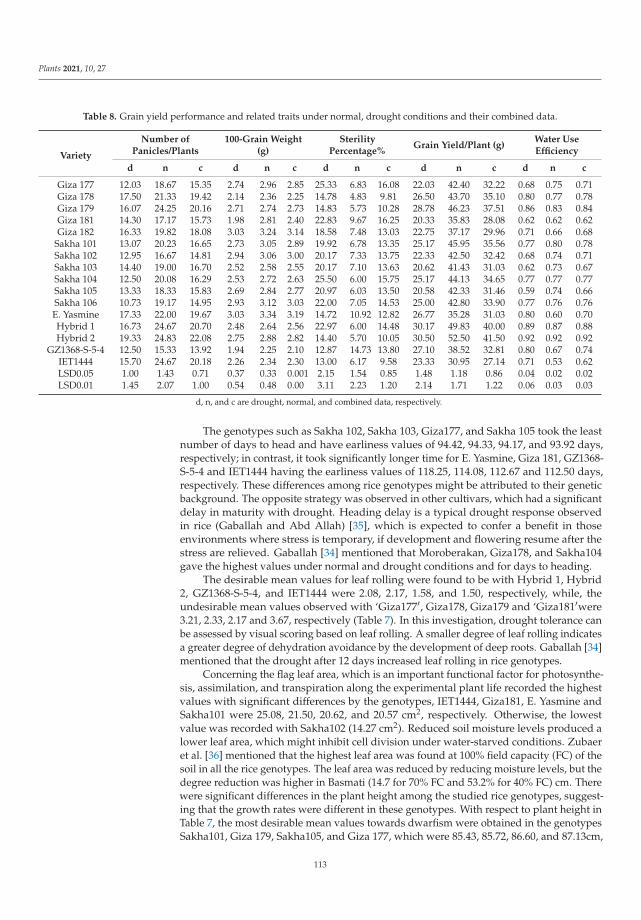
Plants 2021, 10, 27
Table 8. Grain yield performance and related traits under normal, drought conditions and their combined data.
Variety
Number ofPanicles/Plants
100-Grain Weight(g)
SterilityPercentage%
Grain Yield/Plant (g)Water UseEfficiency
d n c d n c d n c d n c d n c
Giza 177 12.03 18.67 15.35 2.74 2.96 2.85 25.33 6.83 16.08 22.03 42.40 32.22 0.68 0.75 0.71Giza 178 17.50 21.33 19.42 2.14 2.36 2.25 14.78 4.83 9.81 26.50 43.70 35.10 0.80 0.77 0.78Giza 179 16.07 24.25 20.16 2.71 2.74 2.73 14.83 5.73 10.28 28.78 46.23 37.51 0.86 0.83 0.84Giza 181 14.30 17.17 15.73 1.98 2.81 2.40 22.83 9.67 16.25 20.33 35.83 28.08 0.62 0.62 0.62Giza 182 16.33 19.82 18.08 3.03 3.24 3.14 18.58 7.48 13.03 22.75 37.17 29.96 0.71 0.66 0.68
Sakha 101 13.07 20.23 16.65 2.73 3.05 2.89 19.92 6.78 13.35 25.17 45.95 35.56 0.77 0.80 0.78Sakha 102 12.95 16.67 14.81 2.94 3.06 3.00 20.17 7.33 13.75 22.33 42.50 32.42 0.68 0.74 0.71Sakha 103 14.40 19.00 16.70 2.52 2.58 2.55 20.17 7.10 13.63 20.62 41.43 31.03 0.62 0.73 0.67Sakha 104 12.50 20.08 16.29 2.53 2.72 2.63 25.50 6.00 15.75 25.17 44.13 34.65 0.77 0.77 0.77Sakha 105 13.33 18.33 15.83 2.69 2.84 2.77 20.97 6.03 13.50 20.58 42.33 31.46 0.59 0.74 0.66Sakha 106 10.73 19.17 14.95 2.93 3.12 3.03 22.00 7.05 14.53 25.00 42.80 33.90 0.77 0.76 0.76E. Yasmine 17.33 22.00 19.67 3.03 3.34 3.19 14.72 10.92 12.82 26.77 35.28 31.03 0.80 0.60 0.70Hybrid 1 16.73 24.67 20.70 2.48 2.64 2.56 22.97 6.00 14.48 30.17 49.83 40.00 0.89 0.87 0.88Hybrid 2 19.33 24.83 22.08 2.75 2.88 2.82 14.40 5.70 10.05 30.50 52.50 41.50 0.92 0.92 0.92
GZ1368-S-5-4 12.50 15.33 13.92 1.94 2.25 2.10 12.87 14.73 13.80 27.10 38.52 32.81 0.80 0.67 0.74IET1444 15.70 24.67 20.18 2.26 2.34 2.30 13.00 6.17 9.58 23.33 30.95 27.14 0.71 0.53 0.62LSD0.05 1.00 1.43 0.71 0.37 0.33 0.001 2.15 1.54 0.85 1.48 1.18 0.86 0.04 0.02 0.02LSD0.01 1.45 2.07 1.00 0.54 0.48 0.00 3.11 2.23 1.20 2.14 1.71 1.22 0.06 0.03 0.03
d, n, and c are drought, normal, and combined data, respectively.
The genotypes such as Sakha 102, Sakha 103, Giza177, and Sakha 105 took the leastnumber of days to head and have earliness values of 94.42, 94.33, 94.17, and 93.92 days,respectively; in contrast, it took significantly longer time for E. Yasmine, Giza 181, GZ1368-S-5-4 and IET1444 having the earliness values of 118.25, 114.08, 112.67 and 112.50 days,respectively. These differences among rice genotypes might be attributed to their geneticbackground. The opposite strategy was observed in other cultivars, which had a significantdelay in maturity with drought. Heading delay is a typical drought response observedin rice (Gaballah and Abd Allah) [35], which is expected to confer a benefit in thoseenvironments where stress is temporary, if development and flowering resume after thestress are relieved. Gaballah [34] mentioned that Moroberakan, Giza178, and Sakha104gave the highest values under normal and drought conditions and for days to heading.
The desirable mean values for leaf rolling were found to be with Hybrid 1, Hybrid2, GZ1368-S-5-4, and IET1444 were 2.08, 2.17, 1.58, and 1.50, respectively, while, theundesirable mean values observed with ‘Giza177′, Giza178, Giza179 and ‘Giza181′were3.21, 2.33, 2.17 and 3.67, respectively (Table 7). In this investigation, drought tolerance canbe assessed by visual scoring based on leaf rolling. A smaller degree of leaf rolling indicatesa greater degree of dehydration avoidance by the development of deep roots. Gaballah [34]mentioned that the drought after 12 days increased leaf rolling in rice genotypes.
Concerning the flag leaf area, which is an important functional factor for photosynthe-sis, assimilation, and transpiration along the experimental plant life recorded the highestvalues with significant differences by the genotypes, IET1444, Giza181, E. Yasmine andSakha101 were 25.08, 21.50, 20.62, and 20.57 cm2, respectively. Otherwise, the lowestvalue was recorded with Sakha102 (14.27 cm2). Reduced soil moisture levels produced alower leaf area, which might inhibit cell division under water-starved conditions. Zubaeret al. [36] mentioned that the highest leaf area was found at 100% field capacity (FC) of thesoil in all the rice genotypes. The leaf area was reduced by reducing moisture levels, but thedegree reduction was higher in Basmati (14.7 for 70% FC and 53.2% for 40% FC) cm. Therewere significant differences in the plant height among the studied rice genotypes, suggest-ing that the growth rates were different in these genotypes. With respect to plant height inTable 7, the most desirable mean values towards dwarfism were obtained in the genotypesSakha101, Giza 179, Sakha105, and Giza 177, which were 85.43, 85.72, 86.60, and 87.13cm,
113
Plants 2021, 10, 27
respectively. Similarly, the tallest values were obtained in Sakha106, Sakha104, Sakha102,and IET1444, 96.13, 96.86, 100.45, and 104.37 cm, respectively. Rice cultivars have toleranceby assessing plant height reduction under drought stress conditions. Lafitte et al. [37]indicated that the low land stress reduced height by only 4 cm (3%), ranging from a 43 cmreduction to a 22 cm increase in height. Regarding relative water content, the genotypesSakha104, IET1444, Giza179, and Sakha101 resulted in the maximum values 83.30, 83.72,83.76, and 84.55%, respectively, while the minimum values were recorded in Sakha105,Sakha103, ‘Giza177′ and Giza181 were 53.61, 58.78, 61.24, and 66.87%, respectively (Table 7).Plant responses to tissue water potential determine their level of drought tolerance. Thetraits, such as leaf turgor (RWC) maintenance and leaf rolling, have been used as selectioncriteria in rice [38], due to rice cultivar’s ability to save water in the leaf tissue to overcomewater shortage. In the present study, we could also find a similar mechanism of droughttolerance is operating in genotypes, such as Giza 179, Sakha 101, Sakha 104, and IET1444,which were able to maintain significantly higher RWC under drought condition. We foundthat these genotypes can be considered as tolerant to moderately tolerant rice genotypesfor drought stress.
For a number of panicles/plant, the genotypes Giza179, IET1444, Hybrid 1, andHybrid 2 recorded the highest mean values of 20.16, 20.18, 20.70, and 22.08, respectively.Otherwise, the lowest values 13.92, 14.81, 14.95, and 15.35 with the genotypes GZ1368-S-5-4, Sakha102, Sakha106, and Giza177, respectively (Table 8). The heaviest 100-grainweight were 3.00, 3.03, 3.14, and 3.19 g, achieved with Sakha102, Sakha106, Giza182, and E.Yasmine. Therefore, the genotypes GZ1368-S-5-4, Giza178, IET1444, and Giza181 gave thelightest values, 2.10, 2.25, 2.30, and 2.40 g, respectively. The desirable values for sterilitypercentage were confirmed with genotypes IET1444, Giza178, Hybrid 2 and Giza179, whichwere 9.58, 9.81, 10.05 and 10.28%, respectively, otherwise the genotypes Sakha106, Sakha104,Giza177, and Giza181 gave undesirable values 14.53, 15.75, 16.08, and 16.25%, respectively.Concerning grain yield/plant, the genotypes Sakha101, Giza179, Hybrid 1, and Hybrid 2resulted in the greatest values 35.56, 37.51, 40.00, and 41.50 g/plant. On the other hand,the lowest values obtained with the genotypes IET1444, Giza181, Giza182, and E. Yasminewere 27.14, 28.08, 29.96, and 31.03 g/plant, respectively. Mukamuhirwa et al. [39] reportedthat the cultivar Intsindagirabigega was most tolerant to drought, while Zong geng was themost sensitive. The genotypes Giza178, Giza179, Hybrid 1, and Hybrid 2 gave maximumvalues 0.78, 0.84, 0.88, and 0.92 respectively, for water use efficiency, while the genotypesGiza181, IET1444, Sakha105, and Sakha103 recorded the minimum values were 0.62, 0.62,0.66, and 0.67, respectively. The rice genotypes Giza 179, Hybrid 1and Hybrid 2 hadhigher values for a number of panicles/plants, 100-grain weight, grain yield/plant andwater use efficiency under normal, drought stress, and their combined data. Gaballah andAbdAllah [35] mentioned that the water stress reduced plant height, induced leaf rolling inthe susceptible rice genotypes. The reduction of grain yield, number of panicles/plants,100-grain weight, and high sterility percentage resulted from water stress at flowering andripening stages. Water stress during vegetative, panicle initiation, flowering has reducedgrain yield/plant by 28%, 34%, and 40%, respectively. Drought mitigation, through thedevelopment of drought-tolerant varieties with higher yields suitable for water-limitingenvironments, will be the critical factor in improving stable rice production.
3.2. Number of Alleles and Allelic Diversity
The sixteen rice genotypes were used in the present study were subjected to DNApolymorphism screening and assessment using SSR markers, which offer excellent potentialfor generating large numbers of markers evenly distributed throughout the genome andhave efficiently been used to give reliable and reproducible genetic markers. Ten SSRprimer pairs related to drought tolerance with known map positions distributed in the ricegenome were used to screen a set of sixteen selected indica, japonica, and tropical-japonicarice genotypes with different levels with mechanisms of drought.
114
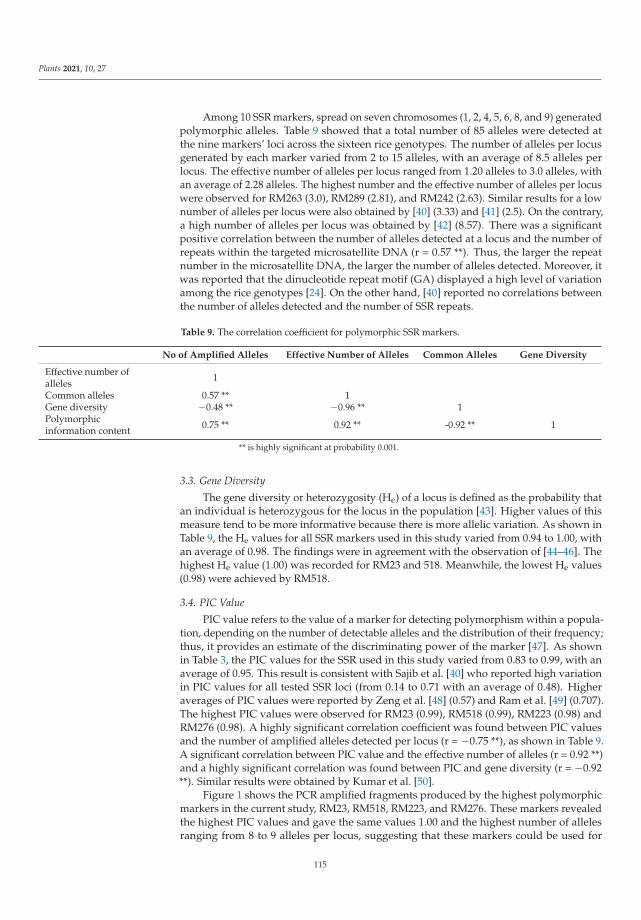
Plants 2021, 10, 27
Among 10 SSR markers, spread on seven chromosomes (1, 2, 4, 5, 6, 8, and 9) generatedpolymorphic alleles. Table 9 showed that a total number of 85 alleles were detected atthe nine markers’ loci across the sixteen rice genotypes. The number of alleles per locusgenerated by each marker varied from 2 to 15 alleles, with an average of 8.5 alleles perlocus. The effective number of alleles per locus ranged from 1.20 alleles to 3.0 alleles, withan average of 2.28 alleles. The highest number and the effective number of alleles per locuswere observed for RM263 (3.0), RM289 (2.81), and RM242 (2.63). Similar results for a lownumber of alleles per locus were also obtained by [40] (3.33) and [41] (2.5). On the contrary,a high number of alleles per locus was obtained by [42] (8.57). There was a significantpositive correlation between the number of alleles detected at a locus and the number ofrepeats within the targeted microsatellite DNA (r = 0.57 **). Thus, the larger the repeatnumber in the microsatellite DNA, the larger the number of alleles detected. Moreover, itwas reported that the dinucleotide repeat motif (GA) displayed a high level of variationamong the rice genotypes [24]. On the other hand, [40] reported no correlations betweenthe number of alleles detected and the number of SSR repeats.
Table 9. The correlation coefficient for polymorphic SSR markers.
No of Amplified Alleles Effective Number of Alleles Common Alleles Gene Diversity
Effective number ofalleles 1
Common alleles 0.57 ** 1Gene diversity −0.48 ** −0.96 ** 1Polymorphicinformation content 0.75 ** 0.92 ** -0.92 ** 1
** is highly significant at probability 0.001.
3.3. Gene Diversity
The gene diversity or heterozygosity (He) of a locus is defined as the probability thatan individual is heterozygous for the locus in the population [43]. Higher values of thismeasure tend to be more informative because there is more allelic variation. As shown inTable 9, the He values for all SSR markers used in this study varied from 0.94 to 1.00, withan average of 0.98. The findings were in agreement with the observation of [44–46]. Thehighest He value (1.00) was recorded for RM23 and 518. Meanwhile, the lowest He values(0.98) were achieved by RM518.
3.4. PIC Value
PIC value refers to the value of a marker for detecting polymorphism within a popula-tion, depending on the number of detectable alleles and the distribution of their frequency;thus, it provides an estimate of the discriminating power of the marker [47]. As shownin Table 3, the PIC values for the SSR used in this study varied from 0.83 to 0.99, with anaverage of 0.95. This result is consistent with Sajib et al. [40] who reported high variationin PIC values for all tested SSR loci (from 0.14 to 0.71 with an average of 0.48). Higheraverages of PIC values were reported by Zeng et al. [48] (0.57) and Ram et al. [49] (0.707).The highest PIC values were observed for RM23 (0.99), RM518 (0.99), RM223 (0.98) andRM276 (0.98). A highly significant correlation coefficient was found between PIC valuesand the number of amplified alleles detected per locus (r = −0.75 **), as shown in Table 9.A significant correlation between PIC value and the effective number of alleles (r = 0.92 **)and a highly significant correlation was found between PIC and gene diversity (r = −0.92**). Similar results were obtained by Kumar et al. [50].
Figure 1 shows the PCR amplified fragments produced by the highest polymorphicmarkers in the current study, RM23, RM518, RM223, and RM276. These markers revealedthe highest PIC values and gave the same values 1.00 and the highest number of allelesranging from 8 to 9 alleles per locus, suggesting that these markers could be used for
115
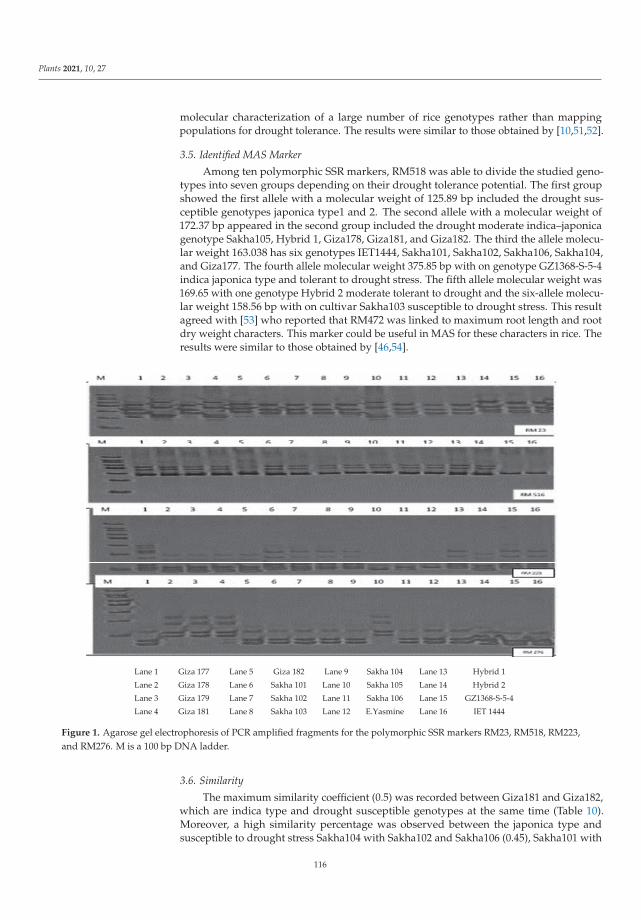
Plants 2021, 10, 27
molecular characterization of a large number of rice genotypes rather than mappingpopulations for drought tolerance. The results were similar to those obtained by [10,51,52].
3.5. Identified MAS Marker
Among ten polymorphic SSR markers, RM518 was able to divide the studied geno-types into seven groups depending on their drought tolerance potential. The first groupshowed the first allele with a molecular weight of 125.89 bp included the drought sus-ceptible genotypes japonica type1 and 2. The second allele with a molecular weight of172.37 bp appeared in the second group included the drought moderate indica–japonicagenotype Sakha105, Hybrid 1, Giza178, Giza181, and Giza182. The third the allele molecu-lar weight 163.038 has six genotypes IET1444, Sakha101, Sakha102, Sakha106, Sakha104,and Giza177. The fourth allele molecular weight 375.85 bp with on genotype GZ1368-S-5-4indica japonica type and tolerant to drought stress. The fifth allele molecular weight was169.65 with one genotype Hybrid 2 moderate tolerant to drought and the six-allele molecu-lar weight 158.56 bp with on cultivar Sakha103 susceptible to drought stress. This resultagreed with [53] who reported that RM472 was linked to maximum root length and rootdry weight characters. This marker could be useful in MAS for these characters in rice. Theresults were similar to those obtained by [46,54].
Lane 1 Giza 177 Lane 5 Giza 182 Lane 9 Sakha 104 Lane 13 Hybrid 1 Lane 2 Giza 178 Lane 6 Sakha 101 Lane 10 Sakha 105 Lane 14 Hybrid 2 Lane 3 Giza 179 Lane 7 Sakha 102 Lane 11 Sakha 106 Lane 15 GZ1368-S-5-4 Lane 4 Giza 181 Lane 8 Sakha 103 Lane 12 E.Yasmine Lane 16 IET 1444
Figure 1. Agarose gel electrophoresis of PCR amplified fragments for the polymorphic SSR markers RM23, RM518, RM223,and RM276. M is a 100 bp DNA ladder.
3.6. Similarity
The maximum similarity coefficient (0.5) was recorded between Giza181 and Giza182,which are indica type and drought susceptible genotypes at the same time (Table 10).Moreover, a high similarity percentage was observed between the japonica type andsusceptible to drought stress Sakha104 with Sakha102 and Sakha106 (0.45), Sakha101 with
116
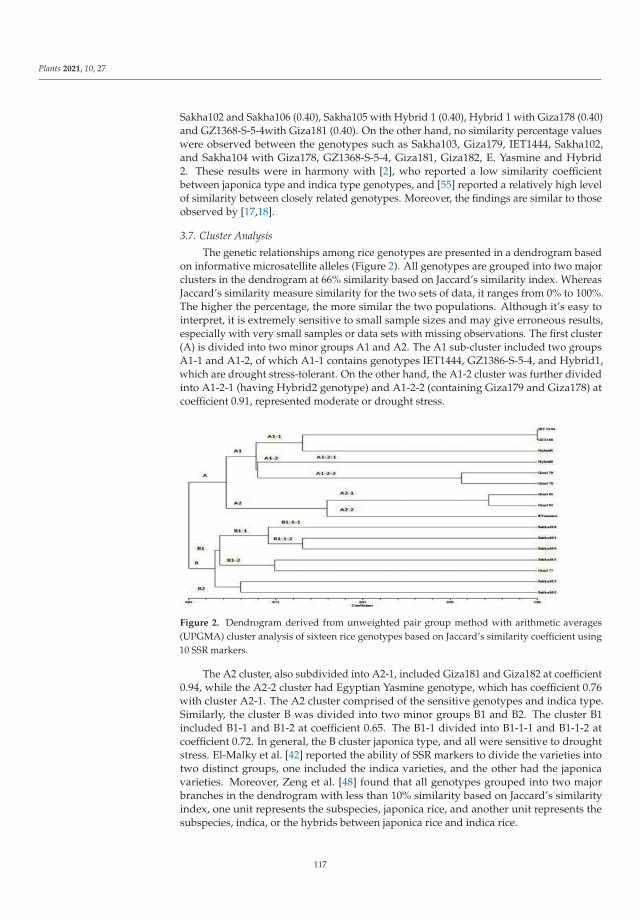
Plants 2021, 10, 27
Sakha102 and Sakha106 (0.40), Sakha105 with Hybrid 1 (0.40), Hybrid 1 with Giza178 (0.40)and GZ1368-S-5-4with Giza181 (0.40). On the other hand, no similarity percentage valueswere observed between the genotypes such as Sakha103, Giza179, IET1444, Sakha102,and Sakha104 with Giza178, GZ1368-S-5-4, Giza181, Giza182, E. Yasmine and Hybrid2. These results were in harmony with [2], who reported a low similarity coefficientbetween japonica type and indica type genotypes, and [55] reported a relatively high levelof similarity between closely related genotypes. Moreover, the findings are similar to thoseobserved by [17,18].
3.7. Cluster Analysis
The genetic relationships among rice genotypes are presented in a dendrogram basedon informative microsatellite alleles (Figure 2). All genotypes are grouped into two majorclusters in the dendrogram at 66% similarity based on Jaccard’s similarity index. WhereasJaccard’s similarity measure similarity for the two sets of data, it ranges from 0% to 100%.The higher the percentage, the more similar the two populations. Although it’s easy tointerpret, it is extremely sensitive to small sample sizes and may give erroneous results,especially with very small samples or data sets with missing observations. The first cluster(A) is divided into two minor groups A1 and A2. The A1 sub-cluster included two groupsA1-1 and A1-2, of which A1-1 contains genotypes IET1444, GZ1386-S-5-4, and Hybrid1,which are drought stress-tolerant. On the other hand, the A1-2 cluster was further dividedinto A1-2-1 (having Hybrid2 genotype) and A1-2-2 (containing Giza179 and Giza178) atcoefficient 0.91, represented moderate or drought stress.
Figure 2. Dendrogram derived from unweighted pair group method with arithmetic averages(UPGMA) cluster analysis of sixteen rice genotypes based on Jaccard’s similarity coefficient using10 SSR markers.
The A2 cluster, also subdivided into A2-1, included Giza181 and Giza182 at coefficient0.94, while the A2-2 cluster had Egyptian Yasmine genotype, which has coefficient 0.76with cluster A2-1. The A2 cluster comprised of the sensitive genotypes and indica type.Similarly, the cluster B was divided into two minor groups B1 and B2. The cluster B1included B1-1 and B1-2 at coefficient 0.65. The B1-1 divided into B1-1-1 and B1-1-2 atcoefficient 0.72. In general, the B cluster japonica type, and all were sensitive to droughtstress. El-Malky et al. [42] reported the ability of SSR markers to divide the varieties intotwo distinct groups, one included the indica varieties, and the other had the japonicavarieties. Moreover, Zeng et al. [48] found that all genotypes grouped into two majorbranches in the dendrogram with less than 10% similarity based on Jaccard’s similarityindex, one unit represents the subspecies, japonica rice, and another unit represents thesubspecies, indica, or the hybrids between japonica rice and indica rice.
117
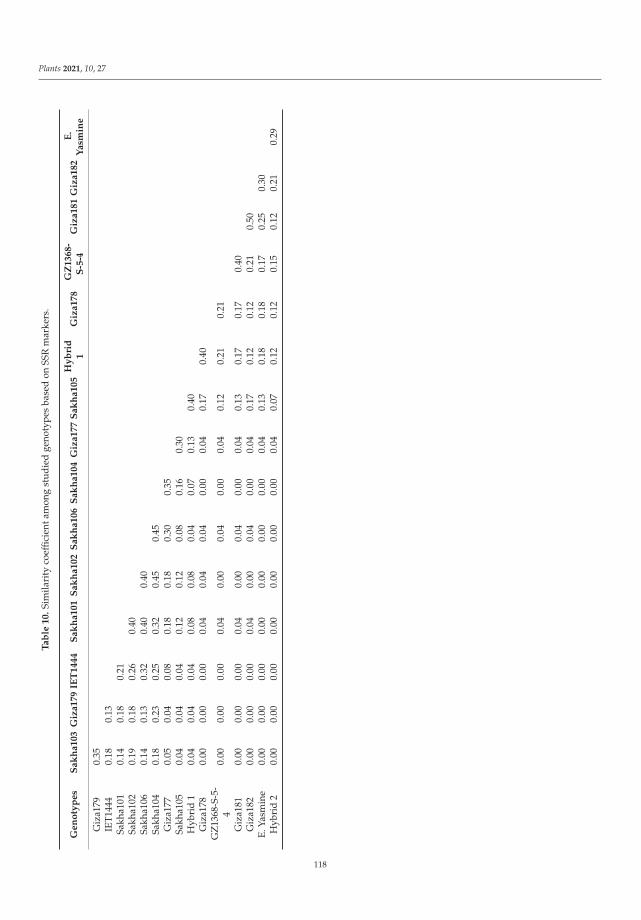
Plants 2021, 10, 27
Ta
ble
10
.Si
mila
rity
coef
ficie
ntam
ong
stud
ied
geno
type
sba
sed
onSS
Rm
arke
rs.
Ge
no
typ
es
Sa
kh
a1
03
Giz
a1
79
IET
14
44
Sa
kh
a1
01
Sa
kh
a1
02
Sa
kh
a1
06
Sa
kh
a1
04
Giz
a1
77
Sa
kh
a1
05
Hy
bri
d1
Giz
a1
78
GZ
13
68
-S
-5-4
Giz
a1
81
Giz
a1
82
E.
Ya
smin
e
Giz
a179
0.35
IET1
444
0.18
0.13
Sakh
a101
0.14
0.18
0.21
Sakh
a102
0.19
0.18
0.26
0.40
Sakh
a106
0.14
0.13
0.32
0.40
0.40
Sakh
a104
0.18
0.23
0.25
0.32
0.45
0.45
Giz
a177
0.05
0.04
0.08
0.18
0.18
0.30
0.35
Sakh
a105
0.04
0.04
0.04
0.12
0.12
0.08
0.16
0.30
Hyb
rid
10.
040.
040.
040.
080.
080.
040.
070.
130.
40G
iza1
780.
000.
000.
000.
040.
040.
040.
000.
040.
170.
40G
Z13
68-S
-5-
40.
000.
000.
000.
040.
000.
040.
000.
040.
120.
210.
21
Giz
a181
0.00
0.00
0.00
0.04
0.00
0.04
0.00
0.04
0.13
0.17
0.17
0.40
Giz
a182
0.00
0.00
0.00
0.04
0.00
0.04
0.00
0.04
0.17
0.12
0.12
0.21
0.50
E.Ya
smin
e0.
000.
000.
000.
000.
000.
000.
000.
040.
130.
180.
180.
170.
250.
30H
ybri
d2
0.00
0.00
0.00
0.00
0.00
0.00
0.00
0.04
0.07
0.12
0.12
0.15
0.12
0.21
0.29
118
Plants 2021, 10, 27
4. Conclusions
Genetic improvement for drought tolerance in rice can be achieved in this presentstudy based on results obtained at phenotypic characterization. Extensive genetic diversityanalyses were presented as valuable in selecting the truly promising drought-tolerant geno-types, which can be used to cross to development genotypes with increased water stresstolerance levels. The rice genotypes Giza179, IET1444, Hybrid1, and Hybrid2, achievedthe greatest values for grain yield/plant and produced maximum values regarding wateruse efficiency. It could be summarized the genotypes GZ1368-S-5-4, IET1444, Giza 178,and Giza179 were suitable materials for developing drought breeding. Thus, this study’sresults indicate that incorporating genetic analyses with phenotypic data is very importantto accelerate breeding programs by selecting suitable genotypes to improve target traitsand could help exclude genotypes with bad performance.
Author Contributions: Conceptualization, M.M.G., and A.M.F.; methodology, M.M.G. and A.M.M.;software, A.M.M.; validation, A.E.S., M.M.G.; formal analysis, A.M.F.; investigation, M.M.G.; re-sources, M.M.G. and A.M.F.; data curation, M.M.G.; writing—original draft preparation, M.M.G.,A.M.F., and A.M.M.; writing—review and editing, A.E.S., M.S., M.B., M.M.H.; visualization, A.M.F.;supervision, M.M.G.; project administration, A.M.F.; funding acquisition, M.S., M.B., M.M.H., A.E.S.All authors have read and agreed to the published version of the manuscript.
Funding: The current work was funded by Taif University Researchers Supporting Project number(TURSP—2020/59), Taif university, Taif, Saudi Arabia.
Acknowledgments: The authors sincerely acknowledge the contributions of Rice Research andTraining Center (RRTC), Field Crops Research Institute, Agricultural Research Center, 33717, Sakha,Kafr Elsheikh, Egypt for providing necessary laboratory facility during the investigation. Besides,the authors extend their appreciation to Taif University for funding current work by Taif UniversityResearchers Supporting Project number (TURSP—2020/59), Taif University, Taif, Saudi Arabia.
Conflicts of Interest: The authors declare no conflict of interest.
References
1. Long, S.P.; Ort, D.R. More than taking the heat: Crops and global change. Curr. Opin. Plant Biol. 2010, 13, 1–8. [CrossRef][PubMed]
2. Chakravarthi, B.K.; Naravaneni, R. SSR marker-based DNA fingerprinting and diversity study in rice (Oryza sativa L.). Afr. J.Biotechnol. 2006, 5, 684–688.
3. Passioura, J.B. The drought environment: Physical, biological and agricultural perspectives. J. Exp. Bot. 2007, 58, 113–117.[CrossRef] [PubMed]
4. Wery, J.; Silim, S.N.; Knights, E.J.; Malhotra, R.S.; Cousin, R. Screening techniques and sources and tolerance to extremes ofmoisture and air temperature in cool season food legumes. Euphytica 1994, 73, 73–83. [CrossRef]
5. Anis, G.; Hassan, H.; Saneoka, H.; El Sabagh, A. Evaluation of new promising rice hybrid and its parental lines for floral,agronomic traits and genetic purity assessment. Pak. J. Agric. Sci. 2019, 56, 567–576.
6. Hossain, M.M.; Islam, M.M.; Hossain, H.; Ali, M.S.; Silva, T.D. Genetic diversity analysis of aromatic landraces of rice (Oryzasativa L.) by microsatellite markers. Genes Genom. Genom. 2012, 6, 42–47.
7. Sivaranjani, A.K.P.; Pandey, M.K.; Sudharshan, I.; Kumar, G.R.; Madhav, M.S. Assessment of genetic diversity among Basmatiand non-Basmati aromatic rices of India using SSR markers. Curr. Sci. 2010, 99, 221–226.
8. Ravi, M.; Geethanjali, S.; Sameeyafarheen, F.; Maheswaran, M. Molecular marker based genetic diversity analysis in rice (Oryzasativa L.) using RAPD and SSR markers. Euphytica 2003, 133, 243–252. [CrossRef]
9. Singh, A.; Sengar, R.S. DNA fingerprinting based decoding of indica rice (Oryza sativa L) via molecular marker (SSR, ISSR, &RAPD) in aerobic condition. Adv. Crop. Sci. Technol. 2015, 3, 167.
10. Chukwu, S.C.; Rafii, M.Y.; Ramlee, S.I.; Ismail, S.I.; Oladosu, Y.; Kolapo, K.; Musa, I.; Halidu, J.; Muhammad, I.; Ahmed, M.Marker-Assisted Introgression of Multiple Resistance Genes Confers Broad Spectrum Resistance against Bacterial Leaf Blight andBlast Diseases in PUTRA-1 Rice Variety. Agronomy 2020, 10, 42. [CrossRef]
11. Lapitan, V.C.; Brar, D.S.; Abe, T.; Redofia, E.D. Assessment of genetic diversity of Philippine rice cultivars carrying good qualitytraits using SSR markers. Breed Sci. 2007, 57, 263–270. [CrossRef]
12. Suh, J.P.; Won, Y.J.; Ahn, E.K.; Lee, J.H.; Ha, W.G.; Kim, M.K.; Cho, Y.C.; Jeong, E.G.; Kim, B.K. Field performance and SSR analysisof drought QTL introgression lines of rice. Plant Breed Biotechnol. 2014, 30, 158–166. [CrossRef]
119
Plants 2021, 10, 27
13. Vikram, P.; Swamy, B.P.M.; Dixit, S.; Cruz, S.; Ahmed, H.U.; Singh, A.K.; Kumar, A. qDTY1.1, a major QTL for rice grain yieldunder reproductive-stage drought stress with a consistent effect in multiple elite genetic backgrounds. BMC Genet. 2011, 12, 89.[CrossRef] [PubMed]
14. Venuprasad, R.; Dalid, C.O.; Del Valle, M.; Zhao, D.; Espiritu, M.; Sta Cruz, M.T.; Amante, M.; Kumar, A.; Atlin, G.N. Identificationand characterization of large-effect quantitative trait loci for grain yield under lowland drought stress in rice using bulk-segregantanalysis. Theoret. Appl. Genet. 2009, 120, 177–190. [CrossRef] [PubMed]
15. Shamshudin, N.A.; Swamy, B.M.; Ratnam, W.; Cruz, M.T.; Raman, A.; Kumar, A. Marker assisted pyramiding of drought yieldQTLs into a popular Malaysian rice cultivar, MR219. BMC genet. 2016, 17, 3.
16. Abdallah, A.A.; Ammar, M.H.; Badawi, A.T. Screening rice genotypes for drought resistance in Egypt. J. Plant Breed Crop. Sci.2010, 2, 205–215.
17. Mumtaz, M.Z.; Saqib, M.; Abbas, G.; Akhtar, J.; Ul-Qamar, Z. Drought stress impairs grain yield and quality of rice genotypes byimpaired photosynthetic attributes and k nutrition. Rice Sci. 2020, 27, 5–9. [CrossRef]
18. Tabkhkar, N.; Rabiei, B.; Lahiji, H.S.; Chaleshtori, M.H. Identification of a new set of drought-related miRNA-SSR markers andassociation analysis under drought stress in rice (Oryza sativa L.). Plant Gene 2020, 21, 1–10. [CrossRef]
19. Steel, R.G.D.; Torrie, J.H.; Dickey, D.A. Principles and Procedures for Statistics; M.c. Graw Hill Book Co.: New York, NY, USA, 1997.20. Zheng, K.; Huang, N.; Bennett, J.; Khush, G.S. PCR-Based Marker Assisted Selection in Rice Breeding; Irri Discussion Paper Series No
12; International Rice Research Institute: Manila, Philippines, 1995; pp. 9–11.21. Chen, X.; Temnykh, S.; Xu, Y.; Cho, Y.G.; Mccouch, S.R. Development of a microsatellite framework map providing genome-wide
coverage in rice (Oryza sativa L.). Theoret. Appl. Genet. 1997, 95, 553–567. [CrossRef]22. Wu, K.S.; Tanksley, S.D. Abundance, polymorphism and genetic mapping of microsatellites in rice. Mol. Gen. Genet. 1993, 241,
225–235. [CrossRef]23. Qu, S.; Desai, A.; Wing, R.; Sundaresan, V. A versatile transposon-based activation tag vector system for functional genomics in
cereals and other monocot plants. Plant Physiol. 2008, 146, 189–199. [CrossRef] [PubMed]24. Temnykh, S.; Park, W.D.; Ayres, N.M.; Cartinhour, S.; Hauck, N.; Lipovich, L.; Cho, Y.G.; Ishii, T.; Mccouch, S.R. Mapping and
genome organization of microsatellite sequences in rice (Oryza sativa L.). Theoret. Appld. Genet. 2000, 100, 697–712. [CrossRef]25. Temnykh, S.; Clerck, D.G.; Lukashova, A.; Lipovich, L.; Cartinhour, S.; Couch, M.S. Computational and experimental analysis
of microsatellites in rice (Oryza sativa L.): Frequency, length variation, transposon associations, and genetic marker potential.Genome Res. 2001, 11, 1441–1452. [CrossRef] [PubMed]
26. Nei, M.; Li, W.H. Mathematical model for studying genetic variation in terms of restriction endonucleases. Proc. Natl. Acad. Sci.USA 1979, 76, 5269–5273. [CrossRef] [PubMed]
27. Sun, J.; Zhao, J.; Schwartz, M.A.; Wang, J.Y.; Weidmer, T.; Sims, P.J. c-Abl tyrosine kinase binds and phosphorylates phospholipidscramblase 1. J. Boil. Chem. 2001, 276, 28984–28990. [CrossRef]
28. Abdallah, A.; Gaballah, M.; Aml El-Saidy, M.; Ammar, M. Drought Tolerance of Anther Culture Derived Rice Lines. J. Plant Prod.2014, 11, 115–124. [CrossRef]
29. Meng, T.Y.; Wei, H.H.; Li, C.; Dai, Q.G.; Xu, K.; Huo, Z.Y.; Wei, H.Y.; Guo, B.W.; Zhang, H.C. Morphological and PhysiologicalTraits of Large-Panicle Rice Varieties with High Filled-Grain Percentage. J. Integr. Agric. 2016, 15, 1751–1762. [CrossRef]
30. Raman, A.; Verulkar, S.B.; Mandal, N.P.; Variar, M.; Shukla, V.D.; Dwivedi, J.L.; Singh, B.N.; Singh, O.N.; Swain, P.; Mall, A.K.;et al. Drought yield index to select high yielding rice lines under different drought stress severities. Rice 2012, 5, 31. [CrossRef]
31. Zhang, J.; Babu, R.C.; Pantuwan, G.; Kamoshita, A.; Blum, A.; Wade, L.; Sarkarung, S.; O’Toole, J.C.; Nguyen, H.T. Environments.In Molecular Dissection of Drought Tolerance in Rice: From Physio-Morphological Traits to Field Performance; Ito, O., O’Toole, J.C., Hardy,B., Eds.; International Rice Research Institute: Los Banos, Philippines, 1999; pp. 331–343.
32. Singh, S.; Pradhan, S.; Singh, A.; Singh, O. Marker validation in recombinant inbred lines and random varieties of rice for droughttolerance. Aust. J. Crop. Sci. 2012, 6, 606–612.
33. Wang, H.; Inukai, Y.; Yamauchi, A. Root development and nutrient uptake. Crit. Rev. Plant Sci. 2006, 25, 279–301. [CrossRef]34. Gaballah, M.M. Studies on Physiological and Morphological Traits Associated with Drought Resistance in Rice (Oryza sativa L.).
Ph.D. Thesis, Kafer El-Sheikh University, Kafer, Egypt, 2009.35. Gaballah, M.M.; Abdallah, A.A. Effect of water irrigation shortage on some quantitative characters at different rice development
growth stages. World Rural Obs. 2015, 7, 10–21.36. Zubaer, M.A.; Chowdhury, A.K.; Islam, M.Z.; Ahmed, T.; Hasan, M.A. Effects of water stress on growth and yield attributes of
Aman rice genotypes. Int. J. Sustain. Crop. Prod. 2007, 2, 25–30.37. Lafitte, H.R.; Li, V.R.; Gao, C.H.M.; Shi, Y.M.; Xu, Y.; Fu, J.L.; Yu, B.Y.; Ali, S.B.; Domingo, A.J.; Maghirang, J.; et al. Improvement
of rice drought tolerance through backcross breeding: Evaluation of donors and selection in drought nurseries. Field Crop. Res.2006, 97, 77–86. [CrossRef]
38. Kumar, A.; Basu, S.; Ramegowda, V.; Pereira, A. Mechanisms of Drought Tolerance in Rice. Burleigh Dodds Sci. Publ. Ltd. 2018, 12,1–34.
39. Mukamuhirwa, A.; Hovmalm, H.P.; Bolinsson, H.; Ortiz, R.; Nyamangyoku, O.; Johansson, E. Concurrent Drought andTemperature Stress in Rice-a Possible Result of the Predicted Climate Change: Effects on Yield Attributes, Eating Characteristics,and Health Promoting Compounds. Int. J. Environ. Res. Public Health 2019, 16, 1043. [CrossRef]
120
Plants 2021, 10, 27
40. Sajib, A.M.; Hossain, M.M.; Mosnaz, A.T.M.; Hossain, H.; Islam, M.M.; Ali, M.S.; Prodhan, S.H. SSR marker-based molecularcharacterization and genetic diversity analysis of aromatic landreces of rice (Oryza sativa L.). J. BioSci. Biotech. 2012, 1, 107–116.
41. Vanniarajan, C.; Vinod, K.K.; Pereira, A. Molecular evaluation of genetic diversity and association studies in rice (Oryza sativa, L.).J. Genet. 2012, 91, 1–11. [CrossRef]
42. El-Malky, M.M.; Fahmy, A.I.; Kotb, A.A. Detection of genetic diversity using microsatellites in rice (Oryza sative L.). Afr. Crop. Sci.Conf. Proc. 2007, 8, 597–603.
43. Liu, B.H. Statistical Genomics: Linkage, Mapping and QTL Analysis; CRC Press: Boca Raton, FL, USA, 1998; p. 611.44. Fasahat, P.; Muhammad, K.; Abdullah, A.; Wickneswari, R. Identification of introgressed alien chromosome segments associated
with grain quality in Oryza rufiogon x MR219 advanced breeding genotypes using SSR markers. Genet. Mol. Res. 2012, 11,3534–3546. [CrossRef]
45. Islam, M.D.S.; Guswami, A.A.P.; Sarid-Ullah, M.; Hossain, M.M.; Prodhan, H.F.M.S. Assessment of genetic diversity amongmoderately drought tolerant landraces of rice using RAPD markers. J. Biosci. Biotech. 2013, 2, 207–213.
46. El-Wahsh, S.M.; El-Refaee, Y.Z.; Emeran, A.A.; Mashaal, S.F.; Arafa, R.A. Genetic diversity of rice blast fungus populations(Pyricularia grisea) using molecular markers. J. Agric. Chem. Biotechnol. 2016, 7, 57–65. [CrossRef]
47. Nagy, S.; Poczai, P.; Cernak, I.; Gorji, A.M.; Hegedus, G.; Taller, J. PIC calc: An online program to calculate polymorphicinformation content for molecular genetic studies. Biochem. Genet. 2012, 50, 670–672. [CrossRef] [PubMed]
48. Zeng, L.; Kwon, T.R.; Liu, X.; Wilson, C.; Grieve, C.M.; Gregorio, G.B. Genetic diversity analyzed by microsatellite markers amongrice (Oryza sativa, L.) genotypes with different adaptations to saline soils. Plant Sci. 2004, 166, 1275–1285. [CrossRef]
49. Ram, S.G.; Thiruvengadam, V.; Vinod, K.K. Genetic diversity among cultivars, landraces and wild relatives of rice as revealed bymicrosatellite markers. J. Appl. Genet. 2007, 48, 337–345. [CrossRef] [PubMed]
50. Kumar, V.; Kumar, S.; Chakrabarty, S.K.; Mohapatra, T.; Dadlani, M. Molecular characterization of farmers’ varieties of rice (Oryzasativa). Indian J. Agric. Sci. 2015, 85, 118–124.
51. Aljumaili, S.J.; Rafii, M.Y.; Latif, M.A.; Sakimin, S.Z.; Arolu, I.W.; Miah, G. Genetic diversity of aromatic rice germplasm revealedby SSR markers. BioMed Res. Int. 2018, 2018, 7658032. [CrossRef]
52. Melaku, G.; Zhang, S.; Haileselassie, T. Comparative evaluation of rice SSR markers on different Oryza species. J. Rice Res. Dev.2018, 1, 38–48.
53. Kanbar, A.; Shashidhar, H.E. Participatory selection assisted by DNA markers for enhanced drought resistance and productivityin rice (Oryza sativa, L.). Euphytica 2011, 178, 137–150. [CrossRef]
54. Pachauri, V.; Taneja, N.; Vikram, P.; Singh, N.K.; Singh, S. Molecular and morphological characterization of Indian farmers’ ricevarieties (Oryza sativa L.). Aust. J. Crop. Sci. 2013, 7, 923–932.
55. Kanawapee, N.; Sanitchon, J.; Srihaban, P.; Theerakulpisut, P. Genetic diversity analysis of rice cultivars (Oryza sativa L.) differingin salinity tolerance based on RAPD and SSR markers. Electr. J. Biotechnol. 2011, 14, 1–17.
121

plants
Article
QMrl-7B Enhances Root System, Biomass, NitrogenAccumulation and Yield in Bread Wheat
Jiajia Liu 1,2,†, Qi Zhang 1,2,†, Deyuan Meng 1,2, Xiaoli Ren 1,2, Hanwen Li 3, Zhenqi Su 3, Na Zhang 1, Liya Zhi 1,
Jun Ji 1, Junming Li 1, Fa Cui 4,* and Liqiang Song 1,5,*
Citation: Liu, J.; Zhang, Q.; Meng, D.;
Ren, X.; Li, H.; Su, Z.; Zhang, N.; Zhi,
L.; Ji, J.; Li, J.; et al. QMrl-7B Enhances
Root System, Biomass, Nitrogen
Accumulation and Yield in Bread
Wheat. Plants 2021, 10, 764. https://
doi.org/10.3390/plants10040764
Academic Editor: Igor G. Loskutov
Received: 16 March 2021
Accepted: 10 April 2021
Published: 13 April 2021
Publisher’s Note: MDPI stays neutral
with regard to jurisdictional claims in
published maps and institutional affil-
iations.
Copyright: © 2021 by the authors.
Licensee MDPI, Basel, Switzerland.
This article is an open access article
distributed under the terms and
conditions of the Creative Commons
Attribution (CC BY) license (https://
creativecommons.org/licenses/by/
4.0/).
1 Center for Agricultural Resources Research, Institute of Genetics and Developmental Biology,The Innovative Academy of Seed Design, Chinese Academy of Sciences, Shijiazhuang 050022, China;[email protected] (J.L.); [email protected] (Q.Z.); [email protected] (D.M.);[email protected] (X.R.); [email protected] (N.Z.); [email protected] (L.Z.);[email protected] (J.J.); [email protected] (J.L.)
2 University of Chinese Academy of Sciences, Beijing 100049, China3 College of Agronomy and Biotechnology, China Agricultural University, Beijing 100094, China;
[email protected] (H.L.); [email protected] (Z.S.)4 Key Laboratory of Molecular Module-Based Breeding of High Yield and Abiotic Resistant Plants in
Universities of Shandong, School of Agriculture, Ludong University, Yantai 264025, China5 State Key Laboratory of North China Crop Improvement and Regulation, College of Agronomy, Hebei
Agricultural University, Baoding 071000, China* Correspondence: [email protected] (F.C.); [email protected] (L.S.); Tel.: +86-311-8588-7272 (L.S.);
Fax: +86-311-8581-5093 (L.S.)† The authors have contributed equally to this work.
Abstract: Genetic improvement of root systems is an efficient approach to improve yield potentialand nitrogen use efficiency (NUE) of crops. QMrl-7B was a major stable quantitative trait locus (QTL)controlling the maximum root length in wheat (Triticum aestivum L). Two types of near isogeniclines (A-NILs with superior and B-NILs with inferior alleles) were used to specify the effects ofQMrl-7B on root, grain output and nitrogen-related traits under both low nitrogen (LN) and highnitrogen (HN) environments. Trials in two consecutive growing seasons showed that the root traits,including root length (RL), root area (RA) and root dry weight (RDW), of the A-NILs were higherthan those of the B-NILs at seedling stage (SS) before winter, jointing stage (JS), 10 days post anthesis(PA10) and maturity (MS), respectively. Under the LN environment, in particular, all the root traitsshowed significant differences between the two types of NILs (p < 0.05). In contrast, there were nocritical differences in aerial biomass and aerial N accumulation (ANA) between the two types ofNILs at SS and JS stages. At PA10 stage, the aerial biomass and ANA of the A-NILs were significantlyhigher than those of the B-NILs under both LN and HN environments (p < 0.05). At MS stage, theA-NILs also exhibited significantly higher thousand-grain weight (TGW), plot grain yield, harvestindex (HI), grain N accumulation (GNA), nitrogen harvest index (NHI) and nitrogen partial factorproductivity (NPFP) than the B-NILs under the corresponding environments (p < 0.05). In summary,the QMrl-7B A-NILs manifested larger root systems compared to the B-NILs which is favorable toN uptake and accumulation, and eventually enhanced grain production. This research providesvaluable information for genetic improvement of root traits and breeding elite wheat varieties withhigh yield potential and NPFP.
Keywords: Triticum aestivum L.; QMrl-7B; root traits; grain yield; nitrogen use efficiency
1. Introduction
Bread wheat (Triticum aestivum L.) is one of the major crops worldwide; its productiongreatly affects food security and the global economy [1]. In general, high grain productivitylargely depends on water and fertilizer input. However, over-application of fertilizers has
Plants 2021, 10, 764. https://doi.org/10.3390/plants10040764 https://www.mdpi.com/journal/plants
123
Plants 2021, 10, 764
led to not only natural resources exhaustion, but also soil, air and water quality degrada-tion [2,3]. To resolve these environmental issues and ensure food security, breeding cropswith efficient use of water and nutrients is urgently required for sustainable agriculture [4].Roots are the primary organs that determine the acquisition efficiency of soil resourcesand have a direct impact on grain yield [5]; more and deeper roots may improve thewater and mineral uptake from deeper soil layers and reduce nitrate leaching losses tothe environment [6]. Although root traits are difficult to characterize and their breedingvalues are seldom assessed under field conditions, manipulating root system architectureto enhance nutrient uptake has been proposed to enable a very much needed new greenrevolution and further increase in yield potential [7].
Root traits can be dissected into root number, root length (RL), root weight, rootsurface area (RA), root volume, root thickness, and density of primary roots, lateral rootsand adventitious roots as well as root/shoot dry weight ratio, etc. [8,9]. Since the 1990s,a large number of quantitative trait loci (QTLs) controlling root system architecture havebeen reported in rice and some of them have been successfully cloned [10]. In maize,several major QTLs involving root morphology have been detected, but no causal geneshave been reported yet [11]. In recent years, a good many QTLs for root traits in wheathave been also documented [9,12–16]. However, most of these QTLs were identified atseedling stage in hydroponic culture. It was not clear whether these root-related QTLs wereassociated with yield-related traits in most cases. Considering that root is mainly grown insoil and root traits are plastic in adapting to environmental factors such as limitation ofwater [17] and nutrients [18], field experiments under diverse environments are necessaryto elucidate the genetic effects of QTLs identified in hydroponic culture. With preciseevaluation and verification at the population level, QTLs associated with root traits may beused in molecular wheat breeding practice.
Nitrogen (N), as the key element of proteins and other biomacromolecules, is quantita-tively the most important mineral nutrient for plant growth and development. Applicationof enough synthetic N fertilizers at the appropriate time can overwhelmingly improve cropyield [19]. However, only 30%~40% of the applied N fertilizer is taken up from soil bycrops. Therefore, improving nitrogen use efficiency (NUE) in crops can help minimize thedetrimental impact of N fertilizers on the environment and be favorable for sustainable agri-culture [20,21]. As a result, a number of NUE-improved cultivars of main cereal crops havebeen released. Numerous research studies on rice [22,23], maize [24,25] and barley [26]indicated that root traits are closely related with N uptake and genetically controlled bymajor QTLs [27,28]. In wheat, several studies also discovered the co-localization of QTLsfor root traits, nitrogen uptake and grain productivity [8,9]. These results presented thecommon genetic basis of root traits and N utilization, suggesting the tremendous potentialof root traits in improving grain yield and NUE. Nevertheless, more sufficient understand-ing of the role of the key loci conferring high NUE will facilitate its future application inmolecular breeding.
Near-isogenic lines (NILs) are powerful tools to characterize the gene/QTL functionfor certain plant traits [29]. We [9] detected a major stable QTL, named QMrl-7B, controllingthe maximum root length of wheat at seedling stage in hydroponic culture and developeda pair of QMrl-7B NILs with superior and inferior alleles, respectively. The objective of thisstudy was to specify QMrl-7B’s genetic effects on root, above-ground biomass, grain yieldand nitrogen accumulation, using the pair of QMrl-7B NILs as materials at the populationlevel under different nitrogen environments, which would provide a valuable resource formolecular improvement of root traits.
2. Results
2.1. Root Morphology of QMrl-7B NILs
Field trials showed that the root traits of KN9204 and the QMrl-7B NILs displayed thetendency of rapid increase in the initial seedling stage and then gradual decrease with theadvancement of the growth period of wheat, and the highest values of root length, root
124
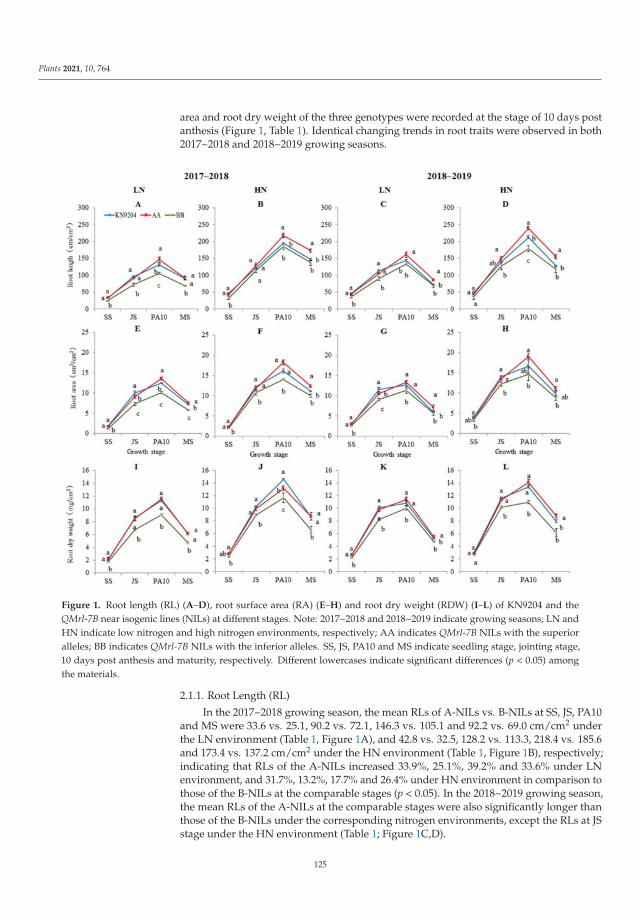
Plants 2021, 10, 764
area and root dry weight of the three genotypes were recorded at the stage of 10 days postanthesis (Figure 1, Table 1). Identical changing trends in root traits were observed in both2017~2018 and 2018~2019 growing seasons.
Figure 1. Root length (RL) (A–D), root surface area (RA) (E–H) and root dry weight (RDW) (I–L) of KN9204 and theQMrl-7B near isogenic lines (NILs) at different stages. Note: 2017~2018 and 2018~2019 indicate growing seasons; LN andHN indicate low nitrogen and high nitrogen environments, respectively; AA indicates QMrl-7B NILs with the superioralleles; BB indicates QMrl-7B NILs with the inferior alleles. SS, JS, PA10 and MS indicate seedling stage, jointing stage,10 days post anthesis and maturity, respectively. Different lowercases indicate significant differences (p < 0.05) amongthe materials.
2.1.1. Root Length (RL)
In the 2017~2018 growing season, the mean RLs of A-NILs vs. B-NILs at SS, JS, PA10and MS were 33.6 vs. 25.1, 90.2 vs. 72.1, 146.3 vs. 105.1 and 92.2 vs. 69.0 cm/cm2 underthe LN environment (Table 1, Figure 1A), and 42.8 vs. 32.5, 128.2 vs. 113.3, 218.4 vs. 185.6and 173.4 vs. 137.2 cm/cm2 under the HN environment (Table 1, Figure 1B), respectively;indicating that RLs of the A-NILs increased 33.9%, 25.1%, 39.2% and 33.6% under LNenvironment, and 31.7%, 13.2%, 17.7% and 26.4% under HN environment in comparison tothose of the B-NILs at the comparable stages (p < 0.05). In the 2018~2019 growing season,the mean RLs of the A-NILs at the comparable stages were also significantly longer thanthose of the B-NILs under the corresponding nitrogen environments, except the RLs at JSstage under the HN environment (Table 1; Figure 1C,D).
125
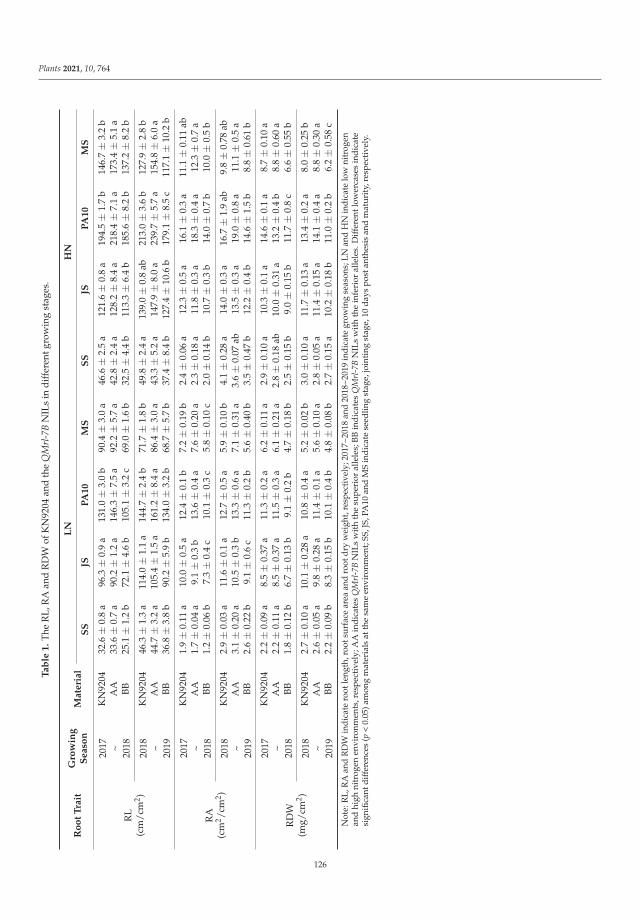
Plants 2021, 10, 764
Ta
ble
1.
The
RL,
RA
and
RD
Wof
KN
9204
and
the
QM
rl-7
BN
ILs
indi
ffer
entg
row
ing
stag
es.
Ro
ot
Tra
itG
row
ing
Se
aso
nM
ate
ria
lL
NH
N
SS
JSP
A1
0M
SS
SJS
PA
10
MS
RL
(cm
/cm
2 )
2017 ~
2018
KN
9204
32.6±
0.8
a96
.3±
0.9
a13
1.0±
3.0
b90
.4±
3.0
a46
.6±
2.5
a12
1.6±
0.8
a19
4.5±
1.7
b14
6.7±
3.2
bA
A33
.6±
0.7
a90
.2±
1.2
a14
6.3±
7.5
a92
.2±
5.7
a42
.8±
2.4
a12
8.2±
8.4
a21
8.4±
7.1
a17
3.4±
5.1
aBB
25.1±
1.2
b72
.1±
4.6
b10
5.1±
3.2
c69
.0±
1.6
b32
.5±
4.4
b11
3.3±
6.4
b18
5.6±
8.2
b13
7.2±
8.2
b
2018 ~
2019
KN
9204
46.3±
1.3
a11
4.0±
1.1
a14
4.7±
2.4
b71
.7±
1.8
b49
.8±
2.4
a13
9.0±
0.8
ab21
3.0±
3.6
b12
7.9±
2.8
bA
A44
.7±
3.2
a10
5.4±
1.5
a16
1.2±
8.4
a86
.4±
3.0
a43
.3±
5.2
a14
7.9±
8.0
a23
9.7±
5.7
a15
4.8±
6.0
aBB
36.8±
3.8
b90
.2±
5.9
b13
4.0±
3.2
b68
.7±
5.7
b37
.4±
8.4
b12
7.4±
10.6
b17
9.1±
8.5
c11
7.1±
10.2
b
RA
(cm
2 /cm
2 )
2017 ~
2018
KN
9204
1.9±
0.11
a10
.0±
0.5
a12
.4±
0.1
b7.
2±
0.19
b2.
4±
0.06
a12
.3±
0.5
a16
.1±
0.3
a11
.1±
0.11
abA
A1.
7±
0.04
a9.
1±
0.3
b13
.6±
0.4
a7.
6±
0.20
a2.
3±
0.18
a11
.8±
0.3
a18
.3±
0.4
a12
.3±
0.7
aBB
1.2±
0.06
b7.
3±
0.4
c10
.1±
0.3
c5.
8±
0.10
c2.
0±
0.14
b10
.7±
0.3
b14
.0±
0.7
b10
.0±
0.5
b
2018 ~
2019
KN
9204
2.9±
0.03
a11
.6±
0.1
a12
.7±
0.5
a5.
9±
0.10
b4.
1±
0.28
a14
.0±
0.3
a16
.7±
1.9
ab9.
8±
0.78
abA
A3.
1±
0.20
a10
.5±
0.3
b13
.3±
0.6
a7.
1±
0.31
a3.
6±
0.07
ab13
.5±
0.3
a19
.0±
0.8
a11
.1±
0.5
aBB
2.6±
0.22
b9.
1±
0.6
c11
.3±
0.2
b5.
6±
0.40
b3.
5±
0.47
b12
.2±
0.4
b14
.6±
1.5
b8.
8±
0.61
b
RD
W(m
g/cm
2 )
2017 ~
2018
KN
9204
2.2±
0.09
a8.
5±
0.37
a11
.3±
0.2
a6.
2±
0.11
a2.
9±
0.10
a10
.3±
0.1
a14
.6±
0.1
a8.
7±
0.10
aA
A2.
2±
0.11
a8.
5±
0.37
a11
.5±
0.3
a6.
1±
0.21
a2.
8±
0.18
ab10
.0±
0.31
a13
.2±
0.4
b8.
8±
0.60
aBB
1.8±
0.12
b6.
7±
0.13
b9.
1±
0.2
b4.
7±
0.18
b2.
5±
0.15
b9.
0±
0.15
b11
.7±
0.8
c6.
6±
0.55
b
2018 ~
2019
KN
9204
2.7±
0.10
a10
.1±
0.28
a10
.8±
0.4
a5.
2±
0.02
b3.
0±
0.10
a11
.7±
0.13
a13
.4±
0.2
a8.
0±
0.25
bA
A2.
6±
0.05
a9.
8±
0.28
a11
.4±
0.1
a5.
6±
0.10
a2.
8±
0.05
a11
.4±
0.15
a14
.1±
0.4
a8.
8±
0.30
aBB
2.2±
0.09
b8.
3±
0.15
b10
.1±
0.4
b4.
8±
0.08
b2.
7±
0.15
a10
.2±
0.18
b11
.0±
0.2
b6.
2±
0.58
c
Not
e:R
L,R
Aan
dR
DW
indi
cate
root
leng
th,r
oots
urfa
cear
eaan
dro
otdr
yw
eigh
t,re
spec
tive
ly;2
017~
2018
and
2018
~201
9in
dica
tegr
owin
gse
ason
s;LN
and
HN
indi
cate
low
nitr
ogen
and
high
nitr
ogen
envi
ronm
ents
,res
pect
ivel
y;A
Ain
dic
ates
QM
rl-7
BN
ILs
wit
hth
esu
peri
oral
lele
s;B
Bin
dic
ates
QM
rl-7
BN
ILs
wit
hth
ein
feri
oral
lele
s.D
iffer
entl
ower
case
sin
dic
ate
sign
ifica
ntdi
ffer
ence
s(p
<0.
05)a
mon
gm
ater
ials
atth
esa
me
envi
ronm
ent;
SS,J
S,PA
10an
dM
Sin
dica
tese
edlin
gst
age,
join
ting
stag
e,10
days
post
anth
esis
and
mat
urit
y,re
spec
tive
ly.
126
Plants 2021, 10, 764
2.1.2. Root Surface Area (RA)
In the 2017~2018 growing season, likewise, the mean RAs of A-NILs vs. B-NILs at SS,JS, PA10 and MS were 1.7 vs. 1.2, 9.1 vs. 7.3, 13.6 vs. 10.1 and 7.6 vs. 5.8 cm2/cm2 underthe LN environment (Table 1, Figure 1E), and 2.3 vs. 2.0, 11.8 vs. 10.7, 18.3 vs. 14.0 and 12.3vs. 10.0 cm2/cm2 under the HN environment (Table 1, Figure 1F), respectively; indicatingthat the mean RAs of the A-NILs increased by 41.7%, 24.7%, 34.7% and 31.0% under theLN environment, and 15%, 10.3%, 30.7% and 23% under the HN environment higher thanthose of the B-NILs at the comparable stages (p < 0.05). In the 2018~2019 growing season,the unvarying trends in RA difference between the two types of NILs were observed atthe comparable growth stages under the corresponding nitrogen environments, except theRAs at SS stage under the HN environment (Table 1; Figure 1G,H).
2.1.3. Root Dry Weight (RDW)
In the 2017~2018 growing season, similarly, the mean RDWs of A-NILs vs. B-NILsat SS, JS, PA10 and MS were 2.2 vs. 1.8, 8.5 vs. 6.7, 11.5 vs. 9.1 and 6.1 vs. 4.7 mg/cm2,respectively, under the LN environment (Table 1, Figure 1I), indicating that the A-NILs wereheavier than the B-NILs by 22.2%, 26.9%, 26.4% and 29.8% in RDW at the four growth stages(p < 0.05). Under the HN environment, the mean RDWs of A-NILs vs. B-NILs at SS, JS,PA10 and MS were 2.8 vs. 2.5, 10.0 vs. 9.0, 13.2 vs. 11.7 and 8.8 vs. 6.6 mg/cm2, respectively(Table 1, Figure 1J), indicating that the A-NILs were 12.0%, 11.1%, 12.8% and 33.3% heavierthan the B-NILs in RDW at the four growth stages (p < 0.05). In the 2018~2019 growingseason, the mean RDWs of the A-NILs at the comparable stages were also significantlyheavier than those of the B-NILs under the corresponding nitrogen environments, exceptthe RDW at SS under the HN environment (Table 1; Figure 1K,L).
2.1.4. Root Vertical Distribution
To investigate the root distribution in soil, the RLD, RAD and RWD were measuredevery 10 cm of soil layer at MS, JS, PA10 and MS stages. The biggest values of RLDs,RADs and RWDs at each growth stage were recorded in the upper soil layer (0~10 cm and10~20 cm), then gradual decrease of the root indices accompanied with the raised soil depth(Figure 2, Figures S1–S3). Noticeably, the root distribution in the 30~40 cm soil layer wasmuch less than those in the neighboring soil layers (20~30 and 40~50 cm), which may resultfrom the restriction effect of compact soil on root growth in this ploughed bottom layer. TheA-NILs exhibited superior RLDs, RADs and RWDs over the B-NILs in each soil layer (exceptfor 30~40 cm) at the most comparable stages (p < 0.05). Taking the 10~20 cm soil layer atPA10 stage as an example, the mean RLDs of the A-NILs were 3.6 cm/cm3 in 2017~2018 and4.0 cm/cm3 in 2018~2019 growing seasons under the LN environment, respectively, whichwere 33.3% and 14.3% higher than those of the B-NILs (2.7 and 3.5 cm/cm3), respectively(Figure 2A,C). Under the HN environment, the corresponding RLDs of the A-NILs were5.2 and 4.9 cm/cm3, respectively, which were 36.8% and 40.0% higher than those of theB-NILs (3.8 and 3.5 cm/cm3) (Figure 2B,D). As expected, the RAD (Figure 2E–H) and RWD(Figure 2I–L) exhibited the consistent distribution pattern in different soil layers like RLD.
Besides, the root distribution in 0~30, 30~60, 60~100 and 100~150 cm groups of soillayers at PA10 stage was further analyzed (Table 2). The mean RL, RA and RDW of theA-NILs were significantly different from those of the B-NILs in most soil layers under theLN environment (p < 0.05), except for RL in the 0~30 cm soil layer and RA in the 60~100 cmsoil layer in 2018~2019. Under the HN environment, significant differences in RL, RA andRDW between the two genotypes mainly took place in the 0~30 and 100~150 cm soil layers(p < 0.05). The ample roots of the A-NILs over the B-NILs in both upper soil and deeper soilwould definitely improve water and mineral uptake, especially in water-deficient northChina plain.
127
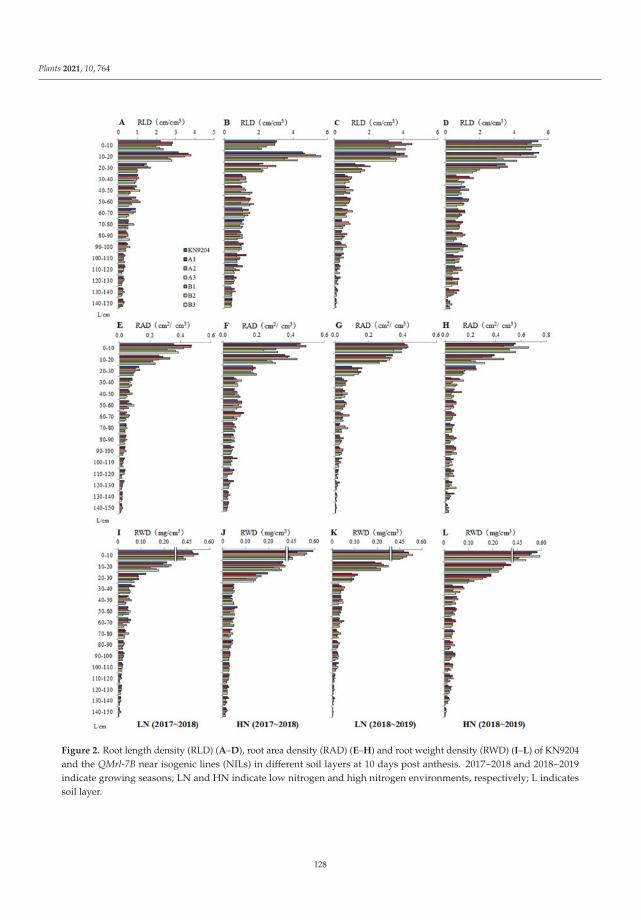
Plants 2021, 10, 764
Figure 2. Root length density (RLD) (A–D), root area density (RAD) (E–H) and root weight density (RWD) (I–L) of KN9204and the QMrl-7B near isogenic lines (NILs) in different soil layers at 10 days post anthesis. 2017~2018 and 2018~2019indicate growing seasons; LN and HN indicate low nitrogen and high nitrogen environments, respectively; L indicatessoil layer.
128
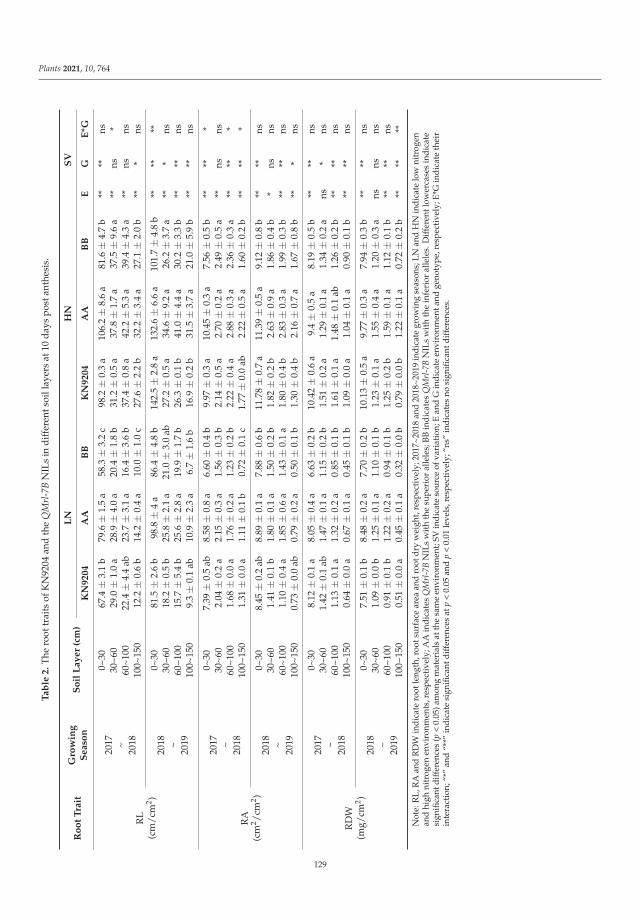
Plants 2021, 10, 764
Ta
ble
2.
The
root
trai
tsof
KN
9204
and
the
QM
rl-7
BN
ILs
indi
ffer
ents
oill
ayer
sat
10da
yspo
stan
thes
is.
Ro
ot
Tra
itG
row
ing
Se
aso
nS
oil
La
ye
r(c
m)
LN
HN
SV
KN
92
04
AA
BB
KN
92
04
AA
BB
EG
E*G
RL
(cm
/cm
2 )
2017 ~
2018
0~30
67.4±
3.1
b79
.6±
1.5
a58
.3±
3.2
c98
.2±
0.3
a10
6.2±
8.6
a81
.6±
4.7
b**
**ns
30~6
029
.0±
1.0
a28
.9±
4.0
a20
.4±
1.8
b31
.2±
0.5
a37
.8±
1.7
a37
.5±
9.6
a**
ns*
60~1
0022
.4±
4.4
ab23
.7±
3.1
a16
.4±
3.6
b37
.4±
0.8
a42
.2±
5.3
a39
.4±
4.3
a**
nsns
100~
150
12.2±
0.6
b14
.2±
0.4
a10
.0±
1.0
c27
.6±
2.2
b32
.2±
3.4
a27
.1±
2.0
b**
*ns
2018 ~
2019
0~30
81.5±
2.6
b98
.8±
4a
86.4±
4.8
b14
2.5±
2.8
a13
2.6±
6.6
a10
1.7±
4.8
b**
****
30~6
018
.2±
0.5
b25
.8±
2.1
a21
.0±
3.0
ab27
.2±
0.5
a34
.6±
9.2
a26
.2±
3.7
a**
*ns
60~1
0015
.7±
5.4
b25
.6±
2.8
a19
.9±
1.7
b26
.3±
0.1
b41
.0±
4.4
a30
.2±
3.3
b**
**ns
100~
150
9.3±
0.1
ab10
.9±
2.3
a6.
7±
1.6
b16
.9±
0.2
b31
.5±
3.7
a21
.0±
5.9
b**
**ns
RA
(cm
2 /cm
2 )
2017 ~
2018
0~30
7.39
±0.
5ab
8.58
±0.
8a
6.60
±0.
4b
9.97
±0.
3a
10.4
5±
0.3
a7.
56±
0.5
b**
***
30~6
02.
04±
0.2
a2.
15±
0.3
a1.
56±
0.3
b2.
14±
0.5
a2.
70±
0.2
a2.
49±
0.5
a**
nsns
60~1
001.
68±
0.0
a1.
76±
0.2
a1.
23±
0.2
b2.
22±
0.4
a2.
88±
0.3
a2.
36±
0.3
a**
***
100~
150
1.31
±0.
0a
1.11
±0.
1b
0.72
±0.
1c
1.77
±0.
0ab
2.22
±0.
5a
1.60
±0.
2b
****
*
2018 ~
2019
0~30
8.45
±0.
2ab
8.89
±0.
1a
7.88
±0.
6b
11.7
8±
0.7
a11
.39±
0.5
a9.
12±
0.8
b**
**ns
30~6
01.
41±
0.1
b1.
80±
0.1
a1.
50±
0.2
b1.
82±
0.2
b2.
63±
0.9
a1.
86±
0.4
b*
nsns
60~1
001.
10±
0.4
a1.
85±
0.6
a1.
43±
0.1
a1.
80±
0.4
b2.
83±
0.3
a1.
99±
0.3
b**
**ns
100~
150
0.73
±0.
0ab
0.79
±0.
2a
0.50
±0.
1b
1.30
±0.
4b
2.16
±0.
7a
1.67
±0.
8b
***
ns
RD
W(m
g/cm
2 )
2017 ~
2018
0~30
8.12
±0.
1a
8.05
±0.
4a
6.63
±0.
2b
10.4
2±
0.6
a9.
4±
0.5
a8.
19±
0.5
b**
**ns
30~6
01.
42±
0.1
ab1.
47±
0.1
a1.
15±
0.2
b1.
51±
0.2
a1.
29±
0.1
a1.
34±
0.2
ans
*ns
60~1
001.
13±
0.1
a1.
32±
0.2
a0.
85±
0.1
b1.
61±
0.1
a1.
48±
0.1
ab1.
26±
0.2
b**
**ns
100~
150
0.64
±0.
0a
0.67
±0.
1a
0.45
±0.
1b
1.09
±0.
0a
1.04
±0.
1a
0.90
±0.
1b
****
ns
2018 ~
2019
0~30
7.51
±0.
1b
8.48
±0.
2a
7.70
±0.
2b
10.1
3±
0.5
a9.
77±
0.3
a7.
94±
0.3
b**
**ns
30~6
01.
09±
0.0
b1.
25±
0.1
a1.
10±
0.1
b1.
23±
0.1
a1.
55±
0.4
a1.
20±
0.3
ans
nsns
60~1
000.
91±
0.1
b1.
22±
0.2
a0.
94±
0.1
b1.
25±
0.2
b1.
59±
0.1
a1.
12±
0.1
b**
**ns
100~
150
0.51
±0.
0a
0.45
±0.
1a
0.32
±0.
0b
0.79
±0.
0b
1.22
±0.
1a
0.72
±0.
2b
****
**
Not
e:R
L,R
Aan
dR
DW
indi
cate
root
leng
th,r
oots
urfa
cear
eaan
dro
otdr
yw
eigh
t,re
spec
tive
ly;2
017~
2018
and
2018
~201
9in
dica
tegr
owin
gse
ason
s;LN
and
HN
indi
cate
low
nitr
ogen
and
high
nitr
ogen
envi
ronm
ents
,res
pect
ivel
y;A
Ain
dic
ates
QM
rl-7
BN
ILs
wit
hth
esu
peri
oral
lele
s;B
Bin
dic
ates
QM
rl-7
BN
ILs
wit
hth
ein
feri
oral
lele
s.D
iffer
entl
ower
case
sin
dic
ate
sign
ifica
ntdi
ffer
ence
s(p
<0.
05)a
mon
gm
ater
ials
atth
esa
me
envi
ronm
ent;
SVin
dica
teso
urce
ofva
riat
ion;
Ean
dG
indi
cate
envi
ronm
enta
ndge
noty
pe,r
espe
ctiv
ely;
E*G
indi
cate
thei
rin
tera
ctio
n;“*
”an
d“*
*”in
dica
tesi
gnifi
cant
diff
eren
ces
atp
<0.
05an
dp
<0.
01le
vels
,res
pect
ivel
y;“n
s”in
dica
tes
nosi
gnifi
cant
diff
eren
ces.
129
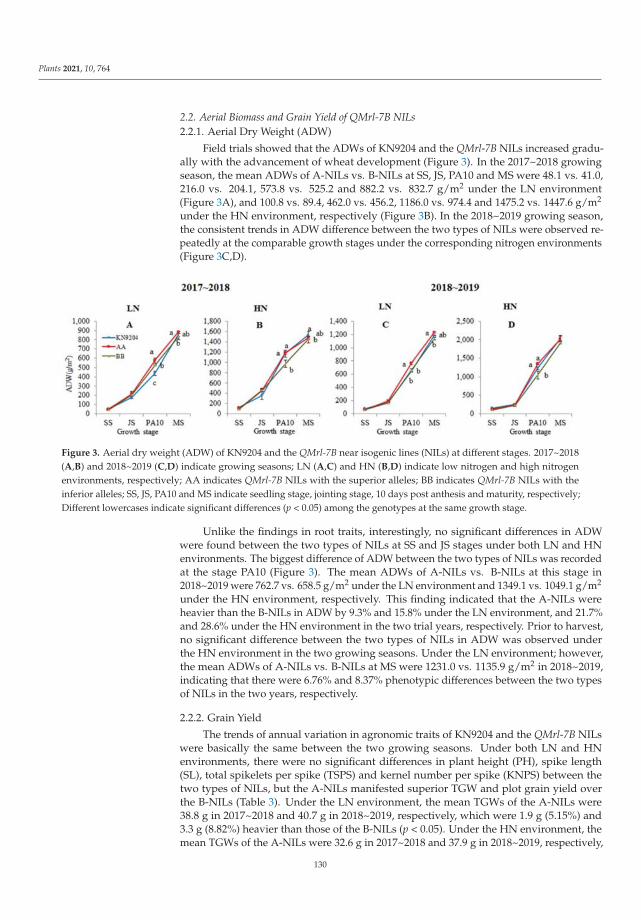
Plants 2021, 10, 764
2.2. Aerial Biomass and Grain Yield of QMrl-7B NILs2.2.1. Aerial Dry Weight (ADW)
Field trials showed that the ADWs of KN9204 and the QMrl-7B NILs increased gradu-ally with the advancement of wheat development (Figure 3). In the 2017~2018 growingseason, the mean ADWs of A-NILs vs. B-NILs at SS, JS, PA10 and MS were 48.1 vs. 41.0,216.0 vs. 204.1, 573.8 vs. 525.2 and 882.2 vs. 832.7 g/m2 under the LN environment(Figure 3A), and 100.8 vs. 89.4, 462.0 vs. 456.2, 1186.0 vs. 974.4 and 1475.2 vs. 1447.6 g/m2
under the HN environment, respectively (Figure 3B). In the 2018~2019 growing season,the consistent trends in ADW difference between the two types of NILs were observed re-peatedly at the comparable growth stages under the corresponding nitrogen environments(Figure 3C,D).
Figure 3. Aerial dry weight (ADW) of KN9204 and the QMrl-7B near isogenic lines (NILs) at different stages. 2017~2018(A,B) and 2018~2019 (C,D) indicate growing seasons; LN (A,C) and HN (B,D) indicate low nitrogen and high nitrogenenvironments, respectively; AA indicates QMrl-7B NILs with the superior alleles; BB indicates QMrl-7B NILs with theinferior alleles; SS, JS, PA10 and MS indicate seedling stage, jointing stage, 10 days post anthesis and maturity, respectively;Different lowercases indicate significant differences (p < 0.05) among the genotypes at the same growth stage.
Unlike the findings in root traits, interestingly, no significant differences in ADWwere found between the two types of NILs at SS and JS stages under both LN and HNenvironments. The biggest difference of ADW between the two types of NILs was recordedat the stage PA10 (Figure 3). The mean ADWs of A-NILs vs. B-NILs at this stage in2018~2019 were 762.7 vs. 658.5 g/m2 under the LN environment and 1349.1 vs. 1049.1 g/m2
under the HN environment, respectively. This finding indicated that the A-NILs wereheavier than the B-NILs in ADW by 9.3% and 15.8% under the LN environment, and 21.7%and 28.6% under the HN environment in the two trial years, respectively. Prior to harvest,no significant difference between the two types of NILs in ADW was observed underthe HN environment in the two growing seasons. Under the LN environment; however,the mean ADWs of A-NILs vs. B-NILs at MS were 1231.0 vs. 1135.9 g/m2 in 2018~2019,indicating that there were 6.76% and 8.37% phenotypic differences between the two typesof NILs in the two years, respectively.
2.2.2. Grain Yield
The trends of annual variation in agronomic traits of KN9204 and the QMrl-7B NILswere basically the same between the two growing seasons. Under both LN and HNenvironments, there were no significant differences in plant height (PH), spike length(SL), total spikelets per spike (TSPS) and kernel number per spike (KNPS) between thetwo types of NILs, but the A-NILs manifested superior TGW and plot grain yield overthe B-NILs (Table 3). Under the LN environment, the mean TGWs of the A-NILs were38.8 g in 2017~2018 and 40.7 g in 2018~2019, respectively, which were 1.9 g (5.15%) and3.3 g (8.82%) heavier than those of the B-NILs (p < 0.05). Under the HN environment, themean TGWs of the A-NILs were 32.6 g in 2017~2018 and 37.9 g in 2018~2019, respectively,
130
Plants 2021, 10, 764
which were 5.50% and 6.76% higher than those of the B-NILs in the comparable growingseasons (p < 0.05). Consequently, the A-NILs yielded more than the B-NILs. Under the LNenvironment, GYs of the A-NILs were 4030.9 and 5735.4 kg/ha in 2017~2018 and 2018~2019,respectively; which were 454.8 kg/ha (12.72%) and 550.2 kg/ha (10.61%) heavier thanthose of the B-NILs (p < 0.05), respectively. Under the HN environment, GYs of the A-NILswere 6388.9 and 8426.8 kg/ha in 2017~2018 and 2018~2019, respectively; which were6.40% (6004.1 kg/ha) and 9.99% (7661.4 kg/ha) higher than those of the B-NILs (p < 0.05),respectively. What is more, the mean HI of the A-NILs was also significantly higher thanthat of the B-NILs under the corresponding nitrogen environments.
2.3. Nitrogen Accumulation of QMrl-7B NILs2.3.1. The Aerial N Content (ANC) and Accumulation (ANA)
Field trials revealed that the ANCs of KN9204 and the QMrl-7B NILs tended todecrease with the advancement of wheat development (Table S1, Figure 4A–D). The ANCsof A-NILs vs. B-NILs at SS, JS, PA10 and MS stages were 2.47% vs. 2.45%, 1.70% vs 1.71%,1.33% vs. 1.22% and 1.25% vs. 1.13% in 2017~2018, and 3.53% vs 3.35%, 2.00% vs 2.01%,1.64% vs. 1.57% and 1.80% vs. 1.62% in 2018~2019 under the LN environment, respectively.Under the HN environments, the ANCs of A-NILs vs. B-NILs at the comparable stageswere 2.79% vs. 2.75%, 2.42% vs 2.40%, 1.79% vs. 1.76% and 1.65% vs. 1.50% in 2017~2018,and 3.69% vs 3.69%, 2.32% vs 2.30%, 2.05% vs. 1.95% and 1.98% vs. 1.91% in 2018~2019,respectively. The result showed that the A-NILs exhibited higher ANC than the B-NILs,but the differences were not significant in most cases. The significant differences werepresented at SS and MS stages under the LN environment in 2018~2019 (p < 0.05).
The ANA tended to increase with the advancement of the growth period (Table S1,Figure 4E–H), but no significant differences were found between the two types of NILsat SS and JS. At PA10 and MS, on the other hand, the A-NILs exhibited significant higherANA than the B-NILs under both LN and HN environments (p < 0.05). At PA10 stage, themean ANAs of the A-NILs vs. B-NILs were 7.62 vs. 6.35 and 12.51 vs. 10.37 g/m2 underthe LN environment, and 21.19 vs. 17.12 g/m2 and 27.69 vs. 20.36 g/m2 under the HNenvironment in the two growing seasons, respectively, indicating that the A-NILs wereheavier than the B-NILs in ANA by 20.0%, 20.6%, 23.8% and 36.0% under the correspondingenvironments, respectively. At MS stage, the A-NILs also accumulated more N than theB-NILs, the mean ANAs of the A-NILs vs. B-NILs were 10.99 vs. 9.42 g/cm2 and 22.12 vs.18.43 g/m2 under the LN environment, and 24.34 vs. 21.71 g/m2 and 40.05 vs. 36.71 g/m2
under the HN environment in the two growing seasons, respectively, indicating that ANAsof the A-NILs were higher than those of the B-NILs by 16.7% and 20.0% under the LNenvironment as well as 12.1% and 9.1% under the HN environment.
2.3.2. The Grain N Content (GNC) and Accumulation (GNA)
Compared to the B-NILs, the A-NILs had higher mean GNCs, but the differences werenot significant (Table 4). The GNCs of A-NILs vs. B-NILs were 2.15% vs. 2.01%, 2.64%vs. 2.44% under the LN environment, and 2.51% vs. 2.23%, and 2.98% vs. 2.87% underthe HN environment in the two trial years, respectively. In contrast, there were significantdifferences in GNAs between the two genotypes (p < 0.05). The GNAs of the A-NILs vs.B-NILs were 8.9 vs. 7.2 g/m2 and 15.6 vs. 12.8 g/m2 under the LN environment, and16.4 vs. 13.5 g/m2 and 25.3 vs. 22.1 g/m2 under the HN environment in the two years,which were 23.6%, 21.9%, 21.5%, and 14.5% higher than those of the B-NILs under thecorresponding environments, respectively (Table 4).
131
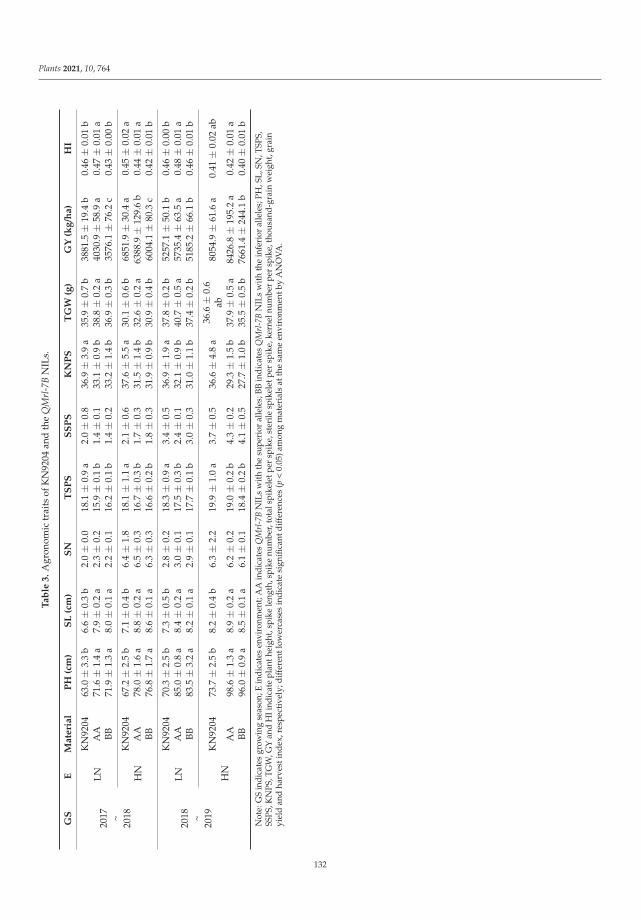
Plants 2021, 10, 764
Ta
ble
3.
Agr
onom
ictr
aits
ofK
N92
04an
dth
eQ
Mrl
-7B
NIL
s.
GS
EM
ate
ria
lP
H(c
m)
SL
(cm
)S
NT
SP
SS
SP
SK
NP
ST
GW
(g)
GY
(kg
/ha
)H
I
2017 ~
2018
LNK
N92
0463
.0±
3.3
b6.
6±
0.3
b2.
0±
0.0
18.1±
0.9
a2.
0±
0.8
36.9±
3.9
a35
.9±
0.7
b38
81.5±
19.4
b0.
46±
0.01
bA
A71
.6±
1.4
a7.
9±
0.2
a2.
3±
0.2
15.9±
0.1
b1.
4±
0.1
33.1±
0.9
b38
.8±
0.2
a40
30.9±
58.9
a0.
47±
0.01
aBB
71.9±
1.3
a8.
0±
0.1
a2.
2±
0.1
16.2±
0.1
b1.
4±
0.2
33.2±
1.4
b36
.9±
0.3
b35
76.1±
76.2
c0.
43±
0.00
b
HN
KN
9204
67.2±
2.5
b7.
1±
0.4
b6.
4±
1.8
18.1±
1.1
a2.
1±
0.6
37.6±
5.5
a30
.1±
0.6
b68
51.9±
30.4
a0.
45±
0.02
aA
A78
.0±
1.6
a8.
8±
0.2
a6.
5±
0.3
16.7±
0.3
b1.
7±
0.3
31.5±
1.4
b32
.6±
0.2
a63
88.9±
129.
6b
0.44
±0.
01a
BB76
.8±
1.7
a8.
6±
0.1
a6.
3±
0.3
16.6±
0.2
b1.
8±
0.3
31.9±
0.9
b30
.9±
0.4
b60
04.1±
80.3
c0.
42±
0.01
b
2018 ~
2019
LNK
N92
0470
.3±
2.5
b7.
3±
0.5
b2.
8±
0.2
18.3±
0.9
a3.
4±
0.5
36.9±
1.9
a37
.8±
0.2
b52
57.1±
50.1
b0.
46±
0.00
bA
A85
.0±
0.8
a8.
4±
0.2
a3.
0±
0.1
17.5±
0.3
b2.
4±
0.1
32.1±
0.9
b40
.7±
0.5
a57
35.4±
63.5
a0.
48±
0.01
aBB
83.5±
3.2
a8.
2±
0.1
a2.
9±
0.1
17.7±
0.1
b3.
0±
0.3
31.0±
1.1
b37
.4±
0.2
b51
85.2±
66.1
b0.
46±
0.01
b
HN
KN
9204
73.7±
2.5
b8.
2±
0.4
b6.
3±
2.2
19.9±
1.0
a3.
7±
0.5
36.6±
4.8
a36
.6±
0.6
ab80
54.9±
61.6
a0.
41±
0.02
ab
AA
98.6±
1.3
a8.
9±
0.2
a6.
2±
0.2
19.0±
0.2
b4.
3±
0.2
29.3±
1.5
b37
.9±
0.5
a84
26.8±
195.
2a
0.42
±0.
01a
BB96
.0±
0.9
a8.
5±
0.1
a6.
1±
0.1
18.4±
0.2
b4.
1±
0.5
27.7±
1.0
b35
.5±
0.5
b76
61.4±
244.
1b
0.40
±0.
01b
Not
e:G
Sin
dica
tes
grow
ing
seas
on;E
indi
cate
sen
viro
nmen
t;A
Ain
dica
tes
QM
rl-7
BN
ILs
with
the
supe
rior
alle
les;
BBin
dica
tes
QM
rl-7
BN
ILs
with
the
infe
rior
alle
les;
PH,S
L,SN
,TSP
S,SS
PS,K
NPS
,TG
W,G
Yan
dH
Iind
icat
epl
anth
eigh
t,sp
ike
leng
th,s
pike
num
ber,
tota
lspi
kele
tper
spik
e,st
erile
spik
elet
per
spik
e,ke
rnel
num
ber
per
spik
e,th
ousa
nd-g
rain
wei
ght,
grai
nyi
eld
and
harv
esti
ndex
,res
pect
ivel
y;di
ffer
entl
ower
case
sin
dica
tesi
gnifi
cant
diff
eren
ces
(p<
0.05
)am
ong
mat
eria
lsat
the
sam
een
viro
nmen
tby
AN
OVA
.
132
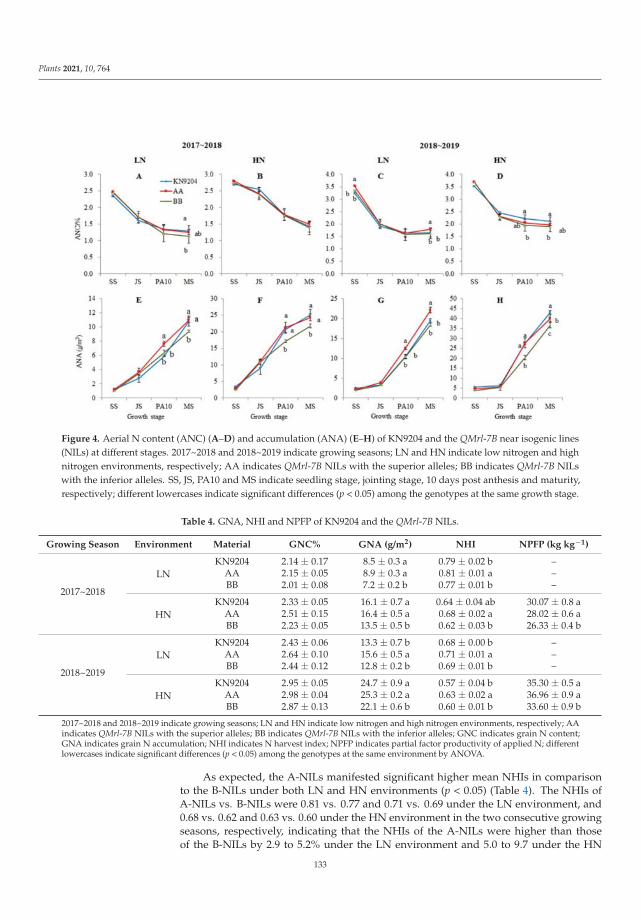
Plants 2021, 10, 764
Figure 4. Aerial N content (ANC) (A–D) and accumulation (ANA) (E–H) of KN9204 and the QMrl-7B near isogenic lines(NILs) at different stages. 2017~2018 and 2018~2019 indicate growing seasons; LN and HN indicate low nitrogen and highnitrogen environments, respectively; AA indicates QMrl-7B NILs with the superior alleles; BB indicates QMrl-7B NILswith the inferior alleles. SS, JS, PA10 and MS indicate seedling stage, jointing stage, 10 days post anthesis and maturity,respectively; different lowercases indicate significant differences (p < 0.05) among the genotypes at the same growth stage.
Table 4. GNA, NHI and NPFP of KN9204 and the QMrl-7B NILs.
Growing Season Environment Material GNC% GNA (g/m2) NHI NPFP (kg kg−1)
2017~2018
LNKN9204 2.14 ± 0.17 8.5 ± 0.3 a 0.79 ± 0.02 b –
AA 2.15 ± 0.05 8.9 ± 0.3 a 0.81 ± 0.01 a –BB 2.01 ± 0.08 7.2 ± 0.2 b 0.77 ± 0.01 b –
HNKN9204 2.33 ± 0.05 16.1 ± 0.7 a 0.64 ± 0.04 ab 30.07 ± 0.8 a
AA 2.51 ± 0.15 16.4 ± 0.5 a 0.68 ± 0.02 a 28.02 ± 0.6 aBB 2.23 ± 0.05 13.5 ± 0.5 b 0.62 ± 0.03 b 26.33 ± 0.4 b
2018~2019
LNKN9204 2.43 ± 0.06 13.3 ± 0.7 b 0.68 ± 0.00 b –
AA 2.64 ± 0.10 15.6 ± 0.5 a 0.71 ± 0.01 a –BB 2.44 ± 0.12 12.8 ± 0.2 b 0.69 ± 0.01 b –
HNKN9204 2.95 ± 0.05 24.7 ± 0.9 a 0.57 ± 0.04 b 35.30 ± 0.5 a
AA 2.98 ± 0.04 25.3 ± 0.2 a 0.63 ± 0.02 a 36.96 ± 0.9 aBB 2.87 ± 0.13 22.1 ± 0.6 b 0.60 ± 0.01 b 33.60 ± 0.9 b
2017~2018 and 2018~2019 indicate growing seasons; LN and HN indicate low nitrogen and high nitrogen environments, respectively; AAindicates QMrl-7B NILs with the superior alleles; BB indicates QMrl-7B NILs with the inferior alleles; GNC indicates grain N content;GNA indicates grain N accumulation; NHI indicates N harvest index; NPFP indicates partial factor productivity of applied N; differentlowercases indicate significant differences (p < 0.05) among the genotypes at the same environment by ANOVA.
As expected, the A-NILs manifested significant higher mean NHIs in comparisonto the B-NILs under both LN and HN environments (p < 0.05) (Table 4). The NHIs ofA-NILs vs. B-NILs were 0.81 vs. 0.77 and 0.71 vs. 0.69 under the LN environment, and0.68 vs. 0.62 and 0.63 vs. 0.60 under the HN environment in the two consecutive growingseasons, respectively, indicating that the NHIs of the A-NILs were higher than thoseof the B-NILs by 2.9 to 5.2% under the LN environment and 5.0 to 9.7 under the HN
133
Plants 2021, 10, 764
environment, respectively. Meanwhile, the NPFPs of the A-NILs vs. the B-NILs were 28.02vs. 26.33 kg kg−1 in 2017~2018, and 36.96 vs. 33.60 kg kg−1 in 2018~2019, respectively,indicating that the NPFPs of the A-NILs were 6.4% to 10.0% higher than those of the B-NILsat the normal nitrogen management (p < 0.05) (Table 4).
3. Discussion
3.1. The Plasticity of Wheat Root Traits Is Affected by Both Genetic and Environmental Factors
A characteristic feature of plant development plasticity is that it does not follow arigidly predefined plan but, instead, is continuously susceptible to modification by in-teractions with the environment [30,31]. Root architecture is a complicated trait not onlycontrolled by endogenous genes/QTLs but also affected by soil environment. In Arabidop-sis, for example, genes such as MONOPTEROS (MP) and BODENLOSBDL regulate rootarchitecture through repressing primary root development [32,33]. In rice, Yao et al. [34]found that the short-root mutant, srt5, showed extreme inhibition of seminal root, crownroot and lateral root elongation, as well as altered root hair formation at the seedlingstage. The PIN1 family gene, OsPIN1 and ZmPIN1, plays important roles in root growth inrice [35] and maize [36], respectively. In wheat, suppression of LATERAL ROOT DENSITY(LRD) expression in RNAi plants confers the ability to maintain root growth under waterlimitation and has a positive pleiotropic effect on grain size and number under optimalgrowth conditions [37]. Overexpression of TaTRIP1 [38]) affects the growth of root inArabidopsis. While knockdown of the transcription factor TabZIP60 can increase the lateralroot branching in wheat [39]. Uga et al. [22] reported that the DRO1, a rice quantitativetrait locus controlling root growth angle, is involved in cell elongation in the root tip thatcauses asymmetric root growth and downward bending of the root in response to gravity.Maccaferri et al. [14] revealed 20 clusters of QTLs controlling root architecture such as rootlength, root number and root angle of wheat. QMrl-7B, a major stable QTL controllingmaximum root length, was reported to regulate root development of wheat in hydroponicculture of different nitrogen conditions [9]. All the above findings indicated that rootarchitecture is mainly controlled by both major genes as well as QTLs with moderate orminor effects.
Root plastic development is enormously influenced by environmental factors includ-ing soil water deficiency [40] and insufficient nutrient availability [18]. Developmentalresponse to drought stress in crops is manifested through enhanced root growth andsuppressed shoot growth resulting in increased root/shoot ratio [41]. According to thedescription of Zhang et al. [17], the root growth of bread wheat in the north China plainwas even before winter, remained almost static in the winter, increased rapidly betweenjointing and grain filling stage, and then decreased at maturity. In the present study, a pairof QMrl-7B near isogenic lines experienced similar root growth patterns, the root traitsincluding root length, root surface area and root dry weight expressed plasticity to variedsoil nitrogen supplies. Interestingly, there were significant differences in root traits betweenthe two types of QMrl-7B NILs from seedling till mature under both low and high nitrogenenvironments, indicating that the QMrl-7B played a vital role in the maintenance of roottraits (Tables 1 and 2). QMrl-7B allele from KN9204 had significant positive effect on wheatroot growth and development. For root vertical distribution, it was noticed that there wasalways significant difference between the two types of NILs, especially in deep soil, nomatter what nitrogen environment there was (Tables 1 and 2). This result further supportedthe permanent effect of QMrl-7B on root development.
3.2. The Association of Root System with Nitrogen Accumulation
As an integral part of plants, roots are involved in the acquisition of water and nu-trients, affecting efficiency of nitrogen uptake and utilization. Several studies in maizerevealed that a larger root system contributed to effective N accumulation in N-efficientcultivars in comparison with N-inefficient cultivars [42,43]. Different wheat varieties re-sponded to low N supply by expanding their root traits, such as root length, but manifested
134
Plants 2021, 10, 764
varied N accumulation [44]. Ehdaie et al. [45] suggested that positive and significantcorrelation coefficients existed between root biomass and plant N content, between rootbiomass and grain yield in wheat. KN9204, the donor of QMrl-7B superior alleles, is anefficient nitrogen use wheat cultivar [46] with long roots and large root system [47]. In thecurrent study, the two types of NILs of QMrl-7B did not show a significant difference inaerial nitrogen accumulation before jointing stage, but the A-NILs, with huge root systems,exhibited enhanced N accumulation in both aerial vegetative organ at anthesis and grainover the B-NILs with small root systems, particularly under LN environment (Figure 4,Table 4). These results demonstrated that QMrl-7B has a prolonged positive effect on Naccumulation during later vegetative growth and reproductive development of wheat.
Saengwilai et al. [48] found that maize genotypes with few crown roots in six RILs had45% greater rooting depth in low-N soils, which further enhanced N acquisition, biomassand grain yield. Li et al. [28] detected 331 QTLs for root and NUE-related traits in maizeand found about 70% of QTLs for NUE-related traits co-located in a cluster with those forroot traits, suggesting genetic associations between root and NUE-related traits in mostcases. Some reports in wheat revealed the linkage or co-localization of root trait QTLs withN uptake QTLs [8,12]. Using the KN9204-derived RIL population, Fan et al. [9] detecteda list of QTLs for root architecture and NUE-related traits, and found most of them weremapped in nine clusters. In the present study, the pleiotropic effects of QMrl-7B wereshown by the prolonged larger root system (Figures 1 and 2), higher N accumulation inthe above-ground part and grain in the A-NILs (Table 3). In rice, Obara et al. [49] detectedfive QTLs for root system architecture and found that the most effective QTL increased themaximum root length and total root length 15.2–24.6%, in a near-isogenic line (NIL) over awide range of nitrogen concentrations. Other studies showed that root and NUE-relatedtraits might be regulated by the same gene. For example, overexpression of TaNAC2-5Aenhanced root growth and nitrate influx rate in wheat, increased the root’s ability to acquirenitrogen and nitrogen accumulation in aerial parts, and eventually allocated more nitrogenin grains [50].
3.3. The Ideal Root System Enhances Biomass, Grain Yield and NUE
Up to now, studies principally supported the theory that larger root system is pos-itively correlated with the enhanced nutrient uptake, biomass accumulation and yieldformation [51]. In the present study, the A-NILs with superior alleles at QMrl-7B exhibitedextremely huge root systems over the B-NILs with inferior alleles from seedling till harvest.The seedling aerial biomass of the A-NILs, interestingly, were not significantly differentfrom those of the B-NILs (Figure 1); this insignificant difference between the two typesof NILs maintained till jointing stage. At PA10 stage, the aerial biomass of the A-NILsincreased dramatically and surpassed that of the B-NILs remarkably (p < 0.05) (Figure 1).Till mature, the root dry weight of the two types of NILs paralleled the aerial biomassand grain yield linearly. These results illustrated that there is no correlation betweenroot biomass and the aboveground biomass in early vegetative growth of the very wheatgenotype, but the huge root system formed during seedling stage potentially associateswith the final biomass and grain yield. The QMrl-7B donor parent KN9204, as a nitrogenefficient cultivar [46], bears a larger root system, but moderate tiller number and vegetativebiomass in early seedling stage compared to the well-known 1RS-1BL cultivar ‘Lovrin10’ [47]. Comprehensively, we proposed that the luxuriant root system, rather than abun-dant above-ground biomass before jointing, may be essential characteristics of modernwheat cultivars with high yield and NUE.
In wheat, deep root systems contribute to greater yield potential under droughtconditions [52]. The drought-adapted genotype SeriM82 showed longer root systemsin deep soil layers and higher potential grain yield [41], KN9204 with its robust rootsystem showed high grain yield and high NUE [46]. Similarly, the A-NILs with large rootsystems also showed a higher aerial biomass prior to harvest than the B-NILs (Figure 3),demonstrating higher potential grain yield. Some researches pointed out that abundant
135
Plants 2021, 10, 764
roots in deep soil are essential for wheat growth and final yield, especially in deficient waterand nutrient stresses [53,54]. The A-NILs manifested large root systems in the 100~150 cmsoil layers under both LN and HN environments, and also showed significant higher grainyield than the B-NILs. These results demonstrated that QMrl-7B has a positive effect onenhanced aboveground biomass and grain yield.
Among the root system architecture traits, the maximum root length decides the rootdepth in soil and is considered as the most important root traits to impact crop yield [55].Cane et al. [56] detected a QTL controlling root length on chromosome 7B co-located withgrain weight in durum wheat. Fan et al. [9] found the cluster C7B had striking effecton TGW and the loci QMrl-7B with KN9204 allele could improve TGW by 4 g (10.64%).In the present study, the mean TGW of the A-NILs was significantly higher than that ofthe B-NILs by 5.15% to 8.82% under the LN environment and 5.50% to 6.76% under theHN environment, respectively (Table 3), when they were planted at the population level.But the significance was much less than the effect obtained at the individual level whenthe RILs (10.64%) and QMrl-7B NILs (9.19%) were planted in a large row [9]. It seemsthat planting density has vital influence on the precise evaluation of the genetic effect ofQMrl-7B. What is more, the increased TGW devoted by QMrl-7B greatly contributed to plotgrain yield of the A-NILs, over the B-NILs by 10.61% to 12.72% under LN environmentand 6.40% to 9.99% under HN environment, respectively (Table 3). These results at thepopulation level further showed that QMrl-7B is of great value in elevated grain weightand grain yield.
In conclusion, NILs with superior alleles of QMrl-7B not only manifested a luxuri-ant root system, but also had positive effects on aboveground biomass, grain yield andNPFP, indicating that QMrl-7B could facilitate genetic improvement of wheat root system.Therefore, this study provides a valuable case that improving root system via geneticmanipulation can contributes directly to increased yield and NPFP.
4. Materials and Methods
4.1. Plant Materials and Experimental Design
A major stable QTL QMrl-7B (controlling the maximum root length) was identi-fied by hydroponic culture using the recombinant inbred line population derived fromthe cross between KN9204 and J411 (KJ-RIL) [9]. This QTL was located in the interval89.50–92.50 cM and the candidate physical region preliminarily ranged from 580.13 to590.13 Mb (IWGSC1.0) [9]. A residual heterozygous line KJ-RIL239, which was heterozy-gous within the confidence interval of QMrl-7B detected by twelve PCR markers acrossthis interval [9], was selected from F6 progeny and self-pollinated for four generations tillF10 progeny. Of which, two types of QMrl-7B NILs respectively, with superior alleles fromKN9204 (A-NILs) and inferior alleles from J411 (B-NILs), were developed. In this study, thesuperior parent KN9204, three A-NILs (namely A1, A2 and A3) and three B-NILs (namelyB1, B2 and B3) were used as materials.
The seven materials were evaluated under two different nitrogen environments in asplit-plot design with three replicates at Luancheng (37◦53′ N, 114◦41′ E, 54 m altitude),Hebei province, China for 2017~2018 and 2018~2019 growing seasons, respectively (twoyears × two controlled-environments × three replicates). The low nitrogen (LN) environ-ment was located on a long-term positioned experimental site where no nitrogen fertilizerbut 600 kg ha−1 of superphosphate (around 16% P2O5) were applied throughout the grow-ing period. In the high nitrogen (HN) environment, 300 kg ha−1 of diamine phosphate and225 kg ha−1 of urea were applied before sowing, and 150 kg ha−1 of urea was applied atthe elongation stage with irrigation every year. The field was irrigated twice at elongationand anthesis respectively to keep convenient soil hydraulic status for wheat growth. Thesoil fertility within the top tillage soil layer (0~20 cm) in each environment were measuredafter harvest (Table S2).
136
Plants 2021, 10, 764
The plot was 6.3 m2 (7.0 m × 0.9 m) containing 6 rows 0.18 m apart, and 280 seeds wereevenly planted in each row. All of the recommended agronomic practices were followed ineach of the trials except for the nitrogen fertilization treatment as described above.
4.2. Root Sampling and Measurement
Roots were sampled at seedling stage before winter (SS), jointing stage (JS), 10 dayspost anthesis (PA10) and maturity (MS) under both LN and HN environments duringthe 2017~2018 and 2018~2019 growing seasons. After removing the above-ground partof the plants, the corer of 10 cm diameter was used to take the soil cores from the rowsin each plot. The depth of sampling was 60, 100, 150 and 160 cm at the SS, JS, PA10and MS at intervals of 10 cm, respectively. The soil cores were taken to the laboratoryand the root samples were obtained as described by Zhang et al. [18]. The root sampleswere stored at –20 ◦C to prevent decay. On quantifying the root length (RL, cm) and rootsurface area (RA, cm2), the root samples were tiled in a transparent dish to be scannedusing ScanMaker i800 Plus Scanner (600 DPI) and analyzed by LA-S software (HangzhouWanshen Detection Technology Co., Ltd., Hangzhou, China, www.wseen.com). Afterbeing scanned, the roots were collected, oven-dried at 105 ◦C for an hour and then keptat 80 ◦C until constant weight to determine root dry weight (RDW, mg). The root lengthdensity (RLD, cm/cm3), root area density (RAD, cm2/cm3) and root weight density (RWD,mg/cm3) were calculated using RL, RA and RDW divided by the soil core volume.
4.3. Yield-Related Trait Evaluation
Ten representative plants in the center of the plot were randomly sampled at phys-iological maturity to evaluate the yield-related traits. The plant height (PH, cm), spikenumber per plant (SN), spike length (SL, cm), total spikelets per spike (TSPS), sterilespikelet number per spike (SSPS), kernel number per spike (KNPS) were determined.Thousand-grain weight (TGW, g) was evaluated after harvest using the Seed Counting andAnalysis System of WSeen SC-G Instrument (Hangzhou Wanshen Detection TechnologyCo., Ltd., Hangzhou, China, www.wseen.com). The grain yield per plot (GY, kg/ha) wasmeasured after harvest.
4.4. Measurement of Nitrogen-Related Traits
Ten representative plants in each plot were randomly sampled at the stages of SS, JS,PA10 and MS, respectively, and the aerial part was oven-dried at 105 ◦C for an hour andthen kept at 80 ◦C until constant weight to determine dry matter accumulation (DW, g).The aerial part at the MS was further divided into shoot and grain parts. The dry matteraccumulation was corrected to the aerial dry weight per unit area (aerial dry weight, ADW,g/m2) and grain dry weight per unit area (grain dry weight, GDW, g/m2), according tothe number of plants per unit area. The dried samples were ground and sifted through a0.5 mm sieves to determine the total aerial N content (ANC, %) and total grain N content(GNC, %) using a standard Kjeldahl procedure. Based on grain yield, dry weight and totalN content, a suite of traits were calculated as follows:
Harvest index (HI) = GDW/ADWAerial N accumulation (ANA, g/m2) = ANC × ADWGrain N accumulation (GNA, g/m2) = GNC × GDWN harvest index (NHI) = GNA/ANAPartial factor productivity of applied N (NPFP, kg kg−1) = GY/N applied amountStatistical analyses were conducted using the SPSS 20.0 (SPSS, Chicago, IL, United
States) and the ANOVA was used to test the difference of the above traits among thegenotypes at p < 0.05.
137
Plants 2021, 10, 764
Supplementary Materials: The following are available online at https://www.mdpi.com/article/10.3390/plants10040764/s1, Table S1: Aerial N content (ANC) and accumulation (ANA) of KN9204and the QMrl-7B NILs at different stages; Table S2: Summary of the major macronutrients in toptillage soil layer (0~20 cm) during the two growing seasons; Figure S1: Root length density (RLD),root surface area density (RAD) and root weight density (RWD) of KN9204 and the QMrl-7B NILsat seedling stage before winter (SS); Figure S2: Root length density (RLD), root surface area density(RAD) and root weight density (RWD) of KN9204 and the QMrl-7B NILs at jointing stage (JS); FigureS3: Root length density (RLD), root surface area density (RAD) and root weight density (RWD) ofKN9204 and the QMrl-7B NILs at maturity (MS).
Author Contributions: L.S. and F.C. planned the research project. J.L. (Jiajia Liu), Q.Z., F.C. andL.S. made genotyping of the materials. J.L. (Jiajia Liu), Q.Z., L.S., J.J., N.Z., D.M., X.R., L.Z. and J.L.(Junming Li) conducted the field experiments. J.L. (Jiajia Liu), H.L., L.S. analyzed the data and wrotethe manuscript. F.C., Z.S. and J.L. (Junming Li) revised the manuscript. All authors have read andagreed to the published version of the manuscript.
Funding: This research was jointly funded by the Natural Science Foundation of Hebei Provence(C2019503066), the National Key Research and Development Program of China (2016YFD0100706)and China Agriculture Research System (CARS-03).
Institutional Review Board Statement: Not applicable.
Informed Consent Statement: Not applicable.
Acknowledgments: We are grateful to our colleague Xiying Zhang for her critical review of the manuscript.
Conflicts of Interest: The authors declare that the research was conducted in the absence of anycommercial or financial relationships that could be construed as potential conflicts of interest.
References
1. West, P.C.; Gerber, J.S.; Engstrom, P.M.; Mueller, N.D.; Brauman, K.A.; Carlson, K.M.; Cassidy, E.S.; Johnston, M.; Macdonald,G.K.; Ray, D.K.; et al. Leverage points for improving global food security and the environment. Science 2014, 345, 325–328.[CrossRef]
2. Galloway, J.N.; Townsend, A.R.; Erisman, J.W.; Bekunda, M.; Cai, Z.; Freney, J.R.; Martinelli, L.A.; Seitzinger, S.P.; Sutton, M.A.Transformation of the Nitrogen Cycle: Recent Trends, Questions, and Potential Solutions. Science 2008, 320, 889–892. [CrossRef]
3. Guo, J.H.; Liu, X.J.; Zhang, Y.; Shen, J.L.; Han, W.X.; Zhang, W.F.; Christie, P.; Goulding, K.W.T.; Vitousek, P.M.; Zhang, F.S.Significant Acidification in Major Chinese Croplands. Science 2010, 327, 1008–1010. [CrossRef]
4. Fillery, I.R.P. Plant-based manipulation of nitrification in soil: A new approach to managing N loss? Plant Soil 2007, 294, 1–4.[CrossRef]
5. Lynch, J.P. Roots of the second green revolution. Aust. J. Bot. 2007, 55, 493–512. [CrossRef]6. Gastal, F.; Lemaire, G. N uptake and distribution in crops: An agronomical and ecophysiological perspective. J. Exp. Bot. 2002, 53,
789–799. [CrossRef]7. Herder, G.D.; Van Isterdael, G.; Beeckman, T.; De Smet, I. The roots of a new green revolution. Trends Plant Sci. 2010, 15, 600–607.
[CrossRef]8. Atkinson, J.A.; Wingen, L.U.; Griffiths, M.; Pound, M.P.; Gaju, O.; Foulkes, M.J.; Le Gouis, J.; Griffiths, S.; Bennett, M.J.; King,
J.; et al. Phenotyping pipeline reveals major seedling root growth QTL in hexaploid wheat. J. Exp. Bot. 2015, 66, 2283–2292.[CrossRef]
9. Fan, X.; Zhang, W.; Zhang, N.; Chen, M.; Zheng, S.; Zhao, C.; Han, J.; Liu, J.; Zhang, X.; Song, L.; et al. Identification of QTLregions for seedling root traits and their effect on nitrogen use efficiency in wheat (Triticum aestivum L.). Theor. Appl. Genet. 2018,131, 2677–2698. [CrossRef]
10. Mai, C.D.; Phung, N.T.; To, H.T.; Gonin, M.; Hoang, G.T.; Nguyen, K.L.; Do, V.N.; Courtois, B.; Gantet, P. Genes controlling rootdevelopment in rice. Rice 2014, 7, 30. [CrossRef]
11. Bray, A.L.; Topp, C.N. The Quantitative Genetic Control of Root Architecture in Maize. Plant Cell Physiol. 2018, 59, 1919–1930.[CrossRef]
12. An, D.; Su, J.; Liu, Q.; Zhu, Y.-G.; Tong, Y.; Li, J.; Jing, R.; Li, B.; Li, Z. Mapping QTLs for nitrogen uptake in relation to the earlygrowth of wheat (Triticum aestivum L.). Plant Soil 2006, 284, 73–84. [CrossRef]
13. Ren, Y.; He, X.; Liu, D.; Li, J.; Zhao, X.; Li, B.; Tong, Y.; Zhang, A.; Li, Z. Major quantitative trait loci for seminal root morphologyof wheat seedlings. Mol. Breed. 2012, 30, 139–148. [CrossRef]
14. Maccaferri, M.; El-Feki, W.; Nazemi, G.; Salvi, S.; Canè, M.A.; Colalongo, M.C.; Stefanelli, S.; Tuberosa, R. Prioritizing quantitativetrait loci for root system architecture in tetraploid wheat. J. Exp. Bot. 2016, 67, 1161–1178. [CrossRef]
138
Plants 2021, 10, 764
15. Ren, Y.; Qian, Y.; Xu, Y.; Zou, C.; Liu, D.; Zhao, X.; Zhang, A.; Tong, Y. Characterization of QTLs for Root Traits of Wheat Grownunder Different Nitrogen and Phosphorus Supply Levels. Front. Plant Sci. 2017, 8, 2096. [CrossRef]
16. Li, T.; Ma, J.; Zou, Y.; Chen, G.; Ding, P.-Y.; Zhang, H.; Yang, C.-C.; Mu, Y.; Tang, H.; Liu, Y.; et al. Quantitative trait loci for seedingroot traits and the relationships between root and agronomic traits in common wheat. Genome 2020, 63, 27–36. [CrossRef]
17. Zhang, X.; Pei, D.; Chen, S. Root growth and soil water utilization of winter wheat in the North China Plain. Hydrol. Process. 2004,18, 2275–2287. [CrossRef]
18. Rasmussen, I.S.; Dresbøll, D.B.; Thorup-Kristensen, K. Winter wheat cultivars and nitrogen (N) fertilization—Effects on rootgrowth, N uptake efficiency and N use efficiency. Eur. J. Agron. 2015, 68, 38–49. [CrossRef]
19. Raun, W.R.; Johnson, G.V. Improving Nitrogen Use Efficiency for Cereal Production. Agron. J. 1999, 91, 357–363. [CrossRef]20. Hirel, B.; Tetu, T.; Lea, P.J.; Dubois, F. Improving Nitrogen Use Efficiency in Crops for Sustainable Agriculture. Sustainability 2011,
3, 1452–1485. [CrossRef]21. Wu, K.; Wang, S.; Song, W.; Zhang, J.; Wang, Y.; Liu, Q.; Yu, J.; Ye, Y.; Li, S.; Chen, J.; et al. Enhanced sustainable green revolution
yield via nitrogen-responsive chromatin modulation in rice. Science 2020, 367, 1–9. [CrossRef] [PubMed]22. Uga, Y.; Sugimoto, K.; Ogawa, S.; Rane, J.; Ishitani, M.; Hara, N.; Kitomi, Y.; Inukai, Y.; Ono, K.; Kanno, N.; et al. Control of root
system architecture by DEEPER ROOTING 1 increases rice yield under drought conditions. Nat. Genet. 2013, 45, 1097–1102.[CrossRef] [PubMed]
23. Kitomi, Y.; Hanzawa, E.; Kuya, N.; Inoue, H.; Hara, N.; Kawai, S.; Kanno, N.; Endo, M.; Sugimoto, K.; Yamazaki, T.; et al. Rootangle modifications by theDRO1homolog improve rice yields in saline paddy fields. Proc. Natl. Acad. Sci. USA 2020, 117,21242–21250. [CrossRef] [PubMed]
24. Lynch, J.P. Steep, cheap and deep: An ideotype to optimize water and N acquisition by maize root systems. Ann. Bot. 2013, 112,347–357. [CrossRef]
25. Trachsel, S.; Kaeppler, S.; Brown, K.; Lynch, J. Maize root growth angles become steeper under low N conditions. Field Crop. Res.2013, 140, 18–31. [CrossRef]
26. Jia, Z.; Liu, Y.; Gruber, B.D.; Neumann, K.; Kilian, B.; Graner, A.; Von Wirén, N. Genetic Dissection of Root System ArchitecturalTraits in Spring Barley. Front. Plant Sci. 2019, 10, 400. [CrossRef]
27. Liu, J.; Li, J.; Chen, F.; Zhang, F.; Ren, T.; Zhuang, Z.; Mi, G. Mapping QTLs for root traits under different nitrate levels at theseedling stage in maize (Zea mays L.). Plant Soil 2008, 305, 253–265. [CrossRef]
28. Li, P.; Pengcheng, L.; Cai, H.; Liu, J.; Pan, Q.; Liu, Z.; Hongguang, C.; Mi, G.; Zhang, F.; Yuan, L. A genetic relationship betweennitrogen use efficiency and seedling root traits in maize as revealed by QTL analysis. J. Exp. Bot. 2015, 66, 3175–3188. [CrossRef]
29. Mu, X.; Chen, F.; Wu, Q.; Chen, Q.; Wang, J.; Yuan, L.; Mi, G. Genetic improvement of root growth increases maize yield viaenhanced post-silking nitrogen uptake. Eur. J. Agron. 2015, 63, 55–61. [CrossRef]
30. Forde, B.; Lorenzo, H. The nutritional control of root development. Plant Soil 2001, 232, 51–68. [CrossRef]31. Hodge, A. The plastic plant: Root responses to heterogeneous supplies of nutrients. New Phytol. 2004, 162, 9–24. [CrossRef]32. Hardtke, C.S.; Berleth, T. The Arabidopsis gene MONOPTEROS encodes a transcription factor mediating embryo axis formation
and vascular development. EMBO J. 1998, 17, 1405–1411. [CrossRef]33. Hamann, T.; Mayer, U.; Jürgens, G. The auxin-insensitive bodenlos mutation affects primary root formation and apical-basal
patterning in the Arabidopsis embryo. Development 1999, 126, 1387–1395.34. Yao, S.-G.; Taketa, S.; Ichii, M. A novel short-root gene that affects specifically early root development in rice (Oryza sativa L.).
Plant Sci. 2002, 163, 207–215. [CrossRef]35. Xu, M.; Zhu, L.; Shou, H.; Wu, P. A PIN1 Family Gene, OsPIN1, involved in Auxin-dependent Adventitious Root Emergence and
Tillering in Rice. Plant Cell Physiol. 2005, 46, 1674–1681. [CrossRef]36. Li, Z.; Zhang, X.; Zhao, Y.; Li, Y.; Zhang, G.; Peng, Z.; Zhang, J. Enhancing auxin accumulation in maize root tips improves root
growth and dwarfs plant height. Plant Biotechnol. J. 2017, 16, 86–99. [CrossRef]37. Placido, D.F.; Sandhu, J.; Sato, S.J.; Nersesian, N.; Quach, T.; Clemente, T.E.; Staswick, P.E.; Walia, H. The LATERAL ROOT
DENSITY gene regulates root growth during water stress in wheat. Plant Biotechnol. J. 2020, 18, 1955–1968. [CrossRef]38. He, X.; Fang, J.; Li, J.; Qu, B.; Ren, Y.; Ma, W.; Zhao, X.; Li, B.; Wang, D.; Li, Z.; et al. A genotypic difference in primary root length
is associated with the inhibitory role of transforming growth factor-beta receptor-interacting protein-1 on root meristem size inwheat. Plant J. 2014, 77, 931–943. [CrossRef]
39. Yang, J.; Wang, M.; Li, W.; He, X.; Teng, W.; Ma, W.; Zhao, X.; Hu, M.; Li, H.; Zhang, Y.; et al. Reducing expression of anitrate-responsive bZIP transcription factor increases grain yield and N use in wheat. Plant Biotechnol. J. 2019, 17, 1823–1833.[CrossRef]
40. Manschadi, A.M.; Christopher, J.; Devoil, P.; Hammer, G.L. The role of root architectural traits in adaptation of wheat towater-limited environments. Funct. Plant Biol. 2006, 33, 823–837. [CrossRef]
41. Sharp, R.E.; Poroyko, V.; Hejlek, L.G.; Spollen, W.G.; Springer, G.K.; Bohnert, H.J.; Nguyen, H.T. Root growth maintenance duringwater deficits: Physiology to functional genomics. J. Exp. Bot. 2004, 55, 2343–2351. [CrossRef]
42. Wang, Y.; Mi, G.; Chen, F.; Zhang, J.; Zhang, F. Response of Root Morphology to Nitrate Supply and its Contribution to NitrogenAccumulation in Maize. J. Plant Nutr. 2005, 27, 2189–2202. [CrossRef]
43. Liu, J.; Chen, F.; Olokhnuud, C.; Glass, A.D.M.; Tong, Y.; Zhang, F.; Mi, G. Root size and nitrogen-uptake activity in two maize(Zea mays) inbred lines differing in nitrogen-use efficiency. J. Plant Nutr. Soil Sci. 2009, 172, 230–236. [CrossRef]
139
Plants 2021, 10, 764
44. Melino, V.J.; Fiene, G.; Enju, A.; Cai, J.; Buchner, P.; Heuer, S. Genetic diversity for root plasticity and nitrogen uptake in wheatseedlings. Funct. Plant Biol. 2015, 42, 942–956. [CrossRef]
45. Ehdaie, B.; Merhaut, D.J.; Ahmadian, S.; Hoops, A.C.; Khuong, T.; Layne, A.P.; Waines, J.G. Root System Size InfluencesWater-Nutrient Uptake and Nitrate Leaching Potential in Wheat. J. Agron. Crop. Sci. 2010, 196, 455–466. [CrossRef]
46. Cui, Z.; Zhang, F.; Chen, X.; Li, F.; Tong, Y. Using In-Season Nitrogen Management and Wheat Cultivars to Improve Nitrogen UseEfficiency. Soil Sci. Soc. Am. J. 2011, 75, 976–983. [CrossRef]
47. Tong, Y.; Li, J.; Li, Z. Genotypic variations of nitrogen use efficiency in winter wheat (Triticum aestivum L.) II. Factors affectingnitrogen uptake efficiency. Acta Bot. Boreali-Occident. Sin. 1999, 19, 393–401.
48. Saengwilai, P.; Tian, X.; Lynch, J.P. Low Crown Root Number Enhances Nitrogen Acquisition from Low-Nitrogen Soils in Maize.Plant Physiol. 2014, 166, 581–589. [CrossRef] [PubMed]
49. Obara, M.; Ishimaru, T.; Abiko, T.; Fujita, D.; Kobayashi, N.; Yanagihara, S.; Fukuta, Y. Identification and characterization ofquantitative trait loci for root elongation by using introgression lines with genetic background of Indica-type rice variety IR64.Plant Biotechnol. Rep. 2014, 8, 267–277. [CrossRef]
50. He, X.; Qu, B.; Li, W.; Zhao, X.; Teng, W.; Ma, W.; Ren, Y.; Li, B.; Li, Z.; Tong, Y. The nitrate inducible NAC transcription factorTaNAC2-5A controls nitrate response and increases wheat yield. Plant Physiol. 2015, 169, 1991–2005. [CrossRef] [PubMed]
51. Meister, R.; Rajani, M.; Ruzicka, D.; Schachtman, D.P. Challenges of modifying root traits in crops for agriculture. Trends Plant Sci.2014, 19, 779–788. [CrossRef]
52. Reynolds, M.; Foulkes, M.J.; Slafer, G.A.; Berry, P.; Parry, M.A.J.; Snape, J.W.; Angus, W.J. Raising yield potential in wheat. J. Exp.Bot. 2009, 60, 1899–1918. [CrossRef]
53. Xu, C.; Tao, H.; Tian, B.; Gao, Y.; Ren, J.; Wang, P. Limited-irrigation improves water use efficiency and soil reservoir capacitythrough regulating root and canopy growth of winter wheat. Field Crop. Res. 2016, 196, 268–275. [CrossRef]
54. Liu, W.; Ma, G.; Wang, C.; Wang, J.; Lu, H.; Li, S.; Feng, W.; Xie, Y.; Ma, D.; Kang, G. Irrigation and Nitrogen Regimes Promote theUse of Soil Water and Nitrate Nitrogen from Deep Soil Layers by Regulating Root Growth in Wheat. Front. Plant Sci. 2018, 9, 32.[CrossRef]
55. Severini, A.D.; Wasson, A.P.; Evans, J.R.; Richards, R.A.; Watt, M. Root phenotypes at maturity in diverse wheat and triticale geno-types grown in three field experiments: Relationships to shoot selection, biomass, grain yield, flowering time, and environment.Field Crop. Res. 2020, 255, 107870. [CrossRef]
56. Canè, M.A.; Maccaferri, M.; Nazemi, G.; Salvi, S.; Francia, R.; Colalongo, C.; Tuberosa, R. Association mapping for rootarchitectural traits in durum wheat seedlings as related to agronomic performance. Mol. Breed. 2014, 34, 1629–1645. [CrossRef]
140
plants
Article
Genome-Wide Association Mapping of Salinity Tolerance at theSeedling Stage in a Panel of Vietnamese Landraces Reveals NewValuable QTLs for Salinity Stress Tolerance Breeding in Rice
Thao Duc Le 1, Floran Gathignol 2, Huong Thi Vu 1, Khanh Le Nguyen 3, Linh Hien Tran 1, Hien Thi Thu Vu 4,
Tu Xuan Dinh 5, Françoise Lazennec 2, Xuan Hoi Pham 1, Anne-Aliénor Véry 6, Pascal Gantet 2,7,*
and Giang Thi Hoang 1,*
Citation: Le, T.D.; Gathignol, F.; Vu,
H.T.; Nguyen, K.L.; Tran, L.H.; Vu,
H.T.T.; Dinh, T.X.; Lazennec, F.; Pham,
X.H.; Véry, A.-A.; et al. Genome-Wide
Association Mapping of Salinity
Tolerance at the Seedling Stage in a
Panel of Vietnamese Landraces
Reveals New Valuable QTLs for
Salinity Stress Tolerance Breeding in
Rice. Plants 2021, 10, 1088. https://
doi.org/10.3390/plants10061088
Academic Editor: Igor G. Loskutov
Received: 14 April 2021
Accepted: 25 May 2021
Published: 28 May 2021
Publisher’s Note: MDPI stays neutral
with regard to jurisdictional claims in
published maps and institutional affil-
iations.
Copyright: © 2021 by the authors.
Licensee MDPI, Basel, Switzerland.
This article is an open access article
distributed under the terms and
conditions of the Creative Commons
Attribution (CC BY) license (https://
creativecommons.org/licenses/by/
4.0/).
1 National Key Laboratory for Plant Cell Biotechnology, Agricultural Genetics Institute, LMI RICE-2,Hanoi 00000, Vietnam; [email protected] (T.D.L.); [email protected] (H.T.V.);[email protected] (L.H.T.); [email protected] (X.H.P.)
2 UMR DIADE, Université de Montpellier, IRD, 34095 Montpellier, France; [email protected] (F.G.);[email protected] (F.L.)
3 Faculty of Agricultural Technology, University of Engineering and Technology, Hanoi 00000, Vietnam;[email protected]
4 Department of Genetics and Plant Breeding, Faculty of Agronomy, Vietnam National University of Agriculture,Hanoi 00000, Vietnam; [email protected]
5 Incubation and Support Center for Technology and Science Enterprises, Hanoi 00000, Vietnam;[email protected]
6 UMR BPMP, Univ Montpellier, CNRS, INRAE, Institut Agro, 34060 Montpellier, France;[email protected]
7 Department of Molecular Biology, Centre of the Region Haná for Biotechnological and Agricultural Research,Palacký University Olomouc, Šlechtitelu 27, 783 71 Olomouc, Czech Republic
* Correspondence: [email protected] (P.G.); [email protected] (G.T.H.);Tel.: +33-467-416-414 (P.G.); +84-397-600-496 (G.T.H.)
Abstract: Rice tolerance to salinity stress involves diverse and complementary mechanisms, suchas the regulation of genome expression, activation of specific ion-transport systems to manageexcess sodium at the cell or plant level, and anatomical changes that avoid sodium penetrationinto the inner tissues of the plant. These complementary mechanisms can act synergistically toimprove salinity tolerance in the plant, which is then interesting in breeding programs to pyramidizecomplementary QTLs (quantitative trait loci), to improve salinity stress tolerance of the plant atdifferent developmental stages and in different environments. This approach presupposes theidentification of salinity tolerance QTLs associated with different mechanisms involved in salinitytolerance, which requires the greatest possible genetic diversity to be explored. To contribute to thisgoal, we screened an original panel of 179 Vietnamese rice landraces genotyped with 21,623 SNPmarkers for salinity stress tolerance under 100 mM NaCl treatment, at the seedling stage, with the aimof identifying new QTLs involved in the salinity stress tolerance via a genome-wide association study(GWAS). Nine salinity tolerance-related traits, including the salt injury score, chlorophyll and watercontent, and K+ and Na+ contents were measured in leaves. GWAS analysis allowed the identificationof 26 QTLs. Interestingly, ten of them were associated with several different traits, which indicatesthat these QTLs act pleiotropically to control the different levels of plant responses to salinity stress.Twenty-one identified QTLs colocalized with known QTLs. Several genes within these QTLs havefunctions related to salinity stress tolerance and are mainly involved in gene regulation, signaltransduction or hormone signaling. Our study provides promising QTLs for breeding programs toenhance salinity tolerance and identifies candidate genes that should be further functionally studiedto better understand salinity tolerance mechanisms in rice.
Keywords: rice; GWAS; salinity tolerance; Vietnamese landraces; QTL
Plants 2021, 10, 1088. https://doi.org/10.3390/plants10061088 https://www.mdpi.com/journal/plants
141
Plants 2021, 10, 1088
1. Introduction
More than one third of cultivated lands are polluted by excess of salt (NaCl) [1].Sodium is a toxic element for plants and this is particularly true for rice, which is often culti-vated in river delta areas where irrigation water is increasingly frequently contaminated bysea water [2]. Rice is the most important food crop, feeding more than three billion peoplein the world [3]. In Vietnam, rice occupies 85% of the total agricultural area [4]. However,with 3620 km of coastline spreading from north to south, Vietnam has been ranked amongthe top five countries likely to be most affected by climate change [5]. Vietnam is one of thefirst rice exporters in the world and consequently plays an important role in food supplysecurity, particularly in Asian countries [6,7]. The Mekong River Delta and Red River Deltaare the main areas of rice production in Vietnam; the Mekong River Delta represents 50%of the total rice production area and supplies 90% of the rice exported by the country [7].The Mekong River Delta is increasingly menaced by an elevation in salinity due to seawater intrusion that results from different climatic and anthropic factors [8]. Accordingto data from the Ministry of Science and Technology of Vietnam, at the end of 2015 andthe first months of 2016, saline intrusion in the Mekong River Delta reached the highestlevel measured during the past 100 years. In addition to global management of the causesleading to increases in salinity, it is important to breed new varieties of rice tolerant tosalinity, which necessitates the identification of genetic determinants conferring salinitytolerance [9]. Several salinity tolerance QTLs (quantitative trait loci) have been identifiedin rice using association genetics approaches, and the mechanisms undelaying rice salinitytolerance start to be well known (for reviews see [10,11]). The mechanisms involved in ricesalinity tolerance act at different levels and combine transcriptional and posttranscriptionalor posttranslational regulation events that lead to sodium exclusion or compartmentationin specific cell infrastructures, osmolyte production or anatomical changes that avoidsodium penetration into the internal tissues of the plant [10]. These mechanisms act indifferent complementary ways that synergistically allow salinity tolerance [10]. For thesereasons, it is interesting to combine genetic sources with different and complementarysalinity tolerance to increase resistance to salinity, which can also buffer the susceptibility ofQTL effects to environmental conditions [12,13]. To identify such complementary sourcesof salinity tolerance, it is necessary to look for them in the widest and most diverse panelsof varieties possible.
To contribute to this goal, in this study, we screened a genotyped panel of 179 Viet-namese landrace varieties of indica and japonica rice collected in different agrosystemsfrom North to South Vietnam for salinity tolerance [14]. Vietnamese landrace varieties areoften underrepresented in the studied international panels such as the 3K panel developedby the International Rice Research Institute (IRRI), even though, they potentially constitutean original source of valuable alleles [15,16]. We already used this panel to identify valuableQTLs associated with root, leaf or panicle traits and water deficit tolerance by genomewide association study (GWAS) [17–20]. The plants were screened for salinity stress toler-ance at an early developmental stage using a hydroponic culture system in the presenceof 100 mM NaCl. The phenotypic standard evaluation score (SES) [21], chlorophyll andrelative water content and the concentrations of K+ and Na+ ions were measured in leaves.GWAS revealed 26 QTLs including 10 QTLs associated with several traits. Most of theseQTLs contain candidate genes that may explain their effect on salinity tolerance, and thefunction of the genes are further discussed.
2. Results
2.1. Phenotypic Variation and Heritability of Salinity Tolerance-Related Traits
The phenotyping experiment was conducted for three consecutive years, from 2017to 2019. The observed salt tolerance diversity in different accessions was reproducible.The data from the last trial were chosen for performing GWAS, for which the screeningprotocol was improved and standardized for the Vietnamese rice landrace panel and forthe parameter measurement as described in the Materials and Methods section. In this trial,
142
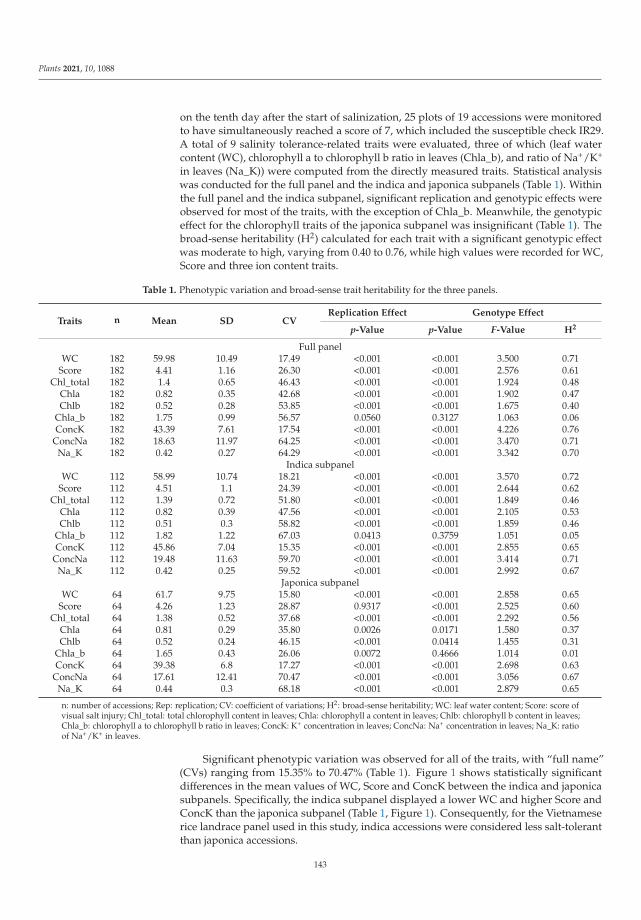
Plants 2021, 10, 1088
on the tenth day after the start of salinization, 25 plots of 19 accessions were monitoredto have simultaneously reached a score of 7, which included the susceptible check IR29.A total of 9 salinity tolerance-related traits were evaluated, three of which (leaf watercontent (WC), chlorophyll a to chlorophyll b ratio in leaves (Chla_b), and ratio of Na+/K+
in leaves (Na_K)) were computed from the directly measured traits. Statistical analysiswas conducted for the full panel and the indica and japonica subpanels (Table 1). Withinthe full panel and the indica subpanel, significant replication and genotypic effects wereobserved for most of the traits, with the exception of Chla_b. Meanwhile, the genotypiceffect for the chlorophyll traits of the japonica subpanel was insignificant (Table 1). Thebroad-sense heritability (H2) calculated for each trait with a significant genotypic effectwas moderate to high, varying from 0.40 to 0.76, while high values were recorded for WC,Score and three ion content traits.
Table 1. Phenotypic variation and broad-sense trait heritability for the three panels.
Traits n Mean SD CVReplication Effect Genotype Effect
p-Value p-Value F-Value H2
Full panelWC 182 59.98 10.49 17.49 <0.001 <0.001 3.500 0.71
Score 182 4.41 1.16 26.30 <0.001 <0.001 2.576 0.61Chl_total 182 1.4 0.65 46.43 <0.001 <0.001 1.924 0.48
Chla 182 0.82 0.35 42.68 <0.001 <0.001 1.902 0.47Chlb 182 0.52 0.28 53.85 <0.001 <0.001 1.675 0.40
Chla_b 182 1.75 0.99 56.57 0.0560 0.3127 1.063 0.06ConcK 182 43.39 7.61 17.54 <0.001 <0.001 4.226 0.76
ConcNa 182 18.63 11.97 64.25 <0.001 <0.001 3.470 0.71Na_K 182 0.42 0.27 64.29 <0.001 <0.001 3.342 0.70
Indica subpanelWC 112 58.99 10.74 18.21 <0.001 <0.001 3.570 0.72
Score 112 4.51 1.1 24.39 <0.001 <0.001 2.644 0.62Chl_total 112 1.39 0.72 51.80 <0.001 <0.001 1.849 0.46
Chla 112 0.82 0.39 47.56 <0.001 <0.001 2.105 0.53Chlb 112 0.51 0.3 58.82 <0.001 <0.001 1.859 0.46
Chla_b 112 1.82 1.22 67.03 0.0413 0.3759 1.051 0.05ConcK 112 45.86 7.04 15.35 <0.001 <0.001 2.855 0.65
ConcNa 112 19.48 11.63 59.70 <0.001 <0.001 3.414 0.71Na_K 112 0.42 0.25 59.52 <0.001 <0.001 2.992 0.67
Japonica subpanelWC 64 61.7 9.75 15.80 <0.001 <0.001 2.858 0.65
Score 64 4.26 1.23 28.87 0.9317 <0.001 2.525 0.60Chl_total 64 1.38 0.52 37.68 <0.001 <0.001 2.292 0.56
Chla 64 0.81 0.29 35.80 0.0026 0.0171 1.580 0.37Chlb 64 0.52 0.24 46.15 <0.001 0.0414 1.455 0.31
Chla_b 64 1.65 0.43 26.06 0.0072 0.4666 1.014 0.01ConcK 64 39.38 6.8 17.27 <0.001 <0.001 2.698 0.63
ConcNa 64 17.61 12.41 70.47 <0.001 <0.001 3.056 0.67Na_K 64 0.44 0.3 68.18 <0.001 <0.001 2.879 0.65
n: number of accessions; Rep: replication; CV: coefficient of variations; H2: broad-sense heritability; WC: leaf water content; Score: score ofvisual salt injury; Chl_total: total chlorophyll content in leaves; Chla: chlorophyll a content in leaves; Chlb: chlorophyll b content in leaves;Chla_b: chlorophyll a to chlorophyll b ratio in leaves; ConcK: K+ concentration in leaves; ConcNa: Na+ concentration in leaves; Na_K: ratioof Na+/K+ in leaves.
Significant phenotypic variation was observed for all of the traits, with “full name”(CVs) ranging from 15.35% to 70.47% (Table 1). Figure 1 shows statistically significantdifferences in the mean values of WC, Score and ConcK between the indica and japonicasubpanels. Specifically, the indica subpanel displayed a lower WC and higher Score andConcK than the japonica subpanel (Table 1, Figure 1). Consequently, for the Vietnameserice landrace panel used in this study, indica accessions were considered less salt-tolerantthan japonica accessions.
143
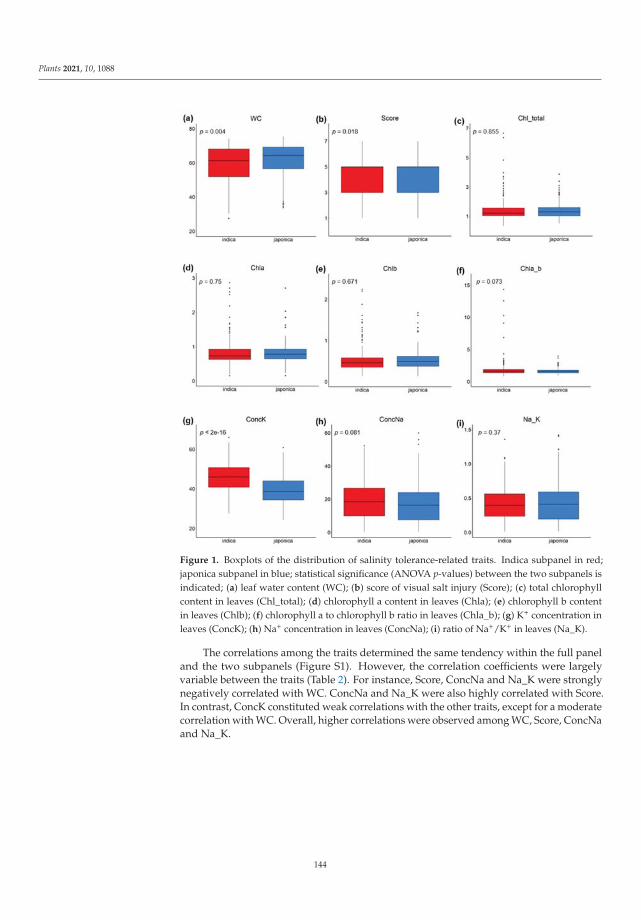
Plants 2021, 10, 1088
Figure 1. Boxplots of the distribution of salinity tolerance-related traits. Indica subpanel in red;japonica subpanel in blue; statistical significance (ANOVA p-values) between the two subpanels isindicated; (a) leaf water content (WC); (b) score of visual salt injury (Score); (c) total chlorophyllcontent in leaves (Chl_total); (d) chlorophyll a content in leaves (Chla); (e) chlorophyll b contentin leaves (Chlb); (f) chlorophyll a to chlorophyll b ratio in leaves (Chla_b); (g) K+ concentration inleaves (ConcK); (h) Na+ concentration in leaves (ConcNa); (i) ratio of Na+/K+ in leaves (Na_K).
The correlations among the traits determined the same tendency within the full paneland the two subpanels (Figure S1). However, the correlation coefficients were largelyvariable between the traits (Table 2). For instance, Score, ConcNa and Na_K were stronglynegatively correlated with WC. ConcNa and Na_K were also highly correlated with Score.In contrast, ConcK constituted weak correlations with the other traits, except for a moderatecorrelation with WC. Overall, higher correlations were observed among WC, Score, ConcNaand Na_K.
144
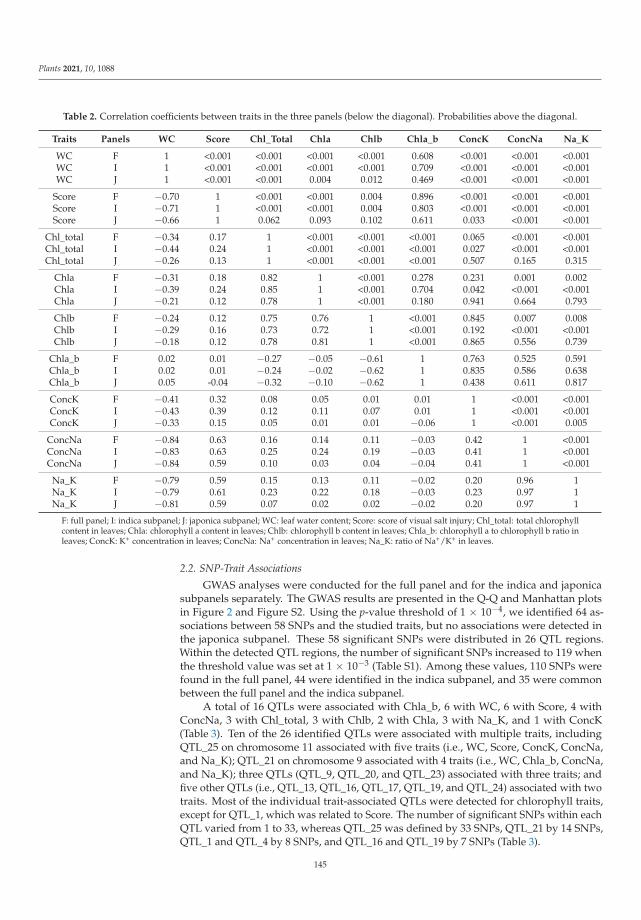
Plants 2021, 10, 1088
Table 2. Correlation coefficients between traits in the three panels (below the diagonal). Probabilities above the diagonal.
Traits Panels WC Score Chl_Total Chla Chlb Chla_b ConcK ConcNa Na_K
WC F 1 <0.001 <0.001 <0.001 <0.001 0.608 <0.001 <0.001 <0.001WC I 1 <0.001 <0.001 <0.001 <0.001 0.709 <0.001 <0.001 <0.001WC J 1 <0.001 <0.001 0.004 0.012 0.469 <0.001 <0.001 <0.001
Score F −0.70 1 <0.001 <0.001 0.004 0.896 <0.001 <0.001 <0.001Score I −0.71 1 <0.001 <0.001 0.004 0.803 <0.001 <0.001 <0.001Score J −0.66 1 0.062 0.093 0.102 0.611 0.033 <0.001 <0.001
Chl_total F −0.34 0.17 1 <0.001 <0.001 <0.001 0.065 <0.001 <0.001Chl_total I −0.44 0.24 1 <0.001 <0.001 <0.001 0.027 <0.001 <0.001Chl_total J −0.26 0.13 1 <0.001 <0.001 <0.001 0.507 0.165 0.315
Chla F −0.31 0.18 0.82 1 <0.001 0.278 0.231 0.001 0.002Chla I −0.39 0.24 0.85 1 <0.001 0.704 0.042 <0.001 <0.001Chla J −0.21 0.12 0.78 1 <0.001 0.180 0.941 0.664 0.793
Chlb F −0.24 0.12 0.75 0.76 1 <0.001 0.845 0.007 0.008Chlb I −0.29 0.16 0.73 0.72 1 <0.001 0.192 <0.001 <0.001Chlb J −0.18 0.12 0.78 0.81 1 <0.001 0.865 0.556 0.739
Chla_b F 0.02 0.01 −0.27 −0.05 −0.61 1 0.763 0.525 0.591Chla_b I 0.02 0.01 −0.24 −0.02 −0.62 1 0.835 0.586 0.638Chla_b J 0.05 -0.04 −0.32 −0.10 −0.62 1 0.438 0.611 0.817
ConcK F −0.41 0.32 0.08 0.05 0.01 0.01 1 <0.001 <0.001ConcK I −0.43 0.39 0.12 0.11 0.07 0.01 1 <0.001 <0.001ConcK J −0.33 0.15 0.05 0.01 0.01 −0.06 1 <0.001 0.005
ConcNa F −0.84 0.63 0.16 0.14 0.11 −0.03 0.42 1 <0.001ConcNa I −0.83 0.63 0.25 0.24 0.19 −0.03 0.41 1 <0.001ConcNa J −0.84 0.59 0.10 0.03 0.04 −0.04 0.41 1 <0.001
Na_K F −0.79 0.59 0.15 0.13 0.11 −0.02 0.20 0.96 1Na_K I −0.79 0.61 0.23 0.22 0.18 −0.03 0.23 0.97 1Na_K J −0.81 0.59 0.07 0.02 0.02 −0.02 0.20 0.97 1
F: full panel; I: indica subpanel; J: japonica subpanel; WC: leaf water content; Score: score of visual salt injury; Chl_total: total chlorophyllcontent in leaves; Chla: chlorophyll a content in leaves; Chlb: chlorophyll b content in leaves; Chla_b: chlorophyll a to chlorophyll b ratio inleaves; ConcK: K+ concentration in leaves; ConcNa: Na+ concentration in leaves; Na_K: ratio of Na+/K+ in leaves.
2.2. SNP-Trait Associations
GWAS analyses were conducted for the full panel and for the indica and japonicasubpanels separately. The GWAS results are presented in the Q-Q and Manhattan plotsin Figure 2 and Figure S2. Using the p-value threshold of 1 × 10⁻⁴, we identified 64 as-sociations between 58 SNPs and the studied traits, but no associations were detected inthe japonica subpanel. These 58 significant SNPs were distributed in 26 QTL regions.Within the detected QTL regions, the number of significant SNPs increased to 119 whenthe threshold value was set at 1 × 10⁻³ (Table S1). Among these values, 110 SNPs werefound in the full panel, 44 were identified in the indica subpanel, and 35 were commonbetween the full panel and the indica subpanel.
A total of 16 QTLs were associated with Chla_b, 6 with WC, 6 with Score, 4 withConcNa, 3 with Chl_total, 3 with Chlb, 2 with Chla, 3 with Na_K, and 1 with ConcK(Table 3). Ten of the 26 identified QTLs were associated with multiple traits, includingQTL_25 on chromosome 11 associated with five traits (i.e., WC, Score, ConcK, ConcNa,and Na_K); QTL_21 on chromosome 9 associated with 4 traits (i.e., WC, Chla_b, ConcNa,and Na_K); three QTLs (QTL_9, QTL_20, and QTL_23) associated with three traits; andfive other QTLs (i.e., QTL_13, QTL_16, QTL_17, QTL_19, and QTL_24) associated with twotraits. Most of the individual trait-associated QTLs were detected for chlorophyll traits,except for QTL_1, which was related to Score. The number of significant SNPs within eachQTL varied from 1 to 33, whereas QTL_25 was defined by 33 SNPs, QTL_21 by 14 SNPs,QTL_1 and QTL_4 by 8 SNPs, and QTL_16 and QTL_19 by 7 SNPs (Table 3).
145
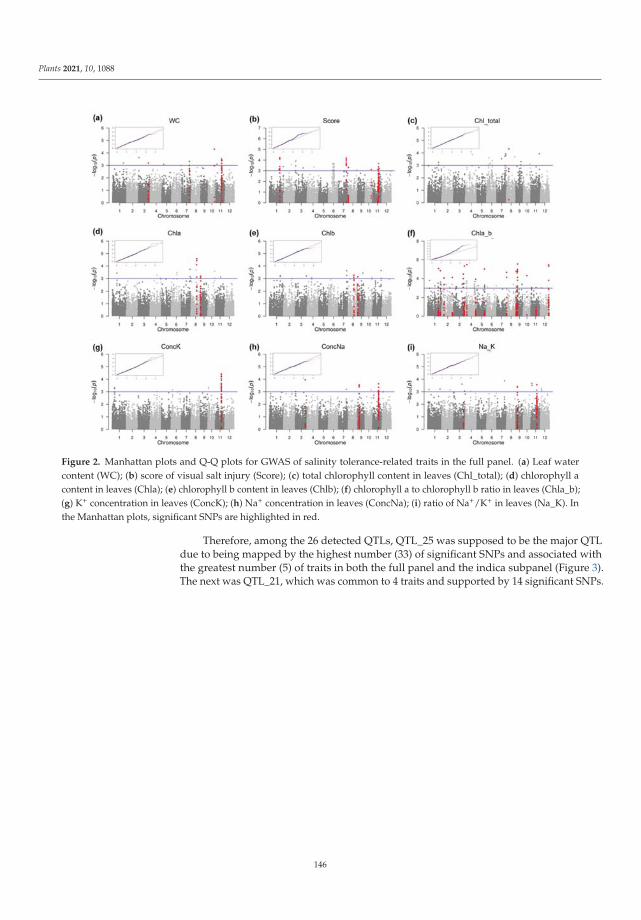
Plants 2021, 10, 1088
Figure 2. Manhattan plots and Q-Q plots for GWAS of salinity tolerance-related traits in the full panel. (a) Leaf watercontent (WC); (b) score of visual salt injury (Score); (c) total chlorophyll content in leaves (Chl_total); (d) chlorophyll acontent in leaves (Chla); (e) chlorophyll b content in leaves (Chlb); (f) chlorophyll a to chlorophyll b ratio in leaves (Chla_b);(g) K+ concentration in leaves (ConcK); (h) Na+ concentration in leaves (ConcNa); (i) ratio of Na+/K+ in leaves (Na_K). Inthe Manhattan plots, significant SNPs are highlighted in red.
Therefore, among the 26 detected QTLs, QTL_25 was supposed to be the major QTLdue to being mapped by the highest number (33) of significant SNPs and associated withthe greatest number (5) of traits in both the full panel and the indica subpanel (Figure 3).The next was QTL_21, which was common to 4 traits and supported by 14 significant SNPs.
146
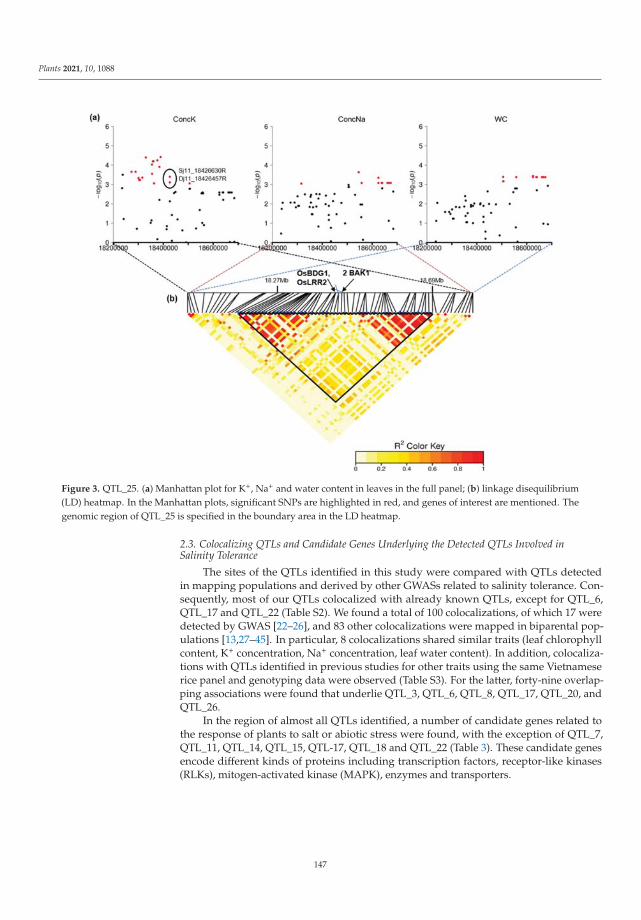
Plants 2021, 10, 1088
Figure 3. QTL_25. (a) Manhattan plot for K+, Na+ and water content in leaves in the full panel; (b) linkage disequilibrium(LD) heatmap. In the Manhattan plots, significant SNPs are highlighted in red, and genes of interest are mentioned. Thegenomic region of QTL_25 is specified in the boundary area in the LD heatmap.
2.3. Colocalizing QTLs and Candidate Genes Underlying the Detected QTLs Involved inSalinity Tolerance
The sites of the QTLs identified in this study were compared with QTLs detectedin mapping populations and derived by other GWASs related to salinity tolerance. Con-sequently, most of our QTLs colocalized with already known QTLs, except for QTL_6,QTL_17 and QTL_22 (Table S2). We found a total of 100 colocalizations, of which 17 weredetected by GWAS [22–26], and 83 other colocalizations were mapped in biparental pop-ulations [13,27–45]. In particular, 8 colocalizations shared similar traits (leaf chlorophyllcontent, K+ concentration, Na+ concentration, leaf water content). In addition, colocaliza-tions with QTLs identified in previous studies for other traits using the same Vietnameserice panel and genotyping data were observed (Table S3). For the latter, forty-nine overlap-ping associations were found that underlie QTL_3, QTL_6, QTL_8, QTL_17, QTL_20, andQTL_26.
In the region of almost all QTLs identified, a number of candidate genes related tothe response of plants to salt or abiotic stress were found, with the exception of QTL_7,QTL_11, QTL_14, QTL_15, QTL-17, QTL_18 and QTL_22 (Table 3). These candidate genesencode different kinds of proteins including transcription factors, receptor-like kinases(RLKs), mitogen-activated kinase (MAPK), enzymes and transporters.
147
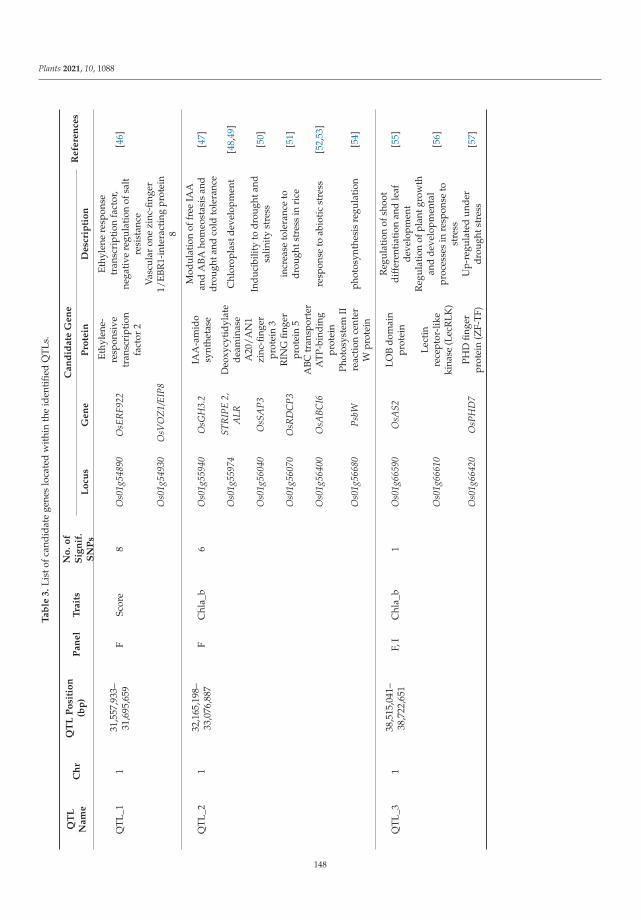
Plants 2021, 10, 1088
Ta
ble
3.
List
ofca
ndid
ate
gene
slo
cate
dw
ithi
nth
eid
enti
fied
QTL
s.
QT
LN
am
eC
hr
QT
LP
osi
tio
n(b
p)
Pa
ne
lT
rait
sN
o.
of
Sig
nif
.S
NP
s
Ca
nd
ida
teG
en
eR
efe
ren
ces
Lo
cus
Ge
ne
Pro
tein
De
scri
pti
on
QTL
_11
31,5
57,9
33–
31,6
95,6
59F
Scor
e8
Os0
1g54
890
OsE
RF9
22
Ethy
lene
-re
spon
sive
tran
scri
ptio
nfa
ctor
2
Ethy
lene
resp
onse
tran
scri
ptio
nfa
ctor
,ne
gati
vere
gula
tion
ofsa
ltre
sist
ance
[46]
Os0
1g54
930
OsV
OZ
1/EI
P8V
ascu
lar
one
zinc
-fing
er1/
EBR
1-in
tera
ctin
gpr
otei
n8
QTL
_21
32,1
65,1
98–
33,0
76,8
87F
Chl
a_b
6O
s01g
5594
0O
sGH
3.2
IAA
-am
ido
synt
heta
se
Mod
ulat
ion
offr
eeIA
Aan
dA
BAho
meo
stas
isan
ddr
ough
tand
cold
tole
ranc
e[4
7]
Os0
1g55
974
STR
IPE
2,A
LRD
eoxy
cyti
dyla
tede
amin
ase
Chl
orop
last
deve
lopm
ent
[48,
49]
Os0
1g56
040
OsS
AP3
A20
/AN
1zi
nc-fi
nger
prot
ein
3
Indu
cibi
lity
todr
ough
tand
salin
ity
stre
ss[5
0]
Os0
1g56
070
OsR
DC
P3R
ING
finge
rpr
otei
n5
incr
ease
tole
ranc
eto
drou
ghts
tres
sin
rice
[51]
Os0
1g56
400
OsA
BCI6
ABC
tran
spor
ter
ATP
-bin
ding
prot
ein
resp
onse
toab
ioti
cst
ress
[52,
53]
Os0
1g56
680
PsbW
Phot
osys
tem
IIre
acti
once
nter
Wpr
otei
nph
otos
ynth
esis
regu
lati
on[5
4]
QTL
_31
38,5
15,0
41–
38,7
22,6
51F,
IC
hla_
b1
Os0
1g66
590
OsA
S2LO
Bdo
mai
npr
otei
n
Reg
ulat
ion
ofsh
oot
diff
eren
tiat
ion
and
leaf
deve
lopm
ent
[55]
Os0
1g66
610
Lect
inre
cept
or-l
ike
kina
se(L
ecR
LK)
Reg
ulat
ion
ofpl
antg
row
than
dde
velo
pmen
tal
proc
esse
sin
resp
onse
tost
ress
[56]
Os0
1g66
420
OsP
HD
7PH
Dfin
ger
prot
ein
(ZF-
TF)
Up-
regu
late
dun
der
drou
ghts
tres
s[5
7]
148
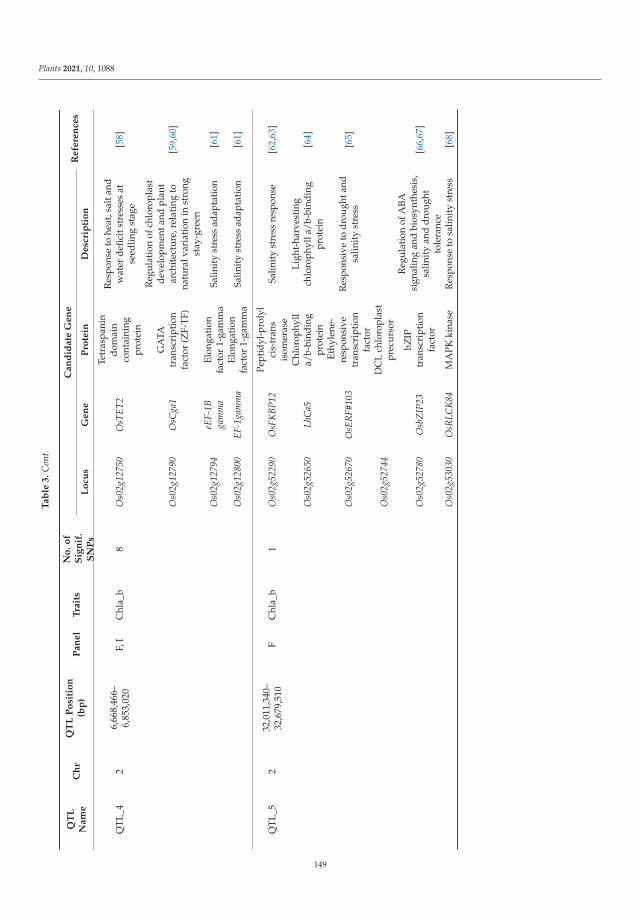
Plants 2021, 10, 1088
Ta
ble
3.
Con
t.
QT
LN
am
eC
hr
QT
LP
osi
tio
n(b
p)
Pa
ne
lT
rait
sN
o.
of
Sig
nif
.S
NP
s
Ca
nd
ida
teG
en
eR
efe
ren
ces
Lo
cus
Ge
ne
Pro
tein
De
scri
pti
on
QTL
_42
6,66
8,46
6–6,
853,
020
F,I
Chl
a_b
8O
s02g
1275
0O
sTET
2
Tetr
aspa
nin
dom
ain
cont
aini
ngpr
otei
n
Res
pons
eto
heat
,sal
tand
wat
erde
ficit
stre
sses
atse
edlin
gst
age
[58]
Os0
2g12
790
OsC
ga1
GA
TAtr
ansc
ript
ion
fact
or(Z
F-T
F)
Reg
ulat
ion
ofch
loro
plas
tde
velo
pmen
tand
plan
tar
chit
ectu
re,r
elat
ing
tona
tura
lvar
iati
onin
stro
ngst
ay-g
reen
[59,
60]
Os0
2g12
794
eEF-
1Bga
mm
aEl
onga
tion
fact
or1-
gam
ma
Salin
ity
stre
ssad
apta
tion
[61]
Os0
2g12
800
EF-1
gam
ma
Elon
gati
onfa
ctor
1-ga
mm
aSa
linit
yst
ress
adap
tati
on[6
1]
QTL
_52
32,0
11,3
40–
32,6
79,5
10F
Chl
a_b
1O
s02g
5229
0O
sFK
BP12
Pept
idyl
-pro
lyl
cis-
tran
sis
omer
ase
Salin
ity
stre
ssre
spon
se[6
2,63
]
Os0
2g52
650
LhC
a5C
hlor
ophy
lla/
b-bi
ndin
gpr
otei
n
Ligh
t-ha
rves
ting
chlo
roph
ylla
/b-b
indi
ngpr
otei
n[6
4]
Os0
2g52
670
OsE
RF#
103
Ethy
lene
-re
spon
sive
tran
scri
ptio
nfa
ctor
Res
pons
ive
todr
ough
tand
salin
ity
stre
ss[6
5]
Os0
2g52
744
DC
Lch
loro
plas
tpr
ecur
sor
Os0
2g52
780
Osb
ZIP
23bZ
IPtr
ansc
ript
ion
fact
or
Reg
ulat
ion
ofA
BAsi
gnal
ing
and
bios
ynth
esis
,sa
linit
yan
ddr
ough
tto
lera
nce
[66,
67]
Os0
2g53
030
OsR
LCK
84M
APK
kina
seR
espo
nse
tosa
linit
yst
ress
[68]
149
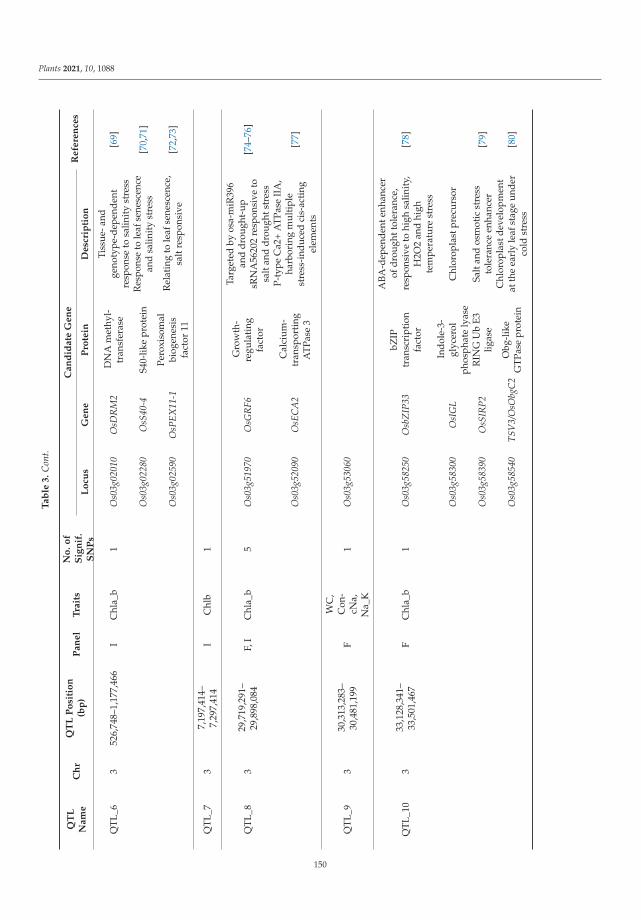
Plants 2021, 10, 1088
Ta
ble
3.
Con
t.
QT
LN
am
eC
hr
QT
LP
osi
tio
n(b
p)
Pa
ne
lT
rait
sN
o.
of
Sig
nif
.S
NP
s
Ca
nd
ida
teG
en
eR
efe
ren
ces
Lo
cus
Ge
ne
Pro
tein
De
scri
pti
on
QTL
_63
526,
748–
1,17
7,46
6I
Chl
a_b
1O
s03g
0201
0O
sDR
M2
DN
Am
ethy
l-tr
ansf
eras
e
Tiss
ue-a
ndge
noty
pe-d
epen
dent
resp
onse
tosa
linit
yst
ress
[69]
Os0
3g02
280
OsS
40-4
S40-
like
prot
ein
Res
pons
eto
leaf
sene
scen
cean
dsa
linit
yst
ress
[70,
71]
Os0
3g02
590
OsP
EX11
-1Pe
roxi
som
albi
ogen
esis
fact
or11
Rel
atin
gto
leaf
sene
scen
ce,
salt
resp
onsi
ve[7
2,73
]
QTL
_73
7,19
7,41
4–7,
297,
414
IC
hlb
1
QTL
_83
29,7
19,2
91–
29,8
98,0
84F,
IC
hla_
b5
Os0
3g51
970
OsG
RF6
Gro
wth
-re
gula
ting
fact
or
Targ
eted
byos
a-m
iR39
6an
ddr
ough
t-up
sRN
A56
202
resp
onsi
veto
salt
and
drou
ghts
tres
s
[74–
76]
Os0
3g52
090
OsE
CA
2C
alci
um-
tran
spor
ting
ATP
ase
3
P-ty
peC
a2+
AT
Pase
IIA
,ha
rbor
ing
mul
tipl
est
ress
-ind
uced
cis-
acti
ngel
emen
ts
[77]
QTL
_93
30,3
13,2
83–
30,4
81,1
99F
WC
,C
on-
cNa,
Na_
K
1O
s03g
5306
0
QTL
_10
333
,128
,341
–33
,501
,467
FC
hla_
b1
Os0
3g58
250
Osb
ZIP
33bZ
IPtr
ansc
ript
ion
fact
or
ABA
-dep
ende
nten
hanc
erof
drou
ghtt
oler
ance
,re
spon
sive
tohi
ghsa
linit
y,H
2O2
and
high
tem
pera
ture
stre
ss
[78]
Os0
3g58
300
OsI
GL
Indo
le-3
-gl
ycer
olph
osph
ate
lyas
eC
hlor
opla
stpr
ecur
sor
Os0
3g58
390
OsS
IRP2
RIN
GU
bE3
ligas
eSa
ltan
dos
mot
icst
ress
tole
ranc
een
hanc
er[7
9]
Os0
3g58
540
TSV
3/O
sObg
C2
Obg
-lik
eG
TPas
epr
otei
n
Chl
orop
last
deve
lopm
ent
atth
eea
rly
leaf
stag
eun
der
cold
stre
ss[8
0]
150
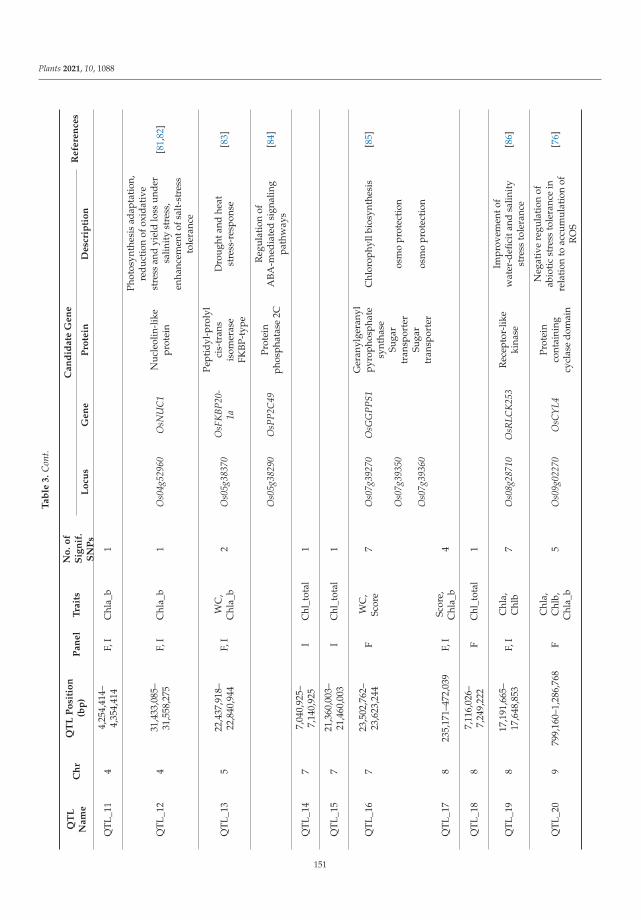
Plants 2021, 10, 1088
Ta
ble
3.
Con
t.
QT
LN
am
eC
hr
QT
LP
osi
tio
n(b
p)
Pa
ne
lT
rait
sN
o.
of
Sig
nif
.S
NP
s
Ca
nd
ida
teG
en
eR
efe
ren
ces
Lo
cus
Ge
ne
Pro
tein
De
scri
pti
on
QTL
_11
44,
254,
414–
4,35
4,41
4F,
IC
hla_
b1
QTL
_12
431
,433
,085
–31
,558
,275
F,I
Chl
a_b
1O
s04g
5296
0O
sNU
C1
Nuc
leol
in-l
ike
prot
ein
Phot
osyn
thes
isad
apta
tion
,re
duct
ion
ofox
idat
ive
stre
ssan
dyi
eld
loss
unde
rsa
linit
yst
ress
,en
hanc
emen
tofs
alt-
stre
ssto
lera
nce
[81,
82]
QTL
_13
522
,437
,918
–22
,840
,944
F,I
WC
,C
hla_
b2
Os0
5g38
370
OsF
KBP
20-
1a
Pept
idyl
-pro
lyl
cis-
tran
sis
omer
ase
FKBP
-typ
e
Dro
ught
and
heat
stre
ss-r
espo
nse
[83]
Os0
5g38
290
OsP
P2C
49Pr
otei
nph
osph
atas
e2C
Reg
ulat
ion
ofA
BA-m
edia
ted
sign
alin
gpa
thw
ays
[84]
QTL
_14
77,
040,
925–
7,14
0,92
5I
Chl
_tot
al1
QTL
_15
721
,360
,003
–21
,460
,003
IC
hl_t
otal
1
QTL
_16
723
,502
,762
–23
,623
,244
FW
C,
Scor
e7
Os0
7g39
270
OsG
GPP
S1G
eran
ylge
rany
lpy
roph
osph
ate
synt
hase
Chl
orop
hyll
bios
ynth
esis
[85]
Os0
7g39
350
Suga
rtr
ansp
orte
ros
mo
prot
ecti
on
Os0
7g39
360
Suga
rtr
ansp
orte
ros
mo
prot
ecti
on
QTL
_17
823
5,17
1–47
2,03
9F,
ISc
ore,
Chl
a_b
4
QTL
_18
87,
116,
026–
7,24
9,22
2F
Chl
_tot
al1
QTL
_19
817
,191
,665
–17
,648
,853
F,I
Chl
a,C
hlb
7O
s08g
2871
0O
sRLC
K25
3R
ecep
tor-
like
kina
se
Impr
ovem
ento
fw
ater
-defi
cita
ndsa
linit
yst
ress
tole
ranc
e[8
6]
QTL
_20
979
9,16
0–1,
286,
768
FC
hla,
Chl
b,C
hla_
b5
Os0
9g02
270
OsC
YL4
Prot
ein
cont
aini
ngcy
clas
edo
mai
n
Neg
ativ
ere
gula
tion
ofab
ioti
cst
ress
tole
ranc
ein
rela
tion
toac
cum
ulat
ion
ofR
OS
[76]
151
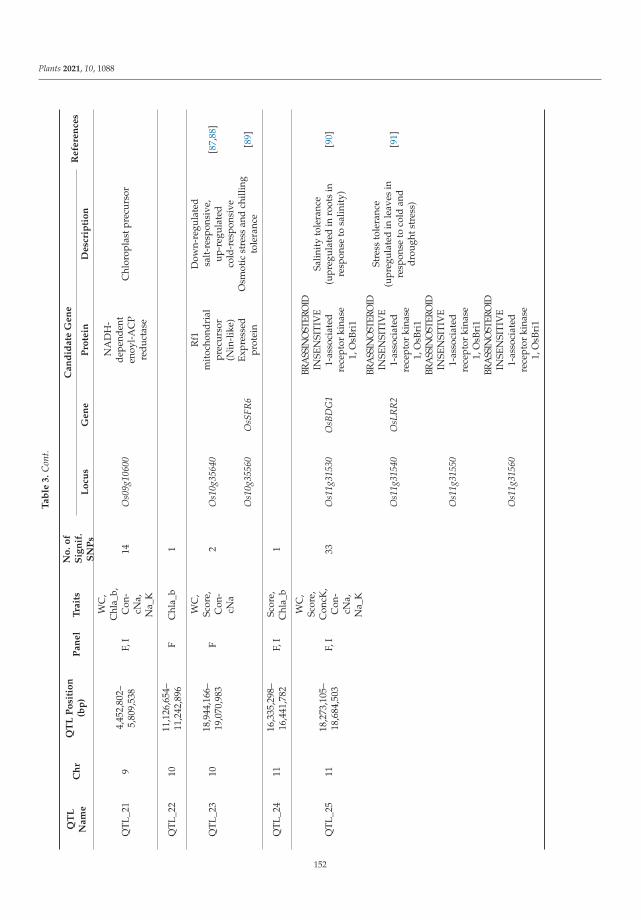
Plants 2021, 10, 1088
Ta
ble
3.
Con
t.
QT
LN
am
eC
hr
QT
LP
osi
tio
n(b
p)
Pa
ne
lT
rait
sN
o.
of
Sig
nif
.S
NP
s
Ca
nd
ida
teG
en
eR
efe
ren
ces
Lo
cus
Ge
ne
Pro
tein
De
scri
pti
on
QTL
_21
94,
452,
802–
5,80
9,53
8F,
I
WC
,C
hla_
b,C
on-
cNa,
Na_
K
14O
s09g
1060
0
NA
DH
-de
pend
ent
enoy
l-A
CP
redu
ctas
e
Chl
orop
last
prec
urso
r
QTL
_22
1011
,126
,654
–11
,242
,896
FC
hla_
b1
QTL
_23
1018
,944
,166
–19
,070
,983
F
WC
,Sc
ore,
Con
-cN
a
2O
s10g
3564
0
Rf1
mit
ocho
ndri
alpr
ecur
sor
(Nin
-lik
e)
Dow
n-re
gula
ted
salt
-res
pons
ive,
up-r
egul
ated
cold
-res
pons
ive
[87,
88]
Os1
0g35
560
OsS
FR6
Expr
esse
dpr
otei
nO
smot
icst
ress
and
chill
ing
tole
ranc
e[8
9]
QTL
_24
1116
,335
,298
–16
,441
,782
F,I
Scor
e,C
hla_
b1
QTL
_25
1118
,273
,105
–18
,684
,503
F,I
WC
,Sc
ore,
Con
cK,
Con
-cN
a,N
a_K
33O
s11g
3153
0O
sBD
G1
BRA
SSIN
OST
ERO
IDIN
SEN
SIT
IVE
1-as
soci
ated
rece
ptor
kina
se1,
OsB
ri1
Salin
ity
tole
ranc
e(u
preg
ulat
edin
root
sin
resp
onse
tosa
linit
y)[9
0]
Os1
1g31
540
OsL
RR
2
BRA
SSIN
OST
ERO
IDIN
SEN
SIT
IVE
1-as
soci
ated
rece
ptor
kina
se1,
OsB
ri1
Stre
ssto
lera
nce
(upr
egul
ated
inle
aves
inre
spon
seto
cold
and
drou
ghts
tres
s)
[91]
Os1
1g31
550
BRA
SSIN
OST
ERO
IDIN
SEN
SIT
IVE
1-as
soci
ated
rece
ptor
kina
se1,
OsB
ri1
Os1
1g31
560
BRA
SSIN
OST
ERO
IDIN
SEN
SIT
IVE
1-as
soci
ated
rece
ptor
kina
se1,
OsB
ri1
152
Plants 2021, 10, 1088
Ta
ble
3.
Con
t.
QT
LN
am
eC
hr
QT
LP
osi
tio
n(b
p)
Pa
ne
lT
rait
sN
o.
of
Sig
nif
.S
NP
s
Ca
nd
ida
teG
en
eR
efe
ren
ces
Lo
cus
Ge
ne
Pro
tein
De
scri
pti
on
QTL
_26
1225
,841
,227
–26
,215
,713
FC
hla_
b5
Os1
2g41
860
OsH
ox33
HD
ZIP
III
tran
scri
ptio
nfa
ctor
Targ
eted
bya
miR
NA
resp
onsi
veto
salin
ityst
ress
,co
ntro
lofl
eafs
enes
cenc
e[7
5,92
]
Os1
2g41
950
OsA
RF6
b,O
sAR
F25
Aux
inre
spon
sefa
ctor
Can
dida
tesa
linit
yto
lera
nce-
rela
ted
gene
atth
ese
edlin
gst
age
[93]
Os1
2g42
060
OsW
AK
128
OsW
AK
rece
ptor
-lik
eki
nase
Can
dida
tesa
linit
yto
lera
nce-
rela
ted
gene
atth
ese
edlin
gst
age
[93]
Os1
2g42
070
OsR
LCK
375,
OsW
AK
129
OsW
AK
rece
ptor
-lik
eki
nase
Dow
n-re
gula
ted
inco
ld,
salt
and
drou
ghts
tres
sco
ndit
ions
atth
ese
edlin
gst
age
[94]
Os1
2g42
090
37kD
ain
ner
enve
lope
mem
bran
epr
otei
n
Chl
orop
last
prec
urso
r,sa
linit
y-in
duci
ble
[93,
95]
Os1
2g42
200
OsC
HX
15A
TCH
Xpr
otei
n
Cat
ion
H+
anti
port
er,
cand
idat
esa
linit
yto
lera
nce-
rela
ted
gene
atth
ese
edlin
gst
age
[93]
Os1
2g42
250
OsZ
FP21
3,PI
NE1
C2H
2tr
ansc
ript
ion
fact
or
Inte
ract
ing
wit
hO
sMA
PK3
toen
hanc
esa
linit
yto
lera
nce
byen
hanc
ing
RO
S-sc
aven
ging
abili
ty,
regu
lati
ngin
tern
ode
elon
gati
onan
dph
otop
erio
dic
sign
als
[96,
97]
153
Plants 2021, 10, 1088
3. Discussion
Rice is considered to be very sensitive to salinity [98,99]. Here, to determine the re-sponse of the Vietnamese rice landrace panel to salinity, a moderate salinity stress (100 mMNaCl) was applied at the seedling stage. We assessed a total of 9 phenotypic traits, all ofwhich showed high variability within the panel in response to salinity stress. Of these9 traits, WC, Score and three ion content traits (ConcNa, ConcK and Na_K) exhibited highheritability (0.60–0.76). Additionally, strong correlations (0.59–0.97) were observed amongthese traits with the exception of ConcK, indicating that WC, Score, ConcNa and Na_K werestrongly associated with the response of rice plants to salinity stress, which is consistentwith previous studies on rice salinity tolerance evaluation [100–102]. WC is a physiolog-ical parameter of the plant water status that expresses the response of plants to osmoticstress [103,104], ionic content traits reflect the level of ionic stress (ion homeostasis) [105],and the salt injury score is an indicator of plant damage/survival (growth performance)under salinity stress [100]. Previous studies reported that rice accessions tolerant to salinitystress have the ability to reduce the osmotic stress, prevent the excess accumulation of Na+
and absorb greater K+ to maintain a low shoot Na+/K+ ratio [106–109].Correlations among the traits varied in the same direction in the full panel and the two
subpanels. However, the japonica subpanel had, on average, greater WC and lower Scorethan the indica subpanel, indicating that japonica accessions are more salt-tolerant thanindica accessions. This finding contradicts the results reported in a previous study [101]that used 4 japonica varieties and 6 indica varieties. This contradiction can be explainedby the difference in the number of rice accessions included in the screening. In our study,112 indica and 64 japonica accessions were evaluated.
In this study, GWAS analyses were applied for the full panel and for the two subpanels.Thus far, we succeeded in identifying 119 significant SNPs assigned to 26 QTLs. Twenty-two QTLs were detected in the full panel and 15 QTLs were detected only in the indicasubpanel, but no japonica-specific QTLs were found, although japonica seems to havean average higher salinity tolerance than indica accessions. Similarly, in other studiesusing the same rice panel and genotyping data screened for water deficit tolerance and leaftraits, no japonica-specific QTLs were detected [17,18], likely because japonica accessionsrepresent only one-third of the total accessions of the panel. In this study, of the 26 identifiedQTLs, 11 QTLs were detected in both the full panel and the indica subpanel, and 10 QTLswere associated with two or more traits (Table 3). Interestingly, all the QTLs that weredetected for WC colocalized with QTLs associated with Score and/or ion content traits,except for QTL_13, which was found for WC and Chla_b. These results suggest that WC,Score and ion content traits have a shared genetic basis related to salinity stress responses.However, there was no overlap between QTLs detected for chlorophyll-related traits andion content traits.
The QTLs discovered in this study were located on most chromosomes, apart fromchromosome 6, and we found 3 QTLs (QTL_1, QTL_2 and QTL3) on chromosome 1, butnone of these QTLs colocalized with Saltol, a well-known major QTL for rice salinitytolerance at the seedling stage [110,111]. A large number of QTLs for salinity tolerancedetected in this study colocalized with QTLs detected in other studies and populationsunder conditions of salt stress at vegetative or reproductive stages, which validates ourapproach (Tables S2 and S3). Interestingly, of 26 QTLs identified in the present study,3 QTLs (QTL_6, QTL_17 and QTL_22) did not colocalize with previously reported QTLsand thus constituted novel QTLs. They can be of high interest to bring new salinitytolerance sinks into breeding programs.
The major QTL identified in our study, QTL_25 at 18,273.1–18,684.5 kb on chromosome11 was associated with WC, Score, ConcK, ConcNa and Na_K (Table 3, Figure 3). Inparticular, QTL_25 was mapped by 33 significant SNPs, and each of them contributed5.75–14.09% to the phenotypic variation (Table S1). QTL_25 colocalized with previouslyidentified QTLs under conditions of salinity stress using different mapping populations(Table S2), i.e., with 2 QTLs associated with leaf water content [42], with QTL qSHL11.1
154
Plants 2021, 10, 1088
for shoot length and QTL qRTL11.1 for root length [39], and with 4 GWAS-derived QTLsfor the number of unfilled grains per plant [25] (Table S2), suggesting that this QTL has apleiotropic effect on plant growth and reproduction under salinity stress and likely actssynergistically with other major salinity tolerance QTLs such as Saltol, in enhancing thesalinity tolerance in rice.
Compared to the previous GWAS [14,17,18,20,112], using the same rice panel andgenotyping data, we found 28 associations of 6 QTLs identified in this study colocalizedwith 23 associations of [14,17,20,112], but there was no colocalization between QTLs forsalinity tolerance-related traits and for leaf mass traits [18] (Table S3). Remarkably, 9 associ-ations for various drought tolerance-related traits, including relative water content after2 and 3 weeks of drought stress, slope of relative water content after 2 weeks of droughtstress, drought sensitivity score after 2, 3 and 4 weeks of drought stress, and recovery ability,belonging to QTL q9 of [17], were colocalized with all associations in QTL_17 for Chla_band Score, suggesting that this genomic region contains important genetic determinantsfor rice adaptation to osmotic stresses.
Underlying 19 out of the 26 QTLs detected in this study, a high number of genes wereannotated or functionally associated with salinity tolerance (Table 3).
Most candidate genes encode transcription factors reported to be involved in therice response to salinity or abiotic stresses. Found in QTL_1 for Score, the OsERF922gene (ETHYLENE RESPONSE FACTOR 922, Os01g54890) negatively regulates toleranceto salinity stress through an ABA signaling pathway, since rice transgenic plants over-expressing OsERF922 exhibited reduced salinity tolerance with increased shoot Na+/K+
ratio and ABA level, and knockdown of OsERF922 expression reduced the ABA accumula-tion [46]. Additionally, as a member of the ERF gene family, OsERF922, the expression ofOsERF#103 (ETHYLENE RESPONSE FACTOR 103, Os02g52670) (in QTL_5), was reportedto be upregulated under drought and salinity stress conditions at the seedling stage [65].
Furthermore, we found two potential genes encoding bZIP transcription factors. Inplants, bZIP genes are involved in the response to abiotic stress [66,113]. One of thesetwo genes is OsbZIP23 (b-ZIP TRANSCRIPTION FACTOR 23, Os02g52780) (in QTL_5),which was functionally characterized as being an ABA-dependent enhancer of droughtand salinity tolerance [66,67]. On the one hand, OsbZIP23 overexpression significantlyenhances tolerance to drought stress, especially to high salinity stress, compared with thewild type [66,67]. On the other hand, the OsbZIP23 mutant displays significantly reducedtolerance to drought and salinity stress [67]. In addition, the SUMO protease OsOSTS1(OVERLY TOLERANT TO SALT 1), a gene involved in tolerance to high salinity [114],was reported to directly target OsbZIP23, which results in activation of OsbZIP23 andstimulation of OsbZIP23-dependent gene expression, which helps promote tolerance todrought stress [115]. Similar to OsbZIP23, OsbZIP33 (b-ZIP TRANSCRIPTION FACTOR33, Os03g58250), located in QTL_10, also plays a role as an ABA-dependent enhancer ofdrought and salinity tolerance. OsbZIP33 is highly upregulated under drought and highsalinity stress conditions. OsbZIP33-overexpressing transgenic plants exhibited signifi-cantly increased drought tolerance [78].
Three candidate genes belonging to the zinc-finger transcription factors were identi-fied: OsSAP3 (STRESS-ASSOCIATED PROTEIN 3, Os01g56040) in QTL_2, OsPHD7 (PHDFINGER PROTEIN 7, Os01g66420) in QTL_3, and OsCga1 (CYTOKININ GATA TRANSCRIP-TION FACTOR 1, Os02g12790) in QTL_4. OsSAP3 and OsPHD7 are related to abiotic stressresponses. In particular, the expression of OsSAP3 is induced in response to droughtand salinity stress [50], and OsPHD7 is upregulated under drought stress [57]; moreover,OsCga1 is associated with the development of chloroplasts [59] and stay-green [60]. Stay-green refers to the ability to maintain green leaves and photosynthetic capacity and is thusrelated to plant adaptation to osmotic stress [116]. Overexpression of OsCga1 delays leafsenescence [59].
Underlying QTL_2, OsRDCP3 (RING DOMAIN-CONTAINING PROTEIN 3, Os01g56070)was predicted to be involved in drought stress tolerance [51], and OsABCI6 (ABC TRANS-
155
Plants 2021, 10, 1088
PORTER I FAMILY MEMBER 6, Os01g56400) was supposed to be involved in the responseto abiotic stress [52,53]. Similarly, the expression of OsTET2 (TETRASPANIN 2, Os02g12750),an integral membrane protein found in QTL_4, was increased in drought-stress seedlings;in addition, this gene was highly upregulated under heat and salinity stress [58].
Two other candidate transcription factor genes were found in QTL_26 on chromo-some 11, including OsHox33 (HOMEOBOX GENE 33, Os12g41860) and OsARF25 (AUXINRESPONSE FACTOR 25, Os12g41950). OsHox33, encoding an HDZIP transcription fac-tor, is involved in leaf senescence because its knockdown accelerates leaf senescence [92]and is a target of a salinity stress-responsive miRNA [75]. OsARF25 is also a salinitytolerance-related candidate gene discovered by GWAS, as reported by [93].
Another transcription factor gene identified, OsAS2 (ASYMMETRIC LEAVES 2,Os01g66590) in QTL_3 [55], was associated with the development of plants. LhCa5 (PHOTO-SYSTEM I LIGHT HARVESTING COMPLEX GENE 5, Os02g52650) in QTL_5 was predictedto function in the photosystem [64].
Within the region of QTL_25, the strongest QTL found in this study, we detected a con-secutive set of four BRASSINOSTEROID INSENSITIVE 1-associated receptor kinase 1 (BAK1),including Os11g31530 (OsBDG1), Os11g31540 (OsLRR2), Os11g31550, and Os11g31560(Figure 3b). BAK1, encoding a leucine-rich repeat type II receptor-like kinase, functionsas a coreceptor of BRI1 in brassinosteroid plant signaling [117]. Perception of brassinos-teroids through the BRI1-BAK1 complex can influence the growth and development of riceplants [118], e.g., regulating the leaf angle and grain size [119] and regulating ABA-inducedstomatal closure, which is critical for the survival of plants under water stress [120]. Amongthese four BAK1 genes, OsBDG1 and OsLRR2 are considered to be involved in salt and/orabiotic stress responses [90,91]. Under salinity stress conditions, OsBDG1 is significantlyupregulated in roots of the rice-sensitive cultivar IR29, whereas OsLRR2 is upregulatedin roots of the rice-tolerant cultivar FL478 [90]. Additionally, the expression of OsLRR2 ishighly induced in leaves after cold and drought treatment; thus, OsLRR2 is a supposedcandidate gene involved in tolerance to abiotic stress [91]. Interestingly, two significantSNPs identified in this study, Sj11_18426630R and Dj11_18426457R, were located in thesequence of OsBDG1 (Figure 3). Dj11_18426457R is intronic, while Sj11_18426630R is posi-tioned within a coding sequence (i.e., exon 5) that changes the amino acid sequence in theLRR domain of the OsBDG1 protein. Thus, the perspective of a functional characterizationof these BAK1 candidate genes is opened.
Three other genes encoding receptor-like kinase (RLK) with enhanced abiotic stresstolerance are Os08g28710 (OsRLCK253) in QTL_19 and Os12g42060 (OsWAK128) andOs12g42070 (OsRLCK375, OsWAK129) in QTL_26. Functionally, OsRLCK253 confers tol-erance to salt and water deficits in transgenic Arabidopsis thaliana plants during differentgrowth stages, resulting in yield protection against stress [86]. OsWAK128 and Os12g42070were candidate genes near a GWAS-derived QTL related to salinity tolerance at the seedlingstage [93]. In addition, a mitogen-activated protein kinase (MAPK) encoded by the Os-RLCK84 gene (Os02g53030) in QTL_5 was activated in response to salinity stress [68].
4. Materials and Methods
4.1. Plant Materials and Genotyping
This study included 179 Vietnamese rice landraces and 3 control genotypes (Nip-ponbare, Azucena and IR64). The Vietnamese rice accessions came from diverse loca-tions throughout Vietnam and were originally provided by the Plant Resource Center(21◦00′05′ ′N and 105◦43′33′ ′E). All 182 accessions were genotyped by 21,623 single nu-cleotide polymorphism (SNP) markers using genotyping-by-sequencing with a minorallele frequency above 5% [14]. IR29 was used as a susceptibility check for phenotypingexperiments. The names of the accessions, provinces of origin and ecosystem are describedin Table S4. More detailed information on this panel can be found in [14].
156
Plants 2021, 10, 1088
4.2. Phenotyping Experiment4.2.1. Salt Treatment
The experiment was conducted from August 26, 2019, to September 24, 2019, atthe Agriculture Genetics Institute, Hanoi, Vietnam (21◦02′55′ ′ N and 105◦46′58′ ′ E). Theaccessions were grown in hydroponics following the IRRI standard protocol with threereplicates [100]. Within each replicate, the accessions were randomly distributed in 5.2 indi-vidual plastic trays (36 × 31 × 15 cm) fitted with styrofoam float of 35 slots (2 mm diameter)filled with Peters solution composed of 1 g/L Peters water-soluble fertilizer (20-20-20 NPK)and 200 mg/L ferrous sulfate [21]. A total of 16 plastic trays were used.
The experiment was set under greenhouse conditions. After breaking dormancy at50 ◦C for five days, seeds were soaked in water for 2–3 days. When germination began,seeds were incubated in a culture room (28 ◦C, photoperiod 12 h light/12 h dark) for2 days. Once the primary root emerged well at a length of 2–3 cm, seedlings were culturedin styrofoam floats with a nylon net bottom according to the experimental design. Fourseedlings were cultured per slot. Three days after seeding, seedlings were thinned to keep3 well-developed plants per slot. The pH (5.2) and the level of nutrient solution wereadjusted daily. The Peters solution was replaced weekly until the end of the experiment.Salinity stress was applied when plants reached the fourth leaf stage. Salt NaCl wasgradually supplemented to the hydroponic medium to avoid osmotic shocks. Each time,50 mM NaCl was separated by two days to obtain a final concentration of 100 mM NaCl.The experiment was stopped once all the plants exhibited drying in most leaves (averageevaluation score of 7).
4.2.2. Scoring and Sampling
For each plant, salinity tolerance score was evaluated based on leaf injury symptomsusing the modified standard evaluation score (SES) for rice [21], as follows: score 1—normalgrowth, no leaf symptoms; score 3—near normal growth, but leaf tips or few leaves whitishand rolled; score 5—growth severely retarded, most leaves rolled, only a few elongating;score 7—complete cessation of growth, most leaves dry, some plants dying; score 9—almostall plants dead or dying.
After scoring, the second fully expanded leaves of three plants in each hole wereharvested. Quickly cut a 1.5 cm fragment from the leaf base, separately pack the materialof each hole in aluminum foil, avoiding folding the leaves, and place on ice for chlorophylldetermination. The rest of the cut leaves were immediately put into a small zip plastic bagof known weight for measuring the water content.
4.2.3. Chlorophyll Determination
The chlorophyll content was estimated as described in the protocol of [121] with somemodifications. The harvested samples were weighed, put into 2-mL Eppendorf tubes, andground in liquid nitrogen. The pellet was resuspended in 1.5 mL of 85% acetone solutionand centrifuged at 12,000× g at 4 ◦C for 15 min. One milliliter of the supernatant wascollected, and the absorbance was measured at wavelengths of 645 and 663 nm using a7305 UV/visible spectrophotometer (Jenway, Staffordshire, UK). The chlorophyll contentwas calculated as follows: total chlorophyll (Chl_total, μg/mL) = 20.2 (A645) + 8.02 (A663),chlorophyll a (Chla, μg/mL) = 12.7 (A663) − 2.69 (A645), chlorophyll b (Chlb, μg/mL) =22.9 (A645) − 4.68 (A663). The values were then converted to the amount of chlorophyll permilligram of fresh tissue (μg/mg). The ratio of chlorophyll a to chlorophyll b (Chla_b) wasalso determined.
4.2.4. Water Content Measurement
The bags containing samples were weighed to determine the sample fresh weight(FW). After being dried for 3 days at 70 ◦C in an oven, the sample dry weight (DW) wasmeasured. The leaf water content of each sampling was calculated using the formula:WC (%) = (FW − DW) × 100/FW.
157
Plants 2021, 10, 1088
4.2.5. Ion Content Measurement
The above dried samples with known weight (DW, mg) were used for measurement ofNa+ and K+ ion content. The samples were put into 15-mL Falcon tubes, and 10 mL of 0.1 Nhydrochloric acid solution was added. After sample ion solubilization at room temperatureovernight, 2 mL of sample solution at 200-fold dilution (10 μL of first sample solution +2 mL 0,1 N hydrochloric acid solution) was used to measure Na+ and K+ concentrations(mg/L) by a SpectrAA 220FS atomic absorption spectrometer (Varian, US). The Na+ andK+ contents (ConcNa and ConcK) were then converted back to the quantity of Na+ andK+ ions per gram of dry weight (mg/gDW) by the following equations: ConcNa = [Na+
measurement (mg/L) × dilution rate (200) × volume of first sample solution (10 mL)]/DW(mg); ConcK = [K+ measurement (mg/L) × dilution rate (200) × volume of first samplesolution (10 mL)]/DW (mg). The Na+/K+ ratio (Na_K) was calculated as the proportion ofNa+ content to K+ content.
4.3. Statistical Analysis of Phenotypic Data
Statistical analysis of phenotypic data (means, standard deviations, coefficients ofvariation (CVs), graphs) was carried out in the R software v3.6.2. Analysis of variance(ANOVA) was performed to test the effect of genotype and replication using a linear modelof the R function lm(). Broad-sense heritability (H2) was used to estimate the geneticvariance based on the variance among phenotypic measurements between three replicatesof the panel. H2 was computed using the following formula: H2 = (F-value − 1)/F-value,where the F-value was derived from analysis of ANOVA for the genotype effect [18].Phenotypic correlations between traits were evaluated by the Pearson method using thecorrplot R package. The R function cor.test() was used to test the significance of thecorrelation coefficients.
4.4. Genome-Wide Association Study
The phenotypic data from the salt test and SNP genotypic data on the full panel and theindica and japonica subpanels were separately used to study the marker-trait associationsby incorporating a kinship matrix along with population structure. In the Tassel softwarev.5.0, the structure matrix was determined with 6 axes on the SNP data of the populationby running a principal component analysis (PCA). The kinship matrix was built by thepairwise identity-by-state method, to account for relatedness of individuals among 182accessions. Q-Q and Manhattan plots of the negative log10-transformed observed p-valuesfor each SNP-trait association were created to visualize the GWAS results. Markers with ap-value ≥ 5 × 10⁻⁴ were declared significant.
The number of QTLs from the detected associations was determined based on linkagedisequilibrium (LD) between SNPs surrounding the significant markers. The LD heatmapswere plotted by using the LDheatmap R package, and the genomic regions of QTLswere limited by LD blocks with r2 values (squared allele frequency correlation) betweenSNPs > 0.4. For a low LD block (<50 kb), the interval of QTLs was enlarged by a distanceof +/− 50 kb. The qqman package in R software was utilized to highlight the significantmarkers of strong QTLs in Manhattan plots. The genes in the genomic regions of strongQTLs were scanned in the MSU rice database.
5. Conclusions and Future Prospects
Our approach identified different QTLs characterized by the presence of a high numberof genes associated with the response to salinity or abiotic stress. Interestingly, thesegenes are related to hormone transduction pathways or transcriptional modulation ofgene expression in response to stress, suggesting that these QTLs act in complementaryways to control the salinity tolerance, which is of major interest for breeding programs.Pyramiding several favorable QTLs in a variety will ensure a better resilience of the plantto salinity stress under different environmental conditions and then a better sustainabilityof the variety. Therefore, it will be interesting to conduct introgression of the major QTLs
158
Plants 2021, 10, 1088
identified in this study such as QTL25 in modern varieties cultivated in the Mekong or RedRiver Delta areas such as Bac Thom 7 and Khang Dan 18. The function of the four BAK1genes in QTL25 should be specified by generating single and multiple gene mutationsusing the CRISPR Cas9 system.
Supplementary Materials: The following are available online at https://www.mdpi.com/article/10.3390/plants10061088/s1, Figure S1: Correlation plots in the full panel and the indica and japonicasubpanels, Figure S2: Manhattan plots and Q-Q plots for GWAS of salinity tolerance-related traits inthe indica panel. In the Manhattan plots, significant SNPs are highlighted in red, Table S1: GWASassociations and significant SNPs at p ≤ 1 × 10⁻³ in the full panel and the indica subpanel, Table S2:Colocalizations of the QTLs identified in this study with previous reports, Table S3: Colocalizationsof the QTLs detected in this and previous studies using the same rice panel and genotyping data,Table S4: List of the 183 rice accessions used in the experiment.
Author Contributions: Conceptualization, P.G.; methodology, formal analysis, data curation, G.T.H.,A.-A.V. and P.G.; investigation, T.D.L., H.T.V., K.L.N., F.G., L.H.T., H.T.T.V., F.L., X.H.P., A.-A.V.,G.T.H.; writing—original draft preparation, G.T.H. and P.G.; writing—review and editing, T.D.L.,H.T.V., K.L.N., H.T.T.V., T.X.D., X.H.P., A.-A.V.; visualization, supervision, project administration,G.T.H.; funding acquisition, G.T.H. and P.G. All authors have read and agreed to the publishedversion of the manuscript.
Funding: This research was funded by the Ministry of Science and Technology of Vietnam andthe French embassy in Vietnam in the frame of project “Application of functional genomics andassociation genetics to characterize genes involved in abiotic stresses tolerance in rice” (code:NDT.56.FRA/19). This research was also supported by the Global Rice Science Partnership (2011–2016) and by the CGIAR Research Program (CRP) on rice agri-food systems (RICE, 2017–2022).
Data Availability Statement: The GBS genotyping dataset supporting the results of this study hasbeen deposited as a downloadable Excel file in TropGeneDB: http://tropgenedb.cirad.fr/tropgene/JSP/interface.jsp?module=RICE (accessed on 24 May 2021) tab “studies”, study type “genotype”,study “Vietnamese panel-GBS data”. The seeds of the accessions are available in the National KeyLaboratory for Plant Cell Biotechnology of Agricultural Genetics Institute, Hanoi, Vietnam.
Conflicts of Interest: The authors declare no conflict of interest.
References
1. Rengasamy, P. Soil Processes Affecting Crop Production in Salt-Affected Soils. Funct. Plant Biol. 2010, 37, 613. [CrossRef]2. Wassmann, R.; Nelson, G.; Peng, S.; Sumfleth, K.; Jagadish, K.; Hosen, Y.; Rosegrant, M. Rice and global climate change. In Rice in
the Global Economy: Strategic Research and Policy Issues for Food Security; IRRI: Los Banos, Philippines, 2010; pp. 411–433.3. Timmer, C.P.; Block, S.; Dawe, D. Long-run dynamics of rice consumption, 1960–2050. In Rice in the Global Economy: Strategic
Research and Policy Issues for Food Security; IRRI: Los Banos, Philippines, 2010; pp. 139–174.4. Sarah, K.B. System of Rice Intensification in Vietnam: Doing More with Less; 52 Profiles on Agroecology; Oxfam: Food and Agriculture
Organisation of the United States: Washington, DC, USA, 2016.5. Ngoc Huyen Việt Nam chịu ảnh hưởng ra sao bởi biến dổi khí hậu? Báo Ðồng Khởi. 2008. Available online: https://baodongkhoi.
vn/viet-nam-chiu-anh-huong-ra-sao-boi-bien-doi-khi-hau-14012008-a543.html (accessed on 24 May 2021).6. Ha, P.V.; Nguyen, H.T.M.; Kompas, T.; Che, T.N.; Trinh, B. Rice Production, Trade and the Poor: Regional Effects of Rice Export
Policy on Households in Vietnam. J. Agric. Econ. 2015, 66, 280–307. [CrossRef]7. Maitah, K.; Smutka, L.; Sahatqija, J.; Maitah, M.; Phuong Anh, N. Rice as a Determinant of Vietnamese Economic Sustainability.
Sustainability 2020, 12, 5123. [CrossRef]8. Loc, H.H.; Van Binh, D.; Park, E.; Shrestha, S.; Dung, T.D.; Son, V.H.; Truc, N.H.T.; Mai, N.P.; Seijger, C. Intensifying Saline Water
Intrusion and Drought in the Mekong Delta: From Physical Evidence to Policy Outlooks. Sci. Total Environ. 2021, 757, 143919.[CrossRef] [PubMed]
9. Tin, H.Q.; Loi, N.H.; Labarosa, S.J.E.; McNally, K.L.; McCouch, S.; Kilian, B. Phenotypic Response of Farmer-selected CWR-derivedRice Lines to Salt Stress in the Mekong Delta. Crop Sci. 2021, 61, 201–218. [CrossRef]
10. Ganie, S.A.; Molla, K.A.; Henry, R.J.; Bhat, K.V.; Mondal, T.K. Advances in Understanding Salt Tolerance in Rice. Theor. Appl.Genet. 2019, 132, 851–870. [CrossRef]
11. Negrão, S.; Courtois, B.; Ahmadi, N.; Abreu, I.; Saibo, N.; Oliveira, M.M. Recent Updates on Salinity Stress in Rice: FromPhysiological to Molecular Responses. Crit. Rev. Plant Sci. 2011, 30, 329–377. [CrossRef]
12. Pang, Y.; Chen, K.; Wang, X.; Wang, W.; Xu, J.; Ali, J.; Li, Z. Simultaneous Improvement and Genetic Dissection of Salt Toleranceof Rice (Oryza Sativa L.) by Designed QTL Pyramiding. Front. Plant Sci. 2017, 8, 1275. [CrossRef]
159
Plants 2021, 10, 1088
13. Wang, Z.; Cheng, J.; Chen, Z.; Huang, J.; Bao, Y.; Wang, J.; Zhang, H. Identification of QTLs with Main, Epistatic and QTL ×Environment Interaction Effects for Salt Tolerance in Rice Seedlings under Different Salinity Conditions. Theor. Appl. Genet. 2012,125, 807–815. [CrossRef] [PubMed]
14. Phung, N.T.P.; Mai, C.D.; Mournet, P.; Frouin, J.; Droc, G.; Ta, N.K.; Jouannic, S.; Lê, L.T.; Do, V.N.; Gantet, P.; et al. Characterizationof a Panel of Vietnamese Rice Varieties Using DArT and SNP Markers for Association Mapping Purposes. BMC Plant Biol. 2014,14, 371. [CrossRef]
15. Fukuoka, S.; Alpatyeva, N.V.; Ebana, K.; Luu, N.T.; Nagamine, T. Analysis of Vietnamese Rice Germplasm Provides an Insightinto Japonica Rice Differentiation. Plant Breed. 2003, 122, 497–502. [CrossRef]
16. Li, J.-Y.; Wang, J.; Zeigler, R.S. The 3000 Rice Genomes Project: New Opportunities and Challenges for Future Rice Research.GigaScience 2014, 3, 8. [CrossRef]
17. Hoang, G.T.; Van Dinh, L.; Nguyen, T.T.; Ta, N.K.; Gathignol, F.; Mai, C.D.; Jouannic, S.; Tran, K.D.; Khuat, T.H.; Do, V.N.; et al.Genome-Wide Association Study of a Panel of Vietnamese Rice Landraces Reveals New QTLs for Tolerance to Water Deficitduring the Vegetative Phase. Rice 2019, 12, 4. [CrossRef] [PubMed]
18. Hoang, G.T.; Gantet, P.; Nguyen, K.H.; Phung, N.T.P.; Ha, L.T.; Nguyen, T.T.; Lebrun, M.; Courtois, B.; Pham, X.H. Genome-WideAssociation Mapping of Leaf Mass Traits in a Vietnamese Rice Landrace Panel. PLoS ONE 2019, 14, e0219274. [CrossRef][PubMed]
19. Phung, N.T.P.; Mai, C.D.; Hoang, G.T.; Truong, H.T.M.; Lavarenne, J.; Gonin, M.; Nguyen, K.L.; Ha, T.T.; Do, V.N.; Gantet, P.; et al.Genome-Wide Association Mapping for Root Traits in a Panel of Rice Accessions from Vietnam. BMC Plant Biol. 2016, 16, 64.[CrossRef] [PubMed]
20. Ta, K.N.; Khong, N.G.; Ha, T.L.; Nguyen, D.T.; Mai, D.C.; Hoang, T.G.; Phung, T.P.N.; Bourrie, I.; Courtois, B.; Tran, T.T.H.; et al.A Genome-Wide Association Study Using a Vietnamese Landrace Panel of Rice (Oryza Sativa) Reveals New QTLs ControllingPanicle Morphological Traits. BMC Plant Biol. 2018, 18, 282. [CrossRef]
21. Egdane, J.; Vispo, N.; Mohammadi, R.; Amas, J.; Katimbang, M.; Platten, J.; Ismail, A.; Gregorio, G. Phenotyping Protocols forSalinity and Other Problem Soils; International Rice Research Institute: Los Banos, Philippines, 2007.
22. Batayeva, D.; Labaco, B.; Ye, C.; Li, X.; Usenbekov, B.; Rysbekova, A.; Dyuskalieva, G.; Vergara, G.; Reinke, R.; Leung, H.Genome-Wide Association Study of Seedling Stage Salinity Tolerance in Temperate Japonica Rice Germplasm. BMC Genet. 2018,19, 2. [CrossRef]
23. Frouin, J.; Languillaume, A.; Mas, J.; Mieulet, D.; Boisnard, A.; Labeyrie, A.; Bettembourg, M.; Bureau, C.; Lorenzini, E.; Portefaix,M.; et al. Tolerance to Mild Salinity Stress in Japonica Rice: Agenome-Wide Association Mapping Study Highlights CalciumSignaling and Metabolism Genes. PLoS ONE 2018, 13, e0190964. [CrossRef]
24. Kumar, V.; Singh, A.; Mithra, S.V.A.; Krishnamurthy, S.L.; Parida, S.K.; Jain, S.; Tiwari, K.K.; Kumar, P.; Rao, A.R.; Sharma,S.K.; et al. Genome-Wide Association Mapping of Salinity Tolerance in Rice (Oryza Sativa). DNA Res. 2015, 22, 133–145. [CrossRef]
25. Lekklar, C.; Pongpanich, M.; Suriya-arunroj, D.; Chinpongpanich, A.; Tsai, H.; Comai, L.; Chadchawan, S.; Buaboocha, T.Genome-Wide Association Study for Salinity Tolerance at the Flowering Stage in a Panel of Rice Accessions from Thailand. BMCGenom. 2019, 20, 76. [CrossRef]
26. Yuan, J.; Wang, X.; Zhao, Y.; Khan, N.U.; Zhao, Z.; Zhang, Y.; Wen, X.; Tang, F.; Wang, F.; Li, Z. Genetic Basis and Identification ofCandidate Genes for Salt Tolerance in Rice by GWAS. Sci. Rep. 2020, 10, 9958. [CrossRef]
27. Ammar, M.H.M.; Pandit, A.; Singh, R.K.; Sameena, S.; Chauhan, M.S.; Singh, A.K.; Sharma, P.C.; Gaikwad, K.; Sharma, T.R.;Mohapatra, T.; et al. Mapping of QTLs Controlling Na+, K+ and CI− Ion Concentrations in Salt Tolerant Indica Rice VarietyCSR27. J. Plant Biochem. Biotechnol. 2009, 18, 139–150. [CrossRef]
28. Cheng, L.; Wang, Y.; Meng, L.; Hu, X.; Cui, Y.; Sun, Y.; Zhu, L.; Ali, J.; Xu, J.; Li, Z. Identification of Salt-Tolerant QTLs with StrongGenetic Background Effect Using Two Sets of Reciprocal Introgression Lines in Rice. Genome 2012, 55, 45–55. [CrossRef] [PubMed]
29. De Leon, T.B.; Linscombe, S.; Subudhi, P.K. Molecular Dissection of Seedling Salinity Tolerance in Rice (Oryza Sativa L.) Using aHigh-Density GBS-Based SNP Linkage Map. Rice 2016, 9, 52. [CrossRef]
30. Ghomi, K.; Rabiei, B.; Sabouri, H.; Sabouri, A. Mapping QTLs for Traits Related to Salinity Tolerance at Seedling Stage of Rice(Oryza Sativa L.): An Agrigenomics Study of an Iranian Rice Population. OMICS 2013, 17, 242–251. [CrossRef]
31. Gimhani, D.R.; Gregorio, G.B.; Kottearachchi, N.S.; Samarasinghe, W.L.G. SNP-Based Discovery of Salinity-Tolerant QTLs in aBi-Parental Population of Rice (Oryza Sativa). Mol. Genet. Genom. 2016, 291, 2081–2099. [CrossRef] [PubMed]
32. Hemamalini, G.S.; Shashidhar, H.E.; Hittalmani, S. Molecular Marker Assisted Tagging of Morphological and Physiological Traitsunder Two Contrasting Moisture Regimes at Peak Vegetative Stage in Rice (Oryza Sativa L.). Euphytica 2000, 112, 69–78. [CrossRef]
33. Hossain, H.; Rahman, M.A.; Alam, M.S.; Singh, R.K. Mapping of Quantitative Trait Loci Associated with Reproductive-Stage SaltTolerance in Rice. J. Agron. Crop Sci. 2015, 201, 17–31. [CrossRef]
34. Koyama, M.L.; Levesley, A.; Koebner, R.M.D.; Flowers, T.J.; Yeo, A.R. Quantitative Trait Loci for Component Physiological TraitsDetermining Salt Tolerance in Rice. Plant Physiol. 2001, 125, 406–422. [CrossRef]
35. Lafitte, R.H.; Courtois, B. Genetic Variation in Performance under Reproductive-Stage Water Deficit in a Doubled Haploid RicePopulation in Upland Fields. In Proceedings of the Molecular Approaches for the Genetic Improvement of Cereals for StableProduction in Water-Limited Environments, CIMMYT, El Batan, Mexico, 21 June 1999.
36. Mohammadi, R.; Mendioro, M.S.; Diaz, G.Q.; Gregorio, G.B.; Singh, R.K. Mapping Quantitative Trait Loci Associated with Yieldand Yield Components under Reproductive Stage Salinity Stress in Rice (Oryza Sativa L.). J. Genet. 2013, 92, 433–443. [CrossRef]
160
Plants 2021, 10, 1088
37. Prasad, S.R.; Bagali, P.G.; Hittalmani, S.; Shashidhar, H.E. Molecular Mapping of Quantitative Trait Loci Associated with SeedlingTolerance to Salt Stress in Rice (Oryza Sativa L.). Curr. Sci. 2000, 78, 162–164.
38. Price, A.H.; Steele, K.A.; Moore, B.J.; Jones, R.G.W. Upland Rice Grown in Soil-Filled Chambers and Exposed to ContrastingWater-Deficit Regimes II. Mapping Quantitative Trait Loci for Root Morphology and Distribution. Field Crops Res. 2002, 76, 25–43.[CrossRef]
39. Puram, V.R.R.; Ontoy, J.; Linscombe, S.; Subudhi, P.K. Genetic Dissection of Seedling Stage Salinity Tolerance in Rice UsingIntrogression Lines of a Salt Tolerant Landrace Nona Bokra. J. Hered. 2017, 108, 658–670. [CrossRef] [PubMed]
40. Sabouri, H.; Rezai, A.M.; Moumeni, A.; Kavousi, A.; Katouzi, M.; Sabouri, A. QTLs Mapping of Physiological Traits Related toSalt Tolerance in Young Rice Seedlings. Biol. Plant. 2009, 53, 657–662. [CrossRef]
41. Thomson, M.J.; de Ocampo, M.; Egdane, J.; Rahman, M.A.; Sajise, A.G.; Adorada, D.L.; Tumimbang-Raiz, E.; Blumwald, E.; Seraj,Z.I.; Singh, R.K.; et al. Characterizing the Saltol Quantitative Trait Locus for Salinity Tolerance in Rice. Rice 2010, 3, 148–160.[CrossRef]
42. Ul Haq, T.; Gorham, J.; Akhtar, J.; Akhtar, N.; Steele, K.A. Dynamic Quantitative Trait Loci for Salt Stress Components onChromosome 1 of Rice. Funct. Plant Biol. 2010, 37, 634–645. [CrossRef]
43. Wang, Z.; Chen, Z.; Cheng, J.; Lai, Y.; Wang, J.; Bao, Y.; Huang, J.; Zhang, H. QTL Analysis of Na+ and K+ Concentrations in Rootsand Shoots under Different Levels of NaCl Stress in Rice (Oryza Sativa L.). PLoS ONE 2012, 7, e51202. [CrossRef] [PubMed]
44. Wang, Z.; Wang, J.; Bao, Y.; Wu, Y.; Zhang, H. Quantitative Trait Loci Controlling Rice Seed Germination under Salt Stress.Euphytica 2011, 178, 297–307. [CrossRef]
45. Yue, B.; Xue, W.; Xiong, L.; Yu, X.; Luo, L.; Cui, K.; Jin, D.; Xing, Y.; Zhang, Q. Genetic Basis of Drought Resistance at ReproductiveStage in Rice: Separation of Drought Tolerance from Drought Avoidance. Genetics 2006, 172, 1213–1228. [CrossRef]
46. Liu, D.; Chen, X.; Liu, J.; Guo, Z. The Rice ERF Transcription Factor OsERF922 Negatively Regulates Resistance to MagnaportheOryzae and Salt Tolerance. J. Exp. Bot. 2012, 63. [CrossRef]
47. Du, H.; Wu, N.; Fu, J.; Wang, S.; Li, X.; Xiao, J.; Xiong, L. A GH3 Family Member, OsGH3-2, Modulates Auxin and Abscisic AcidLevels and Differentially Affects Drought and Cold Tolerance in Rice. J. Exp. Bot. 2012, 63, 6467–6480. [CrossRef]
48. Niu, M.; Wang, Y.; Wang, C.; Lyu, J.; Wang, Y.; Dong, H.; Long, W.; Wang, D.; Kong, W.; Wang, L.; et al. ALR Encoding DCMPDeaminase Is Critical for DNA Damage Repair, Cell Cycle Progression and Plant Development in Rice. J. Exp. Bot. 2017, 68,5773–5786. [CrossRef] [PubMed]
49. Xu, J.; Deng, Y.; Li, Q.; Zhu, X.; He, Z. STRIPE2 Encodes a Putative DCMP Deaminase That Plays an Important Role in ChloroplastDevelopment in Rice. J. Genet. Genom. 2014, 41, 539–548. [CrossRef] [PubMed]
50. Vij, S.; Tyagi, A.K. Genome-Wide Analysis of the Stress Associated Protein (SAP) Gene Family Containing A20/AN1 Zinc-Finger(s)in Rice and Their Phylogenetic Relationship with Arabidopsis. Mol. Genet. Genom. 2006, 276, 565–575. [CrossRef]
51. Bae, H.; Kim, S.K.; Cho, S.K.; Kang, B.G.; Kim, W.T. Overexpression of OsRDCP1, a Rice RING Domain-Containing E3 UbiquitinLigase, Increased Tolerance to Drought Stress in Rice (Oryza Sativa L.). Plant Sci. 2011, 180, 775–782. [CrossRef] [PubMed]
52. Nguyen, V.N.T.; Moon, S.; Jung, K.-H. Genome-Wide Expression Analysis of Rice ABC Transporter Family across Spatio-TemporalSamples and in Response to Abiotic Stresses. J. Plant Physiol. 2014, 171, 1276–1288. [CrossRef]
53. Saha, J.; Sengupta, A.; Gupta, K.; Gupta, B. Molecular Phylogenetic Study and Expression Analysis of ATP-Binding CassetteTransporter Gene Family in Oryza Sativa in Response to Salt Stress. Comput. Biol. Chem. 2015, 54, 18–32. [CrossRef]
54. Wang, Y.; Jiang, Q.; Liu, J.; Zeng, W.; Zeng, Y.; Li, R.; Luo, J. Comparative Transcriptome Profiling of Chilling Tolerant RiceChromosome Segment Substitution Line in Response to Early Chilling Stress. Genes Genom. 2017, 39, 127–141. [CrossRef]
55. Ma, Y.; Wang, F.; Guo, J.; Zhang, X.S. Rice OsAS2 Gene, a Member of LOB Domain Family, Functions in the Regulation of ShootDifferentiation and Leaf Development. J. Plant Biol. 2009, 52, 374–381. [CrossRef]
56. Passricha, N.; Saifi, S.; Ansari, M.W.; Tuteja, N. Prediction and Validation of Cis-Regulatory Elements in 5′ Upstream RegulatoryRegions of Lectin Receptor-like Kinase Gene Family in Rice. Protoplasma 2017, 254, 669–684. [CrossRef] [PubMed]
57. Sun, M.; Jia, B.; Yang, J.; Cui, N.; Zhu, Y.; Sun, X. Genome-Wide Identification of the PHD-Finger Family Genes and TheirResponses to Environmental Stresses in Oryza Sativa L. Int. J. Mol. Sci. 2017, 18, 2005. [CrossRef] [PubMed]
58. Mani, B.; Agarwal, M.; Katiyar-Agarwal, S. Comprehensive Expression Profiling of Rice Tetraspanin Genes Reveals Diverse Rolesduring Development and Abiotic Stress. Front. Plant Sci. 2015, 6. [CrossRef]
59. Hudson, D.; Guevara, D.R.; Hand, A.J.; Xu, Z.; Hao, L.; Chen, X.; Zhu, T.; Bi, Y.-M.; Rothstein, S.J. Rice Cytokinin GATATranscription Factor1 Regulates Chloroplast Development and Plant Architecture. Plant Physiol. 2013, 162, 132–144. [CrossRef]
60. Zhao, Y.; Qiang, C.; Wang, X.; Chen, Y.; Deng, J.; Jiang, C.; Sun, X.; Chen, H.; Li, J.; Piao, W.; et al. New Alleles for ChlorophyllContent and Stay-Green Traits Revealed by a Genome Wide Association Study in Rice (Oryza Sativa). Sci. Rep. 2019, 9, 2541.[CrossRef] [PubMed]
61. Hossain, M.R.; Bassel, G.W.; Pritchard, J.; Sharma, G.P.; Ford-Lloyd, B.V. Trait Specific Expression Profiling of Salt StressResponsive Genes in Diverse Rice Genotypes as Determined by Modified Significance Analysis of Microarrays. Front. Plant Sci.2016, 7. [CrossRef] [PubMed]
62. Lakra, N.; Kaur, C.; Singla-Pareek, S.L.; Pareek, A. Mapping the ‘Early Salinity Response’ Triggered Proteome Adaptation inContrasting Rice Genotypes Using ITRAQ Approach. Rice 2019, 12, 3. [CrossRef] [PubMed]
161
Plants 2021, 10, 1088
63. Lim, S.D.; Jung, C.G.; Park, Y.C.; Lee, S.C.; Lee, C.; Lim, C.W.; Kim, D.S.; Jang, C.S. Molecular Dissection of a Rice Microtubule-Associated RING Finger Protein and Its Potential Role in Salt Tolerance in Arabidopsis. Plant Mol. Biol. 2015, 89, 365–384.[CrossRef] [PubMed]
64. Umate, P. Genome-Wide Analysis of the Family of Light-Harvesting Chlorophyll a/b-Binding Proteins in Arabidopsis and Rice.Plant Signal. Behav. 2010, 5, 1537–1542. [CrossRef]
65. Mishra, M.; Kanwar, P.; Singh, A.; Pandey, A.; Kapoor, S.; Pandey, G.K. Plant Omics: Genome-Wide Analysis of ABA Repressor1(ABR1) Related Genes in Rice during Abiotic Stress and Development. OMICS 2013, 17, 439–450. [CrossRef]
66. Park, S.-H.; Jeong, J.S.; Lee, K.H.; Kim, Y.S.; Do Choi, Y.; Kim, J.-K. OsbZIP23 and OsbZIP45, Members of the Rice Basic LeucineZipper Transcription Factor Family, Are Involved in Drought Tolerance. Plant Biotechnol. Rep. 2015, 9, 89–96. [CrossRef]
67. Xiang, Y.; Tang, N.; Du, H.; Ye, H.; Xiong, L. Characterization of OsbZIP23 as a Key Player of the Basic Leucine ZipperTranscription Factor Family for Conferring Abscisic Acid Sensitivity and Salinity and Drought Tolerance in Rice. Plant Physiol.2008, 148, 1938–1952. [CrossRef]
68. Mirdar Mansuri, R.; Shobbar, Z.-S.; Babaeian Jelodar, N.; Ghaffari, M.R.; Nematzadeh, G.-A.; Asari, S. Dissecting MolecularMechanisms Underlying Salt Tolerance in Rice: A Comparative Transcriptional Profiling of the Contrasting Genotypes. Rice 2019,12, 13. [CrossRef]
69. Ferreira, L.J.; Azevedo, V.; Maroco, J.; Oliveira, M.M.; Santos, A.P. Salt Tolerant and Sensitive Rice Varieties Display DifferentialMethylome Flexibility under Salt Stress. PLoS ONE 2015, 10, e0124060. [CrossRef] [PubMed]
70. Jehanzeb, M.; Zheng, X.; Miao, Y. The Role of the S40 Gene Family in Leaf Senescence. Int. J. Mol. Sci. 2017, 18, 2152. [CrossRef][PubMed]
71. Zheng, X.; Jehanzeb, M.; Habiba; Zhang, Y.; Li, L.; Miao, Y. Characterization of S40-like Proteins and Their Roles in Response toEnvironmental Cues and Leaf Senescence in Rice. BMC Plant Biol. 2019, 19, 174. [CrossRef] [PubMed]
72. Liu, L.; Zhou, Y.; Zhou, G.; Ye, R.; Zhao, L.; Li, X.; Lin, Y. Identification of Early Senescence-Associated Genes in Rice Flag Leaves.Plant Mol. Biol. 2008, 67, 37–55. [CrossRef] [PubMed]
73. Molla, K.A.; Debnath, A.B.; Ganie, S.A.; Mondal, T.K. Identification and Analysis of Novel Salt Responsive Candidate Gene BasedSSRs (CgSSRs) from Rice (Oryza Sativa L.). BMC Plant Biol. 2015, 15, 122. [CrossRef] [PubMed]
74. Gao, P.; Bai, X.; Yang, L.; Lv, D.; Li, Y.; Cai, H.; Ji, W.; Guo, D.; Zhu, Y. Over-Expression of Osa-MIR396c Decreases Salt and AlkaliStress Tolerance. Planta 2010, 231, 991–1001. [CrossRef]
75. Huang, X.; Feng, J.; Wang, R.; Zhang, H.; Huang, J. Comparative Analysis of MicroRNAs and Their Targets in the Roots of TwoCultivars with Contrasting Salt Tolerance in Rice (Oryza Sativa L.). Plant Growth Regul. 2019, 87, 139–148. [CrossRef]
76. Qin, J.; Ma, X.; Tang, Z.; Meng, Y. Construction of Regulatory Networks Mediated by Small RNAs Responsive to Abiotic Stressesin Rice (Oryza Sativa). Comput. Biol. Chem. 2015, 58, 69–80. [CrossRef]
77. Huda, K.K.; Yadav, S.; Banu, M.S.A.; Trivedi, D.K.; Tuteja, N. Genome-Wide Analysis of Plant-Type II Ca2+ ATPases Gene Familyfrom Rice and Arabidopsis: Potential Role in Abiotic Stresses. Plant Physiol. Biochem. 2013, 65, 32–47. [CrossRef]
78. Chen, H.; Dai, X.J.; Gu, Z.Y. OsbZIP33 Is an ABA-Dependent Enhancer of Drought Tolerance in Rice. Crop Sci. 2015, 55, 1673–1685.[CrossRef]
79. Chapagain, S.; Park, Y.C.; Kim, J.H.; Jang, C.S. Oryza Sativa Salt-Induced RING E3 Ligase 2 (OsSIRP2) Acts as a Positive Regulatorof Transketolase in Plant Response to Salinity and Osmotic Stress. Planta 2018, 247, 925–939. [CrossRef] [PubMed]
80. Lin, D.; Jiang, Q.; Ma, X.; Zheng, K.; Gong, X.; Teng, S.; Xu, J.; Dong, Y. Rice TSV3 Encoding Obg-Like GTPase Protein Is Essentialfor Chloroplast Development during the Early Leaf Stage under Cold Stress. Genes Genomes Genet. 2018, 8, 253–263. [CrossRef][PubMed]
81. Boonchai, C.; Udomchalothorn, T.; Sripinyowanich, S.; Comai, L.; Buaboocha, T.; Chadchawan, S. Rice Overexpressing OsNUC1-SReveals Differential Gene Expression Leading to Yield Loss Reduction after Salt Stress at the Booting Stage. Int. J. Mol. Sci. 2018,19, 3936. [CrossRef]
82. Sripinyowanich, S.; Chamnanmanoontham, N.; Udomchalothorn, T.; Maneeprasopsuk, S.; Santawee, P.; Buaboocha, T.; Qu, L.-J.;Gu, H.; Chadchawan, S. Overexpression of a Partial Fragment of the Salt-Responsive Gene OsNUC1 Enhances Salt Adaptation inTransgenic Arabidopsis Thaliana and Rice (Oryza Sativa L.) during Salt Stress. Plant Sci. 2013, 213, 67–78. [CrossRef]
83. Ahn, J.C.; Kim, D.-W.; You, Y.N.; Seok, M.S.; Park, J.M.; Hwang, H.; Kim, B.-G.; Luan, S.; Park, H.-S.; Cho, H.S. Classification ofRice (Oryza Sativa l. Japonica Nipponbare) Immunophilins (Fkbps, Cyps) and Expression Patterns under Water Stress. BMCPlant Biol. 2010, 10, 253. [CrossRef] [PubMed]
84. Xue, T.; Wang, D.; Zhang, S.; Ehlting, J.; Ni, F.; Jakab, S.; Zheng, C.; Zhong, Y. Genome-Wide and Expression Analysis of ProteinPhosphatase 2C in Rice and Arabidopsis. BMC Genomics 2008, 9, 550. [CrossRef] [PubMed]
85. Zhou, F.; Wang, C.-Y.; Gutensohn, M.; Jiang, L.; Zhang, P.; Zhang, D.; Dudareva, N.; Lu, S. A Recruiting Protein of GeranylgeranylDiphosphate Synthase Controls Metabolic Flux toward Chlorophyll Biosynthesis in Rice. Proc. Natl. Acad. Sci. USA 2017, 114,6866–6871. [CrossRef] [PubMed]
86. Giri, J.; Vij, S.; Dansana, P.K.; Tyagi, A.K. Rice A20/AN1 Zinc-Finger Containing Stress-Associated Proteins (SAP1/11) and aReceptor-like Cytoplasmic Kinase (OsRLCK253) Interact via A20 Zinc-Finger and Confer Abiotic Stress Tolerance in TransgenicArabidopsis Plants. New Phytol. 2011, 191, 721–732. [CrossRef] [PubMed]
87. Goswami, K.; Tripathi, A.; Sanan-Mishra, N. Comparative MiRomics of Salt-Tolerant and Salt-Sensitive Rice. J. Integr. Bioinform.2017, 14. [CrossRef] [PubMed]
162
Plants 2021, 10, 1088
88. Pradhan, S.K.; Pandit, E.; Nayak, D.K.; Behera, L.; Mohapatra, T. Genes, Pathways and Transcription Factors Involved in SeedlingStage Chilling Stress Tolerance in Indica Rice through RNA-Seq Analysis. BMC Plant Biol. 2019, 19, 352. [CrossRef]
89. Lakmini, W.G. The Role of SENSITIVE TO FREEZING6 (SFR6) in Plant Tolerance to Stress. In Durham Theses; Durham University:Durham, UK, 2010.
90. Senadheera, P.; Maathuis, F.J.M. Differentially Regulated Kinases and Phosphatases in Roots May Contribute to Inter-CultivarDifference in Rice Salinity Tolerance. Plant Signal. Behav. 2009, 4, 1163–1165. [CrossRef]
91. Liao, Y.; Hu, C.; Zhang, X.; Cao, X.; Xu, Z.; Gao, X.; Li, L.; Zhu, J.; Chen, R. Isolation of a Novel Leucine-Rich Repeat Receptor-likeKinase (OsLRR2) Gene from Rice and Analysis of Its Relation to Abiotic Stress Responses. Biotechnol. Biotechnol. Equip. 2017, 31,51–57. [CrossRef]
92. Luan, W.; Shen, A.; Jin, Z.; Song, S.; Li, Z.; Sha, A. Knockdown of OsHox33, a Member of the Class III Homeodomain-LeucineZipper Gene Family, Accelerates Leaf Senescence in Rice. Sci. China Life Sci. 2013, 56, 1113–1123. [CrossRef] [PubMed]
93. Yu, J.; Zao, W.; He, Q.; Kim, T.-S.; Park, Y.-J. Genome-Wide Association Study and Gene Set Analysis for Understanding CandidateGenes Involved in Salt Tolerance at the Rice Seedling Stage. Mol. Genet. Genom. 2017, 292, 1391–1403. [CrossRef] [PubMed]
94. Vij, S.; Giri, J.; Dansana, P.K.; Kapoor, S.; Tyagi, A.K. The Receptor-like Cytoplasmic Kinase (OsRLCK) Gene Family in Rice:Organization, Phylogenetic Relationship, and Expression during Development and Stress. Mol. Plant 2008, 1, 732–750. [CrossRef]
95. Hedayati, P.; Monfard, H.H.; Isa, N.M.; Hwang, D.J.; Zain, C.R.C.M.; Uddin, M.I.; Zuraida, A.R.; Ismail, I.; Zainal, Z. Constructionand Analysis of an Oryza Sativa (Cv. MR219) Salinity-Related CDNA Library. Acta Physiol. Plant. 2015, 37, 91. [CrossRef]
96. Gómez-Ariza, J.; Brambilla, V.; Vicentini, G.; Landini, M.; Cerise, M.; Carrera, E.; Shrestha, R.; Chiozzotto, R.; Galbiati, F.; Caporali,E.; et al. A Transcription Factor Coordinating Internode Elongation and Photoperiodic Signals in Rice. Nat. Plants 2019, 5, 358–362.[CrossRef]
97. Zhang, Z.; Liu, H.; Sun, C.; Ma, Q.; Bu, H.; Chong, K.; Xu, Y. A C2H2 Zinc-Finger Protein OsZFP213 Interacts with OsMAPK3 toEnhance Salt Tolerance in Rice. J. Plant Physiol. 2018, 229, 100–110. [CrossRef]
98. Flowers, T.J.; Yeo, A.R. Variability in the Resistance of Sodium Chloride Salinity within Rice (Oryza Sativa L.) Varieties. NewPhytol. 1981, 88, 363–373. [CrossRef]
99. Lutts, S.; Kinet, J.M.; Bouharmont, J. Changes in plant response to NaCl during development of rice (Oryza sativa L.) varietiesdiffering in salinity resistance. J. Exp. Bot. 1995, 46, 1843–1852. [CrossRef]
100. Gregorio, G.B.; Senadhira, D.; Mendoza, R.D. Screening Rice for Salinity Tolerance; IRRl Discussion Paper Series; IRRI: Los Banos,Philippines, 1997; pp. 2–23.
101. Lee, K.-S.; Choi, W.-Y.; Ko, J.-C.; Kim, T.-S.; Gregorio, G.B. Salinity Tolerance of Japonica and Indica Rice (Oryza Sativa L.) at theSeedling Stage. Planta 2003, 216, 1043–1046. [CrossRef] [PubMed]
102. Neang, S.; de Ocampo, M.; Egdane, J.A.; Platten, J.D.; Ismail, A.M.; Seki, M.; Suzuki, Y.; Skoulding, N.S.; Kano-Nakata, M.;Yamauchi, A.; et al. A GWAS Approach to Find SNPs Associated with Salt Removal in Rice Leaf Sheath. Ann. Bot. 2020, 126,1193–1202. [CrossRef] [PubMed]
103. Negrão, S.; Schmöckel, S.M.; Tester, M. Evaluating Physiological Responses of Plants to Salinity Stress. Ann. Bot. 2017, 119, 1–11.[CrossRef] [PubMed]
104. Verslues, P.E.; Agarwal, M.; Katiyar-Agarwal, S.; Zhu, J.; Zhu, J.-K. Methods and Concepts in Quantifying Resistance to Drought,Salt and Freezing, Abiotic Stresses That Affect Plant Water Status. Plant J. 2006, 45, 523–539. [CrossRef]
105. Zhu, J.-K. Regulation of Ion Homeostasis under Salt Stress. Curr. Opin. Plant Biol. 2003, 6, 441–445. [CrossRef]106. Chakraborty, K.; Chattaopadhyay, K.; Nayak, L.; Ray, S.; Yeasmin, L.; Jena, P.; Gupta, S.; Mohanty, S.K.; Swain, P.; Sarkar, R.K.
Ionic Selectivity and Coordinated Transport of Na+ and K+ in Flag Leaves Render Differential Salt Tolerance in Rice at theReproductive Stage. Planta 2019, 250, 1637–1653. [CrossRef]
107. Gregorio, G.B.; Senadhira, D. Genetic Analysis of Salinity Tolerance in Rice (Oryza Sativa L.). Theoret. Appl. Genet. 1993, 86,333–338. [CrossRef] [PubMed]
108. Moradi, F.; Ismail, A.M. Responses of Photosynthesis, Chlorophyll Fluorescence and ROS-Scavenging Systems to Salt Stressduring Seedling and Reproductive Stages in Rice. Ann. Bot. 2007, 99, 1161–1173. [CrossRef]
109. Yeo, A.R.; Yeo, M.E.; Flowers, S.A.; Flowers, T.J. Screening of Rice (Oryza Sativa L.) Genotypes for Physiological CharactersContributing to Salinity Resistance, and Their Relationship to Overall Performance. Theoret. Appl. Genet. 1990, 79, 377–384.[CrossRef] [PubMed]
110. Bonilla, P.; Dvorak, J.; Mackill, D.; Deal, K.; Gregorio, G. RFLP and SSLP Mapping of Salinity Tolerance Genes in Chromosome 1of Rice (Oryza Sativa L.) Using Recombinant Inbred Lines. Philipp. Agric. Sci. 2002, 85, 68–76.
111. Gregorio, G.B. Tagging Salinity Tolerance Genes in Rice Using Amplified Fragment Length Polymorphism (AFLP); University of thePhilippines: Los Baños, Philippines, 1997.
112. To, H.T.M.; Nguyen, H.T.; Dang, N.T.M.; Nguyen, N.H.; Bui, T.X.; Lavarenne, J.; Phung, N.T.P.; Gantet, P.; Lebrun, M.; Bellafiore,S.; et al. Unraveling the Genetic Elements Involved in Shoot and Root Growth Regulation by Jasmonate in Rice Using aGenome-Wide Association Study. Rice 2019, 12, 69. [CrossRef]
113. Baillo, E.H.; Kimotho, R.N.; Zhang, Z.; Xu, P. Transcription Factors Associated with Abiotic and Biotic Stress Tolerance and TheirPotential for Crops Improvement. Genes 2019, 10, 771. [CrossRef]
114. Srivastava, A.K.; Zhang, C.; Yates, G.; Bailey, M.; Brown, A.; Sadanandom, A. SUMO Is a Critical Regulator of Salt StressResponses in Rice. Plant Physiol. 2016, 170, 2378–2391. [CrossRef]
163
Plants 2021, 10, 1088
115. Srivastava, A.K.; Zhang, C.; Caine, R.S.; Gray, J.; Sadanandom, A. Rice SUMO Protease Overly Tolerant to Salt 1 Targets theTranscription Factor, OsbZIP23 to Promote Drought Tolerance in Rice. Plant J. 2017, 92, 1031–1043. [CrossRef]
116. Kamal; Alnor Gorafi; Abdelrahman; Abdellatef; Tsujimoto Stay-Green Trait: A Prospective Approach for Yield Potential, andDrought and Heat Stress Adaptation in Globally Important Cereals. IJMS 2019, 20, 5837. [CrossRef]
117. Li, J.; Wen, J.; Lease, K.A.; Doke, J.T.; Tax, F.E.; Walker, J.C. BAK1, an Arabidopsis LRR Receptor-like Protein Kinase, Interactswith BRI1 and Modulates Brassinosteroid Signaling. Cell 2002, 110, 213–222. [CrossRef]
118. Wang, X. Brassinosteroids Regulate Dissociation of BKI1, a Negative Regulator of BRI1 Signaling, from the Plasma Membrane.Science 2006, 313, 1118–1122. [CrossRef]
119. Jang, S.; Li, H.-Y. Oryza Sativa BRASSINOSTEROID UPREGULATED1 LIKE1 Induces the Expression of a Gene Encoding a SmallLeucine-Rich-Repeat Protein to Positively Regulate Lamina Inclination and Grain Size in Rice. Front. Plant Sci. 2017, 8, 1253.[CrossRef]
120. Shang, Y.; Dai, C.; Lee, M.M.; Kwak, J.M.; Nam, K.H. BRI1-Associated Receptor Kinase 1 Regulates Guard Cell ABA SignalingMediated by Open Stomata 1 in Arabidopsis. Mol. Plant 2016, 9, 447–460. [CrossRef] [PubMed]
121. Arnon, D.I. Copper Enzymes in Isolated Chloroplasts. Polyphenoloxidase in Beta Vulgaris. Plant Physiol. 1949, 24, 1–15.[CrossRef] [PubMed]
164
plants
Article
Morphological Analysis, Protein Profiling and ExpressionAnalysis of Auxin Homeostasis Genes of Roots of TwoContrasting Cultivars of Rice Provide Inputs on MechanismsInvolved in Rice Adaptation towards Salinity Stress
Shivani Saini 1, Navdeep Kaur 1, Deeksha Marothia 1, Baldev Singh 1, Varinder Singh 1, Pascal Gantet 2,3,*
and Pratap Kumar Pati 1,*
Citation: Saini, S.; Kaur, N.;
Marothia, D.; Singh, B.; Singh, V.;
Gantet, P.; Pati, P.K. Morphological
Analysis, Protein Profiling and
Expression Analysis of Auxin
Homeostasis Genes of Roots of Two
Contrasting Cultivars of Rice Provide
Inputs on Mechanisms Involved in
Rice Adaptation towards Salinity
Stress. Plants 2021, 10, 1544.
https://doi.org/10.3390/plants10081544
Academic Editors: Igor G. Loskutov
and Masayuki Fujita
Received: 15 April 2021
Accepted: 24 July 2021
Published: 28 July 2021
Publisher’s Note: MDPI stays neutral
with regard to jurisdictional claims in
published maps and institutional affil-
iations.
Copyright: © 2021 by the authors.
Licensee MDPI, Basel, Switzerland.
This article is an open access article
distributed under the terms and
conditions of the Creative Commons
Attribution (CC BY) license (https://
creativecommons.org/licenses/by/
4.0/).
1 Department of Biotechnology, Guru Nanak Dev University, Amritsar 143005, Punjab, India;[email protected] (S.S.); [email protected] (N.K.); [email protected] (D.M.);[email protected] (B.S.); [email protected] (V.S.)
2 Université de Montpellier, UMR DIADE, Centre de Recherche de l’IRD, Avenue Agropolis, BP 64501,CEDEX 5, 34394 Montpellier, France
3 Centre of the Region Haná for Biotechnological and Agricultural Research, Department of Molecular Biology,Palacký University Olomouc, Šlechtitelu 27, 783 71 Olomouc, Czech Republic
* Correspondence: [email protected] (P.G.); [email protected] (P.K.P.)
Abstract: Plants remodel their root architecture in response to a salinity stress stimulus. This processis regulated by an array of factors including phytohormones, particularly auxin. In the presentstudy, in order to better understand the mechanisms involved in salinity stress adaptation in rice, wecompared two contrasting rice cultivars—Luna Suvarna, a salt tolerant, and IR64, a salt sensitivecultivar. Phenotypic investigations suggested that Luna Suvarna in comparison with IR64 presentedstress adaptive root traits which correlated with a higher accumulation of auxin in its roots. Theexpression level investigation of auxin signaling pathway genes revealed an increase in severalauxin homeostasis genes transcript levels in Luna Suvarna compared with IR64 under salinity stress.Furthermore, protein profiling showed 18 proteins that were differentially regulated between theroots of two cultivars, and some of them were salinity stress responsive proteins found exclusively inthe proteome of Luna Suvarna roots, revealing the critical role of these proteins in imparting salinitystress tolerance. This included proteins related to the salt overly sensitive pathway, root growth, thereactive oxygen species scavenging system, and abscisic acid activation. Taken together, our resultshighlight that Luna Suvarna involves a combination of morphological and molecular traits of theroot system that could prime the plant to better tolerate salinity stress.
Keywords: rice; abiotic stress; salinity; root; auxin; YUCCA; PIN; proteomics; mass spectrometry
1. Introduction
The plant root is the vital organ that serves a wide range of functions and regulatescrop productivity. As roots are in direct interface with the soil, they act as the primarysite for perceiving environmental stress-related signals for plants [1,2]. Among variousenvironmental stresses, salinity has emerged as one of the most serious threats limitingglobal crop production and yield [3]. Currently, almost 20% of the world’s total irrigatedland is estimated to be affected by salinity stress and it is expected that by the end of theyear 2050, more than 50% of the world’s arable land will become saline [4–7]. High soilsalinity induces undesirable changes at phenotypic, biochemical, physiological, cellular,genetic and molecular levels, which are detrimental to plant growth and survival [8]. Theroot system responds to abiotic stresses by triggering stress adaptive mechanisms, whichare supposed to be regulated by a number of factors [2,9,10].
The potential of several phytohormones to ameliorate the damaging effects of salinitystress has attracted the attention of researchers in the recent past [11,12]. Among different
Plants 2021, 10, 1544. https://doi.org/10.3390/plants10081544 https://www.mdpi.com/journal/plants
165
Plants 2021, 10, 1544
phytohormones, auxin is an important plant hormone well-known for controlling the dif-ferent aspects of plant growth and development including tropistic growth, vascular tissuedifferentiation, auxiliary bud formation, cell elongation, flower organ development andabiotic stress tolerance [13–16]. It has also been regarded as a master player in triggeringsalinity stress-induced changes in root system architecture [12]. Auxin regulates the rootgrowth rates by promoting lateral root formation and mediating the size of root meristemby controlling the transition from cell division to cell differentiation processes [17,18].The processes that determine the spatiotemporal distribution of auxin and the mainte-nance of auxin homeostasis required for root growth and development include local auxinbiosynthesis, transport, perception, signaling, conjugation and degradation [19,20].
Although roots are the critical site for the perception of salinity stress signals andare responsible for triggering stress-related mechanisms in plants, very little attention hasbeen paid to analyzing this underground part of the plant in the context of understandingsalinity tolerance. Physiological, biochemical and genetic studies have provided ampleevidence in support of the key role of auxin in triggering abiotic stress-mediated differentialmodifications in the root system architecture of plants [21]. The key role of the maintenanceof auxin homeostasis in regulating salinity stress tolerance is emerging in plant biology [22].In the present study, in order to better understand the mechanisms conferring rice adapta-tion to salinity stress, we conducted a comparative analysis of various auxin-related genes(which regulate auxin homeostasis) in the roots of salt sensitive IR64 and salt tolerant LunaSuvarna (LS) cultivars of rice under optimal as well as salinity stress conditions. Further,the endogenous content of indole-3-acetic acid (IAA) has also been estimated in the rootsof two contrasting salinity stress cultivars of rice, and an analysis of their root morphologyhas been performed.
For finding significant clues on the adaptive behavior of plants to salinity stresses,studies at the protein level might be a better option compared to at the transcript levelsince many post-transcriptional and post-translational changes often take place in plantsand hence, the rate of transcription and the translation will not necessarily always corre-late. Hence, proteome-based approaches involving two-dimensional gel electrophoresis(2-DE) and mass spectrometry (MS) are often utilized for unraveling proteins associatedwith induced changes in plants as they are very reliable, sensitive and powerful tech-nologies [9,23]. For example, a comparative study of the leaf proteome profiles of thewild salt tolerant Poaceae species Porteresia coarctata with two rice cultivars variable insalt sensitivity—IR64 (salt-sensitive) and Pokkali (salt-tolerant)—suggested that, in theleaves of Porteresia coarctata, several proteins exhibited up-regulation that could provide ita physiological advantage under salinity stress [24]. However, there are limited reportson a comparative proteome analysis of the root of contrasting salt-responsive cultivars ofrice. Therefore, herein a comparison of the root proteome of two rice cultivars differingin salt tolerance has been conducted using 2-DE and MS. Our results showed that salttolerant rice cultivar LS has better stress adaptive root traits, elevated expression of auxinhomeostasis genes and more endogenous IAA content than IR64 cultivar, which could belinked to the acquisition of natural salinity stress tolerance in LS. Further, several salinitystress responsive proteins were detected exclusively in the roots of LS, which might beproviding a peculiar property for attaining salinity stress adaptation and tolerance in rice.
2. Results
2.1. Analysis of Morphological Parameters and IAA Quantification in IR64 and LS
The differences in the morphological parameters of the two cultivars were clearlyobservable when cultivated in normal conditions (Figure 1A,B). An approximately 40%increase in the length of shoot and a 70% longer roots were observed in the salt-tolerantcultivar, LS, as compared to the sensitive cultivar IR64 (Figure 1A–C,F). The number ofroots (primary root and crown roots) was also found to be 169% more in LS (Figure 1G).Moreover, an increase in the fresh weight of shoots and roots by 101% and 137% respectively,was noticed in LS (Figure 1D,H). Similarly, an approximately 122% and 170% enhancement
166
Plants 2021, 10, 1544
in the dry weight of shoots and roots in the tolerant cultivar, respectively, was observed inLS with respect to IR64 (Figure 1E,I). The amount of endogenous IAA was also quantified inthe roots of IR64 and LS. It was observed that in LS roots, the endogenous IAA concentrationwas significantly higher (1.086 μg/gFW) as compared to IR64 roots (0.6608 μg/gFW)(Figure 1J).
2.2. Expression Analysis of Genes Involved in Auxin Homeostasis in IR64 and LS Roots
To better understand the cause of the differences observed in the IAA content in theroots of both cultivars, the transcript levels of various genes involved in auxin homeostasiswere measured by qRT-PCR under optimal and salinity stress conditions. Among variousauxin biosynthesis genes, the transcript levels of OsYUCCA5, OsYUCCA7, and OsYUCCA8exhibited significant up-regulation of 2.79, 3.53, and 2.58 fold, respectively, in the roots ofthe salt-tolerant cultivar LS as compared to the salt-sensitive cultivar IR64 of rice undernormal conditions (Figure 2A). In response to salinity stress, significant down-regulationof OsYUCCA3, OsYUCCA4, OsYUCCA6, OsYUCCA7, and OsYUCCA9 by 0.43, 0.15, 0.18,0.27, and 0.39 fold was observed in IR64 with respect to the control (Figure 2A). In theLS cultivar, auxin biosynthesis genes OsYUCCA3, OsYUCCA4, OsYUCCA5, OsYUCCA6,OsYUCCA7, and OsYUCCA9 exhibited significant up-regulation by 2.83, 2.79, 7.88, 6.75,4.53 and 3.07 fold, respectively, in the roots upon salinity stress with respect to the IR64(control) (Figure 2A). On the contrary, the expression level of OsYUCCA1 and OsYUCCA8exhibited significant down-regulation by 0.41 and 0.75 fold, respectively, in the LS rootcompared to the control (Figure 2A). The transcript levels of OsYUCCA2 did not show anysignificant difference in two contrasting salinity stress responsive cultivars of rice undernormal and salinity stress conditions.
Among different auxin efflux transporter OsPIN genes, OsPIN2, OsPIN5a, and Os-PIN5b exhibited higher transcript level accumulation of 1.95, 2.36, and 2.46 fold, respectively,in the roots of untreated LS as compared to the IR64 (Figure 2B). On the contrary, significantdown-regulation in the expression of OsPIN1b, that is, 0.48, was found in the roots of LSas compared to the salt-sensitive cultivar IR64 of rice (Figure 2B). In response to salinitystress in the IR64 cultivar, significant down-regulation of OsPIN1a and OsPIN2 by 0.28 and0.23 fold, respectively, was observed as compared to the control. The expression of auxinefflux transporters OsPIN1a, OsPIN1b, OsPIN2, OsPIN3a, and OsPIN5b was up-regulated by4.51, 1.62, 5.46, 1.42, and 1.54 fold, respectively, in the roots of the LS cultivar under salinitystress as compared to the untreated IR64 control (Figure 2B). However, the transcript levelsof OsPIN1c and OsPIN1d did not show any significant differences between the two cultivarsin response to control or salinity stress conditions (Figure 2B). Under the effect of salinitystress, OsPIN5a and OsPIN9 exhibited down-regulation by 0.85 and 0.33 fold, respectively,in LS than the roots of the control (Figure 2B).
167
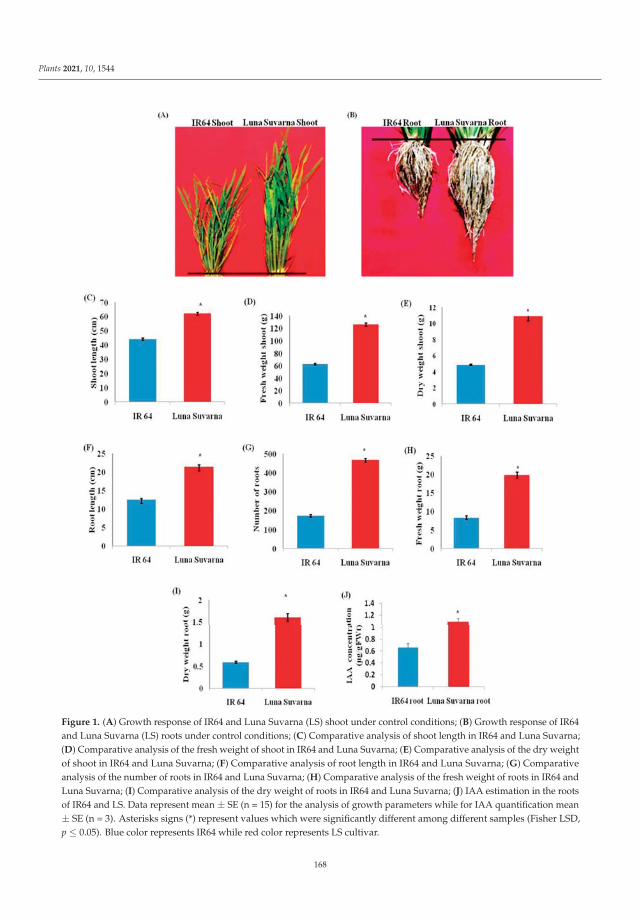
Plants 2021, 10, 1544
Figure 1. (A) Growth response of IR64 and Luna Suvarna (LS) shoot under control conditions; (B) Growth response of IR64and Luna Suvarna (LS) roots under control conditions; (C) Comparative analysis of shoot length in IR64 and Luna Suvarna;(D) Comparative analysis of the fresh weight of shoot in IR64 and Luna Suvarna; (E) Comparative analysis of the dry weightof shoot in IR64 and Luna Suvarna; (F) Comparative analysis of root length in IR64 and Luna Suvarna; (G) Comparativeanalysis of the number of roots in IR64 and Luna Suvarna; (H) Comparative analysis of the fresh weight of roots in IR64 andLuna Suvarna; (I) Comparative analysis of the dry weight of roots in IR64 and Luna Suvarna; (J) IAA estimation in the rootsof IR64 and LS. Data represent mean ± SE (n = 15) for the analysis of growth parameters while for IAA quantification mean± SE (n = 3). Asterisks signs (*) represent values which were significantly different among different samples (Fisher LSD,p ≤ 0.05). Blue color represents IR64 while red color represents LS cultivar.
168
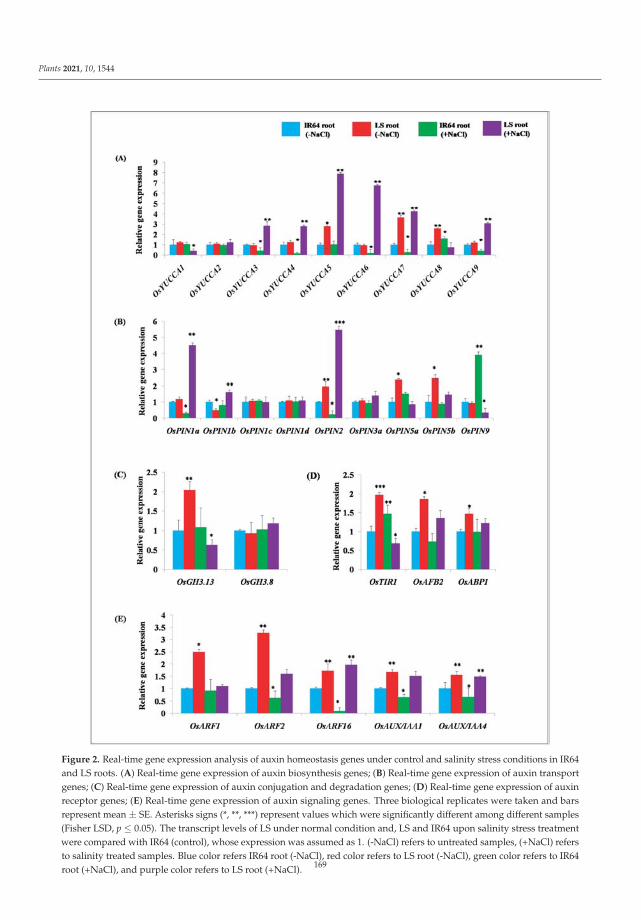
Plants 2021, 10, 1544
Figure 2. Real-time gene expression analysis of auxin homeostasis genes under control and salinity stress conditions in IR64and LS roots. (A) Real-time gene expression of auxin biosynthesis genes; (B) Real-time gene expression of auxin transportgenes; (C) Real-time gene expression of auxin conjugation and degradation genes; (D) Real-time gene expression of auxinreceptor genes; (E) Real-time gene expression of auxin signaling genes. Three biological replicates were taken and barsrepresent mean ± SE. Asterisks signs (*, **, ***) represent values which were significantly different among different samples(Fisher LSD, p ≤ 0.05). The transcript levels of LS under normal condition and, LS and IR64 upon salinity stress treatmentwere compared with IR64 (control), whose expression was assumed as 1. (-NaCl) refers to untreated samples, (+NaCl) refersto salinity treated samples. Blue color refers IR64 root (-NaCl), red color refers to LS root (-NaCl), green color refers to IR64root (+NaCl), and purple color refers to LS root (+NaCl). 169
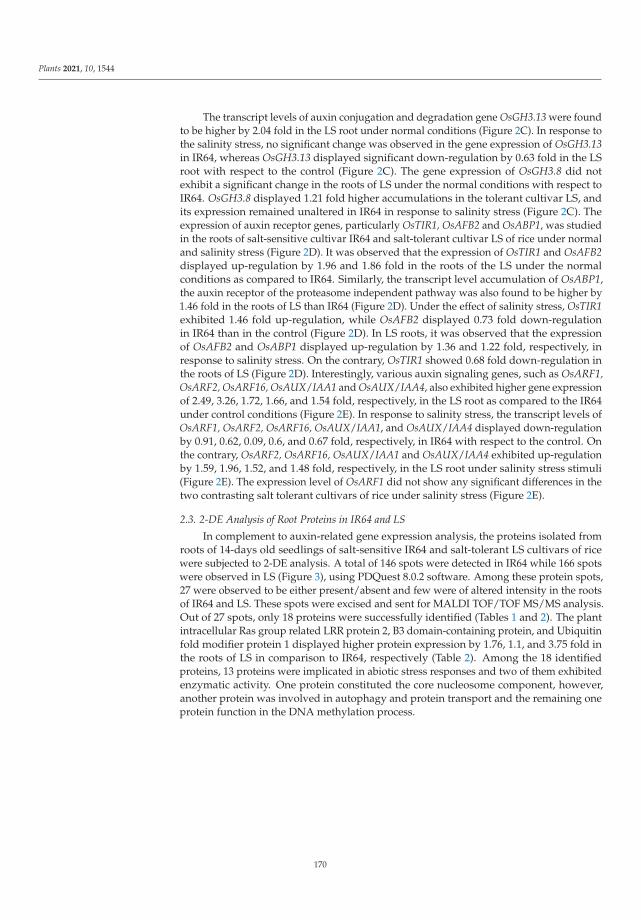
Plants 2021, 10, 1544
The transcript levels of auxin conjugation and degradation gene OsGH3.13 were foundto be higher by 2.04 fold in the LS root under normal conditions (Figure 2C). In response tothe salinity stress, no significant change was observed in the gene expression of OsGH3.13in IR64, whereas OsGH3.13 displayed significant down-regulation by 0.63 fold in the LSroot with respect to the control (Figure 2C). The gene expression of OsGH3.8 did notexhibit a significant change in the roots of LS under the normal conditions with respect toIR64. OsGH3.8 displayed 1.21 fold higher accumulations in the tolerant cultivar LS, andits expression remained unaltered in IR64 in response to salinity stress (Figure 2C). Theexpression of auxin receptor genes, particularly OsTIR1, OsAFB2 and OsABP1, was studiedin the roots of salt-sensitive cultivar IR64 and salt-tolerant cultivar LS of rice under normaland salinity stress (Figure 2D). It was observed that the expression of OsTIR1 and OsAFB2displayed up-regulation by 1.96 and 1.86 fold in the roots of the LS under the normalconditions as compared to IR64. Similarly, the transcript level accumulation of OsABP1,the auxin receptor of the proteasome independent pathway was also found to be higher by1.46 fold in the roots of LS than IR64 (Figure 2D). Under the effect of salinity stress, OsTIR1exhibited 1.46 fold up-regulation, while OsAFB2 displayed 0.73 fold down-regulationin IR64 than in the control (Figure 2D). In LS roots, it was observed that the expressionof OsAFB2 and OsABP1 displayed up-regulation by 1.36 and 1.22 fold, respectively, inresponse to salinity stress. On the contrary, OsTIR1 showed 0.68 fold down-regulation inthe roots of LS (Figure 2D). Interestingly, various auxin signaling genes, such as OsARF1,OsARF2, OsARF16, OsAUX/IAA1 and OsAUX/IAA4, also exhibited higher gene expressionof 2.49, 3.26, 1.72, 1.66, and 1.54 fold, respectively, in the LS root as compared to the IR64under control conditions (Figure 2E). In response to salinity stress, the transcript levels ofOsARF1, OsARF2, OsARF16, OsAUX/IAA1, and OsAUX/IAA4 displayed down-regulationby 0.91, 0.62, 0.09, 0.6, and 0.67 fold, respectively, in IR64 with respect to the control. Onthe contrary, OsARF2, OsARF16, OsAUX/IAA1 and OsAUX/IAA4 exhibited up-regulationby 1.59, 1.96, 1.52, and 1.48 fold, respectively, in the LS root under salinity stress stimuli(Figure 2E). The expression level of OsARF1 did not show any significant differences in thetwo contrasting salt tolerant cultivars of rice under salinity stress (Figure 2E).
2.3. 2-DE Analysis of Root Proteins in IR64 and LS
In complement to auxin-related gene expression analysis, the proteins isolated fromroots of 14-days old seedlings of salt-sensitive IR64 and salt-tolerant LS cultivars of ricewere subjected to 2-DE analysis. A total of 146 spots were detected in IR64 while 166 spotswere observed in LS (Figure 3), using PDQuest 8.0.2 software. Among these protein spots,27 were observed to be either present/absent and few were of altered intensity in the rootsof IR64 and LS. These spots were excised and sent for MALDI TOF/TOF MS/MS analysis.Out of 27 spots, only 18 proteins were successfully identified (Tables 1 and 2). The plantintracellular Ras group related LRR protein 2, B3 domain-containing protein, and Ubiquitinfold modifier protein 1 displayed higher protein expression by 1.76, 1.1, and 3.75 fold inthe roots of LS in comparison to IR64, respectively (Table 2). Among the 18 identifiedproteins, 13 proteins were implicated in abiotic stress responses and two of them exhibitedenzymatic activity. One protein constituted the core nucleosome component, however,another protein was involved in autophagy and protein transport and the remaining oneprotein function in the DNA methylation process.
170
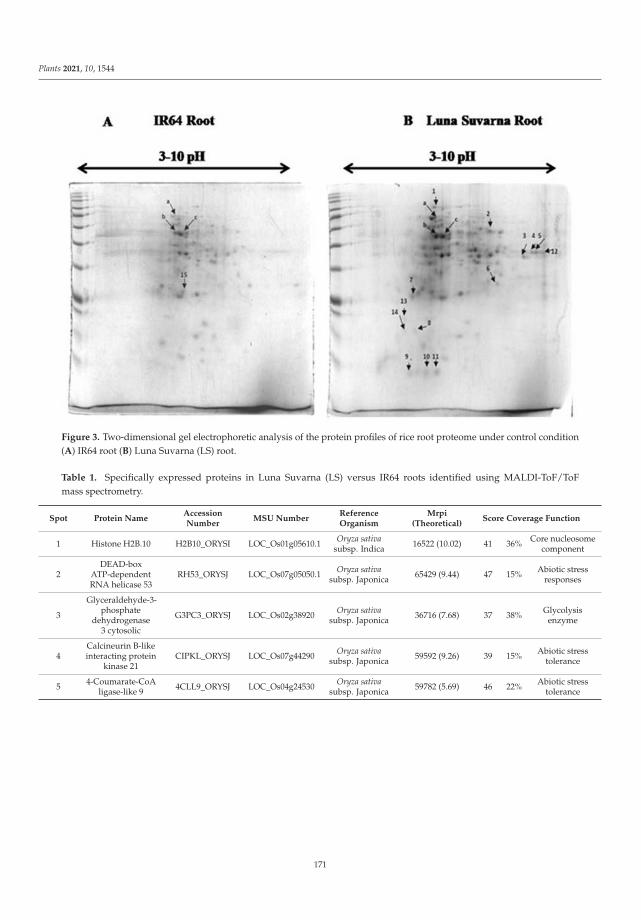
Plants 2021, 10, 1544
Figure 3. Two-dimensional gel electrophoretic analysis of the protein profiles of rice root proteome under control condition(A) IR64 root (B) Luna Suvarna (LS) root.
Table 1. Specifically expressed proteins in Luna Suvarna (LS) versus IR64 roots identified using MALDI-ToF/ToFmass spectrometry.
Spot Protein NameAccessionNumber
MSU NumberReferenceOrganism
Mrpi(Theoretical)
Score Coverage Function
1 Histone H2B.10 H2B10_ORYSI LOC_Os01g05610.1 Oryza sativasubsp. Indica 16522 (10.02) 41 36% Core nucleosome
component
2DEAD-box
ATP-dependentRNA helicase 53
RH53_ORYSJ LOC_Os07g05050.1 Oryza sativasubsp. Japonica 65429 (9.44) 47 15% Abiotic stress
responses
3
Glyceraldehyde-3-phosphate
dehydrogenase3 cytosolic
G3PC3_ORYSJ LOC_Os02g38920 Oryza sativasubsp. Japonica 36716 (7.68) 37 38% Glycolysis
enzyme
4Calcineurin B-likeinteracting protein
kinase 21CIPKL_ORYSJ LOC_Os07g44290 Oryza sativa
subsp. Japonica 59592 (9.26) 39 15% Abiotic stresstolerance
5 4-Coumarate-CoAligase-like 9 4CLL9_ORYSJ LOC_Os04g24530 Oryza sativa
subsp. Japonica 59782 (5.69) 46 22% Abiotic stresstolerance
171
Plants 2021, 10, 1544
Table 1. Cont.
Spot Protein NameAccessionNumber
MSU NumberReferenceOrganism
Mrpi(Theoretical)
Score Coverage Function
6 β-glucosidases 12 BGL12_ORYSJ LOC_Os04g39880 Oryza sativasubsp. Japonica 57713 (8.75) 47 11% Abiotic stress
tolerance
7Ubiquitin-like
proteinautophagy-related
ATG12_ORYSI LOC_Os06g10340 Oryza sativasubsp. Indica 10454/9.05 34 32% Autophagy and
protein transport
8 Phytosulfokines 3 PSK3_ORYSJ LOC_Os03g47230 Oryza sativasubsp. Japonica 8341/5.83 34 29% Abiotic stress
tolerance
9 Cyanate hydratase CYNS_ORYSI LOC_Os10g33270 Oryza sativasubsp. Indica 18653/5.61 33 44% Abiotic stress
tolerance
10Probable protein
arginine N-methyltransferase
ANM3_ORYSI LOC_Os07g44640 Oryza sativasubsp. Indica 69127/4.49 29 13%
Mediatesmethylation
process
11Heat stress
transcription factorB 1
HSFB1_ORYSJ LOC_Os09g28354 Oryza sativasubsp. Japonica 33121/9.35 33 43% Abiotic stress
responses
12Delta 1-pyrroline-5-
carboxylatesynthase
P5CS_ORYSJ LOC_Os05g38150 Oryza sativasubsp. Japonica 78153/6.37 53 14% Abiotic stress
tolerance
13Calcineurin
B-like-interactingprotein kinase 29
CIPKT_ORYSJ LOC_Os07g48090 Oryza sativasubsp. Japonica 48581/8.69 38 44% Abiotic stress
tolerance
14 Minichromosomemaintenance 6 MCM6_ORYSI LOC_Os05g14590 Oryza sativa
subsp. Indica 93168/5.55 43 17% Abiotic stresstolerance
15 UDP-glucose6-dehydrogenase 1 UGDH1_ORYSJ LOC_Os03g31210 Oryza sativa
subsp. Japonica 52834 (5.75) 39 13% Enzymaticfunction
Spots 1–14 were exclusively observed in the case of Luna Suvarna root, whereas spot 15 was differentially less expressed in the IR64 root.
Table 2. Highly expressed proteins in Luna Suvarna (LS) roots as compared to IR64 identified using MALDI-ToF/ToF massspectrometry.
Spot Protein NameAccessionNumber
MSU NumberReferenceOrganism
Mrpi(Theo-retical)
Mrpi(Experimental)
ScoreCoverage Function
a Plant intracellular Ras grouprelated LRR protein 2 PIRL2_ORYSJ LOC_Os02g38040 Oryza sativa
subsp. Japonica 55345/5.51 114.7/5.6 30 27% Abiotic stresstolerant
b Ubiquitin-fold modifier 1 UFM1_ORYSJ LOC_Os01g73140 Oryza sativasubsp. Japonica 10356/9.60 81.67/5.98 30 44% Abiotic stress
tolerant
c B3 domain-containingprotein Y1237_ORYSJ LOC_Os01g52540 Oryza sativa
subsp. Japonica 83749/5.81 118.37/5.71 38 34% Abiotic stresstolerant
Comparative expression analysis of identified stress marker genes (which are knownfor exhibiting tolerance against salinity stress) (Table 3) was performed in the roots ofIR64 and LS under the native condition to complete the results obtained with MS at thetranscript level. The transcript levels of 4-coumarate CoA ligase 9 (CCoA), β-glucosidases 12(β-gluc), phytosulfokines 3 (PSK), and B3 domain-containing protein (B3D) were observed tobe 1.09, 1.02, 3.64, and 1.78 fold higher, respectively, in LS roots compared to IR64 undernormal conditions (Figure 4). However, the gene expression of calcineurin B-like interactingprotein kinase 21 (CIPK), delta-pyrroline-5-carboxylate synthase (P5CS), cyanate hydratase (CHS),DEAD-box ATP-dependent RNA helicases 53 (DEAD), plant intracellular Ras group relatedLRR protein 2 (RAS-LRR), and minichromosome maintenance 6 (MCM6) was 0.69, 0.38, 0.30,0.21, 0.64, and 0.22 fold lower, respectively, in the roots of tolerant cultivar LS (Figure 4)with respect to the salt-sensitive IR64. Under salinity stress, β-gluc and B3D displayedup-regulation of 1.22 and 2.44 fold, respectively, in IR64 roots compared to the control(Figure 4). On the contrary, CIPK, CCoA, PSK, P5CS, CHS, and MCM6 showed lower
172
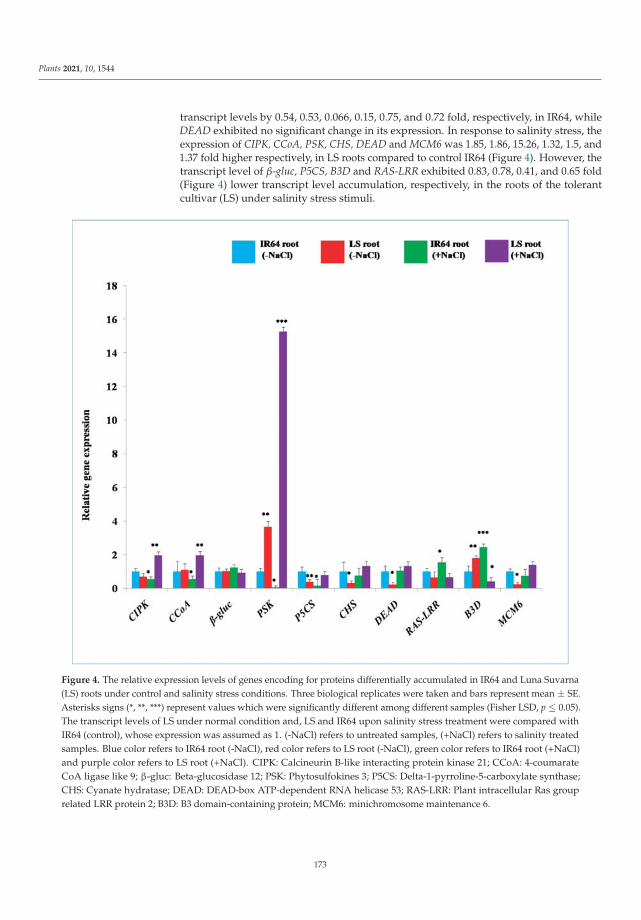
Plants 2021, 10, 1544
transcript levels by 0.54, 0.53, 0.066, 0.15, 0.75, and 0.72 fold, respectively, in IR64, whileDEAD exhibited no significant change in its expression. In response to salinity stress, theexpression of CIPK, CCoA, PSK, CHS, DEAD and MCM6 was 1.85, 1.86, 15.26, 1.32, 1.5, and1.37 fold higher respectively, in LS roots compared to control IR64 (Figure 4). However, thetranscript level of β-gluc, P5CS, B3D and RAS-LRR exhibited 0.83, 0.78, 0.41, and 0.65 fold(Figure 4) lower transcript level accumulation, respectively, in the roots of the tolerantcultivar (LS) under salinity stress stimuli.
Figure 4. The relative expression levels of genes encoding for proteins differentially accumulated in IR64 and Luna Suvarna(LS) roots under control and salinity stress conditions. Three biological replicates were taken and bars represent mean ± SE.Asterisks signs (*, **, ***) represent values which were significantly different among different samples (Fisher LSD, p ≤ 0.05).The transcript levels of LS under normal condition and, LS and IR64 upon salinity stress treatment were compared withIR64 (control), whose expression was assumed as 1. (-NaCl) refers to untreated samples, (+NaCl) refers to salinity treatedsamples. Blue color refers to IR64 root (-NaCl), red color refers to LS root (-NaCl), green color refers to IR64 root (+NaCl)and purple color refers to LS root (+NaCl). CIPK: Calcineurin B-like interacting protein kinase 21; CCoA: 4-coumarateCoA ligase like 9; β-gluc: Beta-glucosidase 12; PSK: Phytosulfokines 3; P5CS: Delta-1-pyrroline-5-carboxylate synthase;CHS: Cyanate hydratase; DEAD: DEAD-box ATP-dependent RNA helicase 53; RAS-LRR: Plant intracellular Ras grouprelated LRR protein 2; B3D: B3 domain-containing protein; MCM6: minichromosome maintenance 6.
173
Plants 2021, 10, 1544
3. Discussion
Plant roots perceive the salinity stress signals and promptly pass them to the shoot toactivate various stress-responsive pathways [1,2,9,10]. Although roots are the importantsite for the perception of salinity stress-related signals, not much attention has been paidto exploring this underground part of the plant in the context of understanding salinitytolerance attributes. In the present study, a positive correlation has been observed betweenthe root system architecture, auxin content, stress marker proteins, and salinity stressadaptation. It was observed that the salinity stress tolerant LS cultivar of rice has a longerprimary root, a larger number of roots and a higher fresh weight and dry weight incomparison to IR64. It is realized that plants acquire deeper roots, more lateral roots, moreroot hair length, and a larger number of roots and its biomass for achieving natural defenseagainst stress conditions including salinity [25–27]. Moreover, it has been demonstratedthat the presence of a larger root/shoot length ratio and a higher root biomass promoted theadaptation of plants towards environmental stresses [24,28]. Thus, the present observationof distinct differences in the root phenotype of LS compared to IR64 could be extrapolatedto the acquisition of adaptive morphological traits that enable LS plants to mitigate salinitystress when exposed.
It is believed that phytohormones are critical signaling molecules that function down-stream of environmental stimuli and regulate various stress adaptive pathways [29]. Inprevious studies, it has been demonstrated that high salinity stress greatly affects root ar-chitecture by inhibiting primary and lateral root growth through altering the accumulationand distribution of the critical phytohormone, auxin [30–33]. Among different auxins, therole of primary auxin IAA is thought to be fundamental as it is the key player in regulatingroot development [34,35]. Thus, in the present work, the endogenous levels of IAA havebeen estimated. Upon analysis, it was observed that LS exhibited significantly higherIAA content compared to IR64 roots. Earlier, it was reported that iaam-OX transgeniclines (with higher endogenous IAA level) and wild-type plants of Arabidopsis pretreatedwith IAA exhibited resistance towards drought stress [15]. However, the triple mutants,yuc1yuc2yuc6, which were deficient in endogenous IAA content, showed decreased resis-tance towards drought stress [15]. Moreover, augmented levels of indole-3-butyric acid(IBA) in growing leaves and higher IAA content in the roots of the highly salt-resistantmaize variety, SR03, were observed in response to salinity stress [32]. It was revealedthat the increased IAA concentration enhanced the accumulation of cell growth-relatedagents, such as β-expansins (involved in cell wall extension), under salinity stress [32,36].In Arabidopsis iar4 mutants, reduced root meristem activity and root growth were reporteddue to diminished auxin distribution in root tips, indicating the key role of auxin in rootgrowth and development [30]. The exogenous application of auxin is also well knownto positively modulate root architecture, especially the lateral root number [15,33,37,38].Thus, the higher endogenous levels of IAA observed in salt tolerant rice cultivar (LS) couldbe considered as one of the prominent reasons for the acquisition of salinity stress adaptiveroot traits observed in the LS cultivar.
It is well realized that the process of auxin-mediated root development is regulated bya complex interplay between auxin metabolism, its signaling and transport leading to thespatio-temporal distribution of auxin [12,39,40]. Thus, to get insights into the moleculardynamics of auxin homeostasis, the transcript-level expression of different genes involvedin the auxin pathway has been analyzed in roots in the present work. Recent studies suggestthat the local biosynthesis of auxin by YUCCA flavin monooxygenases in the roots is theprimary source for normal root development and root gravitropic responses [35]. Moreover,it has been demonstrated that five YUCCA genes—YUCCA3, YUCCA5, YUCCA7, YUCCA8,and YUCCA9—express highly in Arabidopsis roots, playing an essential role in the rootdevelopment [35]. However, the link of YUCCA genes and salinity stress adaptation hasnever been evaluated in rice. Interestingly, in the present study, it was observed that thetranscript level accumulation of different OsYUCCA genes was higher in the roots of LS. Itmight be the primary reason for more auxin biosynthesis and its accumulation in LS roots.
174
Plants 2021, 10, 1544
Further, in response to salinity stress, the transcript level accumulation of OsYUCCA3,OsYUCCA4, OsYUCCA5, OsYUCCA6, OsYUCCA7, and OsYUCCA9 was enhanced in LSroots. In Arabidopsis, YUCCA8 and YUCCA9 have been linked with the development oflateral roots, while their mutants develop shorter primary roots suggesting their key role inthe development of root system architecture [41]. Hence, the present study hints towards alink between OsYUCCA genes mediated enhanced auxin accumulation and subsequentlybetter developed root system architecture for the acquisition of salinity stress tolerancein rice.
Once IAA is biosynthesized, it is transported to the area of its requirement with thehelp of cell-to-cell auxin transport mediated by OsPINs in rice [42]. Earlier, it was foundthat polar auxin transport is affected by osmotic stress caused by increased salinity ordrought [31]. Moreover, flavonoids and phenolic compounds that are accumulated inresponse to stress exposure also inhibit polar auxin transport [43,44]. Interestingly, inthe present study, the transcript levels of auxin efflux carrier genes, such as OsPIN1a,OsPIN2, OsPIN3a, OsPIN5a, and OsPIN5b, were found to be higher in the LS root. More-over, under salinity stress, the expression of auxin transport genes, particularly OsPIN1a,OsPIN1b, OsPIN2, OsPIN3a, and OsPIN5b, was up-regulated in the roots of LS. OsPIN1band OsPIN9 have been suggested to participate in root development in rice, by regulatingauxin-cytokinin interaction [45]. Further, OsPIN2 expresses highly in roots and enhancesshoot to root auxin transport [46]. Thus, the increased expression of such transportergenes in LS roots suggests that salt-tolerant rice cultivar has better capability to maintainauxin homeostasis under salinity stress; however, further investigations are necessary toconsolidate these findings.
The optimum concentration of IAA is maintained in a cell through their conjuga-tion and degradation by OsGH3 genes [47]. Hence, the expression of auxin conjugationand degradation gene OsGH3.13 was analyzed in the roots of salt-sensitive (IR64) andsalt-tolerant cultivar (LS) of rice. It was observed that the expression of OsGH3.13 wassignificantly higher in the roots of LS, which is contradictory to the observed higher IAAcontent in LS. Thus, it can be inferred that the role of the OsYUCCA genes is probably morecritical in regulating auxin content in rice as compared to OsGH3. Further, the analysis ofOsGH3.8 at transcript level suggests no difference in expression level between IR64 and LSroots. However, under salinity stress, the transcript level accumulation of OsGH3.13 wasdown-regulated in the roots of LS compared to IR64. On the contrary, OsGH3.8 exhibitedup-regulation in the root but not to a significant level. It indicates that the lower expres-sion of OsGH3.13 under NaCl application in LS root might be responsible for providingtolerance against salinity stress, probably by enhancing IAA levels.
Various findings have suggested that OsAFB2 and OsTIR1 are the auxin signalingreceptors affected by salinity stress [31,48]. However, their probable role in providinga natural defense against salinity stress has never been evaluated. In the present study,the transcript level accumulation of auxin receptor genes OsTIR1, OsAFB2, and OsABP1were found to be elevated in the roots of LS with respect to IR64 under normal conditions.This identification of the enhanced expression of auxin receptors can be linked to higherauxin content in the roots of LS compared to IR64. Under salinity stress, the expression ofOsTIR1 showed down-regulation in LS roots with respect to control IR64. On the contrary,the transcript levels of OsAFB2 and OsABP1 exhibited up-regulation in the roots of LScompared to IR64 under the salt application. The expression of various auxin signalinggenes, OsARF1, OsARF2, OsARF16, OsAUX/IAA1, and OsAUX/IAA4, was also foundto be higher in the roots of LS compared to IR64 under both control as well as salinitystress conditions, demonstrating elevated endogenous IAA level in LS root comparedto IR64. Previous studies have also linked elevated auxin concentration with increasedauxin transport and downstream signaling genes [49], thus promoting auxin-mediated rootdevelopment. In rice, 31 auxin repressor (OsAUX/IAAs) and 25 auxin activator (OsARFs)genes that participate in auxin signaling were observed to be suppressed by cold, heat anddrought stress [31]. On the contrary, some OsAUX/IAA, such as OsAUX/IAA 6,9,18,19,20
175
Plants 2021, 10, 1544
and 28 and OsARF 4,11,13,14,16,18 and 19, were induced by at least one among cold, heat,and drought stress [31]. Hence, various auxin signaling genes respond differentially toabiotic stresses such as cold, heat and drought [31]. However, to the best of our knowledge,there is no report on the effect of salinity stress on the auxin signaling genes. It has beensuggested that, in Arabidopsis Aux/IAA protein, IAA14 participates in the early stages oflateral root development [50,51]. Hence, the observed elevated expression of AUX/IAA inLS root compared to IR64 might be extrapolated to the salt tolerance and a higher numberof roots detected in the tolerant cultivar.
The comparative proteomics study revealed that some proteins were specificallypresent in the roots of LS compared to IR64. Among these, CIPK21 and CIPK29, the Ca2+
sensing proteins of the CIPK gene family, have been previously linked with the enhancedtolerance against salinity stress conditions in Arabidopsis [52,53]. It was suggested thatsalt overly sensitive 3 (SOS3) encodes for CBL, which functions in sensing the cytosolicCa2+ concentration by directly binding to it [52,54]. The Ca2+ bound CBL proteins directlyactivate their interacting partners, such as CIPK6, which are involved in auxin transport,regulation of root length and lateral root development [52,54]. CIPK6 also enhances thetranscript levels of NAC, PIN2, and P5CS genes, which promote salinity stress resistancein plants [52]. P5CS protein, which is involved in proline biosynthesis, was also observedto show increased levels in LS roots in the current study. Proline is involved in themaintenance of cell turgor or osmotic balance, stabilizing membranes to prevent theleakage of electrolytes, and regulates reactive oxygen species (ROS) homeostasis [55,56].Thus, it can be supposed that the increased levels of an enzyme involved in prolinebiosynthesis could be responsible for enhancing the proline content in the LS roots thathas been previously linked to salinity tolerance [2]. In LS roots, a higher abundance oflignin biosynthesis protein, CCoA, was also observed. There is evidence that salinitystress causes increased lignification of the cell wall through maintaining the structuralrigidity and durability of desert poplar plants [57]. Thus, the current finding indicatesthe possible role of lignin deposition in enhancing salinity stress tolerance in rice [57–59].Further, higher protein accumulation of detoxification enzyme, CHS (which detoxifiescytotoxic compounds such as cyanate), was observed exclusively in LS roots. CHS alsosupplies salinity-stressed plants with alternative sources of nitrogen and carbon for betteradaptation [60,61]. PSK, which was found exclusively in LS roots, is linked to plantimmunity and the maintenance of cellular homeostasis, and is also involved in normalroot growth and development [62]. PSK also decreases ethylene production which hindersthe primary root growth by inhibiting cell proliferation in the meristematic zone and cellelongation in the elongation zone [62–64]. Hence, the augmented root growth and salinitystress tolerance observed in LS compared to IR64 could also be linked to the higher PSKcontent. Another stress marker protein, DEAD, was observed exclusively in the rootsof LS. In earlier reports, DEAD has been shown to provide salinity stress tolerance intransgenic tobacco by reducing oxidative stress through activating the ROS scavengingsystem [65,66]. It also improves a plant’s photosynthesis machinery, enhances plant growthand development, and mitigates salinity stress [65]. Hence, the higher accumulation ofDEAD in LS roots might be involved in scavenging excess ROS, leading to the promotionof salinity stress tolerance. Moreover, β-gluc, which enhances the ABA pool, was alsofound exclusively in LS roots. The key role of β-gluc in releasing active and free forms ofabscisic acid (ABA) from physiologically inactive ABA-glucose conjugate pool, resulting inthe alleviation of salinity stress, has already been reported [67,68]. Therefore, the higheraccumulation of β-gluc in LS roots might promote ABA accumulation, thus enhancingsalinity stress tolerance. The content of MCM6 protein was found exclusively in the roots ofthe salt tolerant cultivar (LS), which plays an important role in the initiation and elongationsteps of eukaryotic DNA replication [69]. In one of the previous studies, the role of MCM6in providing resistance against high salinity and cold stress has already been elucidated [69].It was also suggested that the ectopic over-expression of Pisum sativum PsMCM6 in tobaccoconfers salinity stress tolerance without affecting yield [65,69]. Further, there were some
176
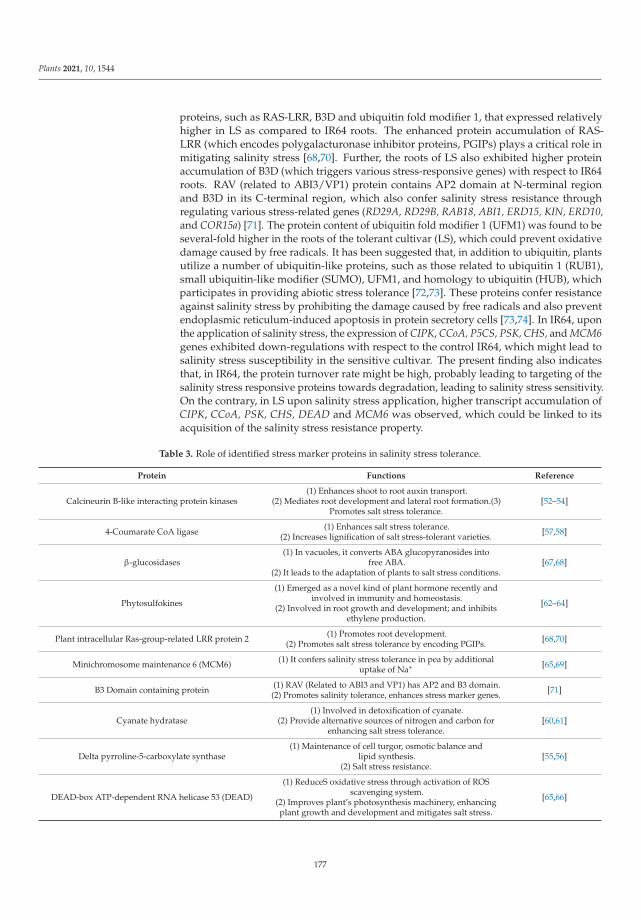
Plants 2021, 10, 1544
proteins, such as RAS-LRR, B3D and ubiquitin fold modifier 1, that expressed relativelyhigher in LS as compared to IR64 roots. The enhanced protein accumulation of RAS-LRR (which encodes polygalacturonase inhibitor proteins, PGIPs) plays a critical role inmitigating salinity stress [68,70]. Further, the roots of LS also exhibited higher proteinaccumulation of B3D (which triggers various stress-responsive genes) with respect to IR64roots. RAV (related to ABI3/VP1) protein contains AP2 domain at N-terminal regionand B3D in its C-terminal region, which also confer salinity stress resistance throughregulating various stress-related genes (RD29A, RD29B, RAB18, ABI1, ERD15, KIN, ERD10,and COR15a) [71]. The protein content of ubiquitin fold modifier 1 (UFM1) was found to beseveral-fold higher in the roots of the tolerant cultivar (LS), which could prevent oxidativedamage caused by free radicals. It has been suggested that, in addition to ubiquitin, plantsutilize a number of ubiquitin-like proteins, such as those related to ubiquitin 1 (RUB1),small ubiquitin-like modifier (SUMO), UFM1, and homology to ubiquitin (HUB), whichparticipates in providing abiotic stress tolerance [72,73]. These proteins confer resistanceagainst salinity stress by prohibiting the damage caused by free radicals and also preventendoplasmic reticulum-induced apoptosis in protein secretory cells [73,74]. In IR64, uponthe application of salinity stress, the expression of CIPK, CCoA, P5CS, PSK, CHS, and MCM6genes exhibited down-regulations with respect to the control IR64, which might lead tosalinity stress susceptibility in the sensitive cultivar. The present finding also indicatesthat, in IR64, the protein turnover rate might be high, probably leading to targeting of thesalinity stress responsive proteins towards degradation, leading to salinity stress sensitivity.On the contrary, in LS upon salinity stress application, higher transcript accumulation ofCIPK, CCoA, PSK, CHS, DEAD and MCM6 was observed, which could be linked to itsacquisition of the salinity stress resistance property.
Table 3. Role of identified stress marker proteins in salinity stress tolerance.
Protein Functions Reference
Calcineurin B-like interacting protein kinases(1) Enhances shoot to root auxin transport.
(2) Mediates root development and lateral root formation.(3)Promotes salt stress tolerance.
[52–54]
4-Coumarate CoA ligase (1) Enhances salt stress tolerance.(2) Increases lignification of salt stress-tolerant varieties. [57,58]
β-glucosidases(1) In vacuoles, it converts ABA glucopyranosides into
free ABA.(2) It leads to the adaptation of plants to salt stress conditions.
[67,68]
Phytosulfokines
(1) Emerged as a novel kind of plant hormone recently andinvolved in immunity and homeostasis.
(2) Involved in root growth and development; and inhibitsethylene production.
[62–64]
Plant intracellular Ras-group-related LRR protein 2 (1) Promotes root development.(2) Promotes salt stress tolerance by encoding PGIPs. [68,70]
Minichromosome maintenance 6 (MCM6) (1) It confers salinity stress tolerance in pea by additionaluptake of Na+ [65,69]
B3 Domain containing protein (1) RAV (Related to ABI3 and VP1) has AP2 and B3 domain.(2) Promotes salinity tolerance, enhances stress marker genes. [71]
Cyanate hydratase(1) Involved in detoxification of cyanate.
(2) Provide alternative sources of nitrogen and carbon forenhancing salt stress tolerance.
[60,61]
Delta pyrroline-5-carboxylate synthase(1) Maintenance of cell turgor, osmotic balance and
lipid synthesis.(2) Salt stress resistance.
[55,56]
DEAD-box ATP-dependent RNA helicase 53 (DEAD)
(1) ReduceS oxidative stress through activation of ROSscavenging system.
(2) Improves plant’s photosynthesis machinery, enhancingplant growth and development and mitigates salt stress.
[65,66]
177
Plants 2021, 10, 1544
4. Materials and Methods
4.1. Plant Material
The certified and disease-free seeds of salinity stress-sensitive IR64 and salinity stress-tolerant LS rice (Oryza sativa L.) cultivars were procured from Punjab Agricultural Uni-versity, Ludhiana, India, and the Central Rice Research Institute (CRRI), Cuttack, India,respectively. LS can tolerate the salt stress up to 8 dSm−1. The seeds were surface sterilizedwith 70% ethanol (v/v) for 1 min and treated with 0.4% sodium hypochlorite solutioncontaining a drop of tween-20 for 30 min. The seeds were washed thrice with autoclaveddistilled water and were then dried on autoclaved Whatman paper (3 mm) for 5 min. Aftersurface sterilization, the seeds were inoculated in the plastic tray containing autoclavedsand moistened with sterile distilled water and were incubated in the culture room at 25 ◦C(day/night), 70–80% relative humidity (day/night), and 14 h photoperiod for 14 days.After 14 days, IR64 and LS seedlings were treated with 100 mM NaCl for 8 h for imposingsalinity stress. The roots were later separated for protein and RNA extraction to conduct2-dimensional gel electrophoresis and gene expression studies, respectively.
4.2. Study of Morphological Parameters
The seedlings of IR64 and LS were harvested after 2 months and were dipped in waterto remove the adhering sand particles. A representative sample of 15 seedlings of bothIR64 and LS were selected to study the morphological parameters. Root and shoot lengthwere measured using a meter scale and observations for fresh weight were taken in grams.The root and shoot of each sample were then dried in an oven at 70 ◦C until a constantweight was achieved, and then the observations for dry weight were recorded. The numberof roots for each seedling of IR64 and LS was also counted.
4.3. IAA Estimation
To estimate the content of IAA, 5 g fresh roots of IR64 and LS were crushed finelyin liquid nitrogen and extracted in chilled 80% ethanol (15 mL/g) containing butylatedhydroxytoluene (BHT) (100 mg/L) [75]. The homogenized material was kept in the darkat 4 ◦C for 24 h and was filtered. The solid residues were re-extracted thrice with 80%ethanol for 4 h without adding BHT. The BHT containing filtrate and the filtrate withoutBHT were combined and were centrifuged at 8000 rpm for 20 min. The supernatant wasconcentrated by drying at 30 ◦C in a rotavapor in the dark and was used for furtherprocessing while the pellet was discarded. The concentrate was resuspended in 2.5 mL of0.1 M potassium phosphate buffer (pH 8) and was applied to the PVP column after adding3-bed volumes of potassium phosphate buffer into the PVP column. After elution, a 3-bedvolume of potassium phosphate buffer in the PVP column was added again. The elute wasconcentrated by drying in the rotavapor at 30 ◦C to obtain 10 mL of elute and its pH wasadjusted to 2.5 with 1N HCl. The concentrated 10 mL elute was dissolved in diethyl ether(30 mL) containing BHT (100 mg/L). It was vortexed and kept for 10 min and then thesupernatant was taken in a fresh flask (approx. 30 mL). This step was repeated four times.The obtained elute was mixed with 1.5 g of Na2SO4 and kept for 30 min. After 30 min, itwas evaporated and dried completely at 30 ◦C using the rotavapor. Then 5 mL of distilledwater was added and evaporated on rotavapor at 30 ◦C. The step was repeated twice anda dried pellet was obtained. The pellet was then dissolved in 1.5 mL of methanol (HPLCgrade) for IAA estimation. Further, the elution was carried out with 100 % methanol (HPLCgrade): Water (Formic acid 0.05% v/v), 35:65, at a flow rate of 1 mL·min−1. The columnelutes were passed through a UV detector at 254 nm, and IAA was estimated with referenceto an authentic standard of IAA (1 mM) (Sigma Chemical Co., St. Louis, MO, USA). Thereadings were taken in the replicates of three and the average of peaks was obtained.
4.4. RNA Extraction and cDNA Synthesis
A total of 150 mg of root sample of IR64 and LS was homogenized in liquid nitro-gen using pestle and mortar. Total RNA was isolated using Trizol reagent (Invitrogen,
178
Plants 2021, 10, 1544
http://www.invitrogen.com, last accessed on 20 July 2021), as per the manufacturer’sinstructions. RNase-free DNase (Sigma-Aldrich, USA) was used to remove the genomicDNA and 2 μg of RNA was used to synthesize cDNA in a total volume of 10 μL reactionusing the iScript cDNA synthesis kit (Bio-Rad, Hercules, CA, USA) as per the manufac-turer’s recommendations.
4.5. Quantitative Real-Time (qRT) PCR Analysis
qRT-PCR was performed to study the differential expression of auxin homeostasisgenes in the roots of IR64 and LS. The nucleotide sequences of different genes involvedin auxin homeostasis were retrieved from the rice annotation project database (RAP-DB) and the gene-specific primers were designed using Integrated DNA Technologies,USA (http://www.idtdna.com/primerquest/Home/Index, last accessed on 20 July 2021)(Supporting Information-Table S1). The qRT-PCR reaction was performed in 96 wellplates using SYBR Green detection chemistry in the StepOne Plus Realtime PCR machine(Applied Biosystems, Waltham, MA, USA). A 10 μL reaction was prepared using 5 μL of2X Fast SYBR Green (Applied Biosystem), 7.5 ng of each cDNA, 5 μmol each of forwardand reverse gene-specific primers and the final volume was raised to 10 μL using sterilenuclease-free water. No template control (NTC) was also set for each primer pair. Thethermal cycling was carried out using the following parameters: initial denaturation stepat 95 ◦C for the 20 s to activate the Taq DNA polymerase, followed by the 40 cycles ofdenaturation at 95 ◦C for 3 s and finally annealing at 60 ◦C for 30 s. The melting curvewas generated by heating the amplicon from 60 to 90 ◦C. Baseline and threshold cycles(Ct) were automatically determined using the StepOne Plus Software version 2.3 (AppliedBiosystems, USA). Fold changes were calculated using CT (ΔΔCT) and normalized againstOsUBQ5 (LOC_Os1g328400) used as an endogenous control.
4.6. Protein Extraction
A phenol-based method was used for extracting proteins from 1 g roots of IR64 and LSas reported previously [76]. The samples were homogenized with 6 mL of extraction buffercontaining 100 mM KCl, 700 mM sucrose, 50 mM EDTA, and 500 mM Tris-HCl pH 8.0.Further, 2% β-mercaptoethanol, 1 mM PMSF, and a 10 mM protease inhibitor cocktail wereadded to the extraction buffer just before use. The mixture was vortexed and incubatedby agitating on ice for 10 min. After incubation, 6 mL of tris-buffered phenol was addedto it and the mixture was again vortexed and incubated on a shaker on ice for 10 min.The homogeneous mixture was centrifuged at 12,000 rpm at 4 ◦C for 20 min. The upperphenolic phase was collected carefully in a fresh tube. Again, 3 mL of the extraction bufferwas added to the tris-buffered phenol and the extraction process was repeated and theupper phenolic phase was collected. Further, 5 volumes of 0.1 M ammonium acetate in100% cold methanol were added to the phenolic phase and the tube was shaken gently.The mixture was incubated at −20 ◦C for protein precipitation overnight. The proteinpellet was recovered after 24 h by centrifugation at 12,000 rpm at 4 ◦C for 10 min andthe supernatant was discarded. The pellet so obtained was washed thrice with 0.1 Mammonium acetate in cold methanol and then with a mixture containing 80% methanoland 20% acetone, followed by washing with 100% cold methanol. The final washing wasgiven with 100% chilled acetone and the washed pellet was air-dried and stored at −80 ◦Cfor 2-DE.
4.7. Protein Solubilization and Quantification
The protein pellets were suspended thoroughly in rehydration buffer (ReadyPrep™2-D Starter Kit Rehydration/Sample Buffer #1632106, Bio-Rad, USA). Protein concentrationwas quantified with a Bradford protein estimation assay [77] using bovine serum albumin(BSA) taken as standard.
179
Plants 2021, 10, 1544
4.8. Two-Dimensional Gel Electrophoretic (2-DE) Analysis
For isoelectric focusing (IEF), 150 μg of protein was dissolved in a total of 130 μL ofrehydration buffer containing 8 M urea, 2% CHAPS, 50 mM DTT, 0.2% Bio-Lyte® 3/10ampholyte, 0.001% bromophenol blue (Bio-Rad, USA) and passively rehydrated over IPGstrips (7 cm, pH 3–10, Readystrips, Cat. No. 163-200, Bio-Rad, USA) overnight at 20 ◦C.After rehydration, the strips were focused at 250V for 40 min, 4000 V for 2 h with linearvoltage amplification, and finally to 10,000 V h with rapid amplification. After IEF, the stripswere incubated with equilibration buffer I, containing 6 M urea, 375 mM Tris-HCL pH 8.8,2% SDS and 2% DTT for 15 min for reduction (ReadyPrep 2-D Starter Kit EquilibrationBuffer I #1632107, Bio-Rad USA). For alkylation of the proteins, the strip was furtherincubated with 2.5% iodoacetamide dissolved in equilibration buffer II containing 6 Murea, 375 mM Tris-HCL pH 8.8 and 2% SDS (ReadyPrep 2-D Starter Kit Equilibration BufferI #1632108) for 15 min. The second-dimensional electrophoresis was performed using 12%polyacrylamide gel. After mounting the strip on the gel, it was sealed with 0.5% agarosecontaining 0.1% bromophenol blue, and the protein molecular marker was also loaded.Electrophoresis was performed at a constant voltage of 100 V for 2 h in tris-glycine-SDScontaining running buffer.
4.9. Gel Staining, Imaging, and Analysis
After 2-DE, gels were stained with Coomassie brilliant blue and were stored in 5%acetic acid until further analysis. Gel imaging was conducted using the Molecular Im-ager Gel Doc XR system (Bio-Rad, USA) and the images were analyzed using PDQuest8.0.2 software.
4.10. Protein in-Gel Digestion and Mass Spectrometry (MS) Analysis
Proteins spots showing variations in their intensities, presence and absence weremanually excised from Coomassie brilliant blue-stained gels and were subjected to massspectrometric analysis [78]. The excised gel pieces were destained properly using 100 mMNH4HCO3/50% ACN solution and washed twice with 200 μL of Milli-Q water for 5 mineach and were dehydrated using 100 μL of acetonitrile. The samples were subjected totrypsinolysis in 25 μL of trypsin solution (Sigma, USA) with a concentration of 20 μg/mL in25 mmol/L NH4HCO3, and were incubated overnight at 37 ◦C. Each digested peptide wasfurther extracted from the gels using 50% trifluoroacetic acid/ 50% acetonitrile, twice atroom temperature. The extracted peptides were mixed with 0.5 μL of α-cyano-4-hydroxy-cinnamic acid (Bruker) of a concentration of 20 mg/mL prepared in 0.1% trifluoroaceticacid, 30% (v/v) acetonitrile and dried at room temperature. The trypsin digested proteinsamples were subjected to mass spectrometric analysis using an UltrafleXtreme™ massspectrometer (Bruker Daltonics Inc. Germany). The instrument was calibrated and fine-tuned with a mass standard starter kit (Bruker) and standard tryptic digested BSA (Bruker,Germany). TOF spectra were recorded in positive ion reflector mode between mass rangesof 700–3500 Da. For protein characterization, the obtained MS spectra were searchedagainst a non-redundant database (SwissProt database) using a MASCOT search enginewith these parameters: taxonomy: Oryza sativa (rice); parent ion mass tolerance was set at± 1.2 Da and MS/MS tolerance at 100ppm; variable modifications, oxidation of methionine(M) and carbadomethylation of cysteine (C) and trypsin enzyme.
4.11. Statistical Analysis
All the data obtained from different experiments were evaluated using statisticalanalysis. An unpaired t-test and a one-way analysis of variance (ANOVA) (the Fischer LSD,Waltham, MA, USA) test were conducted to compare the mean differences using SigmaStat version 3.5. Comparisons with p < 0.05 were considered significantly different.
180
Plants 2021, 10, 1544
5. Conclusions
The present study shows that salt tolerant rice cultivars present salinity stress adaptiveroot traits, likely due to an elevated endogenous auxin content and augmented levels ofkey salinity stress providing proteins in its roots. Salt tolerant rice LS cultivars exhibitedhigher transcript-level expression of different genes involved in auxin homeostasis bothunder control and salinity stress conditions. Thus, our study suggests that an elevatedlevel of auxin and a higher buffering capacity of the auxin homeostasis process may becritical for the acquisition of salinity stress adaptation in rice. Upon 2-DE and MS analysis,several salinity stress tolerance providing proteins were detected that exhibited higherconstitutive expression in the roots of LS with respect to IR64. In LS roots, the transcriptlevel of some identified stress marker proteins exhibited lower expression; on the contrary,their protein accumulation was higher in the tolerant cultivar, LS. It indicates that theirprotein turnover rate might be low. Taken together; these results highlight morphologicaland molecular features that are critical for rice adaptation towards salinity stress and revealthat this process is multifactorial. Moreover, our results pinpoint several candidate genesthat could be artificially overexpressed to increase salinity stress tolerance in rice.
Supplementary Materials: The following are available online at https://www.mdpi.com/article/10.3390/plants10081544/s1, Table S1: List of primers used for the quantitative real-time polymerasechain reaction.
Author Contributions: Conceptualization, P.K.P.; methodology, P.K.P. and S.S.; validation, P.K.P.,S.S. and N.K.; formal analysis, S.S., N.K., D.M., B.S. and V.S.; investigation, S.S.; resources, P.K.P.,S.S., N.K. and D.M.; data curation, P.K.P., S.S. and N.K.; writing—original draft preparation, S.S.and N.K.; writing—review and editing, P.K.P., P.G., S.S. and N.K.; visualization, S.S., N.K. and D.M.;supervision, P.K.P. and P.G.; project administration, P.K.P.; funding acquisition, P.K.P. and P.G. Allauthors have read and agreed to the published version of the manuscript.
Funding: We are thankful to the funding agencies, the Department of Science and Technology (DST),Government of India, and the Department of Biotechnology (DBT), Government of India, and toCGIAR Research Program (CRP) on rice agri-food systems (RICE, 2017–2022) for supporting thisresearch work.
Data Availability Statement: The available data are presented in the manuscript.
Conflicts of Interest: The authors declare no conflict of interest.
References
1. Jackson, M. Hormones from roots as signals for the shoots of stressed plants. Trends Plant Sci. 1997, 2, 22–28. [CrossRef]2. Saini, S.; Kaur, N.; Pati, P.K. Reactive oxygen species dynamics in roots of salt sensitive and salt tolerant cultivars of rice. Anal.
Biochem. 2018, 550, 99–108. [CrossRef]3. Gerona, M.E.B.; Deocampo, M.P.; Egdane, J.A.; Ismail, A.M.; Dionisio-Sese, M.L. Physiological Responses of Contrasting Rice
Genotypes to Salt Stress at Reproductive Stage. Rice Sci. 2019, 26, 207–219. [CrossRef]4. Qadir, M.; Quillérou, E.; Nangia, V.; Murtaza, G.; Singh, M.; Thomas, R.J.; Drechsel, P.; Noble, A.D. Economics of salt-induced
land degradation and restoration. Nat. Resour. Forum. 2014, 38, 282–295. [CrossRef]5. Shrivastava, P.; Kumar, R. Soil salinity: A serious environmental issue and plant growth promoting bacteria as one of the tools for
its alleviation. Saudi. J. Biol. Sci. 2015, 22, 123–131. [CrossRef]6. Egamberdieva, D.; Wirth, S.; Bellingrath-Kimura, S.D.; Mishra, J.; Naveen, K.; Arora, N.K. Salt-Tolerant Plant Growth Promoting
Rhizobacteria for Enhancing Crop Productivity of Saline Soils. Front. Microbiol. 2019, 10, 2791. [CrossRef]7. Solis, C.A.; Yong, M.T.; Vinarao, R.; Jena, K.; Holford, P.; Shabala, L.; Zhou, M.; Shabala, S.; Chen, Z. Back to the Wild: On a Quest
for Donors toward Salinity Tolerant Rice. Front. Plant Sci. 2020, 11, 323. [CrossRef]8. AbdElgawad, H.; Zinta, G.; Hegab, M.M.; Pandey, R.; Asard, H.; Abuelsoud, W. High salinity induces different oxidative stress
and antioxidant responses in maize seedlings organs. Front. Plant Sci. 2016, 7, 276. [CrossRef] [PubMed]9. Zhao, Q.; Zhang, H.; Wang, T.; Chen, S.; Dai, S. Proteomics-based investigation of salt-responsive mechanisms in plant roots. J.
Proteomics 2013, 2, 230–253. [CrossRef] [PubMed]10. Ghosh, D.; Xu, J. Abiotic stress responses in plant roots: A proteomics perspective. Front. Plant Sci. 2014, 5, 6. [CrossRef]
[PubMed]11. Ryu, H.; Cho, Y. Plant hormones in salt stress tolerance. J. Plant Biol. 2015, 58, 147–155. [CrossRef]
181
Plants 2021, 10, 1544
12. Korver, R.A.; Koevoets, I.T.; Testerink, C. Out of Shape during Stress: A Key Role for Auxin. Trends Plant Sci. 2018, 23, 783–793.[CrossRef]
13. Quint, M.; Gray, W.M. Auxin signaling. Curr. Opin. Plant Biol. 2006, 9, 448–453. [CrossRef]14. Davies, P.J. Plant hormones: Their nature, occurrence, and functions. In Plant Hormones; Davies, P.J., Ed.; Springer: Dordrecht,
The Netherlands, 2010; pp. 1–15.15. Shi, H.; Chen, L.; Ye, T.; Liu, X.; Ding, K.; Chan, Z. Modulation of auxin content in Arabidopsis confers improved drought stress
resistance. Plant Physiol. Biochem. 2014, 82, 209–217. [CrossRef] [PubMed]16. Jadamba, C.; Kang, K.; Paek, N.; Lee, S.I.; Yoo, S. Overexpression of Rice Expansin7 (Osexpa7) Confers Enhanced Tolerance to Salt
Stress in Rice. Int. J. Mol. Sci. 2020, 21, 454. [CrossRef]17. Fukaki, H.; Okushima, Y.; Tasaka, M. Auxin-mediated lateral root formation in higher plants. Int. Rev. Cytol. 2007, 256, 111–137.18. Di Mambro, R.; De Ruvo, M.; Pacifici, E.; Salvi, E.; Sozzani, R.; Benfey, P.N.; Busch, W.; Novak, O.; Ljung, K.; Di Paola, L.; et al.
Auxin minimum triggers the developmental switch from cell division to cell differentiation in the Arabidopsis root. Proc. Natl.Acad. Sci. USA 2017, 114, 641–649. [CrossRef]
19. Rosquete, M.R.; Barbez, E.; Kleine-Vehn, J. Cellular auxin homeostasis: Gatekeeping is housekeeping. Mol. Plant 2012, 5, 772–786.[CrossRef] [PubMed]
20. Saini, S.; Sharma, I.; Pati, P.K. Integrating the Knowledge of Auxin Homeostasis with Stress Tolerance in Plants. In Mechanism ofPlant Hormone Signaling under Stress; Pandey, G.K., Ed.; John Wiley and Sons, Inc.: Hoboken, NJ, USA, 2017; pp. 53–70.
21. Ribba, T.; Garrido-Vargas, F.; O’Brien, J.A. Auxin-mediated responses under salt stress: From developmental regulation tobiotechnological applications. J. Exp. Bot. 2020, 71, 3843–3853. [CrossRef] [PubMed]
22. Vaseva, I.I.; Mishev, K.; Depaepe, T.; Vassileva, V.; Van Der Straeten, D. The Diverse Salt-Stress Response of Arabidopsis ctr1-1and ein2-1 Ethylene Signaling Mutants is Linked to Altered Root Auxin Homeostasis. Plants 2021, 10, 452. [CrossRef]
23. Zhang, H.; Han, B.; Wang, T.; Chen, S.; Li, H.; Zhang, Y.; Dai, S. Mechanisms of plant salt response: Insights from proteomics. J.Proteome Res. 2012, 11, 49–67. [CrossRef]
24. Sengupta, S.; Majumder, A.L. Insight into the salt tolerance factors of a wild halophytic rice, Porteresia coarctata: A physiologicaland proteomic approach. Planta 2009, 29, 911–929. [CrossRef]
25. Comas, L.H.; Becker, S.R.; Cruz, V.M.V.; Byrne, P.F.; Dierig, D.A. Root traits contributing to plant productivity under drought.Front. Plant Sci. 2013, 4, 442. [CrossRef]
26. Kim, Y.; Chung, Y.S.; Lee, E.; Tripathi, P.; Heo, S.; Kim, K.H. Root response to drought stress in rice (Oryza sativa L.). Int. J. Mol.Sci. 2020, 21, 1513. [CrossRef] [PubMed]
27. Arif, M.R.; Islam, M.T.; Robin, A.H.K. Salinity stress alters root morphology and root hair traits in Brassica napus. Plants 2019, 8,192. [CrossRef]
28. Polania, J.; Poschenrieder, C.; Rao, I.; Beebe, S. Root traits and their potential links to plant ideotypes to improve droughtresistance in common bean. Theor. Exp. Plant Physiol. 2017, 29, 143–154. [CrossRef]
29. Ku, Y.; Sintaha, M.; Cheung, M.; Lam, H. Plant Hormone Signaling Crosstalks between Biotic and Abiotic Stress Responses. Int. J.Mol. Sci. 2018, 19, 3206. [CrossRef] [PubMed]
30. Fu, Y.; Yang, Y.; Chen, S.; Ning, N.; Hu, H. Arabidopsis IAR4 modulates primary root growth under salt stress throughROS-mediated modulation of auxin distribution. Front. Plant Sci. 2019, 10, 522. [CrossRef] [PubMed]
31. Du, H.; Liu, H.; Xiong, L. Endogenous auxin and jasmonic acid levels are differentially modulated by abiotic stresses in rice.Front. Plant Sci. 2013, 4, 397. [CrossRef] [PubMed]
32. Zörb, C.; Geilfus, C.M.; Mühling, K.H.; Ludwig-Müller, J. The influence of salt stress on ABA and auxin concentrations in twomaize cultivars differing in salt resistance. J. Plant Physiol. 2013, 170, 220–224. [CrossRef] [PubMed]
33. Koevoets, I.T.; Venema, J.H.; Elzenga, J.T.M.; Testerink, C. Roots Withstanding their Environment: Exploiting Root SystemArchitecture Responses to Abiotic Stress to Improve Crop Tolerance. Front. Plant Sci. 2016, 7, 1335. [CrossRef]
34. Saini, S.; Sharma, I.; Kaur, N.; Pati, P.K. Auxin: A master regulator in plant root development. Plant. Cell Rep. 2013, 32, 741–757.[CrossRef]
35. Chen, Q.; Dai, X.; De-Paoli, H.; Cheng, Y.; Takebayashi, Y.; Kasahara, H.; Kamiya, Y.; Zhao, Y. Auxin overproduction in shootscannot rescue auxin deficiencies in Arabidopsis roots. Plant. Cell Physiol. 2014, 55, 1072–1079. [CrossRef]
36. Kao, C. Mechanisms of Salt Tolerance in Rice Plants: Cell Wall-Related Genes and Expansins. J. Taiwan Agric. Res. 2017, 66, 87–93.37. Cheng, Y.; Dai, X.; Zhao, Y. Auxin biosynthesis by the YUCCA flavin monooxygenases controls the formation of floral organs and
vascular tissues in Arabidopsis. Genes Dev. 2006, 20, 1790–1799. [CrossRef] [PubMed]38. Alarcón, M.; Salguero, J.; Lloret, P.G. Auxin modulated initiation of lateral roots is linked to pericycle cell length in maize. Front.
Plant Sci. 2019, 10, 11. [CrossRef] [PubMed]39. Ljung, K. Auxin metabolism and homeostasis during plant development. Development 2013, 140, 943–950. [CrossRef]40. Fukui, K.; Hayashi, K.I. Manipulation and sensing of auxin metabolism, transport and signaling. Plant Cell Physiol. 2018, 59,
1500–1510. [CrossRef]41. Hentrich, M.; Böttcher, C.; Düchting, P.; Cheng, Y.; Zhao, Y.; Berkowitz, O.; Masle, J.; Medina, J.; Pollmann, S. The jasmonic acid
signaling pathway is linked to auxin homeostasis through the modulation of YUCCA8 and YUCCA9 gene expression. Plant J.2013, 74, 626–637. [CrossRef] [PubMed]
182
Plants 2021, 10, 1544
42. Zwiewka, M.; Bilanovicová, V.; Seifu, Y.W.; Nodzynski, T. The Nuts and Bolts of PIN Auxin Efflux Carriers. Front. Plant Sci. 2019,10, 985. [CrossRef] [PubMed]
43. Bielach, A.; Hrtyan, M.; Tognetti, V.B. Plants under stress: Involvement of auxin and cytokinin. Int. J. Mol. Sci. 2017, 18, 1427.[CrossRef]
44. Potters, G.; Pasternak, T.P.; Guisez, Y.; Jansen, M.A. Different stresses, similar morphogenic responses: Integrating a plethora ofpathways. Plant Cell Environ. 2009, 32, 158–169. [CrossRef] [PubMed]
45. Singh, P.; Mohanta, T.K.; Sinha, A.K. Unraveling the Intricate Nexus of Molecular Mechanisms Governing Rice Root Development:OsMPK3/6 and Auxin-Cytokinin Interplay. PLoS ONE 2015, 10, e0123620. [CrossRef] [PubMed]
46. Balzan, S.; Johal, G.S.; Carraro, N. The role of auxin transporters in monocots development. Front. Plant Sci. 2014, 5, 393.[CrossRef]
47. Kong, W.; Zhong, H.; Deng, X.; Gautam, M.; Gong, Z.; Zhang, Y.; Zhao, G.; Liu, C.; Li, Y. Evolutionary Analysis of GH3 Genesin Six Oryza Species/Subspecies and Their Expression Under Salinity Stress in Oryza sativa ssp. Japonica. Plants 2019, 8, 30.[CrossRef]
48. Xia, K.; Wang, R.; Ou, X.; Fang, Z.; Tian, C.; Duan, J.; Wang, Y.; Zhang, M. OsTIR1 and OsAFB2 downregulation via OsmiR393overexpression leads to more tillers, early flowering and lesstolerance to salt and drought in rice. PLoS ONE 2012, 7, e30039.
49. Xu, D.; Miao, J.; Yumoto, E.; Yokota, T.; Asahina, M.; Watahiki, M. YUCCA9 Mediated Auxin Biosynthesis and Polar AuxinTransport Synergistically Regulate Regeneration of Root Systems Following Root Cutting. Plant Cell Physiol. 2017, 58, 1710–1723.[CrossRef]
50. Guseman, J.M.; Hellmuth, A.; Lanctot, A.; Feldman, T.P.; Moss, B.L.; Klavins, E.; Calderón Villalobos, L.I.; Nemhauser, J.L.Auxin-induced degradation dynamics set the pace for lateral root development. Development 2015, 142, 905–909.
51. Leyser, O. Auxin Signaling. Plant Physiol. 2018, 176, 465–479. [CrossRef] [PubMed]52. Tripathi, V.; Parasuraman, B.; Laxmi, A.; Chattopadhyay, D. CIPK6, a CBL-interacting protein kinase is required for development
and salt tolerance in plants. Plant J. 2009, 58, 778–790. [CrossRef]53. Chen, L.; Wang, Q.Q.; Zhou, L.; Ren, F.; Li, D.D.; Li, X.B. Arabidopsis CBL-interacting protein kinase (CIPK6) is involved in plant
response to salt/osmotic stress and ABA. Mol. Biol. Rep. 2013, 40, 4759–4767. [CrossRef]54. Hu, W.; Xia, Z.; Yan, Y.; Ding, Z.; Tie, W.; Wang, L.; Zou, M.; Wei, Y.; Lu, C.; Hou, X.; et al. Genome-wide gene phylogeny of CIPK
family in cassava and expression analysis of partial drought-induced genes. Front. Plant Sci. 2015, 6, 914. [CrossRef]55. Hayat, S.; Hayat, Q.; Alyemeni, M.N.; Wani, A.S.; Pichtel, J.; Ahmad, A. Role of proline under changing environments: A review.
Plant Signal. Behav. 2012, 7, 1456–1466. [CrossRef] [PubMed]56. Gharsallah, C.; Fakhfakh, H.; Grubb, D.; Gorsane, F. Effect of salt stress on ion concentration, proline content, antioxidant enzyme
activities and gene expression in tomato cultivars. AoB Plants 2016, 8, plw055. [CrossRef] [PubMed]57. Zhang, C.H.; Ma, T.; Luo, W.C.; Xu, J.M.; Liu, J.Q.; Wan, D.S. Identification of 4CL Genes in Desert Poplars and Their Changes in
Expression in Response to Salt Stress. Genes 2015, 6, 901–917. [CrossRef] [PubMed]58. Shafi, A.; Chauhan, R.; Gill, T.; Swarnkar, M.K.; Sreenivasulu, Y.; Kumar, S.; Kumar, N.; Shankar, R.; Ahuja, P.S.; Singh, A.K.
Expression of SOD and APX genes positively regulates secondary cell wall biosynthesis and promotes plant growth and yield inArabidopsis under salt stress. Plant Mol. Biol. 2015, 87, 615–631. [CrossRef]
59. Le Gall, H.; Philippe, F.; Domon, J.M.; Gillet, F.; Pelloux, J.; Rayon, C. Cell Wall Metabolism in Response to Abiotic Stress. Plants2015, 4, 112–166. [CrossRef] [PubMed]
60. Nveawiah-Yoho, P.; Zhou, J.; Palmer, M.; Sauve, R.; Zhou, S. Identification of Proteins for Salt Tolerance Using a ComparativeProteomics Analysis of Tomato Accessions with Contrasting Salt Tolerance. J. Am. Soc. Hortic. Sci. 2013, 138, 382–394. [CrossRef]
61. Maršálová, L.; Vítámvás, P.; Hynek, R.; Prášil, I.T.; Kosová, K. Proteomic Response of Hordeum vulgare cv. Tadmor and Hordeummarinum to Salinity Stress: Similarities and Differences between a Glycophyte and a Halophyte. Front. Plant Sci. 2016, 7, 1154.[CrossRef] [PubMed]
62. Lorbiecke, R.; Steffens, M.; Tomm, J.M.; Scholten, S.; Wiegen, P.; Kranz, E.; Wienand, U.; Sauter, M. Phytosulphokine generegulation during maize (Zea mays L.) reproduction. J. Exp. Bot. 2005, 56, 1805–1819. [CrossRef]
63. Sauter, M. Phytosulfokine peptide signaling. J. Exp. Bot. 2015, 66, 5161–5169. [CrossRef]64. Kutschmar, A.; Rzewuski, G.; Stührwohldt, N.; Beemster, G.T.; Inzé, D.; Sauter, M. PSK-α promotes root growth in Arabidopsis.
New Phytol. 2009, 181, 820–831. [CrossRef]65. Macovei, A.; Vaid, N.; Tula, S.; Tuteja, N. A new DEAD-box helicase ATP-binding protein (OsABP) from rice is responsive to
abiotic stress. Plant Signal. Behav. 2012, 7, 1138–1143. [CrossRef] [PubMed]66. Tuteja, N.; Banu, M.S.; Huda, K.M.; Gill, S.S.; Jain, P.; Pham, X.H.; Tuteja, R. Pea p68, a DEAD-box helicase, provides salinity
stress tolerance in transgenic tobacco by reducing oxidative stress and improving photosynthesis machinery. PLoS ONE 2014, 30,e98287. [CrossRef]
67. Dietz, K.J.; Sauter, A.; Wichert, K.; Messdaghi, D.; Hartung, W. Extracellular beta-glucosidase activity in barley involved in thehydrolysis of ABA glucose conjugate in leaves. J. Exp. Bot. 2000, 51, 937–944. [CrossRef] [PubMed]
68. Li, W.; Zhao, F.; Fang, W.; Xie, D.; Hou, J.; Yang, X.; Zhao, Y.; Tang, Z.; Nie, L.; Lv, S. Identification of early salt stress responsiveproteins in seedling roots of upland cotton (Gossypium hirsutum L.) employing iTRAQ-based proteomic technique. Front. PlantSci. 2015, 6, 732. [CrossRef]
183
Plants 2021, 10, 1544
69. Dang, H.Q.; Tran, N.Q.; Gill, S.S.; Tuteja, R.; Tuteja, N. A single subunit MCM6 from pea promotes salinity stress tolerancewithout affecting yield. Plant Mol. Biol. 2011, 76, 19–34. [CrossRef] [PubMed]
70. Xu, Z.S.; Xiong, T.F.; Ni, Z.Y.; Chen., X.P.; Chen, M.; Li, L.C.; Gao, D.Y.; Yu, X.D.; Liu, P.; Ma, Y.Z. Isolation and identification oftwo genes encoding leucine-rich repeat (LRR) proteins differentially responsive to pathogen attack and salt stress in tobacco.Plant Sci. 2009, 176, 38–45. [CrossRef]
71. Li, X.J.; Li, M.; Zhou, Y.; Hu, S.; Hu, R.; Chen, Y.; Li, X.B. Overexpression of cotton RAV1 gene in Arabidopsis confers transgenicplants high salinity and drought sensitivity. PLoS ONE 2015, 10, e0118056. [CrossRef] [PubMed]
72. Miura, K.; Hasegawa, P.M. Sumoylation and other ubiquitin-like post-translational modifications in plants. Trends Cell Biol. 2010,20, 223–232. [CrossRef]
73. Srivastava, A.K.; Zhang, C.; Yates, G.; Bailey, M.; Brown, A.; Sadanandom, A. SUMO is a Critical Regulator of Salt StressResponses in Rice. Plant Physiol. 2016, 170, 2378–2391. [CrossRef] [PubMed]
74. Lemaire, K.; Moura, R.F.; Granvik, M.; Igoillo-Esteve, M.; Hohmeier, H.E.; Hendrickx, N.; Newgard, C.B.; Waelkens, E.; Cnop, M.;Schuit, F. Ubiquitin fold modifier 1 (UFM1) and its target UFBP1 protect pancreatic beta cells from ER stress-induced apoptosis.PLoS ONE 2011, 6, e18517. [CrossRef]
75. Nagar, P.K.; Sood, S. Changes in endogenous auxins during winter dormancy in tea (Camellia sinensis L.) O. Kuntze. Acta Physiol.Plant 2006, 28, 165–169. [CrossRef]
76. Faurobert, M.; Pelpoir, E.; Chaïb, J. Phenol extraction of proteins for proteomic studies of recalcitrant plant tissues. Methods Mol.Biol. 2007, 355, 9–14. [PubMed]
77. Bradford, M. A rapid and sensitive method for the quantitation of microgram quantities of protein utilizing the principle ofprotein-dye binding. Anal. Biochem. 1976, 72, 248–254. [CrossRef]
78. Kaur, D.; Dogra, V.; Thapa, P.; Bhattacharya, A.; Sood, A.; Sreenivasulu, Y. In vitro flowering associated protein changes inDendrocalamus hamiltonii. Proteomics 2015, 15, 1291–1306. [CrossRef] [PubMed]
184

MDPISt. Alban-Anlage 66
4052 BaselSwitzerland
Tel. +41 61 683 77 34Fax +41 61 302 89 18
www.mdpi.com
Plants Editorial OfficeE-mail: [email protected]
www.mdpi.com/journal/plants


MDPI
St. Alban-Anlage 66
4052 Basel
Switzerland
Tel: +41 61 683 77 34
Fax: +41 61 302 89 18
www.mdpi.com ISBN 978-3-0365-2651-5


