AERODYNAMICS OF VOCAL VIBRATO Srihimaja Nandamudi A Dissertation Submitted to the Graduate College of Bowling Green State University in partial fulfillment of the requirements for the degree of DOCTOR OF PHILOSOPHY August 2017 Committee: Ronald C. Scherer, Advisor Mingsheng Li Graduate Faculty Representative Alexander Goberman Jason Whitfield
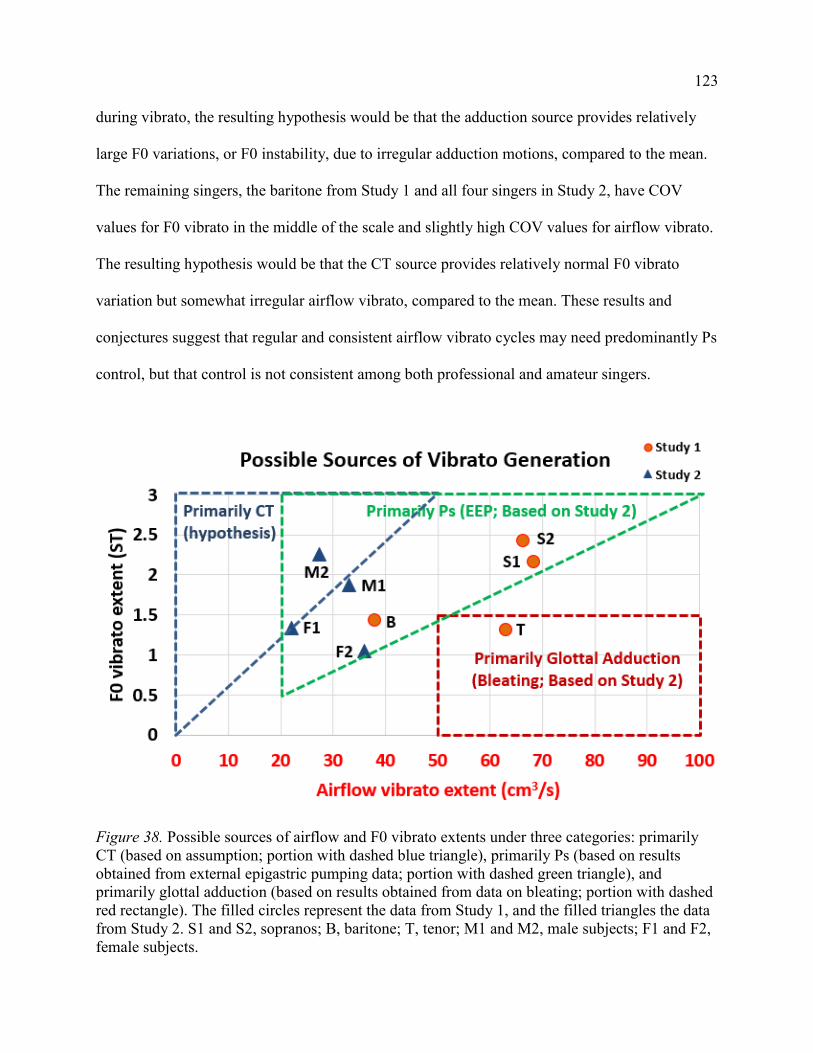
Transcript
AERODYNAMICS OF VOCAL VIBRATO
Srihimaja Nandamudi
A Dissertation
Submitted to the Graduate College of Bowling Green State University in partial fulfillment of
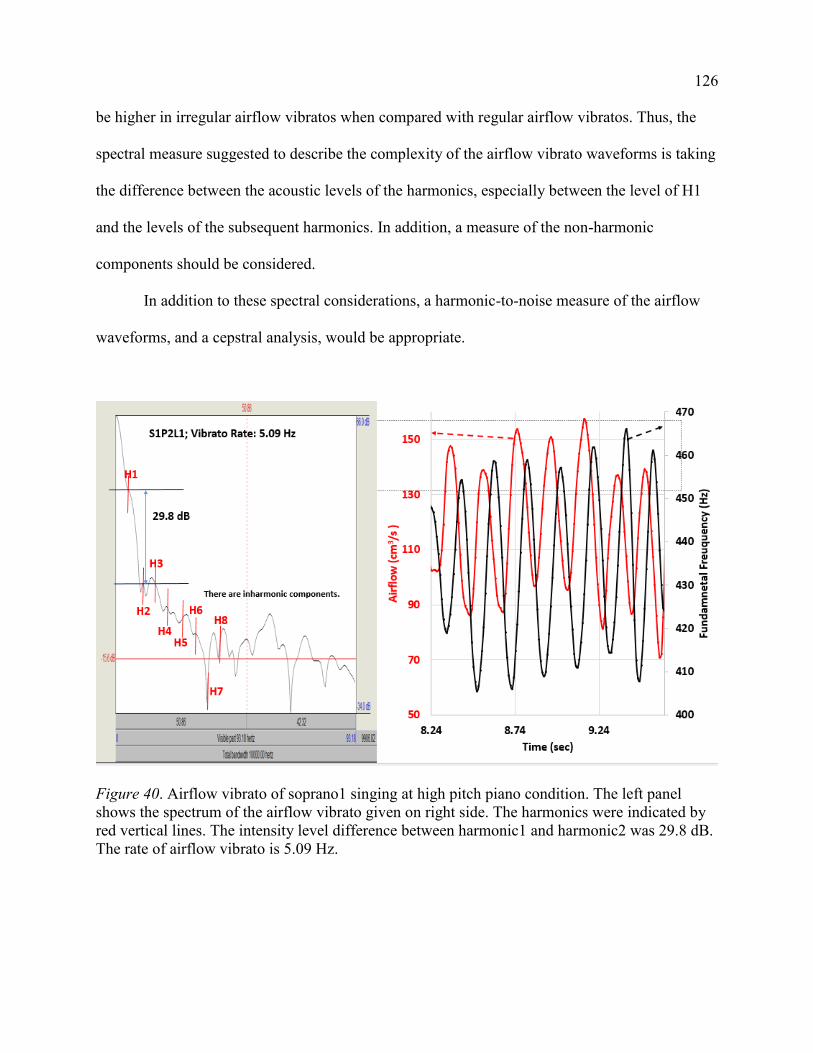
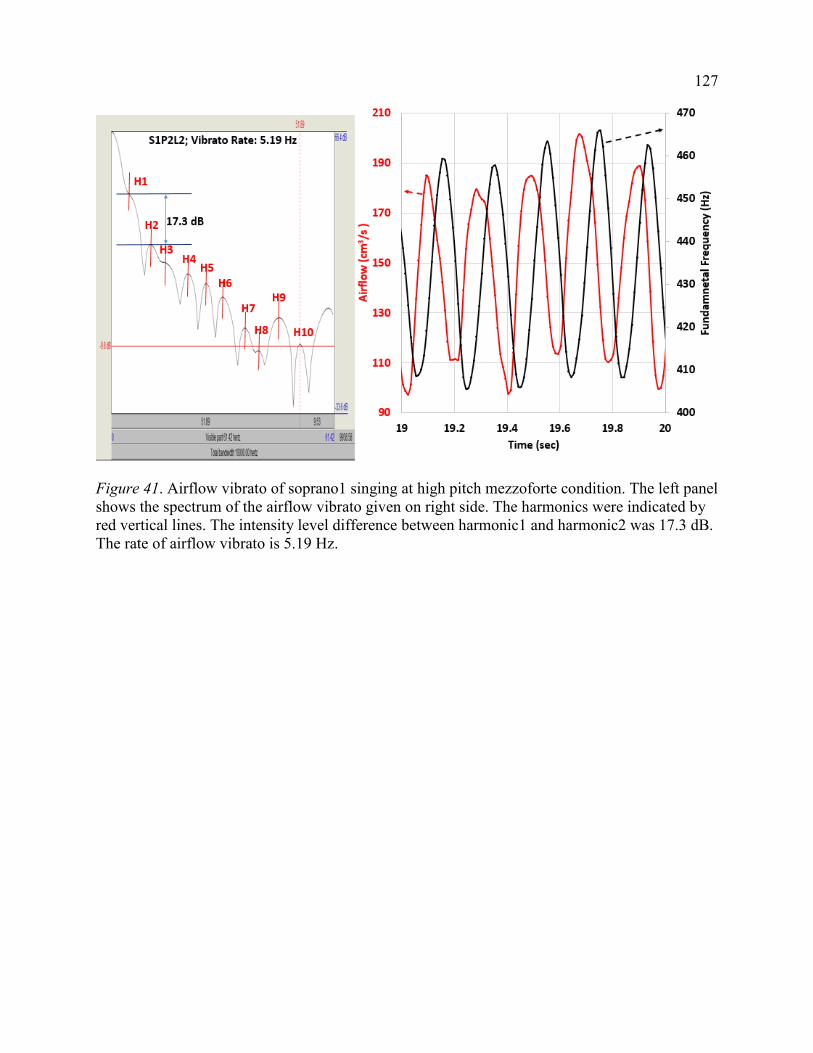
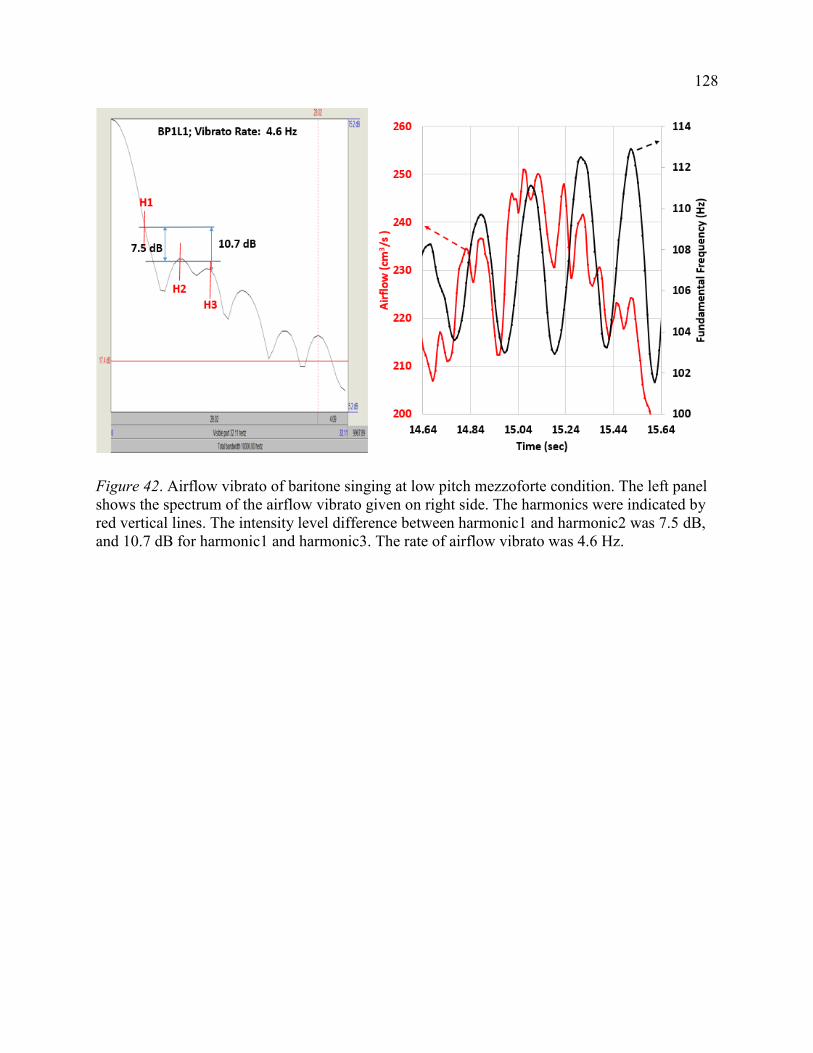
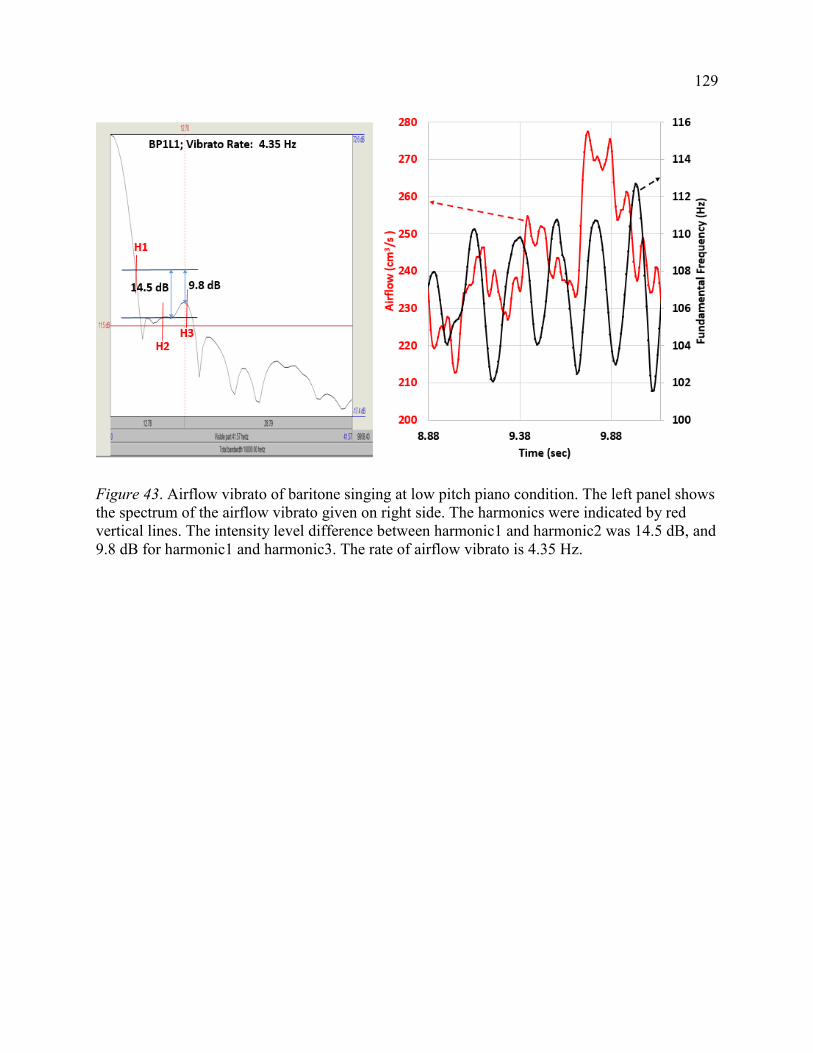
(Sundberg et al, 1993). The mean airflow variations during vibrato production are called “airflow
vibrato” in this study.
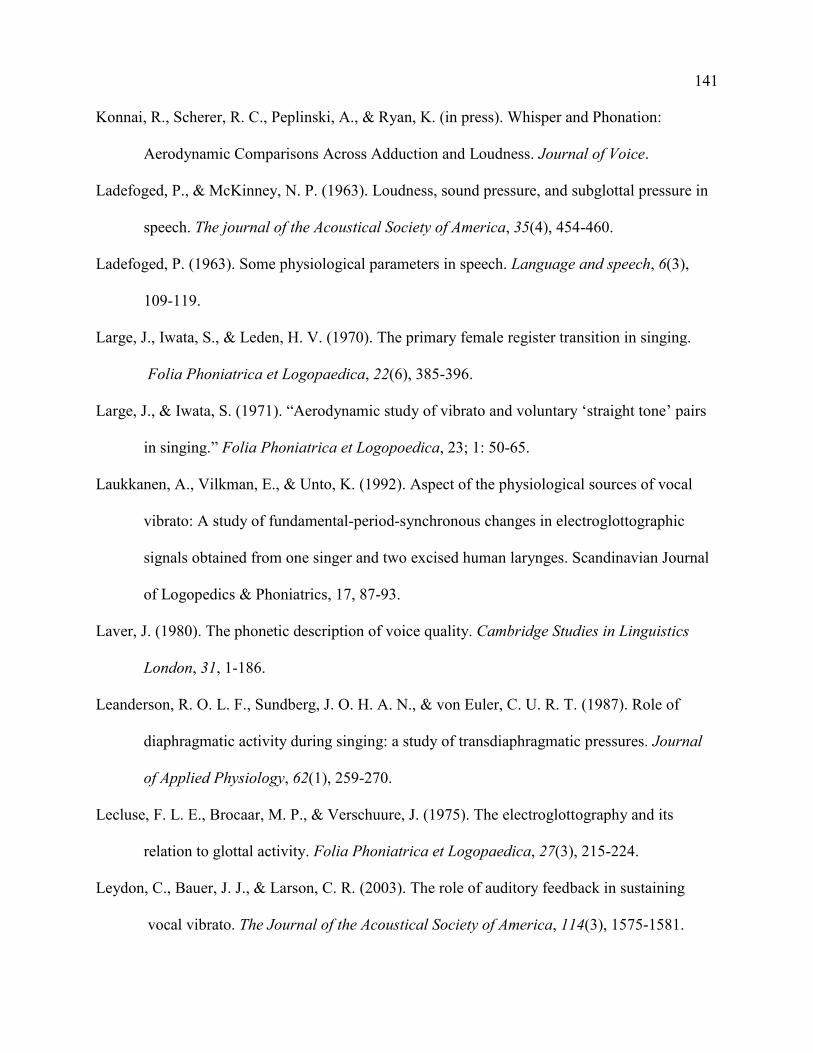
Work by Rubin, LeCover, and Vennard (1967)
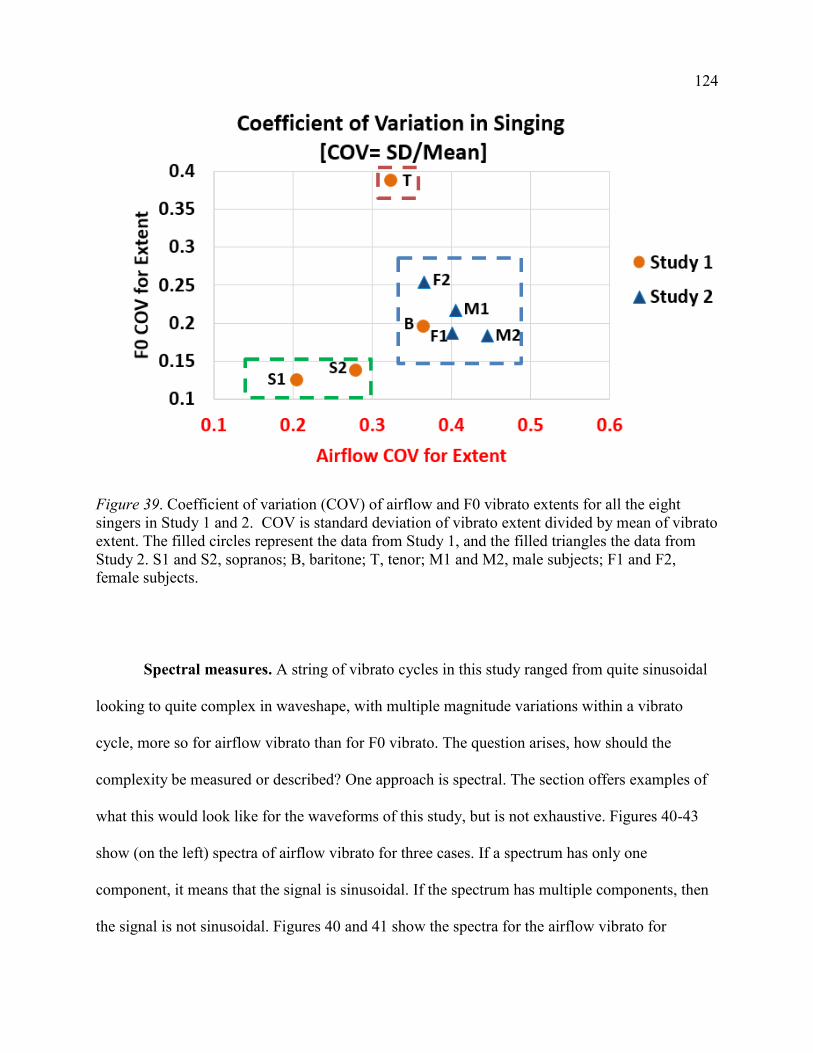
There are few studies showing airflow vibrato and its relation to other production
variables. One such study was reported by Rubin et al. (1967) who studied the relationship
among vocal intensity, subglottal pressure, and airflow in singers while singing and producing
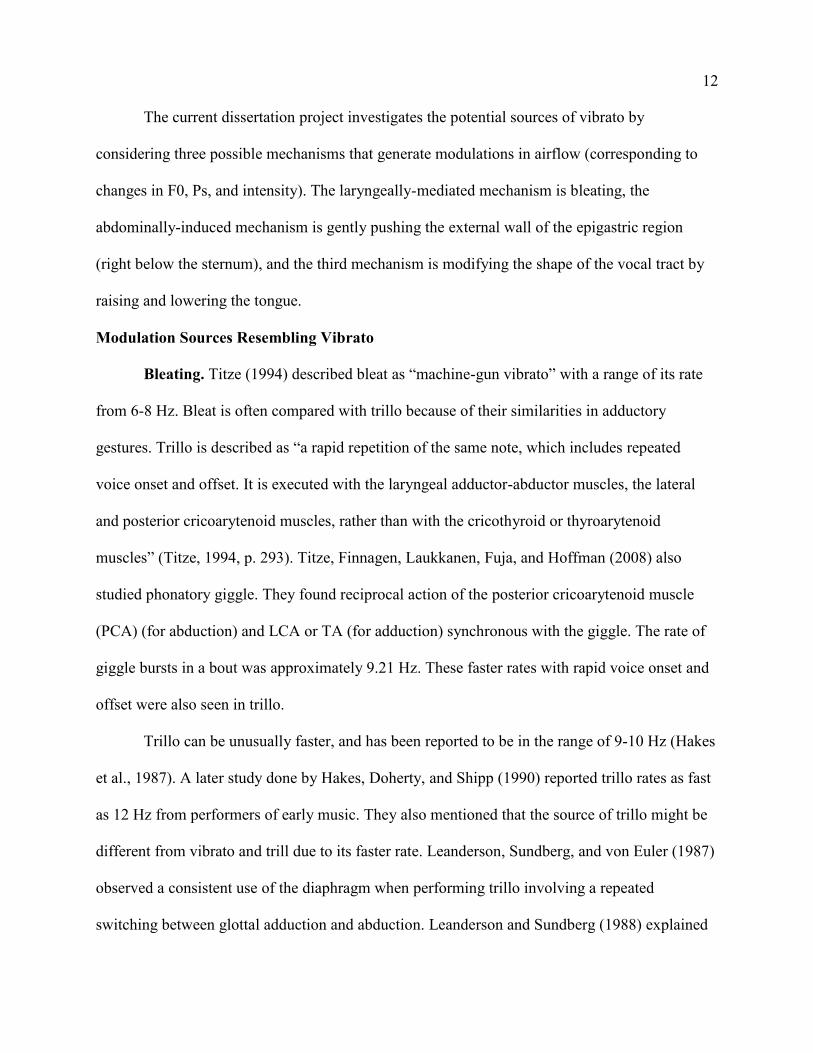
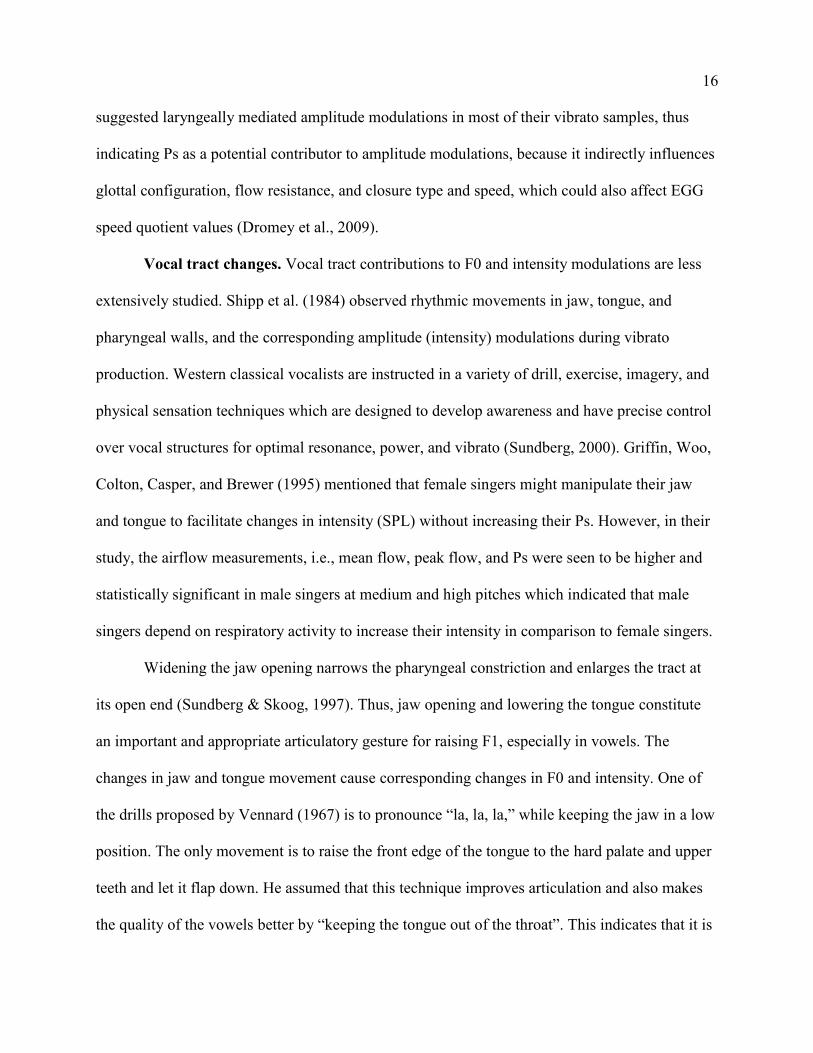
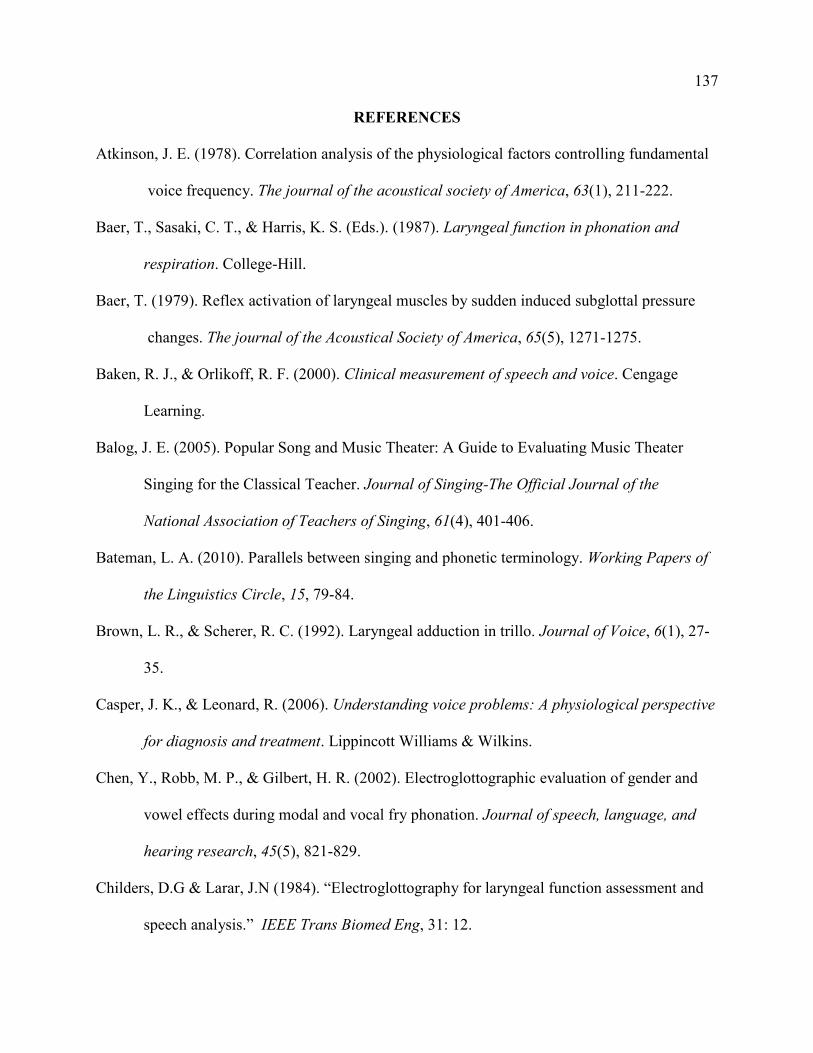
vibrato. Figures 1-3 are from that study. For this discussion, it is assumed that there are
negligible time delays among the three signals shown in the figures. For example, if there were a
10 ms delay among signals, with a vibrato rate of 6 Hz, the delay vs. period would only be 6% of
the period.
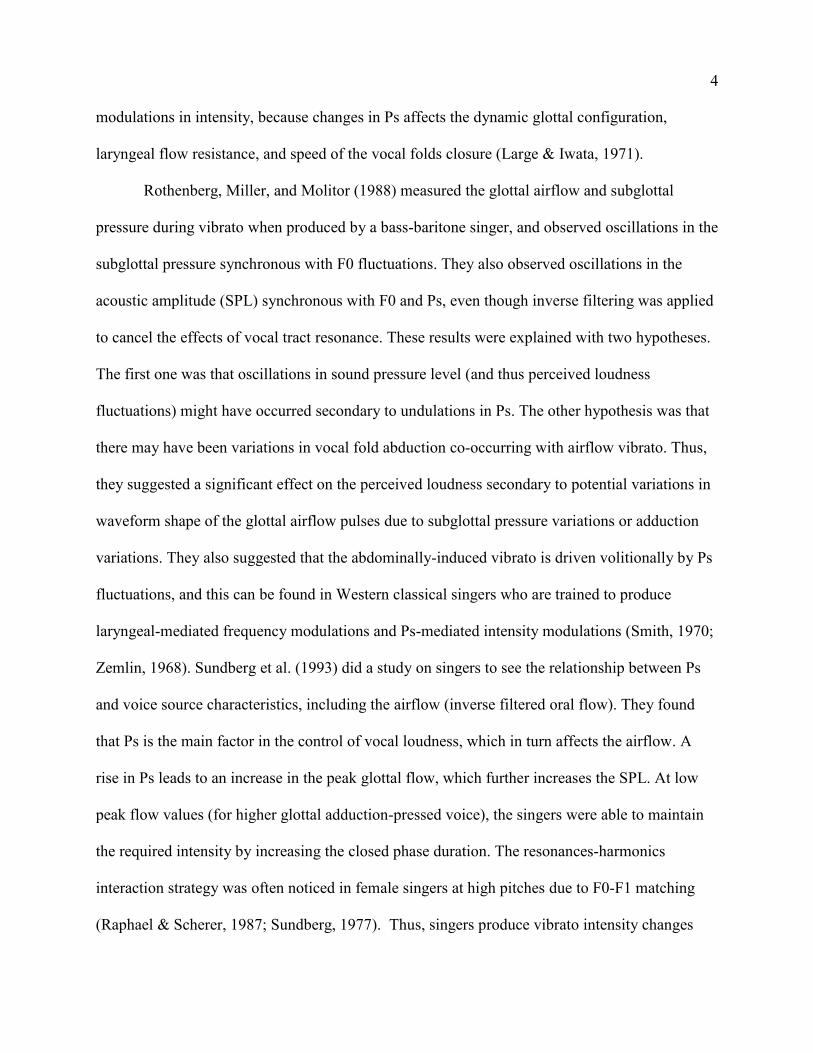
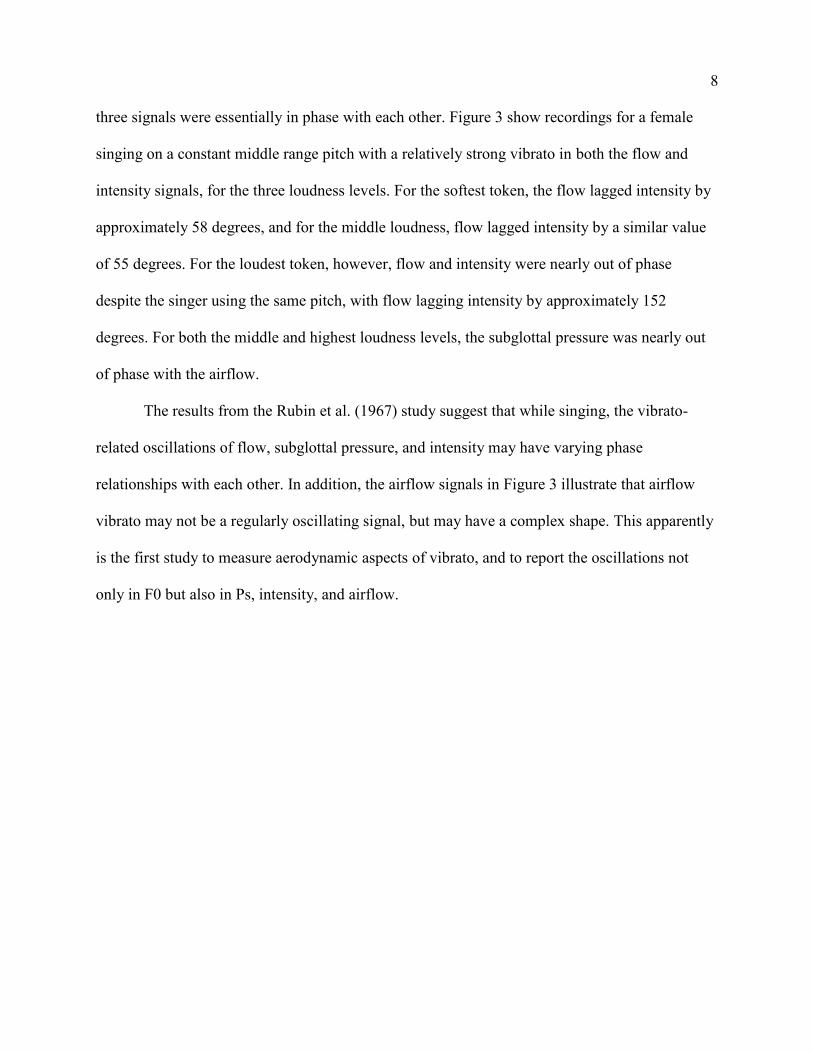
The vertical lines in Figures 1-3 (parallel to the y-axis designations on the left) were
added to the original figures to examine the phase relationship among the variables for the
various singing conditions. In Figure 1, the relationship between airflow vibrato (A) and
intensity vibrato (S) for the male’s middle pitch was such that airflow peaks led intensity peaks
by approximately 113 degrees (see below for the definition of phase calculations). For the
highest pitch, airflow was nearly completely out of phase with both intensity and subglottal
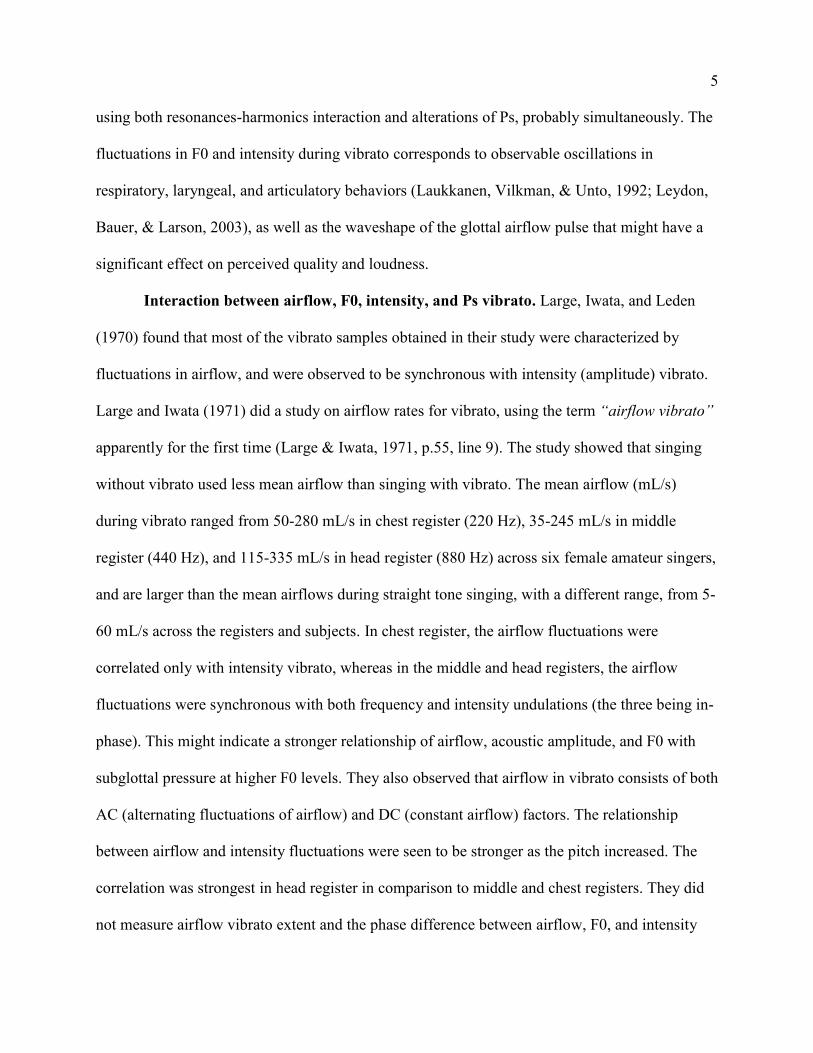
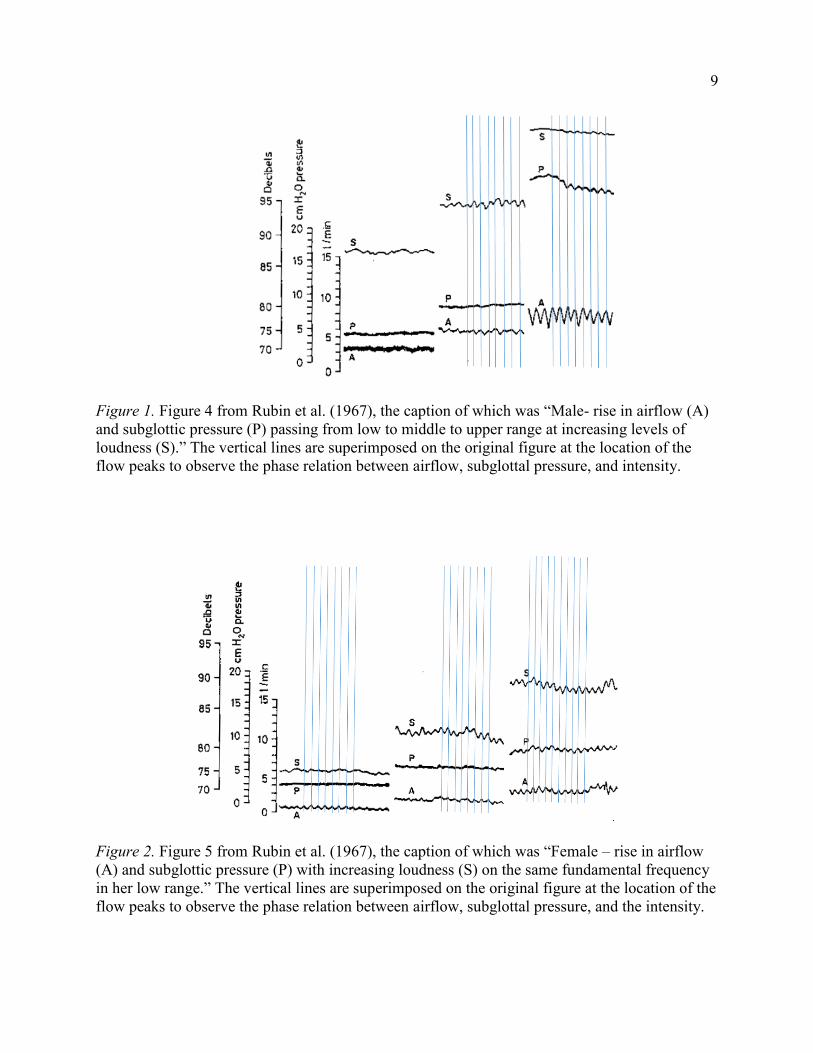
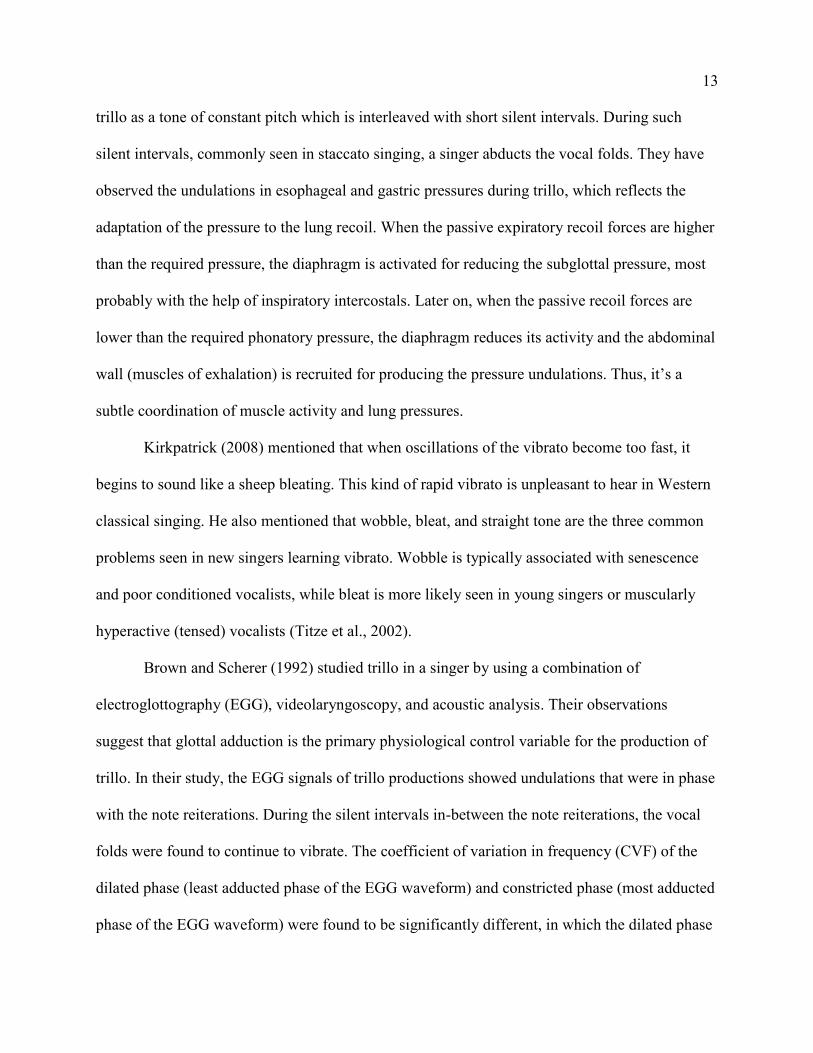
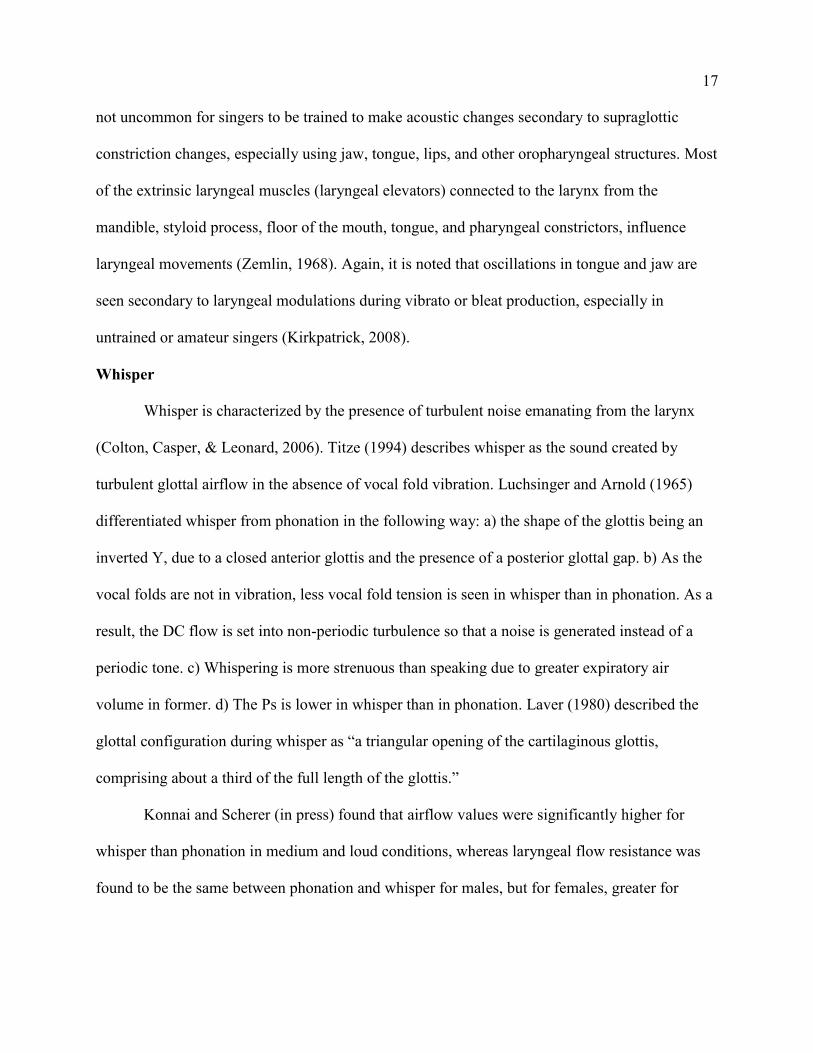
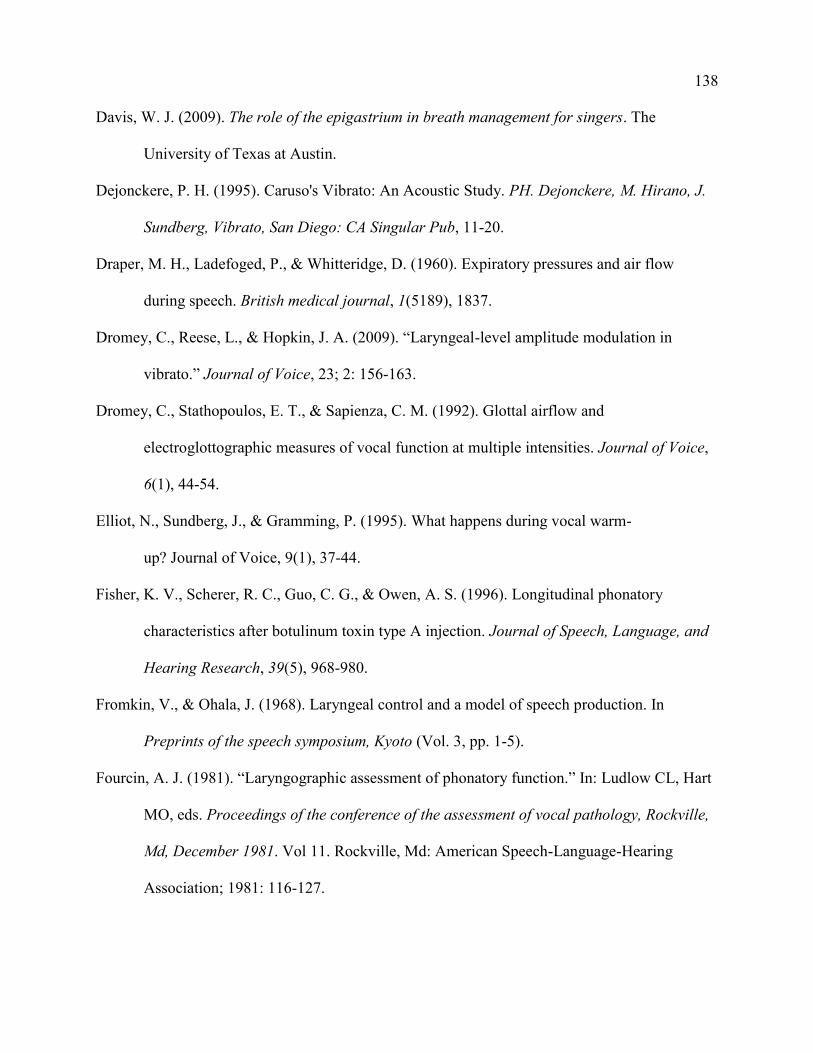
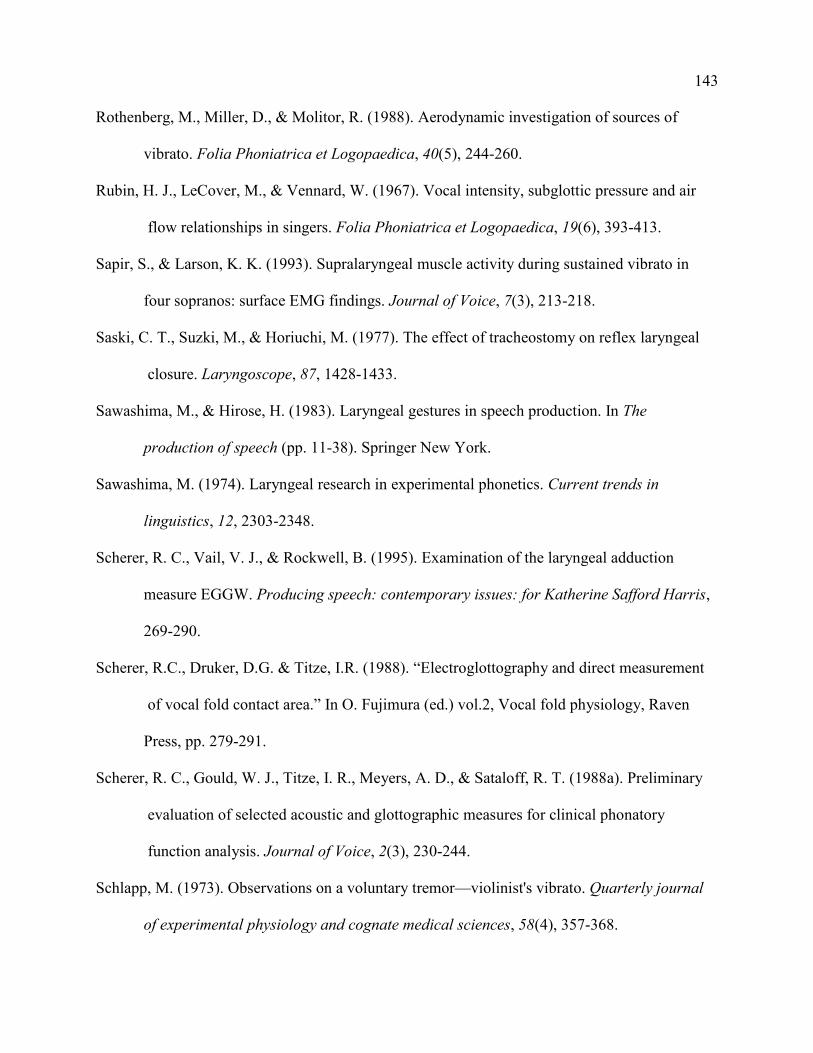
pressure. Figure 2 shows recordings for a female singing three loudness levels at the same
fundamental frequency. For her middle loudness token, the airflow lagged intensity by
approximately 72 degrees for the last three cycles shown, and for the loudest production, all
8
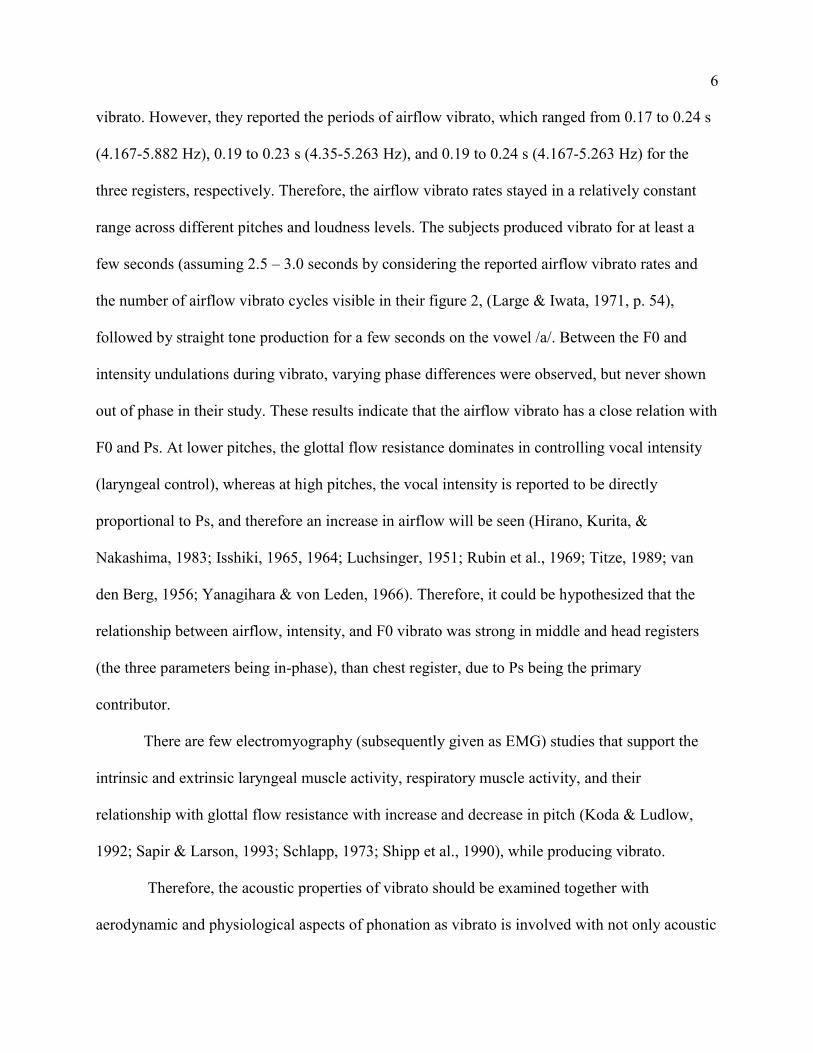
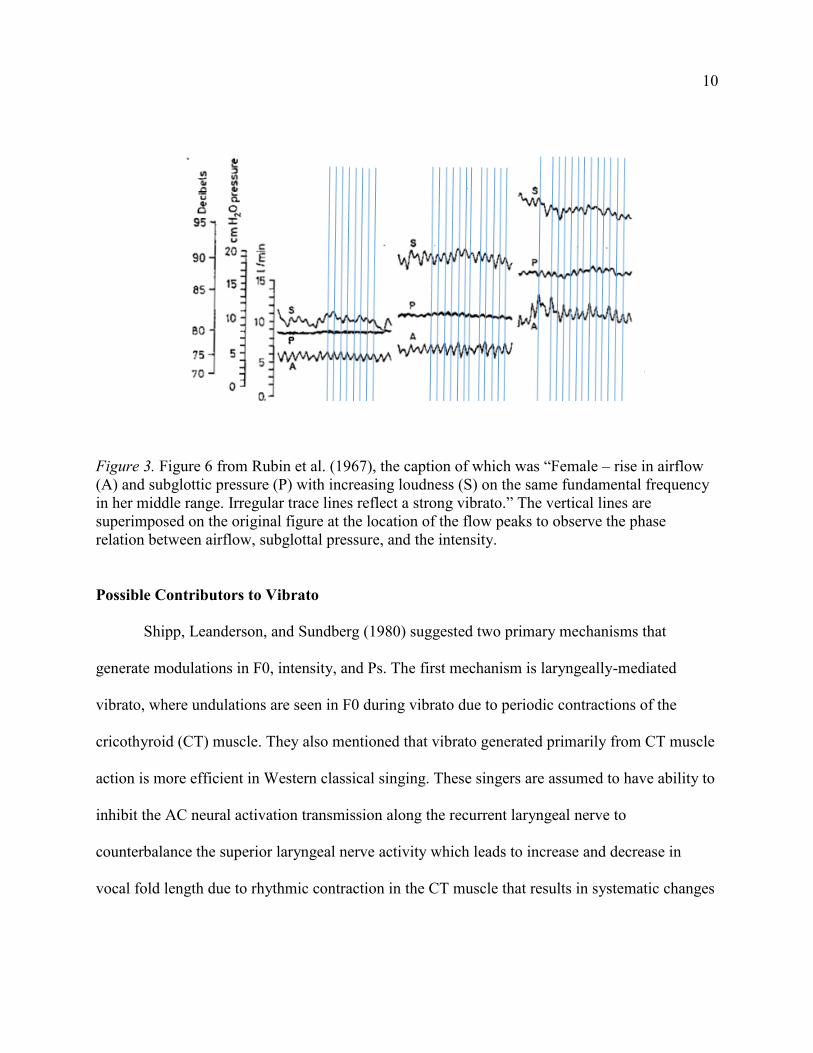
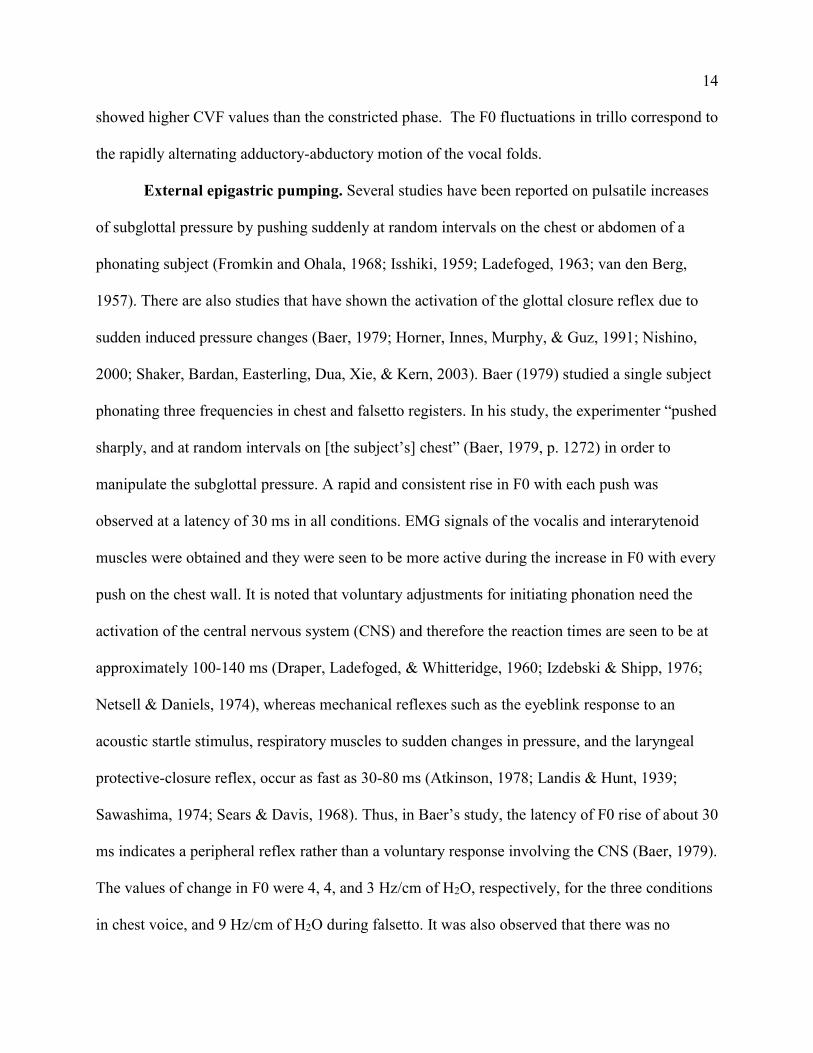
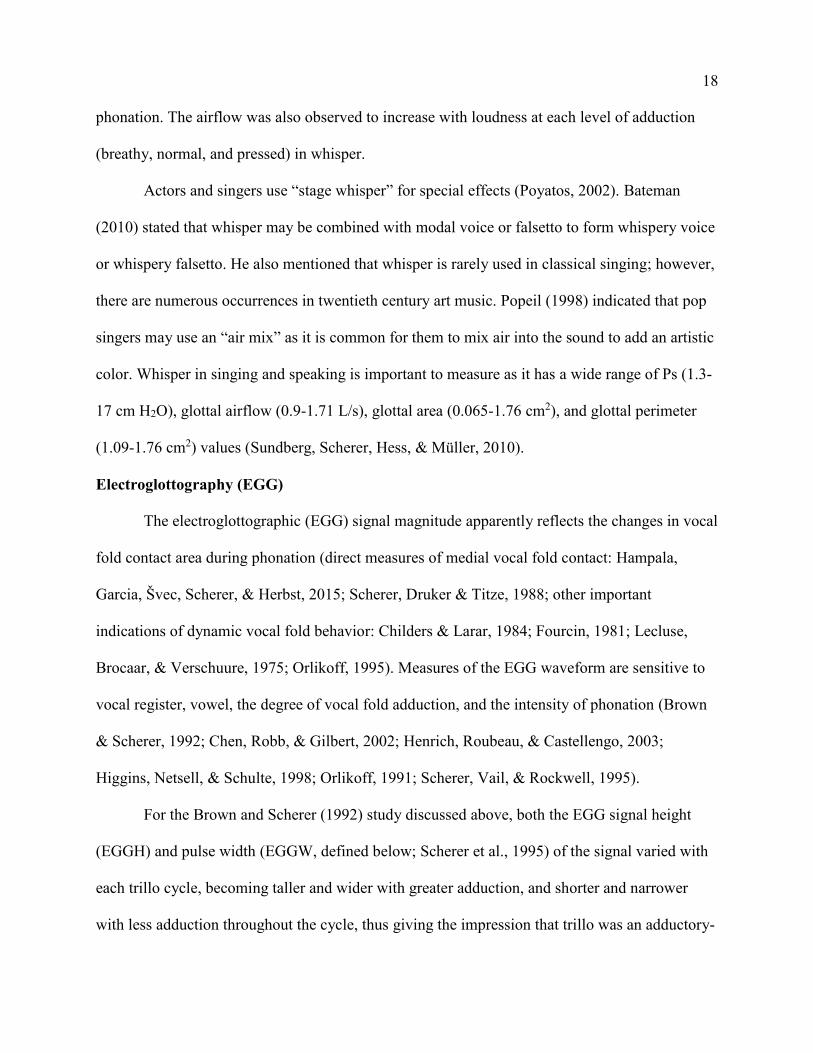
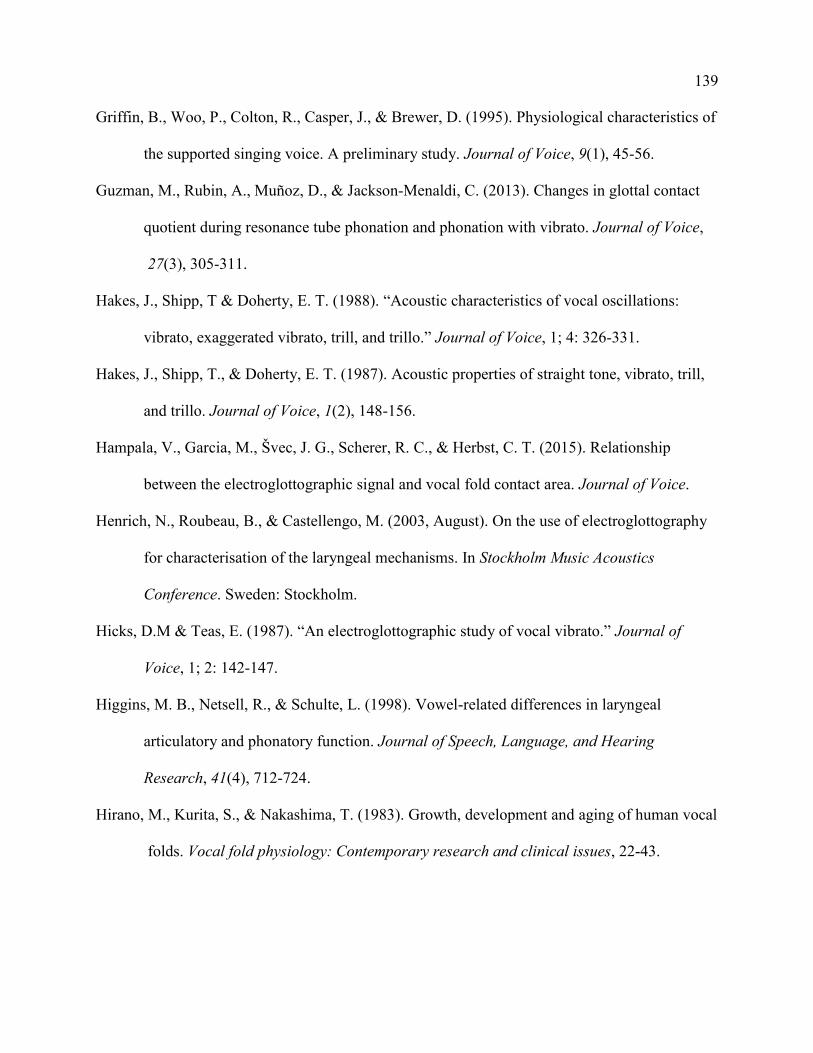
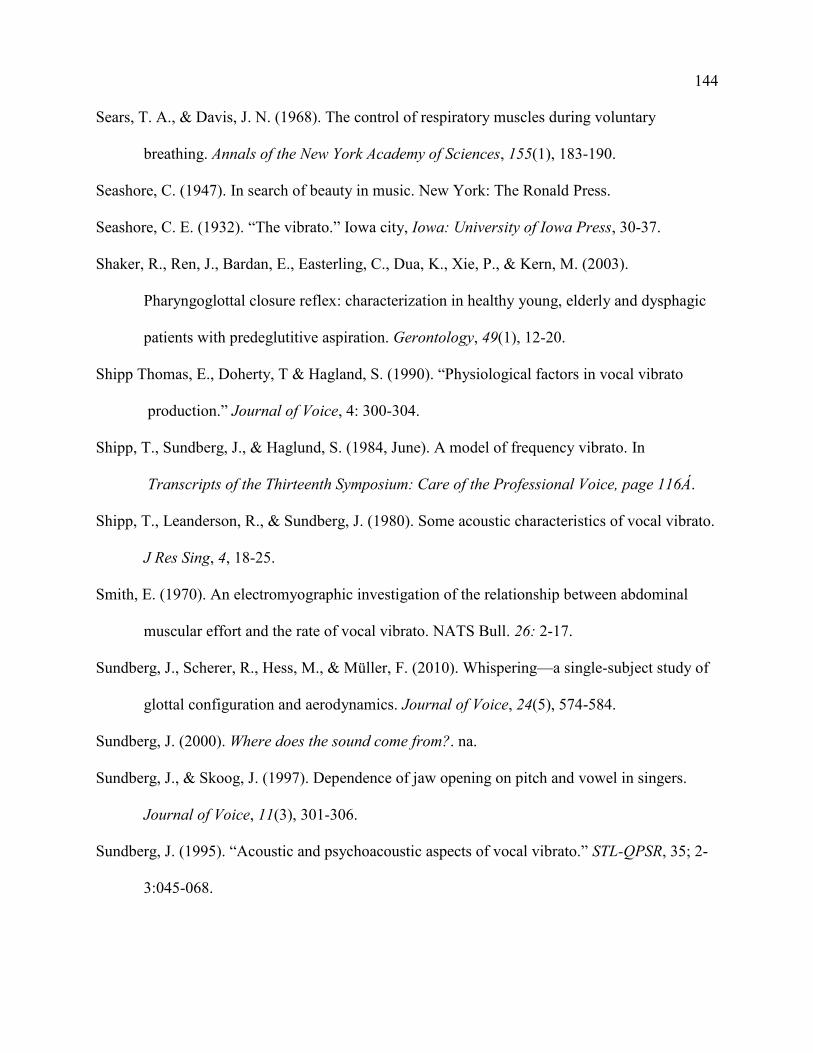
three signals were essentially in phase with each other. Figure 3 show recordings for a female
singing on a constant middle range pitch with a relatively strong vibrato in both the flow and
intensity signals, for the three loudness levels. For the softest token, the flow lagged intensity by
approximately 58 degrees, and for the middle loudness, flow lagged intensity by a similar value
of 55 degrees. For the loudest token, however, flow and intensity were nearly out of phase
despite the singer using the same pitch, with flow lagging intensity by approximately 152
degrees. For both the middle and highest loudness levels, the subglottal pressure was nearly out
of phase with the airflow.
The results from the Rubin et al. (1967) study suggest that while singing, the vibrato-
related oscillations of flow, subglottal pressure, and intensity may have varying phase
relationships with each other. In addition, the airflow signals in Figure 3 illustrate that airflow
vibrato may not be a regularly oscillating signal, but may have a complex shape. This apparently
is the first study to measure aerodynamic aspects of vibrato, and to report the oscillations not
only in F0 but also in Ps, intensity, and airflow.
9
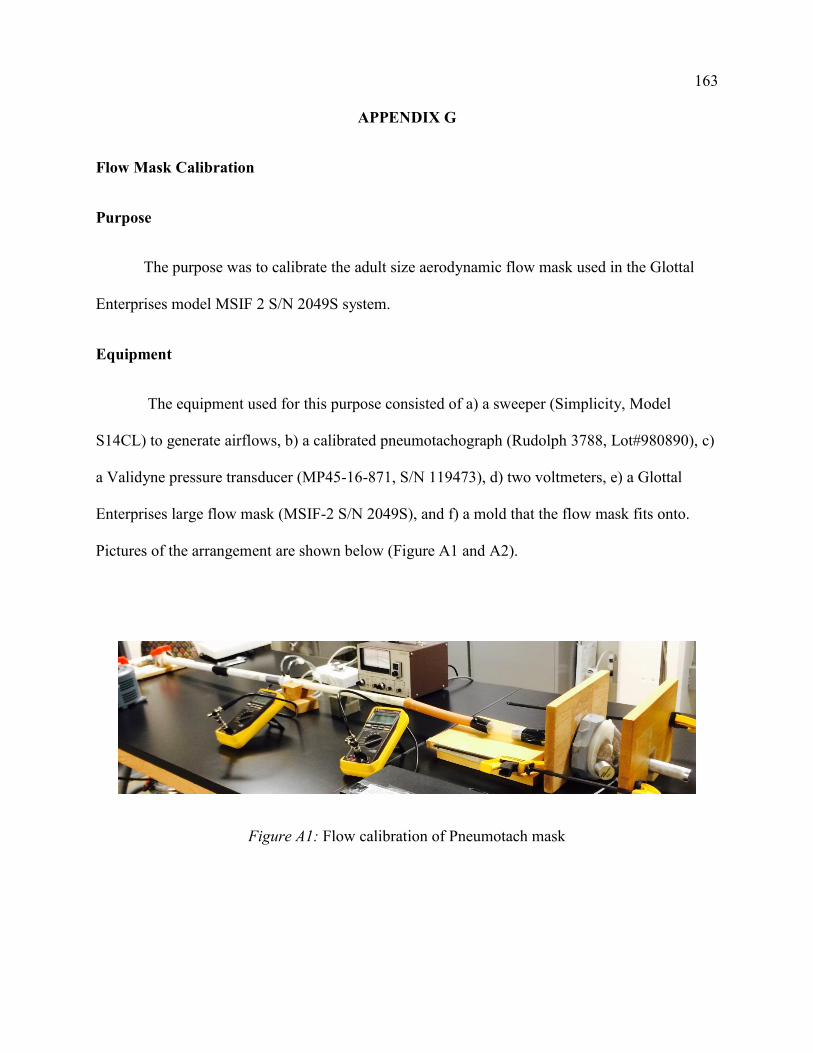
Figure 1. Figure 4 from Rubin et al. (1967), the caption of which was “Male- rise in airflow (A) and subglottic pressure (P) passing from low to middle to upper range at increasing levels of loudness (S).” The vertical lines are superimposed on the original figure at the location of the flow peaks to observe the phase relation between airflow, subglottal pressure, and intensity.
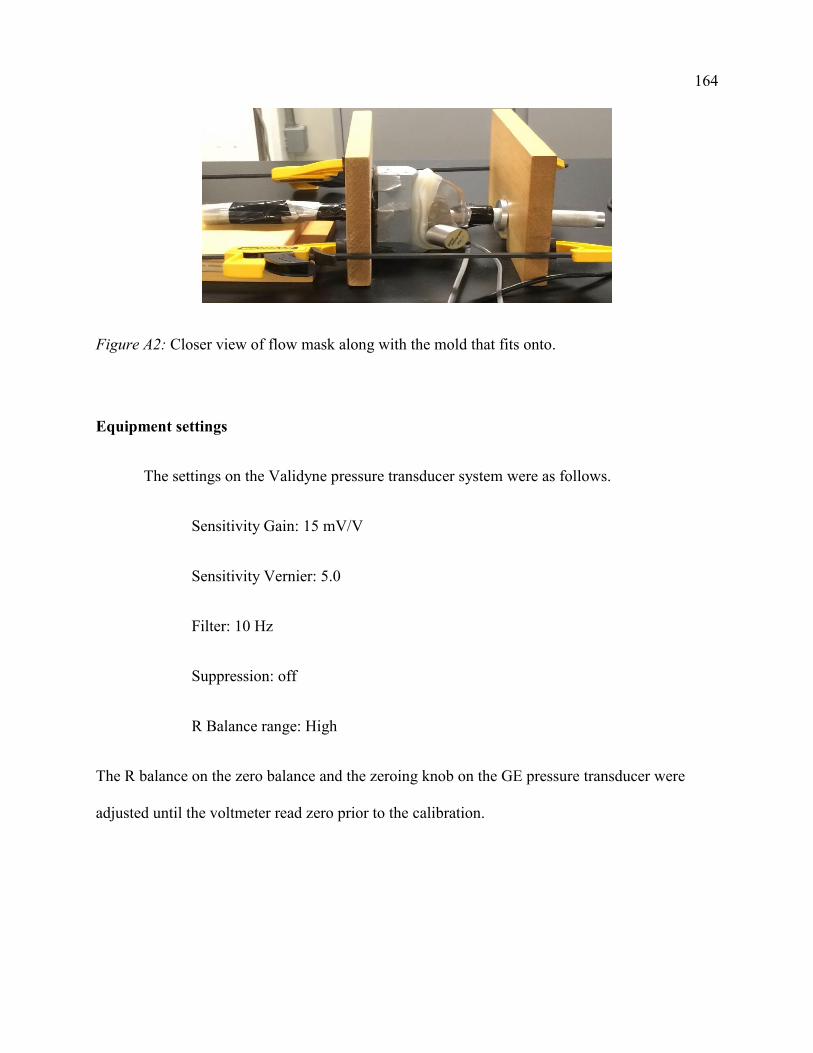
Figure 2. Figure 5 from Rubin et al. (1967), the caption of which was “Female – rise in airflow (A) and subglottic pressure (P) with increasing loudness (S) on the same fundamental frequencyin her low range.” The vertical lines are superimposed on the original figure at the location of theflow peaks to observe the phase relation between airflow, subglottal pressure, and the intensity.
10
Figure 3. Figure 6 from Rubin et al. (1967), the caption of which was “Female – rise in airflow (A) and subglottic pressure (P) with increasing loudness (S) on the same fundamental frequencyin her middle range. Irregular trace lines reflect a strong vibrato.” The vertical lines aresuperimposed on the original figure at the location of the flow peaks to observe the phaserelation between airflow, subglottal pressure, and the intensity.
Possible Contributors to Vibrato
Shipp, Leanderson, and Sundberg (1980) suggested two primary mechanisms that
generate modulations in F0, intensity, and Ps. The first mechanism is laryngeally-mediated
vibrato, where undulations are seen in F0 during vibrato due to periodic contractions of the
cricothyroid (CT) muscle. They also mentioned that vibrato generated primarily from CT muscle
action is more efficient in Western classical singing. These singers are assumed to have ability to
inhibit the AC neural activation transmission along the recurrent laryngeal nerve to
counterbalance the superior laryngeal nerve activity which leads to increase and decrease in
vocal fold length due to rhythmic contraction in the CT muscle that results in systematic changes
11
below and above the target pitch. Thus, the first mechanism assumes that CT action provides the
vocal fold lengthening and tension variations to create F0 vibrato.
This mechanism is supported by a review of EMG studies by Hirano (1995) involving
five subjects, where he found that the CT muscle appears to be the dominant muscle to control
F0 vibrato. His studies were with four American singers and one Japanese singer. The CT
muscle of all 5 subjects presented with oscillating activities during vibrato phonation” (Hirano,
1995, p. 12). The inhibition of the adductory system suggested in the Shipp et al. (1980) study,
however, is not supported by the Hirano review. That is, the lateral cricothyroid muscle (LCA)
also had similar oscillation activity for all 5 subjects, with one not always having LCA activity.
The thyroarytenoid (TA) muscle “often presented with oscillation synchronous with vibrato in all
4 singers investigated, but not always” (Hirano, 1995, p.12).
The second mechanism suggested by Shipp et al., (1990) is abdominally-mediated
vibrato, where undulations in F0 are due to the counteraction of intrinsic laryngeal muscles to
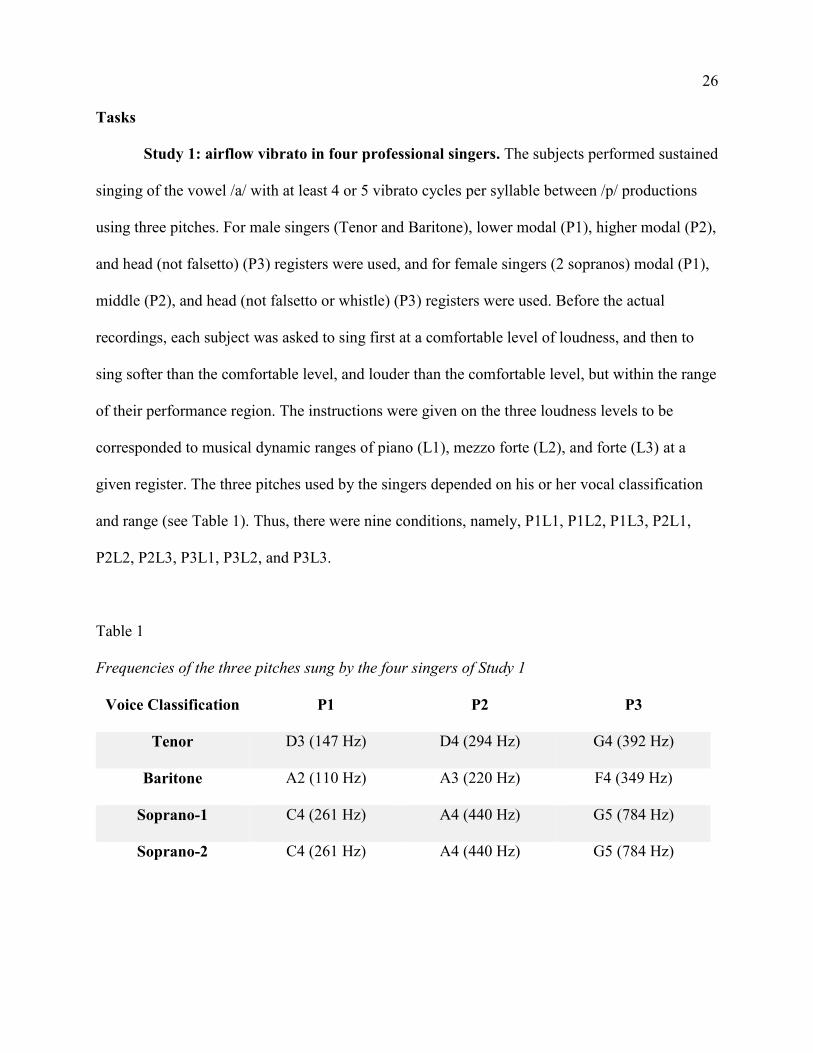
Study 1: airflow vibrato in four professional singers. The subjects performed sustained
singing of the vowel /a/ with at least 4 or 5 vibrato cycles per syllable between /p/ productions
using three pitches. For male singers (Tenor and Baritone), lower modal (P1), higher modal (P2),
and head (not falsetto) (P3) registers were used, and for female singers (2 sopranos) modal (P1),
middle (P2), and head (not falsetto or whistle) (P3) registers were used. Before the actual
recordings, each subject was asked to sing first at a comfortable level of loudness, and then to
sing softer than the comfortable level, and louder than the comfortable level, but within the range
of their performance region. The instructions were given on the three loudness levels to be
corresponded to musical dynamic ranges of piano (L1), mezzo forte (L2), and forte (L3) at a
given register. The three pitches used by the singers depended on his or her vocal classification
and range (see Table 1). Thus, there were nine conditions, namely, P1L1, P1L2, P1L3, P2L1,
P2L2, P2L3, P3L1, P3L2, and P3L3.
Table 1
Frequencies of the three pitches sung by the four singers of Study 1
Voice Classification P1 P2 P3
Tenor D3 (147 Hz) D4 (294 Hz) G4 (392 Hz)
Baritone A2 (110 Hz) A3 (220 Hz) F4 (349 Hz)
Soprano-1 C4 (261 Hz) A4 (440 Hz) G5 (784 Hz)
Soprano-2 C4 (261 Hz) A4 (440 Hz) G5 (784 Hz)
27
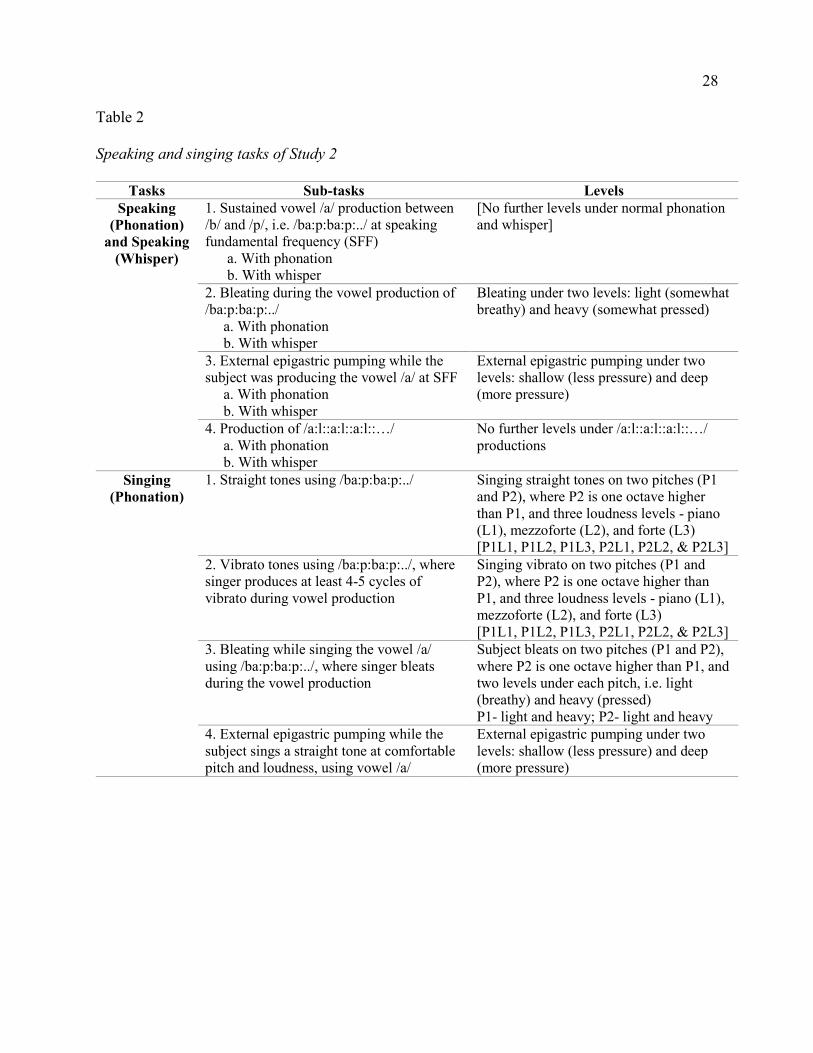
Study 2: sources of airflow vibrato. The four subjects performed speaking and singing
tasks. Under speaking tasks, there were two sub-tasks, phonation and whisper. Speaking
fundamental frequency was used for most of the speaking tasks as it correlates with perceived
pitch of the subject’s voice (Baken & Orlikoff, 2000). Auditory cues were given in between
using a keyboard up on subject’s request to maintain the pitch at similar range. Under singing
tasks, there was only phonation. Table 2 gives the outline of all tasks performed by the subjects.
The frequencies of pitches P1 and P2 sung by the baritones were A2 (110 Hz) and A3 (220 Hz),
and for the sopranos were A3 (220 Hz) and A4 (440 Hz), respectively.
28
Table 2
Speaking and singing tasks of Study 2
Tasks Sub-tasks Levels Speaking
(Phonation) and Speaking
(Whisper)
1. Sustained vowel /a/ production between/b/ and /p/, i.e. /ba:p:ba:p:../ at speakingfundamental frequency (SFF)
a. With phonationb. With whisper
[No further levels under normal phonation and whisper]
2. Bleating during the vowel production of/ba:p:ba:p:../
a. With phonationb. With whisper
Bleating under two levels: light (somewhat breathy) and heavy (somewhat pressed)
3. External epigastric pumping while thesubject was producing the vowel /a/ at SFF
a. With phonationb. With whisper
External epigastric pumping under two levels: shallow (less pressure) and deep (more pressure)
4. Production of /a:l::a:l::a:l::…/a. With phonationb. With whisper
No further levels under /a:l::a:l::a:l::…/ productions
Singing (Phonation)
1. Straight tones using /ba:p:ba:p:../ Singing straight tones on two pitches (P1 and P2), where P2 is one octave higher than P1, and three loudness levels - piano (L1), mezzoforte (L2), and forte (L3) [P1L1, P1L2, P1L3, P2L1, P2L2, & P2L3]
2. Vibrato tones using /ba:p:ba:p:../, wheresinger produces at least 4-5 cycles ofvibrato during vowel production
Singing vibrato on two pitches (P1 and P2), where P2 is one octave higher than P1, and three loudness levels - piano (L1), mezzoforte (L2), and forte (L3) [P1L1, P1L2, P1L3, P2L1, P2L2, & P2L3]
3. Bleating while singing the vowel /a/using /ba:p:ba:p:../, where singer bleatsduring the vowel production
Subject bleats on two pitches (P1 and P2), where P2 is one octave higher than P1, and two levels under each pitch, i.e. light (breathy) and heavy (pressed) P1- light and heavy; P2- light and heavy
4. External epigastric pumping while thesubject sings a straight tone at comfortablepitch and loudness, using vowel /a/
External epigastric pumping under two levels: shallow (less pressure) and deep (more pressure)
29
Measures and Procedures
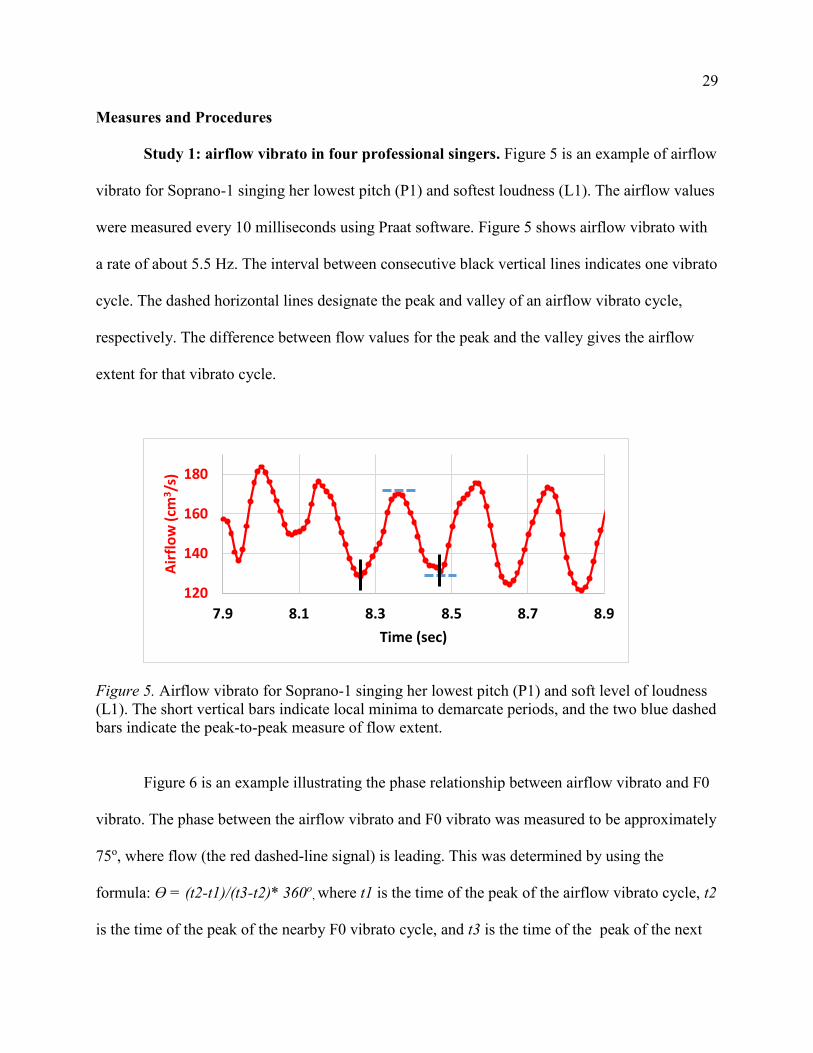
Study 1: airflow vibrato in four professional singers. Figure 5 is an example of airflow
vibrato for Soprano-1 singing her lowest pitch (P1) and softest loudness (L1). The airflow values
were measured every 10 milliseconds using Praat software. Figure 5 shows airflow vibrato with
a rate of about 5.5 Hz. The interval between consecutive black vertical lines indicates one vibrato
cycle. The dashed horizontal lines designate the peak and valley of an airflow vibrato cycle,
respectively. The difference between flow values for the peak and the valley gives the airflow
extent for that vibrato cycle.
Figure 5. Airflow vibrato for Soprano-1 singing her lowest pitch (P1) and soft level of loudness (L1). The short vertical bars indicate local minima to demarcate periods, and the two blue dashed bars indicate the peak-to-peak measure of flow extent.
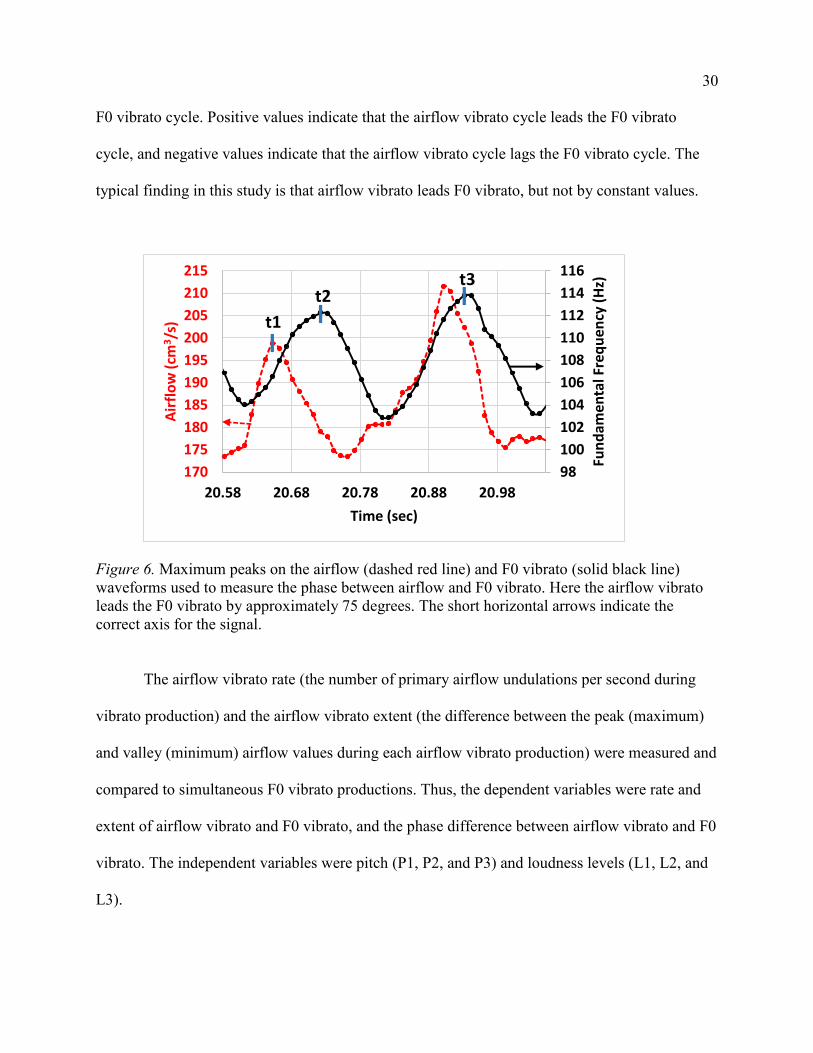
Figure 6 is an example illustrating the phase relationship between airflow vibrato and F0
vibrato. The phase between the airflow vibrato and F0 vibrato was measured to be approximately
75o, where flow (the red dashed-line signal) is leading. This was determined by using the
formula: ϴ = (t2-t1)/(t3-t2)* 360o, where t1 is the time of the peak of the airflow vibrato cycle, t2
is the time of the peak of the nearby F0 vibrato cycle, and t3 is the time of the peak of the next
120
140
160
180
7.9 8.1 8.3 8.5 8.7 8.9
Air
flo
w (
cm3/s
)
Time (sec)
30
F0 vibrato cycle. Positive values indicate that the airflow vibrato cycle leads the F0 vibrato
cycle, and negative values indicate that the airflow vibrato cycle lags the F0 vibrato cycle. The
typical finding in this study is that airflow vibrato leads F0 vibrato, but not by constant values.
Figure 6. Maximum peaks on the airflow (dashed red line) and F0 vibrato (solid black line) waveforms used to measure the phase between airflow and F0 vibrato. Here the airflow vibrato leads the F0 vibrato by approximately 75 degrees. The short horizontal arrows indicate the correct axis for the signal.
The airflow vibrato rate (the number of primary airflow undulations per second during
vibrato production) and the airflow vibrato extent (the difference between the peak (maximum)
and valley (minimum) airflow values during each airflow vibrato production) were measured and
compared to simultaneous F0 vibrato productions. Thus, the dependent variables were rate and
extent of airflow vibrato and F0 vibrato, and the phase difference between airflow vibrato and F0
vibrato. The independent variables were pitch (P1, P2, and P3) and loudness levels (L1, L2, and
L3).
98
100
102
104
106
108
110
112
114
116
170
175
180
185
190
195
200
205
210
215
20.58 20.68 20.78 20.88 20.98
Fun
dam
enta
l Fre
qu
ency
(H
z)
Air
flo
w (
cm3/s
)
Time (sec)
ll
lt1
t2t3
31
A three-way ANOVA was performed for a 3 x 2 x 2 three-factor design (3 loudness
levels, 2 pitches, and 2 genders) in order to compare the mean differences of F0 vibrato extent
and airflow vibrato extent. Correlation coefficients were measured to see the strength of
relationship between airflow and F0 vibrato rates. Phase values are reported without statistical
analysis. The regularity and consistency of the airflow waveforms are interpreted subjectively
depending on the presence or absence of multiple peaks, the shape of the waveform (quasi-
sinusoidal), and its relation to F0 vibrato. The average oral pressures for all nine conditions are
reported by taking the average of pressures during the lip occlusion of stop consonant /p: /
production. The average intensity values were measured using Praat for all nine conditions.
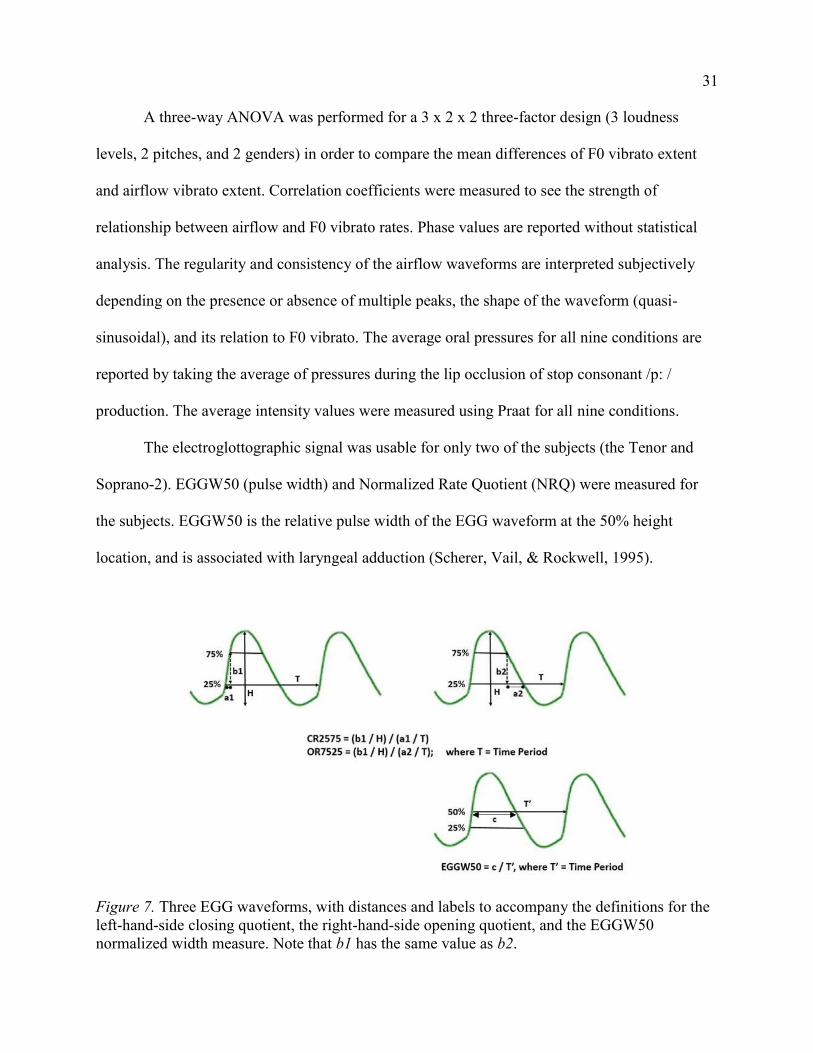
The electroglottographic signal was usable for only two of the subjects (the Tenor and
Soprano-2). EGGW50 (pulse width) and Normalized Rate Quotient (NRQ) were measured for
the subjects. EGGW50 is the relative pulse width of the EGG waveform at the 50% height
location, and is associated with laryngeal adduction (Scherer, Vail, & Rockwell, 1995).
Figure 7. Three EGG waveforms, with distances and labels to accompany the definitions for the left-hand-side closing quotient, the right-hand-side opening quotient, and the EGGW50 normalized width measure. Note that b1 has the same value as b2.
32
The Normalized Rate Quotient (NRQ), a measure similar to the EGG Speed Quotient of
Dromey et al. (2009), was obtained as a ratio of CR2575 divided by OR7525 (see Figure 7), viz.,
NRQ = CR2575 / OR7525. The closing slope ratio, CR2575, is defined as the normalized rise
(b1/H) divided by the normalized run a1/T, where b1 is the EGG waveform height corresponding
the segment between 25% and 75% of the peak-to-peak amplitude H, a1 is the time segment
corresponding to b1, and T is the cycle period. The opening slope ratio, OR7525, is defined by
the normalized rise b2/H divided by the normalized run a2/T, where b2 is the EGG waveform
height corresponding to the segment between 75% and 25% of H, and a2 represents the time for
the signal to drop from the 75% to the 25% level (Fisher et al., 1996). When the NRQ expression
is simplified, NRQ = a2/a1, the ratio of the duration to lower the EGG signal from 75% to 25%
of the height on the right hand side to the duration to raise the EGG signal from 25% to 75% of
the height on the left hand side of the EGG cycle. NRQ is a negative quantity because it is the
ratio of a positive slope (left hand side) and a negative slope (right hand side). The closing and
opening slope measures depend upon the speed and manner of vocal fold movement during
contact. A larger negative NRQ value means that the medial vocal fold surfaces come together
faster or separate slower. The two measures (EGGW and NRQ) were obtained for a sequence of
about 3-4 cycles at both the peaks and the valleys of the airflow vibrato cycles. The values were
averaged at the peaks and averaged at the valleys to give representative EGGW and NRQ values
for each utterance. Pairwise t-tests were performed to observe if there was any statistically
significant difference in glottal adduction between peaks and valleys of airflow vibrato.
Study 2: sources of airflow vibrato. The airflow and F0 modulation extents and rates,
and all the other measures - average airflow, average intensity, intensity extents, and oral
pressures were measured using the same method mentioned in Study 1 for vibrato. Another
33
measure is percent airflow, which is average airflow extent for vibrato, bleat, or external
epigastric pumping conditions, divided by the corresponding average airflow value for the
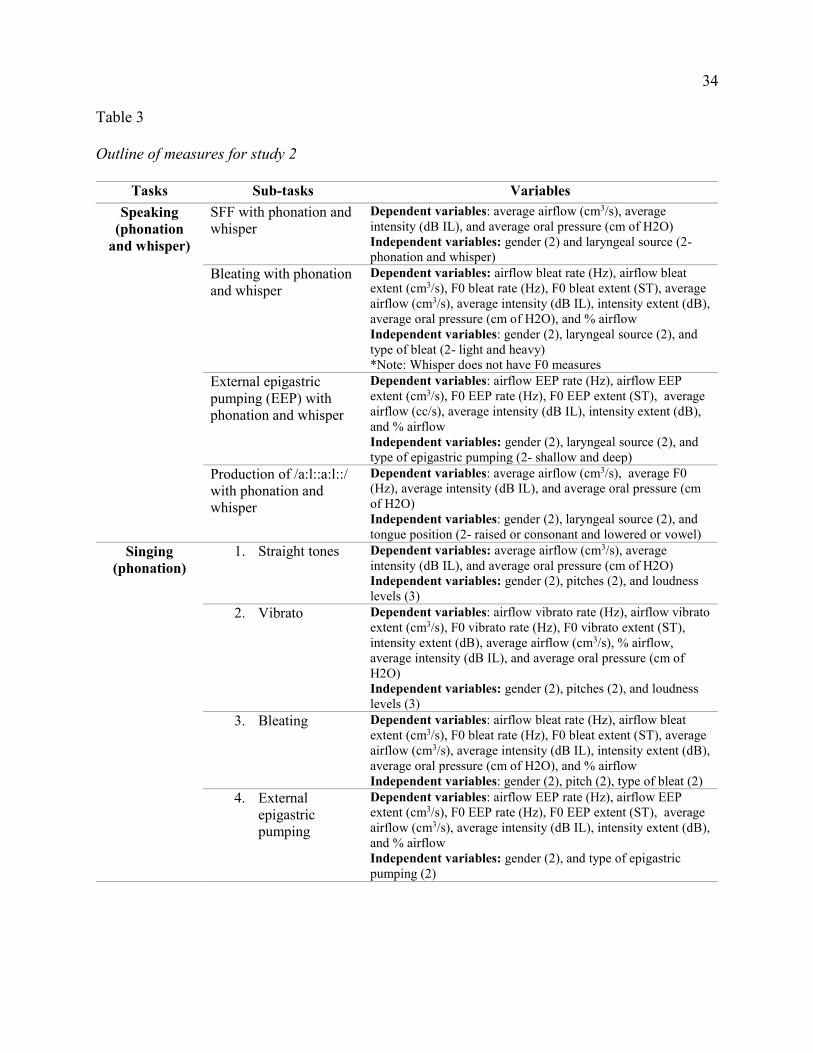
condition. Table 3 gives an outline of obtained measures from individual tasks. Each subject was
screened before the actual recordings to make sure that they were able to perform all the tasks in
the study, primarily vibrato, bleat, and their sensitivity to external epigastric pumping. Each task
had three recordings, each recording had three repetitions, and each token was used from each
recording. For a few measures, more than one token was taken from each recording in case of
flow mask leak or inaccurately obtained oral pressures. For example, for one of the subjects, the
oral pressure tube was clogged with excessive saliva during certain tasks, and those recordings
were not used.
34
Table 3
Outline of measures for study 2
Tasks Sub-tasks Variables Speaking
(phonation and whisper)
SFF with phonation and whisper
Dependent variables: average airflow (cm3/s), average intensity (dB IL), and average oral pressure (cm of H2O) Independent variables: gender (2) and laryngeal source (2- phonation and whisper)
Bleating with phonation and whisper
Dependent variables: airflow bleat rate (Hz), airflow bleat extent (cm3/s), F0 bleat rate (Hz), F0 bleat extent (ST), average airflow (cm3/s), average intensity (dB IL), intensity extent (dB), average oral pressure (cm of H2O), and % airflow Independent variables: gender (2), laryngeal source (2), and type of bleat (2- light and heavy) *Note: Whisper does not have F0 measures
External epigastric pumping (EEP) with phonation and whisper
Dependent variables: airflow EEP rate (Hz), airflow EEP extent (cm3/s), F0 EEP rate (Hz), F0 EEP extent (ST), average airflow (cc/s), average intensity (dB IL), intensity extent (dB), and % airflow Independent variables: gender (2), laryngeal source (2), and type of epigastric pumping (2- shallow and deep)
Production of /a:l::a:l::/ with phonation and whisper
Dependent variables: average airflow (cm3/s), average F0 (Hz), average intensity (dB IL), and average oral pressure (cm of H2O) Independent variables: gender (2), laryngeal source (2), and tongue position (2- raised or consonant and lowered or vowel)
Singing (phonation)
1. Straight tones Dependent variables: average airflow (cm3/s), average intensity (dB IL), and average oral pressure (cm of H2O) Independent variables: gender (2), pitches (2), and loudness levels (3)
2. Vibrato Dependent variables: airflow vibrato rate (Hz), airflow vibrato extent (cm3/s), F0 vibrato rate (Hz), F0 vibrato extent (ST), intensity extent (dB), average airflow (cm3/s), % airflow, average intensity (dB IL), and average oral pressure (cm of H2O) Independent variables: gender (2), pitches (2), and loudness levels (3)
3. Bleating Dependent variables: airflow bleat rate (Hz), airflow bleat extent (cm3/s), F0 bleat rate (Hz), F0 bleat extent (ST), average airflow (cm3/s), average intensity (dB IL), intensity extent (dB), average oral pressure (cm of H2O), and % airflow Independent variables: gender (2), pitch (2), type of bleat (2)
4. External epigastric pumping
Dependent variables: airflow EEP rate (Hz), airflow EEP extent (cm3/s), F0 EEP rate (Hz), F0 EEP extent (ST), average airflow (cm3/s), average intensity (dB IL), intensity extent (dB), and % airflow Independent variables: gender (2), and type of epigastric pumping (2)
35
For statistical analysis, a repeated measures 2-crossed and 3-staged ANOVA model was
used to compare the mean differences among different levels of tasks. The 2-crossed indicates
crossed effect of subjects and gender on measures, and 3-staged is speaking (phonation),
speaking (whisper), and singing. The main effects of gender (2 levels: Male, Female), task (2
Pumping-EEP), and levels of sub-tasks (24 levels: normal phonation (Sp), normal whisper (Sp),
lighter bleat (Sp), heavier bleat (Sp), shallow pumping (Sp), deep pumping (Sp), low pitch piano
straight tone (Sn), low pitch mezzoforte straight tone (Sn), low pitch forte straight tone (Sn), high
pitch piano straight tone (Sn), high pitch mezzoforte straight tone (Sn), high pitch forte straight
tone (Sn), low pitch piano vibrato (Sn), low pitch mezzoforte vibrato (Sn), low pitch forte vibrato
(Sn), high pitch piano vibrato (Sn), high pitch mezzoforte vibrato (Sn), high pitch forte vibrato
(Sn), low pitch lighter bleat (Sn), low pitch heavy bleat (Sn), high pitch lighter bleat (Sn), high
pitch heavier bleat (Sn), shallow pumping EEP (Sn), and deep pumping EEP (Sn) were given.
The interaction between gender and tasks, gender and sub-tasks, and gender and levels of sub-
tasks was also given. The multiple level variate main effects and interaction effects were
interpreted using a significance value of p < 0.05. Tukey’s HSD (honest significant difference)
test was used for post-hoc analyses wherever necessary to further see the differences among the
sub-groups. For few of the conditions, individual paired and intersample t-tests were done in
order to remove the effects of whisper among the speaking tasks, as the whisper results were
different from speaking phonation and singing tasks.
The measures of modulations in airflow, F0, and intensity were measured by using the
vowel segment of /ba:p:ba:p:../ (same as in Study 1). The subjects were asked to produce vibrato
and bleat during the vowel portion. Bleating is similar to trillo. Although bleat was not part of
36
their singing training, all the subjects were able to bleat at a satisfactory level. Bleating is also
called machine-gun vibrato, and is perceptually like a sheep bleat or a giggle. During the task of
external epigastric pumping, the student researcher stood next to the subject, and placed two
fingers (index and middle fingers) on the external epigastrium region of the subject. The
epigastrium is the upper abdominal portion right below the sternum, and the lung pressure is
highly sensitive to external pressure applications at that location (Vennard, 1967). The subject
was asked to produce a sustained vowel /a/ using phonation and whisper. During the production,
the student researcher gently moved her fingers to and fro (perpendicular to the body) on the
epigastric region externally. There was no pressure transducer used to monitor the rates or actual
pressure of the pumping during the experiment. There was shallow or lighter pressure and deep
or more pressure used during the epigastric pumping. None of the subjects felt discomfort, pain,
and/or rejected the tasks. The remaining tasks are given in Table 2. EGGW measures were
obtained in the same way as mentioned in Study 1 for vibrato, at the peaks and valleys of the
airflow modulations. Pairwise t-tests were performed to compare the differences in EGGW and
NRQ between peaks and valleys of airflow modulations during vibrato.
Because of the relatively low number of sample points within each vibrato cycle, the
measures of rate, extent, and phase for the various modulated signals of this project were easily
obtained because they involved the maximum and minimum values of the modulation cycles.
That is, the peaks and valleys were clearly represented by single sample points (e.g., see Figure 5
that shows between 15 and 21 points per cycle), and thus for those measures reliability measures
were not necessary. For complex signal modulation cycles, a consensus approach was used to
decide on the relevant peaks and valleys for the measures (two researchers made joint decisions).
37
CHAPTER III. RESULTS
Study 1: Airflow Vibrato in Four Professional Singers
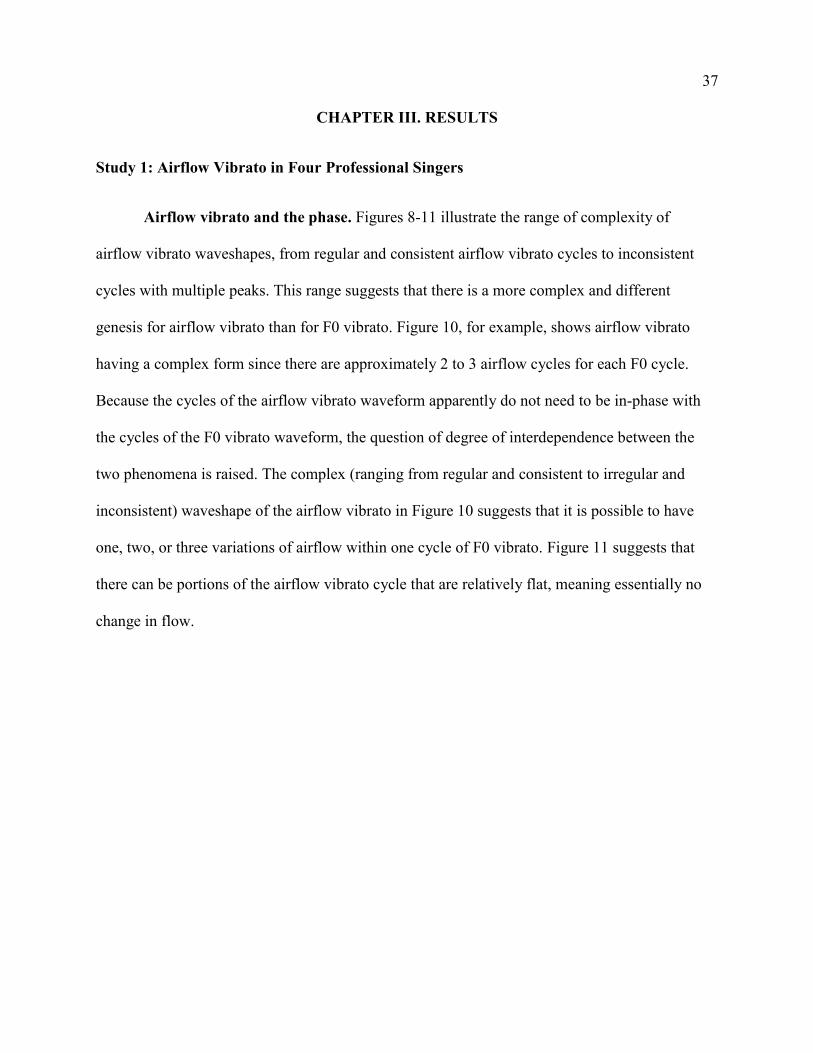
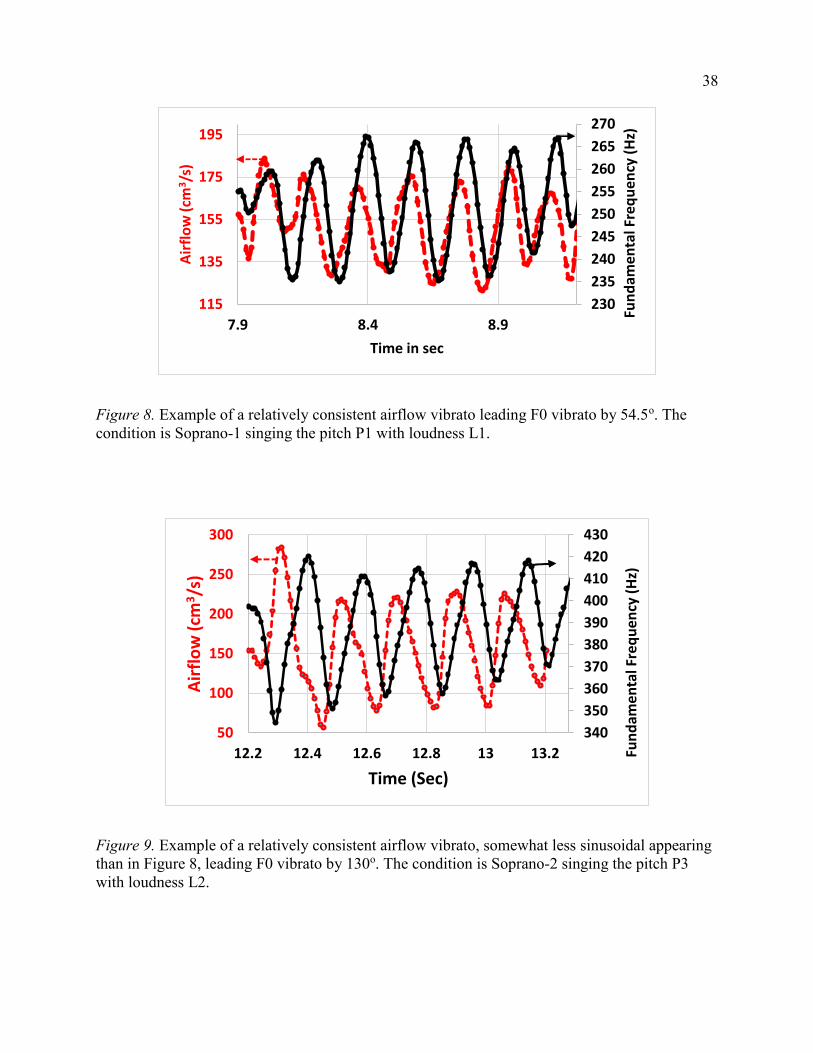
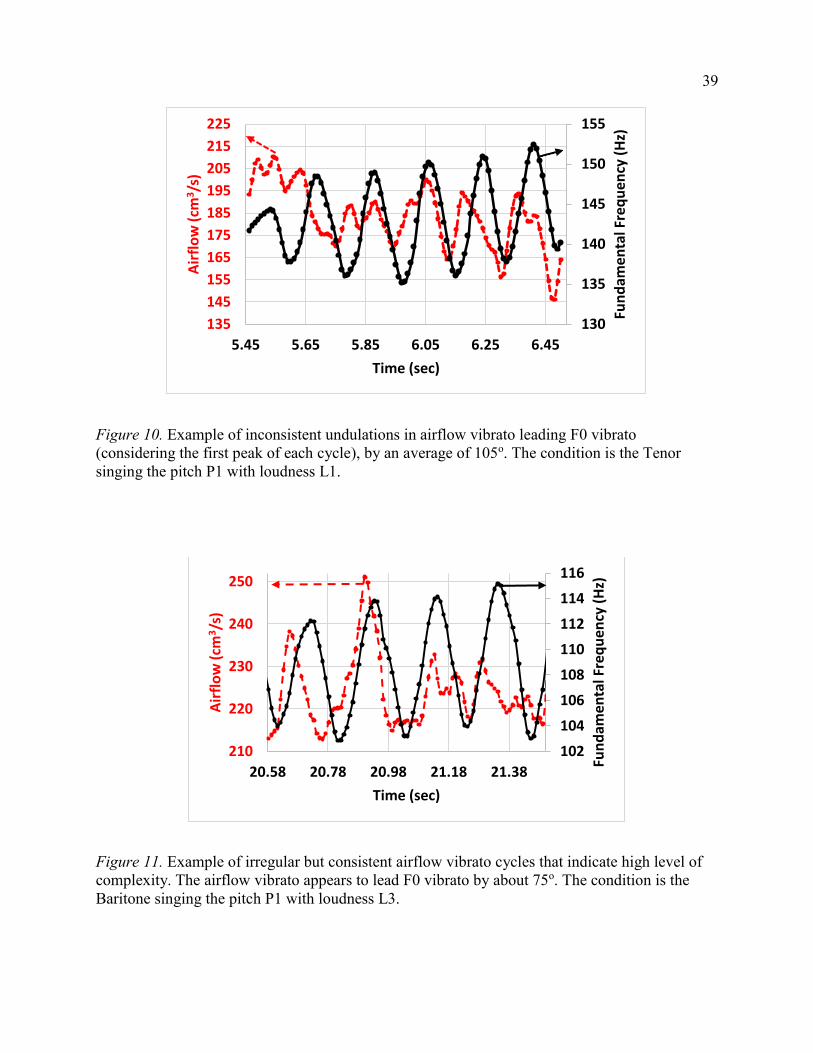
Airflow vibrato and the phase. Figures 8-11 illustrate the range of complexity of
airflow vibrato waveshapes, from regular and consistent airflow vibrato cycles to inconsistent
cycles with multiple peaks. This range suggests that there is a more complex and different
genesis for airflow vibrato than for F0 vibrato. Figure 10, for example, shows airflow vibrato
having a complex form since there are approximately 2 to 3 airflow cycles for each F0 cycle.
Because the cycles of the airflow vibrato waveform apparently do not need to be in-phase with
the cycles of the F0 vibrato waveform, the question of degree of interdependence between the
two phenomena is raised. The complex (ranging from regular and consistent to irregular and
inconsistent) waveshape of the airflow vibrato in Figure 10 suggests that it is possible to have
one, two, or three variations of airflow within one cycle of F0 vibrato. Figure 11 suggests that
there can be portions of the airflow vibrato cycle that are relatively flat, meaning essentially no
change in flow.
38
Figure 8. Example of a relatively consistent airflow vibrato leading F0 vibrato by 54.5o. The condition is Soprano-1 singing the pitch P1 with loudness L1.
Figure 9. Example of a relatively consistent airflow vibrato, somewhat less sinusoidal appearing than in Figure 8, leading F0 vibrato by 130o. The condition is Soprano-2 singing the pitch P3 with loudness L2.
230
235
240
245
250
255
260
265
270
115
135
155
175
195
7.9 8.4 8.9
Fun
dam
enta
l Fre
qu
ency
(H
z)
Air
flo
w (
cm3/s
)
Time in sec
340
350
360
370
380
390
400
410
420
430
50
100
150
200
250
300
12.2 12.4 12.6 12.8 13 13.2 Fun
dam
enta
l Fre
qu
ency
(H
z)
Air
flo
w (
cm3/s
)
Time (Sec)
39
Figure 10. Example of inconsistent undulations in airflow vibrato leading F0 vibrato (considering the first peak of each cycle), by an average of 105o. The condition is the Tenor singing the pitch P1 with loudness L1.
Figure 11. Example of irregular but consistent airflow vibrato cycles that indicate high level of complexity. The airflow vibrato appears to lead F0 vibrato by about 75o. The condition is the Baritone singing the pitch P1 with loudness L3.
130
135
140
145
150
155
135
145
155
165
175
185
195
205
215
225
5.45 5.65 5.85 6.05 6.25 6.45
Fun
dam
enta
l Fre
qu
ency
(H
z)
Air
flo
w (
cm3/s
)
Time (sec)
102
104
106
108
110
112
114
116
210
220
230
240
250
20.58 20.78 20.98 21.18 21.38
Fun
dam
enta
l Fre
qu
ency
(H
z)
Air
flo
w (
cm3/s
)
Time (sec)
40
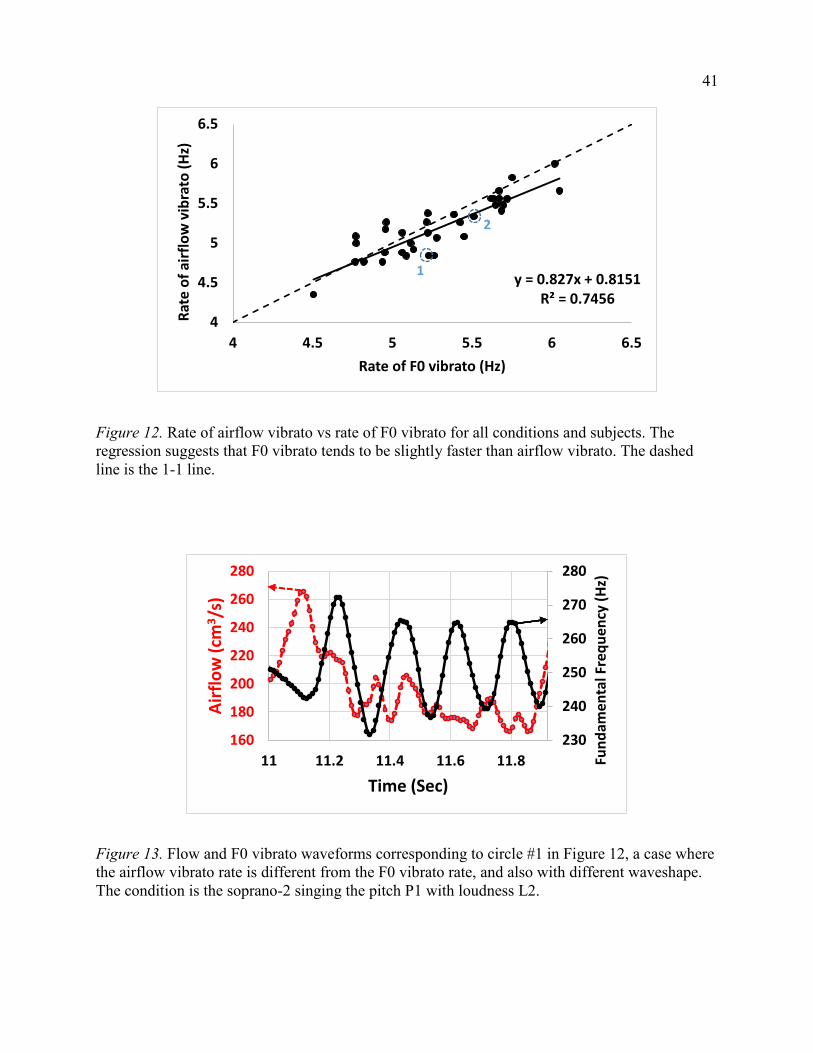
Rate of airflow vibrato and its relationship to rate of F0 vibrato. The rate of airflow
vibrato was measured and compared with the rate of F0 vibrato. Figure 12 shows the rates for
both for all conditions (4 singers X 3 pitches X 3 loudness levels). The relationship between the
rate of airflow vibrato and rate of F0 vibrato was seen to be strong (R2=0.7456). This suggests
that similar mechanisms govern the rate of both types of vibrato. Because only 4-5 cycles were
used to obtain vibrato rates, a relatively small number of cycles, and the airflow vibrato
waveform can be complex (non-sinusoidal), the calculation for airflow vibrato rate is less valid
or at least more difficult to obtain, and thus the relationship might actually be stronger than
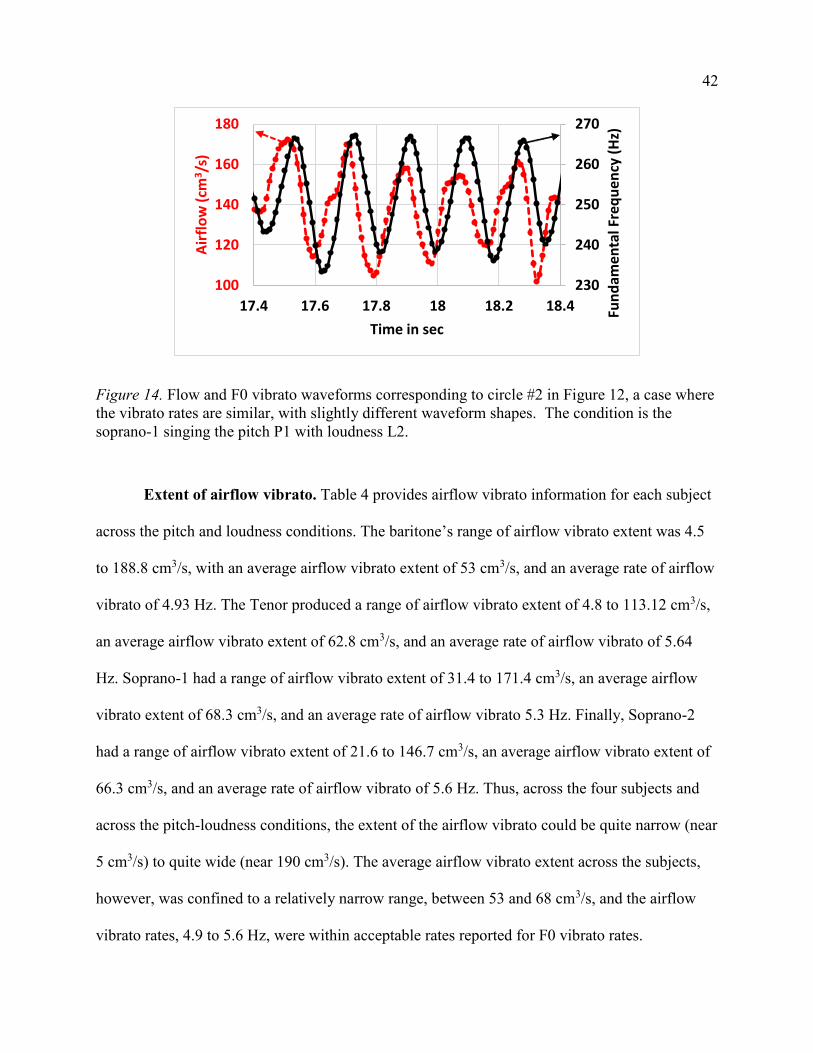
indicated in this project’s sample. Figure 13 shows a condition (data point circled and labeled #1
in Fig. 12) where the flow and F0 vibrato rates were most dissimilar – the rate of F0 vibrato
(5.26 Hz) is seen to be faster than the approximate rate of airflow vibrato (4.84 Hz), assuming
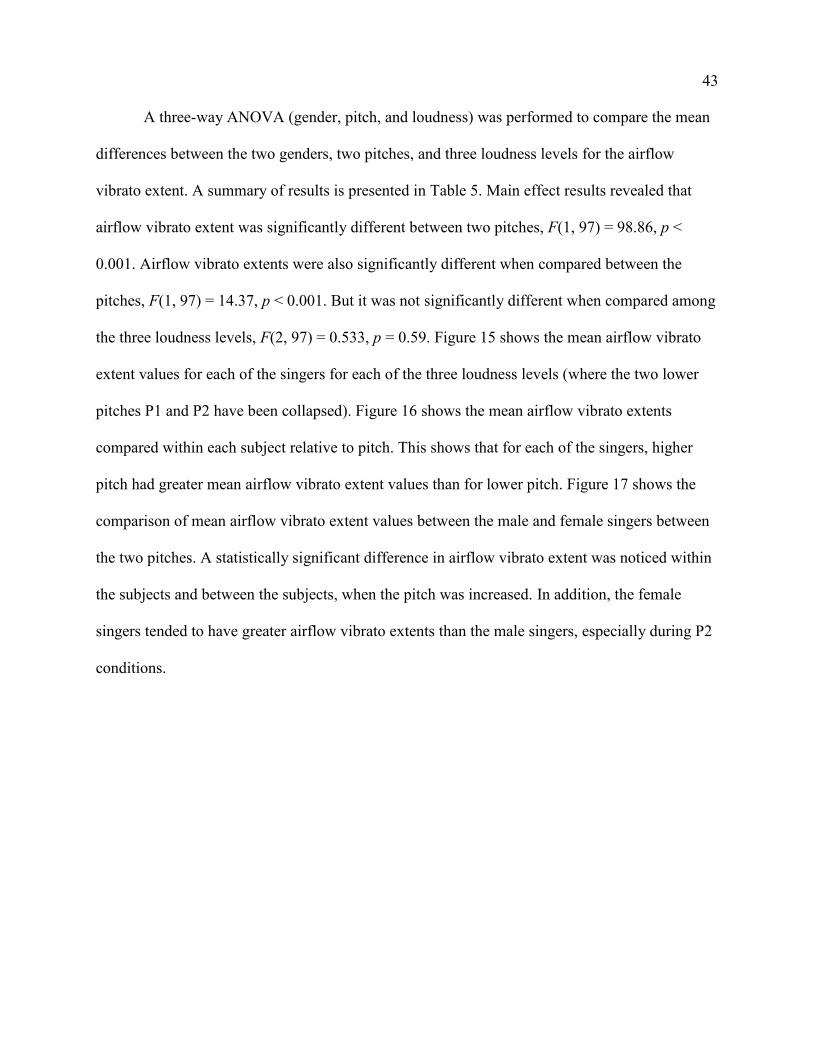
the secondary oscillations are within single cycles. Figure 14 shows the condition where both
flow and F0 vibrato rates were similar (5.34 Hz and 5.51 Hz respectively), with slight differences
in signal waveshapes (data point circled and labeled #2 in Fig. 12).
41
Figure 12. Rate of airflow vibrato vs rate of F0 vibrato for all conditions and subjects. The regression suggests that F0 vibrato tends to be slightly faster than airflow vibrato. The dashed line is the 1-1 line.
Figure 13. Flow and F0 vibrato waveforms corresponding to circle #1 in Figure 12, a case where the airflow vibrato rate is different from the F0 vibrato rate, and also with different waveshape. The condition is the soprano-2 singing the pitch P1 with loudness L2.
y = 0.827x + 0.8151R² = 0.7456
4
4.5
5
5.5
6
6.5
4 4.5 5 5.5 6 6.5
Rat
e o
f ai
rflo
w v
ibra
to (
Hz)
Rate of F0 vibrato (Hz)
1
2
230
240
250
260
270
280
160
180
200
220
240
260
280
11 11.2 11.4 11.6 11.8 Fun
dam
enta
l Fre
qu
ency
(H
z)
Air
flo
w (
cm3/s
)
Time (Sec)
42
Figure 14. Flow and F0 vibrato waveforms corresponding to circle #2 in Figure 12, a case where the vibrato rates are similar, with slightly different waveform shapes. The condition is the soprano-1 singing the pitch P1 with loudness L2.
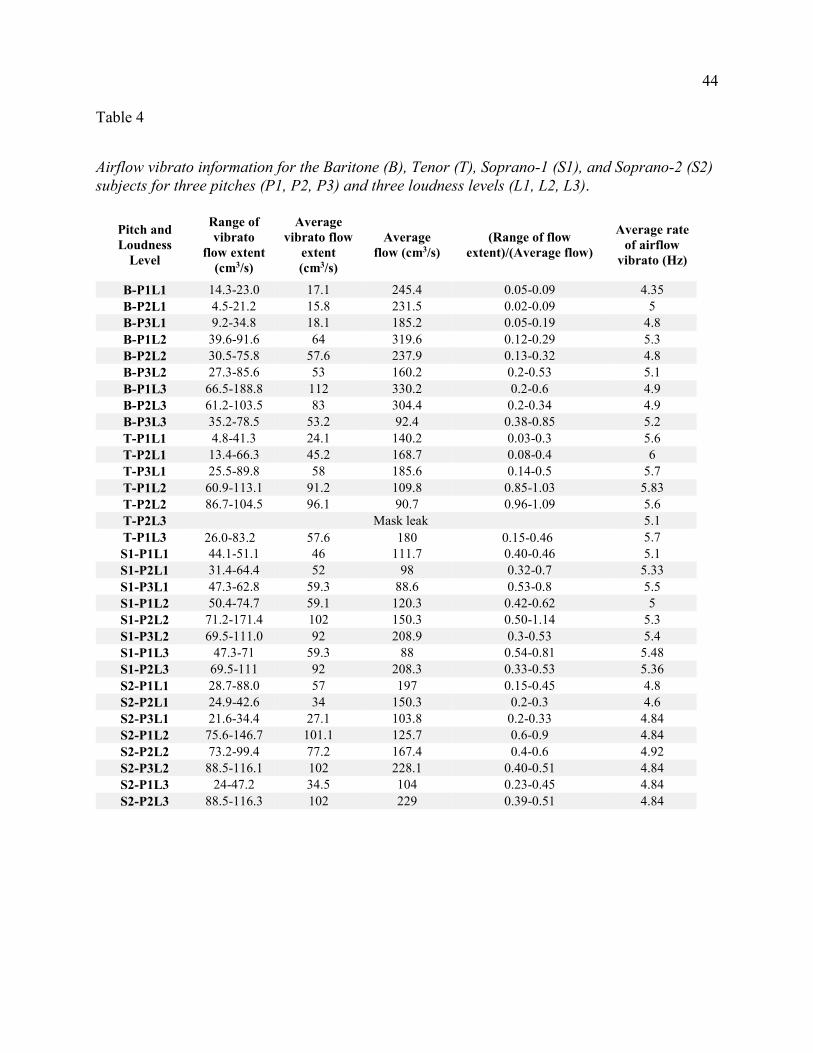
Extent of airflow vibrato. Table 4 provides airflow vibrato information for each subject
across the pitch and loudness conditions. The baritone’s range of airflow vibrato extent was 4.5
to 188.8 cm3/s, with an average airflow vibrato extent of 53 cm3/s, and an average rate of airflow
vibrato of 4.93 Hz. The Tenor produced a range of airflow vibrato extent of 4.8 to 113.12 cm3/s,
an average airflow vibrato extent of 62.8 cm3/s, and an average rate of airflow vibrato of 5.64
Hz. Soprano-1 had a range of airflow vibrato extent of 31.4 to 171.4 cm3/s, an average airflow
vibrato extent of 68.3 cm3/s, and an average rate of airflow vibrato 5.3 Hz. Finally, Soprano-2
had a range of airflow vibrato extent of 21.6 to 146.7 cm3/s, an average airflow vibrato extent of
66.3 cm3/s, and an average rate of airflow vibrato of 5.6 Hz. Thus, across the four subjects and
across the pitch-loudness conditions, the extent of the airflow vibrato could be quite narrow (near
5 cm3/s) to quite wide (near 190 cm3/s). The average airflow vibrato extent across the subjects,
however, was confined to a relatively narrow range, between 53 and 68 cm3/s, and the airflow
vibrato rates, 4.9 to 5.6 Hz, were within acceptable rates reported for F0 vibrato rates.
230
240
250
260
270
100
120
140
160
180
17.4 17.6 17.8 18 18.2 18.4
Time in sec
Fun
dam
enta
l Fre
qu
ency
(H
z)
Air
flo
w (
cm3/s
)
43
A three-way ANOVA (gender, pitch, and loudness) was performed to compare the mean
differences between the two genders, two pitches, and three loudness levels for the airflow
vibrato extent. A summary of results is presented in Table 5. Main effect results revealed that
airflow vibrato extent was significantly different between two pitches, F(1, 97) = 98.86, p <
0.001. Airflow vibrato extents were also significantly different when compared between the
pitches, F(1, 97) = 14.37, p < 0.001. But it was not significantly different when compared among
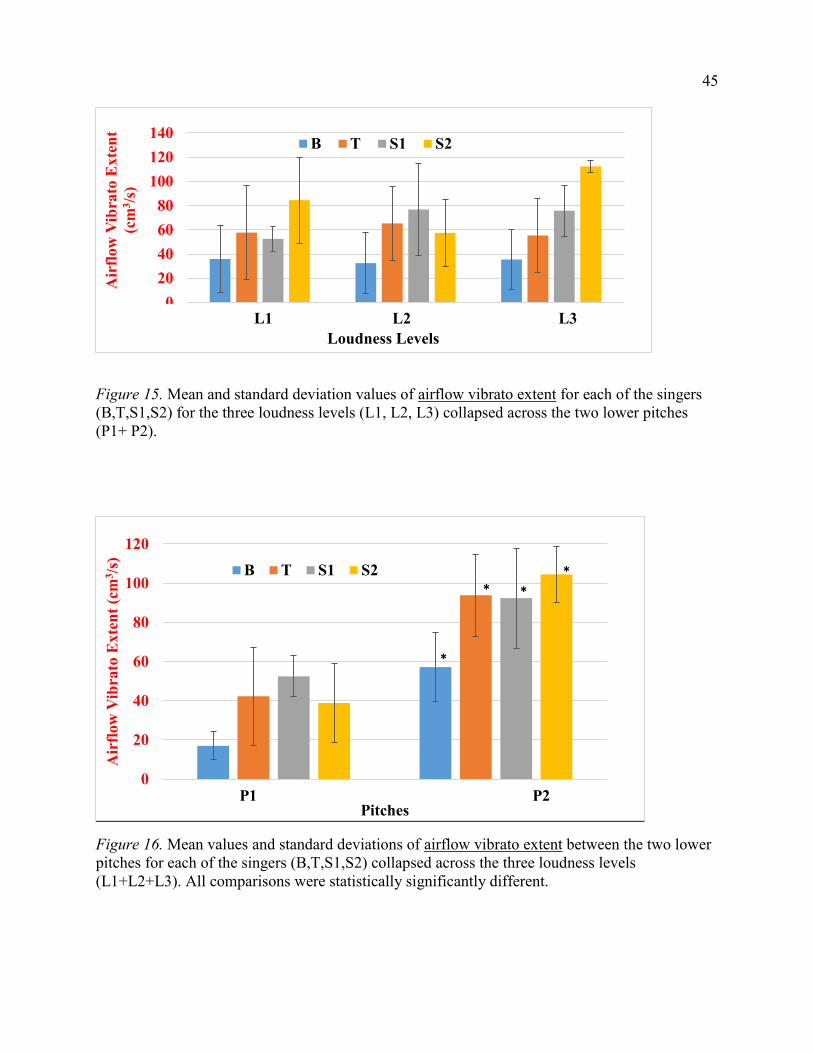
the three loudness levels, F(2, 97) = 0.533, p = 0.59. Figure 15 shows the mean airflow vibrato
extent values for each of the singers for each of the three loudness levels (where the two lower
pitches P1 and P2 have been collapsed). Figure 16 shows the mean airflow vibrato extents
compared within each subject relative to pitch. This shows that for each of the singers, higher
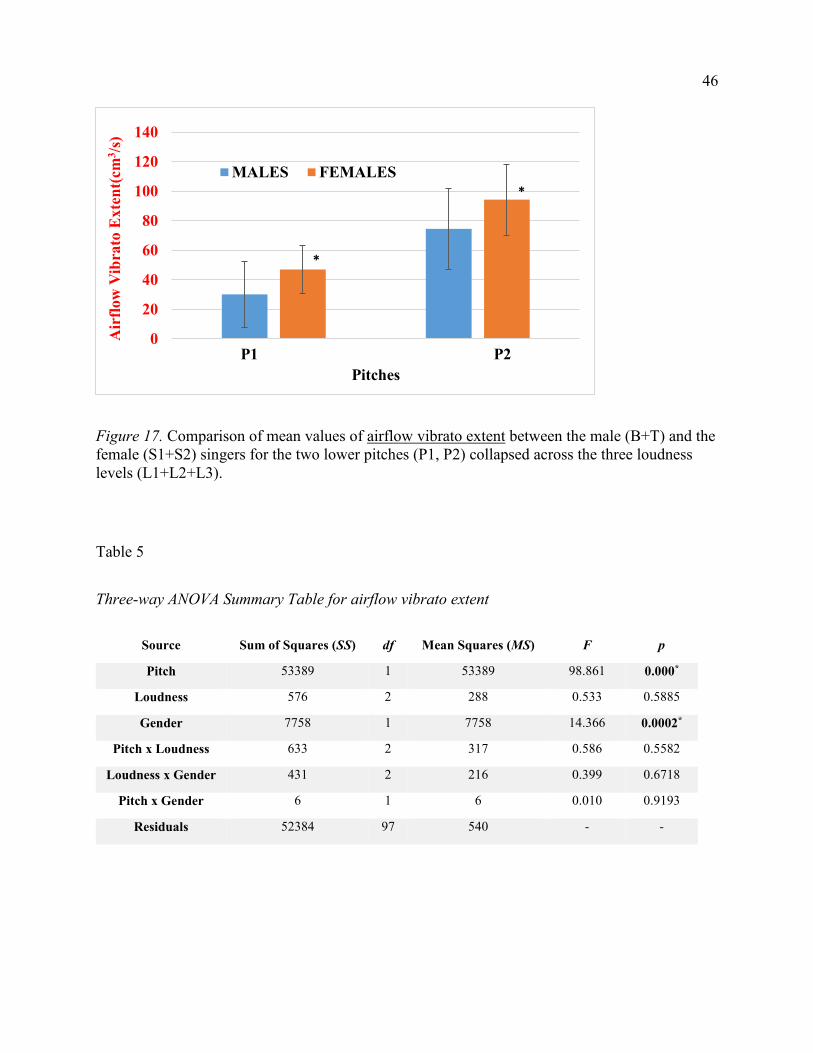
pitch had greater mean airflow vibrato extent values than for lower pitch. Figure 17 shows the
comparison of mean airflow vibrato extent values between the male and female singers between
the two pitches. A statistically significant difference in airflow vibrato extent was noticed within
the subjects and between the subjects, when the pitch was increased. In addition, the female
singers tended to have greater airflow vibrato extents than the male singers, especially during P2
conditions.
44
Table 4
Airflow vibrato information for the Baritone (B), Tenor (T), Soprano-1 (S1), and Soprano-2 (S2) subjects for three pitches (P1, P2, P3) and three loudness levels (L1, L2, L3).
Figure 15. Mean and standard deviation values of airflow vibrato extent for each of the singers (B,T,S1,S2) for the three loudness levels (L1, L2, L3) collapsed across the two lower pitches (P1+ P2).
Figure 16. Mean values and standard deviations of airflow vibrato extent between the two lower pitches for each of the singers (B,T,S1,S2) collapsed across the three loudness levels (L1+L2+L3). All comparisons were statistically significantly different.
020406080
100120140
1 2 3
Air
flow
Vib
rato
Ext
ent
(cm
3 /s)
Loudness Levels
B T S1 S2
L1 L2 L3
0
20
40
60
80
100
120
1 2
Air
flow
Vib
rato
Ext
ent (
cm3 /s
)
Pitches
B T S1 S2
*
* *
*
P1 P2
46
Figure 17. Comparison of mean values of airflow vibrato extent between the male (B+T) and the female (S1+S2) singers for the two lower pitches (P1, P2) collapsed across the three loudness levels (L1+L2+L3).
Table 5
Three-way ANOVA Summary Table for airflow vibrato extent
Source Sum of Squares (SS) df Mean Squares (MS) F p
Pitch 53389 1 53389 98.861 0.000*
Loudness 576 2 288 0.533 0.5885
Gender 7758 1 7758 14.366 0.0002*
Pitch x Loudness 633 2 317 0.586 0.5582
Loudness x Gender 431 2 216 0.399 0.6718
Pitch x Gender 6 1 6 0.010 0.9193
Residuals 52384 97 540 - -
0
20
40
60
80
100
120
140
1 2
Air
flow
Vib
rato
Ext
ent(c
m3 /s
)
Pitches
MALES FEMALES*
P1 P2
*
47
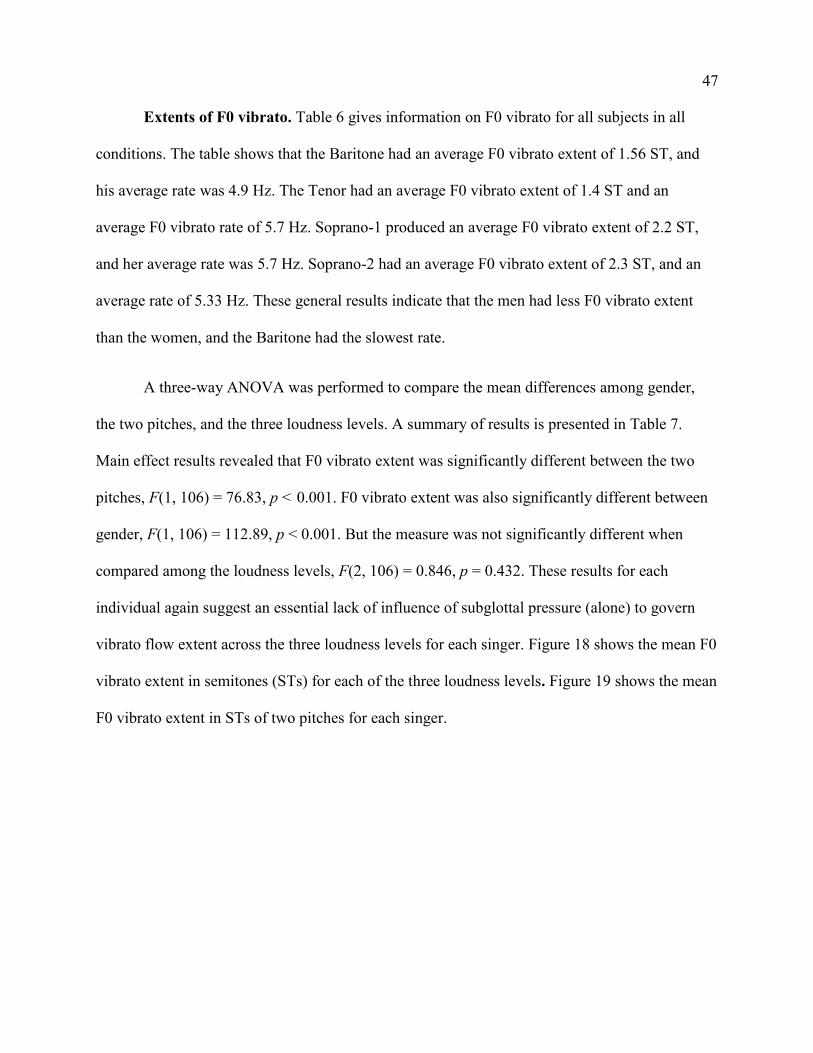
Extents of F0 vibrato. Table 6 gives information on F0 vibrato for all subjects in all
conditions. The table shows that the Baritone had an average F0 vibrato extent of 1.56 ST, and
his average rate was 4.9 Hz. The Tenor had an average F0 vibrato extent of 1.4 ST and an
average F0 vibrato rate of 5.7 Hz. Soprano-1 produced an average F0 vibrato extent of 2.2 ST,
and her average rate was 5.7 Hz. Soprano-2 had an average F0 vibrato extent of 2.3 ST, and an
average rate of 5.33 Hz. These general results indicate that the men had less F0 vibrato extent
than the women, and the Baritone had the slowest rate.
A three-way ANOVA was performed to compare the mean differences among gender,
the two pitches, and the three loudness levels. A summary of results is presented in Table 7.
Main effect results revealed that F0 vibrato extent was significantly different between the two
pitches, F(1, 106) = 76.83, p < 0.001. F0 vibrato extent was also significantly different between
gender, F(1, 106) = 112.89, p < 0.001. But the measure was not significantly different when
compared among the loudness levels, F(2, 106) = 0.846, p = 0.432. These results for each
individual again suggest an essential lack of influence of subglottal pressure (alone) to govern
vibrato flow extent across the three loudness levels for each singer. Figure 18 shows the mean F0
vibrato extent in semitones (STs) for each of the three loudness levels. Figure 19 shows the mean
F0 vibrato extent in STs of two pitches for each singer.
48
Table 6
F0 vibrato information for the Baritone (B), Tenor (T), Soprano-1 (S1), and Soprano-2 (S2)
subjects for three pitches (P1, P2, P3) and loudness (L1, L2, L3).
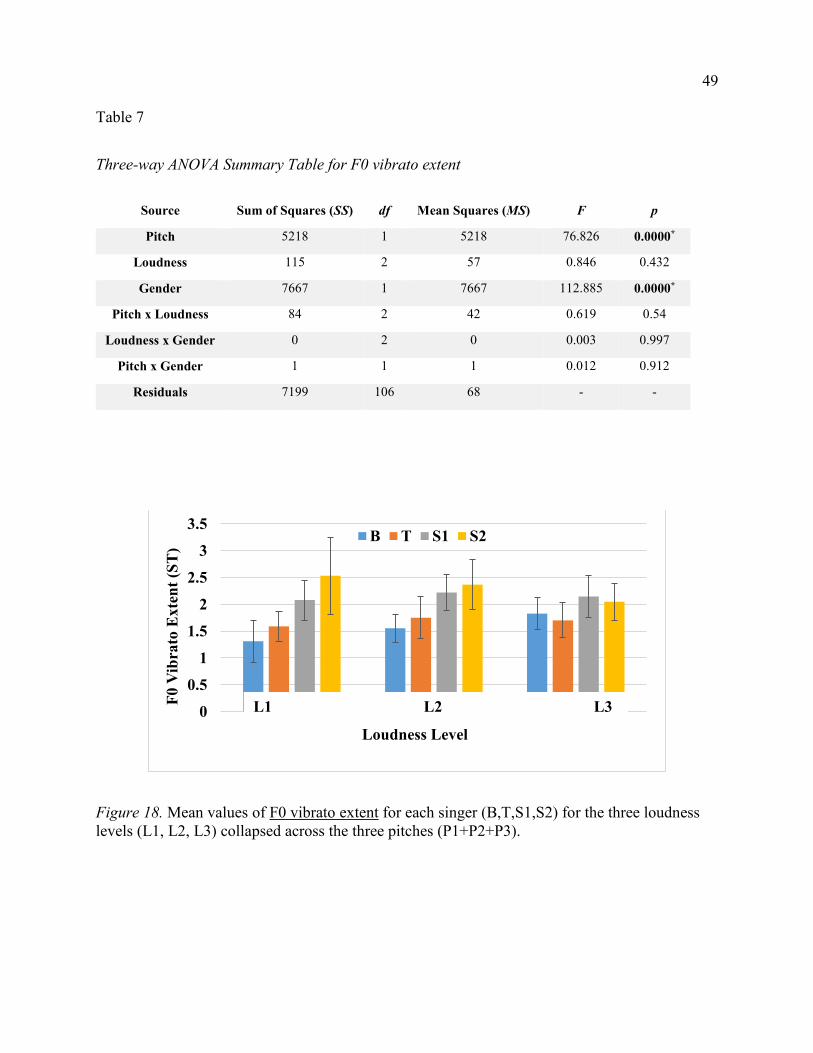
Three-way ANOVA Summary Table for F0 vibrato extent
Source Sum of Squares (SS) df Mean Squares (MS) F p
Pitch 5218 1 5218 76.826 0.0000*
Loudness 115 2 57 0.846 0.432
Gender 7667 1 7667 112.885 0.0000*
Pitch x Loudness 84 2 42 0.619 0.54
Loudness x Gender 0 2 0 0.003 0.997
Pitch x Gender 1 1 1 0.012 0.912
Residuals 7199 106 68 - -
Figure 18. Mean values of F0 vibrato extent for each singer (B,T,S1,S2) for the three loudness levels (L1, L2, L3) collapsed across the three pitches (P1+P2+P3).
0
0.5
1
1.5
2
2.5
3
3.5
F0 V
ibra
to E
xten
t (ST
)
Loudness Level
B T S1 S2
L1 L2 L3
50
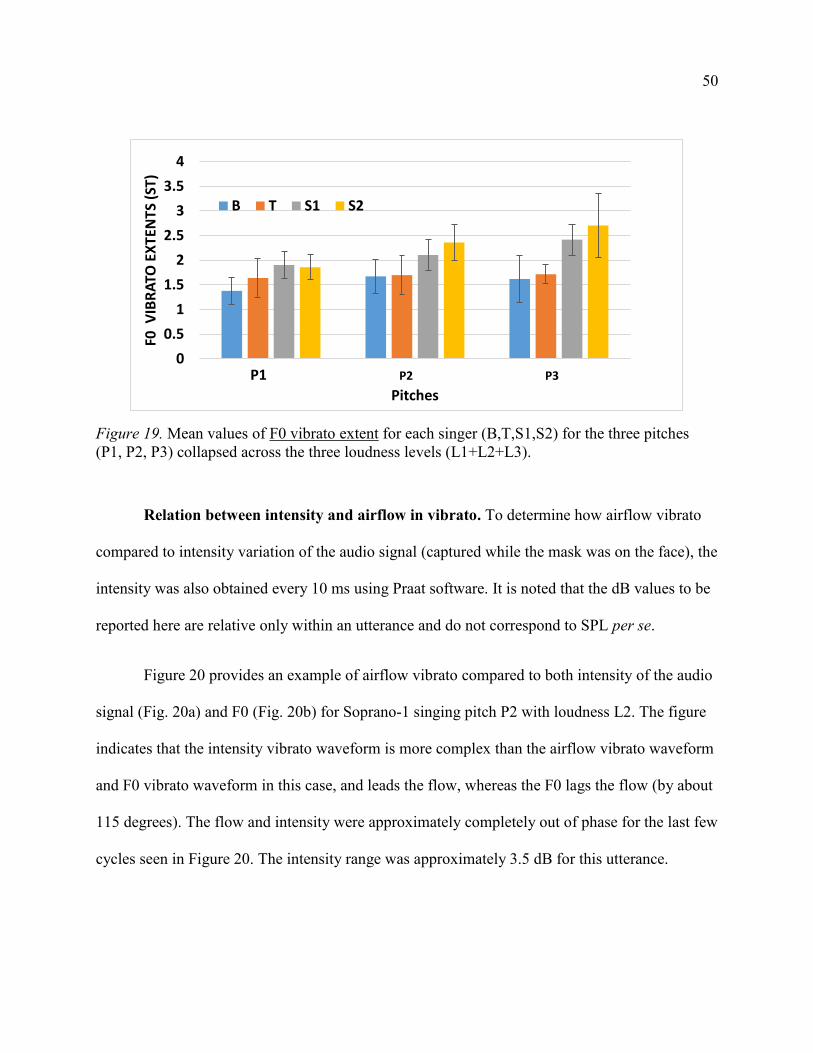
Figure 19. Mean values of F0 vibrato extent for each singer (B,T,S1,S2) for the three pitches (P1, P2, P3) collapsed across the three loudness levels (L1+L2+L3).
Relation between intensity and airflow in vibrato. To determine how airflow vibrato
compared to intensity variation of the audio signal (captured while the mask was on the face), the
intensity was also obtained every 10 ms using Praat software. It is noted that the dB values to be
reported here are relative only within an utterance and do not correspond to SPL per se.
Figure 20 provides an example of airflow vibrato compared to both intensity of the audio
signal (Fig. 20a) and F0 (Fig. 20b) for Soprano-1 singing pitch P2 with loudness L2. The figure
indicates that the intensity vibrato waveform is more complex than the airflow vibrato waveform
and F0 vibrato waveform in this case, and leads the flow, whereas the F0 lags the flow (by about
115 degrees). The flow and intensity were approximately completely out of phase for the last few
cycles seen in Figure 20. The intensity range was approximately 3.5 dB for this utterance.
0
0.5
1
1.5
2
2.5
3
3.5
4
1 2 3
F0 V
IBR
ATO
EX
TEN
TS (
ST)
Pitches
B T S1 S2
P1 P2 P3
51
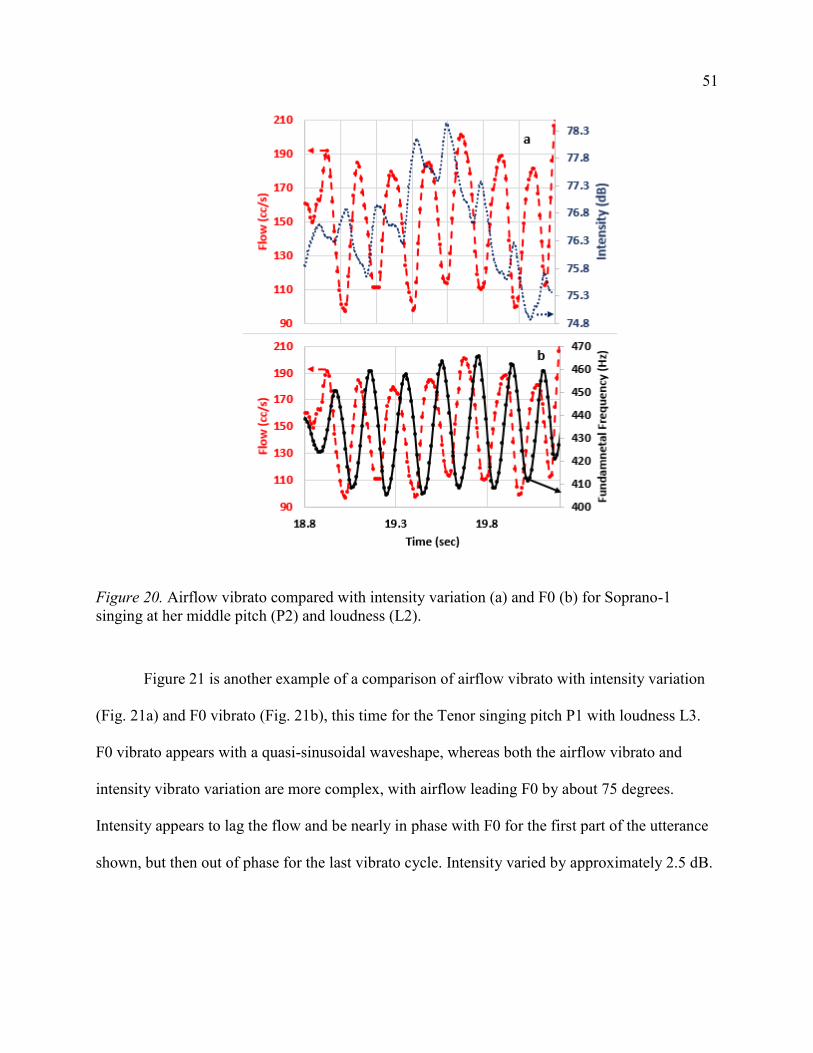
Figure 20. Airflow vibrato compared with intensity variation (a) and F0 (b) for Soprano-1 singing at her middle pitch (P2) and loudness (L2).
Figure 21 is another example of a comparison of airflow vibrato with intensity variation
(Fig. 21a) and F0 vibrato (Fig. 21b), this time for the Tenor singing pitch P1 with loudness L3.
F0 vibrato appears with a quasi-sinusoidal waveshape, whereas both the airflow vibrato and
intensity vibrato variation are more complex, with airflow leading F0 by about 75 degrees.
Intensity appears to lag the flow and be nearly in phase with F0 for the first part of the utterance
shown, but then out of phase for the last vibrato cycle. Intensity varied by approximately 2.5 dB.
52
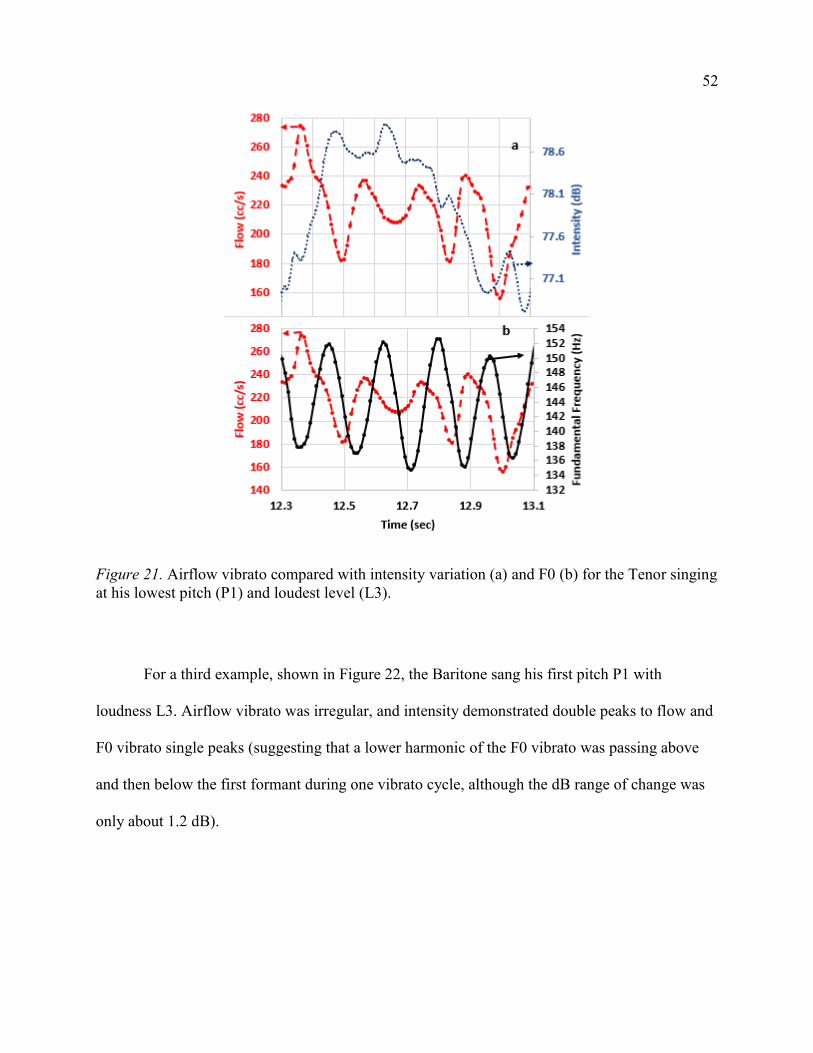
Figure 21. Airflow vibrato compared with intensity variation (a) and F0 (b) for the Tenor singing at his lowest pitch (P1) and loudest level (L3).
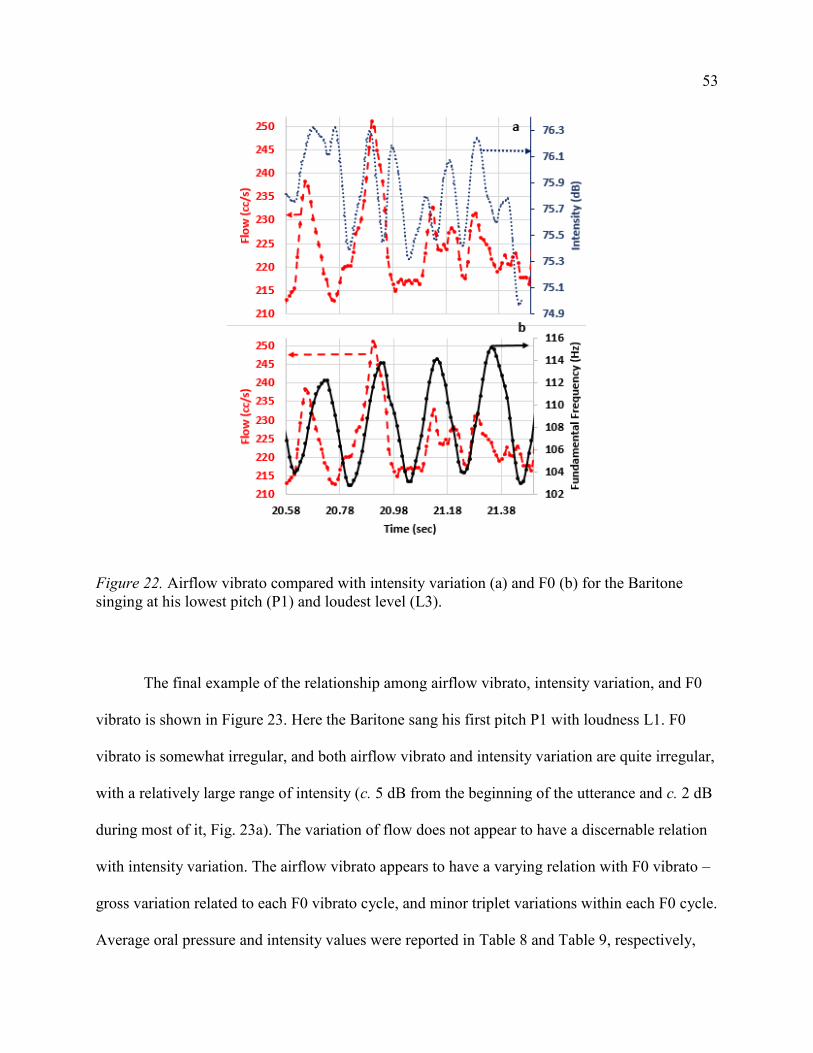
For a third example, shown in Figure 22, the Baritone sang his first pitch P1 with
loudness L3. Airflow vibrato was irregular, and intensity demonstrated double peaks to flow and
F0 vibrato single peaks (suggesting that a lower harmonic of the F0 vibrato was passing above
and then below the first formant during one vibrato cycle, although the dB range of change was
only about 1.2 dB).
53
Figure 22. Airflow vibrato compared with intensity variation (a) and F0 (b) for the Baritone singing at his lowest pitch (P1) and loudest level (L3).
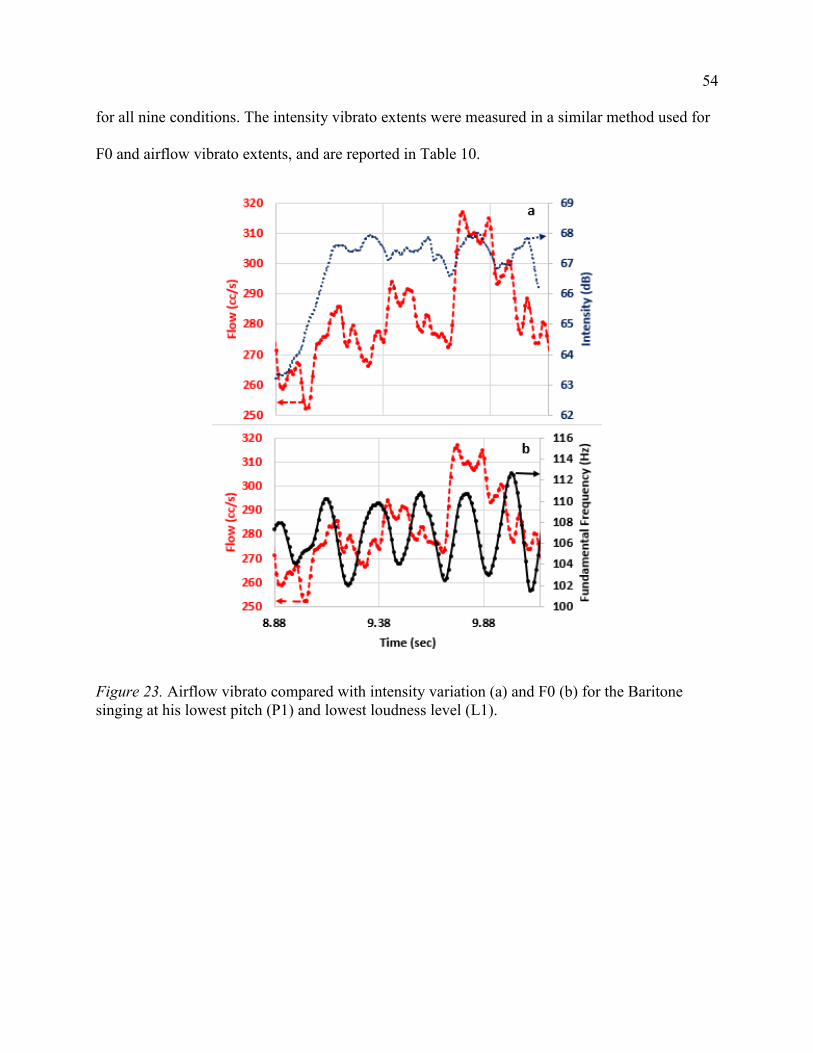
The final example of the relationship among airflow vibrato, intensity variation, and F0
vibrato is shown in Figure 23. Here the Baritone sang his first pitch P1 with loudness L1. F0
vibrato is somewhat irregular, and both airflow vibrato and intensity variation are quite irregular,
with a relatively large range of intensity (c. 5 dB from the beginning of the utterance and c. 2 dB
during most of it, Fig. 23a). The variation of flow does not appear to have a discernable relation
with intensity variation. The airflow vibrato appears to have a varying relation with F0 vibrato –
gross variation related to each F0 vibrato cycle, and minor triplet variations within each F0 cycle.
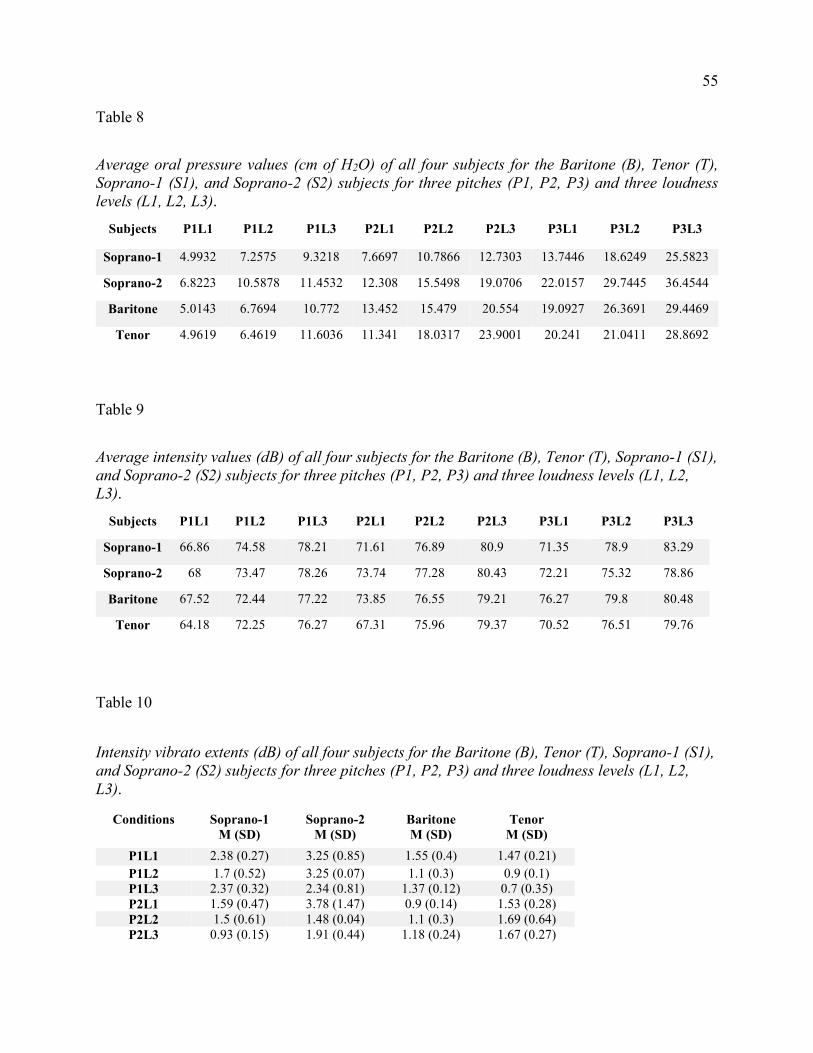
Average oral pressure and intensity values were reported in Table 8 and Table 9, respectively,
54
for all nine conditions. The intensity vibrato extents were measured in a similar method used for
F0 and airflow vibrato extents, and are reported in Table 10.
Figure 23. Airflow vibrato compared with intensity variation (a) and F0 (b) for the Baritone singing at his lowest pitch (P1) and lowest loudness level (L1).
55
Table 8
Average oral pressure values (cm of H2O) of all four subjects for the Baritone (B), Tenor (T), Soprano-1 (S1), and Soprano-2 (S2) subjects for three pitches (P1, P2, P3) and three loudness levels (L1, L2, L3).
Average intensity values (dB) of all four subjects for the Baritone (B), Tenor (T), Soprano-1 (S1), and Soprano-2 (S2) subjects for three pitches (P1, P2, P3) and three loudness levels (L1, L2, L3).
Intensity vibrato extents (dB) of all four subjects for the Baritone (B), Tenor (T), Soprano-1 (S1), and Soprano-2 (S2) subjects for three pitches (P1, P2, P3) and three loudness levels (L1, L2, L3).
EGG width measurement and airflow vibrato. Airflow vibrato may reasonably be
caused by changes in adduction, less adducted for higher flows within the vibrato cycle, and
greater adduction for lower flows within the cycle. To attempt to test this hypothesis, EGGW
was measured at the peaks and valleys of the airflow vibrato. It is noted that the EGG waveform
is related to membranous vocal fold contact rather than posterior glottal activity (Hampala et al.,
2015; Henrich et al., 2003; Scherer et al., 1988).
Two to three consecutive glottal cycles of the EGG waveform were analyzed at all
primary peaks and valleys of the airflow vibrato waveforms under all conditions for the Soprano-
1 and the Tenor. EGG signals from Soprano-2 and Baritone were not possible to obtain. In
Soprano-2, poor EGG signals were seen due to relatively thick tissue in the neck region, and the
Baritone was not comfortable wearing the EGG device. T-tests for EGGW values between peaks
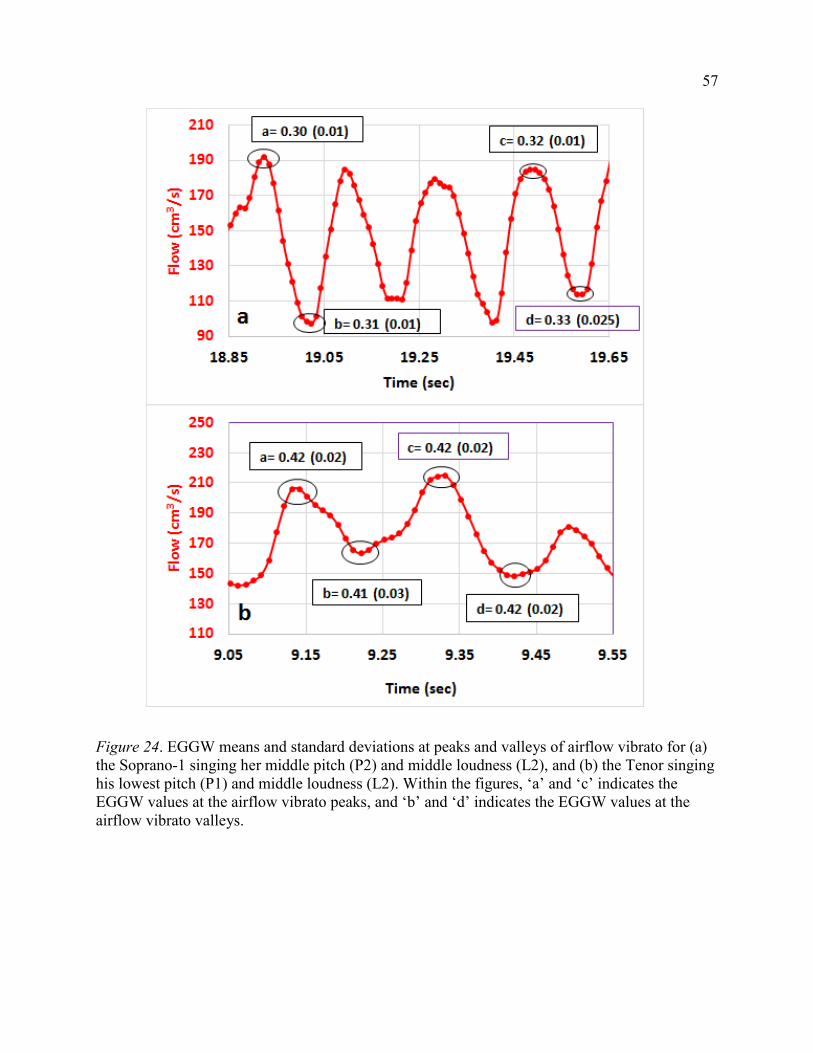
and valleys indicated` no significant differences. Figure 24 provides two examples, one for
Soprano-1 (Fig. 24a) and one for the Tenor (Fig. 24b). In Fig. 24a, the EGGW values
corresponding to the peak of the airflow vibrato are shown to be 0.30 and 0.32, and the valley
values of EGGW are 0.31 and 0.33, indicating that there is no difference in EGGW between the
two extremes. Similar non-differences are shown in Fig. 24b. Therefore, airflow vibrato appears
to be independent of EGGW measures, and suggests that EGGW is insensitive to these flow
variations, or airflow vibrato is not due to anterior glottis adductory changes.
57
Figure 24. EGGW means and standard deviations at peaks and valleys of airflow vibrato for (a) the Soprano-1 singing her middle pitch (P2) and middle loudness (L2), and (b) the Tenor singing his lowest pitch (P1) and middle loudness (L2). Within the figures, ‘a’ and ‘c’ indicates the EGGW values at the airflow vibrato peaks, and ‘b’ and ‘d’ indicates the EGGW values at the airflow vibrato valleys.
58
Normalized rate quotient (NRQ) and airflow vibrato. The meaning of the NRQ
measure is that, because it is the normalized EGG left-side rise slope divided by the normalized
right-side fall slope (between the 25% and 75% height locations of each EGG waveform), the
larger the negative value of the NRQ measure, the faster the contact between the two vocal folds
compared to the separation of the two vocal folds. Does this differ between the max and min of
the airflow vibrato cycles? If so, it would indicate a mechanical and physiological differentiation
between the two regions.
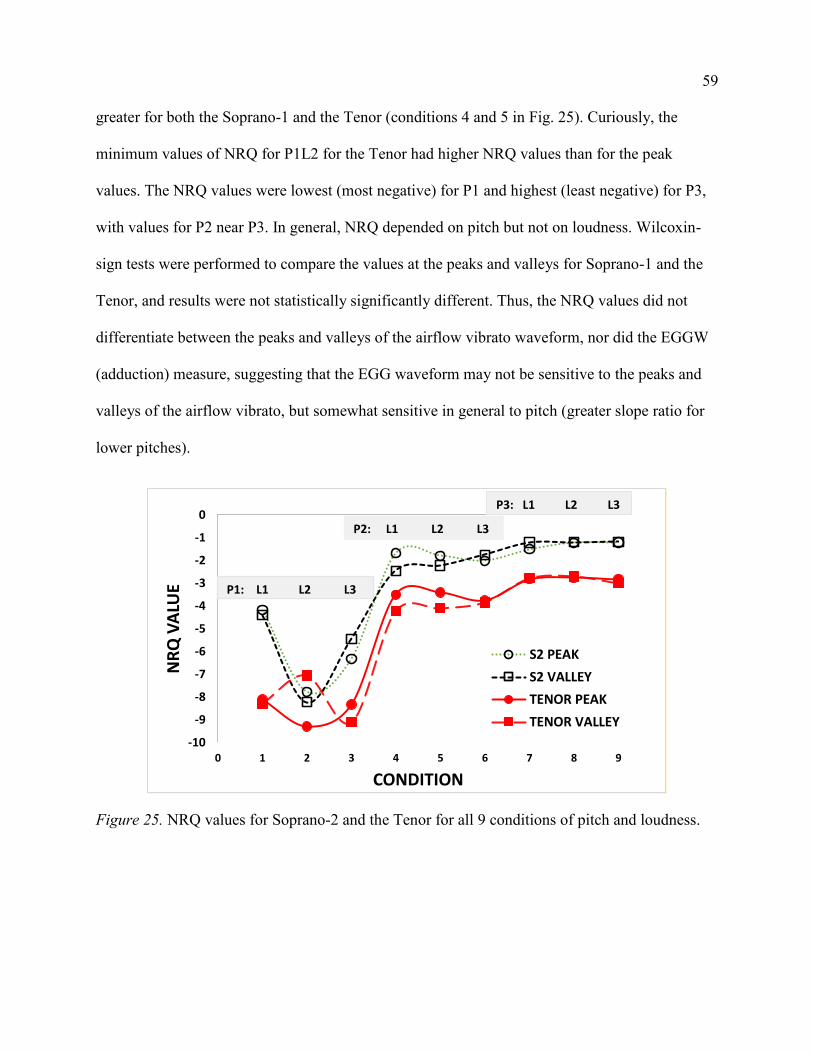
NRQ values for two peaks and values from all nine conditions of pitch and loudness for
Soprano-1 and the Tenor were obtained and averaged. Figure 25 shows the results. With a few
exceptions, the airflow vibrato maxima (peaks) and minima (valleys) had similar NRQ values for
each of the two singers. In general, there were higher NRQ (less negative) values for Soprano-1
than for the Tenor, and the pattern of change across conditions was similar for both singers. The
lower pitch P1 had the greatest negative NRQ values, suggesting that the increase in vocal fold
contact area during closure was relatively faster than the decrease in vocal fold contact area later
during vocal fold separation during contact, compared to the other two pitches used. The largest
negative value was approximately -9, indicating 9 times faster increase than decrease in contact
area. In comparison, for the highest pitch P3, Soprano-1 had NRQ values close to -1, indicating
approximately the same rate of increase and decrease on either side of the EGG waveform
(suggesting a relatively sinusoidal waveform).
Except for one condition (number 2 on the x-axis), the Tenor had values of NRQ that
were more negative than Soprano-1, which might be reasonable given the expected larger size of
the larynx in the Tenor. For the middle pitch, the NRQ values for the airflow vibrato peaks were
59
greater for both the Soprano-1 and the Tenor (conditions 4 and 5 in Fig. 25). Curiously, the
minimum values of NRQ for P1L2 for the Tenor had higher NRQ values than for the peak
values. The NRQ values were lowest (most negative) for P1 and highest (least negative) for P3,
with values for P2 near P3. In general, NRQ depended on pitch but not on loudness. Wilcoxin-
sign tests were performed to compare the values at the peaks and valleys for Soprano-1 and the
Tenor, and results were not statistically significantly different. Thus, the NRQ values did not
differentiate between the peaks and valleys of the airflow vibrato waveform, nor did the EGGW
(adduction) measure, suggesting that the EGG waveform may not be sensitive to the peaks and
valleys of the airflow vibrato, but somewhat sensitive in general to pitch (greater slope ratio for
lower pitches).
Figure 25. NRQ values for Soprano-2 and the Tenor for all 9 conditions of pitch and loudness.
-10
-9
-8
-7
-6
-5
-4
-3
-2
-1
0
0 1 2 3 4 5 6 7 8 9
NR
Q V
ALU
E
CONDITION
S2 PEAK
S2 VALLEY
TENOR PEAK
TENOR VALLEY
P1: L1 L2 L3
P2: L1 L2 L3
P3: L1 L2 L3
60
Study 2: Sources of Airflow Vibrato
Raw data of airflow, F0, and intensity modulations. The airflow, F0, and intensity
vibrato and modulations in Study 2 were analyzed using the same methods as in Study 1. A few
examples of F0 and airflow modulations during bleat and external epigastric pumping are given
next. Figures 26-29 represent the modulations due to bleat (adductory change maneuver). The
phase differences among airflow, F0, and intensity vary over a wide range. Airflow leading both
F0 and intensity was predominantly seen in almost all of the conditions and can be seen in
Figures 26-29. Figures 27a and 27c show an example of F0 with airflow and intensity
respectively in anti-phase while subject M1 was using a light bleat at high pitch in a singing task.
Figure 27b shows less or negligible phase difference between airflow and intensity. But when the
same subject was producing bleat while whispering the vowel /a/, as seen in Figure 28, there was
a phase difference between airflow and intensity ranging from 70-13 degrees, where airflow
leads intensity. There was also a variety of waveform shapes observed for F0 and airflow. Figure
29 shows a highly irregular F0 modulation with regular and consistent airflow changes during
bleat while subject F1 was producing lighter bleat at high pitch in the singing task.
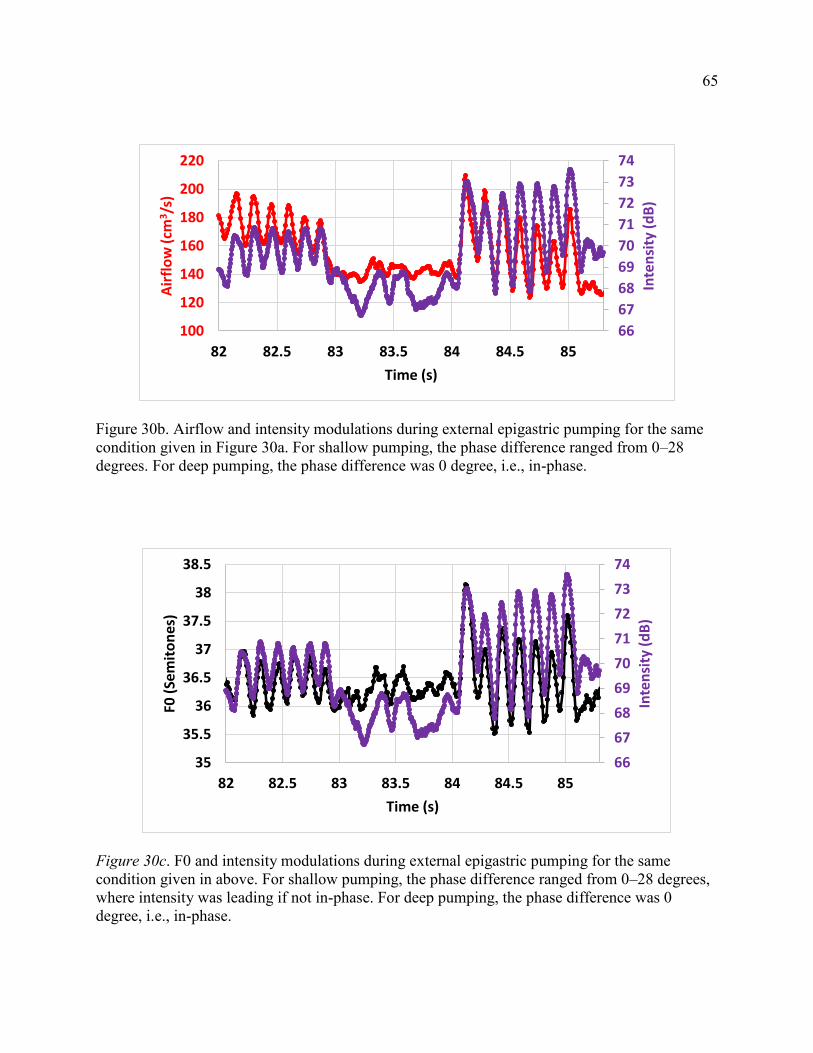
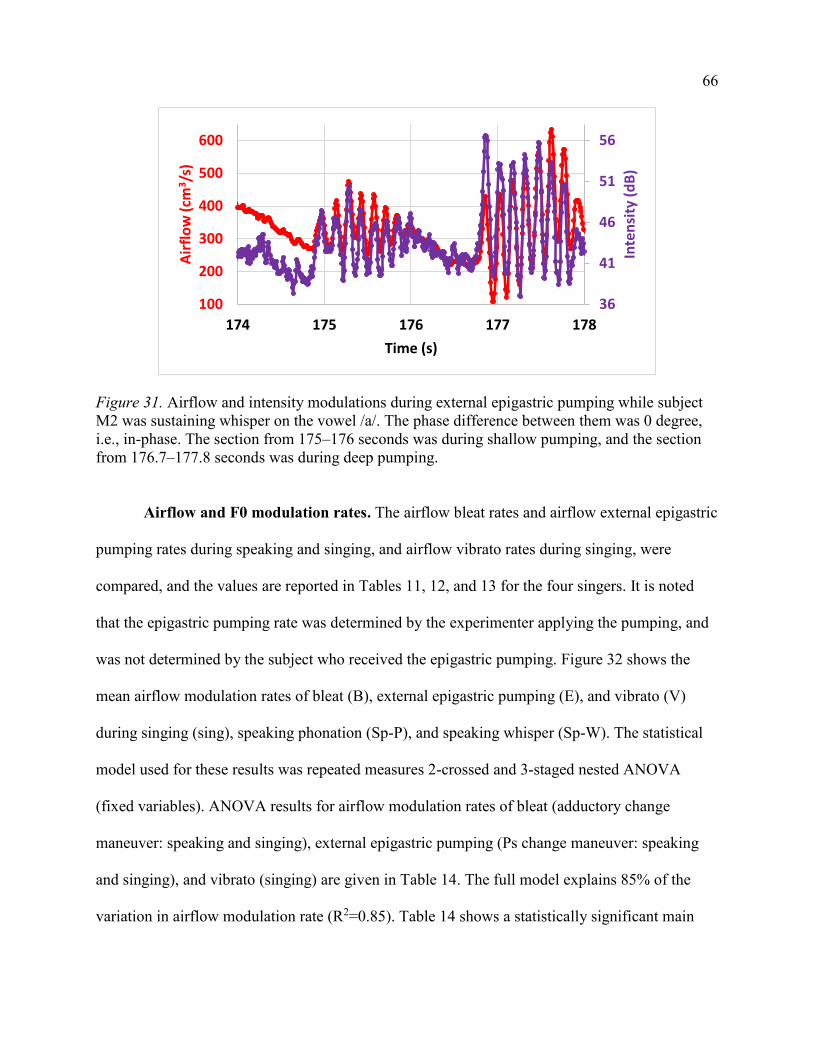
Figures 30 (a,b,c)–31 represent airflow, F0, and intensity modulations due to external
epigastric pumping (EEP). In Figure 30, subject F1 was phonating the vowel /a/ during EEP. The
phase differences among F0, airflow, and intensity were 0 degrees to low values (up to 60-70
degrees, predominantly airflow leading). The synchronization here is due to subglottal pressure
variations because of the nature of the stimuli (pushing on the epigastric region). Similarly,
during whisper tasks of EEP, there were large synchronous variations in airflow and intensity, as
seen in Figure 31. These results suggest that when the three waveforms (airflow, F0, and
61
intensity) are nearly in phase with each other (approximately 0 to 50 degrees, airflow leading),
Ps may be a primary causative factor (Scherer et al., 1988a).
In general, then, as shown earlier, bleat and vibrato have similar results in terms of phase
differences, with airflow leading and having a wide range of phase differences across the two
pitches and three loudness levels, whereas for the external epigastric pumping, the three signals
are nearly in phase with each other.
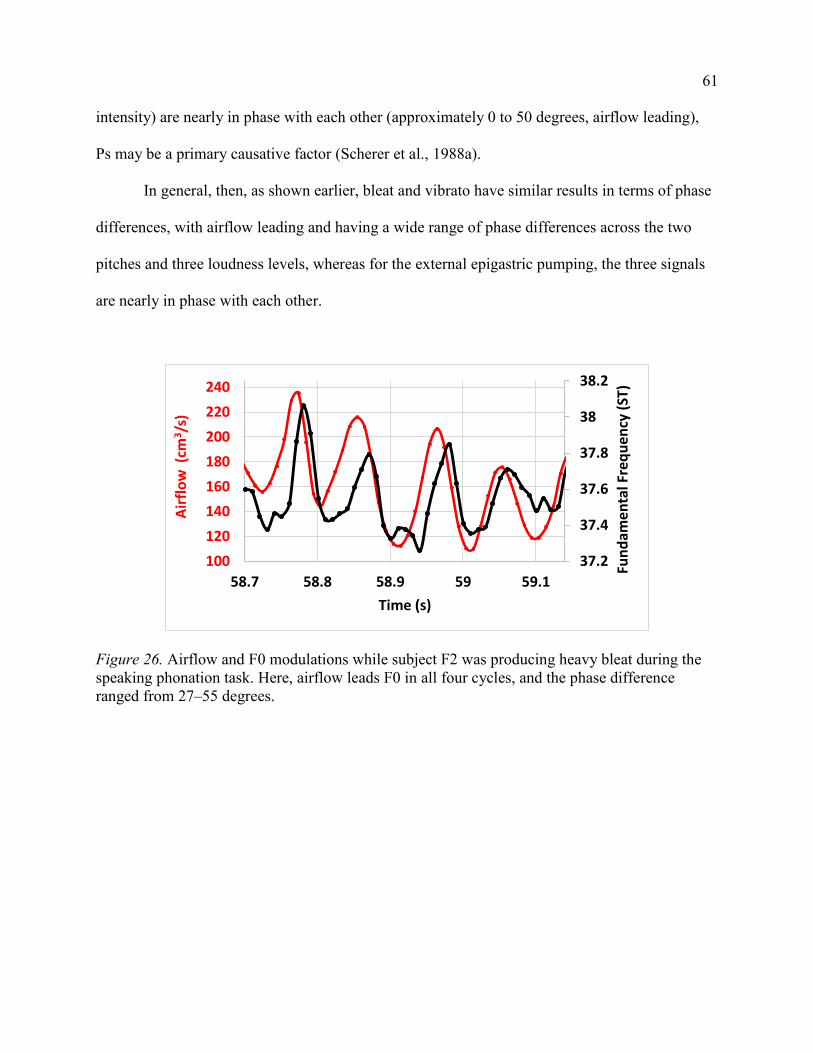
Figure 26. Airflow and F0 modulations while subject F2 was producing heavy bleat during the speaking phonation task. Here, airflow leads F0 in all four cycles, and the phase difference ranged from 27–55 degrees.
37.2
37.4
37.6
37.8
38
38.2
100
120
140
160
180
200
220
240
58.7 58.8 58.9 59 59.1
Fun
dam
enta
l Fre
qu
ency
(ST
)
Air
flo
w (
cm3/s
)
Time (s)
62
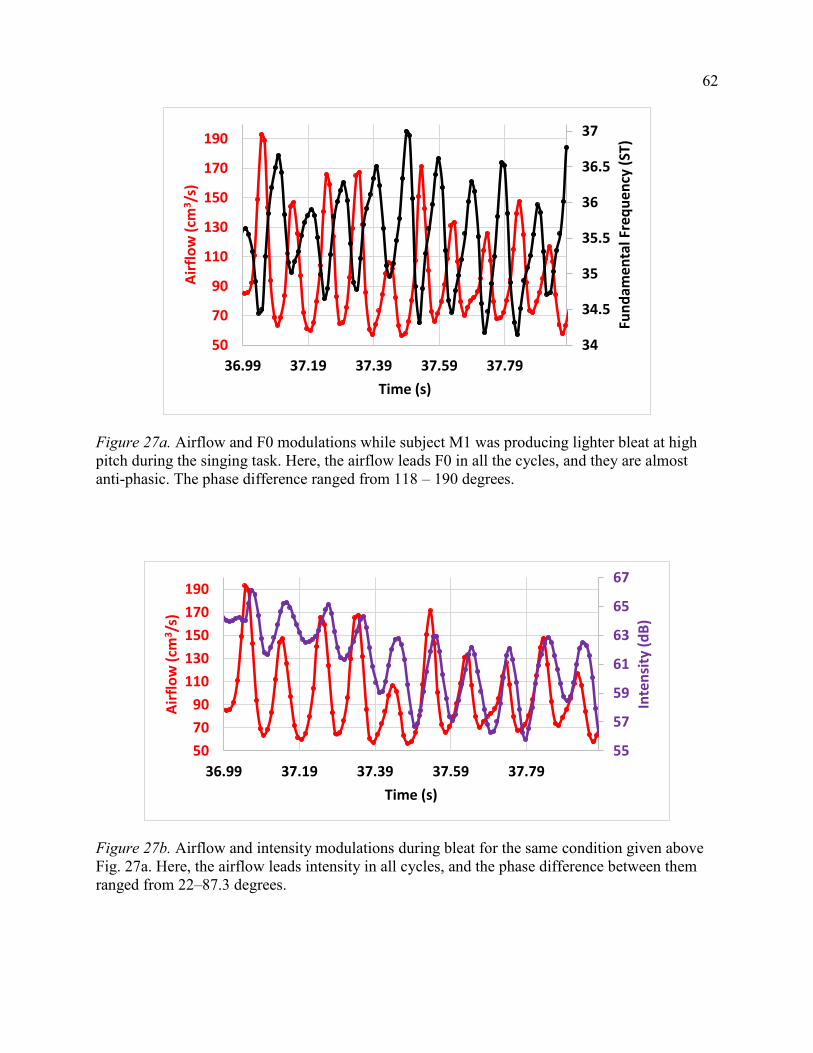
Figure 27a. Airflow and F0 modulations while subject M1 was producing lighter bleat at high pitch during the singing task. Here, the airflow leads F0 in all the cycles, and they are almost anti-phasic. The phase difference ranged from 118 – 190 degrees.
Figure 27b. Airflow and intensity modulations during bleat for the same condition given above Fig. 27a. Here, the airflow leads intensity in all cycles, and the phase difference between them ranged from 22–87.3 degrees.
34
34.5
35
35.5
36
36.5
37
50
70
90
110
130
150
170
190
36.99 37.19 37.39 37.59 37.79
Fun
dam
enta
l Fre
qu
ency
(ST
)
Air
flo
w (
cm3/s
)
Time (s)
55
57
59
61
63
65
67
50
70
90
110
130
150
170
190
36.99 37.19 37.39 37.59 37.79
Inte
nsi
ty (
dB
)
Air
flo
w (
cm3/s
)
Time (s)
63
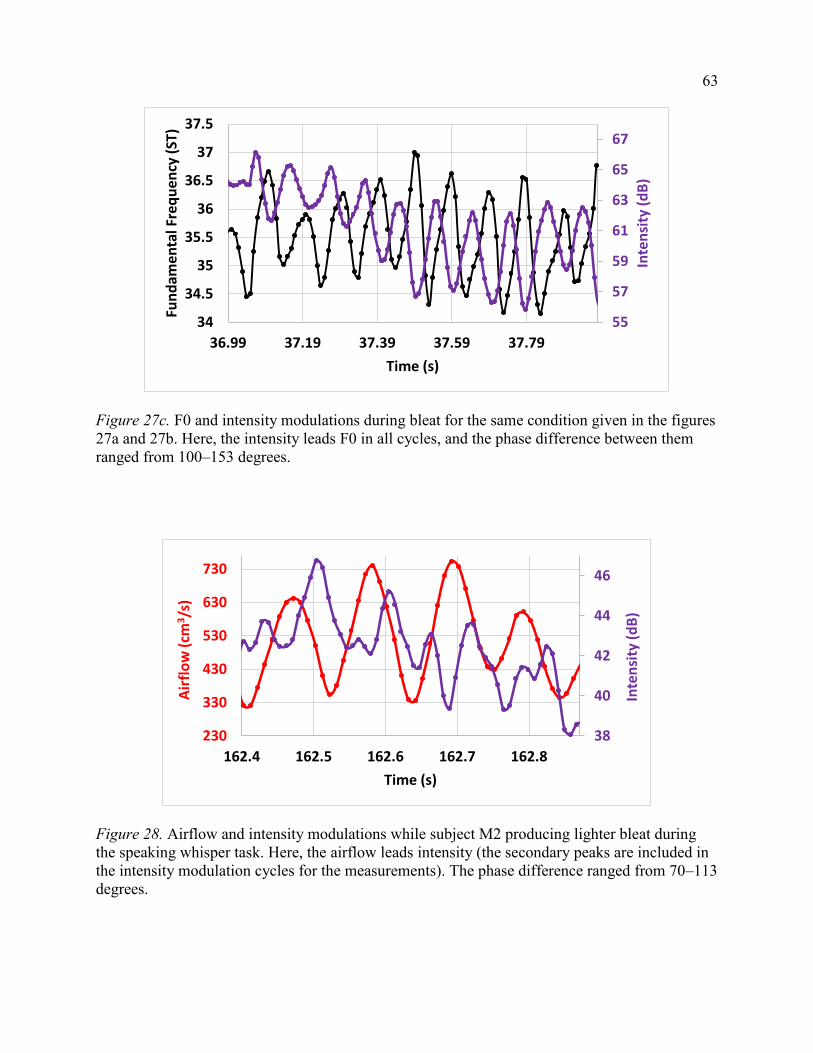
Figure 27c. F0 and intensity modulations during bleat for the same condition given in the figures 27a and 27b. Here, the intensity leads F0 in all cycles, and the phase difference between them ranged from 100–153 degrees.
Figure 28. Airflow and intensity modulations while subject M2 producing lighter bleat during the speaking whisper task. Here, the airflow leads intensity (the secondary peaks are included in the intensity modulation cycles for the measurements). The phase difference ranged from 70–113 degrees.
55
57
59
61
63
65
67
34
34.5
35
35.5
36
36.5
37
37.5
36.99 37.19 37.39 37.59 37.79
Inte
nsi
ty (
dB
)
Fun
dam
enta
l Fre
qu
ency
(ST
)
Time (s)
38
40
42
44
46
230
330
430
530
630
730
162.4 162.5 162.6 162.7 162.8
Inte
nsi
ty (
dB
)
Air
flo
w (
cm3/s
)
Time (s)
64
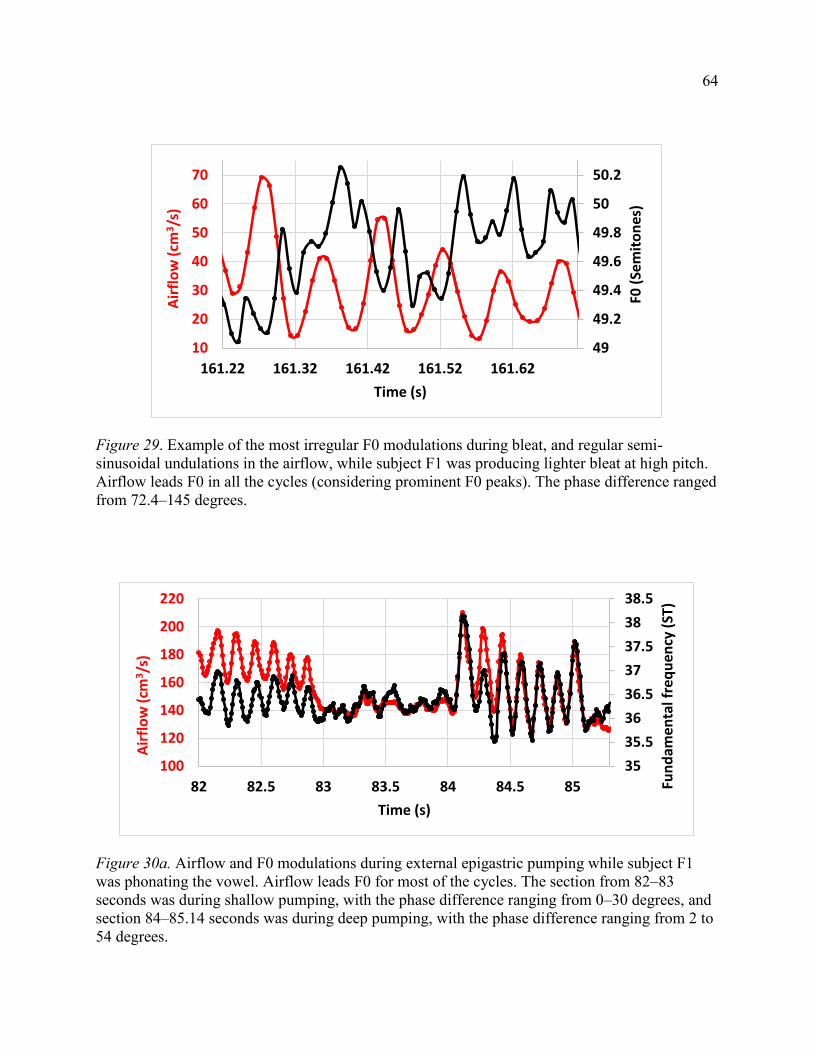
Figure 29. Example of the most irregular F0 modulations during bleat, and regular semi-sinusoidal undulations in the airflow, while subject F1 was producing lighter bleat at high pitch. Airflow leads F0 in all the cycles (considering prominent F0 peaks). The phase difference ranged from 72.4–145 degrees.
Figure 30a. Airflow and F0 modulations during external epigastric pumping while subject F1 was phonating the vowel. Airflow leads F0 for most of the cycles. The section from 82–83 seconds was during shallow pumping, with the phase difference ranging from 0–30 degrees, and section 84–85.14 seconds was during deep pumping, with the phase difference ranging from 2 to 54 degrees.
49
49.2
49.4
49.6
49.8
50
50.2
10
20
30
40
50
60
70
161.22 161.32 161.42 161.52 161.62
F0 (
Sem
ito
nes
)
Air
flo
w (
cm3/s
)
Time (s)
35
35.5
36
36.5
37
37.5
38
38.5
100
120
140
160
180
200
220
82 82.5 83 83.5 84 84.5 85 Fun
dam
enta
l fre
qu
ency
(ST
)
Air
flo
w (
cm3/s
)
Time (s)
65
Figure 30b. Airflow and intensity modulations during external epigastric pumping for the same condition given in Figure 30a. For shallow pumping, the phase difference ranged from 0–28 degrees. For deep pumping, the phase difference was 0 degree, i.e., in-phase.
Figure 30c. F0 and intensity modulations during external epigastric pumping for the same condition given in above. For shallow pumping, the phase difference ranged from 0–28 degrees, where intensity was leading if not in-phase. For deep pumping, the phase difference was 0 degree, i.e., in-phase.
66
67
68
69
70
71
72
73
74
100
120
140
160
180
200
220
82 82.5 83 83.5 84 84.5 85
Inte
nsi
ty (
dB
)
Air
flo
w (
cm3/s
)
Time (s)
66
67
68
69
70
71
72
73
74
35
35.5
36
36.5
37
37.5
38
38.5
82 82.5 83 83.5 84 84.5 85
Inte
nsi
ty (
dB
)
F0 (
Sem
ito
nes
)
Time (s)
66
Figure 31. Airflow and intensity modulations during external epigastric pumping while subject M2 was sustaining whisper on the vowel /a/. The phase difference between them was 0 degree, i.e., in-phase. The section from 175–176 seconds was during shallow pumping, and the section from 176.7–177.8 seconds was during deep pumping.
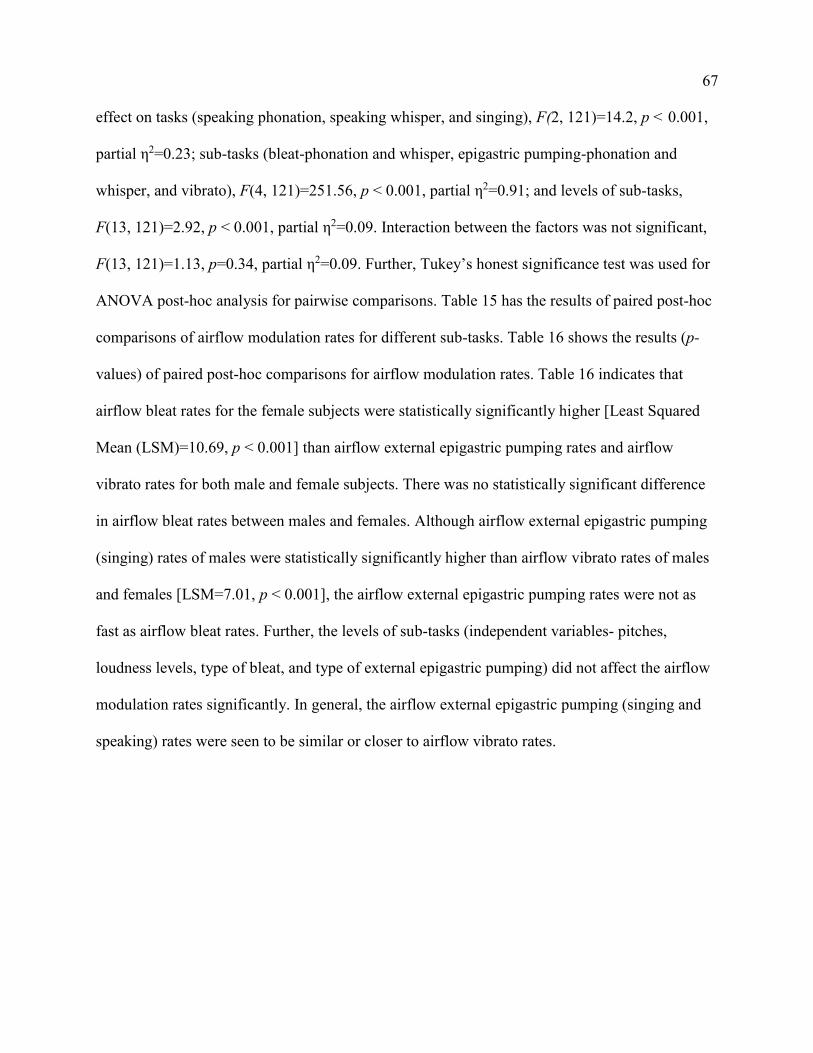
Airflow and F0 modulation rates. The airflow bleat rates and airflow external epigastric
pumping rates during speaking and singing, and airflow vibrato rates during singing, were
compared, and the values are reported in Tables 11, 12, and 13 for the four singers. It is noted
that the epigastric pumping rate was determined by the experimenter applying the pumping, and
was not determined by the subject who received the epigastric pumping. Figure 32 shows the
mean airflow modulation rates of bleat (B), external epigastric pumping (E), and vibrato (V)
during singing (sing), speaking phonation (Sp-P), and speaking whisper (Sp-W). The statistical
model used for these results was repeated measures 2-crossed and 3-staged nested ANOVA
(fixed variables). ANOVA results for airflow modulation rates of bleat (adductory change
and singing), and vibrato (singing) are given in Table 14. The full model explains 85% of the
variation in airflow modulation rate (R2=0.85). Table 14 shows a statistically significant main
36
41
46
51
56
100
200
300
400
500
600
174 175 176 177 178
Inte
nsi
ty (
dB
)
Air
flo
w (
cm3/s
)
Time (s)
67
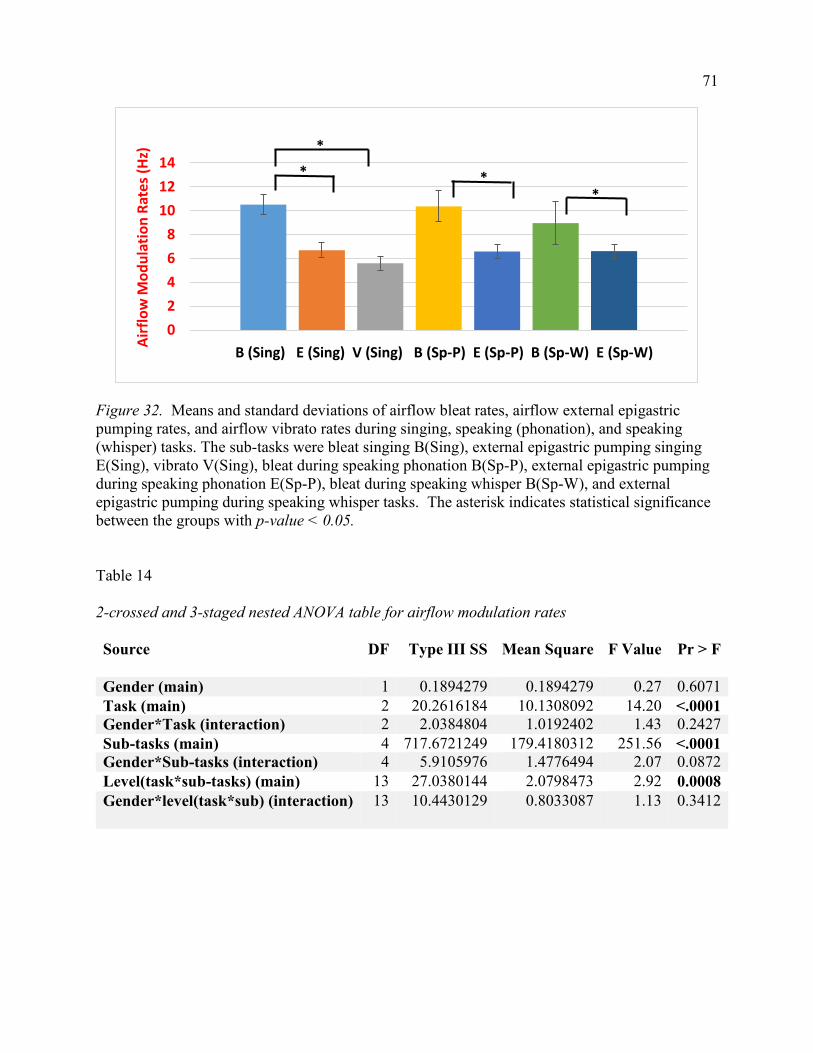
effect on tasks (speaking phonation, speaking whisper, and singing), F(2, 121)=14.2, p < 0.001,
partial η2=0.23; sub-tasks (bleat-phonation and whisper, epigastric pumping-phonation and
whisper, and vibrato), F(4, 121)=251.56, p < 0.001, partial η2=0.91; and levels of sub-tasks,
F(13, 121)=2.92, p < 0.001, partial η2=0.09. Interaction between the factors was not significant,
F(13, 121)=1.13, p=0.34, partial η2=0.09. Further, Tukey’s honest significance test was used for
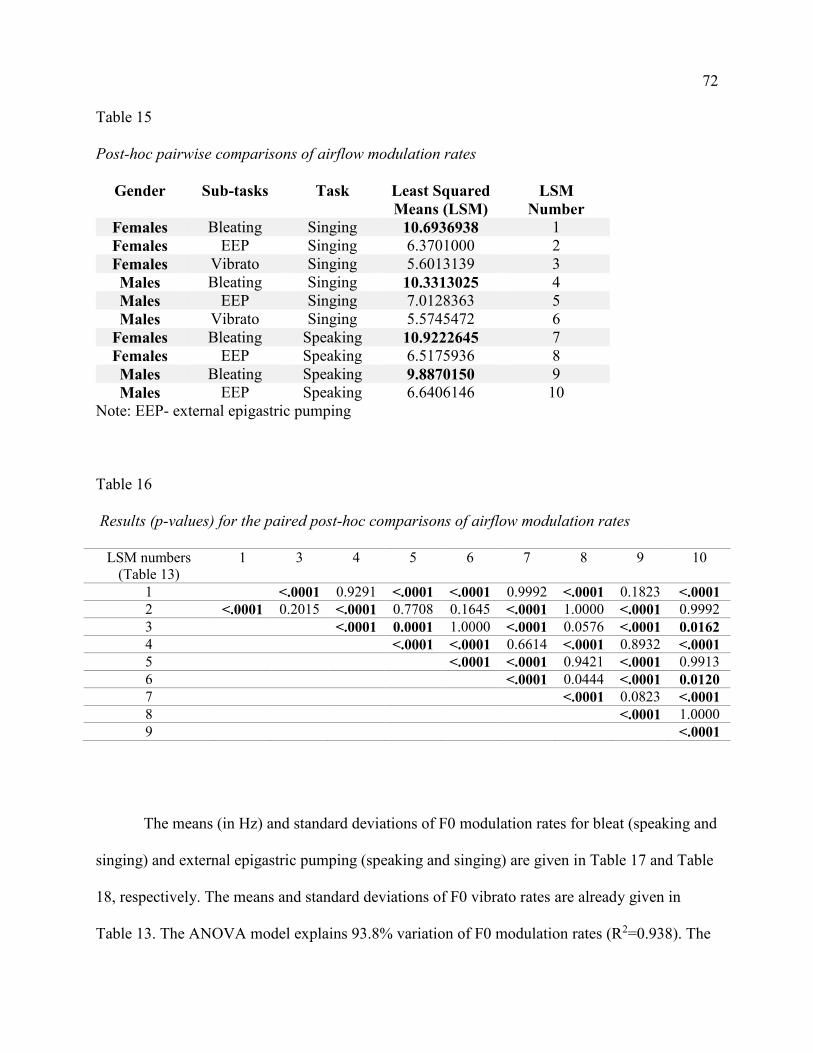
ANOVA post-hoc analysis for pairwise comparisons. Table 15 has the results of paired post-hoc
comparisons of airflow modulation rates for different sub-tasks. Table 16 shows the results (p-
values) of paired post-hoc comparisons for airflow modulation rates. Table 16 indicates that
airflow bleat rates for the female subjects were statistically significantly higher [Least Squared
Mean (LSM)=10.69, p < 0.001] than airflow external epigastric pumping rates and airflow
vibrato rates for both male and female subjects. There was no statistically significant difference
in airflow bleat rates between males and females. Although airflow external epigastric pumping
(singing) rates of males were statistically significantly higher than airflow vibrato rates of males
and females [LSM=7.01, p < 0.001], the airflow external epigastric pumping rates were not as
fast as airflow bleat rates. Further, the levels of sub-tasks (independent variables- pitches,
loudness levels, type of bleat, and type of external epigastric pumping) did not affect the airflow
modulation rates significantly. In general, the airflow external epigastric pumping (singing and
speaking) rates were seen to be similar or closer to airflow vibrato rates.
68
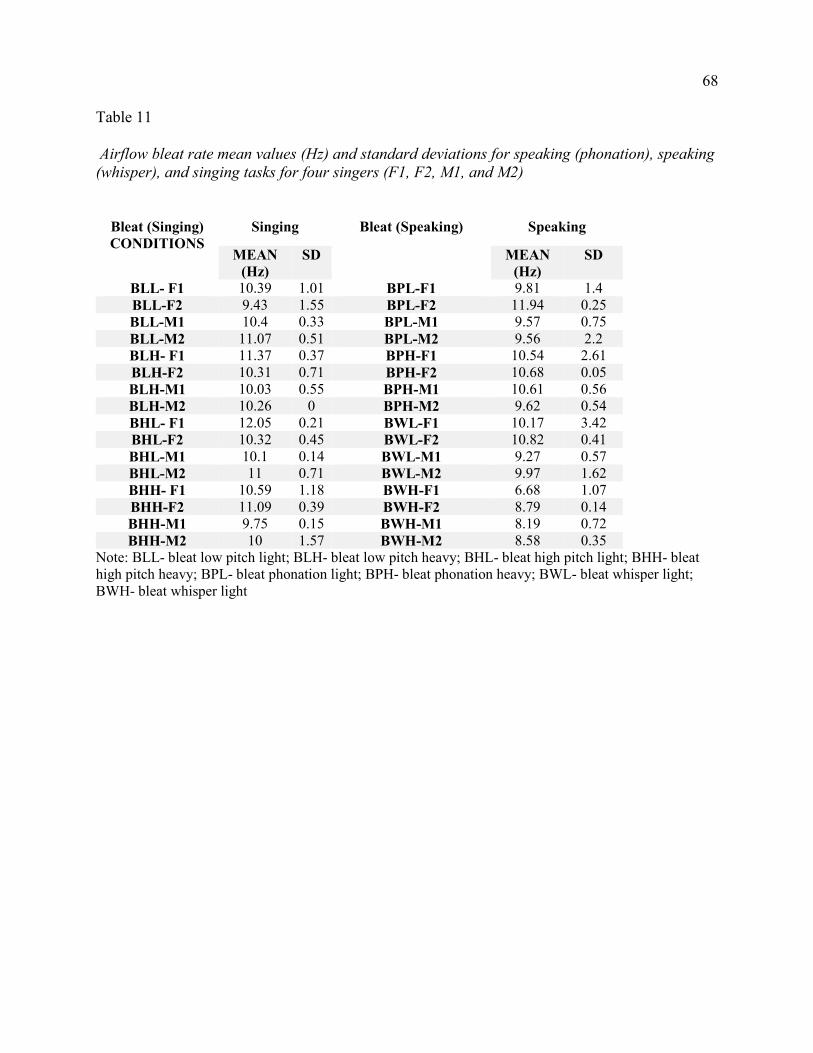
Table 11
Airflow bleat rate mean values (Hz) and standard deviations for speaking (phonation), speaking (whisper), and singing tasks for four singers (F1, F2, M1, and M2)
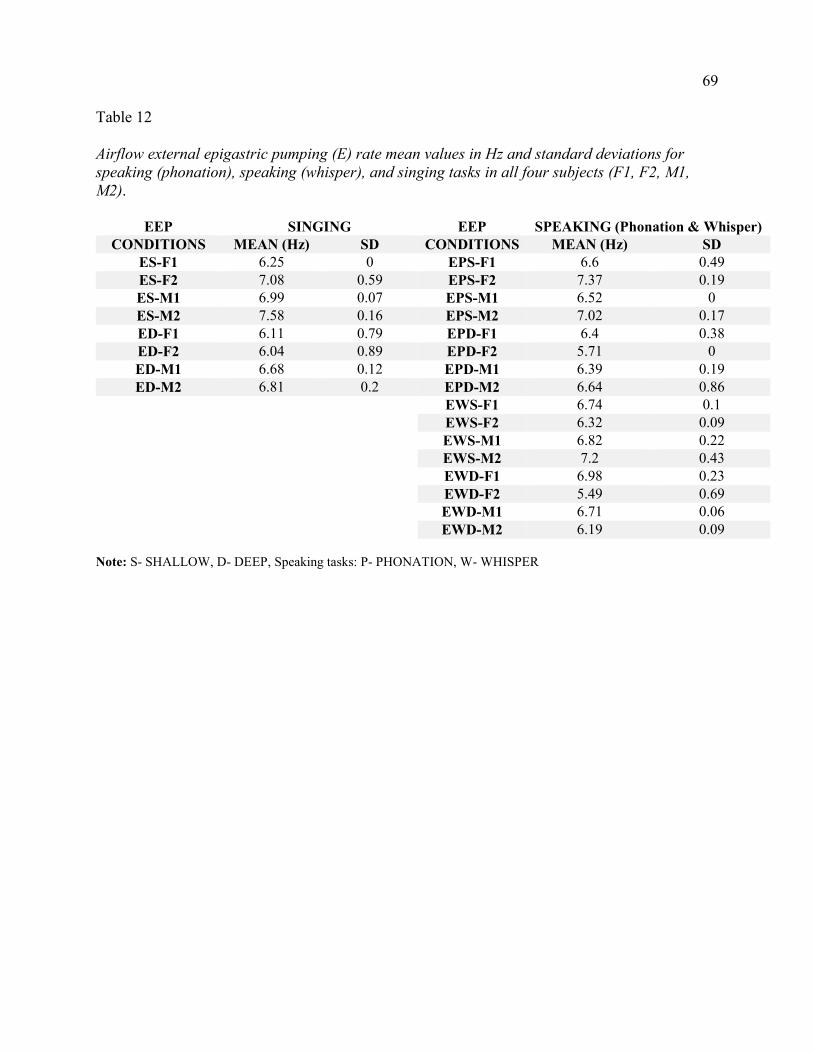
Airflow external epigastric pumping (E) rate mean values in Hz and standard deviations for speaking (phonation), speaking (whisper), and singing tasks in all four subjects (F1, F2, M1, M2).
EEP SINGING EEP SPEAKING (Phonation & Whisper) CONDITIONS MEAN (Hz) SD CONDITIONS MEAN (Hz) SD
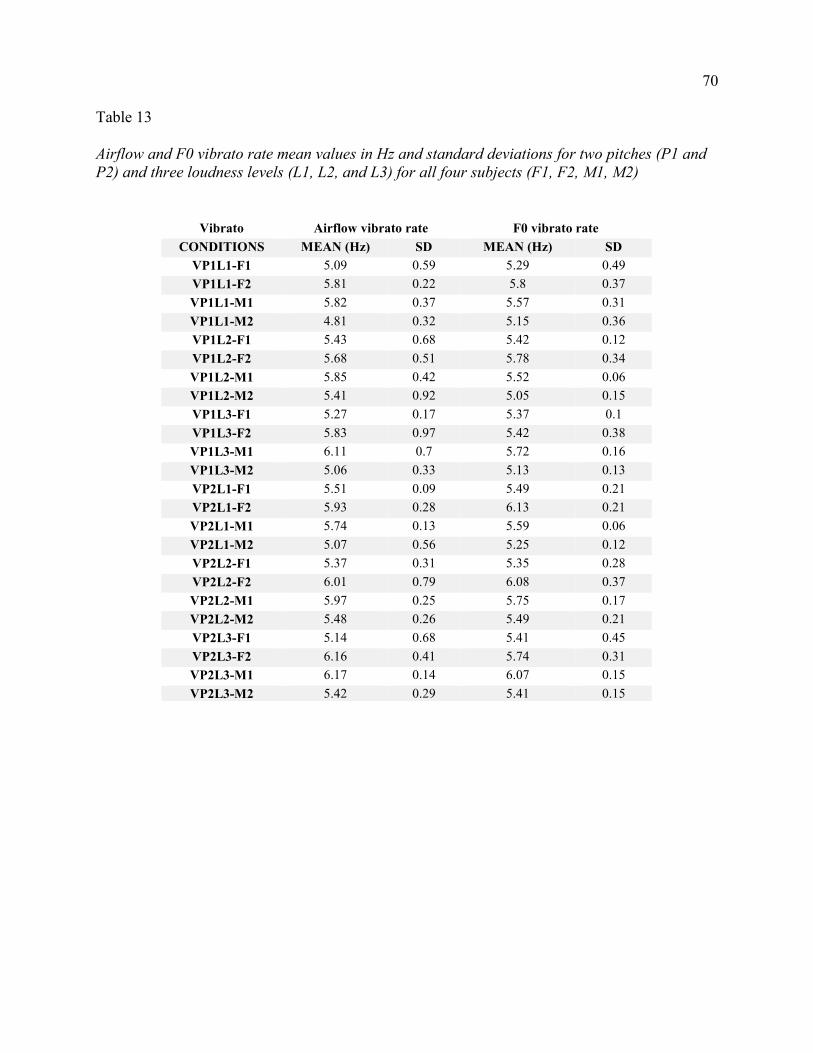
Airflow and F0 vibrato rate mean values in Hz and standard deviations for two pitches (P1 and P2) and three loudness levels (L1, L2, and L3) for all four subjects (F1, F2, M1, M2)
Vibrato Airflow vibrato rate F0 vibrato rate CONDITIONS MEAN (Hz) SD MEAN (Hz) SD
Figure 32. Means and standard deviations of airflow bleat rates, airflow external epigastric pumping rates, and airflow vibrato rates during singing, speaking (phonation), and speaking (whisper) tasks. The sub-tasks were bleat singing B(Sing), external epigastric pumping singing E(Sing), vibrato V(Sing), bleat during speaking phonation B(Sp-P), external epigastric pumping during speaking phonation E(Sp-P), bleat during speaking whisper B(Sp-W), and external epigastric pumping during speaking whisper tasks. The asterisk indicates statistical significance between the groups with p-value < 0.05.
Table 14
2-crossed and 3-staged nested ANOVA table for airflow modulation rates
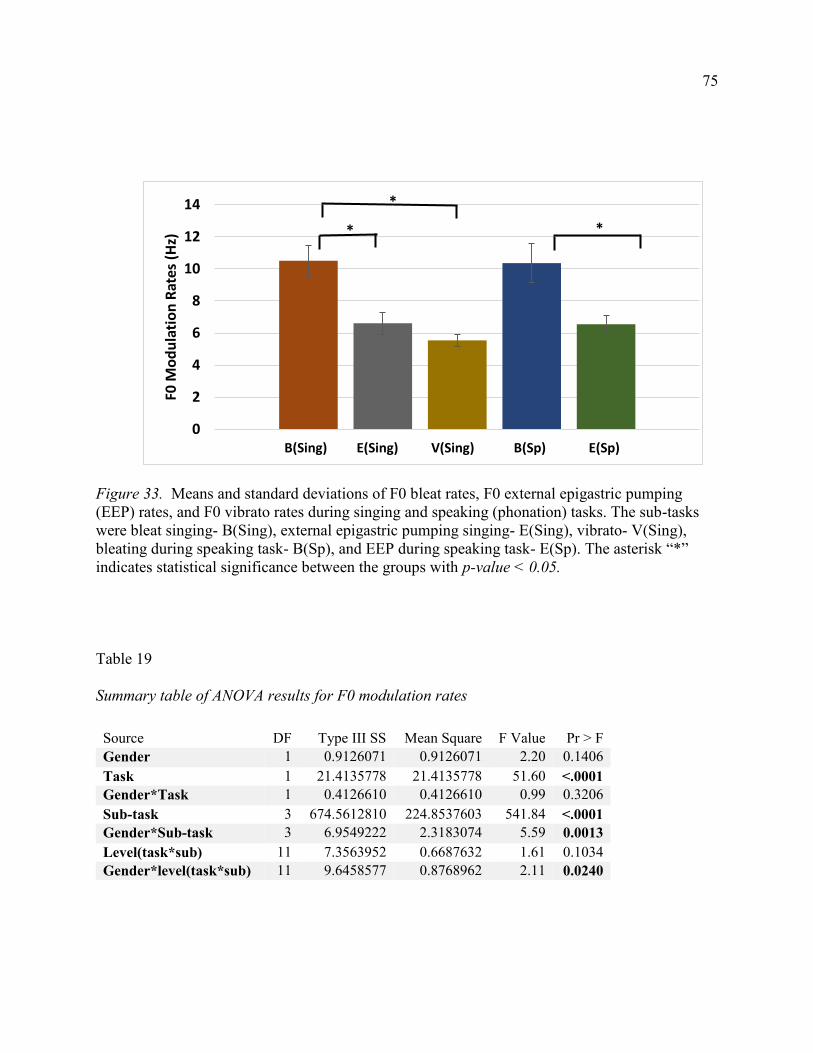
Figure 33. Means and standard deviations of F0 bleat rates, F0 external epigastric pumping (EEP) rates, and F0 vibrato rates during singing and speaking (phonation) tasks. The sub-tasks were bleat singing- B(Sing), external epigastric pumping singing- E(Sing), vibrato- V(Sing), bleating during speaking task- B(Sp), and EEP during speaking task- E(Sp). The asterisk “*” indicates statistical significance between the groups with p-value < 0.05.
Table 19
Summary table of ANOVA results for F0 modulation rates
0
2
4
6
8
10
12
14
MEAN
F0 M
od
ula
tio
n R
ates
(H
z)
B(Sing) E(Sing) V(Sing) B(Sp) E(Sp)
Source DF Type III SS Mean Square F Value Pr > F Gender 1 0.9126071 0.9126071 2.20 0.1406 Task 1 21.4135778 21.4135778 51.60 <.0001 Gender*Task 1 0.4126610 0.4126610 0.99 0.3206 Sub-task 3 674.5612810 224.8537603 541.84 <.0001 Gender*Sub-task 3 6.9549222 2.3183074 5.59 0.0013 Level(task*sub) 11 7.3563952 0.6687632 1.61 0.1034 Gender*level(task*sub) 11 9.6458577 0.8768962 2.11 0.0240
*
*
*
76
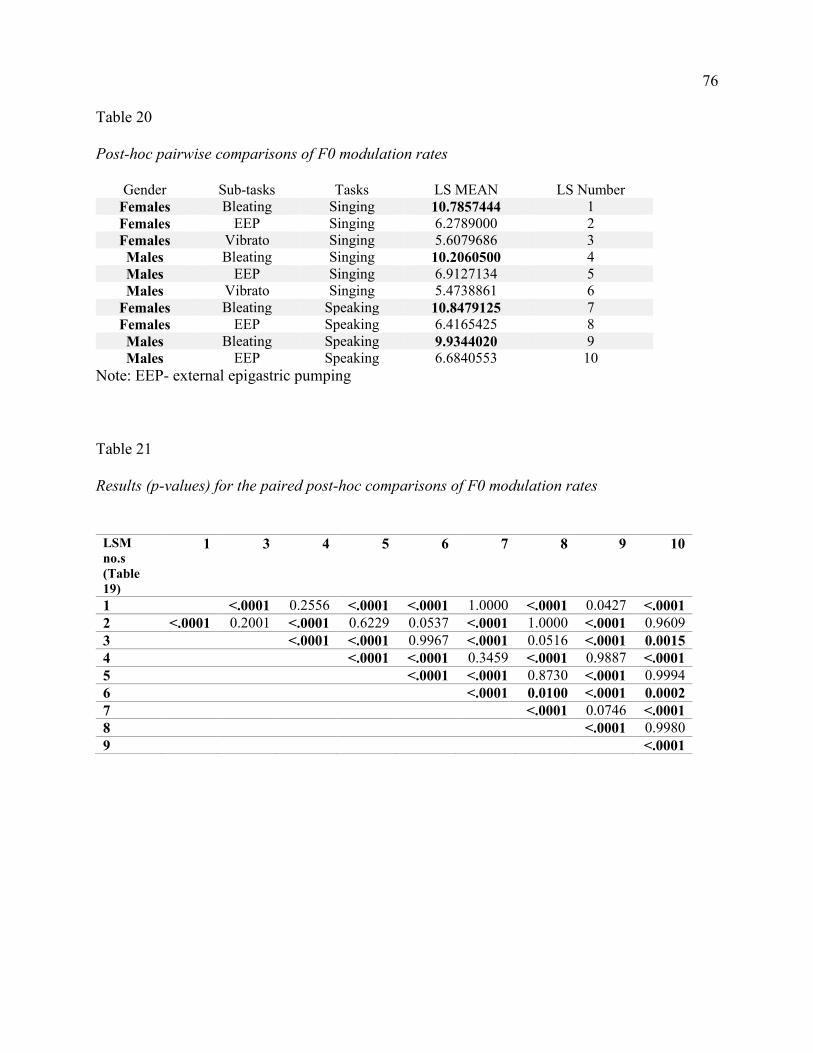
Table 20
Post-hoc pairwise comparisons of F0 modulation rates
Gender Sub-tasks Tasks LS MEAN LS Number Females Bleating Singing 10.7857444 1 Females EEP Singing 6.2789000 2 Females Vibrato Singing 5.6079686 3 Males Bleating Singing 10.2060500 4 Males EEP Singing 6.9127134 5 Males Vibrato Singing 5.4738861 6
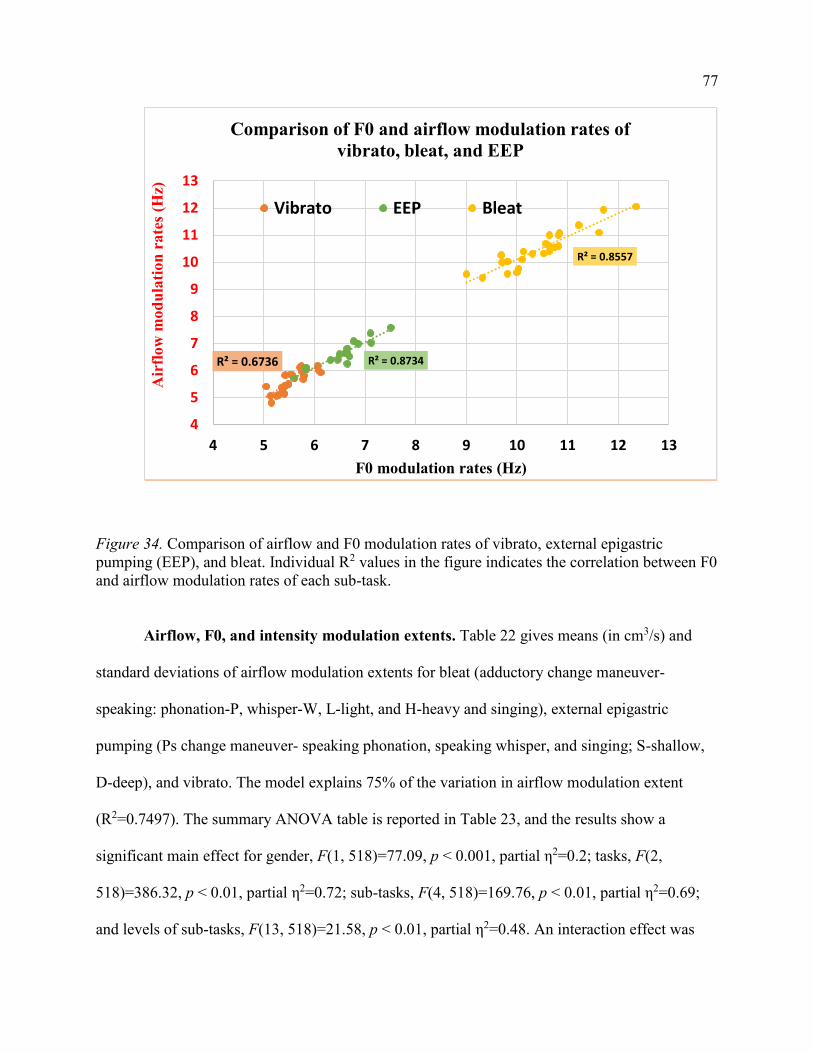
Figure 34. Comparison of airflow and F0 modulation rates of vibrato, external epigastric pumping (EEP), and bleat. Individual R2 values in the figure indicates the correlation between F0 and airflow modulation rates of each sub-task.
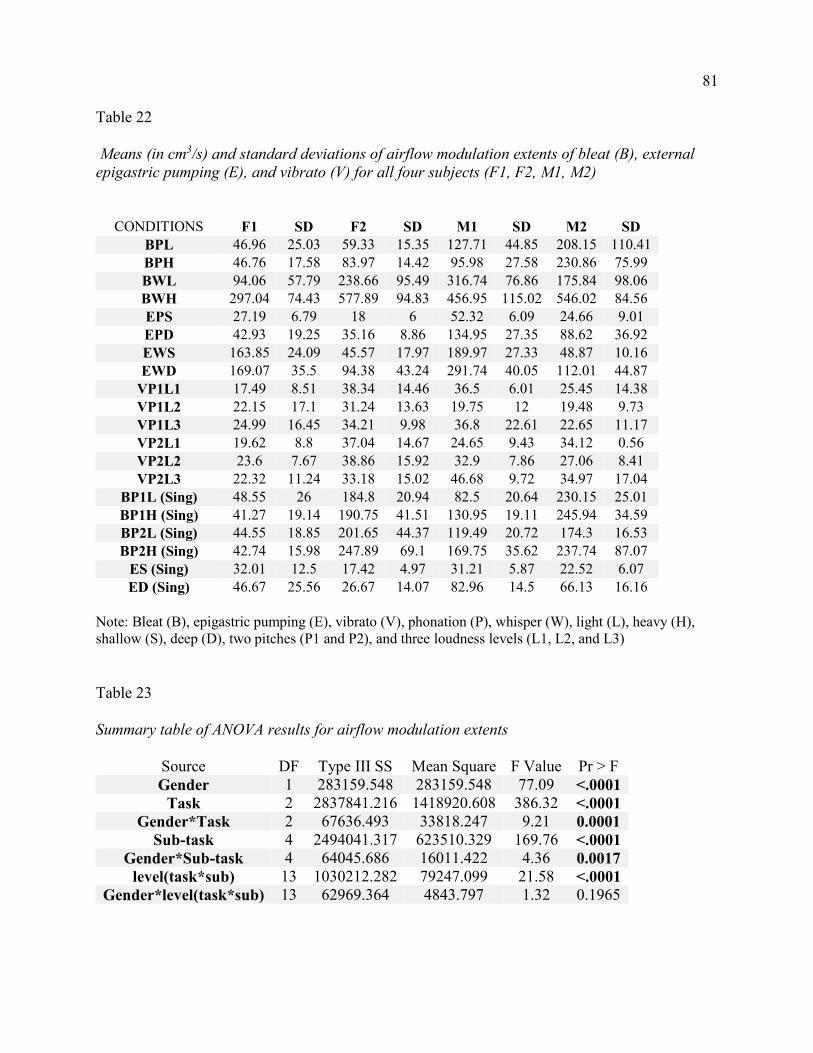
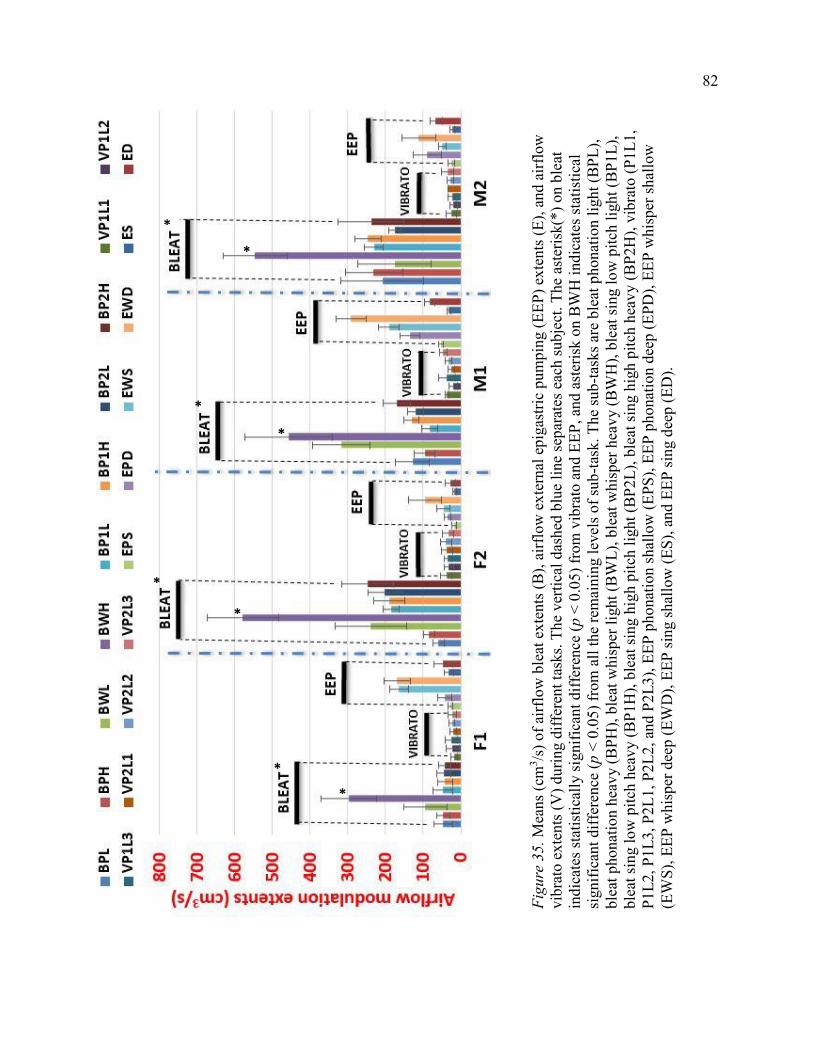
Airflow, F0, and intensity modulation extents. Table 22 gives means (in cm3/s) and
standard deviations of airflow modulation extents for bleat (adductory change maneuver-
speaking: phonation-P, whisper-W, L-light, and H-heavy and singing), external epigastric
indicates larger respiratory pumping and large-sized larynges undergo greater airflow
modulations than shallow pumping and small-sized larynges (there was no intent on the
experimenter’s part to use more pumping force on the epigastric area of the males).
81
Table 22
Means (in cm3/s) and standard deviations of airflow modulation extents of bleat (B), external epigastric pumping (E), and vibrato (V) for all four subjects (F1, F2, M1, M2)
ES (Sing) 32.01 12.5 17.42 4.97 31.21 5.87 22.52 6.07 ED (Sing) 46.67 25.56 26.67 14.07 82.96 14.5 66.13 16.16
Note: Bleat (B), epigastric pumping (E), vibrato (V), phonation (P), whisper (W), light (L), heavy (H), shallow (S), deep (D), two pitches (P1 and P2), and three loudness levels (L1, L2, and L3)
Table 23
Summary table of ANOVA results for airflow modulation extents
Source DF Type III SS Mean Square F Value Pr > F Gender 1 283159.548 283159.548 77.09 <.0001
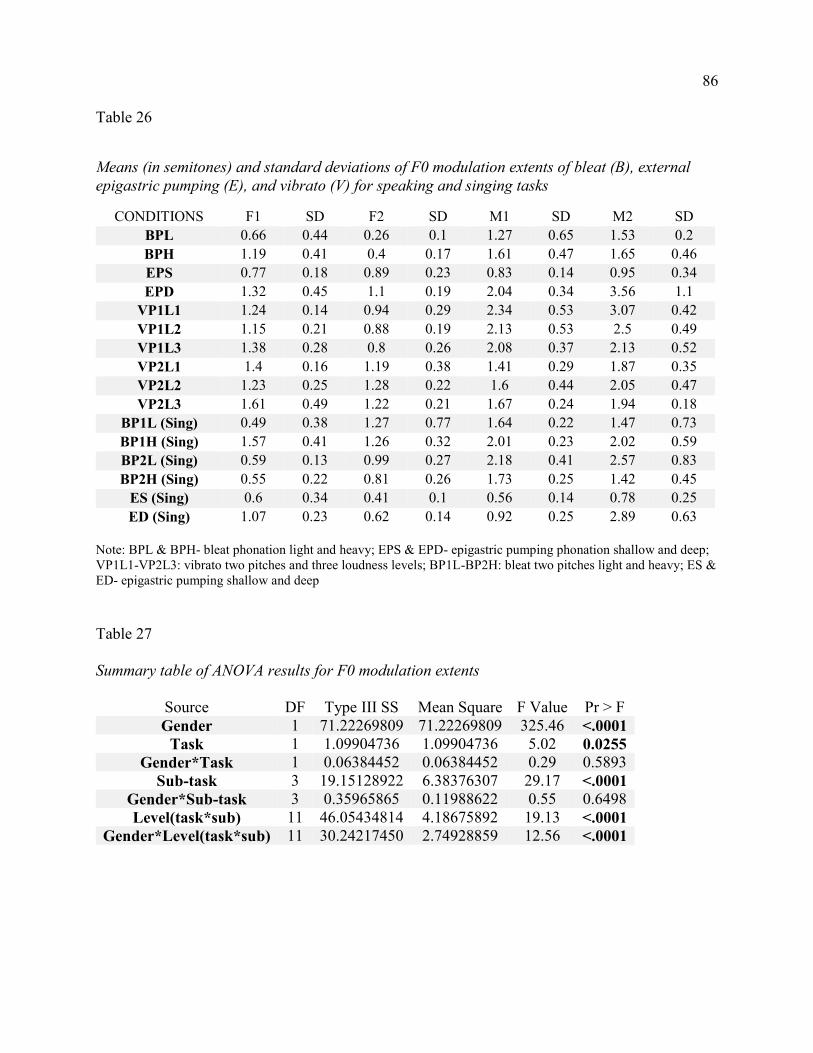
SD=0.44 ST, p=0.0022]. This indicates that F0 modulation extents are greatly affected by
changes in subglottal pressure, and are directly related. During vibrato, in general there was no
statistically significant difference seen in F0 vibrato extents among the three loudness levels in
the four subjects. When comparison was made between low pitch (P1) and high pitch (P2), the
F0 vibrato extents were statistically significantly higher in P1 than in P2 for males [P1: M=2.38
ST, SD=0.48 ST, p=0.027], whereas in females, F0 vibrato extents in P2 were slightly higher
than P1, but not statistically significant [P2: M=1.32 ST, SD=0.29 ST, p=0.12]. This indicates
that the increase of vocal fold tension with increase of pitch may or may not contribute to
determining the extent of the F0 vibrato extent, since the relationship differed between the males
and females, unless there is a gender difference in the production of different pitches. The
highest F0 vibrato extent in females was seen in the P2L3 condition in comparison with other
conditions. This might suggest a slightly higher contribution of subglottal pressure on F0 vibrato
extents at higher pitches in females.
86
Table 26
Means (in semitones) and standard deviations of F0 modulation extents of bleat (B), external epigastric pumping (E), and vibrato (V) for speaking and singing tasks
ES (Sing) 0.6 0.34 0.41 0.1 0.56 0.14 0.78 0.25 ED (Sing) 1.07 0.23 0.62 0.14 0.92 0.25 2.89 0.63
Note: BPL & BPH- bleat phonation light and heavy; EPS & EPD- epigastric pumping phonation shallow and deep; VP1L1-VP2L3: vibrato two pitches and three loudness levels; BP1L-BP2H: bleat two pitches light and heavy; ES & ED- epigastric pumping shallow and deep
Table 27
Summary table of ANOVA results for F0 modulation extents
Source DF Type III SS Mean Square F Value Pr > F Gender 1 71.22269809 71.22269809 325.46 <.0001
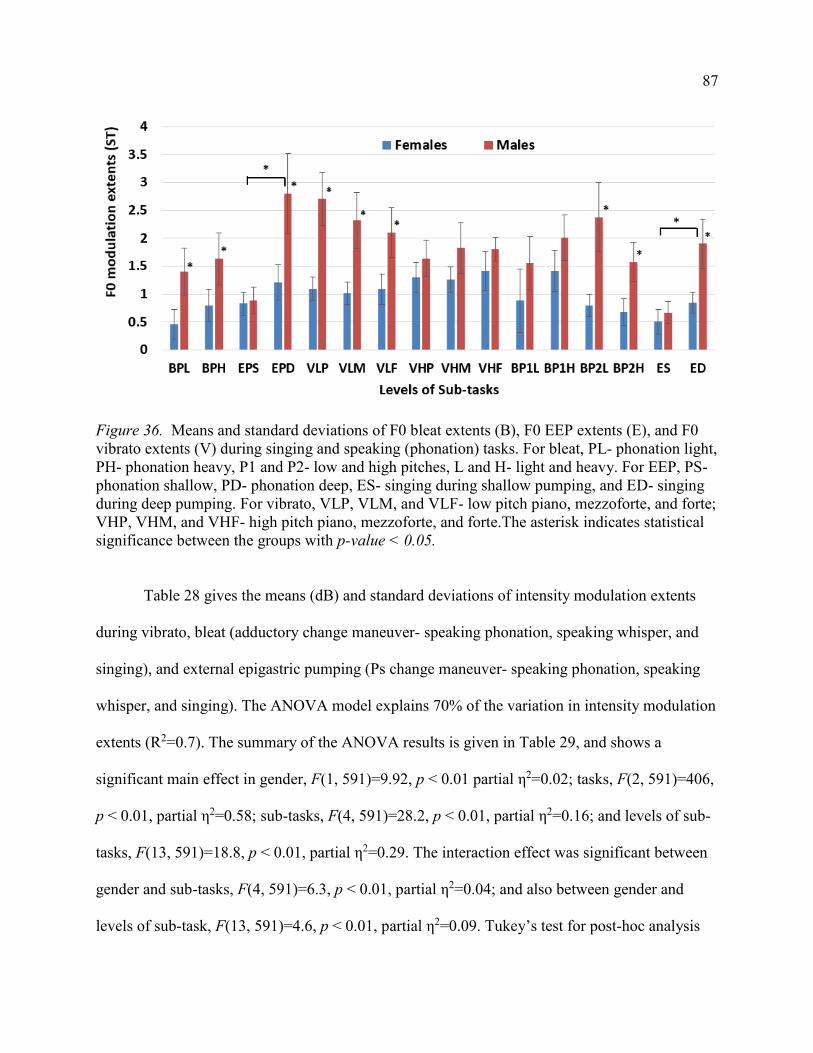
Figure 36. Means and standard deviations of F0 bleat extents (B), F0 EEP extents (E), and F0 vibrato extents (V) during singing and speaking (phonation) tasks. For bleat, PL- phonation light, PH- phonation heavy, P1 and P2- low and high pitches, L and H- light and heavy. For EEP, PS- phonation shallow, PD- phonation deep, ES- singing during shallow pumping, and ED- singing during deep pumping. For vibrato, VLP, VLM, and VLF- low pitch piano, mezzoforte, and forte; VHP, VHM, and VHF- high pitch piano, mezzoforte, and forte.The asterisk indicates statistical significance between the groups with p-value < 0.05.
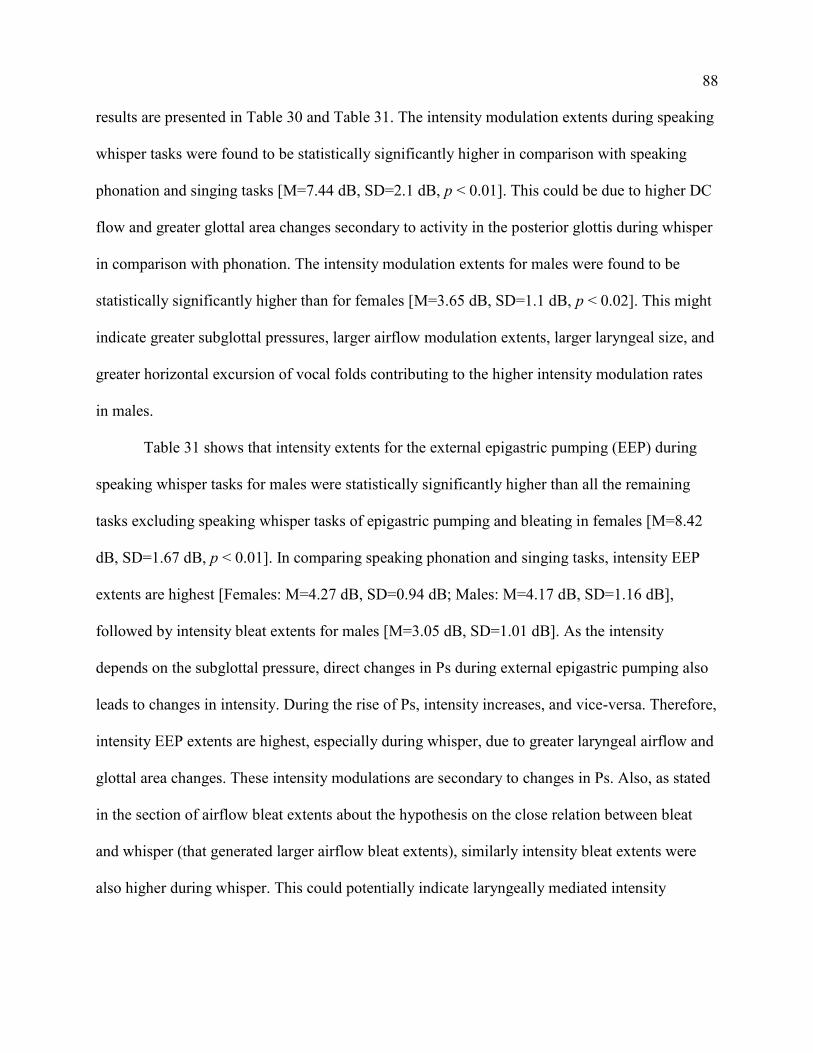
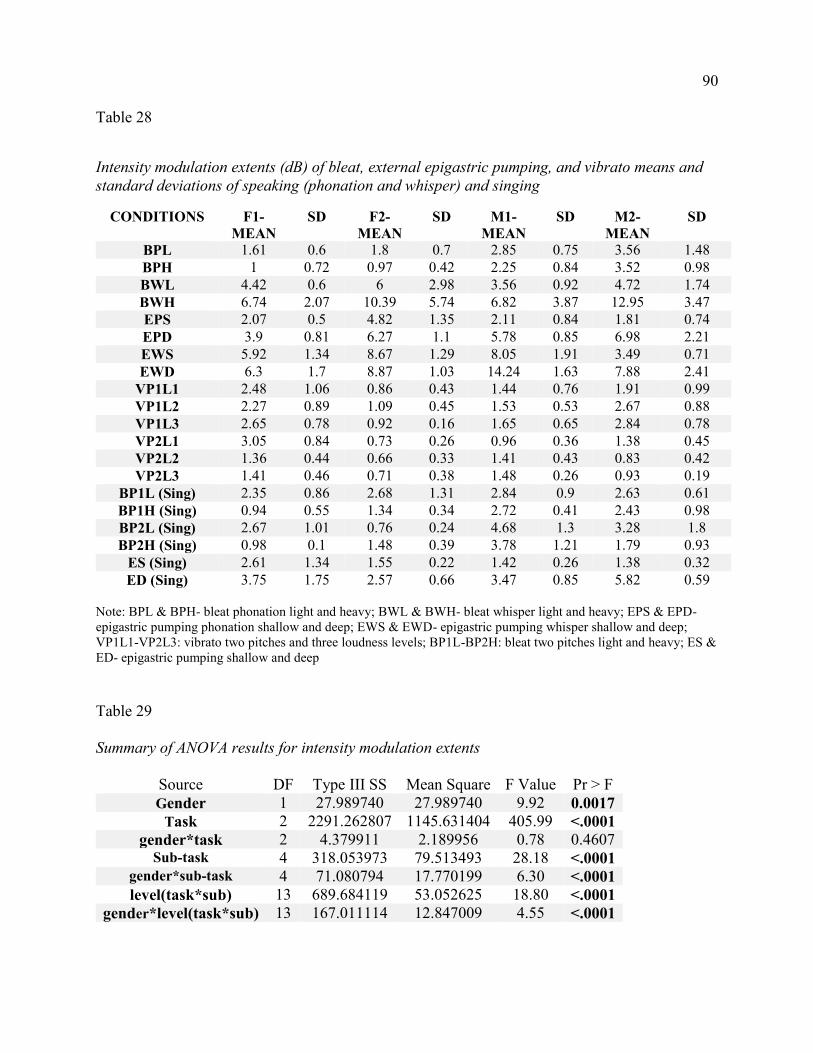
Table 28 gives the means (dB) and standard deviations of intensity modulation extents
during vibrato, bleat (adductory change maneuver- speaking phonation, speaking whisper, and
followed by intensity bleat extents for males [M=3.05 dB, SD=1.01 dB]. As the intensity
depends on the subglottal pressure, direct changes in Ps during external epigastric pumping also
leads to changes in intensity. During the rise of Ps, intensity increases, and vice-versa. Therefore,
intensity EEP extents are highest, especially during whisper, due to greater laryngeal airflow and
glottal area changes. These intensity modulations are secondary to changes in Ps. Also, as stated
in the section of airflow bleat extents about the hypothesis on the close relation between bleat
and whisper (that generated larger airflow bleat extents), similarly intensity bleat extents were
also higher during whisper. This could potentially indicate laryngeally mediated intensity
89
modulations secondary to adductory-abductory changes in bleat as supported by a study done by
Dromey et al. (2009) on amplitude (intensity) modulations during vibrato.
The intensity vibrato extents of males and females had a similar range of intensity bleat
extents as in females [Bleat: Singing- M=1.65 dB, SD=0.6 dB; Speaking- M=1.35 dB, SD=0.06
dB]. The intensity vibrato extents were the lowest in compared with intensity external epigastric
pumping extents and intensity bleat extents. This could lead to a hypothesis of a combination of
subglottal pressure, glottal adduction, and laryngeal flow resistance, and its being neither
primarily respiratory related nor purely laryngeal adductory.
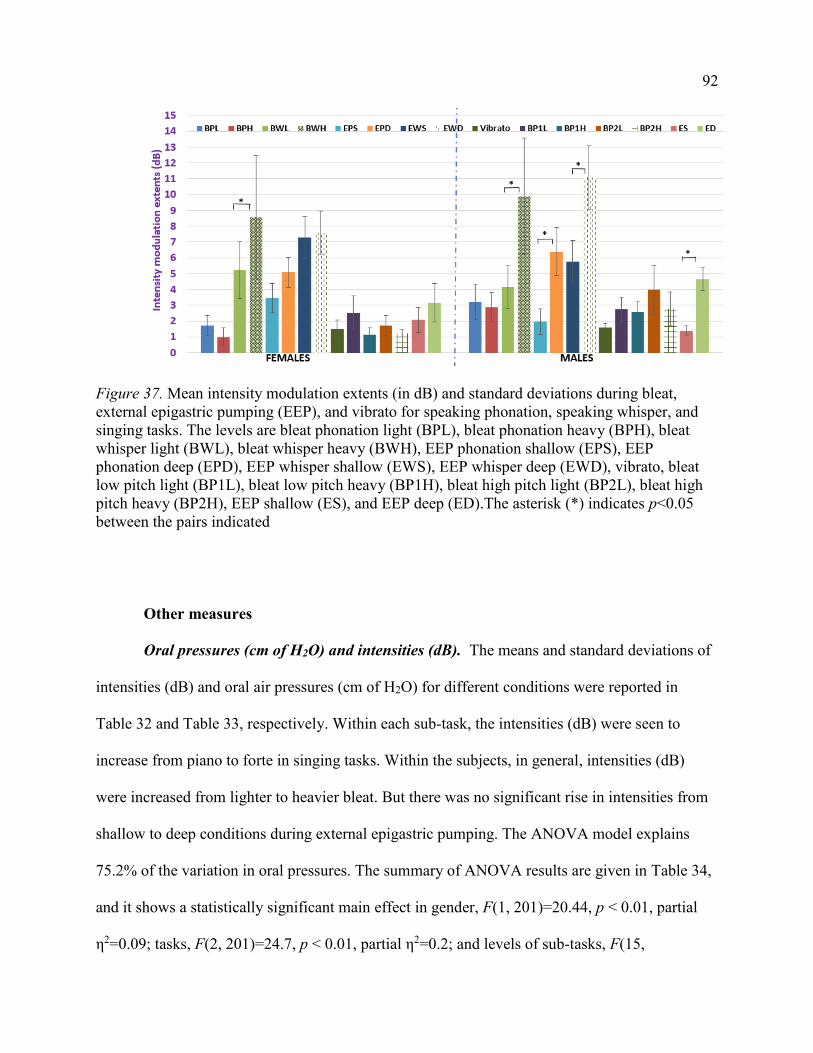
Figure 37 shows the intensity modulation extents during different levels of bleat and
external epigastric pumping. During speaking phonation and singing tasks (P1 and P2), the
intensity bleat extents decrease from lighter to heavier bleat, and this could be due to an increase
of glottal adduction and laryngeal flow resistance. In speaking whisper tasks, the intensity bleat
extents increased significantly from lighter to heavier bleat, which is opposite to phonation, and
this could be due to increased DC flow due to greater enlargement of the posterior glottis [Males,
BWH: M=9.9 dB, SD=3.67 dB, p < 0.01; Females, BWH: M=8.6 dB, SD=3.91 dB, p < 0.01].
During external epigastric pumping (Speaking phonation- EPS and EPD, Speaking whisper-
EWP and EWD, Singing-ES and ED), the intensity external epigastric pumping extents increased
from shallow to deep pumping conditions, and was statistically significant in males [EPD:
M=6.38 dB, SD=1.53 dB, p < 0.01; EWD: M=11.06 dB, SD=2.02 dB, p < 0.01; ED: M=4.65 dB,
SD=0.72 dB, p < 0.01]. This leads to an hypothesis that intensity modulations during singing
(especially vibrato) may be more related to respiratory events in male singers and more to a
combination of respiratory and resonances-harmonics interaction in women (Horii, 1989).
90
Table 28
Intensity modulation extents (dB) of bleat, external epigastric pumping, and vibrato means and standard deviations of speaking (phonation and whisper) and singing
ES (Sing) 2.61 1.34 1.55 0.22 1.42 0.26 1.38 0.32 ED (Sing) 3.75 1.75 2.57 0.66 3.47 0.85 5.82 0.59
Note: BPL & BPH- bleat phonation light and heavy; BWL & BWH- bleat whisper light and heavy; EPS & EPD- epigastric pumping phonation shallow and deep; EWS & EWD- epigastric pumping whisper shallow and deep; VP1L1-VP2L3: vibrato two pitches and three loudness levels; BP1L-BP2H: bleat two pitches light and heavy; ES & ED- epigastric pumping shallow and deep
Table 29
Summary of ANOVA results for intensity modulation extents
Source DF Type III SS Mean Square F Value Pr > F Gender 1 27.989740 27.989740 9.92 0.0017
Figure 37. Mean intensity modulation extents (in dB) and standard deviations during bleat, external epigastric pumping (EEP), and vibrato for speaking phonation, speaking whisper, and singing tasks. The levels are bleat phonation light (BPL), bleat phonation heavy (BPH), bleat whisper light (BWL), bleat whisper heavy (BWH), EEP phonation shallow (EPS), EEP phonation deep (EPD), EEP whisper shallow (EWS), EEP whisper deep (EWD), vibrato, bleat low pitch light (BP1L), bleat low pitch heavy (BP1H), bleat high pitch light (BP2L), bleat high pitch heavy (BP2H), EEP shallow (ES), and EEP deep (ED).The asterisk (*) indicates p<0.05 between the pairs indicated
Other measures
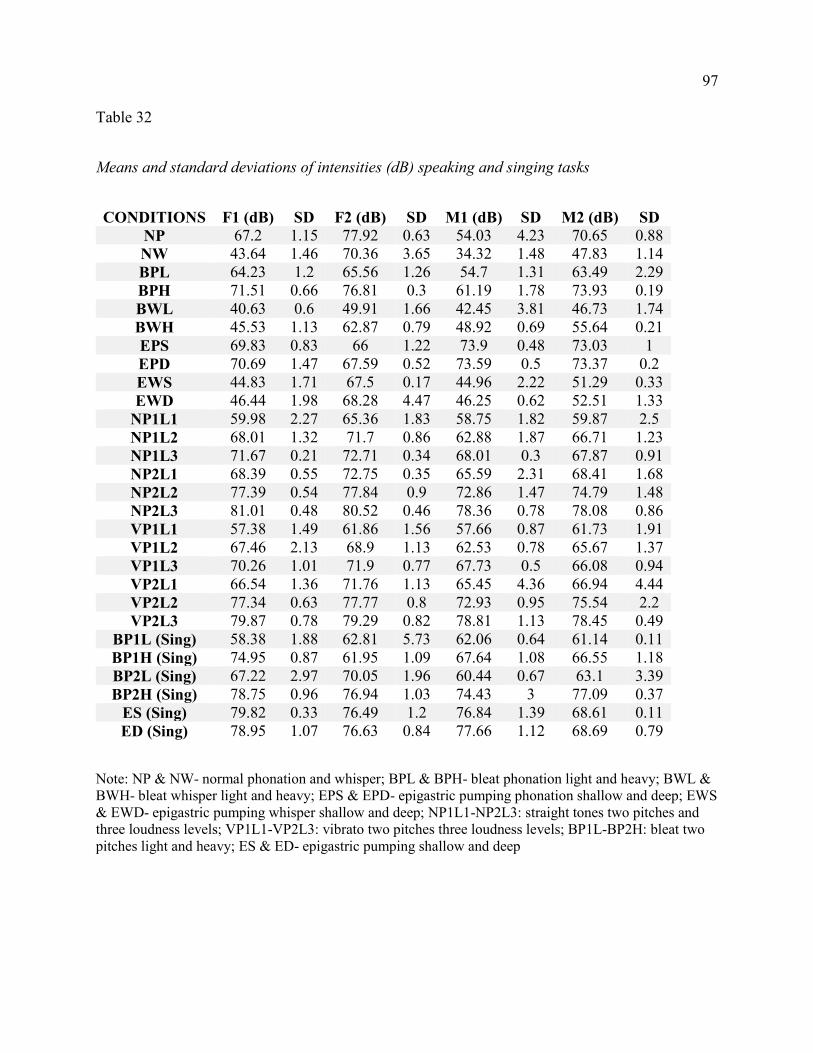
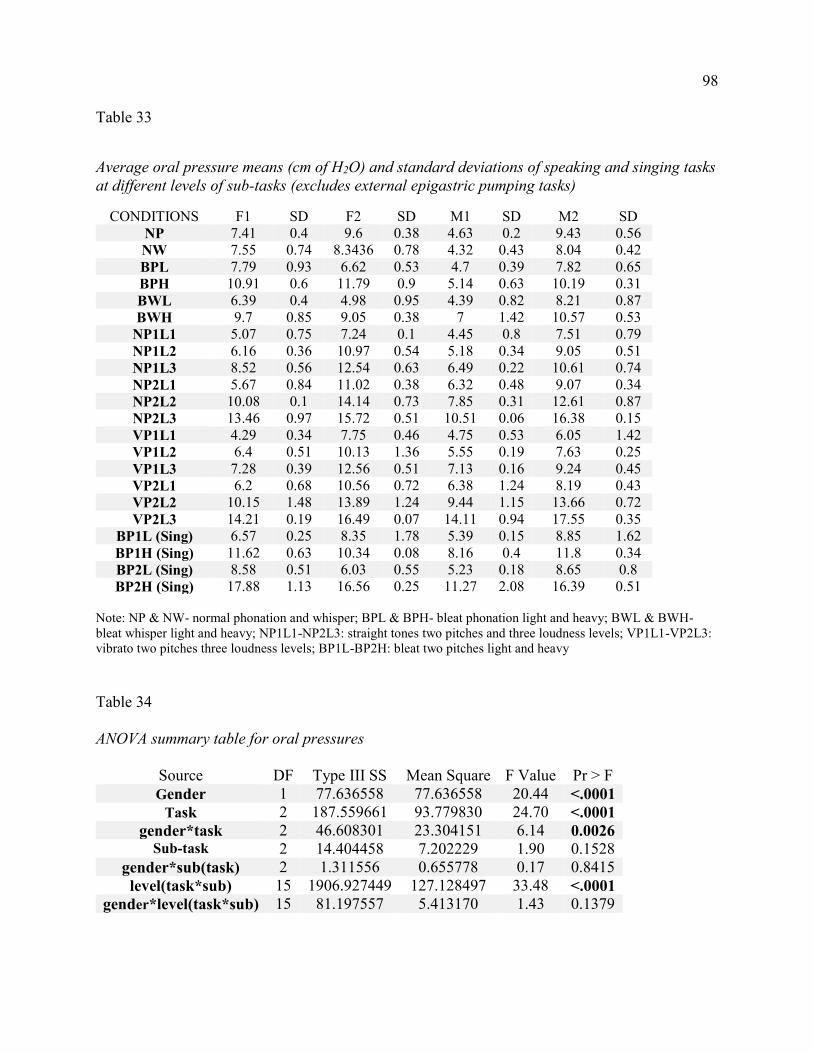
Oral pressures (cm of H2O) and intensities (dB). The means and standard deviations of
intensities (dB) and oral air pressures (cm of H2O) for different conditions were reported in
Table 32 and Table 33, respectively. Within each sub-task, the intensities (dB) were seen to
increase from piano to forte in singing tasks. Within the subjects, in general, intensities (dB)
were increased from lighter to heavier bleat. But there was no significant rise in intensities from
shallow to deep conditions during external epigastric pumping. The ANOVA model explains
75.2% of the variation in oral pressures. The summary of ANOVA results are given in Table 34,
and it shows a statistically significant main effect in gender, F(1, 201)=20.44, p < 0.01, partial
η2=0.09; tasks, F(2, 201)=24.7, p < 0.01, partial η2=0.2; and levels of sub-tasks, F(15,
93
201)=33.48, p < 0.01, partial η2=0.71. An interaction effect was significant between gender and
tasks, F(2, 201)=6.14, p < 0.01, partial η2=0.06. The pairwise post-hoc analysis shows
statistically significantly higher pressures (cm of H2O) in singing tasks in comparison with
speaking phonation and whisper [M=9.7 dB, SD=0.61, p < 0.01]. Females have greater oral
pressures than males and is statistically significant [Females: M=9.7 dB, SD=0.62 dB, p < 0.01].
In straight tones and vibrato, the oral pressures increased from piano to forte. During bleat
(speaking phonation, whisper, and singing: P1 and P2), the heavier conditions had higher oral
pressures than lighter, and the highest pressures were seen in high pitch heavy bleat (BP2H)
[M=15.53 dB, SD=0.81 dB, p < 0.01].
In both P1 and P2 conditions, higher lung pressures were required to produce heavier
bleats than light. This might also indicate why intensities (dB) increase from lighter to heavier
bleats. The F0 bleat extents were also higher in heavier conditions, and this could be due to
greater lung pressures. The intensity bleat extents were, however, seen to be lower in heavier
bleat conditions, and this may be due to increased glottal adduction. Therefore, due to greater
lung pressures, average intensity (dB) increased from lighter to heavier bleat, whereas intensity
modulations during bleat did not primarily depend on subglottal pressure but on laryngeal
adductory functioning. For example, Figure 32 shows that increase in glottal adduction (from
BPL - BPH, BP1L - BP1H, and BP2L - BP2H) decreases the intensity bleat extent, and posterior
glottal activity (during whisper) and increase in glottal area increases the intensity bleat extent.
Similarly, increase in average intensities (dB) secondary to increase in subglottal pressures were
seen in vibrato, but intensity vibrato extents were seen to be lower due to its dependence on
laryngeal adductory functioning.
94
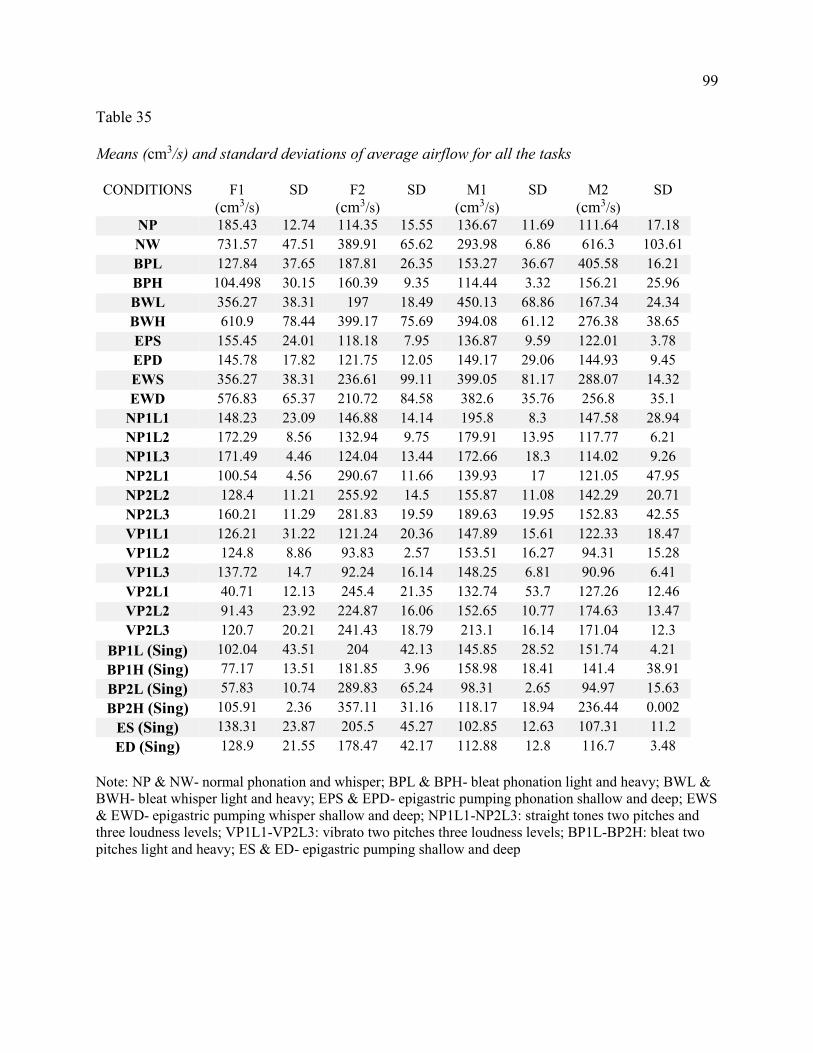
Average airflow (cm3/s) and percent airflow (%). Table 35 gives the means and standard
deviations of average airflow (cm3/s) for all the speaking and singing tasks. The ANOVA model
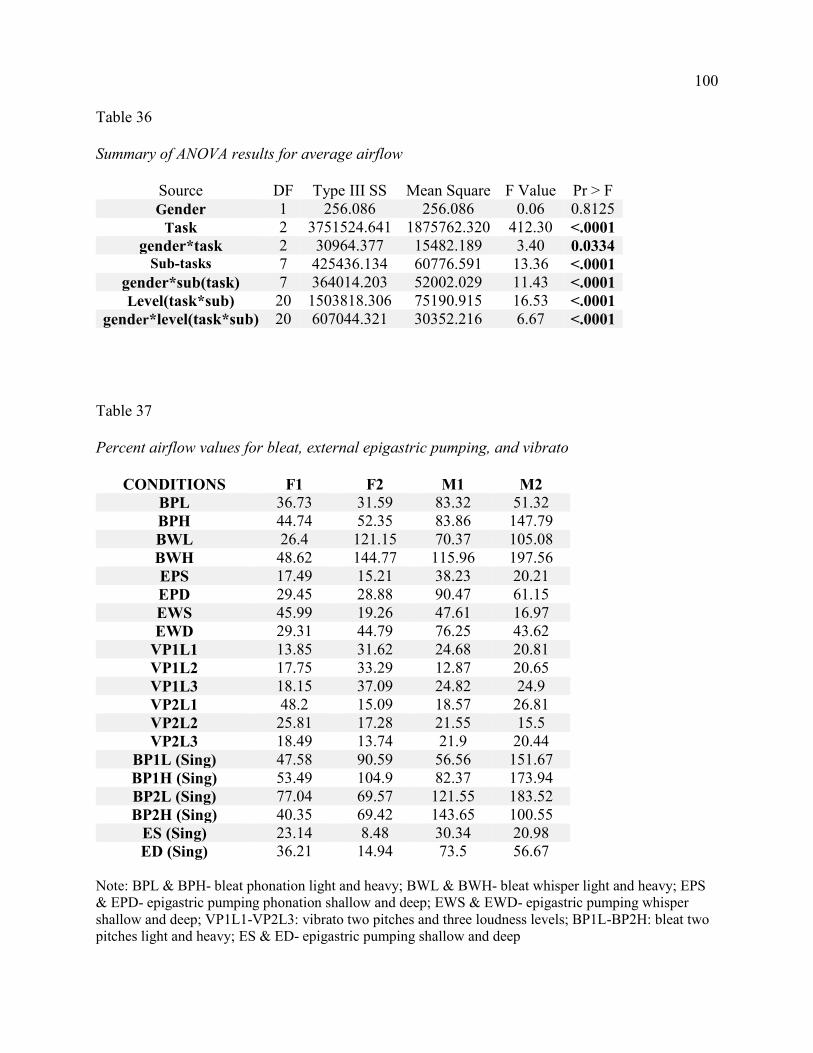
explains 72% of the variation in laryngeal airflow. Table 36 gives the summary results of
ANOVA, and it shows a statistically significant main effect in tasks, F(2, 3078)=412.3, p < 0.01,
partial η2=0.21; sub-tasks, F(7, 3078)=13.36, p < 0.01, partial η2=0.03; and levels of sub-tasks,
F(20, 3078)=16.53, p < 0.01, partial η2=0.1. An interaction effect was significant between gender
and tasks, F(2, 3078)=3.4, p < 0.05, partial η2=0.002; gender and sub-tasks, F(7, 3078)=11.43, p
< 0.01, partial η2=0.025, and gender and level of sub-tasks, F(20, 3078)=6.67, p < 0.01, partial
η2=0.042. The post-hoc pairwise comparisons did not show statistically significant differences in
sub-tasks and levels of sub-tasks. Overall, the average airflow (cm3/s) was seen statistically
significantly higher in females than in males [M=201.57 cm3/s, SD=26.84 cm3/s, p < 0.01].
Statistically significantly higher airflows were seen in speaking whisper tasks in comparison with
speaking phonation and singing [M=379.5 cm3/s, SD=54.06 cm3/s, p < 0.01]. There was no
significant difference in airflows within different levels of sub-tasks, except higher airflows in
normal whisper than in normal phonation (speaking task) [Females: M=560.74 cm3/s, SD=56.6
cm3/s, p < 0.01; Males: M=455.14 cm3/s, SD=55 cm3/s, p < 0.01], in high pitch heavy bleat than
high pitch light [Females: M=231.51 cm3/s, SD=16.8 cm3/s, p < 0.01; Males: M=177.31,
SD=9.47 cm3/s, p < 0.01], and heavy bleat during whisper [Females: M=505.04 cm3/s, SD=77.1
cm3/s, p < 0.01; Males: M=335.23 cm3/s, SD=50 cm3/s, p < 0.05].
Table 37 gives the means and standard deviations for the ratio of the airflow modulation
extent and the corresponding average airflow, in percent [[(airflow modulation extents)/ (average
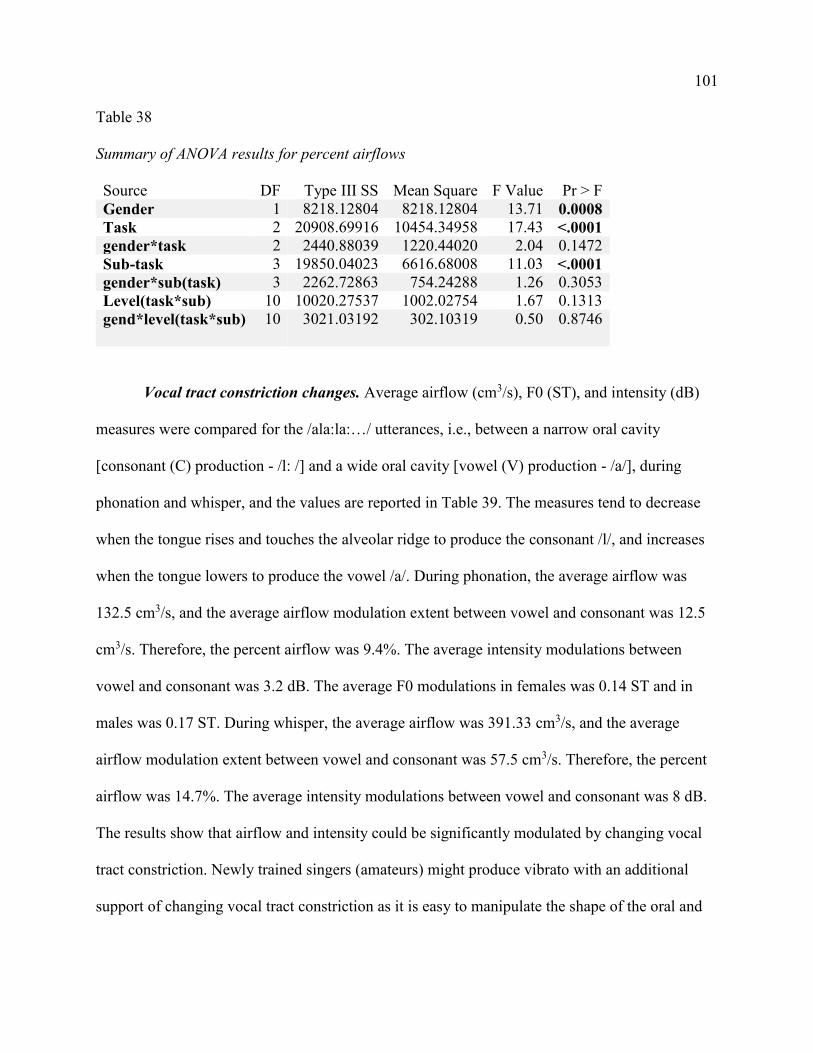
airflow)]*100] during bleat, external epigastric pumping, and vibrato. The ANOVA model
explains 78% of the variation in percent airflow. Table 38 shows the summary of ANOVA
95
results, and it shows a significant main effect in gender, F(1, 32)=13.71, p < 0.01, partial η2=0.3;
task, F(2, 32)=17.43, p < 0.01, partial η2=0.52; and sub-tasks, F(3, 32)=11.03, p < 0.01, partial
η2=0.51. Interaction between factors was not significant, F(10, 32)=0.5, p=0.9, partial η2=0.14.
Males had statistically significantly larger percent airflows than females [M=67.5%, SD=52%,
p=0.02]. Overall, bleating tasks were seen to have statistically significant percent airflows
compared to vibrato and external epigastric pumping [M=91.5%, SD=47%, p < 0.01]. The
percent airflows were statistically significantly higher in external epigastric pumping tasks than
vibrato [M=37.05%, SD=21.7%, p < 0.05; vibrato: M=22.7%, SD=8.3%]. In vibrato, the percent
airflows were in the range of approximately 20.5 – 25%, and there was no significant difference
when compared among two pitches and three loudness levels. In external epigastric pumping
tasks, the percent airflows were approximately in the range of 20.7 – 32.5% during shallow
pumping and 45 – 52.5% during deep pumping conditions. Overall, the percent airflows were
statistically significantly higher in deep pumping than shallow [M=49%, SD=23%, p=0.0052].
There was no significant difference observed between whisper and phonation in percent airflows.
For bleat, the percent airflows were approximately in the range of 50.5 – 113% in lighter bleat,
and 82 – 126% in heavier bleats. Speaking whisper Sp-W) tasks were found to have highest
percent airflows followed by singing (Sg) tasks [Sp-W: M=104%, SD=55%; Sg: M=98%,
SD=45.2%; Speaking phonation: M=67%, SD=38.2%, p > 0.05]. The highest percent airflows
were seen in heavy bleat during whisper followed by lighter bleating at high pitch (P1) in singing
tasks [Sp-W: M=127%, SD=62%; Sg: M=113%, SD=52.4%]. None of the differences were
statistically significantly different due to larger standard deviations.
Higher percent airflows in males support larger airflow modulation extents in
them during bleat, external epigastric pumping, and vibrato. Even though average airflows were
96
seen to be higher in females, they tend to have lower percent airflows in comparison with male
subjects. The average airflows were seen to be highest in whisper, but the percent airflows
during whisper were only higher in bleat, with no significant difference in external epigastric
pumping. This supports a stronger positive correlation between whisper and bleat, and this
combination showed larger airflow and intensity modulation extents, larger average airflows, and
greater percent airflows. Although in external epigastric pumping the percent airflows increased
from shallow to deep pumping, it was not statistically significant. This indicates that airflow
pulses generated due to increase in subglottal pressure are not enough to produce larger
modulation extents. Neither average airflows nor percent airflows were seen to be higher during
vibrato, suggesting that it is not as purely adductory as bleat is, nor requires greater lung
pressures to generate vibrato.
97
Table 32
Means and standard deviations of intensities (dB) speaking and singing tasks
ES (Sing) 79.82 0.33 76.49 1.2 76.84 1.39 68.61 0.11 ED (Sing) 78.95 1.07 76.63 0.84 77.66 1.12 68.69 0.79
Note: NP & NW- normal phonation and whisper; BPL & BPH- bleat phonation light and heavy; BWL & BWH- bleat whisper light and heavy; EPS & EPD- epigastric pumping phonation shallow and deep; EWS & EWD- epigastric pumping whisper shallow and deep; NP1L1-NP2L3: straight tones two pitches and three loudness levels; VP1L1-VP2L3: vibrato two pitches three loudness levels; BP1L-BP2H: bleat two pitches light and heavy; ES & ED- epigastric pumping shallow and deep
98
Table 33
Average oral pressure means (cm of H2O) and standard deviations of speaking and singing tasks at different levels of sub-tasks (excludes external epigastric pumping tasks)
Note: NP & NW- normal phonation and whisper; BPL & BPH- bleat phonation light and heavy; BWL & BWH- bleat whisper light and heavy; NP1L1-NP2L3: straight tones two pitches and three loudness levels; VP1L1-VP2L3: vibrato two pitches three loudness levels; BP1L-BP2H: bleat two pitches light and heavy
Table 34
ANOVA summary table for oral pressures
Source DF Type III SS Mean Square F Value Pr > F Gender 1 77.636558 77.636558 20.44 <.0001
ES (Sing) 138.31 23.87 205.5 45.27 102.85 12.63 107.31 11.2 ED (Sing) 128.9 21.55 178.47 42.17 112.88 12.8 116.7 3.48
Note: NP & NW- normal phonation and whisper; BPL & BPH- bleat phonation light and heavy; BWL & BWH- bleat whisper light and heavy; EPS & EPD- epigastric pumping phonation shallow and deep; EWS & EWD- epigastric pumping whisper shallow and deep; NP1L1-NP2L3: straight tones two pitches and three loudness levels; VP1L1-VP2L3: vibrato two pitches three loudness levels; BP1L-BP2H: bleat two pitches light and heavy; ES & ED- epigastric pumping shallow and deep
100
Table 36
Summary of ANOVA results for average airflow
Source DF Type III SS Mean Square F Value Pr > F Gender 1 256.086 256.086 0.06 0.8125
ES (Sing) 23.14 8.48 30.34 20.98 ED (Sing) 36.21 14.94 73.5 56.67
Note: BPL & BPH- bleat phonation light and heavy; BWL & BWH- bleat whisper light and heavy; EPS & EPD- epigastric pumping phonation shallow and deep; EWS & EWD- epigastric pumping whisper shallow and deep; VP1L1-VP2L3: vibrato two pitches and three loudness levels; BP1L-BP2H: bleat two pitches light and heavy; ES & ED- epigastric pumping shallow and deep
101
Table 38
Summary of ANOVA results for percent airflows
Source DF Type III SS Mean Square F Value Pr > F Gender 1 8218.12804 8218.12804 13.71 0.0008 Task 2 20908.69916 10454.34958 17.43 <.0001 gender*task 2 2440.88039 1220.44020 2.04 0.1472 Sub-task 3 19850.04023 6616.68008 11.03 <.0001 gender*sub(task) 3 2262.72863 754.24288 1.26 0.3053 Level(task*sub) 10 10020.27537 1002.02754 1.67 0.1313 gend*level(task*sub) 10 3021.03192 302.10319 0.50 0.8746
Vocal tract constriction changes. Average airflow (cm3/s), F0 (ST), and intensity (dB)
measures were compared for the /ala:la:…/ utterances, i.e., between a narrow oral cavity
[consonant (C) production - /l: /] and a wide oral cavity [vowel (V) production - /a/], during
phonation and whisper, and the values are reported in Table 39. The measures tend to decrease
when the tongue rises and touches the alveolar ridge to produce the consonant /l/, and increases
when the tongue lowers to produce the vowel /a/. During phonation, the average airflow was
132.5 cm3/s, and the average airflow modulation extent between vowel and consonant was 12.5
cm3/s. Therefore, the percent airflow was 9.4%. The average intensity modulations between
vowel and consonant was 3.2 dB. The average F0 modulations in females was 0.14 ST and in
males was 0.17 ST. During whisper, the average airflow was 391.33 cm3/s, and the average
airflow modulation extent between vowel and consonant was 57.5 cm3/s. Therefore, the percent
airflow was 14.7%. The average intensity modulations between vowel and consonant was 8 dB.
The results show that airflow and intensity could be significantly modulated by changing vocal
tract constriction. Newly trained singers (amateurs) might produce vibrato with an additional
support of changing vocal tract constriction as it is easy to manipulate the shape of the oral and
102
pharyngeal structures. The less or no modulations in F0 during vocal tract changes shows that
they are primarily laryngeal mediated.
Table 39
Airflow (AF), intensity, and F0 values at vowel (V) and consonant (C) production during phonation (P) and whisper (W)
Note: No F0 during whisper; V- Vowel (Wide oral cavity); C- Consonant (Narrow oral cavity)
103
CHAPTER IV. DISCUSSION
Study 1: Airflow Vibrato in Four Professional Singers
The purpose of this study was to expand the information available on airflow vibrato, motivated
by the assumption that a more complete understanding of the production mechanism for vibrato
would lead to a better understanding of laryngeal mechanics and pedagogical applications. This
study is descriptive relative to understanding the phenomenon of airflow vibrato, and does not
attempt to determine the specific causes of airflow vibrato (which is related more to Study 2).
Study 1 provides characteristics of airflow vibrato produced by four professional singers
singing three pitches and three loudness levels. Results indicate that airflow vibrato is a real
phenomenon, with strong correspondence to fundamental frequency (F0) vibrato. Airflow
vibrato waveforms are more complex than F0 vibrato waveforms, however, and the greater
complexity raises important questions about the causation of airflow vibrato.
RQ1. What are the general characteristics of airflow vibrato in Western classical
singing? The general characteristics of F0 vibrato are rate, extent, regularity, and waveform
shape (Sundberg, 1995). Similarly, airflow vibrato can also be characterized by rate, extent,
regularity, and waveform shape (Figures 8 -11). Study 1 measured the first two characteristics of
airflow vibrato and has included observations concerning the latter two. The rates of airflow
vibrato ranged from 4.0 – 6.5 Hz (basically identical to the F0 vibrato rates), and a similar range
was reported in the studies by Large and Iwata (1971) and Rubin et al. (1967). The airflow
vibrato peak-to-peak extents ranged from 16 cm3/s to 112 cm3/s. This appears to be the first
study to measure the airflow modulation extents during vibrato, and therefore there do not appear
to be other studies with which to compare the quantitative results obtained here.
104
The similarities in airflow and F0 vibrato rates indicate their dependence on a similar
subset of physiological variables. Although regularity and waveform shape were not specifically
measured in this study, the airflow vibrato waveforms were seen to have a range from regular,
essentially sinusoidal-looking waveforms to having an inconsistent irregularity to the
waveforms, compared to relatively regular F0 vibrato waveforms. It is quite reasonable to
assume that the complexity in the airflow vibrato waveform should be due to its sensitivity to
subtle changes in laryngeal flow resistance (and thus related to glottal adduction, glottal area, and
subglottal pressure).
The phase difference between airflow and F0 vibrato varied over a wide range in which
airflow leads F0 vibrato predominantly. The phase difference between them ranged from 34o to
197o. Positive phase difference values indicate airflow leading F0 vibrato. Typically prominent
peaks consistently near F0 vibrato peaks were chosen for phase measurements, neglecting the
minor components of the more complex waveforms.
RQ2. Do airflow vibrato extent and F0 vibrato extent vary similarly within pitches
and loudness levels in males and females? Airflow and F0 vibrato extents increased with a rise
in pitch for all four subjects (Figure 16). The airflow vibrato extents more than doubled for three
of the four subjects when the pitch rose from P1 to P2. Interestingly, despite an assumed smaller
larynx, the airflow vibrato extent was larger for the two females than for the baritone (the tenor
had similar values to the two sopranos). For the males, on average airflow vibrato extents
increased from 30 cm3/s to 75 cm3/s from the lower to the higher modal pitch, and for females,
increased from 47 cm3/s to 94 cm3/s (Figure 17). Increase in pitch was associated with a
statistically significant difference within subjects and between males and females. Out of four
subjects, three of them showed a tendency for slightly lower airflow vibrato extents (3 – 27
105
cm3/s) with increase in loudness levels. This indicates that a rise in Ps may not be enough to
increase the airflow vibrato extents. But raise in Ps and F0 are required to increase the airflow
vibrato extents. Although airflow vibrato extents were larger for females, average airflow during
vibrato production was seen to be higher in males (220 cm3/s at P1 and 197.5 cm3/s at P2)
compared to females (154.5 cm3/s at P1 and 132.5 cm3/s at P2).
Contrary to an increase in pitch, when loudness levels were increased from piano to forte,
there was no significant effect observed on the airflow vibrato extents for all the subjects (Figure
15). However, females had higher airflow vibrato extents for the three loudness levels when
compared with the males (at L3: 94 cm3/s for females, and 46 cm3/s) and was statistically
significant at forte. For males; again it is noted that the baritone had lower extent values than the
two sopranos, but the tenor had similar values). The average airflows (cm3/s) during vibrato did
not change with increase in loudness levels. Usually, the glottal airflow increases with rise in Ps.
But no change in average airflows with increase in Ps might suggest increase in glottal flow
resistance.
The airflow vibrato extent value was less than the average airflow produced during the
vibrato cycle. The percentage was defined as (airflow vibrato extent / average airflow)*100 and
was 18% and 47% for males and females, respectively, at P1, and 38% and 56% at P2. When the
two pitches were combined, at the piano loudness level, the percentage of laryngeal airflow
during each vibrato cycle was 32.4% and 47% for males and females, respectively. Increase in
loudness level from piano to mezzoforte did not change the percentage values significantly in
females, 49.4% at L1, 48% at L2, and 59% at L3. In males, baritone did not show significant
change in percentage airflows with increase in loudness, 15% at L1, 12% at L2, and 11.2% at L3.
Whereas, in tenor, the percentage airflow was doubled from piano to mezzoforte, and came
106
dropped down at forte (L1- 37.3%, L2- 65.13%, and L3- 31%). The average airflows were higher
in males, and this could be due to larger laryngeal sizes. But larger percent airflows in females
might be due to more frequent cycles (higher pitches).
The F0 vibrato extents were statistically significantly higher in P2 than in P1 for all thr
subjects (Figure 19). For males, the F0 vibrato extent did not change significantly with increase
in pitch, and was in the similar range from 1.52 – 1.67 ST. For females, the F0 vibrato extents
significantly increased from 1.9 to 2.6 ST from low pitch to high pitch. Similar ranges (0.5 –
2.00 ST) were reported by Horii (1989), Prame (1997), Shipp et al. (1980), and Sundberg (1995).
But lower extents of 0.25 – 0.5 ST were reported by Seashore (1932 and 1947). The higher F0
vibrato extents in females along with larger airflow vibrato extents and percent airflows, not only
suggest greater relative CT activity change but also might suggest higher subglottal pressure, less
laryngeal flow resistance, or more posterior glottal area variation. The increase in loudness levels
did not significantly affect the F0 vibrato extents in both males and females (Figure 18).
Interestingly, there was no specific trend due to increase or decrease in loudness level, and the
effect was differently seen in each subject; e.g., the baritone showed an increase in F0 vibrato
extent from loudness level L1 to L3, soprano-2 showed decreased F0 vibrato extent due to an
increase in loudness, and the tenor and soprano-1 showed a slight increase in L2 and a slight
decrease in L3 (Figure 18). Thus, increase in loudness levels showed different effects on F0
vibrato extents on subjects. This might indicate F0 vibrato extents do not primarily depend on
subglottal pressure (in females, 11.26 cm of H2O at L1, 15.43 cm of H2O at L2, and 19 cm of
H2O at L3; in males, 12.35 cm of H2O at L1, 15.69 cm of H2O at L2, and 21 cm of H2O at L3)
but more on a combination with laryngeal level activity.
107
In the Dromey et al. (1992) study, the difference between the EGG Speed Quotient values
was greatest for their softest productions but was not affected by change in pitch, whereas in the
current study the difference for the comparable measure, NRQ, did not appear to be significant
across either loudness levels, but had relatively greater negative values for the lowest pitch
compared to the two higher pitches (Figure 25) (across subjects). The values did not differentiate
the peaks and valleys of the vibrato cycles (Figure 25). Thus, this aspect of vocal fold dynamics,
along with the non-differentiating EGGW values at the peaks and valleys (Figure 24), do not
appear to be discerning features, suggesting that there may be little difference in membranous
glottal adduction and changing vocal fold contact behavior throughout the vibrato cycles for
these singers. Essentially “through elimination”, the changing airflows during airflow vibrato
may thus suggest posterior glottal area variation during vibrato. Sundberg (1995a) shows a singer
whose airflow during singing varies by about 100 cm3/s, attributed to “ad/abduction undulation
in the glottis” (p. 49). This example also suggests that the adduction mechanism may include
posterior glottis area variation. Thus, the posterior glottal area variation to create the relatively
large airflow vibrato is a hypothesis that needs to be tested.
RQ3. Is there a relationship between airflow vibrato rate and F0 vibrato rate? The
airflow and F0 vibrato rates were seen to have a similar range of 4.5 – 6.0 Hz. The rates were not
affected by change in pitch and loudness levels. They tended to maintain similar vibrato rates
across all nine conditions. A similar range (4.9 – 6.5 Hz) of F0 vibrato rates were reported by
DeJonckere (1995), Rubin et al. (1967), Seashore (1932 and 1947), Shipp et al. (1980), Sundberg
(1995), , and Titze et al. (2002). These studies also support the current study’s F0 vibrato rates
which were not affected by change in pitch and loudness levels.
108
The airflow vibrato rates essentially coincided with F0 vibrato rates. The relation
between F0 vibrato rates and airflow vibrato rates was seen to be moderate to strong (R2=0.75).
It is expected that the relationship found here is weaker than it actually was, due to the necessity
of measuring only 3 to 4 vibrato cycles for each token. This small number often did not allow
high accuracy of the “actual” rate that 8 to 10 vibrato cycles would have given. The question
arises, Could there be a mechanism that would produce an airflow vibrato rate different from an
F0 vibrato rate? It seems quite unlikely that there is such a mechanism.
Other observations for Study 1. Causative factors are most likely quite different
between airflow vibrato and F0 vibrato. F0 vibrato should be dependent on vocal fold effective
stiffness, length, and mass changes throughout the vibrato cycle, whereas airflow vibrato should
be most sensitive to variations in the laryngeal airflow resistance (more flow with less resistance
due to greater glottal area) and subglottal pressure (more flow with greater subglottal pressure).
Both F0 vibrato and airflow vibrato may be dependent on vocal fold length change, however,
suggesting that a subtle length change should raise the F0 value as well as increase glottal area,
raising the airflow value, and thus, F0 vibrato and airflow vibrato should be in phase with each
other. The results of this study and the numerous figures of this report strongly indicate that
indeed airflow vibrato is synchronized with F0 vibrato, with airflow vibrato typically leading F0
vibrato. However, this study does not appear to suggest the specific causation of the timing
difference between the airflow vibrato and F0 vibrato.
In addition, when one examines the extent of airflow change within an airflow vibrato
cycle, it would appear that simple and subtle vocal fold lengthening should not result in airflow
vibrato extents that range from 60 cm3/s to over 100 cm3/s. This size of airflow extent suggests
change in glottal adduction and/or change in subglottal pressure to account for much of the
109
airflow vibrato extent. The EGGW measure was used as a possible indicator of glottal adduction,
but its values were not statistically different between the peaks and valleys of the airflow vibrato
waveform. That would tend to discount gross glottal adduction, and leave subglottal pressure
variation as a primary cause. However, airflow vibrato extent did not vary systematically with
increases in loudness, which should be governed by relatively large increases in subglottal
pressure, and thus airflow vibrato may not be highly dependent on subglottal pressure. That is, if
airflow vibrato extent increased with loudness, subglottal pressure would be suspected to play a
role in altering the extent, but since extent was not increased overall, subglottal pressure may not
be a primary underlying factor even within the vibratory cycle.
Thus, there is therefore a return to the possibility of variation in the posterior glottal area
as a direct source of airflow vibrato. The posterior glottal area was not viewed nor measured in
this study. There is a logical reason to suspect the posterior glottis relative to the quality of the
voice produced by the professional Western classical singer. That is, if a singer wishes to
preserve the sound quality produced by the larynx, it is rather doubtful that the singer would
choose to alter the anterior glottal adduction a great deal, unless the person is intentionally
producing an ornament such as trillo in which glottal adduction appears to be the dominant factor
(Hakes et al., 1988; 1987) (typically a singing student attempts to get rid of this “bleat” vibrato
behavior as he or she is developing a “smooth” vibrato). Thus, it is hypothesized that the
posterior glottal area varies in such a manner that it creates airflow vibrato. Because airflow
vibrato and F0 vibrato are often synchronized with each other, it is further hypothesized that as
the cricothyroid (CT) and vocalis (VOC) muscle contraction levels alter to govern vocal fold
tissue tension to change the fundamental frequency, the interarytenoid muscles are also changing
in a synchronized manner with the CT and VOC. The phase delays between airflow vibrato and
110
F0 vibrato constitute another area of needed explanation, but may relate to the phasing between
the vocal fold lengthening mechanism (CT and VOC) and the posterior adductory system (the
interarytenoid muscles, or the more complicated antagonistic actions of the adductory system in
general).
Some other interesting findings also need valid explanations. (1) What explains the
complexities of the airflow vibrato cycle? That is, how can an airflow vibrato cycle (a) have
double or triple peaks, (b) greatly changing flow patterns across just a few contiguous cycles, or
(c)even have flat portions when the F0 vibrato continues with its regular nearly-sinusoidal
changes? (2) The airflow vibrato extent tended to be greater for the female singers than the male
singers, by about 25 cm3/s. Is this due to more cycles per second and a relatively larger posterior
glottal opening for the females? (3) Airflow vibrato extent was greater for the middle pitch (P2)
than for the lowest pitch (P1) across the singers and loudness levels. Do longer vocal folds
(greater glottal area on average) and higher subglottal pressures for the higher pitch generate the
difference in the airflow vibrato extent?
The second study of this dissertation addresses the question of “What are possible causes
of airflow vibrato?” This is a logical outgrowth of Study 1 that explored the descriptions of
airflow vibrato but did not explain its causation. Study 2 will not complete the task of finding
causative factors, but should shed some light on the subject.
Study 2: Sources of Airflow Vibrato
The purpose of Study 2 was to investigate different possible sources that may cause
modulations in airflow resembling vibrato. The literature review suggested two main sources that
lead to airflow modulations (and also modulations in F0 and intensity) resembling vibrato. The
first source was bleat, which is primarily produced by rapid repeated adductory-abductory action
111
of the glottis, leading to laryngeally-mediated F0, airflow, and intensity modulations. The second
source was subglottal pressure variation, typically achieved in reported research through pushing
on the chest wall. Study 2 used both bleating and chest wall pumping to support an adductory-
source and a pulmonary source (Ps change), respectively, to induce airflow variations. Relative
to chest wall pumping, this study used external epigastric pumping to move the diaphragm and
change the lung pressure accordingly (Vennard, 1967). This lead to changes in F0, intensity, and
airflow, due to subglottal pressure variation.
Another source that was hypothesized to cause changes in airflow was vocal tract
constriction changes (typically relegated to timbre vibrato due to vocal tract shaping variation as
seen with tongue, jaw, and other structures oscillating at the vibrato frequency). The airflow
would change significantly above the glottis only if the constriction were narrow or closed. In
Study 2, /al:al:a.../ productions were used, where the tongue touches the alveolar ridge and hard
palate during the consonant /l/ production, and therefore the amount of air going through the oral
cavity would be less in comparison to airflow during vowel /a/. The findings suggested that
there was no effect on the airflow vibrato due to the relatively small additional airflow resistance
when the tongue was placed high for the /l/.
In Study 2 the speaking tasks of bleat (adductory change maneuver), external epigastric
pumping (Ps change maneuver), and vocal tract constriction changes included not only
phonation but also whisper. Whisper was studied as it is characterized by no vocal fold vibration
but with an open posterior glottis, and thus the airflow modulations due to imposed bleat and
external epigastric pumping would be purely flow through the posterior glottis (and perhaps a
portion of the non-moving anterior glottis; Sundberg et al., 2010). Thus, the use of whisper may
help help to test the hypothesis made at the end of Study 1 that the posterior glottis variation, or
112
merely the presence of the posterior glottis may account for much of the airflow vibrato
variations. That is, if airflow varied due to either bleating or epigastric pumping, then this may
be a reasonable cause of airflow vibrato.
Study 2 provides the airflow results for the production of normal vibrato, bleat (adductory
gesture), and external epigastric pumping (Ps gesture) produced by four non-professional highly
trained amateur singers.
RQ4. Does airflow vibrato rate differ from airflow bleat rate and external epigastric
pumping rate in male and female singers? Study 2 found that the airflow vibrato rates were
statistically significantly slower than the airflow bleat rates. The range of airflow vibrato rates
was 5.07 – 6.17 Hz, and was similar to Study 1 (4.5 – 6.0 Hz). The airflow bleat rates ranged
from 9.03 – 12.05 Hz for the singing tasks and 8.19 – 11.94 Hz for the speaking tasks. Airflow
modulation rates of bleat and vibrato were not affected by changes in pitch and loudness level.
During conditions of whisper + heavier bleat, the rates were slightly slower than the bleating
rates with phonation, and this was only due to difficulty in bleating heavily with whisper.
Titze et al. (2008) found that PCA and LCA/TA are primarily involved in giggle, a
phenomenon similar to trillo and bleat. The repeated voice onsets and offsets were generated by
alternate raising and lowering the activity of the PCA and LCA/TA muscles. Figure 1 in Titze et
al.’s study showed that the activation of PCA is in line with relaxation of TA, and vice-versa.
This showing that they are out of phase. They mentioned that the faster rates of giggle were
matched closely with twitch activation times of these intrinsic laryngeal muscles.
The findings for bleat in this study, where the bleat frequency can be approximately
double that of normal vibrato, suggest that the bleat-like activity attributed to adductory-
abductory movement may account for variations in the airflow vibrato seen in Study 1 where
113
there are double pulses seen within the airflow vibrato cycle. See for example Figures 10, 11,
and 13, where there are two pulses within the airflow vibrato cycle. In these kinds of cases, the
primary variation of airflow that defines airflow vibrato appears to be supplemented with a
secondary source, and the adductory-oriented bleat-like phenomenon may be the cause, even
though it is not heard as a bleat-produced sound.
The external epigastric pumping was used with the assumption that it essentially directly
causes changes in subglottal pressure which further causes changes in F0, intensity, and airflow.
The airflow modulation rates during external epigastric pumping were created by the rates
provided by the experimenter as she pushed on the subject’s epigastric region, and ranged from
5.49 – 7.37 Hz. Thus, the rate per se does not differentiate subglottal pressure as a source of the
variations of airflow vibrato during a vibrato cycle.
RQ5. Does F0 vibrato rate differ from F0 bleat rate and F0 external epigastric
(upper abdominal) pumping rate in males and females? Like the airflow vibrato rates, the F0
vibrato rates were statistically significantly slower than the F0 bleat rates. The range of F0
vibrato rates was 5.05 – 6.13 Hz, similar to Study 1 (4.5 – 6.0 Hz). The F0 bleat rates ranged
from 9.0 – 12.35 Hz for both speaking and singing tasks, and were similar to airflow bleat rates.
The F0 vibrato and bleat rates were not affected by change in pitch and loudness level. The faster
rates of F0 and airflow in bleat were most likely due to involvement of the adductory-abductory
mechanism of intrinsic laryngeal muscles primarily. The F0 and airflow vibrato rates were
similar in range and their correlation was moderate to strong (R2=0.67) which was lower than
observed in Study 1 (R2=0.75). This may indicate that professional singers have a better
correlation between airflow and F0 during vibrato than in non-professional singers, but it is again
mentioned that a limitation of rate measures is the small number of cycles used to obtain the
114
measure, and for a more irregular signal such as the airflow vibrato, it is more difficult to make a
valid measure. The correlation between airflow and F0 rate during bleat and external epigastric
pumping showed strongest correlations (R2=0.86 for bleat and R2=0.87 for external epigastric
pumping). This indicates that the strongest correlation exists between F0 and airflow vibrato
rates if the source of production is either primarily Ps or glottal adduction.
RQ6. Does airflow vibrato extent differ from airflow bleat extent and airflow
external epigastric (upper abdominal) pumping extent in males and females? Airflow
vibrato extents were statistically significantly lower than airflow bleat extents during phonation
and whisper, and airflow external epigastric pumping extents during whisper. The airflow
external epigastric pumping extents during phonation were observed to be similar or slightly
higher than airflow vibrato extents. Because of the similarities between the external epigastric
pumping extents and airflow vibrato extents, the resulting suggestion would be that lung pressure
variations may be sufficient to produce the airflow vibrato extents seen in both Study 1 and
Study 2, supporting the lung pressure hypothesis for vibrato production.
Both males and females had similar airflow vibrato extents in Study 2, whereas females
showed statistically significantly higher airflow vibrato extents than males in Study 1. In Study
2, the airflow vibrato extents were not significantly affected by change in pitch and loudness
levels, whereas in Study 1, although increase in loudness level did not affect the airflow vibrato
extent, the higher pitch had statistically significantly larger airflow vibrato extents compared
with low pitch in both males and females. The average airflow vibrato extents at higher pitch
were seen to be statistically significantly larger in professional singers (Study 1; for P2, females-
94 cm3/s, males- 75 cm3/s) compared with non-professional singers (Study 2; for P2, females- 29
115
cm3/s, males- 33 cm3/s). Thus, the level of training may affect the airflow vibrato extent, where
more training and experience may move the extent to greater values on higher pitches.
The largest airflow modulation extents were seen for whisper and bleat (about 380
cm3/s). Regarding bleat, these extents were undoubtedly created by greater adductory-abductory
changes (predominantly PCA and LCA/TA). Thus, very large alterations in airflow vibrato
extent may be caused by, again, posteriorly-located changes in glottal area.
During external epigastric pumping also, whisper tasks were seen to have larger airflow
modulation extents, and this again indicates the participation of lung pressure to cause greater
fluctuations in airflow during vibrato or simulated vibrato. Also, during external epigastric
pumping the deeper pumping had larger airflow modulation extents compared with shallow
pumping, suggesting that greater subglottal pressures will cause greater airflow vibrato extents. It
would suggest, then, that the professional singers may have been using higher lung pressures and
greater posterior glottal activity during vibrato production compared with the non-professional
singers. The airflow vibrato extents were smaller in the latter, but similar to fluctuations created
by shallow pumping, indicating again that the potential source for the shallower extents also
could be lung pressure variations.
RQ7. Does F0 vibrato extent differ from F0 bleat extent and F0 external epigastric
(upper abdominal) pumping extent in males and females? The F0 modulation extents for
bleat, external epigastric pumping, and vibrato showed similar ranges from 0.5 – 2.6 ST, and
there was no statistical significant differences observed among these three sub-tasks. In study 2,
males had higher F0 modulation extents than females and were statistically significant in bleat,
EEP, and low pitch vibrato tasks. The F0 vibrato extents were not affected by increase in
loudness levels, but were statistically significantly higher at low pitch than high pitch in males.
116
In Study 1, the F0 vibrato extents were seen to be statistically significantly higher in females,
especially for the high pitch (about 2.24 ST). This indicates that a relatively greater increase in
CT muscle activity may have been used by the professional soprano singers to increase their F0
vibrato extents. In Study 2, slightly higher F0 vibrato extents were observed in non-professional
sopranos compared to the males but not statistically significantly so. In Study 2, the non-
professional male singers had statistically significantly higher F0 vibrato extents at lower pitch
compared with higher pitch (about 2.38 ST), whereas in Study 1, the professional male singers
showed higher F0 vibrato extents at high pitch compared with low pitch (about 1.7 ST from 1.51
ST), but was not statistically significant.
During external epigastric pumping, F0 modulation extents were seen to be higher with
deeper pumping than in shallow, and was statistically significant in males (up to 2.8 ST). This
indicates the dependence of F0 modulation extents on subglottal pressure, increasing with greater
subglottal pressure, especially for males. At the same time, increases in intensity during vibrato
were not significantly associated with the F0 vibrato extents. Therefore, because of intensity’s
dependence on subglottal pressure, increasing Ps apparently is not enough to explain F0 vibrato
extents.
During speaking tasks with bleating (prolonging a vowel with bleating), the heavier bleat
had higher F0 modulation extents than lighter bleat conditions. This indicates greater glottal
adduction also increases the F0 modulations. During singing tasks of bleating (with straight
tone)prolonging a sung vowel with bleating), the F0 bleat extents increased from lighter to
heavier bleat at low pitch, and decreased at high pitch. The variables which might increase the F0
modulation extents would therefore appear to be an increase in subglottal pressure, greater glottal
adduction variation, and CT activity (more stretching and contraction).
117
RQ8. Do intensity extent, subglottal pressure, average airflow, and percent airflow
of vibrato differ from bleat and external epigastric pumping in males and females? Oral
pressures (equivalent to subglottal pressures) were measured for all levels of sub-tasks for bleat
and vibrato. Overall, the highest oral pressures were seen in the heavier bleat productions at high
pitch conditions and vibrato at high pitch forte (about 16 cm of H2O) followed by straight tone at
high pitch forte (about 14 cm of H2O). In straight tones and vibrato, oral pressures increased with
increase in loudness level and pitch. But the range of oral pressures was higher in Study 1 (5 – 24
cm of H2O) than in Study 2 (4 – 17.5 cm of H2O). In Study 1, males tended to have larger
subglottal pressures than the females, whereas in Study 2, although they were in a similar range,
females tended to have slightly higher pressures than the males, especially at low pitch. During
speaking tasks using bleat, phonation tasks tended to have greater subglottal pressures than in
whisper. Within phonation and whisper tasks, heavier bleats had statistically significantly higher
pressures than lighter ones. During singing tasks of bleating, high pitch (P2) heavier bleat had
statistically significantly higher oral pressures than lighter bleats at P1 and P2, and heavier bleat
at P1. Thus, from a functional point of view, the subjects of the two studies appear to use higher
subglottal pressures in general for greater loudness, higher pitch, and heavier bleat, suggesting
the typical findings for increased subglottal pressure and/or increased respiratory effort. In
addition, the professional singers tended to use more subglottal pressure in singing than the
amateur singers.
Average airflows (cm3/s) were seen to be similar in both males (144 cm3/s) and females
(138 cm3/s) while producing vibrato. Similarly, in Study 2 (Table 35), males (155 cm3/s) and
females (145 cm3/s) showed similar average airflow values (cm3/s). During vibrato, there was no
significant change in average airflows due to change in pitch and loudness level. In Study 1, in
118
general, average airflows did not increase significantly as the loudness and pitch increased
(Table 4).
Percent airflows in Study 2 were highest in males due to larger airflow modulation
extents and a similar range of average airflows compared with females. Therefore, for the
amateur singers, there may be a difference in how the males varied their airflow vibrato
compared to the females. In Study 1, females tended to have larger airflow vibrato extents and a
similar range of average airflows compared with males, and so higher percent airflows were seen
in the female subjects. Differences in the results could be due to differences in duration of
vocal/singing training experiences in the subjects of Study 1 and Study 2. In general, males may
tend to have higher average airflows due to larger larynges (Holmberg et al., 1989; 1988).
Because professional Western classical singers can produce good quality vibrato, the
characteristics of their vibrato might be considered relatively standard. They have larger airflow
vibrato extents compared to non-professionals singers (Study 2). They also showed higher lung
pressures than the latter. As discussed above, the larger extents in professional singers could be
due to larger subglottal pressure variations, more glottal adduction variation, and potential
participation of the posterior glottis (a combination of external epigastric pumping and bleat),
whereas in non-professional singers, the airflow vibrato extents might be primarily respiratory
(as seen in airflow external epigastric pumping extents).
Intensity vibrato extents were found to be in the range of 0.66 – 3.05 dB. They were not
affected by changes in pitch and loudness level. During speaking phonation and singing bleat
tasks, typically the intensity modulation extents decreased from lighter to heavier conditions.
This suggests that an increase in glottal adduction decreased the intensity modulation extents.
Although relative intensities within each subject were lower in whisper, intensity extents were
119
found to be highest during whisper bleat and whisper external epigastric pumping. The heavier
bleat with whisper produced the highest intensity extents, ranging from 6.7 – 13.0 dB. The
combination of whisper and bleat produced the largest airflow vibrato extents, as well.
Physiologically, rapid contraction and relaxation of the CT muscles along with posterior
glottal area involvement are hypothesized to produce large airflow and intensity modulation
extents. During external epigastric pumping, the intensity modulation extents were found to be
higher in whisper than in phonation. Also, deeper pumping generated higher intensity
modulation extents compared to shallow, especially in males. This again indicates greater lung
pressures, higher airflows, and airflow modulation extents produce higher intensity modulation
extents.
These results support the laryngeal level and respiratory level intensity modulations
produced during vibrato and / or simulated vibrato (Large et al., 1971; 1970; Smith, 1970;
Zemlin, 1968; Shipp et al., 1980; Rothenberg et al., 1988; Dromey et al., 2009; 1992). The
intensity modulation extents during vibrato in Study 1 ranged from 0.9 – 3.8 dB and was in a
similar range seen in Study 2. Yet the quality of the vibrato produced by the professional singers
might be considered to be better than the non-professional singers. This would indicate the
potential importance of F0 and airflow modulations along with greater lung pressures during
vibrato which were found to be highest in the former (trained, experienced) group. All these
findings give strong indications to posterior glottis activity along with CT muscle action,
subglottal pressure, and laryngeal flow resistance.
Other observations in terms of regularity, waveform shape, and phase. The phase
differences among F0, airflow, and intensity modulation cycles were found to be less or almost
in-phase during external epigastric pumping. Therefore, when there exists a nearly in-phase
120
relationship among F0, intensity, and airflow undulations during vibrato singing, the
phenomenon suggests subglottal pressure as a primary source of vibrato generation.
During vibrato, in Study 1 and 2, a wide range of phase differences were produced
between airflow and F0, where airflow leads F0 predominantly. Similarly, during bleat, the
phase differences varied broadly especially during whisper, and predominantly airflow lead F0
and intensity. There were a few conditions where airflow and F0 modulations were in anti-phase.
One of the distinguishing features of bleat from vibrato is in terms of the consistency of
the waveforms. Bleat is highly variable in the airflow, F0, and intensity of its waveforms, as well
as in the phase relation among those variables (Figure 26-29). However, most often the F0
modulations during bleat were more inconsistent and irregular in waveshape, whereas the airflow
bleat was more consistent and regular.
Vocal tract constriction changes. Vocal tract constriction changes were studied in order
to see the changes in F0, airflow, and intensity during articulatory narrowing (consonant /l:/) and
widening (vowel /a/) of the oral cavity. During the /al:al:a.../ productions, the difference in
intensity between vowel and consonant was about 4.0 dB during phonation, and 8 dB during
whisper, considerably large changes. This indicates that intensity modulation extents can be
highly affected by vocal tract changes. The airflow changes between the phonated production of
the vowel and consonant was only about 13 cm3/s, whereas during whisper, it was about 60
cm3/s. This indicates that airflow during singing (phonation) might not be affected significantly
due to vocal tract constriction changes unless the constriction is extremely narrow (or, of course,
full occlusion of the vocal tract). The differences in F0 between the /a/ vowel and the /l:/
consonant production was negligible, thus suggesting that F0 vibrato is a phenomenon that is
primarily laryngeally-mediated rather than vocal tract related for non-fully-occluded sounds. The
121
non-professional amateur singers in Study 2 had shorter airflow and F0 vibrato extents than the
professionals in Study 1, but had similar intensity vibrato extents compared to the professional
singers of Study 1. This might indicate a slight assistance of the vocal tract (oral structures
especially) to produce amplitude modulations in intensity in the non-professional group.
Oscillations of the vocal tract synchronous to vibrato were observed by Hirano (1988). Hirano
hypothesized that if the oscillatory movements of the vocal tract are moderate, that could be
helpful to avoid tightness or rigidity of the vocal tract adjustment. Hirano observed negligible F0
and significant amplitude modulations due to vocal tract oscillations. The oral cavity variation
studied here was to attempt to identify changes due to that variation, but the study here did not
assume that during the experiment that the subjects of either study moved articulators to any
identifiable extent, and thus the results for this portion of the overall study do not pertain to
seeking sources of airflow vibrato characteristics.
Possible sources of airflow and F0 modulation extents. Figure 38 shows the possible
sources of generation that were hypothesized based on results obtained from Study 1 and Study
2. Three possible sources were hypothesized. The first one was primarily CT muscle action
which could alone cause F0 vibrato extents. Changes in CT muscle action may lead to small
changes in glottal area and glottal flow resistance. Therefore, small changes in airflow vibrato
extents would also be expected due to CT contraction variation alone. The portion with the blue
dashed line in Figure 38 shows the modulation extents if CT is a primary source. The second
source hypothesized was subglottal pressure, Ps. A triangle with green dashed lines is drawn
based on results obtained from external epigastric pumping, as the primary source of modulation
is change in subglottal pressure. In Study 2, the range of F0 and airflow vibrato extents obtained
were 0.5 – 3.0 ST and 20 – 150 cm3/s, respectively. The third potential source hypothesized was
122
glottal adduction. A rectangle with red dashed line is drawn based on results obtained from
bleating, as the primary source of modulation is change in glottal adduction. In Study 2, the
range of F0 and airflow vibrato extents obtained were 0 – 1.5 ST and 50 – 150 cm3/s,
respectively.
Figure 38 graphs the airflow vibrato extents versus the F0 vibrato extents for the eight
subjects of this study. The figure shows that the sopranos S1 and S2 from Study 1 might be using
primarily Ps as the source of production of vibrato modulation extents, rather than using glottal
adduction or even CT contraction. They showed the highest airflow and F0 vibrato extents. The
tenor T of Study 1 is seen in the figure to be using glottal adduction as his primary source of
vibrato modulation extents (hypothetically). He showed higher airflow vibrato extents but
smaller F0 vibrato extents. The remaining singers, the baritone (B) from Study 1 and all four
singers from Study 2, were essentially in the overlap region of CT and Ps. These five singers
showed higher F0 vibrato extents but smaller airflow vibrato extents.
Figure 39 shows the coefficient of variation of F0 vibrato extent and the coefficient of
variation of airflow vibrato extent for all eight singers in Study 1 and 2. The coefficient of
variation (COV) is the standard deviation divided by the mean. The lower the COV value is, the
more regular and consistent are the vibrato cycles relative to the mean. The two sopranos S1 and
S2 from Study 1 showed relatively low COV values for both F0 and airflow vibrato extents. This
might suggest that if the singers produced F0 and airflow vibrato extents by primarily using Ps as
the source, the resulting hypothesis would be that the Ps source provides relatively regular
variations in both F0 and airflow vibrato. The tenor T from Study 1 showed the highest COV for
F0 vibrato extent and an average COV (about 0.3) for airflow vibrato extents. This might suggest
that if glottal adduction were used primarily for the production of F0 and airflow modulations
123
during vibrato, the resulting hypothesis would be that the adduction source provides relatively
large F0 variations, or F0 instability, due to irregular adduction motions, compared to the mean.
The remaining singers, the baritone from Study 1 and all four singers in Study 2, have COV
values for F0 vibrato in the middle of the scale and slightly high COV values for airflow vibrato.
The resulting hypothesis would be that the CT source provides relatively normal F0 vibrato
variation but somewhat irregular airflow vibrato, compared to the mean. These results and
conjectures suggest that regular and consistent airflow vibrato cycles may need predominantly Ps
control, but that control is not consistent among both professional and amateur singers.
Figure 38. Possible sources of airflow and F0 vibrato extents under three categories: primarily CT (based on assumption; portion with dashed blue triangle), primarily Ps (based on results obtained from external epigastric pumping data; portion with dashed green triangle), and primarily glottal adduction (based on results obtained from data on bleating; portion with dashed red rectangle). The filled circles represent the data from Study 1, and the filled triangles the data from Study 2. S1 and S2, sopranos; B, baritone; T, tenor; M1 and M2, male subjects; F1 and F2, female subjects.
124
Figure 39. Coefficient of variation (COV) of airflow and F0 vibrato extents for all the eight singers in Study 1 and 2. COV is standard deviation of vibrato extent divided by mean of vibrato extent. The filled circles represent the data from Study 1, and the filled triangles the data from Study 2. S1 and S2, sopranos; B, baritone; T, tenor; M1 and M2, male subjects; F1 and F2, female subjects.
Spectral measures. A string of vibrato cycles in this study ranged from quite sinusoidal
looking to quite complex in waveshape, with multiple magnitude variations within a vibrato
cycle, more so for airflow vibrato than for F0 vibrato. The question arises, how should the
complexity be measured or described? One approach is spectral. The section offers examples of
what this would look like for the waveforms of this study, but is not exhaustive. Figures 40-43
show (on the left) spectra of airflow vibrato for three cases. If a spectrum has only one
component, it means that the signal is sinusoidal. If the spectrum has multiple components, then
the signal is not sinusoidal. Figures 40 and 41 show the spectra for the airflow vibrato for
125
soprano-1 singing at high pitch piano and mezzoforte conditions, respectively. The harmonics
are indicated by red vertical lines. The airflow vibrato in each figure is fairly regular and
consistent, but not entirely sinusoidal. Figure 40 shows inharmonic components, but more
importantly that the intensity level difference between the first and second harmonic was about
29.8 dB, suggesting that the highly dominant harmonic was the first, suggesting a nearly-
sinusoidal pattern for the airflow vibrato, as can be seen in the figure to the right in Figure 40.
Figure 41shows that the airflow vibrato was highly harmonic, but importantly the intensity level
difference between first and second harmonic was 17.3 dB, suggesting that the second harmonic
was significantly greater for that utterance than for the one shown in Figure 40. This is
confirmed by seeing a little more non-sinusoidal waveform shape in Figure 41.
Figure 42 and 43 show the spectra of baritone singing at low pitch piano and mezzoforte
conditions. The airflow vibrato is irregular and inconsistent, indicating more complicated airflow
vibrato waveshapes. Figure 42 shows stronger second and third harmonics than shown in Figures
40 and 41. Therefore, the intensity level difference between first and second harmonic, and first
and third harmonic was only 7.5 dB and 10.7 dB, which is much less in comparison with the
more regular airflow vibrato waveforms of Figures 40 and 41. Figure 43 shows the intensity
level difference between the first and second harmonic, and first and third harmonic of 14.5 dB
and 9.8 dB, respectively. Higher intensities for H2 and H3 indicate the frequencies of multiple
components for the airflow vibrato. Every F0 vibrato cycle corresponds with 2-3 airflow vibrato
cycles. Therefore, the intensity level differences were less, and the intensity of H3 is higher than
H2 in Figure 43.
Thus, intensity level differences between H1 and H2, and H1 and H3 were significantly
different between the regular and irregular airflow vibratos. The intensities of H2 and H3 would
126
be higher in irregular airflow vibratos when compared with regular airflow vibratos. Thus, the
spectral measure suggested to describe the complexity of the airflow vibrato waveforms is taking
the difference between the acoustic levels of the harmonics, especially between the level of H1
and the levels of the subsequent harmonics. In addition, a measure of the non-harmonic
components should be considered.
In addition to these spectral considerations, a harmonic-to-noise measure of the airflow
waveforms, and a cepstral analysis, would be appropriate.
Figure 40. Airflow vibrato of soprano1 singing at high pitch piano condition. The left panel shows the spectrum of the airflow vibrato given on right side. The harmonics were indicated by red vertical lines. The intensity level difference between harmonic1 and harmonic2 was 29.8 dB. The rate of airflow vibrato is 5.09 Hz.
127
Figure 41. Airflow vibrato of soprano1 singing at high pitch mezzoforte condition. The left panel shows the spectrum of the airflow vibrato given on right side. The harmonics were indicated by red vertical lines. The intensity level difference between harmonic1 and harmonic2 was 17.3 dB. The rate of airflow vibrato is 5.19 Hz.
128
Figure 42. Airflow vibrato of baritone singing at low pitch mezzoforte condition. The left panel shows the spectrum of the airflow vibrato given on right side. The harmonics were indicated by red vertical lines. The intensity level difference between harmonic1 and harmonic2 was 7.5 dB, and 10.7 dB for harmonic1 and harmonic3. The rate of airflow vibrato was 4.6 Hz.
129
Figure 43. Airflow vibrato of baritone singing at low pitch piano condition. The left panel shows the spectrum of the airflow vibrato given on right side. The harmonics were indicated by red vertical lines. The intensity level difference between harmonic1 and harmonic2 was 14.5 dB, and 9.8 dB for harmonic1 and harmonic3. The rate of airflow vibrato is 4.35 Hz.
130
CHAPTER V. CONCLUSIONS
The purpose of this study was to gain an understanding of the production of airflow
vibrato, a phenomenon without a scientific basis up to this time. Two studies were run, the first
to examine observations of airflow vibrato (rate, extent, relationship with fundamental frequency
vibrato, intensity variation), and the other to study more specifically potential sources of the
creation of airflow vibrato (by specifically manipulating glottal adduction and subglottal
pressure). The results should give deeper insights into phonation in general and the aerodynamics
of phonation specifically, and begin a greater focus on an understudied area of research that can
be called “the aerodynamics of laryngeal modulations”. The first study with professional singers
demonstrated the obvious existence of airflow vibrato, and as such expands the categories of
vibrato classification. That is, the three classic vibrato descriptors, frequency vibrato, intensity
vibrato, and timbre vibrato, now can be accompanied by a fourth, airflow vibrato.
Study 1: Airflow Vibrato in Four Professional Singers
The results from studying four professional singers suggest that airflow vibrato varies in
an overall similar manner with F0 vibrato, usually leading F0 vibrato, but can be much more
complex in waveshape than F0 vibrato. Because airflow in general is related strongly to
laryngeal flow resistance, it might be assumed that airflow vibrato is strongly related to glottal
adduction and subglottal pressure. In this study, however, adduction (suggested by the EGGW
measure) and subglottal pressure (suggested by loudness) did not have obvious causative
relations with airflow vibrato. Airflow vibrato did have a strong relation with pitch, however,
having a wider airflow vibrato extent with higher pitch. In addition, the two female singers
131
tended to have greater vibrato extents than the two male singers. This study lead to the second
study that attempted to study possible sources of airflow vibrato more specifically.
Study 2: Sources of Airflow Vibrato
Airflow vibrato was compared to airflow variations during bleat (primarily glottal
adductory changes) and external epigastric pumping (primarily subglottal pressure changes) in
order to attempt to uncover potential sources of airflow vibrato. Males tended to have higher F0
vibrato extents than females, but similar airflow vibrato extents were seen in both males and
females, which was contrary to the results of Study 1. The epigastric pumping portions of the
study suggest that subglottal pressure variations may have a strong influence on the vibrato
characteristics. The non-professional singers showed smaller airflow vibrato extents similar to
the airflow variations during shallow abdominal pumping. Larger airflow vibrato extents in
professional singers compared to amateur singers suggest greater glottal adduction variation
(presumably of the posterior glottis) along with higher lung pressure variations.
F0 modulation extents were seen to be in a similar range as bleat, external epigastric
pumping, and vibrato. But higher F0 modulation extents were seen when higher subglottal
pressures were involved, i.e., during deep abdominal pumping. Therefore, singers who show
higher F0 vibrato extents are potentially using higher lung pressure variations along with CT
contraction alterations. Laryngeally mediated intensity extents were also seen to be higher along
with larger airflow extents, when the posterior glottis activity (during whisper) was involved.
This leads to an hypothesis that highly experienced professional singers develop a skill of
increased posterior glottal activity along with CT muscle function and higher lung pressures
during vibrato production, whereas in newly trained or less experienced singers, vibrato
132
production involves the anterior glottis primarily by CT and vocalis coordination, with
potentially less respiratory involvement.
Observation of Regularity of Airflow and F0 Modulations
F0 modulations were smoother, more consistent, and quasi-sinusoidal compared to
airflow modulations during vibrato production. Airflow vibrato presented with a variety of
waveform shapes and a wide range of regularity. The results for bleating conditions suggest that
the primary airflow vibrato shaping is most likely due to adductory and subglottal pressure
variations, whereas the finer variations superimposed on the airflow vibrato waveshape may be
due to superimposed bleat-like variations of the glottis (up to two times the undulation
frequency).
The phase differences among F0, intensity, and airflow occurred over a wide range. The
ranges were relatively consistent within each subject, emphasizing the individual style of
producing vibrato. During bleat productions, the phase differences among F0, intensity, and
airflow also occurred over a wide range. The striking phenomenon that was seen for bleat was
smoother, consistent, and quasi-sinusoidal airflow modulations with simple to complex (multiple
components and inconsistent) F0 modulations. During external epigastric pumping, very regular
and consistent modulated waveforms of intensity, F0, and airflow were seen. The phase
differences among them were almost zero, and was more highly correlated in deep abdominal
pumping than in shallow pumping. Thus, combining the results for bleat and epigastric pumping,
since both sources of variation resulted in smooth waveforms and relatively predictable
relationships, they cannot be the full cause of airflow vibrato, since airflow vibrato showed a
relatively wide range of shapes and irregularities.
133
Combining the results of Study 1 and Study 2 (especially when viewing Figures 38 and
39) suggests that a few hypotheses can be generated relative to the sources of airflow vibrato and
its relation to F0 vibrato. For example, relative to airflow vibrato extent and F0 vibrato extent,
the two sopranos of Study 1 appear to use subglottal pressure variation as a primary source
(undoubtedly also with CT variations), the tenor primarily glottal adduction variations, and the
baritone and the 4 amateur singers both CT and Ps variations. Also, the two sopranos had
relatively consistent extents of both F0 and airflow vibrato that were small relative to the average
extents, suggesting that subglottal pressure variation may provide relatively regular variations
of both F0 and airflow vibrato. The results for the tenor suggest the hypothesis that a primarily
adductory source provides relatively low F0 vibrato extent and moderately high airflow vibrato
extent, but with a relatively inconsistent extent especially of the F0. For the rest of the subjects
(the baritone and the four subjects of Study 2), the hypothesis is that a primarily CT-governed
source may result in moderate F0 vibrato extent and relatively low airflow vibrato extent, but a
moderate level of inconsistency for the F0 extent and a higher level of inconsistency to the
airflow extent. These are hypotheses to test in future studies.
Limitations and Future Directions
The airflow vibrato measures such as extent and rate were sometimes difficult to measure
due to the complex nature of the airflow vibrato waveforms. During the more complex waveform
conditions, prominent and/or most approximate values were considered for the measurement.
The EGG measures did not show significant changes in adduction when peaks and valleys of the
airflow vibrato were compared, suggesting that possible countering aspects are involved with
those measures.
134
For most of the conditions, airflow vibrato lead F0 vibrato. The current study could not
discover the probable reason behind this observation. The airflow and F0 vibrato extents were
significantly affected with increase in pitch in both Study 1 and Study 2, but were unaffected by
increase in loudness levels. As Ps increased, the average airflow was expected to increase. But
the average airflows along with F0 and airflow vibrato extents did not change significantly with
increase in loudness levels for all eight subjects. This might indicate the there was an increase in
glottal flow resistance in order to maintain similar ranges of glottal airflows. But the current
study could not give a convincing explanation of F0 and airflow vibrato extents unaffected by
loudness levels.
A critically important future study is to use flexible fiber-optic high-speed imaging of
vocal fold vibration simultaneously with laryngeal EMG, direct measures of subglottal pressure
using a tracheal puncture technique, and measures of airflow using the airflow mask system,
while the singer is producing vibrato. Such a study would help answer many of the questions that
are unanswered in the current study, because viewing the larynx would give the important
information about glottal size and shape variation during singer. Comparing the results obtained
from different possible sources of Study 2 along with this future physiological study should give
a more complete understanding of F0, airflow, and intensity vibrato, and most importantly the
complexity of the waveform shape in airflow vibrato. If there exists a difference in regularity of
airflow vibrato waveform shape between professional and non-professional singers that should
suggest that there may be a target behavior in laryngeal aerodynamics as the airflow corresponds
to some favorable physiological coordination that increases with professional experience.
The studies of production and control of airflow vibrato should direct the clinical
investigation of airflow variation relative to vocal tremors and other abnormal neuromuscular
135
activities as seen in spasmodic dysphonia, muscle tension dysphonia, and neurogenic stuttering.
By doing so, a deeper understanding of how the body produces these disorders will be gained.
From the results of airflow and F0 modulation characteristics of possible sources
(primarily adductory and primarily Ps) obtained from Study 2, a basic understanding of these
phenomena was presented. This should help the clinician to therapeutically focus on target
behavior. For example, if the airflow and F0 modulation cycles were exactly in phase, the
possible source most likely would be respiratory (results obtained from external epigastric
pumping). This would suggest to the clinician to plan one of the therapy goals on respiratory
muscle strengthening, training, and control. Whereas, if the airflow and F0 modulation cycles
were not in phase and varied widely in phase difference, the possible source may be laryngeal
(results obtained from bleating and the corresponding adductory gesture). This indirectly
suggests that the clinician might focus on phonatory strengthening through different vocal
functioning exercises to improve muscle strength, functioning, and control.
In addition, the regularity and waveform shapes of F0 and airflow vibrato should be
extensively studied. The wide range of waveshapes of the airflow vibrato of this study was
remarkable, and the sources for such variability are still not fully understood.
The relationship between airflow vibrato and perceptual attributes should also be
pursued. A perceptual study should be done by categorizing the airflow vibrato samples based on
the levels of complexity (regularity, consistency, and multiple components and peaks). The
complexity of the airflow vibrato should be measured using cycle to cycle short-term
perturbation measures similar to jitter and shimmer, as well as longer-term measures such as the
coefficient of variation, harmonics to noise ratio, and spectral methods. Qualitative measures
136
should be used such as CAPE-V and perceptual judgement of quality of vibrato from expert
singers or singing teachers.
It is anticipated that eventually there will be sufficiently complex and valid computer
models that could be used to include not only the aerodynamic and acoustic aspects of complex
vibrato production, but also the corresponding effects of the individual intrinsic and extrinsic
laryngeal muscles involved with production of vocal vibrato (e.g., Titze’s VoxInSilico software).
137
REFERENCES
Atkinson, J. E. (1978). Correlation analysis of the physiological factors controlling fundamental
voice frequency. The journal of the acoustical society of America, 63(1), 211-222.
Baer, T., Sasaki, C. T., & Harris, K. S. (Eds.). (1987). Laryngeal function in phonation and
respiration. College-Hill.
Baer, T. (1979). Reflex activation of laryngeal muscles by sudden induced subglottal pressure
changes. The journal of the Acoustical Society of America, 65(5), 1271-1275.
Baken, R. J., & Orlikoff, R. F. (2000). Clinical measurement of speech and voice. Cengage
Learning.
Balog, J. E. (2005). Popular Song and Music Theater: A Guide to Evaluating Music Theater
Singing for the Classical Teacher. Journal of Singing-The Official Journal of the
National Association of Teachers of Singing, 61(4), 401-406.
Bateman, L. A. (2010). Parallels between singing and phonetic terminology. Working Papers of
the Linguistics Circle, 15, 79-84.
Brown, L. R., & Scherer, R. C. (1992). Laryngeal adduction in trillo. Journal of Voice, 6(1), 27-
35.
Casper, J. K., & Leonard, R. (2006). Understanding voice problems: A physiological perspective
for diagnosis and treatment. Lippincott Williams & Wilkins.
Chen, Y., Robb, M. P., & Gilbert, H. R. (2002). Electroglottographic evaluation of gender and
vowel effects during modal and vocal fry phonation. Journal of speech, language, and
hearing research, 45(5), 821-829.
Childers, D.G & Larar, J.N (1984). “Electroglottography for laryngeal function assessment and
speech analysis.” IEEE Trans Biomed Eng, 31: 12.
138
Davis, W. J. (2009). The role of the epigastrium in breath management for singers. The
University of Texas at Austin.
Dejonckere, P. H. (1995). Caruso's Vibrato: An Acoustic Study. PH. Dejonckere, M. Hirano, J.
Sundberg, Vibrato, San Diego: CA Singular Pub, 11-20.
Draper, M. H., Ladefoged, P., & Whitteridge, D. (1960). Expiratory pressures and air flow
during speech. British medical journal, 1(5189), 1837.
Dromey, C., Reese, L., & Hopkin, J. A. (2009). “Laryngeal-level amplitude modulation in
vibrato.” Journal of Voice, 23; 2: 156-163.
Dromey, C., Stathopoulos, E. T., & Sapienza, C. M. (1992). Glottal airflow and
electroglottographic measures of vocal function at multiple intensities. Journal of Voice,
6(1), 44-54.
Elliot, N., Sundberg, J., & Gramming, P. (1995). What happens during vocal warm‐
up? Journal of Voice, 9(1), 37‐44.
Fisher, K. V., Scherer, R. C., Guo, C. G., & Owen, A. S. (1996). Longitudinal phonatory
characteristics after botulinum toxin type A injection. Journal of Speech, Language, and
Hearing Research, 39(5), 968-980.
Fromkin, V., & Ohala, J. (1968). Laryngeal control and a model of speech production. In
Preprints of the speech symposium, Kyoto (Vol. 3, pp. 1-5).
Fourcin, A. J. (1981). “Laryngographic assessment of phonatory function.” In: Ludlow CL, Hart
MO, eds. Proceedings of the conference of the assessment of vocal pathology, Rockville,
Md, December 1981. Vol 11. Rockville, Md: American Speech-Language-Hearing
Association; 1981: 116-127.
139
Griffin, B., Woo, P., Colton, R., Casper, J., & Brewer, D. (1995). Physiological characteristics of
the supported singing voice. A preliminary study. Journal of Voice, 9(1), 45-56.
Guzman, M., Rubin, A., Muñoz, D., & Jackson-Menaldi, C. (2013). Changes in glottal contact
quotient during resonance tube phonation and phonation with vibrato. Journal of Voice,
27(3), 305-311.
Hakes, J., Shipp, T & Doherty, E. T. (1988). “Acoustic characteristics of vocal oscillations:
vibrato, exaggerated vibrato, trill, and trillo.” Journal of Voice, 1; 4: 326-331.
Hakes, J., Shipp, T., & Doherty, E. T. (1987). Acoustic properties of straight tone, vibrato, trill,
and trillo. Journal of Voice, 1(2), 148-156.
Hampala, V., Garcia, M., Švec, J. G., Scherer, R. C., & Herbst, C. T. (2015). Relationship
between the electroglottographic signal and vocal fold contact area. Journal of Voice.
Henrich, N., Roubeau, B., & Castellengo, M. (2003, August). On the use of electroglottography
for characterisation of the laryngeal mechanisms. In Stockholm Music Acoustics
Conference. Sweden: Stockholm.
Hicks, D.M & Teas, E. (1987). “An electroglottographic study of vocal vibrato.” Journal of
Voice, 1; 2: 142-147.
Higgins, M. B., Netsell, R., & Schulte, L. (1998). Vowel-related differences in laryngeal
articulatory and phonatory function. Journal of Speech, Language, and Hearing
Research, 41(4), 712-724.
Hirano, M., Kurita, S., & Nakashima, T. (1983). Growth, development and aging of human vocal
folds. Vocal fold physiology: Contemporary research and clinical issues, 22-43.
140
Hixon, T. J., Klatt, D. H., & Mead, J. (1971). Influence of forced transglottal pressure changes
on vocal fundamental frequency. The Journal of the Acoustical Society of America,
49(1A), 105-105.
Holmberg, E. B., Hillman, R. E., & Perkell, J. S. (1989). Glottal airflow and transglottal air
pressure measurements for male and female speakers in low, normal, and high pitch.
Journal of Voice, 3(4), 294-305.
Holmberg, E. B., Hillman, R. E., & Perkell, J. S. (1988). Glottal airflow and transglottal air
pressure measurements for male and female speakers in soft, normal, and loud voice.
The Journal of the Acoustical Society of America, 84(2), 511-529.
Horii, Y., & Hata, K. (1988). A note on phase relationships between frequency and amplitude
modulations in vocal vibrato. Folia Phoniatrica, 40, 303-311
Horii, Y. (1989). Acoustic analysis of vocal vibrato: a theoretical interpretation of data. Journal
of Voice, 3(1), 36-43.
Horner, R. L., Innes, J. A., Murphy, K., & Guz, A. (1991). Evidence for reflex upper airway
dilator muscle activation by sudden negative airway pressure in man. The Journal of
Physiology, 436, 15.
Isshiki, N. (1964). Regulatory mechanism of voice intensity variation. Journal of Speech,
Language, and Hearing Research, 7(1), 17-29.
Izdebski, K., & Shipp, T. (1976). Voluntary reaction times for phonation initiation. The Journal
of the Acoustical Society of America, 60(S1), S66-S66.
Koda, J., & Ludlow, C. (1992). An evaluation of laryngeal muscle activation in patients with
voice tremor. Otolaryngology – Head and Neck Surgery, 107, 684-696
141
Konnai, R., Scherer, R. C., Peplinski, A., & Ryan, K. (in press). Whisper and Phonation:
Aerodynamic Comparisons Across Adduction and Loudness. Journal of Voice.
Ladefoged, P., & McKinney, N. P. (1963). Loudness, sound pressure, and subglottal pressure in
speech. The journal of the Acoustical Society of America, 35(4), 454-460.
Ladefoged, P. (1963). Some physiological parameters in speech. Language and speech, 6(3),
109-119.
Large, J., Iwata, S., & Leden, H. V. (1970). The primary female register transition in singing.
Folia Phoniatrica et Logopaedica, 22(6), 385-396.
Large, J., & Iwata, S. (1971). “Aerodynamic study of vibrato and voluntary ‘straight tone’ pairs
in singing.” Folia Phoniatrica et Logopoedica, 23; 1: 50-65.
Laukkanen, A., Vilkman, E., & Unto, K. (1992). Aspect of the physiological sources of vocal
vibrato: A study of fundamental-period-synchronous changes in electroglottographic
signals obtained from one singer and two excised human larynges. Scandinavian Journal
of Logopedics & Phoniatrics, 17, 87-93.
Laver, J. (1980). The phonetic description of voice quality. Cambridge Studies in Linguistics
London, 31, 1-186.
Leanderson, R. O. L. F., Sundberg, J. O. H. A. N., & von Euler, C. U. R. T. (1987). Role of
diaphragmatic activity during singing: a study of transdiaphragmatic pressures. Journal
of Applied Physiology, 62(1), 259-270.
Lecluse, F. L. E., Brocaar, M. P., & Verschuure, J. (1975). The electroglottography and its
relation to glottal activity. Folia Phoniatrica et Logopaedica, 27(3), 215-224.
Leydon, C., Bauer, J. J., & Larson, C. R. (2003). The role of auditory feedback in sustaining
vocal vibrato. The Journal of the Acoustical Society of America, 114(3), 1575-1581.
142
Luchsinger, R. (1965). Voice, speech, language: Clinical communicology: its physiology and
pathology. Wadsworth Pub..
Mason, R. (1965). A study of the physiological mechanisms of vocal vibrato. Unpublished
doctoral dissertation, University of Illinois.
Netsell, R., & Daniel, B. (1974). Neural and mechanical response time for speech production.
Journal of Speech, Language, and Hearing Research, 17(4), 608-618.
Nishino, T. (2000). Physiological and pathophysiological implications of upper airway reflexes
in humans. The Japanese journal of physiology, 50(1), 3-14.
Orlikoff, R.F. (1995). “Vocal stability and vocal tract configuration: an acoustic and
electroglottographic investigation.” Journal of Voice, 9; 2: 173-181.
Orlikoff, R.F. (1991). “Assessment of the dynamics of vocal fold contact from the
electroglottogram: data from normal male subjects.” J Speech Hear Res, 2: 5-19
Poyatos, F. (2002). Nonverbal Communication Across Disciplines: Paralanguage, kinesics,
silence, personal and environmental interaction (Vol. 2). John Benjamins Publishing.
Prame, E. (1997). Vibrato extent and intonation in professional Western lyric singing. The
Journal of the Acoustical Society of America, 102(1), 616-621.
Ramsdell, D. A. (1938). “The psycho-physic of frequency modulation.” Unpublished thesis,
Harvard University (not seen, reported in Stevens & Davis: Hearing- its psychology and
physiology, Wiley & Sons, New York, pp. 236-239.
Raphael, B. N., & Scherer, R. C. (1987). Voice modifications of stage actors: acoustic analyses.
Journal of Voice, 1(1), 83-87.
Rothenberg, M., Miller, D., Molitor, R., & Leffingwell, D. (1987). The control of air flow during
loud soprano singing. Journal of Voice, 1(3), 262-268.
143
Rothenberg, M., Miller, D., & Molitor, R. (1988). Aerodynamic investigation of sources of
vibrato. Folia Phoniatrica et Logopaedica, 40(5), 244-260.
Rubin, H. J., LeCover, M., & Vennard, W. (1967). Vocal intensity, subglottic pressure and air
flow relationships in singers. Folia Phoniatrica et Logopaedica, 19(6), 393-413.
Sapir, S., & Larson, K. K. (1993). Supralaryngeal muscle activity during sustained vibrato in
four sopranos: surface EMG findings. Journal of Voice, 7(3), 213-218.
Saski, C. T., Suzki, M., & Horiuchi, M. (1977). The effect of tracheostomy on reflex laryngeal
closure. Laryngoscope, 87, 1428-1433.
Sawashima, M., & Hirose, H. (1983). Laryngeal gestures in speech production. In The
production of speech (pp. 11-38). Springer New York.
Sawashima, M. (1974). Laryngeal research in experimental phonetics. Current trends in
linguistics, 12, 2303-2348.
Scherer, R. C., Vail, V. J., & Rockwell, B. (1995). Examination of the laryngeal adduction
measure EGGW. Producing speech: contemporary issues: for Katherine Safford Harris,
269-290.
Scherer, R.C., Druker, D.G. & Titze, I.R. (1988). “Electroglottography and direct measurement
of vocal fold contact area.” In O. Fujimura (ed.) vol.2, Vocal fold physiology, Raven
Press, pp. 279-291.
Scherer, R. C., Gould, W. J., Titze, I. R., Meyers, A. D., & Sataloff, R. T. (1988a). Preliminary
evaluation of selected acoustic and glottographic measures for clinical phonatory
function analysis. Journal of Voice, 2(3), 230-244.
Schlapp, M. (1973). Observations on a voluntary tremor—violinist's vibrato. Quarterly journal
of experimental physiology and cognate medical sciences, 58(4), 357-368.
144
Sears, T. A., & Davis, J. N. (1968). The control of respiratory muscles during voluntary
breathing. Annals of the New York Academy of Sciences, 155(1), 183-190.
Seashore, C. (1947). In search of beauty in music. New York: The Ronald Press.
Seashore, C. E. (1932). “The vibrato.” Iowa city, Iowa: University of Iowa Press, 30-37.
Shaker, R., Ren, J., Bardan, E., Easterling, C., Dua, K., Xie, P., & Kern, M. (2003).
Pharyngoglottal closure reflex: characterization in healthy young, elderly and dysphagic
patients with predeglutitive aspiration. Gerontology, 49(1), 12-20.
Shipp Thomas, E., Doherty, T & Hagland, S. (1990). “Physiological factors in vocal vibrato
production.” Journal of Voice, 4: 300-304.
Shipp, T., Sundberg, J., & Haglund, S. (1984, June). A model of frequency vibrato. In
Transcripts of the Thirteenth Symposium: Care of the Professional Voice, page 116Á.
Shipp, T., Leanderson, R., & Sundberg, J. (1980). Some acoustic characteristics of vocal vibrato.
J Res Sing, 4, 18-25.
Smith, E. (1970). An electromyographic investigation of the relationship between abdominal
muscular effort and the rate of vocal vibrato. NATS Bull. 26: 2-17.
Sundberg, J., Scherer, R., Hess, M., & Müller, F. (2010). Whispering—a single-subject study of
glottal configuration and aerodynamics. Journal of Voice, 24(5), 574-584.
Sundberg, J. (2000). Where does the sound come from?. na.
Sundberg, J., & Skoog, J. (1997). Dependence of jaw opening on pitch and vowel in singers.
Journal of Voice, 11(3), 301-306.
Sundberg, J. (1995). “Acoustic and psychoacoustic aspects of vocal vibrato.” STL-QPSR, 35; 2-
3:045-068.
145
Sundberg, J. (1995a). “Acoustic and psychoacoustic aspects of vocal vibrato,” chapter 2 in P.H.
DeJonckere, M. Hirano, J. Sundberg, eds., Vibrato, Singular Publishing Group, Inc., San
Diego.
Sundberg, J. (1994). Perceptual aspects of singing. Journal of voice, 8(2), 106-122.
Sundberg, J., Titze, I & Scherer, R. C. (1993). “Phonatory control in male singing: a study of the
effects of subglottal pressure, fundamental frequency, and mode of phonation on the
voice source.” Journal of Voice, 7; 1: 15-29.
Sundberg, J. (1989). “Synthesis of singing by rule.” In current directions in computer music
research (M. Mathews & J. Pierce, eds), Cambridge, MA: The MIT Press, pp. 45-55 and
pp.401-403.
Sundberg, J. (1977). Singing and timbre. Music room acoustics, 17, 57-81.
Titze, I.R. (2017). VoxInSilico (software, freeware), National Center for Voice and Speech, Salt
Lake City, Utah.
Titze, I. R., Finnegan, E. M., Laukkanen, A. M., Fuja, M., & Hoffman, H. (2008). Laryngeal
muscle activity in giggle: A damped oscillation model. Journal of Voice, 22(6), 644-648.
Titze, I. R., Story, B., Smith, M., & Long, R. (2002). A reflex resonance model of vocal vibrato.
The Journal of the Acoustical Society of America, 111(5), 2272-2282.
Titze, I. R. (2000). Principles of voice production. National Center for Voice and Speech.
Titze, I. R., & Sundberg, J. (1992). Vocal intensity in speakers and singers. The Journal of the
Acoustical Society of America, 91(5), 2936-2946.
Titze, I.R. (1994). Principles of voice production. New Jersey: Prentice Hall
Titze, I. R. (1989). “On the relation between subglottal pressure and fundamental frequency in
phonation.” Journal of Acoustical Society of America, 85(2).
146
Traunmüller, H., & Eriksson, A. (2000). Acoustic effects of variation in vocal effort by men,
women, and children. The Journal of the Acoustical Society of America, 107(6), 3438-
3451.
Tsunoda, K., Ohta, Y., Niimi, S., Soda, Y., & Hirose, H. (1997). Laryngeal adjustment in
whispering: magnetic resonance imaging study. Annals of Otology, Rhinology &
Laryngology, 106(1), 41-43.
van den Berg, J. W. (1957). Subglottic pressures and vibrations of the vocal folds. Folia
Phoniatrica et Logopaedica, 9(2), 65-71.
Vennard, W. (1967). Singing: The mechanism and the technic. New York: Carl Fischer.
Zemlin W. (1968). Speech and Hearing Sciences (Prentice-hall, Englewood, Cliffs, N.J.,
Landis, C., & Hunt, W. (1939). The startle pattern.
147
APPENDIX A
HSRB Approval Letter
148
APPENDIX B
Recruitment Script
Singers are invited to participate in a study on ‘aerodynamics of vibrato’. Speech and singing
data will be collected to determine acoustic and aerodynamic aspects of vibrato. The purpose of
this study is to understand glottal airflow changes while speaking and singing. Participation is
voluntary, and if you decide to withdraw from the experiment at any time, you can do so without
any kind of penalty. You will be given a $15 gift card as a token of appreciation for your
participation. This study will be conducted by Srihimaja Nandamudi, M.S, doctoral student in
Voice and Speech Sciences ([email protected] ; 419-372-4320) and Dr. Ronald C. Scherer, Ph.
D., Distinguished Research Professor ([email protected] ; 419-372-7189) in the Department of
Communication Sciences and Disorders, College of Health and Human Services, Bowling Green
State University.
The study includes one session which will take about two hours. The study will take place at The
Voice Laboratory, Health and Human Services Building. During the study, you will be asked to
fill out a consent form (which includes a complete description of the protocol) and a confidential
health & voice form. You will be acquainted with the environment and recording procedures.
You will be asked to perform relatively familiar speech and singing tasks with convenient breaks
of 5-10 minutes whenever necessary.
If you are interested in hearing more about this study and are considering participating, please
write to me, Sri Nandamudi, at the email address [email protected] ; please include your contact
information. Thank you.
149
APPENDIX C
Study 1 Consent Form
I. Purpose
You are invited to participate in a research project on “Flow Vibrato in Singers”. You will
be asked to sing a variety of sounds in different pitches and loudness levels. The speech and
singing tasks, which will include a combination of repeated tones, scales, arpeggios, vocalises
(musical exercises), and musical excerpts from the vocal literature, are normally encountered in
your daily voice use as a singer and performer.
This project is descriptive in nature. The results may help us in better understanding vocal
function. A copy of this consent form will be given to you. This project will be part of a research
project in the Department of Communication Science and Disorders.
II. Procedures
The utterances you will be expected to perform are representative of your everyday singing
activities. The tasks will include repeated tones, scales, arpeggios, and vocalises (vocal
exercises) performed at different pitch, loudness levels and registers. In addition, you will be
expected to perform musical excerpts from the vocal literature.
You will sit or stand (depend on your convenience) while performing the speech and
singing tasks in a sound-treated booth in the Voice Physiology Laboratory at the College of
Health and Human Services. The dimensions of the booth are approximately 4 foot by 6.33 foot
by 6.5 foot. You will be asked to become accustomed to the booth and it’s furnishings by being
150
in the booth 10 minutes before the actual recording begins, or longer, until you indicate that you
are comfortable with the environment.
For most utterances, you will be asked to place a mask on your face. This mask is made of
clear plastic and has holes in it. It will measure the airflow you use during voicing (singing and
speech). You will hold the mask to your face; the soft seal of the mask prevents air escape
around the edges. There is a sterile tube that extends from a pressure transducer on the inside of
the mask to the inside corner of your mouth. This tube has no sharp edges. It is used to measure
the air pressure in your mouth. The only mask discomfort known is the presence of the mask on
the face.
You will wear an electroglottography electrode band on your neck. This will indirectly
record aspects of vocal fold motion. This device is non-invasive. The only known problem is
irritation to metal contact. Please let me know if you are allergic to metal contact. There will be a
microphone and a sound level meter placed in front or to the side of you.
The recording session is anticipated to take place on one occasions lasting approximately
60 minutes. On the day of the recording, you will be asked to fill out a Health and Voice History
Form to make sure that you are in sufficiently good condition physically and vocally. If you
think that your physical condition is interfering with your singing production, the recording
session will be canceled and re-scheduled to a later date at your convenience. You will be given
approximately 10 minutes to get used to the booth before the recording of the tasks begins. You
may take a break or stop the session anytime you like (due to any reason). You have the right to
discontinue any task that is uncomfortable to you.
151
A video camera placed outside the booth will record the experiment for archival and
trouble-shooting purposes.
III. Risks:
There are no known risks involved in this project. As mentioned above, the only known
problem is a potential irritation to metal contact while using the electroglottography (EGG).
Please let me know if you are allergic to metal contact.
IV. Benefits:
The current research project is significant pedagogically. It may help singing teachers in
understanding the functional changes associated with pitch, loudness, and register variations in
singing.
You may benefit from the findings and procedures of the experiment as a teacher of
singing and voice pedagogy. Potential benefits include:
1) Acquiring a better understanding of the scientific basis of pitch, loudness, and register
variations in singing training;
2) Acquiring a better understanding of the objective measurements used in voice science
research and their application to voice pedagogy;
3) Hands-on experience of instrumentation techniques frequently mentioned in singing and voice
science journals.
You will not be paid for participating in the study.
152
V. Confidentiality:
The recorded samples and data to which only members of the research team have access,
will be stored in password protected files in the Voice Physiology Laboratory, College of Health
and Human Services at Bowling Green State University. The recordings made in this study will
be kept for a minimum of 10 years for further reference, analysis, investigation, and inclusion in
other research projects.
You, as a collaborator in this project will be anonymous as a subject relative to all reports
and presentations.
VI. Participation:
Your participation in this study is completely voluntary. Participating or not participating
will have no effect on your relationship with BGSU. If you decide to withdraw from the
experiment at any time, you may do so without penalty of any kind.
VII. Contact Information:
Please contact me, Srihimaja Nandamudi (419) 378-0280 (cell), or Dr. Ronald C. Scherer
(419) 372-7189 (work phone), at any time concerned this study. Also, if you have questions
regarding the conduct of this study or about your rights as a research participant, you may
contact the Chair of Bowling Green State University’s Human Subjects Review Board at (419)
372-7716 ([email protected]). This research project may involve participating students from
the Department of Communication Sciences and Disorders; and possibly from other departments
of the BGSU campus, including your own department.