Page 1
Running head: AN ABNORMAL APPLE A DAY, KEEPS FOOD WASTE AT BAY! 1
An Abnormal Apple A Day, Keeps Food Waste At Bay!
Effect of Food Shape and Firm Reputation on Perceived
Food Quality and Purchase Intention
Rody R. Le – 10761551
Master’s Thesis
7481 words
29 – 06 – 2018
M.s. Dr. Stephanie C. M. Welten
Master’s programme Communication Science
Graduate School of Communication
University of Amsterdam
Page 2
AN ABNORMAL APPLE A DAY, KEEPS FOOD WASTE AT BAY! 2
Abstract
This study researched the main effect of food shape (normal versus abnormal) on purchase
intention and examined if perceived food quality mediated the effect, and if firm reputation
(low vs. high) moderated this mediated effect. This study adds to the existing knowledge in
two ways. Firstly, this study clarifies the decline in consumers’ purchase intention when food
shape deviates by looking into perceived food quality. Retailers could use this insight to
enhance consumers’ perceived quality by informing them that abnormal shaped foods are of
the same quality as normal shaped foods. Secondly, this study adds to the existing knowledge
about cue utilisation theory and the dominance of intrinsic over extrinsic cues by examining if
a positive extrinsic high-scope cue can counter the negative effect of an intrinsic high-scope
cue.
The study has been performed amongst 214 consumers and consisted out of a 2 (food
shape: normal or abnormal) x 2 (firm reputation: low or high) factorial between-subjects
design. The results showed that food shape influences consumers’ purchase intention:
consumers are less likely to purchase abnormal shaped foods when compared to normal
shaped foods. The results also showed that perceived quality partially mediates the effect of
food shape on consumers’ purchase intention: when consumers are exposed to abnormal
shaped foods, their quality perceptions are lower, which consequently weakens their purchase
intentions. The study did not find a moderation effect of firm reputation on the mediation
effect. This implies that a high firm reputation cannot eliminate the negative effect of
abnormal shaped foods on perceived quality and purchase intention.
Future research should measure consumers’ price perception, as research shows that
high reputational firms can form higher reference price scales while consumers are less likely
to purchase a product when they perceive the price as high.
Page 3
AN ABNORMAL APPLE A DAY, KEEPS FOOD WASTE AT BAY! 3
Introduction
Annually, 1.3 billion tonnes of food is wasted and Western countries produce the greatest
amount of it (Gustavsson, Cederberg, Sonesson, Van Otterdijk, & Meybeck, 2011). In these
countries, food waste occurs notably in the production to retailing stages and out of all foods,
especially fruits and vegetables are wasted (Gustavson et al., 2011). These wasted foods
deviate from normal foods and do not meet the consumption standards, however, there is no
deviation on the intrinsic quality or safety (Halloran, Clement, Kornum, Bucatariu, & Magid,
2014), making them still fine for human consumption. Nonetheless, retailers are unwilling to
sell suboptimal foods (Aschemann-Witzel, De Hooge, Amani, Bech-Larsen, & Oostindjer,
2015; Buzby & Hyman, 2012; Buzby, Hyman, Stewart, & Wells, 2011), as they believe that
consumers dislike and do not want to consume these abnormal fruits and vegetables
(Aschemann-Witzel et al., 2015; Buzby & Hyman, 2012; Buzby et al., 2011). Especially in
Europe, in comparison to other continents, an outstanding amount of fruits and vegetables is
wasted in the pre-consumption stage (Gustavson et al., 2011). This significant amount of food
waste of fruits and vegetables has to be reduced, as it implies a negative impact on the
environment (Nelleman et al., 2009), including waste in the use of chemicals (e.g., pesticides,
fertilizers), energy (e.g., greenhouses, transportation), water, and land (Nelleman et al., 2009).
Although retailers are unwilling to sell abnormal foods to their consumers, it is
interesting that consumers base their quality evaluations on a combination of cues and not
only on the food’s appearance (Dawar & Parker, 1994; Dodds, Monroe, & Grewal, 1991;
Miyazaki, Grewal, & Goodstein, 2005). The food’s appearance can be categorised as an
intrinsic cue (Olson, 1972), which is a product-related attribute (e.g., food shape). However,
during an evaluation process, consumers are not just faced with intrinsic cues, but also with
multiple extrinsic cues, such as price, quality labels and the firm’s reputation. Extrinsic cues
represent product-related attributes that are not part of the physical product (Olson, 1972).
Page 4
AN ABNORMAL APPLE A DAY, KEEPS FOOD WASTE AT BAY! 4
Due to the many cues that have to be processed, not all cues can be equally important:
consumers tend to rank cues on their relative importance as to what they can distinguish as a
low- or high-quality product. The ranking of cues can be categorised into low- or high-scope
(Purohit & Srivastava, 2001). Low-scope cues are temporary and are relatively easily and
inexpensively changeable (e.g., price can easily be decreased or increased). High-scope cues
evolve over time and cannot be changed instantly (e.g., the reputation of a brand or a firm
cannot be easily changed, particularly from negative to positive, as great amounts of effort,
money and time are required). High-scope cues give a better indication of the product quality
when compared to low-scope cues and are found to be the driving force of a purchase
decision (Purohit & Srivastava, 2001). The appearance of food can also be considered a high-
scope cue, as it cannot be changed easily (Loebnitz, Schuitema, & Grunert 2015).
In order to weaken consumers’ negative evaluations of abnormal foods, another
positive high-scope cue may counter the negative effect of the high-scope abnormal food
appearance. Research shows that consumers tend to use both intrinsic and extrinsic cues
concurrently when evaluating product quality (Jacoby, Olson, & Haddock, 1973; Simonson,
1989; Szybillo & Jacoby, 1974). As only the most important intrinsic and extrinsic cues are
simultaneously processed, the most important high-scope cue should be deployed for
enhancing consumers’ perceived overall food quality. Firm reputation has been found to be
one of the most important determinants for consumers to rely on when assessing the quality of
the product (Dodds, et al., 1991; Nevin & Houston, 1980). The associations consumers have
of the firm’s reputation is found to influence the perception of the value of the product
(Brown & Dacin, 1997; Dodds, et al., 1991; Grewal, Monroe, & Krishnan, 1998) and
intention to purchase a product (Buckley, 1991). Moreover, brand reputation – which is
similar to firm reputation, as they are both high-scope cues – has been shown to positively
affect consumers’ quality perceptions when there are visible differences in product quality
Page 5
AN ABNORMAL APPLE A DAY, KEEPS FOOD WASTE AT BAY! 5
(Dodds, et al., 1991; Jacoby, et al., 1973). By using firm reputation as an opposing cue that is
just as strong a cue as abnormal food appearance, the negative effect that abnormal
appearance can elicit, may be diminished. The study adds to the existing knowledge about
abnormal foods and consumer preferences by looking into firm reputation as a high-scope
factor that moderates the effect of food appearance.
Moreover, this study looks into consumers’ food quality perceptions as an explanatory
variable for these effects. Research suggests that when consumers evaluate products, they
often evaluate them on their quality (e.g., freshness, taste, nourishment and safety of the
product; De Hooge et al., 2016; Olson & Jacoby, 1972; Tal, Gvili, Amar, & Wansink, 2017).
Several studies found that purchase intentions are weaker the more foods deviate from the
norm and suggest that this could be mediated by quality perceptions (De Hooge et al., 2016;
Loebnitz & Grunert, 2014; Loebnitz et al., 2015; Verhulst et al., 2017). By looking into
perceived quality as a mediator, a clarification can be provided for this decline. Retailers
could use this insight to enhance consumers’ perceived quality by informing them that these
foods are of the same quality as normal foods (e.g., same taste, nutritional and sanitary
quality).
This study will examine fruits and vegetables that deviate in shape, as it has found to
be the most preferred abnormality (De Hooge et al., 2016). This study aims to research the
main effect of food shape (normal versus abnormal) on purchase intention and will look into
perceived quality as a mediator. Moreover, this study will examine if firm reputation interacts
with food shape, as such that a firm with a high reputation increases consumers’ quality
perceptions and consequently strengthens their purchase intentions. Researching these effects
may give retailers insight on how abnormal shaped foods are perceived by consumers and in
which type of supermarkets they are more likely to be successful. This may positively impact
the environment, as less chemicals, energy, water and land is wasted, and it may possibly
Page 6
AN ABNORMAL APPLE A DAY, KEEPS FOOD WASTE AT BAY! 6
even lead to a reduction in usage of the aforementioned production processes. Additionally,
this study contributes to the literature in two ways: it gives insight into how firm reputation
can be used to positively influence consumers’ negative evaluation of abnormal shaped foods
and it clarifies the underlying structure of the effect on purchase intention. The following
research question has been posed to examine the aim of the study:
RQ: To what extent is there a difference between normal versus abnormal
shaped food on the purchase intention amongst adults living in the Netherlands?
And to what extent is this effect moderated by a low or high firm reputation and
mediated by the perceived quality?
Theoretical Framework
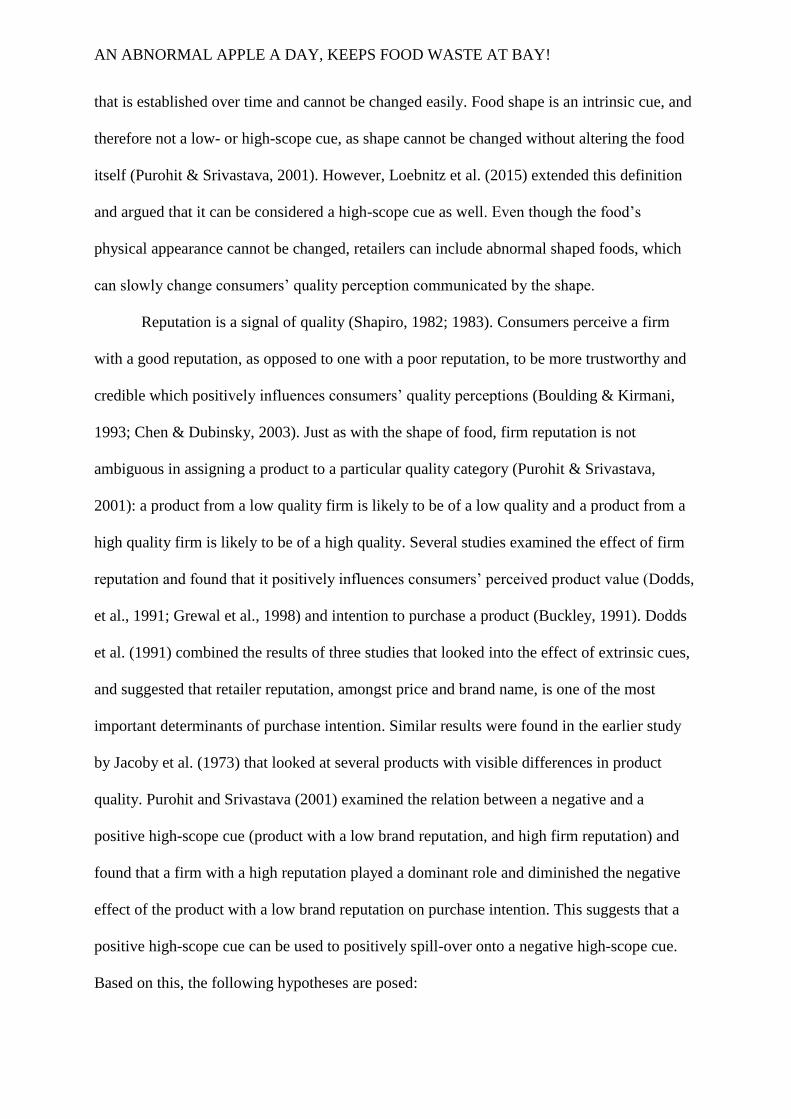
In this section, the hypotheses that belong to the overall research question will be specified
and explained. See Figure 1 for a visual representation of the hypotheses.
Effects of Abnormalities on Quality Perceptions and Purchase Intentions
Consumers generally have the tendency to reject abnormal foods: they prefer products that are
typical of a product category, such that ‘typical’ appearances of products are used as cognitive
reference points to evaluate atypical products (Hurling & Shephard, 2003; Veryzer &
Hutchinson, 1998; Wilkins, BokaerSmith, & Hilchey, 1996). Examples of abnormal foods in
retail settings are rare, which may reinforce normative knowledge, such that consumers
become familiar with a particular appearance. Consumers might use any differences in food
appearances to infer quality, which may lead to a rejection to purchase these foods (Creusen
& Schoormans, 2005).
Although consumers do not prefer abnormal foods, they are not necessarily unwilling
to purchase these products (Aschemann-Witzel et al., 2015; Buzby & Hyman, 2012; Buzby et
al., 2011). A recent study by De Hooge et al. (2016), which conducted a survey amongst
Page 7
AN ABNORMAL APPLE A DAY, KEEPS FOOD WASTE AT BAY! 7
consumers from five Northern European countries including the Netherlands, found that
consumers do not necessarily dislike abnormal foods. Especially Dutch consumers, younger
consumers and consumers who have a higher commitment to environmental sustainability,
showed a higher preference for suboptimal products. However, these consumers did still
perceive suboptimal foods as inferior to ‘normal’ foods (De Hooge et al., 2016).
When taking the extent of food shape deviation into regard, differences in effect can
occur. All research to date about food shape abnormality show that the more food shape
deviates, the weaker consumers’ purchase intentions are (De Hooge et al., 2016; Loebnitz &
Grunert, 2014; Loebnitz et al., 2015; Verhulst et al., 2017). The study by Verhulst et al.
(2017) looked into consumers’ food quality perceptions as well and found the same negative
relation for quality perceptions. However, Verhulst et al. (2017) did not examine perceived
quality as a determinant of purchase intention, hence this recent study looks into this
mediation. In all past studies on food shape, food shape abnormality was operationalised as a
continuum, with normal and abnormal as the extremes. The foods only differed in shape.
Although normal shaped foods were similar in these studies, abnormal shaped foods differed
in their abnormality and how realistic they looked. Furthermore, these past studies looked into
different types of fruits and vegetables and differed in how many foods were examined. While
De Hooge et al. (2016) only looked into one type of vegetable, Loebnitz and Grunert (2014),
Loebnitz et al. (2015) and Verhulst et al. (2017), looked into two types of fruits and
vegetables. Although the operationalisations differed, the past studies did still find similar
results of food shape abnormality on quality perceptions and purchase intentions. Therefore,
the following hypotheses are assumed:
H1: Normal shaped foods lead to stronger purchase intentions than abnormal shaped
foods.
H2: This effect is positively mediated by higher quality perceptions.
Page 8
AN ABNORMAL APPLE A DAY, KEEPS FOOD WASTE AT BAY! 8
Effects of Extrinsic Quality Cues on Quality Perceptions and Purchase Intentions
In the pre-purchase phase, consumers can assess product quality based on multiple cues
(Connolly & Srivastava, 1995). According to the cue utilisation theory, these cues can be
classified as intrinsic or extrinsic (Olson, 1972). Intrinsic cues are product-related attributes
that cannot be manipulated without altering physical properties of the product (e.g.,
ingredients, colour and food shape). Conversely, extrinsic cues are product-related attributes
that can be altered without altering physical properties of the product (e.g., packaging, price,
firm reputation; Richardson, Dick, & Jain, 1994). Research shows that consumers tend to use
both intrinsic and extrinsic cues when evaluating product quality (Jacoby et al., 1973;
Simonson, 1989; Szybillo & Jacoby, 1974). Several reviews of the literature on cue utilisation
theory examined multiple extrinsic cues, and firm reputation was found to be one of the most
important extrinsic cues consumers relied on when making quality assessments (Wheatley,
Chiu, & Goldman, 1977). In this study, both the shape of food and firm reputation, are cues
that can indicate the level of food quality.
Although consumers use both intrinsic and extrinsic cues to rely on, intrinsic cues are
found to dominate extrinsic cues, in terms of their perceived usefulness (Purohit & Srivastava,
2001). However, this does depend on the strength of the cue. No dominance is expected to
occur when using a positively loaded extrinsic cue that is just as strong as the negatively
loaded intrinsic cue. This study examined the interaction effect of food shape and firm
reputation which are both considered high-scope cues according to the cue diagnosticity
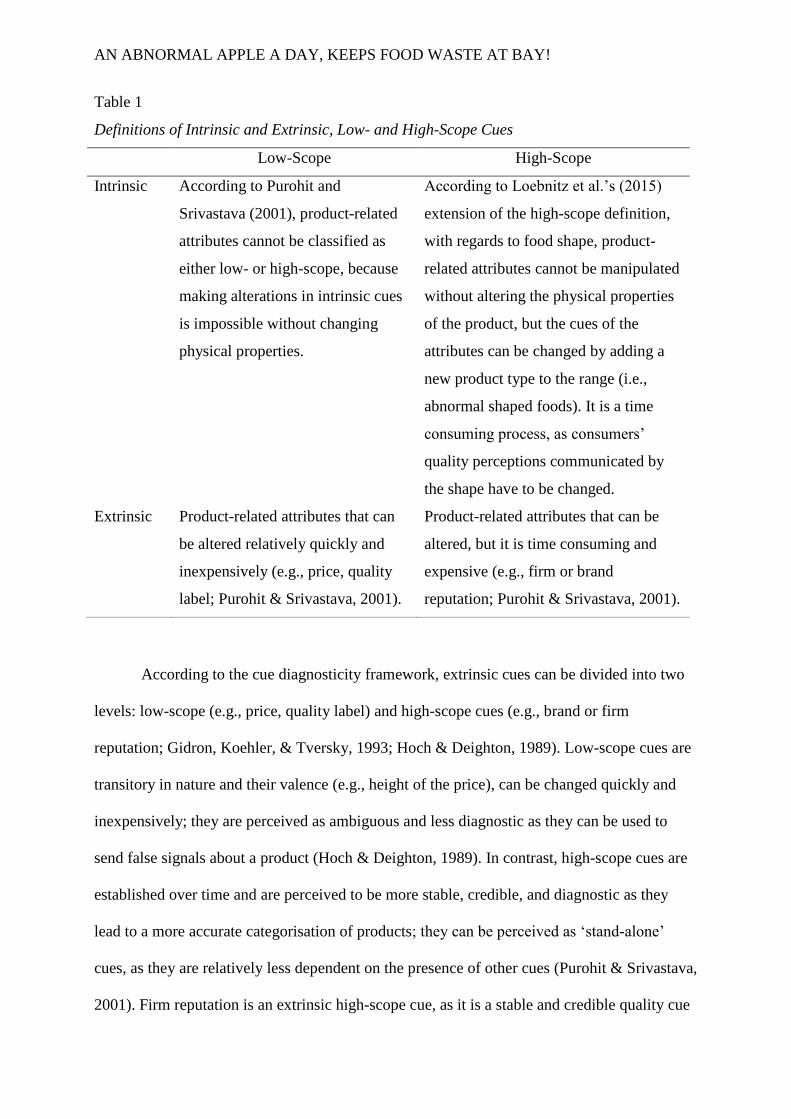
framework and Loebnitz et al.’s (2015) extension on the definition (see Table 1 for a
summary of the definitions).
Page 9
AN ABNORMAL APPLE A DAY, KEEPS FOOD WASTE AT BAY! 9
Table 1
Definitions of Intrinsic and Extrinsic, Low- and High-Scope Cues
Low-Scope High-Scope
Intrinsic According to Purohit and
Srivastava (2001), product-related
attributes cannot be classified as
either low- or high-scope, because
making alterations in intrinsic cues
is impossible without changing
physical properties.
According to Loebnitz et al.’s (2015)
extension of the high-scope definition,
with regards to food shape, product-
related attributes cannot be manipulated
without altering the physical properties
of the product, but the cues of the
attributes can be changed by adding a
new product type to the range (i.e.,
abnormal shaped foods). It is a time
consuming process, as consumers’
quality perceptions communicated by
the shape have to be changed.
Extrinsic Product-related attributes that can
be altered relatively quickly and
inexpensively (e.g., price, quality
label; Purohit & Srivastava, 2001).
Product-related attributes that can be
altered, but it is time consuming and
expensive (e.g., firm or brand
reputation; Purohit & Srivastava, 2001).
According to the cue diagnosticity framework, extrinsic cues can be divided into two
levels: low-scope (e.g., price, quality label) and high-scope cues (e.g., brand or firm
reputation; Gidron, Koehler, & Tversky, 1993; Hoch & Deighton, 1989). Low-scope cues are
transitory in nature and their valence (e.g., height of the price), can be changed quickly and
inexpensively; they are perceived as ambiguous and less diagnostic as they can be used to
send false signals about a product (Hoch & Deighton, 1989). In contrast, high-scope cues are
established over time and are perceived to be more stable, credible, and diagnostic as they
lead to a more accurate categorisation of products; they can be perceived as ‘stand-alone’
cues, as they are relatively less dependent on the presence of other cues (Purohit & Srivastava,
2001). Firm reputation is an extrinsic high-scope cue, as it is a stable and credible quality cue
Page 10
AN ABNORMAL APPLE A DAY, KEEPS FOOD WASTE AT BAY! 10
that is established over time and cannot be changed easily. Food shape is an intrinsic cue, and
therefore not a low- or high-scope cue, as shape cannot be changed without altering the food
itself (Purohit & Srivastava, 2001). However, Loebnitz et al. (2015) extended this definition
and argued that it can be considered a high-scope cue as well. Even though the food’s
physical appearance cannot be changed, retailers can include abnormal shaped foods, which
can slowly change consumers’ quality perception communicated by the shape.
Reputation is a signal of quality (Shapiro, 1982; 1983). Consumers perceive a firm
with a good reputation, as opposed to one with a poor reputation, to be more trustworthy and
credible which positively influences consumers’ quality perceptions (Boulding & Kirmani,
1993; Chen & Dubinsky, 2003). Just as with the shape of food, firm reputation is not
ambiguous in assigning a product to a particular quality category (Purohit & Srivastava,
2001): a product from a low quality firm is likely to be of a low quality and a product from a
high quality firm is likely to be of a high quality. Several studies examined the effect of firm
reputation and found that it positively influences consumers’ perceived product value (Dodds,
et al., 1991; Grewal et al., 1998) and intention to purchase a product (Buckley, 1991). Dodds
et al. (1991) combined the results of three studies that looked into the effect of extrinsic cues,
and suggested that retailer reputation, amongst price and brand name, is one of the most
important determinants of purchase intention. Similar results were found in the earlier study
by Jacoby et al. (1973) that looked at several products with visible differences in product
quality. Purohit and Srivastava (2001) examined the relation between a negative and a
positive high-scope cue (product with a low brand reputation, and high firm reputation) and
found that a firm with a high reputation played a dominant role and diminished the negative
effect of the product with a low brand reputation on purchase intention. This suggests that a
positive high-scope cue can be used to positively spill-over onto a negative high-scope cue.
Based on this, the following hypotheses are posed:
Page 11
AN ABNORMAL APPLE A DAY, KEEPS FOOD WASTE AT BAY! 11
H3a: Firms with a high reputation that sell normal shaped foods lead to similar
quality perceptions and consequently purchase intentions when compared to abnormal
shaped foods.
H3b: Firms with a low reputation that sell normal shaped foods lead to higher
quality perceptions and consequently stronger purchase intentions when compared to
abnormal shaped foods.
Figure 1. Conceptual model.
Method
Design
The study was conducted with an online experiment in order to establish a causal effect of
food shape and firm reputation on the perceived quality and purchase intention. The
experiment consisted out of a 2 (food shape: normal or abnormal) x 2 (firm reputation: low or
high) factorial between-subjects design.
Food Shape:
Normal vs.
Abnormal
Perceived
Food Quality
Purchase
Intention
Firm Reputation:
Low vs. High
H1
H2
H2
H3a,H3b
Page 12
AN ABNORMAL APPLE A DAY, KEEPS FOOD WASTE AT BAY! 12
Pilot Study
A pilot study was conducted in order to examine which two firms (low and high reputation)
should be included in the main experiment. Participants were informed that they cooperated in
a study about supermarket preferences (see Appendix A for the full pilot study). It consisted
out of several demographic questions and two questions that measured the firm’s reputation.
Firm reputation was measured on a two-items, seven-point Likert scale (strongly disagree [1]
to strongly agree [7]). The measures were adopted from Purohit and Srivastava’s (2001)
study. Participants were asked to indicate the extent to which they agree with the following
statements: “This is a supermarket one can trust” and “This supermarket has a reputation for
selling high-quality food products”. Participants who did not know a supermarket, were able
to choose the answer option ‘I do not know this supermarket’. These answers were made
missing before the analysis. All 26 supermarket chains in the Netherlands, as stated in
Distrifood (n.d.), were included in this study.
The pilot study was performed amongst 53 participants who currently lived in the
Netherlands and lived there for longer than one year. These requirements had to be met as
participants needed to be familiar with the firms and their reputations. Participants were
generally female (52.8%) as opposed to male (47.2%). The average age was 26 (M = 25.77,
SD = 8.89, Min = 18, Max = 71). 83% were Dutch, the remaining were Austrian (1.9%),
Bulgarian (1.9%), Canadian (1.9%), German (7.5%), Greek (1.9%) and Swiss (1.9%).
Eight supermarkets appeared to be most known: at least 92% of the participants knew
these firms. The ninth most known supermarket was known amongst 68% of the participants
and even fewer knew the remaining supermarkets. In order for firm reputation to have an
influence in the main study, participants should be familiar with the firm. Therefore, 92% was
taken as a cut-off point. A pearson correlation, factor and reliability analysis was conducted
on the items that measured firm reputation. Only the two supermarkets with the highest
Page 13
AN ABNORMAL APPLE A DAY, KEEPS FOOD WASTE AT BAY! 13
average on the reputation scale (Albert Heijn and Jumbo) and the two supermarkets with the
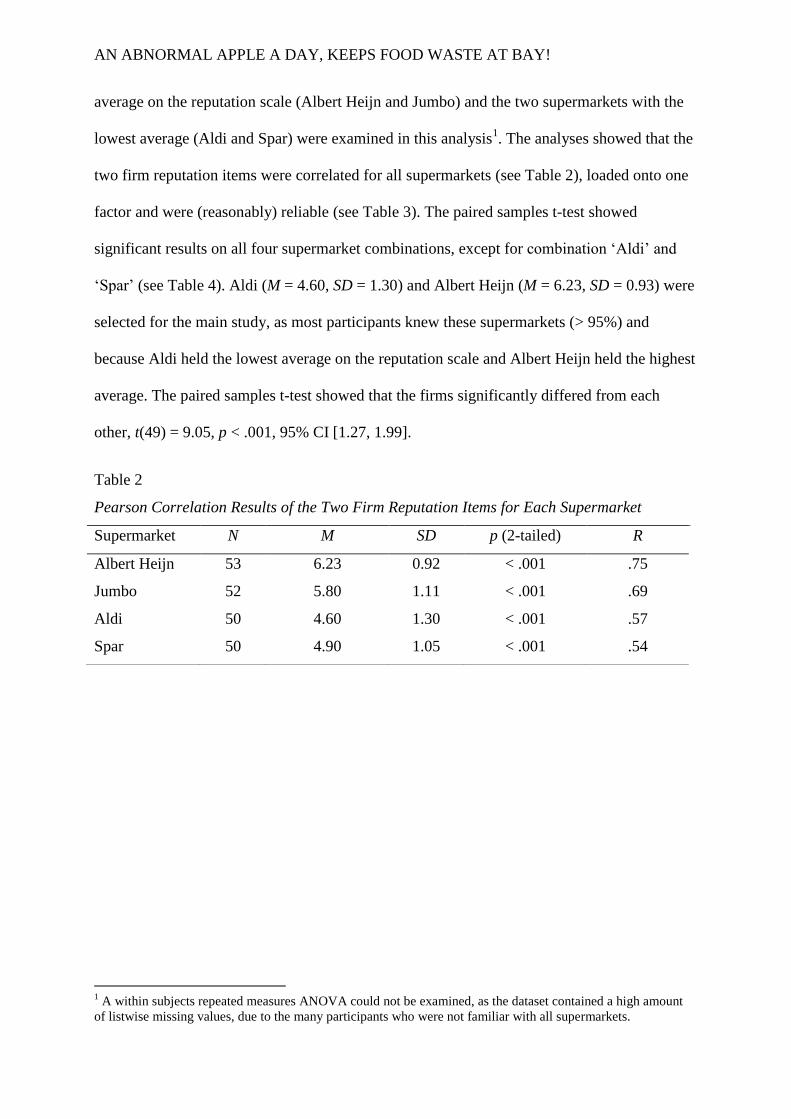
lowest average (Aldi and Spar) were examined in this analysis1. The analyses showed that the
two firm reputation items were correlated for all supermarkets (see Table 2), loaded onto one
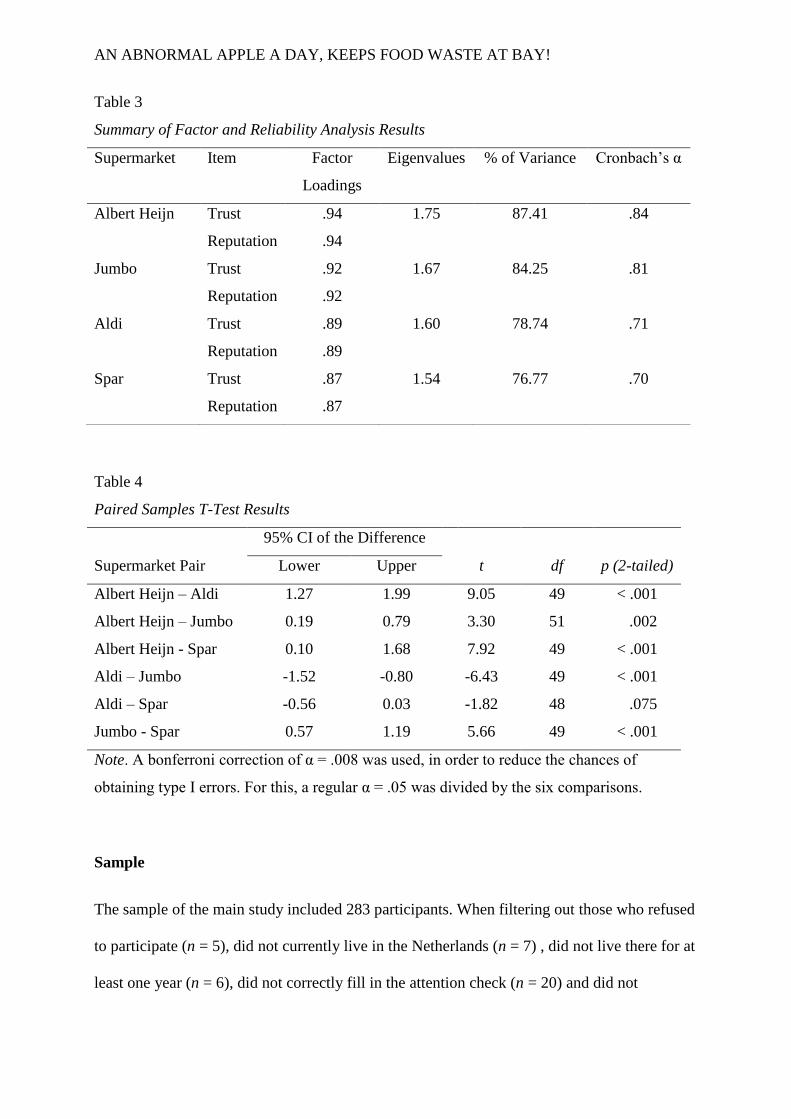
factor and were (reasonably) reliable (see Table 3). The paired samples t-test showed
significant results on all four supermarket combinations, except for combination ‘Aldi’ and
‘Spar’ (see Table 4). Aldi (M = 4.60, SD = 1.30) and Albert Heijn (M = 6.23, SD = 0.93) were
selected for the main study, as most participants knew these supermarkets (> 95%) and
because Aldi held the lowest average on the reputation scale and Albert Heijn held the highest
average. The paired samples t-test showed that the firms significantly differed from each
other, t(49) = 9.05, p < .001, 95% CI [1.27, 1.99].
Table 2
Pearson Correlation Results of the Two Firm Reputation Items for Each Supermarket
Supermarket N M SD p (2-tailed) R
Albert Heijn 53 6.23 0.92 < .001 .75
Jumbo 52 5.80 1.11 < .001 .69
Aldi 50 4.60 1.30 < .001 .57
Spar 50 4.90 1.05 < .001 .54
1 A within subjects repeated measures ANOVA could not be examined, as the dataset contained a high amount
of listwise missing values, due to the many participants who were not familiar with all supermarkets.
Page 14
AN ABNORMAL APPLE A DAY, KEEPS FOOD WASTE AT BAY! 14
Table 3
Summary of Factor and Reliability Analysis Results
Supermarket Item Factor
Loadings
Eigenvalues % of Variance Cronbach’s α
Albert Heijn Trust
Reputation
.94
.94
1.75 87.41 .84
Jumbo Trust
Reputation
.92
.92
1.67 84.25 .81
Aldi Trust
Reputation
.89
.89
1.60 78.74 .71
Spar Trust
Reputation
.87
.87
1.54 76.77 .70
Table 4
Paired Samples T-Test Results
95% CI of the Difference
Supermarket Pair Lower Upper t df p (2-tailed)
Albert Heijn – Aldi 1.27 1.99 9.05 49 < .001
Albert Heijn – Jumbo 0.19 0.79 3.30 51 .002
Albert Heijn - Spar 0.10 1.68 7.92 49 < .001
Aldi – Jumbo -1.52 -0.80 -6.43 49 < .001
Aldi – Spar -0.56 0.03 -1.82 48 .075
Jumbo - Spar 0.57 1.19 5.66 49 < .001
Note. A bonferroni correction of α = .008 was used, in order to reduce the chances of
obtaining type I errors. For this, a regular α = .05 was divided by the six comparisons.
Sample
The sample of the main study included 283 participants. When filtering out those who refused
to participate (n = 5), did not currently live in the Netherlands (n = 7) , did not live there for at
least one year (n = 6), did not correctly fill in the attention check (n = 20) and did not
Page 15
AN ABNORMAL APPLE A DAY, KEEPS FOOD WASTE AT BAY! 15
remember the supermarket (n = 30), the sample dropped down to 214 participants (see
Appendix B for the demographics). Participants needed to live in the Netherlands for at least
one year, so they would be familiar with the supermarkets included in this study and their
reputations.
Participants were collected through a convenience sample and were approached
through social media (e.g., Facebook, WhatsApp; 59.3%), face-to-face contact (35%) or a
telephone conversation (5.6%). This study controlled if the type of approach had an influence
on perceived quality and purchase intention. Participants were also collected through a
snowball sample; participants who cooperated in the study were asked to send the study to
their friends, colleagues and/or family members.
Participants were generally female (63.1%) as opposed to male (36.9%). The average
age was 25 (M = 25.49, SD = 8.89, Min = 18, Max = 72). 81.3% were Dutch and 6.1% were
German; the remaining 12.6% consisted of a variety of other nationalities. Regarding the
highest completed level of education, 39.7% had a bachelor’s degree, 31.3% a high school
degree, 15% a master’s degree, 9.3% did some college and did not receive a degree, 4.2% had
an associate degree and 0.5% had less than a high school degree. Generally, participants
understood the English vocabulary used in the study well to extremely well (M = 6.47, SD =
0.82). This study controlled if participants’ English proficiency had an influence on perceived
quality and purchase intention.
Procedure and Stimuli
Participants were informed that they would be participating in a study about food preferences
(see Appendix C for the main study). They were able to cooperate in the study with the URL
provided. After reading the factsheet (see Appendix D) and accepting the informed consent
(see Appendix E), participants could start the study. Participants who did not accept the
informed consent, were sent to the end of the study. Those who agreed to participate, were
Page 16
AN ABNORMAL APPLE A DAY, KEEPS FOOD WASTE AT BAY! 16
asked about their country of residence. Participants who did not reside in the Netherlands (at
the moment of the study) or did not live in the Netherlands for longer than one year, were sent
to the end of the study. Those who did continue, were asked how they were approached to
participate in the study and several demographic questions. Participants were then randomly
distributed to see one of the four conditions: normal shaped foods from a low reputation firm,
normal shaped foods from a high reputation firm, abnormal shaped foods from a low
reputation firm or abnormal shaped foods from a high reputation firm (see Table 5 for an
overview of the foods).
In every condition, the supermarket that sold the foods was specified in a text.
Participants were told to imagine they were doing their groceries at either Aldi or Albert
Heijn. They were told that they are wanting to purchase an apple, a carrot, a lemon and an
aubergine and when they walk down the aisle looking for these products, they see the foods
that were displayed in the study. This study builds forward on Loebnitz and Grunert’s (2014)
and Loebnitz et al.’s (2015) study, therefore the same food products were used2. These foods
were perceived as products that are domestically produced (apple and carrot) and imported
(lemon and aubergine). Only extremely abnormal shaped foods were examined, as this type of
deviation is the most preferred abnormality (De Hooge et al., 2016) and as Loebnitz et al.
(2015) only found a significant difference for normal and extremely abnormal shaped foods
on purchase intention and not for moderately abnormal shaped foods. The images used by
Loebnitz and Grunert (2014) and Loebnitz et al. (2015) were constructed by the commercial
photographer Uli Westphal and were designed to be similar in size and pixels, to minimise
any extraneous variance in the results. The images provided real examples of naturally
occurring abnormalities. To ensure that the resulting images controlled for all factors except
shape, each image was required to show no abnormalities based on colour (i.e., shades, colour
2 Permission for usage of the stimuli was granted by Natascha Loebnitz, author of both studies.
Page 17
AN ABNORMAL APPLE A DAY, KEEPS FOOD WASTE AT BAY! 17
of fruit), size, or damage, and all images provided a full frontal view. Participants had to look
at the displayed foods and supermarket firm for at least 10 seconds, for which a timer was
used.
Afterwards participants answered several questions that measured purchase intention,
perceived quality and their attention to the study. Following this were the manipulation
checks and a question concerning English proficiency. Afterwards, the debriefing (see
Appendix F) was shown. After continuing, they were sent to the end of the survey.
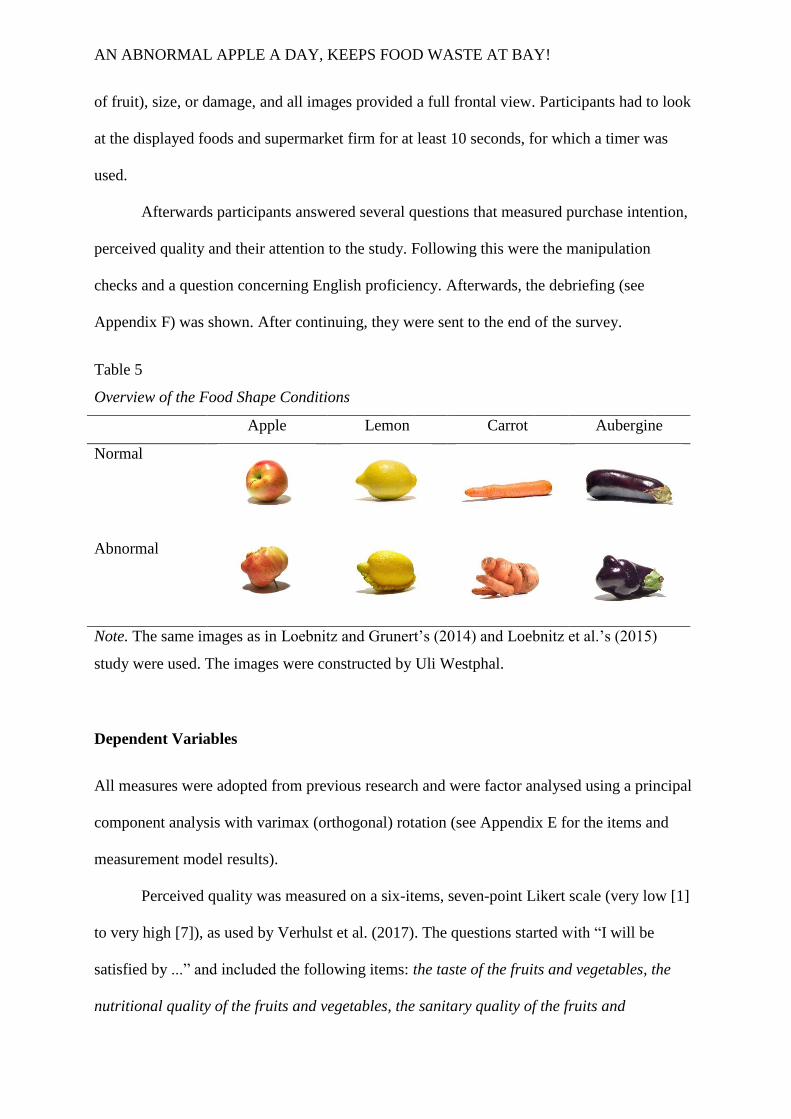
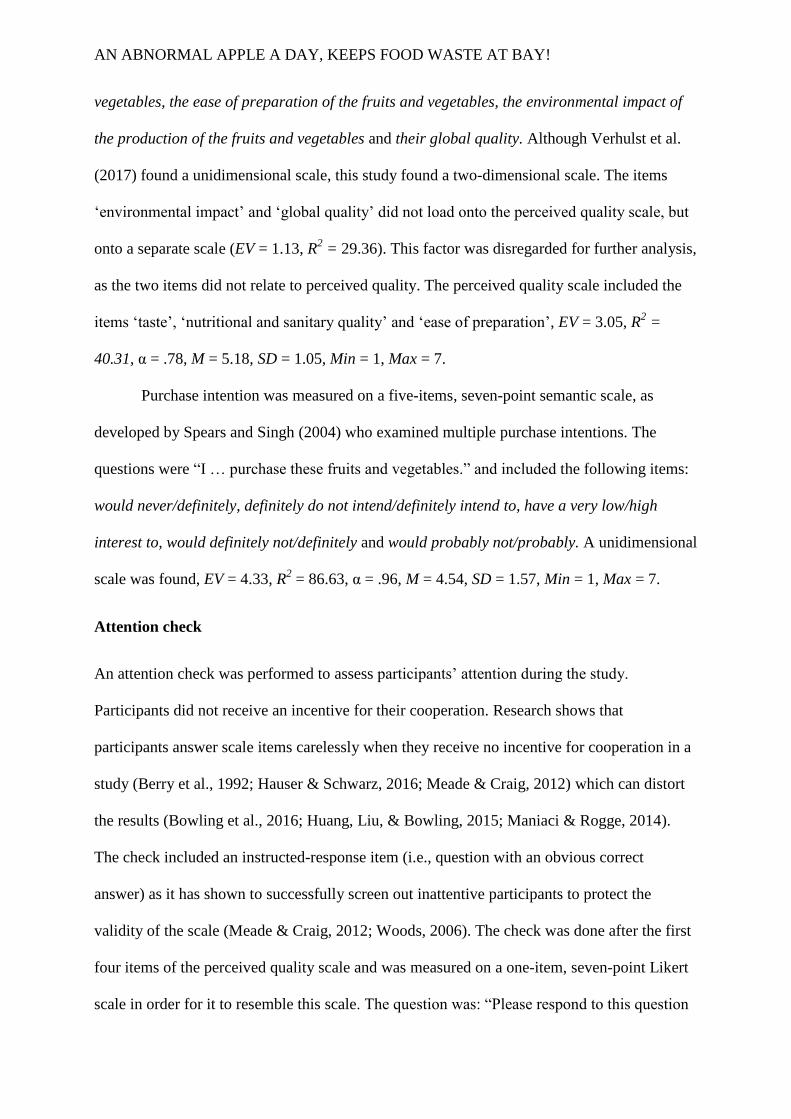
Table 5
Overview of the Food Shape Conditions
Apple Lemon Carrot Aubergine
Normal
Abnormal
Note. The same images as in Loebnitz and Grunert’s (2014) and Loebnitz et al.’s (2015)
study were used. The images were constructed by Uli Westphal.
Dependent Variables
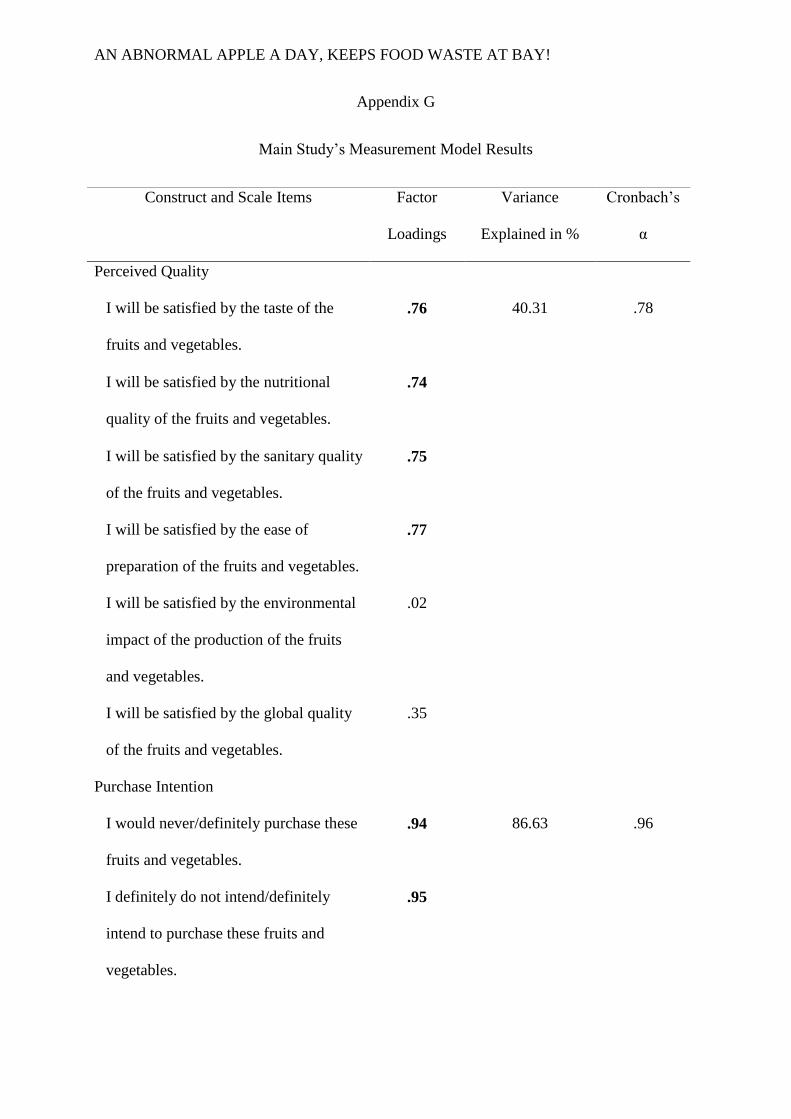
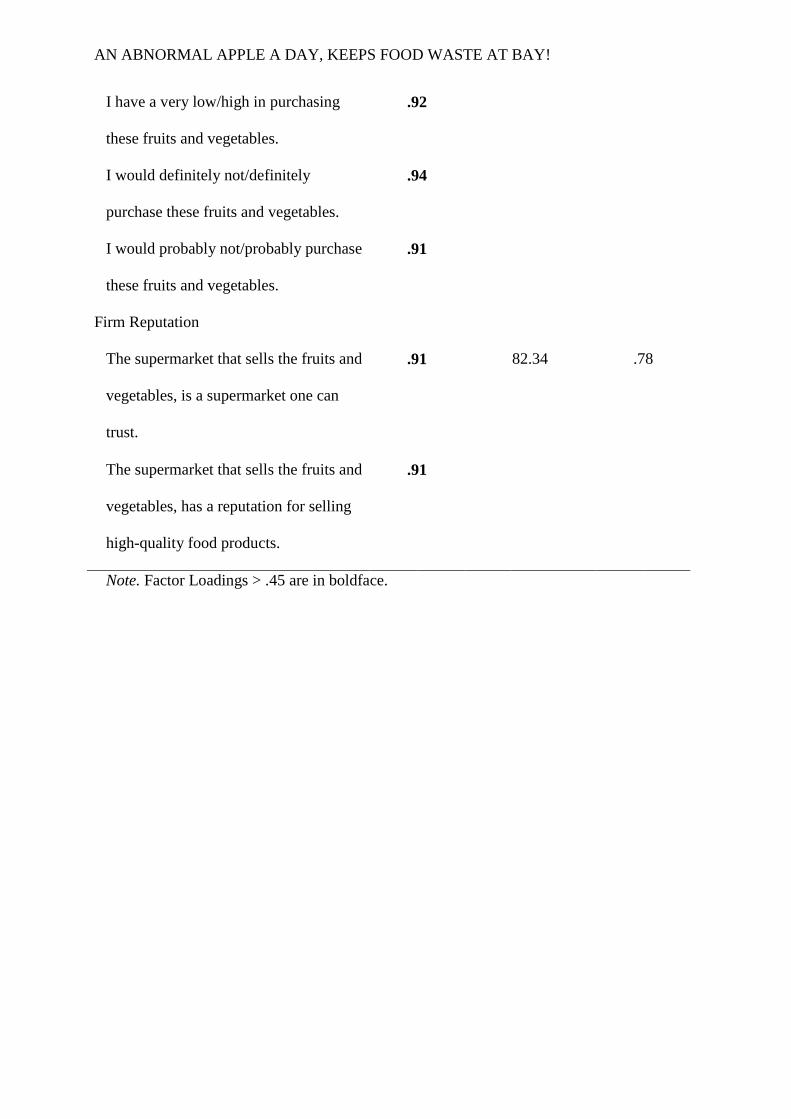
All measures were adopted from previous research and were factor analysed using a principal
component analysis with varimax (orthogonal) rotation (see Appendix E for the items and
measurement model results).
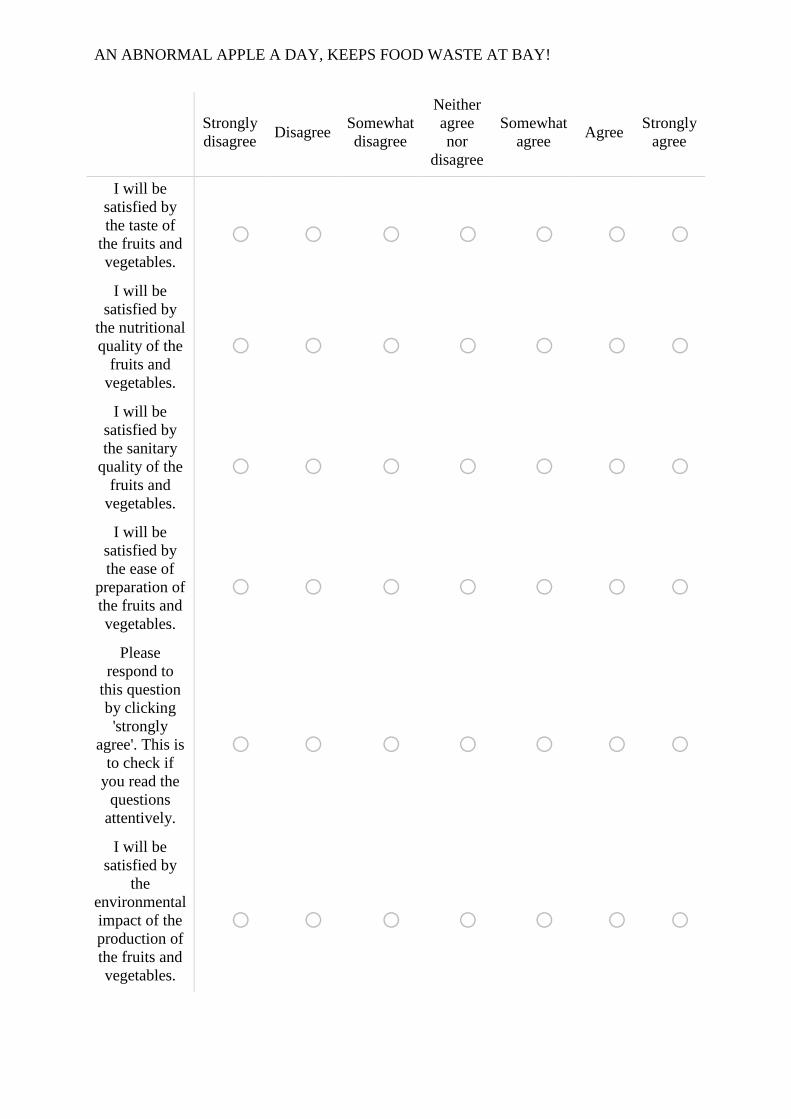
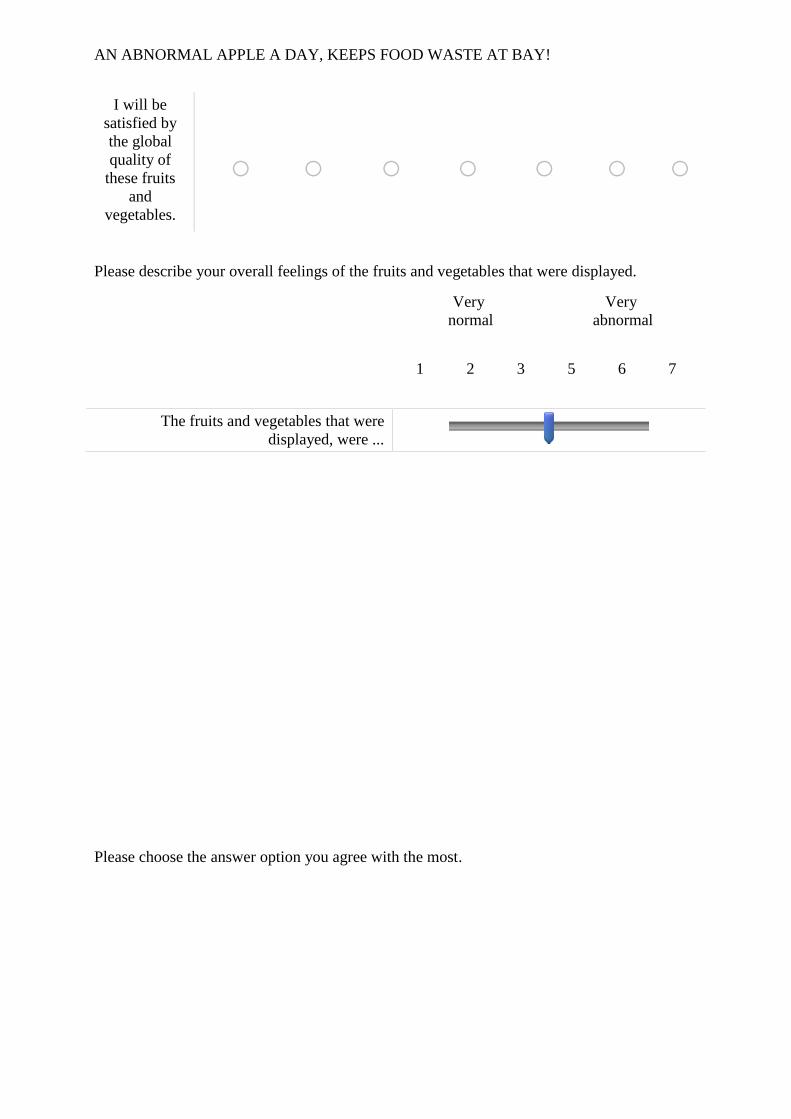
Perceived quality was measured on a six-items, seven-point Likert scale (very low [1]
to very high [7]), as used by Verhulst et al. (2017). The questions started with “I will be
satisfied by ...” and included the following items: the taste of the fruits and vegetables, the
nutritional quality of the fruits and vegetables, the sanitary quality of the fruits and
Page 18
AN ABNORMAL APPLE A DAY, KEEPS FOOD WASTE AT BAY! 18
vegetables, the ease of preparation of the fruits and vegetables, the environmental impact of
the production of the fruits and vegetables and their global quality. Although Verhulst et al.
(2017) found a unidimensional scale, this study found a two-dimensional scale. The items
‘environmental impact’ and ‘global quality’ did not load onto the perceived quality scale, but
onto a separate scale (EV = 1.13, R2 = 29.36). This factor was disregarded for further analysis,
as the two items did not relate to perceived quality. The perceived quality scale included the
items ‘taste’, ‘nutritional and sanitary quality’ and ‘ease of preparation’, EV = 3.05, R2 =
40.31, α = .78, M = 5.18, SD = 1.05, Min = 1, Max = 7.
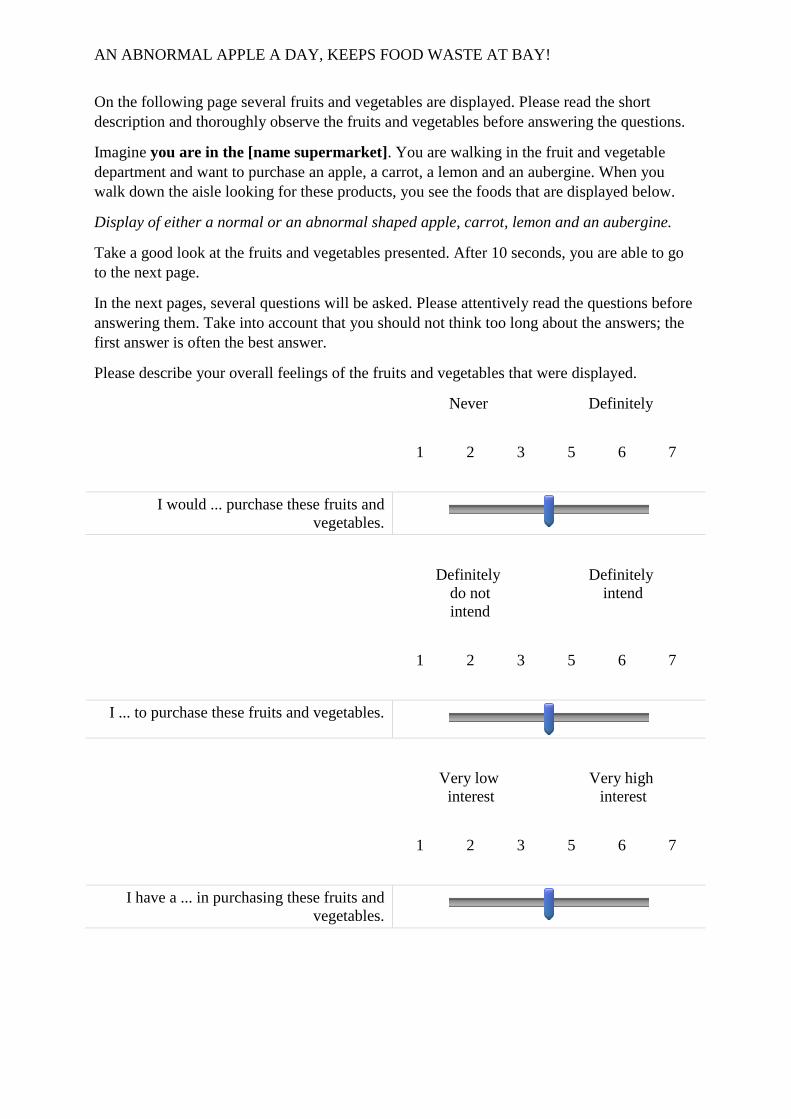
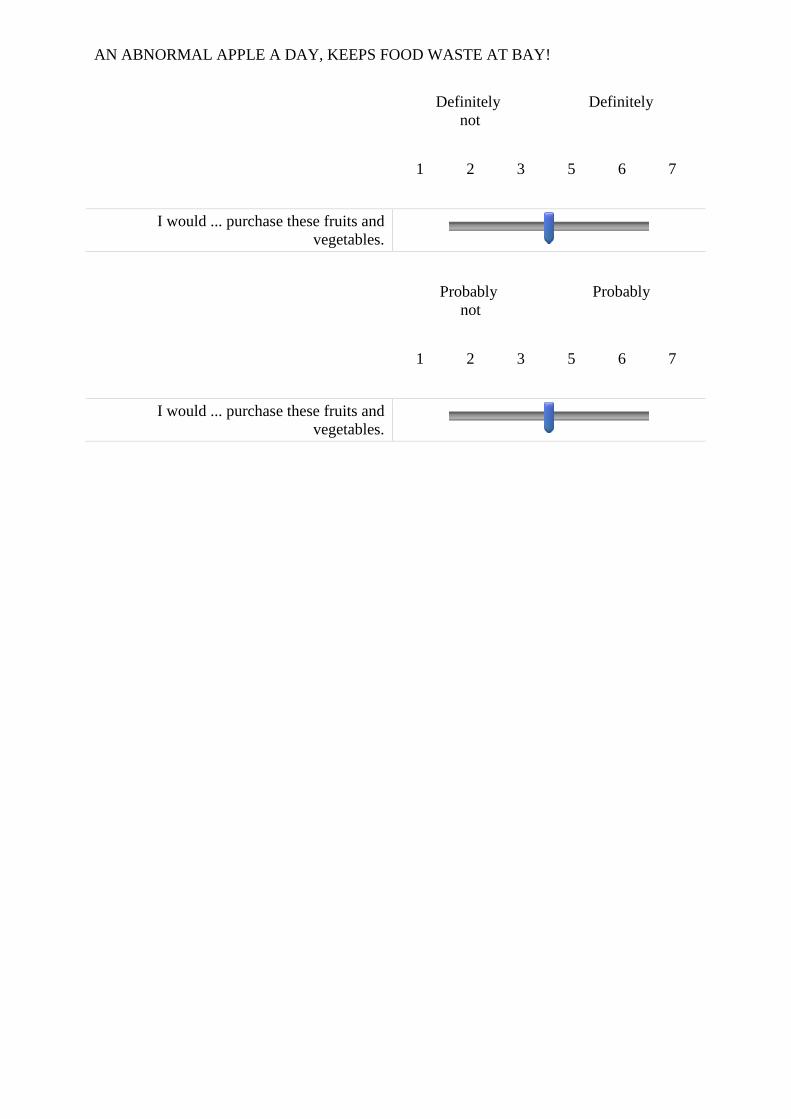
Purchase intention was measured on a five-items, seven-point semantic scale, as
developed by Spears and Singh (2004) who examined multiple purchase intentions. The
questions were “I … purchase these fruits and vegetables.” and included the following items:
would never/definitely, definitely do not intend/definitely intend to, have a very low/high
interest to, would definitely not/definitely and would probably not/probably. A unidimensional
scale was found, EV = 4.33, R2 = 86.63, α = .96, M = 4.54, SD = 1.57, Min = 1, Max = 7.
Attention check
An attention check was performed to assess participants’ attention during the study.
Participants did not receive an incentive for their cooperation. Research shows that
participants answer scale items carelessly when they receive no incentive for cooperation in a
study (Berry et al., 1992; Hauser & Schwarz, 2016; Meade & Craig, 2012) which can distort
the results (Bowling et al., 2016; Huang, Liu, & Bowling, 2015; Maniaci & Rogge, 2014).
The check included an instructed-response item (i.e., question with an obvious correct
answer) as it has shown to successfully screen out inattentive participants to protect the
validity of the scale (Meade & Craig, 2012; Woods, 2006). The check was done after the first
four items of the perceived quality scale and was measured on a one-item, seven-point Likert
scale in order for it to resemble this scale. The question was: “Please respond to this question
Page 19
AN ABNORMAL APPLE A DAY, KEEPS FOOD WASTE AT BAY! 19
by clicking ‘strongly agree’”. Participants who did not choose for the answer option ‘strongly
agree’, were regarded as inattentive and filtered out before analysing the results.
Manipulation Check
The images were subjected to a manipulation check to verify the distinctions amongst normal
and abnormal shaped foods. Participants were asked how normal the depicted fruits and
vegetables appeared on a one-item, seven-point Likert scale (very normal [1] to very
abnormal [7]; Loebnitz et al., 2015), M = 3.64, SD = 1.99, Min = 1, Max = 7.
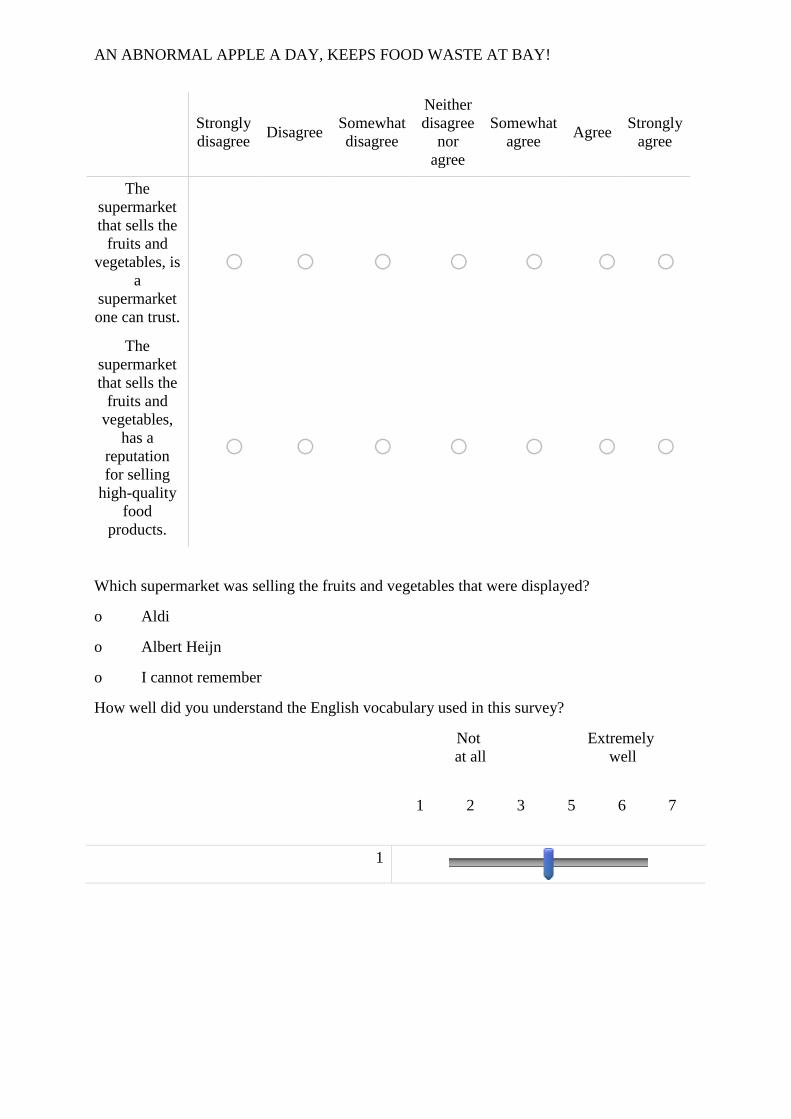
Participant’s perceptions about firm reputation were measured on a two-items, seven-
point Likert scale (strongly disagree [1] to strongly agree [7]). The manipulation check used
the same scale for firm reputation as the pilot study. The principal component analysis with
varimax (orthogonal) rotation showed a unidimensional scale, EV = 1.65, R2 = 82.34, α = .78,
M = 4.63, SD = 1.34, Min = 1, Max = 7.
In order to check if participants were aware of the firm they were exposed to,
participants were asked which supermarket sold the foods. The answer options were ‘Aldi’,
‘Albert Heijn’ and ‘I cannot remember’.
Results
Randomisation Check
A randomisation check was performed for gender and age. The chi-squared test showed no
significant differences between the conditions for gender, χ2(3) = 5.68, p = .128. The one-way
ANOVA demonstrated no significant differences between the conditions for age, F(3, 210) =
1.02, p = .384, 95% CI [-0.96, 0.71]3.
3 Levene’s test indicated unequal variances, F(3, 210) = 4.08, p = .008. The groups were still perceived as
homogeneous, as the largest group was not 10% bigger than the smallest group.
Page 20
AN ABNORMAL APPLE A DAY, KEEPS FOOD WASTE AT BAY! 20
Control Variables Check
A pearson correlation was performed for gender, age, received degree, type of approach and
English proficiency to control for a correlation with perceived quality and purchase intention.
Although no significant correlation was found for gender and perceived quality (R = .99, p =
.148), one was found for purchase intention (R = .21, p = .002). Therefore, gender was
controlled for in the hypothesis testing. Age was also controlled for in the hypothesis testing,
as a significant correlation was found for perceived quality (R = .14, p = .047) and purchase
intention (R = .15, p = .027). Received degree was controlled for, as a significant correlation
was found for perceived quality (R = .14, p = .035) and purchase intention (R = .18, p = .010).
The type of approach was not controlled for, as no significant correlation was found for
perceived quality (R = -.09, p = .188) and purchase intention (R = -.11, p = .108). English
proficiency was not controlled for either, as no significant correlation was found for perceived
quality (R = .07, p = .312) and purchase intention (R = .04, p = .555).
Manipulation Check
A two-way ANOVA was performed to assess if participants perceived the foods as
normal/abnormal and if participants perceived the firm as one with a low/high reputation.
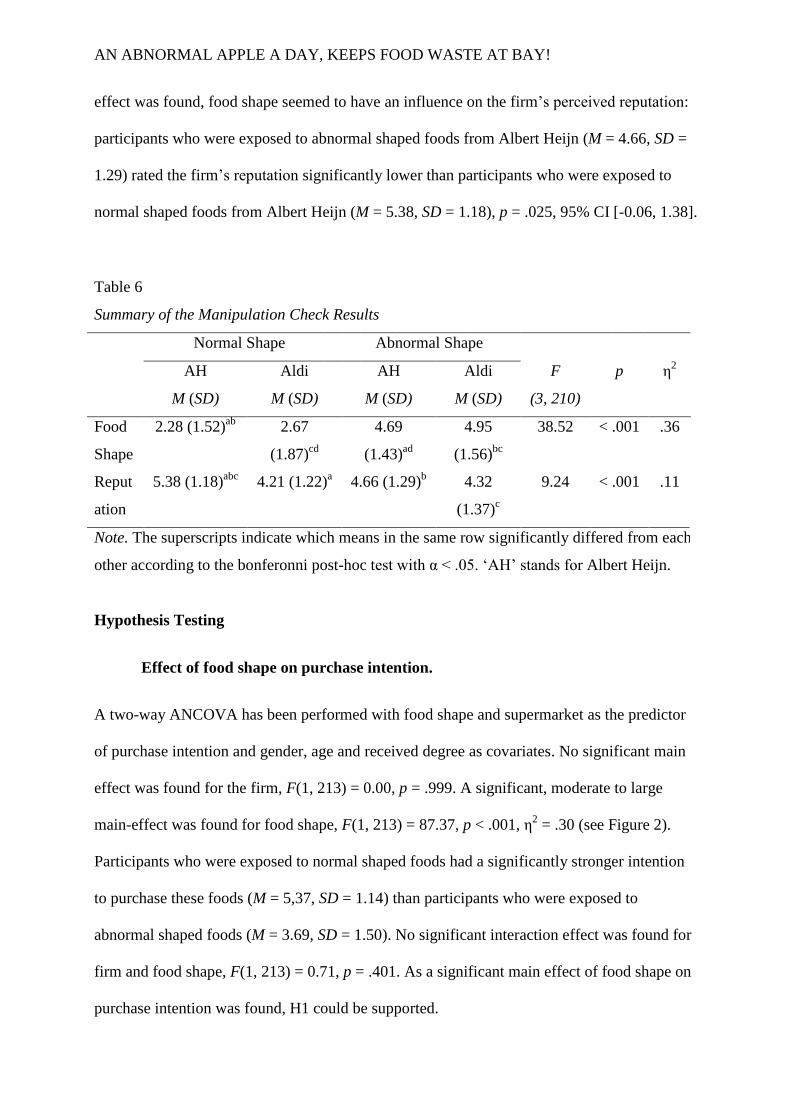
Both manipulation checks appeared to be statistically successful (see Table 6 for an overview
of the results). A significant, large effect was found for food shape, F(3, 210) = 38.52, p <
.001, η2 = .36
4. Participants who were exposed to normal shaped foods from Aldi (M = 2.67,
SD = 1.87) and Albert Heijn (M = 2.28, SD = 1.52) generally perceived the foods as more
normal than participants who were exposed to abnormal shaped foods from Aldi (M = 4.95,
SD = 1.56) and Albert Heijn (M = 4.69, SD = 1.43). A significant, moderate effect was found
for the reputation of the firm, F(3, 210) = 9.24, p < .001, η2 = .12
5. Although a significant
4 Levene’s test indicated equal variances, F(3, 210) = 1.58, p = .195.
5 Levene’s test indicated equal variances, F(3, 210) = 0.77, p = .515.
Page 21
AN ABNORMAL APPLE A DAY, KEEPS FOOD WASTE AT BAY! 21
effect was found, food shape seemed to have an influence on the firm’s perceived reputation:
participants who were exposed to abnormal shaped foods from Albert Heijn (M = 4.66, SD =
1.29) rated the firm’s reputation significantly lower than participants who were exposed to
normal shaped foods from Albert Heijn (M = 5.38, SD = 1.18), p = .025, 95% CI [-0.06, 1.38].
Table 6
Summary of the Manipulation Check Results
Normal Shape Abnormal Shape
AH
M (SD)
Aldi
M (SD)
AH
M (SD)
Aldi
M (SD)
F
(3, 210)
p η2
Food
Shape
2.28 (1.52)ab
2.67
(1.87)cd
4.69
(1.43)ad
4.95
(1.56)bc
38.52 < .001 .36
Reput
ation
5.38 (1.18)abc
4.21 (1.22)a
4.66 (1.29)b
4.32
(1.37)c
9.24 < .001 .11
Note. The superscripts indicate which means in the same row significantly differed from each
other according to the bonferonni post-hoc test with α < .05. ‘AH’ stands for Albert Heijn.
Hypothesis Testing
Effect of food shape on purchase intention.
A two-way ANCOVA has been performed with food shape and supermarket as the predictor
of purchase intention and gender, age and received degree as covariates. No significant main
effect was found for the firm, F(1, 213) = 0.00, p = .999. A significant, moderate to large
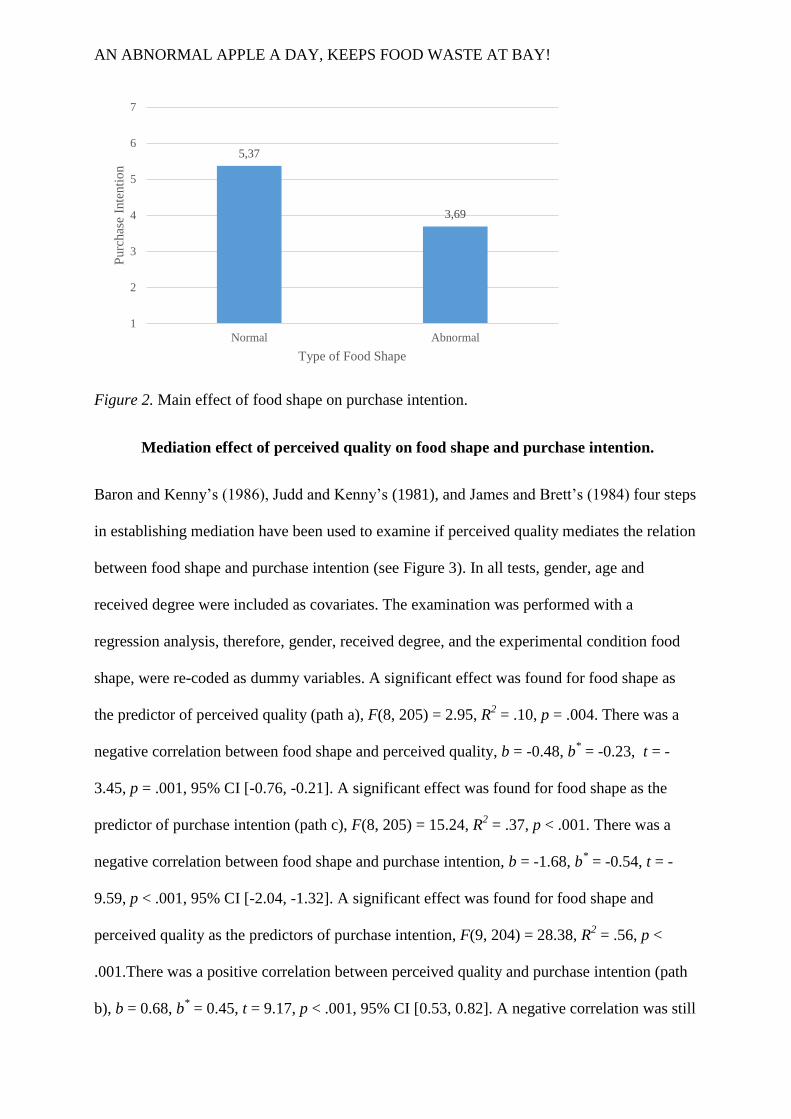
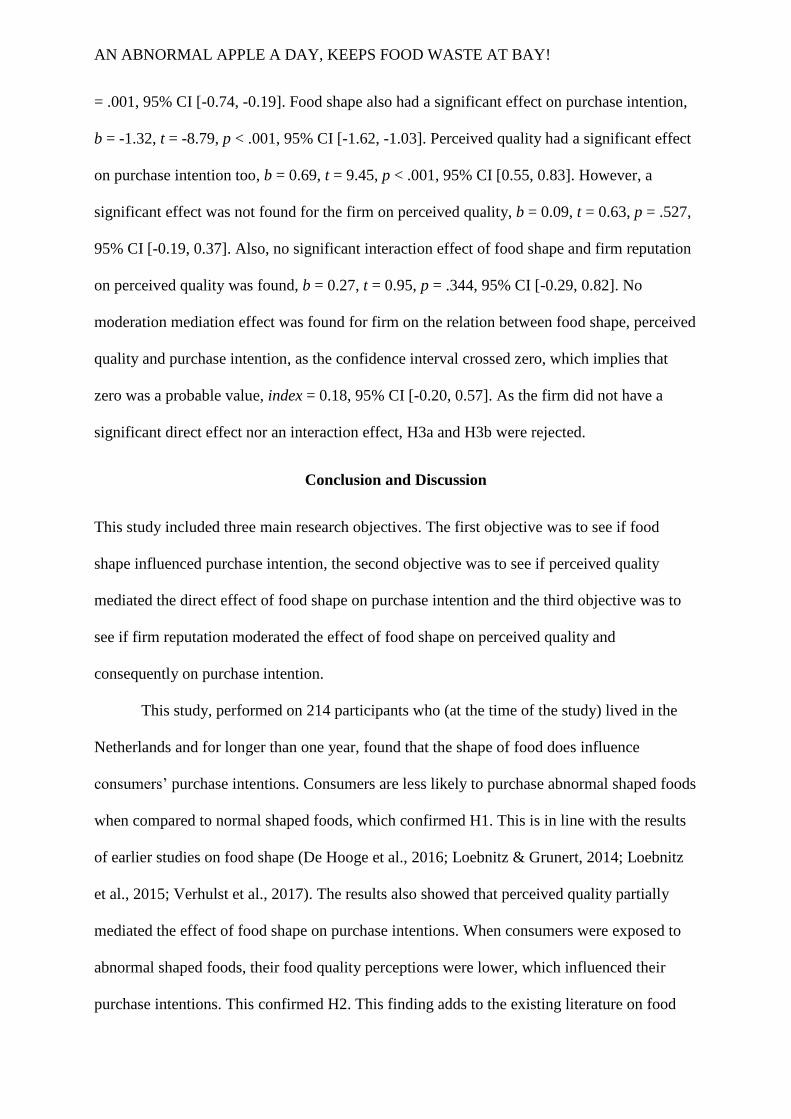
main-effect was found for food shape, F(1, 213) = 87.37, p < .001, η2 = .30 (see Figure 2).
Participants who were exposed to normal shaped foods had a significantly stronger intention
to purchase these foods (M = 5,37, SD = 1.14) than participants who were exposed to
abnormal shaped foods (M = 3.69, SD = 1.50). No significant interaction effect was found for
firm and food shape, F(1, 213) = 0.71, p = .401. As a significant main effect of food shape on
purchase intention was found, H1 could be supported.
Page 22
AN ABNORMAL APPLE A DAY, KEEPS FOOD WASTE AT BAY! 22
Figure 2. Main effect of food shape on purchase intention.
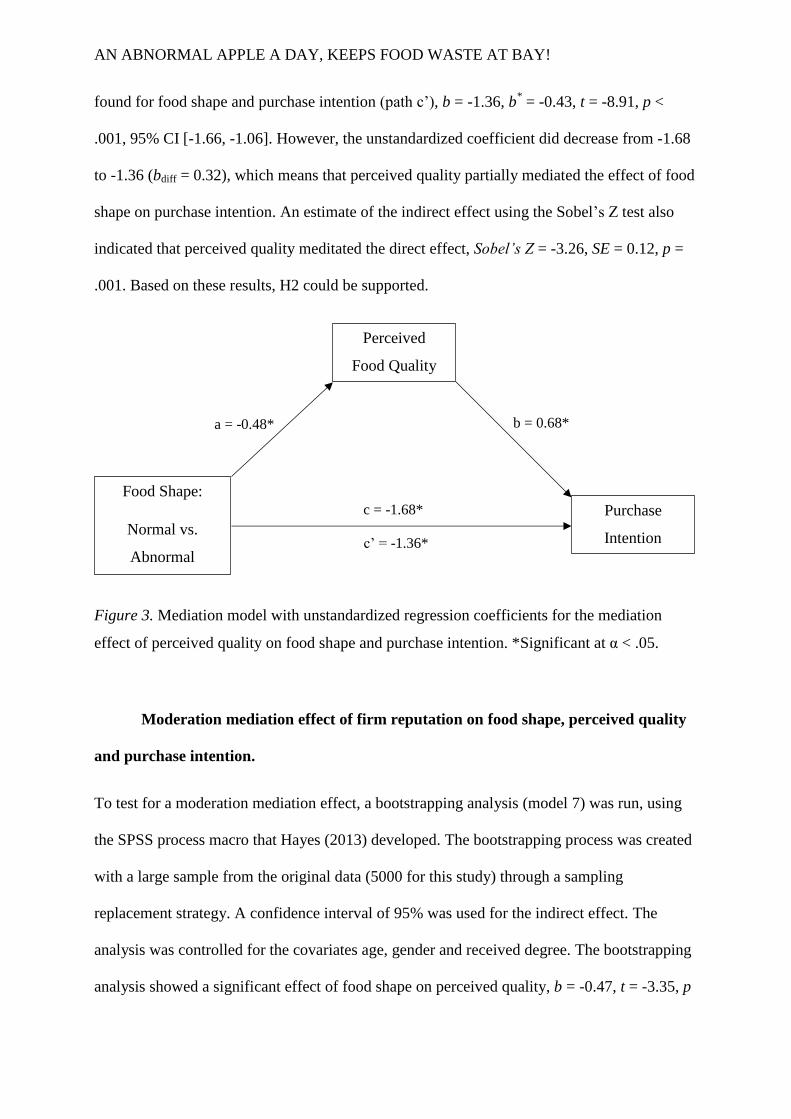
Mediation effect of perceived quality on food shape and purchase intention.
Baron and Kenny’s (1986), Judd and Kenny’s (1981), and James and Brett’s (1984) four steps
in establishing mediation have been used to examine if perceived quality mediates the relation
between food shape and purchase intention (see Figure 3). In all tests, gender, age and
received degree were included as covariates. The examination was performed with a
regression analysis, therefore, gender, received degree, and the experimental condition food
shape, were re-coded as dummy variables. A significant effect was found for food shape as
the predictor of perceived quality (path a), F(8, 205) = 2.95, R2 = .10, p = .004. There was a
negative correlation between food shape and perceived quality, b = -0.48, b* = -0.23, t = -
3.45, p = .001, 95% CI [-0.76, -0.21]. A significant effect was found for food shape as the
predictor of purchase intention (path c), F(8, 205) = 15.24, R2 = .37, p < .001. There was a
negative correlation between food shape and purchase intention, b = -1.68, b* = -0.54, t = -
9.59, p < .001, 95% CI [-2.04, -1.32]. A significant effect was found for food shape and
perceived quality as the predictors of purchase intention, F(9, 204) = 28.38, R2 = .56, p <
.001.There was a positive correlation between perceived quality and purchase intention (path
b), b = 0.68, b* = 0.45, t = 9.17, p < .001, 95% CI [0.53, 0.82]. A negative correlation was still
5,37
3,69
1
2
3
4
5
6
7
Normal Abnormal
Purc
has
e In
tenti
on
Type of Food Shape
Page 23
AN ABNORMAL APPLE A DAY, KEEPS FOOD WASTE AT BAY! 23
found for food shape and purchase intention (path c’), b = -1.36, b* = -0.43, t = -8.91, p <
.001, 95% CI [-1.66, -1.06]. However, the unstandardized coefficient did decrease from -1.68
to -1.36 (bdiff = 0.32), which means that perceived quality partially mediated the effect of food
shape on purchase intention. An estimate of the indirect effect using the Sobel’s Z test also
indicated that perceived quality meditated the direct effect, Sobel’s Z = -3.26, SE = 0.12, p =
.001. Based on these results, H2 could be supported.
Figure 3. Mediation model with unstandardized regression coefficients for the mediation
effect of perceived quality on food shape and purchase intention. *Significant at α < .05.
Moderation mediation effect of firm reputation on food shape, perceived quality
and purchase intention.
To test for a moderation mediation effect, a bootstrapping analysis (model 7) was run, using
the SPSS process macro that Hayes (2013) developed. The bootstrapping process was created
with a large sample from the original data (5000 for this study) through a sampling
replacement strategy. A confidence interval of 95% was used for the indirect effect. The
analysis was controlled for the covariates age, gender and received degree. The bootstrapping
analysis showed a significant effect of food shape on perceived quality, b = -0.47, t = -3.35, p
Food Shape:
Normal vs.
Abnormal
Perceived
Food Quality
Purchase
Intention
c = -1.68*
b = 0.68* a = -0.48*
c’ = -1.36*
Page 24
AN ABNORMAL APPLE A DAY, KEEPS FOOD WASTE AT BAY! 24
= .001, 95% CI [-0.74, -0.19]. Food shape also had a significant effect on purchase intention,
b = -1.32, t = -8.79, p < .001, 95% CI [-1.62, -1.03]. Perceived quality had a significant effect
on purchase intention too, b = 0.69, t = 9.45, p < .001, 95% CI [0.55, 0.83]. However, a
significant effect was not found for the firm on perceived quality, b = 0.09, t = 0.63, p = .527,
95% CI [-0.19, 0.37]. Also, no significant interaction effect of food shape and firm reputation
on perceived quality was found, b = 0.27, t = 0.95, p = .344, 95% CI [-0.29, 0.82]. No
moderation mediation effect was found for firm on the relation between food shape, perceived
quality and purchase intention, as the confidence interval crossed zero, which implies that
zero was a probable value, index = 0.18, 95% CI [-0.20, 0.57]. As the firm did not have a
significant direct effect nor an interaction effect, H3a and H3b were rejected.
Conclusion and Discussion
This study included three main research objectives. The first objective was to see if food
shape influenced purchase intention, the second objective was to see if perceived quality
mediated the direct effect of food shape on purchase intention and the third objective was to
see if firm reputation moderated the effect of food shape on perceived quality and
consequently on purchase intention.
This study, performed on 214 participants who (at the time of the study) lived in the
Netherlands and for longer than one year, found that the shape of food does influence
consumers’ purchase intentions. Consumers are less likely to purchase abnormal shaped foods
when compared to normal shaped foods, which confirmed H1. This is in line with the results
of earlier studies on food shape (De Hooge et al., 2016; Loebnitz & Grunert, 2014; Loebnitz
et al., 2015; Verhulst et al., 2017). The results also showed that perceived quality partially
mediated the effect of food shape on purchase intentions. When consumers were exposed to
abnormal shaped foods, their food quality perceptions were lower, which influenced their
purchase intentions. This confirmed H2. This finding adds to the existing literature on food
Page 25
AN ABNORMAL APPLE A DAY, KEEPS FOOD WASTE AT BAY! 25
shape. Although Verhulst et al. (2017) found a negative effect of food shape on perceived
quality as well, consumer’s purchase intention was not examined and therefore no mediation
analysis could be performed. The results for the third research objective showed that firm
reputation did not moderate the direct and indirect effect, which implies that a high firm
reputation cannot eliminate the negative effect of abnormal shaped foods on perceived quality
and purchase intention. This means that H3a and H3b were rejected. Although an effect was
expected, it does add to the existing scientific knowledge that a high firm reputation cannot be
used in order to generate an increase in sales for abnormal shaped foods.
The insignificant effect of firm reputation can be explained by the manipulation check.
Although the manipulation check was significant, the bonferonni post-hoc test showed that
food shape had an influence on firm reputation: when Albert Heijn sold normal shaped foods
it had a significantly higher reputation than when it sold abnormal shaped foods. This implies
that foods of a lower perceived quality negatively influences the firm’s reputation. Retailers
with a high reputation may learn from this. For these retailers, it would be recommended to
not supply products that are of too low a perceived quality, as it can damage their high
reputation.
Another reason for the insignificant effect of the firm could be the activation of
negatively loaded perceptions, such as higher price perceptions. Several studies on brand
reputation – which is similar to firm reputation, as they are both high-scope cues (Boulding &
Kirmani, 1993) – found a positive relationship between a high firm reputation and a high
price perception (Bearden, Lichtenstein, & Teel, 1984; Biswas, Wilson, & Licata, 1993).
Studies show that consumers form an internal reference price scale based on their past
experiences with the firm (Monroe, Grewal, & Compeau, 1991): when a firm reputation is
high compared to low, consumers perceive a product to be sold for a higher price. Consumers
however, are found to want a price discount for purchasing abnormal shaped foods (Verghese,
Page 26
AN ABNORMAL APPLE A DAY, KEEPS FOOD WASTE AT BAY! 26
Lewis, Lockrey, & Williams, 2013). This suggests that consumers are less likely to purchase
abnormal foods when they perceive the price as high, which could be the reason why the firm
did not moderate the effect. Future research on food shape should measure price perception in
order to assess if a high firm reputation instigates higher price perceptions than a low firm
reputation.
Limitations and Future Research
As with any study, this research has some limitations, which provide possibilities for future
research. Firstly, this study adopted a cross-sectional approach; behaviour over a period of
time could therefore not be analysed. Attitudes, and subsequently purchase intentions, may
however change through mere exposure, as consumers are able to get more familiar with
abnormal products (Zajonc, 1968). Exposing consumers to unfamiliar foods for a longer
period of time, is found to be an effective strategy to increase consumers’ acceptance of
unfamiliar foods (Tuorila, Meiselman, Cardello, & Lesher, 1998), which suggests that
consumers might be more positive towards abnormal shaped foods when they are exposed to
them for a longer period. Future research on food abnormality should therefore adopt a
longitudinal approach. Participants could be exposed weekly to abnormal shaped foods, for
example through a fictive supermarket e-mail newsletter. The study could consist of several
conditions, including a control condition, one with normal shaped foods and one with
abnormal shaped foods. Through the use of a pre- and a post-test, changes in consumers’
perceptions could be examined.
Secondly, the findings of this study may not be generalizable for the entire study
population. Because participants were not collected at random, some groups were over-
and/or underrepresented. In this study, 90.2% of the sample was between 18 and 30 years old.
The results showed that age significantly determined consumers’ quality perceptions and
purchase intentions: the older the person, the higher their quality perceptions and the stronger
Page 27
AN ABNORMAL APPLE A DAY, KEEPS FOOD WASTE AT BAY! 27
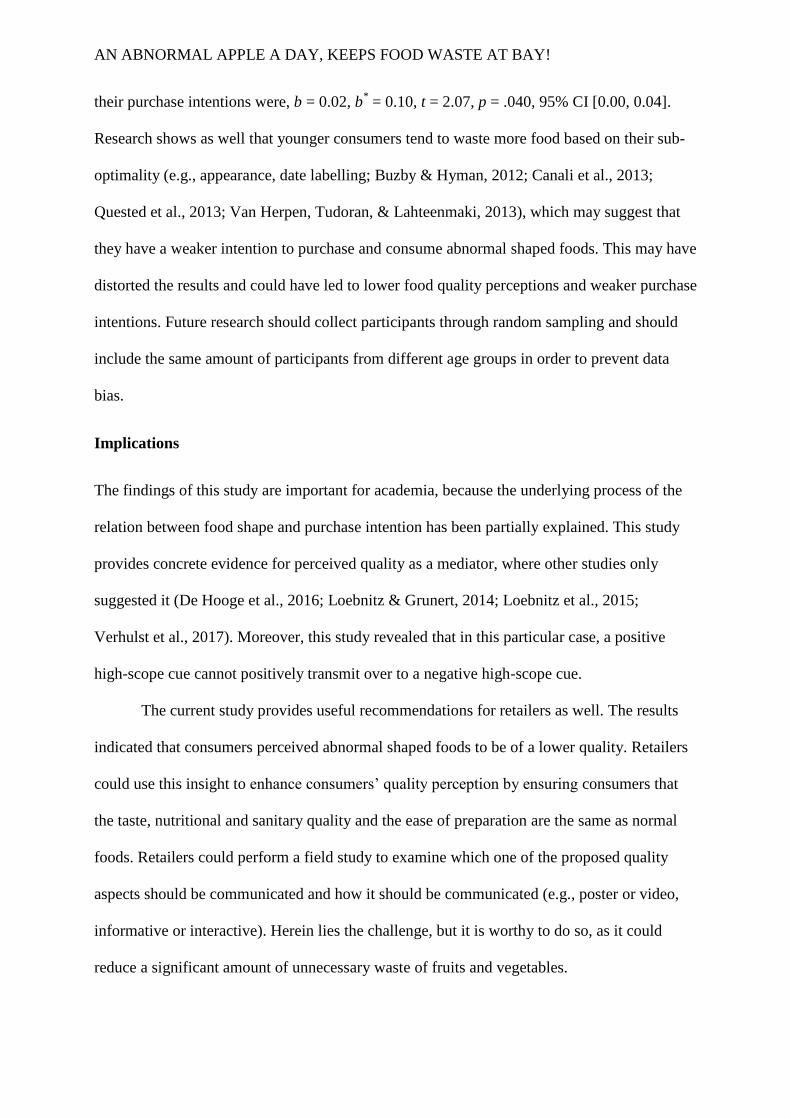
their purchase intentions were, b = 0.02, b* = 0.10, t = 2.07, p = .040, 95% CI [0.00, 0.04].
Research shows as well that younger consumers tend to waste more food based on their sub-
optimality (e.g., appearance, date labelling; Buzby & Hyman, 2012; Canali et al., 2013;
Quested et al., 2013; Van Herpen, Tudoran, & Lahteenmaki, 2013), which may suggest that
they have a weaker intention to purchase and consume abnormal shaped foods. This may have
distorted the results and could have led to lower food quality perceptions and weaker purchase
intentions. Future research should collect participants through random sampling and should
include the same amount of participants from different age groups in order to prevent data
bias.
Implications
The findings of this study are important for academia, because the underlying process of the
relation between food shape and purchase intention has been partially explained. This study
provides concrete evidence for perceived quality as a mediator, where other studies only
suggested it (De Hooge et al., 2016; Loebnitz & Grunert, 2014; Loebnitz et al., 2015;
Verhulst et al., 2017). Moreover, this study revealed that in this particular case, a positive
high-scope cue cannot positively transmit over to a negative high-scope cue.
The current study provides useful recommendations for retailers as well. The results
indicated that consumers perceived abnormal shaped foods to be of a lower quality. Retailers
could use this insight to enhance consumers’ quality perception by ensuring consumers that
the taste, nutritional and sanitary quality and the ease of preparation are the same as normal
foods. Retailers could perform a field study to examine which one of the proposed quality
aspects should be communicated and how it should be communicated (e.g., poster or video,
informative or interactive). Herein lies the challenge, but it is worthy to do so, as it could
reduce a significant amount of unnecessary waste of fruits and vegetables.
Page 28
AN ABNORMAL APPLE A DAY, KEEPS FOOD WASTE AT BAY! 28
Page 29
AN ABNORMAL APPLE A DAY, KEEPS FOOD WASTE AT BAY! 29
References
Akdeniz, B., Calantone, R. J., & Voorhees, C. M. (2013). Effectiveness of marketing cues on
consumer perceptions of quality: The moderating roles of brand reputation and third-
party information. Psychology & Marketing, 30(1), 76–89. doi: 10.1002/mar.20590
Aschemann-Witzel, J., De Hooge, I., Amani, P., Bech-Larsen, T., & Oostindjer, M. (2015).
Consumer-related food waste: Causes and potential for action. Sustainability, 7(6),
6457–6477. doi: 10.3390/su7066457
Baron, R. M., & Kenny, D. A. (1986). The moderator–mediator variable distinction in social
psychological research: Conceptual, strategic, and statistical considerations. Journal of
Personality and Social Psychology, 51(6), 1173–1182.
doi: 10.1037/0022-3514.51.6.1173
Bearden, W. O., Lichtenstein, D. R., & Teel, J. E. (1984). Comparison price, coupon, and
brand effects on consumer reactions to retail newspaper advertisements. Journal of
Retailing, 60(2), 11–34. Retrieved from https://web-a-ebscohost-
com.proxy.uba.uva.nl:2443/ehost/detail/detail?vid=0&sid=606ba5d3-a182-4579-835a-
9794bc3b1f7c%40sessionmgr4009&bdata=JnNpdGU9ZWhvc3QtbGl2ZQ%3d%3d#A
N=4666970&db=buh
Berry, D. T. R., Wetter, M. W., Baer, R. A., Larsen, L., Clark, C., & Monroe, K. (1992).
MMPI-2 random responding indices: Validation using a self-report methodology.
Psychological Assessment, 4(3), 340–345. doi: 10.1037/1040-3590.4.3.340
Biswas, A., Wilson, E. J., & Licata, J. W. (1993). Reference pricing studies in marketing: A
synthesis of research results. Journal of Business Research, 27(3), 239–256.
doi: 10.1016/0148-2963(93)90029-O
Page 30
AN ABNORMAL APPLE A DAY, KEEPS FOOD WASTE AT BAY! 30
Boulding, W., & Kirmani, A. (1993). A consumer-side experimental examination of
signaling theory: Do consumers perceive warranties as signals of quality? Journal of
Consumer Research, 20(1), 111–123. Retrieved from
http://www.jstor.org/stable/2489204?seq=1#page_scan_tab_contents
Bowling, N. A., Huang, J. L., Bragg, C. B., Khazon, S., Liu, M., & Blackmore, C. E. (2016).
Who cares and who is careless? Insufficient effort responding as a reflection of
respondent personality. Journal of Personality and Social Psychology, 111(2),
218–229. doi: 10.1037/pspp0000085
Bredahl, L. (2004). Cue utilisation and quality perception with regard to branded beef. Food
Quality and Preference, 15(1), 65–75. doi: 10.1016/S0950-3293(03)00024-7
Brown, T. J., & Dacin, P. A. (1997). The company and the product: Corporate associations
and consumer product responses. The Journal of Marketing, 61(1), 68–84. Retrieved
from https://search.proquest.com/docview/1296592376/fulltext/A838EAF64F72
4C7FPQ/1?accountid=14615
Buckley, P. G. (1991). An S-O-R model of the purchase of an item in a store. In R. H.
Holman & M. R. Solomon (Eds.), Association for consumer research (pp. 491–500).
Retrieved from http://acrwebsite.org/volumes/7138/volumes/v18/NA-18
Buzby, J. C., & Hyman, J. (2012). Total and per capita value of food loss in the United States.
Food Policy, 37(5), 561–570. doi: 10.1016/j.foodpol.2012.06.002
Buzby, J. C., Hyman, J., Stewart, H., & Wells, H. F. (2011). The value of retail‐and
consumer‐level fruit and vegetable losses in the United States. Journal of Consumer
Affairs, 45(3), 492–515. doi: 10.1111/j.1745-6606.2011.01214.x
Page 31
AN ABNORMAL APPLE A DAY, KEEPS FOOD WASTE AT BAY! 31
Canali, M., Ostergren, K., Amani, P., Aramyan, L., Easteal, S., Gaiani, S., ... Waldron, K.
(2013). Report on food waste drivers for reducing food waste and barriers and
opportunities (Report No. 311972). Bologna: FUSIONS.
Chen, Z., & Dubinsky, A. J. (2003). A conceptual model of perceived customer value in
e-commerce: A preliminary investigation. Psychology and Marketing, 20(4), 323–347.
doi: 10.1002/mar.10076
Connolly, T., & Srivastava, J. (1995). Cues and components in multiattribute evaluation.
Organizational Behavior and Human Decision Processes, 64(2), 219–228.
doi: 10.1006/obhd.1995.1101
Creusen, M. E., & Schoormans, J. P. (2005). The different roles of product appearance in
consumer choice. Journal of Product Innovation Management, 22(1), 63–81.
doi: 10.1111/j.0737-6782.2005.00103.x
Dawar, N., & Parker, P. (1994). Marketing universals: Consumers' use of brand name, price,
physical appearance, and retailer reputation as signals of product quality. The Journal
of Marketing, 58(2), 81–95. doi: 10.2307/1252271
De Hooge, I. E., Oostindjer, M., Aschemann-Witzel, J., Normann, A., Loose, S. M., & Almli,
V. L. (2016). This apple is too ugly for me! Consumer preferences for suboptimal
food products in the supermarket and at home. Food Quality and Preference, 56,
80–92. doi: 10.1016/j.foodqual.2016.09.012
Distrifood. (n.d.). Formule-overzicht. Retrieved from http://www.distrifood.nl/formule-
overzicht
Page 32
AN ABNORMAL APPLE A DAY, KEEPS FOOD WASTE AT BAY! 32
Dodds, W. B., Monroe, K. B., & Grewal, D. (1991). Effects of price, brand, and store
information on buyers' product evaluations. Journal of Marketing Research, 28(3),
307–319. doi: 10.2307/3172866
Ghada, O. M., Abdel, H. A. H., Bader M. A. A., & Ahmad A. A. (2017). The impact of
product performance on brand loyalty mediated by customer satisfaction: Study in
Sudanese service industry. International Journal of Advances and Applied Sciences,
4(1), 116–122. Retrieved from http://www.sciencegate.com/IJAAS/V4I1/
Mohammed.html
Gidron, D., Koehler, D. J., & Tversky, A. (1993). Implicit quantification of personality traits.
Personality and Social Psychology Bulletin, 19(5), 594–604.
doi: 10.1177/0146167293195011
Gobel, C., Langen, N., Blumenthal, A., Teitscheid, P., & Ritter, G. (2015). Cutting food waste
through cooperation along the food supply chain. Sustainability, 7, 1429–1445.
doi: http://dx.doi.org/10.3390/su7021429
Grewal, D., Krishnan, R., Baker, J. and Borin, N. (1998). The effect of store name, brand
name, and price discounts on consumers’ evaluations and purchase intentions. Journal
of Retailing, 74(3), 331–52. doi: 10.1016/S0022-4359(99)80099-2
Grewal, D., Monroe, K. B., & Krishnan, R. (1998). The effects of price-comparison
advertising on buyers' perceptions of acquisition value, transaction value, and
behavioral intentions. The Journal of Marketing, 62(2), 46–59. Retrieved from
https://search-proquest-com.proxy.uba.uva.nl:2443/docview/1296570921/fulltext/9C
33776E7134C7DPQ/1?accountid=14615
Page 33
AN ABNORMAL APPLE A DAY, KEEPS FOOD WASTE AT BAY! 33
Gustavsson, J., Cederberg, C., Sonesson, U., Van Otterdijk, R., & Meybeck, A. (2011).
Global food losses and food waste. Rome: Food and Agriculture Organization of the
United Nations.
Halloran, A., Clement, J., Kornum, N., Bucatariu, C., & Magid, J. (2014). Addressing food
waste reduction in Denmark. Food Policy, 49, 294–301.
doi: 10.1016/j.foodpol.2014.09.005
Hansen, T. (2005). Understanding consumer perception of food quality: The cases of shrimps
and cheese. British Food Journal, 107(7), 500–525. doi: 10.1108/00070700510606909
Hauser, D. J., & Schwarz, N. (2016). Attentive turkers: MTurk participants perform better on
online attention checks than do subject pool participants. Behavior Research Methods,
48(1), 400–407. doi: 10.3758/s13428-015-0578-z
Hayes, A. (2013). Introduction to mediation, moderation, and conditional process analysis: A
regression-based approach. New York: Guilford Publications.
Hoch, S. J., & Deighton, J. (1989). Managing what consumers learn from experience. The
Journal of Marketing, 53(2), 1–20. doi: 10.2307/1251410
Huang, J. L., Liu, M., & Bowling, N. A. (2015). Insufficient effort responding: Examining an
insidious confound in survey data. Journal of Applied Psychology, 100(3), 828–845.
doi: 10.1037/a0038510
Hurling, R., & Shepherd, R. (2003). Eating with your eyes: Effect of appearance on
expectations of liking. Appetite, 41(2), 167–174.
doi: 10.1016/S0195-6663(03)00058- 8
Page 34
AN ABNORMAL APPLE A DAY, KEEPS FOOD WASTE AT BAY! 34
Jacoby, J., Olson, J., & Haddock., R. (1973). Price, brand name and product composition
characteristics as determinants of perceived quality. Journal of Applied Psychology,
55(6), 570–579. doi: 10.1037/h0032045
James, L. R., & Brett, J. M. (1984). Mediators, moderators, and tests for mediation. Journal of
Applied Psychology, 69(2), 307–321. doi: 10.1037/0021-9010.69.2.307
Judd, C. M., & Kenny, D. A. (1981). Process analysis: Estimating mediation in treatment
evaluations. Evaluation Review, 5(5), 602–619. doi: 10.1177/0193841X8100500502
Keller, K. L. & Aaker, D. A. (1992). The effect of sequential introduction of brand
extensions. Journal of Marketing Research, 29(1), 35–50. doi: 0.2307/3172491
Lebersorger, S., & Schneider, F. (2014). Food loss rates at the food retail, influencing factors
and reasons as a basis for waste prevention measures. Waste Management, 34(11),
1911–1919. doi: 10.1016/j.wasman.2014.06.013
Loebnitz, N., & Grunert, K. G. (2014). The effect of food shape abnormality on purchase
intentions in China. Food Quality and Preference, 40, 24–30.
doi: 10.1016/j.foodqual.2014.08.005
Loebnitz, N., Schuitema, G., & Grunert, K. G. (2015). Who buys oddly shaped food and why?
Impacts of food shape abnormality and organic labelling on purchase intentions.
Psychology & Marketing, 32(4), 408–421. doi: 10.1002/mar.20788
Maniaci, M.R., & Rogge, R.D. (2014). Caring about carelessness: Participant inattention and
its effects on research. Journal of Research in Personality, 48, 61–83.
doi: 10.1016/j.jrp.2013.09.008
Meade, A. W., & Craig, S. B. (2012). Identifying careless responses in survey data.
Psychological Methods, 17(3), 437–455. doi: 10.1037/a0028085
Page 35
AN ABNORMAL APPLE A DAY, KEEPS FOOD WASTE AT BAY! 35
Milieu Centraal. (2017). Feiten en cijfers over verspillen van voedsel door consumenten in
2016. Retrieved from https://www.milieucentraal.nl/media/3725/factsheet-
voedselverspilling-huishoudens-mei-2017.pdf
Monroe, K. B., Grewal, D., & Compeau, L. D. (1991). The concept of reference prices:
Theoretical justifications and research issues. Journal of Marketing, 62(2), 46–59.
Retrieved from https://search-proquest-com.proxy.uba.uva.nl:2443/docview/
1296570921/fulltext/20F3FBE376784517PQ/1?accountid=14615
Nellemann, C., MacDevette, M., Manders, T., Eickhout, B., Svihus, B., Prins, A. G., &
Kaltenborn, B. P. (2009). The environmental food crisis: The environment's role in
averting future food crises: A UNEP rapid response assessment. Retrieved from
http://www.grida.no/publications/154
Nevin, J. R., & Houston, M. J. (1980). Image as a component of attraction to intraurban
shopping areas. Journal of Retailing, 56(1), 77–93. Retrieved from https://web-a-
ebscohost-com.proxy.uba.uva.nl:2443/ehost/detail/detail?vid=0&sid=57b32585-8c21-
4730-ac18-529f21ebe608%40sessionmgr4007&bdata=JnNpdGU9ZWhvc3QtbGl2ZQ
%3d%3d#db=buh&AN=4668522
Olson, J. C. (1978). Inferential belief formation in the cue utilization process. In H. Keith
(Ed.), Advances in consumer research (Vol. 5, pp. 706–713). Hunt, Ann Arbor:
Association for Consumer Research.
Purohit, D., & Srivastava, J. (2001). Effect of manufacturer reputation, retailer reputation, and
product warranty on consumer judgments of product quality: A cue diagnosticity
framework. Journal of Consumer Psychology, 10(3), 123–134. Retrieved from
https://onlinelibrary.wiley.com/doi/abs/10.1207/s15327663jcp1003_1
Page 36
AN ABNORMAL APPLE A DAY, KEEPS FOOD WASTE AT BAY! 36
Quested, T. E., Marsh, E., Stunell, D., & Parry, A. D. (2013). Spaghetti soup: The complex
world of food waste behaviours. Resources, Conservation and Recycling, 79, 43–51.
doi: 10.1016/j.resconrec.2013.04.011
Richardson, P. S., Dick, A. S., & Jain, A. K. (1994). Extrinsic and intrinsic cue effects on
perceptions of store brand quality. The Journal of Marketing, 58(4), 28–36. Retrieved
from https://search.proquest.com/docview/227722982?rfr_id=info%3Axri%2Fsid%3A
primo
Shapiro, C. (1982). Consumer information, product quality, and seller reputation. The Bell
Journal of Economics, 13(1), 20–35. Retrieved from https://www-jstor-org.proxy
.uba.uva.nl:2443/stable/3003427?sid=primo&origin=crossref&seq=1#page_scan_tab_
contents
Shapiro, C. (1983). Premiums for high quality products as returns to reputations. The
Quarterly Journal of Economics, 98(4), 659–679. Retrieved from https://www-jstor-
org.proxy.uba.uva.nl:2443/stable/1881782?sid=primo&origin=crossref&seq=1#page_
scan_tab_contents
Simonson, I. (1989). Choice based on reasons: The case of attraction and compromise effects.
Journal of Consumer Research, 16(2), 158–174. Retrieved from https://www.jstor.org/
stable/2489315?seq=1#page_scan_tab_contents
Spears, N., & Singh, S. N. (2004). Measuring attitude toward the brand and purchase
intentions. Journal of Current Issues & Research in Advertising, 26(2), 53–66.
doi: 10.1080/10641734.2004.10505164
Steenkamp, J. B. E. M. (1989). Product quality. Amsterdam: Van Corcum.
Page 37
AN ABNORMAL APPLE A DAY, KEEPS FOOD WASTE AT BAY! 37
Stefan, V., Van Herpen, E., Tudoran, A. A., & Lahteenmaki, L. (2013). Avoiding food waste
by Romanian consumers: The importance of planning and shopping routines. Food
Quality and Preference, 28(1), 375–381. doi: 10.1016/j.foodqual.2012.11.001
Szybillo, G. J., & Jacoby, J. (1974). Intrinsic versus extrinsic cues as determinants of
perceived product quality. Journal of Applied Psychology, 59(1), 74–78.
doi: 10.1037/h0035796.
Tal, A., Gvili, Y., Amar, M., & Wansink, B. (2017). Can political cookies leave a bad taste in
one’s mouth? Political ideology influences taste. European Journal of Marketing,
51(11/12), 2175–2191. doi: 10.1108/EJM-04-2015-0237
Tuorila, H. M., Meiselman, H. L., Cardello, A. V., & Lesher, L. L. (1998). Effect of
expectations and the definition of product category on the acceptance of unfamiliar
foods. Food Quality and Preference, 9, 421–430.
doi: 10.1016/S0950-3293(98)00012-3
Verghese, K., Lewis, H., Lockrey, S., & Williams, H. (2013). The role of packaging in
minimising food waste in the supply chain of the future. Retrieved from RMIT
University, Engineering and Technology Food Engineering website: http://www.diva-
portal.org/smash/record.jsf?pid=diva2%3A752398&dswid=-2033
Veryzer Jr, R. W., & Hutchinson, J. W. (1998). The influence of unity and prototypicality on
aesthetic responses to new product designs. Journal of Consumer Research, 24(4),
374–394. doi: 10.1086/209516
Wheatley, J. J., Chiu, J. S., & Goldman, A. (1981). Physical quality, price, and perceptions of
product quality-implications for retailers. Journal of Retailing, 57(2), 100–116.
Retrieved from https://web-a-ebscohost-com.proxy.uba.uva.nl:2443/ehost/detail/detail
Page 38
AN ABNORMAL APPLE A DAY, KEEPS FOOD WASTE AT BAY! 38
?vid=0&sid=bbd2a69d-7999-4976-88d8-c51ccbe05782%40sessionmgr4006&bdata=
JnNpdGU9ZWhvc3QtbGl2ZQ%3d%3d#AN=4666852&db=buh
Wilkins, J. L., Bokaer-Smith, J., & Hilchey, D. (1996). Local foods and local agriculture: A
survey of attitudes among north-eastern consumers. Retrieved from
http://media.cce.cornell.edu/hosts/agrofoodcommunity/AttitudeSurvey.doc
Woods, C.M. (2006). Careless responding to reverse-worded items: Implications for
confirmatory factor analysis. Journal of Psychopathology and Behavioral Assessment,
28(3), 86–191. doi: 10.1007/s10862-005-9004-7
Zajonc, R. B. (1968). Attitudinal effects of mere exposure. Journal of Personality and Social
Psychology, 9(2), 1–27. doi: 10.1037/h0025848
Page 39
AN ABNORMAL APPLE A DAY, KEEPS FOOD WASTE AT BAY! 39
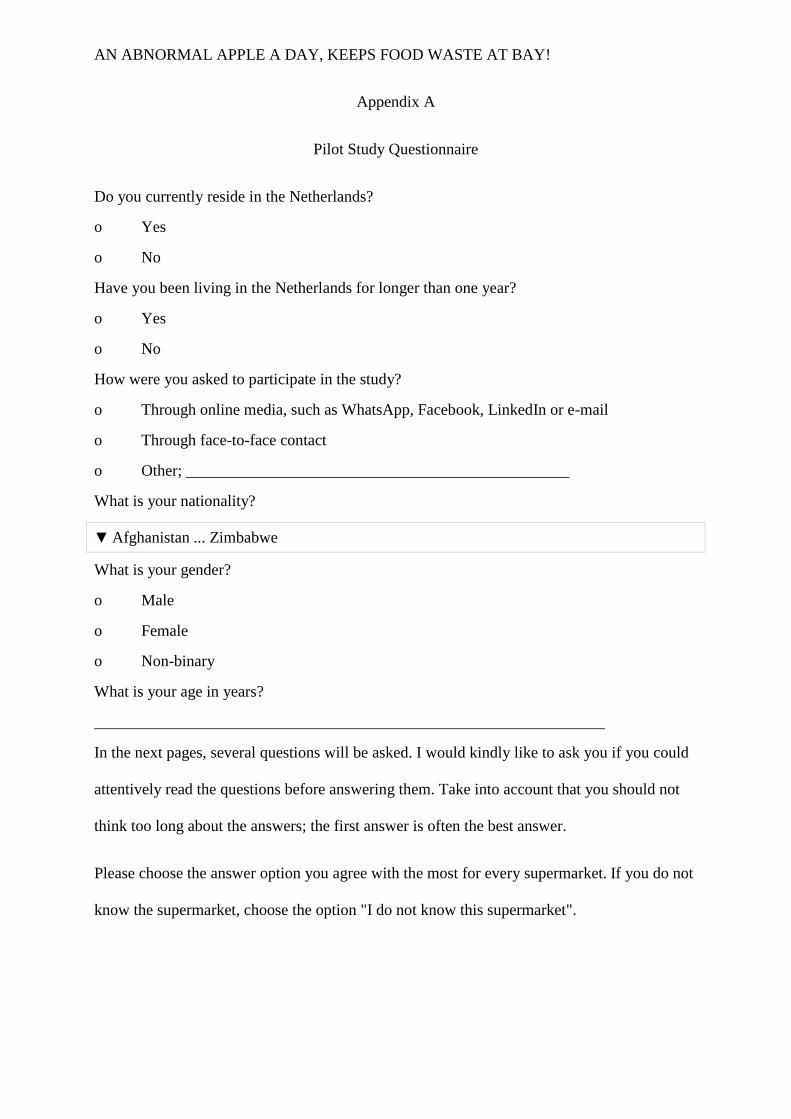
Appendix A
Pilot Study Questionnaire
Do you currently reside in the Netherlands?
o Yes
o No
Have you been living in the Netherlands for longer than one year?
o Yes
o No
How were you asked to participate in the study?
o Through online media, such as WhatsApp, Facebook, LinkedIn or e-mail
o Through face-to-face contact
o Other; ________________________________________________
What is your nationality?
▼ Afghanistan ... Zimbabwe
What is your gender?
o Male
o Female
o Non-binary
What is your age in years?
________________________________________________________________
In the next pages, several questions will be asked. I would kindly like to ask you if you could
attentively read the questions before answering them. Take into account that you should not
think too long about the answers; the first answer is often the best answer.
Please choose the answer option you agree with the most for every supermarket. If you do not
know the supermarket, choose the option "I do not know this supermarket".
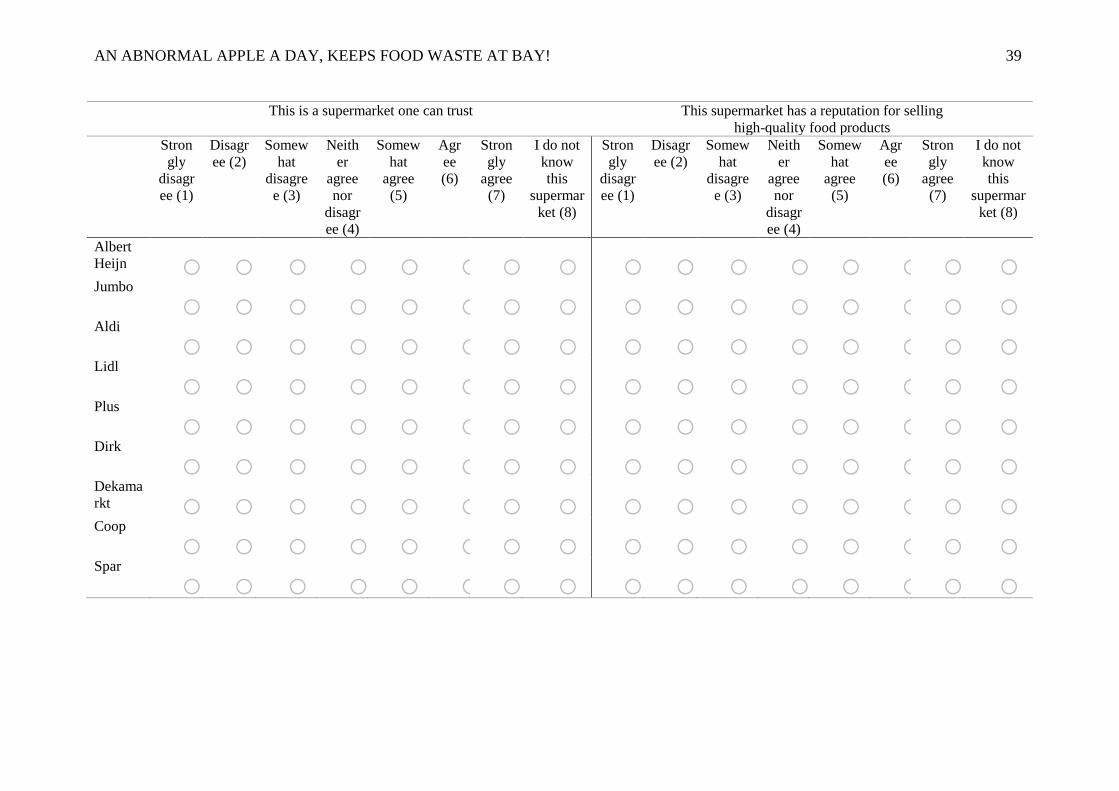
Page 40
AN ABNORMAL APPLE A DAY, KEEPS FOOD WASTE AT BAY! 39
This is a supermarket one can trust This supermarket has a reputation for selling
high-quality food products
Stron
gly
disagr
ee (1)
Disagr
ee (2)
Somew
hat
disagre
e (3)
Neith
er
agree
nor
disagr
ee (4)
Somew
hat
agree
(5)
Agr
ee
(6)
Stron
gly
agree
(7)
I do not
know
this
supermar
ket (8)
Stron
gly
disagr
ee (1)
Disagr
ee (2)
Somew
hat
disagre
e (3)
Neith
er
agree
nor
disagr
ee (4)
Somew
hat
agree
(5)
Agr
ee
(6)
Stron
gly
agree
(7)
I do not
know
this
supermar
ket (8)
Albert
Heijn o o o o o o o o o o o o o o o o Jumbo
o o o o o o o o o o o o o o o o Aldi
o o o o o o o o o o o o o o o o Lidl
o o o o o o o o o o o o o o o o Plus
o o o o o o o o o o o o o o o o Dirk
o o o o o o o o o o o o o o o o Dekama
rkt o o o o o o o o o o o o o o o o Coop
o o o o o o o o o o o o o o o o Spar
o o o o o o o o o o o o o o o o
Page 41
AN ABNORMAL APPLE A DAY, KEEPS FOOD WASTE AT BAY! 41
This is a supermarket one can trust This supermarket has a reputation for selling
high-quality food products
Stron
gly
disagr
ee (1)
Disagr
ee (2)
Somew
hat
disagre
e (3)
Neith
er
agree
nor
disagr
ee (4)
Somew
hat
agree
(5)
Agr
ee
(6)
Stron
gly
agree
(7)
I do not
know
this
supermar
ket (8)
Stron
gly
disagr
ee (1)
Disagr
ee (2)
Somew
hat
disagre
e (3)
Neith
er
agree
nor
disagr
ee (4)
Somew
hat
agree
(5)
Agr
ee
(6)
Stron
gly
agree
(7)
I do not
know
this
supermar
ket (8)
Hoogvli
et o o o o o o o o o o o o o o o o Deen
o o o o o o o o o o o o o o o o Vomar
o o o o o o o o o o o o o o o o Jan
Linders o o o o o o o o o o o o o o o o Poiesz
o o o o o o o o o o o o o o o o Boni
o o o o o o o o o o o o o o o o Ekoplaz
a o o o o o o o o o o o o o o o o Emté
o o o o o o o o o o o o o o o o Dagwin
kel o o o o o o o o o o o o o o o o
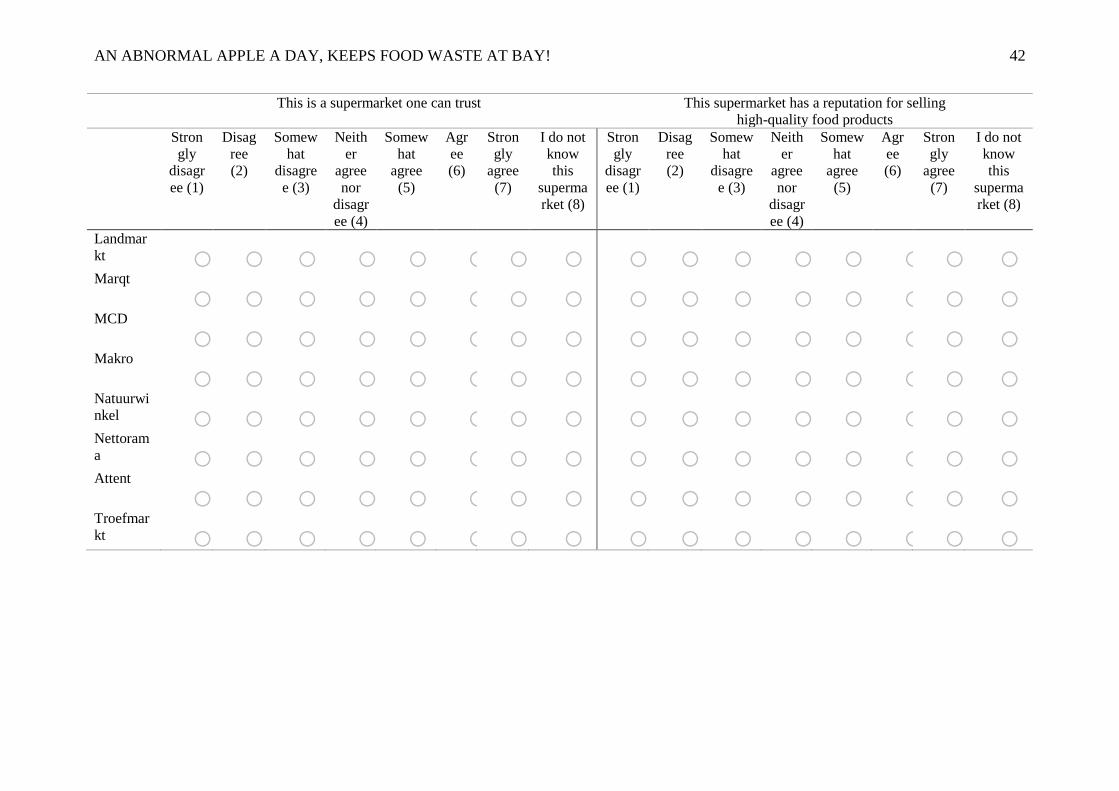
Page 42
AN ABNORMAL APPLE A DAY, KEEPS FOOD WASTE AT BAY! 42
This is a supermarket one can trust This supermarket has a reputation for selling
high-quality food products
Stron
gly
disagr
ee (1)
Disag
ree
(2)
Somew
hat
disagre
e (3)
Neith
er
agree
nor
disagr
ee (4)
Somew
hat
agree
(5)
Agr
ee
(6)
Stron
gly
agree
(7)
I do not
know
this
superma
rket (8)
Stron
gly
disagr
ee (1)
Disag
ree
(2)
Somew
hat
disagre
e (3)
Neith
er
agree
nor
disagr
ee (4)
Somew
hat
agree
(5)
Agr
ee
(6)
Stron
gly
agree
(7)
I do not
know
this
superma
rket (8)
Landmar
kt o o o o o o o o o o o o o o o o Marqt
o o o o o o o o o o o o o o o o MCD
o o o o o o o o o o o o o o o o Makro
o o o o o o o o o o o o o o o o Natuurwi
nkel o o o o o o o o o o o o o o o o Nettoram
a o o o o o o o o o o o o o o o o Attent
o o o o o o o o o o o o o o o o Troefmar
kt o o o o o o o o o o o o o o o o
Page 43
AN ABNORMAL APPLE A DAY, KEEPS FOOD WASTE AT BAY! 42
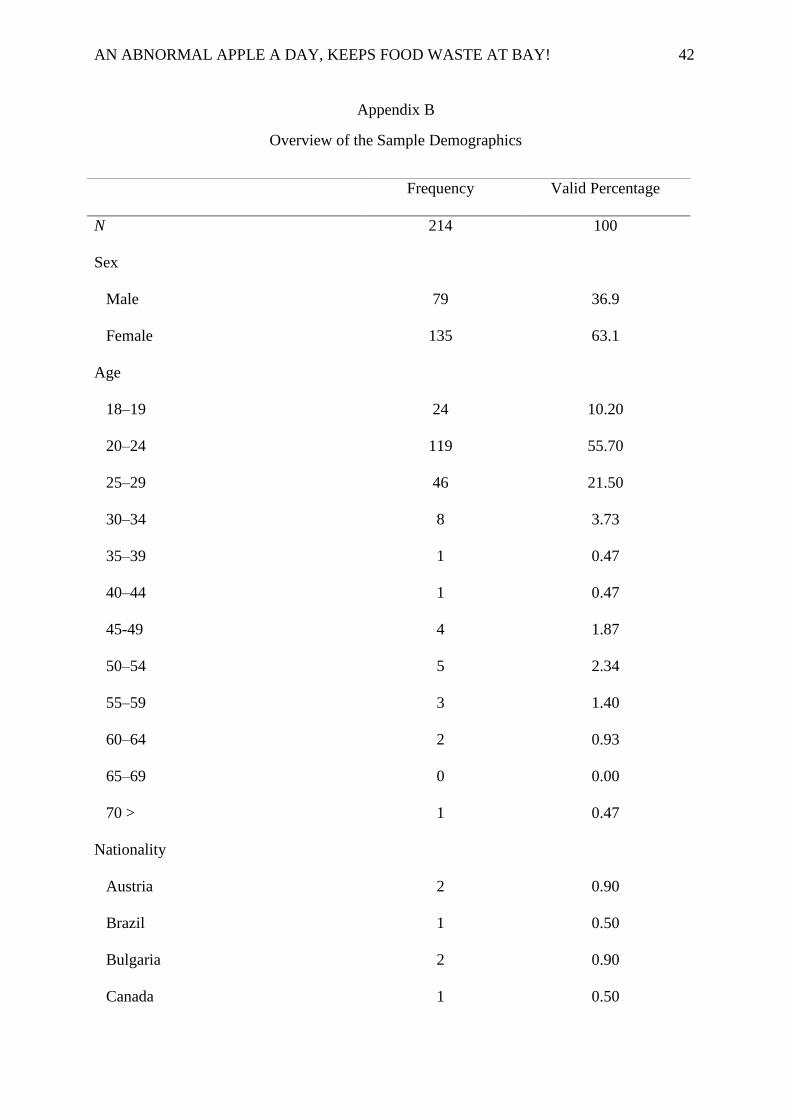
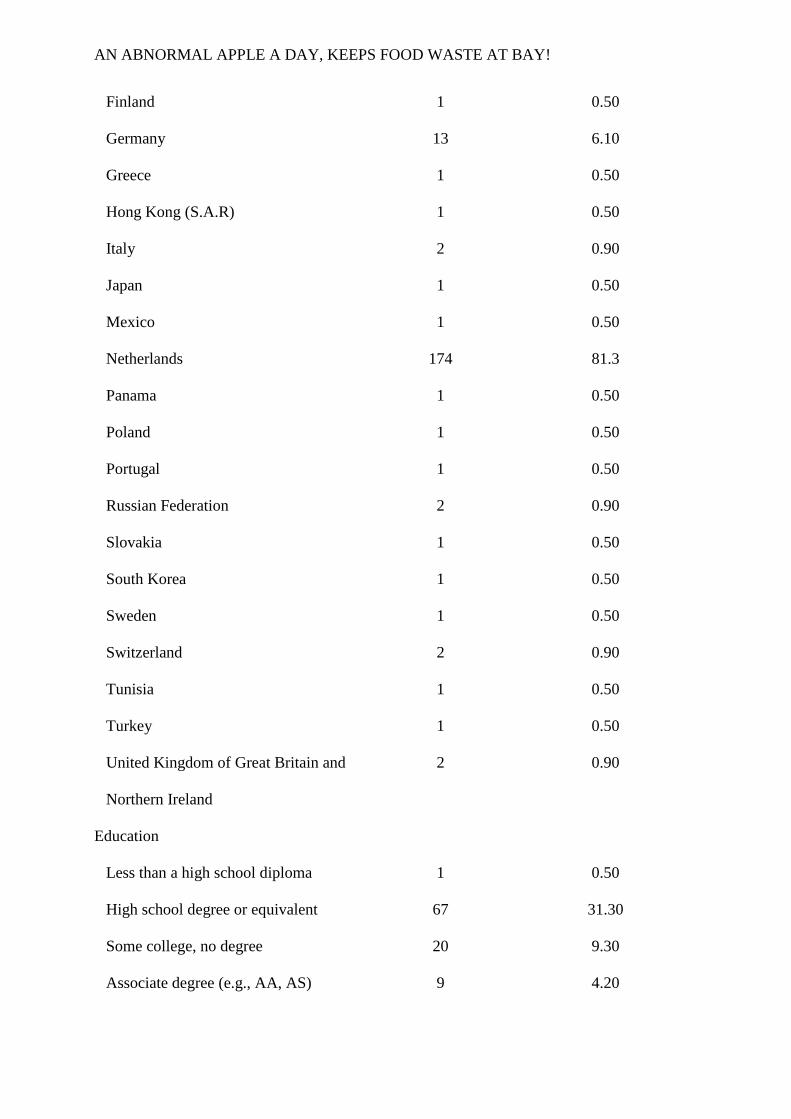
Appendix B
Overview of the Sample Demographics
Frequency Valid Percentage
N 214 100
Sex
Male 79 36.9
Female 135 63.1
Age
18–19 24 10.20
20–24 119 55.70
25–29 46 21.50
30–34 8 3.73
35–39 1 0.47
40–44 1 0.47
45-49 4 1.87
50–54 5 2.34
55–59 3 1.40
60–64 2 0.93
65–69 0 0.00
70 > 1 0.47
Nationality
Austria 2 0.90
Brazil 1 0.50
Bulgaria 2 0.90
Canada 1 0.50
Page 44
AN ABNORMAL APPLE A DAY, KEEPS FOOD WASTE AT BAY! 44
Finland 1 0.50
Germany 13 6.10
Greece 1 0.50
Hong Kong (S.A.R) 1 0.50
Italy 2 0.90
Japan 1 0.50
Mexico 1 0.50
Netherlands 174 81.3
Panama 1 0.50
Poland 1 0.50
Portugal 1 0.50
Russian Federation 2 0.90
Slovakia 1 0.50
South Korea 1 0.50
Sweden 1 0.50
Switzerland 2 0.90
Tunisia 1 0.50
Turkey 1 0.50
United Kingdom of Great Britain and
Northern Ireland
2 0.90
Education
Less than a high school diploma 1 0.50
High school degree or equivalent 67 31.30
Some college, no degree 20 9.30
Associate degree (e.g., AA, AS) 9 4.20
Page 45
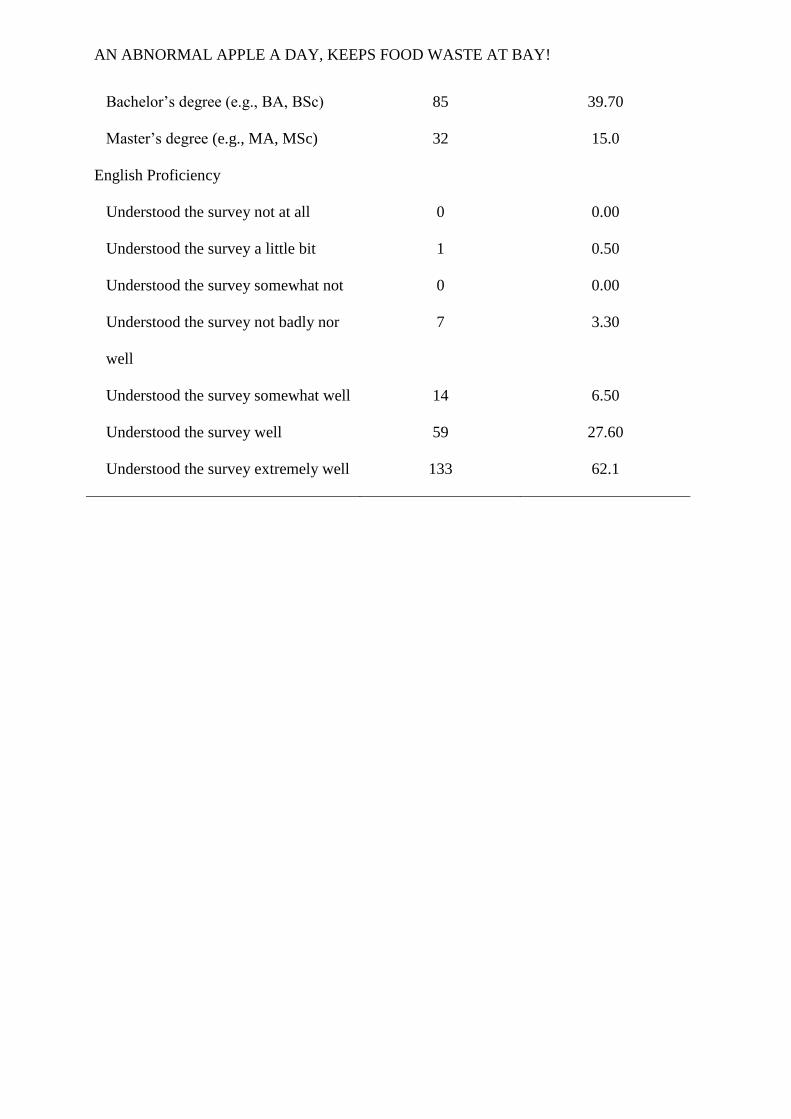
AN ABNORMAL APPLE A DAY, KEEPS FOOD WASTE AT BAY! 45
Bachelor’s degree (e.g., BA, BSc) 85 39.70
Master’s degree (e.g., MA, MSc) 32 15.0
English Proficiency
Understood the survey not at all 0 0.00
Understood the survey a little bit 1 0.50
Understood the survey somewhat not 0 0.00
Understood the survey not badly nor
well
7 3.30
Understood the survey somewhat well 14 6.50
Understood the survey well 59 27.60
Understood the survey extremely well 133 62.1
Page 46
AN ABNORMAL APPLE A DAY, KEEPS FOOD WASTE AT BAY! 46
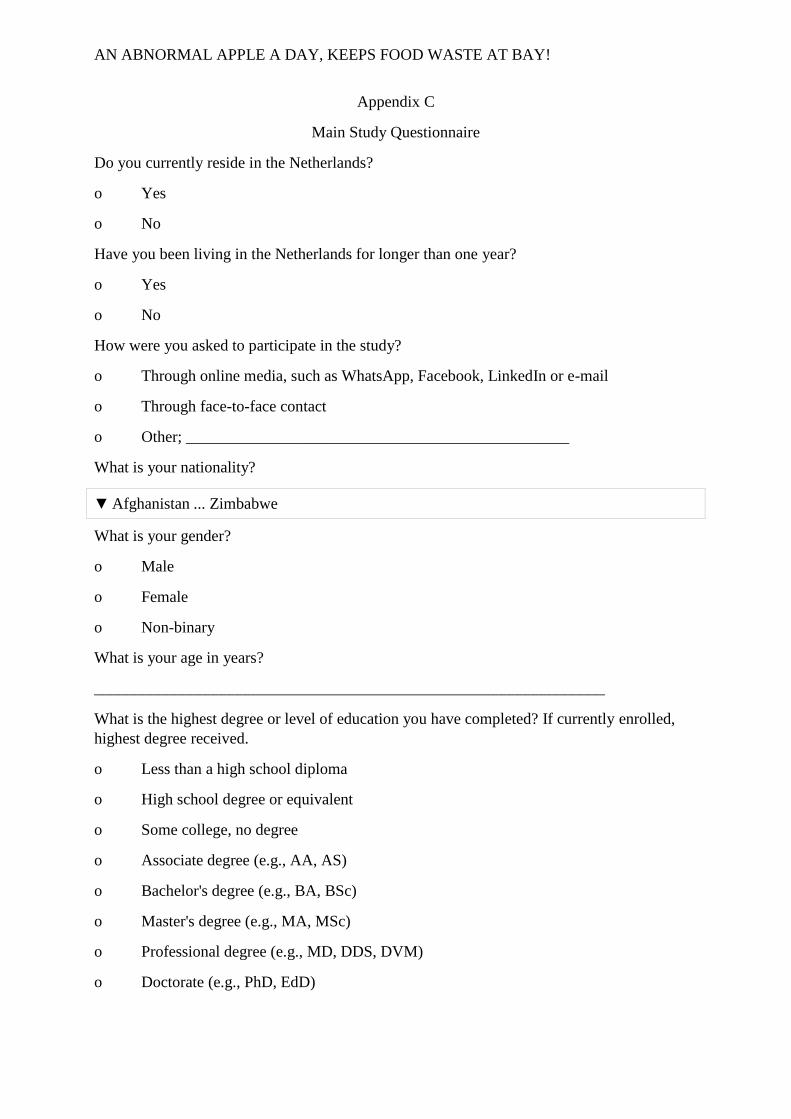
Appendix C
Main Study Questionnaire
Do you currently reside in the Netherlands?
o Yes
o No
Have you been living in the Netherlands for longer than one year?
o Yes
o No
How were you asked to participate in the study?
o Through online media, such as WhatsApp, Facebook, LinkedIn or e-mail
o Through face-to-face contact
o Other; ________________________________________________
What is your nationality?
▼ Afghanistan ... Zimbabwe
What is your gender?
o Male
o Female
o Non-binary
What is your age in years?
________________________________________________________________
What is the highest degree or level of education you have completed? If currently enrolled,
highest degree received.
o Less than a high school diploma
o High school degree or equivalent
o Some college, no degree
o Associate degree (e.g., AA, AS)
o Bachelor's degree (e.g., BA, BSc)
o Master's degree (e.g., MA, MSc)
o Professional degree (e.g., MD, DDS, DVM)
o Doctorate (e.g., PhD, EdD)
Page 47
AN ABNORMAL APPLE A DAY, KEEPS FOOD WASTE AT BAY! 47
On the following page several fruits and vegetables are displayed. Please read the short
description and thoroughly observe the fruits and vegetables before answering the questions.
Imagine you are in the [name supermarket]. You are walking in the fruit and vegetable
department and want to purchase an apple, a carrot, a lemon and an aubergine. When you
walk down the aisle looking for these products, you see the foods that are displayed below.
Display of either a normal or an abnormal shaped apple, carrot, lemon and an aubergine.
Take a good look at the fruits and vegetables presented. After 10 seconds, you are able to go
to the next page.
In the next pages, several questions will be asked. Please attentively read the questions before
answering them. Take into account that you should not think too long about the answers; the
first answer is often the best answer.
Please describe your overall feelings of the fruits and vegetables that were displayed.
Never Definitely
1 2 3 5 6 7
I would ... purchase these fruits and
vegetables.
Definitely
do not
intend
Definitely
intend
1 2 3 5 6 7
I ... to purchase these fruits and vegetables.
Very low
interest
Very high
interest
1 2 3 5 6 7
I have a ... in purchasing these fruits and
vegetables.
Page 48
AN ABNORMAL APPLE A DAY, KEEPS FOOD WASTE AT BAY! 48
Definitely
not
Definitely
1 2 3 5 6 7
I would ... purchase these fruits and
vegetables.
Probably
not
Probably
1 2 3 5 6 7
I would ... purchase these fruits and
vegetables.
Page 49
AN ABNORMAL APPLE A DAY, KEEPS FOOD WASTE AT BAY! 49
Strongly
disagree Disagree
Somewhat
disagree
Neither
agree
nor
disagree
Somewhat
agree Agree
Strongly
agree
I will be
satisfied by
the taste of
the fruits and
vegetables.
o o o o o o o
I will be
satisfied by
the nutritional
quality of the
fruits and
vegetables.
o o o o o o o
I will be
satisfied by
the sanitary
quality of the
fruits and
vegetables.
o o o o o o o
I will be
satisfied by
the ease of
preparation of
the fruits and
vegetables.
o o o o o o o
Please
respond to
this question
by clicking
'strongly
agree'. This is
to check if
you read the
questions
attentively.
o o o o o o o
I will be
satisfied by
the
environmental
impact of the
production of
the fruits and
vegetables.
o o o o o o o
Page 50
AN ABNORMAL APPLE A DAY, KEEPS FOOD WASTE AT BAY! 50
I will be
satisfied by
the global
quality of
these fruits
and
vegetables.
o o o o o o o
Please describe your overall feelings of the fruits and vegetables that were displayed.
Very
normal
Very
abnormal
1 2 3 5 6 7
The fruits and vegetables that were
displayed, were ...
Please choose the answer option you agree with the most.
Page 51
AN ABNORMAL APPLE A DAY, KEEPS FOOD WASTE AT BAY! 51
Strongly
disagree Disagree
Somewhat
disagree
Neither
disagree
nor
agree
Somewhat
agree Agree
Strongly
agree
The
supermarket
that sells the
fruits and
vegetables, is
a
supermarket
one can trust.
o o o o o o o
The
supermarket
that sells the
fruits and
vegetables,
has a
reputation
for selling
high-quality
food
products.
o o o o o o o
Which supermarket was selling the fruits and vegetables that were displayed?
o Aldi
o Albert Heijn
o I cannot remember
How well did you understand the English vocabulary used in this survey?
Not
at all
Extremely
well
1 2 3 5 6 7
1
Page 52
AN ABNORMAL APPLE A DAY, KEEPS FOOD WASTE AT BAY! 52
Appendix D
Factsheet
Dear participant,
I would like to invite you to participate in a research study to be conducted under the auspices
of the Graduate School of Communication, a part of the University of Amsterdam.
The study for which I am requesting your cooperation looks into people’s food preferences. In
the online survey, several fruits and vegetables will be displayed. Afterwards, a few questions
will be asked about your preference for these products. In addition, several questions will be
asked about your food consumption behaviour. You have to be 18 years old or above in order
to be able to cooperate into this study. The goal of this research is to generate insight into the
food preferences of people who live in the Netherlands. The survey will take about 6 minutes.
As this research is being carried out under the responsibility of the ASCoR, University of
Amsterdam, I can guarantee that:
1) Your anonymity will be safeguarded, and that your personal information will not be passed
on to third parties under any conditions, unless you first give your express permission for this.
2) You can refuse to participate in the research or cut short your participation without having
to give a reason for doing so. You also have up to 24 hours after participating to withdraw
your permission to allow your answers or data to be used in the research.
3) Participating in the research will not entail your being subjected to any appreciable risk or
discomfort, the researcher will not deliberately mislead you, and you will not be exposed to
any explicitly offensive material.
4) No later than five months after the conclusion of the research, we will be able to provide
you with a research report that explains the general results of the research.
Page 53
AN ABNORMAL APPLE A DAY, KEEPS FOOD WASTE AT BAY! 53
For more information about the research and the invitation to participate, you are welcome to
contact Rody Le by sending an e-mail to [email protected] at any time. Should you have any
complaints or comments about the course of the research and the procedures it involves as a
consequence of your participation in this research, you can contact the designated member of
the Ethics Committee representing ASCoR, at the following address: ASCoR Secretariat,
Ethics Committee, University of Amsterdam, Postbus 15793, 1001 NG Amsterdam; 020‐525
3680; ascor‐secr‐[email protected] . Any complaints or comments will be treated in the strictest
confidence.
I hope that I have provided you with sufficient information. I would like to take this
opportunity to thank you in advance for your assistance with this research, which I greatly
appreciate.
Kind regards,
Rody Le
Page 54
AN ABNORMAL APPLE A DAY, KEEPS FOOD WASTE AT BAY! 54
Appendix E
Informed Consent
I hereby declare that I have been informed in a clear manner about the nature and method of
the research, as described in the introduction for this study. I agree, fully and voluntarily, to
participate in this research study. With this, I retain the right to withdraw my consent, without
having to give a reason for doing so. I am aware that I may halt my participation in the
experiment at any time. If my research results are used in scientific publications or are made
public in another way, this will be done such a way that my anonymity is completely
safeguarded. My personal data will not be passed on to third parties without my express
permission.
If I wish to receive more information about the research, either now or in future, I can contact
Rody Le by sending an e-mail to [email protected] . Should I have any complaints about this
research, I can contact the designated member of the Ethics Committee representing the
ASCoR, at the following address: ASCoR secretariat, Ethics Committee, University of
Amsterdam, Postbus 15793, 1001 NG Amsterdam; 020‐525 3680; ascor‐secr‐[email protected] .
√ I understand the text presented above, and I agree to participate in the research study and I
am 18 years old or above
√ I understand the text presented above, and I do not agree to participate in the research study
and/or I am younger than 18
Page 55
AN ABNORMAL APPLE A DAY, KEEPS FOOD WASTE AT BAY! 55
Appendix F
Debriefing
Dear participant,
I would like to thank you for participating in this research study. The study you just
cooperated in looks into people’s food preferences for normal and abnormal shaped foods.
You were randomly selected to see either one of these. The food products are based on real
representations on what these foods can look like. Besides this, the study looks into the fact if
a supermarket’s reputation can influence the way people perceive certain food products. You
were randomly selected to read information with either the Aldi or the Albert Heijn
mentioned in it. It is possible that the mentioned supermarket does not sell these foods in
actual life. The supermarket is in no way affiliated in this research.
Again, I would like to thank you for participating in this research study. In case you would
like to talk about this study with others, I would kindly like to ask you if you could do this
after their participation in the study.
In case you have any remarks about the study, please write your comments in the text box
below.
If you wish to receive more information about the research, either now or in future, you are
welcome to contact Rody Le by sending an e-mail to [email protected] .
Kind regards,
Rody Le
Page 56
AN ABNORMAL APPLE A DAY, KEEPS FOOD WASTE AT BAY! 56
Appendix G
Main Study’s Measurement Model Results
Construct and Scale Items Factor
Loadings
Variance
Explained in %
Cronbach’s
α
Perceived Quality
I will be satisfied by the taste of the
fruits and vegetables.
.76
40.31
.78
I will be satisfied by the nutritional
quality of the fruits and vegetables.
.74
I will be satisfied by the sanitary quality
of the fruits and vegetables.
I will be satisfied by the ease of
preparation of the fruits and vegetables.
I will be satisfied by the environmental
impact of the production of the fruits
and vegetables.
I will be satisfied by the global quality
of the fruits and vegetables.
.75
.77
.02
.35
Purchase Intention
I would never/definitely purchase these
fruits and vegetables.
.94
86.63
.96
I definitely do not intend/definitely
intend to purchase these fruits and
vegetables.
.95
Page 57
AN ABNORMAL APPLE A DAY, KEEPS FOOD WASTE AT BAY! 57
I have a very low/high in purchasing
these fruits and vegetables.
I would definitely not/definitely
purchase these fruits and vegetables.
I would probably not/probably purchase
these fruits and vegetables.
.92
.94
.91
Firm Reputation
The supermarket that sells the fruits and
vegetables, is a supermarket one can
trust.
.91
82.34
.78
The supermarket that sells the fruits and
vegetables, has a reputation for selling
high-quality food products.
.91
Note. Factor Loadings > .45 are in boldface.