Hindawi Publishing CorporationComputational and Mathematical Methods in MedicineVolume 2013 Article ID 137392 14 pageshttpdxdoiorg1011552013137392
Research ArticleAn Improved Computer Vision Method forWhite Blood Cells Detection
Erik Cuevas Margarita Diacuteaz Miguel ManzanaresDaniel Zaldivar and Marco Perez-Cisneros
Departamento de Electronica Universidad de Guadalajara CUCEI Avenida Revolucion 1500 44430 Guadalajara JAL Mexico
Correspondence should be addressed to Erik Cuevas erikcuevascuceiudgmx
Received 7 February 2013 Accepted 8 April 2013
Academic Editor Juan Manuel Gorriz
Copyright copy 2013 Erik Cuevas et al This is an open access article distributed under the Creative Commons Attribution Licensewhich permits unrestricted use distribution and reproduction in any medium provided the original work is properly cited
The automatic detection of white blood cells (WBCs) still remains as an unsolved issue in medical imaging The analysis of WBCimages has engaged researchers from fields of medicine and computer vision alike SinceWBC can be approximated by an ellipsoidform an ellipse detector algorithmmaybe successfully applied in order to recognize such elementsThis paper presents an algorithmfor the automatic detection ofWBC embedded in complicated and cluttered smear images that considers the complete process as amultiellipse detection problemThe approach which is based on the differential evolution (DE) algorithm transforms the detectiontask into an optimization problemwhose individuals represent candidate ellipses An objective function evaluates if such candidateellipses are actually present in the edgemap of the smear image Guided by the values of such function the set of encoded candidateellipses (individuals) are evolved using the DE algorithm so that they can fit into theWBCs which are enclosed within the edgemapof the smear image Experimental results from white blood cell images with a varying range of complexity are included to validatethe efficiency of the proposed technique in terms of its accuracy and robustness
1 Introduction
Medical image processing has become more and moreimportant in diagnosis with the development of medicalimaging and computer technique Huge amounts of medicalimages are obtained by X-ray radiography CT and MRIThey provide essential information for efficient and accuratediagnosis based on advanced computer vision techniques[1 2]
On the other hand white blood cells (WBCs) also knownas leukocytes play a significant role in the diagnosis ofdifferent diseases Although computer vision techniques havesuccessfully contributed to generating new methods for cellanalysis which in turn have led tomore accurate and reliablesystems for disease diagnosis high variability on cell shapesize edge and localization complicates the data extractionprocess Moreover the contrast between cell boundaries andthe imagersquos background may vary due to unstable lightingconditions during the capturing process
Manyworks have been conducted in the area of blood celldetection In [3] amethodbased onboundary support vectors
is proposed to identify WBC In such approach the intensityof each pixel is used to construct feature vectors whereasa support vector machine (SVM) is used for classificationand segmentation By using a different approach in [4]Wu et al developed an iterative Otsu method based on thecircular histogram for leukocyte segmentation According tosuch technique the smear images are processed in the hue-saturation-intensity (HSI) space by considering that the huecomponent contains most of the WBC information One ofthe latest advances in white blood cell detection researchis the algorithm proposed by Wang [5] that is based onthe fuzzy cellular neural network (FCNN) Although suchmethod has proved successful in detecting only one leukocytein the image it has not been tested over images containingseveral white cells Moreover its performance commonlydecays when the iteration number is not properly definedyielding a challenging problem itself with no clear clues onhow to make the best choice
Since white blood cells can be approximated with anellipsoid form computer vision techniques for detectingellipses may be used in order to recognize them Ellipse
2 Computational and Mathematical Methods in Medicine
detection in real images is an open research problem longtime ago Several approaches have been proposed whichtraditionally fall under three categories symmetry-basedHough transform-based (HT) and random sampling
In symmetry-based detection [6 7] the ellipse geometryis taken into account The most common elements used inellipse geometry are the ellipse center and axis Using theseelements and edges in the image the ellipse parameters can befound Ellipse detection in digital images is commonly solvedthrough the Hough transform [8] It works by representingthe geometric shape by its set of parameters and thenaccumulating bins in the quantized parameter space Peaksin the bins provide the indication of where ellipses may beObviously since the parameters are quantized into discretebins the intervals of the bins directly affect the accuracyof the results and the computational effort Therefore forfine quantization of the space the algorithm returns moreaccurate results while suffering from largememory loads andexpensive computation In order to overcome such a problemsome other researchers have proposed other ellipse detectorsfollowing the Hough transform principles by using randomsampling In random sampling-based approaches [9 10] abin represents a candidate shape rather than a set of quantizedparameters as in the HT However like the HT randomsampling approaches go through an accumulation processfor the bins The bin with the highest score represents thebest approximation of an actual ellipse in the target imageMcLaughlinrsquos work [11] shows that a random sampling-basedapproach produces improvements in accuracy and compu-tational complexity as well as a reduction in the number offalse positives (nonexistent ellipses) when compared to theoriginal HT and the number of its improved variants
As an alternative to traditional techniques the problem ofellipse detection has also been handled through optimizationmethods In general they have demonstrated to give betterresults than those based on the HT and random samplingwith respect to accuracy and robustness [13] Such approacheshave produced several robust ellipse detectors using differentoptimization algorithms such as genetic algorithms (GAs)[14 15] and particle swarm optimization (PSO) [16]
Although detection algorithms based on optimizationapproaches present several advantages in comparison totraditional approaches they have been scarcely applied toWBC detection One exception is the work presented byKarkavitsas andRangoussi [12] that solves theWBCdetectionproblem through the use of GA However since the evalu-ation function which assesses the quality of each solutionconsiders the number of pixels contained inside of a circlewith fixed radius the method is prone to produce misde-tections particularly for images that contained overlapped orirregular WBC
In this paper the WBC detection task is approachedas an optimization problem and the differential evolutionalgorithm is used to build the ellipsoidal approximationDifferential evolution (DE) introduced by Storn and Price[17] is a novel evolutionary algorithm which is used tooptimize complex continuous nonlinear functions As apopulation-based algorithm DE uses simple mutation andcrossover operators to generate new candidate solutions and
applies one-to-one competition scheme to greedily decidewhether the new candidate or its parent will survive in thenext generationDue to its simplicity ease of implementationfast convergence and robustness the DE algorithm hasgained much attention reporting a wide range of successfulapplications in the literature [18ndash22]
This paper presents an algorithm for the automaticdetection of blood cell images based on the DE algorithmThe proposedmethod uses the encoding of five edge points ascandidate ellipses in the edge map of the smear An objectivefunction allows to accurately measure the resemblance of acandidate ellipse with an actual WBC on the image Guidedby the values of such objective function the set of encodedcandidate ellipses are evolved using the DE algorithm so thatthey can fit into actual WBC on the image The approachgenerates a subpixel detector which can effectively identifyleukocytes in real images Experimental evidence showsthe effectiveness of such method in detecting leukocytesdespite complex conditions Comparison to the state-of-the-art WBC detectors on multiple images demonstrates a betterperformance of the proposed method
The main contribution of this study is the proposal ofa new WBC detector algorithm that efficiently recognizesWBC under different complex conditions while consideringthe whole process as an ellipse detection problem Althoughellipse detectors based on optimization present several inter-esting properties to the best of our knowledge they have notyet been applied to any medical image processing up to date
This paper is organized as follows Section 2 provides adescription of the DE algorithm while in Section 3 the ellipsedetection task is fully explained from an optimization per-spective within the context of the DE approachThe completeWBC detector is presented in Section 4 Section 5 reports theobtained experimental results whereas Section 6 conducts acomparison between state-of-the-art WBC detectors and theproposed approach Finally in Section 7 some conclusionsare drawn
2 Differential Evolution Algorithm
The DE algorithm is a simple and direct search algorithmwhich is based on population and aims for optimizing globalmultimodal functions DE employs the mutation operator toprovide the exchange of information among several solutions
There are various mutation base generators to definethe algorithm type The version of DE algorithm used inthis work is known as rand-to-best1bin or ldquoDE1rdquo [23] DEalgorithms begin by initializing a population of 119873119901 and D-dimensional vectors considering parameter values that arerandomly distributed between the prespecified lower initialparameter bound 119909119895 low and the upper initial parameterbound 119909119895 high as follows
119909119895 119894 119905 = 119909119895 low + rand (0 1) sdot (119909119895 high minus 119909119895 low)
The subscript 119905 is the generation index while 119895 and 119894 arethe parameter and particle indexes respectively Hence 119909119895 119894 119905
Computational and Mathematical Methods in Medicine 3
is the jth parameter of the 119894th particle in generation 119905 In orderto generate a trial solution DE algorithm first mutates thebest solution vector xbest 119905 from the current population byadding the scaled difference of two vectors from the currentpopulation
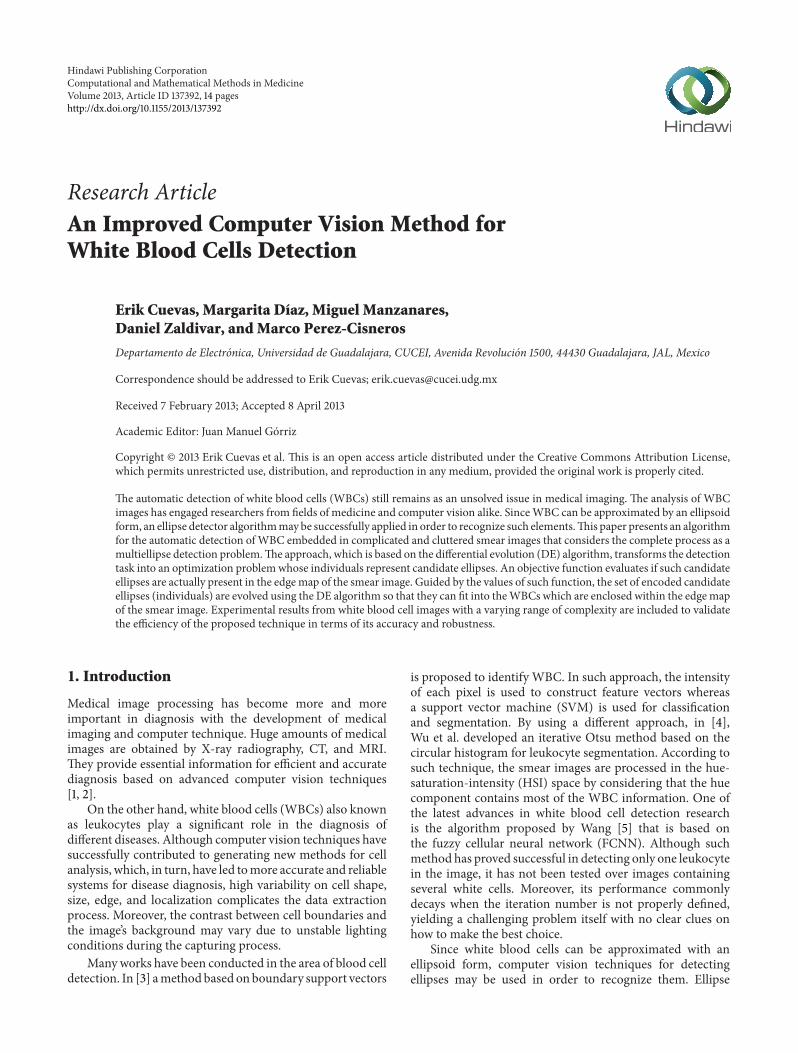
with k119894 119905 being the mutant vector Indices 1199031 and 1199032 arerandomly selected with the condition that they are differentand have no relation to the particle index 119894 whatsoever (ie1199031 = 1199032 = 119894) The mutation scale factor 119865 is a positive realnumber typically less than one Figure 1 illustrates the vector-generation process defined by (2)
In order to increase the diversity of the parameter vectorthe crossover operation is applied between the mutant vectork119894 119905 and the original individuals x119894 119905 The result is the trialvector u119894 119905 which is computed by considering element toelement as follows
119906119895 119894 119905 = V119895 119894 119905 if rand (0 1) le CR or 119895 = 119895rand119909119895 119894 119905 otherwise
(3)
with 119895rand isin 1 2 119863 The crossover parameter (00 le
CR le 10) controls the fraction of parameters that themutantvector is contributing to the final trial vector In additionthe trial vector always inherits the mutant vector parameteraccording to the randomly chosen index 119895rand assuring thatthe trial vector differs by at least one parameter from thevector to which it is compared (x119894 119905)
Finally a greedy selection is used to find better solutionsThus if the computed cost function value of the trial vectoru119894 119905 is less than or equal to the cost of the vector x119894 119905 then suchtrial vector replaces x119894 119905 in the next generation Otherwise x119894 119905remains in the population for at least one more generation
x119894 119905+1 = u119894 119905 if 119891 (u119894 119905) le 119891 (x119894 119905) x119894 119905 otherwise
(4)
Here 119891( ) represents the objective function These pro-cesses are repeated until a termination criterion is attained ora predetermined generation number is reached
3 Ellipse Detection Using DE
31 Data Preprocessing In order to detect ellipse shapescandidate images must be preprocessed first by an edgedetection algorithm which yields an edge map image Thenthe (119909119894 119910119894) coordinates for each edge pixel 119901119894 are stored insidethe edge vector 119875 = 1199011 1199012 119901119873
119901
with119873119901 being the totalnumber of edge pixels
32 Individual Representation Just as a line requires twopoints to completely define its characteristics an ellipse isdefined by five points Therefore each candidate solution E(ellipse candidate) considers five edge points to representan individual Under such representation edge points are
selected following a random positional index within the edgearray 119875 This procedure will encode a candidate solution asthe ellipse that passes throughfive points1199011 1199012 1199013 1199014 and1199015(119864 = 1199011 1199012 1199013 1199014 1199015)Thus by substituting the coordinatesof each point of119864 into (5) we gather a set of five simultaneousequations which are linear in the five unknown parameters119886 119887 119891 119892 and ℎ
1198861199092+ 2ℎ119909119910 + 119887119910
2+ 2119892119909 + 2119891119910 + 1 = 0 (5)
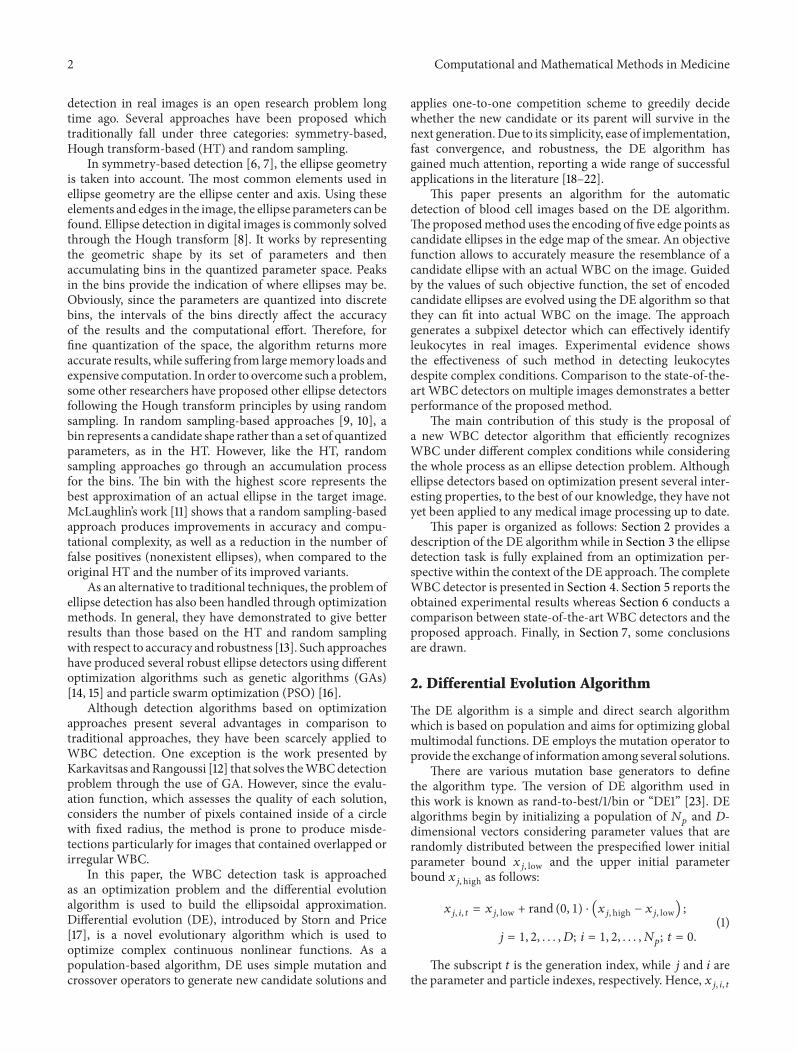
Considering the configuration of the edge points shown byFigure 2 the ellipse center (1199090 1199100) the radius maximum(119903max) the radiusminimum (119903min) and the ellipse orientation(120579) can be calculated as follows
33 Objective Function Optimization refers to choosing thebest element from one set of available alternatives In thesimplest case it means to minimize an objective function orerror by systematically choosing the values of variables fromtheir valid ranges In order to calculate the error produced bya candidate solution E the ellipse coordinates are calculatedas a virtual shape which in turn must also be validated ifit really exists in the edge image The test set is representedby 119878 = 1199041 1199042 119904119873
119904
where 119873119904 are the number of pointsover which the existence of an edge point corresponding toE should be tested
The set 119878 is generated by the Midpoint Ellipse Algorithm(MEA) [24] which is a searching method that seeks requiredpoints for drawing an ellipse For any point (x y) lying on theboundary of the ellipse with 119886 ℎ 119887 119892 and f it does satisfy theequation119891ellipse(119909 119910) cong 119903max119909
2+119903min119910
2minus1199032
max1199032
min where 119903maxand 119903min represent the major and minor axes respectivelyHoweverMEAavoids computing square-root calculations bycomparing the pixel separation distances Amethod for directdistance comparison is to test the halfway position betweentwo pixels (subpixel distance) to determine if this midpointis inside or outside the ellipse boundary If the point is in the
4 Computational and Mathematical Methods in Medicine
1199092
1199091
x1199031119905 minus x1199032119905
x1199031119905
x1199032119905119865 middot (x1199031119905 minus x1199032119905)
v119894119905
119905xbest
Figure 1 Two-dimensional example of an objective function show-ing its contour lines and the process for generating v in schemeDEbestlexp from vectors of the current generation
119910
119909
120579
1199011
1199012
1199013
119903min119903max
11990141199015
(1199090 1199100)
Figure 2 Ellipse candidate (individual) built from the combinationof points 1199011 1199012 1199013 1199014 and 1199015
interior of the ellipse the ellipse function is negative Thus ifthe point is outside the ellipse the ellipse function is positiveTherefore the error involved in locating pixel positions usingthe midpoint test is limited to one-half the pixel separation(subpixel precision) To summarize the relative position ofany point (x y) can be determined by checking the sign ofthe ellipse function
119891ellipse (119909 119910)
lt0 if (119909 119910) is inside the ellipse boundary=0 if (119909 119910) is on the ellipse boundarygt0 if (119909 119910) is outside the ellipse boundary
(8)
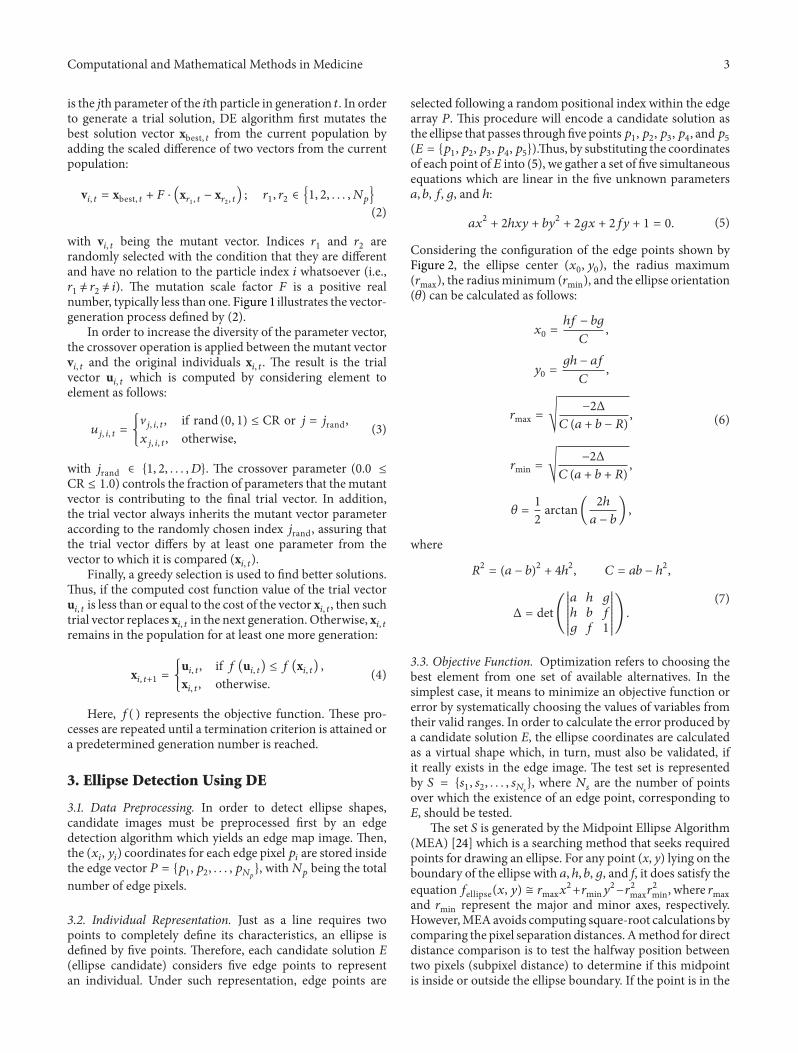
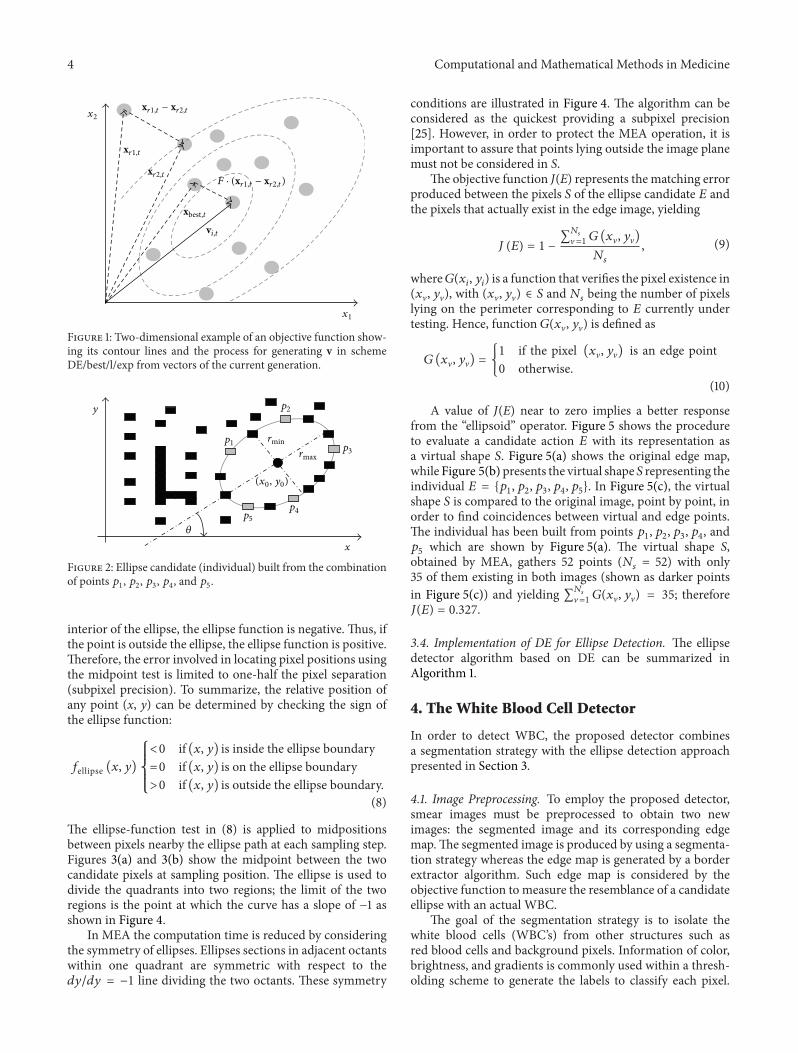
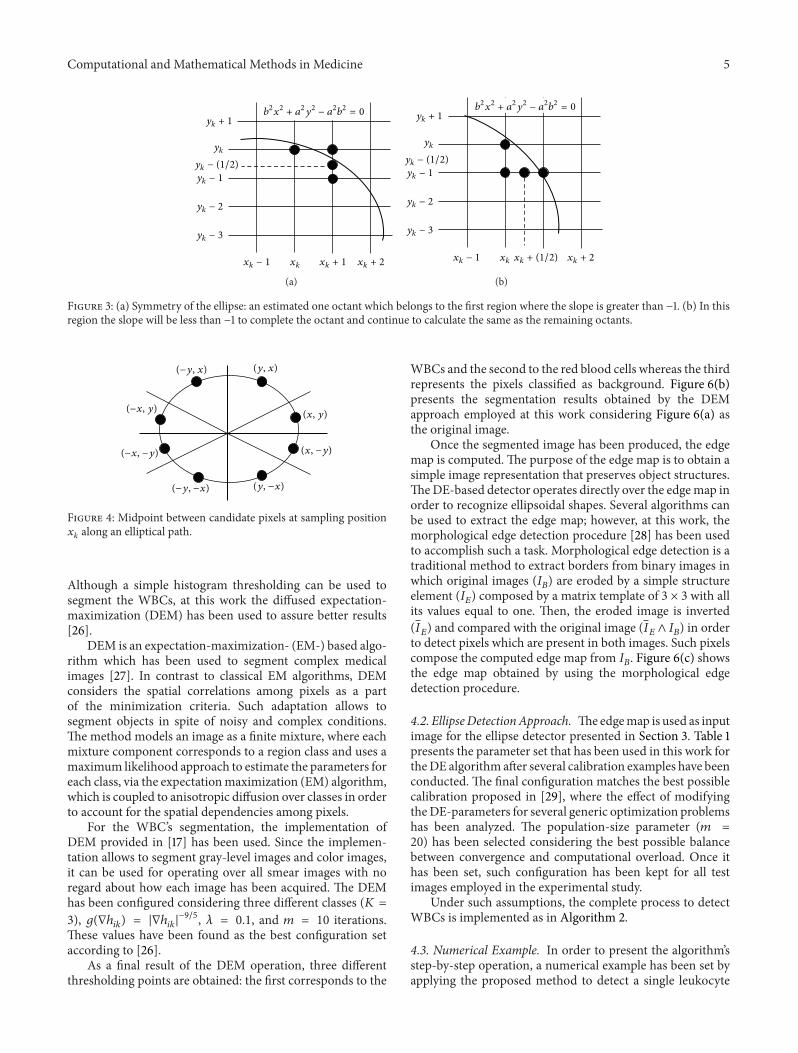
The ellipse-function test in (8) is applied to midpositionsbetween pixels nearby the ellipse path at each sampling stepFigures 3(a) and 3(b) show the midpoint between the twocandidate pixels at sampling position The ellipse is used todivide the quadrants into two regions the limit of the tworegions is the point at which the curve has a slope of minus1 asshown in Figure 4
In MEA the computation time is reduced by consideringthe symmetry of ellipses Ellipses sections in adjacent octantswithin one quadrant are symmetric with respect to the119889119910119889119910 = minus1 line dividing the two octants These symmetry
conditions are illustrated in Figure 4 The algorithm can beconsidered as the quickest providing a subpixel precision[25] However in order to protect the MEA operation it isimportant to assure that points lying outside the image planemust not be considered in S
The objective function J(E) represents the matching errorproduced between the pixels 119878 of the ellipse candidate 119864 andthe pixels that actually exist in the edge image yielding
119869 (119864) = 1 minussum119873119904
V=1 119866 (119909V 119910V)
119873119904
(9)
where119866(119909119894 119910119894) is a function that verifies the pixel existence in(119909V 119910V) with (119909V 119910V) isin 119878 and119873119904 being the number of pixelslying on the perimeter corresponding to 119864 currently undertesting Hence function 119866(119909V 119910V) is defined as
119866 (119909V 119910V) = 1 if the pixel (119909V 119910V) is an edge point0 otherwise
(10)
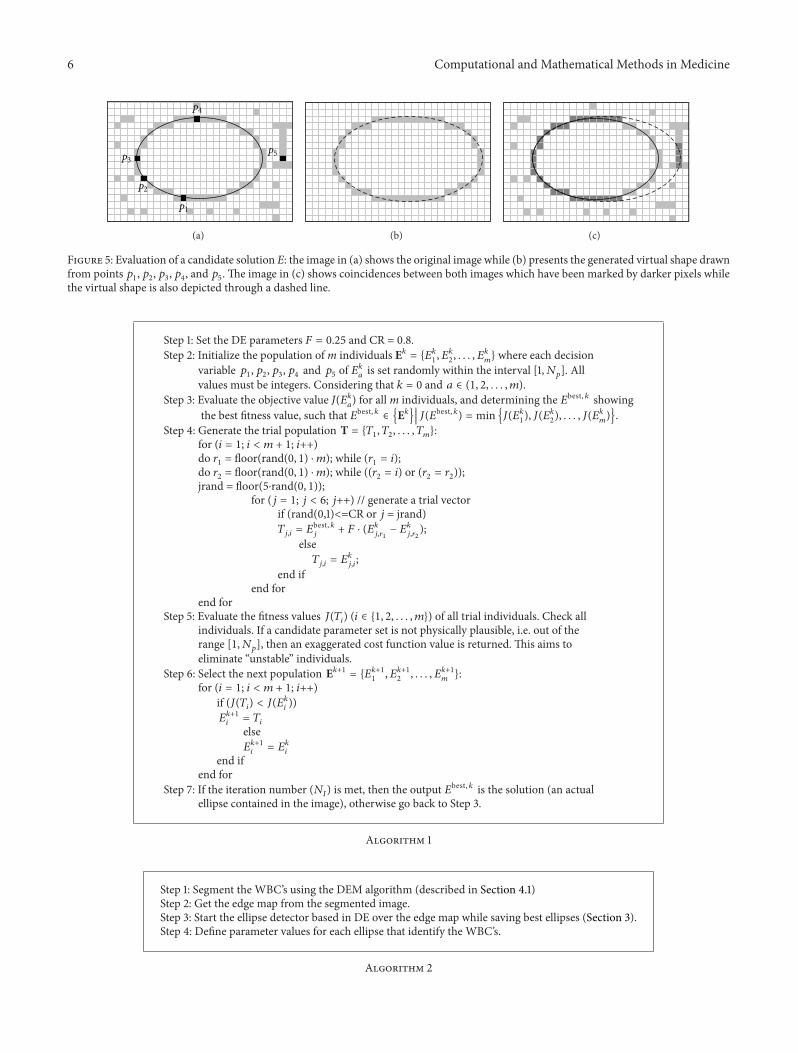
A value of J(E) near to zero implies a better responsefrom the ldquoellipsoidrdquo operator Figure 5 shows the procedureto evaluate a candidate action 119864 with its representation asa virtual shape 119878 Figure 5(a) shows the original edge mapwhile Figure 5(b) presents the virtual shape 119878 representing theindividual 119864 = 1199011 1199012 1199013 1199014 1199015 In Figure 5(c) the virtualshape 119878 is compared to the original image point by point inorder to find coincidences between virtual and edge pointsThe individual has been built from points 1199011 1199012 1199013 1199014 and1199015 which are shown by Figure 5(a) The virtual shape Sobtained by MEA gathers 52 points (119873119904 = 52) with only35 of them existing in both images (shown as darker pointsin Figure 5(c)) and yielding sum119873119904V=1 119866(119909V 119910V) = 35 therefore119869(119864) = 0327
34 Implementation of DE for Ellipse Detection The ellipsedetector algorithm based on DE can be summarized inAlgorithm 1
4 The White Blood Cell Detector
In order to detect WBC the proposed detector combinesa segmentation strategy with the ellipse detection approachpresented in Section 3
41 Image Preprocessing To employ the proposed detectorsmear images must be preprocessed to obtain two newimages the segmented image and its corresponding edgemapThe segmented image is produced by using a segmenta-tion strategy whereas the edge map is generated by a borderextractor algorithm Such edge map is considered by theobjective function to measure the resemblance of a candidateellipse with an actual WBC
The goal of the segmentation strategy is to isolate thewhite blood cells (WBCrsquos) from other structures such asred blood cells and background pixels Information of colorbrightness and gradients is commonly used within a thresh-olding scheme to generate the labels to classify each pixel
Computational and Mathematical Methods in Medicine 5
11988721199092 + 11988621199102 minus 11988621198872 = 0119910119896 + 1
119910119896
119910119896 minus (12)
119910119896 minus 1
119910119896 minus 2
119910119896 minus 3
119909119896 minus 1 119909119896 119909119896 + 1 119909119896 + 2
(a)
11988721199092 + 11988621199102 minus 11988621198872 = 0119910119896 + 1
119910119896
119910119896 minus (12)
119910119896 minus 1
119910119896 minus 2
119910119896 minus 3
119909119896 minus 1 119909119896 119909119896 + 2119909119896 + (12)
(b)
Figure 3 (a) Symmetry of the ellipse an estimated one octant which belongs to the first region where the slope is greater than minus1 (b) In thisregion the slope will be less than minus1 to complete the octant and continue to calculate the same as the remaining octants
(119910 119909)(minus119910 119909)
(minus119909 119910)
(minus119909 minus119910)
(minus119910 minus119909) (119910 minus119909)
(119909 minus119910)
(119909 119910)
Figure 4 Midpoint between candidate pixels at sampling position119909119896 along an elliptical path
Although a simple histogram thresholding can be used tosegment the WBCs at this work the diffused expectation-maximization (DEM) has been used to assure better results[26]
DEM is an expectation-maximization- (EM-) based algo-rithm which has been used to segment complex medicalimages [27] In contrast to classical EM algorithms DEMconsiders the spatial correlations among pixels as a partof the minimization criteria Such adaptation allows tosegment objects in spite of noisy and complex conditionsThe method models an image as a finite mixture where eachmixture component corresponds to a region class and uses amaximum likelihood approach to estimate the parameters foreach class via the expectationmaximization (EM) algorithmwhich is coupled to anisotropic diffusion over classes in orderto account for the spatial dependencies among pixels
For the WBCrsquos segmentation the implementation ofDEM provided in [17] has been used Since the implemen-tation allows to segment gray-level images and color imagesit can be used for operating over all smear images with noregard about how each image has been acquired The DEMhas been configured considering three different classes (119870 =
These values have been found as the best configuration setaccording to [26]
As a final result of the DEM operation three differentthresholding points are obtained the first corresponds to the
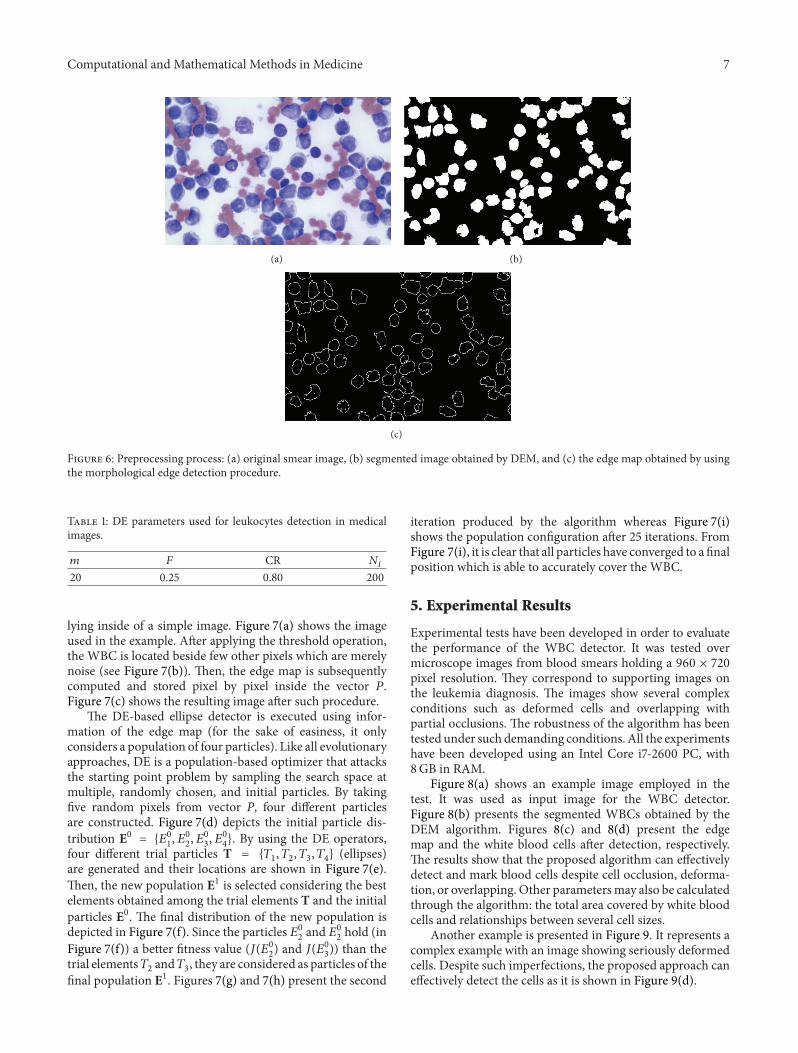
WBCs and the second to the red blood cells whereas the thirdrepresents the pixels classified as background Figure 6(b)presents the segmentation results obtained by the DEMapproach employed at this work considering Figure 6(a) asthe original image
Once the segmented image has been produced the edgemap is computed The purpose of the edge map is to obtain asimple image representation that preserves object structuresTheDE-based detector operates directly over the edgemap inorder to recognize ellipsoidal shapes Several algorithms canbe used to extract the edge map however at this work themorphological edge detection procedure [28] has been usedto accomplish such a task Morphological edge detection is atraditional method to extract borders from binary images inwhich original images (119868119861) are eroded by a simple structureelement (119868119864) composed by a matrix template of 3 times 3 with allits values equal to one Then the eroded image is inverted(119868119864) and compared with the original image (119868119864 and 119868119861) in orderto detect pixels which are present in both images Such pixelscompose the computed edge map from 119868119861 Figure 6(c) showsthe edge map obtained by using the morphological edgedetection procedure
42 EllipseDetectionApproach Theedgemap is used as inputimage for the ellipse detector presented in Section 3 Table 1presents the parameter set that has been used in this work fortheDE algorithm after several calibration examples have beenconducted The final configuration matches the best possiblecalibration proposed in [29] where the effect of modifyingtheDE-parameters for several generic optimization problemshas been analyzed The population-size parameter (119898 =
20) has been selected considering the best possible balancebetween convergence and computational overload Once ithas been set such configuration has been kept for all testimages employed in the experimental study
Under such assumptions the complete process to detectWBCs is implemented as in Algorithm 2
43 Numerical Example In order to present the algorithmrsquosstep-by-step operation a numerical example has been set byapplying the proposed method to detect a single leukocyte
6 Computational and Mathematical Methods in Medicine
1199011
1199012
1199013
1199014
1199015
(a) (b) (c)
Figure 5 Evaluation of a candidate solution E the image in (a) shows the original image while (b) presents the generated virtual shape drawnfrom points 1199011 1199012 1199013 1199014 and 1199015 The image in (c) shows coincidences between both images which have been marked by darker pixels whilethe virtual shape is also depicted through a dashed line
Step 1 Set the DE parameters 119865 = 025 and CR = 08Step 2 Initialize the population ofm individuals E119896 = 119864119896
1 119864119896
2 119864
119896
119898 where each decision
variable 1199011119901211990131199014 and 1199015 of 119864119896
119886is set randomly within the interval [1119873119901] All
values must be integers Considering that 119896 = 0 and 119886 isin (1 2 119898)Step 3 Evaluate the objective value J(119864119896
119886) for allm individuals and determining the 119864best 119896 showing
the best fitness value such that 119864best 119896isin E11989610038161003816100381610038161003816 119869(119864
best 119896) = min 119869(119864119896
1) 119869(119864
119896
2) 119869(119864
119896
119898)
Step 4 Generate the trial population T = 1198791 1198792 119879119898for (119894 = 1 119894 lt 119898 + 1 119894++)do 1199031 = floor(rand(0 1) sdot 119898) while (1199031 = 119894)do 1199032 = floor(rand(0 1) sdot 119898) while ((1199032 = 119894) or (1199032 = 1199032))jrand = floor(5sdotrand(0 1))
for (119895 = 1 119895 lt 6 119895++) generate a trial vectorif (rand(01)lt=CR or 119895 = jrand)119879119895119894 = 119864
best 119896119895
+ 119865 sdot (119864119896
1198951199031minus 119864119896
1198951199032)
else119879119895119894 = 119864
119896
119895119894
end ifend for
end forStep 5 Evaluate the fitness values 119869(119879119894) (119894 isin 1 2 119898) of all trial individuals Check all
individuals If a candidate parameter set is not physically plausible ie out of therange [1119873119901] then an exaggerated cost function value is returned This aims toeliminate ldquounstablerdquo individuals
Step 6 Select the next population E119896+1 = 119864119896+11 119864119896+1
Step 7 If the iteration number (119873119868) is met then the output 119864best 119896 is the solution (an actualellipse contained in the image) otherwise go back to Step 3
Algorithm 1
Step 1 Segment the WBCrsquos using the DEM algorithm (described in Section 41)Step 2 Get the edge map from the segmented imageStep 3 Start the ellipse detector based in DE over the edge map while saving best ellipses (Section 3)Step 4 Define parameter values for each ellipse that identify the WBCrsquos
Algorithm 2
Computational and Mathematical Methods in Medicine 7
(a) (b)
(c)
Figure 6 Preprocessing process (a) original smear image (b) segmented image obtained by DEM and (c) the edge map obtained by usingthe morphological edge detection procedure
Table 1 DE parameters used for leukocytes detection in medicalimages
119898 119865 CR 119873119868
20 025 080 200
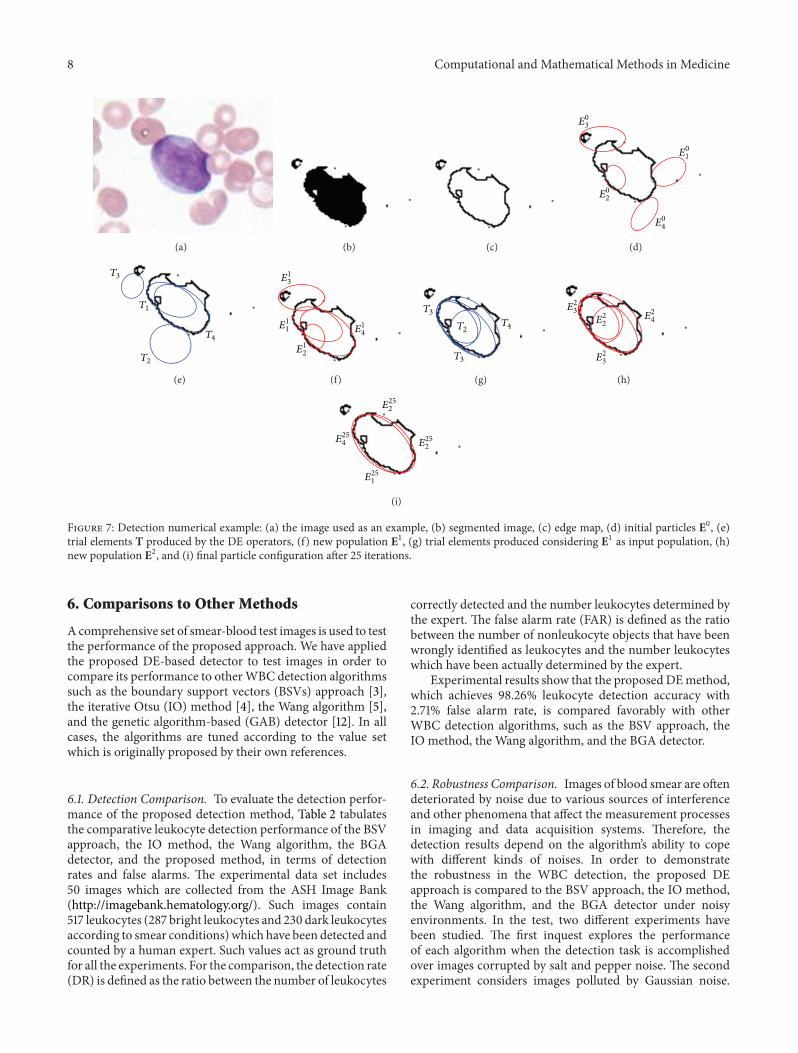
lying inside of a simple image Figure 7(a) shows the imageused in the example After applying the threshold operationthe WBC is located beside few other pixels which are merelynoise (see Figure 7(b)) Then the edge map is subsequentlycomputed and stored pixel by pixel inside the vector 119875Figure 7(c) shows the resulting image after such procedure
The DE-based ellipse detector is executed using infor-mation of the edge map (for the sake of easiness it onlyconsiders a population of four particles) Like all evolutionaryapproaches DE is a population-based optimizer that attacksthe starting point problem by sampling the search space atmultiple randomly chosen and initial particles By takingfive random pixels from vector P four different particlesare constructed Figure 7(d) depicts the initial particle dis-tribution E0 = 119864
0
1 1198640
2 1198640
3 1198640
4 By using the DE operators
four different trial particles T = 1198791 1198792 1198793 1198794 (ellipses)are generated and their locations are shown in Figure 7(e)Then the new population E1 is selected considering the bestelements obtained among the trial elements T and the initialparticles E0 The final distribution of the new population isdepicted in Figure 7(f) Since the particles 1198640
2and 1198640
2hold (in
Figure 7(f)) a better fitness value (119869(11986402) and 119869(1198640
3)) than the
trial elements1198792 and1198793 they are considered as particles of thefinal population E1 Figures 7(g) and 7(h) present the second
iteration produced by the algorithm whereas Figure 7(i)shows the population configuration after 25 iterations FromFigure 7(i) it is clear that all particles have converged to a finalposition which is able to accurately cover the WBC
5 Experimental Results
Experimental tests have been developed in order to evaluatethe performance of the WBC detector It was tested overmicroscope images from blood smears holding a 960 times 720pixel resolution They correspond to supporting images onthe leukemia diagnosis The images show several complexconditions such as deformed cells and overlapping withpartial occlusions The robustness of the algorithm has beentested under such demanding conditions All the experimentshave been developed using an Intel Core i7-2600 PC with8GB in RAM
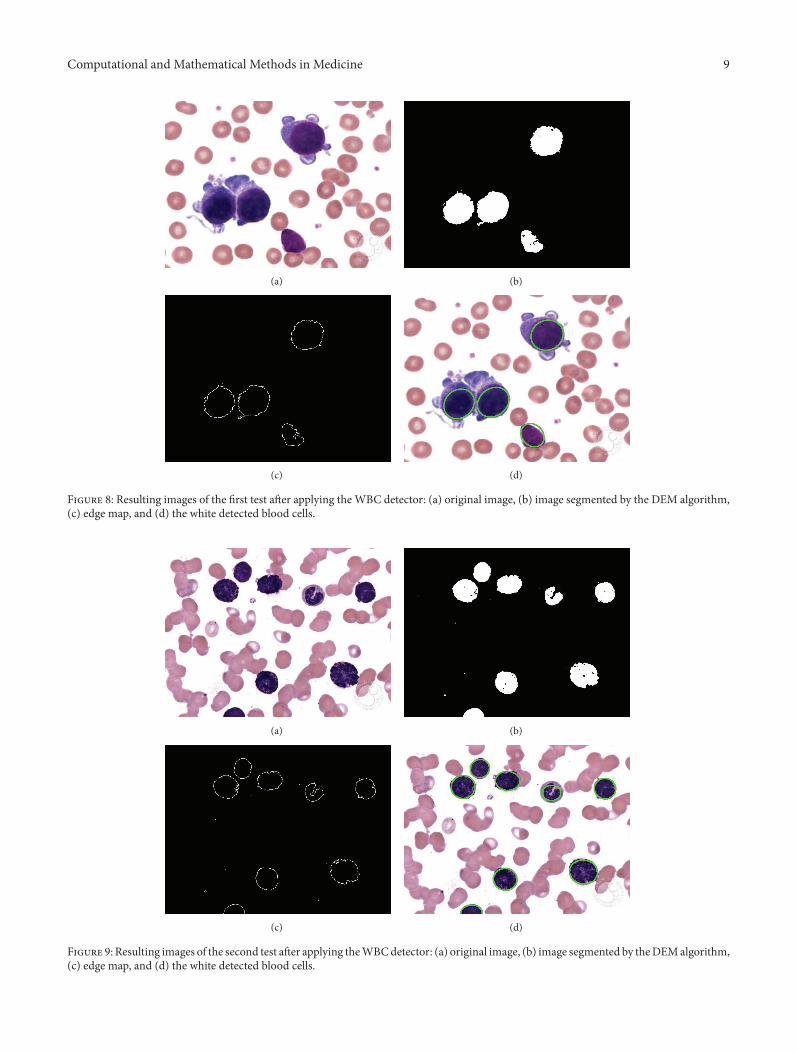
Figure 8(a) shows an example image employed in thetest It was used as input image for the WBC detectorFigure 8(b) presents the segmented WBCs obtained by theDEM algorithm Figures 8(c) and 8(d) present the edgemap and the white blood cells after detection respectivelyThe results show that the proposed algorithm can effectivelydetect and mark blood cells despite cell occlusion deforma-tion or overlapping Other parametersmay also be calculatedthrough the algorithm the total area covered by white bloodcells and relationships between several cell sizes
Another example is presented in Figure 9 It represents acomplex example with an image showing seriously deformedcells Despite such imperfections the proposed approach caneffectively detect the cells as it is shown in Figure 9(d)
8 Computational and Mathematical Methods in Medicine
(a) (b) (c)
11986403
11986401
11986402
11986404
(d)
1198793
1198791
1198792
1198794
(e)
11986413
11986414
11986411
11986412
(f)
1198793
1198793
11987921198794
(g)
11986423
119864241198642
2
11986423
(h)
119864252
119864254
119864251
119864252
(i)
Figure 7 Detection numerical example (a) the image used as an example (b) segmented image (c) edge map (d) initial particles E0 (e)trial elements T produced by the DE operators (f) new population E1 (g) trial elements produced considering E1 as input population (h)new population E2 and (i) final particle configuration after 25 iterations
6 Comparisons to Other Methods
Acomprehensive set of smear-blood test images is used to testthe performance of the proposed approach We have appliedthe proposed DE-based detector to test images in order tocompare its performance to otherWBC detection algorithmssuch as the boundary support vectors (BSVs) approach [3]the iterative Otsu (IO) method [4] the Wang algorithm [5]and the genetic algorithm-based (GAB) detector [12] In allcases the algorithms are tuned according to the value setwhich is originally proposed by their own references
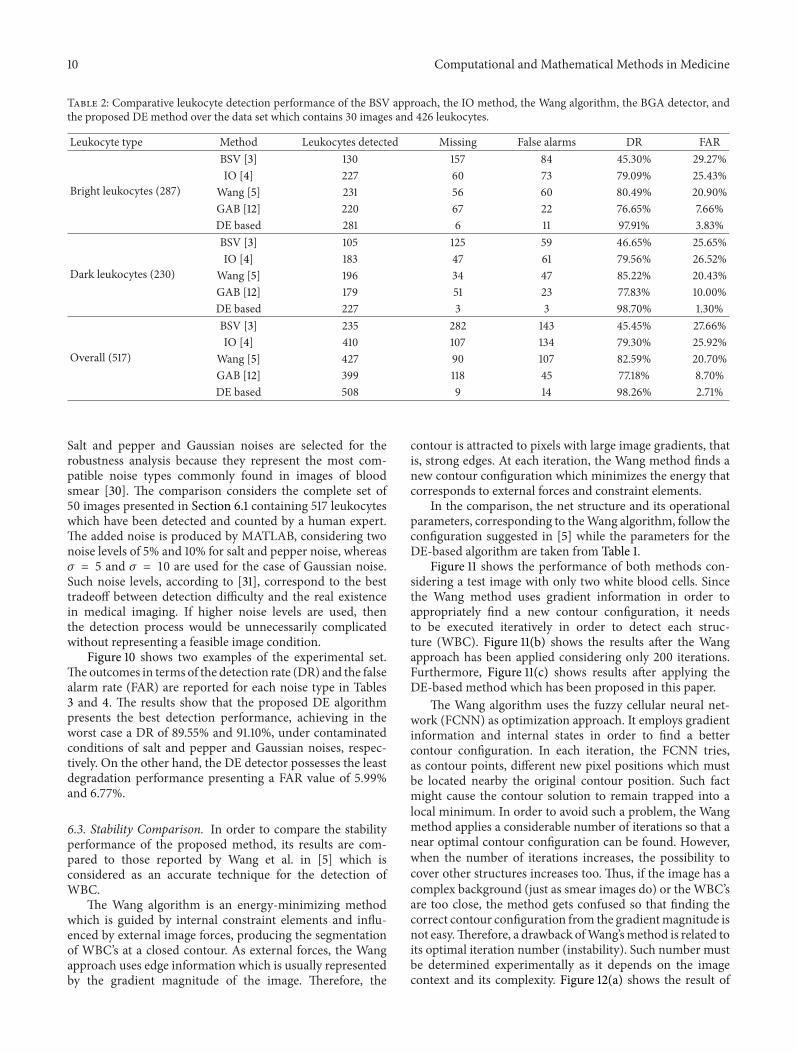
61 Detection Comparison To evaluate the detection perfor-mance of the proposed detection method Table 2 tabulatesthe comparative leukocyte detection performance of the BSVapproach the IO method the Wang algorithm the BGAdetector and the proposed method in terms of detectionrates and false alarms The experimental data set includes50 images which are collected from the ASH Image Bank(httpimagebankhematologyorg) Such images contain517 leukocytes (287 bright leukocytes and 230 dark leukocytesaccording to smear conditions) which have been detected andcounted by a human expert Such values act as ground truthfor all the experiments For the comparison the detection rate(DR) is defined as the ratio between the number of leukocytes
correctly detected and the number leukocytes determined bythe expert The false alarm rate (FAR) is defined as the ratiobetween the number of nonleukocyte objects that have beenwrongly identified as leukocytes and the number leukocyteswhich have been actually determined by the expert
Experimental results show that the proposed DEmethodwhich achieves 9826 leukocyte detection accuracy with271 false alarm rate is compared favorably with otherWBC detection algorithms such as the BSV approach theIO method the Wang algorithm and the BGA detector
62 Robustness Comparison Images of blood smear are oftendeteriorated by noise due to various sources of interferenceand other phenomena that affect the measurement processesin imaging and data acquisition systems Therefore thedetection results depend on the algorithmrsquos ability to copewith different kinds of noises In order to demonstratethe robustness in the WBC detection the proposed DEapproach is compared to the BSV approach the IO methodthe Wang algorithm and the BGA detector under noisyenvironments In the test two different experiments havebeen studied The first inquest explores the performanceof each algorithm when the detection task is accomplishedover images corrupted by salt and pepper noise The secondexperiment considers images polluted by Gaussian noise
Computational and Mathematical Methods in Medicine 9
(a) (b)
(c) (d)
Figure 8 Resulting images of the first test after applying the WBC detector (a) original image (b) image segmented by the DEM algorithm(c) edge map and (d) the white detected blood cells
(a) (b)
(c) (d)
Figure 9 Resulting images of the second test after applying theWBCdetector (a) original image (b) image segmented by theDEMalgorithm(c) edge map and (d) the white detected blood cells
10 Computational and Mathematical Methods in Medicine
Table 2 Comparative leukocyte detection performance of the BSV approach the IO method the Wang algorithm the BGA detector andthe proposed DE method over the data set which contains 30 images and 426 leukocytes
Leukocyte type Method Leukocytes detected Missing False alarms DR FAR
Wang [5] 427 90 107 8259 2070GAB [12] 399 118 45 7718 870DE based 508 9 14 9826 271
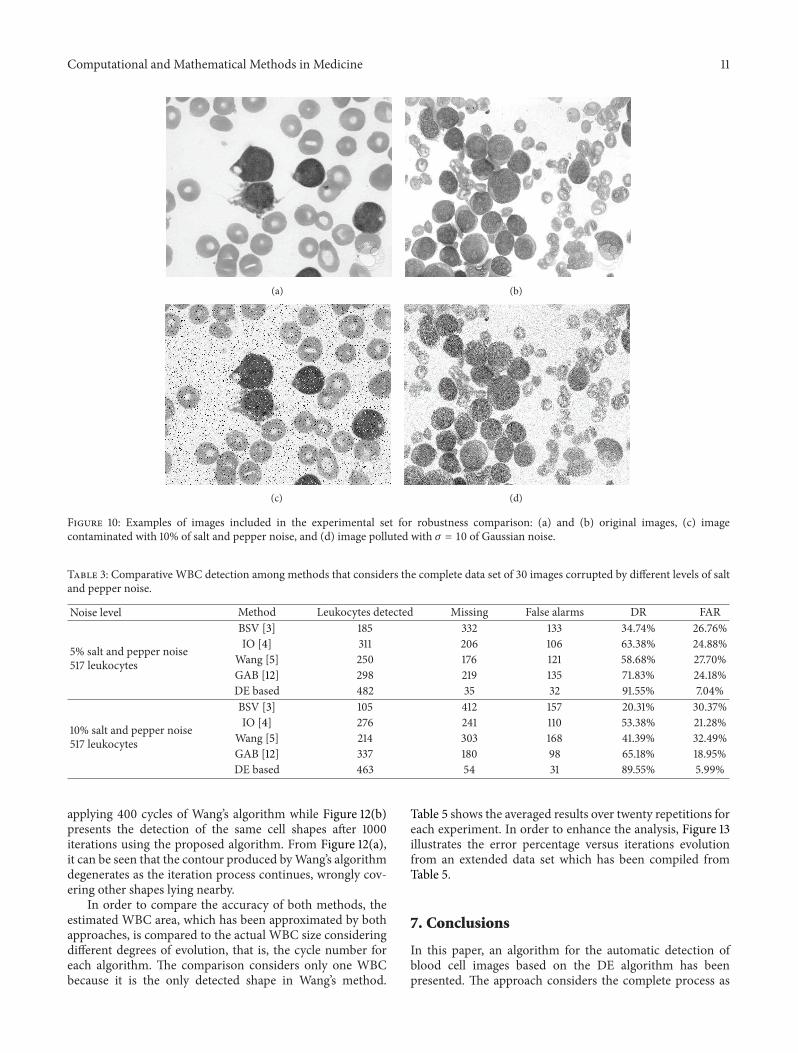
Salt and pepper and Gaussian noises are selected for therobustness analysis because they represent the most com-patible noise types commonly found in images of bloodsmear [30] The comparison considers the complete set of50 images presented in Section 61 containing 517 leukocyteswhich have been detected and counted by a human expertThe added noise is produced by MATLAB considering twonoise levels of 5 and 10 for salt and pepper noise whereas120590 = 5 and 120590 = 10 are used for the case of Gaussian noiseSuch noise levels according to [31] correspond to the besttradeoff between detection difficulty and the real existencein medical imaging If higher noise levels are used thenthe detection process would be unnecessarily complicatedwithout representing a feasible image condition
Figure 10 shows two examples of the experimental setThe outcomes in terms of the detection rate (DR) and the falsealarm rate (FAR) are reported for each noise type in Tables3 and 4 The results show that the proposed DE algorithmpresents the best detection performance achieving in theworst case a DR of 8955 and 9110 under contaminatedconditions of salt and pepper and Gaussian noises respec-tively On the other hand the DE detector possesses the leastdegradation performance presenting a FAR value of 599and 677
63 Stability Comparison In order to compare the stabilityperformance of the proposed method its results are com-pared to those reported by Wang et al in [5] which isconsidered as an accurate technique for the detection ofWBC
The Wang algorithm is an energy-minimizing methodwhich is guided by internal constraint elements and influ-enced by external image forces producing the segmentationof WBCrsquos at a closed contour As external forces the Wangapproach uses edge information which is usually representedby the gradient magnitude of the image Therefore the
contour is attracted to pixels with large image gradients thatis strong edges At each iteration the Wang method finds anew contour configuration which minimizes the energy thatcorresponds to external forces and constraint elements
In the comparison the net structure and its operationalparameters corresponding to theWang algorithm follow theconfiguration suggested in [5] while the parameters for theDE-based algorithm are taken from Table 1
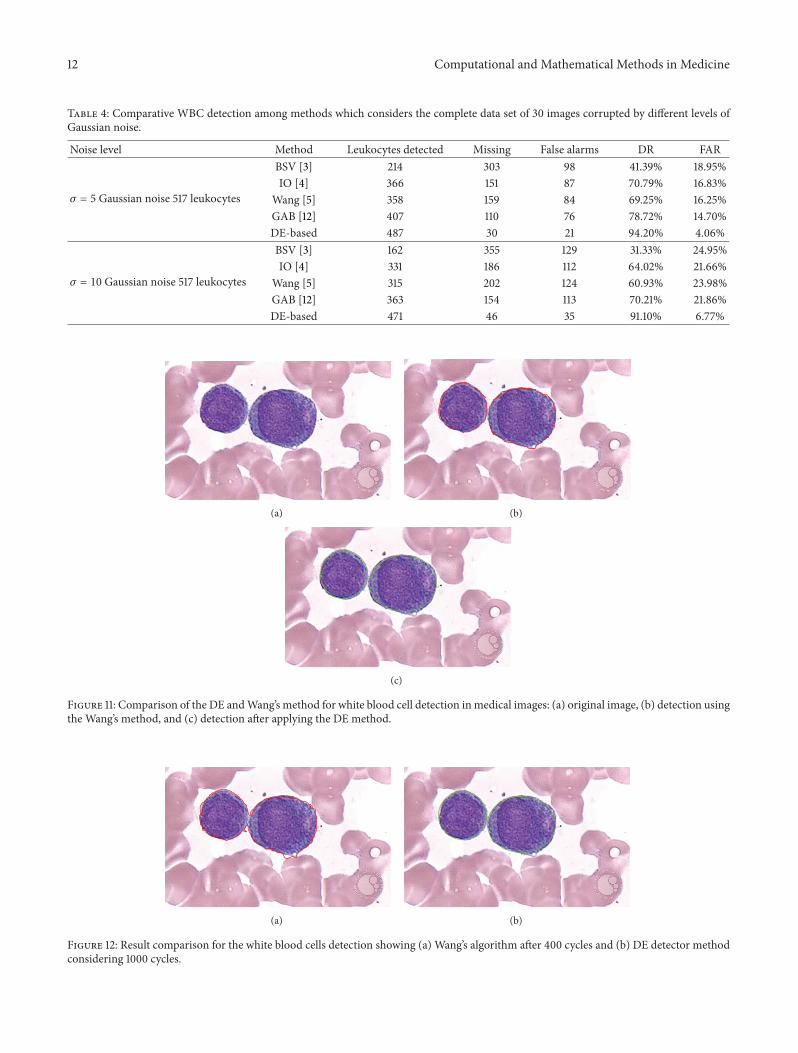
Figure 11 shows the performance of both methods con-sidering a test image with only two white blood cells Sincethe Wang method uses gradient information in order toappropriately find a new contour configuration it needsto be executed iteratively in order to detect each struc-ture (WBC) Figure 11(b) shows the results after the Wangapproach has been applied considering only 200 iterationsFurthermore Figure 11(c) shows results after applying theDE-based method which has been proposed in this paper
The Wang algorithm uses the fuzzy cellular neural net-work (FCNN) as optimization approach It employs gradientinformation and internal states in order to find a bettercontour configuration In each iteration the FCNN triesas contour points different new pixel positions which mustbe located nearby the original contour position Such factmight cause the contour solution to remain trapped into alocal minimum In order to avoid such a problem the Wangmethod applies a considerable number of iterations so that anear optimal contour configuration can be found Howeverwhen the number of iterations increases the possibility tocover other structures increases too Thus if the image has acomplex background (just as smear images do) or theWBCrsquosare too close the method gets confused so that finding thecorrect contour configuration from the gradientmagnitude isnot easyTherefore a drawback ofWangrsquosmethod is related toits optimal iteration number (instability) Such number mustbe determined experimentally as it depends on the imagecontext and its complexity Figure 12(a) shows the result of
Computational and Mathematical Methods in Medicine 11
(a) (b)
(c) (d)
Figure 10 Examples of images included in the experimental set for robustness comparison (a) and (b) original images (c) imagecontaminated with 10 of salt and pepper noise and (d) image polluted with 120590 = 10 of Gaussian noise
Table 3 Comparative WBC detection among methods that considers the complete data set of 30 images corrupted by different levels of saltand pepper noise
Noise level Method Leukocytes detected Missing False alarms DR FAR
Wang [5] 214 303 168 4139 3249GAB [12] 337 180 98 6518 1895DE based 463 54 31 8955 599
applying 400 cycles of Wangrsquos algorithm while Figure 12(b)presents the detection of the same cell shapes after 1000iterations using the proposed algorithm From Figure 12(a)it can be seen that the contour produced byWangrsquos algorithmdegenerates as the iteration process continues wrongly cov-ering other shapes lying nearby
In order to compare the accuracy of both methods theestimated WBC area which has been approximated by bothapproaches is compared to the actual WBC size consideringdifferent degrees of evolution that is the cycle number foreach algorithm The comparison considers only one WBCbecause it is the only detected shape in Wangrsquos method
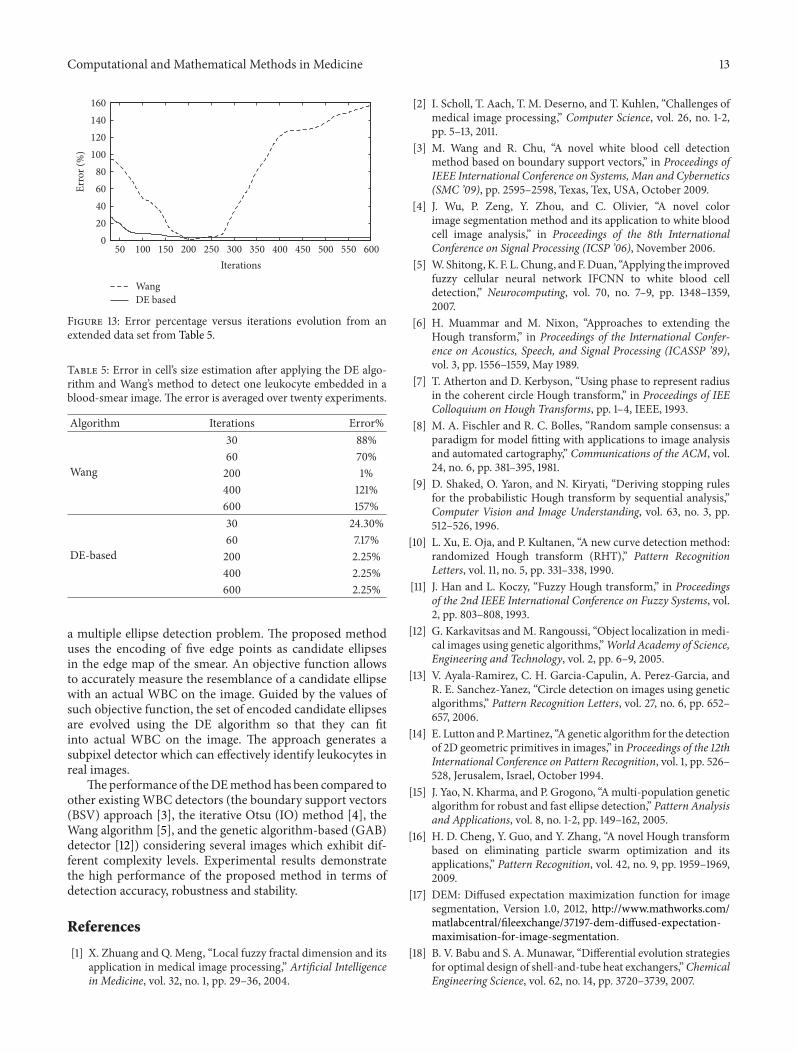
Table 5 shows the averaged results over twenty repetitions foreach experiment In order to enhance the analysis Figure 13illustrates the error percentage versus iterations evolutionfrom an extended data set which has been compiled fromTable 5
7 Conclusions
In this paper an algorithm for the automatic detection ofblood cell images based on the DE algorithm has beenpresented The approach considers the complete process as
12 Computational and Mathematical Methods in Medicine
Table 4 Comparative WBC detection among methods which considers the complete data set of 30 images corrupted by different levels ofGaussian noise
Noise level Method Leukocytes detected Missing False alarms DR FAR
Figure 11 Comparison of the DE andWangrsquos method for white blood cell detection inmedical images (a) original image (b) detection usingthe Wangrsquos method and (c) detection after applying the DE method
(a) (b)
Figure 12 Result comparison for the white blood cells detection showing (a) Wangrsquos algorithm after 400 cycles and (b) DE detector methodconsidering 1000 cycles
Computational and Mathematical Methods in Medicine 13
50 100 150 200 250 300 350 400 450 500 550 6000
20406080
100120140160
Iterations
Erro
r (
)
WangDE based
Figure 13 Error percentage versus iterations evolution from anextended data set from Table 5
Table 5 Error in cellrsquos size estimation after applying the DE algo-rithm and Wangrsquos method to detect one leukocyte embedded in ablood-smear image The error is averaged over twenty experiments
Algorithm Iterations Error
Wang
30 8860 70200 1400 121600 157
DE-based
30 243060 717200 225400 225600 225
a multiple ellipse detection problem The proposed methoduses the encoding of five edge points as candidate ellipsesin the edge map of the smear An objective function allowsto accurately measure the resemblance of a candidate ellipsewith an actual WBC on the image Guided by the values ofsuch objective function the set of encoded candidate ellipsesare evolved using the DE algorithm so that they can fitinto actual WBC on the image The approach generates asubpixel detector which can effectively identify leukocytes inreal images
Theperformance of theDEmethod has been compared toother existingWBC detectors (the boundary support vectors(BSV) approach [3] the iterative Otsu (IO) method [4] theWang algorithm [5] and the genetic algorithm-based (GAB)detector [12]) considering several images which exhibit dif-ferent complexity levels Experimental results demonstratethe high performance of the proposed method in terms ofdetection accuracy robustness and stability
References
[1] X Zhuang and Q Meng ldquoLocal fuzzy fractal dimension and itsapplication in medical image processingrdquo Artificial Intelligencein Medicine vol 32 no 1 pp 29ndash36 2004
[2] I Scholl T Aach T M Deserno and T Kuhlen ldquoChallenges ofmedical image processingrdquo Computer Science vol 26 no 1-2pp 5ndash13 2011
[3] M Wang and R Chu ldquoA novel white blood cell detectionmethod based on boundary support vectorsrdquo in Proceedings ofIEEE International Conference on Systems Man and Cybernetics(SMC rsquo09) pp 2595ndash2598 Texas Tex USA October 2009
[4] J Wu P Zeng Y Zhou and C Olivier ldquoA novel colorimage segmentation method and its application to white bloodcell image analysisrdquo in Proceedings of the 8th InternationalConference on Signal Processing (ICSP rsquo06) November 2006
[5] W ShitongK F L Chung andFDuan ldquoApplying the improvedfuzzy cellular neural network IFCNN to white blood celldetectionrdquo Neurocomputing vol 70 no 7ndash9 pp 1348ndash13592007
[6] H Muammar and M Nixon ldquoApproaches to extending theHough transformrdquo in Proceedings of the International Confer-ence on Acoustics Speech and Signal Processing (ICASSP rsquo89)vol 3 pp 1556ndash1559 May 1989
[7] T Atherton and D Kerbyson ldquoUsing phase to represent radiusin the coherent circle Hough transformrdquo in Proceedings of IEEColloquium on Hough Transforms pp 1ndash4 IEEE 1993
[8] M A Fischler and R C Bolles ldquoRandom sample consensus aparadigm for model fitting with applications to image analysisand automated cartographyrdquo Communications of the ACM vol24 no 6 pp 381ndash395 1981
[9] D Shaked O Yaron and N Kiryati ldquoDeriving stopping rulesfor the probabilistic Hough transform by sequential analysisrdquoComputer Vision and Image Understanding vol 63 no 3 pp512ndash526 1996
[10] L Xu E Oja and P Kultanen ldquoA new curve detection methodrandomized Hough transform (RHT)rdquo Pattern RecognitionLetters vol 11 no 5 pp 331ndash338 1990
[11] J Han and L Koczy ldquoFuzzy Hough transformrdquo in Proceedingsof the 2nd IEEE International Conference on Fuzzy Systems vol2 pp 803ndash808 1993
[12] G Karkavitsas and M Rangoussi ldquoObject localization in medi-cal images using genetic algorithmsrdquoWorld Academy of ScienceEngineering and Technology vol 2 pp 6ndash9 2005
[13] V Ayala-Ramirez C H Garcia-Capulin A Perez-Garcia andR E Sanchez-Yanez ldquoCircle detection on images using geneticalgorithmsrdquo Pattern Recognition Letters vol 27 no 6 pp 652ndash657 2006
[14] E Lutton andPMartinez ldquoA genetic algorithm for the detectionof 2D geometric primitives in imagesrdquo in Proceedings of the 12thInternational Conference on Pattern Recognition vol 1 pp 526ndash528 Jerusalem Israel October 1994
[15] J Yao N Kharma and P Grogono ldquoAmulti-population geneticalgorithm for robust and fast ellipse detectionrdquo Pattern Analysisand Applications vol 8 no 1-2 pp 149ndash162 2005
[16] H D Cheng Y Guo and Y Zhang ldquoA novel Hough transformbased on eliminating particle swarm optimization and itsapplicationsrdquo Pattern Recognition vol 42 no 9 pp 1959ndash19692009
[17] DEM Diffused expectation maximization function for imagesegmentation Version 10 2012 httpwwwmathworkscommatlabcentralfileexchange37197-dem-diffused-expectation-maximisation-for-image-segmentation
[18] B V Babu and S A Munawar ldquoDifferential evolution strategiesfor optimal design of shell-and-tube heat exchangersrdquoChemicalEngineering Science vol 62 no 14 pp 3720ndash3739 2007
14 Computational and Mathematical Methods in Medicine
[19] D G Mayer B P Kinghorn and A A Archer ldquoDifferentialevolutionmdashan easy and efficient evolutionary algorithm formodel optimisationrdquoAgricultural Systems vol 83 no 3 pp 315ndash328 2005
[20] S Kannan S Mary Raja Slochanal and N Padhy ldquoApplicationand comparison of metaheuristic techniques to generationexpansion planning problemrdquo IEEE Transactions on PowerSystems vol 20 no 1 pp 466ndash475 February 2005
[21] J P Chiou C F Chang and C T Su ldquoVariable scaling hybriddifferential evolution for solving network reconfiguration ofdistribution systemsrdquo IEEE Transactions on Power Systems vol20 no 2 pp 668ndash674 2005
[22] E Cuevas D Zaldivar and M Perez-Cisneros ldquoA novelmulti-threshold segmentation approach based on differentialevolution optimizationrdquo Expert Systems with Applications vol37 no 7 pp 5265ndash5271 2010
[23] R Storn andK Price ldquoDifferential evolutionmdasha simple and effi-cient adaptive scheme for global optimization over continuousspacesrdquo Tech Rep TR-95-012 International Computer ScienceInstitute Berkeley Calif USA 1995
[24] J E Bresenham ldquoA linear algorithm for incremental digitaldisplay of circular arcsrdquo Communications of the ACM vol 20no 2 pp 100ndash106 1977
[25] J R Van Aken ldquoAn efficient ellipse-drawing algorithmrdquo IEEEComputer Graphics and Applications vol 4 no 9 pp 24ndash351984
[26] G Boccignone M Ferraro and P Napoletano ldquoDiffusedexpectation maximisation for image segmentationrdquo ElectronicsLetters vol 40 no 18 pp 1107ndash1108 2004
[27] G Boccignone P Napoletano V Caggiano and M Ferraro ldquoAmulti-resolution diffused expectation-maximization algorithmfor medical image segmentationrdquo Computers in Biology andMedicine vol 37 no 1 pp 83ndash96 2007
[28] R C Gonzalez and R E Woods Digital Image ProcessingAddison-Wesley Reading Mass USA 1992
[29] L Wang and F Z Huang ldquoParameter analysis based onstochastic model for differential evolution algorithmrdquo AppliedMathematics and Computation vol 217 no 7 pp 3263ndash32732010
[30] G Landi and E Loli Piccolomini ldquoAn efficient method fornonnegatively constrained Total Variation-based denoising ofmedical images corrupted by Poisson noiserdquo ComputerizedMedical Imaging and Graphics vol 36 no 1 pp 38ndash46 2012
[31] M J Tapiovaara and R F Wagner ldquoSNR and noise measure-ments for medical imaging I A practical approach based onstatistical decision theoryrdquo Physics in Medicine and Biology vol38 no 1 pp 71ndash92 1993
2 Computational and Mathematical Methods in Medicine
detection in real images is an open research problem longtime ago Several approaches have been proposed whichtraditionally fall under three categories symmetry-basedHough transform-based (HT) and random sampling
In symmetry-based detection [6 7] the ellipse geometryis taken into account The most common elements used inellipse geometry are the ellipse center and axis Using theseelements and edges in the image the ellipse parameters can befound Ellipse detection in digital images is commonly solvedthrough the Hough transform [8] It works by representingthe geometric shape by its set of parameters and thenaccumulating bins in the quantized parameter space Peaksin the bins provide the indication of where ellipses may beObviously since the parameters are quantized into discretebins the intervals of the bins directly affect the accuracyof the results and the computational effort Therefore forfine quantization of the space the algorithm returns moreaccurate results while suffering from largememory loads andexpensive computation In order to overcome such a problemsome other researchers have proposed other ellipse detectorsfollowing the Hough transform principles by using randomsampling In random sampling-based approaches [9 10] abin represents a candidate shape rather than a set of quantizedparameters as in the HT However like the HT randomsampling approaches go through an accumulation processfor the bins The bin with the highest score represents thebest approximation of an actual ellipse in the target imageMcLaughlinrsquos work [11] shows that a random sampling-basedapproach produces improvements in accuracy and compu-tational complexity as well as a reduction in the number offalse positives (nonexistent ellipses) when compared to theoriginal HT and the number of its improved variants
As an alternative to traditional techniques the problem ofellipse detection has also been handled through optimizationmethods In general they have demonstrated to give betterresults than those based on the HT and random samplingwith respect to accuracy and robustness [13] Such approacheshave produced several robust ellipse detectors using differentoptimization algorithms such as genetic algorithms (GAs)[14 15] and particle swarm optimization (PSO) [16]
Although detection algorithms based on optimizationapproaches present several advantages in comparison totraditional approaches they have been scarcely applied toWBC detection One exception is the work presented byKarkavitsas andRangoussi [12] that solves theWBCdetectionproblem through the use of GA However since the evalu-ation function which assesses the quality of each solutionconsiders the number of pixels contained inside of a circlewith fixed radius the method is prone to produce misde-tections particularly for images that contained overlapped orirregular WBC
In this paper the WBC detection task is approachedas an optimization problem and the differential evolutionalgorithm is used to build the ellipsoidal approximationDifferential evolution (DE) introduced by Storn and Price[17] is a novel evolutionary algorithm which is used tooptimize complex continuous nonlinear functions As apopulation-based algorithm DE uses simple mutation andcrossover operators to generate new candidate solutions and
applies one-to-one competition scheme to greedily decidewhether the new candidate or its parent will survive in thenext generationDue to its simplicity ease of implementationfast convergence and robustness the DE algorithm hasgained much attention reporting a wide range of successfulapplications in the literature [18ndash22]
This paper presents an algorithm for the automaticdetection of blood cell images based on the DE algorithmThe proposedmethod uses the encoding of five edge points ascandidate ellipses in the edge map of the smear An objectivefunction allows to accurately measure the resemblance of acandidate ellipse with an actual WBC on the image Guidedby the values of such objective function the set of encodedcandidate ellipses are evolved using the DE algorithm so thatthey can fit into actual WBC on the image The approachgenerates a subpixel detector which can effectively identifyleukocytes in real images Experimental evidence showsthe effectiveness of such method in detecting leukocytesdespite complex conditions Comparison to the state-of-the-art WBC detectors on multiple images demonstrates a betterperformance of the proposed method
The main contribution of this study is the proposal ofa new WBC detector algorithm that efficiently recognizesWBC under different complex conditions while consideringthe whole process as an ellipse detection problem Althoughellipse detectors based on optimization present several inter-esting properties to the best of our knowledge they have notyet been applied to any medical image processing up to date
This paper is organized as follows Section 2 provides adescription of the DE algorithm while in Section 3 the ellipsedetection task is fully explained from an optimization per-spective within the context of the DE approachThe completeWBC detector is presented in Section 4 Section 5 reports theobtained experimental results whereas Section 6 conducts acomparison between state-of-the-art WBC detectors and theproposed approach Finally in Section 7 some conclusionsare drawn
2 Differential Evolution Algorithm
The DE algorithm is a simple and direct search algorithmwhich is based on population and aims for optimizing globalmultimodal functions DE employs the mutation operator toprovide the exchange of information among several solutions
There are various mutation base generators to definethe algorithm type The version of DE algorithm used inthis work is known as rand-to-best1bin or ldquoDE1rdquo [23] DEalgorithms begin by initializing a population of 119873119901 and D-dimensional vectors considering parameter values that arerandomly distributed between the prespecified lower initialparameter bound 119909119895 low and the upper initial parameterbound 119909119895 high as follows
119909119895 119894 119905 = 119909119895 low + rand (0 1) sdot (119909119895 high minus 119909119895 low)
The subscript 119905 is the generation index while 119895 and 119894 arethe parameter and particle indexes respectively Hence 119909119895 119894 119905
Computational and Mathematical Methods in Medicine 3
is the jth parameter of the 119894th particle in generation 119905 In orderto generate a trial solution DE algorithm first mutates thebest solution vector xbest 119905 from the current population byadding the scaled difference of two vectors from the currentpopulation
with k119894 119905 being the mutant vector Indices 1199031 and 1199032 arerandomly selected with the condition that they are differentand have no relation to the particle index 119894 whatsoever (ie1199031 = 1199032 = 119894) The mutation scale factor 119865 is a positive realnumber typically less than one Figure 1 illustrates the vector-generation process defined by (2)
In order to increase the diversity of the parameter vectorthe crossover operation is applied between the mutant vectork119894 119905 and the original individuals x119894 119905 The result is the trialvector u119894 119905 which is computed by considering element toelement as follows
119906119895 119894 119905 = V119895 119894 119905 if rand (0 1) le CR or 119895 = 119895rand119909119895 119894 119905 otherwise
(3)
with 119895rand isin 1 2 119863 The crossover parameter (00 le
CR le 10) controls the fraction of parameters that themutantvector is contributing to the final trial vector In additionthe trial vector always inherits the mutant vector parameteraccording to the randomly chosen index 119895rand assuring thatthe trial vector differs by at least one parameter from thevector to which it is compared (x119894 119905)
Finally a greedy selection is used to find better solutionsThus if the computed cost function value of the trial vectoru119894 119905 is less than or equal to the cost of the vector x119894 119905 then suchtrial vector replaces x119894 119905 in the next generation Otherwise x119894 119905remains in the population for at least one more generation
x119894 119905+1 = u119894 119905 if 119891 (u119894 119905) le 119891 (x119894 119905) x119894 119905 otherwise
(4)
Here 119891( ) represents the objective function These pro-cesses are repeated until a termination criterion is attained ora predetermined generation number is reached
3 Ellipse Detection Using DE
31 Data Preprocessing In order to detect ellipse shapescandidate images must be preprocessed first by an edgedetection algorithm which yields an edge map image Thenthe (119909119894 119910119894) coordinates for each edge pixel 119901119894 are stored insidethe edge vector 119875 = 1199011 1199012 119901119873
119901
with119873119901 being the totalnumber of edge pixels
32 Individual Representation Just as a line requires twopoints to completely define its characteristics an ellipse isdefined by five points Therefore each candidate solution E(ellipse candidate) considers five edge points to representan individual Under such representation edge points are
selected following a random positional index within the edgearray 119875 This procedure will encode a candidate solution asthe ellipse that passes throughfive points1199011 1199012 1199013 1199014 and1199015(119864 = 1199011 1199012 1199013 1199014 1199015)Thus by substituting the coordinatesof each point of119864 into (5) we gather a set of five simultaneousequations which are linear in the five unknown parameters119886 119887 119891 119892 and ℎ
1198861199092+ 2ℎ119909119910 + 119887119910
2+ 2119892119909 + 2119891119910 + 1 = 0 (5)
Considering the configuration of the edge points shown byFigure 2 the ellipse center (1199090 1199100) the radius maximum(119903max) the radiusminimum (119903min) and the ellipse orientation(120579) can be calculated as follows
33 Objective Function Optimization refers to choosing thebest element from one set of available alternatives In thesimplest case it means to minimize an objective function orerror by systematically choosing the values of variables fromtheir valid ranges In order to calculate the error produced bya candidate solution E the ellipse coordinates are calculatedas a virtual shape which in turn must also be validated ifit really exists in the edge image The test set is representedby 119878 = 1199041 1199042 119904119873
119904
where 119873119904 are the number of pointsover which the existence of an edge point corresponding toE should be tested
The set 119878 is generated by the Midpoint Ellipse Algorithm(MEA) [24] which is a searching method that seeks requiredpoints for drawing an ellipse For any point (x y) lying on theboundary of the ellipse with 119886 ℎ 119887 119892 and f it does satisfy theequation119891ellipse(119909 119910) cong 119903max119909
2+119903min119910
2minus1199032
max1199032
min where 119903maxand 119903min represent the major and minor axes respectivelyHoweverMEAavoids computing square-root calculations bycomparing the pixel separation distances Amethod for directdistance comparison is to test the halfway position betweentwo pixels (subpixel distance) to determine if this midpointis inside or outside the ellipse boundary If the point is in the
4 Computational and Mathematical Methods in Medicine
1199092
1199091
x1199031119905 minus x1199032119905
x1199031119905
x1199032119905119865 middot (x1199031119905 minus x1199032119905)
v119894119905
119905xbest
Figure 1 Two-dimensional example of an objective function show-ing its contour lines and the process for generating v in schemeDEbestlexp from vectors of the current generation
119910
119909
120579
1199011
1199012
1199013
119903min119903max
11990141199015
(1199090 1199100)
Figure 2 Ellipse candidate (individual) built from the combinationof points 1199011 1199012 1199013 1199014 and 1199015
interior of the ellipse the ellipse function is negative Thus ifthe point is outside the ellipse the ellipse function is positiveTherefore the error involved in locating pixel positions usingthe midpoint test is limited to one-half the pixel separation(subpixel precision) To summarize the relative position ofany point (x y) can be determined by checking the sign ofthe ellipse function
119891ellipse (119909 119910)
lt0 if (119909 119910) is inside the ellipse boundary=0 if (119909 119910) is on the ellipse boundarygt0 if (119909 119910) is outside the ellipse boundary
(8)
The ellipse-function test in (8) is applied to midpositionsbetween pixels nearby the ellipse path at each sampling stepFigures 3(a) and 3(b) show the midpoint between the twocandidate pixels at sampling position The ellipse is used todivide the quadrants into two regions the limit of the tworegions is the point at which the curve has a slope of minus1 asshown in Figure 4
In MEA the computation time is reduced by consideringthe symmetry of ellipses Ellipses sections in adjacent octantswithin one quadrant are symmetric with respect to the119889119910119889119910 = minus1 line dividing the two octants These symmetry
conditions are illustrated in Figure 4 The algorithm can beconsidered as the quickest providing a subpixel precision[25] However in order to protect the MEA operation it isimportant to assure that points lying outside the image planemust not be considered in S
The objective function J(E) represents the matching errorproduced between the pixels 119878 of the ellipse candidate 119864 andthe pixels that actually exist in the edge image yielding
119869 (119864) = 1 minussum119873119904
V=1 119866 (119909V 119910V)
119873119904
(9)
where119866(119909119894 119910119894) is a function that verifies the pixel existence in(119909V 119910V) with (119909V 119910V) isin 119878 and119873119904 being the number of pixelslying on the perimeter corresponding to 119864 currently undertesting Hence function 119866(119909V 119910V) is defined as
119866 (119909V 119910V) = 1 if the pixel (119909V 119910V) is an edge point0 otherwise
(10)
A value of J(E) near to zero implies a better responsefrom the ldquoellipsoidrdquo operator Figure 5 shows the procedureto evaluate a candidate action 119864 with its representation asa virtual shape 119878 Figure 5(a) shows the original edge mapwhile Figure 5(b) presents the virtual shape 119878 representing theindividual 119864 = 1199011 1199012 1199013 1199014 1199015 In Figure 5(c) the virtualshape 119878 is compared to the original image point by point inorder to find coincidences between virtual and edge pointsThe individual has been built from points 1199011 1199012 1199013 1199014 and1199015 which are shown by Figure 5(a) The virtual shape Sobtained by MEA gathers 52 points (119873119904 = 52) with only35 of them existing in both images (shown as darker pointsin Figure 5(c)) and yielding sum119873119904V=1 119866(119909V 119910V) = 35 therefore119869(119864) = 0327
34 Implementation of DE for Ellipse Detection The ellipsedetector algorithm based on DE can be summarized inAlgorithm 1
4 The White Blood Cell Detector
In order to detect WBC the proposed detector combinesa segmentation strategy with the ellipse detection approachpresented in Section 3
41 Image Preprocessing To employ the proposed detectorsmear images must be preprocessed to obtain two newimages the segmented image and its corresponding edgemapThe segmented image is produced by using a segmenta-tion strategy whereas the edge map is generated by a borderextractor algorithm Such edge map is considered by theobjective function to measure the resemblance of a candidateellipse with an actual WBC
The goal of the segmentation strategy is to isolate thewhite blood cells (WBCrsquos) from other structures such asred blood cells and background pixels Information of colorbrightness and gradients is commonly used within a thresh-olding scheme to generate the labels to classify each pixel
Computational and Mathematical Methods in Medicine 5
11988721199092 + 11988621199102 minus 11988621198872 = 0119910119896 + 1
119910119896
119910119896 minus (12)
119910119896 minus 1
119910119896 minus 2
119910119896 minus 3
119909119896 minus 1 119909119896 119909119896 + 1 119909119896 + 2
(a)
11988721199092 + 11988621199102 minus 11988621198872 = 0119910119896 + 1
119910119896
119910119896 minus (12)
119910119896 minus 1
119910119896 minus 2
119910119896 minus 3
119909119896 minus 1 119909119896 119909119896 + 2119909119896 + (12)
(b)
Figure 3 (a) Symmetry of the ellipse an estimated one octant which belongs to the first region where the slope is greater than minus1 (b) In thisregion the slope will be less than minus1 to complete the octant and continue to calculate the same as the remaining octants
(119910 119909)(minus119910 119909)
(minus119909 119910)
(minus119909 minus119910)
(minus119910 minus119909) (119910 minus119909)
(119909 minus119910)
(119909 119910)
Figure 4 Midpoint between candidate pixels at sampling position119909119896 along an elliptical path
Although a simple histogram thresholding can be used tosegment the WBCs at this work the diffused expectation-maximization (DEM) has been used to assure better results[26]
DEM is an expectation-maximization- (EM-) based algo-rithm which has been used to segment complex medicalimages [27] In contrast to classical EM algorithms DEMconsiders the spatial correlations among pixels as a partof the minimization criteria Such adaptation allows tosegment objects in spite of noisy and complex conditionsThe method models an image as a finite mixture where eachmixture component corresponds to a region class and uses amaximum likelihood approach to estimate the parameters foreach class via the expectationmaximization (EM) algorithmwhich is coupled to anisotropic diffusion over classes in orderto account for the spatial dependencies among pixels
For the WBCrsquos segmentation the implementation ofDEM provided in [17] has been used Since the implemen-tation allows to segment gray-level images and color imagesit can be used for operating over all smear images with noregard about how each image has been acquired The DEMhas been configured considering three different classes (119870 =
These values have been found as the best configuration setaccording to [26]
As a final result of the DEM operation three differentthresholding points are obtained the first corresponds to the
WBCs and the second to the red blood cells whereas the thirdrepresents the pixels classified as background Figure 6(b)presents the segmentation results obtained by the DEMapproach employed at this work considering Figure 6(a) asthe original image
Once the segmented image has been produced the edgemap is computed The purpose of the edge map is to obtain asimple image representation that preserves object structuresTheDE-based detector operates directly over the edgemap inorder to recognize ellipsoidal shapes Several algorithms canbe used to extract the edge map however at this work themorphological edge detection procedure [28] has been usedto accomplish such a task Morphological edge detection is atraditional method to extract borders from binary images inwhich original images (119868119861) are eroded by a simple structureelement (119868119864) composed by a matrix template of 3 times 3 with allits values equal to one Then the eroded image is inverted(119868119864) and compared with the original image (119868119864 and 119868119861) in orderto detect pixels which are present in both images Such pixelscompose the computed edge map from 119868119861 Figure 6(c) showsthe edge map obtained by using the morphological edgedetection procedure
42 EllipseDetectionApproach Theedgemap is used as inputimage for the ellipse detector presented in Section 3 Table 1presents the parameter set that has been used in this work fortheDE algorithm after several calibration examples have beenconducted The final configuration matches the best possiblecalibration proposed in [29] where the effect of modifyingtheDE-parameters for several generic optimization problemshas been analyzed The population-size parameter (119898 =
20) has been selected considering the best possible balancebetween convergence and computational overload Once ithas been set such configuration has been kept for all testimages employed in the experimental study
Under such assumptions the complete process to detectWBCs is implemented as in Algorithm 2
43 Numerical Example In order to present the algorithmrsquosstep-by-step operation a numerical example has been set byapplying the proposed method to detect a single leukocyte
6 Computational and Mathematical Methods in Medicine
1199011
1199012
1199013
1199014
1199015
(a) (b) (c)
Figure 5 Evaluation of a candidate solution E the image in (a) shows the original image while (b) presents the generated virtual shape drawnfrom points 1199011 1199012 1199013 1199014 and 1199015 The image in (c) shows coincidences between both images which have been marked by darker pixels whilethe virtual shape is also depicted through a dashed line
Step 1 Set the DE parameters 119865 = 025 and CR = 08Step 2 Initialize the population ofm individuals E119896 = 119864119896
1 119864119896
2 119864
119896
119898 where each decision
variable 1199011119901211990131199014 and 1199015 of 119864119896
119886is set randomly within the interval [1119873119901] All
values must be integers Considering that 119896 = 0 and 119886 isin (1 2 119898)Step 3 Evaluate the objective value J(119864119896
119886) for allm individuals and determining the 119864best 119896 showing
the best fitness value such that 119864best 119896isin E11989610038161003816100381610038161003816 119869(119864
best 119896) = min 119869(119864119896
1) 119869(119864
119896
2) 119869(119864
119896
119898)
Step 4 Generate the trial population T = 1198791 1198792 119879119898for (119894 = 1 119894 lt 119898 + 1 119894++)do 1199031 = floor(rand(0 1) sdot 119898) while (1199031 = 119894)do 1199032 = floor(rand(0 1) sdot 119898) while ((1199032 = 119894) or (1199032 = 1199032))jrand = floor(5sdotrand(0 1))
for (119895 = 1 119895 lt 6 119895++) generate a trial vectorif (rand(01)lt=CR or 119895 = jrand)119879119895119894 = 119864
best 119896119895
+ 119865 sdot (119864119896
1198951199031minus 119864119896
1198951199032)
else119879119895119894 = 119864
119896
119895119894
end ifend for
end forStep 5 Evaluate the fitness values 119869(119879119894) (119894 isin 1 2 119898) of all trial individuals Check all
individuals If a candidate parameter set is not physically plausible ie out of therange [1119873119901] then an exaggerated cost function value is returned This aims toeliminate ldquounstablerdquo individuals
Step 6 Select the next population E119896+1 = 119864119896+11 119864119896+1
Step 7 If the iteration number (119873119868) is met then the output 119864best 119896 is the solution (an actualellipse contained in the image) otherwise go back to Step 3
Algorithm 1
Step 1 Segment the WBCrsquos using the DEM algorithm (described in Section 41)Step 2 Get the edge map from the segmented imageStep 3 Start the ellipse detector based in DE over the edge map while saving best ellipses (Section 3)Step 4 Define parameter values for each ellipse that identify the WBCrsquos
Algorithm 2
Computational and Mathematical Methods in Medicine 7
(a) (b)
(c)
Figure 6 Preprocessing process (a) original smear image (b) segmented image obtained by DEM and (c) the edge map obtained by usingthe morphological edge detection procedure
Table 1 DE parameters used for leukocytes detection in medicalimages
119898 119865 CR 119873119868
20 025 080 200
lying inside of a simple image Figure 7(a) shows the imageused in the example After applying the threshold operationthe WBC is located beside few other pixels which are merelynoise (see Figure 7(b)) Then the edge map is subsequentlycomputed and stored pixel by pixel inside the vector 119875Figure 7(c) shows the resulting image after such procedure
The DE-based ellipse detector is executed using infor-mation of the edge map (for the sake of easiness it onlyconsiders a population of four particles) Like all evolutionaryapproaches DE is a population-based optimizer that attacksthe starting point problem by sampling the search space atmultiple randomly chosen and initial particles By takingfive random pixels from vector P four different particlesare constructed Figure 7(d) depicts the initial particle dis-tribution E0 = 119864
0
1 1198640
2 1198640
3 1198640
4 By using the DE operators
four different trial particles T = 1198791 1198792 1198793 1198794 (ellipses)are generated and their locations are shown in Figure 7(e)Then the new population E1 is selected considering the bestelements obtained among the trial elements T and the initialparticles E0 The final distribution of the new population isdepicted in Figure 7(f) Since the particles 1198640
2and 1198640
2hold (in
Figure 7(f)) a better fitness value (119869(11986402) and 119869(1198640
3)) than the
trial elements1198792 and1198793 they are considered as particles of thefinal population E1 Figures 7(g) and 7(h) present the second
iteration produced by the algorithm whereas Figure 7(i)shows the population configuration after 25 iterations FromFigure 7(i) it is clear that all particles have converged to a finalposition which is able to accurately cover the WBC
5 Experimental Results
Experimental tests have been developed in order to evaluatethe performance of the WBC detector It was tested overmicroscope images from blood smears holding a 960 times 720pixel resolution They correspond to supporting images onthe leukemia diagnosis The images show several complexconditions such as deformed cells and overlapping withpartial occlusions The robustness of the algorithm has beentested under such demanding conditions All the experimentshave been developed using an Intel Core i7-2600 PC with8GB in RAM
Figure 8(a) shows an example image employed in thetest It was used as input image for the WBC detectorFigure 8(b) presents the segmented WBCs obtained by theDEM algorithm Figures 8(c) and 8(d) present the edgemap and the white blood cells after detection respectivelyThe results show that the proposed algorithm can effectivelydetect and mark blood cells despite cell occlusion deforma-tion or overlapping Other parametersmay also be calculatedthrough the algorithm the total area covered by white bloodcells and relationships between several cell sizes
Another example is presented in Figure 9 It represents acomplex example with an image showing seriously deformedcells Despite such imperfections the proposed approach caneffectively detect the cells as it is shown in Figure 9(d)
8 Computational and Mathematical Methods in Medicine
(a) (b) (c)
11986403
11986401
11986402
11986404
(d)
1198793
1198791
1198792
1198794
(e)
11986413
11986414
11986411
11986412
(f)
1198793
1198793
11987921198794
(g)
11986423
119864241198642
2
11986423
(h)
119864252
119864254
119864251
119864252
(i)
Figure 7 Detection numerical example (a) the image used as an example (b) segmented image (c) edge map (d) initial particles E0 (e)trial elements T produced by the DE operators (f) new population E1 (g) trial elements produced considering E1 as input population (h)new population E2 and (i) final particle configuration after 25 iterations
6 Comparisons to Other Methods
Acomprehensive set of smear-blood test images is used to testthe performance of the proposed approach We have appliedthe proposed DE-based detector to test images in order tocompare its performance to otherWBC detection algorithmssuch as the boundary support vectors (BSVs) approach [3]the iterative Otsu (IO) method [4] the Wang algorithm [5]and the genetic algorithm-based (GAB) detector [12] In allcases the algorithms are tuned according to the value setwhich is originally proposed by their own references
61 Detection Comparison To evaluate the detection perfor-mance of the proposed detection method Table 2 tabulatesthe comparative leukocyte detection performance of the BSVapproach the IO method the Wang algorithm the BGAdetector and the proposed method in terms of detectionrates and false alarms The experimental data set includes50 images which are collected from the ASH Image Bank(httpimagebankhematologyorg) Such images contain517 leukocytes (287 bright leukocytes and 230 dark leukocytesaccording to smear conditions) which have been detected andcounted by a human expert Such values act as ground truthfor all the experiments For the comparison the detection rate(DR) is defined as the ratio between the number of leukocytes
correctly detected and the number leukocytes determined bythe expert The false alarm rate (FAR) is defined as the ratiobetween the number of nonleukocyte objects that have beenwrongly identified as leukocytes and the number leukocyteswhich have been actually determined by the expert
Experimental results show that the proposed DEmethodwhich achieves 9826 leukocyte detection accuracy with271 false alarm rate is compared favorably with otherWBC detection algorithms such as the BSV approach theIO method the Wang algorithm and the BGA detector
62 Robustness Comparison Images of blood smear are oftendeteriorated by noise due to various sources of interferenceand other phenomena that affect the measurement processesin imaging and data acquisition systems Therefore thedetection results depend on the algorithmrsquos ability to copewith different kinds of noises In order to demonstratethe robustness in the WBC detection the proposed DEapproach is compared to the BSV approach the IO methodthe Wang algorithm and the BGA detector under noisyenvironments In the test two different experiments havebeen studied The first inquest explores the performanceof each algorithm when the detection task is accomplishedover images corrupted by salt and pepper noise The secondexperiment considers images polluted by Gaussian noise
Computational and Mathematical Methods in Medicine 9
(a) (b)
(c) (d)
Figure 8 Resulting images of the first test after applying the WBC detector (a) original image (b) image segmented by the DEM algorithm(c) edge map and (d) the white detected blood cells
(a) (b)
(c) (d)
Figure 9 Resulting images of the second test after applying theWBCdetector (a) original image (b) image segmented by theDEMalgorithm(c) edge map and (d) the white detected blood cells
10 Computational and Mathematical Methods in Medicine
Table 2 Comparative leukocyte detection performance of the BSV approach the IO method the Wang algorithm the BGA detector andthe proposed DE method over the data set which contains 30 images and 426 leukocytes
Leukocyte type Method Leukocytes detected Missing False alarms DR FAR
Wang [5] 427 90 107 8259 2070GAB [12] 399 118 45 7718 870DE based 508 9 14 9826 271
Salt and pepper and Gaussian noises are selected for therobustness analysis because they represent the most com-patible noise types commonly found in images of bloodsmear [30] The comparison considers the complete set of50 images presented in Section 61 containing 517 leukocyteswhich have been detected and counted by a human expertThe added noise is produced by MATLAB considering twonoise levels of 5 and 10 for salt and pepper noise whereas120590 = 5 and 120590 = 10 are used for the case of Gaussian noiseSuch noise levels according to [31] correspond to the besttradeoff between detection difficulty and the real existencein medical imaging If higher noise levels are used thenthe detection process would be unnecessarily complicatedwithout representing a feasible image condition
Figure 10 shows two examples of the experimental setThe outcomes in terms of the detection rate (DR) and the falsealarm rate (FAR) are reported for each noise type in Tables3 and 4 The results show that the proposed DE algorithmpresents the best detection performance achieving in theworst case a DR of 8955 and 9110 under contaminatedconditions of salt and pepper and Gaussian noises respec-tively On the other hand the DE detector possesses the leastdegradation performance presenting a FAR value of 599and 677
63 Stability Comparison In order to compare the stabilityperformance of the proposed method its results are com-pared to those reported by Wang et al in [5] which isconsidered as an accurate technique for the detection ofWBC
The Wang algorithm is an energy-minimizing methodwhich is guided by internal constraint elements and influ-enced by external image forces producing the segmentationof WBCrsquos at a closed contour As external forces the Wangapproach uses edge information which is usually representedby the gradient magnitude of the image Therefore the
contour is attracted to pixels with large image gradients thatis strong edges At each iteration the Wang method finds anew contour configuration which minimizes the energy thatcorresponds to external forces and constraint elements
In the comparison the net structure and its operationalparameters corresponding to theWang algorithm follow theconfiguration suggested in [5] while the parameters for theDE-based algorithm are taken from Table 1
Figure 11 shows the performance of both methods con-sidering a test image with only two white blood cells Sincethe Wang method uses gradient information in order toappropriately find a new contour configuration it needsto be executed iteratively in order to detect each struc-ture (WBC) Figure 11(b) shows the results after the Wangapproach has been applied considering only 200 iterationsFurthermore Figure 11(c) shows results after applying theDE-based method which has been proposed in this paper
The Wang algorithm uses the fuzzy cellular neural net-work (FCNN) as optimization approach It employs gradientinformation and internal states in order to find a bettercontour configuration In each iteration the FCNN triesas contour points different new pixel positions which mustbe located nearby the original contour position Such factmight cause the contour solution to remain trapped into alocal minimum In order to avoid such a problem the Wangmethod applies a considerable number of iterations so that anear optimal contour configuration can be found Howeverwhen the number of iterations increases the possibility tocover other structures increases too Thus if the image has acomplex background (just as smear images do) or theWBCrsquosare too close the method gets confused so that finding thecorrect contour configuration from the gradientmagnitude isnot easyTherefore a drawback ofWangrsquosmethod is related toits optimal iteration number (instability) Such number mustbe determined experimentally as it depends on the imagecontext and its complexity Figure 12(a) shows the result of
Computational and Mathematical Methods in Medicine 11
(a) (b)
(c) (d)
Figure 10 Examples of images included in the experimental set for robustness comparison (a) and (b) original images (c) imagecontaminated with 10 of salt and pepper noise and (d) image polluted with 120590 = 10 of Gaussian noise
Table 3 Comparative WBC detection among methods that considers the complete data set of 30 images corrupted by different levels of saltand pepper noise
Noise level Method Leukocytes detected Missing False alarms DR FAR
Wang [5] 214 303 168 4139 3249GAB [12] 337 180 98 6518 1895DE based 463 54 31 8955 599
applying 400 cycles of Wangrsquos algorithm while Figure 12(b)presents the detection of the same cell shapes after 1000iterations using the proposed algorithm From Figure 12(a)it can be seen that the contour produced byWangrsquos algorithmdegenerates as the iteration process continues wrongly cov-ering other shapes lying nearby
In order to compare the accuracy of both methods theestimated WBC area which has been approximated by bothapproaches is compared to the actual WBC size consideringdifferent degrees of evolution that is the cycle number foreach algorithm The comparison considers only one WBCbecause it is the only detected shape in Wangrsquos method
Table 5 shows the averaged results over twenty repetitions foreach experiment In order to enhance the analysis Figure 13illustrates the error percentage versus iterations evolutionfrom an extended data set which has been compiled fromTable 5
7 Conclusions
In this paper an algorithm for the automatic detection ofblood cell images based on the DE algorithm has beenpresented The approach considers the complete process as
12 Computational and Mathematical Methods in Medicine
Table 4 Comparative WBC detection among methods which considers the complete data set of 30 images corrupted by different levels ofGaussian noise
Noise level Method Leukocytes detected Missing False alarms DR FAR
Figure 11 Comparison of the DE andWangrsquos method for white blood cell detection inmedical images (a) original image (b) detection usingthe Wangrsquos method and (c) detection after applying the DE method
(a) (b)
Figure 12 Result comparison for the white blood cells detection showing (a) Wangrsquos algorithm after 400 cycles and (b) DE detector methodconsidering 1000 cycles
Computational and Mathematical Methods in Medicine 13
50 100 150 200 250 300 350 400 450 500 550 6000
20406080
100120140160
Iterations
Erro
r (
)
WangDE based
Figure 13 Error percentage versus iterations evolution from anextended data set from Table 5
Table 5 Error in cellrsquos size estimation after applying the DE algo-rithm and Wangrsquos method to detect one leukocyte embedded in ablood-smear image The error is averaged over twenty experiments
Algorithm Iterations Error
Wang
30 8860 70200 1400 121600 157
DE-based
30 243060 717200 225400 225600 225
a multiple ellipse detection problem The proposed methoduses the encoding of five edge points as candidate ellipsesin the edge map of the smear An objective function allowsto accurately measure the resemblance of a candidate ellipsewith an actual WBC on the image Guided by the values ofsuch objective function the set of encoded candidate ellipsesare evolved using the DE algorithm so that they can fitinto actual WBC on the image The approach generates asubpixel detector which can effectively identify leukocytes inreal images
Theperformance of theDEmethod has been compared toother existingWBC detectors (the boundary support vectors(BSV) approach [3] the iterative Otsu (IO) method [4] theWang algorithm [5] and the genetic algorithm-based (GAB)detector [12]) considering several images which exhibit dif-ferent complexity levels Experimental results demonstratethe high performance of the proposed method in terms ofdetection accuracy robustness and stability
References
[1] X Zhuang and Q Meng ldquoLocal fuzzy fractal dimension and itsapplication in medical image processingrdquo Artificial Intelligencein Medicine vol 32 no 1 pp 29ndash36 2004
[2] I Scholl T Aach T M Deserno and T Kuhlen ldquoChallenges ofmedical image processingrdquo Computer Science vol 26 no 1-2pp 5ndash13 2011
[3] M Wang and R Chu ldquoA novel white blood cell detectionmethod based on boundary support vectorsrdquo in Proceedings ofIEEE International Conference on Systems Man and Cybernetics(SMC rsquo09) pp 2595ndash2598 Texas Tex USA October 2009
[4] J Wu P Zeng Y Zhou and C Olivier ldquoA novel colorimage segmentation method and its application to white bloodcell image analysisrdquo in Proceedings of the 8th InternationalConference on Signal Processing (ICSP rsquo06) November 2006
[5] W ShitongK F L Chung andFDuan ldquoApplying the improvedfuzzy cellular neural network IFCNN to white blood celldetectionrdquo Neurocomputing vol 70 no 7ndash9 pp 1348ndash13592007
[6] H Muammar and M Nixon ldquoApproaches to extending theHough transformrdquo in Proceedings of the International Confer-ence on Acoustics Speech and Signal Processing (ICASSP rsquo89)vol 3 pp 1556ndash1559 May 1989
[7] T Atherton and D Kerbyson ldquoUsing phase to represent radiusin the coherent circle Hough transformrdquo in Proceedings of IEEColloquium on Hough Transforms pp 1ndash4 IEEE 1993
[8] M A Fischler and R C Bolles ldquoRandom sample consensus aparadigm for model fitting with applications to image analysisand automated cartographyrdquo Communications of the ACM vol24 no 6 pp 381ndash395 1981
[9] D Shaked O Yaron and N Kiryati ldquoDeriving stopping rulesfor the probabilistic Hough transform by sequential analysisrdquoComputer Vision and Image Understanding vol 63 no 3 pp512ndash526 1996
[10] L Xu E Oja and P Kultanen ldquoA new curve detection methodrandomized Hough transform (RHT)rdquo Pattern RecognitionLetters vol 11 no 5 pp 331ndash338 1990
[11] J Han and L Koczy ldquoFuzzy Hough transformrdquo in Proceedingsof the 2nd IEEE International Conference on Fuzzy Systems vol2 pp 803ndash808 1993
[12] G Karkavitsas and M Rangoussi ldquoObject localization in medi-cal images using genetic algorithmsrdquoWorld Academy of ScienceEngineering and Technology vol 2 pp 6ndash9 2005
[13] V Ayala-Ramirez C H Garcia-Capulin A Perez-Garcia andR E Sanchez-Yanez ldquoCircle detection on images using geneticalgorithmsrdquo Pattern Recognition Letters vol 27 no 6 pp 652ndash657 2006
[14] E Lutton andPMartinez ldquoA genetic algorithm for the detectionof 2D geometric primitives in imagesrdquo in Proceedings of the 12thInternational Conference on Pattern Recognition vol 1 pp 526ndash528 Jerusalem Israel October 1994
[15] J Yao N Kharma and P Grogono ldquoAmulti-population geneticalgorithm for robust and fast ellipse detectionrdquo Pattern Analysisand Applications vol 8 no 1-2 pp 149ndash162 2005
[16] H D Cheng Y Guo and Y Zhang ldquoA novel Hough transformbased on eliminating particle swarm optimization and itsapplicationsrdquo Pattern Recognition vol 42 no 9 pp 1959ndash19692009
[17] DEM Diffused expectation maximization function for imagesegmentation Version 10 2012 httpwwwmathworkscommatlabcentralfileexchange37197-dem-diffused-expectation-maximisation-for-image-segmentation
[18] B V Babu and S A Munawar ldquoDifferential evolution strategiesfor optimal design of shell-and-tube heat exchangersrdquoChemicalEngineering Science vol 62 no 14 pp 3720ndash3739 2007
14 Computational and Mathematical Methods in Medicine
[19] D G Mayer B P Kinghorn and A A Archer ldquoDifferentialevolutionmdashan easy and efficient evolutionary algorithm formodel optimisationrdquoAgricultural Systems vol 83 no 3 pp 315ndash328 2005
[20] S Kannan S Mary Raja Slochanal and N Padhy ldquoApplicationand comparison of metaheuristic techniques to generationexpansion planning problemrdquo IEEE Transactions on PowerSystems vol 20 no 1 pp 466ndash475 February 2005
[21] J P Chiou C F Chang and C T Su ldquoVariable scaling hybriddifferential evolution for solving network reconfiguration ofdistribution systemsrdquo IEEE Transactions on Power Systems vol20 no 2 pp 668ndash674 2005
[22] E Cuevas D Zaldivar and M Perez-Cisneros ldquoA novelmulti-threshold segmentation approach based on differentialevolution optimizationrdquo Expert Systems with Applications vol37 no 7 pp 5265ndash5271 2010
[23] R Storn andK Price ldquoDifferential evolutionmdasha simple and effi-cient adaptive scheme for global optimization over continuousspacesrdquo Tech Rep TR-95-012 International Computer ScienceInstitute Berkeley Calif USA 1995
[24] J E Bresenham ldquoA linear algorithm for incremental digitaldisplay of circular arcsrdquo Communications of the ACM vol 20no 2 pp 100ndash106 1977
[25] J R Van Aken ldquoAn efficient ellipse-drawing algorithmrdquo IEEEComputer Graphics and Applications vol 4 no 9 pp 24ndash351984
[26] G Boccignone M Ferraro and P Napoletano ldquoDiffusedexpectation maximisation for image segmentationrdquo ElectronicsLetters vol 40 no 18 pp 1107ndash1108 2004
[27] G Boccignone P Napoletano V Caggiano and M Ferraro ldquoAmulti-resolution diffused expectation-maximization algorithmfor medical image segmentationrdquo Computers in Biology andMedicine vol 37 no 1 pp 83ndash96 2007
[28] R C Gonzalez and R E Woods Digital Image ProcessingAddison-Wesley Reading Mass USA 1992
[29] L Wang and F Z Huang ldquoParameter analysis based onstochastic model for differential evolution algorithmrdquo AppliedMathematics and Computation vol 217 no 7 pp 3263ndash32732010
[30] G Landi and E Loli Piccolomini ldquoAn efficient method fornonnegatively constrained Total Variation-based denoising ofmedical images corrupted by Poisson noiserdquo ComputerizedMedical Imaging and Graphics vol 36 no 1 pp 38ndash46 2012
[31] M J Tapiovaara and R F Wagner ldquoSNR and noise measure-ments for medical imaging I A practical approach based onstatistical decision theoryrdquo Physics in Medicine and Biology vol38 no 1 pp 71ndash92 1993