20
Best Practices For Pharma Analytics A THREE-PART SERIES
| Date post: | 05-May-2023 |
| Category: |
Documents |
| Upload: | khangminh22 |
| View: | 0 times |
| Download: | 0 times |

Best Practices For Pharma Analytics
A THREE-PART SERIES
Part 1
Creating Digital Personas

Pharmaceutical companies today can court potential customers in a myriad of exciting ways.
Besides traditional formats such as in-person meetings and congresses, companies can create digital-only brands, reaching out directly to healthcare providers (HCPs) through various digital platforms. But to optimise your commercial results, you’ll need to implement a targeted strategy that connects with HCPs through their preferred channels – rather than adopt a single, one-size- fits-all approach. How can you achieve this?
By drawing on data analytics to generate digital personas of individual HCPs – a project that Lynx Analytics recently embarked on in collaboration with a leading pharmaceutical company.
Creating Digital PersonasThese digital profiles can determine how receptive an individual is to virtual communication, thereby enabling you to allocate your resources more effectively. The process begins by harnessing all available interaction data between the individual HCPand your organisation. This is obtained from your central data warehouse, alongside othersources and formats.
The internal data is complemented with data from external sources such as graduation year, medical specialty, publications, public posts in social media and online behaviour.
Once the relevant data is gathered, the software applies several advanced statistical and machine-learning techniques to derive the digital propensity of the target HCP and develop affinity scores across different platforms.

Besides the aforementioned data sources, the profiling algorithm also evaluates how digitally advanced a channel is and its effectiveness from a sales perspective. For HCPs where only limited data is available, their digital affinity is inferred from HCPs with similar characteristics. Such profiles are updated on a regular basis to ensure that any recent changes in a HCP’s digital affinity are properly reflected. This profiling information is subsequently integrated into your company’s existing systems, thus ensuring that it’s easily and automatically available when planning campaigns in CRM systems such as Veeva or SFMC.
Additionally, information regarding digital profiles and sales-force activities by digital segment are tracked via a handy sales-force effectiveness dashboard.
You can then use these data-driven insights to power more successful and personalisedsales and marketing campaigns.
For instance, doctors with a high digital affinity can be targeted through virtual platforms.
Such channels are usually more cost-effective than traditional methods, so your more expensive sales representatives can be allocated to high-potential HCPs that still prefer in-person interactions.
The COVID-19 pandemic has only accelerated the industry’s digitalisation, which makes it allthe more important for companies to hone their digital sales and marketing strategies formaximum success.
By creating digital personas of your target HCPs, you can equip your business with the necessary insights to optimise your commercial agenda.

Advanced data analytics and AI solutions can have a radical effect on improving the commercial operations of life sciences companies.
For instance, they can help organisations to identify high-potential healthcare providers (HCPs) based on online behaviour; gain a better and more comprehensive understanding of their customers; and using forecasting methods to run targeted, seamless omni-channel campaigns.
But to implement these tools, businesses first need to get the basics right: by organising, streamlining and syncing their disparate data into an integrated system.
Once companies have established this strong foundation, they can then proceed to empower their commercial and medical teams with the necessary resources and data-driven insights to optimise their efforts.
Part 2
Optimizing The Brand Adoption Ladder
A successful commercial strategy begins with knowing your customers. For pharmaceuticalcompanies, having an in-depth understanding of the attitudes that individual healthcareproviders (HCPs) have towards your products can empower you to tailor your commercialefforts to meet their unique needs.
The brand adoption ladder is an important industry-wide tool that serves this purpose.
Put simply, it is a systematic framework that determines how strongly potential customers have “bought into” your product by ranking them on a scale from being unaware of its presence on the market to acting as a strong advocate among their peers.
This can complement other HCP profiling approaches, such as creating a digital persona to ascertain their communication preferences and determining their prescription potential.
Locating where an HCP is on the brand adoption ladder serves a critical commercialpurpose.
It can offer key insights into which exact messages to send out to optimally engage with an individual, thereby allowing you to efficiently allocate your resources.
For instance, an HCP may have a high prescription potential due to their large patientpopulation.
However, their brand adoption ladder rating reveals that they are only a “trialist” of your product. Based on these results, there is immense untapped potential.
With the right tools, you can identify these HCPs and subsequently determine the reasonsfor the low level of adoption – thereby allowing you to specifically craft your campaigns toaddress their needs.
For example, the aforementioned HCP might be worried about the potential side effects in a patient population with high co-morbidities.
Thus, it would be advisable to share positive clinical study results relating to such patient groups.
For pharmaceutical companies to leverage the full potential of the brand adoption ladder andcreate more effective sales and marketing campaigns, it’s important to rate as many HCPs as you can to gain a full overview of the entire landscape. The information also needs to be as up to date as possible to ensure accuracy.
However, many ratings are gleaned from analogue assessments by sales representatives, and must be updated manually.
This is an arduous, time-consuming process that often results in incomplete and outdated information.
To generate more comprehensive and accurate brand adoption ladder ratings, you can harness AI-based predictive technology that uses advanced data analytics.
This is exactly what a major pharmaceutical organisation recently did by partnering with Lynx Analytics.
As part of the pilot study, Lynx Analytics developed a machine-leaning-based recommendation engine that classifies HCPs based on factors including their interactionpatterns with the pharmaceutical company, socio-demographic data, online behaviour andrelevant sales data.
After analysing this information, the software suggests a brand adoption ladder ranking for a specific HCP, which the sales representative can choose to accept or decline.
Such digital, data-driven technology has the ability to substantially improve the quality of customer profiles.
It directs sales representatives to HCPs with brand adoption ladder figures that are likely outdated or missing altogether, and allows them to plug these gaps.

During the pilot study, the share of sales representatives making an update to the brand adoption ladder rating of at least one of their target HCPs increased threefold.
Similarly, the share of overall brand adoption ladder figures that were updated during the pilot study was triple compared to that of a control group.
The recommendation engine also reduced the time that sales representatives spent onadministrative tasks, such as manually updating data in CRM systems.
Consequently, 83% of the participating sales representatives indicated that they would recommend this tool, and the organisation is now in the process of rolling it out across all of its sales offices.
Indeed, by leveraging data analytics to optimise your brand adoption ladder ratings, you can gain more holistic and accurate insights into your potential customers – which can in turn drive better commercial results.
Part 3
Dashboards For Business Operations
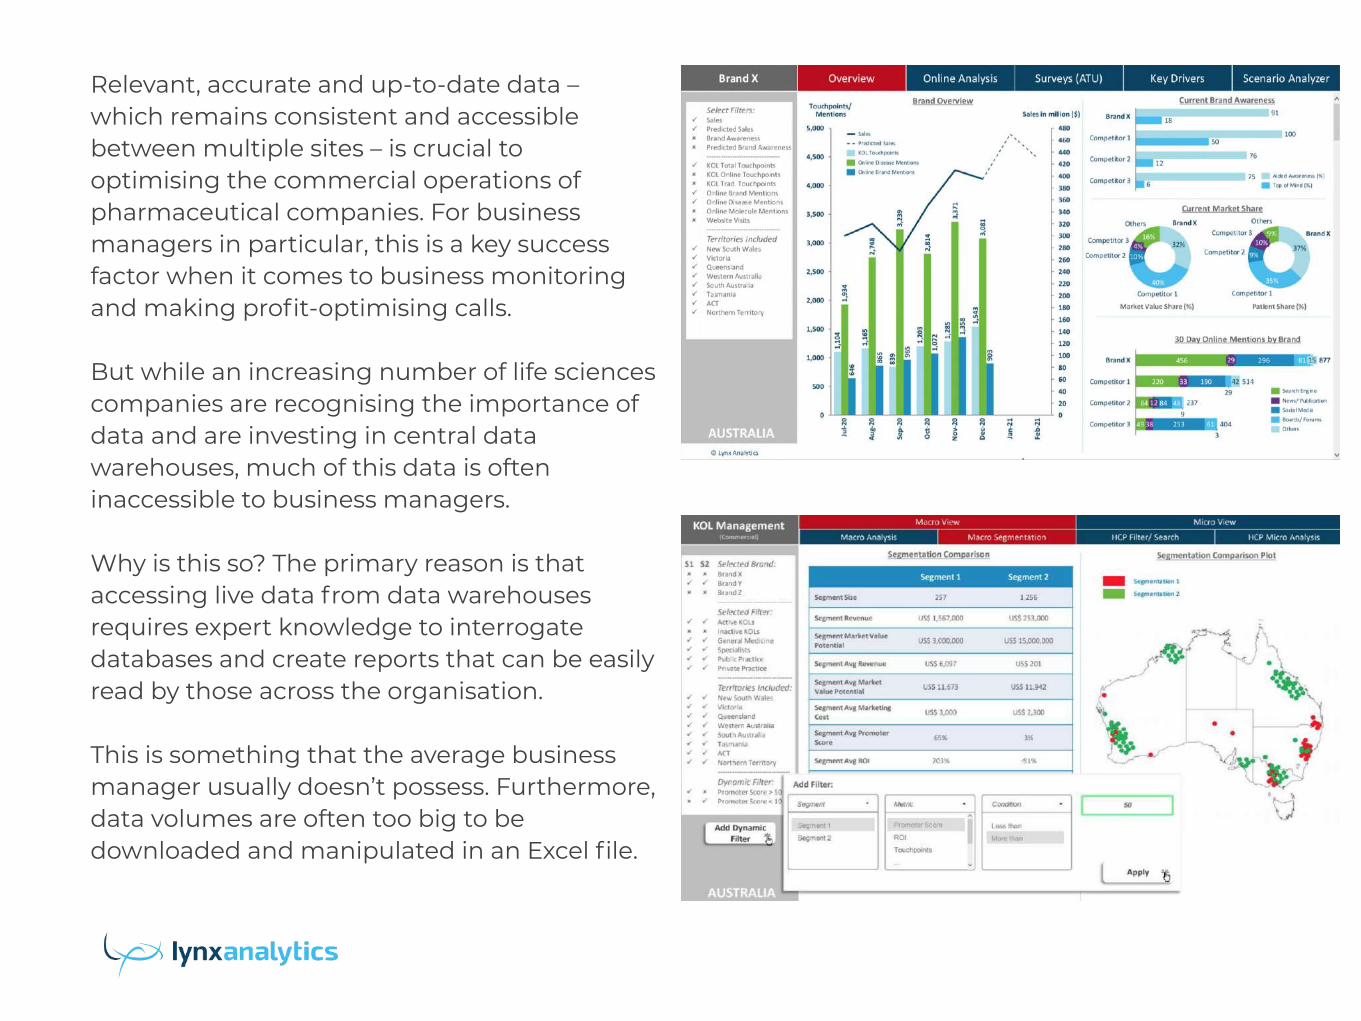
Relevant, accurate and up-to-date data – which remains consistent and accessible between multiple sites – is crucial to optimising the commercial operations of pharmaceutical companies. For business managers in particular, this is a key success factor when it comes to business monitoring and making profit-optimising calls.
But while an increasing number of life sciences companies are recognising the importance of data and are investing in central data warehouses, much of this data is often inaccessible to business managers.
Why is this so? The primary reason is that accessing live data from data warehouses requires expert knowledge to interrogate databases and create reports that can be easily read by those across the organisation.
This is something that the average business manager usually doesn’t possess. Furthermore, data volumes are often too big to be downloaded and manipulated in an Excel file.
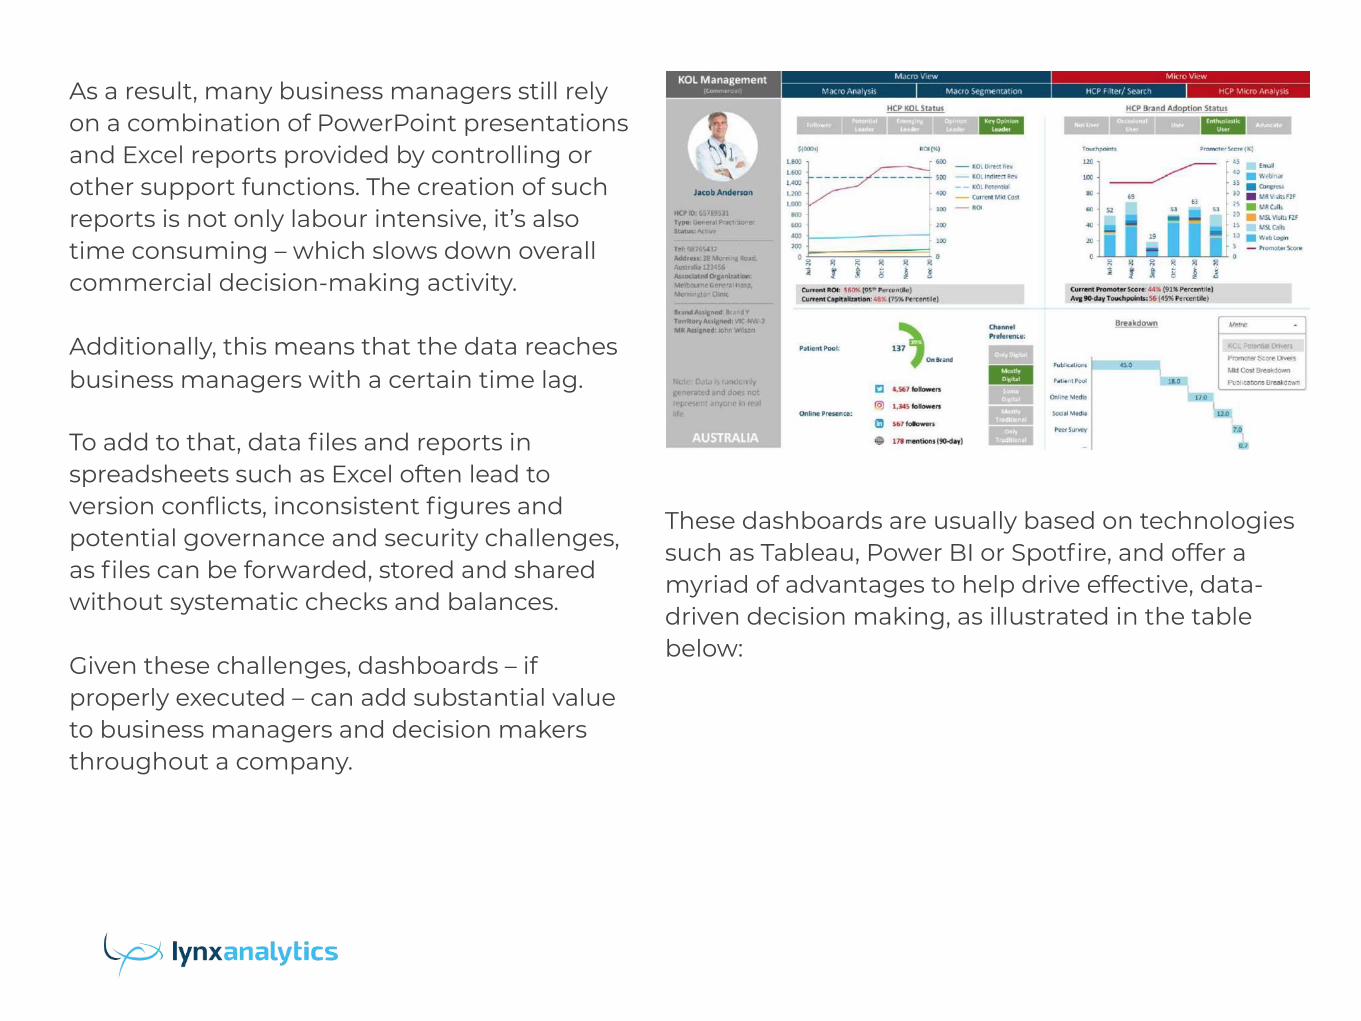
As a result, many business managers still rely on a combination of PowerPoint presentations and Excel reports provided by controlling or other support functions. The creation of such reports is not only labour intensive, it’s also time consuming – which slows down overall commercial decision-making activity.
Additionally, this means that the data reaches business managers with a certain time lag.
To add to that, data files and reports in spreadsheets such as Excel often lead to version conflicts, inconsistent figures and potential governance and security challenges, as files can be forwarded, stored and shared without systematic checks and balances.
Given these challenges, dashboards – if properly executed – can add substantial value to business managers and decision makers throughout a company.
These dashboards are usually based on technologies such as Tableau, Power BI or Spotfire, and offer a myriad of advantages to help drive effective, data-driven decision making, as illustrated in the table below:

Advantages of dashboards over Excel spreadsheets
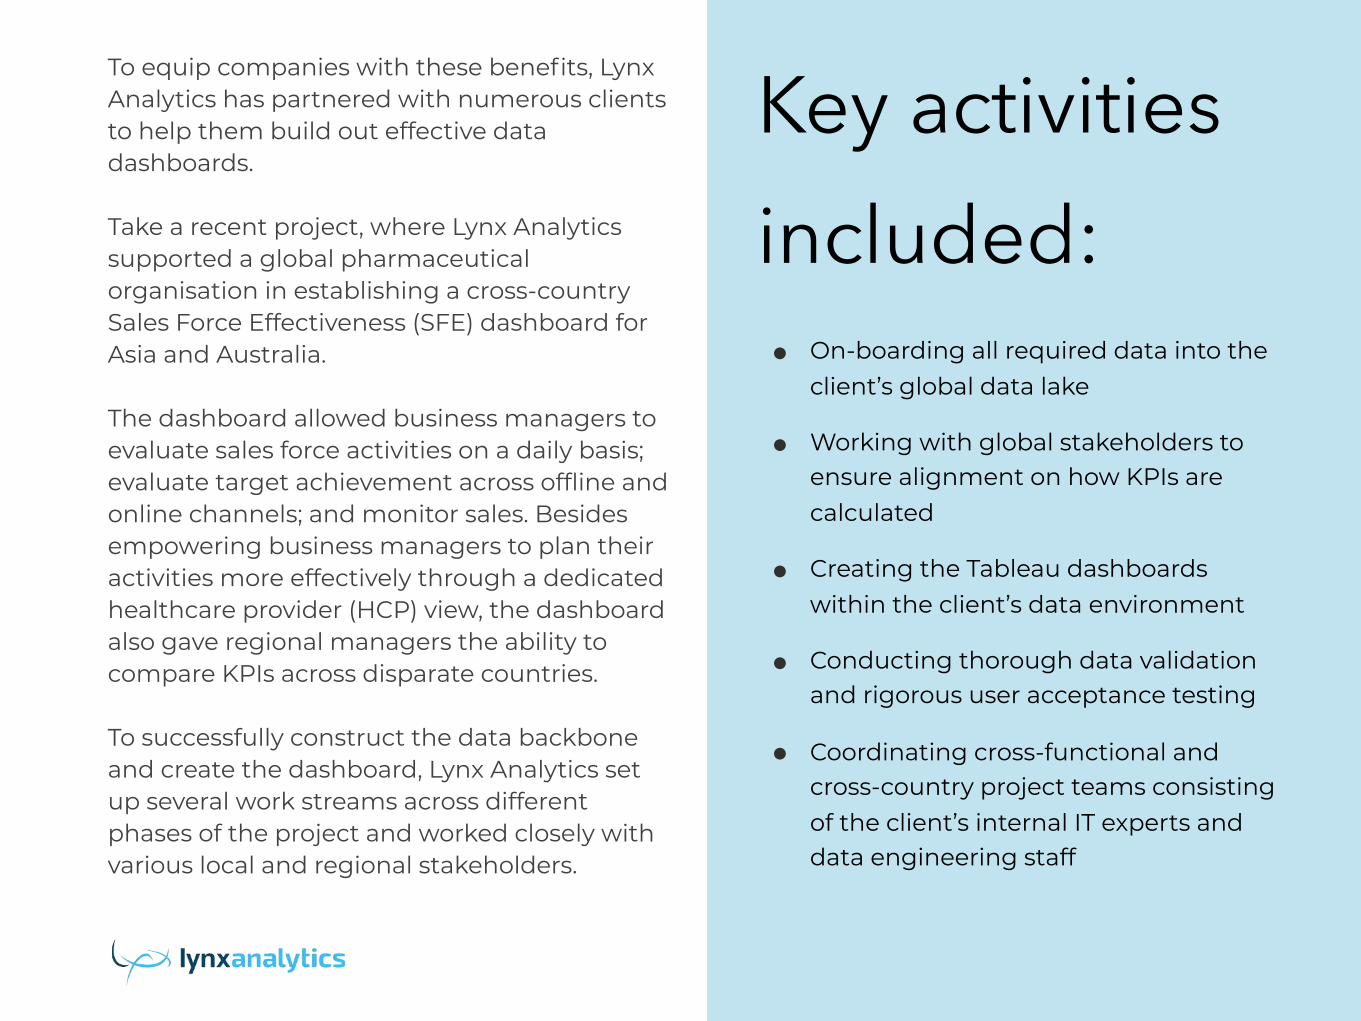
To equip companies with these benefits, Lynx Analytics has partnered with numerous clients to help them build out effective data dashboards.
Take a recent project, where Lynx Analytics supported a global pharmaceutical organisation in establishing a cross-country Sales Force Effectiveness (SFE) dashboard for Asia and Australia.
The dashboard allowed business managers to evaluate sales force activities on a daily basis; evaluate target achievement across offline and online channels; and monitor sales. Besides empowering business managers to plan their activities more effectively through a dedicated healthcare provider (HCP) view, the dashboard also gave regional managers the ability to compare KPIs across disparate countries.
To successfully construct the data backbone and create the dashboard, Lynx Analytics set up several work streams across different phases of the project and worked closely with various local and regional stakeholders.
Key activities included: • On-boarding all required data into the
client’s global data lake
• Working with global stakeholders to ensure alignment on how KPIs are calculated
• Creating the Tableau dashboards within the client’s data environment
• Conducting thorough data validation and rigorous user acceptance testing
• Coordinating cross-functional and cross-country project teams consisting of the client’s internal IT experts and data engineering staff

Lynx Analytics was able to quickly establish the dashboard, which has been successfully implemented by the company’s local business stakeholders across Asia and Australia to make data-driven commercial decisions.
Beyond this particular case, Lynx Analytics has worked with other clients to create dashboards that track and display the results of awareness, trial and usage studies over time; as well as those that summarise HCP-related information including recent publications, conference participations and online activities.
Indeed, be it gaining a more holistic understanding of HCP behaviour or better monitoring cross-country sales force activities, well-executed dashboards can equip business managers with the necessary tools to enact revenue-optimising decisions.

Bonus Content
Data Infrastructure Transformation
How Lynx Analytics partnered with a leading global pharmaceutical company to overhaul its legacy data systems, thereby empowering it to improve its customer engagement and
optimise its commercial agenda.

Many pharmaceutical companies maintain their data – which can include commercial figures, CRM statistics, customer records and survey results – across a range of disparate, siloed and complex systems that cannot be easily integrated.
Hence, in order to attain greater efficiency and results, they will first need to transform their legacy data infrastructure.
This was the case for a leading global pharmaceutical firm that sought to improve customer engagement in its Japanese market.
It wanted to empower its commercial and medical teams with applications to make their customer interactions more intelligent, proactive and efficient – but its existing data infrastructure was not set up for this.
Why good data infrastructure is crucial for advanced data analytics and AI solutions
To help the company achieve its aims, Lynx Analytics collaborated with them to overhaul their existing data infrastructure.
The new, tailored system – completed within four months of the project’s inception – allowed them to seamlessly integrate previously disparate data sources. This empowered the firm to streamline important business processes and commercial tasks: such as automating HCP profiling activities; monitoring end-to-end customer engagement and commercial KPIs; and designing and executing harmonised omni-channel campaigns.

As with many traditional systems, the global pharmaceutical company’s data – gleaned from internal and external sources – was siloed and held in a range of often-incompatible formats.
It was therefore challenging to combine this information to guide sales, automate processes, generate insights or apply analytics to inform forecasts.
Devising the best strategy to transform the company’s data infrastructure required a deep dive into its systems. This process revealed key synergies between data sources that could help to facilitate data sharing.
Throughout the entire process, Lynx Analytics also took care to adhere and cater to various business sensitivities – such as
Transforming a global pharmaceutical company’s legacy data infrastructure
the need to separate medical and commercial data for compliance purposes.
Based on these findings, Lynx Analytics evaluated the commercial opportunities that could arise from using an integrated, master database.
After identifying 10 strategic use cases and presenting them to company stakeholders, the partners decided to develop an application for the merging of multi-channel information and reporting automation – a high-value opportunity that would deliver commercial benefits quickly.
Lynx Analytics then performed the necessary engineering to build the data infrastructure and application, as well as onboard the data.

With the new system, the company was able to achieve its objectives of merging multi-channel information and reporting automation.
By integrating a vast amount of data from previously disparate sources, the system gave the company the ability to generate new and deeper insights, respond to changes quickly and improve its commercial performance.
Take monthly multi-channel reports, which are crucial to obtaining a better understanding of customer engagement across platforms.
Previously, production of each report required three weeks of cross-team coordination and manually merging over 30 files from different sources.
But with the new data infrastructure and application, the relevant data could be integrated into a single environment.
Wide-ranging benefits of the new data infrastructure
This facilitated the automated production of an aggregated report, reducing the three-week process to just 10 minutes.
In addition to dramatically improving productivity, the system set the foundation for deploying other applications for the company to obtain key insights that simply weren’t possible before. These include more accurate and granular information about customer preferences, as well as metrics revealing the impact of specific marketing efforts.
Indeed, transforming their data infrastructure is that all-important first step for organisations to unlock the possibilities of advanced data analytics and AI solutions.
Once the data has been integrated into a holistic, seamless and easy-to-use system, businesses can then proceed to draw on cutting-edge digital applications to achieve data-driven insights – which can help to power better customer engagement and drive commercial success.

Besides tackling this initial use case, the system would also support the remaining use cases: such as increasing sales by employing advanced data analytics and AI solutions to profile HCPs and tailor commercial strategies accordingly; better targeting customers by capturing relevant smartphone data; and predicting changes in product demand by tracking online discussions of patients and doctors.
To facilitate this, Lynx Analytics worked closely with the client to devise detailed road maps for the future implementation of each of these opportunities.


