land degradation & developmentLand Degrad. Develop. (2014)
Published online in Wiley Online Library (wileyonlinelibrary.com) DOI: 10.1002/ldr.2268
SELECTION OF TREE SPECIES AND SOIL MANAGEMENT FORSIMULTANEOUS FUELWOOD PRODUCTION AND SOIL REHABILITATION
IN THE ETHIOPIAN CENTRAL HIGHLANDS
Mehari A. Tesfaye1,3, Andrés Bravo-Oviedo2,3*, Felipe Bravo1,3, Berhane Kidane4, Kassahun Bekele5, Demissew Sertse5
1University of Valladolid at Palencia (UVa), Avda.Madrid, 44, 34071 Palencia, Spain2INIA, Forest Research Centre CIFOR, Crta. La Coruña km 7.5 28040 Madrid, Spain
3Sustainable Forest Management Research Institute, Universidad de Valladolid & INIA, Spain4Ethiopian Institute of Agricultural Research, Forestry Research Centre, P.O. Box 58532, Addis Ababa, Ethiopia
5Holetta Research Centre, P.O. Box 31, Holetta, Ethiopia
Received: 9 August 2013; Revised: 11 December 2013; Accepted: 15 December 2013
key words: tree growth; survival; biomass; nitrogen depletion; mixed model
INTRODUCTION
Sub-Saharan Africa accommodates one of the world’sfastest growing populations, and it is significantly affectedby land degradation because of deforestation, poor landmanagement and conversion of fragile natural habitats intofields for crops. The forest area in East Africa was reducedby 783,000 ha between 2000 and 2010: equivalent to anannual loss rate of 1.01% (FAO, 2011). Shortages of forestproducts, loss of soil fertility and disruption of the watercycle are followed by poverty, hunger and social unrest inthe region (Barrowclough & Ghimire, 1996).This general layout of deforestation and its consequences is
similar to other tropical and sub-tropical areas (López-García& Ayala-Alcántara, 2012; De la Paix et al., 2013) and hasmade restoration of degraded land an essential challenge.John et al. (1997) identified some of the factors that act ascatalyst of such situation: intensive crop expansion, over-grazing and unsustainable fuelwood harvesting. In recentyears, the fuelwood crisis that links deforestation with
* Correspondence to: A. Bravo-Oviedo, INIA-Forest Research Centre, CtraA. Coruña, km. 7.5 Madrid, Spain.E-mail: [email protected]
fuelwood consumption has been discarded as many of theharvest occurs on species growing ‘outside’ the forest(Mahiri & Howorth, 2001; Bensel, 2008). This pattern offuelwood consumption is improved by householders’ treeplantations, where natural forests are scarce (Bewket, 2003).As a consequence, tree planting has emerged as a plausibleoption to fulfil the fuelwood demand (Lemenih & Bongers,2010). However, there may not be a link between treeplanting and fuelwood consumption (Gebreegziabher & vanKooten, 2013).In Ethiopia, nearly 1·5 billion tons of topsoil is lost every
year (Tadesse, 2001). Despite efforts to combat land degra-dation in all Sub-Saharan Africa, and Ethiopia in particular(Yitbarek et al., 2012), the scope and magnitude of theproblem continues, and the country is identified amongthose, which has expanded cropland area at the expense ofnatural habitats (Phalan et al., 2013). Currently, the seem-ingly contradictory objective of restoring vegetation coverand production of fuelwood is a key environmental issue.With this regard, species selection for afforestation is cru-
cial as the tree species may affect soil properties differently(Li et al., 2012). However, interim management solutionssuch as physical soil retention structures are needed priorto establishing vegetation (Yitbarek et al., 2012). Exclosures
M. A. TESFAYE ET AL.
have been identified as a valuable rehabilitation option whenthe main driver of land degradation is grazing (Mekuria &Ayenekulu, 2011) or intense recreational use (Özcan et al.,2013). However, these measures are expensive for localcommunities. Effective restoration practices should be basedon local perceptions of soil erosion and should includeeasily available management options (Kiome & Stocking,1995). The application of manure has demonstrated topositively affect the infiltration capacity of soils and plantproduction on grazed lands (Tadesse et al., 2003) at lowcost. In addition, mulching can both enhance conditionsfor plant growth in harsh environments (Blanco-García &Lindig-Cisneros, 2005) and protect topsoil against erosion(Roose & Barethès, 2001). The correct selection of plantspecies and soil management is vital for both fuelwoodproduction and soil rehabilitation.Motivation for this study stems from the lack of research
on species selection for plantations that pursues two objec-tives: land rehabilitation while assuring fuelwood produc-tion in the Ethiopian Central Highlands. The aim was todetermine which species and soil management options arebetter adapted to current Highlands conditions. On the basisof the observations and previous studies, we hypothesizedthat native tree species might not show better performancefor both objectives in this harsh environment.
MATERIAL AND METHODS
Study Area
The study was conducted from 2005 to 2009 in the centralhighlands of Ethiopia. The study site was located at9º38’19.66’N latitude and 38º49’34·46’E longitude, at2600m a.s.l. (Figure S1). Metereological data wereobtained from Ethiopian Metereological Agency in AddisAbaba. The 5-year (2005–2009) averaged mean annualmaximum and minimum temperature of the study areawere 21°C and 8°C, respectively, with 5-year annual meanaveraged precipitation 1,200mm falling mostly in July andAugust (Figure S2). Köppen’s classification is temperatehighland tropical climate with dry winters.The experimental site was selected through a participatory
process with local stakeholders. A focus group discussionwas conducted with district agricultural experts, develop-ment agents and farmers. The farmers were selected on thebasis of age (young: 18–35 years old; adult: 35–55 andold: >55), average income per household per year (poor:$232; medium: $407; rich: $700) and gender. Ten key infor-mant interviewers (development agents, agricultural expertsand community administrators) and 40 random householdswere selected to ascertain commitment and attitude towardsthe project, in order to avoid a negative impact on the exper-imental layout. The experimental site was selected on thebasis of accessibility and representativeness of degraded landon sandy soil, rock outcrops and without vegetation cover.The experimental site was a cultivated land until 1995 whenit was abandoned because of soil fertility depletion.
The same participatory process as for selection of experi-mental site was used for the selection of tree species andsoil management options. Species were selected on thebasis of local adaptability. A total of seven species wereidentified in this study: two native tree species [Dombeyatorrida (J.F.Gmel.) Bamps and Hagenia abyssinica (Bruce)J.F.Gmel.], four exotic tree species [Acacia decurrensWilld.,A.saligna (Labill.) H.L.Wendl., Eucalyptus globulus Labill.andGrevillea robustaA.Cunn. ex R. Br.] and one exotic shrubChamaecytisus palmensis (Christ.) Hutch. All seeds weredirectly sown in polyethylene bags for 8months and wereexposed to similar watering, shading, weeding and hardeningoff practices until 20–30 cm high.Three soil management options were applied, based on local
perceptions of erosion control: i) a control treatment wherenothing was performed to correct the initial degraded condi-tion; ii) application of manure; and iii) application of manureand mulching. Three kilogrammes of decomposed manurewere added to the planting pits (40 cm deep) during seedlingplanting on 12th July, 2005, while 0·5 kg of mulching withair dried grass was applied in the preceding dry season to con-serve moisture and avoid the desiccation of soil and seedlings.The experimental layout was organized as a split-plot design,
with tree species as the main plot and soil management optionsas subplots; it was organized in three blocks to control variationalong a slope gradient and three replicates for each species. Themain plot consisted of 90 trees divided into three groups of 30trees; each arranged into five rows, with six trees in each row.The distance between trees in the same row and between rowsin the same subplot was 1·5m, whereas the distance betweentreatments in the main plot and sub-plots was 2m. Weedingand hoeing were applied uniformly to the entire plot on 10thof August and 12th of September 2005 (Figure S3).
Data Collection and Procedure
The 12 inner trees in every sub-plot were assessed for datacollection, and the rest were considered border trees. Survivalcounts, alongwith tree height and root collar diameter measure-ments were taken at 12, 24, 36 and 48months after planting.Volume was calculated from the average height and
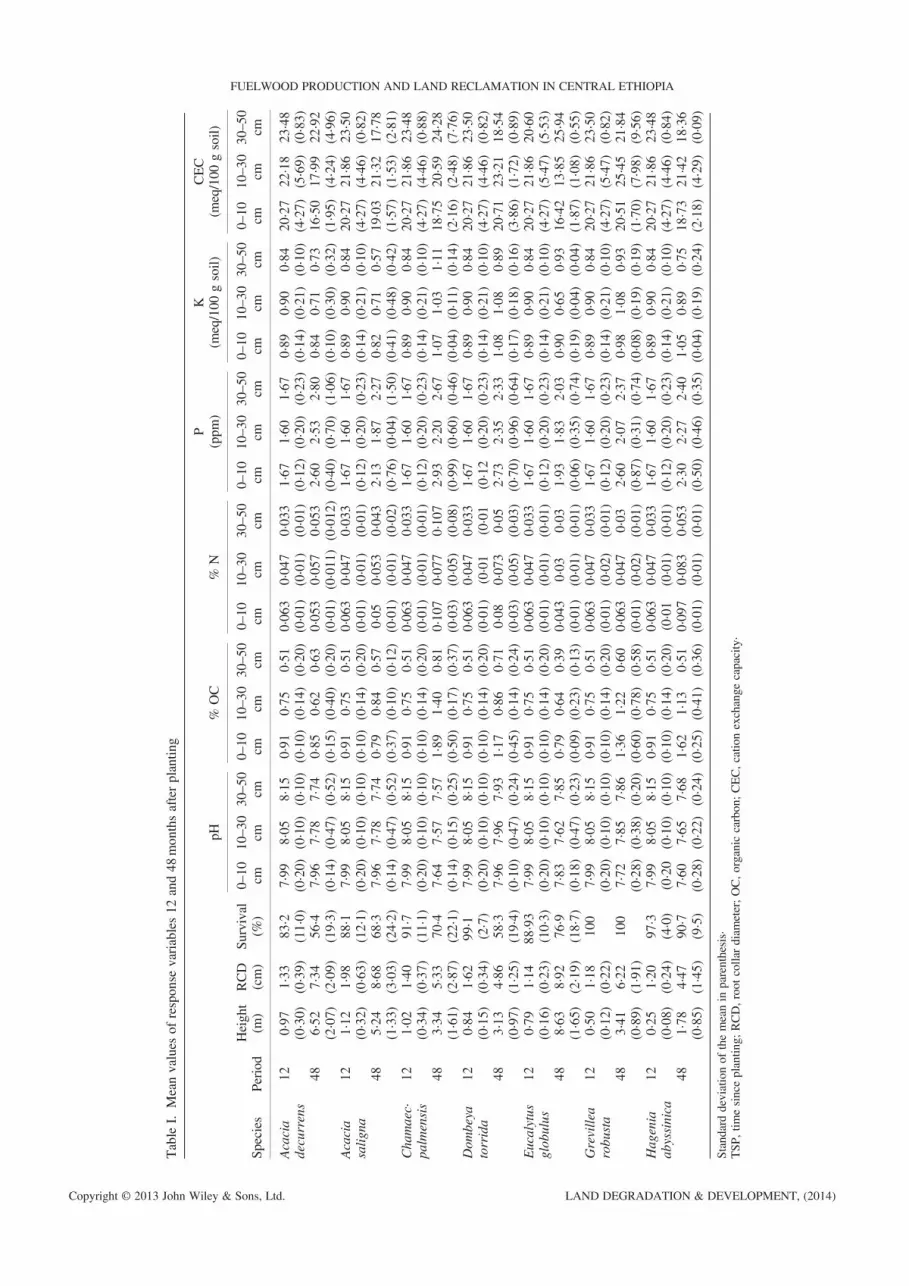
diameter of the experiment trees; total biomass calculationswere based on tree volume and specific gravity, using valuesobtained from the specific gravity. Table I provides a sum-mary of data 1 and 4 years after planting.
Soil Sampling and Analysis
Soil augering was carried out in 3m× 3m subplot at theinitial and final stage of the experiment, at 0–10, 10–30 and30–50 cm depth. A total of 72 composite soil samples werecollected for analysis. Three random sampling points weremixed to form one composite sample. The collected sampleswere air dried, sieved (2mm diameter) and grounded beforeanalysis.The samples were analyzed for pH (1:2·5 soil :water ratio), total N (%) using Kjeldahl’s method, organiccarbon (%) according to Walkely–Black’s method, available
LAND DEGRADATION & DEVELOPMENT, (2014)
Table
I.Meanvalues
ofresponse
variables12
and48
monthsafterplantin
g
Species
Period
Height
(m)
RCD
(cm)
Survival
(%)
pH%
OC
%N
P(ppm
)K
(meq/100
gsoil)
CEC
(meq/100
gsoil)
0–10
cm10
–30
cm30–5
0cm
0–10
cm10
–30
cm30
–50
cm0–
10cm
10–30
cm30–5
0cm
0–10
cm10
–30
cm30–5
0cm
0–10
cm10–3
0cm
30–50
cm0–
10cm
10–30
cm30
–50
cm
Acacia
decurrens
120·97
(0·30)
1·33
(0·39)
83·2
(11·0)
7·99
(0·20)
8·05
(0·10)
8·15
(0·10)
0·91
(0·10)
0·75
(0·14)
0·51
(0·20)
0·063
(0·01)
0·047
(0·01)
0·033
(0·01)
1·67
(0·12)
1·60
(0·20)
1·67
(0·23)
0·89
(0·14)
0·90
(0·21)
0·84
(0·10)
20·27
(4·27)
22·18
(5·69)
23·48
(0·83)
486·52
(2·07)
7·34
(2·09)
56·4
(19·3)
7·96
(0·14)
7·78
(0·47)
7·74
(0·52)
0·85
(0·15)
0·62
(0·40)
0·63
(0·20)
0·053
(0·01)
0·057
(0·011)
0·053
(0·012)
2·60
(0·40)
2·53
(0·70)
2·80
(1·06)
0·84
(0·10)
0·71
(0·30)
0·73
(0·32)
16·50
(1·95)
17·99
(4·24)
22·92
(4·96)
Acacia
salig
na12
1·12
(0·32)
1·98
(0·63)
88·1
(12·1)
7·99
(0·20)
8·05
(0·10)
8·15
(0·10)
0·91
(0·10)
0·75
(0·14)
0·51
(0·20)
0·063
(0·01)
0·047
(0·01)
0·033
(0·01)
1·67
(0·12)
1·60
(0·20)
1·67
(0·23)
0·89
(0·14)
0·90
(0·21)
0·84
(0·10)
20·27
(4·27)
21·86
(4·46)
23·50
(0·82)
485·24
(1·33)
8·68
(3·03)
68·3
(24·2)
7·96
(0·14)
7·78
(0·47)
7·74
(0·52)
0·79
(0·37)
0·84
(0·10)
0·57
(0·12)
0·05
(0·01)
0·053
(0·01)
0·043
(0·02)
2·13
(0·76)
1·87
(0·04)
2·27
(1·50)
0·82
(0·41)
0·71
(0·48)
0·57
(0·42)
19·03
(1·57)
21·32
(1·53)
17·78
(2·81)
Chamaec·
palmensis
121·02
(0·34)
1·40
(0·37)
91·7
(11·1)
7·99
(0·20)
8·05
(0·10)
8·15
(0·10)
0·91
(0·10)
0·75
(0·14)
0·51
(0·20)
0·063
(0·01)
0·047
(0·01)
0·033
(0·01)
1·67
(0·12)
1·60
(0·20)
1·67
(0·23)
0·89
(0·14)
0·90
(0·21)
0·84
(0·10)
20·27
(4·27)
21·86
(4·46)
23·48
(0·88)
483·34
(1·61)
5·33
(2·87)
70·4
(22·1)
7·64
(0·14)
7·57
(0·15)
7·57
(0·25)
1·89
(0·50)
1·40
(0·17)
0·81
(0·37)
0·107
(0·03)
0·077
(0·05)
0·107
(0·08)
2·93
(0·99)
2·20
(0·60)
2·67
(0·46)
1·07
(0·04)
1·03
(0·11)
1·11
(0·14)
18·75
(2·16)
20·59
(2·48)
24·28
(7·76)
Dom
beya
torrida
120·84
(0·15)
1·62
(0·34)
99·1
(2·7)
7·99
(0·20)
8·05
(0·10)
8·15
(0·10)
0·91
(0·10)
0·75
(0·14)
0·51
(0·20)
0·063
(0·01)
0·047
(0·01
0·033
(0·01
1·67
(0·12
1·60
(0·20)
1·67
(0·23)
0·89
(0·14)
0·90
(0·21)
0·84
(0·10)
20·27
(4·27)
21·86
(4·46)
23·50
(0·82)
483·13
(0·97)
4·86
(1·25)
58·3
(19·4)
7·96
(0·10)
7·96
(0·47)
7·93
(0·24)
1·17
(0·45)
0·86
(0·14)
0·71
(0·24)
0·08
(0·03)
0·073
(0·05)
0·05
(0·03)
2·73
(0·70)
2·35
(0·96)
2·33
(0·64)
1·08
(0·17)
1·08
(0·18)
0·89
(0·16)
20·71
(3·86)
23·21
(1·72)
18·54
(0·89)
Eucalytus
globulus
120·79
(0·16)
1·14
(0·23)
88·93
(10·3)
7·99
(0·20)
8·05
(0·10)
8·15
(0·10)
0·91
(0·10)
0·75
(0·14)
0·51
(0·20)
0·063
(0·01)
0·047
(0·01)
0·033
(0·01)
1·67
(0·12)
1·60
(0·20)
1·67
(0·23)
0·89
(0·14)
0·90
(0·21)
0·84
(0·10)
20·27
(4·27)
21·86
(5·47)
20·60
(5·53)
488·63
(1·65)
8·92
(2·19)
76·9
(18·7)
7·83
(0·18)
7·62
(0·47)
7·85
(0·23)
0·79
(0·09)
0·64
(0·23)
0·39
(0·13)
0·043
(0·01)
0·03
(0·01)
0·03
(0·01)
1·93
(0·06)
1·83
(0·35)
2·03
(0·74)
0·90
(0·19)
0·65
(0·04)
0·93
(0·04)
16·42
(1·87)
13·85
(1·08)
25·94
(0·55)
Grevillea
robusta
120·50
(0·12)
1·18
(0·22)
100
7·99
(0·20)
8·05
(0·10)
8·15
(0·10)
0·91
(0·10)
0·75
(0·14)
0·51
(0·20)
0·063
(0·01)
0·047
(0·02)
0·033
(0·01)
1·67
(0·12)
1·60
(0·20)
1·67
(0·23)
0·89
(0·14)
0·90
(0·21)
0·84
(0·10)
20·27
(4·27)
21·86
(5·47)
23·50
(0·82)
483·41
(0·89)
6·22
(1·91)
100
7·72
(0·28)
7·85
(0·38)
7·86
(0·20)
1·36
(0·60)
1·22
(0·78)
0·60
(0·58)
0·063
(0·01)
0·047
(0·02)
0·03
(0·01)
2·60
(0·87)
2·07
(0·31)
2·37
(0·74)
0·98
(0·08)
1·08
(0·19)
0·93
(0·19)
20·51
(1·70)
25·45
(7·98)
21·84
(9·56)
Hagenia
abyssinica
120·25
(0·08)
1·20
(0·24)
97·3
(4·0)
7·99
(0·20
8·05
(0·10)
8·15
(0·10)
0·91
(0·10)
0·75
(0·14)
0·51
(0·20)
0·063
(0·01
0·047
(0·01)
0·033
(0·01)
1·67
(0·12)
1·60
(0·20)
1·67
(0·23)
0·89
(0·14)
0·90
(0·21)
0·84
(0·10)
20·27
(4·27)
21·86
(4·46)
23·48
(0·84)
481·78
(0·85)
4·47
(1·45)
90·7
(9·5)
7·60
(0·28)
7·65
(0·22)
7·68
(0·24)
1·62
(0·25)
1·13
(0·41)
0·51
(0·36)
0·097
(0·01)
0·083
(0·01)
0·053
(0·01)
2·30
(0·50)
2·27
(0·46)
2·40
(0·35)
1·05
(0·04)
0·89
(0·19)
0·75
(0·24)
18·73
(2·18)
21·42
(4·29)
18·36
(0·09)
Standarddeviationof
themeanin
parenthesis·
TSP,
timesinceplantin
g;RCD,rootcollardiam
eter;OC,organiccarbon;CEC,catio
nexchange
capacity·
FUELWOOD PRODUCTION AND LAND RECLAMATION IN CENTRAL ETHIOPIA
Figure 1. Percentage of trees alive by species throughout the lifespan of theexperiment. Points indicate the month of measurement 12, 24, 36 and 48.EG, Eucalyptus globulus; AS, Acacia saligna; AD, Acacia decurrens; CP,Chamaecytisus palmensis; GR, Grevillea robusta; DT, Dombeya torrida;HA, Hagenia abyssinica. This figure is available in colour online at
wileyonlinelibrary.com/journal/ldr
M. A. TESFAYE ET AL.
phosphorus (units) using Olsen’s method, pH was deter-mined using a suspension of 1:5 soil : water ratio. Ammo-nium and sodium acetate were applied to determine cationexchange capacity (CEC). Exchangeable K were measuredwith flame photometer.The mean values and standard errors for soil variables at the
beginning and end of the experiment are shown in Table I.
Statistical Analysis
Correlation among observations and plausible blocking ran-dom effect were accounted for by fitting a multilevel linearmixed model for longitudinal data, using SAS v. 8·01 PROCMIXED software (SAS Institute Inc, 1999). Species and soilmanagement options were considered as fixed effects, blockand tree were considered as random effects, and age at timeof measurement was considered a covariate. Fixed interactionbetween treatment and species, and random interactions wereconsidered because visual inspection of the interaction plotsshowed clear patterns. All interactions were considered toaffect the slope of the relationship between response and pre-dictors. Interaction plots were performed with R statisticalsoftware, version 2·15·0 (R Development Core Team, 2012).The linear mixed model requires a linear relationship
between response and predictors, as well as normality in re-siduals. Because survival data is a proportion, normality andhomogenous variance were not expected. Consequently, weapplied a squared arcsine transformation to the response var-iable (Sabin & Stafford, 1990), that is, z= arcsin(sqr(p)),where: z is the squared arcsine transformed response variablefor survival data and p is the proportion of individuals.Height and root collar diameter were plotted over time to
discern both heteroscedasticity in data, indicated by greatervariability in the response variable, and curvature in thetemporal pattern (Figure S4). Heteroscedasticity was treatedby logarithmic transformation of the response variable toln(y+0·5) , where y is the height or root collar diameter.Curvature was taken into account by logarithmic conversionof time according to Verbeke & Molenberghs (2000).Plotting individual height or root collar diameter trajectoriesover time also served to reveal any random tree effect for indi-vidual trees, in both the intercept and the slope (Figure S5).We tested the following general structure to obtain a
model of survival, height and root collar diameter:
yij ¼ μþ β1i þ β2itij þ εij (1)
Where: yij is the response variable of the i-th tree at timej, and μ is the intercept or grand mean, β1i =β1ADi +β2ASi + β3CPi + β4DTi + β5EGi + β6GRi + β7HAi + b1i, β2i =β0 + β8ADi + β9ASi +,β10CPi + β11DTi + β12EGi + β13GRi +β14HAi + β15Ci + β16Mi + β17MMi + γ2i + b2i + p2i + u2i, AD:A. decurrens, AS: A. saligna, CP: C. palmensis, DT:D. torrida, EG: E. globulus, GR: G. robusta, HA:H. abyssinica, C: Control, M: Manure and MM: Manure +Mulch. The parameter β0 reflects the overall slope for thetime effect and makes it possible to test group differencesin species or treatment, β1� 17 are parameters for species
and treatment fixed effects, γ1i is any fixed interaction,b1i and b2i are random tree parameters with varianceσ2b1 and σ2
b2 , p1i is the block random effect with varianceσ2p1 , u1i is random interaction effect with variance σ2
u1i ,and εij accounts for within-tree random variation σ2
εij .Because of both the randomized experimental layout andtime transformation, the subject-specific intercepts wereconsidered to be independent of the treatment (Verbeke& Molenberghs, 2000).Biomass data were analyzed with a mixed linear model
approach in order to avoid an error term construction inthe generalized linear model (SAS Institute Inc, 1999). Themodel tested was
yskb ¼ μþ αs þ βk þ γsk þ bb þ vkb þ εskb (2)
Where: yskb is the biomass of the average tree of species sunder k treatment in the bth block, is the intercept, αs,is thespecies fixed effect (i.e. αs= α1ADi+ α2ASi+ α3CPi+α4DTi+ α5EGi + α6GRi+ α7HAi), βk is the treatment fixedeffect (i.e. βk = β1Ci + β2Mi+ β3MMi), γsk is the interactionfixed effect between species and treatment, bb is the blockrandom effect with variance σ2bb , vkb is the interactionrandom effect between treatment and block with varianceσ2νkb , and εskb accounts for error due to within-species varia-tion and variance parameter σ2εskb .A paired-wise mean comparison by species was made
using Tukey’s test to reveal the differences in the responsevariable at every measurement time.Soil data are repeated measures in both time (before and
4 years after planting) and space (soil depth). We conducteda multivariate approach in which both repetition patterns aretaken into account using SAS v. 8·01 PROC GLM software
LAND DEGRADATION & DEVELOPMENT, (2014)
FUELWOOD PRODUCTION AND LAND RECLAMATION IN CENTRAL ETHIOPIA
(SAS Institute Inc, 1999). A least squares means comparisonfor the main effect is performed to analyze differencesbetween solid depths before and after plantation. A signifi-cance level of 0·05 is assumed across the analysis.
RESULTS
Planted Tree Species Survival Rate
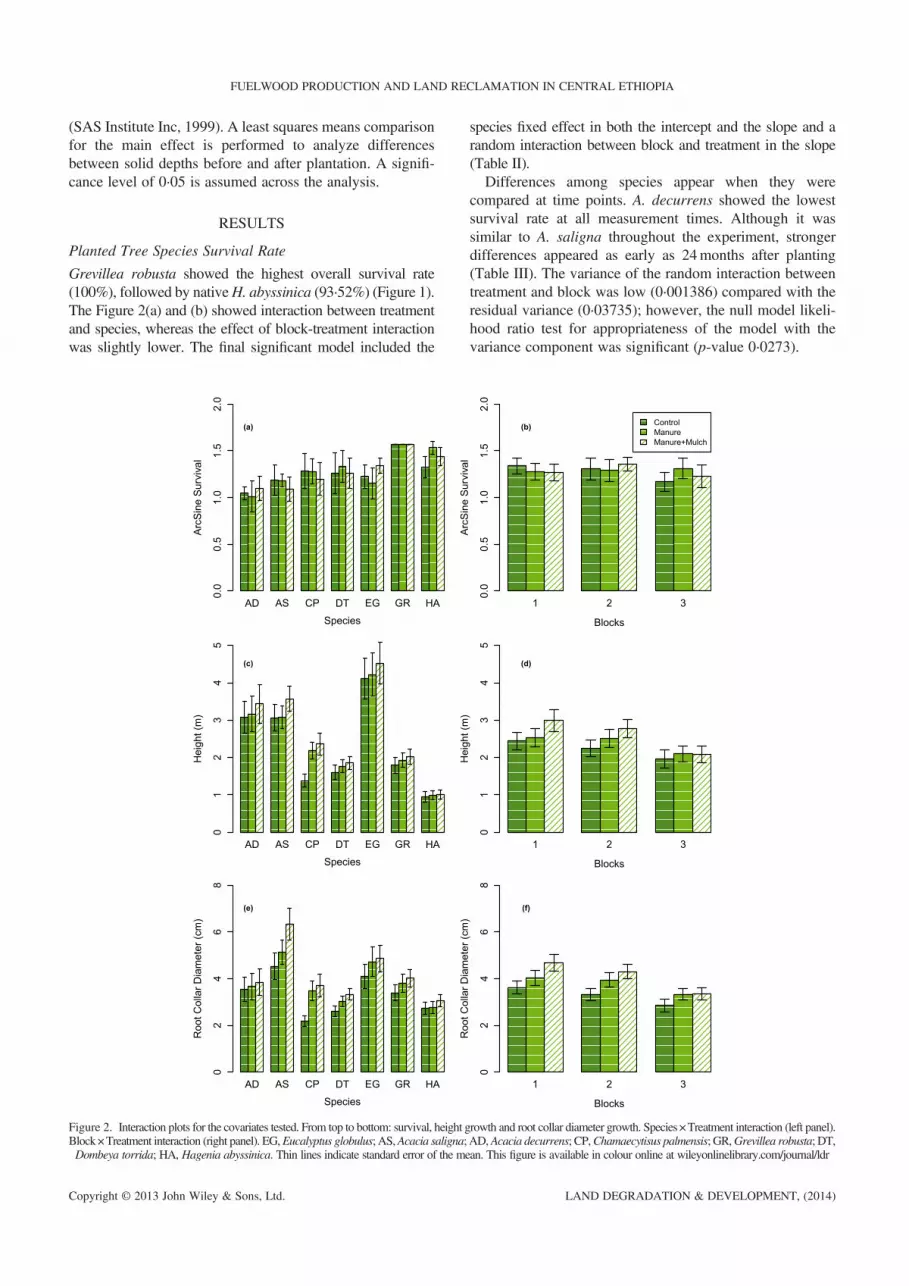
Grevillea robusta showed the highest overall survival rate(100%), followed by nativeH. abyssinica (93·52%) (Figure 1).The Figure 2(a) and (b) showed interaction between treatmentand species, whereas the effect of block-treatment interactionwas slightly lower. The final significant model included the
Figure 2. Interaction plots for the covariates tested. From top to bottom: survival, height gBlock×Treatment interaction (right panel). EG,Eucalyptus globulus; AS,Acacia saligna;Dombeya torrida; HA, Hagenia abyssinica. Thin lines indicate standard error of the me
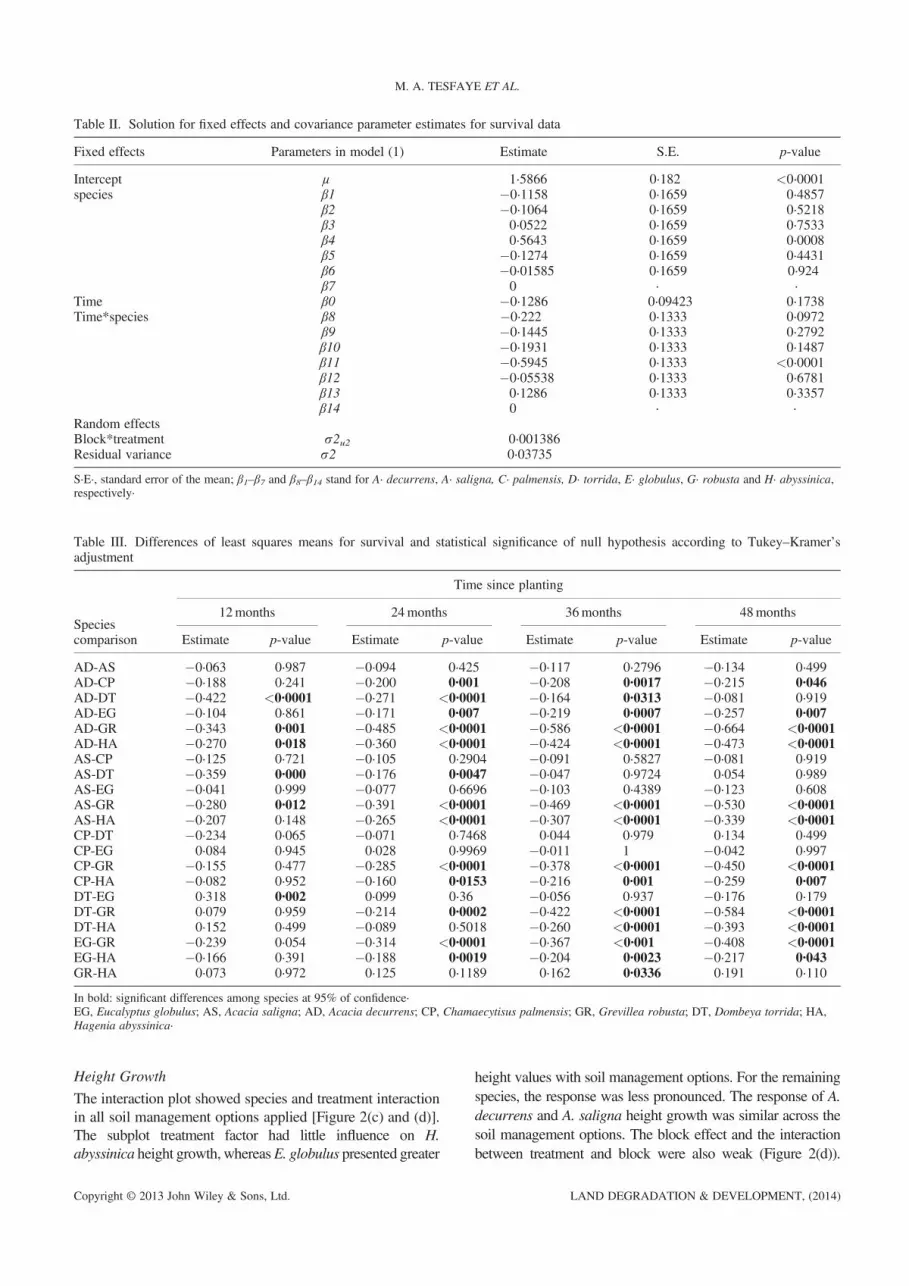
species fixed effect in both the intercept and the slope and arandom interaction between block and treatment in the slope(Table II).Differences among species appear when they were
compared at time points. A. decurrens showed the lowestsurvival rate at all measurement times. Although it wassimilar to A. saligna throughout the experiment, strongerdifferences appeared as early as 24months after planting(Table III). The variance of the random interaction betweentreatment and block was low (0·001386) compared with theresidual variance (0·03735); however, the null model likeli-hood ratio test for appropriateness of the model with thevariance component was significant (p-value 0·0273).
rowth and root collar diameter growth. Species×Treatment interaction (left panel).AD,Acacia decurrens; CP,Chamaecytisus palmensis; GR,Grevillea robusta; DT,an. This figure is available in colour online at wileyonlinelibrary.com/journal/ldr
LAND DEGRADATION & DEVELOPMENT, (2014)
Table II. Solution for fixed effects and covariance parameter estimates for survival data
Fixed effects Parameters in model (1) Estimate S.E. p-value
Random effectsBlock*treatment σ2u2 0·001386Residual variance σ2 0·03735
S·E·, standard error of the mean; β1–β7 and β8–β14 stand for A· decurrens, A· saligna, C· palmensis, D· torrida, E· globulus, G· robusta and H· abyssinica,respectively·
Table III. Differences of least squares means for survival and statistical significance of null hypothesis according to Tukey–Kramer’sadjustment
In bold: significant differences among species at 95% of confidence·EG, Eucalyptus globulus; AS, Acacia saligna; AD, Acacia decurrens; CP, Chamaecytisus palmensis; GR, Grevillea robusta; DT, Dombeya torrida; HA,Hagenia abyssinica·
M. A. TESFAYE ET AL.
Height Growth
The interaction plot showed species and treatment interactionin all soil management options applied [Figure 2(c) and (d)].The subplot treatment factor had little influence on H.abyssinica height growth, whereasE. globulus presented greater
height values with soil management options. For the remainingspecies, the response was less pronounced. The response of A.decurrens and A. saligna height growth was similar across thesoil management options. The block effect and the interactionbetween treatment and block were also weak (Figure 2(d)).
LAND DEGRADATION & DEVELOPMENT, (2014)
FUELWOOD PRODUCTION AND LAND RECLAMATION IN CENTRAL ETHIOPIA
Time since planting (age) was also an important variablewith considerable variation across species. For example, A.saligna height growth was faster up to 24months after plantingand then decreased’ whereas E. globulus experienced fastheight growth throughout the experiment (Figure S4).Species and treatment effects were significantly differ-
ent, though the difference between soil managementoptions was not significantly different. The random effectfor the intercept and the slope revealed the covariancesfor both effects (0·0393 and 0·0984, respectively) to behigher than the residual variance (0·0195), indicating thestrong random effect associated with individuals(Table IV). On average, the fixed effects revealed that G.robusta and H. abyssinica showed the same height growthpattern, and the application of either soil managementoption resulted in similar height growth, which was higherthan that of the control treatment.Height growth differences were noticeable 12months
after planting. H. abyssinica and E. globulus showed thelowest and highest mean difference, respectively (Table V).
Root Collar Diameter Growth Performance
Visual inspection of the interaction plot showed that theinteraction between species and treatment was morepronounced than in height growth [Figure 2(e)], A. salignashowed a stronger response to manure +mulch treatmentthan other species, whereas C. palmensis exhibited increasedroot collar diameter when either soil management optionswere applied.
Table IV. Solution for fixed effects and covariance parameters estimate
Fixed effects parameters in model (1)HeightEstimate S.E
β1–β7 and β8–β14 stand for A· decurrens, A· saligna, C· palmensis, D· torrida, E·control, manure and manure +mulch interaction with time, respectively·
Time since planting was also an important variable andnotably different: the root collar diameter of A. salignaincreased for 36months after planting. At 48months, E.globulus showed higher average root collar diameter(RCD) values. The other species showed similar valuesat 12 and 24months after planting; from that point on,root collar diameter differences became more pro-nounced. C. palmensis, D. torrida and H. abyssinicahad the lowest RCD values at the end of the experiment(Figure S4).The final model for root collar diameter included
random individual effect on the intercept and the slope.Neither the fixed effects for species and treatment in theslope nor the interaction between species and treatmentwere significant. The solution for fixed effects gave resultssimilar to those of the height model (Table IV), althoughnone of the species had RCD values similar to those ofH. abyssinica. Comparison of the species at each timepoint showed fewer RCD differences between species thanin the height growth comparison (Tables V and VI): E.globulus outperformed all species in height growth buthad almost the same root collar diameter as A. saligna atthe end of the experiment.
Biomass Production
Tree biomass production was similar in all soil managementapplications (TableVII), except forE. globulus (11·71 kg tree�1),A. saligna (8·76kg tree�1) and A. decurrens (6·41kg tree�1).Mulching induced overlaid results between the control and
In bold: significant differences between species at 95% of confidence·EG, Eucalyptus globulus; AS, Acacia saligna; AD, Acacia decurrens; CP, Chamaecytisus palmensis; GR, Grevillea robusta; DT, Dombeya torrida; HA,Hagenia abyssinica·
Table VI. Differences of least squares means for root collar diameter growth and statistical significance of null hypothesis according toTukey–Kramer’s adjustment
Random effectsBlock σ2bb 0·5331Species*block σ2vkb 3·69Residual variance σ2ε 5·2966
α1–α7 stand for A· decurrens, A· saligna, C· palmensis, D· torrida, E· globulus, G· robusta and H· abyssinica, respectively· β1–β3 stands for Control, Manureand Manure +Mulch treatment, respectively·
Table VIII. Repeated multivariate analysis of variance for soil parameters
Soil parameter
Between effects Within effects
Effect F p-value Effect F p-value
pH Species 0·31 0·9193 Time 43·87 0·0001Time × species 0·74 0·6264Depth 5·05 0·0134Depth × species 1·08 0·4139Time × depth 2·62 0·0904Time × depth × species 0·49 0·905
Carbon (%) Species 2·08 0·1217 Time 6·59 0·0224Time × species 1·76 0·1799Depth 59·25 0·0001Depth × species 1·41 0·221Time × depth 5·9 0·0073Time × depth × species 2·93 0·0093
Nitrogen (%) Species 3·87 0·0174 Time 8·81 0·0102Time × species 3·13 0·0368Depth 21·66 0·0001Depth × species 0·68 0·76Time × depth 1·68 0·2042Time × depth × species 0·91 0·5497
P (ppm) Species 0·56 0·7557 Time 21·8 0·0004Time × species 0·54 0·7729Depth 4·18 0·0258Depth × species 0·41 0·9451Time × depth 1·19 0·3192Time × depth × species 0·33 0·9773
K (meq/100 gr) Species 0·93 0·5038 Time 0·04 0·8379Time × species 1·48 0·2538Depth 5·22 0·0118Depth × species 1·38 0·2312Time × depth 1·59 0·2216Time × depth × species 1·18 0·3429
CEC (meq/100 gr) Species 0·47 0·8179 Time 2·43 0·1413Time × species 0·24 0·9577Depth 5·78 0·0079Depth × species 0·86 0·5955Time × depth 0·04 0·9641Time × depth × species 2·39 0·0282
Bold values indicate significance at 0·05 level·
FUELWOOD PRODUCTION AND LAND RECLAMATION IN CENTRAL ETHIOPIA
mulching +manure treatment. Comparison of control withmulching +manure treatments revealed the treatment fixedeffect to be highly significant (p< 0·0001), with a biomassproduction gradient from 3·79 kg tree�1 for the control to4·88 kg tree�1 with manure to 5·84 kg tree�1 with mulching +manure treatment. The interaction between species andtreatment was highly insignificant in all cases.Differences of least squares means showed that E.
globulus produced more biomass than other species,followed closely by A. saligna. These were significantlygreater than D. torrida and H. abyssinica, which presentedthe lowest biomass production (Table S1).
Soil Condition
The significance of treatment effects on growth and biomassproduction was not very high, indicating that tree species isthe main factor controlling the performance of indicator var-iables (i.e. growth, survival and biomass). For this reason,we tested species effect on soil properties. In so doing, wealso avoid expensive analysis of soil depths across treatments.Statistical analysis of between and within effects in the multi-variate repeated analysis are shown in Table VIII.Nitrogen concentration was affected by species, time,
depth and the interaction of time and species, indicating a
0−10 10_30 30−50
pH
1012
(a)
0−10 10_30 30−50
Nitr
ogen
(%
)
0.00
0.10
0.20
(c)
0−10 10_30 30−50
Depth (cm)
Org
anic
Car
bon
(%)
0.0
1.0
2.0
3.0
(e)
02
46
8
Figure 3. Mean value and standard error bars for soil properties at the beginning andmean value before planting. Light bars are mean value after 48months. This
strong species control on this soil parameter. Time wassignificant for all soil properties except for K and CEC,whereas depth within effect was significant for all soil prop-erties. The significant interaction effect of species, time anddepth for organic carbon and cationic exchange capacity wasmainly controlled by depth.Differences in some soil parameters within species
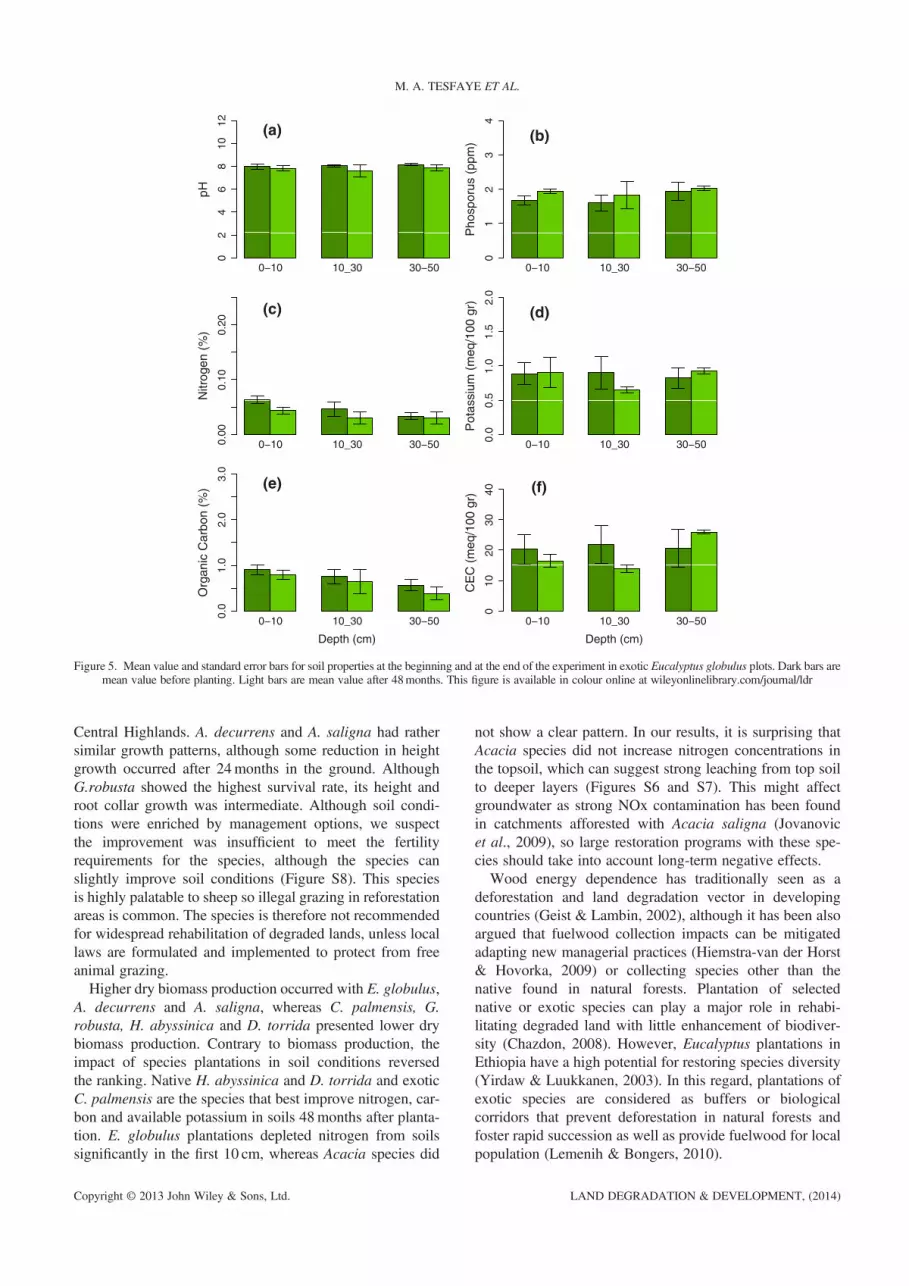
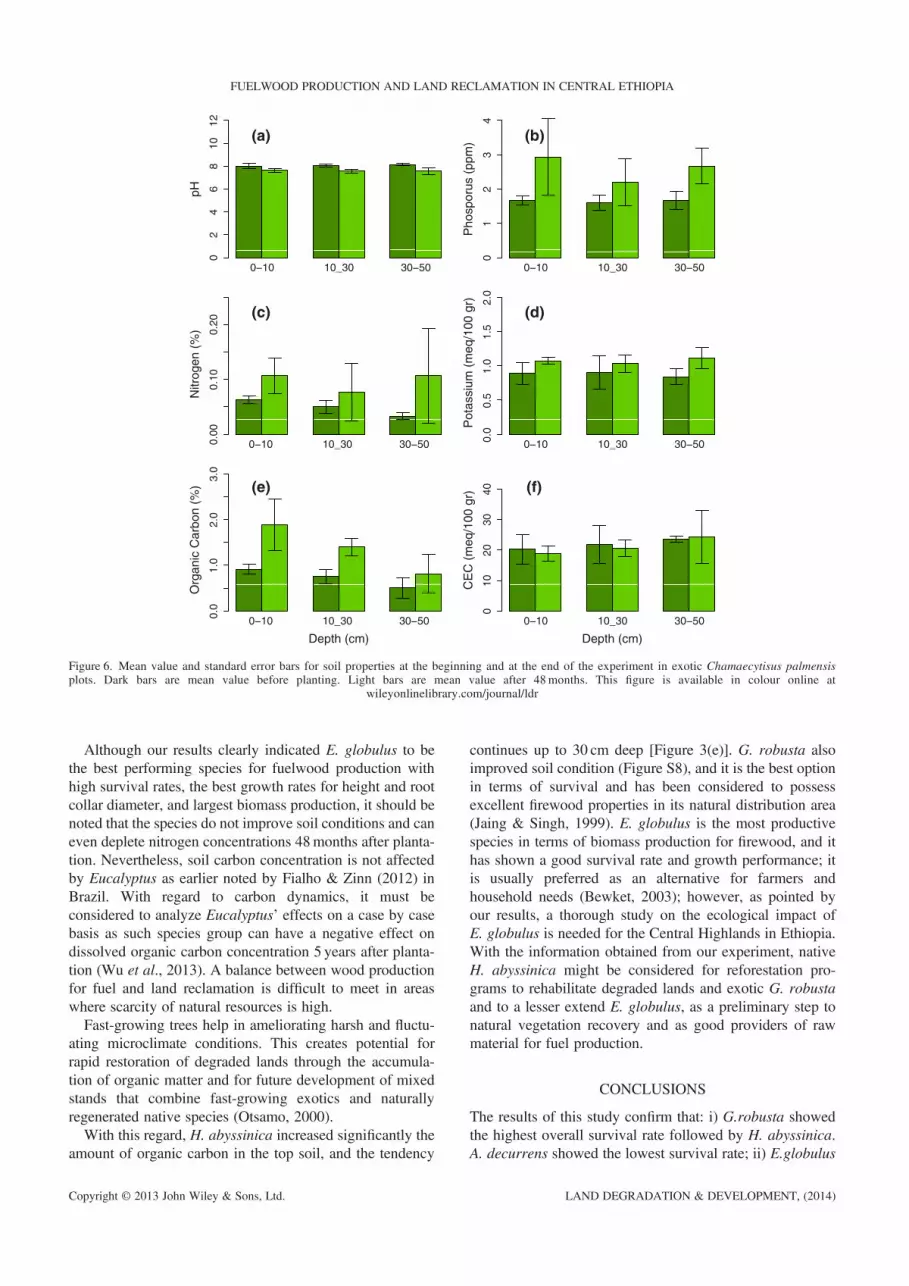
between initial conditions and 4 years after planting weredetected. After 4 years since planting, pH did not change.Soil parameter values increased in native H. abyssinicaand D. torrida (Figures 3 and 4), whereas nitrogen andcarbon concentration decreased in E. globulus plantationalong the whole profile [Figure 5(c) and (e)]. Chamaecytisuspalmensis showed the highest N and carbon increase 4 yearsafter plantation [Figure 6(c)]. Acacia spp showed a decreas-ing pattern in nitrogen and carbon concentrations and avail-able potassium in top soil [Figures S6 and S7 (c), (d) and(e)], whereas G. robusta showed increased nitrogen and car-bon contents [Figure S8(c) and (e)]. All species increasedavailable P in soils.The higher differences between species are in the top
mineral soil and later up to 30 cm, and they are mainly dueto changes in carbon, nitrogen from 0 to 10 cm, K concentra-tions from 10 to 30 cm and CEC (Table SII). pH and P
0−10 10_30 30−50
Pho
spor
us (
ppm
)
4
(b)
0−10 10_30 30−50
Pot
assi
um (
meq
/100
gr)
0.0
0.5
1.0
1.5
2.0
(d)
0−10 10_30 30−50
Depth (cm)
CE
C (
meq
/100
gr)
020
12
30
10
3040 (f)
at the end of the experiment in nativeHagenia abyssinica plots. Dark bars arefigure is available in colour online at wileyonlinelibrary.com/journal/ldr
LAND DEGRADATION & DEVELOPMENT, (2014)
0−10 10_30 30−50
pH
1012
(a)
0−10 10_30 30−50
Nitr
ogen
(%
)
0.00
0.10
0.20
(c)
0−10 10_30 30−50
Depth (cm)
Org
anic
Car
bon
(%)
0.0
1.0
2.0
3.0
(e)
0−10 10_30 30−50
Pho
spor
us (
ppm
)
4
(b)
0−10 10_30 30−50
Pot
assi
um (
meq
/100
gr)
0.0
0.5
1.0
1.5
2.0
(d)
0−10 10_30 30−50
Depth (cm)
CE
C (
meq
/100
gr)
02
46
8
01
23
010
2030
40 (f)
Figure 4. Mean value and standard error bars for soil properties at the beginning and at the end of the experiment in native Dombeya torrida plots. Dark bars aremean value before planting. Light bars are mean value after 48months. This figure is available in colour online at wileyonlinelibrary.com/journal/ldr
FUELWOOD PRODUCTION AND LAND RECLAMATION IN CENTRAL ETHIOPIA
concentration did not show differences across species. Acaciaspp. and Ecualyptus globulus had significantly less organiccarbon in the top mineral soil (0–10 cm) than H. abyssinica,G. robusta and C. palmensis. The concentration of nitrogenis significantly low in Acacia spp. and E. globulus as com-pared withC. palmensis that showed the highest amount of ni-trogen (0·11%) in the topsoil (0–10 cm) 4 years afterplantation followed by H. abyssinica (0·09%) and D. torrida(0·08%). Differences in K concentration are found in10–30 cm. Acacia spp and E. globulus showed the minimumK values, which were significantly different from the rest ofspecies. CEC in E. globulus and A. decurrens (16·4 and16·5meq/100g soil) plots is significantly lower than thatfound in D. torrida and G. robusta plots (20·7 and20·5meq/100 g soil). The same pattern occurs from 10 to30 cm deep.
DISCUSSION
This study presents a screening of six tree species and oneshrub species for use in the restoration of degraded land andfuelwood production in the Central Highlands of Ethiopia.The combination of survival, height, root collar diameter
growth, total biomass production and soil condition changeafter 48months provides a five-dimensional indicator ofspecies suitability for both objectives. The best optionwould always be that with the highest values in all fiveindicators; however, none of the species studied perfectlyfulfilled these requirements. In fact, contradictory resultsfor restoration and fuelwood production were found.Native H. abyssinica and exotic G. robusta and E.
globulus had the highest survival rates; the lowest survivalrates were recorded for native D. torrida and exotic A.decurrens. An intermediate group was formed by C.palmensis and A. saligna. Peter et al. (2005) reported asurvival rate of 100% for G. robusta on a mixed rainforesttree plantation in Australia after 6 years. In Chile, a screen-ing trial for degraded highlands reported a survival rate ofless than 25% for A. saligna and less than 60% for C.palmensis (Arredondo et al., 1998).Exotic E. globulus, A. saligna and A. decurrens had faster
root collar diameter and height growth than other species,and the soil management significantly impacted theirgrowth. Mekonnen et al. (2006) also found that E. globulushad greater height and root collar diameter growth comparedwith other species growing on nitisols of the Ethiopian
LAND DEGRADATION & DEVELOPMENT, (2014)
0−10 10_30 30−50
pH
1012 (a)
0−10 10_30 30−50
Nitr
ogen
(%
)
0.00
0.10
0.20
(c)
0−10 10_30 30−50
Depth (cm)
Org
anic
Car
bon
(%)
0.0
1.0
2.0
3.0
(e)
0−10 10_30 30−50
Pho
spor
us (
ppm
)
4
(b)
0−10 10_30 30−50
Pot
assi
um (
meq
/100
gr)
0.0
0.5
1.0
1.5
2.0
(d)
0−10 10_30 30−50
Depth (cm)
CE
C (
meq
/100
gr)
02
46
8
01
23
010
2030
40 (f)
Figure 5. Mean value and standard error bars for soil properties at the beginning and at the end of the experiment in exotic Eucalyptus globulus plots. Dark bars aremean value before planting. Light bars are mean value after 48months. This figure is available in colour online at wileyonlinelibrary.com/journal/ldr
M. A. TESFAYE ET AL.
Central Highlands. A. decurrens and A. saligna had rathersimilar growth patterns, although some reduction in heightgrowth occurred after 24months in the ground. AlthoughG.robusta showed the highest survival rate, its height androot collar growth was intermediate. Although soil condi-tions were enriched by management options, we suspectthe improvement was insufficient to meet the fertilityrequirements for the species, although the species canslightly improve soil conditions (Figure S8). This speciesis highly palatable to sheep so illegal grazing in reforestationareas is common. The species is therefore not recommendedfor widespread rehabilitation of degraded lands, unless locallaws are formulated and implemented to protect from freeanimal grazing.Higher dry biomass production occurred with E. globulus,
A. decurrens and A. saligna, whereas C. palmensis, G.robusta, H. abyssinica and D. torrida presented lower drybiomass production. Contrary to biomass production, theimpact of species plantations in soil conditions reversedthe ranking. Native H. abyssinica and D. torrida and exoticC. palmensis are the species that best improve nitrogen, car-bon and available potassium in soils 48months after planta-tion. E. globulus plantations depleted nitrogen from soilssignificantly in the first 10 cm, whereas Acacia species did
not show a clear pattern. In our results, it is surprising thatAcacia species did not increase nitrogen concentrations inthe topsoil, which can suggest strong leaching from top soilto deeper layers (Figures S6 and S7). This might affectgroundwater as strong NOx contamination has been foundin catchments afforested with Acacia saligna (Jovanovicet al., 2009), so large restoration programs with these spe-cies should take into account long-term negative effects.Wood energy dependence has traditionally seen as a
deforestation and land degradation vector in developingcountries (Geist & Lambin, 2002), although it has been alsoargued that fuelwood collection impacts can be mitigatedadapting new managerial practices (Hiemstra-van der Horst& Hovorka, 2009) or collecting species other than thenative found in natural forests. Plantation of selectednative or exotic species can play a major role in rehabi-litating degraded land with little enhancement of biodiver-sity (Chazdon, 2008). However, Eucalyptus plantations inEthiopia have a high potential for restoring species diversity(Yirdaw & Luukkanen, 2003). In this regard, plantations ofexotic species are considered as buffers or biologicalcorridors that prevent deforestation in natural forests andfoster rapid succession as well as provide fuelwood for localpopulation (Lemenih & Bongers, 2010).
LAND DEGRADATION & DEVELOPMENT, (2014)
0−10 10_30 30−50
pH
1012
(a)
0−10 10_30 30−50
Nitr
ogen
(%
)
0.00
0.10
0.20
(c)
0−10 10_30 30−50
Depth (cm)
Org
anic
Car
bon
(%)
0.0
1.0
2.0
3.0
(e)
0−10 10_30 30−50
Pho
spor
us (
ppm
)
4
(b)
0−10 10_30 30−50
Pot
assi
um (
meq
/100
gr)
0.0
0.5
1.0
1.5
2.0
(d)
0−10 10_30 30−50
Depth (cm)
CE
C (
meq
/100
gr)
20
02
46
8
01
23
010
3040 (f)
Figure 6. Mean value and standard error bars for soil properties at the beginning and at the end of the experiment in exotic Chamaecytisus palmensisplots. Dark bars are mean value before planting. Light bars are mean value after 48months. This figure is available in colour online at
wileyonlinelibrary.com/journal/ldr
FUELWOOD PRODUCTION AND LAND RECLAMATION IN CENTRAL ETHIOPIA
Although our results clearly indicated E. globulus to bethe best performing species for fuelwood production withhigh survival rates, the best growth rates for height and rootcollar diameter, and largest biomass production, it should benoted that the species do not improve soil conditions and caneven deplete nitrogen concentrations 48months after planta-tion. Nevertheless, soil carbon concentration is not affectedby Eucalyptus as earlier noted by Fialho & Zinn (2012) inBrazil. With regard to carbon dynamics, it must beconsidered to analyze Eucalyptus’ effects on a case by casebasis as such species group can have a negative effect ondissolved organic carbon concentration 5 years after planta-tion (Wu et al., 2013). A balance between wood productionfor fuel and land reclamation is difficult to meet in areaswhere scarcity of natural resources is high.Fast-growing trees help in ameliorating harsh and fluctu-
ating microclimate conditions. This creates potential forrapid restoration of degraded lands through the accumula-tion of organic matter and for future development of mixedstands that combine fast-growing exotics and naturallyregenerated native species (Otsamo, 2000).With this regard, H. abyssinica increased significantly the
amount of organic carbon in the top soil, and the tendency
continues up to 30 cm deep [Figure 3(e)]. G. robusta alsoimproved soil condition (Figure S8), and it is the best optionin terms of survival and has been considered to possessexcellent firewood properties in its natural distribution area(Jaing & Singh, 1999). E. globulus is the most productivespecies in terms of biomass production for firewood, and ithas shown a good survival rate and growth performance; itis usually preferred as an alternative for farmers andhousehold needs (Bewket, 2003); however, as pointed byour results, a thorough study on the ecological impact ofE. globulus is needed for the Central Highlands in Ethiopia.With the information obtained from our experiment, nativeH. abyssinica might be considered for reforestation pro-grams to rehabilitate degraded lands and exotic G. robustaand to a lesser extend E. globulus, as a preliminary step tonatural vegetation recovery and as good providers of rawmaterial for fuel production.
CONCLUSIONS
The results of this study confirm that: i) G.robusta showedthe highest overall survival rate followed by H. abyssinica.A. decurrens showed the lowest survival rate; ii) E.globulus
LAND DEGRADATION & DEVELOPMENT, (2014)
M. A. TESFAYE ET AL.
outperformed all species in height growth and biomassproduction and had a similar root collar diameter growthas A. saligna; however, it depleted nitrogen in the top soil;iii) H. abyssinica, C. palmensis and D. torrida showed thelowest growth and biomass production, but all of themimproved soil conditions 48months after plantation; iv)G. robusta and H. abyssinica resulted in similar heightgrowth pattern over application of soil management options.A. saligna showed a stronger response to manure +mulchthan other species; v) dry biomass production was highlysignificant for E. globulus, although it was non-significantacross soil management options; and vi) there is not a cleareffect of any of the soil management options in growth.Finally, we have to modulate our working hypothesis thatnative tree species might not show better growth perfor-mance in harsh environment because native speciesimproved soil conditions. We recommend the use of nativeH. abyssinica for improving soil conditions of degradedland and exotic G. robusta for both soil rehabilitation andfirewood production, whereas E. globulus plantationsshould be considered a good alternative for firewoodproduction after a complete study upon the ecologicalimpact of the species has been performed. More researchis needed to confirm if planting native H. abyssinica inthe understory of those species is appropriate to reclaimnatural vegetation cover.
ACKNOWLEDGEMENTS
The authors thank the staff of the Forestry ResearchDirectorate of the Holetta Agricultural Research Centrefor their support, the Spanish Agency for InternationalCooperation and Development (AECID) for fundingTesfaye’s fellowship and Agroforestry Case Team(4-19-1) of the Forestry Research Directorate for fundingthe research work. Many thanks to Dr. R. Calama fromINIA for his assistance in the mixed model analysis.Comments from two anonymous referees improved theoriginal manuscript.
REFERENCES
Arredondo S, Aronson J, Ovalle C, Pozo AD, Avendano J. 1998. Screeningmultipurpose legume trees in central Chile. Forest Ecology and Manage-ment 109: 221–229.
Barrowclough SL, Ghimire KB. 1996. Deforestation in Tanzania; beyondsimplistic generalizations. Ecologist 26: 104–109.
Bensel T. 2008. Fuelwood, deforestation and land degradation: 10 years ofevidence from Cebu province, the Philippines. Land Degradation &Development 19: 587–605. DOI: 10.1002/ldr.862
Bewket W. 2003. Land cover dynamics since the 1950s in Chemoga water-shed, Blue Nile Basin, Ethiopia. Mountain Research and Development22: 263–269.
Blanco-García A, Lindig-Cisneros R. 2005. Incorporating restoration insustainable forestry magement using Pine-bark mulch to improve nativespecies establishment on tephra deposits. Restoration Ecology 13:703–709.
Chazdon RL. 2008. Beyond deforestation: restoring forests and ecosystemservices on degraded lands. Science 320: 1458–60.
De la Paix MJ, Lanhai L, Xi C, Ahmed S, Varenyam A. 2013. Soildegradation and altered flood risk as a consequence of deforestation.Land Degradation & Development 24: 478–485. DOI: 10.1002/ldr.1147
FAO. 2011. State of World’s forests 2011. Rome, Italy.Fialho RC, Zinn YL. 2012. Changes in soil organic carbon under eucalyptusplantations in Brazil: a comparative analysis. Land Degradation &Development DOI: 10.1002/ldr.2158.
Gebreegziabher Z, van Kooten GC. 2013. Does community and householdtree planting imply increased use of wood for fuel? Evidence fromEthiopia. Forest Policy and Economics 34: 30–40.
Geist HJ, Lambin EF. 2002. Proximate causes and underlying drivingforces of tropical deforestation. BioScience 52 (2): 143–150.
Hiemstra-van der Horst G, Hovorka AJ. 2009. Fuelwood: The “other”renewable energy source for Africa? Biomass and Bioenergy 33 (11):1605–1616.
Jaing RK, Singh B. 1999. Fuelwood characteristics of selected indige-nous tree species from central India. Bioresource Technology 68:305–308.
John A, John W, Norman J. 1997. Catalyzing native forest regenera-tion on degraded tropical lands. Forest Ecology and Management99: 1–7.
Jovanovic NZ, Israel S, Tredoux G, Soltau L, Le Maitre D, Rusinga F,Rozanov A, van der Merwe N. 2009. Nitrogen dynamics in land clearedof alien vegetation (Acacia saligna) and impacts on groundwater atRiverlands Nature Reserve (Western Cape, South Africa) Water SA(Pretoria). 35(1). JAN 2009. 37–44.
Kiome RM, Stocking M. 1995. Rationality of farmers’ perception of soilerosion. The effectiveness of soil conservation in semi arid Kenya.Global Environment Change 5: 281–295.
Lemenih M, Bongers F. 2010. The role of plantation forests in fosteringecological restoration: experience form East Africa. In Degraded forestsin eastern Africa. Management and restoration, Bongers F, Tennigkeit T(eds). Earthscan Ltd.: London; 370.
Li D, Niu S, Luo Y. 2012. Global patterns of the dynamics of soil carbonand nitrogen stocks following afforestation: a meta-analysis. The Newphytologist 195(1): 172–81.
López-García J, Ayala-Alcántara I. 2012. Land-use change and hillslopeinstability in the monarch butterfly biosphere reserve, Central Mexico.Land Degradation & Development 23: 384–397. DOI: 10.1002/ldr.2159.
Mahiri I, Howorth C. 2001. Twenty years of resolving the irresolvable:approaches to the fuelwood problem in Kenya. Land Degradation &Development 12(3): 205–215. DOI: 10.1002/ldr.433.
Mekonnen K, Tadesse Y, Gerhard G, Yossef A. 2006. Performance of eighttree species in the highland Vertisols Of Central Ethiopia: growth, foliagenutrient concentration and effect on soil chemical properties. NewForests 32(3): 285–98.
Mekuria W, Ayenekulu E. 2011. Exclosures land management forrestoration of the soils in degraded communal grazing lands inNorthern Ethiopia. Land Degradration & Development. D.O.I.10.1002/ldr.1146
Otsamo R. 2000. Secondary forest regeneration under fast-growing forestplantations on degraded Imperata cylindrical Grasslands. New Forest19: 69–93.
Özcan M, Gökbulak F, Hizal A. 2013. Exclosure effects on recovery ofselected soil properties in a mixed broadleaf forest recreation site. LandDegradation & Development 24(3): 266–276.
Peter D, Erskine D, Geoff B. 2005. Growth performance and man-agement of a mixed rainforest tree plantation. New Forests 29:117–134.
Phalan B, Bertzky N, Butchart SHM, Donald PF, Scharlemann JPW,Stattersfield AJ, Balmford A. 2013. Crop expansion and conservationpriorities in tropical countries. PloS one 8(1): 1–13.
R Development Core Team. 2012. R: a language and environment forstatistical computing. R Foundation for Statistical Computing, Vienna,Austria. ISBN 3-900051-07-0, URL http://www.R-project.org/.
Roose E, Barethès B. 2001. Organic matter management for soilconservation and productivity restoration in Africa: a contributionfrom Francophone research. J. Nutrient cycling in Agro ecosystems61: 159–170.
Sabin TE, Stafford SG. 1990. Assessing the need for transformation ofresponse variables. Forest Research Lab Special Publication, College ofForestry. Oregon State University, pp.31
SAS Institute Inc. 1999. The SAS System for Windows, v. 8.01. Cary, NC.USA.
FUELWOOD PRODUCTION AND LAND RECLAMATION IN CENTRAL ETHIOPIA
Tadesse G. 2001. Land degradation: “a challenge to Ethiopia”. EnvironmentalManagement 27: 815–824.
Tadesse G, Peden D, Abiye A, Wagnew A. 2003. Effect of manure ongrazing lands in Ethiopia, east African highlands. Mountain Researchand Development 23 (2): 156–160.
Verbeke G, Molenberghs G. 2000. Linear mixed models for longitudinaldata. Springer Verlag: New York.
Wu JP, Liu ZF, Sun YX, Zhou LX, Lin LB, Fu SL. 2013. IntroducedEucalyptus urophylla plantations change the composition of the soilmicrobial community in subtropical China. Land Degradation &Development 406: 400–406. DOI: 10.1002/ldr.2161.
Yirdaw E, Luukkanen O. 2003. Indigenous woody species diver-sity in Eucalyptus globulus Labill. ssp. globulus plantations in
the Ethiopian Highlands. Biodiversity and Conservation 12:567–582.
Yitbarek TW, Bellietahtahan S, Stringer GC. 2012. The onsite cost of gullyerosion and cost-benefit rehabilitation: a case study in Ethiopia. LandDegradation & Development 23: 157–166. DOI: 10.1002/ldr.1065.
SUPPORTING INFORMATION
Additional supporting information may be found in theonline version of this article at the publisher's web-site.