Journal of Food Engineering 64 (2004) 277–283
www.elsevier.com/locate/jfoodeng
Bioreactor design via spreadsheet––a study on themonosodium glutamate (MSG) process
Jolius Gimbun, A.B. Dayang Radiah, T.G. Chuah *
Department of Chemical and Environmental Engineering, Faculty of Engineering, Universiti Putra Malaysia, Serdang 43400, Selangor, Malaysia
Received 25 June 2003; received in revised form 6 October 2003; accepted 20 October 2003
Abstract
Preliminary design calculation of a unit operation is always necessary to determine an order of magnitude of the proposed
chemical plant. This paper describes an application of a spreadsheet in preliminary design of a bioreactor. There are a few steps in
bioreactor design which are mass/mole balances and energy balances calculations before carrying out the bioreactor sizing. A
spreadsheet was used as a tool to make a quick and accurate calculation. Glutamic acid fermentation is used to describe the overall
method in this bioreactor design via spreadsheet. The method presented here is easy to learn and easy for the designer to scale up
and to simulate different operating conditions to meet an optimum design from time to time by changing only a few variable such as
flow rate and substrate concentration of the feed in the previously constructed spreadsheet.
� 2003 Elsevier Ltd. All rights reserved.
Keywords: Bioreactor; Spreadsheet; Glutamic acid; Fermentation; Monosodium glutamate
1. Introduction
It is often necessary to develop data for a range of
operating conditions, so that the optimum configuration
of a bioreactor can be found. There are two conven-
tional methods to perform such a task, either by handcalculation (which is somewhat inaccurate and time
consuming) or by any of a number of commercial simu-
lations that are faster but costly to licence. A third
alternative is presented here: Insert all the manual cal-
culation equations into any spreadsheet program such
as Microsoft Excel. This will eliminate the need for
employing expensive simulation software and labouring
over hand calculations. Further, the time involved fromthe programmer’s point of view is no more (or conside-
rably less) than that required to learn how to use a
commercial simulation package.
Microsoft Excel is a commercial spreadsheet software
developed by Microsoft� Corporation, which is widely
used today. Microsoft Excel is part of the package
Microsoft Office and it is fully developed with statistics,
mathematical and engineering applications (Bloch,
*Corresponding author. Tel.: +60-3-894-662-88; fax: +60-3-865-
670-99.
E-mail address: [email protected] (T.G. Chuah).
0260-8774/$ - see front matter � 2003 Elsevier Ltd. All rights reserved.
doi:10.1016/j.jfoodeng.2003.10.009
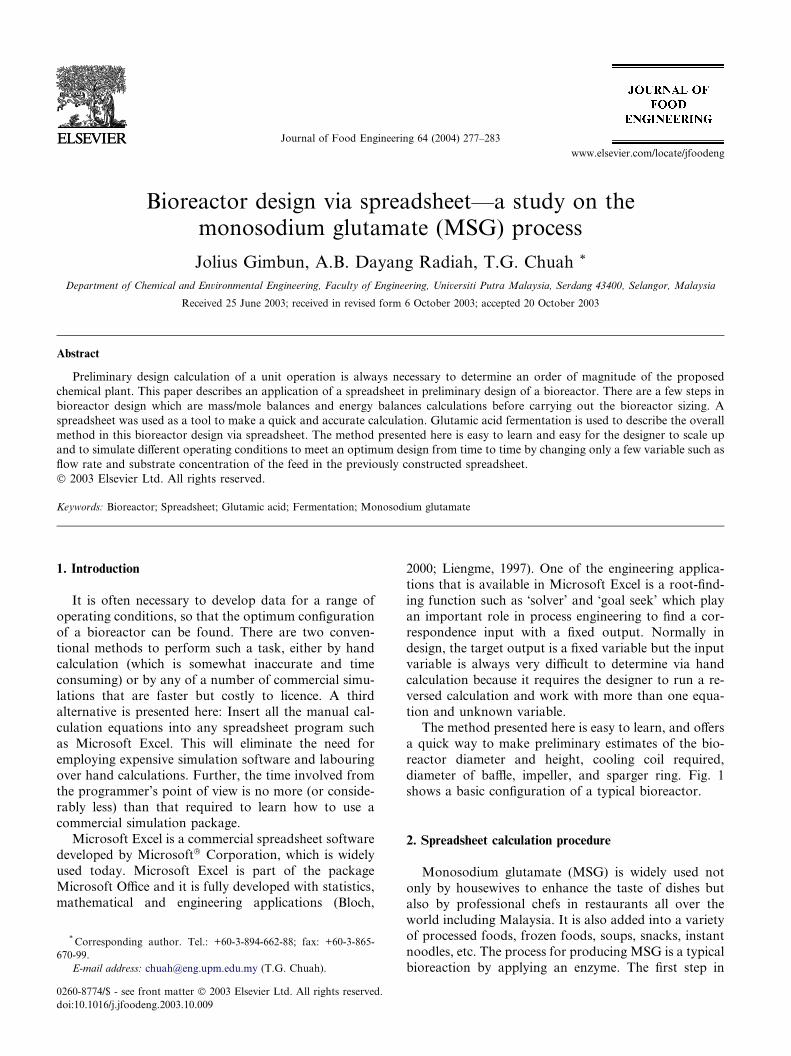
2000; Liengme, 1997). One of the engineering applica-
tions that is available in Microsoft Excel is a root-find-
ing function such as �solver’ and �goal seek’ which playan important role in process engineering to find a cor-
respondence input with a fixed output. Normally in
design, the target output is a fixed variable but the inputvariable is always very difficult to determine via hand
calculation because it requires the designer to run a re-
versed calculation and work with more than one equa-
tion and unknown variable.
The method presented here is easy to learn, and offers
a quick way to make preliminary estimates of the bio-
reactor diameter and height, cooling coil required,
diameter of baffle, impeller, and sparger ring. Fig. 1shows a basic configuration of a typical bioreactor.
2. Spreadsheet calculation procedure
Monosodium glutamate (MSG) is widely used not
only by housewives to enhance the taste of dishes but
also by professional chefs in restaurants all over the
world including Malaysia. It is also added into a varietyof processed foods, frozen foods, soups, snacks, instant
noodles, etc. The process for producing MSG is a typical
bioreaction by applying an enzyme. The first step in
Nomenclature
CP heat capacity, kJ/kg �CE energy_m mass flow rate, kg/s
Pb bioreactor bottom pressure, atm
Patm atmospheric pressure, atmPair power absorbed by air flow, W
PAmmonia power absorbed by ammonia, WPF net power generated in fermentation, W
Pe energy produced within the system
QGen total power generated in fermentation, W
QA power result by agitation heat, W
QF power resultant by micro-organism activity,
W
QB power absorbed by broth, W
Qq heat flow into system
Qw work done by system
R gas constant m3 Pa/moleK
T temperature, �CT1 inlet cooling water temperature, �CT2 outlet cooling water temperature, �CTp Broth temperature, �CTLMTD log mean temperature difference
U overall heat transfer coefficient, W/m2 �Cq density, kg/m3
278 J. Gimbun et al. / Journal of Food Engineering 64 (2004) 277–283
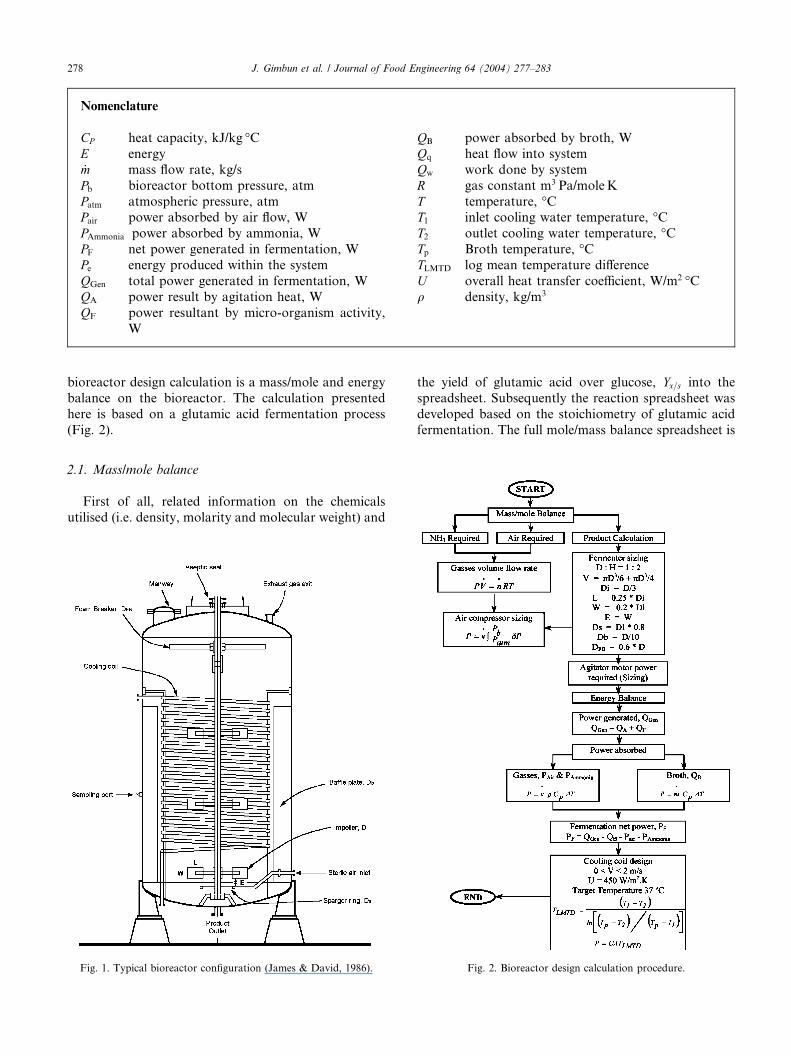
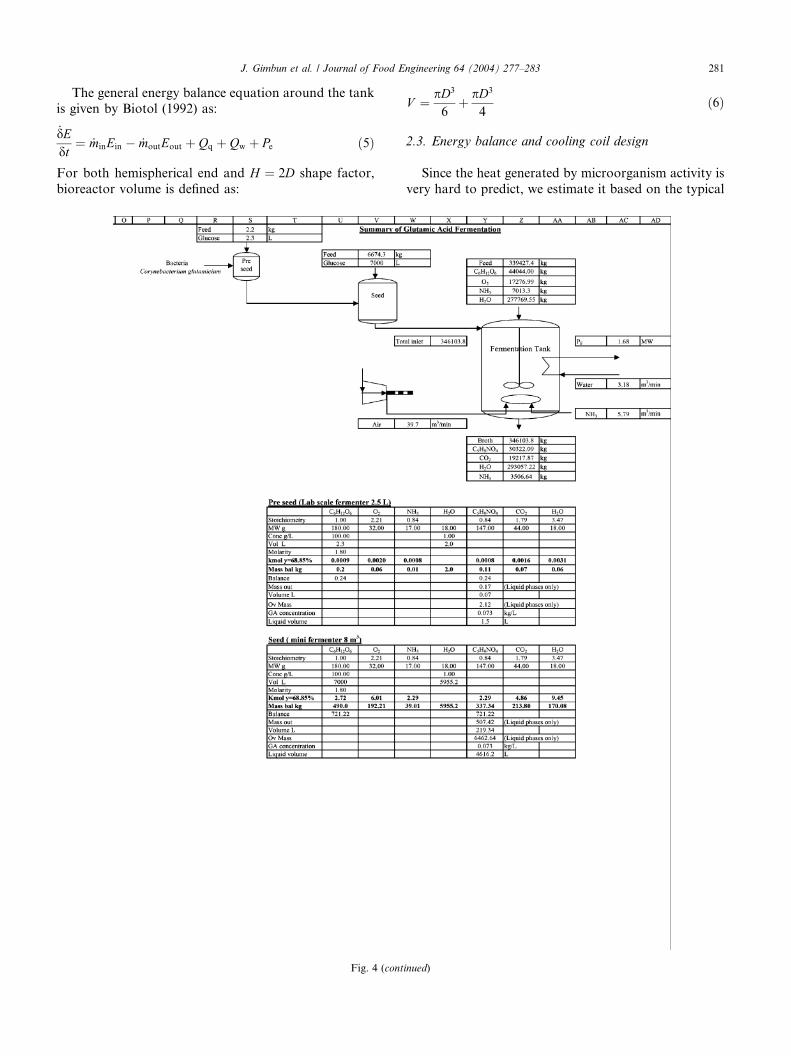
bioreactor design calculation is a mass/mole and energy
balance on the bioreactor. The calculation presented
here is based on a glutamic acid fermentation process
(Fig. 2).
2.1. Mass/mole balance
First of all, related information on the chemicals
utilised (i.e. density, molarity and molecular weight) and
Fig. 1. Typical bioreactor configuration (James & David, 1986).
the yield of glutamic acid over glucose, Yx=s into thespreadsheet. Subsequently the reaction spreadsheet was
developed based on the stoichiometry of glutamic acid
fermentation. The full mole/mass balance spreadsheet is
Fig. 2. Bioreactor design calculation procedure.
Feed 2.2 kgGlucose 2.3 L
Feed 6674.3 kgBacteria Glucose 7000 L Feed 339427.4 kg
Corynebacterium glutamicium C6H12O6 44044.00 kg
O2 17276.99 kg
NH3 7013.3 kg
H2O 277769.55 kg
Total inlet 346103.8 E1 1.68 MW
Water 3.18 m3/min
NH3 5.79 m3/min
Air (O2) 39.7 m3/min
Broth 346103.8 kgC5H9NO4 30322.09 kg
CO2 19217.87 kg
H2O 293057.22 kg
NH3 3506.64 kg
Fermentation Tank
Seed
PreSeed
Fig. 3. Summary of mass and heat transfer from MS Excel spreadsheet.
Table 1
Bioreactor design criteria (Hall, Stanbury, & Whitaker, 1999)
Dimension Ratio
Working volume/bioreactor vessel volume 0.8
Height/vessel diameter ðH=DÞ 2
Vessel diameter/impeller diameter ðD=DiÞ 3
Sparger ring diameter/impeller diameter
ðDs=DiÞ1–1.2
Baffle/vessel diameter ðDb=DÞ 0.1
Foam breaker diameter/vessel diameter
ðDFB=DÞ0.6
L=Di 0.25
E=W 1
W =Di 0.2
Table 2
Bioreactor sizing spreadsheet
J. Gimbun et al. / Journal of Food Engineering 64 (2004) 277–283 279
constructed by linking each cell from the reaction
spreadsheet to the equation and chemical or physical
properties. From this mole/mass balance the amount of
substrate (glucose), ammonia, and air (oxygen supply)required can be calculated. The ideal gas law is applied
in the spreadsheet for the automatic calculation of air
and ammonia flow rate. The ideal gas law is considered
applicable since the air pressure is not more than 2 atm.
The summary of the mass/mole balance calculated by
the Excel spreadsheet is shown in Fig. 3.
The stoichiometric equation of LL-glutamic acid fer-
mentation is as follow (Murray, 1985):
C6H12O6 þ 2:21O2 þ 0:84NH3
! 0:84C5H9O4Nþ 1:78H2Oþ 3:74H2O
The mass balance for the component A in a bioreactorvessel as stated in Biotol (1992) is:
VdCA
dt¼ _vinCA;in � _voutCA;out þ rAV ð1Þ
The mole balance of component A of a bioreactor fromBiotol (1992) is written as:
Vd _nAdt
¼ _vin _nA;in � _vout _nA;out þ rAV ð2Þ
The ideal gas law applied to estimates the volume flow
rate of gases given as:
P _V ¼ _nRT ð3Þ
Broth final volume, which is equal to the bioreactor
working volume, is estimated as:
V ¼ mq
ð4Þ
280 J. Gimbun et al. / Journal of Food Engineering 64 (2004) 277–283
2.2. Bioreactor sizing
After performing the mass/mole balance, the working
volume of the bioreactor can be calculated. A typical
working volume of a bioreactor is 80% of the total
volume as shown in Table 1 (Hall et al., 1999). Based on
Fig. 4. Bioreactor mass/mol
this information the total volume of a bioreactor can becalculated. A spreadsheet for the bioreactor sizing is
constructed by linking the cells of working volume in the
mass/mole balance spreadsheet to the bioreactor design
criteria as shown in Table 1. Table 2 is an example of the
constructed spreadsheet for bioreactor sizing (Fig. 4).
e balance spreadsheet.
J. Gimbun et al. / Journal of Food Engineering 64 (2004) 277–283 281
The general energy balance equation around the tankis given by Biotol (1992) as:
_dEdt
¼ _minEin � _moutEout þ Qq þ Qw þ Pe ð5Þ
For both hemispherical end and H ¼ 2D shape factor,
bioreactor volume is defined as:
Fig. 4 (cont
V ¼ pD3
6þ pD3
4ð6Þ
2.3. Energy balance and cooling coil design
Since the heat generated by microorganism activity is
very hard to predict, we estimate it based on the typical
inued)
Table 3
Data for typical glutamic acid fermentation from Atkinson and
Mavituna (1992)
Agitator power required 15 hp (1000 gal)�1
Heat of fermentation 100 Btu (h)(gal)�1
Agitation heat 38 Btu (h)(gal)�1
Broth temperature 37–38 �CInlet cooling water 10 �C
Table 4
Energy balance and cooling coil design spreadsheet
282 J. Gimbun et al. / Journal of Food Engineering 64 (2004) 277–283
operation data for fermentation as shown in Table 3(Atkinson & Mavituna, 1992). The energy balance
spreadsheet constructed by linking this design data to the
cells of the bioreactor working volume, air and ammonia
flow rate and the substrate flow rate. This spreadsheet
will calculate the net fermentation heat generated per
unit time (power), which is equal to the cooling coil duty
that is yet, to be designed. Water is chosen as the coolant
Table 5
Summary of calculated results
Parameter Value
Total volume 290 m3
Liquid volume (working volume) 231 m3
Tank OD 6 m
Total height/diameter 2
Percentage fill 80
Pressure (liquid surface) 1 atm
Pressure (bottom) 1.64 atm
Air flow rate 36.1 m3/min
Oxygen flow rate 7.6 m3/min
Ammonia flow rate 5.8 m3/min
Sparger diameter 2.22 m
Sparger hole diameter 6 mm
Sparger pipe diameter 0.1 m
Off segmented baffle (total) db 0.6 m
Baffle ratio db=dt 1/10
Baffle plate d 0b 0.5 m
No. of turbine 3
Impeller diameter 2.12 m
Impeller di=dt ratio 0.3
Motor power required 9.8 MW
Heat load 1.7 MW
U 550 W/m2 �CCoolant inlet temperature (water) 10 �CCoolant flow 3.2 m3/min
Coil side velocity 1.62 m/s
Coil area required 206.1 m2
Coil pipe diameter OD 73 mm
Coil pipe diameter ID 63 mm
Coil diameter 4.53 m
Coil spacing 0.06 m
No. of coil 64
Area provided 209.4 m2
J. Gimbun et al. / Journal of Food Engineering 64 (2004) 277–283 283
because it is cheap and available. A spreadsheet to cal-
culate heat transfer area required is then constructed by
linking Eqs. (7)–(10). The design parameter such as
cooling pipe diameter and size of coolant inlet are fixed
by the designer. The heat transfer area, pipe diameter
and size of inlet value are used to determine the coolant
side velocity. The purpose of coolant side velocity or coil
inner velocity calculation is to check whether the designis applicable or not. If the coolant side velocity is larger
than 2 m/s mean then the designed cooling coil is not
applicable because of lack in heat transfer. The way to
overcome such a problem is to design a larger coolant. A
larger coolant inlet will reduce the flow rate of coolant
without reducing the total heat transfer area so that the
tendency will be to reduce the coolant side velocity into
the correct operating range. Table 4 shows an example ofthe constructed spreadsheet for the energy balance and
design of the cooling coil.
The energy contained in the liquid is given by Kern
(1965) as:
P ¼ _mCPDT ð7Þ
By substituting m ¼ _vq the energy contained in thegasses phase is written as:
P ¼ _vqCPDT ð8Þthe log mean temperature difference, TLMTD is defined as:
TLMTD ¼ ðT1 � T1Þln½ðTP � T2Þ=ðTP � T1Þ�
ð9Þ
Duty of a cooling coil with heat transfer coefficient U is
given by Sinnott (1996) as:
P ¼ UATLMTD ð10ÞTable 5 shows the summary results of the bioreactor
design, carried out MS Excel.
3. Conclusions
A bioreactor design spreadsheet is easy to learn, and
offers a quicker way for preliminary calculation of the
bioreactor design. A spreadsheet also eliminates human
error in doing the iteration calculation, which is com-monly used in design calculation. This method also
offers an easy way for the designer to scale up and
optimise the process. By using this method the designer
also escapes the costly simulation software license. The
spreadsheet method also provides a cheaper alternative
to the designer compared to costly commercial software.
Acknowledgements
The authors would like to thank very much to Dr.
Tey Beng Ti and Ajinomoto (Malaysia) Berhad for their
guidance and support.
References
Atkinson, B., & Mavituna, F. (1992). Biochemical engineering and
biotechnology handbook (2nd ed.). London: M Stockton Press.
Biotol (1992). Bioprocess technology: modelling and transport pheno-
mena. Oxford: Butterworth–Heinemann.
Bloch, S. C. (2000). Excel for engineers and scientists. New York: John
Wiley.
Hall, S. J., Stanbury, P. F., & Whitaker, A. (1999). Principle of
fermentation technology (2nd ed.). Oxford: Butterworth–Heine-
mann.
James, B. E., & David, O. F. (1986). Biochemical engineering
fundamentals (2nd ed.). New York: McGraw-Hill.
Kern, Q. D. (1965). Process heat transfer. New York: McGraw-Hill.
Liengme, B. V. (1997). A guide to microsoft excel for scientist and
engineers. London: Arnold.
Murray, M. Y. (1985). Comprehensive biotechnology, vol. 4. London:
Pergamon Press.
Sinnott, R. K. (1996). Coulson and Richardson’s chemical engineering,
vol. 6 (2nd ed.). Oxford: Butterworth–Heinemann.