Page 1
Calcareous Compacted Mine Soil in Southeast Ohio: A Prairie Grass Habitat
Dissertation
Presented in Partial Fulfillment of the Requirements for the Degree Doctor of
Philosophy in the Graduate School of The Ohio State University
By
Mark Ervin Thorne, B.S., M.S.
Environmental Science Graduate Program
The Ohio State University
2010
Dissertation Committee:
John Cardina, Advisor
James Metzger
Landon Rhodes
Craig Davis
Page 2
Copyright by
Mark Ervin Thorne
2010
Page 3
ii
Abstract
The degradation of terrestrial ecosystems has been an unfortunate by-product
of the human demand for natural resources. As a result, environmental quality suffers
as watersheds are lost, global warming continues, species go extinct, and productivity
is reduced. Restoring ecosystems such as prairies or forests to their original character
is desirable but may be impossible if the extent of degradation is too great.
Rehabilitation of severely degraded ecosystems may require establishment of
alternative communities to recreate functional ecosystem attributes such as diversity,
stability, and productivity. In Ohio, surface coal mining has replaced thousands of
hectares of diverse forests with a low-diversity, non-native forage complex. Adverse
soil conditions have prohibited reestablishment of native forest species; thus,
restoration of the original ecosystem is unlikely. As an alternative, establishment of a
diverse prairie would restore ecosystem attributes and be more desirable than the
current forage complex. This research examines suitability of native prairie grasses on
reclaimed mine land in southeast Ohio. Grass species were selected form habitats
across North America and represent differences in climate and native habitat. Grasses
were planted on compacted, calcareous, bare-soil field plots in 2005 and 2006 on land
that had been mined and reclaimed in the mid-1980s and was previously supporting a
low-diversity, non-native forage complex. Establishment and growth of prairie
grasses was monitored through 2007 with population counts, cover assessments, and
Page 4
iii
biomass measurements. Glasshouse experiments were conducted to compare growth
of selected grasses and effectiveness of mine soil arbuscular-mycorrhizal fungi (AMF)
with native tallgrass prairie AMF at different levels of soil phosphorus and
compaction. Eastern gamagrass (Tripsacum dactyloides L.) was the most successful
in relation to number of seeds sown and equaled productivity of the existing
vegetation by the second year. Eastern gamagrass was also found to be highly
dependent on AMF when phosphorus was low. Tall dropseed (Sporobolus asper
(Michx.) Kunth) was successful and tolerated low phosphorus without AMF.
Buffalograss (Buchloe dactyloides (Nutt.) Engelm) established well with spreading
stolons and produced a dense ground cover within the first year of growth. Big
bluestem (Andropogon gerardii Vitman), Indiangrass (Sorghastrum nutans (L.) Nash),
and little bluestem (Schizachyrium scoparium (Michx.) Nash) are highly dependent on
AMF and were least successful in establishment, but increased in productivity during
the study. Sideoats grama (Bouteloua curtipendula (Michx.) A. Gray) and blue grama
(Bouteloua gracilis (Willd. ex Kunth) Lag. ex Griffiths) did not persist, likely due to
periodic anaerobic soil. Mine soil AMF were found to be equally or more effective
than the tallgrass prairie AMF, and would likely not be a barrier for establishment of
other prairie species. Soil compaction was not a factor for eastern gamagrass but early
growth was greater for tall fescue (Festuca arundinaceae Schreb.), one of the existing
non-native forage species, which explains its success in mine soil revegetation.
Establishing a diverse prairie community on mine soil can likely be accomplished, but
with a mix of prairie species that contain different strategies to overcome the poor
growing conditions of the mine soil habitat.
Page 5
iv
Dedication
I dedicate this work to my best friend,
Deborah Mills Thorne.
The journey, we share.
Page 6
v
Acknowledgements
This work would not have occurred without the outstanding support and
mentoring from Dr. John Cardina, my advisor, who was genuinely interested in my
success. I also sincerely appreciate the members of my committee, Dr. James
Metzger, Dr. Landon Rhodes, and Dr. Craig Davis who provided advice, laboratory
space and equipment, and were great mentors in the classroom. I recognize and
appreciate the assistance of Dr. Nicole Cavender of the Wilds, who provided a great
field location for this research. Assistance given by Jim Vent and David Snodgrass at
the Howlett greenhouse and nursery on The Ohio State University campus was
invaluable. First-year funding provided by Dr. Martin Quigley, and consultation given
by Dr. J.P. Vimmerstedt, Professor Emeritus, The Ohio State University / Ohio
Agricultural Research and Development Center, and Gary Kaster, American Electrical
Power, was also greatly appreciated. And, I am forever grateful to The Ohio State
University for awarding me a Mary S. Muellhaupt Presidential Fellowship, which
significantly aided in the completion of this work.
Page 7
vi
Vita
1980 ..................... A.A. Liberal Arts, Blue Mountain Community College, Pendleton,
OR.
1989 ..................... B.S. Crop Science, Oregon State University, Corvallis, OR.
1990-1994 ........... Agricultural Research Technician, Washington State University,
Pullman, WA.
1996 ..................... M.S. Natural Resource Sciences, Washington State University,
Pullman, WA.
1996-1997 ........... Associate of Research, Washington State University, Pullman, WA.
1997-1998 ........... Agricultural Research Technologist, Washington State University,
Pullman, WA.
2000 ..................... Instructor – Crop Science 305 – Principles of Weed Science,
Washington State University. Pullman, WA.
2002 ..................... Graduate Teaching Associate – Weed Science 422 – Principles of
Weed Science, The Ohio State University, Columbus, OH.
2004 ..................... Graduate Teaching Associate – Environment and Natural Resources
201 – Introduction to Environmental Science, The Ohio State
University, Columbus, OH.
2005 ..................... Graduate Teaching Associate – Environment and Natural Resources
201 – Introduction to Environmental Science, The Ohio State
University, Columbus, OH.
2005 ..................... Graduate Teaching Associate – Environment and Natural Resources
203 – Society and Natural Resources, The Ohio State University,
Columbus, OH.
2007 ..................... Mary S. Muellhaupt Presidential Fellowship, The Ohio State
University, Columbus, OH.
Page 8
vii
2008 ..................... Graduate Teaching Associate – Environment and Natural Resources
201 – Introduction to Environmental Science, The Ohio State
University, Columbus, OH.
Publications
1990 ..................... Eastern Washington Weed Control Report, C.M. Boerboom, Dept.
of Crop and Soil Sciences, Washington State University, Pullman,
WA.
1991 ..................... Eastern Washington Weed Control Report, C.M. Boerboom, and
M.E. Thorne, Dept. of Crop and Soil Sciences, Washington State
University, Pullman, WA.
1992 ..................... Eastern Washington Weed Control Report, C.M. Boerboom, and
M.E. Thorne, Technical Report 93-1, Dept. of Crop and Soil
Sciences, Washington State University, Pullman, WA.
1993 ..................... Eastern Washington Weed Control Report, C.M. Boerboom, and
M.E. Thorne, Technical Report 94-3, Dept. of Crop and Soil
Sciences, Washington State University, Pullman, WA.
1998 ..................... Thorne, M.E., B.A. Zamora, and A.C. Kennedy. Sewage sludge
and mycorrhizal effects on Secar bluebunch wheatgrass in mine
spoil. Journal of Environmental Quality 27:1228-1233.
1998 ..................... Integrated spring cropping systems for the semiarid wheat-fallow
region. Thorne, M. and F. Young. Technical Report 98-1, Dept. of
Crop and Soil Sciences, Washington State University, Pullman,
WA.
2003 ..................... Thorne, M.E., F.L. Young, W.L. Pan, R. Bafus, and J.R. Alldredge.
No-till spring cereal cropping systems reduce wind erosion
susceptibility in the wheat/fallow region of the Pacific Northwest.
Journal of Soil and Water Conservation 58:250-257.
2004 ..................... Thorne, D., A. Tickamyer, and M. Thorne. Poverty and income in
Appalachia. Journal of Appalachian Studies, Special Issue:
Appalachian Counts: The Region in the 2000 Census. 10:341-358.
Page 9
viii
2004 ..................... Young, F.L. and M.E. Thorne. Weed-species dynamics and
management in no-till and reduced-till fallow cropping systems for
the semi-arid agricultural region of the Pacific Northwest, USA.
Crop Protection 23:1097-1110.
2006 ..................... Young, F.L., M.E. Thorne, and D.L. Young. Nitrogen fertility and
weed management critical for continuous no-till wheat in the
Pacific Northwest. Weed Technology 20:658-669.
2007 ..................... Thorne, M.E., F.L. Young, J.P. Yenish. Cropping systems alter
weed seed banks in Pacific Northwest semi-arid wheat region.
Crop Protection 26:1121-1134.
Fields of Study
Major Field: Environmental Science Graduate Program
Page 10
ix
Table of Contents
Abstract ......................................................................................................................... ii
Dedication .................................................................................................................... iv
Acknowledgments ......................................................................................................... v
Vita ............................................................................................................................... vi
List of Tables................................................................................................................ xi
List of Figures ............................................................................................................. xv
Chapter 1: Introduction ................................................................................................ 1
Chapter 2: Prairie Grass Establishment on Calcareous Reclaimed Mine Soil ............. 4
Chapter 3: Productivity of Native Prairie Grasses on Reclaimed Calcareous
Mine Soil ............................................................................................................... 44
Chapter 4: Safe-sites Control Warm-season Prairie Grass Establishment on
Calcareous Compacted Mine Soil ............................................................................... 70
Chapter 5: Effectivity of Arbuscular Mycorrhizal Fungi of Reclaimed Calcareous
Surface Mine Soil and Native Tallgrass Prairie Soil on Growth of
Prairie Grasses ....................................................................................................... 87
Page 11
x
Chapter 6: Effect of soil compaction and arbuscular-mycorrhizal fungi on tall fescue,
big bluestem and eastern gamagrass seedling growth......................................... 112
Chapter 7: Summary and Conclusions ..................................................................... 134
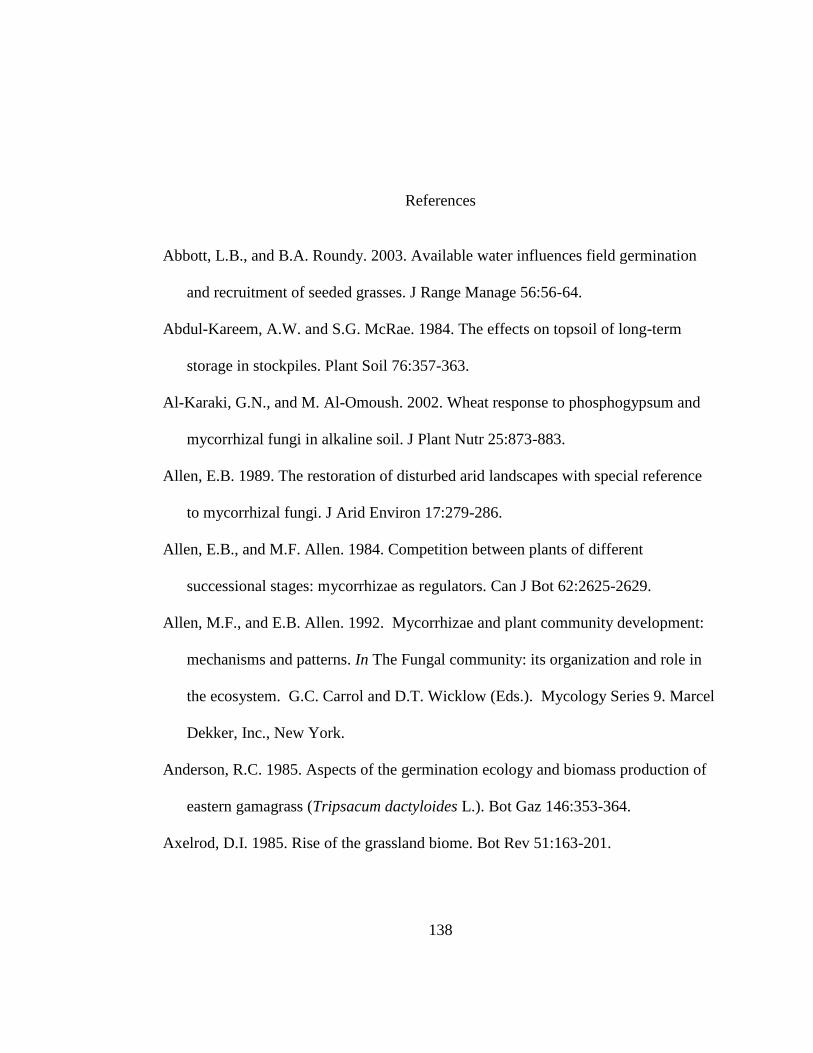
References ................................................................................................................. 138
Appendix A: Photographs of Reclaimed Surface Mined Land in Southeast Ohio .. 160
Appendix B: Cover Measurements of Existing Mine Soil Vegetation Re-establishing
in Prairie Grass Plots at the Conclusion of the Research .................................... 165
Page 12
xi
List of Tables
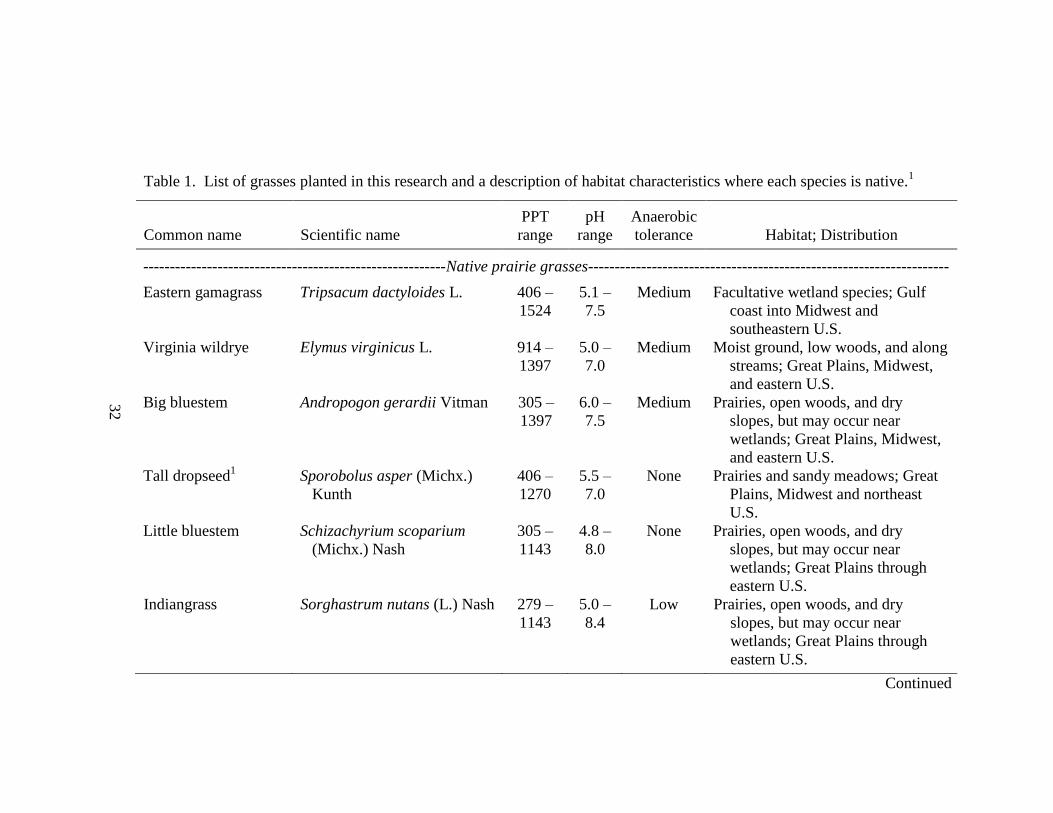
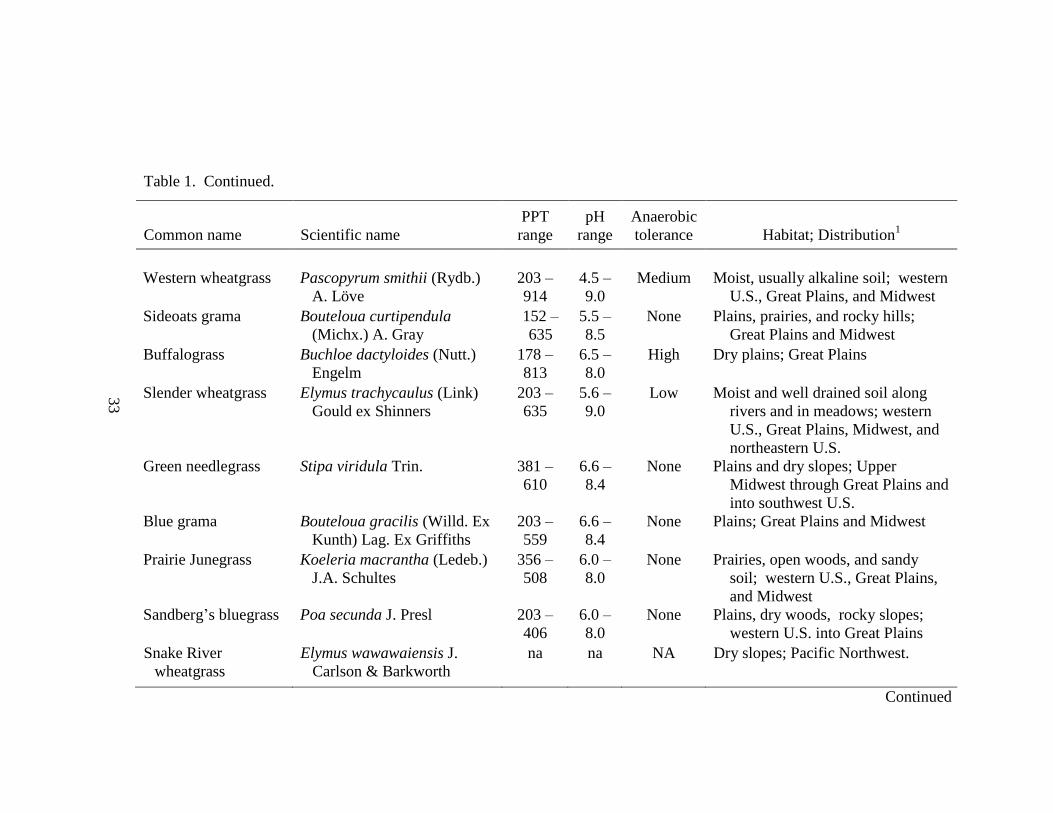
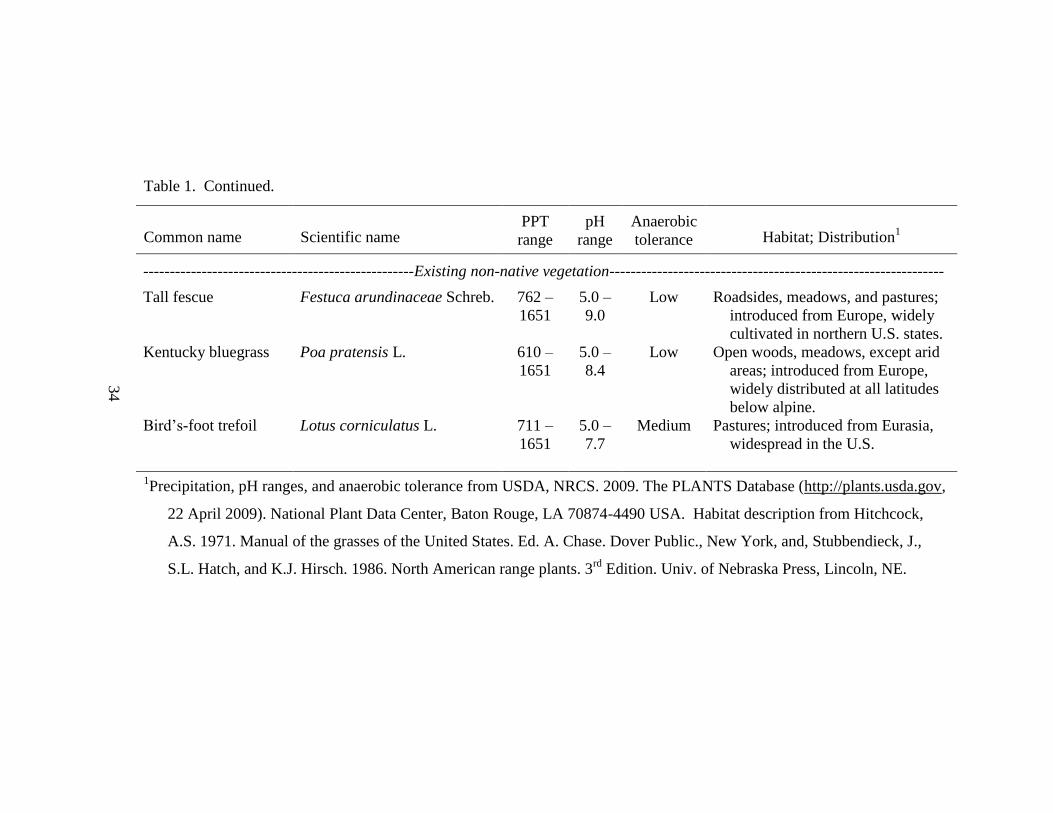
Table 1. List of grasses planted in this research and a description of habitat
characteristics where each species is native. ......................................................... 32
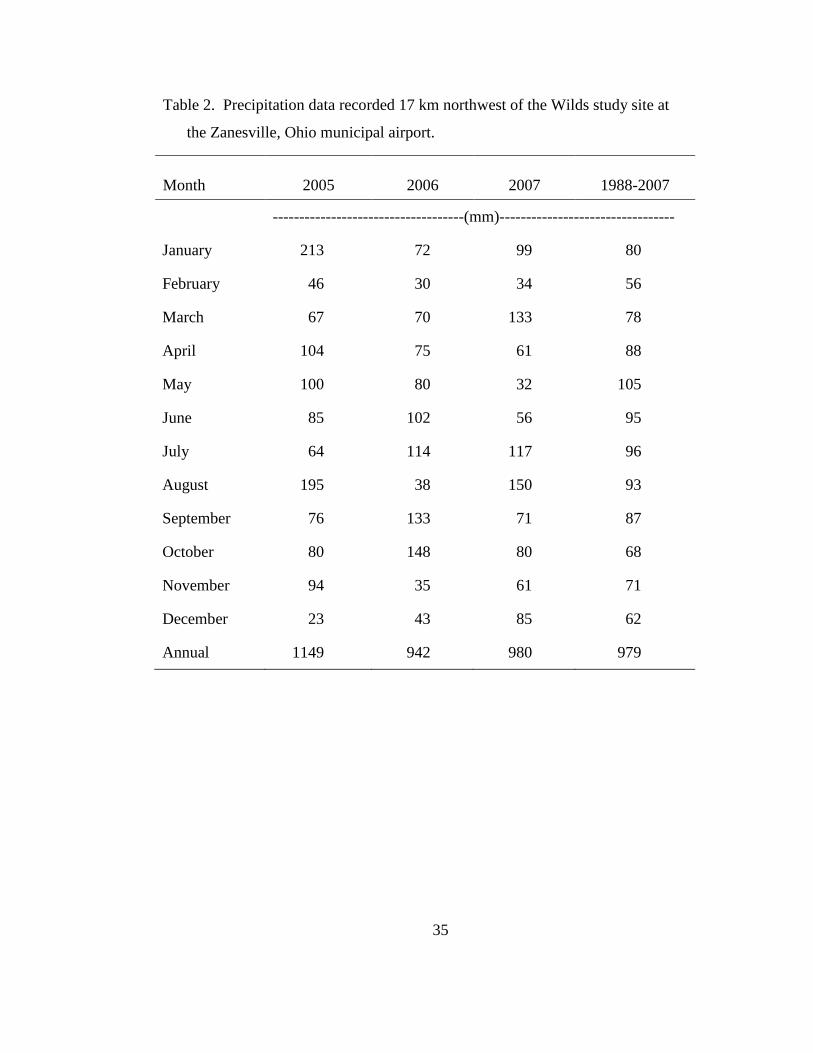
Table 2. Precipitation data recorded 17 km northwest of the Wilds study site at the
Zanesville, Ohio municipal airport. ...................................................................... 35
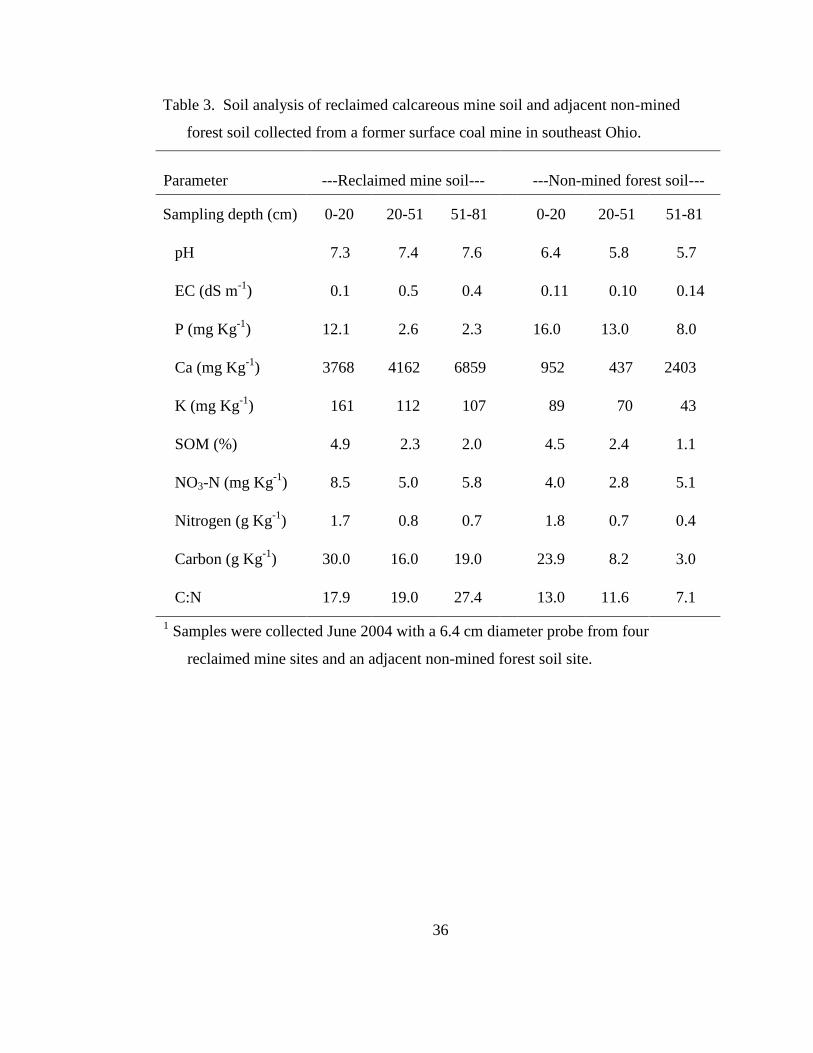
Table 3. Soil analysis of reclaimed calcareous mine soil and adjacent non-mined forest
soil collected from a former surface coal mine in southeast Ohio. ....................... 36
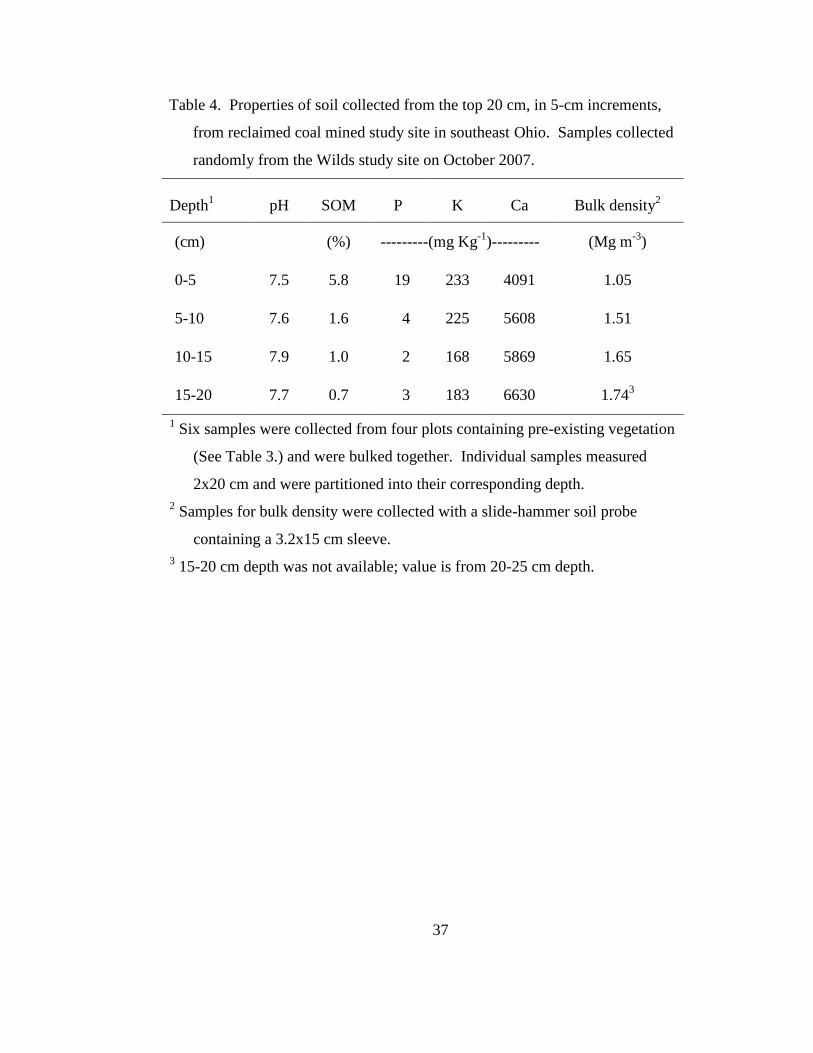
Table 4. Properties of soil collected from the top 20 cm, in 5-cm increments, from
reclaimed coal mined study site in southeast Ohio. Samples collected randomly
from the Wilds study site on October 2007. ......................................................... 37
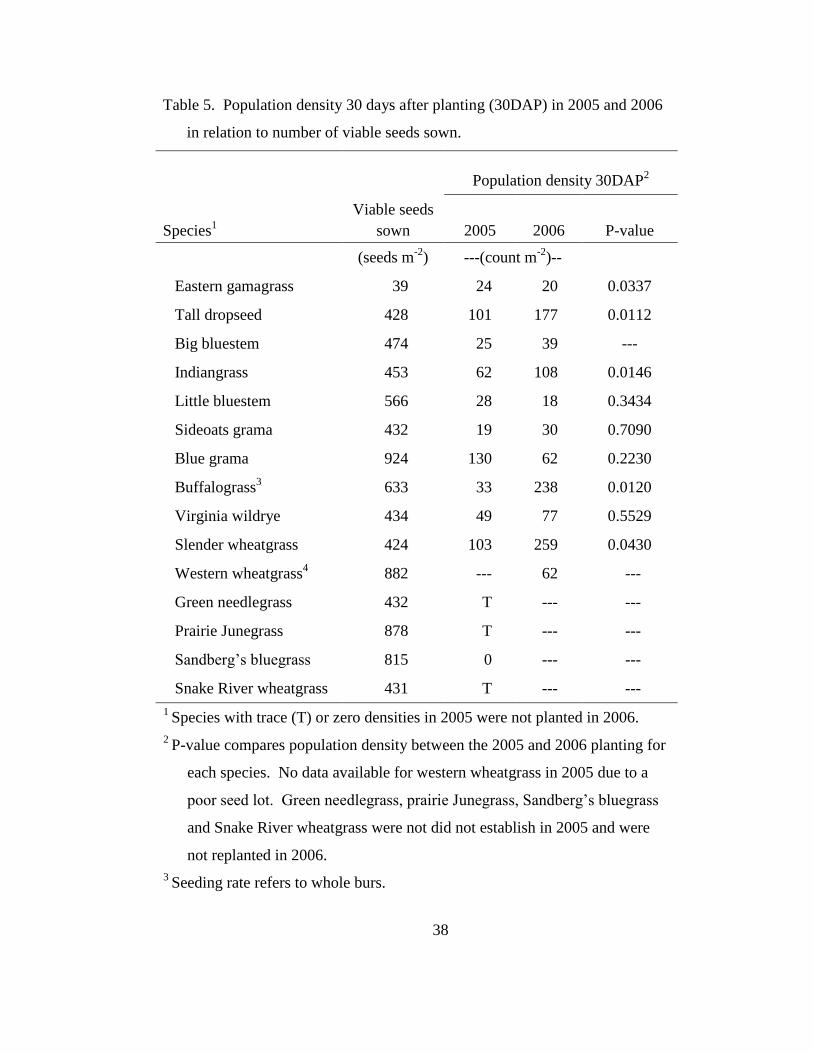
Table 5. Population density 30 days after planting (30DAP) in 2005 and 2006 in
relation to number of viable seeds sown. .............................................................. 38
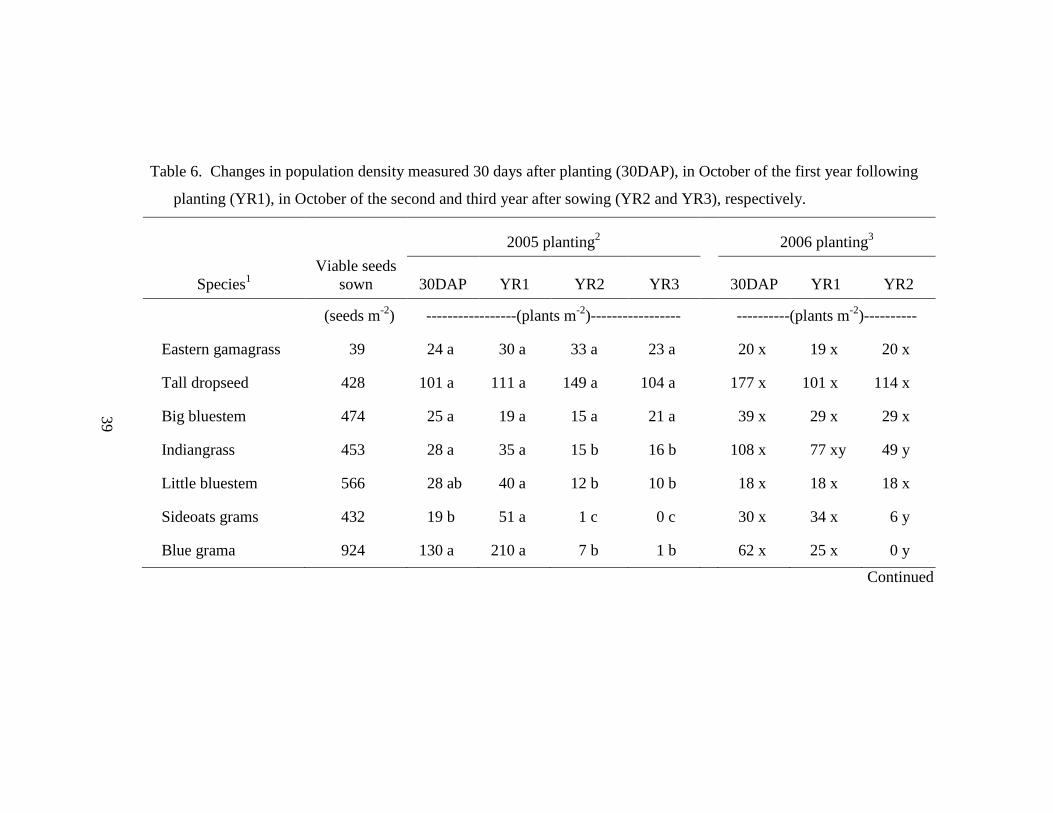
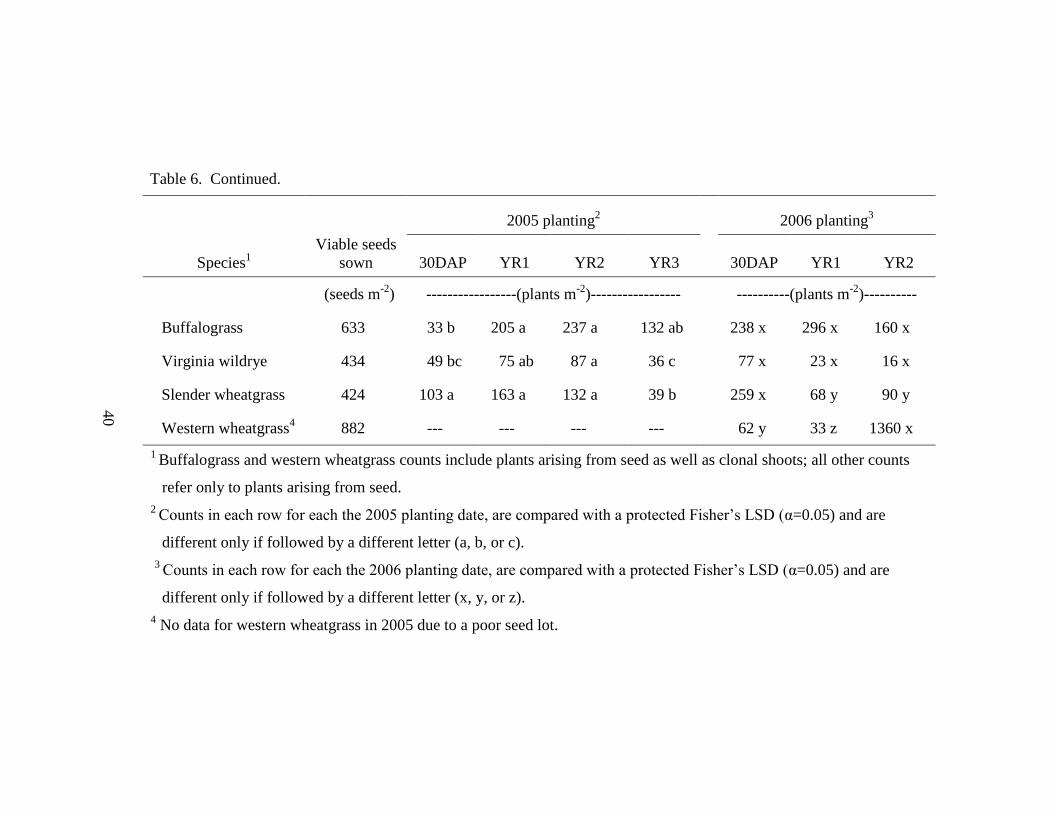
Table 6. Changes in population density measured 30 days after planting (30DAP), in
October of the first year following planting (YR1), in October of the second and
third year after sowing (YR2 and YR3), respectively........................................... 39
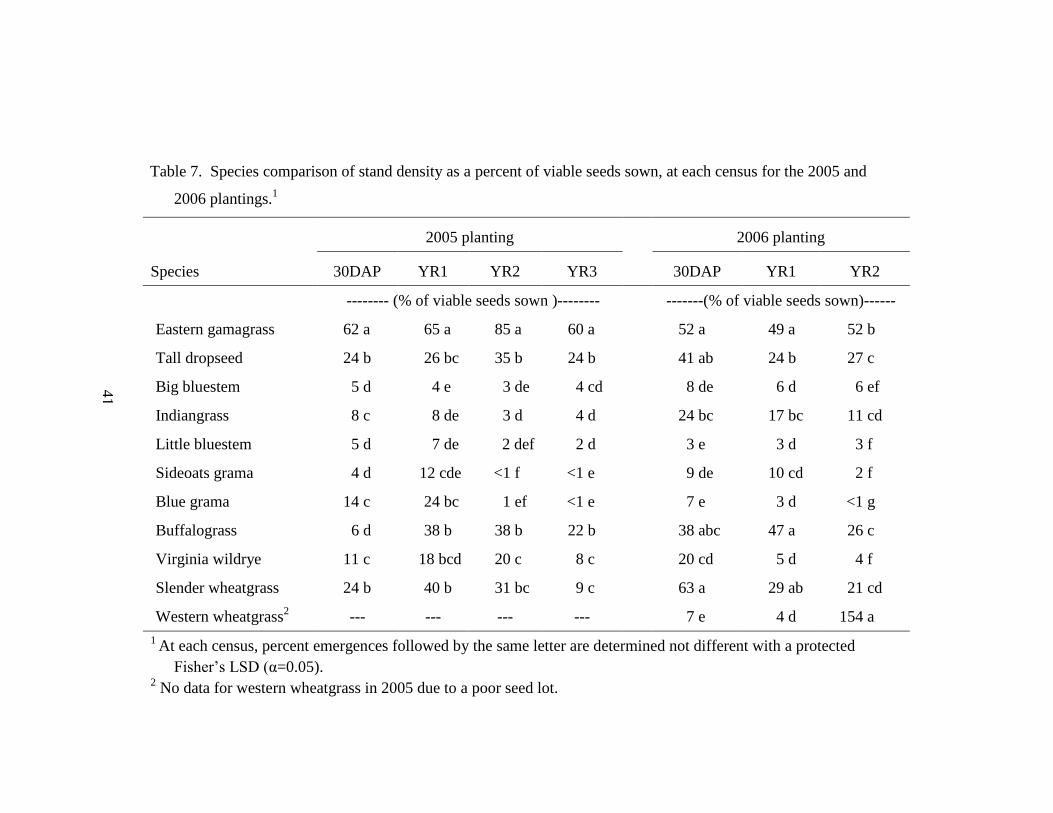
Table 7. Species comparison of stand density as a percent of viable seeds sown, at
each census for the 2005 and 2006 plantings. ....................................................... 41
Page 13
xii
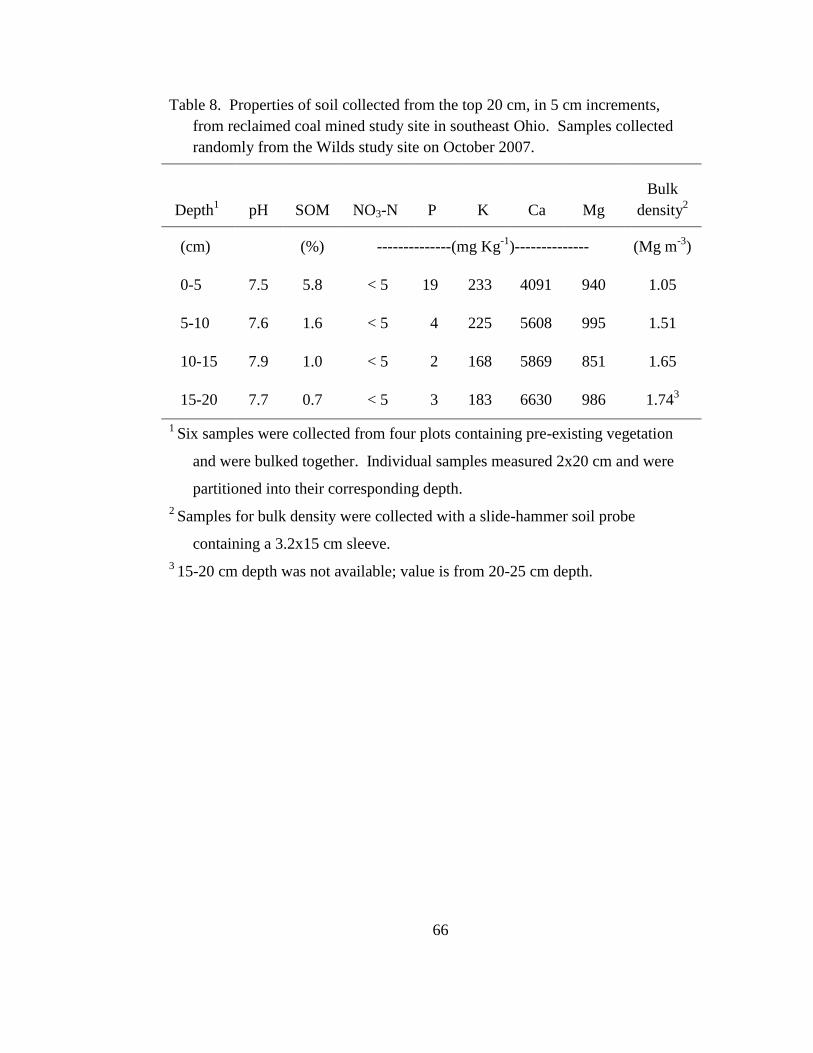
Table 8. Properties of soil collected from the top 20 cm, in 5 cm increments, from
reclaimed coal mined study site in southeast Ohio. Samples collected randomly
from the Wilds study site on October 2007. ......................................................... 66
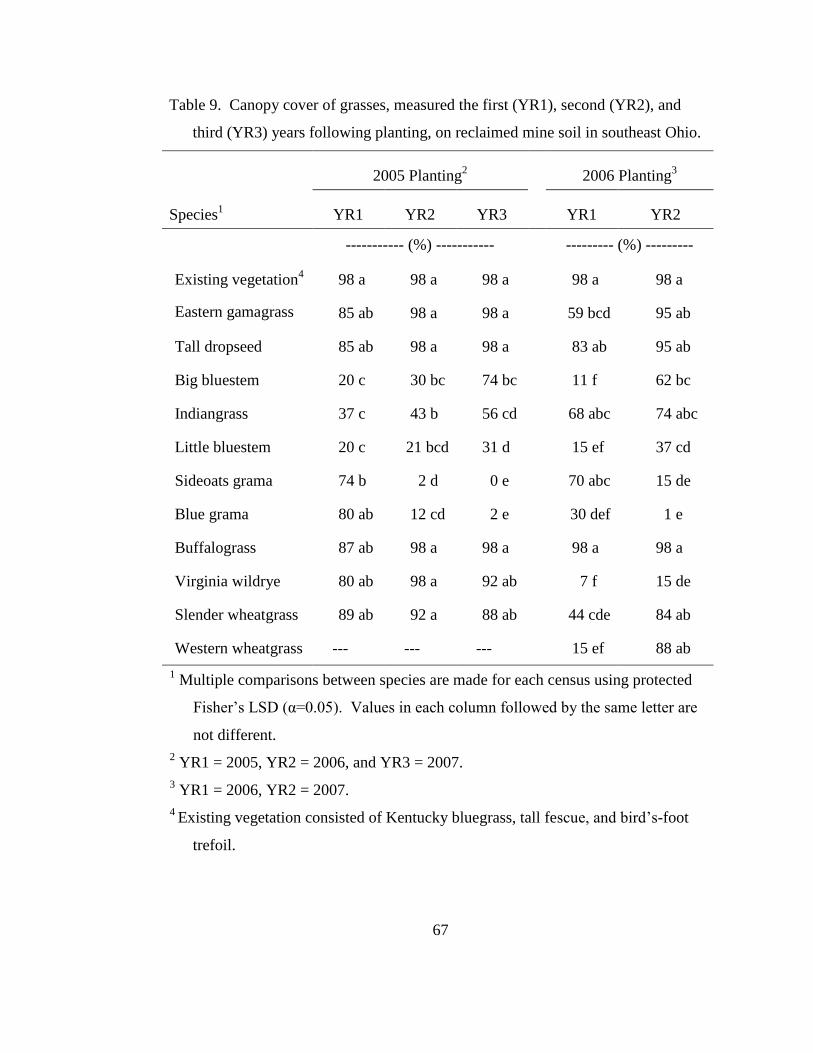
Table 9. Canopy cover of grasses, measured the first (YR1), second (YR2), and third
(YR3) years following planting, on reclaimed mine soil in southeast Ohio. ........ 67
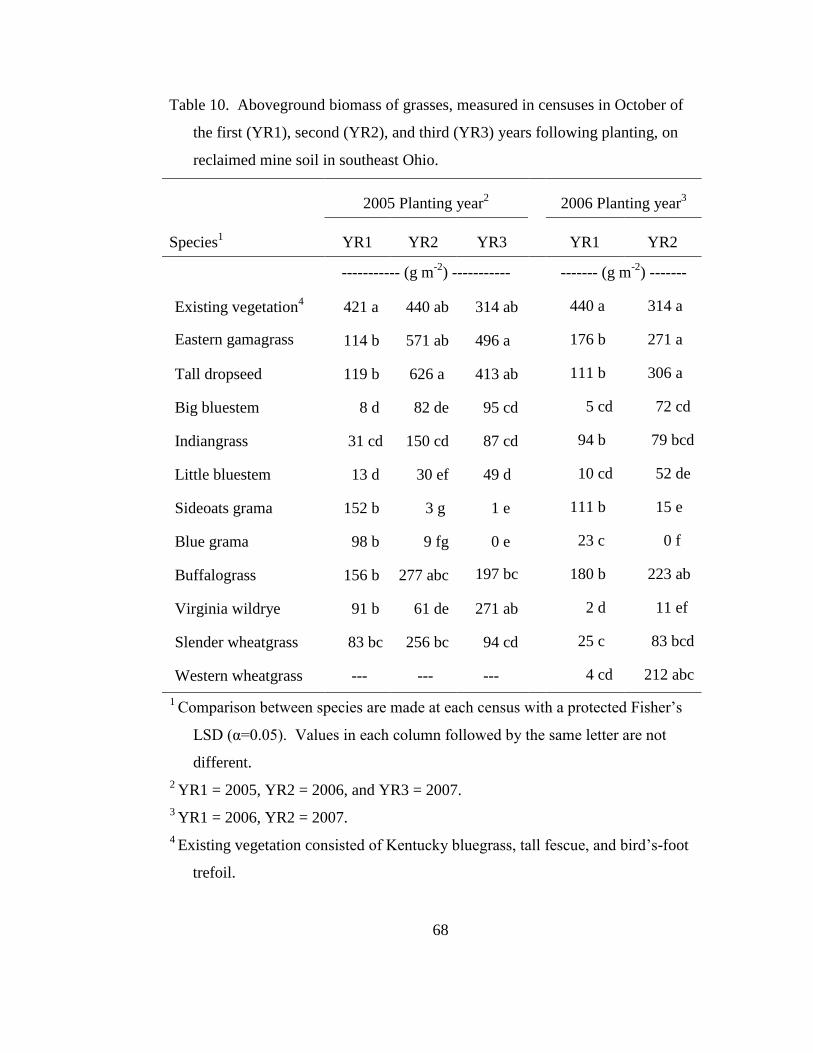
Table 10. Aboveground biomass of grasses, measured in censuses in October of the
first (YR1), second (YR2), and third (YR3) years following planting, on reclaimed
mine soil in southeast Ohio. .................................................................................. 68
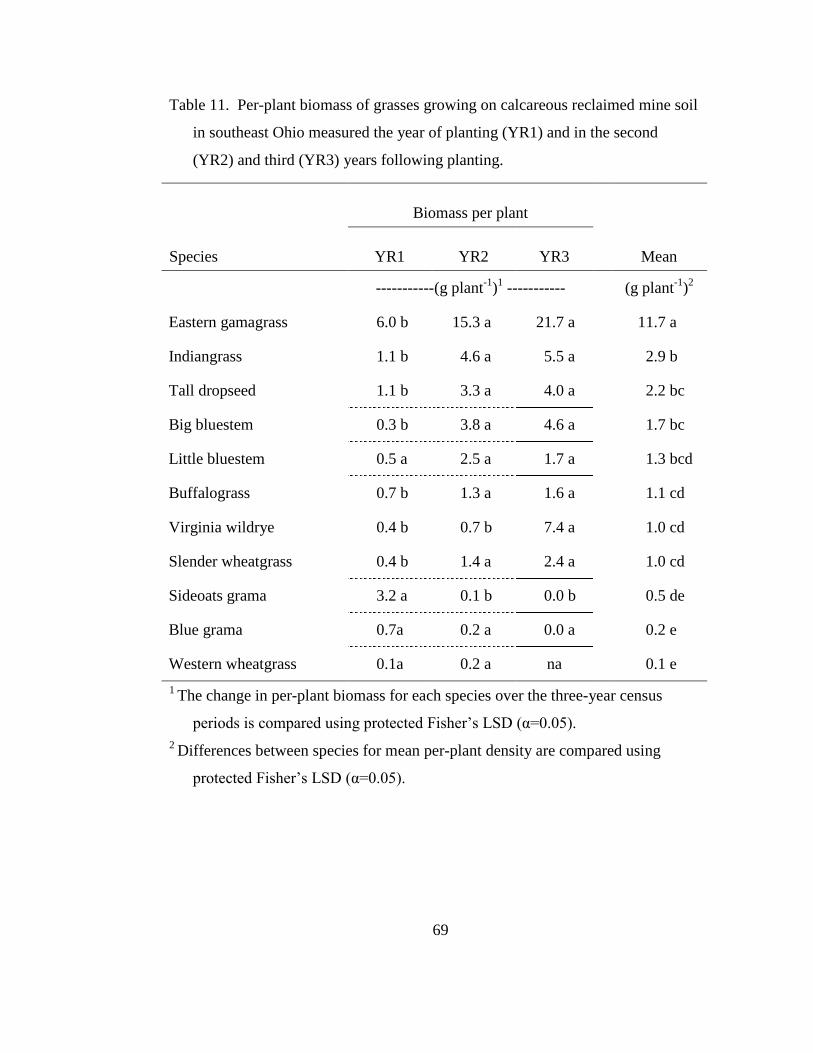
Table 11. Per-plant biomass of grasses growing on calcareous reclaimed mine soil in
southeast Ohio measured the year of planting (YR1) and in the second (YR2) and
third (YR3) years following planting. ................................................................... 69
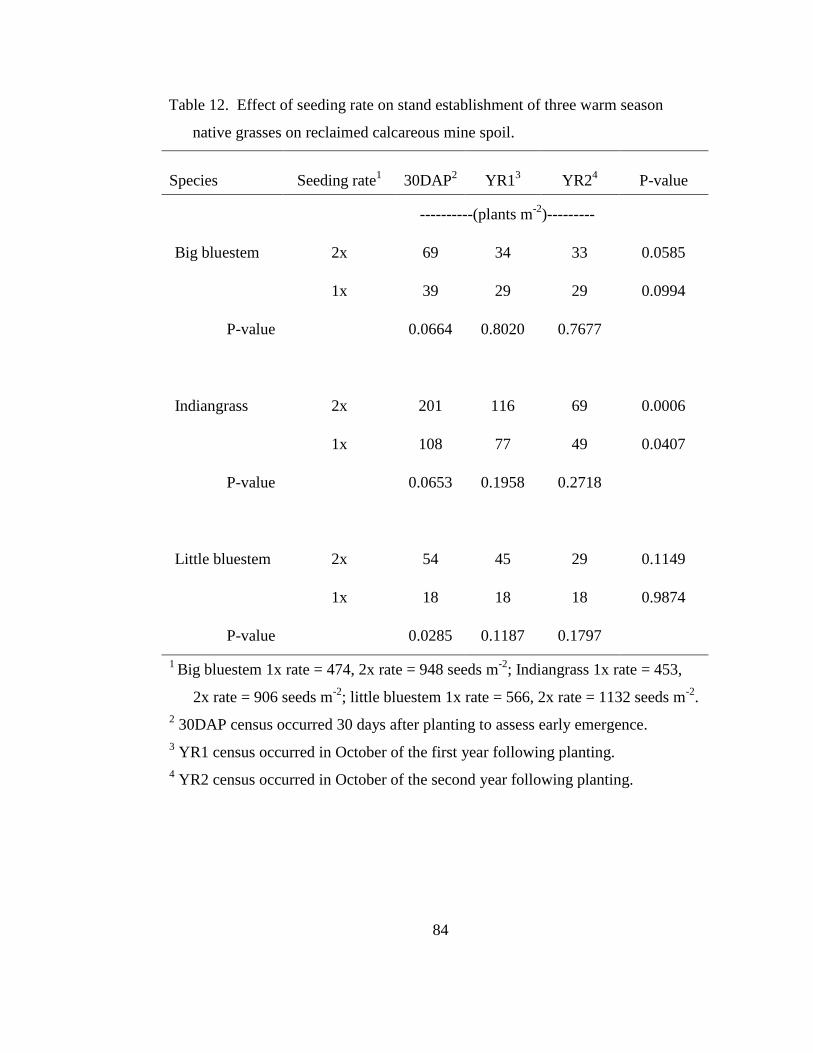
Table 12. Effect of seeding rate on stand establishment of three warm season native
grasses on reclaimed calcareous mine spoil. ......................................................... 84
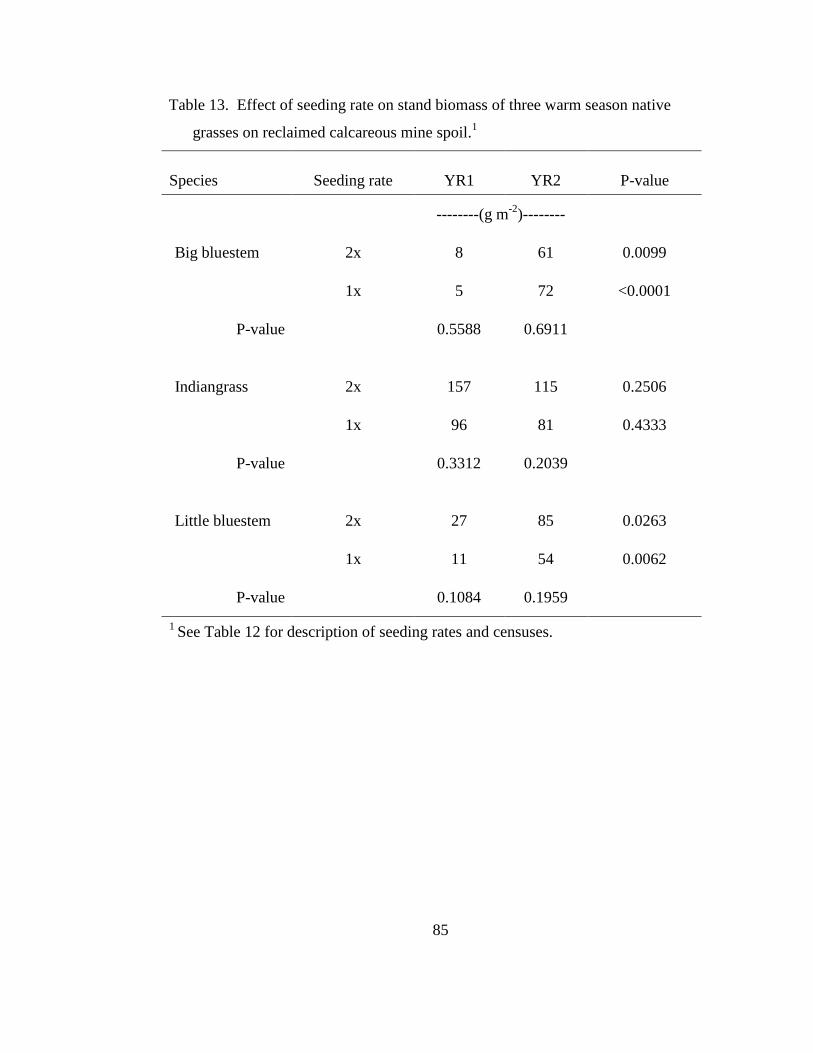
Table 13. Effect of seeding rate on stand biomass of three warm season native grasses
on reclaimed calcareous mine spoil. ..................................................................... 85
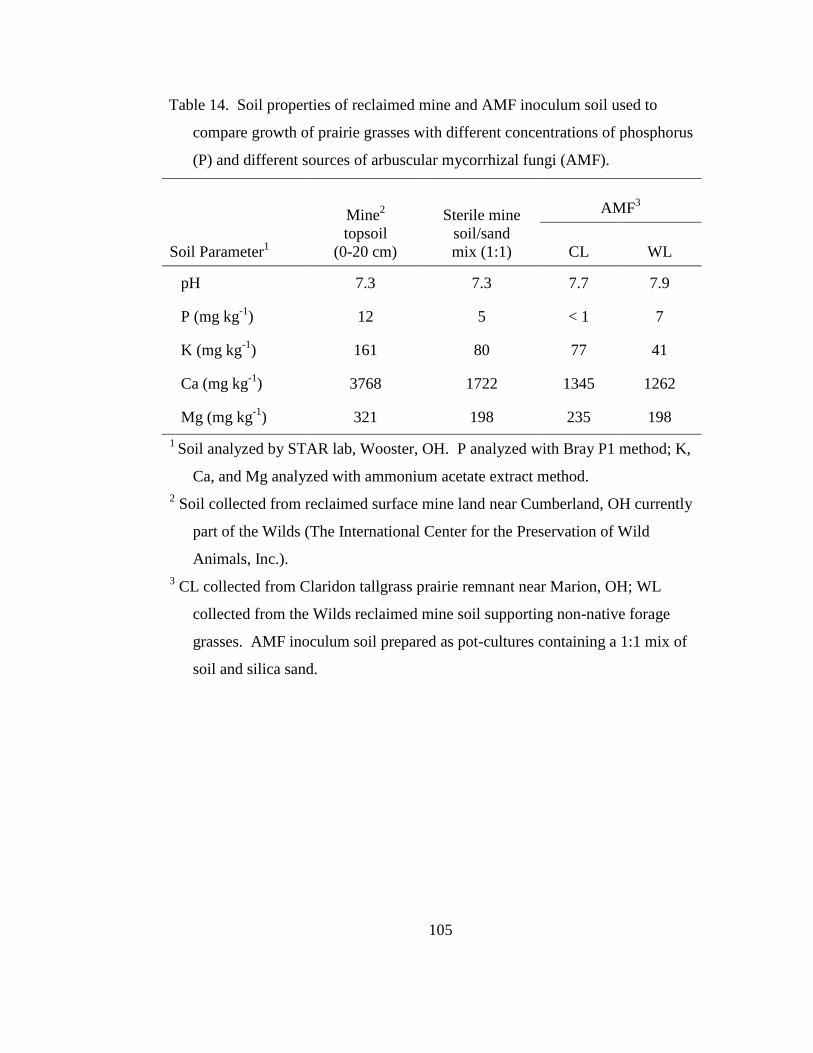
Table 14. Soil properties of reclaimed mine and AMF inoculum soil used to compare
growth of prairie grasses with different concentrations of phosphorus (P) and
different sources of arbuscular mycorrhizal fungi (AMF). ................................. 105
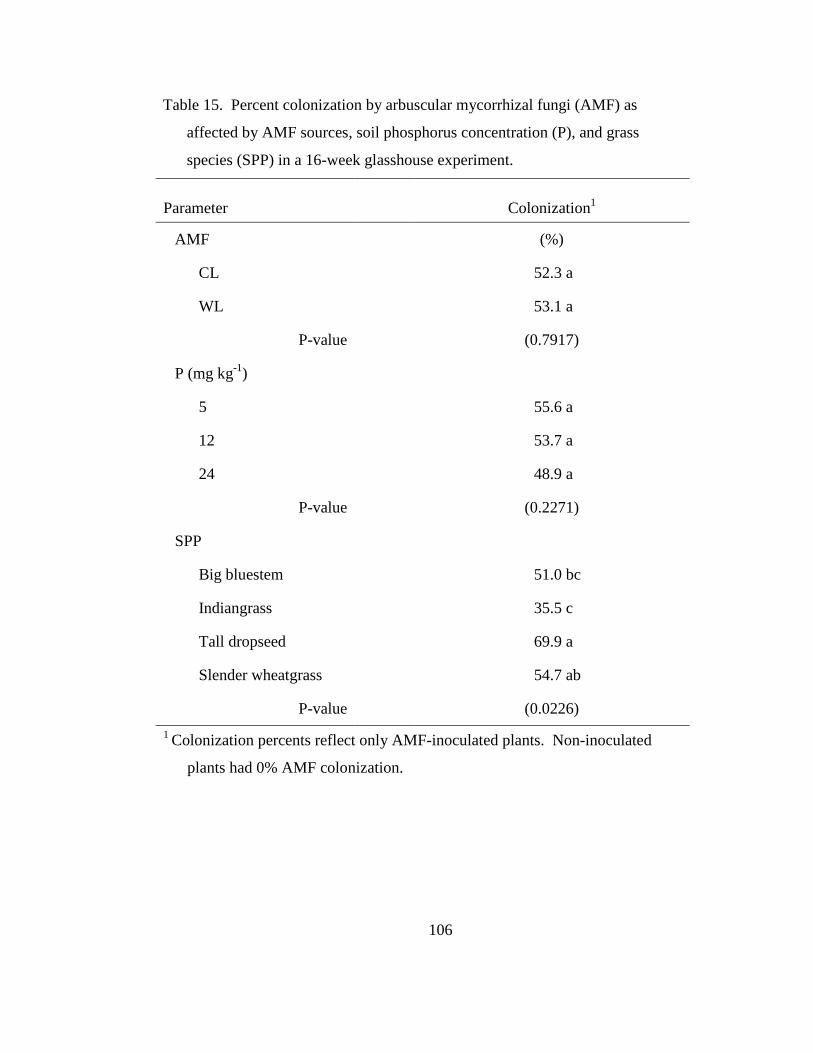
Table 15. Percent colonization by arbuscular mycorrhizal fungi (AMF) as affected by
AMF sources, soil phosphorus concentration (P), and grass species (SPP) in a
16-week glasshouse experiment. ......................................................................... 106
Page 14
xiii
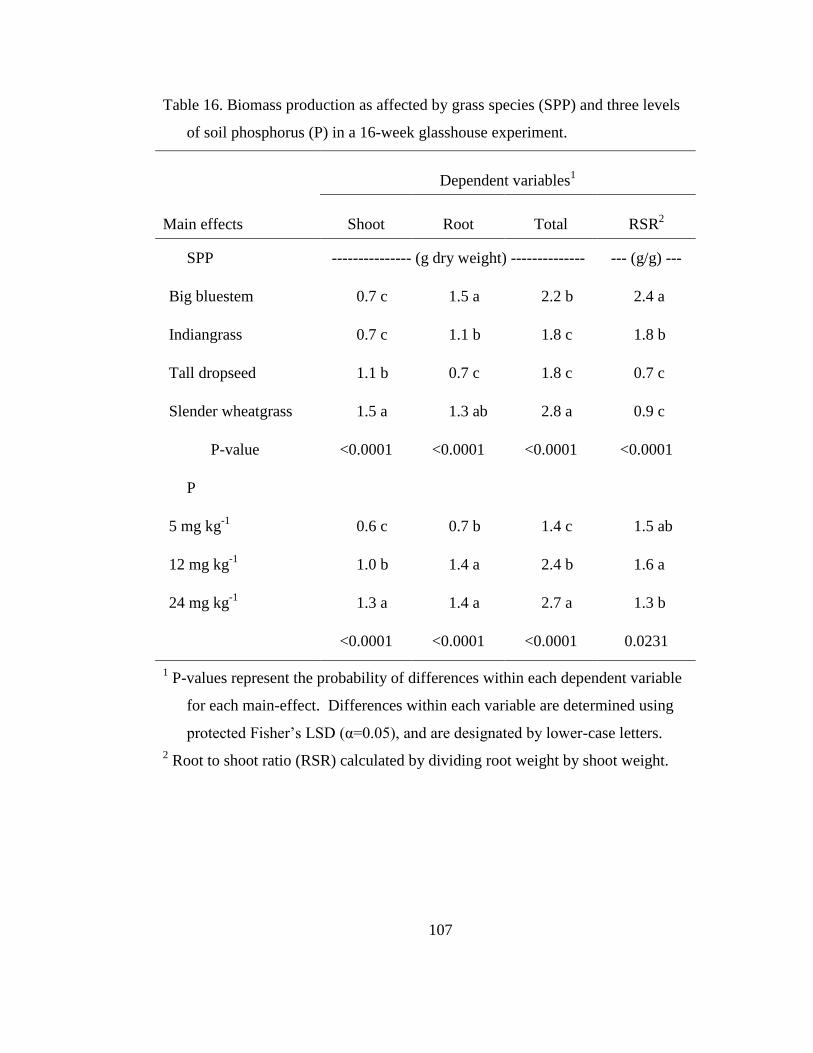
Table 16. Biomass production as affected by grass species (SPP) and three levels of
soil phosphorus (P) in a 16-week glasshouse experiment. .................................. 107
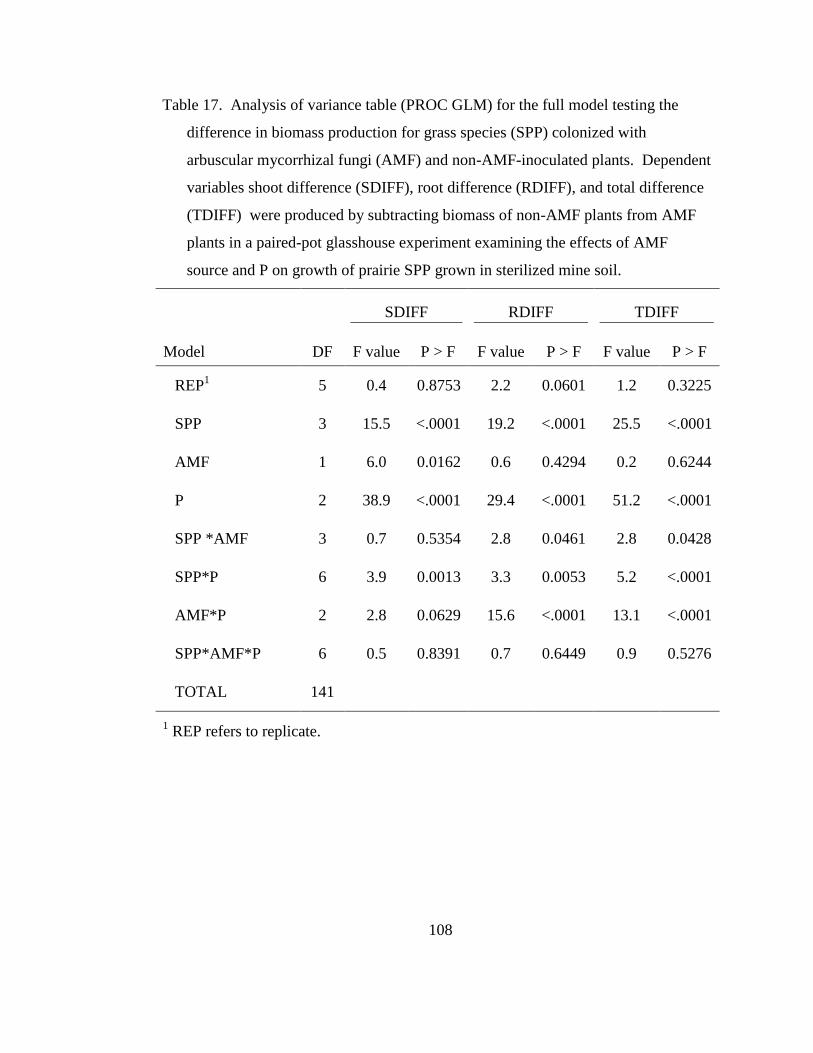
Table 17. Analysis of variance table (PROC GLM) for the full model testing the
difference in biomass production for grass species (SPP) colonized with arbuscular
mycorrhizal fungi (AMF) and non-AMF-inoculated plants. Dependent variables
shoot difference (SDIFF), root difference (RDIFF), and total difference (TDIFF)
were produced by subtracting biomass of non-AMF plants from AMF plants in a
paired-pot glasshouse experiment examining the effects of AMF source and P on
growth of prairie SPP grown in sterilized mine soil. .......................................... 108
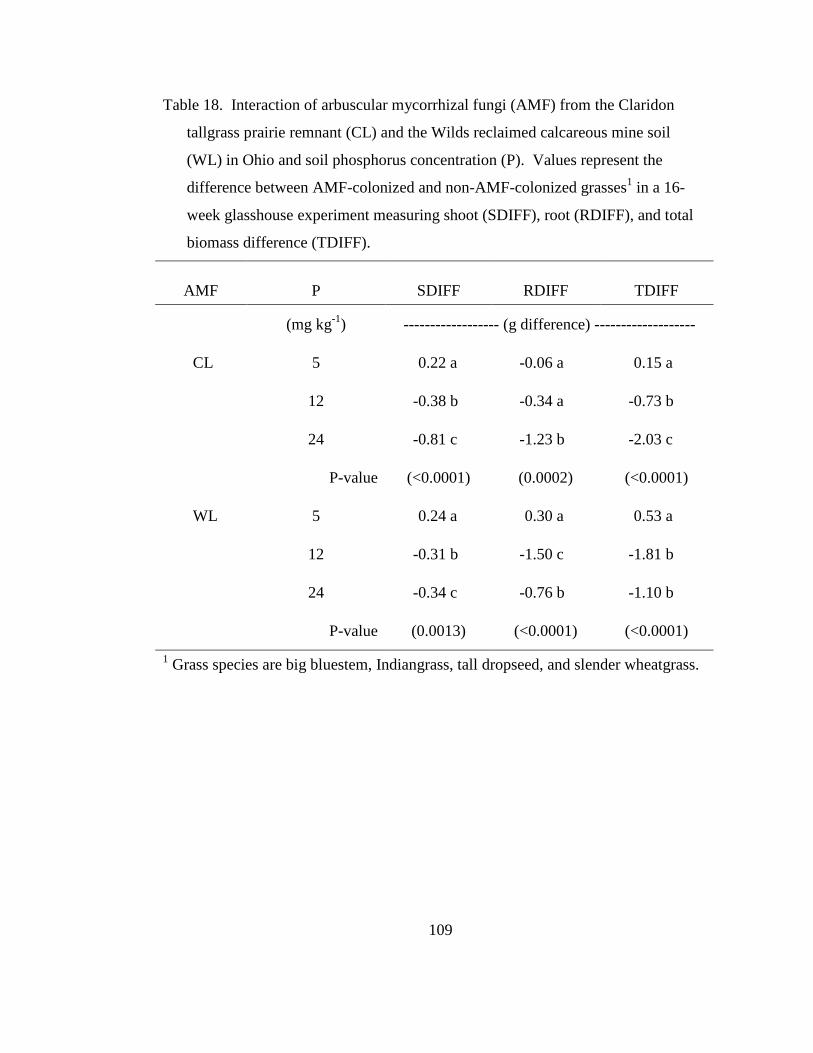
Table 18. Interaction of arbuscular mycorrhizal fungi (AMF) from the Claridon
tallgrass prairie remnant (CL) and the Wilds reclaimed calcareous mine soil (WL)
in Ohio and soil phosphorus concentration (P). Values represent the difference
between AMF-colonized and non-AMF-colonized grasses1 in a 16-week
glasshouse experiment measuring shoot (SDIFF), root (RDIFF), and total biomass
difference (TDIFF) .............................................................................................. 109
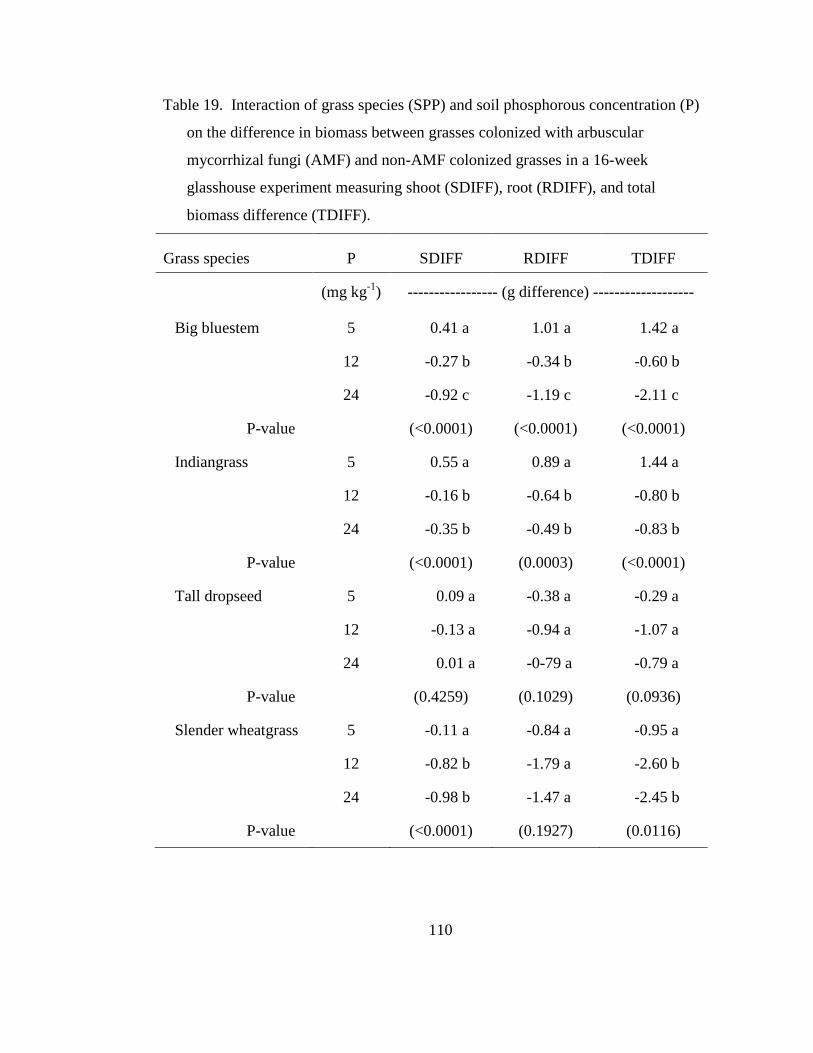
Table 19. Interaction of grass species (SPP) and soil phosphorous concentration (P)
on the difference in biomass between grasses colonized with arbuscular
mycorrhizal fungi (AMF) and non-AMF colonized grasses in a 16-week
glasshouse experiment measuring shoot (SDIFF), root (RDIFF), and total biomass
difference (TDIFF). ............................................................................................. 110
Page 15
xiv
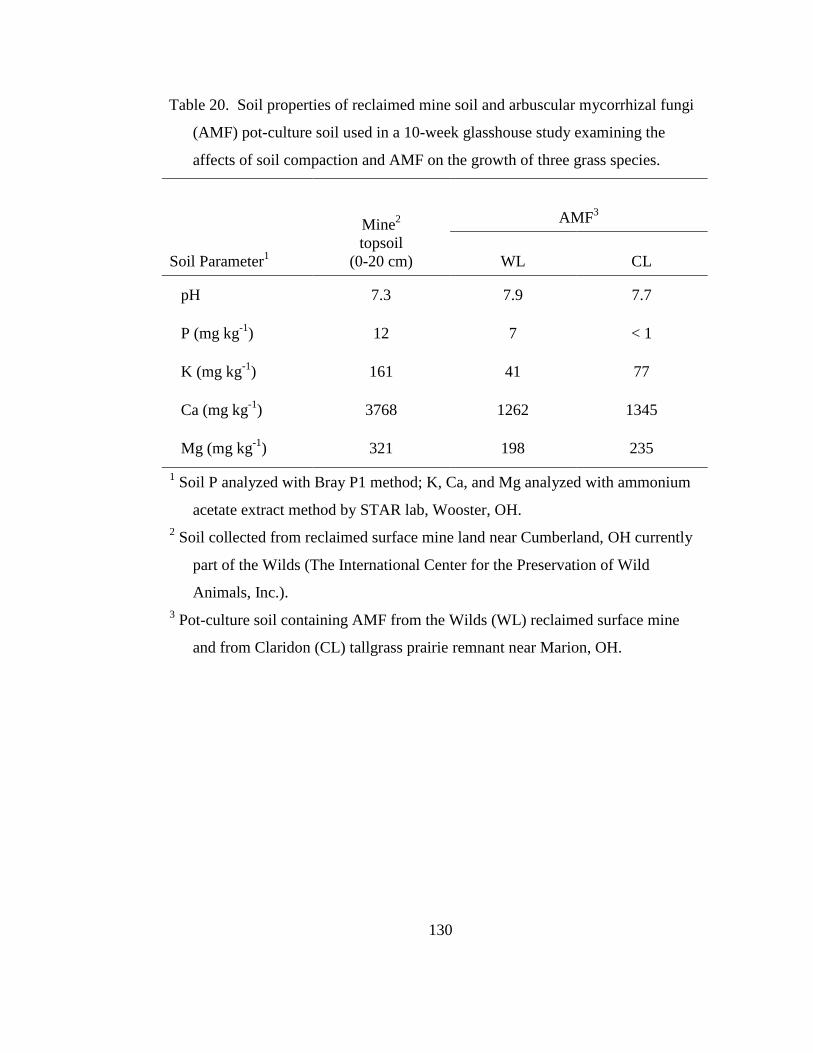
Table 20. Soil properties of reclaimed mine soil and arbuscular mycorrhizal fungi
(AMF) pot-culture soil used in a 10-week glasshouse study examining the
affects of soil compaction and AMF on the growth of three grass species. ....... 130
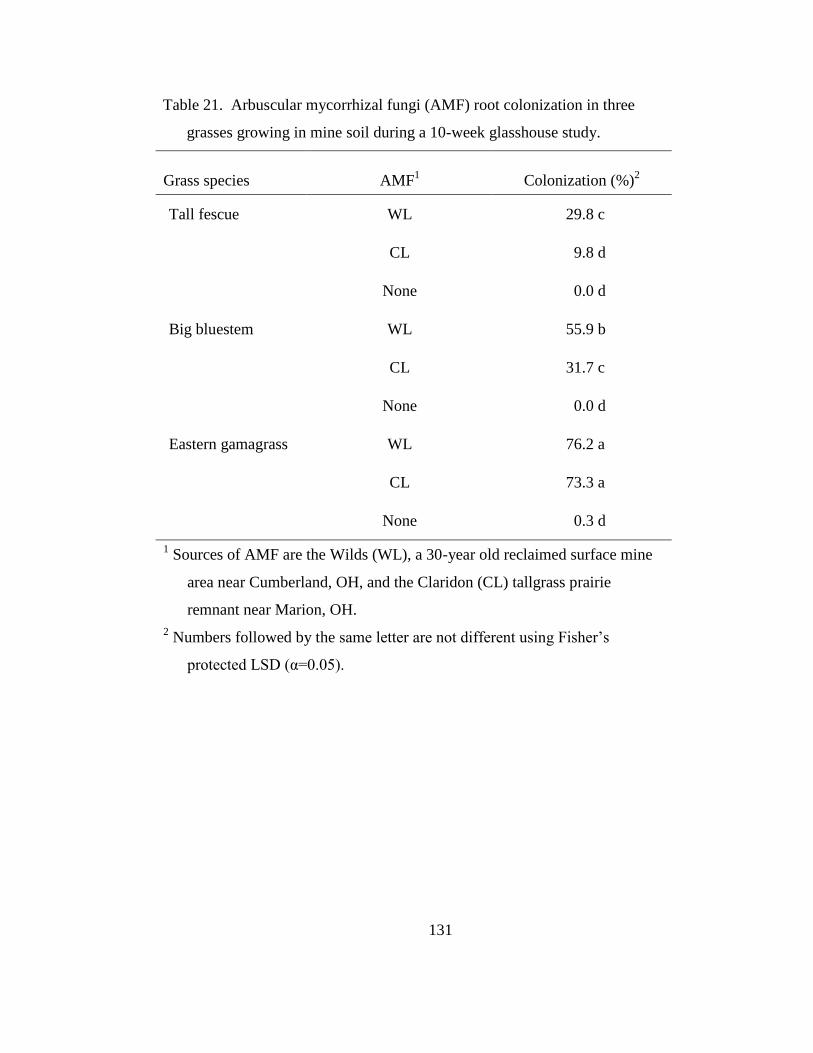
Table 21. Arbuscular mycorrhizal fungi (AMF) root colonization in three grasses
growing in mine soil during a 10-week glasshouse study. ................................. 131
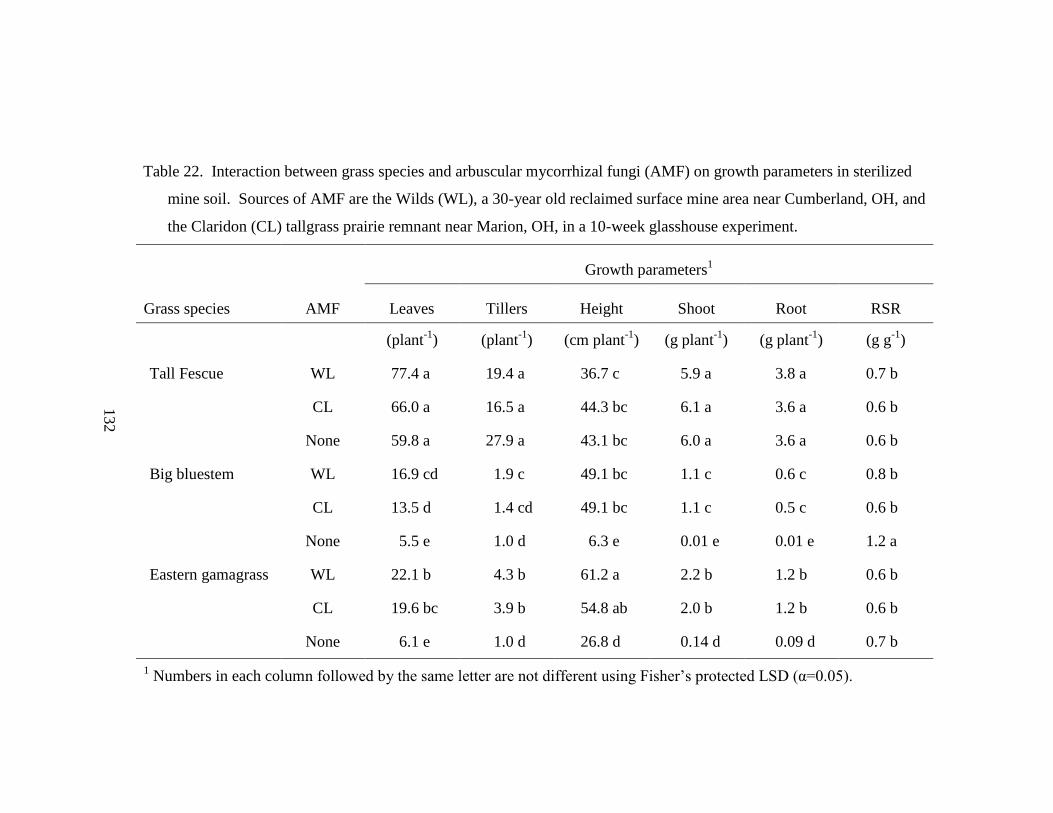
Table 22. Interaction between grass species and arbuscular mycorrhizal fungi (AMF)
on growth parameters in sterilized mine soil. Sources of AMF are the Wilds
(WL), a 30-year old reclaimed surface mine area near Cumberland, OH, and the
Claridon (CL) tallgrass prairie remnant near Marion, OH, in a 10-week
glasshouse experiment. ....................................................................................... 132
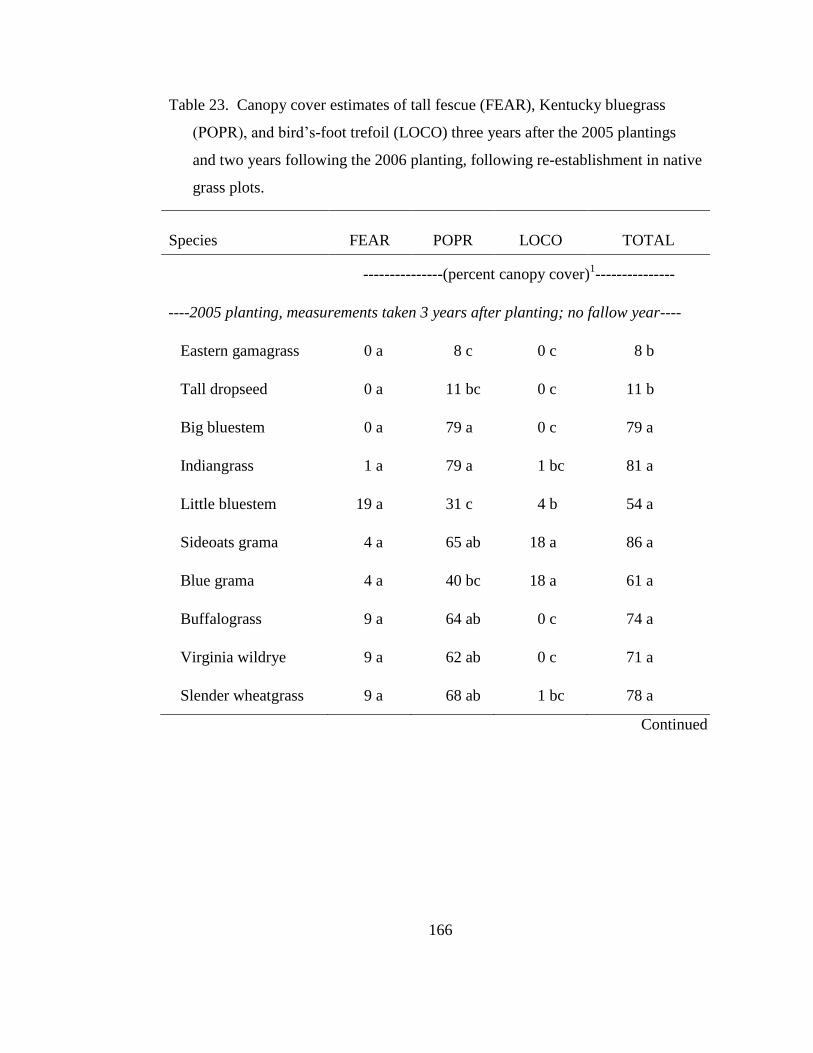
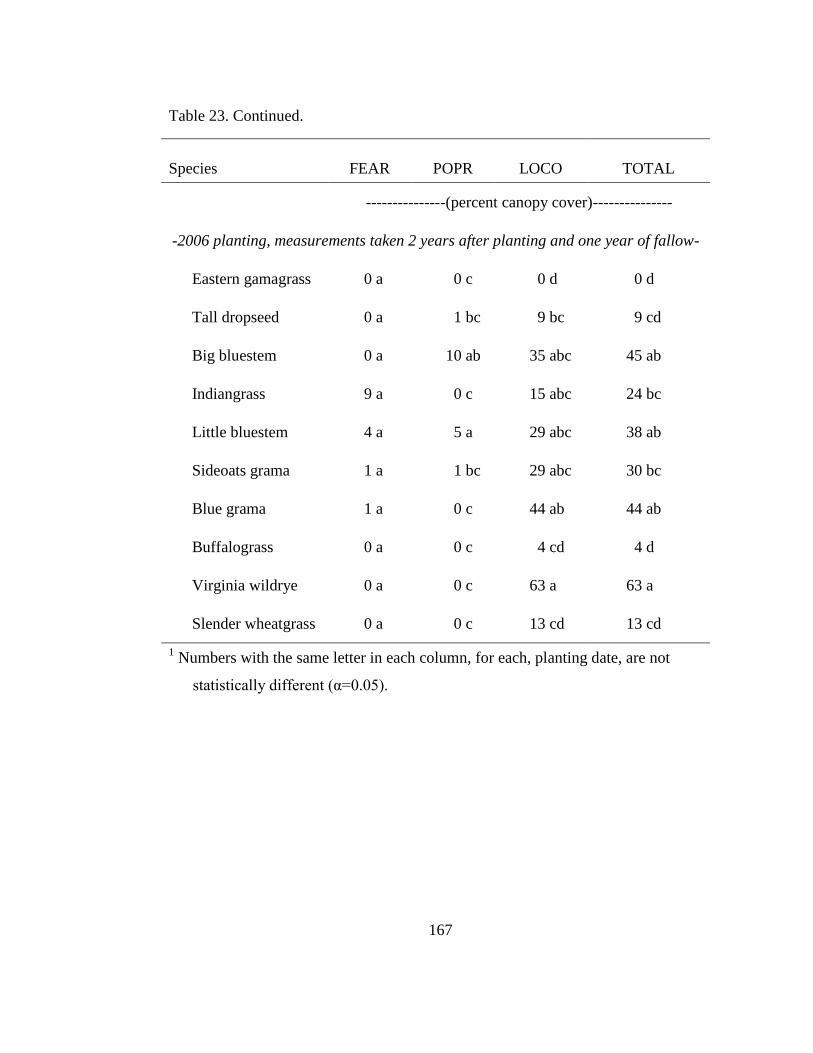
Table 23. Canopy cover estimates of tall fescue (FEAR), Kentucky bluegrass (POPR),
and bird‘s-foot trefoil (LOCO) three years after the 2005 plantings and two years
following the 2006 planting, following re-establishment in native grass plots. . 166
Page 16
xv
List of Figures
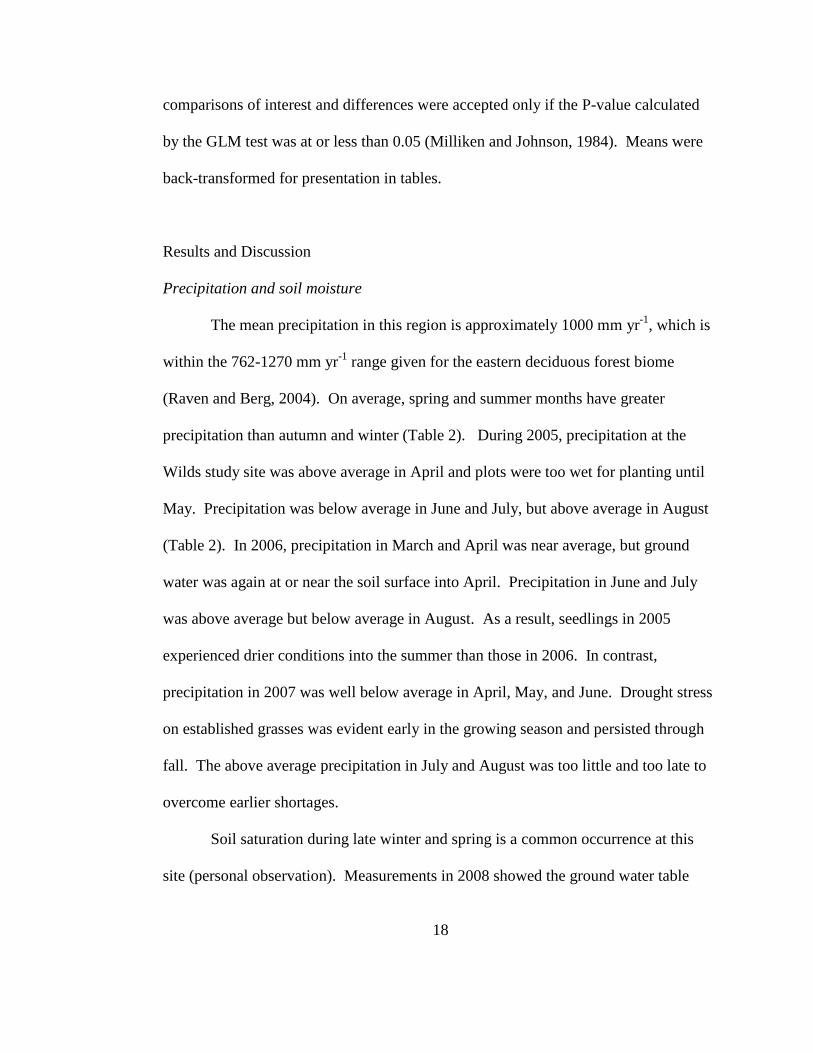
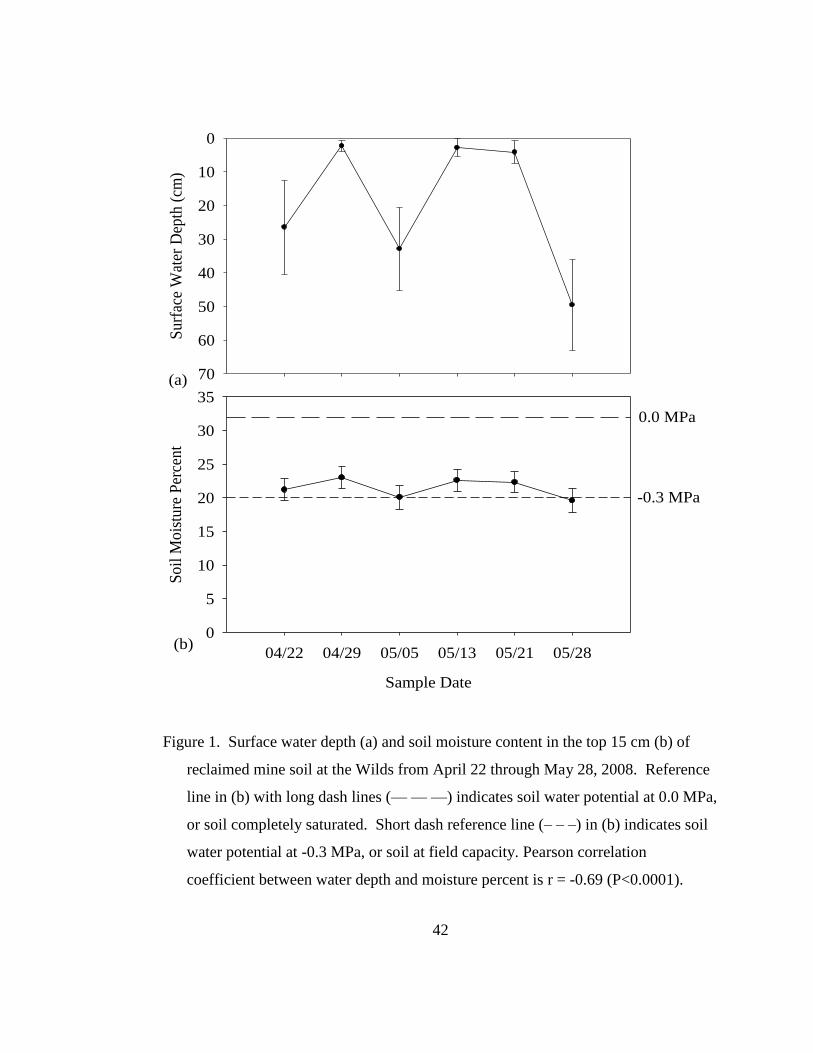
Figure 1. Surface water depth (a) and soil moisture content in the top 15 cm (b) of
reclaimed mine soil at the Wilds study site from April 22 through May 28, 2008.
Reference line in (b) with long dash lines (— — —) indicates soil water potential
at 0.0 MPa, or soil completely saturated. Short dash reference line (– – –) in (b)
indicates soil water potential at -0.3 MPa, or soil at field capacity. Pearson
correlation coefficient between water depth and moisture percent r = -0.69
(P<0.0001). ............................................................................................................ 42
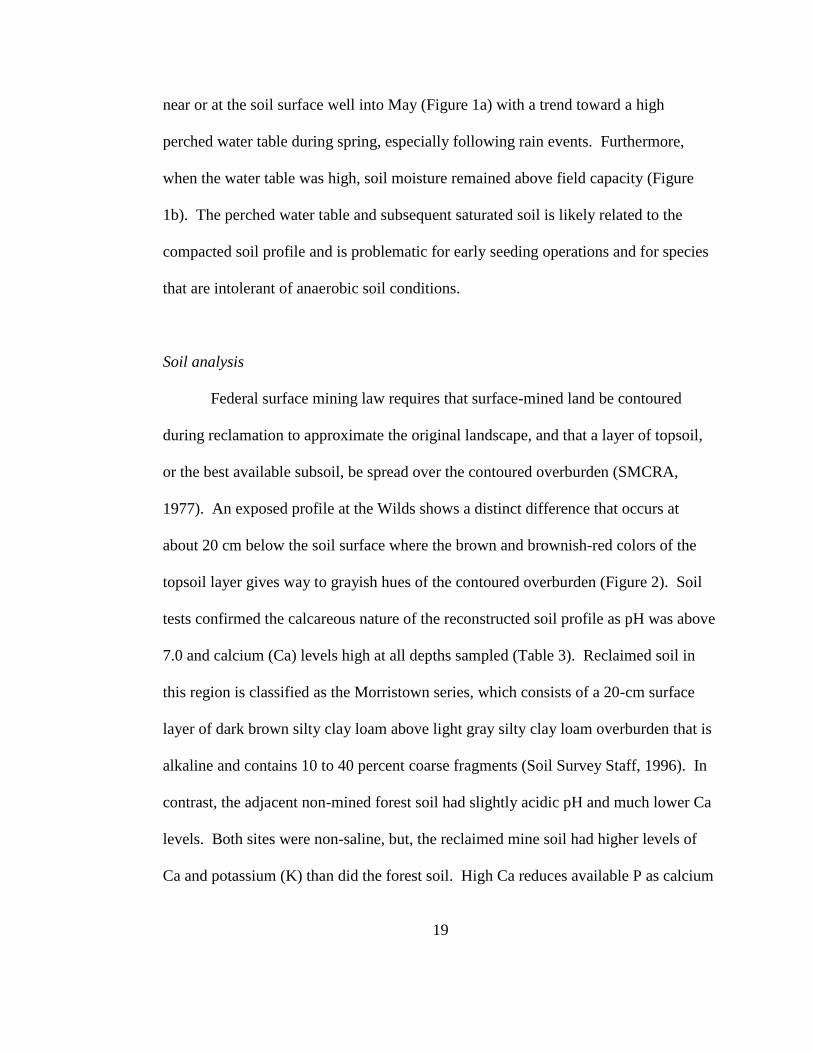
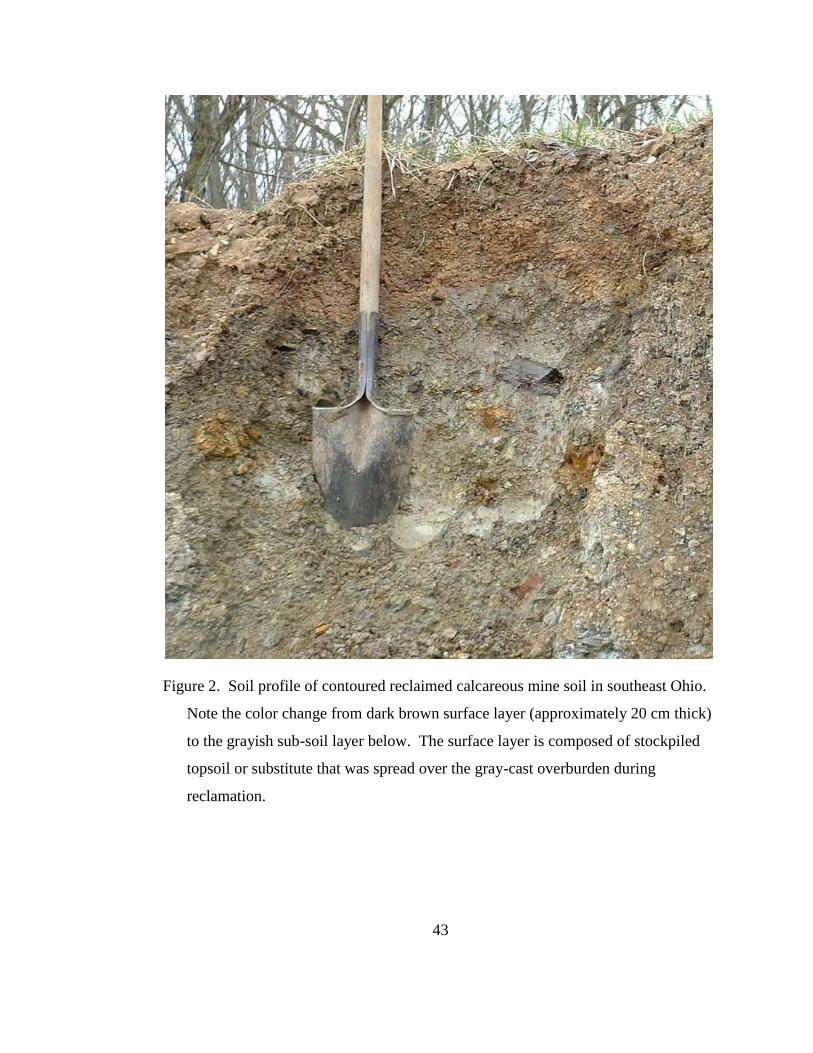
Figure 2. Soil profile of contoured reclaimed calcareous mine soil in southeast Ohio.
Note the color change from dark brown surface layer (approximately 20 cm thick)
to the grayish sub-soil layer below. The surface layer is composed of stockpiled
topsoil or substitute that was spread over the gray-cast overburden during
reclamation. ........................................................................................................... 43
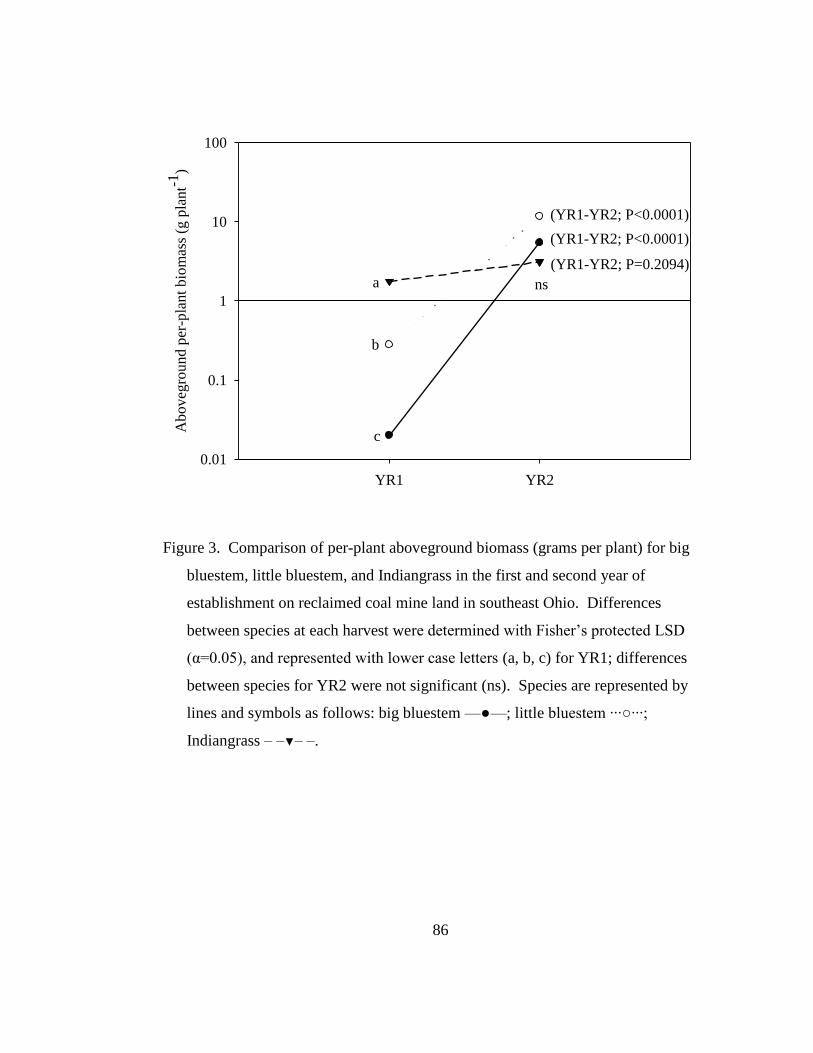
Figure 3. Comparison of per-plant aboveground biomass (grams per plant) for big
bluestem, little bluestem, and Indiangrass in the first and second year of
establishment on reclaimed coal mine land in southeast Ohio. Differences
between species at each harvest were determined with Fisher‘s protected LSD
(α=0.05), and represented with lower case letters (a, b, c) for YR1; differences
between species for YR2 were not significant (ns). Species are represented by
Page 17
xvi
lines and symbols as follows: big bluestem —●—; little bluestem ···○···;
Indiangrass – –▼– –. .............................................................................................. 86
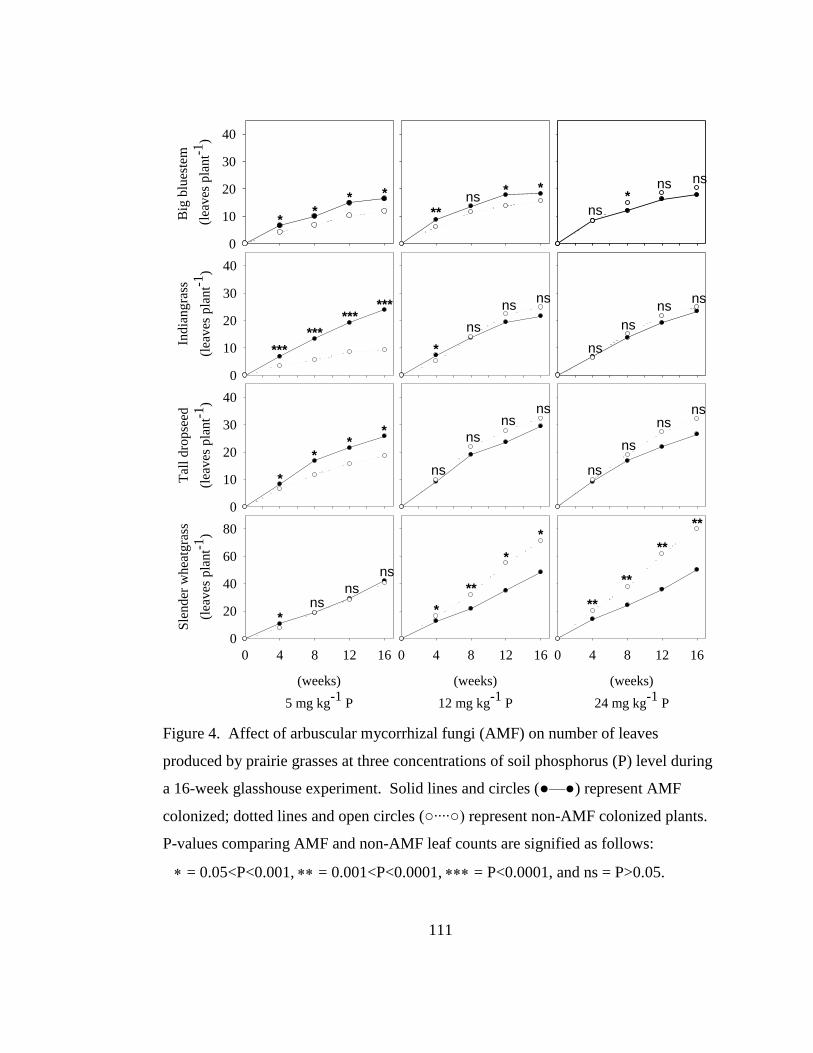
Figure 4. Affect of arbuscular mycorrhizal fungi (AMF) on number of leaves
produced by prairie grasses at three concentrations of soil phosphorus (P) level
during a 16-week glasshouse experiment. Solid lines and circles (●—●) represent
AMF colonized; dotted lines and open circles (○····○) represent non-AMF
colonized plants. P-values comparing AMF and non-AMF leaf counts are
signified as follows: = 0.05<P<0.001, = 0.001<P<0.0001, = P<0.0001,
and ns = P>0.05. .................................................................................................. 111
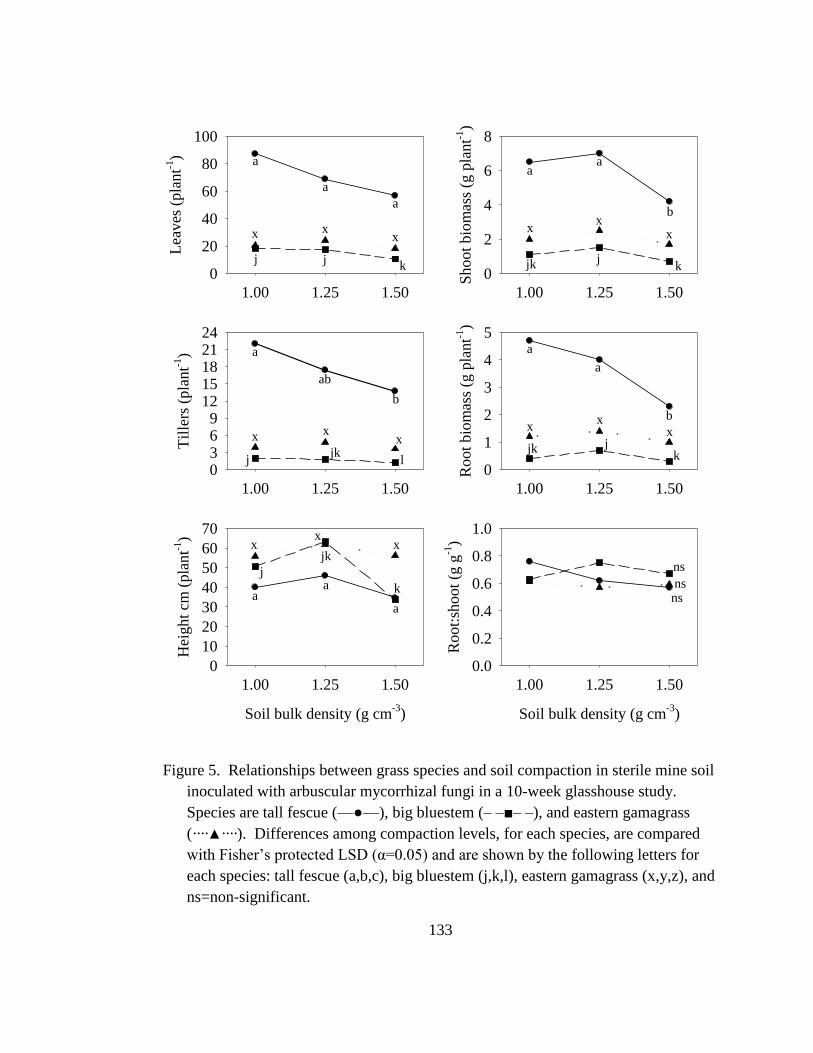
Figure 5. Relationships between grass species and soil compaction in sterile mine soil
inoculated with arbuscular mycorrhizal fungi in a 10-week glasshouse study.
Species are tall fescue (—●—), big bluestem (– –■– –), and eastern gamagrass
(····▲····). Differences among compaction levels, for each species, are compared
with Fisher‘s protected LSD (α=0.05) and are shown by the following letters for
each species: tall fescue (a,b,c), big bluestem (j,k,l), eastern gamagrass (x,y,z),
and ns=non-significant. ....................................................................................... 133
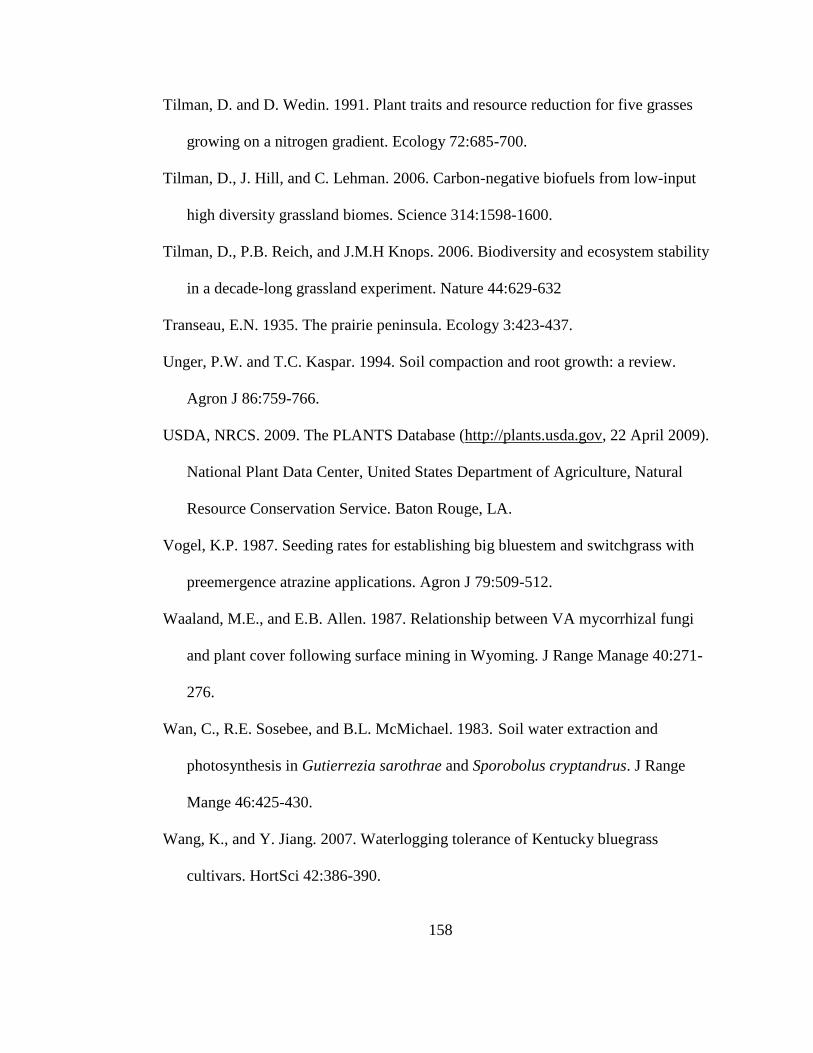
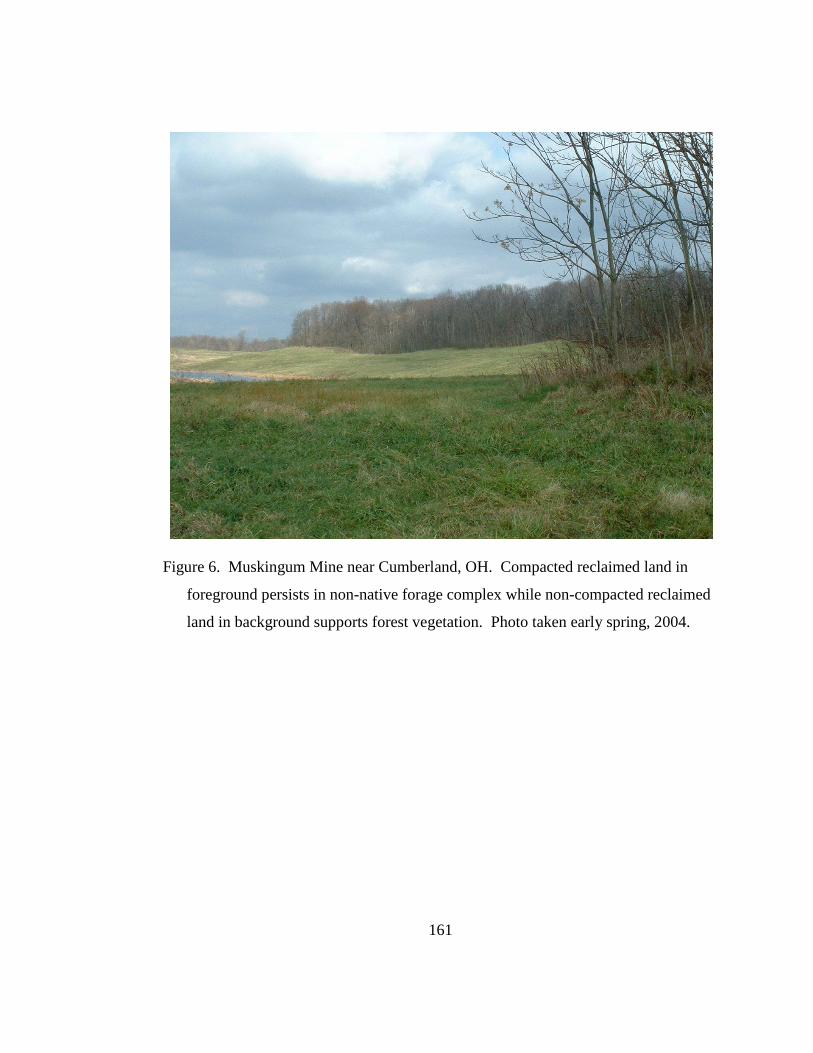
Figure 6. Muskingum Mine near Cumberland, OH. Compacted reclaimed land in
foreground persists in non-native forage complex while non-compacted reclaimed
land in background supports forest vegetation. Photo taken early spring,
2004. .................................................................................................................... 161
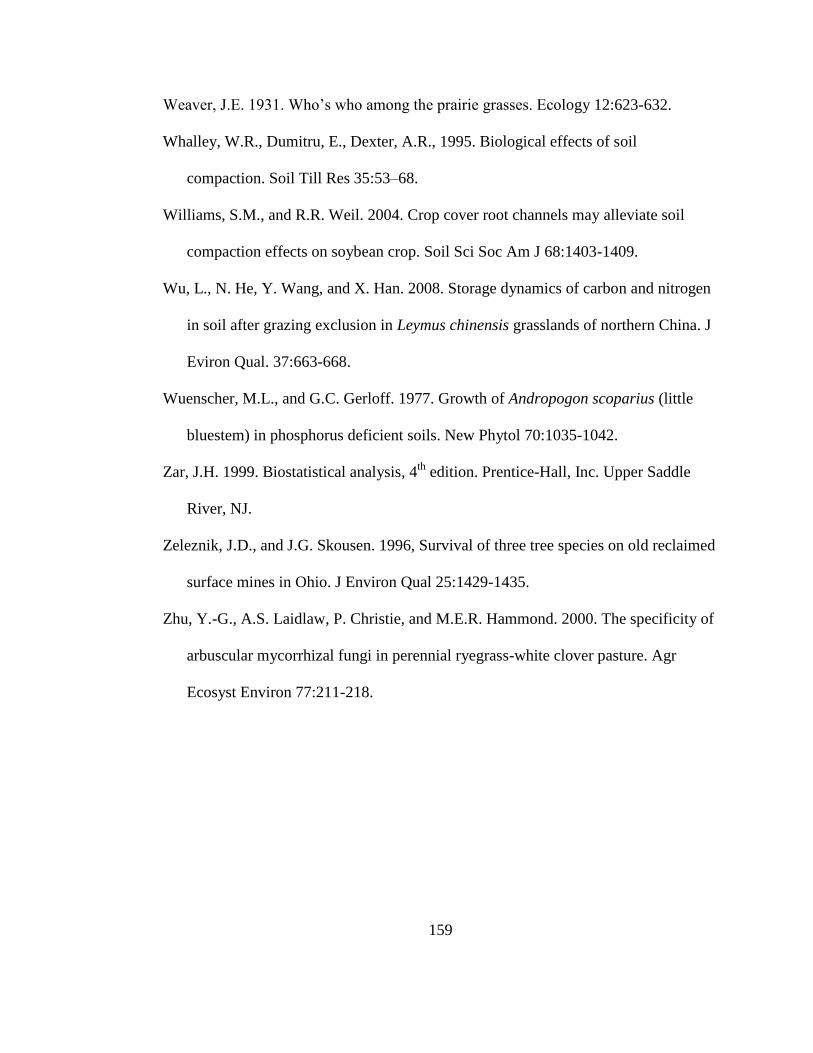
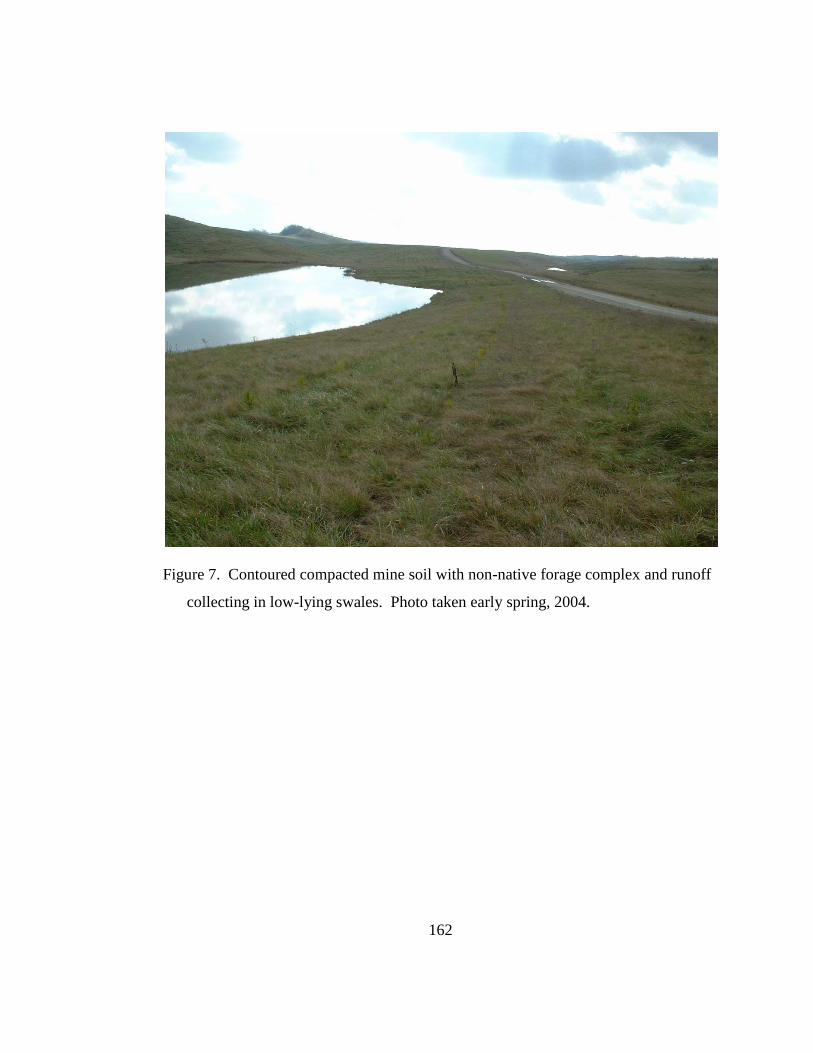
Figure 7. Contoured compacted mine soil with non-native forage complex and
runoff collecting in low-lying swales. Photo taken early spring, 2004. ............. 162
Page 18
xvii
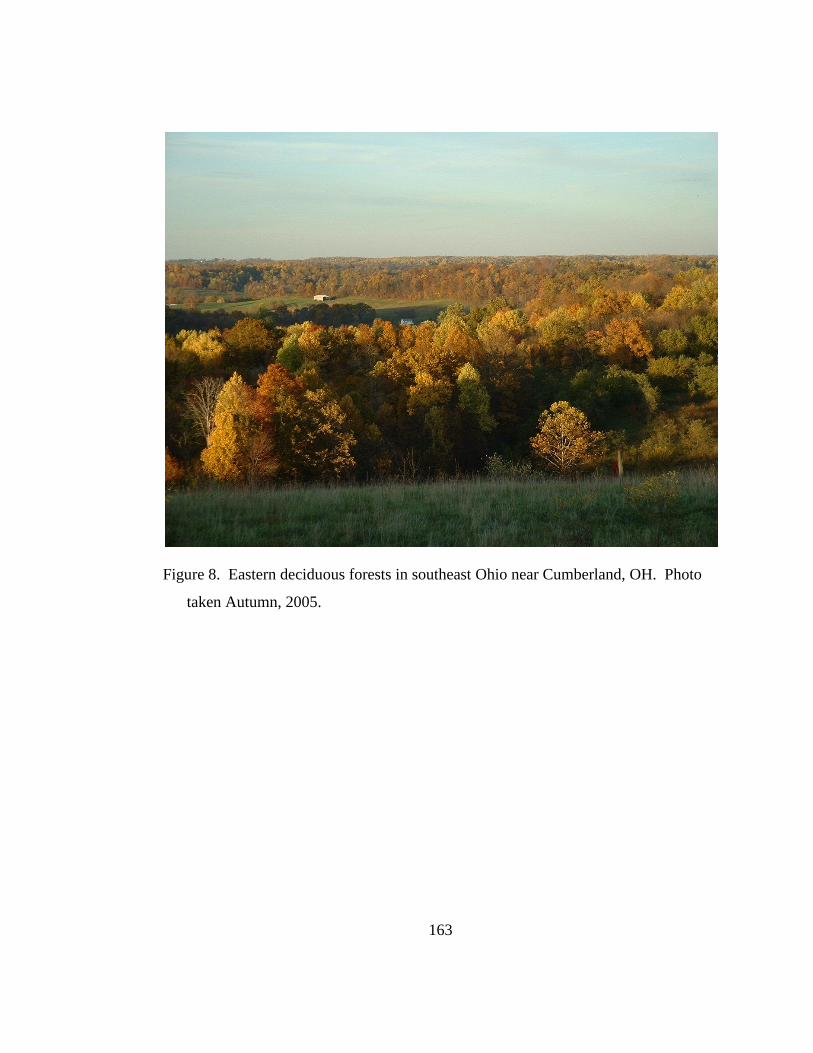
Figure 8. Eastern deciduous forests in southeast Ohio near Cumberland, OH. Photo
taken Autumn, 2005. ........................................................................................... 163
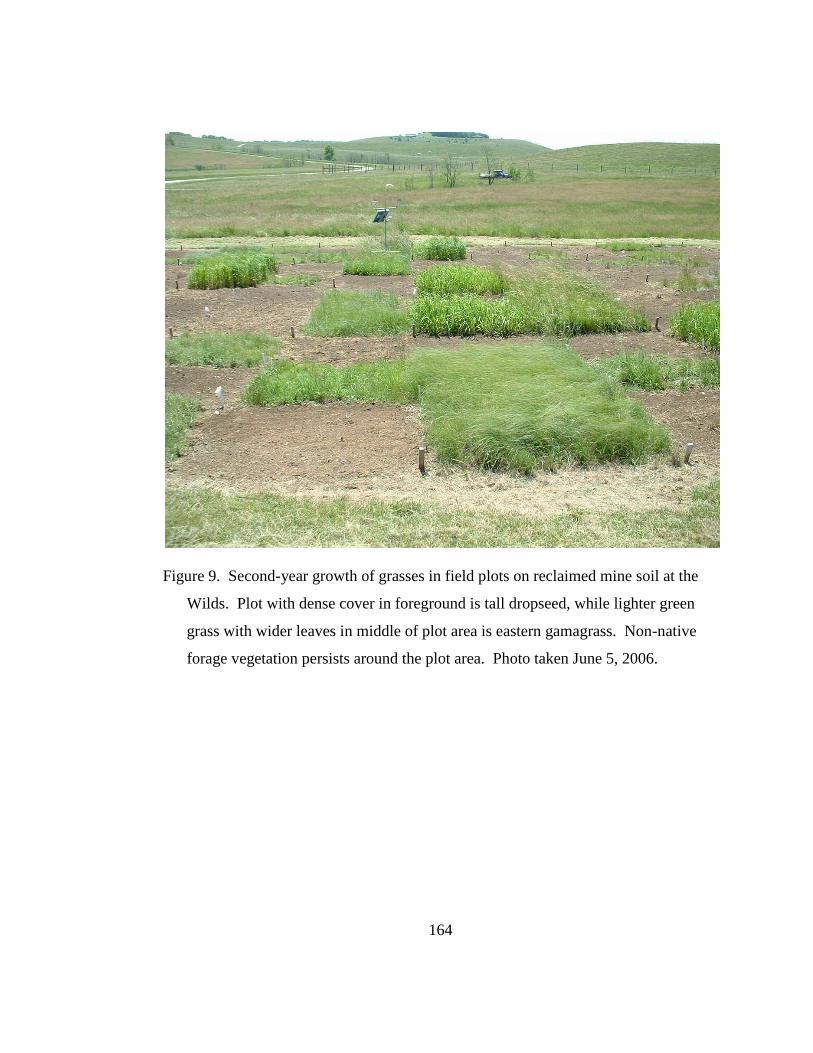
Figure 9. Second-year growth of grasses in field plots on reclaimed mine soil at the
Wilds. Plot with dense cover in foreground is tall dropseed, while lighter green
grass with wider leaves in middle of plot area is eastern gamagrass. Non-native
forage vegetation persists around the plot area. Photo taken June 5, 2006. ....... 164
Page 19
1
Chapter 1: Introduction
Humans have profoundly and negatively affected most natural ecosystems on
the planet, and the expanding demand for natural resources will perpetuate this trend.
In North America alone, diverse prairies and forests have been completely lost, either
replaced by a few species of economic interest, or completely abandoned. The effects
of lost or degraded native ecosystems are seen across the planet as watershed loss
leads to flooding, carbon stored for centuries is released and contributes to global
warming, and species become threatened or extinct as their habitat disappears. To
reverse these trends, humans must become actively involved in restoring damaged
ecosystems to their original integrity. The major problem, however, is that when
ecosystem degradation reaches a specific threshold, complete restoration is unlikely
because original native species may be unable to reestablish, even with attempts to
remediate the disturbed habitat (Ries, 1993). After the point-of-no-return, restoration
efforts must focus on building a new functional ecosystem that will provide positive
ecosystem services and be obtainable (Bradshaw, 1988).
In southeast Ohio, thousands of hectares have been surfaced-mined for coal on
land that once supported vast hardwood forest communities (Kaster and Vimmerstedt,
1996). Restoration of the original forest has not been successful at any level,
Page 20
2
primarily due to extreme soil compaction that occurred during post-mining
reclamation operations. In place of the original forest species, non-native pasture
grasses and legumes were planted and continue to persist as a low-diversity forage
complex (See Appendix A). While this complex does protect the thin layer of topsoil
from eroding, it does not have the functional qualities of either a native prairie or
forest. It is habitat to few animals because of its limited structural diversity, species
planted are relatively shallow rooted and provide little soil development or carbon
storing potential, and low species diversity leaves unfilled niches available for
invasion by non-native invasive plants.
Since restoration of the original forest ecosystem has failed, an alternative
native ecosystem model must be explored. Establishment of a diverse prairie system
would be more desirable than the current forage complex and may help remediate
existing adverse soil conditions. Native prairie ecosystems are diverse, containing
multiple species of grasses and other herbaceous plants, and are noted for their ability
to increase soil quality and support complex faunal communities (Kline, 1997).
Furthermore, diverse prairie ecosystems are excellent sources of biofuel energy and
are more efficient than high-input corn or soybean systems (Tilman, 2006). However,
since reclaimed mined land is not a naturally occurring habitat in Ohio, there is no
historical record of native species suited to this disturbed environment. Therefore,
establishing a diverse ―native‖ prairie ecosystem on reclaimed mine land must be an
inventive process (rather than restorative), in which we select and evaluate species that
can fill niches in this new habitat (Gross, 2003).
Page 21
3
Since grasses are the major component of all prairie systems, they are critical
for prairie establishment on reclaimed mine land. Grasses were responsible for
building the deep, rich soils of the Midwest ―corn-belt‖ and supporting the vast herds
of bison on the American Great Plains. However, grasses that establish on reclaimed
mine land must be able to tolerate adverse soil conditions. Reclaimed mine soils are
highly compacted, which limits nutrient and water uptake and reduces root exploration
(Soil Survey Staff, 1996). Low nutrient status, especially of phosphorus, and loss or
inadequacy of mycorrhizae may also be barriers for establishment. Mycorrhizae are
important symbiotic associations between plant roots and soil fungi where the fungi
transfer phosphorus from the soil to the plants in exchange for plant-synthesized
carbohydrates. Many prairie grasses depend on this symbiosis for survival but it is
unknown if the reclaimed mine land have adequate mycorrhizae to meet this need.
The overall goal of this research is to study North American prairie grass
establishment on calcareous reclaimed mine land in southeast Ohio and explore
mycorrhizae and soil compaction as limitations to establishment in an effort to
develop a diverse prairie ecosystem on this disturbed landscape. To achieve this goal,
separate studies examine the following specific objectives: 1) suitability of North
American prairie grasses on reclaimed mine land, 2) adequacy of mine soil
mycorrhizae for native grass growth, and 3) the relationship between soil compaction
and mycorrhizae on grass establishment and growth.
Page 22
4
Chapter 2: Prairie Grass Establishment on Calcareous Reclaimed Mine Soil.
Abstract
Reclamation of surface mined land in southeast Ohio has created habitats
incapable of supporting native deciduous forest communities. Compaction of
overburden and topsoil restricts plant root and water movement. Limestone in the
overburden produces calcareous soil that is low in available phosphorus. Competition
from non-native forage species inhibits native plant establishment. Replacing the
existing low-diversity forage complex with diverse native prairie communities would
increase ecosystem function; however, a native model for reclaimed mine land prairies
does not exist. Fifteen grasses native to grasslands across North America were planted
on reclaimed mine land in southeast Ohio. Seeds were incorporated into bare soil
during May 2005 and 2006. Population density was assessed at 30 days after planting
and in October of 2005 through 2007. Eastern gamagrass, tall dropseed, buffalograss,
and slender wheatgrass were most successful in the first year of establishment. Big
bluestem, little bluestem, and Indiangrass had the least emergence, although
Indiangrass was more successful in 2006. Eastern gamagrass, tall dropseed, and big
bluestem maintained their population density throughout the study period while
Western wheatgrass had the greatest increase. Big bluestem and little bluestem
Page 23
5
established poorly, but maintained their population density through the study period.
Blue grama and sideoats grama declined following the first year. Arid-land grasses
Snake River wheatgrass and Sandberg‘s bluegrass failed to establish. Species most
successful were able to tolerate compacted calcareous mine soil that was seasonally
saturated during spring and sometimes droughty during summer. Species that
established well in this research represented species that either diminish the effect of
soil compaction by rooting through the compacted layers, or, that avoid the
compaction by rooting shallow and tolerating any water stress that occurs.
Keywords: Calcareous reclaimed mine soil, native grasses, disturbed land, ecosystem
restoration, grass establishment, southeast Ohio.
Introduction
The loss of ecological memory and resilience occurs as habitats are severely
disturbed and are unable to recover naturally (Nyström and Folke, 2001; Schaefer,
2009). This is often the scenario with human-manipulated terrestrial systems and can
occur when sources of reproductive material are lost or replaced by invasive species,
or when physical changes in the habitat keep native species from reestablishing. As a
result, newly developing communities will likely have different ecological trajectories
and resulting physiognomy, and may not be able to reach the level of functioning as
the original ecosystem (Seaman, 2007; Dodds, et al. 2008). Consequently, the
challenge for restoration ecologists and land managers is to accurately assess the level
Page 24
6
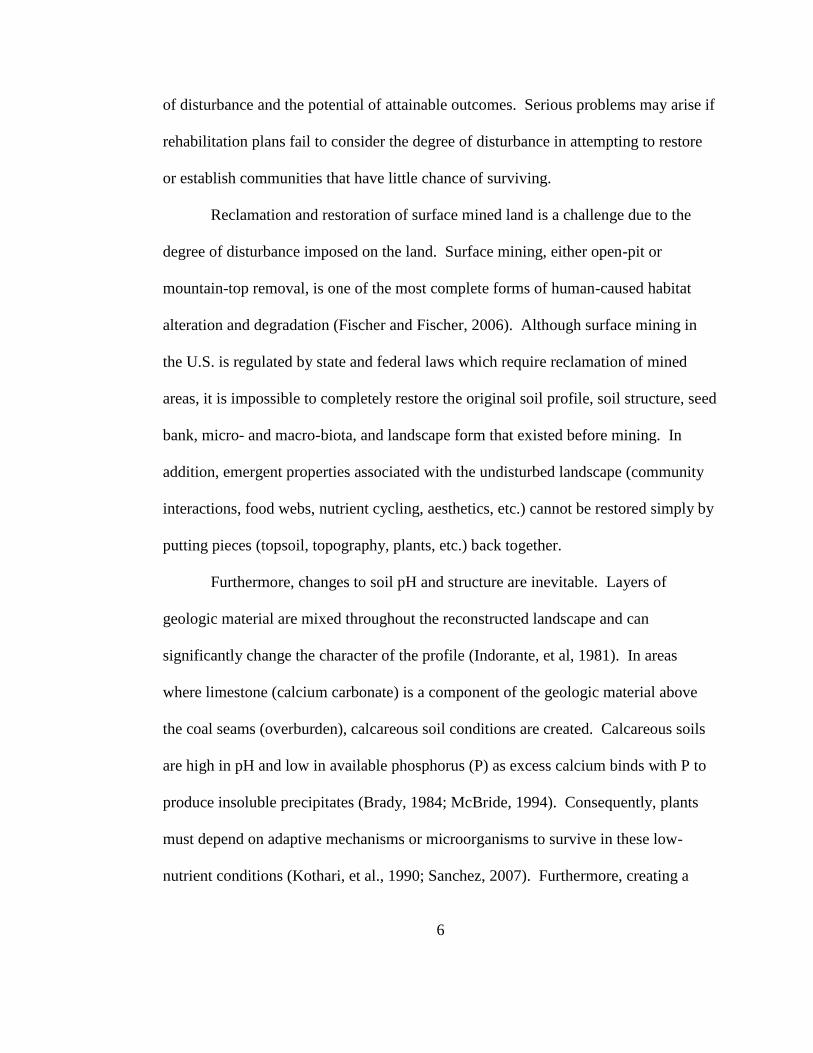
of disturbance and the potential of attainable outcomes. Serious problems may arise if
rehabilitation plans fail to consider the degree of disturbance in attempting to restore
or establish communities that have little chance of surviving.
Reclamation and restoration of surface mined land is a challenge due to the
degree of disturbance imposed on the land. Surface mining, either open-pit or
mountain-top removal, is one of the most complete forms of human-caused habitat
alteration and degradation (Fischer and Fischer, 2006). Although surface mining in
the U.S. is regulated by state and federal laws which require reclamation of mined
areas, it is impossible to completely restore the original soil profile, soil structure, seed
bank, micro- and macro-biota, and landscape form that existed before mining. In
addition, emergent properties associated with the undisturbed landscape (community
interactions, food webs, nutrient cycling, aesthetics, etc.) cannot be restored simply by
putting pieces (topsoil, topography, plants, etc.) back together.
Furthermore, changes to soil pH and structure are inevitable. Layers of
geologic material are mixed throughout the reconstructed landscape and can
significantly change the character of the profile (Indorante, et al, 1981). In areas
where limestone (calcium carbonate) is a component of the geologic material above
the coal seams (overburden), calcareous soil conditions are created. Calcareous soils
are high in pH and low in available phosphorus (P) as excess calcium binds with P to
produce insoluble precipitates (Brady, 1984; McBride, 1994). Consequently, plants
must depend on adaptive mechanisms or microorganisms to survive in these low-
nutrient conditions (Kothari, et al., 1990; Sanchez, 2007). Furthermore, creating a
Page 25
7
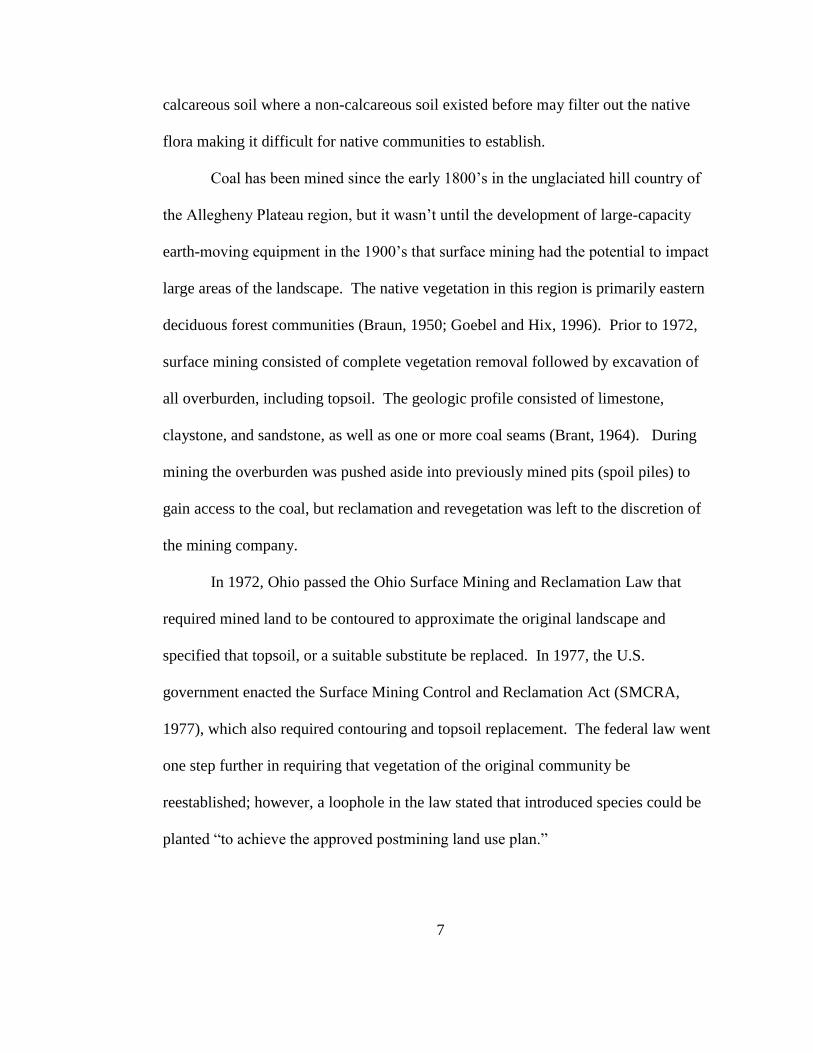
calcareous soil where a non-calcareous soil existed before may filter out the native
flora making it difficult for native communities to establish.
Coal has been mined since the early 1800‘s in the unglaciated hill country of
the Allegheny Plateau region, but it wasn‘t until the development of large-capacity
earth-moving equipment in the 1900‘s that surface mining had the potential to impact
large areas of the landscape. The native vegetation in this region is primarily eastern
deciduous forest communities (Braun, 1950; Goebel and Hix, 1996). Prior to 1972,
surface mining consisted of complete vegetation removal followed by excavation of
all overburden, including topsoil. The geologic profile consisted of limestone,
claystone, and sandstone, as well as one or more coal seams (Brant, 1964). During
mining the overburden was pushed aside into previously mined pits (spoil piles) to
gain access to the coal, but reclamation and revegetation was left to the discretion of
the mining company.
In 1972, Ohio passed the Ohio Surface Mining and Reclamation Law that
required mined land to be contoured to approximate the original landscape and
specified that topsoil, or a suitable substitute be replaced. In 1977, the U.S.
government enacted the Surface Mining Control and Reclamation Act (SMCRA,
1977), which also required contouring and topsoil replacement. The federal law went
one step further in requiring that vegetation of the original community be
reestablished; however, a loophole in the law stated that introduced species could be
planted ―to achieve the approved postmining land use plan.‖
Page 26
8
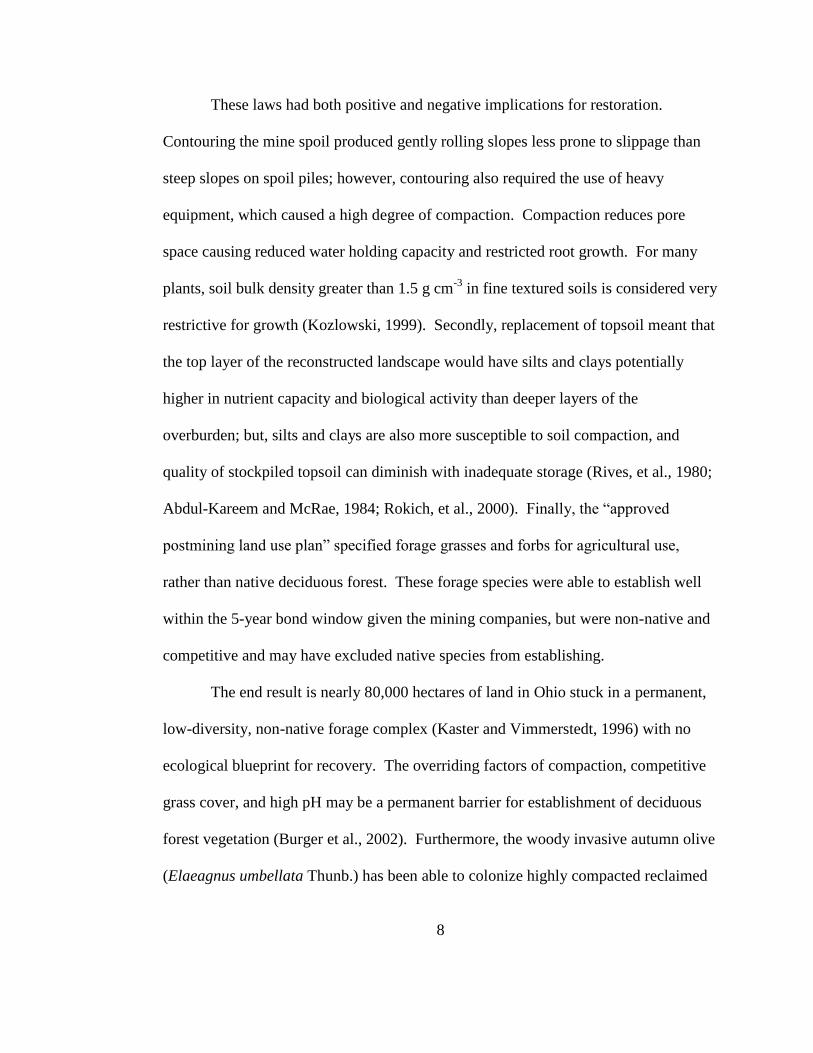
These laws had both positive and negative implications for restoration.
Contouring the mine spoil produced gently rolling slopes less prone to slippage than
steep slopes on spoil piles; however, contouring also required the use of heavy
equipment, which caused a high degree of compaction. Compaction reduces pore
space causing reduced water holding capacity and restricted root growth. For many
plants, soil bulk density greater than 1.5 g cm-3
in fine textured soils is considered very
restrictive for growth (Kozlowski, 1999). Secondly, replacement of topsoil meant that
the top layer of the reconstructed landscape would have silts and clays potentially
higher in nutrient capacity and biological activity than deeper layers of the
overburden; but, silts and clays are also more susceptible to soil compaction, and
quality of stockpiled topsoil can diminish with inadequate storage (Rives, et al., 1980;
Abdul-Kareem and McRae, 1984; Rokich, et al., 2000). Finally, the ―approved
postmining land use plan‖ specified forage grasses and forbs for agricultural use,
rather than native deciduous forest. These forage species were able to establish well
within the 5-year bond window given the mining companies, but were non-native and
competitive and may have excluded native species from establishing.
The end result is nearly 80,000 hectares of land in Ohio stuck in a permanent,
low-diversity, non-native forage complex (Kaster and Vimmerstedt, 1996) with no
ecological blueprint for recovery. The overriding factors of compaction, competitive
grass cover, and high pH may be a permanent barrier for establishment of deciduous
forest vegetation (Burger et al., 2002). Furthermore, the woody invasive autumn olive
(Elaeagnus umbellata Thunb.) has been able to colonize highly compacted reclaimed
Page 27
9
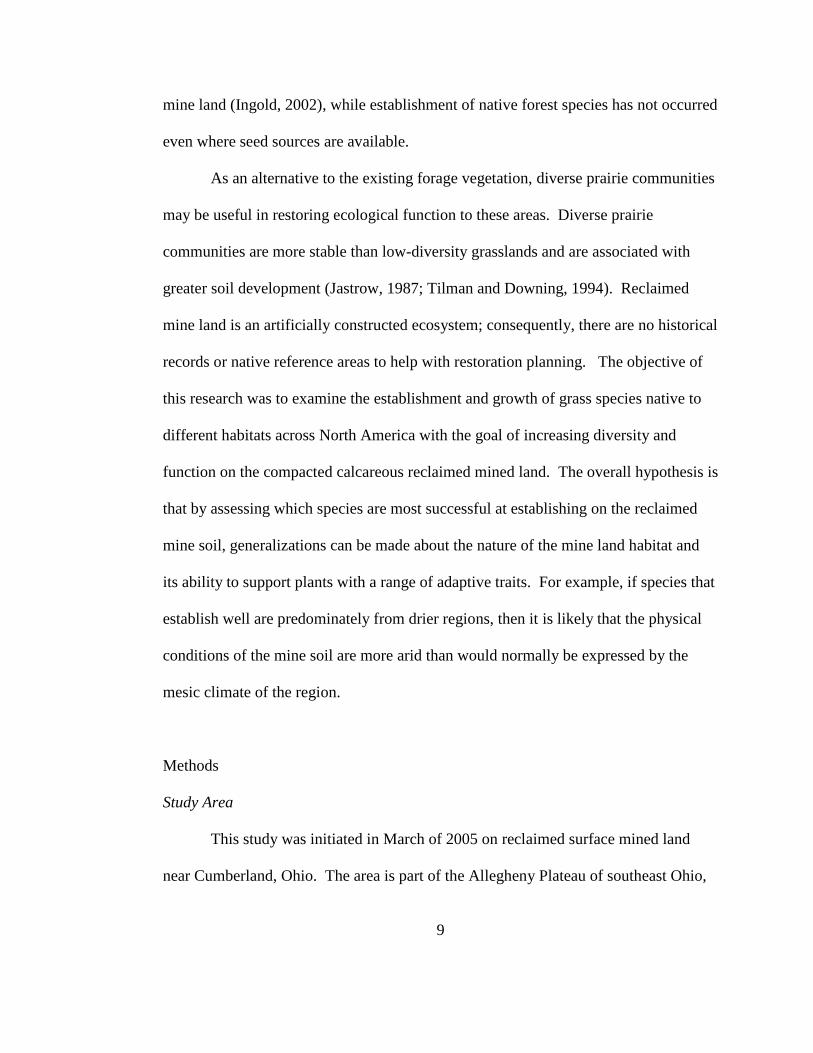
mine land (Ingold, 2002), while establishment of native forest species has not occurred
even where seed sources are available.
As an alternative to the existing forage vegetation, diverse prairie communities
may be useful in restoring ecological function to these areas. Diverse prairie
communities are more stable than low-diversity grasslands and are associated with
greater soil development (Jastrow, 1987; Tilman and Downing, 1994). Reclaimed
mine land is an artificially constructed ecosystem; consequently, there are no historical
records or native reference areas to help with restoration planning. The objective of
this research was to examine the establishment and growth of grass species native to
different habitats across North America with the goal of increasing diversity and
function on the compacted calcareous reclaimed mined land. The overall hypothesis is
that by assessing which species are most successful at establishing on the reclaimed
mine soil, generalizations can be made about the nature of the mine land habitat and
its ability to support plants with a range of adaptive traits. For example, if species that
establish well are predominately from drier regions, then it is likely that the physical
conditions of the mine soil are more arid than would normally be expressed by the
mesic climate of the region.
Methods
Study Area
This study was initiated in March of 2005 on reclaimed surface mined land
near Cumberland, Ohio. The area is part of the Allegheny Plateau of southeast Ohio,
Page 28
10
which extends westward from the Allegheny Mountains and is a subdivision of the
Appalachian Mountain Range. The landscape is unglaciated rolling hills with
deciduous forest communities dominated by Quercus, Acer, Fagus, and Carya species
(Braun, 1950). Much of the land had been cleared for agricultural purposes beginning
in the 1800‘s; therefore, the existing forests are in various stages of regeneration
following decline of agricultural use in the 1900‘s.
The study site is located on land that had been mined in the early 1980‘s, and
was once part of the Muskingum Mine, then owned and mined by Central Ohio Coal
Company, a subsidiary of American Electric Power Company, Columbus, OH. All
overburden was removed above the coal seams during mining and was piled in
previously mined areas. As required by law, the mine spoil was then contoured to
approximate the original ―rolling hill‖ landscape and then covered with stockpiled
topsoil or substitute material approximately 20 cm deep. A mix of non-native forage
grasses and legumes were seeded to establish a vegetation ground cover.
It is unknown exactly what species were planted during reclamation, but a
survey of vegetation at the study site in 2005 included tall fescue, Kentucky bluegrass,
and bird‘s-foot trefoil (Table 1). Other forage species found nearby included smooth
brome (Bromus inermis Leyss.) and meadow foxtail (Alopecurus pratensis L.). Non-
forage species included Canada thistle (Cirsium arvense (L.) Scop.), an introduced
weedy species, common milkweed (Asclepias syriaca L.), a native perennial forb, and
autumn olive, an invasive woody species.
Page 29
11
Plot establishment
The area of interest is located on a 37-km-2
portion of the Muskingum Mine
donated by the Central Ohio Coal Company in 1986 to The International Center for
the Preservation of Wild Animals, Inc. (the Wilds). To this day, this land is managed
by the Wilds for conservation and educational purposes. Plots were set up in April
2005 near the base of a southwest facing slope on a reclaimed spoil ridge. The overall
plot area measured 32x24 m and consisted of four blocks each containing 16 2x6-m
plots. The experimental design was a randomized complete-block with four
replications for each planting. Each plot was further subdivided into three 2-m2
subplots to facilitate plantings in both 2005 and 2006. In April 2005, dead material
and debris was raked off the plot area to expose growing grass. All existing
vegetation was then killed using glyphosate herbicide at a rate of 4.6 kg active
ingredient (a.i.) ha-1
. Four check plots containing the existing forage complex were
left un-sprayed. In accordance with label recommendations, NH4SO4 was added to the
spray mix at a rate of 20 g l-1
to aid movement of the herbicide into the plant. On May
7, 2005, the dying plant material was mowed with a rotary lawn mower. Thatch and
surface soil were loosened with a Bluebird® power dethatcher, and the remaining
plant debris was raked off the plot area by hand. To loosen the soil for planting, plots
were raked with a heavy steel-tined rake to a depth of approximately 2-3 cm.
Page 30
12
Species selection and seeding
Grass species selected for this study are native to North American grassland
ecosystems (Hitchcock, 1971; Stubbendieck et al., 1986; Klips, 2004); however, each
species has its own preferred habitat where it is more likely to be a dominant or
prominent component of the community (Table 1). Selection areas include the
tallgrass prairies of the Midwest and eastern North America, mixed and short-grass
prairies of the Great Plains region, and species from the intermountain-west shrub
steppe. These grassland ecosystems represent a moisture gradient across North
America from mesic to arid as follows: tallgrass>mixed-grass>short-grass>shrub
steppe.
Warm-season tallgrass prairie species were eastern gamagrass (Tripsacum
dactyloides L.), big bluestem (Andropogon gerardii Vitman), tall dropseed
(Sporobolus asper (Michx.) Kunth), Indiangrass (Sorghastrum nutans (L.) Nash), and
sideoats grama (Bouteloua curtipendula (Michx.) A. Gray). Cool-season grasses
primarily associated with tallgrass prairie were Virginia wildrye (Elymus virginicus
L.) and slender wheatgrass (Elymus trachycaulus (Link) Gould ex Shinners); however,
slender wheatgrass is also found abundantly in the northern Great Plains. Warm-
season grasses primarily associated with mixed- and short-grass prairies were little
bluestem (Schizachyrium scoparium (Michx.) Nash), blue grama (Bouteloua gracilis
(Willd. Ex Kunth) Lag. Ex Griffiths), and buffalograss (Buchloe dactyloides (Nutt.)
Engelm). Cool-season grasses in the mixed- and short-grass regions were western
wheatgrass (Pascopyrum smithii (Rydb.) A. Löve), green needlegrass (Stipa viridula
Page 31
13
Trin.), and prairie Junegrass (Koeleria macrantha (Ledeb.) J.A. Schultes); however,
prairie Junegrass also occurs frequently in western grasslands. Cool-season grasses
primarily associated with the shrub-steppe of the intermountain west include and
Sandberg bluegrass (Poa secunda J. Presl) and Snake River wheatgrass (Elymus
wawawaiensis J. Carlson & Barkworth). (Table 1).
Seeds for all species except eastern gamagrass were hand-broadcasted into
their respective plots, 1 m2 at a time. After broadcasting, seeds were incorporated into
the loose soil to a depth of 2 cm with a steel-tined rake. Eastern gamagrass seeds were
individually planted to a depth of 1-2 cm. Buffalograss burs that remained on the
surface were pushed into the soil by hand. For both eastern gamagrass and
buffalograss, the seed/burs were difficult to cover by raking alone because of their
large size. Once seeds were sown, the seedbed was firmed up using foot pressure.
Planting in both years occurred during May when the soil was dry enough to loosen
with a rake and get seeds incorporated.
All seeds, except tall dropseed, eastern gamagrass, Sandberg bluegrass, and
Snake River wheatgrass were purchased from Western Native Seeds, Coaldale, CO
USA. Tall dropseed was purchased from Oak Prairie Farm, Pardeeville, WI USA.
Eastern gamagrass was purchased from the Gamagrass Seed Company, Falls City, NE
USA. Sandberg bluegrass and Snake River wheatgrass seed were purchased from
Grassland West Co., Clarkston, WA USA.
Page 32
14
Plot Management
Following seeding, supplemental irrigation of 15 mm was applied on June 27
and August 9, 2005 as soil surface was drying and cracking. In 2006, supplemental
irrigation of 7 and 5 mm was applied on May 25 and 29, respectively, to moisten soil
that had lightly crusted following a recent rain. Irrigation was only applied as an aid
and would likely not have been needed in 2005 if precipitation would have followed
average patterns, or in either year if seeds had been drilled into the soil instead of
broadcasted and raked (Diboll, 1997).
On August 23, 2005, a dense stand of Canada thistle growing in all plots was
sprayed with mix of 2,4-D amine, mecoprop, dicamba, and sulfetrazone herbicides at
rates of 0.8 kg, 0.28 kg, 0.08 kg acid equivalent (a.e.), and 0.03kg a.i. ha-1
,
respectively. This was a delayed application so that newly seeded grasses had
sufficient growth, at least 5 leaves, to escape injury from the herbicides. Application
was made with a CO2-pressurized backpack sprayer and a 4-nozzle spray wand
applying 140 l spray mix ha-1
.
Prior to the 2006 plantings, plots were sprayed with glyphosate herbicide on
May 2 at a concentration of 20 g a.i. l-1
. On June 5, 2006, Canada thistle growing in
the 2005-planted plots was sprayed with clopyralid herbicide at a concentration of 7.2
g a.e. l-1
. In both applications, leaves were thoroughly covered with spray solution
using a Solo® backpack sprayer and hand-held single-nozzle wand.
On June 26 2007, Canada thistle and other dicotyledonous weeds were sprayed
in all plots with tryclopyr herbicide at an application rate of 1.0 kg a.e. ha-1
. At the
Page 33
15
same time, witchgrass (Panicum capillare L.) seedlings in the cool-season grass plots
were sprayed with fenoxyprop herbicide at a rate of 0.22 kg a.i. ha-1
. Witchgrass
seedlings in the warm-season grass plots were sprayed with sulfometuron methyl
herbicide at a rate of 0.02 kg a.i. ha-1
. Fenoxyprop is effective at selective controlling
annual warm-season grass seedlings growing in cool-season perennial grass stands,
while sulfometuron methyl at low rates is effective at controlling annual warm-season
grasses in perennial warm-season grass stands without causing injury to the perennial
grasses at the applied rates (Peters et al., 1989).
To eliminate the effect of canopy shading, the plot area was mowed after each
year‘s growth when warm-season grasses were dormant, leaving a stubble height of
10-15 cm.
Population measurements
Population densities were counted at 30 days after planting (30DAP) to assess
early establishment following the 2005 and 2006 plantings, and then during October of
2005, 2006, and 2007 to measure change in populations over time. Counts were made
within a 1-m2 frame placed in the center of each 2x2-m subplot to avoid border effect.
In plots with dense and even populations, counting was limited to 0.25-m2 and
adjusted up to a 1-m2 basis. For buffalograss and western wheatgrass, all rooted nodes
on stolons or stems arising from rhizomes were counted as individual plants. This
reduced confusion during counting but still assessed the status of each population.
Page 34
16
Ground water monitoring wells
Proximity of ground water to the soil surface and associated soil moisture
content was measured in 2008 between April 1 and May 28 at weekly intervals.
Ground water was measured in 18 monitoring wells systematically placed across the
plot area. Wells measured 90 cm deep by 5.5 cm in diameter and were dug with a
hand-powered bucket auger. A 3.5-cm diameter PVC pipe measuring 100 cm long
was placed in the center of each well. Holes 5 mm in diameter were drilled the length
of each pipe at 5-cm increments to facilitate water flow. Pipes were covered with
plastic-mesh window screen to keep rocks and other material out of the pipe. The pipe
was surrounded by course silica sand to keep soil from plugging the 5-mm holes. At
the soil surface, mortar mix was poured around the pipe to seal the top of the well.
Ground water depth was measured as the distance from the soil surface to the water
level in the pipe. In addition to water depth, soil moisture content was measured at the
same time ground water was measured. Two 2x15-cm soil cores were extracted near
each monitoring well and placed in a sealable plastic bag. Sample bags were taken to
the lab where soil was weighed wet, placed in a 55 ºC drying oven for a minimum of
48 h, then re-weighed dry. Gravimetric soil moisture content was determined by
dividing the soil dry weight (g) by the soil wet weight (g).
Soil compaction and soil moisture characteristics
Soil compaction (g dry soil cm-3
) was determined at 0-5, 5-10, 10-15, and 20-
25 cm depths of the mine soil profile. Two 5-cm diameter soil cores, 0-15 cm and 20-
Page 35
17
35 cm deep were collected from each of the four plots left in the original forage
complex with a slide-hammer, removable-sleeve soil coring device. Each 15-cm core
was divided into three 5-cm lengths using individual 5-cm sleeves placed in the coring
device. The 20-25 cm depth was collected from the second core taken in the same
hole. The individual 5-cm long cores were weighed wet, dried at 55 ºC for 96 h, then
re-weighed. Weight of the sleeve was subtracted from both the wet and dry weights.
Bulk density was calculated on a wet and dry basis by dividing the soil weight (g) by
the sleeve volume (cm3).
The relationship between soil water content and soil water potential (soil
moisture characteristics) was determined for the top 15 cm of mine soil. A single
5x15-cm core was collected from each of the four check plots, as described above, and
then divided into three 5-cm lengths. Water potentials of 0.0, -0.003, and -0.01
megapascals (MPa) were determined with a gravity tension table. Water potentials of
-0.03, -0.1 and -0.3 MPa were determined using a ceramic pressure plate and negative
vacuum pressure (Richards, 1947).
Statistical analysis
All population data were transformed by adding 0.5 to the raw count and then
calculating the quarter-root of the sum. This transformation was used to improve
conformance with assumptions inherent in analysis of variance (ANOVA) statistical
tests. Transformed data were analyzed using PROC GLM in SAS/STAT® software
(SAS, 2007). Protected Fisher‘s LSD test was used to separate means within
Page 36
18
comparisons of interest and differences were accepted only if the P-value calculated
by the GLM test was at or less than 0.05 (Milliken and Johnson, 1984). Means were
back-transformed for presentation in tables.
Results and Discussion
Precipitation and soil moisture
The mean precipitation in this region is approximately 1000 mm yr-1
, which is
within the 762-1270 mm yr-1
range given for the eastern deciduous forest biome
(Raven and Berg, 2004). On average, spring and summer months have greater
precipitation than autumn and winter (Table 2). During 2005, precipitation at the
Wilds study site was above average in April and plots were too wet for planting until
May. Precipitation was below average in June and July, but above average in August
(Table 2). In 2006, precipitation in March and April was near average, but ground
water was again at or near the soil surface into April. Precipitation in June and July
was above average but below average in August. As a result, seedlings in 2005
experienced drier conditions into the summer than those in 2006. In contrast,
precipitation in 2007 was well below average in April, May, and June. Drought stress
on established grasses was evident early in the growing season and persisted through
fall. The above average precipitation in July and August was too little and too late to
overcome earlier shortages.
Soil saturation during late winter and spring is a common occurrence at this
site (personal observation). Measurements in 2008 showed the ground water table
Page 37
19
near or at the soil surface well into May (Figure 1a) with a trend toward a high
perched water table during spring, especially following rain events. Furthermore,
when the water table was high, soil moisture remained above field capacity (Figure
1b). The perched water table and subsequent saturated soil is likely related to the
compacted soil profile and is problematic for early seeding operations and for species
that are intolerant of anaerobic soil conditions.
Soil analysis
Federal surface mining law requires that surface-mined land be contoured
during reclamation to approximate the original landscape, and that a layer of topsoil,
or the best available subsoil, be spread over the contoured overburden (SMCRA,
1977). An exposed profile at the Wilds shows a distinct difference that occurs at
about 20 cm below the soil surface where the brown and brownish-red colors of the
topsoil layer gives way to grayish hues of the contoured overburden (Figure 2). Soil
tests confirmed the calcareous nature of the reconstructed soil profile as pH was above
7.0 and calcium (Ca) levels high at all depths sampled (Table 3). Reclaimed soil in
this region is classified as the Morristown series, which consists of a 20-cm surface
layer of dark brown silty clay loam above light gray silty clay loam overburden that is
alkaline and contains 10 to 40 percent coarse fragments (Soil Survey Staff, 1996). In
contrast, the adjacent non-mined forest soil had slightly acidic pH and much lower Ca
levels. Both sites were non-saline, but, the reclaimed mine soil had higher levels of
Ca and potassium (K) than did the forest soil. High Ca reduces available P as calcium
Page 38
20
phosphate precipitates are formed (Brady, 1984; McBride, 1994). This is evident in
the mine soil as P is low at all depths compared with the forest soil.
Soil pH was consistently basic in each 5-cm layer of the 20-cm replaced
topsoil layer; however, soil organic matter (SOM) and available P were both greater in
the 0-5 cm surface layer (Table 4). This is likely a result of root growth and decay that
occurred since the land was reclaimed and seeded with non-native forage species,
including the sod-forming Kentucky bluegrass. Furthermore, Ca and K were each
relatively high throughout the 20-cm profile when compared to the non-mined forest
soil (Table 3). Bulk density of the 0-5 cm layer averaged 1.05 Mg m-3
, while depths
below this layer were more compact with bulk densities ranging between 1.5 and 1.8
Mg m-3
(Table 4).
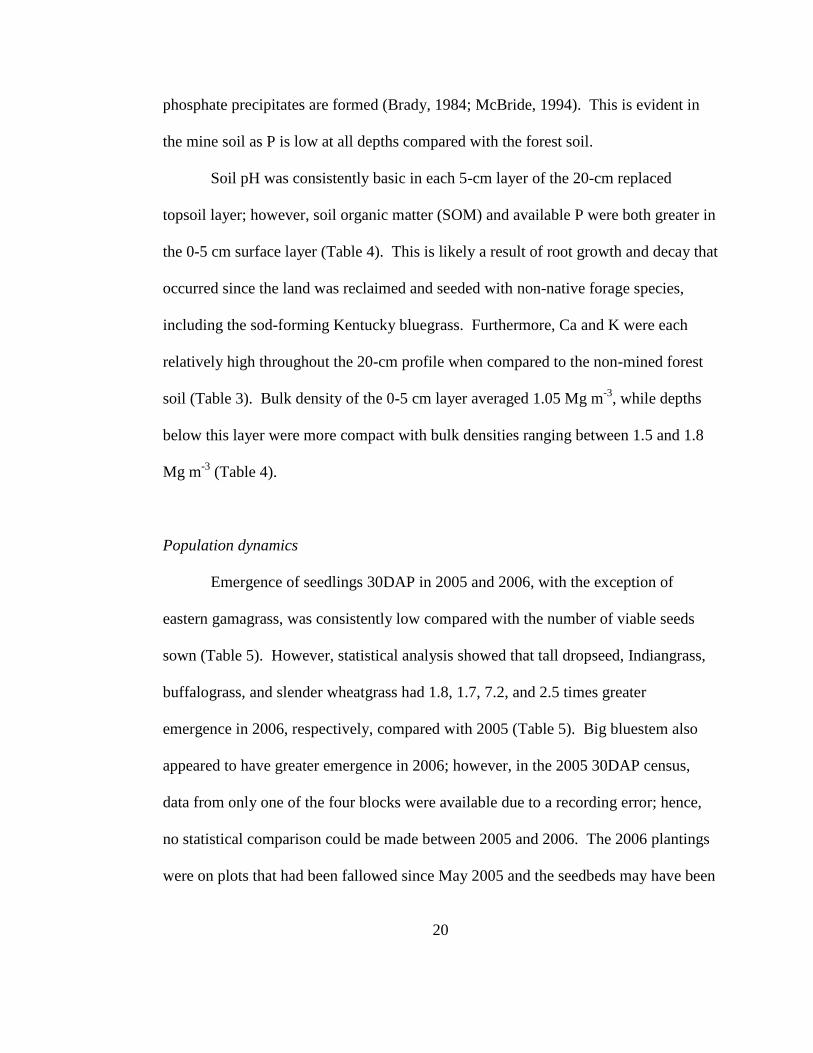
Population dynamics
Emergence of seedlings 30DAP in 2005 and 2006, with the exception of
eastern gamagrass, was consistently low compared with the number of viable seeds
sown (Table 5). However, statistical analysis showed that tall dropseed, Indiangrass,
buffalograss, and slender wheatgrass had 1.8, 1.7, 7.2, and 2.5 times greater
emergence in 2006, respectively, compared with 2005 (Table 5). Big bluestem also
appeared to have greater emergence in 2006; however, in the 2005 30DAP census,
data from only one of the four blocks were available due to a recording error; hence,
no statistical comparison could be made between 2005 and 2006. The 2006 plantings
were on plots that had been fallowed since May 2005 and the seedbeds may have been
Page 39
21
more suitable for germination of these species. Because of the fallowing, the 2006
plots were also easier to till than plots in 2005. Furthermore, the decaying Kentucky
bluegrass roots had a year to release nutrients and lose any allelopathic affect that may
have been present in 2005 (Bosy and Reader, 1995).
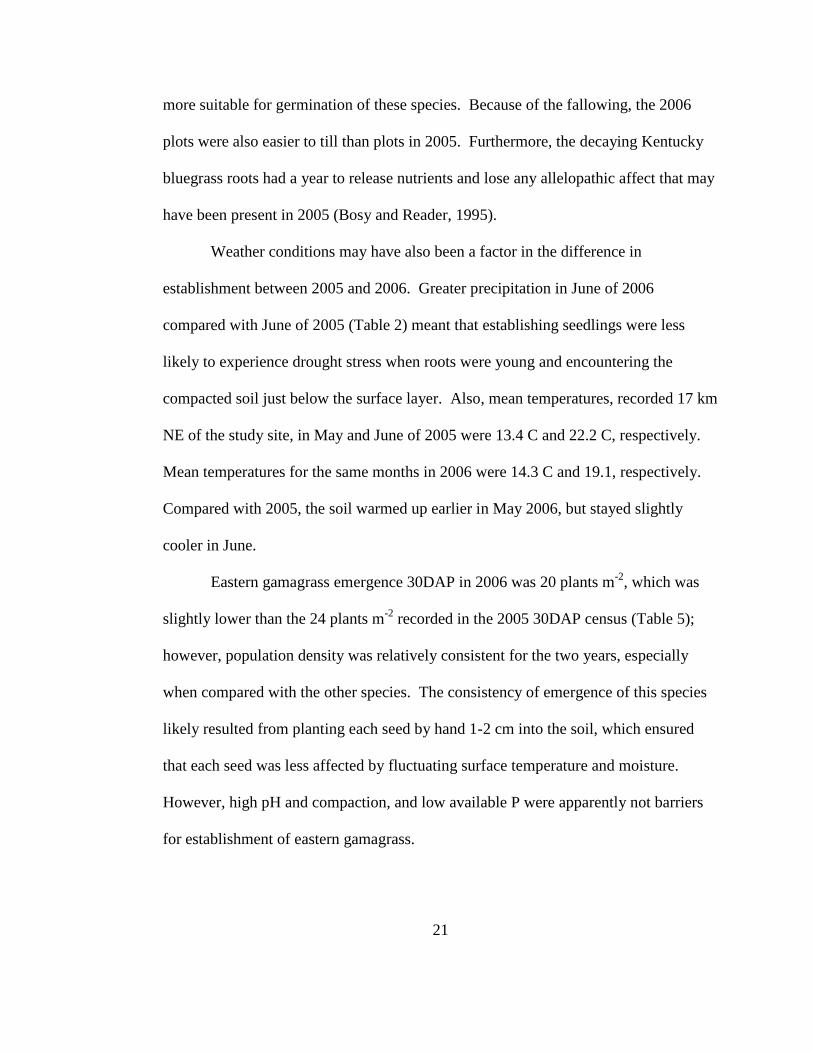
Weather conditions may have also been a factor in the difference in
establishment between 2005 and 2006. Greater precipitation in June of 2006
compared with June of 2005 (Table 2) meant that establishing seedlings were less
likely to experience drought stress when roots were young and encountering the
compacted soil just below the surface layer. Also, mean temperatures, recorded 17 km
NE of the study site, in May and June of 2005 were 13.4 C and 22.2 C, respectively.
Mean temperatures for the same months in 2006 were 14.3 C and 19.1, respectively.
Compared with 2005, the soil warmed up earlier in May 2006, but stayed slightly
cooler in June.
Eastern gamagrass emergence 30DAP in 2006 was 20 plants m-2
, which was
slightly lower than the 24 plants m-2
recorded in the 2005 30DAP census (Table 5);
however, population density was relatively consistent for the two years, especially
when compared with the other species. The consistency of emergence of this species
likely resulted from planting each seed by hand 1-2 cm into the soil, which ensured
that each seed was less affected by fluctuating surface temperature and moisture.
However, high pH and compaction, and low available P were apparently not barriers
for establishment of eastern gamagrass.
Page 40
22
Emergence for Virginia wildrye, little bluestem, blue grama, and sideoats
grama was similar in 2005 and 2006 (Table 5). Variability among blocks strongly
influenced the analysis, but the exact cause of this variability was undetermined and
may have been related to differences in soil moisture across the plot area.
Species that did not establish in 2005, or were present only at low densities,
were not planted in 2006. These included green needlegrass, prairie Junegrass,
Sandberg‘s bluegrass, and Snake River wheatgrass. A final assessment of these
species was made in May 2006 and a sparse few individuals were found.
Furthermore, no consistency could be seen across the blocks, except for Sandberg‘s
bluegrass, which could not be found in any of the plots (data not shown). These
species may be poorly adapted to the mine soil habitat, general climate, or may
establish better if planted in autumn.
Western wheatgrass planted in 2005 had poor seed viability; therefore,
emergence was near zero (data not shown). Since this species is tolerant of high pH
and moist soil (Table 1), a new seed lot was planted in 2006 and no comparison was
made with the failed 2005 planting. As a precaution, a seed rate twice that used in
2005 was sown in 2006 (Table 5). Establishment density of western wheatgrass in
2006 appeared to be consistent with blue grama, sideoats grama, and big bluestem.
When comparing stand density over time, eastern gamagrass, tall dropseed,
and big bluestem had little change in population from 30DAP through the three years
following planting (Table 6). Final density in YR3 of the 2005 planting of eastern
gamagrass, tall dropseed, and big bluestem density was 24, 104, and 21 plants m-2
,
Page 41
23
with each density was consistent with earlier censuses. This trend was also persistent
in the 2006 planting and suggests that once these species establish, individuals are
tolerant of the mine soil. Furthermore, tall dropseed was observed growing in plots
adjacent to plots where it was originally seeded, suggesting it is capable of spreading
in this habitat. In contrast, blue grama and sideoats grama quickly diminished in
density after the first year. In the 2005 planting, density of sideoats grama declined
from 19 plants m-2
at 30DAP to 0 plants m-2
at YR3 (Table 6). Blue grama declined
from 130 to 1 plants m-2
over the same period. Similar outcomes were also seen in the
2006 planting. These two species are listed as intolerant of anaerobic soil (Table 1),
which likely explains the decline in density.
Virginia wildrye and slender wheatgrass, in general, established relatively well
but then appeared to decline in density by the final census. Greatest density for
Virginia wildrye in the 2005 planting was 87 plants m-2
at the YR2 census, then
declined to 36 plants m-2
in YR3 (Table 6). Slender wheatgrass density in YR2 of the
2005 planting was 163 plants m-2
, and then declined to just 39 plants m-2
in YR3. By
the end of the study, it was difficult to distinguish individual plants when growing in
dense clumps. If several plants were mistakenly counted as one, then this may
partially explain the decline in density. However, these two cool-season grasses were
highly preferred by deer, rabbits, and rodents especially through the first winter after
planting. Fecal material from these animals was commonly found in the plots and
grazing activity was intense throughout the winter when the warm season-grasses were
dormant. It may be that young slender wheatgrass and Virginia wildrye plants are
Page 42
24
simply more palatable than the surrounding Kentucky bluegrass or tall fescue, and are
more desirable from a wildlife perspective.
Buffalograss and western wheatgrass both produced dense stands.
Buffalograss, which spreads by stolons as well as seed, increased during the first year
of the 2005 planting from 33 seedlings 30DAP to 205 rooted plants at the end of the
first year (Table 6). In 2006, no difference could be detected for buffalograss from the
30DAP census through the second year census as initial germination was greater than
in 2005. Furthermore, both buffalograss and western wheatgrass spread out of the
plots in which they were seeded. Western wheatgrass substantially increased its
presence from 62 plants m-2
in the first year to 1360 plants m-2
by the end of the
second year following planting (Table 6).
Population density expressed as percent of viable seeds sown was used to
compare establishment success among species. At each of the four censuses of the
2005 planting, eastern gamagrass stand density average 60% or greater of viable seeds
initially sown, which was greater than all other grasses (Table 7). In the 2006
planting, species with the greatest emergence at the 30DAP were eastern gamagrass
(52%), tall dropseed (41%), buffalograss (38%), and slender wheatgrass (63%) (Table
7). At the YR1 census, density as percent of seeds sown was greatest for eastern
gamagrass (49%), buffalograss (47%), and slender wheatgrass (29%). At the YR2
census, density of eastern gamagrass was 52% of seeds sown, but overall greatest for
western wheatgrass, which had increased from 4% to 154% of seeds sown between the
YR1 and YR2 censuses (Table 7). This increase was primarily a function of new
Page 43
25
shoots emerging from rhizomes spreading into open gaps left from the initial seeding.
However, of the species with the greatest percent emergence, only eastern gamagrass
and tall dropseed maintained their absolute population density throughout the study
(Table 6).
In contrast, 30DAP emergence of big bluestem, little bluestem, and Indiangrass
was only 5%, 8%, and 5% of viable seeds sown for the 2005 planting, and 8%, 24%,
and 3% in the 2006 planting (Table 7). In both plantings, 30DAP emergence of
Indiangrass was greater than either big bluestem or little bluestem, and in the 2006
planting, Indiangrass percent emergence (24%) was not different from tall dropseed
(41%), which was one of the most successful grasses in this study (Table 7). Greater
emergence of Indiangrass in the 2006 planting may have been due to greater rainfall
during June and July in 2006 when seedlings were germinating (Table 2). Indiangrass
density in the 2006 planting was 17 and 11% of seed sown at the YR1 and YR2
census, respectively, and was similar to tall dropseed densities of 24 and 27% of seeds
sown at the same censuses, respectively. During the first year of growth, seedlings of
the big bluestem, little bluestem, and Indiangrass exhibited signs of stress, including
blotchy leaves, crowns elevated above the soil surface, dull color, and early
senescence (personal observation). Low establishment success of these tallgrass
prairie species may indicate impaired or limited ability to development tallgrass prairie
on reclaimed calcareous compacted mine soil. In contrast, seedlings of eastern
gamagrass, tall dropseed, and buffalograss showed little signs of stress through their
seedling year (personal observation).
Page 44
26
The results from this study indicate several characteristics of the reclaimed
mine soil habitat that may affect revegetation of the landscape. First, anaerobic soil
conditions can occur following periods of heavy rainfall, especially in spring, which
may filter out intolerant species. Both blue grama and sideoats grama diminished by
the second year following planting. Blue grama is native to the short-grass and mixed-
grass prairies of the Great Plains where moisture is often deficient for establishment
(Laurenroth et al., 1994). It is not unexpected that the mesic climate of southeast
Ohio may be too wet for this species: however, sideoats grama is native to tallgrass
prairie communities from Kansas through Ohio and is found in most southern and
eastern U.S. states (USDA, 2009). Therefore, the exit of sideoats grama from the
mine soil is likely related to saturated soil and not the overall climate. Problems
associated with saturated soil are lack of O2 around the roots and reduction of metals,
e.g. iron and manganese, which are toxic to many plants at higher concentration (Taiz
and Zeiger, 2002).
The moist climate and the periodically saturated soil may benefit the non-
native tall fescue and Kentucky bluegrass. Both species have been developed as
highly competitive forage species and are well adapted to a wide range of soil and
climate conditions. The success of tall fescue and Kentucky bluegrass on the mine
soil is likely due to a combination of two main factors. First, both species are well
adapted to the habitat, and secondly, the habitat is not suitable for more competitive
vegetation, i.e. the native forest species, that would naturally establish through
succession. Tall fescue is adapted to poorly drained soil (Lauriault et al., 2005;
Page 45
27
Hannaway et al., 1999), while certain Kentucky bluegrass cultivars are adapted to
periods of flooding (Wang and Jiang, 2007). The saturated conditions of the mine soil
are directly related to soil compaction; however, tall fescue and Kentucky bluegrass
are also able to tolerate the compaction. Tall fescue establishes well by rooting
directly into the compacted matrix (Crews, 1984). Kentucky bluegrass avoids the
compaction by rooting primarily in the top 20 cm of the soil (DaCosta, et al., 2004).
The mine soil was least compacted in the top 5 cm (Table 4) and periods of saturation
were less frequent and of shorter duration than at deeper depths (Figure 1a). Soil
organic matter was also greater in the 0-5-cm depth (Table 4), reflecting long-term
root growth of the Kentucky bluegrass in the surface layer.
Poor success of the tallgrass prairie species, big bluestem, little bluestem, and
Indiangrass reflects the general difficulty for late-successional prairie species to
establish on bare soil (Kleijn, 2003; Skousen and Venable, 2008). Late-successional
species often experience low seedling establishment rates and stands are slow to
develop when planted in early-successional environments. Seedling desiccation,
improper seeding method, weed competition, and low seeding rate are reasons given
for poor establishment (Launchbaugh and Owensby, 1970; Potvin, 1993; Masters,
1997; Abbott and Roundy, 2003). In this study, germination rates were lower for both
big bluestem and Indiangrass in 2005 when the climate was warmer and drier, than in
2006 with greater precipitation and lower average temperature. Little bluestem
establishment was equally low in both years. This suggests that desiccation during
seedling growth limits establishment of these late-successional grasses; thus, it may be
Page 46
28
unreasonable to expect a high emergence percentage in this habitat. However, big
bluestem density remained consistent through the three years of the study, whereas the
2005 Indiangrass and little bluestem plantings declined by the last census.
In contrast, eastern gamagrass, tall dropseed, buffalograss, and western
wheatgrass were the most successful grasses to establish and maintained stand density
throughout this research. Eastern gamagrass, a perennial relative of maize (Zea mays
L.), is native in the tallgrass prairie regions but also extends into the southern USA,
Mexico, Central America, and into South America (Randolph, 1970; Hitchcock,
1971). This species is often found on stream banks and floodplains where
establishment is likely to follow disturbance as seeds require warm temperatures
associated with bare soil (Anderson, 1985). Warm temperatures in May and June in
southeastern Ohio, coupled with ephemeral wetland-like conditions of the mine soil
may explain the establishment success this species. However, persistence of
established plants is likely due to the ability of eastern gamagrass roots to penetrate
compacted soil layers (Clark et al., 1998; Gilker et al., 2002) where they can access
water during drought periods. Furthermore, it is also apparent that eastern gamagrass
tolerates the calcareous nature of the reclaimed mine soil. Ability to withstand
saturated calcareous soil and to root into the compacted layers below the soil surface
represents mechanisms for adaptation to the mine soil habitat.
The success of tall dropseed would not be predicted given the listing in the
USDA-NRCS Plants Database as intolerant to high soil pH and anaerobic soil
conditions (USDA-NRCS, 2009). Tall dropseed is a component of tallgrass prairie
Page 47
29
communities and produces small seeds that accumulate in the soil surface, where they
can germinate following disturbance (Mitchell et al., 1996; Pérez, 1998). Methods of
plot preparation and seeding in this study likely favored tall dropseed as the small
seeds were able to nestle into soil depressions and were not affected by litter layers or
existing canopies of other species. However, the persistence of this species through
the duration of the study is remarkable as populations did not decline in the plots.
Furthermore, at the end of the study, tall dropseed had begun to spread into plots
adjacent to where it was originally planted (personal observation), indicating
adaptation to the habitat. It is not known how deep this species roots into compacted
soil; however, a closely related species, sand dropseed (Sporobolus cryptandrus
(Torr.) A. Gray) was found more effective at extracting water from 0-30 cm than
Broom snakeweed (Gutierrezia sarothrae Shinners), a shrubby competitor effective at
extracting water from 30-60 cm depths (Wan et al., 1993). This suggests that tall
dropseed may limit its root growth to the surface layers, but is very effective at
extracting water in this zone.
Buffalograss, which spreads by stolons, and western wheatgrass, which
spreads by rhizomes, were able to establish by spreading into gaps where seeds
initially did not germinate. The success of these two species represents mechanisms
that are similar to those of Kentucky bluegrass. All three species tolerate low
precipitation, high pH, and anaerobic soil (Table 1); however, they can also utilize
abundant precipitation or irrigation. The reported maximum rooting depth of
buffalograss (0.9 m) is slightly greater than that reported for Kentucky bluegrass (0.6
Page 48
30
m) but buffalograss is able to extract greater amounts of water from the profile
(Stewart et al., 2004). Western wheatgrass is capable of rooting to 1.2 m (Frank and
Bauer, 1991). Soil compaction of the mine soil likely limits rooting depth of these
three species to shallower layers; however, their persistence is likely due to their
ability to tolerate water stress that naturally occurs at shallow depths in a compacted
profile during periods of drought.
Replacing the non-native forage complex with a diverse plant community
will require a diverse set of mechanisms to overcome constraints imposed by the
compacted calcareous mine soil. Species that established well in this research
represented species that either diminish the effect of soil compaction by rooting
through the compacted layers, or, that avoid the compaction by rooting shallow and
tolerating any water stress that occurs. Species also must tolerate periodic flooding
and the resulting anaerobic soil conditions. However, late-successional grasses like
big bluestem may also persist, even though early establishment is low, because they
are effective at tolerating stress, including low levels of nutrients such as P (Grime,
1977). A community of grasses that include only the species that established in this
research would increase both structural diversity and species richness over the existing
forage complex. However, a greater number of species that tolerate the compaction
and periodic flooding of the calcareous mine soil would further increase diversity in
this habitat.
Furthermore, a diverse prairie ecosystem that contains ecological resilience
and memory would be more able to respond to disturbance and changes in the
Page 49
31
environment and still maintain functional quality and provide greater ecosystem
services. Greater soil development and carbon sequestration, improved animal
diversity and habitat, and a preserve for plant species that have been diminished or
eliminated from their original ranges due to human-centered land use, are benefits that
could be realized by prairie establishment on compacted mine soil in the Appalachian
coal mining region.
Page 50
31
Table 1. List of grasses planted in this research and a description of habitat characteristics where each species is native.1
Common name Scientific name
PPT
range
pH
range
Anaerobic
tolerance Habitat; Distribution
---------------------------------------------------------Native prairie grasses--------------------------------------------------------------------
Eastern gamagrass Tripsacum dactyloides L. 406 –
1524
5.1 –
7.5
Medium Facultative wetland species; Gulf
coast into Midwest and
southeastern U.S.
Virginia wildrye Elymus virginicus L. 914 –
1397
5.0 –
7.0
Medium Moist ground, low woods, and along
streams; Great Plains, Midwest,
and eastern U.S.
Big bluestem Andropogon gerardii Vitman 305 –
1397
6.0 –
7.5
Medium Prairies, open woods, and dry
slopes, but may occur near
wetlands; Great Plains, Midwest,
and eastern U.S.
Tall dropseed1 Sporobolus asper (Michx.)
Kunth
406 –
1270
5.5 –
7.0
None Prairies and sandy meadows; Great
Plains, Midwest and northeast
U.S.
Little bluestem Schizachyrium scoparium
(Michx.) Nash
305 –
1143
4.8 –
8.0
None Prairies, open woods, and dry
slopes, but may occur near
wetlands; Great Plains through
eastern U.S.
Indiangrass Sorghastrum nutans (L.) Nash 279 –
1143
5.0 –
8.4
Low Prairies, open woods, and dry
slopes, but may occur near
wetlands; Great Plains through
eastern U.S.
Continued
32
Page 51
32
Table 1. Continued.
Common name Scientific name
PPT
range
pH
range
Anaerobic
tolerance Habitat; Distribution1
Western wheatgrass Pascopyrum smithii (Rydb.)
A. Löve
203 –
914
4.5 –
9.0
Medium Moist, usually alkaline soil; western
U.S., Great Plains, and Midwest
Sideoats grama Bouteloua curtipendula
(Michx.) A. Gray
152 –
635
5.5 –
8.5
None Plains, prairies, and rocky hills;
Great Plains and Midwest
Buffalograss Buchloe dactyloides (Nutt.)
Engelm
178 –
813
6.5 –
8.0
High Dry plains; Great Plains
Slender wheatgrass Elymus trachycaulus (Link)
Gould ex Shinners
203 –
635
5.6 –
9.0
Low Moist and well drained soil along
rivers and in meadows; western
U.S., Great Plains, Midwest, and
northeastern U.S.
Green needlegrass Stipa viridula Trin. 381 –
610
6.6 –
8.4
None Plains and dry slopes; Upper
Midwest through Great Plains and
into southwest U.S.
Blue grama Bouteloua gracilis (Willd. Ex
Kunth) Lag. Ex Griffiths
203 –
559
6.6 –
8.4
None Plains; Great Plains and Midwest
Prairie Junegrass Koeleria macrantha (Ledeb.)
J.A. Schultes
356 –
508
6.0 –
8.0
None Prairies, open woods, and sandy
soil; western U.S., Great Plains,
and Midwest
Sandberg‘s bluegrass Poa secunda J. Presl 203 –
406
6.0 –
8.0
None Plains, dry woods, rocky slopes;
western U.S. into Great Plains
Snake River
wheatgrass
Elymus wawawaiensis J.
Carlson & Barkworth
na na NA Dry slopes; Pacific Northwest.
Continued
33
Page 52
33
Table 1. Continued.
Common name Scientific name PPT
range
pH
range
Anaerobic
tolerance Habitat; Distribution1
---------------------------------------------------Existing non-native vegetation---------------------------------------------------------------
Tall fescue Festuca arundinaceae Schreb. 762 –
1651
5.0 –
9.0
Low Roadsides, meadows, and pastures;
introduced from Europe, widely
cultivated in northern U.S. states.
Kentucky bluegrass Poa pratensis L. 610 –
1651
5.0 –
8.4
Low Open woods, meadows, except arid
areas; introduced from Europe,
widely distributed at all latitudes
below alpine.
Bird‘s-foot trefoil Lotus corniculatus L. 711 –
1651
5.0 –
7.7
Medium Pastures; introduced from Eurasia,
widespread in the U.S.
1Precipitation, pH ranges, and anaerobic tolerance from USDA, NRCS. 2009. The PLANTS Database (http://plants.usda.gov,
22 April 2009). National Plant Data Center, Baton Rouge, LA 70874-4490 USA. Habitat description from Hitchcock,
A.S. 1971. Manual of the grasses of the United States. Ed. A. Chase. Dover Public., New York, and, Stubbendieck, J.,
S.L. Hatch, and K.J. Hirsch. 1986. North American range plants. 3rd
Edition. Univ. of Nebraska Press, Lincoln, NE.
34
Page 53
35
Table 2. Precipitation data recorded 17 km northwest of the Wilds study site at
the Zanesville, Ohio municipal airport.
Month 2005 2006 2007 1988-2007
------------------------------------(mm)---------------------------------
January 213 72 99 80
February 46 30 34 56
March 67 70 133 78
April 104 75 61 88
May 100 80 32 105
June 85 102 56 95
July 64 114 117 96
August 195 38 150 93
September 76 133 71 87
October 80 148 80 68
November 94 35 61 71
December 23 43 85 62
Annual 1149 942 980 979
Page 54
36
Table 3. Soil analysis of reclaimed calcareous mine soil and adjacent non-mined
forest soil collected from a former surface coal mine in southeast Ohio.
Parameter ---Reclaimed mine soil--- ---Non-mined forest soil---
Sampling depth (cm) 0-20 20-51 51-81 0-20 20-51 51-81
pH 7.3 7.4 7.6 6.4 5.8 5.7
EC (dS m-1
) 0.1 0.5 0.4 0.11 0.10 0.14
P (mg Kg-1
) 12.1 2.6 2.3 16.0 13.0 8.0
Ca (mg Kg-1
) 3768 4162 6859 952 437 2403
K (mg Kg-1
) 161 112 107 89 70 43
SOM (%) 4.9 2.3 2.0 4.5 2.4 1.1
NO3-N (mg Kg-1
) 8.5 5.0 5.8 4.0 2.8 5.1
Nitrogen (g Kg-1
) 1.7 0.8 0.7 1.8 0.7 0.4
Carbon (g Kg-1
) 30.0 16.0 19.0 23.9 8.2 3.0
C:N 17.9 19.0 27.4 13.0 11.6 7.1
1 Samples were collected June 2004 with a 6.4 cm diameter probe from four
reclaimed mine sites and an adjacent non-mined forest soil site.
Page 55
37
Table 4. Properties of soil collected from the top 20 cm, in 5-cm increments,
from reclaimed coal mined study site in southeast Ohio. Samples collected
randomly from the Wilds study site on October 2007.
Depth1 pH SOM P K Ca Bulk density
2
(cm)
(%) ---------(mg Kg-1
)--------- (Mg m-3
)
0-5 7.5 5.8 19 233 4091 1.05
5-10 7.6 1.6 4 225 5608 1.51
10-15 7.9 1.0 2 168 5869 1.65
15-20 7.7 0.7 3 183 6630 1.743
1 Six samples were collected from four plots containing pre-existing vegetation
(See Table 3.) and were bulked together. Individual samples measured
2x20 cm and were partitioned into their corresponding depth.
2 Samples for bulk density were collected with a slide-hammer soil probe
containing a 3.2x15 cm sleeve.
3 15-20 cm depth was not available; value is from 20-25 cm depth.
Page 56
38
Table 5. Population density 30 days after planting (30DAP) in 2005 and 2006
in relation to number of viable seeds sown.
Population density 30DAP
2
Species1
Viable seeds
sown 2005 2006 P-value
(seeds m-2
) ---(count m-2
)--
Eastern gamagrass 39 24 20 0.0337
Tall dropseed 428 101 177 0.0112
Big bluestem 474 25 39 ---
Indiangrass 453 62 108 0.0146
Little bluestem 566 28 18 0.3434
Sideoats grama 432 19 30 0.7090
Blue grama 924 130 62 0.2230
Buffalograss3 633 33 238 0.0120
Virginia wildrye 434 49 77 0.5529
Slender wheatgrass 424 103 259 0.0430
Western wheatgrass4 882 --- 62 ---
Green needlegrass 432 T --- ---
Prairie Junegrass 878 T --- ---
Sandberg‘s bluegrass 815 0 --- ---
Snake River wheatgrass 431 T --- ---
1 Species with trace (T) or zero densities in 2005 were not planted in 2006.
2 P-value compares population density between the 2005 and 2006 planting for
each species. No data available for western wheatgrass in 2005 due to a
poor seed lot. Green needlegrass, prairie Junegrass, Sandberg‘s bluegrass
and Snake River wheatgrass were not did not establish in 2005 and were
not replanted in 2006.
3 Seeding rate refers to whole burs.
Page 57
39
Table 6. Changes in population density measured 30 days after planting (30DAP), in October of the first year following
planting (YR1), in October of the second and third year after sowing (YR2 and YR3), respectively.
2005 planting2 2006 planting
3
Species1
Viable seeds
sown 30DAP YR1 YR2 YR3 30DAP YR1 YR2
(seeds m
-2) -----------------(plants m
-2)----------------- ----------(plants m
-2)----------
Eastern gamagrass 39 24 a 30 a 33 a 23 a 20 x 19 x 20 x
Tall dropseed 428 101 a 111 a 149 a 104 a 177 x 101 x 114 x
Big bluestem 474 25 a 19 a 15 a 21 a 39 x 29 x 29 x
Indiangrass 453 28 a 35 a 15 b 16 b 108 x 77 xy 49 y
Little bluestem 566 28 ab 40 a 12 b 10 b 18 x 18 x 18 x
Sideoats grams 432 19 b 51 a 1 c 0 c 30 x 34 x 6 y
Blue grama 924 130 a 210 a 7 b 1 b 62 x 25 x 0 y
Continued
39
Page 58
40
Table 6. Continued.
2005 planting2 2006 planting
3
Species1
Viable seeds
sown 30DAP YR1 YR2 YR3 30DAP YR1 YR2
(seeds m
-2) -----------------(plants m
-2)----------------- ----------(plants m
-2)----------
Buffalograss 633 33 b 205 a 237 a 132 ab 238 x 296 x 160 x
Virginia wildrye 434 49 bc 75 ab 87 a 36 c 77 x 23 x 16 x
Slender wheatgrass 424 103 a 163 a 132 a 39 b 259 x 68 y 90 y
Western wheatgrass4 882 --- --- --- --- 62 y 33 z 1360 x
1 Buffalograss and western wheatgrass counts include plants arising from seed as well as clonal shoots; all other counts
refer only to plants arising from seed.
2 Counts in each row for each the 2005 planting date, are compared with a protected Fisher‘s LSD (α=0.05) and are
different only if followed by a different letter (a, b, or c).
3
Counts in each row for each the 2006 planting date, are compared with a protected Fisher‘s LSD (α=0.05) and are
different only if followed by a different letter (x, y, or z).
4 No data for western wheatgrass in 2005 due to a poor seed lot.
40
Page 59
41
Table 7. Species comparison of stand density as a percent of viable seeds sown, at each census for the 2005 and
2006 plantings.1
2005 planting 2006 planting
Species 30DAP YR1 YR2 YR3 30DAP YR1 YR2
-------- (% of viable seeds sown )-------- -------(% of viable seeds sown)------
Eastern gamagrass 62 a 65 a 85 a 60 a 52 a 49 a 52 b
Tall dropseed 24 b 26 bc 35 b 24 b 41 ab 24 b 27 c
Big bluestem 5 d 4 e 3 de 4 cd 8 de 6 d 6 ef
Indiangrass 8 c 8 de 3 d 4 d 24 bc 17 bc 11 cd
Little bluestem 5 d 7 de 2 def 2 d 3 e 3 d 3 f
Sideoats grama 4 d 12 cde <1 f <1 e 9 de 10 cd 2 f
Blue grama 14 c 24 bc 1 ef <1 e 7 e 3 d <1 g
Buffalograss 6 d 38 b 38 b 22 b 38 abc 47 a 26 c
Virginia wildrye 11 c 18 bcd 20 c 8 c 20 cd 5 d 4 f
Slender wheatgrass 24 b 40 b 31 bc 9 c 63 a 29 ab 21 cd
Western wheatgrass2 --- --- --- --- 7 e 4 d 154 a
1 At each census, percent emergences followed by the same letter are determined not different with a protected
Fisher‘s LSD (α=0.05). 2 No data for western wheatgrass in 2005 due to a poor seed lot.
41
Page 60
42
(a)
Sample Date
04/22 04/29 05/05 05/13 05/21 05/28
So
il M
ois
ture
Per
cen
t
0
5
10
15
20
25
30
35
0.0 MPa
-0.3 MPa
Su
rfac
e W
ater
Dep
th (
cm)
0
10
20
30
40
50
60
70
(b)
Figure 1. Surface water depth (a) and soil moisture content in the top 15 cm (b) of
reclaimed mine soil at the Wilds from April 22 through May 28, 2008. Reference
line in (b) with long dash lines (— — —) indicates soil water potential at 0.0 MPa,
or soil completely saturated. Short dash reference line (– – –) in (b) indicates soil
water potential at -0.3 MPa, or soil at field capacity. Pearson correlation
coefficient between water depth and moisture percent is r = -0.69 (P<0.0001).
Page 61
43
Figure 2. Soil profile of contoured reclaimed calcareous mine soil in southeast Ohio.
Note the color change from dark brown surface layer (approximately 20 cm thick)
to the grayish sub-soil layer below. The surface layer is composed of stockpiled
topsoil or substitute that was spread over the gray-cast overburden during
reclamation.
Page 62
44
Chapter 3: Productivity of Native Prairie Grasses on Reclaimed Calcareous Mine Soil.
Abstract
Reclamation of surface coal mined land in the eastern U.S. has produced
habitats incapable of supporting deciduous hardwood forests native to the region.
Compacted calcareous soil limits restoration and reduces overall ecosystem function
and diversity. Furthermore, competitive non-native forage species planted during
reclamation persist as a low-diversity forage complex. As an alternative, a native
prairie community may increase diversity, ecosystem function, and productivity.
Fifteen grasses native to North American were planted on bare soil in monoculture
plots on reclaimed surface mine land in southeast Ohio. Plantings were in 2005 and
repeated in 2006. Plots were visually assessed for canopy cover and clipped for
aboveground biomass production in October of the first, second, and third year
following planting. Cover and biomass were consistently high for eastern gamagrass,
tall dropseed, and buffalograss, which had produced dense stands. These species
produced less biomass than the existing forage vegetation only in the first year of
growth. In contrast, tallgrass prairie dominants big bluestem, little bluestem, and
Indiangrass had low cover and biomass production. Sideoats and blue grama were
Page 63
45
productive in the first year but diminished by year two. Western wheatgrass
increased substantially in cover and biomass by the second year from spreading
rhizomes. Slender wheatgrass and Virginia wildrye were productive but results were
mixed in the second planting. Biomass on a per-plant basis was greatest for eastern
gamagrass and lowest for western wheatgrass. Results show that native prairie grasses
can be productive on calcareous reclaimed mine soil.
Keywords: Native grass productivity, disturbed land restoration, surface mined land,
calcareous soil, soil compaction, prairie establishment.
Introduction
Primary productivity is the basis for ecosystem function and is critical in
restoring core processes to degraded landscapes. Carbon sequestration, nutrient
cycling, and community diversity all depend on the ability of producers to transform
inorganic carbon and energy into plant biomass (Martin et al., 2005; Kivimäki et al,
2008; Wu et al., 2008). Reestablishing native communities is a preferred means of
restoring ecosystem function on disturbed land; however, habitat conditions on
degraded sites may limit productivity and may inhibit native plants from establishing.
Surface mined land in the eastern U.S. is permanently impaired by reclamation
that produced adverse soil conditions, primarily soil compaction and high pH, which
prohibit reestablishment of the native deciduous forest communities (Burger et al.,
2002). Soil compaction caused by heavy equipment used to spread and contour spoil
Page 64
46
and stockpiled topsoil during reclamation is a major factor limiting forest
regeneration. Bulk densities ranging from 1.5 to 1.6 g cm-3
can occur in the top 5 cm
of recently reclaimed land and can range between 1.6 and 1.8 g cm-3
at lower depths
(Shrestha et al., 2009). Bulk densities of 1.5 g cm-3
or greater can seriously reduce
root growth, mineral and water uptake, lead to anaerobic soil conditions, and reduce
plant establishment and productivity (Kozlowski, 1999). Furthermore, in areas with
limestone in the substrata, calcareous soil conditions occur when limestone is mixed
and spread near the surface. Calcareous soils are alkaline in pH and can be critically
low in available phosphorus (Brady, 1984; McBride, 1994).
These habitat conditions are unfavorable for the majority of deciduous trees
native to the region. A study conducted on reclaimed surface mined land in southeast
Ohio found that only white ash (Fraxinus americana L.) and green ash (Fraxinus
pennsylvanica Marsh.) had established successfully (>90%) 5 years after planting,
whereas mature-community dominants such as red oak (Quercus rubra L.) and
Shumard oak (Quercus shumardii Buckley var. shumardii) established poorly
(<20%), and yellow poplar (Liriodendron tulipifera L.), a regional early successional
hardwood species, essentially failed to establish (0.5%) (Kost et al., 1994).
Reclamation of surface coal mined land in the United States is mandated by
Public Law 95-87 (Surface Mining Control and Reclamation Act of 1977), which
requires establishment of a ―permanent vegetative cover of the same seasonal variety
native to the area of land to be affected‖ (SMCRA, 1977). This implies that
reclamation of surface mined lands in the eastern U.S would include establishment of
Page 65
47
the native deciduous forest species; however, a loophole in the law allows the use of
non-native species if they fit within an ―approved postmining land use plan‖
(SMCRA, 1977). Furthermore, mining companies are given five years to establish a
permanent ground cover if they are to retrieve bond money paid to cover reclamation
costs in the event of abandonment. It is within this context that mining companies
plant non-native forage grasses and legumes that establish easily within the five-year
bond window as alternatives to native forest vegetation. Forages such as tall fescue
(Festuca arundinaceae Schreb.) and bird‘s-foot trefoil (Lotus corniculatus L.) are
selected because they establish well, produce adequate ground cover for soil
conservation, and fit within a pre-approved agricultural use plan. Restoration of
native forests would require restoration of habitat conditions favorable to the native
species. Reclamation law specifies only that the original topographical contour be
restored and that a layer of topsoil, or suitable substitute, covers the reclaimed land
surface, but the law contains no directive on limiting compaction.
Replacing the low diversity, non-native forage vegetation with a diverse
prairie community may be a reasonable alternative for increasing ecosystem function
on compacted, calcareous reclaimed surface mined land. Evidence suggests that
species diversity is associated with greater ecosystem stability and productivity
(Tilman et al., 2006) and that aboveground net primary productivity increases as
species richness increases (Foster et al., 2007; Flombaum and Sala, 2008).
Furthermore, soils that develop under native prairie vegetation have greater aggregate
stability and organic matter (Jastrow, 1987), which would help alleviate compaction
Page 66
48
and poor aeration problems. However, the key to establishing prairie communities on
reclaimed mine soil rests in finding native prairie species that establish well, are
productive, and are able to persist over time (Evanylo et al., 2005; Casselman et al.,
2006).
Tallgrass prairie ecosystems are found in the eastern part of the North
American central plains (Sala et al., 1988). These prairies are highly productive,
diverse, and are the most mesic of the central plains grassland biome. Because of their
proximity to eastern U.S. coal mining areas, they may be useful models for assembling
prairie communities on reclaimed mined land; yet, the same habitat barriers to native
forest establishment may also apply to prairie species. Consequently, species from
other grasslands systems should be considered in constructing a mine soil prairie.
Compacted calcareous mine soil habitat is potentially very different from the well-
developed prairie soils that support tallgrass prairie. For example, the mine soil
habitat may be more or less mesic compared with what the general climate would
reflect on naturally developed well drained soil not compacted or chemically
compromised. Historically, climate change and associated wildfire were responsible
for the development of the grassland biome throughout central North America
(Axelrod, 1985). Similarly, habitat changes from surface mining and reclamation
practices are responsible for creating new habitats that appear to favor grassland
communities; however, the question remains as to what type of grassland ecosystem
would restore function, diversity, and increase productivity.
Page 67
49
The goal of this research is to identify prairie grass species that are best suited
to reclaimed calcareous mine soil in southeast Ohio. Suitability of grasses
representing different prairie ecosystems was assessed by measuring productivity and
cover during the first three years of establishment. Species selected occur naturally in
North American tallgrass prairies, mixed and short-grass prairies, and the shrub-
steppes of the intermountain western U.S. We hypothesized that mesophyllic tallgrass
prairie species will be less successful than those more tolerant of arid environments
because of the moisture limitations imposed by soil compaction.
Methods
Study Area
This study was initiated in 2005 on reclaimed surface mined land near
Cumberland, Ohio. The area is part of the Allegheny Plateau of southeast Ohio, which
extends westward from the Allegheny Mountains as a subdivision of the Appalachian
Mountain Range. The landscape is unglaciated rolling hills with deciduous forest
communities dominated by Quercus, Acer, Fagus, and Carya species (Braun, 1950).
However, much of the land was cleared for agricultural purposes beginning in the
1800s; therefore, the existing forests are in various stages of regeneration following
decline of agricultural use in the 1900s.
The study site is located on land that was mined in the early 1980s originally
part of the Muskingum Mine. The land was owned and mined by Central Ohio Coal
Company, a subsidiary of American Electric Power Company, Columbus, OH, but
Page 68
50
was donated to The International Center for the Preservation of Wild Animals, Inc.
(the Wilds) for conservation and educational purposes. During mining, all overburden
was removed above the coal seams and was piled in previously mined areas. As
required by SMCRA 1977, the mine spoil was then contoured during reclamation to
approximate the original ―rolling hill‖ landscape and covered with stockpiled topsoil
or substitute material approximately 20 cm deep. Non-native forage grasses and
legumes were seeded to establish a vegetation ground cover.
It is unknown exactly what species were planted during reclamation, but a
survey of vegetation at the study site in 2005 included tall fescue (Festuca
arundinaceae Schreb.), Kentucky bluegrass (Poa pratensis L.), and bird‘s-foot trefoil
(Lotus corniculatus L.). Other forage species found nearby included smooth brome
(Bromus inermis Leyss.) and meadow foxtail (Alopecurus pratensis L.). Non-forage
species included Canada thistle (Cirsium arvense (L.) Scop.), a non-native weedy
species, common milkweed (Asclepias syriaca L.), a native perennial forb, and
autumn olive (Elaeagnus umbellata Thunb.), an invasive woody species.
Plot establishment and management
A plot area was selected in April 2005 near the base of a southwest facing
slope on a reclaimed spoil ridge. The overall plot area measured 32x24 m and
consisted of four blocks each containing 16 2x6-m plots. The experimental design
was a randomized complete-block with four replications for each planting. Each plot
was further subdivided into three 2 m2 subplots to facilitate multiple plantings in both
Page 69
51
2005 and 2006. In April 2005, the plot area was sprayed to kill existing vegetation
using glyphosate herbicide at a rate of 4.6 kg active ingredient (a.i.) ha-1
. Four plots
containing the existing forage complex were left un-sprayed as controls. On May 7,
2005, dying plant material and debris were removed and the soil surface was loosened
with a Bluebird® power dethatcher. Plots were raked with a heavy steel-tined rake to
a depth of approximately 2-3 cm prior to seeding.
Following initial plot area preparation and planting, herbicides were applied to
selectively kill Canada thistle and witchgrass (Panicum capillare L.) in the planted
grass stands. Plots planted in 2006 were re-sprayed prior to planting with glyphosate
herbicide to kill remaining vegetation. See chapter two for specific details.
Species selection
Grass species selected for this study are native to North American grassland
ecosystems (Hitchcock, 1971; Stubbendieck et al., 1986; Klips, 2004). Warm-season
tallgrass prairie species were eastern gamagrass (Tripsacum dactyloides L.), big
bluestem (Andropogon gerardii Vitman), tall dropseed (Sporobolus asper (Michx.)
Kunth), Indiangrass (Sorghastrum nutans (L.) Nash), and sideoats grama (Bouteloua
curtipendula (Michx.) A. Gray). Cool-season tallgrass prairie grasses seeded were
Virginia wildrye (Elymus virginicus L.) and slender wheatgrass (Elymus trachycaulus
(Link) Gould ex Shinners); however, slender wheatgrass is also found abundantly in
the northern Great Plains. Warm-season grasses primarily associated with mixed- and
short-grass prairies were little bluestem (Schizachyrium scoparium (Michx.) Nash),
Page 70
52
blue grama (Bouteloua gracilis (Willd. Ex Kunth) Lag. Ex Griffiths), and buffalograss
(Buchloe dactyloides (Nutt.) Engelm). Cool-season grass occurring in the mixed- and
short-grass regions were western wheatgrass (Pascopyrum smithii (Rydb.) A. Löve),
green needlegrass (Stipa viridula Trin.), and prairie Junegrass (Koeleria macrantha
(Ledeb.) J.A. Schultes); however, prairie Junegrass also occurs frequently in western
grasslands. Cool-season grasses primarily occurring in the shrub-steppe of the
intermountain west include and Sandberg bluegrass (Poa secunda J. Presl) and Snake
River wheatgrass (Elymus wawawaiensis J. Carlson & Barkworth).
All seeds, except tall dropseed, eastern gamagrass, Sandberg bluegrass, and
Snake River wheatgrass were purchased from Western Native Seeds, Coaldale, CO
USA. Tall dropseed was purchased from Oak Prairie Farm, Pardeeville, WI USA.
Eastern gamagrass was purchased from the Gamagrass Seed Company, Falls City, NE
USA. Sandberg bluegrass and Snake River wheatgrass seed were purchased from
Grassland West Co., Clarkston, WA USA.
Soil compaction and analysis
Soil compaction (g dry soil cm-3
) was determined at 0-5, 5-10, 10-15, and 20-
25 cm depths of the mine soil profile. Two 5-cm diameter soil cores, 0-15 cm and 20-
35 cm deep were collected from each of the four plots left in the original forage
vegetation with a slide-hammer soil coring device with removable sleeves. Each 15-
cm core was divided into three 5-cm lengths using individual 5-cm sleeves placed in
the coring device. The 20-25 cm depth was collected from a second core taken in the
Page 71
53
same hole. The individual 5-cm segments were weighed wet, dried at 55 ºC for 96 h,
then re-weighed. Weight of the sleeve was subtracted from both the wet and dry
weights. Bulk density was calculated on a dry-weight basis by dividing the dried soil
weight (g) by the sleeve volume (cm3).
Soil samples for chemical analysis were collected in October 2007 from plots
left in the existing forage vegetation. Samples were collected from 0-5, 5-10, 10-15,
and 15-20 cm depths. Samples were analyzed for pH, soil organic matter (SOM),
nitrate nitrogen (NO3-N), phosphorus (P), potassium (K), calcium (Ca), and
magnesium (Mg) by A & L Analytical Laboratories, Inc., Memphis, TN.
Biomass and canopy cover measurements
Aboveground biomass was sampled in all plots during October of 2005, 2006,
and 2007. Sampling was conducted to minimize the amount of disturbance to the
plots. For the 2005 planting, these censuses represented first year (YR1), second year
(YR2), and third year (YR3) growth, respectively. For the 2006 planting, 2006 and
2007 represented YR1 and YR2 growth, respectively. Clipping was limited to the area
outside the center 1 m2 area, which was reserved for population density counts.
Clipped biomass was put in paper bags and dried at 55 ºC for a minimum of 96 h. For
buffalograss and tall dropseed, which produced dense uniform stands, a 20x50-cm
area was clipped and dry weight biomass was calculated on an area basis. For all
other species, biomass was estimated by clipping individual plants to determine
average dry weight per plant, and then multiplying by the population density. For
Page 72
54
species other than western wheatgrass, 5 representative plants were clipped from each
plot. Several species had low population density and 5 individuals was the minimum
that could be found outside the center 1 m2 area. For western wheatgrass, 100
individual shoots were clipped. For the existing vegetation, a 1 m2 area in the center
of one of the three sub-plots in each main plot was clipped and all biomass was
bagged together. Clipping height was 1 cm for all species except eastern gamagrass,
which was clipped 5 cm above the ground. All biomass measurements were
calculated on a 1 m2 area basis for analysis and comparison. In addition, per-plant
biomass (g dry weight plant-1
) for each species was calculated by dividing biomass (g
m-2
) by population density (plants m-2
).
During the three years of this study, biomass and cover were measured in
October when most warm-season grasses were dormant, or nearly so; however, eastern
gamagrass and buffalograss still had green leaves and appeared to be actively growing.
The cool-season grasses, slender wheatgrass, Virginia wildrye, and western
wheatgrass, and the existing forage species, were all actively producing new leaves
with the cooler autumn temperatures (personal observation). Sampling at this time
was intended to capture the current year‘s growth; however, cool-season grass
biomass may have included some senescent leaf material from the previous autumn
and winter. Furthermore, turnover of leaves and culms during the growing season
could have resulted in underestimation of biomass. During sampling, attention was
given to collecting all living and senescent biomass from the past year‘s growth for
each plant harvested to minimize this potential error.
Page 73
55
Canopy coverage was estimated visually within a 1 m2 frame placed in the
center of each subplot and assessed on six coverage classes as follows: class 1 = 0-5%,
class 2 = 5-25%, class 3 = 25-50%, class 4 = 50-75%, class 5 = 75-95%, and class 6 =
95-100% canopy cover (Daubenmire, 1959). For consistency, all estimates were made
by the author. The midpoints of each range were substituted for the class number in
the statistical analysis and presentation.
Statistical analysis
All data were mathematically transformed to improve conformance with
assumptions inherent in analysis of variance (ANOVA) statistical tests. Biomass data
were transformed using the following equation:
(biomass m-2
+ 0.05)0.25
eq. 1
Cover percents were transformed using the following equation:
(arcsine(cover percent / 100))0.5
eq. 2
Per-plant biomass was transformed using the following equation:
(biomass plant-1
)0.25
eq. 3
Transformed data were analyzed using PROC GLM in SAS/STAT® software (SAS,
2007). Protected Fisher‘s LSD test was used to separate means within comparisons of
interest, differences were accepted only if the P-value calculated by the GLM test was
0.05, or less (Milliken and Johnson, 1984). All transformed means were back
transformed for presentation.
Page 74
56
Results and Discussion
Yearly fluctuations in precipitation likely had an influence on production and
growth. May and June of 2007 were considerably drier than in 2005 or 2006 (Table
2). In 2006, near-normal precipitation was recorded from March through July;
whereas, in 2007, precipitation was below normal from April through June causing
drought stress to be visible on many of the grasses, including the existing Kentucky
bluegrass and tall fescue.
Soil properties most conducive for plant growth were found in the top 5 cm of
the mine soil profile. In this layer, SOM measured 5.8%, P was 19 mg Kg-1
, and bulk
density averaged 1.05 Mg m-3
(Table 8). Below 5 cm, P was low, ranging between 2
and 4 mg Kg-1
, and soil was more compact with bulk density up to 1.74 Mg m-3
at 20
cm. Furthermore, SOM was only 1.6% at the 5-10 cm and 0.7% at the 15-20 cm
depth. At all depths, pH was basic, ranging from 7.5 to 7.9, reflecting the high
concentration of Ca from limestone deposits in the overburden.
Canopy cover
Canopy cover is a measure of how well a species (or group of species)
occupies space, at least in a two-dimensional plane. For comparison, canopy cover of
the existing forage vegetation in control plots was assessed as one entity and measured
98% cover in all plots all years (Table 9). Individually, Kentucky bluegrass coverage
was assessed at 98% in all plots, whereas tall fescue and bird‘s-foot trefoil cover
averaged 38 and 19%, respectively (data not shown). Canopy cover is important from
Page 75
57
a soil conservation standpoint; however, Kentucky bluegrass is a vigorous competitor
that produces a thick sod of densely growing rhizomes, which inhibits seedling
establishment of other species (Curtis and Partch, 1948; Sampson and Moser, 1982;
Jackson, 1999) and likely plays a role in maintaining low plant diversity on reclaimed
mine lands. Successful establishment of a diverse community would require
disruption of the existing vegetation so that new species could establish.
In this study, the existing vegetation was removed with herbicides prior to
planting. Species with the quickest development and most consistent maintenance of
canopy cover were buffalograss, tall dropseed, and eastern gamagrass. Canopy cover
for these grasses was estimated between 80 and 90% in all censuses except for the
2006 spring planting of eastern gamagrass, which was only 59% (Table 9). This
demonstrates an ability to compete quickly for space, independent of yearly
fluctuations in weather. Slender wheatgrass and Virginia wildrye planted in 2005 also
covered the soil quickly, averaging 80 and 89% cover in YR1, respectively.
Establishment of these grasses was lower in the 2006 planting (See Chapter 2), which
resulted in lower canopy cover values of 7 and 44%, respectively, in the YR1 census
(Table 9). However, slender wheatgrass cover increased to 84% by the YR2 census of
the 2006 planting. Virginia wildrye was severely grazed by rodents during the 2006
growing season, which may explain the 7% canopy cover measured in YR1 of this
planting.
Big bluestem, little bluestem, and Indiangrass had the lowest canopy cover in
YR1 of the 2005 planting, averaging 20, 20, and 37%, respectively (Table 9). By
Page 76
58
YR3, big bluestem averaged 74% and was not different from either slender wheatgrass
or Virginia wildrye. Better establishment of Indiangrass in the 2006 planting resulted
in 68 and 74% cover in the YR1 and YR2 censuses, respectively, which was not
different from the existing forage vegetation. Little bluestem cover ranged from 15 to
37% in all censuses, which reflected low establishment density (See Chapter 2).
Western wheatgrass cover was 15% in YR1, but 84% in YR2 as it was able to spread
and fill open gaps left from YR1. Western wheatgrass is tolerant of high soil pH and
apparently not inhibited by periodically saturated soil. In spite of the low cover in
YR1, western wheatgrass seemed well adapted to the mine soil habitat.
The decline in cover for sideoats grama and blue grama reflected their decline
in plant density through the second and third year following planting (See Chapter 2).
Sideoats grama went from 74% cover in YR1 of the 2005 planting to only 2% by YR2
and 0% by YR3 (Table 9). This trend was consistent in both plantings and also
apparent for blue grama as it had only 2% cover in YR3 of the 2005 planting, and 1%
cover in YR2 of the 2006 planting. The quick and complete loss of cover and
presence of these species resulted in bare soil, which was open for reinvasion by the
non-native forage species, or invasion by early successional species represented in the
seedbank or nearby extant populations (Appendix B, Table 23).
In addition to canopy cover, eastern gamagrass had greater vertical structure
than all other species in the study. Leaf canopy height for eastern gamagrass, 3 years
post-planting, measured 90 cm (data not shown). Leaf canopy height for eastern
gamagrass was three times higher than Kentucky bluegrass (30 cm), and more than
Page 77
59
twice the height of tall fescue (40 cm). All other species, except tall dropseed, had
leaf canopy heights less than 40 cm. From a restoration standpoint, eastern gamagrass
would provide greater structural diversity on reclaimed mine soil. Greater
aboveground structure should also correlate with greater belowground growth and
structure (Fitter, 1986; Tilman and Wedin, 1991; Dwire et al., 2004).
Biomass
Aboveground biomass produced by the existing forage vegetation, which
consisted primarily of Kentucky bluegrass and tall fescue, yielded 421, 440, and 314 g
m-2
in 2005, 2006, and 2007, respectively (Table 10). For comparison, mean biomass
yield of tall fescue monocultures grown in 2005 and 2006 southern Ohio forage
research trials was 1175 and 1324 g m-2
, respectively (Sulc et al., 2006). These yields
were produced on silt-loam soil that was fertilized with N, and represented multiple
clippings per year. On the reclaimed mine soil, the existing non-native forage
vegetation produced roughly one third of that produced by the pure stands of tall
fescue grown on productive agricultural land, and was more similar in yield to two
sites of Nebraska tallgrass prairie where biomass of 400 and 470 g m-2
were recorded
(Mitchell et al., 1996). Furthermore, tall fescue growing on a reclaimed mine soil in
Virginia yielded 458 g m-2
six years after planting, but then yielded only 197 g m-2
on
the seventh year with different climate conditions (Evanylo et al., 2005). At three
southeast Ohio reclaimed mine sites, aboveground biomass 5 years after planting with
forage grass/legume mixes, averaged 329, 288, and 337 g m-2
(Shrestha et al., 2009).
Page 78
60
These reports suggest that productivity of the reclaimed mine site in this study
was comparable with other reclaimed mine soils in the region, and even with some
tallgrass prairies, but soil compaction, low fertility, and species composition may have
limited potential productivity. Alleviating compaction on reclaimed mine soil would
require deep ripping of the profile with heavy equipment (Croton and Ainsworth,
2007) and could be costly if applied to large areas of land. Increasing fertility is costly
but less difficult than modifying bulk density throughout the profile; however, simply
fertilizing the existing forage vegetation would likely increase biomass at the expense
of diversity (Tilman, 1993; Baer, et al., 2003). If biomass production is the ultimate
goal, i.e. biofuel production, then increasing fertility to benefit highly competitive
species with superior growth potential would be an option, as is the case with corn-
based ethanol production or forage production. However, long-term sustainability
would be compromised if input costs outweigh marginal benefits. Changing
community composition would be more desirable from an ecological perspective as
ecosystems with greater diversity tend to optimize stability and productivity (Tilman
et al., 2006).
In this research, biomass production was higher for the existing forage
vegetation (421 and 440 g m-2
), compared with the other grasses, only in the first year
of production of both the 2005 and 2006 plantings (Table 10). This was anticipated as
new plantings of perennial grasses are normally less productive than established
stands. However, by YR2, biomass production from tall dropseed, buffalograss,
eastern gamagrass, and western wheatgrass were each similar to the existing
Page 79
61
vegetation. For the 2005 planting, YR2 production of tall dropseed, eastern
gamagrass, and buffalograss averaged 626, 571, and 277 g m-2
, respectively (Table
10). Western wheatgrass had produced 212 g m-2
by YR2 of the 2006 planting, and
was also similar to the existing forage vegetation. Productivity of these native grasses
was similar to the existing non-native forage vegetation in the second year of
establishment, which suggests good pre-adaptation to the habitat. Furthermore, these
grasses had established dense stands (See Chapter 2) and were tolerating the
compacted soil. By YR3 of the 2005 planting, Virginia wildrye had produced 271 g
m-2
and was also similar to the existing forage vegetation (Table 10).
Production of big bluestem, Indiangrass, and little bluestem was consistently
less than the existing forage vegetation in all censuses (Table 10); however, this was
also a function of lower population density (See Chapter 2). These grasses are
dominant components of mixed and tallgrass prairies throughout the North American
central grasslands, but are considered slower to establish than other grasses, especially
non-native cool-season species (Robocker et al., 1953; Hsu and Nelson, 1986; Tilman
and Wedin, 1991). In YR3 of the 2005 planting, biomass produced by big bluestem,
Indiangrass, and little bluestem was only 95, 87, and 49 g m-2
, whereas the existing
vegetation produced 314 g m-2
. In contrast, sideoats and blue grama could not
maintain productivity over the duration of the study. Yield of sideoats grama declined
from 152 to 1 g m-2
between YR1 and YR3 of the 2005 planting, while blue grama
yield declined from 98 to 0 g m-2
in the same planting (Table 10). At the end of the
Page 80
62
study in 2007, only a sparse few plants of these two species could be found and were
growing only in drier areas of the plot site (personal observation).
Performance of the cool-season slender wheatgrass and Virginia wildrye was
mixed. Virginia wildrye produced greater biomass (271 g m-2
) than slender
wheatgrass (94 g m-2
) only in YR3 of 2005 planting (Table 10). Virginia wildrye did
not yield well in the 2006 planting, producing only 2 and 11 g m-2
in YR1 and YR2,
respectively, but herbivory from rodents was observed and likely reduced the harvest
yield. Slender wheatgrass biomass in YR2 of the 2005 planting (256 g m-2
) was not
different from the existing forage vegetation, but in YR3 yielded 94 g m-2
and was
30% less than the existing vegetation. This suggests that slender wheatgrass may be
productive early during community development but declines with time. Leaves of
slender wheatgrass developed discoloration during summer (personal observation),
which may have indicated a mineral deficiency, such as phosphorus given the
calcareous nature of the mine soil. Virginia wildrye did not show signs of stress at
anytime during the study; however, it is apparently preferred by some herbivores,
which suggests it may be beneficial from a wildlife perspective.
Comparing these grasses on a per-plant basis gives a different assessment than
could be made from comparisons on an area basis, as above. Per-plant biomass for
Indiangrass (2.9 g plant-1
), big bluestem (1.7 g plant-1
), and little bluestem (1.3 g plant-
1), averaged across all three years and both plantings, was not different from tall
dropseed, which averaged 2.2 g plant-1
(Table 11). This is an important comparison
because tall dropseed yielded as well as the existing forage vegetation on an area basis
Page 81
63
in both YR2 and YR3. In addition, Indiangrass, big bluestem, and little bluestem did
not decline in per-plant biomass from YR1 through YR3. This suggests that once
these species become established, they are productive on the reclaimed mine soil.
Furthermore, eastern gamagrass, which was more robust than all other grasses, had the
greatest per-plant biomass yielding 11.7 g plant-1
. In contrast, sideoats and blue grama
both declined in per-plant biomass during this research. In YR1, sideoats and blue
grama averaged 3.2 and 0.7 g plant-1
, respectively, but averaged only 0.1 and 0.2 g
plant-1
, respectively, by YR2 (Table 11).
Summary
Productivity of grasses planted in this study reflected variability in moisture
conditions during the growing season on the mine soil habitat. Moisture was
consequential, but at different levels. Soil moisture status ranged from standing water
during late winter and spring to very dry during summer months when precipitation
was limited and evaporation greater. During spring months, and especially following
rainy periods, the soil profile was saturated over much of the plot area to the extent
that the water table was at the soil surface (Chapter 2). Both eastern gamagrass and
buffalograss were productive throughout the study, which suggests moisture
limitations due to soil compaction are not necessarily a barrier to species from either
arid or mesic environments. However, excess moisture is a barrier for species
intolerant of anaerobic conditions, such as blue grama and sideoats grama. Sideoats
Page 82
64
and blue grama were the only species that declined in both per-plant biomass and total
biomass during this research. Both these grasses are listed as intolerant of anaerobic
soil conditions (USDA, 2009), thus their decline is likely related to their intolerance to
the mine soil habitat. These grasses were productive in their first year, but did not
survive the first winter and spring following planting when the soil was saturated.
In general, with the exception of buffalograss, species that were most
productive on the mine soil were native to moist environments. Eastern gamagrass,
tall dropseed, Virginia wildrye, and western wheatgrass are found in mesic grassland
habitats and were most productive in this research in both aboveground biomass and
canopy cover production. In their second year of establishment, these species, with
the exception of Virginia wildrye, equaled the yearly biomass produced by the existing
non-native forage vegetation. Buffalograss is native to the driest region of the Great
Plains and is very tolerant of drought, but also appears tolerant of periodic saturated
soil and is productive in higher rainfall regions. Tallgrass prairie species big bluestem
and Indiangrass established poorly but were productive on a per plant basis,
suggesting the mine soil may be somewhat limiting for seedlings, but less problematic
for established plants.
This research suggests that mesic environments should be referenced for
assembling a diverse prairie community on the reclaimed mine soil. Tallgrass prairies
in the southeast portion of the central grasslands where precipitation is greatest and
species such as eastern gamagrass are prevalent may be useful models. Also, wetland
prairies may also contain species such as sedges and forbs that would be good
Page 83
65
candidates in constructing a ―native‖ calcareous mine soil community. This research
demonstrates native prairie grasses can be productive on calcareous compacted mine
soil, but species selection must include adaptation to the mine soil habitat.
Page 84
66
Table 8. Properties of soil collected from the top 20 cm, in 5 cm increments,
from reclaimed coal mined study site in southeast Ohio. Samples collected
randomly from the Wilds study site on October 2007.
Depth1 pH SOM NO3-N P K Ca Mg
Bulk
density2
(cm)
(%) --------------(mg Kg-1
)-------------- (Mg m-3
)
0-5 7.5 5.8 < 5 19 233 4091 940 1.05
5-10 7.6 1.6 < 5 4 225 5608 995 1.51
10-15 7.9 1.0 < 5 2 168 5869 851 1.65
15-20 7.7 0.7 < 5 3 183 6630 986 1.743
1 Six samples were collected from four plots containing pre-existing vegetation
and were bulked together. Individual samples measured 2x20 cm and were
partitioned into their corresponding depth.
2 Samples for bulk density were collected with a slide-hammer soil probe
containing a 3.2x15 cm sleeve.
3 15-20 cm depth was not available; value is from 20-25 cm depth.
Page 85
67
Table 9. Canopy cover of grasses, measured the first (YR1), second (YR2), and
third (YR3) years following planting, on reclaimed mine soil in southeast Ohio.
2005 Planting2 2006 Planting
3
Species1 YR1 YR2 YR3 YR1 YR2
----------- (%) ----------- --------- (%) ---------
Existing vegetation4 98 a 98 a 98 a 98 a 98 a
Eastern gamagrass 85 ab 98 a 98 a 59 bcd 95 ab
Tall dropseed 85 ab 98 a 98 a 83 ab 95 ab
Big bluestem 20 c 30 bc 74 bc 11 f 62 bc
Indiangrass 37 c 43 b 56 cd 68 abc 74 abc
Little bluestem 20 c 21 bcd 31 d 15 ef 37 cd
Sideoats grama 74 b 2 d 0 e 70 abc 15 de
Blue grama 80 ab 12 cd 2 e 30 def 1 e
Buffalograss 87 ab 98 a 98 a 98 a 98 a
Virginia wildrye 80 ab 98 a 92 ab 7 f 15 de
Slender wheatgrass 89 ab 92 a 88 ab 44 cde 84 ab
Western wheatgrass --- --- --- 15 ef 88 ab
1 Multiple comparisons between species are made for each census using protected
Fisher‘s LSD (α=0.05). Values in each column followed by the same letter are
not different.
2 YR1 = 2005, YR2 = 2006, and YR3 = 2007.
3 YR1 = 2006, YR2 = 2007.
4 Existing vegetation consisted of Kentucky bluegrass, tall fescue, and bird‘s-foot
trefoil.
Page 86
68
Table 10. Aboveground biomass of grasses, measured in censuses in October of
the first (YR1), second (YR2), and third (YR3) years following planting, on
reclaimed mine soil in southeast Ohio.
2005 Planting year2 2006 Planting year
3
Species1 YR1 YR2 YR3 YR1 YR2
----------- (g m
-2) ----------- ------- (g m
-2) -------
Existing vegetation4 421 a 440 ab 314 ab 440 a 314 a
Eastern gamagrass 114 b 571 ab 496 a 176 b 271 a
Tall dropseed 119 b 626 a 413 ab 111 b 306 a
Big bluestem 8 d 82 de 95 cd 5 cd 72 cd
Indiangrass 31 cd 150 cd 87 cd 94 b 79 bcd
Little bluestem 13 d 30 ef 49 d 10 cd 52 de
Sideoats grama 152 b 3 g 1 e 111 b 15 e
Blue grama 98 b 9 fg 0 e 23 c 0 f
Buffalograss 156 b 277 abc 197 bc 180 b 223 ab
Virginia wildrye 91 b 61 de 271 ab 2 d 11 ef
Slender wheatgrass 83 bc 256 bc 94 cd 25 c 83 bcd
Western wheatgrass --- --- --- 4 cd 212 abc
1 Comparison between species are made at each census with a protected Fisher‘s
LSD (α=0.05). Values in each column followed by the same letter are not
different.
2 YR1 = 2005, YR2 = 2006, and YR3 = 2007.
3 YR1 = 2006, YR2 = 2007.
4 Existing vegetation consisted of Kentucky bluegrass, tall fescue, and bird‘s-foot
trefoil.
Page 87
69
Table 11. Per-plant biomass of grasses growing on calcareous reclaimed mine soil
in southeast Ohio measured the year of planting (YR1) and in the second
(YR2) and third (YR3) years following planting.
Biomass per plant
Species YR1 YR2 YR3
Mean
-----------(g plant-1
)1 -----------
(g plant
-1)2
Eastern gamagrass 6.0 b 15.3 a 21.7 a
11.7 a
Indiangrass 1.1 b 4.6 a 5.5 a
2.9 b
Tall dropseed 1.1 b 3.3 a 4.0 a
2.2 bc
Big bluestem 0.3 b 3.8 a 4.6 a
1.7 bc
Little bluestem 0.5 a 2.5 a 1.7 a
1.3 bcd
Buffalograss 0.7 b 1.3 a 1.6 a
1.1 cd
Virginia wildrye 0.4 b 0.7 b 7.4 a
1.0 cd
Slender wheatgrass 0.4 b 1.4 a 2.4 a
1.0 cd
Sideoats grama 3.2 a 0.1 b 0.0 b
0.5 de
Blue grama 0.7a 0.2 a 0.0 a
0.2 e
Western wheatgrass 0.1a 0.2 a na
0.1 e
1 The change in per-plant biomass for each species over the three-year census
periods is compared using protected Fisher‘s LSD (α=0.05).
2 Differences between species for mean per-plant density are compared using
protected Fisher‘s LSD (α=0.05).
Page 88
70
Chapter 4: Safe-sites Control Warm-season Prairie Grass Establishment on
Calcareous Compacted Mine Soil.
Abstract
Restoring native vegetation on surface mined land can be limited by available
propagules or safe sites where seedlings can establish. Surface mining in the eastern
U.S. has altered the landscape such that native forest species are unable to establish in
compact soil following reclamation. In place of forest species, non-native forage
species were planted and persist as a low-diversity forage complex. Native prairie
communities would impart greater diversity and function, but it is not clear if
increasing seed density would increase establishment success. This research examined
seeding rate on establishment of three dominant North American prairie grasses on
reclaimed calcareous mine soil in southeast Ohio. Big bluestem (Andropogon gerardii
Vitman), Indiangrass (Sorghastrum nutans (L.) Nash), and little bluestem
(Schizachyrium scoparium (Michx.) Nash) are prairie dominants in late-successional
prairie communities but are recognized as slow to establish. Seeds of each species
were sown at 1x and 2x rates onto bare-ground plots in May, 2006. Stand density and
plant biomass were assessed 30 days after planting (30DAP), and in autumn of the
first year (YR1) and second year (YR2) after planting. Density of each species sown
Page 89
71
at the 2x rate was greater at 30DAP, but not different from the 1x rate at YR1 or YR2.
Indiangrass experienced the greatest decline through YR2. Per-plant biomass was
greatest for Indiangrass in YR1, but no differences between species were found in
YR2. Only big bluestem and little bluestem plants increased in biomass between YR1
and YR2. Results indicate that population density is more related to safe site
availability than seed density, and that mechanisms of establishment differ between
species.
Keywords: Native grass establishment, seeding rate, safe sites, calcareous mine soil,
soil compaction.
Introduction
As Harper (1977) describes, ―the presence or absence and the density of a
seedling population depends not only on the availability of seed but on the frequency
of ‗safe sites‘ that provide the precise conditions required by a particular seed‖ to
germinate and develop into a viable plant. This dichotomy is realized in restoration of
disturbed land where habitat changes and propagule loss have altered the ‗normal‘
response to disturbance. Restoration often requires that species be reintroduced into
disturbed areas because of limited propagule availability (Foster and Tilman, 2003).
However, variability of microsites, i.e. combinations of mineral nutrients, space, light,
moisture, temperature, ground cover, competition, and soil exist across the landscape
and strongly affect seedling survival (Vogel, 1987; McKenna et al., 1991; Oswald and
Page 90
72
Neuenschwander, 1993; Burke and Grime, 1996; Masters, 1997; Getzin et al., 2008).
Consequently, poor stand establishment can result from either insufficient seed
number or from a limited number of microsites where resources are adequate for
germination and establishment of individual plants.
Reestablishing native vegetation on reclaimed surface mined land can be a
major challenge. Seed reserves in stockpiled topsoil are often inadequate to restore
disturbed land to pre-mined native communities (Iverson and Wali, 1982; Bellairs and
Bell, 1993). Therefore, seeds or live material, e.g. tree seedlings, must be planted
during reclamation to have any chance of reaching restoration goals. However,
reclaimed mine soil can differ structurally and chemically compared with the pre-
mined soil, and may not be capable of supporting native vegetation, i.e, inadequate
safe sites. Mine spoil can range in pH from acid to alkaline and be too low in nutrients
to support plant growth. Reclamation practices using heavy equipment to spread and
contour overburden can cause structural problems, such as soil compaction, which
impedes root growth and water permeability. For example, in the Appalachian coal
mining region of the eastern U.S., reclamation of surface coal mined land since the
enactment of the Surface Mining Control and Reclamation Act of 1977 (SMCRA,
1977) has produced highly compact soils incapable of regenerating the native
deciduous forest vegetation (Burger et al., 2002; Casselman, et al., 2006). In place of
native hardwood trees, these lands have been re-vegetated with highly competitive
non-native forage grasses and legumes that further inhibit native plant seedlings from
establishing (Evanylo et al., 2005; Casselman, et al., 2006). In areas where limestone
Page 91
73
sediments compose a portion of the overburden, calcareous conditions persist that
maintain alkaline pH and reduce the availability of phosphorus (Brady, 1984;
McBride, 1994). These conditions together alter the successional processes that would
regenerate hardwood forest, and favor a low-diversity forage species complex.
Establishing prairie communities would be an alternative for restoring diversity
and increasing structural and functional qualities to reclaimed mined land. Prairie
species native to the region, include warm-season grasses big bluestem, little
bluestem, and Indiangrass (Hitchcock, 1971; Klips, 2003; Klips, 2004). These species
are dominant components of tallgrass and mixed-grass prairies in the North American
central grasslands (Weaver, 1931); however, establishment is often slow compared
with non-native species such as tall fescue. In a related study (Chapter 2), big
bluestem, Indiangrass, and little bluestem establishment was sparse compared with
other prairie grass sown on reclaimed mine soil.
The objective of this study was to determine if establishment of big bluestem,
Indiangrass, and little bluestem on calcareous reclaimed mine soil is affected more by
seed rate or limited number of safe sites. Poor establishment would leave open gaps
that could be colonized by weedy species, thus slowing establishment of a prairie
community. If increasing seed rate would benefit stand establishment, then fewer
open gaps would be available. However, if establishment is limited by safe sites, then
no amount of seed is going to increase establishment success.
Page 92
74
Methods
Study Area
The area of interest is part of the Allegheny Plateau of southeast Ohio, which
extends westward from the Allegheny Mountains and is a subdivision of the
Appalachian Mountain Range. The landscape is unglaciated rolling hills with
deciduous forest communities dominated by Quercus, Acer, Fagus, and Carya species
(Braun, 1950). The study site is on reclaimed surface mined land are near
Cumberland, Ohio as part of a larger study examining native grass alternatives to non-
native forages (See Chapter 2). The site is located on land that had been mined in the
early 1980‘s by Central Ohio Coal Company, a subsidiary of American Electric Power
Company, Columbus, OH. During mining, all overburden material above the coal
seams was removed and, as required by reclamation law, then contoured to
approximate the original ―rolling hill‖ landscape during reclamation. The contoured
overburden (mine spoil) was then covered with a layer of stockpiled topsoil or
substitute material approximately 20 cm deep, and seeded with a mix of non-native
forage grasses and legumes to establish a vegetation ground cover.
The reclaimed soil in this region is classified as the Morristown series, a deep
and well drained soil with slow permeability that contains free lime and coarse
fragments with slopes ranging from 1 to 70 percent (Soil Survey staff, 1996). The top
20 cm consists of a dark brown silty clay loam soil with 10 percent coarse fragments
of shale, siltstone, and limy shale spread over the contoured overburden as a topsoil
replacement. Below 20 cm, the profile consists of light gray silty clay loam
Page 93
75
overburden that is alkaline and contains 10 to 40 percent coarse fragments. Bulk
density measured at the study site averaged from 1.05 g cm-3
at the surface to 1.74 g
cm-3
at 20 cm, while pH measured 7.5 to 7.9 (See Chapter 2). Available phosphorus
measured 19 mg Kg-1
and organic matter 5.8% in the top 5 cm but considerably less at
lower depths. During plot preparation, tillage was kept to a minimum to conserve
nutrients and structure in the surface layer.
Plot establishment
The experimental design was a randomized complete-block with four
replications for each planting. Whole plots measured 2x6 m and were subdivided into
three 2-m2 subplots to facilitate paired-plot comparisons between 1x and 2x seeding
rates. The third subplot was used for a different component of the study. Plots were
initially prepared in April 2005 near the base of a southwest facing slope on a
reclaimed calcareous spoil ridge. Pre-existing vegetation, consisted primarily of
Kentucky bluegrass (Poa pratensis L.), tall fescue (Festuca arundinaceae Schreb.),
and bird‘s-foot trefoil (Lotus corniculatus L.). All vegetation was killed in 2005 using
glyphosate herbicide at a rate of 4.6 kg active ingredient (a.i.) ha-1
. The soil surface
was then lightly tilled and loosened with a Bluebird® power dethatcher. Dead and
dying debris was removed from the plot area and the plots were fallowed through
2005 using glyphosate to control vegetation regrowth.
Page 94
76
Plot Management
Prior to planting in 2006, plots were re-sprayed in early-May with glyphosate
herbicide to kill vegetation that had re-established through the winter and spring. Two
weeks after spraying, plots were tilled with a steel-tine rake to prepare a loose 2–3 cm
deep seedbed. In late-May 2006, seeds were broadcasted into each plot and
incorporated with a steel-tine rack. Species planted were ‗Bison‘ big bluestem
(Andropogon gerardii Vitman), ‗Tomahawk‘ Indiangrass (Sorghastrum nutans (L.)
Nash), and ‗Itasca‘ little bluestem (Schizachyrium scoparium (Michx.) Nash). Seeds
were purchased from Western Native Seeds, Coaldale, CO USA. Two seeding rates
were applied for each species. Big bluestem was seeded at 474 (1x) and 948 (2x)
viable seeds m-2
, Indiangrass was seeded at 453 (1x) and 906 (2x) seeds m-2
, and little
bluestem was seeded at 566 (1x) and 1132 (2x) seeds m-2
(Table 12). Following
planting, supplemental irrigation of 7 and 5 mm was applied on May 25 and 29, 2006,
respectively, to moisten soil that had lightly crusted following a heavy rain soon after
planting.
In 2007, Canada thistle and other dicotyledonous weeds were selectively
controlled with tryclopyr herbicide on June 26 at an application rate of 1.0 kg acid
equivalent (a.e.) ha-1
. At the same time, sulfometuron methyl herbicide was applied at
a rate of 0.02 kg a.i. ha-1
to kill a flush of witchgrass (Panicum capillare L.) seedlings.
Sulfometuron methyl at low rates is effective at controlling annual warm-season
grasses in perennial warm-season grass stands without causing injury to the perennial
grasses at the applied rates (Peters et al., 1989).
Page 95
77
Population and biomass measurements
Population densities were counted at 30 days after planting (30DAP) in 2006
to assess early establishment, and then during October of 2006 (YR1) and 2007 (YR2)
to measure change in population density over time. Counts were made within a 1-m2
frame placed in the center of each 2x2-m subplot to avoid border effect. Aboveground
biomass was also sampled during October of 2006 and 2007 by collecting five
individual plants from each subplot, clipped 1 cm from the soil surface in the area
surrounding the center 1 m2 area. Biomass from each plot was bagged and dried in a
55 ºC oven for a minimum of 96 h, and then weighed to determine mean dry weight
per plant (per-plant biomass). The mean per-plant biomass was multiplying by the
population density to determine production on an area basis.
Statistical analysis
All data were mathematically transformed to improve conformance with
assumptions inherent in analysis of variance (ANOVA) statistical tests. For
population density and stand biomass, data were transformed by taking the square root
of each measurement. Per-plant biomass data were transformed by calculating the
log10 of each value. Transformed data were analyzed using PROC GLM in
SAS/STAT® software (SAS, 2007). Protected Fisher‘s LSD test was used to separate
per-plant biomass means within comparisons of interest and differences were accepted
only if the P-value from the GLM test was 0.05, or less (Milliken and Johnson, 1984).
All transformed means were back transformed for presentation.
Page 96
78
Results and Discussion
Overall, establishment rates were low for all three species. Big bluestem,
Indiangrass, and little bluestem had maximum 30DAP emergence of 8%, 23%, and
5% of viable seed sown, respectively (Table 12). However, low germination rates are
not unusual for these grasses. Cornelius (1944) averaged only 6.5%, 17.9%, and 3.3%
establishment rate of viable seeds sown for big bluestem, Indiangrass, and little
bluestem, respectively, during three consecutive years of a tallgrass prairie
revegetation study in Kansas. Seeding rate was not discussed as a factor; however,
Masters (1977) reported an increase in stand frequency in two Nebraska sites when
seeding rate of big bluestem was increased from 220 to 440 viable seed m-2
.
In our study, differences between seeding rates for each species were more
evident at 30DAP than at YR1 or YR2. The 30DAP counts in June 2006 for big
bluestem, Indiangrass, and little bluestem were 1.8, 1.9, and 3.0 times greater at the 2x
than the 1x seeding rates, respectively, but these margins diminished by the YR1
census (Table 12). At the 30DAP census, big bluestem densities averaged 69 and 39
plants m-2
for the 1x and 2x seeding rates, respectively, and the comparison was nearly
significant at α=0.05 (P=0.0664). However, at the YR1 and YR2 censuses, densities
were nearly identical between the two seeding with associated P-values of 0.8020 and
0.7677, respectively. This occurred because of a declining trend in big bluestem
density between the 30DAP and YR1 and YR2 censuses. Density at the 2x rate
declined from 69 to 33 plants m-2
(P=0.0585) whereas, density at the 1x rate declined
from 39 to 29 plants m-2
(P=0.0994).
Page 97
79
Indiangrass populations responded similarly to big bluestem at the 30DAP
census with germination reflecting the difference between seeding rates. Densities of
109 and 201 plants m-2
were counted at the 1x and 2x rates, respectively, with an
associated P-value of 0.0653 (Table 12). At the YR1 and YR2 censuses, differences
between rates were not found. However, between the 30DAP and YR2 censuses,
Indiangrass declined in density from 201 to 69 plants m-2
at the 2x rate (P=0.0006),
and from 108 to 49 plants m-2
at the 1x rate (P=0.0407). These differences clearly
reflect greater seedling mortality than was seen for big bluestem.
Little bluestem population at the 30DAP census was found to be greater at the
2x rate than the 1x rate (P=0.0285) with densities of 54 and 18 plants m-2
, respectively
(Table 12). But again, differences could not be detected between rates at the YR1 and
YR2 censuses, even though means were 2.5 and 1.6 greater for the 2x rate,
respectively. There was also no detectable change in density from 30DAP to YR2 for
either seeding rate. Stand density at the 2x rate averaged 54 plants m-2
at 30DAP and
29 plants m-2
in YR2. At the 1x rate, 18 plants m-2
were counted at each census.
For each species, difference between the 1x and 2x seeding rates did not
remain consistent throughout the course of the study (Table 12). Densities at the 2x
rate tended to be greater at the 30DAP census, but this was not evident at the YR1 or
YR2 censuses. This interaction would suggest that population density on reclaimed
mine soil is limited by the number of safe sites and not seed density. Given the rocky,
compacted soil, it is likely that the safe sites were related to areas conducive to root
development. The surface 0-5 cm of the mine soil contained greater organic matter
Page 98
80
and nutrients and was less compact than lower layers. At depths below 5 cm the soil
was compact and may have been a barrier to root growth and access to moisture.
However, rocks in the mine soil profile may have contributed to seedling survival
because roots growing along rock faces can access greater depths and moisture than
roots restricted by impenetrable layers (Nobel, et al., 1992; Haering, et al., 2004).
Grass seedlings that have access to greater soil moisture are more likely to
survive than those exposed to dry conditions (Stubbendieck and McCully, 1972;
Frasier et al., 1984). In this study, seedlings likely experienced dry soil during
summer months between periodic rainfall events. Soil moisture is critical for the
development of secondary roots as moist periods of 3 days or more are required for
their initiation and elongation (Newman and Moser, 1988a). Seedling mortality
occurring between the 30DAP census (June 2006) and the YR1 census (October 2006)
could have been related to moisture stress if seedlings were not able to develop
secondary roots. By October of 2006, surviving seedlings were dormant and some
crowns were observed elevated above the soil surface. Warm-season grasses tend to
elevate their crowns during germination due to elongation of the subcoleoptile
internode (Newman and Moser, 1988b). It is possible that seedlings germinating from
shallow depths elevated their crowns above the surface before secondary roots could
establish, and then died from drought stress.
Stand biomass measurements were similar between seeding rates for all
species at both YR1 and YR2 censuses (Table 13). This is consistent with the
similarity in population density between seeding rates. However, stand biomass for
Page 99
81
big bluestem and little bluestem increased from YR1 to YR2, whereas Indiangrass
production did not differ between years. From YR1 to YR2 at the 1x rate, big
bluestem biomass increased from 5 to 72 g m-2
(P<0.0001) and little bluestem biomass
increased from 11 to 54 g m-2
(P=0.0062). At the 2x seeding rate, big bluestem
biomass increased 8 to 61 g m-2
(P=0.0099) and little bluestem biomass increased 27
to 85 g m-2
(P=0.0263). Indiangrass seeded at the 1x rate, produced 96 g m-2
in YR1
and 81 g m-2
in YR2 with a comparison P-value of 0.4333. At the 2x rate, biomass
measured 157 and 115 g m-2
at the YR1 and YR2 censuses, respectively, with a
comparison P-value of 0.2506.
However, when biomass was examined on a per-plant basis, each of the three
species differed at the YR1 census (Figure 3). In YR1, Indiangrass plants were largest
averaging 1.8 g plant-1
, followed by little bluestem yielding 0.3 g plant-1
and big
bluestem averaging 0.02 g plant-1
. But in YR2, differences could not be detected
between the three species as Indiangrass, little bluestem, and big bluestem averaged
3.1, 11.5, and 5.5 g plant-1
, respectively. Between YR1 and YR2, the change in per-
plant biomass was significant for big bluestem (P<0.0001) and little bluestem
(P<0.0001), but not for Indiangrass (P=0.2094). This is partly because big bluestem
and little bluestem plants were smaller than Indiangrass plants in YR1; however, it is
unclear why Indiangrass plants did not gain in biomass during YR2.
Greater growth in the first year of establishment may or may not be associated
with likelihood of long-term survival (Huston and Smith, 1987). Individuals of early
successional species typically grow vigorously soon after disturbance and then decline
Page 100
82
in abundance and productivity during later years as individuals of late-successional
species become dominant. However, all three of the species in this study are
considered late-successional species in the North American central grasslands, but
they may differ in early development. For big bluestem and little bluestem, seedlings
that germinated in the first year acquired little aboveground biomass and only survived
in the most favorable microsites. In the second year, surviving individuals
substantially increased in biomass. However, Indiangrass seedlings were equally
productive during the first and second years of growth; yet, early biomass
accumulation apparently did not prevent seedling mortality.
This study suggests that a limited number of available microsites where
seedlings can germinate and survive through the first year of growth may be a limiting
factor for establishment of these three late-successional prairie species. Increasing
seeding rate does not appear to increase population density. This may be problematic
if the goal is to quickly establish a dense stand that will compete with pioneer and
non-native species, such as Kentucky bluegrass and tall fescue seeded during
reclamation. Competition from the non-native forage species would likely exclude
many bluestem or Indiangrass seedlings. Forage species were initially planted that
established quickly and were pre-adapted to the mine soil conditions, i.e. compaction,
basic pH, low permeability, etc.
Given the results from this study, it is clear that increasing seeding rate alone
would be insufficient to establishing warm-season late-successional prairie grasses. If
late-successional prairie species are to have a chance, strategies must be used to allow
Page 101
83
the seedlings time to establish without competition from existing or re-establishing
non-native species. Prior to planting, existing vegetation must be removed with
herbicides or tillage. Herbicides, such as atrazine or metolachlor applied prior to
planting (Vogel, 1987; Masters, 1997), or sulfometuron methyl at low rates for
selective grass weed control following planting (Peters et al., 1989) could release the
prairie grasses from competition. Furthermore, a fallow year prior to seeding using
glyphosate to control all vegetation, as was used in this study, is helpful in slowing the
reestablishment of non-native species, which are likely well represented in the seed
bank.
Page 102
84
Table 12. Effect of seeding rate on stand establishment of three warm season
native grasses on reclaimed calcareous mine spoil.
Species Seeding rate1 30DAP
2 YR1
3 YR2
4 P-value
----------(plants m
-2)---------
Big bluestem 2x 69 34 33 0.0585
1x 39 29 29 0.0994
P-value
0.0664 0.8020 0.7677
Indiangrass 2x 201 116 69 0.0006
1x 10⁸ 77 49 0.0407
P-value
0.0653 0.1958 0.2718
Little bluestem 2x 54 45 29 0.1149
1x 18 18 18 0.9874
P-value
0.0285 0.1187 0.1797
1 Big bluestem 1x rate = 474, 2x rate = 948 seeds m
-2; Indiangrass 1x rate = 453,
2x rate = 906 seeds m-2
; little bluestem 1x rate = 566, 2x rate = 1132 seeds m-2
.
2 30DAP census occurred 30 days after planting to assess early emergence.
3 YR1 census occurred in October of the first year following planting.
4 YR2 census occurred in October of the second year following planting.
Page 103
85
Table 13. Effect of seeding rate on stand biomass of three warm season native
grasses on reclaimed calcareous mine spoil.1
Species Seeding rate YR1 YR2 P-value
--------(g m
-2)--------
Big bluestem 2x 8 61 0.0099
1x 5 72 <0.0001
P-value
0.5588 0.6911
Indiangrass 2x 157 115 0.2506
1x 96 81 0.4333
P-value
0.3312 0.2039
Little bluestem 2x 27 85 0.0263
1x 11 54 0.0062
P-value
0.1084 0.1959
1 See Table 12 for description of seeding rates and censuses.
Page 104
86
YR1 YR2
Ab
ov
egro
un
d p
er-p
lant
bio
mas
s (g
pla
nt-1
)
0.01
0.1
1
10
100
(YR1-YR2; P=0.2094)
(YR1-YR2; P<0.0001)
(YR1-YR2; P<0.0001)
a
b
c
ns
Figure 3. Comparison of per-plant aboveground biomass (grams per plant) for big
bluestem, little bluestem, and Indiangrass in the first and second year of
establishment on reclaimed coal mine land in southeast Ohio. Differences
between species at each harvest were determined with Fisher‘s protected LSD
(α=0.05), and represented with lower case letters (a, b, c) for YR1; differences
between species for YR2 were not significant (ns). Species are represented by
lines and symbols as follows: big bluestem —●—; little bluestem ···○···;
Indiangrass – –▼– –.
Page 105
87
Chapter 5: Effectivity of Arbuscular Mycorrhizal Fungi of Reclaimed Calcareous
Surface Mine Soil and Native Tallgrass Prairie Soil on Growth of Prairie Grasses.
Abstract
Soil compaction and competition from non-native forages preclude
reestablishment of native deciduous forest communities on reclaimed calcareous
surface mined land on the Allegheny Plateau. Establishing tallgrass prairie
communities may increase structural and functional qualities of these lands.
Arbuscular mycorrhizal fungi (AMF) are critical for establishment and survival of
warm-season prairie grasses, especially when soil phosphorus (P) is low. It is unclear
if AMF associated with the mine soil vegetation would be effective in supporting
warm-season prairie grasses. Studies were conducted to determine if resident AMF are
as affective as native tallgrass prairie AMF for prairie grasses on reclaimed mine soil,
and to determine how the prairie grasses respond to AMF over a range of P levels.
Soil AMF inoculum was prepared from Claridon (CL) tallgrass prairie soil near
Marion, OH, and from a 30-year old reclaimed surface mine soil, now part of the
Wilds (WL), near Cumberland, OH. Growth of four prairie grasses colonized with CL
and WL AMF were compared with non-colonized controls, at three P levels, in a 16-
week glasshouse study. The WL AMF were as effective as CL AMF for all grasses
Page 106
88
suggesting a lack of effective AMF would not likely be a barrier for prairie grass
establishment. Soil P did not reduce AMF colonization, but did reduce AMF efficacy
at higher levels. Big bluestem (Andropogon gerardii Vitman) and Indiangrass
(Sorghastrum nutans (L.) Nash) benefited most from AMF. Tall dropseed
(Sporobolus asper (Michx.) Kunth) and slender wheatgrass (Elymus trachycaulus
(Link) Gould ex Shinners) growth at low P was not different between AMF and non-
AMF plants, indicating a facultative association with AMF for each species. Growth
of slender wheatgrass without AMF exceeded growth with AMF at higher levels of P.
Keywords: Calcareous mine soil, land restoration, arbuscular mycorrhizal fungi,
prairie grass establishment.
Introduction
Surface coal mining negatively impacts landscapes by altering soil structure
and chemistry, and by disturbing or diminishing beneficial soil organisms such as
AMF. During mining, vegetation is removed so that topsoil can be pushed aside in
stockpiles until post-mining reclamation. The removal of topsoil and subsequent
stockpiling disrupts AMF symbiosis, reduces inoculum potential, and alters species
composition of the AMF community (Gould and Liberta, 1981; Waaland and Allen,
1987). Revegetation of mined land is a critical component of reclamation but a
reduced or altered AMF presence in the mine soil may inhibit establishment of desired
species.
Page 107
89
The role of AMF is critical in restoring reclaimed mine soils (Lambert and
Cole, 1980; Waaland and Allen, 1987; Allen, 1989; Hetrick et al., 1994). Arbuscular
mycorrhizal fungi are symbiotic organisms that colonize root systems of most land
plants to gain organic carbon in return for minerals, primarily phosphorus, absorbed
and transferred to the plant by the fungi (Gerdemann, 1968; Rhodes and Gerdemann,
1975; Barrow et al., 1977; Smith and Smith, 1977; Cavagnaro, et al., 2005). This
symbiotic relationship is critical to the survival of many plant species, especially when
soil phosphorus is low (Brejda et al., 1993). In addition, AMF may affect plant
community composition and successional trajectories by differentially benefiting some
plants over others (Janos, 1980; Allen and Allen, 1984; Crowell and Boerner, 1988;
Allen and Allen, 1992; Gange et al., 1990; Gange et al., 1993; Hartnett et al., 1994;
Koske and Gemma, 1997; Gillespie and Allen, 2006).
While AMF symbiosis is common and occurs in nearly every terrestrial
environment (Smith and Smith, 1997), differences in the effectiveness of AMF occurs
over the landscape and with different management histories (Scullion et al., 1998;
Gillespie and Allen, 2006). Strains of AMF from infertile soils are shown to be more
effective at phosphorus transfer to plants than AMF from fertile soil (Henkel et al.,
1989). Greater effectivity has been found in AMF from zinc contaminated soil as well
other stressful habitats (Shetty et al., 1995; Thorne et al., 1998). These studies suggest
that in harsh, low-nutrient habitats, there is selection for superior AMF strains.
Furthermore, a certain degree of host-plant-specificity occurs between AMF and host
plants (Zhu et al., 2000; Ronsheim and Anderson, 2001; Bevor, 2002; Sanders, 2003).
Page 108
90
This suggests that AMF specific to undisturbed native communities might be best
adapted and more effective to associated plants than introduced or non-native AMF.
Conversely, plants introduced into new environments might benefit less from the
indigenous AMF than would plants long established in those environments.
In southeast Ohio, surface coal mining has converted nearly 80,000 hectares of
native deciduous forest land to non-native forage grassland (Kaster and Vimmerstedt,
1996). Since 1972, reclamation laws have required the overburden to be contoured to
approximate the original landscape form, and the stockpiled topsoil to be spread over
the newly constructed landscape. However, revegetation need not necessarily include
native species if preapproved plans state otherwise (SMCRA 1977). In place of the
native forest species, reclaimed mined land has been seeded with non-native forage
species such as tall fescue (Festuca arundinaceae Schreb.), Kentucky bluegrass (Poa
pratensis L.), and bird‘s-foot trefoil (Lotus corniculatus L.), which establish easily and
tolerate soil compaction caused by reclamation procedures. These cool-season forages
have established a thick ground cover important for controlling erosion and have
likely maintained AMF across the landscape, but, they are competitive and have
inhibited development of the native vegetation and diversity.
Replacing the non-native forage complex with regionally native prairie species
is one alternative for increasing biodiversity as a first step in restoring ecosystem
function on reclaimed mine sites that are incapable of supporting native forest species.
Tallgrass prairies are native to parts of Ohio and may represent a diverse set of species
that could enhance the functional quality of the mined land (Transeau, 1935; Sala et
Page 109
91
al., 1988; Klips, 2004). However, it is unclear if AMF associated with the cool-season
forage species currently growing on the reclaimed mine land would be effective in
supporting the tallgrass prairie vegetation. Warm-season tallgrass species are more
dependent on AMF than cool-season grasses (Loree and Williams, 1987; Hetrick et
al., 1991; Brejda et al., 1993; Noyd et al, 1995) and problems with host specificity or
effectivity could delay or limit their establishment (Cavender and Knee, 2006).
This research compares the infective and effective potential of AMF collected
from a central Ohio tallgrass prairie remnant with AMF from reclaimed mine soil on
growth of four native tallgrass prairie grasses. The grass species evaluated are big
bluestem (Andropogon gerardii Vitman), Indiangrass (Sorghastrum nutans (L.) Nash),
tall dropseed (Sporobolus asper (Michx.) Kunth), and slender wheatgrass (Elymus
trachycaulus (Link) Gould ex Shinners). Slender wheatgrass is a cool-season grass
while big bluestem, Indiangrass and tall dropseed are all warm-season grasses; all four
occur throughout the central grassland region of North America, including tallgrass
prairies (Hitchcock, 1971). The reclaimed mine soil in question has supported a non-
native forage complex of three species for 30 years. The tallgrass prairie remnant
contains 177 plant species including the signature tallgrass prairie grasses big
bluestem, Indiangrass, tall dropseed, little bluestem (Schizachyrium scoparium
(Michx.) Nash), and switchgrass (Panicum virgatum L.) (Klips, 2003; Klips, 2004).
The objectives of this research were 1) to determine if AMF associated with mine soil
vegetation are as affective as native tallgrass prairie AMF in supporting prairie grass
growth on reclaimed mine soil, and 2) to determine how these prairie grasses respond
Page 110
92
to each AMF in relation to a range of soil phosphorus levels. The goal of these studies
was to identify growth responses of prairie grasses to AMF and phosphorus that would
aid in developing strategies to increase biodiversity and ecosystem function on
compacted reclaimed mine soil.
Methods
AMF sources and pot culture
Sources of AMF were the Claridon (CL) tallgrass prairie remnant near Marion,
Ohio, and the Wilds (WL), a reclaimed surface mined area near Cumberland, Ohio.
The CL site is a 2.2 ha linear remnant owned by the CSX Railroad and is overseen by
the Marion County Historical Society (Klips, 2003; Klips 2004). The WL site is
located on land that had been surface mined in the early 1980‘s, and was once part of
the Muskingum Mine, then owned and mined by Central Ohio Coal Company, but
was donated in 1986 to The International Center for the Preservation of Wild Animals,
Inc. (the Wilds). The area is part of the Allegheny Plateau of southeast Ohio, which
extends westward from the Allegheny Mountains and is a subdivision of the
Appalachian Mountain Range.
Approximately 35 liters of soil were collected from each site during
September, 2005. Soil from the surface 20 cm was collected from 15-20 randomly
selected locations at each site using a metal spade shovel. At the CL location, samples
were collected along side of established prairie grasses, including big bluestem and
Indiangrass, to be sure that grass roots containing AMF would be included. At the
Page 111
93
WL location, soil was collected from an area supporting non-native forage grasses and
legumes including Kentucky bluegrass, tall fescue, and birds-foot trefoil. These
species were found throughout the reclaimed mined area. Pot cultures of each AMF
source were prepared by mixing soil from each location 1:1 by volume with silica
sand in a portable cement mixer. The soil/sand mix was poured into 3.8-l plastic
nursery containers and sown with white clover (Trifolium repens L.). The containers
were placed on benches in a 20-27º C glasshouse with artificial lighting 12 hr day-1
.
The pot cultures were watered daily without fertilizer for 10 months. Inoculum was
prepared by chopping up soil and roots from each pot, discarding course roots and
tops, then mixing all soil and fine roots together for each AMF source.
Sterile soil to be used as growing medium was prepared by mixing topsoil
collected from the surface 20-cm at the Wilds with silica sand, 1:1 by volume, in a
portable cement mixer. The soil/sand mix was then steamed for 5 hr at 100º C. The
sterile soil was rested in plastic bins for 21 d at 20º C prior to use in the experiment.
Soil from each pot culture, the sterilized growing medium soil, and original WL
topsoil were analyzed by the Service Testing and Research Laboratory (STAR lab),
The Ohio State University/Ohio Agricultural Research and Development Center,
Wooster, OH (Table 14). Identification of AMF species was not attempted for this
study.
Experiment establishment and design
Experimental units consisted of individual grass seedlings growing in 660-cm3
pots (D40 Deepot®, Stuewe and Sons, Inc., Corvallis, OR) containing 500 cm3 sterile
Page 112
94
growing medium soil plus one of four AMF inoculum treatments, and one of three
phosphorus (P) levels. Inoculum treatments included 100 cm3 of CL or WL pot-
culture soil, or 100 cm3 of sterilized CL (CLS) or sterilized WL (WLS) pot culture
soil. Sterilized inoculum soil was added to the non-AMF pots to control for possible
fertilizer effects from adding pot culture soil to the AMF pots. The sterilized soil was
prepared by autoclaving 8 l of each pot culture soil for 70 min at 130º C, and then
resting the soil in plastic bags at 40º C for 96 h.
Soil P levels of 5, 12, and 24 mg kg-1
were established by mixing 0.0, 0.1, and
0.3 g triple super phosphate (0-45-0) (Bonide Products Inc., Oriskany, NY) per pot,
respectively. Calculations were based on the recommendation that 10 mg kg-1
P is
required to increase available soil P 1 mg kg-1
(Dr. Donald Eckert, PhD, The Ohio
State University). Each pot was standardized for bacteria by adding 100 ml of sievate
corresponding to each particular AMF inoculum. The sievate for each inoculum was
prepared by mixing 1000 cm3 pot culture soil and 16 l water, allowing the slurry to
settle for a few seconds, and pouring the liquid and suspended matter through a 53-µm
sieve.
The experiment was set up as a randomized complete block with a factorial
arrangement of 4 levels of grass species, 4 levels of AMF source (CL, CLS, WL, and
WLS), and 3 levels of P (5, 12, and 24 mg kg-1
). Each treatment was replicated six
times. The four grass species (SPP) were ‗Bison‘ big bluestem, ‗Tomahawk‘
Indiangrass, ‗Revenue‘ slender wheatgrass, and tall dropseed. Big bluestem,
Indiangrass, and slender wheatgrass were purchased from Western Native Seeds,
Page 113
95
Coaldale, CO USA, and tall dropseed was purchased from Oak Prairie Farm,
Pardeeville, WI USA. Seeds of each species were sown 10-20 per pot, and thinned to
leave a single seedling in each pot.
Pots were placed in trays and arranged so that live AMF treatments were
adjacent to non-AMF control pots to allow for paired-pot comparisons of AMF
sources. Trays were placed on a glasshouse bench in a randomized-block design, such
that each treatment was contained in each block to control for distance from the
cooling/heating source on one end and exhaust fan at the other. Artificial lighting was
set to maintain a minimum of 300 w m-2
16 h day-1
, and temperature ranged between
19-27º C.
Grass leaf and biomass measurements
At 4, 8, 12, and 16 weeks following germination, the numbers of living and
dead leaves were counted on each plant. To reduce confusion in successive censuses,
dead leaves were removed at each census and stored for later biomass measurement.
At the end of the 16-week experiment, plants were destructively harvested to assess
above- and belowground biomass. Culms and leaves were clipped at the soil surface
and put in paper bags along with dead leaves from earlier censuses. Roots were
washed to remove the soil and then bagged separately from shoots. Biomass samples
were dried at 55º C for a minimum of 96 h, and then weighed. Three small sub-
samples were cut fresh from each root system to assess AMF colonization. The root
sub-samples were approximately 10x25 mm each and cut from the top, middle, and
Page 114
96
bottom third of the root length. Root sub-samples were stored in a 48% ethanol
solution until being processed for AMF evaluation.
AMF colonization assessment
Root samples were cleared and stained according to a modified Phillips and
Hayman (1970) procedure. During processing, root samples from each plant were
contained in 28x5-mm tissue processing cassettes (Canemco Inc., Quebec, Canada).
Roots were cleared in 10% KOH solution and autoclaved at 130º C for 10 min, and
then acidified in a 1% HCL solution for 20 min at room temperature. Roots were
stained in 0.05% Trypan blue staining solution containing 1:2:1 distilled water, lactic
acid, and glycerin, and autoclaved for 7 min at 130 º C. Following staining, roots
were rinsed in tap water and stored in plastic Petri dishes covered with a 1:1 solution
of distilled water and glycerin and kept in a 40º C cooler. Colonization was assessed
using a gridline method (Newman, 1966; Giovannetti and Mosse, 1980). Roots
bisecting gridlines scored on the bottom of a Petri dish and spaced 13 mm apart, were
designated either colonized or not colonized. For each root sample, the first 50 roots
observed were scored colonized if the root segment crossing a gridline contained
hyphae, arbuscules, or vesicles. Percent colonization was calculated by dividing the
number colonized by 50, then multiplying by 100. The root sample was then dried at
55º C and weighed, and the dry weight was added back to the total root biomass.
Page 115
97
Statistical analysis
Data were analyzed using PROC GLM in SAS/STAT® software (SAS, 2007)
and significance was accepted at α=0.05. Main effects were SPP, AMF, and P. Post-
hoc comparisons were made using protected Fisher‘s LSD test and differences were
accepted only if the P-value calculated by PROC GLM was equal or less than 0.05
(Milliken and Johnson, 1984). Dependent variables were leaf number, shoot, root, and
total biomass, root-to-shoot ratio (RSR), difference between AMF and non-AMF for
shoot (SDIFF), root (RDIFF), and total biomass (TDIFF), and AMF root colonization
percent. Difference in biomass was calculated as a separate continuous random
variable for each paired-pot comparison (Zar, 1999). Benefit from AMF inoculation
was indicated by a positive outcome after subtracting the non-AMF value from the
AMF value. Analysis of colonization percent only included the inoculated treatments
in order to accurately the level of infectivity of each inoculum.
Results and Discussion
AMF colonization as affected by soil P, inoculum, and grass species
The reclaimed mine soil used in this experiment measured 12 mg kg-1
P, 3768
mg kg-1
calcium (Ca), and pH of 7.3 (Table 14). These values indicate a calcareous
soil with limited available P. Mixing the soil with silica sand reduced the available P
to 5 mg kg-1
creating a soil critically low in P for plant growth and a soil environment
conducive to test and compare the efficacy of AMF strains. In our study, we found
that neither AMF source nor P concentration had any effect on colonization percent
Page 116
98
when averaged over all other factors (Table 15). Grasses inoculated with CL averaged
52.3% AMF colonization, whereas grasses with WL averaged 53.1%. This indicates
that both AMF cultures were equally accepted by the host grasses in this study.
Grasses grown at 5, 12, and 24 mg kg-1
P averaged 55.6, 53.7, and 48.9% AMF
colonization, respectively, but were not different (Table 15). A number of studies
have shown that AMF colonization is reduced by higher soil P (Mosse, 1973; Schubert
and Hayman, 1986; Sainz and Arines, 1988; Al-Karaki and Al-Omoush, 2002), but
that was not evident in this study. If plants are able to obtain P with their own root
systems, then the symbiosis would clearly be less beneficial. However, there is often
no clear relationship between colonization percent and P uptake or plant growth
response (Lioi and Giovannetti, 1987; Sanders and Fitter, 1992; Mohammad et al.,
1995), meaning that efficacy in not necessarily related to the magnitude of
colonization.
Colonization did differ by species as tall dropseed and slender wheatgrass had
the highest percentages with 69.9 and 54.7%, respectively (Table 15). Big bluestem
and Indiangrass had lowest colonization with 51.0 and 35.5%, respectively. It is
known that warm-season grasses tend to be more dependent on AMF, especially when
P is limited, than cool-season grasses. Cool-season grasses tend to have finer root
systems that are better suited to gaining P from the soil, while warm-season grasses
tend to have more coarse root systems (Hetrick et al., 1991), which is why the high
abundance of AMF colonization in slender wheatgrass roots was unexpected. Big
bluestem is known to be very dependent on AMF (Hetrick et al., 1986) and is a
Page 117
99
dominant species in tallgrass prairies across North America. The mycorrhizal status of
tall dropseed has not been reported, but a related species, Sporobolus heterolepis was
found to be mycorrhizal (Dhillion, 1992).
AMF and soil P effect on plant growth
Overall, biomass production was greatest for slender wheatgrass, which
averaged 1.5 g shoot biomass, 1.3 g root biomass, and 2.8 g total biomass plant-1
(Table 16). Big bluestem root biomass averaged 1.5 g plant-1
and was not different
from slender wheatgrass; however, big bluestem averaged only 0.7 g shoot biomass
plant-1
. The difference in allocation of resources between these species was reflected
in the RSR as slender wheatgrass averaged 0.9 while big bluestem averaged 2.4 (Table
16). Indiangrass and tall dropseed each produced 1.8 g total biomass plant-1
, which
was less than either slender wheatgrass or big bluestem. However, the RSR differed
between Indiangrass and tall dropseed as Indiangrass averaged 1.8, and tall dropseed
averaged 0.7. This indicates that big bluestem and Indiangrass appear to direct more
resources, proportionately, to root growth during seedling establishment, compared
with slender wheatgrass and tall dropseed.
Response to soil P concentration was predictable as an increase in P resulted in
an increase in biomass production (Table 16). However, this occurred only for shoot
biomass, as biomass increased from 0.6 to 1.0 to 1.3 g plant-1
as P increased from 5 to
12 to 24 mg kg-1
, respectively. Root biomass increased from 0.7 to 1.4 g plant-1
at 5
and 12 mg kg-1
P, respectively, but did not increase at 24 mg kg-1
P. This resulted in a
Page 118
100
decline in the RSR from 1.6 to 1.3 between 12 and 24 mg kg-1
P as the increased shoot
growth at the higher P was not matched by a corresponding increase in root growth.
This is likely a result of space limitation in the pots and not a lack of response to
increased P, as pots with the highest P level were densely packed with roots when
harvested. However, total biomass was greatest at 24 mg kg-1
P compared with the 5
and 12 mg kg-1
levels (Table 16).
AMF effectivity in paired-pot comparison
In comparing the effectiveness of the AMF cultures, a paired-pot arrangement
was used to examine the difference in biomass accumulation between colonized and
non-colonized plants. By subtracting the biomass of a non-AMF plant from an
adjacent AMF-plant for each component (shoot/root/total), new variables were created
that if positive, indicated AMF benefit, and if negative, indicated AMF detriment.
Findings in the GLM analysis indicated that P and SPP had the greatest influence on
all three difference variables (Table 17). The F-values associated with P were 38.9,
29.4, and 51.2 for shoot difference (SDIFF), root difference (RDIFF), and total
differences (TDIFF), respectively. For SPP, F-values were 15.5, 19.2, and 25.5 for the
same variables, respectively. Furthermore, the F-values were highly significant for P
and SPP, each having P-values <0.0001 for all variables. In contrast, the F-values for
AMF source were only 6.0 for SDIFF, 0.6 for RDIFF, and 0.2 for TDIFF.
The interaction between AMF and P was significant for RDIFF (P<0.0001)
and TDIFF (P<0.0001), but not for SDIFF (P=0.0643) (Table 17). For SDIFF, the
Page 119
101
response to AMF to P was nearly identical with each AMF source (Table 18), which
would explain the lack of interaction. For SDIFF, the outcome was positive at 5 mg
kg-1
P, averaging 0.22 for CL and 0.24 for WL, meaning that the grasses benefitted
similarly from each culture. However, at 12 mg kg-1
P the outcome was negative for
both AMF sources averaging -0.38 for CL and -0.31 for WL, suggesting AMF was
detrimental. At 28 mg kg-1
P, the outcomes for SDIFF were also negative and
averaged -0.81 for CL and -0.34 for WL (Table 18). Furthermore, within each AMF
source, SDIFF decreased with each increase in P. In contrast, RDIFF outcomes were
similar between 5 and 12 mg kg-1
P with CL and WL averaging -0.06 and -0.34,
respectively (Table 18). The RDIFF was positive only at 5 mg kg-1
P with the WL
source, which averaged 0.30, but averaged -1.50 and -0.76 at the 12 and 24 mg kg-1
P,
respectively. Similarly, TDIFF was positive only at the 5 mg kg-1
P and averaged 0.15
for CL and 0.53 from WL.
The interaction between SPP and P was also significant for SDIFF, RDIFF,
and TDIFF. A breakdown of this interaction shows that AMF benefited only big
bluestem and Indiangrass at the lowest P level (Table 19). Big bluestem averaged
0.41, 1.01, and 1.42 for SDIFF, RDIFF, and TDIFF, respectively, at 5 mg kg-1
, but
each increase in P yielded negative values. At 24 mg kg-1
P, SDIFF, RDIFF, and
TDIFF averaged -0.92, -1.19, and -2.11, respectively. Indiangrass responded similarly
as SDIFF, RDIFF, and TDIFF were positive, 0.55, 0.89, and 1.44, respectively, at 5
mg kg-1
P, but were negative at the higher P levels. However, for Indiangrass, no
Page 120
102
decrease in these variables occurred between 12 and 24 mg kg-1
P. Neither species
appeared to benefit from AMF at the higher P levels.
In contrast, no apparent benefit from AMF at any concentration of P could be
seen for tall dropseed or slender wheatgrass (Table 19). Tall dropseed had positive
SDIFF outcomes of 0.09 and 0.01 for 5 and 24 mg kg-1
P, but these were not different
from the -0.13 outcome recorded at 12 mg kg-1
P. Furthermore, differences were not
found between P concentrations for RDIFF or TDIFF, and all outcomes were negative.
Likewise, slender wheatgrass had negative values for SDIFF, RDIFF and TDIFF at all
P concentrations; however, SDIFF and TDIFF at 5 mg kg-1
P were less negative than
at 12 and 24 mg kg-1
P. This suggests that response of slender wheatgrass to AMF is
more negatively affected by high P concentrations than is tall dropseed.
The interaction between SPP and P was evident also in the number of leaves
produced during the 16-week experiment (Figure 4). Leaf production with 5 mg kg-1
P was greater for AMF big bluestem, Indiangrass, and tall dropseed at each census.
Indiangrass appeared to benefit more from AMF than either big bluestem or tall
dropseed as the difference in leaf count between colonized and non-colonized plants
was significantly greater for Indiangrass. In contrast, at 5 mg kg-1
P, slender
wheatgrass with AMF produced slightly more leaves only at 4 weeks.
At 12 and 24 mg kg-1
P, benefit from AMF was less evident (Figure 4). Big
bluestem with AMF had slightly greater leaf counts at the 4, 12, and 16-week censuses
with 12 mg kg-1
P, but only at 8 weeks with 24 mg kg-1
P. At 4 weeks with 12 mg kg-1
P, Indiangrass plants with AMF had slightly greater leaf counts than non-AMF plants.
Page 121
103
Leaf counts for tall dropseed with AMF at the higher P levels were not different from
non-AMF plants at any census. In contrast slender wheatgrass with AMF produced
fewer leaves than non-AMF plants at all four censuses at the 12 and 24 mg kg-1 P
levels. Furthermore, more leaves were produced by non-AMF slender wheatgrass
with 24 mg kg-1
P than for any other grass or treatment level, indicating superior
growth response to added soil P.
Conclusions
Results of this research indicate that AMF associated with reclaimed mine soil
are not likely a barrier for establishing tallgrass prairie species on the reclaimed mine
soil. Colonization levels are similar between the two AMF inoculums, and plant
growth response to each AMF is similar at all three P levels. This would also suggest
that host specificity is not an issue even though the mine soil AMF have been
associated with non-native forage species for 30 years. It appears that poor soil
conditions of the mine soil, i.e. compacted calcareous soil with low available
phosphorus, may have selected for AMF equally effective in supplying P as AMF
from undisturbed tallgrass prairie.
Big bluestem and Indiangrass responded to AMF and P as expected according
to previous research (Hetrick et al., 1986). Both species benefited from AMF when
soil P was low, and showed less benefit as P increased. Both of these two grasses
allocated more resources to roots than aboveground tissue, which is important for
access to nutrients and water during periods of stress. Harris (1967) determined that
Page 122
104
competitive success of non-native downy brome (Bromus tectorum L.) was due to its
ability to establish a deep root system during autumn and winter when the native
bluebunch wheatgrass (Pseudoroegneria spicata (Pursh) A. Löve) was dormant.
During spring, a downy brome infestation depleted soil moisture before the
wheatgrass was able to complete its reproductive cycle. The dominance of big
bluestem and Indiangrass in tallgrass prairies is likely due to their ability to establish
deep root systems over time, as well as their association with AMF when soil P is
limited.
Tall dropseed and slender wheatgrass both appear facultative in their response
to AMF. Tall dropseed is a warm-season prairie grass, but seems to respond to AMF
and P similarly to facultative cool-season grasses. Greater production of aboveground
biomass than root biomass, and low dependence on AMF, would suggest that tall
dropseed can quickly establish following disturbance in habitats where P may be
limiting. Slender wheatgrass forms association with AMF but is clearly not dependent
on AMF and is able to access P when soil levels are low, and can be very productive
when soil P is higher. Tall dropseed and slender wheatgrass both appear to establish
well when P is low, with or without AMF and would be useful in early establishment
of a tallgrass prairie community on reclaimed mine soil. Big bluestem and Indiangrass
are more dependent on AMF and benefited from the mine soil AMF in this study.
Mine soil AMF. Establishing native prairie species on reclaimed compacted mine soil
would not likely be limited by the effectivity of the mine soil AMF.
Page 123
105
Table 14. Soil properties of reclaimed mine and AMF inoculum soil used to
compare growth of prairie grasses with different concentrations of phosphorus
(P) and different sources of arbuscular mycorrhizal fungi (AMF).
Mine
2
topsoil
(0-20 cm)
Sterile mine
soil/sand
mix (1:1)
AMF3
Soil Parameter1 CL WL
pH 7.3 7.3 7.7 7.9
P (mg kg-1
) 12 5 < 1 7
K (mg kg-1
) 161 80 77 41
Ca (mg kg-1
) 3768 1722 1345 1262
Mg (mg kg-1
) 321 198 235 198
1 Soil analyzed by STAR lab, Wooster, OH. P analyzed with Bray P1 method; K,
Ca, and Mg analyzed with ammonium acetate extract method.
2 Soil collected from reclaimed surface mine land near Cumberland, OH currently
part of the Wilds (The International Center for the Preservation of Wild
Animals, Inc.).
3 CL collected from Claridon tallgrass prairie remnant near Marion, OH; WL
collected from the Wilds reclaimed mine soil supporting non-native forage
grasses. AMF inoculum soil prepared as pot-cultures containing a 1:1 mix of
soil and silica sand.
Page 124
106
Table 15. Percent colonization by arbuscular mycorrhizal fungi (AMF) as
affected by AMF sources, soil phosphorus concentration (P), and grass
species (SPP) in a 16-week glasshouse experiment.
Parameter Colonization1
AMF (%)
CL 52.3 a
WL 53.1 a
P-value (0.7917)
P (mg kg-1
)
5 55.6 a
12 53.7 a
24 48.9 a
P-value (0.2271)
SPP
Big bluestem 51.0 bc
Indiangrass 35.5 c
Tall dropseed 69.9 a
Slender wheatgrass 54.7 ab
P-value (0.0226)
1 Colonization percents reflect only AMF-inoculated plants. Non-inoculated
plants had 0% AMF colonization.
Page 125
107
Table 16. Biomass production as affected by grass species (SPP) and three levels
of soil phosphorus (P) in a 16-week glasshouse experiment.
Dependent variables1
Main effects Shoot Root Total RSR2
SPP --------------- (g dry weight) -------------- --- (g/g) ---
Big bluestem 0.7 c 1.5 a 2.2 b 2.4 a
Indiangrass 0.7 c 1.1 b 1.8 c 1.8 b
Tall dropseed 1.1 b 0.7 c 1.8 c 0.7 c
Slender wheatgrass 1.5 a 1.3 ab 2.8 a 0.9 c
P-value <0.0001 <0.0001 <0.0001 <0.0001
P
5 mg kg-1
0.6 c 0.7 b 1.4 c 1.5 ab
12 mg kg-1
1.0 b 1.4 a 2.4 b 1.6 a
24 mg kg-1
1.3 a 1.4 a 2.7 a 1.3 b
<0.0001 <0.0001 <0.0001 0.0231
1 P-values represent the probability of differences within each dependent variable
for each main-effect. Differences within each variable are determined using
protected Fisher‘s LSD (α=0.05), and are designated by lower-case letters.
2 Root to shoot ratio (RSR) calculated by dividing root weight by shoot weight.
Page 126
108
Table 17. Analysis of variance table (PROC GLM) for the full model testing the
difference in biomass production for grass species (SPP) colonized with
arbuscular mycorrhizal fungi (AMF) and non-AMF-inoculated plants. Dependent
variables shoot difference (SDIFF), root difference (RDIFF), and total difference
(TDIFF) were produced by subtracting biomass of non-AMF plants from AMF
plants in a paired-pot glasshouse experiment examining the effects of AMF
source and P on growth of prairie SPP grown in sterilized mine soil.
SDIFF RDIFF TDIFF
Model DF F value P > F F value P > F F value P > F
REP1 5 0.4 0.8753 2.2 0.0601 1.2 0.3225
SPP 3 15.5 <.0001 19.2 <.0001 25.5 <.0001
AMF 1 6.0 0.0162 0.6 0.4294 0.2 0.6244
P 2 38.9 <.0001 29.4 <.0001 51.2 <.0001
SPP *AMF 3 0.7 0.5354 2.8 0.0461 2.8 0.0428
SPP*P 6 3.9 0.0013 3.3 0.0053 5.2 <.0001
AMF*P 2 2.8 0.0629 15.6 <.0001 13.1 <.0001
SPP*AMF*P 6 0.5 0.8391 0.7 0.6449 0.9 0.5276
TOTAL 141
1 REP refers to replicate.
Page 127
109
Table 18. Interaction of arbuscular mycorrhizal fungi (AMF) from the Claridon
tallgrass prairie remnant (CL) and the Wilds reclaimed calcareous mine soil
(WL) in Ohio and soil phosphorus concentration (P). Values represent the
difference between AMF-colonized and non-AMF-colonized grasses1 in a 16-
week glasshouse experiment measuring shoot (SDIFF), root (RDIFF), and total
biomass difference (TDIFF).
AMF P SDIFF RDIFF TDIFF
(mg kg-1
) ------------------ (g difference) -------------------
CL 5 0.22 a -0.06 a 0.15 a
12 -0.38 b -0.34 a -0.73 b
24 -0.81 c -1.23 b -2.03 c
P-value (<0.0001) (0.0002) (<0.0001)
WL 5 0.24 a 0.30 a 0.53 a
12 -0.31 b -1.50 c -1.81 b
24 -0.34 c -0.76 b -1.10 b
P-value (0.0013) (<0.0001) (<0.0001)
1 Grass species are big bluestem, Indiangrass, tall dropseed, and slender wheatgrass.
Page 128
110
Table 19. Interaction of grass species (SPP) and soil phosphorous concentration (P)
on the difference in biomass between grasses colonized with arbuscular
mycorrhizal fungi (AMF) and non-AMF colonized grasses in a 16-week
glasshouse experiment measuring shoot (SDIFF), root (RDIFF), and total
biomass difference (TDIFF).
Grass species P SDIFF RDIFF TDIFF
(mg kg-1
) ----------------- (g difference) -------------------
Big bluestem 5 0.41 a 1.01 a 1.42 a
12 -0.27 b -0.34 b -0.60 b
24 -0.92 c -1.19 c -2.11 c
P-value (<0.0001) (<0.0001) (<0.0001)
Indiangrass 5 0.55 a 0.89 a 1.44 a
12 -0.16 b -0.64 b -0.80 b
24 -0.35 b -0.49 b -0.83 b
P-value (<0.0001) (0.0003) (<0.0001)
Tall dropseed 5 0.09 a -0.38 a -0.29 a
12 -0.13 a -0.94 a -1.07 a
24 0.01 a -0-79 a -0.79 a
P-value (0.4259) (0.1029) (0.0936)
Slender wheatgrass 5 -0.11 a -0.84 a -0.95 a
12 -0.82 b -1.79 a -2.60 b
24 -0.98 b -1.47 a -2.45 b
P-value (<0.0001) (0.1927) (0.0116)
Page 129
111
Ind
iang
rass
(lea
ves
pla
nt-1
)
0
10
20
30
40
Tal
l d
rop
seed
(lea
ves
pla
nt-1
)
0
10
20
30
40
(weeks)
5 mg kg-1
P
0 4 8 12 16
Sle
nd
er w
hea
tgra
ss
(lea
ves
pla
nt-1
)
0
20
40
60
80
(weeks)
12 mg kg-1
P
0 4 8 12 16
(weeks)
24 mg kg-1
P
0 4 8 12 16
Big
blu
este
m
(lea
ves
pla
nt-1
)
0
10
20
30
40
**
* *
**ns
* *
ns*
ns ns
***
***
******
*
ns
nsns
ns
ns
nsns
ns*
**
*ns
nsns
ns
ns
nsns
*ns
ns
ns
*
**
*
*
**
**
**
**
Figure 4. Affect of arbuscular mycorrhizal fungi (AMF) on number of leaves
produced by prairie grasses at three concentrations of soil phosphorus (P) level during
a 16-week glasshouse experiment. Solid lines and circles (●—●) represent AMF
colonized; dotted lines and open circles (○····○) represent non-AMF colonized plants.
P-values comparing AMF and non-AMF leaf counts are signified as follows:
= 0.05<P<0.001, = 0.001<P<0.0001, = P<0.0001, and ns = P>0.05.
Page 130
112
Chapter 6: Effect of soil compaction and arbuscular-mycorrhizal fungi on tall fescue,
big bluestem and eastern gamagrass seedling growth.
Abstract
Soil compaction on reclaimed surface-mined lands in Appalachia is a barrier to
restoration of deciduous forests native to the region. Non-native tall fescue (Festuca
arundinaceae Schreb.) was planted because it establishes quickly and tolerates soil
compaction. Establishing robust native grasses such as eastern gamagrass (Tripsacum
dactyloides L.) and big bluestem (Andropogon gerardii Vitman) could help ameliorate
the compaction by rooting deep into the profile, while increasing biodiversity. These
warm-season grasses are native to the tallgrass prairie regions of North America and
are major components of prairie communities. Warm-season grasses tend to have
coarse roots and are more dependent on arbuscular-mycorrhizal fungi (AMF) than
cool-season grasses. The symbiosis with AMF increases survival in soils with low
available phosphorus. A10-week glasshouse study was conducted to examine the
interaction between soil compaction and AMF source (reclaimed mine soil, native
tallgrass prairie soil, or none) on seedling growth of tall fescue, big bluestem, and
eastern gamagrass. Growth of tall fescue with AMF was not different from that with
no AMF. Big bluestem and eastern gamagrass were highly dependent on AMF, but
differences were not found between mine soil (WL) and prairie (CL) AMF.
Page 131
113
Colonization was greatest for eastern gamagrass and exceeded 70% with either WL or
CL. Big bluestem and tall fescue colonization was 1.75 and 3 times greater with WL
AMF than CL AMF, respectively. Tall fescue produced 3 times greater shoot and root
biomass than eastern gamagrass and 6 times greater than big bluestem when colonized
with AMF. The highest compaction level reduced tall fescue root biomass by 50%
and shoot biomass by 40%. Big bluestem root biomass was reduced 60% and shoot
biomass 50% by the highest compaction. Eastern gamagrass shoot and root biomass
was not affected by increasing compaction. Eastern gamagrass is slower to establish
than tall fescue but tolerates compaction, which would be beneficial in compacted
mine soil.
Keywords: Soil compaction, arbuscular-mycorrhizal fungi, reclaimed mine soil,
prairie grasses.
Introduction
Soil compaction is a major limiting factor in restoring native vegetation on
reclaimed surface mined land in the Appalachian coal mining region of the eastern
U.S. (Larson and Vimmerstedt, 1983; Kost et al, 1994; Zeleznik and Skousen, 1996;
Haering et al., 2004; Casselman et al., 2006). Bulk densities of up to 1.8 g cm-3
to
depths of at least 60 cm have been recorded following use of heavy equipment to
redistribute and contour overburden and stockpiled topsoil during reclamation
(Shrestha et al., 2009). Soil compaction limits available water and nutrients, reduces
Page 132
114
pore volume, restricts root elongation and development, reduces shoot biomass and
growth, and leads to anaerobic conditions that many plants are unable to tolerate
(Unger and Kaspar, 1994; Whalley et al., 1995; Bengough et al., 1997; Nadian et al.,
1997; Kozlowski, 1999).
Ameliorating soil compaction on reclaimed mine land is possible with deep
tillage (Sinnett et al., 2006; Croton and Ainsworth, 2007; Shrestha et al., 2009).
Tillage can reduce bulk density and improve water infiltration and has been used
extensively in agriculture; however, deep tillage requires heavy equipment and high
levels of energy input (Sinnett et al., 2006; Croton and Ainsworth, 2007) and disrupts
developing soil structure and beneficial micro-organism such as arbuscular-
mycorrhizal fungi (AMF) (Jasper et al., 1989; Lal, 1993). An alternative to tillage is
planting deep-rooting plant species that can penetrate and increase organic matter and
biological activity in compacted regions of the profile. Roots that grow into
compacted soil create channels that increase water flow and are used by the roots of
other species to access soil otherwise not available because of the compaction (Meek
et al, 1990; Cresswell and Kirkegaard, 1995; Rasse and Smucker, 1998; Unger and
Kaspar, 1994; Williams and Weil, 2004). Tap rooted annual plants are often used in
agricultural systems; however, perennial species such as alfalfa may be more effective
because of long-term growth and deeper rooting characteristics. Using perennial
species would also eliminate the need for annual tillage, fertilization, and planting
associated with annual cropping.
Page 133
115
Tall fescue, a perennial non-native forage grass, has been planted extensively
on reclaimed surface-mined land in Appalachia (Casselman et al, 2006). Tall fescue is
very productive and tolerates mine soil compaction (Crews, 1984; Sulc et al., 2006)
and establishes within the five-year window mining companies have to establish a
vegetation cover on reclaimed surface-mined land. However, tall fescue productivity
declines over time on mine soil without organic amendments supplying nitrogen and
phosphorus, or legumes fixing nitrogen, (Roberts et al., 1988a). Furthermore, only
planting a few non-native forages on mine soil results in a low diversity landscape.
Establishing large-statured, robust prairie species as an alternative to low-
diversity forages, might improve soil conditions on reclaimed mine land over time.
Big bluestem (Andropogon gerardii Vitman) and eastern gamagrass (Tripsacum
dactyloides L.) are warm-season C4 grasses native to prairies in the Midwest and
southeastern U.S. (Hitchcock, 1971). Big bluestem is dominant in tallgrass prairies
and historically comprised as much as 90% canopy cover within its range (Weaver,
1931). Eastern gamagrass is a robust perennial relative of corn (Zea mays L.) and is
prevalent in the southern tallgrass prairies regions; however has declined over time
with overgrazing and tillage-based agriculture (Gilker et al., 2002). Furthermore,
eastern gamagrass is productive on compacted mine soil due to its ability to root
through compacted soil layers and tolerance to flooding (Clark et al., 1998: Gilker et
al., 2002; Krizek et al., 2003).
Warm-season prairie grasses tend to have coarser root systems than cool-
season grasses but thrive in soils with low available nutrients, especially phosphorus,
Page 134
116
because of the symbiotic association with AMF (Daniels et al., 1988; Hetrick et al.,
1991; Brejda et al., 1993). The importance of AMF to plant survival is well
documented (Mosse, 1973; Gerdemann, 1968), but AMF also benefit plants growing
in compacted soil (Nadian et al., 1997; Miransari et al., 2007). Establishment of
warm-season prairie grasses on reclaimed mine soil may help ameliorate mine soil
compaction and increase community diversity, but only if the AMF associated with
the mine soil is effective and will benefit the prairie grasses. The objective of this
research is to compare the early growth of tall fescue with big bluestem and eastern
gamagrass in compacted soil in relation to AMF from reclaimed mine soil, native
tallgrass prairie soil, and soil with no AMF. The goal was to determine the
effectiveness of mine soil AMF relative to tallgrass prairie AMF, and to compare the
growth response of each grass species under varying levels of soil compaction, in a
glasshouse study.
Methods
AMF sources and pot culture
Sources of AMF were the Claridon (CL) tallgrass prairie remnant near Marion,
Ohio, and the Wilds (WL), a reclaimed surface mined area near Cumberland, Ohio.
The CL site is a 2.2 ha linear remnant owned by the CSX Railroad and is overseen by
the Marion County Historical Society (Klips, 2003; Klips 2004). The WL site is
located on land that had been surface mined in the early 1980‘s, and was once part of
the Muskingum Mine, then owned and mined by Central Ohio Coal Company, but
Page 135
117
was donated in 1986 to The International Center for the Preservation of Wild Animals,
Inc. (the Wilds). The area is part of the Allegheny Plateau of southeast Ohio, which
extends westward from the Allegheny Mountains and is a subdivision of the
Appalachian Mountain Range.
Approximately 35 liters of surface topsoil were collected at each site during
September, 2005 from 15-20 randomly selected locations at each site using a metal
spade shovel to a depth of 20 cm. At the CL location, samples were collected along
side of established prairie grasses, including big bluestem and Indiangrass, so that
grass roots containing AMF would be included. At the WL location, soil was
collected from an area supporting non-native forage grasses and legumes including
Kentucky bluegrass (Poa pratensis L.), tall fescue, and birds-foot trefoil (Lotus
corniculatus L.). These species were found throughout the reclaimed mined area.
Pot cultures of each AMF source were prepared by mixing soil from each
location 1:1 by volume with silica sand in a portable cement mixer. The soil/sand mix
was poured into 3.8-l plastic nursery containers and sown with white clover (Trifolium
repens L.) as a host plant for the AMF (Liu and Wang, 2003). The clover was
inoculated with rhizobia to insure nitrogen fixation. The containers were placed on
benches in a 20-27º C glasshouse with artificial lighting 12 hr day-1
. The pot cultures
were watered daily without fertilizer for 10 months. Soil and fine roots were collected
from each pot, mixed 1:1 with sterile soil/sand mix, and repotted and seeded with
white clover and sideoats grama (Bouteloua curtipendula (Michx.) Torr.) for a second
pot-culture cycle. After 4 months, watering was ceased and the pots moved to an
Page 136
118
artificially-lighted 16-18º C room until the white clover and sideoats grama had wilted
and dried. Fine roots and soil were collected from each pot and then mixed together
for each AMF source and stored in plastic bags at 5º C for several days before being
used in the experiment.
Sterile growing medium was prepared by sieving topsoil collected from the
surface 20-cm at the Wilds through a 6-mm sieve. The sieved soil was then steamed
for 5 hr at 100º C and rested in plastic bins at 20º C prior to use in the experiment. The
sterilized mine soil and the WL and CL pot-culture soils were analyzed by the Service
Testing and Research Laboratory (STAR lab), The Ohio State University/Ohio
Agricultural Research and Development Center, Wooster, OH (Table 20).
Identification of AMF to species was not attempted for this study.
Experiment design and establishment
Experimental design was a randomized complete block with a factorial
arrangement of three grass species, three soil compaction levels, and three AMF
treatments; each complete block was replicated six times. Experimental units
consisted of individual plants growing in polyvinyl chloride (PVC) tubes measuring 8-
cm inside diameter by 30-cm deep. The inside of each tube was coated with copper
hydroxide (SpinOut® root growth regulator, American Hydrotech, Inc., Chicago, IL.)
to prevent roots from avoiding the compacted soil medium by growing down the side
of the tubes. Soil was mixed individually for each tube by measuring an appropriate
amount of sterile soil, on a dry weight basis, plus 120 cm3 AMF-inoculum soil, to
Page 137
119
yield bulk densities (BD) of 1.0, 1.25 and 1.5 g cm-3
. The AMF control tubes were
filled only with sterile soil. Compaction levels were established by filling tubes in 5-
cm increments with a measured amount of soil to give the desired bulk density. A
solid-wood plunger with 5-cm reference lines, slightly smaller in diameter than the
PVC tubes, was pressed down on the soil while the bottom of tube was simultaneously
tapped on a concrete floor. Tapping continued until the appropriate reference line for
each depth lined up with the top of the tube.
Seeds of ‗Jesup MaxQ‘ tall fescue, ‗Bison‘ big bluestem and ‗Pete‘ eastern
gamagrass were germinated in Petri dishes and transplanted into each tube. After
transplanting, the soil surface was covered with a layer of vermiculite to prevent
drying and cracking. Each tube was then standardized for bacteria by adding 100 ml
of sievate corresponding to each particular AMF inoculum. The sievate for each
inoculum was prepared by mixing 1000 cm3 pot culture soil and 16 l water, allowing
the slurry to settle for a few seconds, and pouring the liquid and suspended matter
through a 53-µm sieve. Sievate from the WL inoculum was applied to the non-AMF
tubes. An endophyte-free tall fescue cultivar was used in this experiment to avoid
inhibition of AMF (Chu-Chou et al., 1992; Guo et al., 1992)
The 27 tubes in each block were randomly arranged in three rows of nine tubes
in a 43x122-cm wooden rack fitted into a 10x60x122-cm plastic tub. Each tube was
placed on a 10x8x10-cm block of floral foam (Aquafoam®, Syndicate Sales, Inc.,
Kokomo, IN). Holes were cut in the sides of the tubs 1 cm from the bottom for
drainage and the tubes were watered daily as needed without fertilizer. The tubs were
Page 138
120
placed on benches in a glasshouse under artificial lighting set to maintain a minimum
of 300 w m-2
16 h day-1
, and temperature set to range between 19-27º C. Block
establishment was staggered so that harvest of the plants would not occur at the same
time, and yet maintain an overall 10-week growing period. The experiment was
conducted from April through July 2008, to take advantage of increasing natural day
length, and moderate outside temperatures.
Plant growth and AMF measurements
At the end of the 10-week growth period, plant height (highest culm), number
of leaves and tillers, aboveground (shoot) biomass, root biomass, and AMF
colonization were measured. Shoots were clipped at the soil surface and soil was
washed from the roots. Shoots and roots were placed in separate paper bags and dried
at 55º C for a minimum of 96 hr, then weighed. Root to shoot ration (RSR) was
calculated by dividing root dry weight by shoot dry weight. Three small root sub-
samples 10x25 mm were cut from each root length to assess AMF colonization.
AMF colonization assessment
Root samples were cleared and stained according to a modified Phillips and
Hayman (1970) procedure. During processing, root samples from each plant were
contained in 5x28 mm tissue processing cassettes (Canemco Inc., Quebec, Canada).
Roots were cleared in 10% KOH solution and autoclaved at 130º C for 10 min, and
then acidified in a 1% HCL solution for 20 min at room temperature to improve
Page 139
121
staining. Roots were stained in 0.05% Trypan blue staining solution containing 1:2:1
distilled water, lactic acid, and glycerin, and autoclaved for 7 min at 130 º C.
Following staining, roots were rinsed in tap water and stored in plastic Petri dishes
covered with a 1:1 solution of distilled water and glycerin and kept in a 40º C cooler.
Colonization was assessed using a gridline method (Newman, 1966; Giovannetti and
Mosse, 1980). Roots were scored either colonized or not colonized when they
bisected gridlines on the bottom of a Petri dish spaced 13 mm apart. For each root
sample, only the first 50 roots were scored. Roots were scored colonized if the root
segment crossing a gridline contained hyphae, arbuscules, or vesicles. Percent
colonization was calculated by dividing the number colonized by 50, then multiplying
by 100.
Statistical analysis
Data were analyzed using PROC GLM in SAS/STAT® software (SAS, 2007)
and significance was accepted at α=0.05. Independent variables were grass species,
AMF inoculum, compaction level, and block. Dependent variables were leaf and tiller
count, shoot and root biomass, RSR, and percent AMF root colonization. All data
except AMF colonization were rank transformed (Iman et al., 1984) to address
normality and equal variance issues; AMF percent colonization data were arcsine
transformed. Post-hoc comparisons were made on transformed data using protected
Fisher‘s LSD test and differences were accepted only if the P-value calculated by
PROC GLM was equal or less than 0.05 (Milliken and Johnson, 1984). For
Page 140
122
presentation, actual means were used in place of ranks, and the sine of the arcsine
means were used to back-transform the colonization data.
Results and Discussion
Soil analysis
The calcareous mine soil used in this study had pH of 7.3, calcium (Ca)
content of 3768 mg kg-1
and available phosphorus (P) content of 12 mg kg-1
(Table
20). The basic pH and high Ca content is due to CaCO3 from limestone layers
unearthed during the mining process (Brant, 1964; Soil Survey Staff, 1996). In
calcareous soil, P becomes unavailable for plant uptake as it binds with Ca to form
calcium phosphate compounds (Brady, 1984; McBride, 1994). Availability of soil P
depends on factors including parent material, soil pH, temperature, total soil P, and
associated plant species (Pearson et al., 1940; Barrow et al., 1977; Wuenscher and
Gerloff, 1977; Roberts et al., 1988b; Jayachandran et al., 1989; Richardson et al.,
2009). Schubert and Hayman (1986) found that AMF was not a benefit to plant
growth when available soil P was greater than 50 mg kg-1
, suggesting that plant
growth may be limited without AMF in the 12 mg kg-1
P mine soil used in this
experiment.
AMF colonization
Percent AMF colonization was greatest for eastern gamagrass, but infectivity
was similar between the WL or CL inoculums (Table 21). Eastern gamagrass root
Page 141
123
colonization with WL averaged 76.2% and 73.3% with CL. The non-inoculated
eastern gamagrass roots were slightly colonized at 0.3%. In contrast, big bluestem had
55.9% root colonization with WL, which was greater than with CL at 31.7%, or 0%
for the non-inoculated plants. Tall fescue was 29.8% colonized with WL, but only
9.8% and 0% with CL and no AMF, respectively. Difference in colonization between
CL- and non-inoculated tall fescue plants was not found. Tall fescue was apparently a
better host for WL AMF than CL AMF. This is likely due to WL AMF being
associated with tall fescue and other cool-season grass on the reclaimed mine soil;
whereas, CL AMF from the tallgrass prairie remnant were primarily associated with
warm-season grasses including big bluestem. Host specificity has been shown for
other AMF cultures (Zhu et al., 2000; Ronsheim and Anderson, 2001; Bevor, 2002;
Sanders, 2003). However, big bluestem also had greater colonization by WL than CL
AMF, which would suggest that WL AMF is more infective than CL. Eastern
gamagrass showed no preference between the two AMF sources, but was clearly more
receptive to AMF than the other two grasses, especially tall fescue. Colonization
levels are not always correlated with efficacy; however, higher colonization may
reflect greater dependence, especially in coarse-rooted species such as eastern
gamagrass (Daniels et al., 1988; Hetrick et al., 1991). Compaction level had no
apparent effect on colonization percent in this study as none of the GLM model
components with compaction were significant at α=0.05 (data not shown).
Page 142
124
Effectivity of AMF on grass growth
Effectiveness of the AMF inoculums were evaluated, in part, based on grass
growth measured at the completion of the 10-week study. The three-way interaction
between grass species, AMF inoculum, and compaction level was not significant at
α=0.05 for any of the growth variables (data not shown); however, the interaction
between grass species and AMF was significant for all variables. When averaged over
compaction levels, plant growth was found to be similar for two AMF sources, but
differed between grass species (Table 22). For tall fescue, there were no differences in
growth between WL, CL, or no AMF inoculum treatments. Tall fescue averaged 77.4,
66.0, and 59.8 leaves plant-1
with WL, CL, and no AMF, respectively, while shoot
biomass averaged 6 g plant-1
for all three AMF inoculums, and root biomass averaged
3.8 for WL and 3.6 for both the CL and non-inoculated plants. Furthermore, the
similarity in shoot and root growth with each inoculum resulted in similar RSR values
as WL-inoculated tall fescue averaged 0.7 and CL and non-inoculated plants averaged
0.6. The similarity between AMF and non-AMF measurements supports other
findings that tall fescue‘s association with AMF is highly facultative, and in the
absence of AMF, can perform as well as AMF-colonized plants when soil is low in
available P (Lambert and Cole, 1980).
Growth measurements for big bluestem were similar between the WL and CL
inoculated plants for all variables, but, differences existed between AMF-inoculated
and non-inoculated plants (Table 22). Big bluestem produced 16.9 and 13.5 leaves
plant-1
, and 1.9 and 1.4 tillers plant-1
with WL and CL, respectively, but only averaged
Page 143
125
5.5 leaves and 1.0 tiller plant-1
with no AMF. Shoot biomass averaged 1.1 g plant-1
with either AMF, but only 0.01 g plant-1
with no AMF. Root biomass averaged 0.6
and 0.5 g plant-1
with WL and CL, respectively, and 0.1 g plant-1
with no AMF.
Similar results were found with eastern gamagrass as AMF-inoculated plants had
greater growth than non-inoculated plants (Table 22). Plants with AMF had 3 times as
many leaves and 4 times as many tillers as non-inoculated plants. Furthermore, shoot
biomass was 14 times greater and root growth 13 times greater for AMF-inoculated
plants. The one exception to this trend was in RSR as no difference was found
between AMF-inoculated (RSR=0.59) and non-inoculated eastern gamagrass
(RSR=0.67). In contrast, non-inoculated big bluestem had a RSR of 1.2, which was
greater than all others, and the only RSR greater than 1.0. Without AMF, big
bluestem was the only species to allocate more resources to root growth, likely to gain
access to P; however, overall biomass production with no AMF was nearly non-
existent.
The difference between AMF and non-AMF big bluestem and eastern
gamagrass was also evident in culm height (Table 22). Big bluestem culm height
averaged 49 cm with either WL or CL AMF, while non-AMF plants grew to only 6
cm. Eastern gamagrass culm height was 61 cm with WL, 55 cm with CL, and 27 cm
with no AMF. Culm height of non-inoculated eastern gamagrass was greater than
non-inoculated big bluestem suggesting slightly better access to P in the absence of
AMF. In contrast, no differences between AMF inoculums was found for tall fescue
as culm height reached 37, 44, and 43 cm with WL, CL, and no AMF, respectively
Page 144
126
(Table 22). Tall fescue culm height with no AMF was not different from big bluestem
with either WL or CL, or eastern gamagrass with CL, but greater than non-inoculated
big bluestem and eastern gamagrass. The tallest plants in this comparison were WL-
inoculated eastern gamagrass averaging 61 cm.
Without AMF, it is likely that either big bluestem or eastern gamagrass would
not survive in habitats where they had to compete against facultative, competitive
species such as tall fescue. Warm-season grasses, including big bluestem, are
dependent on AMF when soil P is limited (Daniels et al., 1988; Brejda et al., 1993;
Noyd et al., 1995; Collins and Foster, 2009). Root growth of tall fescue in this study
was at least 6 times greater than big bluestem with AMF and over 350 times greater
than big bluestem with no AMF (Table 22). Eastern gamagrass with no AMF had 25%
less root growth than tall fescue with or without AMF. However, inoculation with
either WL or CL was equally beneficial to the warm-season grasses, suggesting that
the WL AMF would not be a limiting factor for establishing prairie grasses on the
reclaimed mine soil. In contrast, tall fescue is clearly able to establish quickly in low
P soil, with or without AMF, which demonstrates why it has been widely used in
reclamation of surface mined lands in the eastern U.S. (Roberts et al., 1988a).
Newman and Moser (1988b) found significantly greater adventitious root growth for
tall fescue compared with big bluestem and other warm-season grass during a
glasshouse study comparing root growth at the emergence of a third leaf; however,
third leaf emergence occurred in 15-16 days for big bluestem and 28-32 days for tall
fescue. This suggests that tall fescue seedlings put early resources into root growth.
Page 145
127
Effect of soil compaction on grass growth
The interaction between grass species and soil compaction was not significant
at α=0.05; however, the response of the each species to increasing soil compaction
was of particular interest in this study. Therefore, the effect of soil compaction on
growth of each species was analyzed with only the WL and CL AMF-inoculated
plants. The non-inoculated plants were not included in the analysis because they
would bias the results. The reclaimed mine soil examined in this research contains
AMF (WL); therefore, a non-AMF scenario is unlikely in the effort to replace the non-
native forage complex with prairie vegetation.
Although tall fescue produced more shoot and root biomass than the other
grasses, increasing compaction did result in a reduction of growth (Figure 5). Tall
fescue shoot biomass was reduced from 6.5 to 4.2 g plant-1
, and root biomass declined
from 4.0 to 2.3 g plant-1
between 1.25 and 1.5 BD, respectively. Furthermore, tall
fescue averaged 22 and 17 tillers plant-1
at 1.0 and 1.25 BD, respectively, and only 14
tillers plant-1
at 1.5 BD; however, no difference was seen in culm height or RSR. Leaf
count also appeared to decline as BD increased, but differences were not detected.
These results conflict with an earlier study that found an increase in plant biomass of
KY-31 tall fescue between 1.6 and 2.0 g cm-3
in loam soil and only a slight decrease in
clay soil (Crews, 1984). However, in a turfgrass study, compaction during summer
resulted in a decrease in root biomass for tall fescue and not for perennial ryegrass
(Lolium perenne L.) (Carrow, 1980), indicating that tall fescue is potentially affected
by compaction.
Page 146
128
Big bluestem was also affected by compaction as plants at 1.0 BD averaged 18
leaves and 2 tillers, but declined to 11 leaves and 1.2 tillers plant-1
at 1.5 BD (Figure
5). Differences were not found between 1.0 and 1.25 BD. Culm height declined from
63 to 34 cm between 1.25 and 1.5 BD. Shoot and root biomass also declined with the
highest compaction level. Shoot biomass declined from 1.5 and 0.7 g plant-1
and root
biomass declined from 0.7 to 0.3 g plant-1
, between 1.25 and 1.5 BD, respectively.
The RSR did not differ between compaction levels averaging 0.6 at 1.0 BD, and 0.7 at
both 1.25 and 1.5 BD. Warm-season prairie grasses are generally slower to establish
than cool-season forage grasses (Newman and Moser, 1988b; Evanylo et al., 2005)
and big bluestem in this study was consistent with this generalization. Had the plants
grown for a longer period, growth likely would have been greater at all levels of
compaction.
Eastern gamagrass also produced fewer leaves and tillers, and less biomass
than tall fescue; however, it was not negatively affected by any level of compaction
(Figure 5). Leaf counts plant-1
averaged 18 to 24, tiller count averaged 3.6 to 4.8, and
culm height averaged 56 to 62 cm plant-1
. Shoot biomass averaged 1.7 to 2.5 g plant-1
,
root biomass averaged 1.0 to 1.4 g plant-1
, and the RSR remained constant at 0.6 for
each level of compaction. Eastern gamagrass appears slower to establish than tall
fescue; however, eastern gamagrass is effective in rooting through compacted soil and
has cellular compartments (aerenchyma) that allow air flow into deep roots (Clark et
al., 1998; Gilker et al., 2002; Krizek et al., 2003). Eastern gamagrass is also
successful planted in hedgerows for erosion and runoff control, suggesting tolerance
Page 147
129
of flooding (Dewald et al., 1996; Ritchie et al., 2000), and is as productive as
switchgrass (Panicum virgatum L.) in paired plantings (Edwards et al., 2000).
Conclusions
Establishing native prairie grasses on compacted reclaimed mine soil is limited
by adverse soil conditions. Tall fescue has been successful on reclaimed surface-
mined land in the eastern U.S. coal mining region, but is not native to North America
and is a major component of the low-diversity forage complex planted on mine soil.
Tall fescue establishes quickly but is slightly inhibited by compact soil of at least 1.5 g
cm-3
BD. Big bluestem is a dominant tallgrass prairie species that is slow to establish,
but also is slightly affect by compact soil. Eastern gamagrass is native to the region
and tolerates compacted and wet soil, and may be useful in ameliorating mine soil
compaction, which would facilitate establishment of other native species. Eastern
gamagrass is slower to establish than tall fescue, but is affected relatively less by
compaction. The AMF associated with cool-season forage grasses on reclaimed mine
soil is suitable for establishment of warm-season AMF-dependent prairie grasses;
however, tall fescue is not colonized well by AMF from native tallgrass prairie,
suggesting that tallgrass prairie AMF are more host specific than reclaimed mine soil
AMF. Big bluestem and eastern gamagrass are highly dependent on AMF in low-P
mine soil, whereas, the AMF association with tall fescue is completely facultative.
Page 148
130
Table 20. Soil properties of reclaimed mine soil and arbuscular mycorrhizal fungi
(AMF) pot-culture soil used in a 10-week glasshouse study examining the
affects of soil compaction and AMF on the growth of three grass species.
Mine
2
topsoil
(0-20 cm)
AMF3
Soil Parameter1 WL CL
pH 7.3 7.9 7.7
P (mg kg-1
) 12 7 < 1
K (mg kg-1
) 161 41 77
Ca (mg kg-1
) 3768 1262 1345
Mg (mg kg-1
) 321 198 235
1 Soil P analyzed with Bray P1 method; K, Ca, and Mg analyzed with ammonium
acetate extract method by STAR lab, Wooster, OH.
2 Soil collected from reclaimed surface mine land near Cumberland, OH currently
part of the Wilds (The International Center for the Preservation of Wild
Animals, Inc.).
3 Pot-culture soil containing AMF from the Wilds (WL) reclaimed surface mine
and from Claridon (CL) tallgrass prairie remnant near Marion, OH.
Page 149
131
Table 21. Arbuscular mycorrhizal fungi (AMF) root colonization in three
grasses growing in mine soil during a 10-week glasshouse study.
Grass species AMF1 Colonization (%)
2
Tall fescue WL 29.8 c
CL 9.8 d
None 0.0 d
Big bluestem WL 55.9 b
CL 31.7 c
None 0.0 d
Eastern gamagrass WL 76.2 a
CL 73.3 a
None 0.3 d
1 Sources of AMF are the Wilds (WL), a 30-year old reclaimed surface mine
area near Cumberland, OH, and the Claridon (CL) tallgrass prairie
remnant near Marion, OH.
2 Numbers followed by the same letter are not different using Fisher‘s
protected LSD (α=0.05).
Page 150
132
Table 22. Interaction between grass species and arbuscular mycorrhizal fungi (AMF) on growth parameters in sterilized
mine soil. Sources of AMF are the Wilds (WL), a 30-year old reclaimed surface mine area near Cumberland, OH, and
the Claridon (CL) tallgrass prairie remnant near Marion, OH, in a 10-week glasshouse experiment.
Growth parameters
1
Grass species AMF Leaves Tillers Height Shoot Root RSR
(plant-1
) (plant-1
) (cm plant-1
) (g plant-1
) (g plant-1
) (g g-1
)
Tall Fescue WL 77.4 a 19.4 a 36.7 c 5.9 a 3.8 a 0.7 b
CL 66.0 a 16.5 a 44.3 bc 6.1 a 3.6 a 0.6 b
None 59.8 a 27.9 a 43.1 bc 6.0 a 3.6 a 0.6 b
Big bluestem WL 16.9 cd 1.9 c 49.1 bc 1.1 c 0.6 c 0.8 b
CL 13.5 d 1.4 cd 49.1 bc 1.1 c 0.5 c 0.6 b
None 5.5 e 1.0 d 6.3 e 0.01 e 0.01 e 1.2 a
Eastern gamagrass WL 22.1 b 4.3 b 61.2 a 2.2 b 1.2 b 0.6 b
CL 19.6 bc 3.9 b 54.8 ab 2.0 b 1.2 b 0.6 b
None 6.1 e 1.0 d 26.8 d 0.14 d 0.09 d 0.7 b
1 Numbers in each column followed by the same letter are not different using Fisher‘s protected LSD (α=0.05).
132
Page 151
133
1.00 1.25 1.50
Lea
ves
(p
lant-1
)
0
20
40
60
80
100
1.00 1.25 1.50
Sh
oo
t bio
mas
s (g
pla
nt-1
)
0
2
4
6
8
1.00 1.25 1.50
Til
lers
(p
lant-1
)
0369
1215182124
1.00 1.25 1.50
Ro
ot
bio
mas
s (g
pla
nt-1
)0
1
2
3
4
5
Soil bulk density (g cm-3
)
1.00 1.25 1.50
Hei
gh
t cm
(pla
nt-1
)
0
10
20
30
40
50
60
70
Soil bulk density (g cm-3
)
1.00 1.25 1.50
Ro
ot:
sho
ot
(g g
-1)
0.0
0.2
0.4
0.6
0.8
1.0
a
jk
a
a
a
x xx
kj
a
ab
b
x xx
j
jk
j
l
a
xx
a
a
xjk
k
xx
x
a
b
jk
a
b
a
xx
x
jk jk
ns
nsns
j
Figure 5. Relationships between grass species and soil compaction in sterile mine soil
inoculated with arbuscular mycorrhizal fungi in a 10-week glasshouse study.
Species are tall fescue (—●—), big bluestem (– –■– –), and eastern gamagrass
(····▲····). Differences among compaction levels, for each species, are compared
with Fisher‘s protected LSD (α=0.05) and are shown by the following letters for
each species: tall fescue (a,b,c), big bluestem (j,k,l), eastern gamagrass (x,y,z), and
ns=non-significant.
Page 152
134
Chapter 7: Summary and Conclusions
This research finds prairie grasses native to North America able to establish on
compacted, calcareous reclaimed mine soil with the potential to increase plant
diversity and ecological function on landscapes with habitats compromised by surface
mining. However, species selection must include those that tolerate limitations caused
by soil compaction, including periods of saturation and flooding due to poor
permeability, and restricted rooting leading to drought and limited mineral availability.
Species most successful in establishing employed different mechanisms to survive on
the mine soil. Eastern gamagrass produced thick, coarse crowns and roots that
penetrated the compacted profile. Tall dropseed established a dense stand as its small
seeds were able to find suitable safe sites to germinate. Tall dropseed was also not
dependent on AMF for growth in low P soil, which is unlike other warm-season
prairie grasses. Buffalograss thrived on the bare soil plots as its spreading stolons
quickly produced a dense ground cover. Furthermore, its natural tolerance of drought
maintained its growth during summer between rainfall events when the clayey topsoil
dried and cracked. Cool-season slender wheatgrass germinated quickly and also
established early ground cover; however, it declined after two years and appeared
stressed by either drought or low available soil nutrients. Virginia wildrye established
Page 153
135
well in the first planting year, but not well in the second, which may have due to
seedling herbivory. Western wheatgrass had low initial germination but spread by
rhizomes into bare-soil areas and appears to be well adapted to the mine soil habitat.
In contrast, sideoats and blue grama established well in their seedling year, but were
unable to persist into year two. This was likely due to intolerance of anaerobic soil
conditions that persist on the mine soil during late winter and spring. Cool-season
species limited to the arid West did not establish in the first year and likely reflected
incompatibility with the general climate.
Tallgrass and mixed prairie dominants big bluestem, Indiangrass, and little
bluestem had low initial establishment success. Seedling establishment rates were low
and not related to number of seeds sown. These grasses are recognized as slow to
establish but limited number of available safe sites on the mine soil clearly diminished
their success. It was unclear why initial germination rates were low, but seedlings
were observed with elevated crowns through summer of the seedling year, and first
year biomass production was low. Poor germination and early growth left open gaps
in plots seeded with these species. Symbiosis with AMF is critical for survival of
these warm-season grasses when soil P is low; however, the mine soil AMF was found
to be equally or more effective than AMF from the Claridon tallgrass prairie remnant.
Therefore, inadequate AMF was not a limiting factor for establishment on the mine
soil.
The success of non-native forages on the mine soil is also due to mechanisms
that overcome the poor soil habitat. Tall fescue is able to root in compacted soil,
Page 154
136
establishes early, and is not dependent on AMF when soil P is low. Kentucky
bluegrass appears to avoid the compacted soil by producing thick sod at the soil
surface and tolerating drought periods when they occur. Furthermore, Kentucky
bluegrass sod is a barrier for seedling establishment and may function to reduce
abundance of tall fescue on compacted mine soil when older fescue plants weaken and
die. Bird‘s-foot trefoil is a deep-rooting legume that benefits from symbiosis with
nitrogen fixing bacteria and AMF. These species are also tolerant of saturated soil and
are quick to establish, thus producing a competitive ground cover. Establishing native
prairie communities on mine soil that has supported these non-native forages is
dependent on controlling their reestablishment following planting of prairie species.
Large gaps left open by poor establishment and slow growth of species like big
bluestem are open for reinvasion by the forage species. In this research, plots with
poor establishment were quickly re-colonized by Kentucky bluegrass in the second
year after planting when no fallow year preceded the prairie grass planting; however,
when a fallow year preceded planting, bird‘s-foot trefoil seeds broke dormancy and
established a thick cover (Table 23, Appendix B). Furthermore, intensive use of
herbicides was used to control the invasive Canada thistle during the first two years.
Managing the succession and development of prairie species on the mine soil
landscape is critical for the establishment success of a ‗native‘ mine-soil prairie
community. Finding a compliment of early and late establishing species is critical for
long-term stability and functioning of a new, diverse prairie community. Tall
dropseed, buffalograss, and slender wheatgrass establish easily and produce early
Page 155
137
ground cover. Eastern gamagrass establishes easily and is highly productive and
produces greater vertical structure than the other grasses. Eastern gamagrass also is
less affected by compaction than the other species in this study, including the non-
native forages, and likely would ameliorate the compaction problem in time as its
roots penetrate deeper into the profile. Late-successional prairie species big bluestem
and Indiangrass may become dominant on mine soil, but would easily be overtaken by
the non-native forage grasses during seedling competition. Therefore, a threshold
must be crossed where native prairie species can establish, reproduce, and replace
themselves on the mine soil without the system reverting back to the non-native forage
complex, or in a different direction, i.e. autumn olive thicket. This will result from
selection of a diverse set of species that incorporates multiple mechanisms to deal with
the soil habitat, and provides opportunities for management inputs, e.g. fire,
herbicides, mowing, grazing, to correct deviations from desired prairie development.
This research also proposes questions regarding how to achieve desired
successional goals, not just for calcareous compacted reclaimed mine soil in Ohio, but
for any restoration problem. Ecological restoration can be viewed as ‗managed
succession‘ where at any point during development, a number of outcomes are
possible given events or conditions that may occur. The challenge is to find
opportunities through species selection or habitat manipulation that create possibilities
for management activities that promote development of desired communities that
ultimately increase ecosystem function on damaged or degraded landscapes.
Page 156
138
References
Abbott, L.B., and B.A. Roundy. 2003. Available water influences field germination
and recruitment of seeded grasses. J Range Manage 56:56-64.
Abdul-Kareem, A.W. and S.G. McRae. 1984. The effects on topsoil of long-term
storage in stockpiles. Plant Soil 76:357-363.
Al-Karaki, G.N., and M. Al-Omoush. 2002. Wheat response to phosphogypsum and
mycorrhizal fungi in alkaline soil. J Plant Nutr 25:873-883.
Allen, E.B. 1989. The restoration of disturbed arid landscapes with special reference
to mycorrhizal fungi. J Arid Environ 17:279-286.
Allen, E.B., and M.F. Allen. 1984. Competition between plants of different
successional stages: mycorrhizae as regulators. Can J Bot 62:2625-2629.
Allen, M.F., and E.B. Allen. 1992. Mycorrhizae and plant community development:
mechanisms and patterns. In The Fungal community: its organization and role in
the ecosystem. G.C. Carrol and D.T. Wicklow (Eds.). Mycology Series 9. Marcel
Dekker, Inc., New York.
Anderson, R.C. 1985. Aspects of the germination ecology and biomass production of
eastern gamagrass (Tripsacum dactyloides L.). Bot Gaz 146:353-364.
Axelrod, D.I. 1985. Rise of the grassland biome. Bot Rev 51:163-201.
Page 157
139
Baer, S.G., J.M. Blair, S.L. Collins, and A.K. Knapp. 2003. Soil resources regulate
productivity and diversity in newly established tallgrass prairie. Ecology 84:724-
735.
Barrow, N.J., N. Malajczuk, and T.C. Shaw. 1977. A direct test of the ability of
vesicular-arbuscular mycorrhizae to help plants take up fixed soil phosphate. New
Phytol 78:269-276.
Bellairs, S.M., and D.T. Bell. 1993. Seed stores for restoration of species-rich
shrubland vegetation following mining in western Australia. Restor Ecol 1:231-
240.
Bengough, A.G., C. Croser, and J. Pritchard. 1997. A biophysical analysis of root
growth under mechanical stress. Plant Soil 189:155-164.
Bevor, J.D. 2002. Host-specificity of AM fungal population growth rates can generate
feedback on plant growth. Plant Soil 244:281-290.
Bosy, J.L., and R.J. Reader. 1995. Mechanisms underlying the suppression of forb
seedling emergence by grass (Poa pratensis) litter. Funct Ecol 9:635-639.
Bradshaw, A.D. 1988. Alternative endpoints for reclamation. In, Rehabilitating
damaged ecosystems, II. J. Cairns, Jr. (Ed.). CRC Press, Boca Raton, FL
Brady, N.C. 1984. The nature and properties of soils. Macmillan Publ., New York.
Brant, R.A. 1964. Geological description and effects of strip mining on coal
overburden material. Ohio J Sci 64:68-75.
Braun, E.L. 1950. Deciduous forests of eastern North America. Hafner, New York.
Page 158
140
Brejda, J.J., D.H. Yocom, L.E. Moser, and S.S. Waller. 1993. Dependence of 3
Nebraska Sandhills warm-season grasses on vesicular-arbuscular mycorrhizae. J
Range Manage 46:14-20.
Burger, J.A., D.A. Scott, and D.O. Mitchem. 2002. Field assessment of mine site
quality for establishing hardwoods in the Appalachians. In, Reclamation with a
purpose. R.I. Barnhisel (Ed.). American Society of Mining and Reclamation,
Lexington, KY.
Burke, M.J.W., and J.P. Grime. 1996. An experimental study of plant community
invisibility. Ecology 77:776-790.
Carrow, R.N. 1980. Influence of soil compaction on three turfgrass species. Agron J
72:1038-1042.
Casselman, C.N., T.R. Fox, J.A. Burger, A.T. Jones, and J.M. Galbraith. 2006. Effects
of silvicultural treatments on survival and growth of trees planted on reclaimed
mine lands in the Appalachians. Forest Ecol Manage 223:403-414.
Cavagnaro, T.R., F.A. Smith, S.E. Smith, and I. Jakobsen. 2005. Functional diversity
in arbuscular mycorrhizas: exploitation of soil patches with different phosphate
enrichment differs among fungal species. Plant Cell Environ 28:642-650.
Cavender, N., and M. Knee. 2006. Relationship of seed source and arbuscular
mycorrhizal fungi inoculum type to growth and colonization of big bluestem
(Andropogon gerardii). Plant Soil 285:57-65.
Page 159
141
Chu-Chou, M., B. Guo, Z.Q. An, J.W. Hendrix, R.S. Ferriss, M.R. Siegel, C.T.
Dougherty, and P.B. Burrus. 1992. Suppression of mycorrhizal fungi in fescue by
the Acremonium coenophialum endophyte. Soil Biol Biochem 24:633-637.
Clark, R.B., E.E. Alberts, R.W. Zobel, T.R. Sinclair, M.S. Miller, W.D. Kemper, and
C.D. Foy. 1998. Eastern gamagrass (Tripsacum dactyloides) root penetration and
chemical properties of claypan soils. Plant Soil 200:33-45.
Collins, C.D., and B.L. Foster. 2009. Community-level consequences of mycorrhizae
depend on phosphorus availability. Ecology 90:2567-2576.
Cornelius, D.R. 1944. Revegetation in the tall grass prairie region. Agron J 36:393-
400.
Cresswell, H.P., and J.A. Kirkegaard. 1995. Subsoil amelioration by plant roots --- the
process and the evidence. Soil Phys Hydrol 33:221-239.
Crews, J.T. 1984. Effect of minesoil compaction on growth and yield of KY-31 tall
fescue and Sericea lespedeza. Northeastern Forest Exp Station, Res Note NE-320,
USDA, Forest Service. Berea, KY.
Croton, J.T., and G.L. Ainsworth. 2007. Development of a winged tine to relieve
mining-related soil compaction after bauxite mining in western Australia. Restor
Ecol 15:S48-S53.
Crowell, H.F., and R.E.J. Boerner. 1988. Influences of mycorrhizal and phosphorus on
belowground competition between two old-field annuals. Environ Exp Bot 28:381-
392.
Page 160
142
Curtis, J.T. and M.L. Partch. 1948. Effect of fire on the competition between blue
grass and certain prairie plants. Am Midl Nat 39:437-443.
DaCosta, M., Z. Wang, and B. Huang. 2004. Physiological adaptation of Kentucky
bluegrass to localized soil drying. Crop Sci 44:1307-1314.
Daniels, B.A., J.F. Leslie, G.T. Wilson, and D.G. Kitt. 1988. Physical and topological
assessment of effects of a vesicular-arbuscular mycorrhizal fungus on root
architecture of big bluestem. New Phytol 110:85-96.
Daubenmire, R.F. 1959. A canopy coverage method of vegetation analysis. Northwest
Sci 33:43-64.
Dewald, C.L., J. Henry, S. Bruckerhoff, J. Ritchie, S. Dabney, D. Shepherd, J.
Douglas, and D. Wolf. 1996. Guidelines for establishing warm season grass
hedges for erosion control. J Soil Water Conserv 51:16-20.
Dhillion, S.S. 1992. Evidence for host-mycorrhizal preference in native grassland
species. Mycol Res 96:359-362.
Diboll, N. 1997. Designing seed mixes. In, The tallgrass restoration handbook for
prairies, savannas, and woodlands. S. Packard and C.F. Mutel (Eds.). Island Press,
Washington, DC.
Dodds, W.K., K.C. Wilson, R.L. Rehmeier, G.L. Knight, S. Wiggam, J.A. Falke, H.J.
Dalgleish, and K.N. Bertrand. 2008. Comparing ecosystem goods and services
provided by restored and native lands. BioScience 58:837-845.
Page 161
143
Dwire, K.A., J.B. Kauffman, E.N.J. Brookshire, J.E. Baham. 2004. Plant biomass and
species composition along an environmental gradient in montane riparian
meadows. Oecologia 139:309-317.
Edwards, S., J. Douglas, and H. Bloodworth. 2000. Clipping effect on yield and
quality of eastern gamagrass, switchgrass, and bermudagrass. In, Proceedings of
the 2nd
Eastern Native Grass Symposium, Baltimore, MD, Nov.17–19 1999; J.C.
Ritchie, J.A. Dickerson, and C.A. Ritchie (Eds.); United States Department of
Agriculture, Agricultural Research Service and Natural Resources Conservation
Service, Beltsville, MD.
Evanylo, G.K., A.O. Abaye, C. Dundas, C.E. Zipper, R. Lemus, B. Sukkariyah, and J.
Rockett. 2005. Herbaceous vegetation productivity, persistence, and metals uptake
on a biosolids-amended mine soil. J Environ Qual 34:1811-1819.
Fischer, A., and H. Fischer. 2006. Restoration of forests. In, Restoration Ecology. J.
van Andel and J. Aronson (Eds.). Blackwell Publ., Malden, MA.
Fitter, A.H. 1986. Spatial and temporal patterns of root activity in a species-rich alluvial
grassland. Oecologia 69:594-599.
Flombaum, P., and O.E. Sala. 2008. Higher effect of plant species diversity on
productivity in natural than artificial ecosystems. P Natl Acad Sci USA 105:6087-
6090.
Foster, B.L., and D. Tilman. 2003. Seedling limitation and the regulation of
community structure in oak savanna grassland. J Ecol 91:999-107.
Page 162
144
Foster, B.L., C.A. Murphy, K.R. Keller, T.A. Aschenbach, E.J. Questad, and K.
Kindscher. 2007. Restoration of prairie community structure and ecosystem
function in an abandoned hayfield: a sowing experiment. Restor Ecol 15:652-661.
Frank, A.B., and A. Bauer. 1991. Rooting activity and water use during vegetative
development of crested and western wheatgrass. Agron J 83:906-910.
Frasier, G.W., D.A. Woolhiser, and J.R. Cox. 1984. Emergence and seedling survival
of two warm-season grasses as influenced by the timing of precipitation: a
greenhouse study. J Range Manage 37:7-11.
Gange, A.C., V.K. Brown, and G.S. Sinclair. 1993. Vesicular-arbuscular mycorrhizal
fungi: a determinant of plant community structure in early succession. Funct Ecol
7:616-622.
Gange, A.C., V.K. Brown, and L.M. Farmer. 1990. A test of mycorrhizal benefit in an
early successional plant community. New Phtol 115:85-91.
Gerdemann, J.W. 1968. Vesicular-arbuscular mycorrhiza and plant growth. Annu Rev
Phytopathol 6:397-418.
Getzin, S., T. Wiegand, K. Wiegand, and F. He. 2008. Heterogeneity influences
spatial patterns and demographics in forest stands. J Ecol 96:807-820.
Gilker, R.E., R.R. Weil, D.T. Krizek, and B. Momen. 2002. Eastern gamagrass root
penetration in adverse subsoil conditions. Soil Sci Soc Am J 66:931-938.
Gillespie, I.G., and E.B. Allen. 2006. Effects of soil and mycorrhizae from native and
invaded vegetation on a rare California forb. Appl Soil Ecol 32:6-12.
Page 163
145
Giovannetti, M., and B. Mosse. 1980. An evaluation of techniques for measuring
vesicular arbuscular mycorrhizal infection in roots. New Phytol 84:489-500.
Goebel, P.C. and D.M. Hix. 1996. Development of mixed-oak forests in southeastern
Ohio: a comparison of second-growth and old-growth forests. Forest Ecol Manag
84:1-21.
Gould, A.B, and A.E. Liberta. 1981. Effects of topsoil storage during surface mining
on the viability of vesicular-arbuscular mycorrhiza. Mycologia 73:914-921.
Grime, J.P. 1977. Evidence for existence of three primary strategies in plants and its
relevance to ecological and evolutionary theory. Am Nat 111:1169-1194.
Gross, M. 2003. Inventing nature: ecological restoration by public experiments.
Lexington Books, Lanham, MD.
Guo, B.Z., J.W. Hendrix, Z.-Q. An, and R.S. Ferriss. 1992. Role of Acremonium
endophyte of fescue on inhibition of colonization and reproduction of mycorrhizal
fungi. Mycologia 84:882-885.
Haering, K.C., W.L. Daniels, and J.M. Galbraith. 2004. Appalachian mine soil
morphology and properties: effects of weathering and mining method. Soil Sci Soc
Am J 68:1315-1325.
Hannaway, D., S. Fransen, J. Cropper, M. Teel, M. Chaney, T. Griggs, R. Halse, J.
Hart, P. Cheeke, D. Hansen, R. Klinger, W. Lane. 1999. Tall Fescue (Festuca
arundinaceae Schreb.). Pacific Northwest Bull 504. Oregon State University
Extension Service, Corvallis, OR.
Harper, J.L. 1977. Population biology of plants. Academic Press, London.
Page 164
146
Harris, G.A. 1967. Some Competitive Relationships between Agropyron spicatum and
Bromus tectorum. Ecol Monogr 37:89-111.
Hartnett, D.C., R.J. Samenus, L.E. Fischer, and B.A.D. Hetrick. 1994. Plant
demographic response to mycorrhizal symbiosis in tallgrass prairie. Oecologia
99:21-26.
Henkel, T.W., W.K. Smith, and M. Christensen. 1989. Infectivity and effectivity of
indigenous vesicular-arbuscular mycorrhizal fungi from contiguous soils in
southwestern Wyoming, USA. New Phtol 112:205-214.
Hetrick, B.A.D., D.G. Kitt, and G.T. Wilson. 1986. The influence of phosphorus
fertilization, drought, fungal species, and nonsterile soil on mycorrhizal growth
response in tall grass prairie plants. Can J Bot 64:1199-1203.
Hetrick, B.A.D., G.W.T. Wilson, and D.A.H. Figge. 1994. The influence of
mycorrhizal symbiosis and fertilizer amendments on establishment of vegetation in
heavy metal mine spoil. Environ Pollut 86:171-179.
Hetrick, B.A.D., G.W.T. Wilson, and J.F. Leslie. 1991. Root architecture of warm-
and cool-season grasses: relationship to mycorrhizal dependence. Can J Bot
69:112-118.
Hitchcock, A.S. 1971. Manual of the grasses of the United States. A. Chase (Ed.).
Dover Public., New York, NY.
Hsu, F.H. and C.J. Nelson. 1986. Planting date effects on seedling development of
perennial warm-season grasses. Agron J 78:33-38.
Page 165
147
Huston, M., and T. Smith. 1987. Plant succession: life history and competition. Am
Nat 130:168-198.
Iman, R.L., Hora, S.C., Conover, W.J., 1984. Comparison of asymptotically
distribution-free procedures for the analysis of complete blocks. J Am Stat Assoc
79:674–685.
Indorante, S.J., I.J. Jansen, and C.W. Boast. 1981. Surface mining and reclamation:
initial changes in soil character. J Soil Water Conserv 36:347-351.
Ingold, D.J. 2002. Use of reclaimed stripmine land by grassland nesting birds in east-
central Ohio. Ohio J Sci 102:56-62.
Iverson, L.R., and M.K. Wali. 1982. Buried, viable seeds and their relationship to
revegetation after surface mining. J Range Mange 35:648-652.
Jackson, L. 1999. Establishing tallgrass prairie on grazed permanent pasture in the
upper Midwest Restor Ecol 7:127-138.
Janos, D.P. 1980. Mycorrhizae influence tropical succession. Biotropica 12 (vol. 2
suppl.):56-64.
Jasper, D.A., L.K. Abbott, and A.D. Robson. 1989. Soil disturbance reduces the
infectivity of external hyphae of vesicular-arbuscular mycorrhizal fungi. New
Phytol 112:93-99.
Jastrow, J.D. 1987. Changes in soil aggregation associated with tallgrass prairie
restoration. Am J Bot 74:1656-1664.
Page 166
148
Jayachandran, K., A.P. Schwab, and B.A.D. Hetrick. 1989. Mycorrhizal mediation of
phosphorus availability: synthetic iron chelate effects on phosphorus
solubilization. Soil Sci Soc Am J 53:1701-1706.
Kaster, G, and J.P. Vimmerstedt. 1996. Tree planting on strip-mined land. In, Forest
Resource Issues in Ohio 1996. E.R. Norland and M.S. Ervin (Eds.), Legislator‘s
Handbook, 2nd
Edition. Ohio Society of American Foresters, Columbus, OH.
Kivimäki, S.K, M. Yli-petäys, and E.-S. Tuittila. 2008. Carbon sink function of sedge
and Sphagnum patches in a restored cut-away peatland: increased functional
diversity leads to higher production. J Appl Ecol 45:921-929.
Kleijn, D. 2003. Can establishment characteristics explain the poor colonization
success of late successional grassland species on ex-arable land? Restor Ecol
11:131-138.
Kline, V.M. 1997. Orchards of oak and a sea of grass. In, The tallgrass restoration
handbook for prairies, savannas, and woodlands. Packard, S., and C.F. Mutel
(Eds.). Island Press, Washington, D.C.
Klips, R.A. 2003. Vegetation of Claridon railroad prairie, a remnant of the Sandusky
Plains of central Ohio. Castanea 68:135-142.
Klips, R.A. 2004. Using newly developed analytical tools to compare a restored
prairie with a remnant in Ohio Ecol Restor 22:99-105.
Koske, R.E., and J.N. Gemma. 1997. Mycorrhizae and succession in planting of
beachgrass in sand dunes. Am J Bot 84:118-130.
Page 167
149
Kost, D.A., M.M. Larson, J.P. Vimmerstedt, J.H. Brown, and D.B. Houston. 1994.
Final report: reclamation of calcareous coal spoils with trees, shrubs, and forages.
The Ohio State Univ / Ohio Agric Res Dev Center, Wooster, OH.
Kothari, S.K., H. Marschner, and V. Römheld. 1990. Direct and indirect effects of VA
mycorrhizal fungi and rhizosphere microorganisms on acquisition of mineral
nutrients by maize (Zea mays L.) in a calcareous soil. New Phytol 116:637-645.
Kozlowski, T.T. 1999. Soil compaction and growth of woody plants. Scand J For Res
14:596-619.
Krizek, D.T., J.C. Ritchie, A.M. Sadeghi, C.D. Foy, E.G. Rhoden, J.R. Davis, and
M.J. Camp. 2003. A four-year study of biomass production of eastern gamagrass
grown on an acid compact soil. Commun Soil Sci Plan 34:457-480.
Lal, R. 1993. Tillage effects on soil degradation, soil resilience, soil quality, and
sustainability. Soil Till Res 27:1-8.
Lambert, D.H., and H. Cole Jr. 1980. Effects of mycorrhizae on establishment and
performance of forage species in mine spoil. Agron J 72:257-260.
Larson, M.M, and J. P. Vimmerstedt. 1983. Evaluation of 30-year-old plantations on
strip-mined land in east central Ohio. The Ohio State Univ / Ohio Agric Res Dev
Center, Res Bull 1149, Wooster, OH.
Launchbaugh, J.L., and C.E. Owensby. 1970. Seeding Rate and First-Year Stand
Relationships for Six Native Grasses. J Range Manag 23:414-417.
Page 168
150
Laurenroth, W.K., O.E. Sala, D.P. Coffin, and T.B. Kirchner. 1994. The importance of
soil water in the recruitment of Bouteloua gracilis in the shortgrass steppe. Ecol
Applic 4:741-749.
Lauriault, L.M., R.E. Kirksey, and D.M. VanLeeuwen. 2005. Performance of
perennial cool-season forage grasses in diverse soil moisture environments,
Southern High Plains, USA. Crop Sci 45:909-915.
Lioi, L., and M. Giovannetti. 1987. Variable effectivity of three vesicular-arbuscular
mycorrhizal endophytes in Hedysarum coronarium and Medicago sativa. Biol
Fertil Soils 4:193-197.
Liu, R., and F. Wang. 2003. Selection of appropriate host plants used in trap culture of
arbuscular mycorrhizal fungi. Mycorrhiza 13:123-127.
Loree, M.A.J., and S.E. Williams. 1987. Colonization of western wheatgrass
(Agropyron smithii Rydb.) by vesicular-arbuscular mycorrhizal fungi during the
revegetation of a surface mine. New Phytol 106:735-744.
Martin, L.M., K.A. Moloney, and B.J. Wilsey. 2005. An assessment of grassland
restoration success using species diversity components. J Appl Ecol 42:327-336.
Masters, R.A. 1997. Influence of seeding rate on big bluestem establishment with
herbicides. Agron J 89:947-951.
McBride, M.B. 1994. Environmental chemistry of soils. Oxford University Press, Inc.
New York, NY.
McKenna, J.R., D.D. Wolf, and M. Lentner. 1991. No-till warm-season grass
establishment as affected by atrazine and carbofuran. Agron J 83:311-316.
Page 169
151
Meek, B.D., W.R. DeTar, D. Rolph, E.R. Rechel, and L.M. Carter. 1990. Infiltration
rate as affected by an alfalfa and no-till cotton cropping system. Soil Sci Soc Am J
54:505-508.
Milliken, G.A., and D.E. Johnson. 1984. Analysis of messy data, Volume I: designed
experiments. Wadsworth, Inc., Belmont, CA.
Miransari, M., H.A. Bahrami, F. Rejali, M.J. Malakouti, and H. Torabi. 2007. Using
arbuscular mycorrhiza to reduce the stressful effects of soil compaction on corn
(Zea mays L.) growth. Soil Biol Biochem 39:2014-2026.
Mitchell, R.B., R.A. Masters, S.S., Waller, K.J. Moore, and L.J. Young. 1996.
Tallgrass prairie vegetation response to spring burning dates, fertilizer, and
atrazine. J Range Manage 49:131-136.
Mohammad, M.J., W.L. Pan, and A.C. Kennedy. 1995. Wheat response to vesicular-
arbuscular mycorrhizal fungal inoculation of soils from eroded toposequence. Soil
Sci Soc Am J 59:1086-1090.
Mosse, B. 1973. Plant growth responses to vesicular-arbuscular mycorrhizae IV. In
soil given additional phosphate. New Phytol 72:127-136.
Nadian, H., S.E., Smith, A.M. Alston, and R.S. Murray. 1997. Effects of soil
compaction on plant growth, phosphorus uptake and morphological characteristics
of vesicular-arbuscular mycorrhizal colonization of Trifolium subterraneum. New
Phytol 135:303-311.
Newman, E.I. 1966. A method of estimating the total length of root in a sample. J
Appl Ecol 3:139-145.
Page 170
152
Newman, P.R., and L.E. Moser. 1988a. Grass seedling emergence, morphology, and
establishment as affected by planting depth. Agron J 80:383-387.
Newman, P.R., and L.E. Moser. 1988b. Seedling root development and morphology of
cool-season and warm-season forage grasses. Crop Sci 28:148-151.
Nobel, P.S., P.M. Miller, and E.A. Graham. 1992. Influence of rocks on soil
temperature, soil water potential, and rooting patterns for desert succulents.
Oecologia 92:90-96.
Noyd, R.K., F.L. Pfleger, and M.P. Russelle. 1995. Interactions between native prairie
grasses and indigenous arbuscular mycorrhizal fungi: implications for reclamation
of taconite iron ore tailing. New Phytol 129:651-660.
Nyström, M., and C. Folke. 2001. Spatial resilience of coral reefs. Ecosystems 4:406-
417.
Oswald, B.P., and L.F. Neuenschwander. 1993. Microsite variability and safe site
description for western larch germination and establishment. B Torrey Bot Club
120:148-156.
Pearson, R.W., R. Spry, and H.W. Pierre. 1940. The vertical distribution of total and
dilute acid-soluble phosphorus in twelve Iowa soil profiles. Agron J 32:683-696.
Pérez, C.J., S.S. Waller, L.E. Moser, J.L. Stubbendiek, and A.A. Steuter. 1998.
Seedbank characteristics of a Nebraska sandhills prairie. J. Range Mange. 51:55-
62.
Peters, T.J., R.S. Moomaw, and A.R. Martin. 1989. Herbicides for postemergence
control of annual grass weeds in seedling forage grasses. Weed Sci 37:375-379.
Page 171
153
Phillips, J.M., and D.S. Hayman. 1970. Improved procedures for clearing roots and
staining parasitic and vesicular-arbuscular mycorrhizal fungi for rapid assessment
of infection. Brit Mycol Soc Trans 5:158-161.
Potvin, M.A. 1993. Establishment of native grass seedlings along a
topographic/moisture gradient in the Nebraska Sandhills. Am Midl Nat. 130:248-
261.
Randolph, L.F. 1970. Variation of Tripsacum populations of Mexico and Guatemala.
Brittonia 22:305-307.
Rasse, D.P., and A.J.M. Smucker. 1998. Root colonization of previous root channels
in corn and alfalfa rotations. Plant Soil 204:203-212.
Raven, P.H., and L.R. Berg. 2004. Environment, 4th
Edition. John Wiley & Sons,
Hoboken, NJ.
Reis, R.E. 1993. Historical perspective of ecological reclamation. In, The challenge of
integrating diverse perspectives in reclamation. Zamora, B.A., and R.E. Connolly
(Eds.). Proceedings of the 10th
Annual Meeting of the American Society for
Surface Mining and Reclamation. Spokane, WA
Rhodes, L.H., and J.W. Gerdemann. 1975. Phosphate uptake zones of mycorrhizal and
non-mycorrhizal onions. New Phytol 75:555-561.
Richards, L.A. 1947. Pressure membrane apparatus, construction and use. Agr. Eng.
28:451-454.
Richardson, A.E., P.J. Hocking, R.J. Simpson, and T.S. George. 2009. Plant
mechanisms to optimize access to soil phosphorus. Crop Pasture Sci 60:124-143.
Page 172
154
Ritchie, J.C.; Kemper, W.D.; Englert, J.M.; Krizek, D.T. 2000. Grass hedges for
erosion control. In, Proceedings of the 2nd
Eastern Native Grass Symposium,
Baltimore, MD, Nov.17–19 1999; J.C. Ritchie, J.A. Dickerson, and C.A. Ritchie
(Eds.). United States Department of Agriculture, Agricultural Research Service
and Natural Resources Conservation Service, Beltsville, MD.
Rives, C.S., M.I. Bajwa, A.E. Liberta, and R.M. Miller. 1980. Effects of topsoil
storage during surface mining on the viability of VA mycorrhiza. Soil Sci
129:253-257.
Roberts, J.A., W.L. Daniels, J.C. Bell, and D.C. Martens. 1988a. Tall fescue
production and nutrient status on southwest Virginia mine soils. J Environ Qual
17:55-62.
Roberts, J.A., W.L. Daniels, J.C. Bell, and J.A. Burger. 1988b. Early stages of mine
soil genesis in a southwest Virginia spoil lithosequence. Soil Sci Soc Am J 52:716-
723.
Robocker, W.C., J.T. Curtis, and H.L. Ahlgren. 1953. Some factors affecting
emergence and establishment of native grass seedlings in Wisconsin. Ecology
34:194-199.
Rokich, D.P., K.W. Dixon, K. Sivasithamparam, and K.A. Meney. 2000. Topsoil
handling and storage effects on woodland restoration in Western Australia. Restor
Ecol 8:196-208.
Page 173
155
Ronsheim, M.L., and S.E. Anderson. 2001. Population-level specificity in the plant-
mycorrhizae associations alters intraspecific interactions among neighboring
plants. Oecologia 128:77-84.
Sainz, M.J., and J. Arines. 1988. Effects of native vesicular-arbuscular mycorrhizal
fungi and phosphate fertilizer on red clover growth in acid soils. J Agric Sci Camb
111:67-73.
Sala, O.E., W.J. Patron, L.A. Joyce, and W.K. Laurenroth. 1988. Primary production
of the central grassland region of the United States. Ecology 69:40-45.
Sampson, J.F. and L.E. Moser. 1982. Sod-seeding perennial grasses into eastern
Nebraska pastures. Agron J 74:1055-1060.
Sanchez, C.A. 2007. Phosphorus. In, Handbook of plant nutrition. A.V. Barker and
D.J. Pilbeam (Eds.). CRC Press, Boca Raton, FL.
Sanders, I.R. 2003. Preference, specificity and cheating in the arbuscular mycorrhizae
symbiosis. Trends Plant Sci 8:143-145.
Sanders, I.R., and A.H. Fitter. 1992. The ecology and functioning of vesicular-
arbuscular mycorrhizas in co-existing grassland species. New Phytol 120:525-533.
Schaefer, V. 2009. Alien invasions, ecological restoration in cities and the loss of
ecological memory. Restor Ecol 17:171-176.
Schubert, A., and D.S. Hayman. 1986. Plant growth responses to vesicular-arbuscular
mycorrhiza. XVI. Effectiveness of different endophytes at different levels of soil
phosphate. New Phytol 103:79-90.
Page 174
156
Scullion, J., W.R. Eason, and E.P. Scott. 1998. The effectivity of arbuscular
mycorrhizal fungi from high input conventional and organic grassland and grass-
arable rotations. Plant Soil 204:243-254.
Seaman, W. 2007. Artificial habitats and the restoration of degraded marine
ecosystems and fisheries. Hydrobiologia 580:143-155.
Shetty, K.G., B.A.D. Hetrick, and A.P. Schwab. 1995. Effects of mycorrhizae and
fertilizer amendments on zinc tolerance of plants. Environ Pollut 88:307-314.
Shrestha, R.K., R. Lal, and P.A. Jacinthe. 2009. Enhancing carbon and nitrogen
sequestration in reclaimed soils through organic amendments and chiseling. Soil
Sci Soc Am J 73:1004-1011.
Sinnett, D., J. Poole, and T.R. Hutchings. 2006. The efficacy of three techniques to
alleviate soil compaction at a restored sand and gravel quarry. Soil Use Manage
22:362-371.
Skousen, J.G., and C.L. Venable. 2008. Establishing native plants on newly
constructed and older-reclaimed sites along West Virginia highways. Land Degrad
Develop 19:388-396.
SMCRA (Surface Mining Control and Reclamation Act). 1977. Office of Surface
Mining Reclamation and Enforcement, U. S. Department of Interior. Washington,
D.C.
Smith, F.A., and S.E. Smith. 1997. Structural diversity in (vesicular)-arbuscular
mycorrhizal symbiosis. New Phytol 137:373-388.
Page 175
157
Soil Survey Staff. 1996. Soil survey of Muskingum County, Ohio. United States
Department of Agriculture, Natural Resources Conservation Service, Washington,
DC.
Stewart, J.R., R. Kjelgren, P.G. Johnson, and M.R. Kuhns. 2004. Soil-water-use
characteristics of precision-irrigated buffalograss and Kentucky bluegrass. Online.
Appl. Turf. Sci. doi:10.1094/ATS-2004-1118-01-RS.
Stubbendieck, J., and W.G. McCully. 1972. Factors affecting germination, emergence
and establishment of sand bluestem. J Range Manage 25:383-385.
Stubbendieck, J., S.L. Hatch, and K.J. Hirsch. 1986. North American range plants, 3rd
Edition. University of Nebraska Press, Lincoln, NE.
Sulc, R.M., J.S. McCormick, L.H. Rhodes, D.J. Barker, and K.A. Diedrick. 2006.
Ohio Forage Performance Trials. Horticulture and Crop Science Series 195. The
Ohio State University, Columbus, OH.
Taiz, L., and E. Zeiger. 2002. Plant physiology, 3rd
Edition. Sinauer Associates, Inc.
Sunderland, MA.
Thorne, M.E., B.A. Zamora, and A.C. Kennedy. 1998. Sewage sludge and
mycorrhizal effects on Secar bluebunch wheatgrass in mine spoil. J Environ Qual
27:1228-1233.
Tilman, D. 1993. Species richness of experimental productivity gradients: how
important is colonization limitation? Ecology 74:2179-2191.
Tilman, D and J.A. Downing. 1994. Biodiversity and stability in grasslands. Nature
367:363-365.
Page 176
158
Tilman, D. and D. Wedin. 1991. Plant traits and resource reduction for five grasses
growing on a nitrogen gradient. Ecology 72:685-700.
Tilman, D., J. Hill, and C. Lehman. 2006. Carbon-negative biofuels from low-input
high diversity grassland biomes. Science 314:1598-1600.
Tilman, D., P.B. Reich, and J.M.H Knops. 2006. Biodiversity and ecosystem stability
in a decade-long grassland experiment. Nature 44:629-632
Transeau, E.N. 1935. The prairie peninsula. Ecology 3:423-437.
Unger, P.W. and T.C. Kaspar. 1994. Soil compaction and root growth: a review.
Agron J 86:759-766.
USDA, NRCS. 2009. The PLANTS Database (http://plants.usda.gov, 22 April 2009).
National Plant Data Center, United States Department of Agriculture, Natural
Resource Conservation Service. Baton Rouge, LA.
Vogel, K.P. 1987. Seeding rates for establishing big bluestem and switchgrass with
preemergence atrazine applications. Agron J 79:509-512.
Waaland, M.E., and E.B. Allen. 1987. Relationship between VA mycorrhizal fungi
and plant cover following surface mining in Wyoming. J Range Manage 40:271-
276.
Wan, C., R.E. Sosebee, and B.L. McMichael. 1983. Soil water extraction and
photosynthesis in Gutierrezia sarothrae and Sporobolus cryptandrus. J Range
Mange 46:425-430.
Wang, K., and Y. Jiang. 2007. Waterlogging tolerance of Kentucky bluegrass
cultivars. HortSci 42:386-390.
Page 177
159
Weaver, J.E. 1931. Who‘s who among the prairie grasses. Ecology 12:623-632.
Whalley, W.R., Dumitru, E., Dexter, A.R., 1995. Biological effects of soil
compaction. Soil Till Res 35:53–68.
Williams, S.M., and R.R. Weil. 2004. Crop cover root channels may alleviate soil
compaction effects on soybean crop. Soil Sci Soc Am J 68:1403-1409.
Wu, L., N. He, Y. Wang, and X. Han. 2008. Storage dynamics of carbon and nitrogen
in soil after grazing exclusion in Leymus chinensis grasslands of northern China. J
Eviron Qual. 37:663-668.
Wuenscher, M.L., and G.C. Gerloff. 1977. Growth of Andropogon scoparius (little
bluestem) in phosphorus deficient soils. New Phytol 70:1035-1042.
Zar, J.H. 1999. Biostatistical analysis, 4th
edition. Prentice-Hall, Inc. Upper Saddle
River, NJ.
Zeleznik, J.D., and J.G. Skousen. 1996, Survival of three tree species on old reclaimed
surface mines in Ohio. J Environ Qual 25:1429-1435.
Zhu, Y.-G., A.S. Laidlaw, P. Christie, and M.E.R. Hammond. 2000. The specificity of
arbuscular mycorrhizal fungi in perennial ryegrass-white clover pasture. Agr
Ecosyst Environ 77:211-218.
Page 178
160
Appendix A: Photographs of Reclaimed Surface Mined Land in Southeast Ohio.
Page 179
161
Figure 6. Muskingum Mine near Cumberland, OH. Compacted reclaimed land in
foreground persists in non-native forage complex while non-compacted reclaimed
land in background supports forest vegetation. Photo taken early spring, 2004.
Page 180
162
Figure 7. Contoured compacted mine soil with non-native forage complex and runoff
collecting in low-lying swales. Photo taken early spring, 2004.
Page 181
163
Figure 8. Eastern deciduous forests in southeast Ohio near Cumberland, OH. Photo
taken Autumn, 2005.
Page 182
164
Figure 9. Second-year growth of grasses in field plots on reclaimed mine soil at the
Wilds. Plot with dense cover in foreground is tall dropseed, while lighter green
grass with wider leaves in middle of plot area is eastern gamagrass. Non-native
forage vegetation persists around the plot area. Photo taken June 5, 2006.
Page 183
165
Appendix B: Cover Measurements of Existing Mine Soil Vegetation Re-establishing
in Prairie Grass Plots at the Conclusion of the Research.
Page 184
166
Table 23. Canopy cover estimates of tall fescue (FEAR), Kentucky bluegrass
(POPR), and bird‘s-foot trefoil (LOCO) three years after the 2005 plantings
and two years following the 2006 planting, following re-establishment in native
grass plots.
Species FEAR POPR LOCO TOTAL
---------------(percent canopy cover)
1---------------
----2005 planting, measurements taken 3 years after planting; no fallow year----
Eastern gamagrass 0 a 8 c 0 c 8 b
Tall dropseed 0 a 11 bc 0 c 11 b
Big bluestem 0 a 79 a 0 c 79 a
Indiangrass 1 a 79 a 1 bc 81 a
Little bluestem 19 a 31 c 4 b 54 a
Sideoats grama 4 a 65 ab 18 a 86 a
Blue grama 4 a 40 bc 18 a 61 a
Buffalograss 9 a 64 ab 0 c 74 a
Virginia wildrye 9 a 62 ab 0 c 71 a
Slender wheatgrass 9 a 68 ab 1 bc 78 a
Continued
Page 185
167
Table 23. Continued.
Species FEAR POPR LOCO TOTAL
---------------(percent canopy cover)---------------
-2006 planting, measurements taken 2 years after planting and one year of fallow-
Eastern gamagrass 0 a 0 c 0 d 0 d
Tall dropseed 0 a 1 bc 9 bc 9 cd
Big bluestem 0 a 10 ab 35 abc 45 ab
Indiangrass 9 a 0 c 15 abc 24 bc
Little bluestem 4 a 5 a 29 abc 38 ab
Sideoats grama 1 a 1 bc 29 abc 30 bc
Blue grama 1 a 0 c 44 ab 44 ab
Buffalograss 0 a 0 c 4 cd 4 d
Virginia wildrye 0 a 0 c 63 a 63 a
Slender wheatgrass 0 a 0 c 13 cd 13 cd
1 Numbers with the same letter in each column, for each, planting date, are not
statistically different (α=0.05).