DOEt'KASA/OZI-i-1 MAS. CR- 168071 CREEP-RUPTURE BEHAVlOR OF SIX CANDIDATE STIRLING ENGINE IRON-BASE SUPERALLOYS IN HIGH PRESSURE HYDROGEN VOLUME S - AiR CREEP-RUPTURE BEHAVIOR S. Bhattacbvtya :IT RESEARCH IhSTiTU iE 19 West 35th Street Chicago, Illinois M646 DECEMBER 1982 Preoared for NATIONAL AERONALT!CS ANC SPACE ADMINISTRATION Lewis Research Center Under Contract DEN 3-217 for U.S. DEPARTMENT OF ENERGY Office of Transportation Programs
Transcript
DOEt'KASA/OZI-i-1 M A S . CR- 168071
CREEP-RUPTURE BEHAVlOR OF SIX CANDIDATE STIRLING ENGINE IRON-BASE SUPERALLOYS IN HIGH PRESSURE HYDROGEN
VOLUME S - AiR CREEP-RUPTURE BEHAVIOR
S. Bhattacbvtya :IT RESEARCH IhSTiTU i E 19 West 35th Street Chicago, Illinois M646
DECEMBER 1982
Preoared for
NATIONAL AERONALT!CS ANC SPACE ADMINISTRATION Lewis Research Center Under Contract DEN 3-217
for
U.S. DEPARTMENT OF ENERGY Office of Transportation Programs
00E/NASA/0217- 1 NASA C R - I ~ ~ O ~ I
CREEP- RUPWf!E BEWVIOR OF SIX CANDIDATE S-TIRLIHG ENGINE IRON-3ME SUPERALLOYS 13 HIGii PRESSURE HYDROGEN
YOLURE ; - A I R CREEP-RUF-PJRE GEHAYIS
S. Bhattacharyya I I T Research Ins t i tu te 10 W. 35 Street Chjcago, I 1 1 fno!s 60616
Pre?ared for Hat!xal kronautf cs and Space Main? stratfocr Lewf s Research Center Under Corrtract DEN 3-217
f cr U.S. Department o f Energy Offlce o f Traaspoi-tation Programs he.- Interapncy Agreement DE-A-101-77CS31040
The creep-rupture behavior o f s i x c a ~ d i d a t e St i r l !ng engfne iron-base superalloys was determined i n a i r . The t e s t a l l oys included four wrought a l l oys (A-286, I N 80W, N-155, and 19-90L) and tw cast a l l oys (CRN-60 and XF- 818). The wrought a l l oys were used i n the form of sheets of 0.89 mn (0.035 in.) average thickness. The cast a l l o y specimens were investment cast and machined t o 6.35 mn (0.250 in.) gage diameter. The creep-rupture specimen: were tested t o rupture i n a i r a t d i f f e ren t times up t o 3000 h over the temperature range of 650° t o 925°C (1200" t o 1700°F).
The baslc data, namely, rupture l i f e (t ), minimum creep ra te ( C ), and t!me t o 1% creep r t r a t n (to 01), were s t a t i s ~ i c r l l y analyzed as a f u n k f m o f s t ress a t df f ferent temperaf ures. A1 so, tmperature-compensated anaiysis was performed t o obtafn the act fvat fon energies f o r rupture l i f e , time t o 1% creep s t ra ln , and the minimum creep rate. !4 icrostructura l and f racture analyses were a lso p e r f o m d . Based on s t a t i s t i c a l analyses, estimates were made f o r s t ress l eve ls a t d i f f e ren t teaperatures t o obta!n 3500 h t, and t l ives. A l l the above a i r data an6 analyses rill be compared w!th i i n i l a r O & a k i n g obtatned for these a l l oys under 15 Wa (2175 ps!) hydrogeq, t o he reported 1 ater.
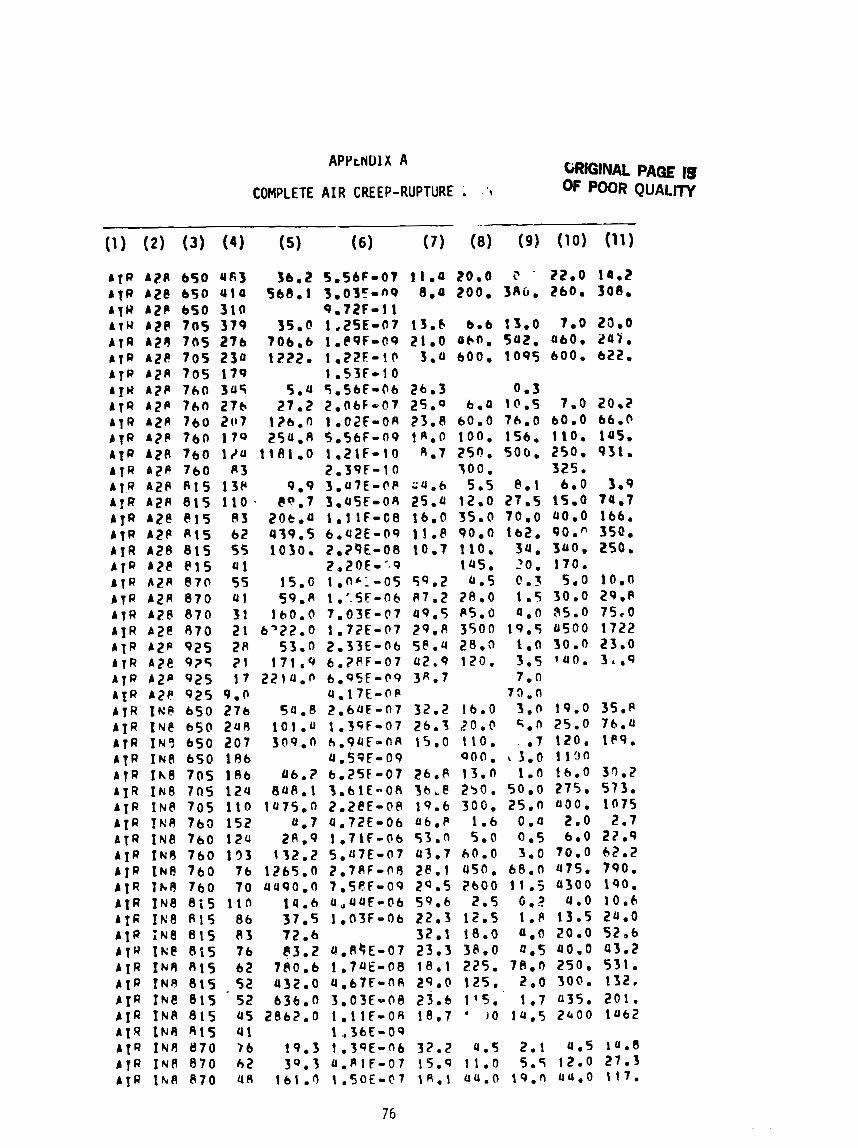
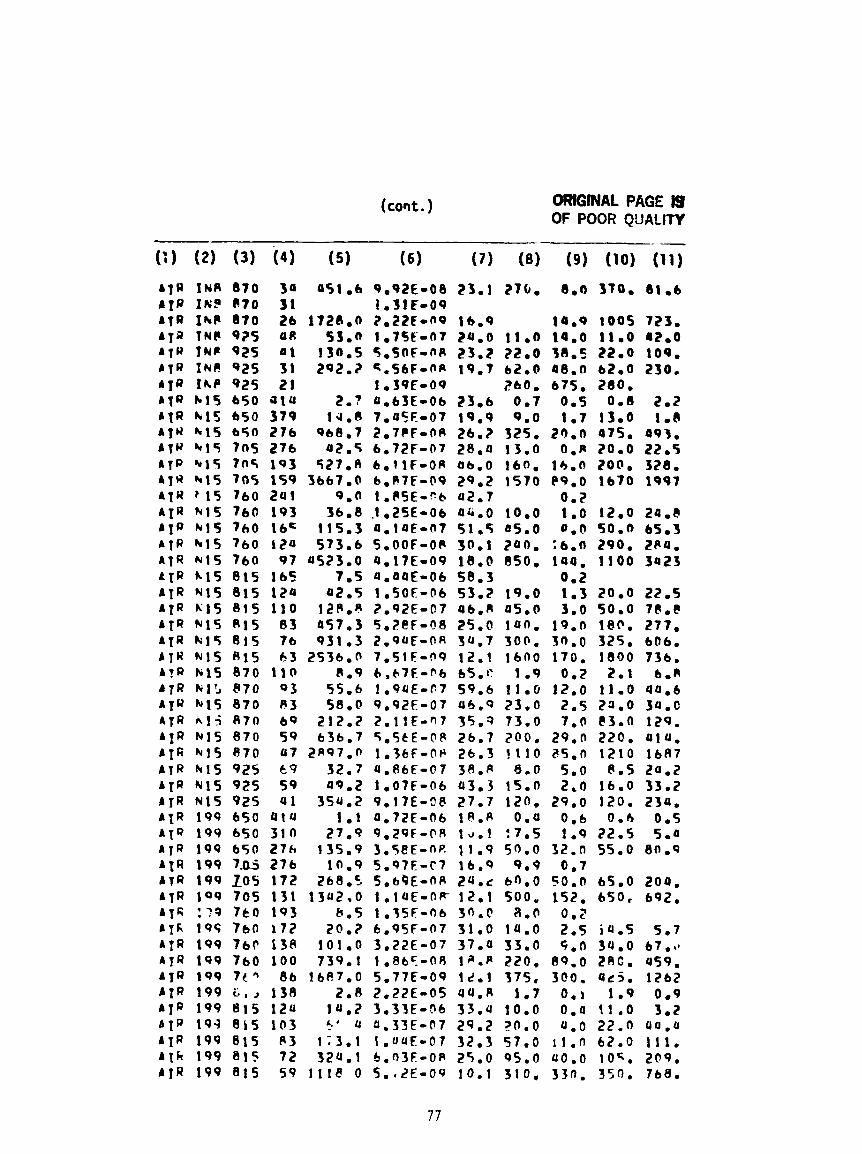
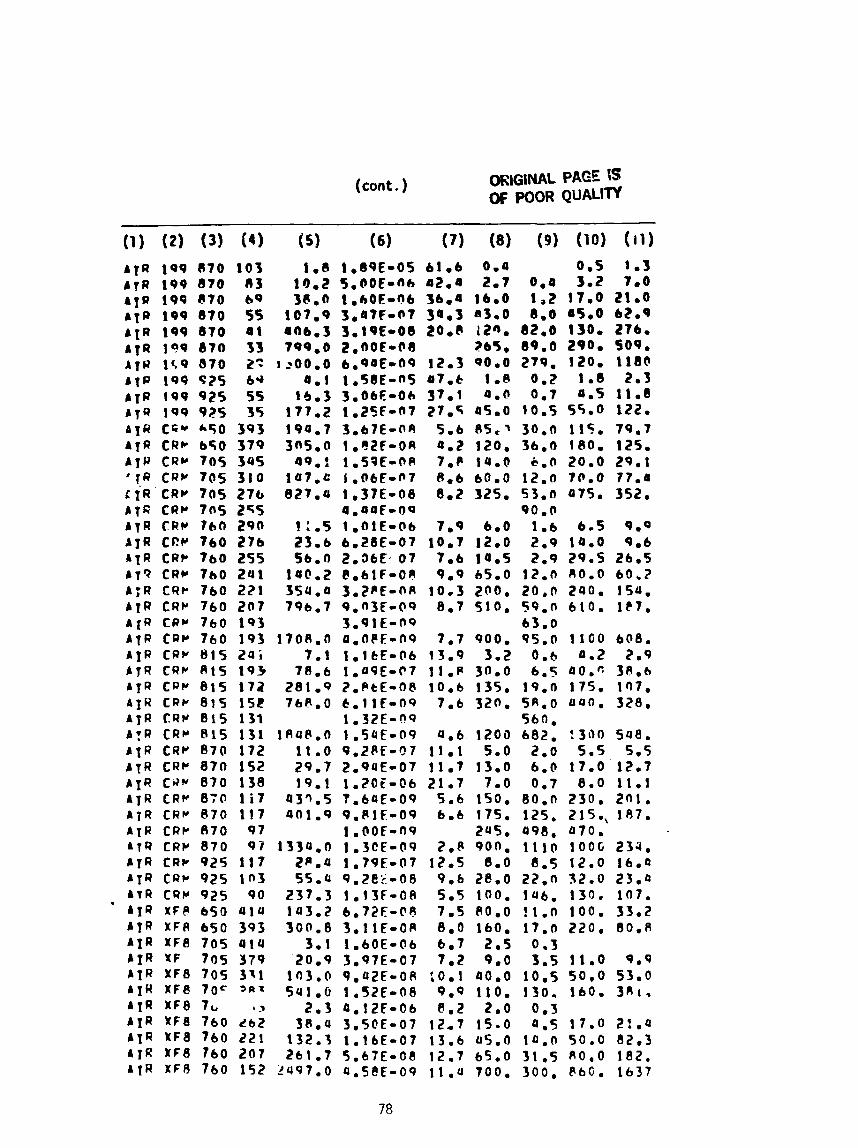
. . . . . . . . . . . . . APPENDIX A: Complete A i r Creep-Rupture Data 75
APPENDIX R : Correlatfona! Analysls of Rupture L i fe . Time t o 1% Creep St ra in . and Hinlmum Creep Rate as a Function of I n f t i a l Stress f o r S i x Iron-Base Superalloys Tested I n A i r a t 650°t092S*C. . . . . . . . . . . . . . . . . . . . . . 81
AYPEYOIX C: Temperdture-Compensated Analysis o f Rupture L i f e . Time t o 1% Creep Strafn. and Minimum Creep Rate as a Function o f In!t!al Stress f o r S f x Iron-Base Superalloys Tested I n A t r a t 650" t o 925.C . . . . . . . . . . . . . . . . . 85
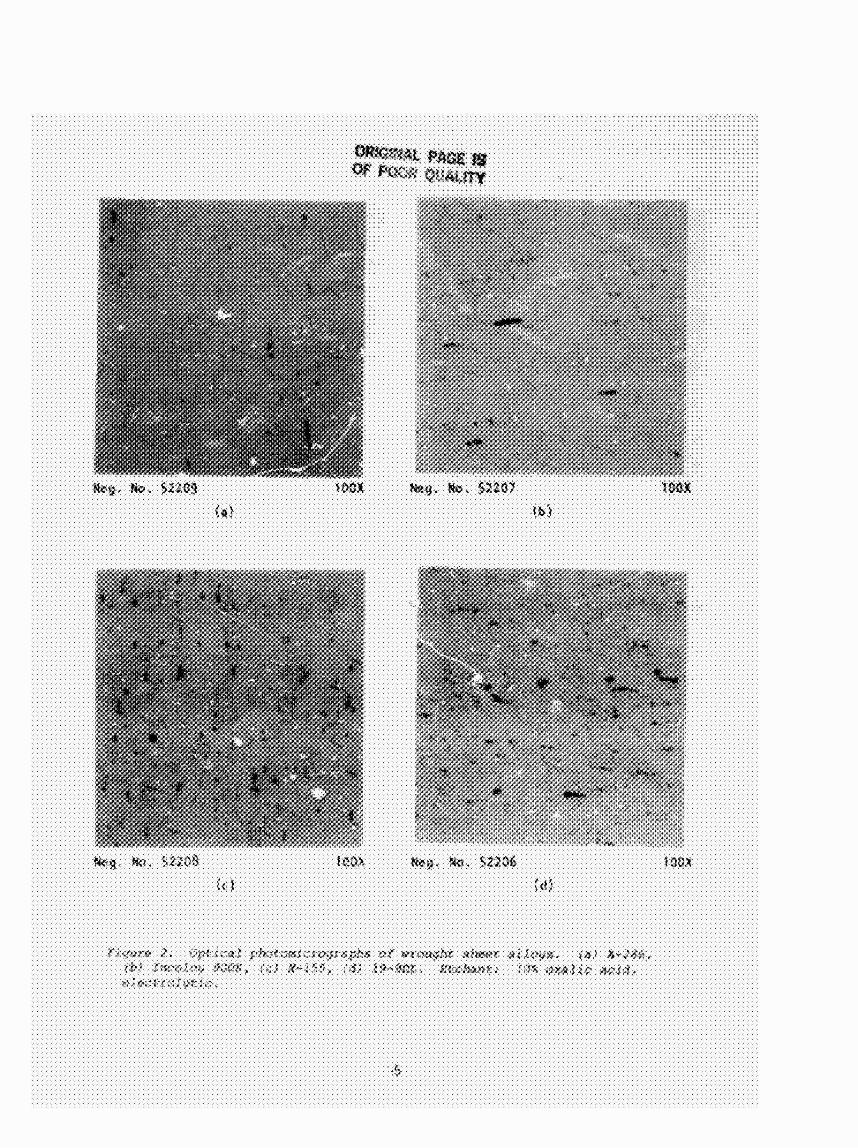
Optical photomicrographs of wrought sheet a l l o y s . . . . . . . . 35
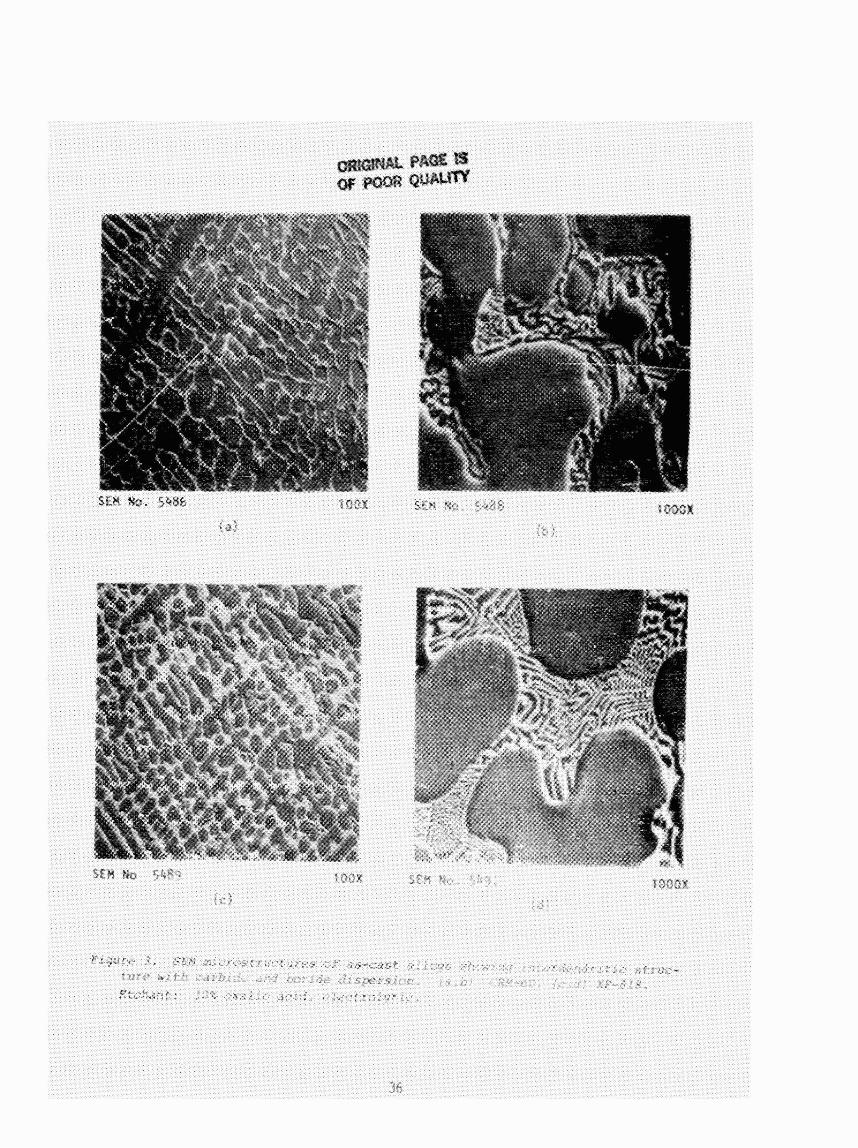
SEM microstructures o f as-cast a l l o y s showfng fn te rdendr i t i c s t ruc ture w i th carbide and boride d i spe rs im . . . . . . . . . . 36
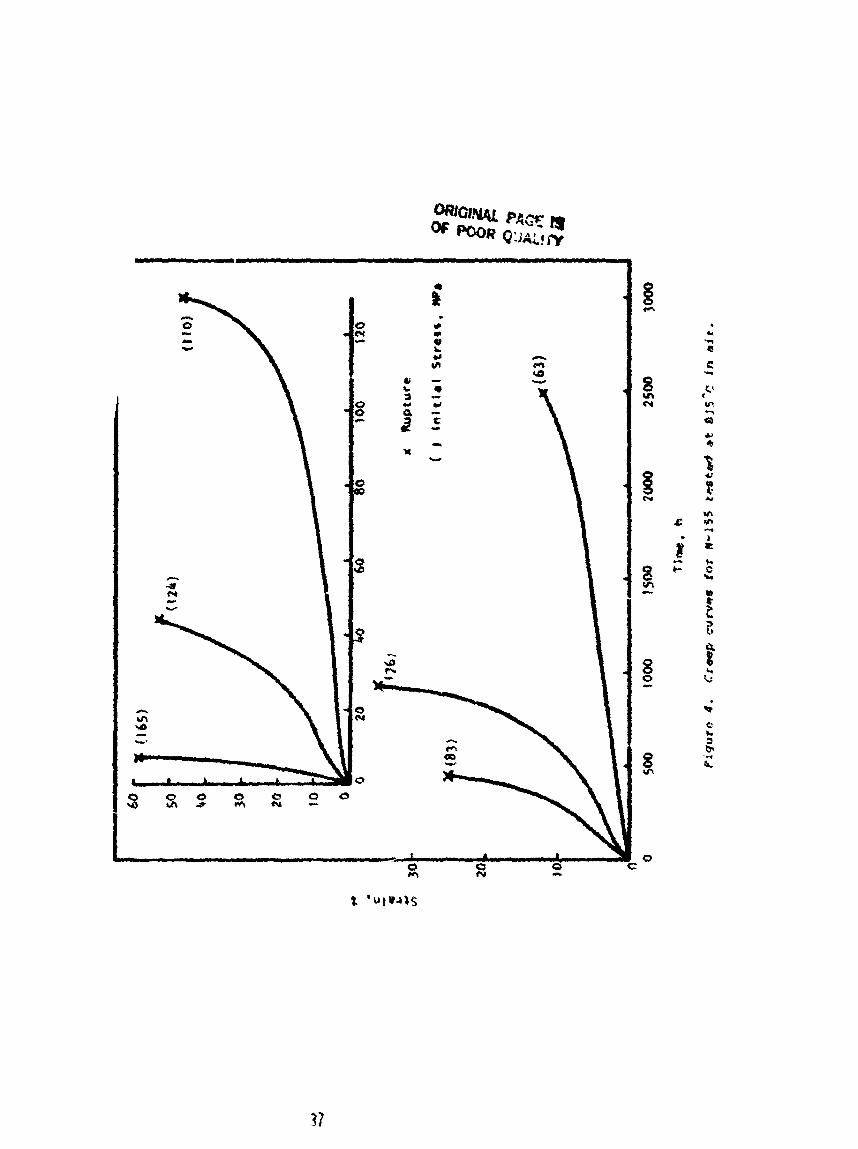
Creep curves f o r N-155 tested a t 8lS0C i n a i r . . . . . . . . . . 37
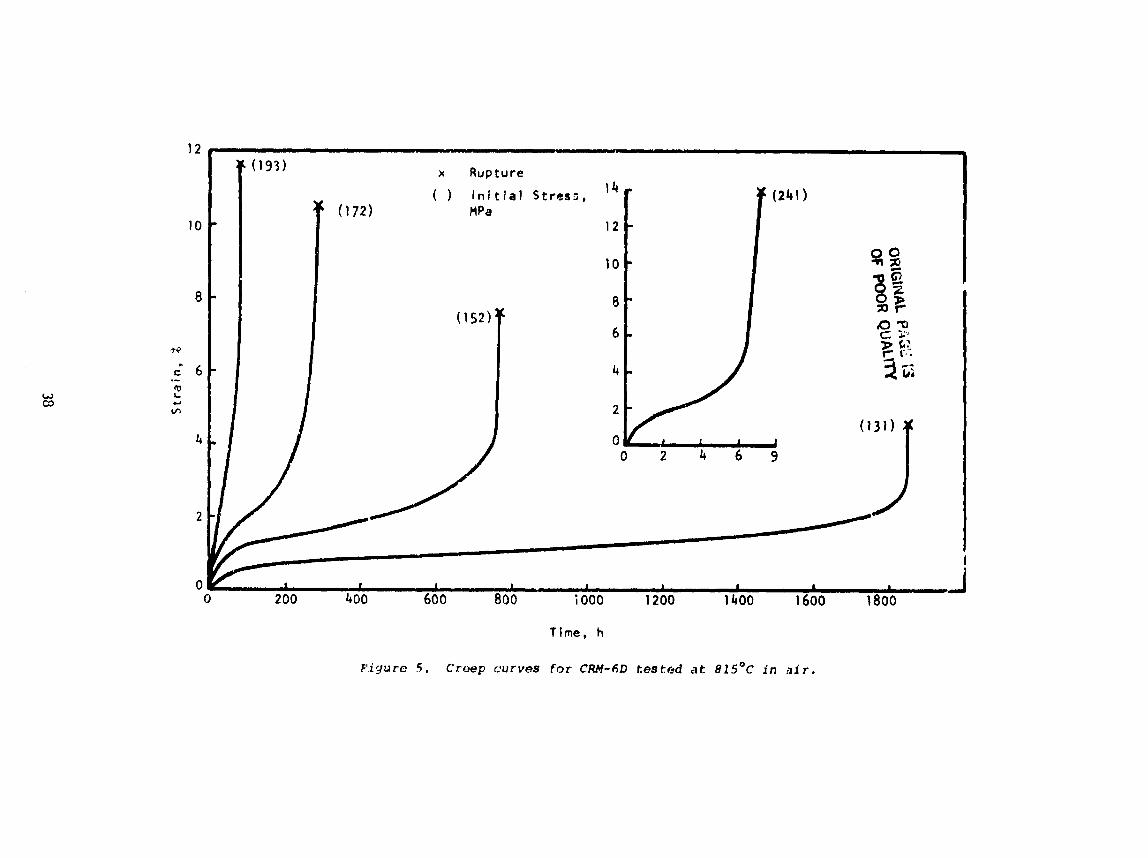
Creep curves f o r CRM-6D tested a t 815OC i n a i r . . . . . . . . . 38
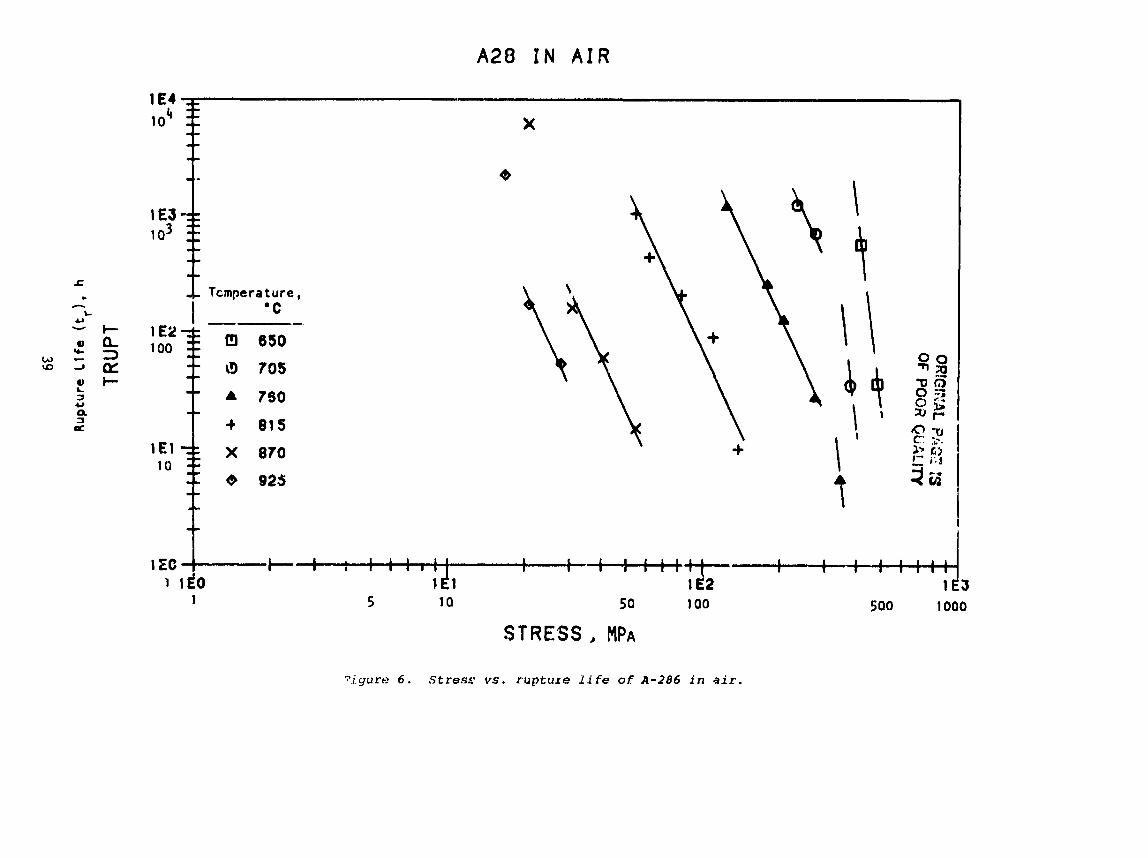
Stress vs . rupture l i f e o f A-286 i n a i r . . . . . . . . . . . . . 39
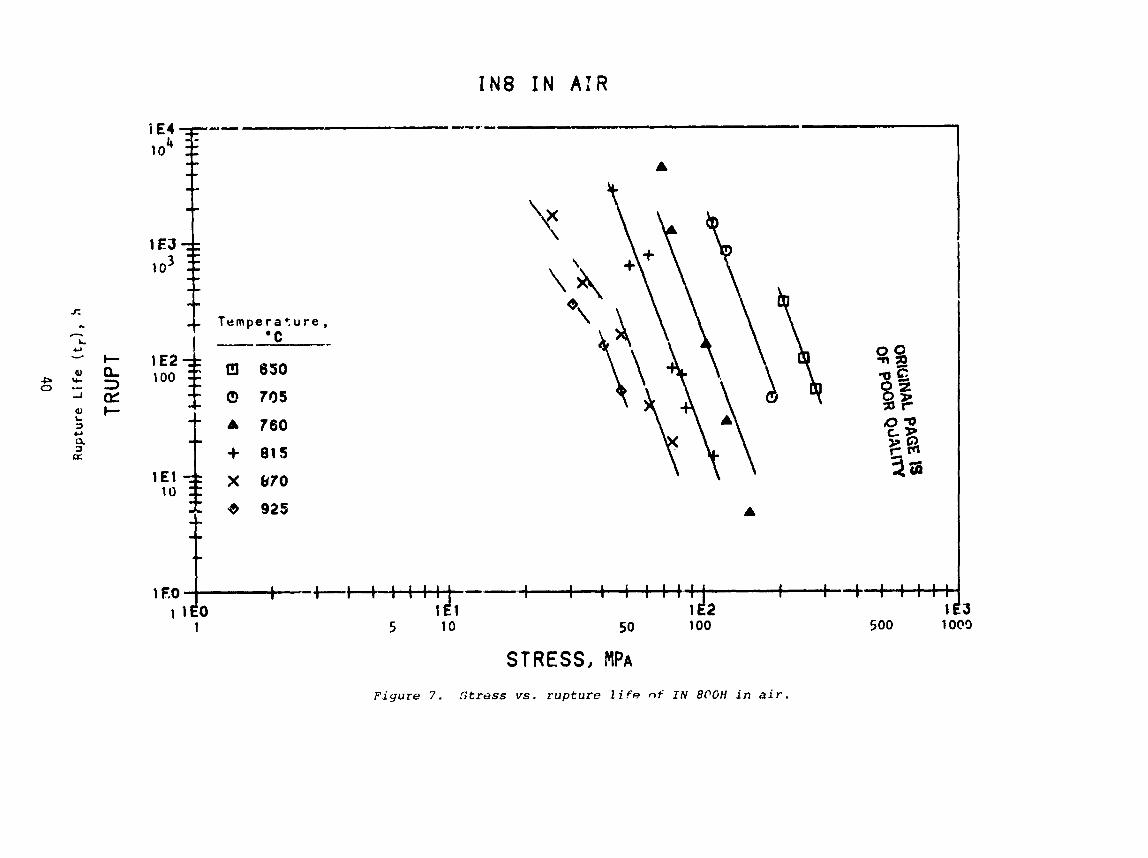
. . . . . . . . . . . . . Stress vs rupture l i f e of IN 800H i n a i r 40
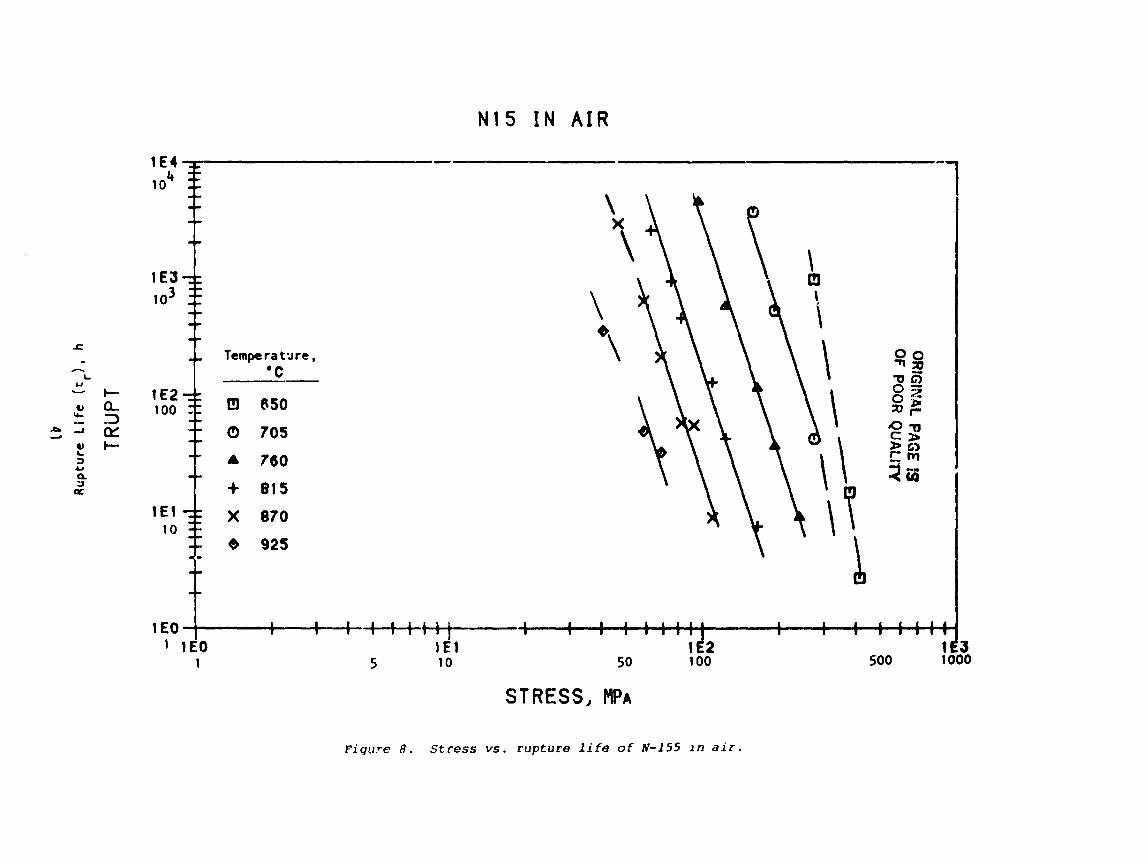
. . . . . . . . . . . . . . Stress vs rupture l i f e o f N-155 i n a i r 41
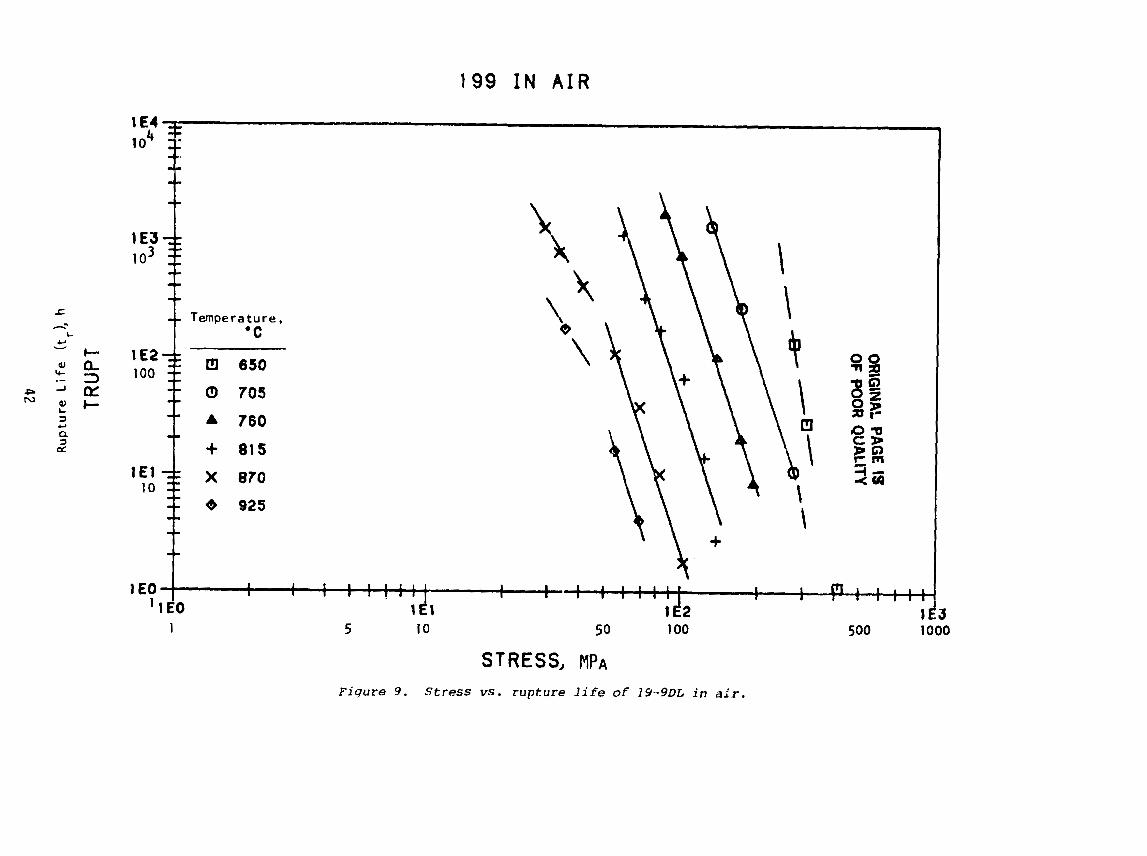
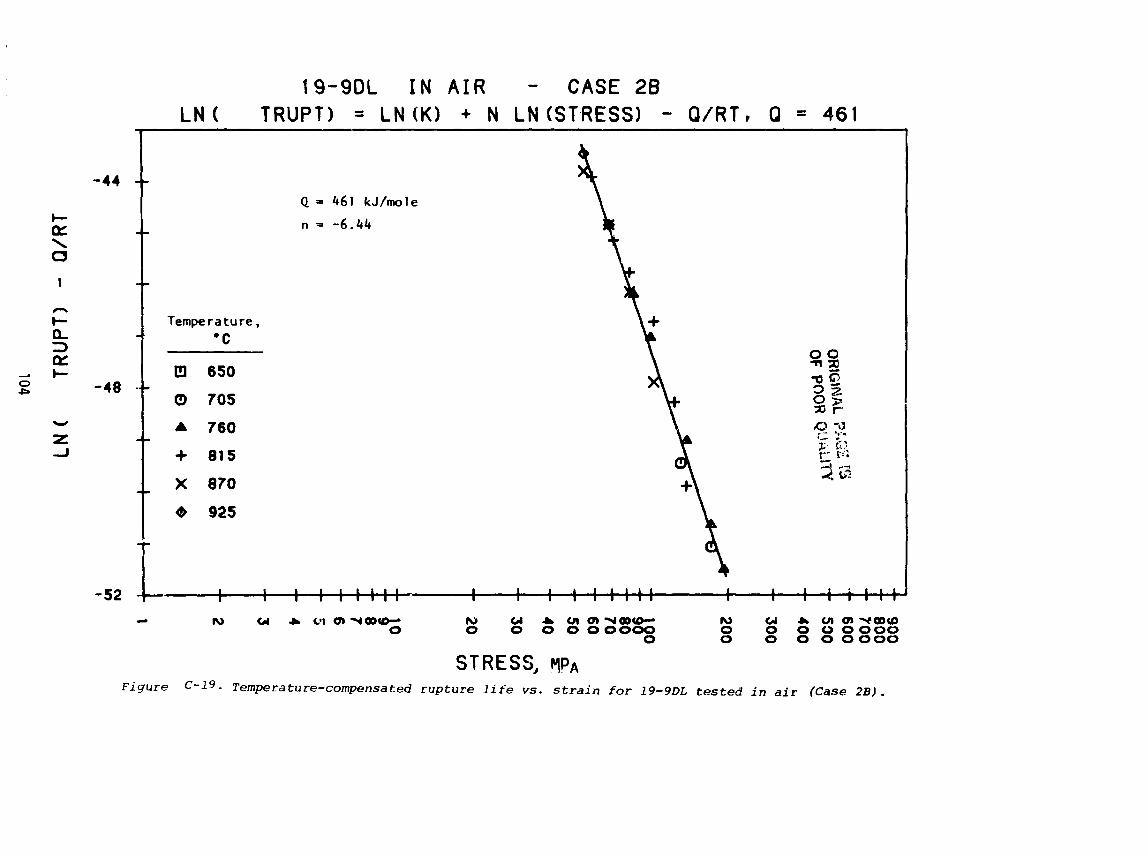
Stress vs . rupture l i f e of 19-9DL i n a i r . . . . . . . . . . . . 42
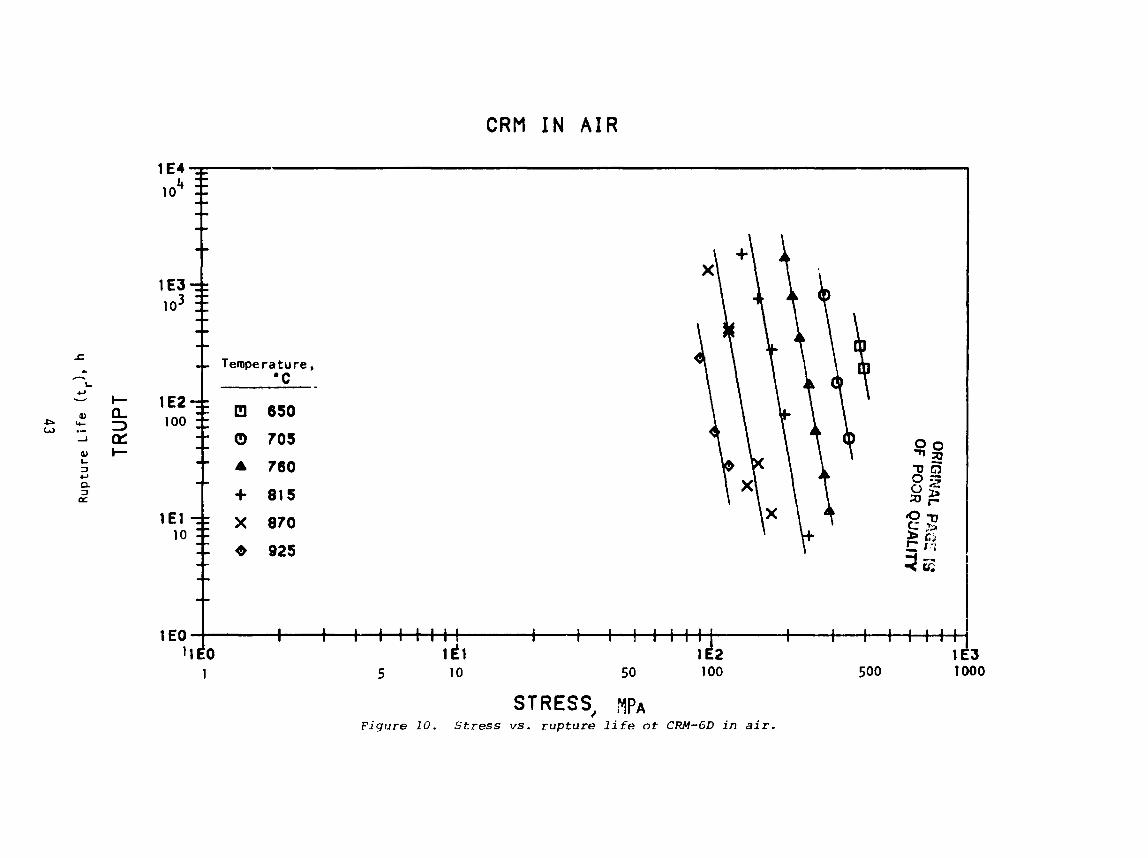
Stress vs . rupture l i f e of CRM-6D i n a i r . . . . . . . . . . . . 43
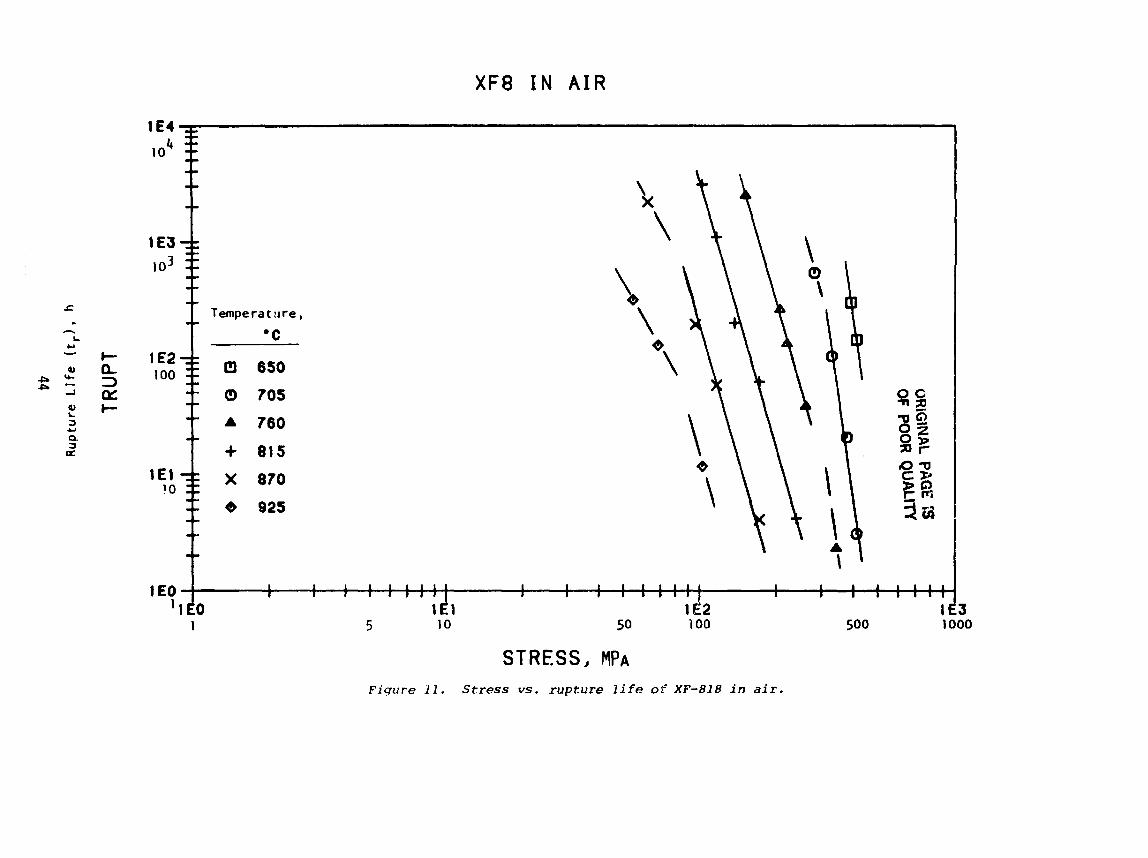
Stress vs . rupture l i f e of XF-818 i n a i r . . . . . . . . . . . . 44
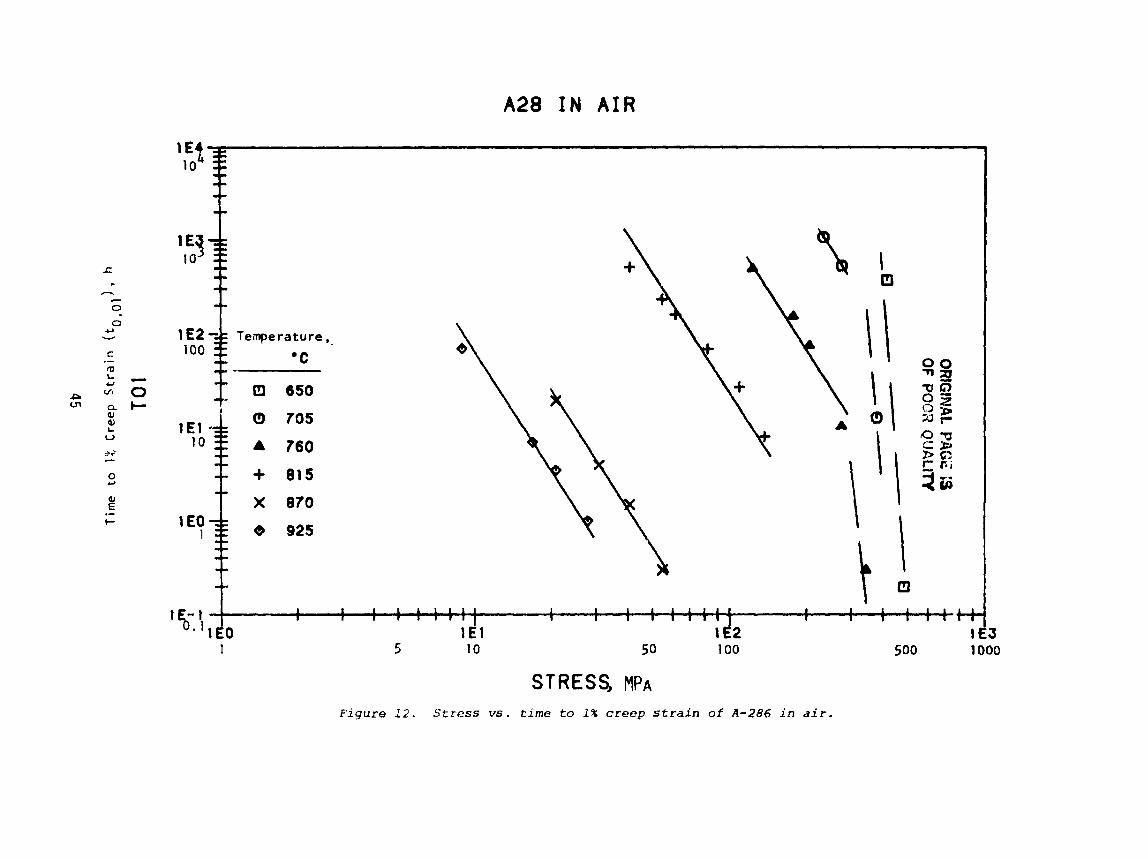
. . . . . . . Stress vs . time t o 1% creep s t r a i n f o r A-286 i n a i r 45
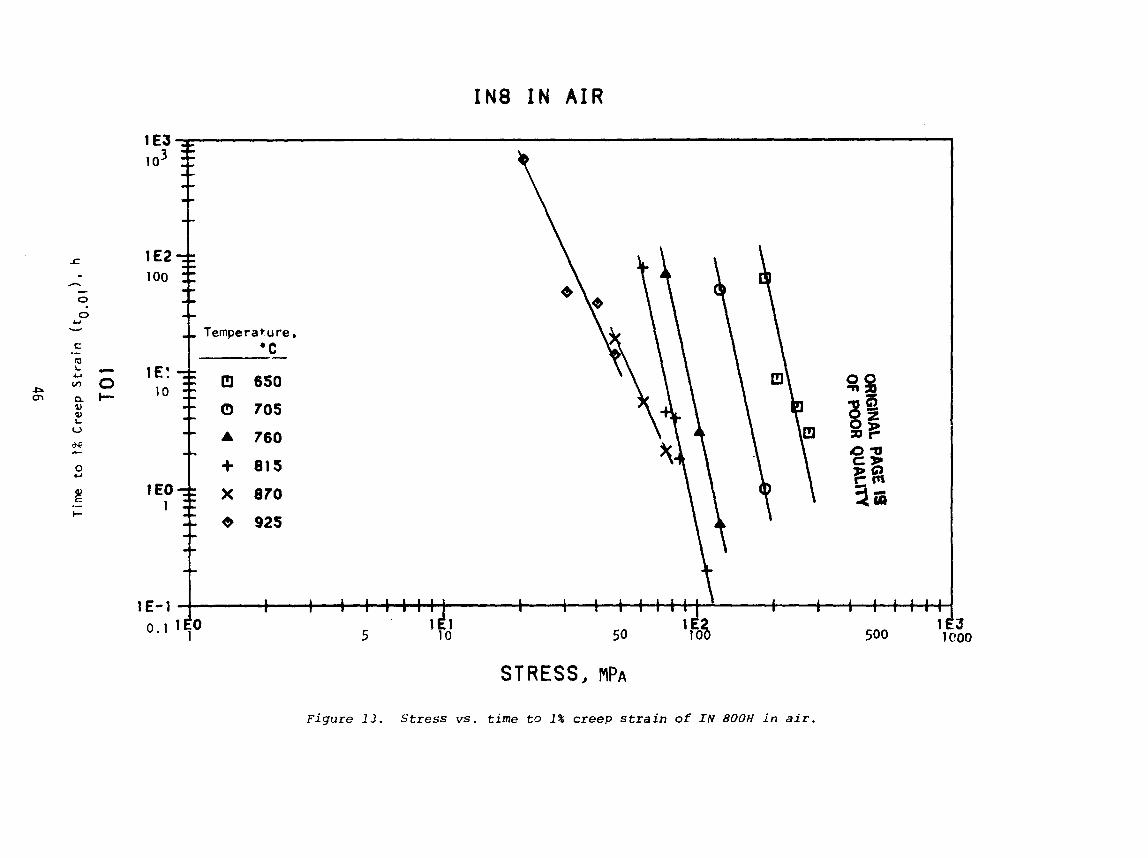
. . . . . . Stress vs . time t o 1% creep s t r a i n f o r I N 800H i n aSr 46
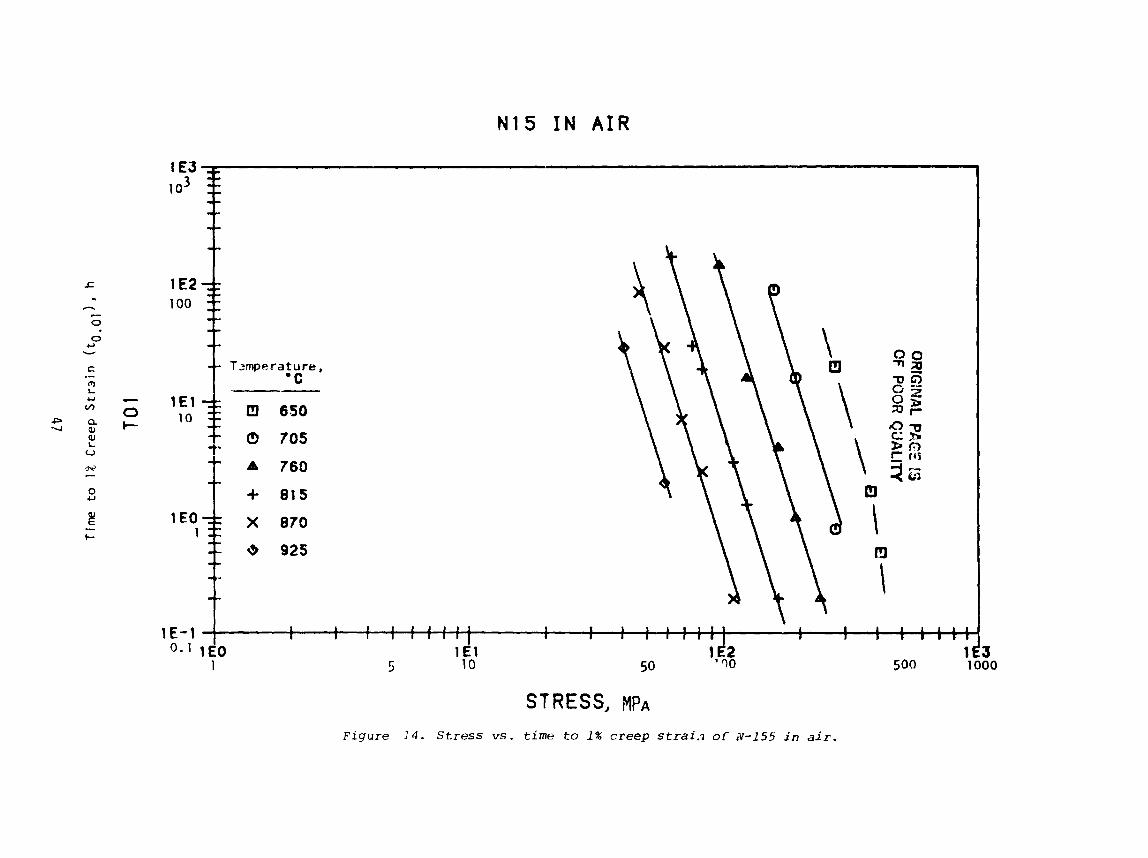
. . . . . . . Stress vs . time t o 1% creep s t r a i n fo r N-155 i n a i r 47
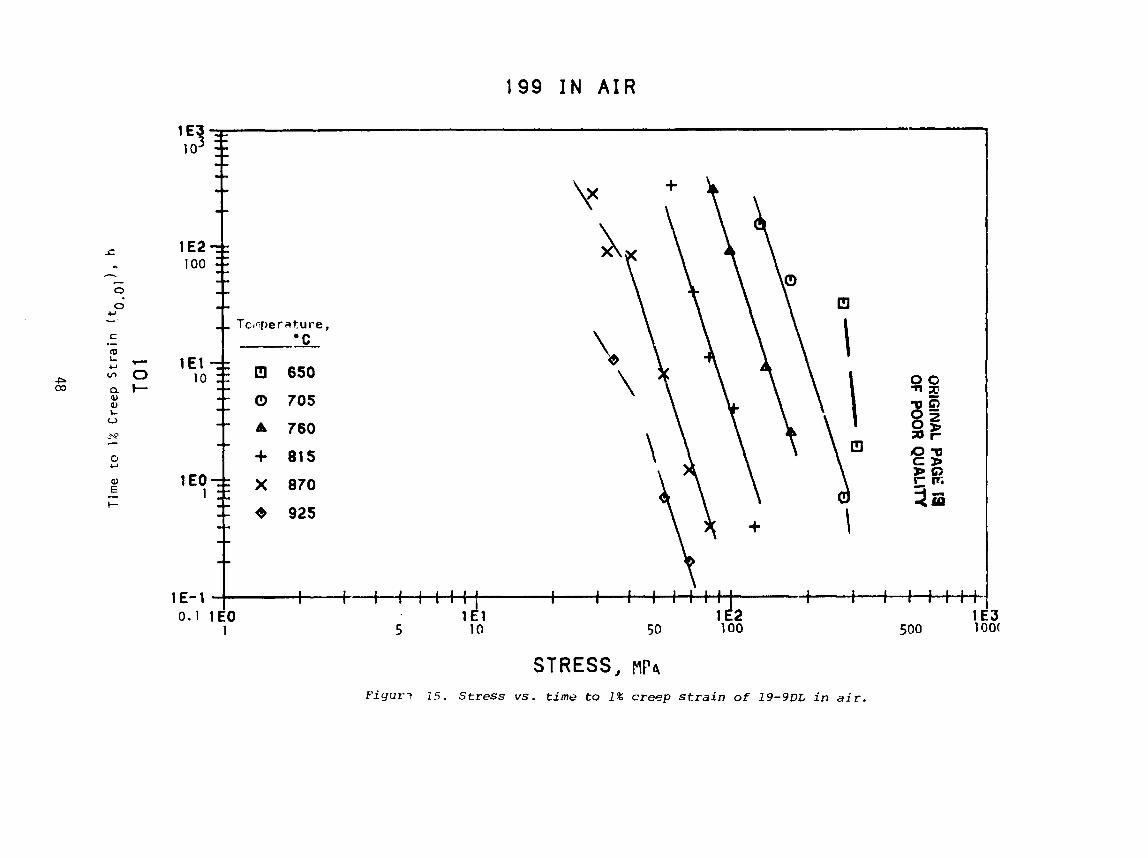
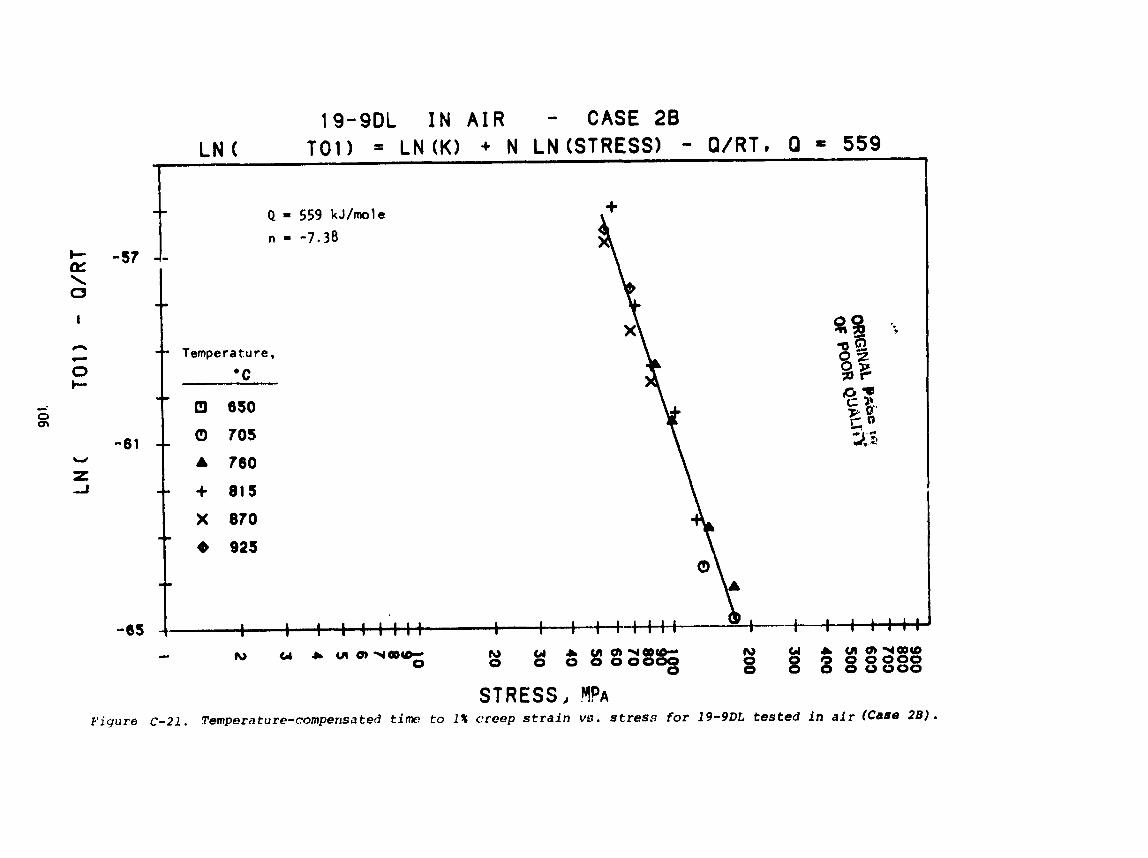
. . . . . . Stress vs . time t o 1% creep s t r a i n fo r 19-9DL i n a i r 48
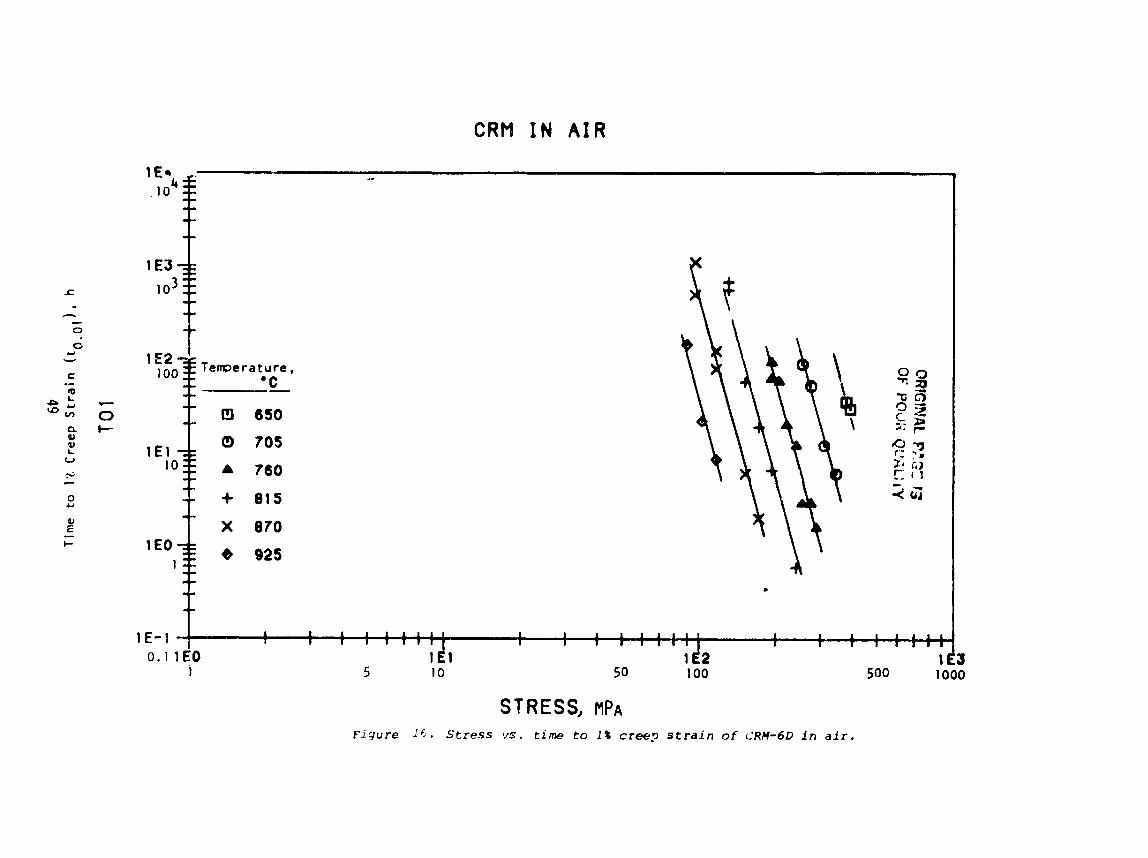
Stress vs . time t o 1% creep s t r a i n f o r CRM-6D i n a i r . . . . . . 49
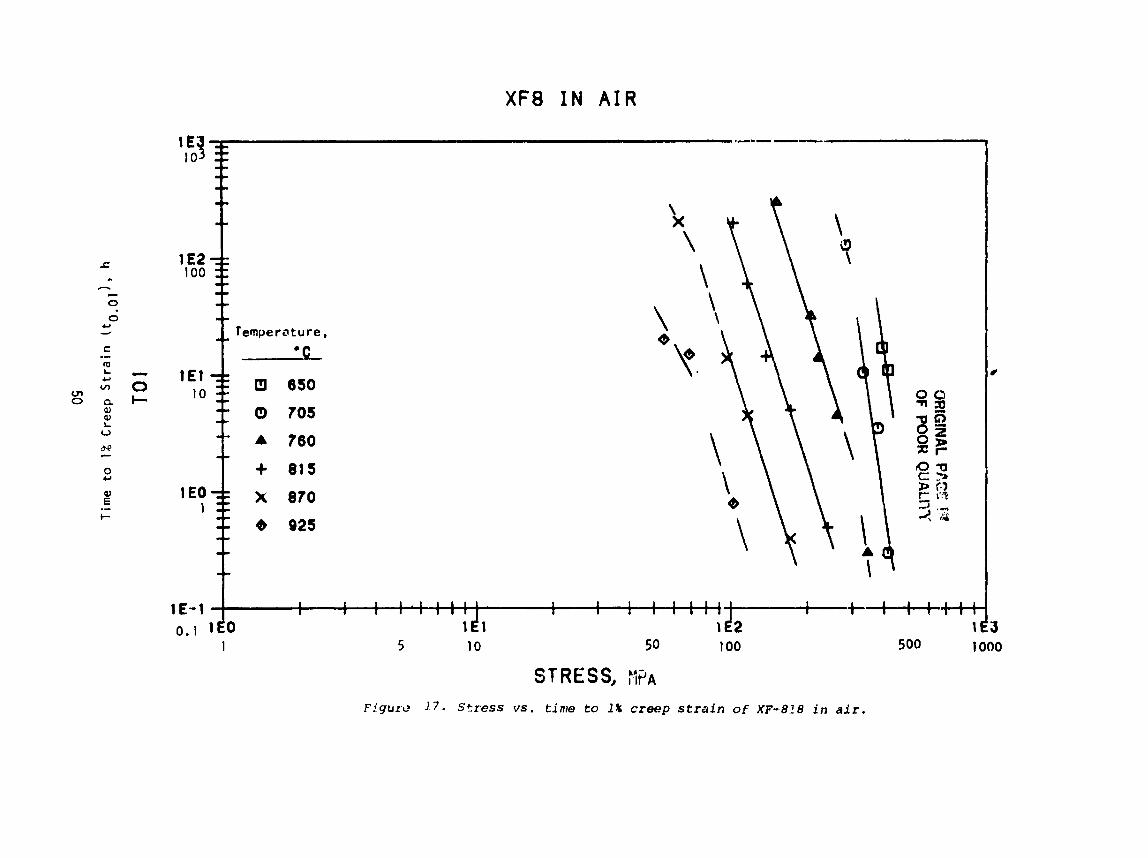
Stress vs . time t o 1% creep s t r a i n f o r XF-818 i n a i r . . . . . . 50
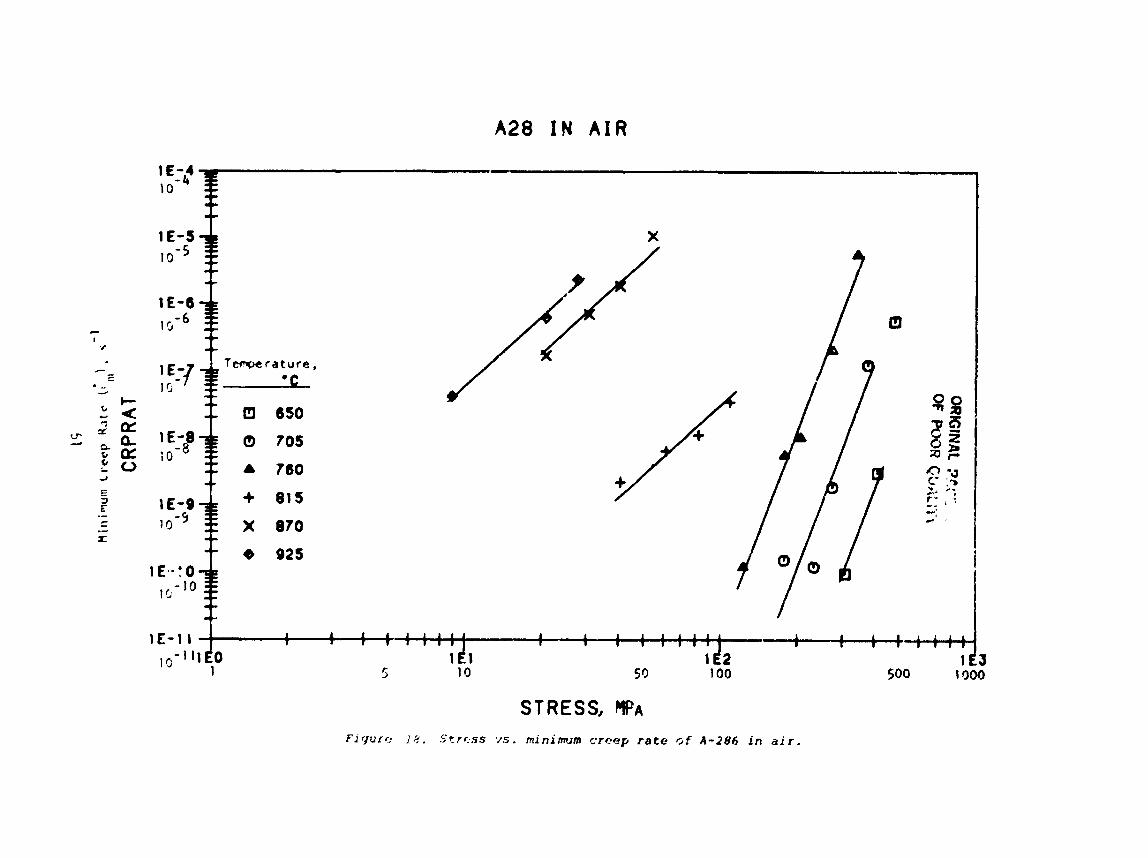
. . . . . . . . . . . Stress vs minimum creep ra te o f A-286 i n a i r 51
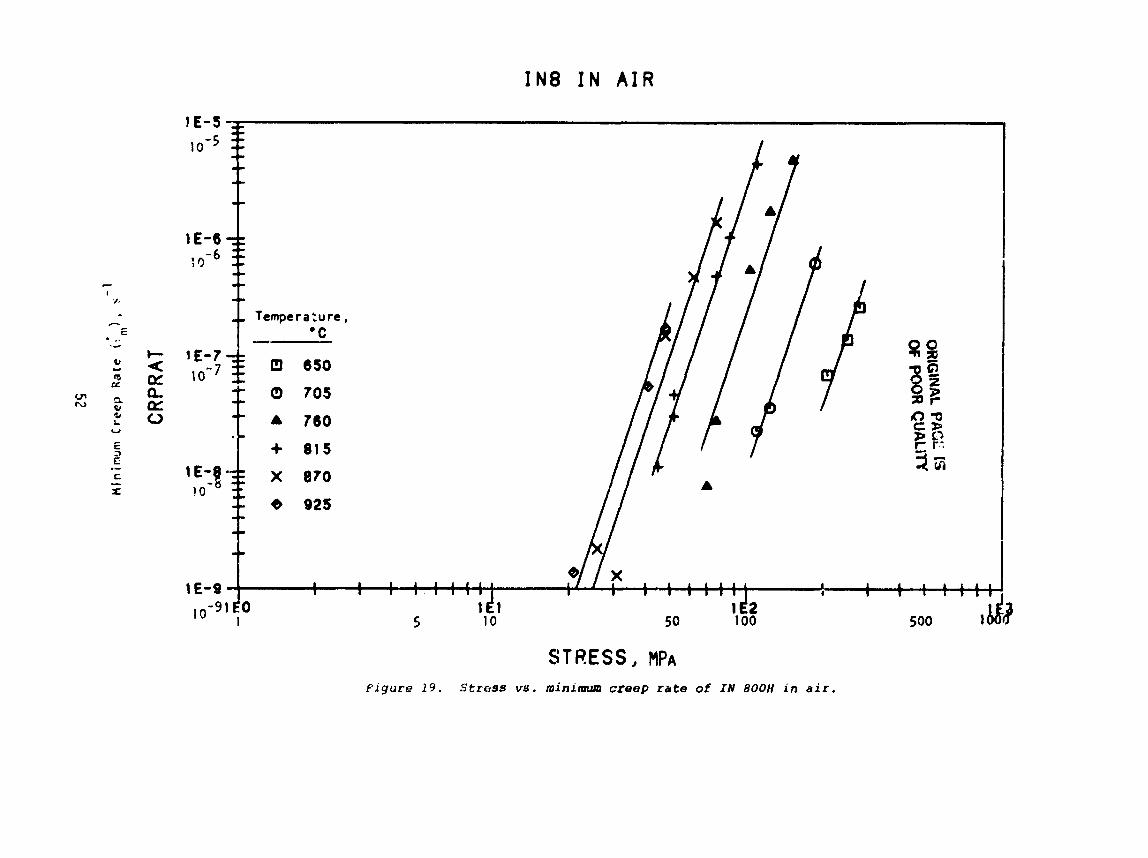
. . . . . . . . . Stress vs . minimum creep ra te o f I N 800H i n a i r 52
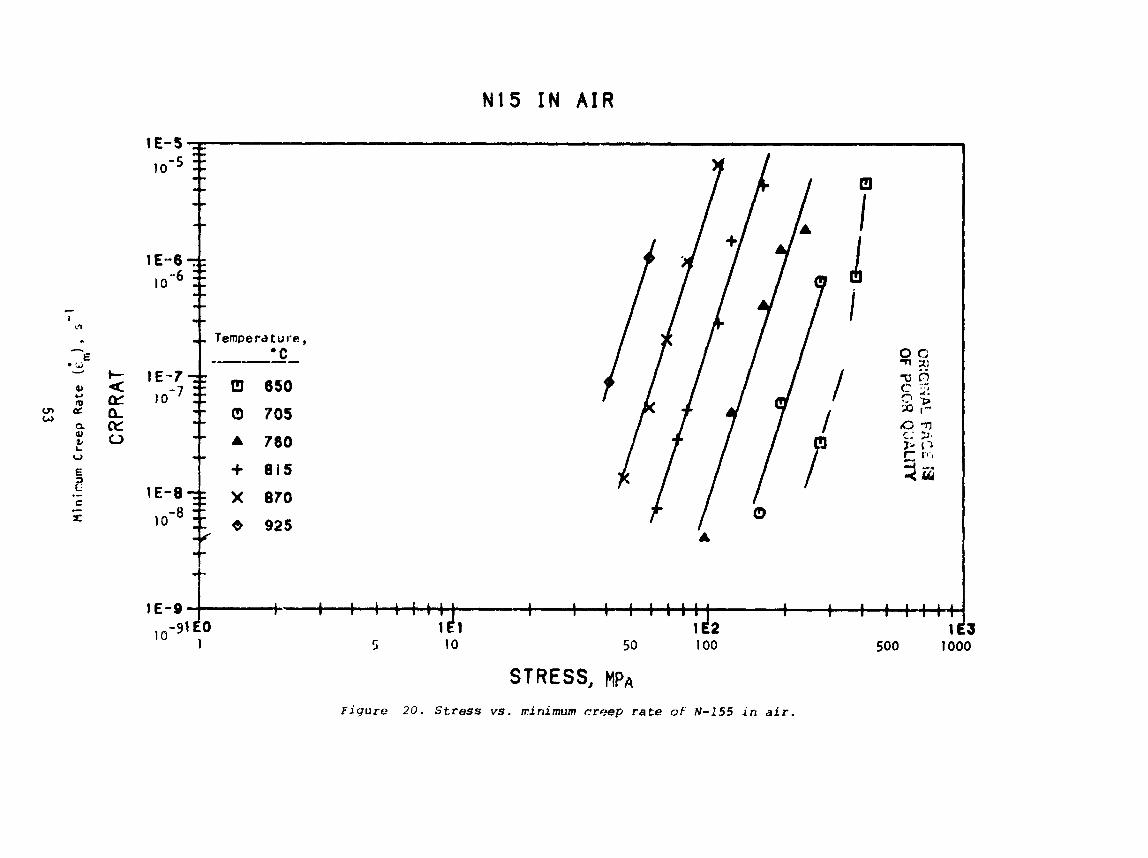
. . . . . . . . . . Stress vs . mintmum creep ra te o f N-155 i n a i r 53
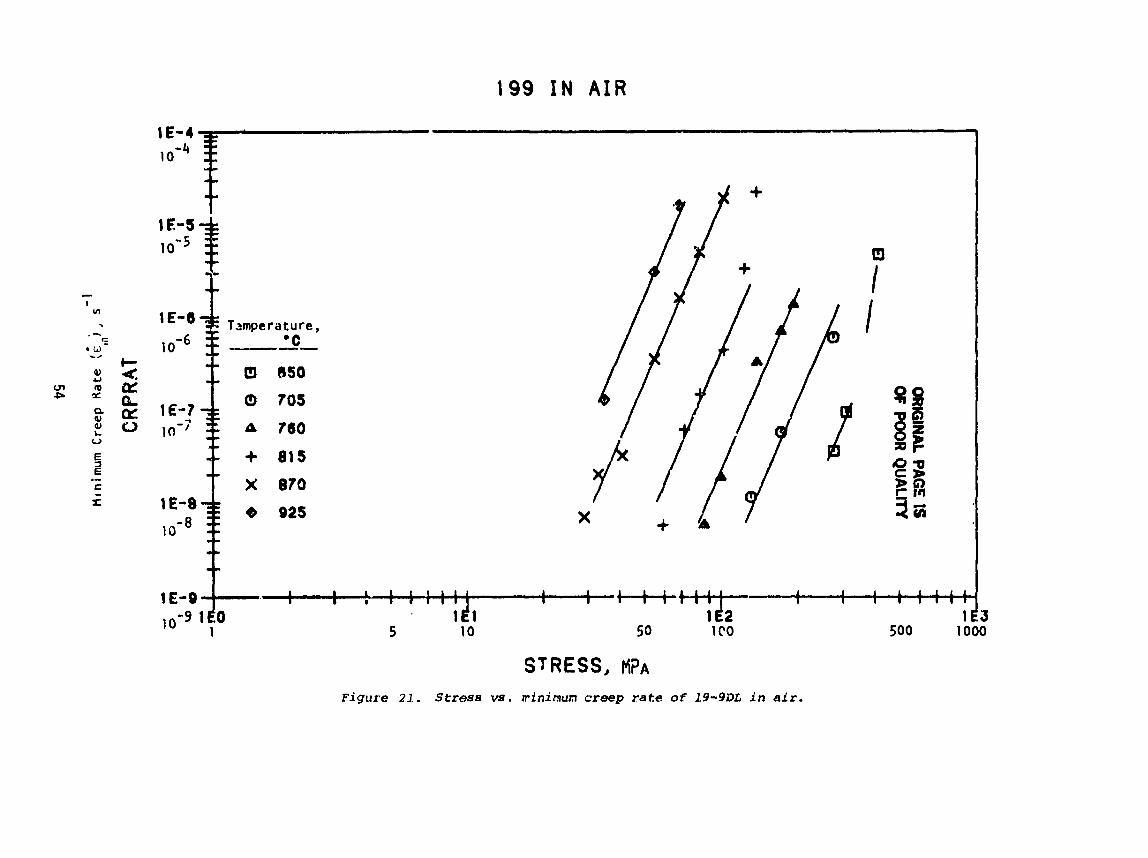
Stress vs . m'nimum creep ra te o f 19-9DL i n a i r . . . . . . . . . 54
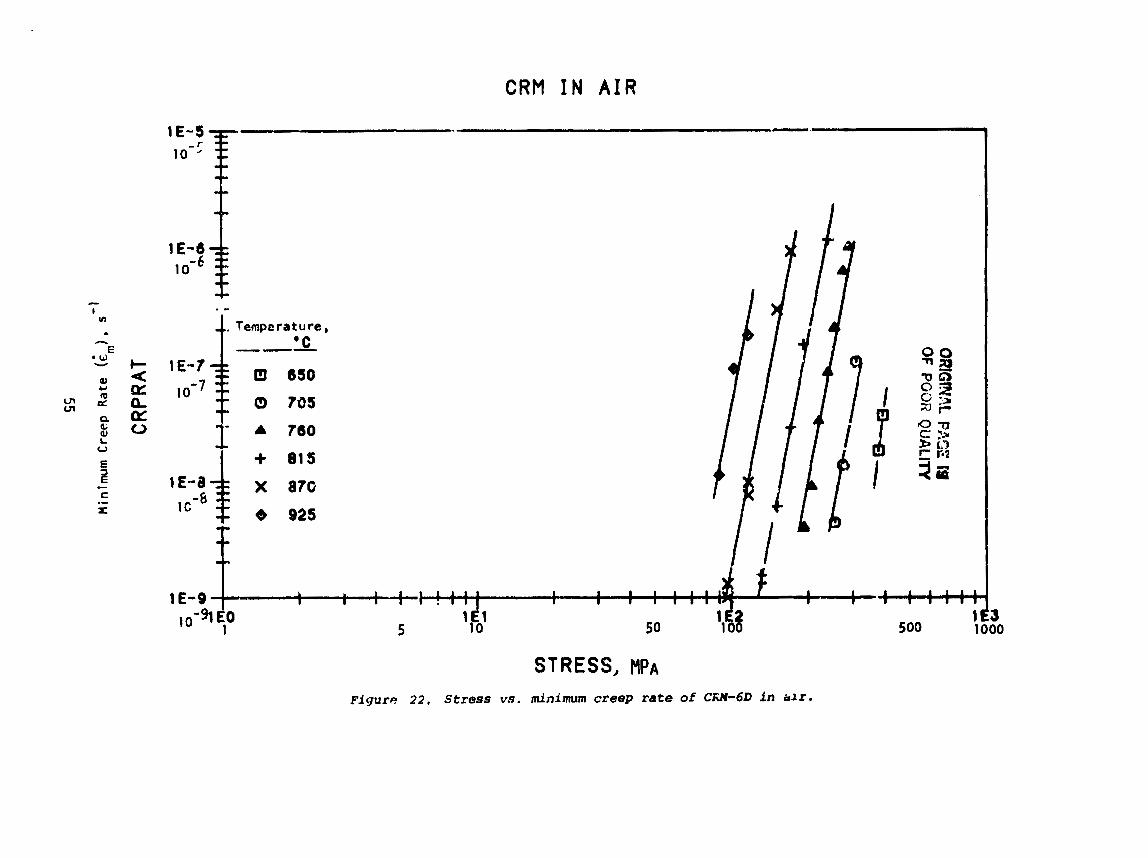
Stress vs . minimum creep ra te o f CRM-6D i n a i r . . . . . . . . . 55
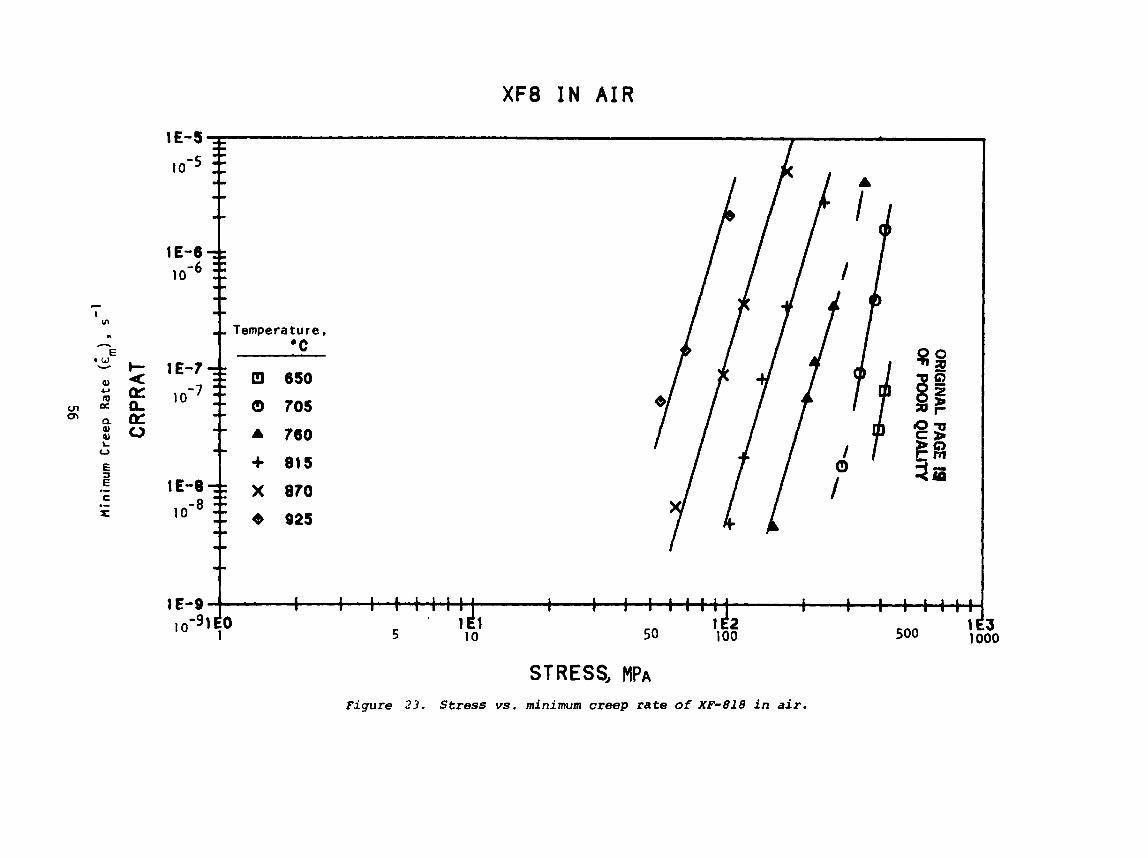
Stress vs . minimum creep ra te o f XF-818 i n a i r . . . . . . . . . 56
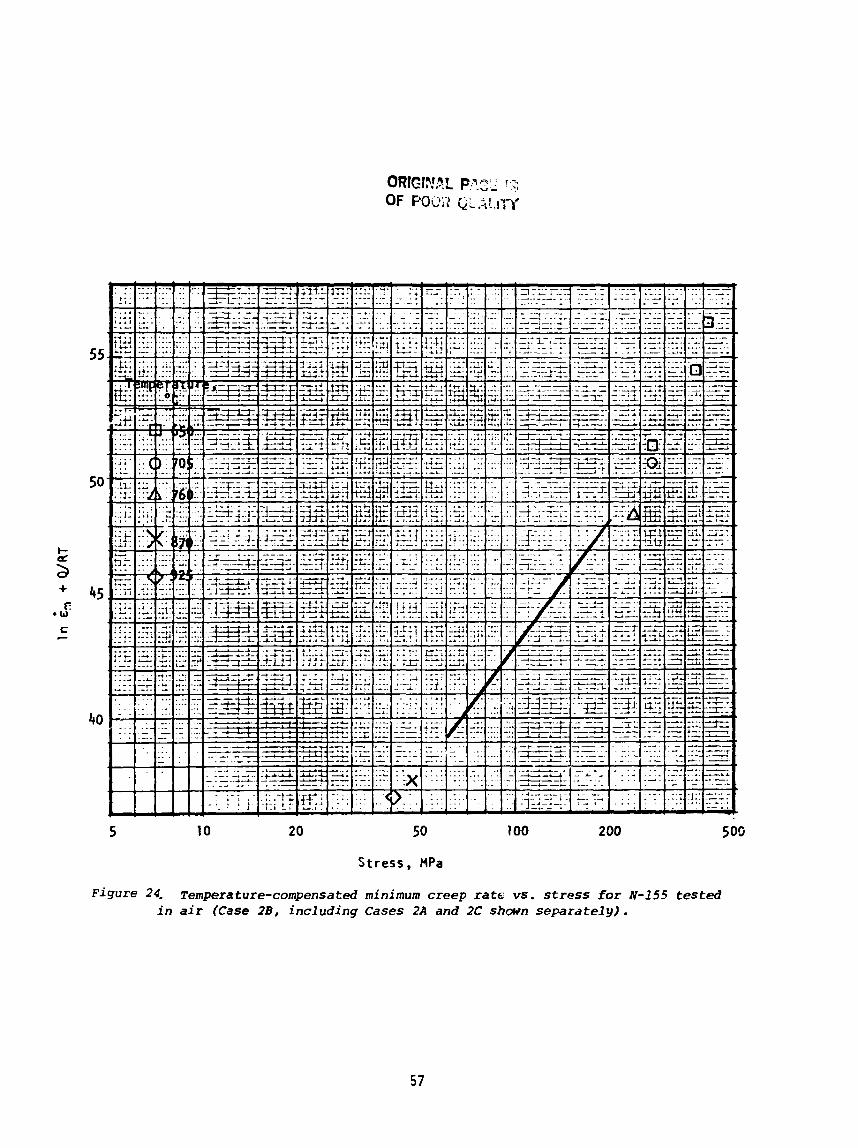
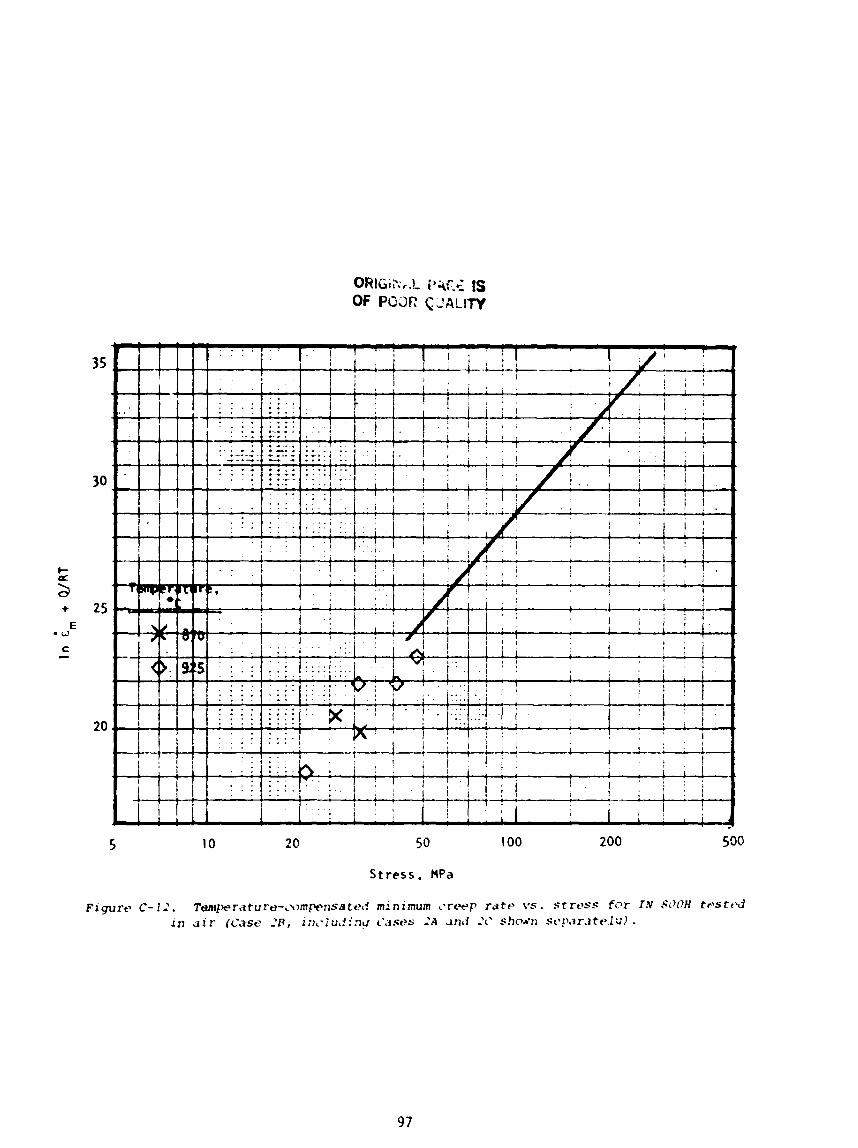
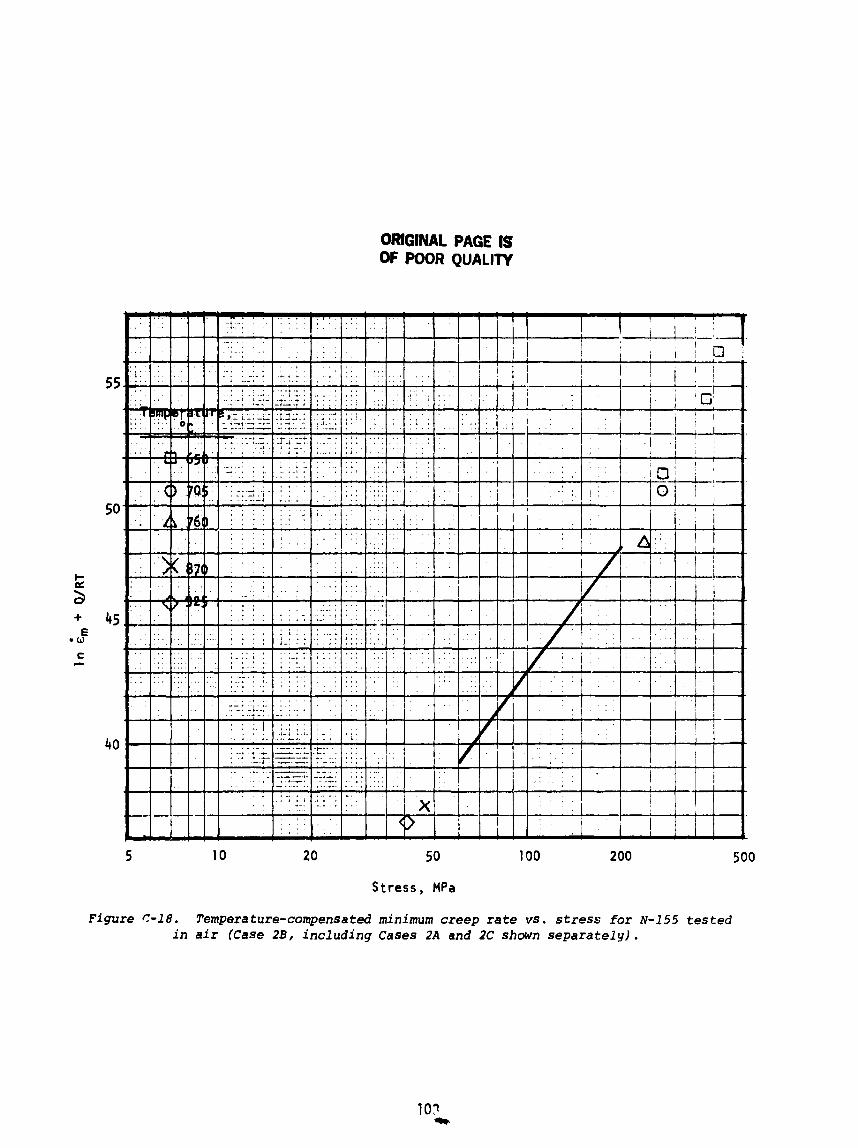
Temperature-compensated minimum creep ra te vs . stress f o r N-155 tested i n a i r (Case 28. inc ludfng Cases 2A qnd 2C data shown separately) . . . . . . . . . . . . . . . . . . . . . . . . . . . 57
LIST OF FIGURES (cont.)
Figure
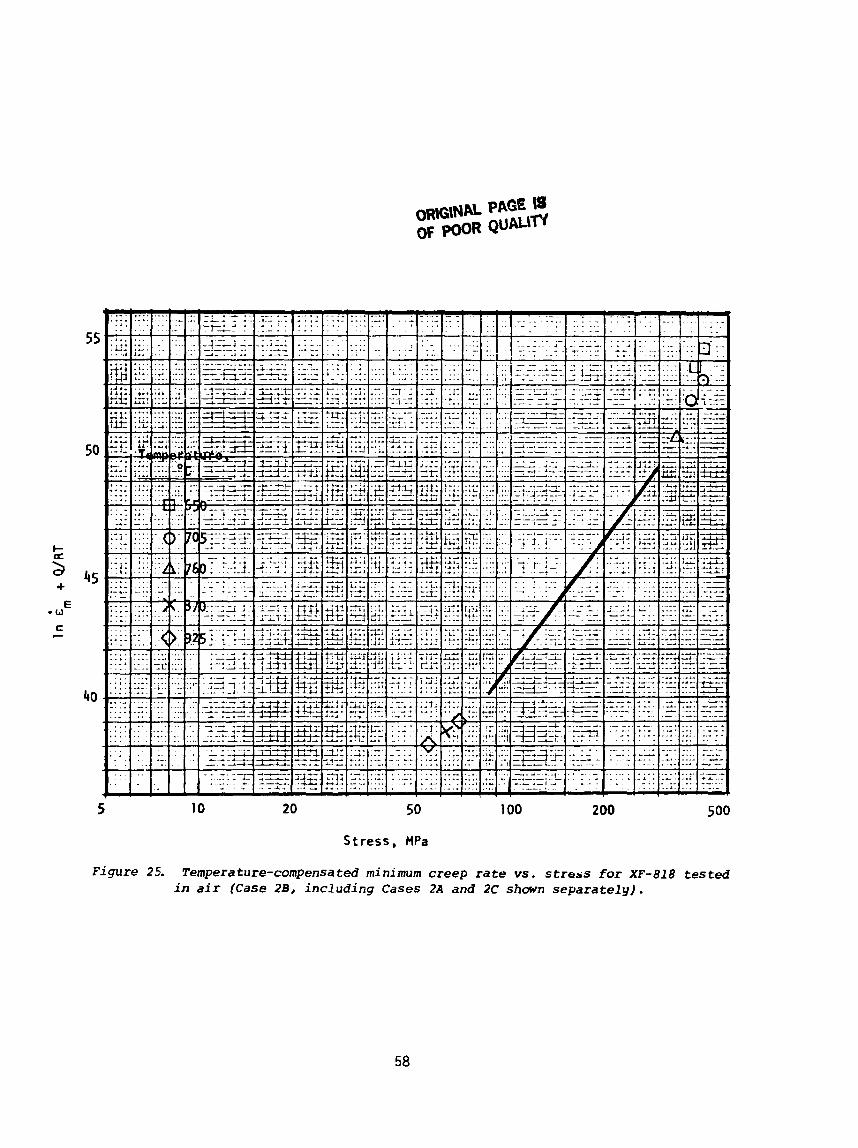
2 5 Temperature-compensated mini mum creep r a t e vs. s t ress fo r XF-818 tes ted i n a i r (Case 28, i nc lud ing Cases 2A and 2C data sham separately). . . . . . . . . . . . . . . . . . . . . . . . . . . 58
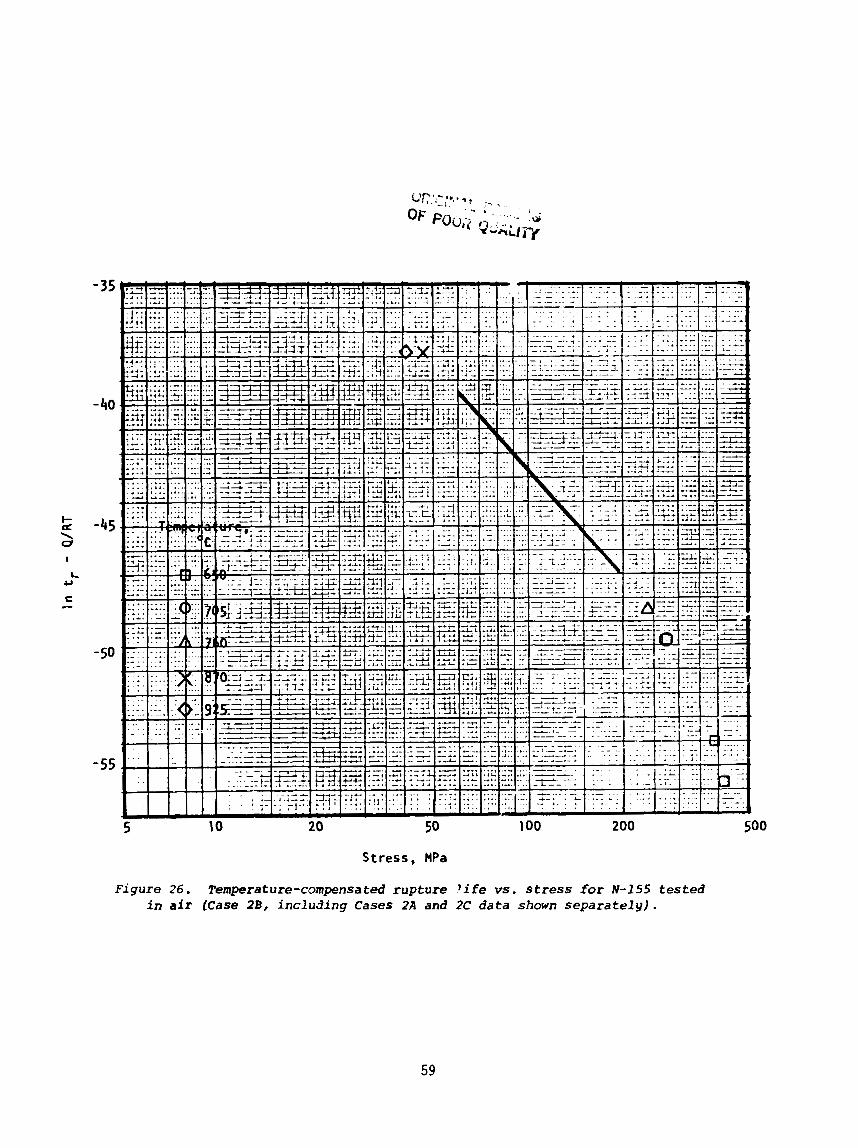
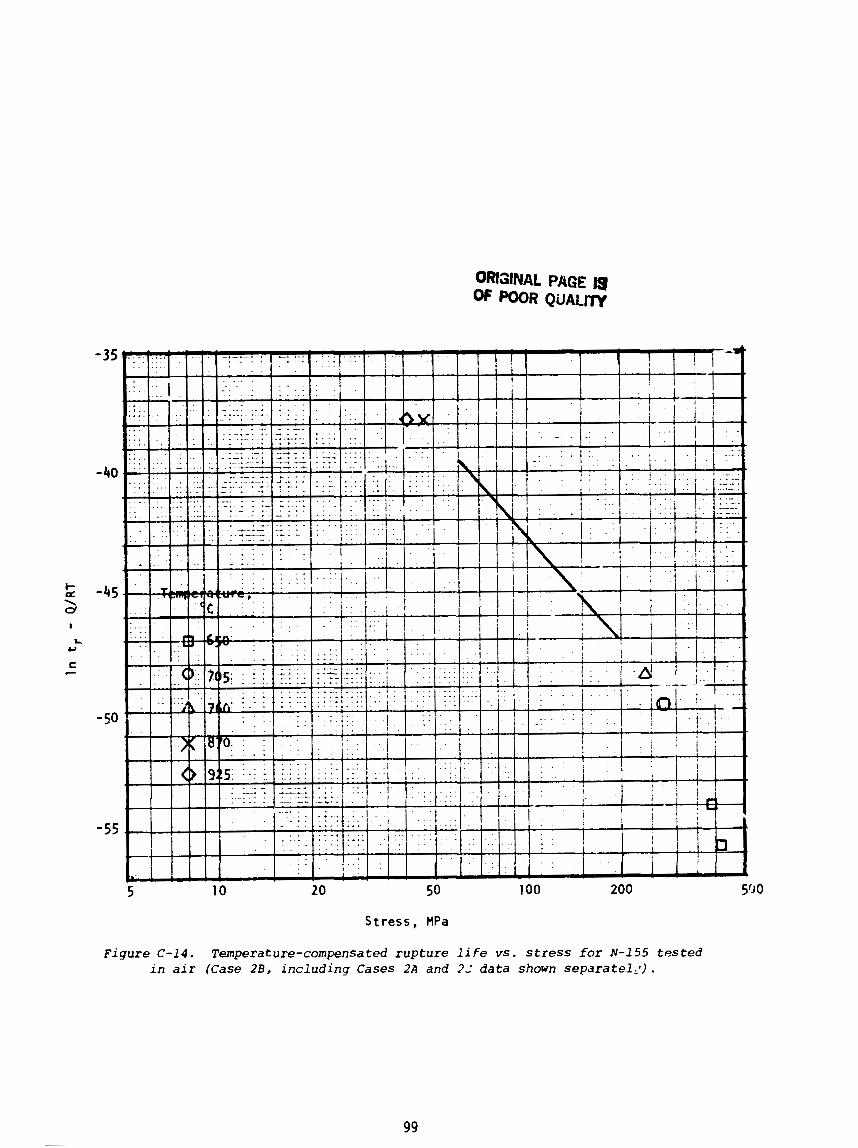
26 Temperature-compensated rupture l i f e vs. s t ress f o r N-155 tes ted i n a i r (Case 28, inc lud ing Cases 2A and X data shmm separately). . . . . . . . . . . . . . . . . . . . . . . . . . . 59
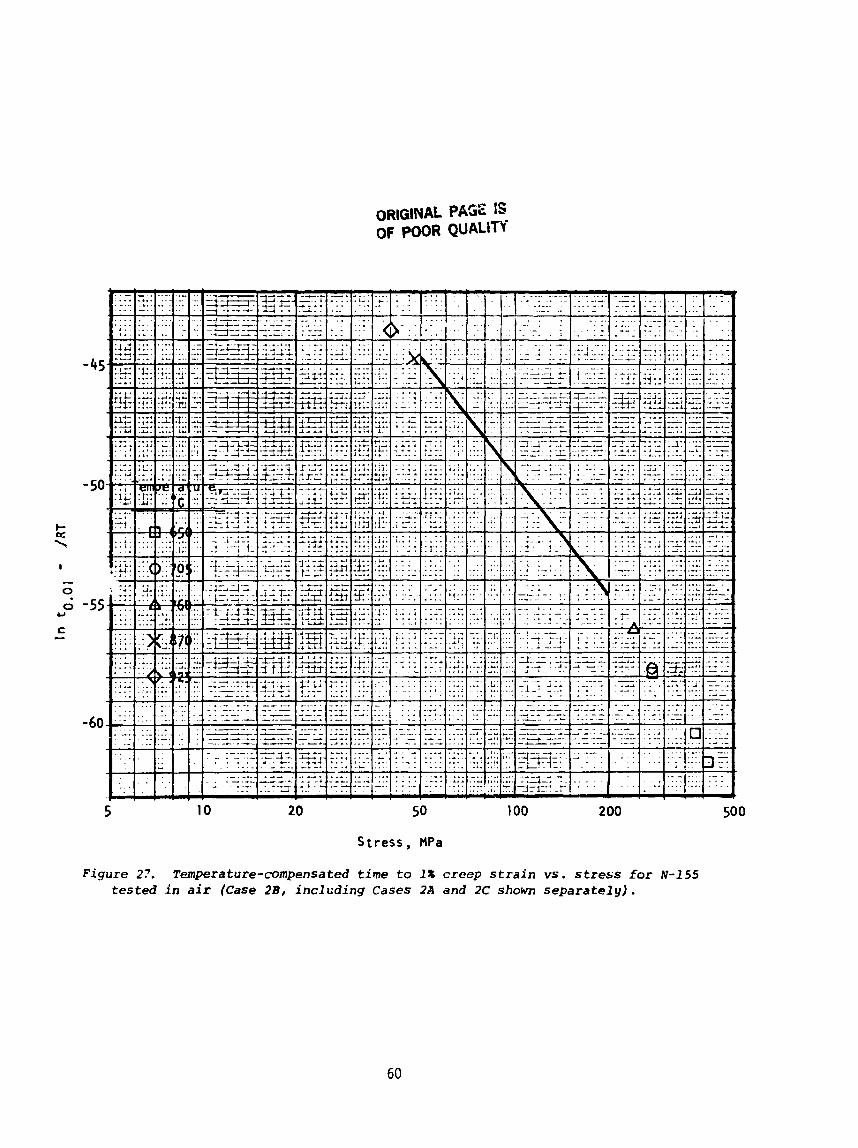
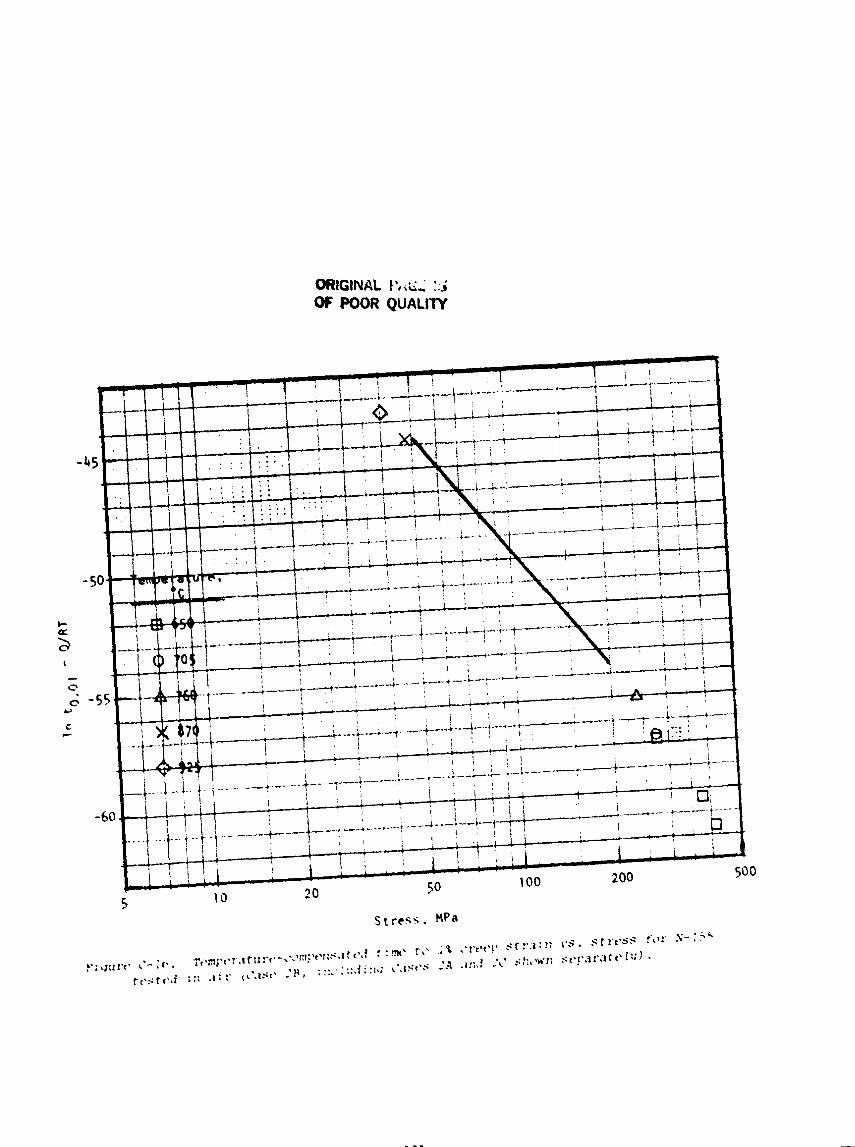
2 7 Temperature-compensated t ime t o 1% creep s t r a i n vs. s t ress fo? N-155 tested 3n a i r (Case 28, inc lud ing Cases 2A and 2C data shown separately). . . . . . . . . . . . . . . . . . . . . . . . 60
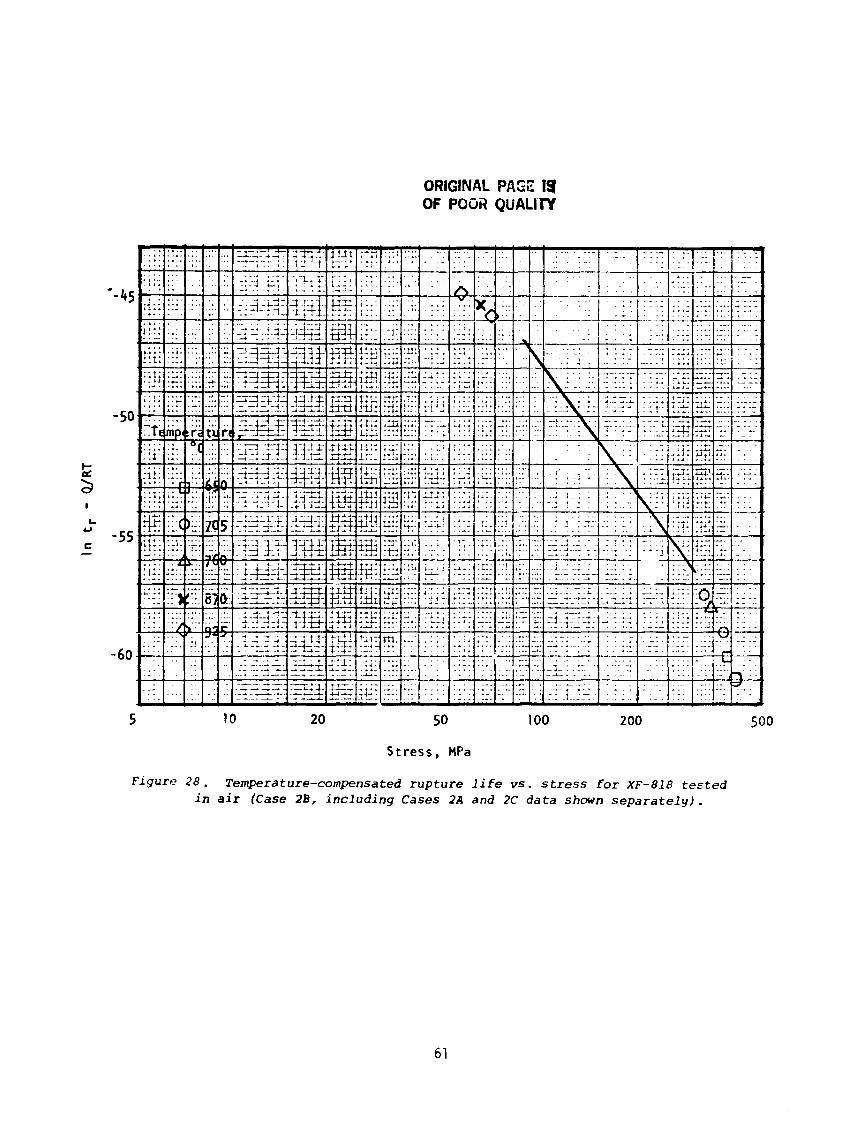
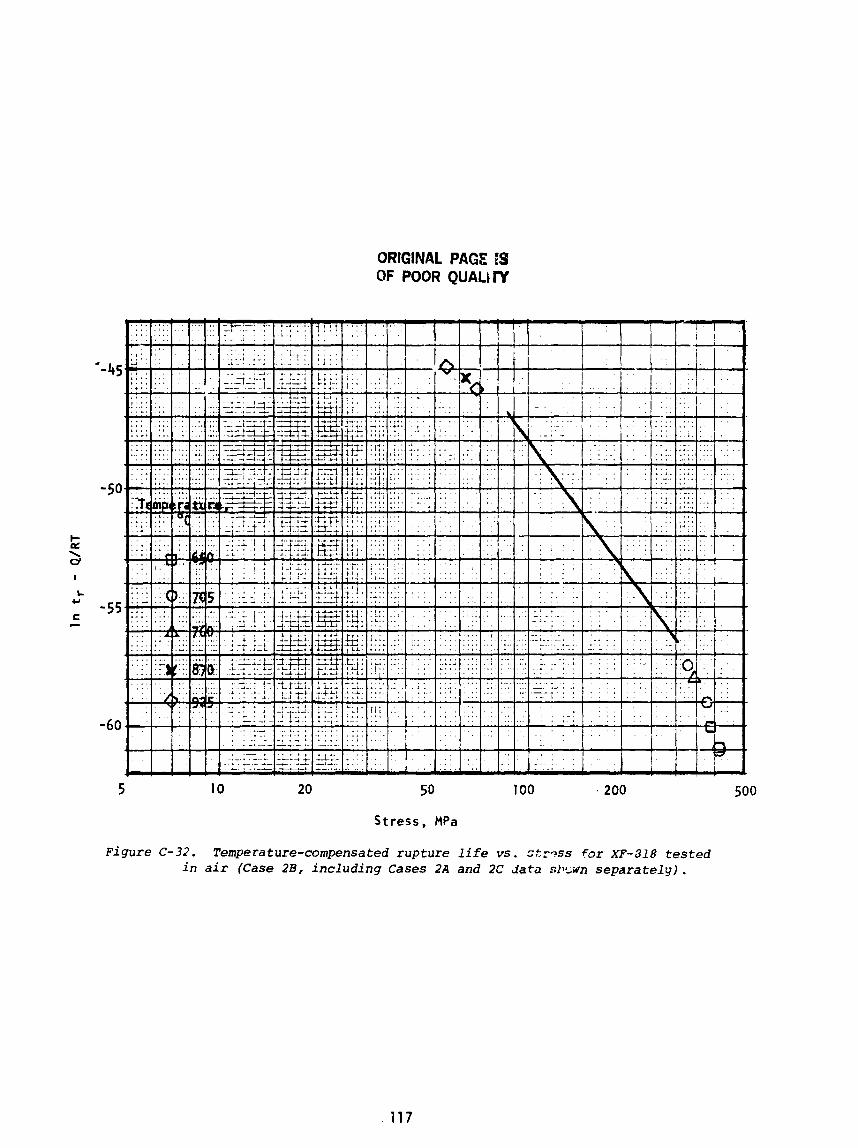
28 Temperature-compensated rupture l i f e vs. s t ress f o r XF-818 tes ted i n a i r (Case 28, inc lud ing Cases 2A and X data shown separately). . . . . . . . . . . . . . . . . . . . . . . . . . . 61
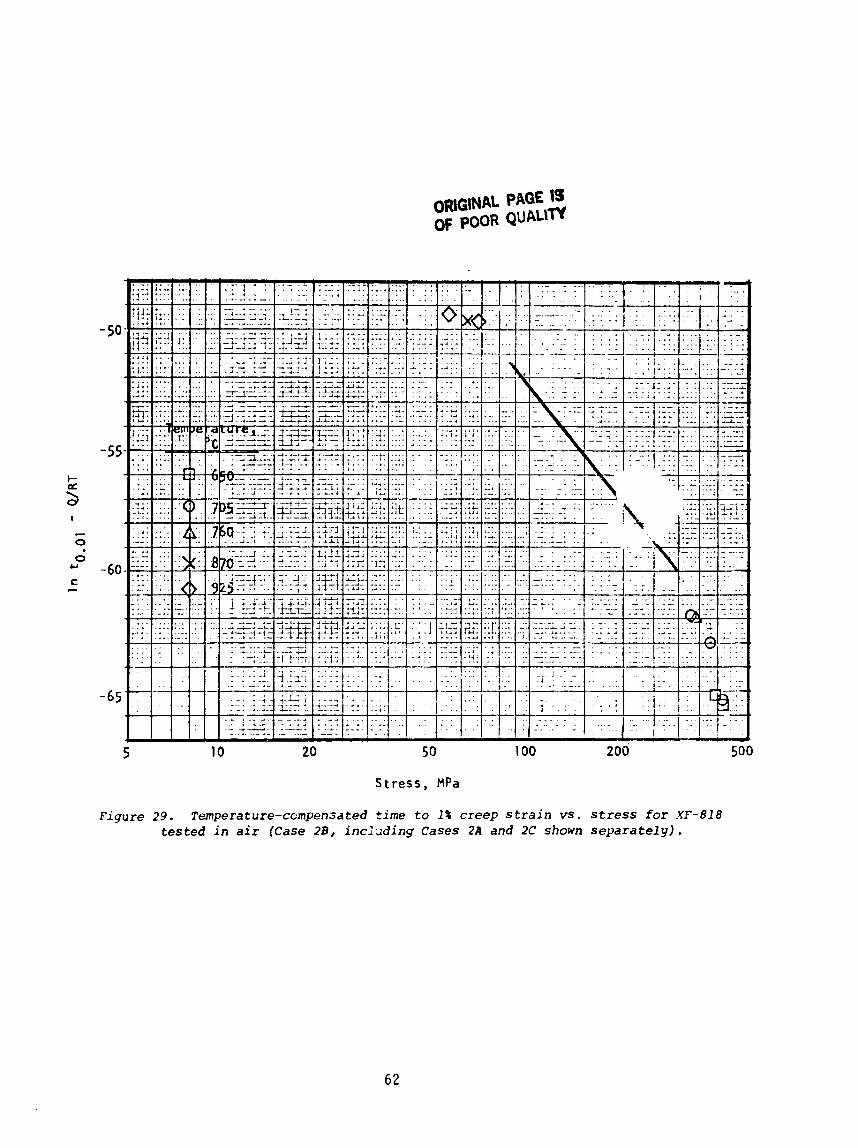
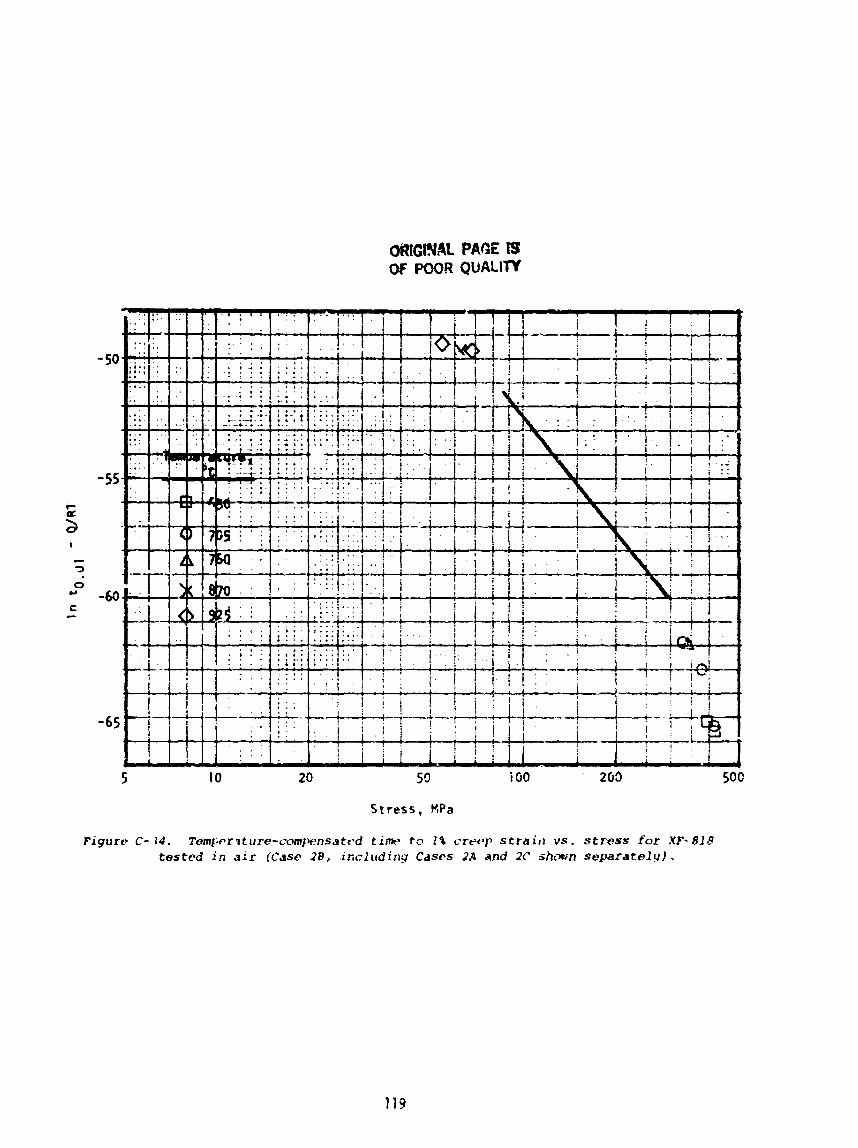
29 Temperature-compensated tjme t o 1% creep s t r a i n vs. s t ress f o r XF-818 tested i n a i r (Case 28, inc lud ing Cases 2A and 2C data . . . . . . . . . . . . . . . . . . . . . . . shown separately). 62
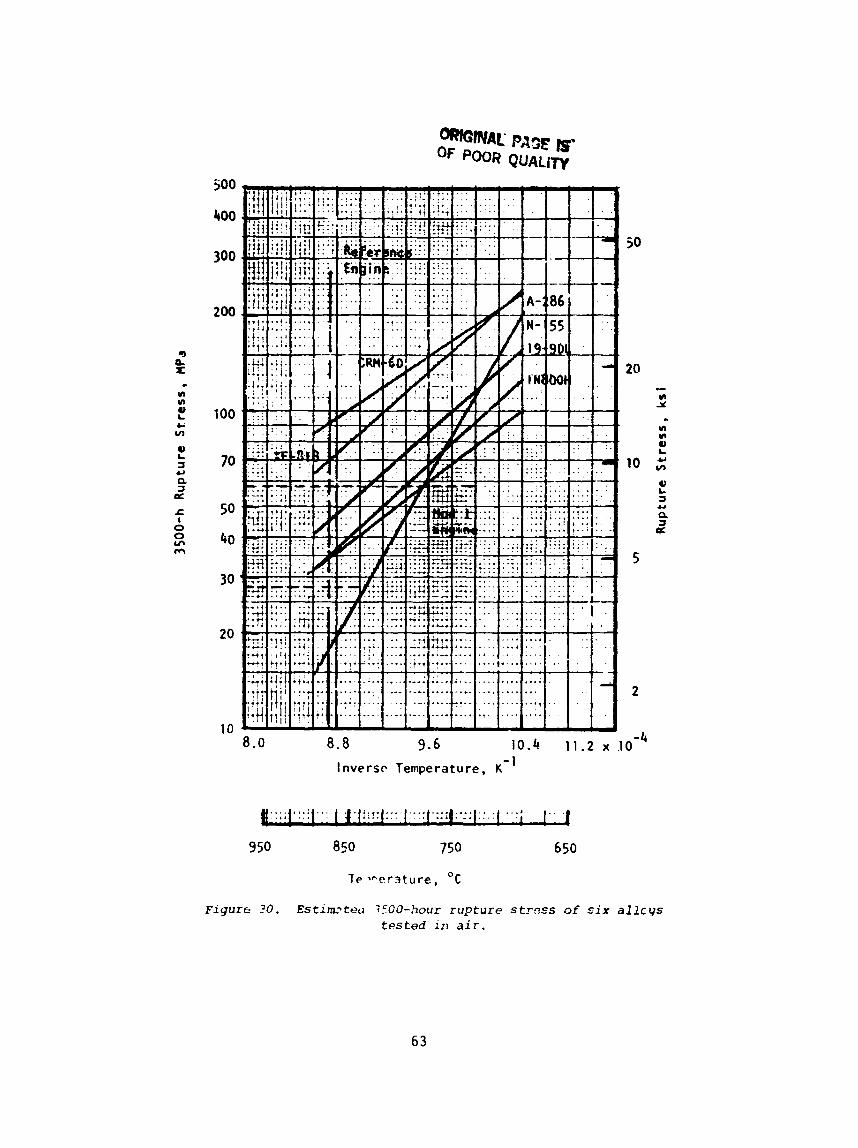
30 Estimated 3500-hour rupture st ress f o r s i x a l l oys tested i n a i r . 63
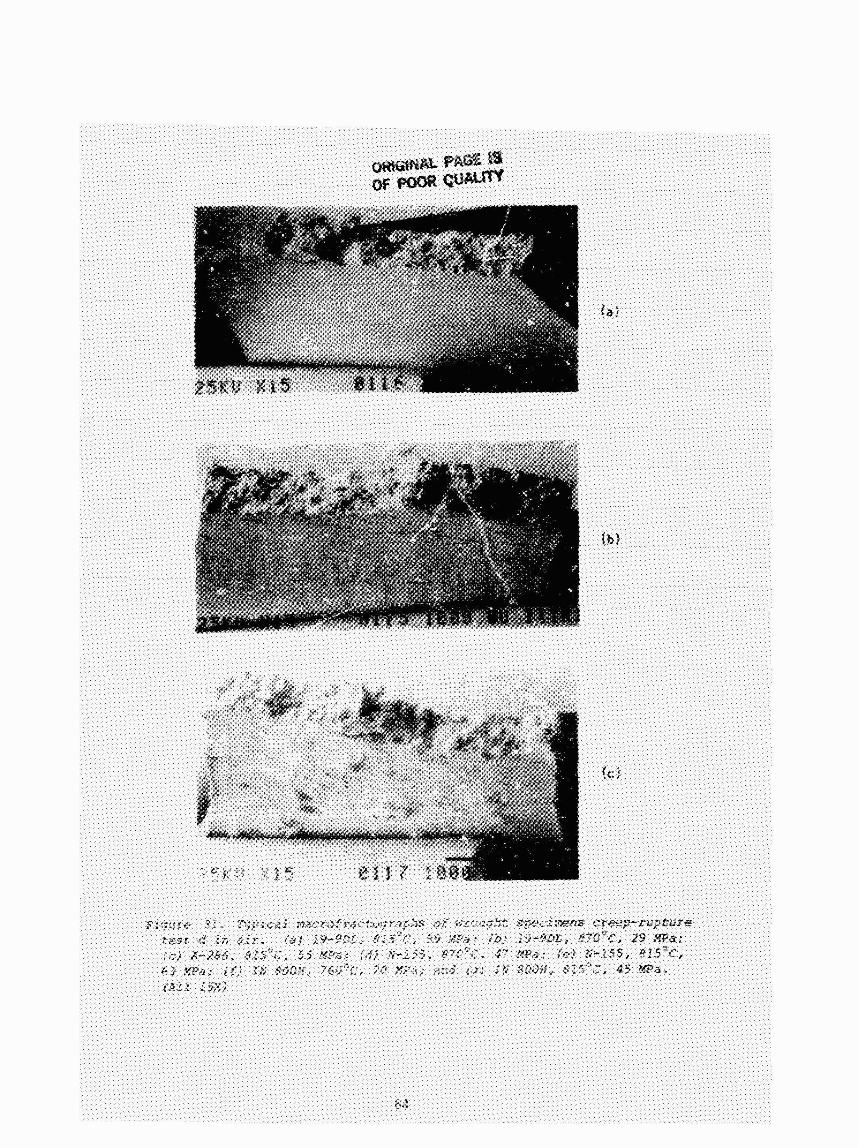
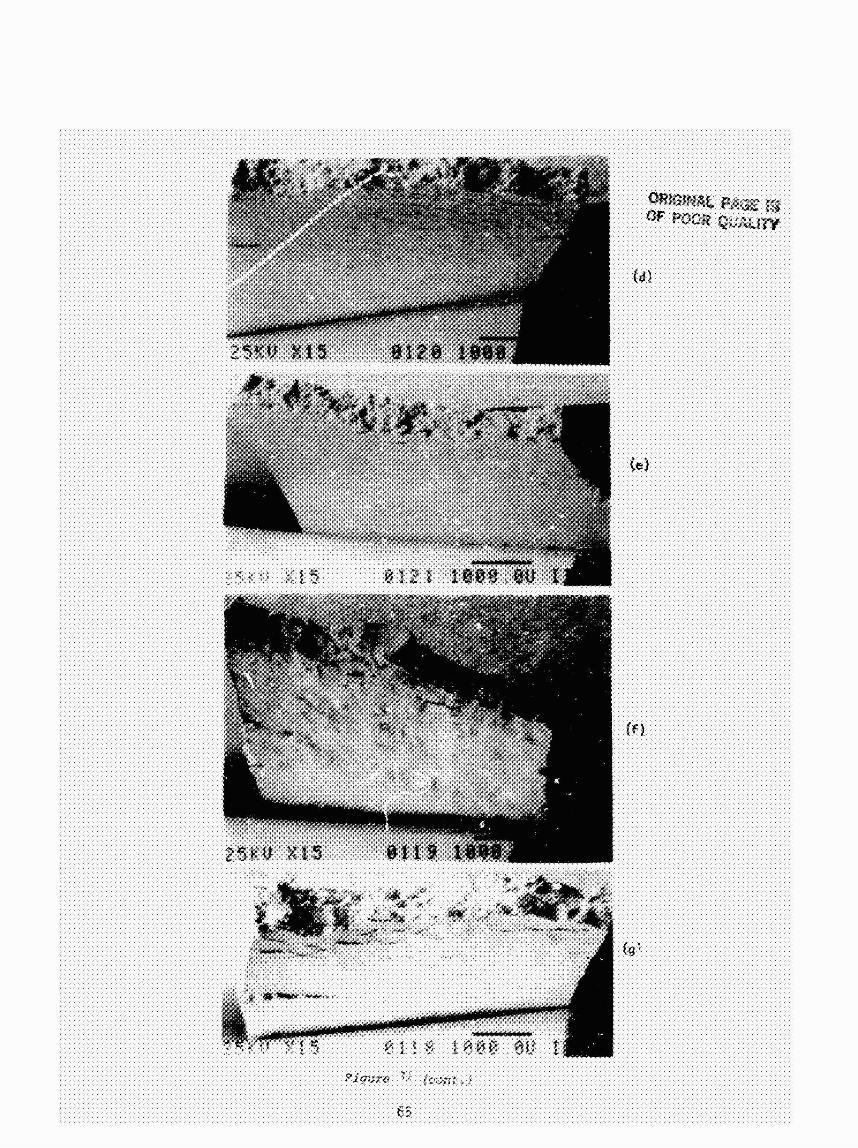
3 1 Typical macrofractographs o f wrought specimens creep-rupture tested i n a i r . . . . . . . . . . . . . . . . . . . . . . . . . . 64
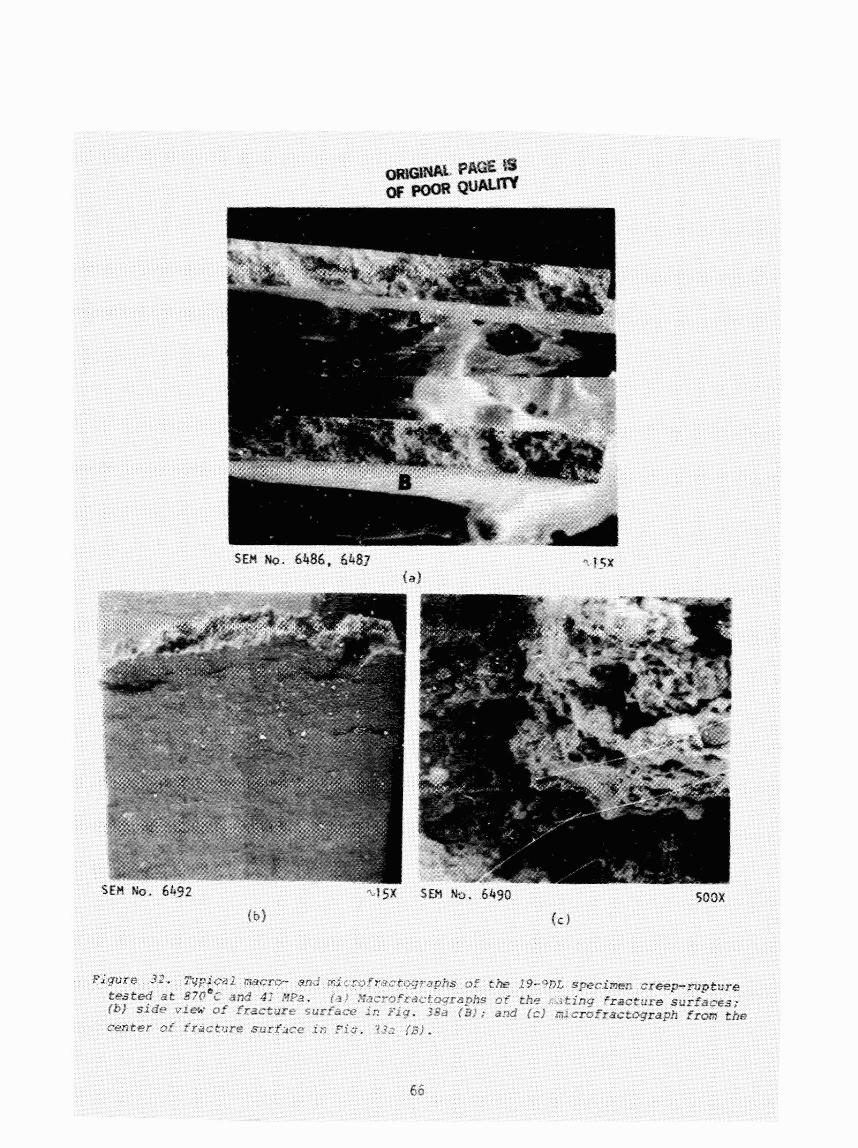
3 2 Typical macro- and microfractographs o f the 19-9DL specimen creep-rupture tested a t 870°C and 41 #Pa . . . . . . . . . . . . 66
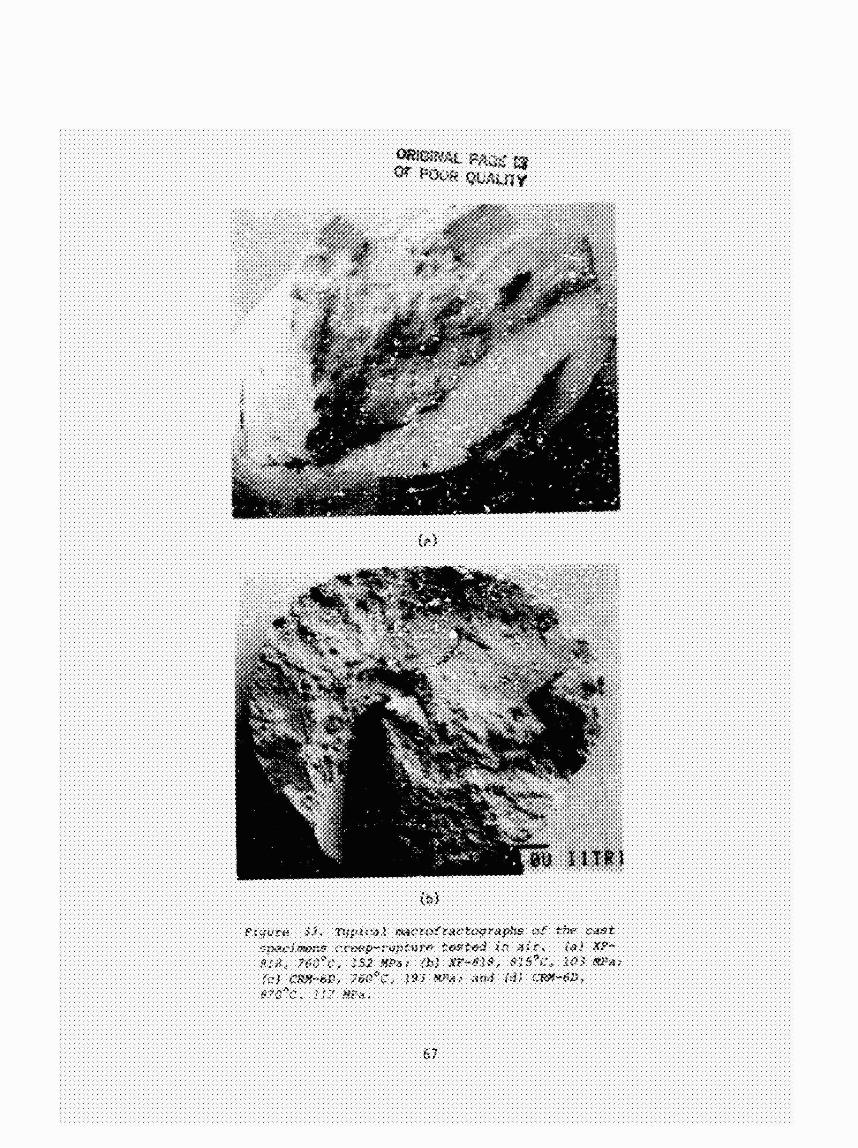
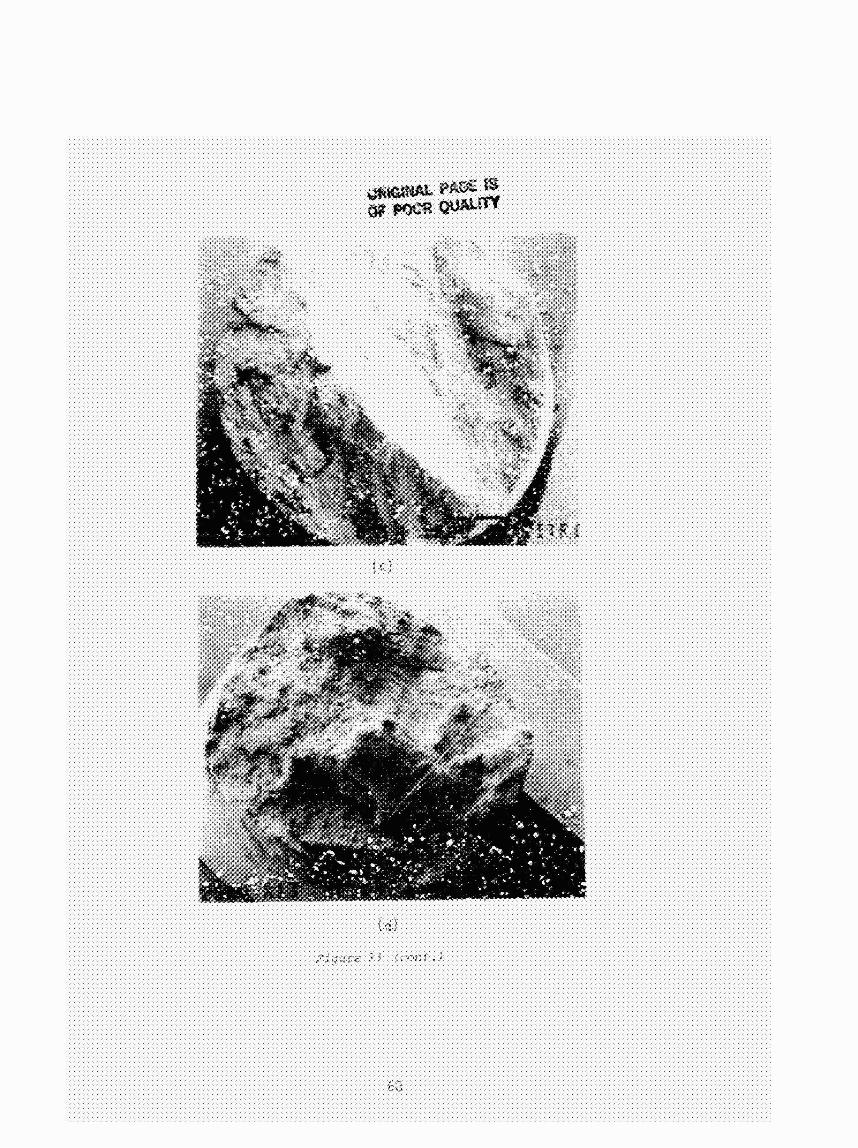
33 Typical mazrofractographs o f the cast specimens creep-rupture tested i n a'r. . . . . . . . . . . . . . . . . . . . . . . . . . 67
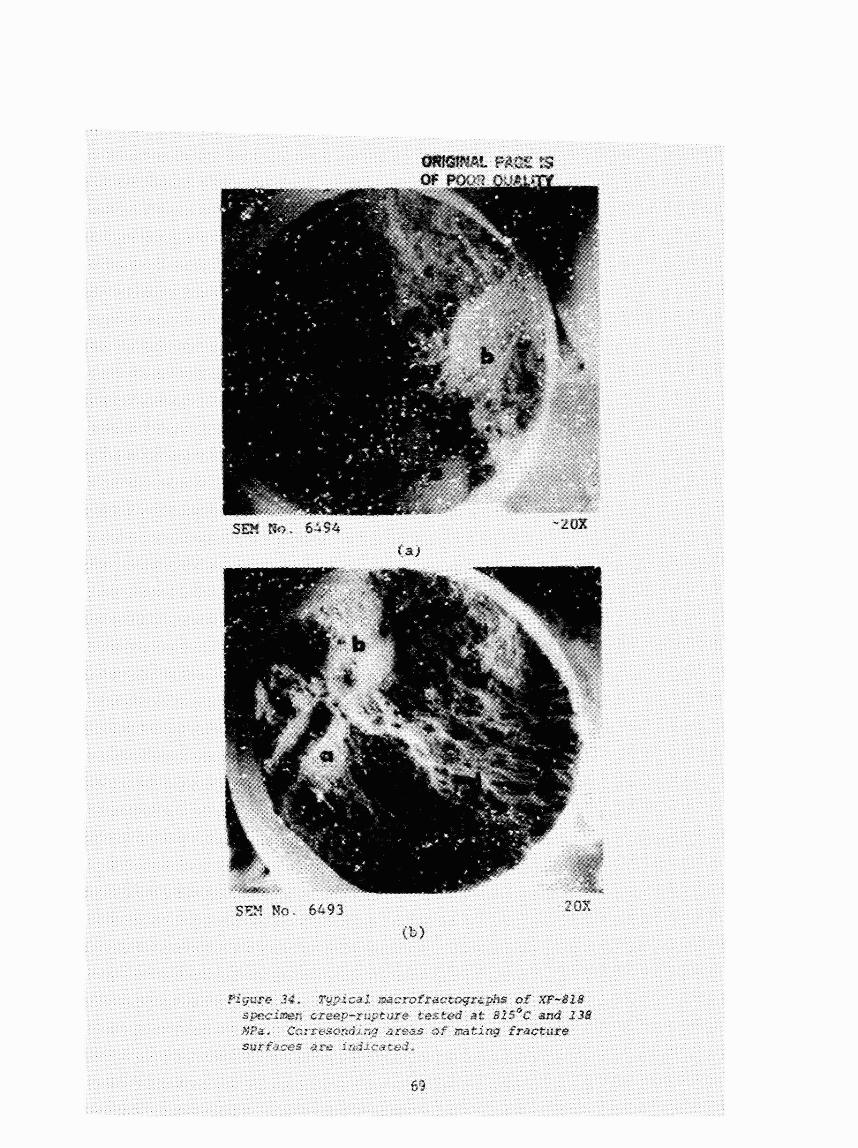
34 Typf cal macrof ractographs o f XF-818 specimen creep-rupture tested a t 815°C and 138 MPa. . . . . . . . . . . . . . . . . . . 69
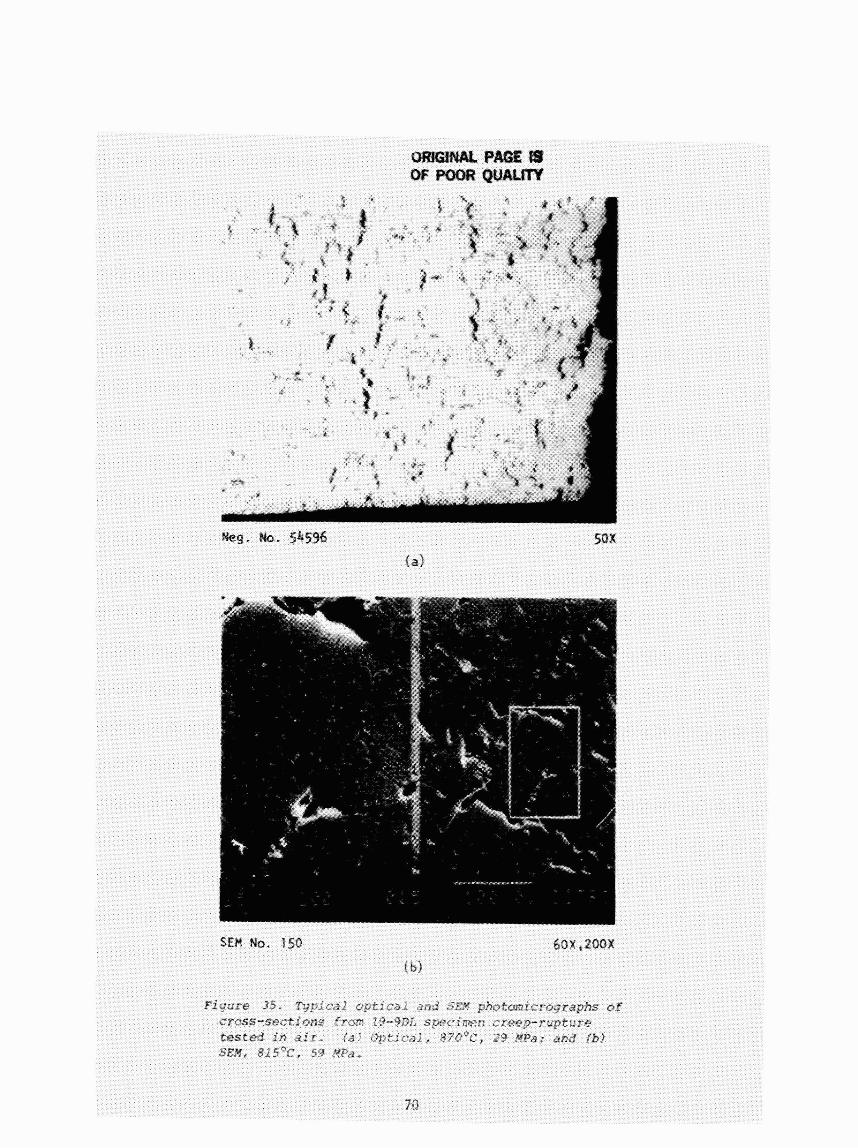
3 5 Typical op t i ca l and Sr-M photomicrogra~hs o f cross-sections from 19-9DL specimen creep-rupture tested i n a i r . . . . . . . . 70
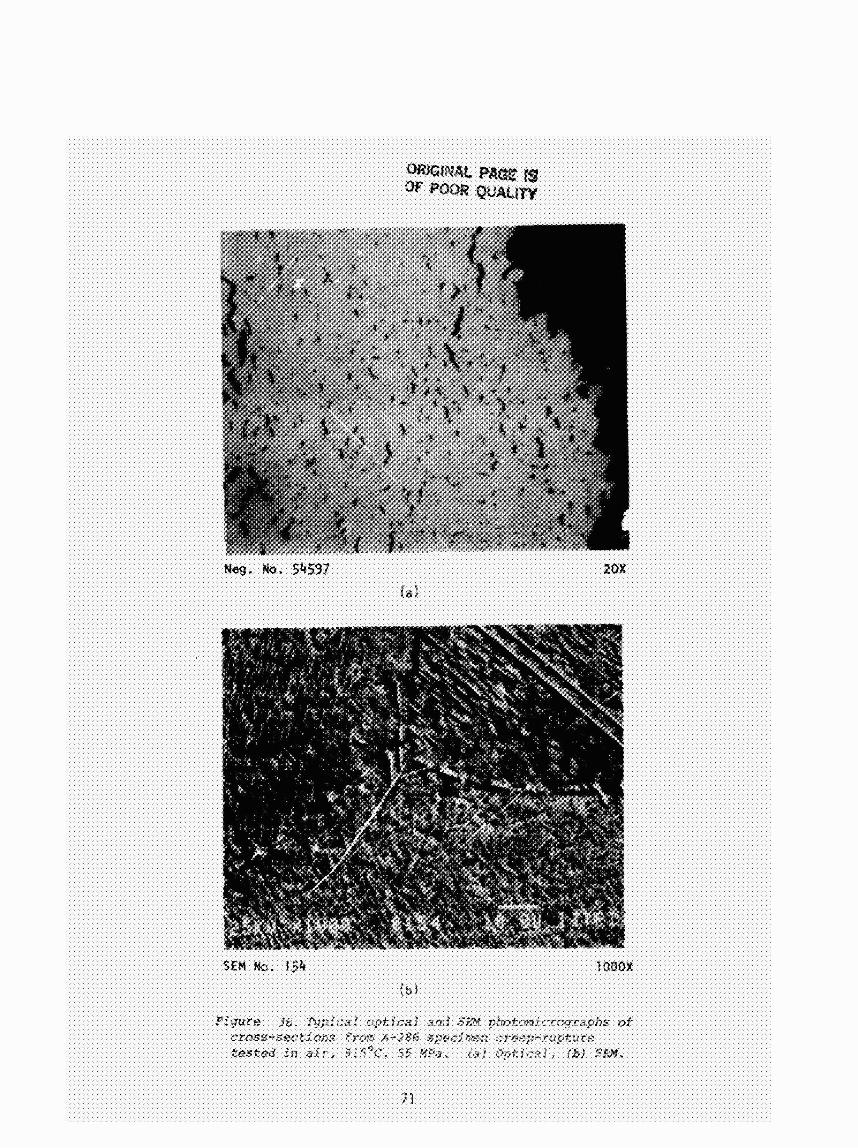
36 Typical op t i ca l and SEM photomicrographs o f cross-sections fram A-286 specimen creep-rupture tested i n a i r , 815"C, 55 MPa . 71
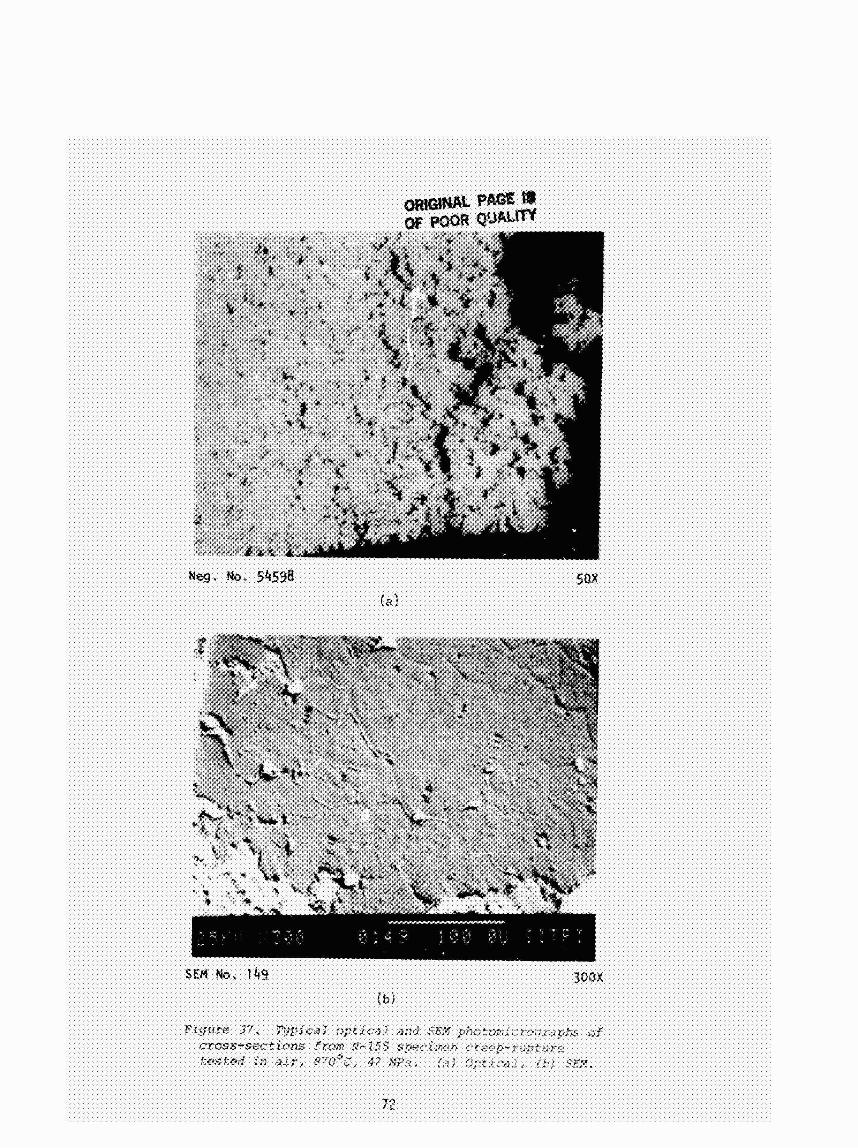
37 Typical op t i ca l and SEM photomicrographs o f cross-sections from N-i55 specimen creep-rupture tested I n a i r , 870°C, 47 MPa . 72
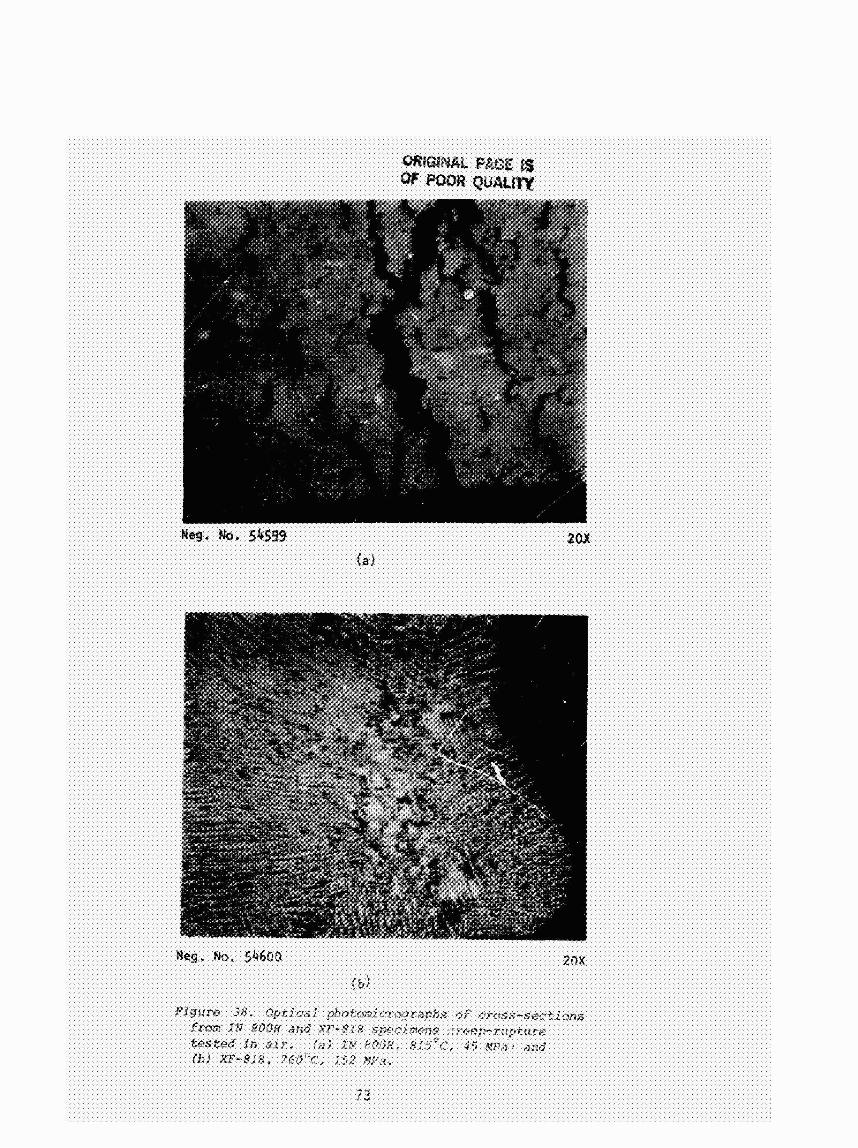
38 Optical photomicrographs o f cross-sect1 ons from I N 800H and . . . . . . . . . . XF-818 specimens creep-rupture tested i n a i r 73
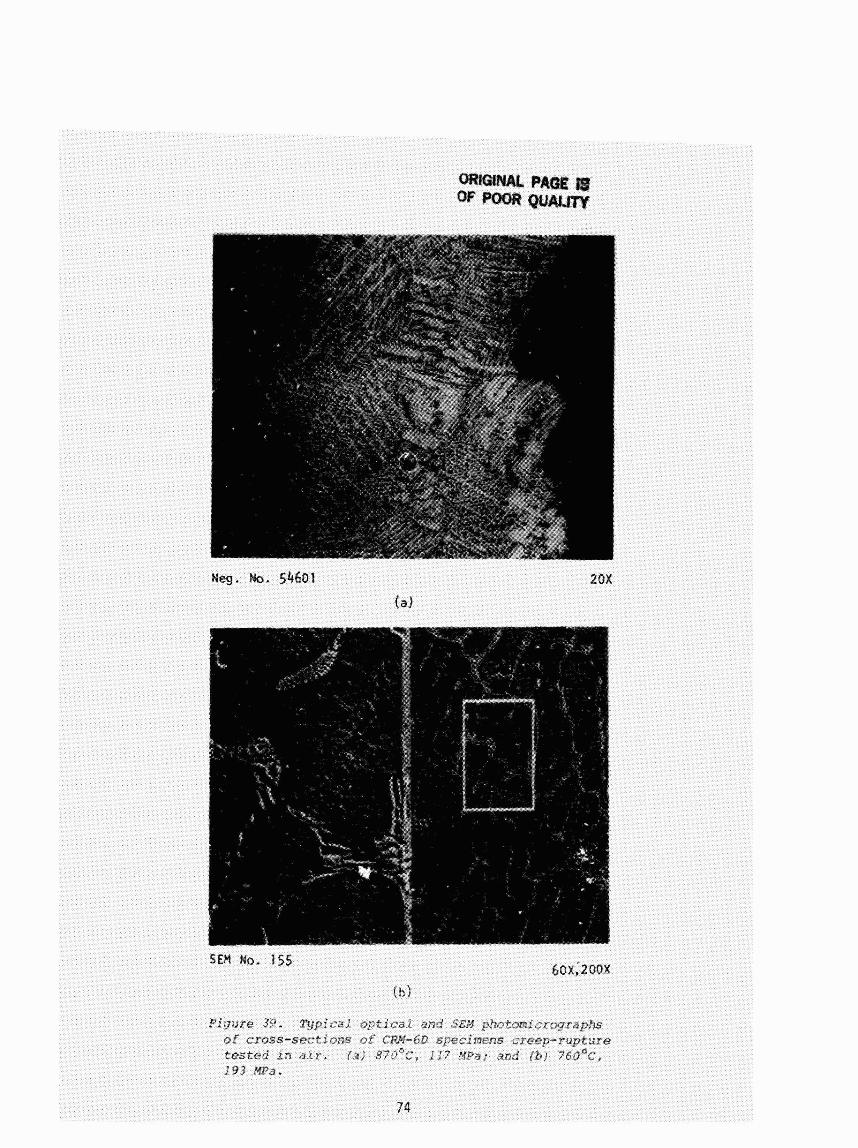
3 9 Typical op t ica l and SEM photomicrographs o f cross-sections o f CRM-6D specimens creep-rupture tested I n a i r . . . . . . . . . . 74
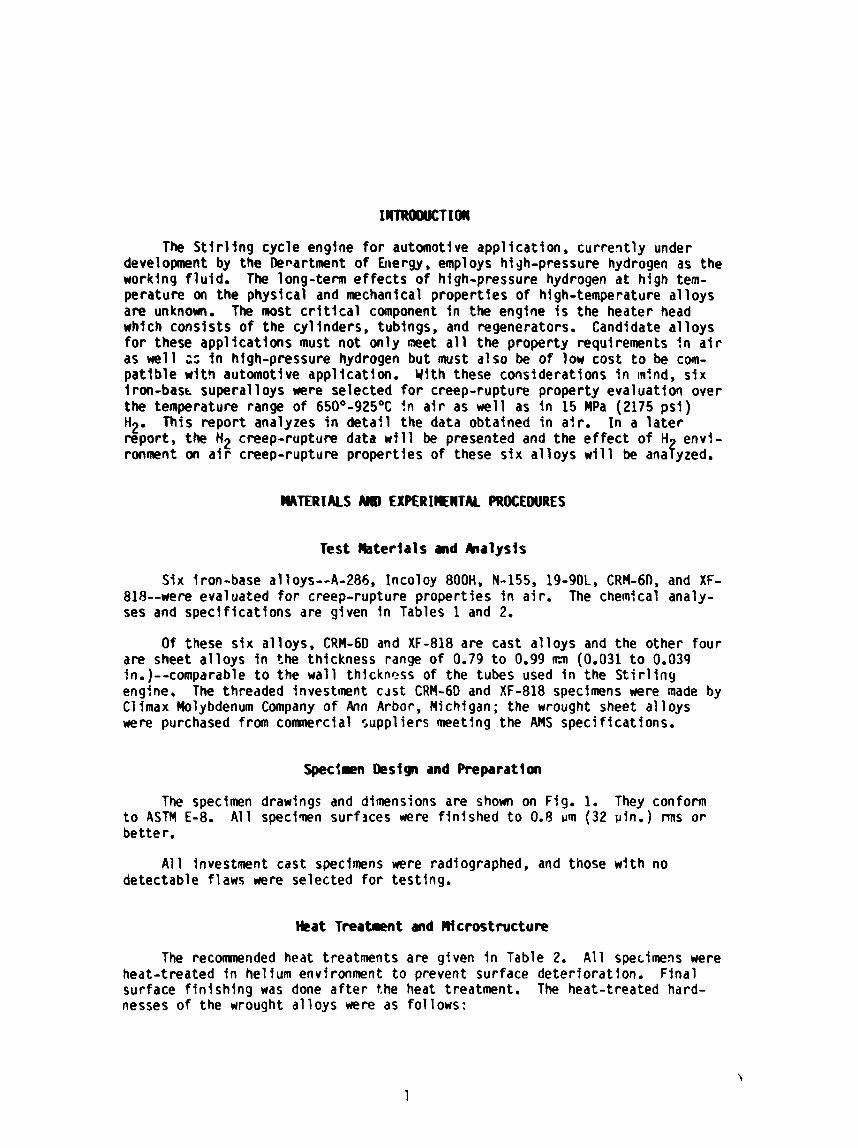
The S t i r l i n g cyc le engine f o r automotive appl icat ion, cu r ren t l y under development by the Department o f Glergy, employs high-pressure hydrogen as the working f l u i d . The long-term e f f e c t s o f high-pressure hydrogen a t h igh tem- perature on the physical and mechanical proper t ies o f high-temperature a l l o y s are unknown. The most c r i t i c a l component i n the engine i s the heater head which consls ts o f the c y l lnders, tubings, and regenerators. Candidate a1 l oys for these appl i ca t l ons must no t only m e t a l l the property requirements i n a1 r as we l l 2: i n high-pressure hydrogen but must a lso be of low cost t o be com- p a t l b l e w i t9 autonrotive appl icat ion. With these corlsiderations i n mfnd, s i x I ron-bast superal l oys were selected for creep-rupture property evaluat ion over the temperature range of 650'-925OC fn a i r as wel l as i n 15 MPa (2175 p s i )
H2. This repor t analyzes i n d e t a i l the data obtained i n a i r . I n a l a t e r repor t , the H2 creep-rupture data w i l l be presented and the e f f e c t of H e n d - ronment on a i r creep-rupture proper t ies of these s i x a l l oys w i l l be ana ? yzed.
Test Mater ia ls a d k r a l y s f s
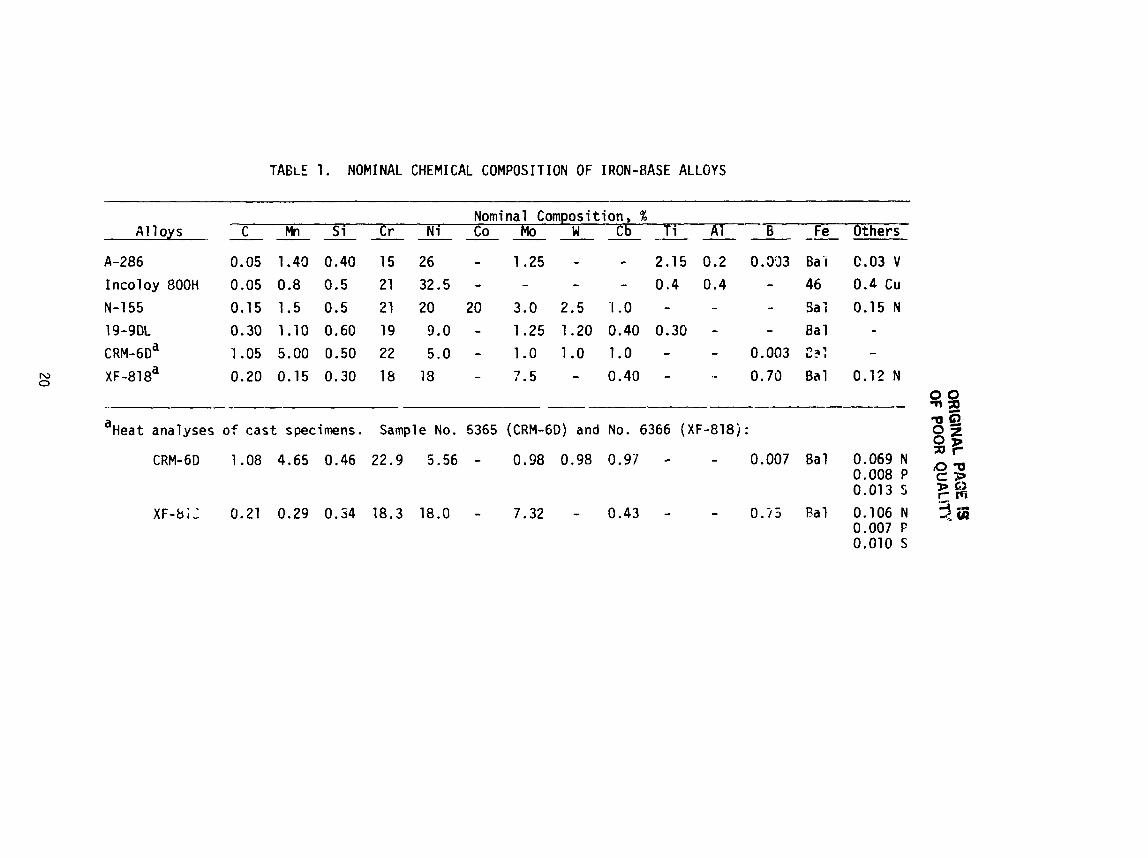
Six i ron-base a1 l oys--A-286, lnco l oy 800H, N-155, 19-90L, CRM-6n, and XF- 818--were evaluated for creep-rupture proper t ies i n a i r. The chemfcal analy- ses and spec i f i ca t ions are given i n Tables 1 and 2.
Of these s i x a1 loys, CRM-6D and XF-818 are cast a l l o y s and the other four are sheet a l l o y s i n the thickness range of 0.79 t o 0.99 m (0.031 t o 0.039 in.)--comparable t o the wal l thickness of the tubes used i n the S t i r l i n g englne, The threaded investment cast CRFI-60 and XF-818 specimens were made by Clfmax Molybdenum Company o f Ann Arbor, Michigan; the wrought sheet a l l oys were purchased from commercial suppl iers meeti ng the AMS speci f icat ions.
Specfaen Deslgn and Preparat ion
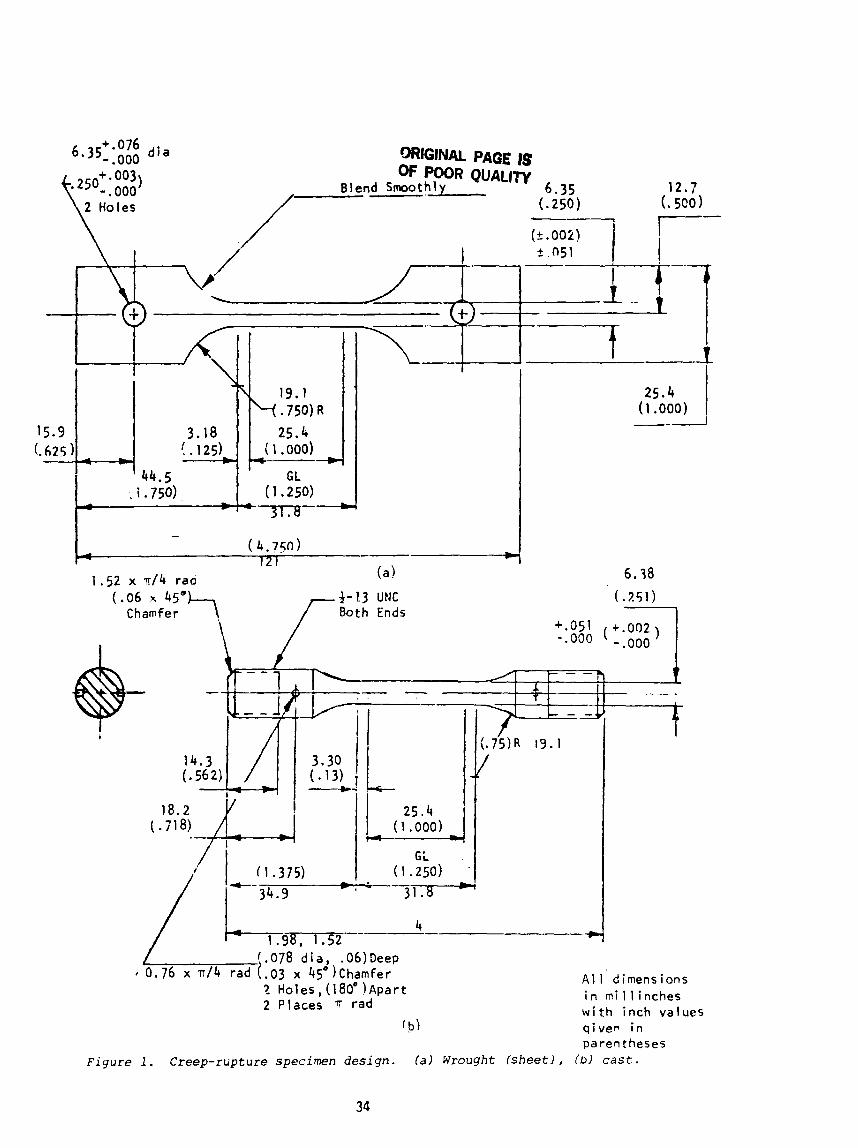
The specimen drawings and dimensions are shown on Fig. 1. They conform t o ASTM E-8. A l l spec iwn surfaces were f i n i shed t o 0.8 urn (32 pin.) rms o r better.
A l l investment cast specimens were radiographed, and those w i th no detectable f laws were selected f o r test ing.
Heat Treatment and ~ c r o s t n r c t u r e
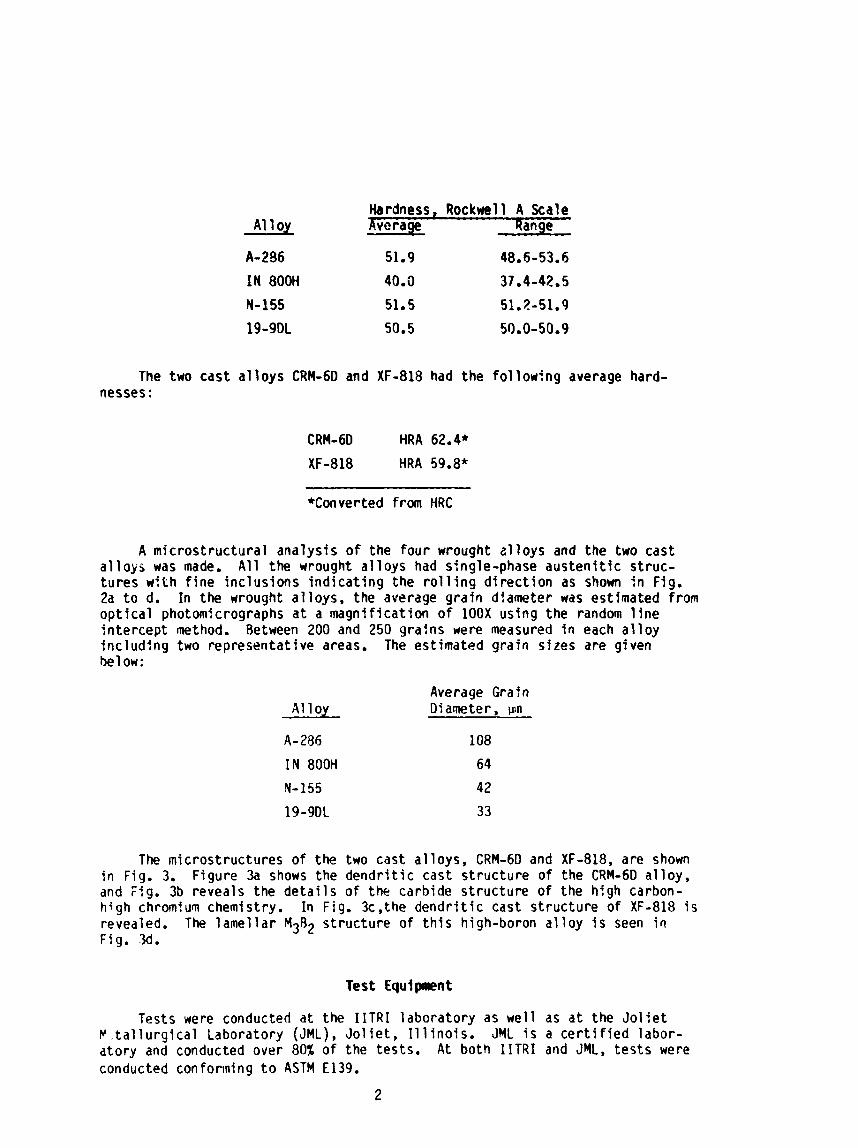
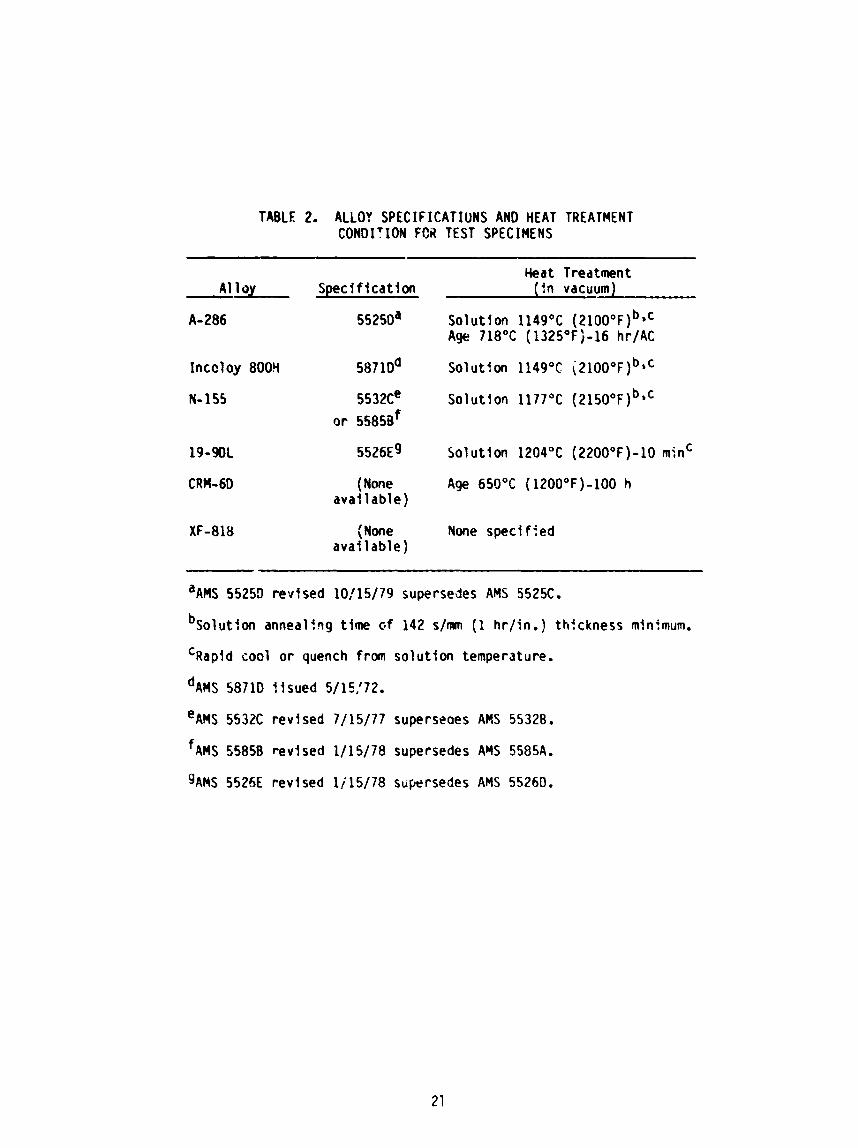
The reconmended heat treatments are given i n Table 2. A l l specimens were heat-treated i n he1 f um environment t o prevent surface de te r l o ra t ion. F ina l surface f i n i s h i n g was done a f t e r the heat treatment, The heat-treated hard- nesses o f the wrought a l l oys were as fol lows:
Hardness, Rockwell A Scale Avcraae Ranae
The two cast a l l o y s CRM-6D and XF-818 had the fol lowfng average hard- nesses :
CRM-6D HRA 62.4*
XF-818 HRA 59.8*
*Converted from HRC
A microstructura l analysis of the four wrought a1 loys and the two cast a l l oys was made. A l l the wrought a l l oys had single-phase aus ten i t l c s t ruc- tu res wf fh f i n e inc lus ions i nd i ca t i ng the r o l l i n g d i r e c t i o n as shown i n Fig. 2a t o d. In the wrought a l loys , the average gra in diameter was estimated from op t i ca l photomicrographs a t a magni f icat ion of l O O X using the random l i n e in te rcept method. Between 200 and 250 grains were measured i n each a l l o y inc lud ing two representat ive areas. The estimated gra in sizes are given be1 ow:
Average Grain A1 l oy Diameter , pin
The microstructures o f the two cast a l loys , CRM-6D and XF-818, are shown i n Fig. 3. Figure 3a shows the dendr i t i c cast s t ruc ture o f the CRM-6D a l loy , and Fig. 3b reveals the d e t a i l s o f the carbide s t ruc ture o f the high carbon- h igh chromiurn chemistry. In Fig. 3c,the dendr i t i c cast s t ruc ture of XF-818 i s revealed. The lamel la r M3R2 s t ruc ture o f t h i s high-boron a l l o y i s seen i n Fig. .M.
Test E q u f p n t
Tests were conducted a t the I I T R I laboratory as wel l as a t the J o l i e t I . t a l l u r g i c a l Laboratory (JML), Jol l e t , I 1 l i n o l s . JML i s a c e r t i f i e d labor- atory and conducted over 80% of the tests. A t both I I T R I and JYL, t es t s were conducted conforrning t o ASTM E139.
A t JML, extension was rrreasured w l th two d i a l microlneters wdd!ny t o 1.27 wn (50 uin,), and the r e s u l t s were averaged, A t I I T R I , a sens i t i ve capacltance-type displacement transducer extensaneter was used, w l th a s ignal condit ioner t o obta!n m i l l i v o l t outputs where 1 mV = 0.50 ~sm (20 pin.).
A three-zone furnace w i th a 76 m ( 3 in.) I D Alundufn tube was contro l l ed by a Barber-Colman Model 560 tenperatuw con t ro l l e r . Two chromel-alu~nel thermocouples were t i e d t o the end of the gage length, arld the rnaxi~num tem- perature d i f ference was l i m i t e d t o 2OC.
Oeadweight loading wf th a lever r a t i o of up t o 20:l was used t o obtain the i r ~ i t i a l stress. The accuracy of the lever r a t i o was c a r e f u l l y checked by means of a 22.2 kN (5000 l b f ) proving r iny, Excel lent speclmen alignment was obtained using universal j o i n t s a t both the top dnd bot tan ends of the p u l l rods.
A l l extension and :emperature data were recorded pe r iod i ca l l y a t 2 t o 4 h i n te rva l s m pr in ted tapes, and l a t e r on magnetlc dlsks. I)n f a i l u r e , a sw!tch automatical ly t r ipped o f f the t imer and furnace c i r c u i t s .
Experimental Procedure
Specimen dfmensfons were twdsured t o f25.4 m, and the cross-sect iof ial areas were calculated t o three s i g n i f i c a n t d fg i ts . Both the sheet and round specimens had a length/w?dth (d la ) r a t t o o f 4, dnd the reduced sect ion length was 31.8 mn. Extensometers were attached t o the specimen shoulders. The f ractured specimens were f i t t e d together, and the distance separatfng the extensometer pos i t ions were measured t o obtdfn the t o t a l extension, To c a l - cu late elongat ion (as percent), the d i v l s o r wds taken as the adjusted leny th o f the reduczd sect ion as defined !n ASTH €139.
Fu l l loading (IITRI) as well as increlnental losdiny (JML) was used, dnd extenslon due t o loading was noted. n i a l micro~neter (JML) and capacftance transducer extensometer ( I ITRI) read? ngs were set t o zero irnnediately a f t e r loading so tha t a l l subsequent extenslons re f lec ted the creep extenslon of the speclmen. A l l the reported creep curves thus o r i g ina te a t the zero values of creep s t r a i n and tllne axes.
I n several ea r l y tes ts a t JML, t es t s e r e dlscontlnued without f a l l u r e or loaded t o a htgher stress t o f rac ture because o f t e s t times exceedfny the expected values due t o low stress leve l select ion. 4h I l e no d e f i n i t e rupture l i f e data were obtained i n these tes ts , other valuable Information on ~nlnimum creep ra te and tlme t o obtain spec i f i c creep s t ra lns was documented and used i n the analysis.
EXPERIMENTAL RESULTS AN0 ANALYSES
Basic Data
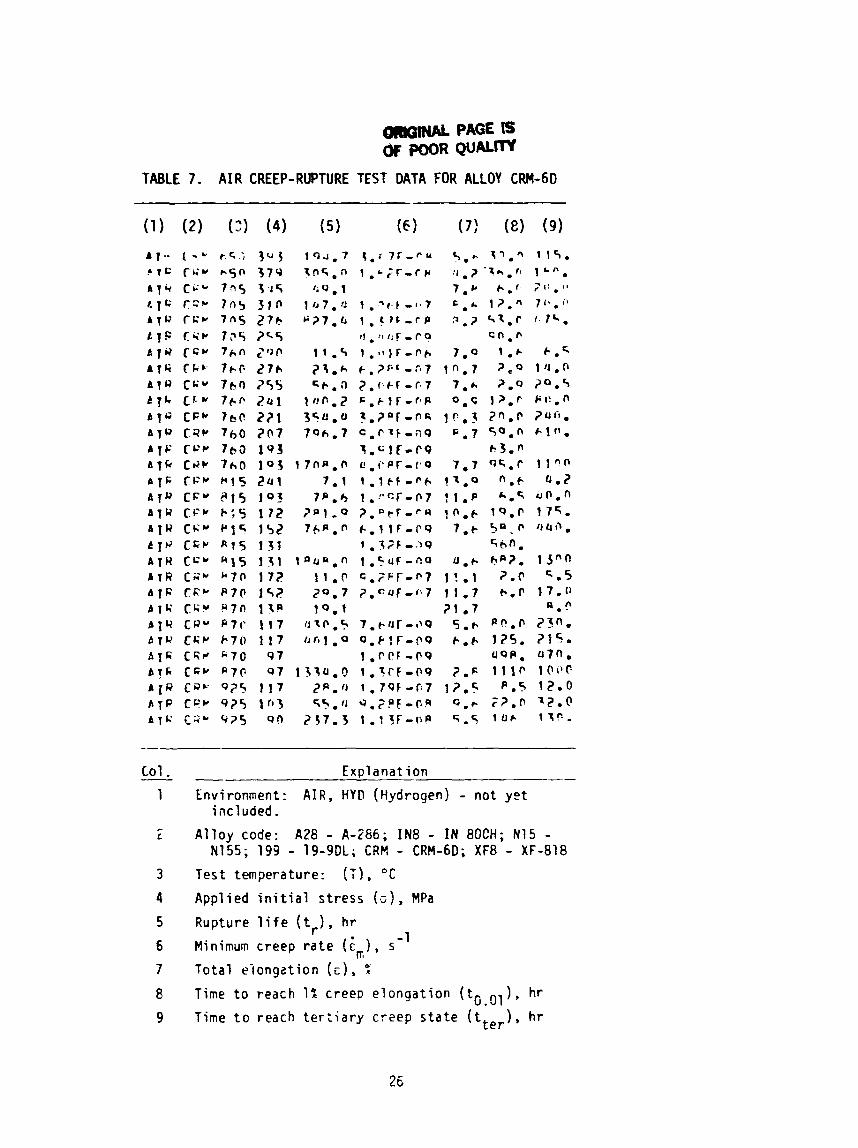
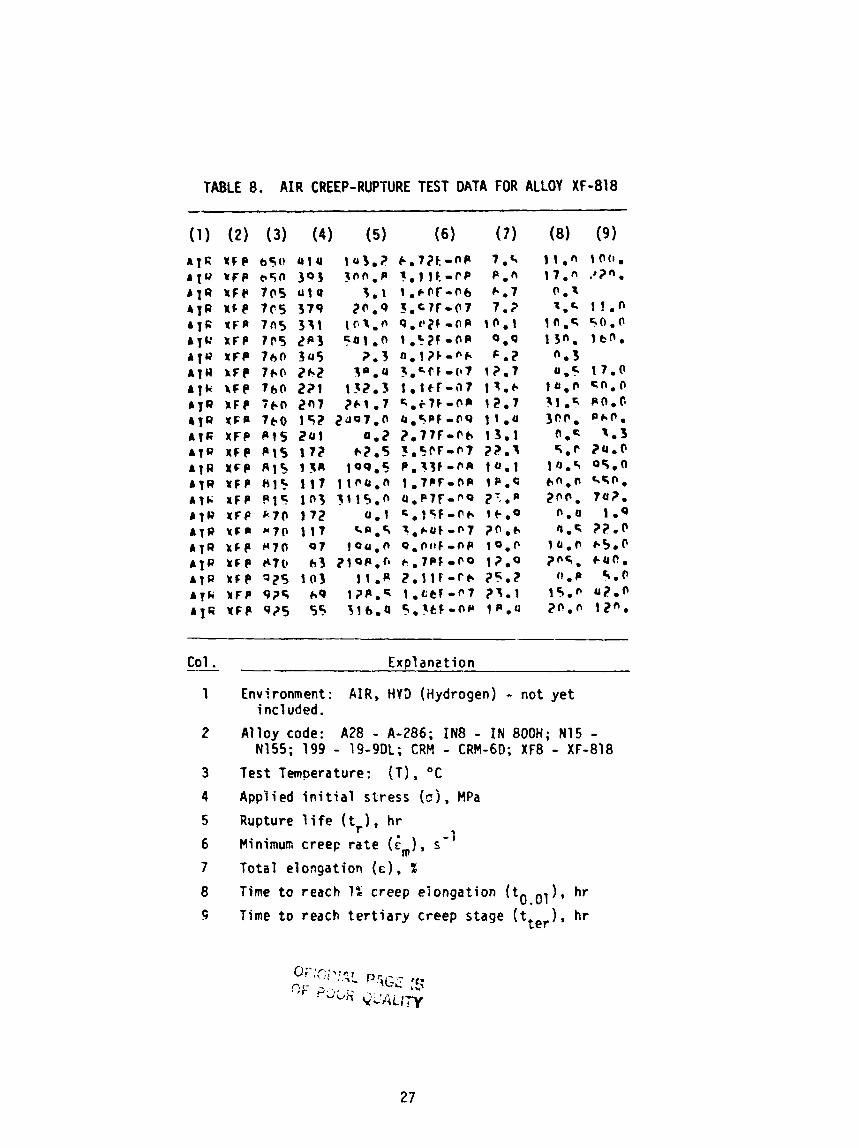
The complete se t o f a i r c r e e p - r u p t ~ r e data i s given :n ApperlllS x A. The data can be broadly grouped i n t o two categor ies , namely, independent (con- t r o l l e d ) and dependent (der ived). The independent category covers the data from cols. (1) t o ( 4 ) of Appendix A, i .em, e n v i r o r ~ w n t - a: r; a1 l o y type - any one o f the s i x a l l oys ; temperature - any one o f th:! s i x temperatures, 650 t o 925°C; and app l ied i n i t i a l s t ress spread over a w'3e range, 17 t o 483 MPa (2.5 t o 70 ks i ) .
The values i n cols, 5 t o 11 are the observed data, i.e., rup tu re l i f e (t,), minimum creep r a t e (6 ), t o t a l e longa t ion (%), dura t ion of secondary creep ( t s C ) , t ime t o reach h creep s t r a i n ( t .O1), t ime t o reach t e r t i d r y creep stage (t ), and e f f e c t i v e l i f e ( t r - eter). Of these, tr, em, and tOmo1 were s ta i? : t ica l ly analyzed as a funct fon o f s t r ess (0).
Creep Curves
The c reep-s t ra in vs. t ime p l o t s f o r t he s i x a l l o y s were obtained a t the var ious temperatures, Two t y p i c a l creep curves a t 915"C, ooe f o r wrought a l l o y N-155 and the other fo r cast a l l o y CRM-60, are shown i n Figs. 4 and 5, respect ive ly .
I n both Figs. 4 and 5, t he creep curves show the three stages o f creep-- primary, secondary, and t e r t i a r y - - l e a d i n g t o rupture. The ex ten t o f the secondary creep range and the onset of t e r t i a r y creep as we l l as the dura t ion o f t e r t i a r y creep stage 1ead:ng t o f r ac tu re depend on a l l o y s t r uc tu re and s t r ess leve ls . I n t he cast a l l o y CRM-6D, the t e r t i d r y stage i s considerably shor te r than t h a t i n the wrought a l l o y N-155, and the t o t a l s t r d i r i i s a l s o much less.
S t ress Co r re l a t i on w i t h Rupture L i fe , Hinimum Creep Rate, and Time t o 1% Creep S t r a i n
A f t e r assessjng a l l the data i n Appendix A w i t h i hc help o f i n i t i a l anal- y s i s , the data po in t s which obv ious ly f e l l out of range or were o t h e r ~ i s e considered f a u l t y and fnadrnissible were de le ted from f u r t h ~ r analys is . I n add i t i on , the o v e r a l l temperatures and s t ress ranges o f t e s t s wh'ch cover d iverse creep mechanisms lead jng on t o creep-ru9ture were broadly yrouped according t o the predominant ,.fechanism models, and the data were analyzed i n smal ler subsets as d i c t a t e d by these groupings. Th's procedure, w i t h some i t e r a t i o n , rosu l t e d i n excel l e n t c o r r e l a t i o n between s t ress and temperature, on the one hatid, and the observed parariieters, e . g . , rupture l i f e (t,), mirlisum creep r a t e ( L ), and t ime t o 1% s t r a i n ( f o e on the o ther hand. A11 the data thus re l ee ted f o r ana lys is are given rn Pables 3 t o 8 f o r the SIX super- a1 1 oys.
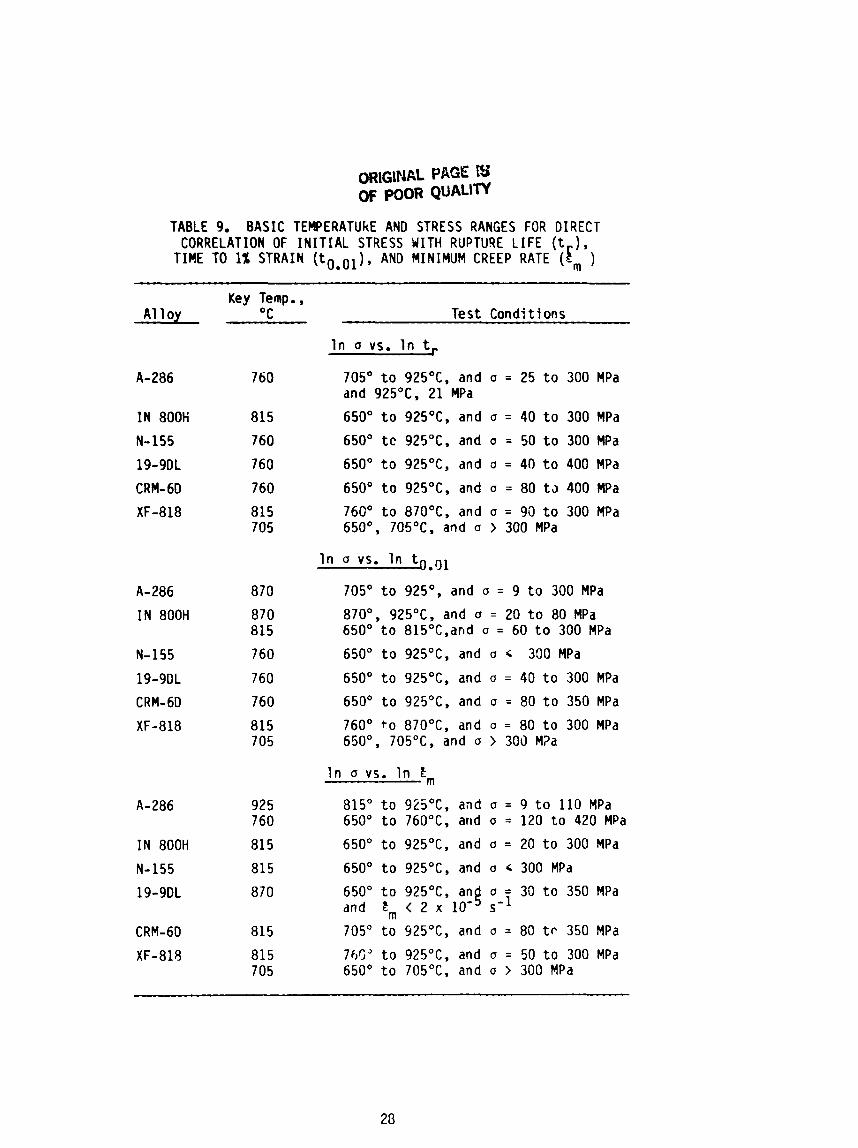
I n a1 1 th ree c o r r e l a t i o n a l analyses, the f o l lowing s i~np le power r e l a t i o n - sh ip was assumed:
or, I n Y = I n k + n I n o
where Y i s e i t h e r t & or tooo , a i s the i n i t i a l stress, k and n are constants t o be evafiatg;. The siope n i s , however, assumed constant w i th in ce r ta in temperature and st ress ranges which depended on the a l l o y strength and st ructure, wrought vs. cast. Table 9 summarizes the ranges o f temperature and st ress l eve l s over which t h i s constancy was assumed and the key temperatures which were used t o determine the slope, n. The basis for t h i s i s re la ted t o the d i f f e r e n t creep mechanisms assumed t o be operat ive under diverse tempera- t u r e and st ress leve ls re la ted t o a l l o y s t ruc ture and st rength propert ies, and may be summarized as fol lows:
1. I n the intermediate stress range and extending over p r a c t i c a l l y a l l the s i x temperatures, but more d e f i n i t e l y over 705' t o i370°C, one creep mechanism i s assumed t o be predominantly operative--a d i s l ocat ion-cl imb model.
2. A t the higher two temperatures o f 870' and 925°C and depending on the st ress l e v c l , a d i f f us iona l mode o f creep was assumed.
3. A t the two lowest temperatures of 705' and 650°C, a d is loca t ion-g l ide model s i m i l a r t o and approaching a tens i le- type f a i 1 ure was assumed wi th some considerat ion given t o the stress leve l i n r e l a t i o n t o the inherent s t rength of the a l l o y and the nature o f the product, wrought vs. cast.
A temperature-compensated analys is based on the Orowan-Sherby-Dorn method i s given !n the next section,
Rupture LIfe vs. Stress
The rupture l i f e data a t each temperature were corre lated w i th stress using the simple power re la t i onsh ip mentioned e a r l i e r . Regression analys is was used t o obtain the constants, and a l l the basic s t a t i s t i c a l information i s given i n Appendfx B, A t y p i c a l example f o r N-155 a t 760°C shows the fo l low ing co r re la t i on :
wi th a cor re la t ion c o e f f i c i e n t o f R~ = 0.998 and a 90% conf!dence range o f 0.4252. Based on the above equatfon and the 90% range value, the estimated mean i n i t i a l stress f o r 3500 h rupture l i f e was calculated t o be 98.3 MPa w i t h low and high values o f 92.3 and 108 MPa a t the 90% confidence leve l .
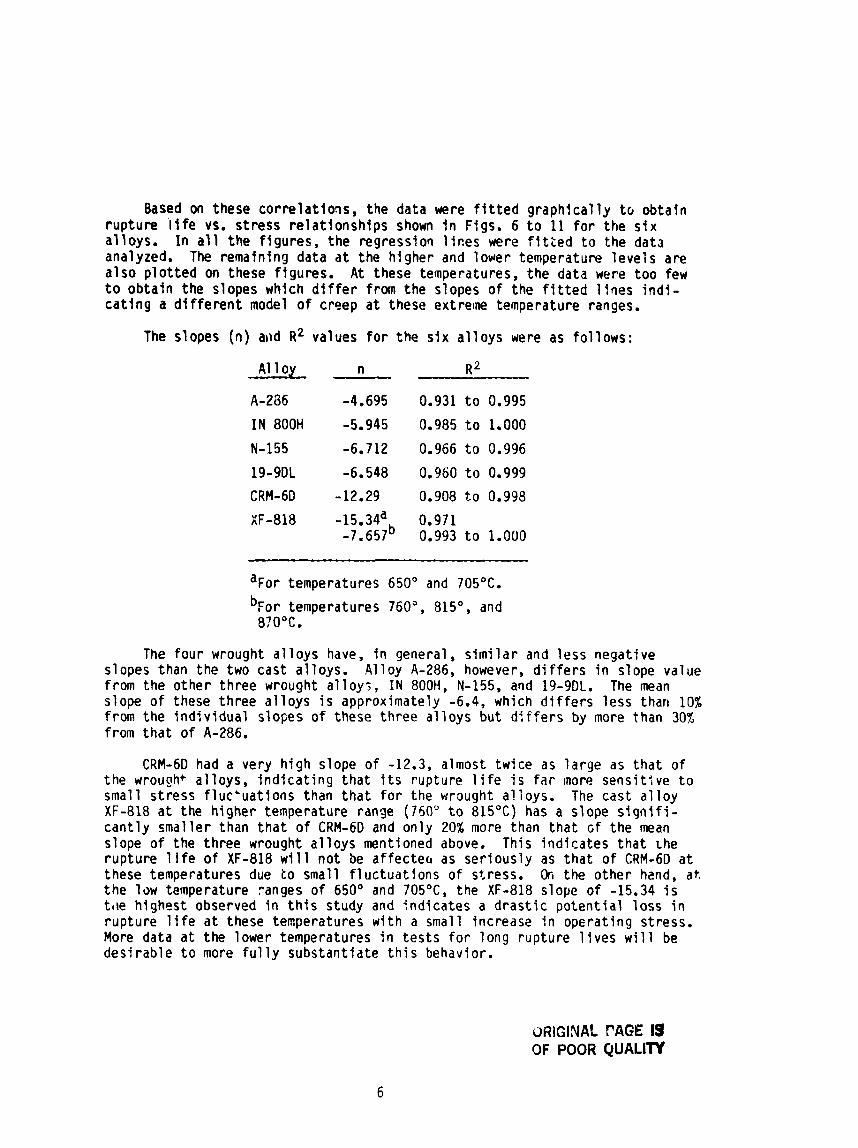
Based on these cor re la t io r l s , the data were f i t t e d g raph i ca l l y t o ob ta in rup tu re l i f e vs. s t ress r e l a t i o n s h i p s shown i n Figs. 6 t o 11 f o r the s i x a l loys . In a l l t h e f i gu res , t he regression l i n e s were f i t t e d t o the data analyzed. The remaining data a t the h igher and lower temperature l e v e l s a re a l s o p l o t t e d on these f igures. A t these temperatures, t he data were t oo few t o ob ta in the slopes ~ h i c h d i f f e r from the slopes of the f i t t e d l f o e s i n d i - c a t i n g a d i f f e r e n t model o f creep a t these extreme temperature ranges.
The slopes (n) and R~ values f o r t he s i x a l l o y s were as fo l l ows :
a ~ o r temperatures 650" and 705OC.
b ~ o r temperatures 760'. 815O, and 8?OQC.
The f ou r wrought a l l o y s have, i n general, s i m i l a r and l ess negat ive slopes than the two cast a l loys . A l l oy A-286, however, d i f f e r s i n slope value from the o ther th ree wrought a1 loy;, I N 800H, N-155, and 19-9DL. The mean slope o f these th ree a l l o y s i s approximately -6.4, which d i f f e r s l ess than 10% from the i n d i v i d u a l s lopes of these t h ree a l l o y s bu t d i f f e r s by more than 30% from t h a t of A-286.
CRM-6D had a very h i gh slope o f -12.3, almost tw ice as l a rge as t h a t o f the wrought a l l oys , i n d i c a t i n g t h a t i t s rup tu re l i f e i s f a r more sens i t i ve t o smal l s t ress f luc 'uat ions than t h a t f o r the wrought a l loys . The cas t a l l o y XF-818 a t the h igher temperature range (750" t o 815°C) has a s lope s i q n i f i - c a n t l y smal ler than t h a t o f CRM-OD and on ly 20% more than t h a t cf the mean slope o f the t h ree wrought a l l o y s mentioned above. This i nd i ca tes t h a t the r up tu re 1 i f e of XF-818 w i 11 no t be a f f ec tea as se r i ous l y as t h a t o f CRM-6D a t these temperatures due t o small f l u c t u a t f o n s o f s t ress. Or, the o ther hznd, at. t h e low temperature ranges o f 650' and 705OC, the XF-818 slope o f -15.34 i s t11e h ighest observed i n t h i s study and i nd i ca tes a d r a s t i c p o t e n t i a l l o ss i n rup tu re l i f e a t these temperatures w i t h a small increase i n operat ing s t ress. More data a t the lower temperatures i n t e s t s f o r long rup tu re l i v e s w i l l be des i r ab le t o more f u l l y subs tan t ia te t h i s behavior.
ORIGINAL PAGE 19 OF POOR QUALITY
TI- t o 1% Cncp Strrln vs. Stress
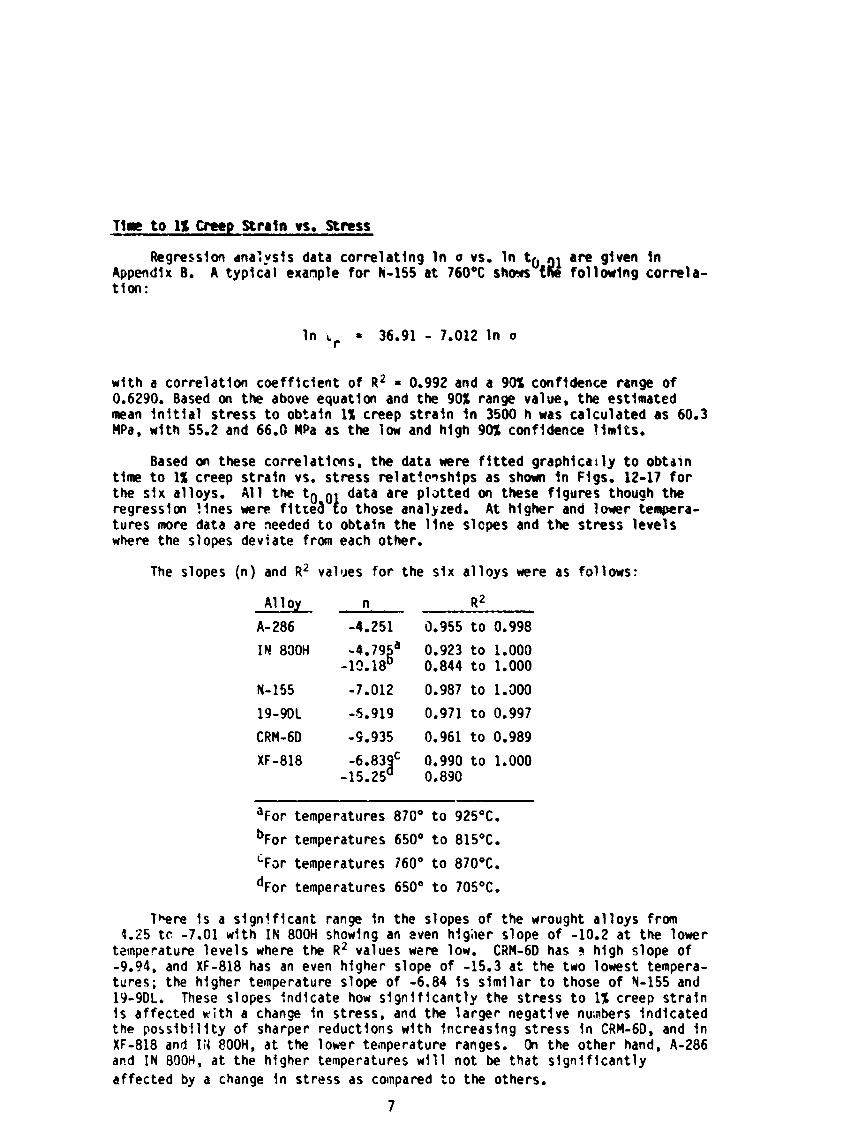
Regression dna:vsIs data co r re la t i ng I n o vs. I n t are given i n Appendix 0. A t y p l c a l example f o r k-155 a t 760°C rhar6ti?l f o l l a l n g c o r n l a - t i an :
w l t h a correlation coe f f l c i en t of R~ = 0.992 and a 90% confldence range o f 0.6290. Based on the above equation and the 90% range value, the estimated mean i n f t l a l s t ress t o obtaln 1% creep s t r a i n I n 3500 h was calculated as 60.3 MPa, w l th 55.2 and 66.0 MPa as the low and hlgh 90% confidence !imits.
Based on these correlat ions, the data were f i t t e d graph lca i l y t o obta in tlme t o 1% creep s t r a l n vs. s t ress r e l a t ? c ~ s h l p s as show I n Flgs. 12-17 f o r the SIX alloys. A l l the t
O O 1 data are p l a t t e d on these f lgures though the regression l i n e s were f i t t e d o those analjzed. A t h igher and lower tempera- tu res more data are needed t o obtain the l l n e slopes and the s t ress l eve l s where the slopes deviate from each other.
The slopes (n) and R2 values f o r the s i x a l l o y s were as fol lows:
A1 l oy n R 2
A- 286 -4.251 0.955t00.998
or temperatures 870° t o 925OC.
b ~ o r temperatures 650' t o 815OC.
' ~ a r temperatures 160' t o 870°C.
d ~ o r temperatures 650' t o 70S°C.
There I s a slgn!f lcant range I n the slopes of the wrought a l l o y s from 4.25 t c -7.01 w i th I N 800H showing an men h f g i ~ e r slope o f -10.2 a t the lower
temperature l eve l s where the R~ values wem low. CRM-6D has 3 hlgh slope o f -9.94, and XF-818 has an even higher slope of -15.3 a t the two lowest tempera- tures; the higher temperature slope of -6.84 I s s lm f la r t o those o f Y-155 and 19-9DL. These slopes fndicate how s l g n l f l c a n t l y the st ress t o 1% creep s t r a i n I s affected w i th a change I n stress, and the l a rge r negative nu;nbers Indicated the poss lb l l l t y of sharper reducttons w l th fncreaslng st ress i n CRM-60, and I n XF-818 and Ii4 800H, a t the lower teinperaturr ranges. On the other hand, A-286 and I N 800H, a t the higher temperatures w l l l no t be tha t s l g n l f l c a n t l y af fected by a change i n stress as compared t o the others.
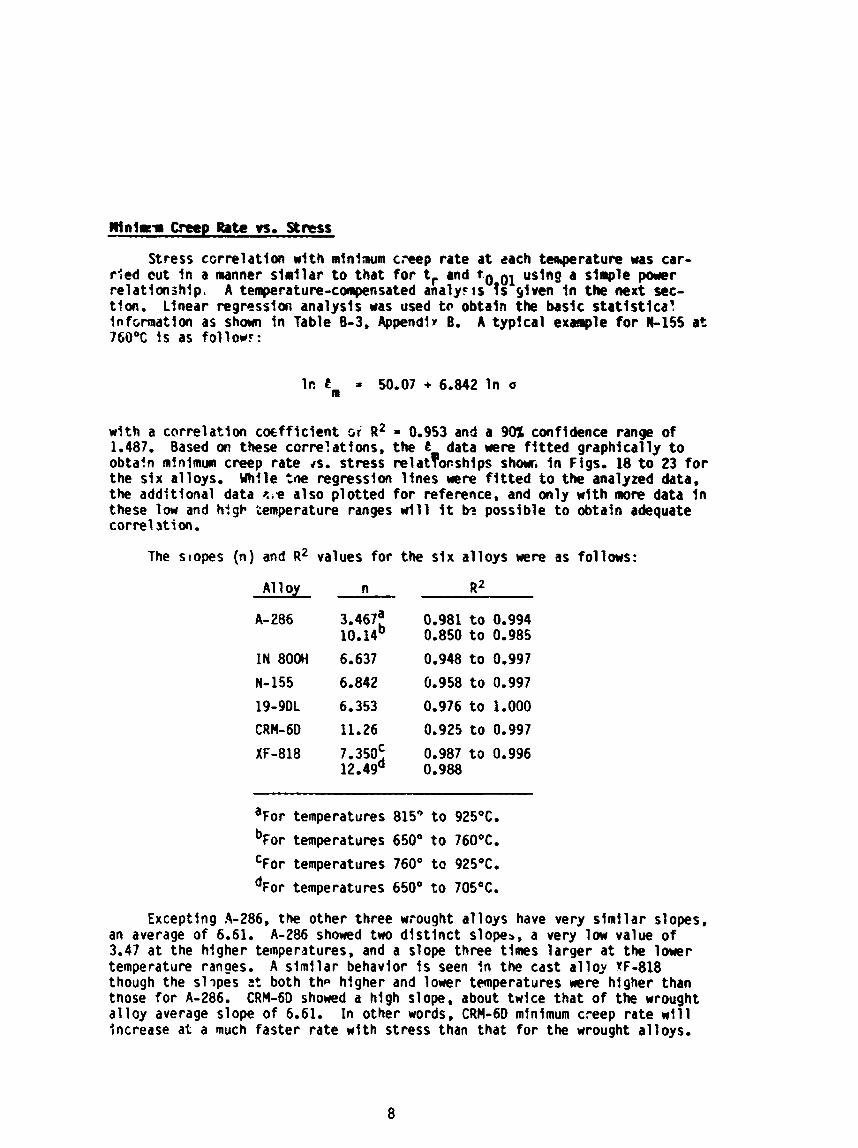
mnlrn Creep Rate vs. %=st
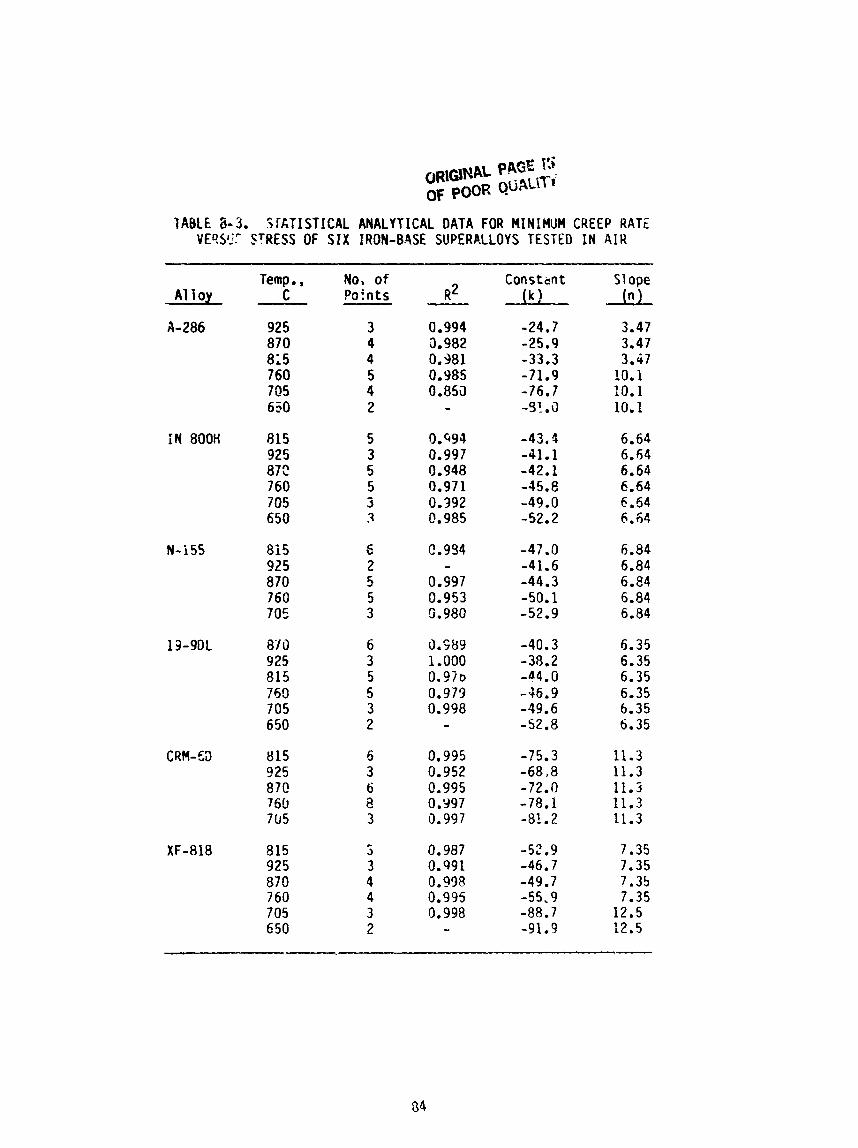
Stress correlat ion wi th miniaum c.eep ra te a t each tengerature was car- r ted cut I n a manner s imi lar t o that for t, and ol using a simple power re lat ionship, A temperature-conpensated ana lyc~s f s given i n the next sec- tfon. Linear regressfar( analysis was used t s obtain the basic s t a t i s t i c a l infcrmation as shown i n Table 0-3, Appendl* B. A typ!cal exwple f o r N-155 a t 760°C i s as f o l l w ~ :
w i th a carrelat ton c w f f i c f e n t 51 R~ = 0.953 and a 90% confidence range o f 1.487. Based on these corre!ations, the € data were f i t t e d graphical ly t o obta!n mfnimun creep rate 4s. stress r e l a t h s h i p s s h m i n Figs. 18 t o 23 f o r the s i x alloys. While tne regression l i nes were f i t t e d t o the analyzed data, the additional data <.e also p lo t ted f o r reference, and only with more data I n these l w and high gemperature ranges w i l l i t k possible t o obtain adequate cor re l s t f on.
The slopes (n) and R~ values fo r the s i x a l loys were as follows:
a ~ o r temperatures 815" t o 92S°C.
b ~ ~ r temperatures 650' t o 760°C.
or temperatures 760' t o 925OC.
d ~ o r temperatures 650' t o 705OC.
Excepting .4-286, the other three wrought a l loys have very s imi lar slopes, an average of 6.61. A-286 showed two d l s t l n c t slopes, a very low value o f 3.47 a t the higher temperatures, and a slope three times larger a t the lower temperature ranges. A s imi lar behavlor i s seen i n the cast a l l02 YF-818 though the sl?pes ~t both the higher and lower temperatures were hfgher than tnose f o r A-286. CRM-6D showed a high slope, about twice that of the wrought a1 loy average slope of 6.61. In other words, CRM-6D minimum cfeep rate w i l l Increase at a much faster rate wi th stress than that f o r the wrought alloys.
Iln n value of about 7 i s noted i n the three wrought a l loys IN 800H, N-155, and 19-9DL and i n XF-ei8 between 760° and 925OC. A h i gher value of about i l i s noted i n CRM-63, XF-818, and A-386 (low temperatures only).
b n y s w i e ~ i r i c a l I n vs. o relat ionships have been Eevelopd, and an equation w i th n = 7.5 has been related t o d i s l ~ ~ a t f o t l cl imb ( l a t t l c e df f fust tm c ~ n t r o l ) . ~ An ::I value of 9.5 has been related t o d is locat ion climb (core d i f fus ion c ~ ~ t r o l ) . ~ Higher a values up t o 40 have been reported i n many alloys. The value o f n = 7 observed !n these tests appears t o tsdlcate tha t the assmption o f d f s l oca t im c!inb/glfde mechanisms made e a r l i e r i s baslcal ly val!d.
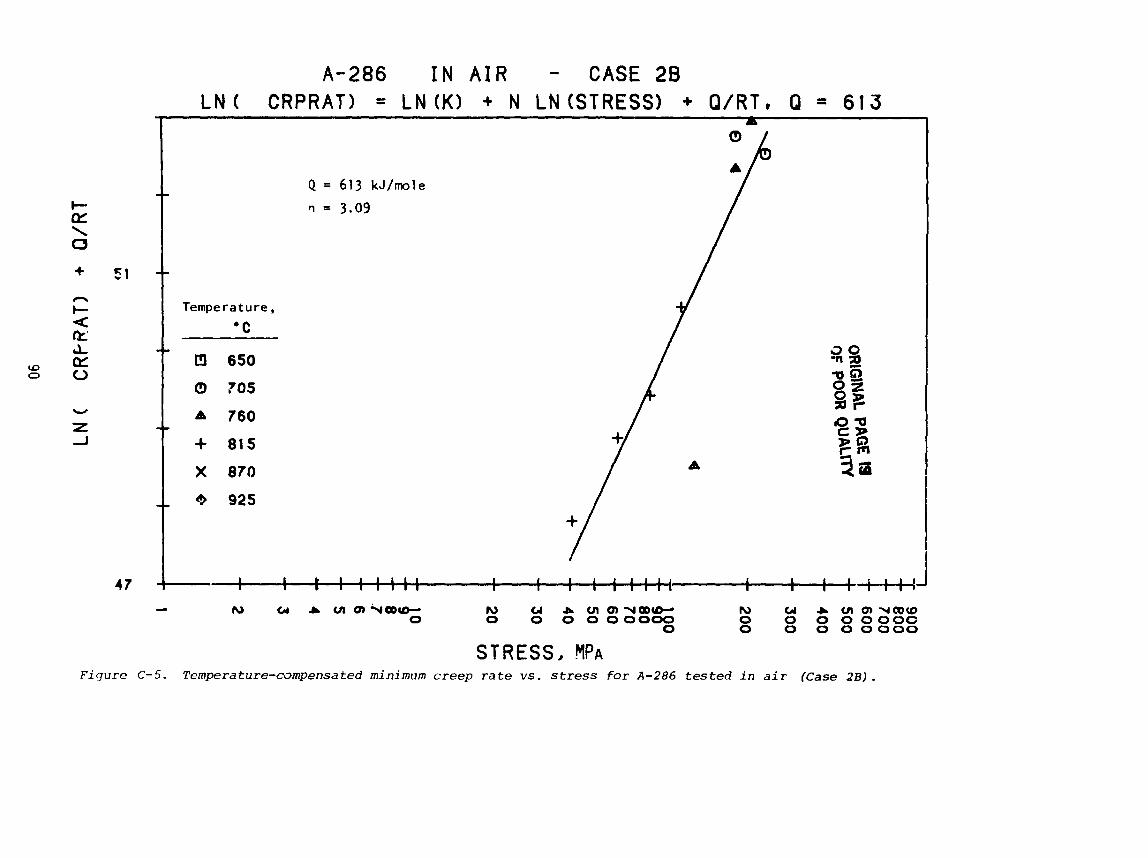
I n A-286, a t t+e higher temperatcres of 815" t o 92S°C, the slope I s smaller wi th an n value o f 3.47. A value o f 'I = 3 i s consfderet representa- t i v e of viscous g l ide b e h a ~ i o r . ~ A? loy A-286 was aged a t 720°C, and i t i s expected thet any age-hardening e f f ec t present !n the structure w l l l be l o s t i n the 81S0 t o 92S°C tes t range. Thus, the material w i l l behave as an over- aged a l loy wi th no appreciable dfspersed phases such as carbides and borfdes, because C was m l y 0.95% and 8, 0.003%. It i s not altogether surprising, the-fore. that A-286 at t h i s high temperature gave a lower value of n = 3.47.
Because o f lack o f adequate data, the n value o f the lower temperature/ nigher stress range cannot be properly evaluated. Rut the observed tendency o f increasing n a t lower temperature and higher stresses i s co?sistent w i th reported 1 i te ra tu re data. Thus, wi th the exception of A-286, i n the other a l loys the stress dependence o f minimum creep rate I s excep t iwa l l y large, about 2 t o 3 times the value a t the hjgher temperature/lower stress ranges.
T e q e r a t u m - C q s a t e d k ra l ys i s fo r Activat ion Energy and Stress Expanent
O f the many d i f fe ren t ~ n e t h o d s ( ~ - ~ ~ ) o f analysis o f creep-rupture param- eters tak izy !nto r,ons!deration both stress and temperature i n a combired form, the &&an-Sherby-Dorr, (OSD) method was selected for 8nalyzfng the data and obtaining the activation energfes f o r the creep-rupture parameters:
where Y = I n em, I n tr or I n
Q = the act fvat ion energy
a = the i n i t f a 1 stress
T = the tes t temperature, %
R = the unfversal gas cons ta~ t , 8.314 J/K mol
I n k 3nd n are constants t o be detennjned.
Equation 1 can be rearranged I n the fol lowlng manner:
U l t h t h i s rearrangement, a l i n e a r regression analysis of ( v - 3/RT) vs. I n a w i l i determine Q, the a s t i v a t i m enerw, and the slope of the f i t t e d l i ne , n, which i s the st ress slope tased on the power r e l a t i m s h f p.
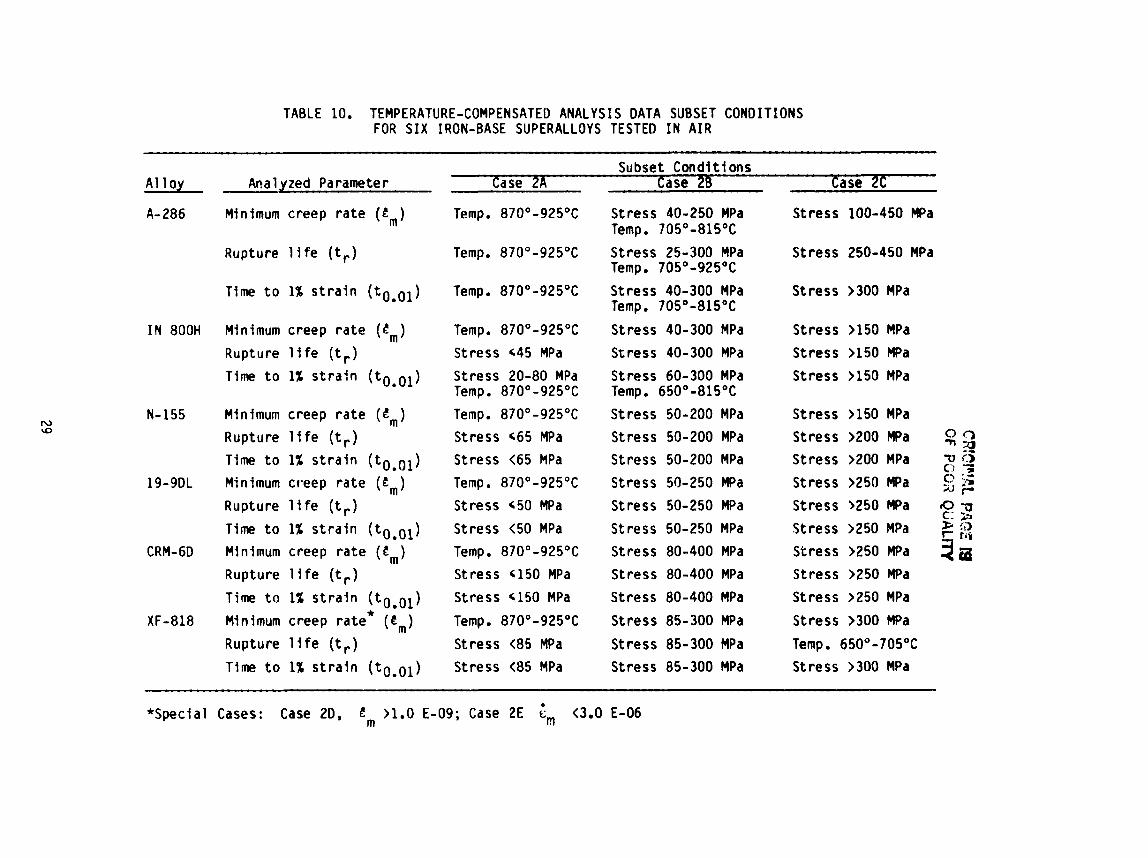
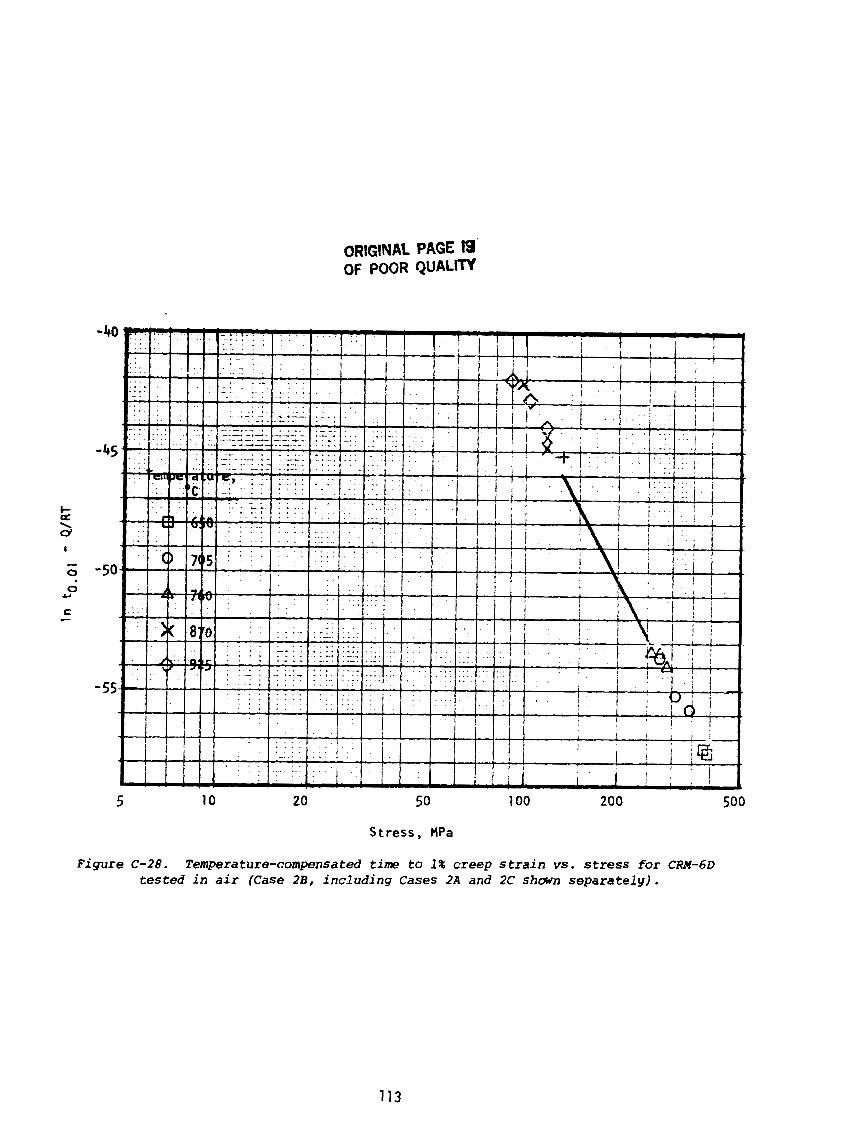
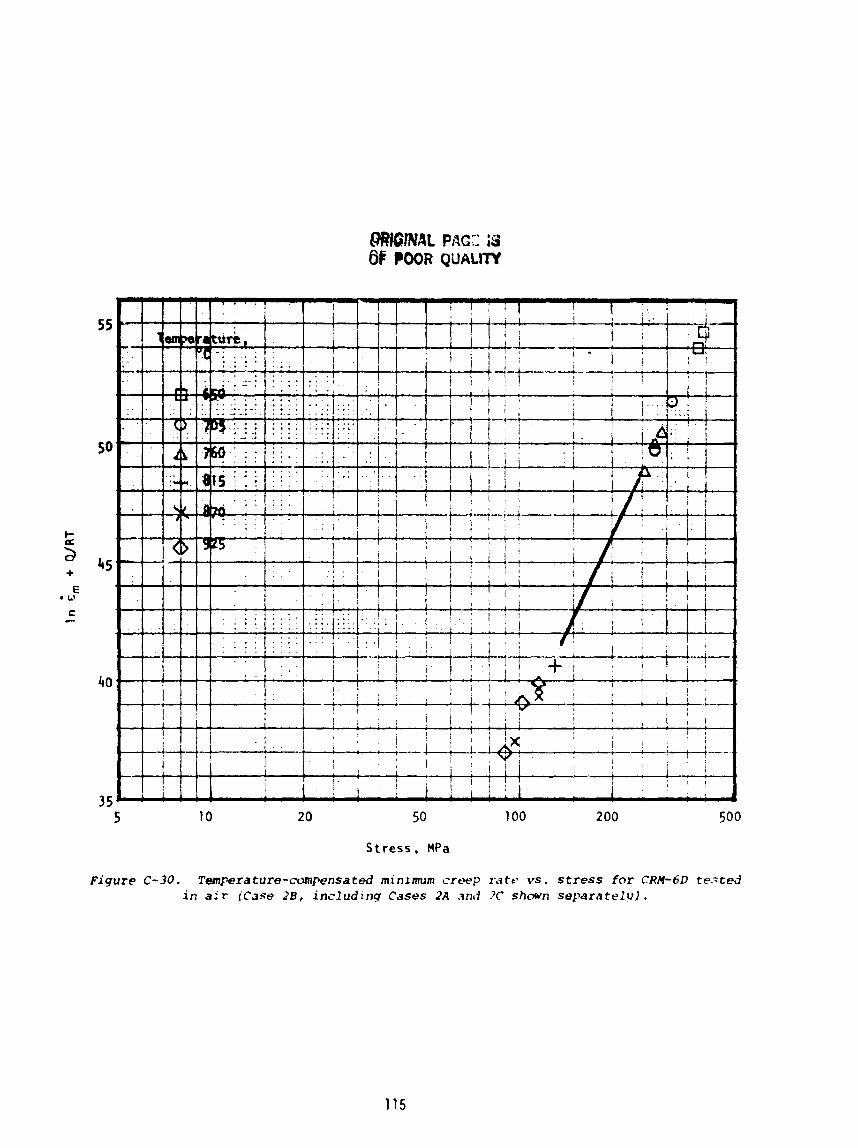
I n order t o p e r f o m t h i s analysis, tk p r i c r d i r e c t co?relat;onal analy- s i s was made use o f t o c l a s s i r y the data i n t o sui tabre subsets, a' stven i n Table 10. Al: the data were d i v ~ d e d i n t o 3 ca5es i2A, 28, and 2C) where Case iu contains the la rgest s*t o f data, whj le Ccses 2A and X are l i m i t e d i n data, and f a l l i n the extreme ranges of temperatures and/or stresses, occa- s iona l l y overlapping Case 28 data. Case 28 data were z2alyzsd s t a t i s t i c a l l y and graph ica l ly p l o t t e d u s i r q Equation 2, and data from Cases 2A and 2C were p l o t t e d on the f igures t o >,;on the extent o f dev;ation a t the higher tempera- tures and st ress levels.
For XF-818, two addi t ional cases fo r tm uere a lso analyzed containing a l a r ~ r co l l ec t i on o f data and these w r e
Case 20: Em > 1.0 E-09 s'l (23 data)
Case 2E: t, < 3.0 E-06 s-' (21 data)
w i t h the bulk of the data conmon i n both cases. The reason f o r considerin Case 20 was t h a t c r w p ra te measurements less than or equal t o 1.0 E-09 s - P would have uncer ta in t ies associated w i th them unless tes ts uere conducted over very long periods o f time. Case 2E was considered because f, greater than o r equal t o 3.0 E-06 s-' approached over1 oadltens! l e type f a i 1 u k associ ated w i t h very high stresses and very short rupture l i v e s o f a few hours.
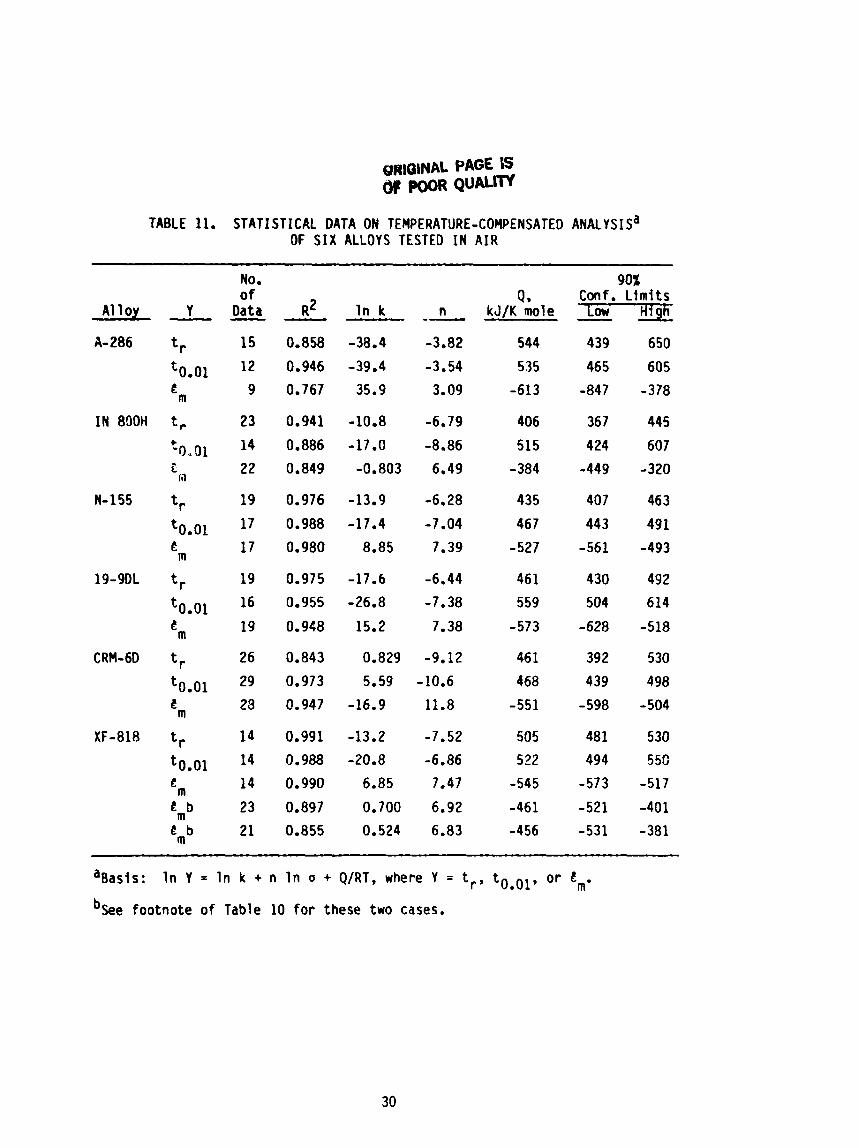
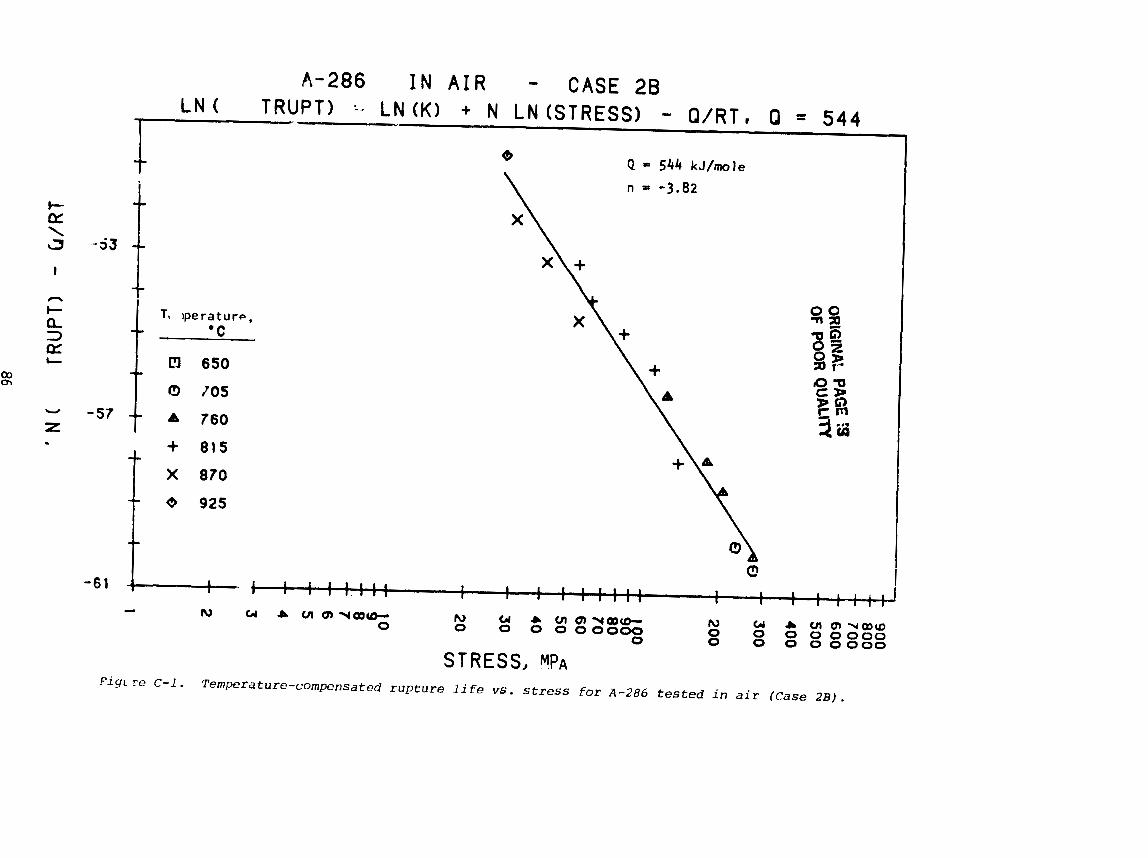
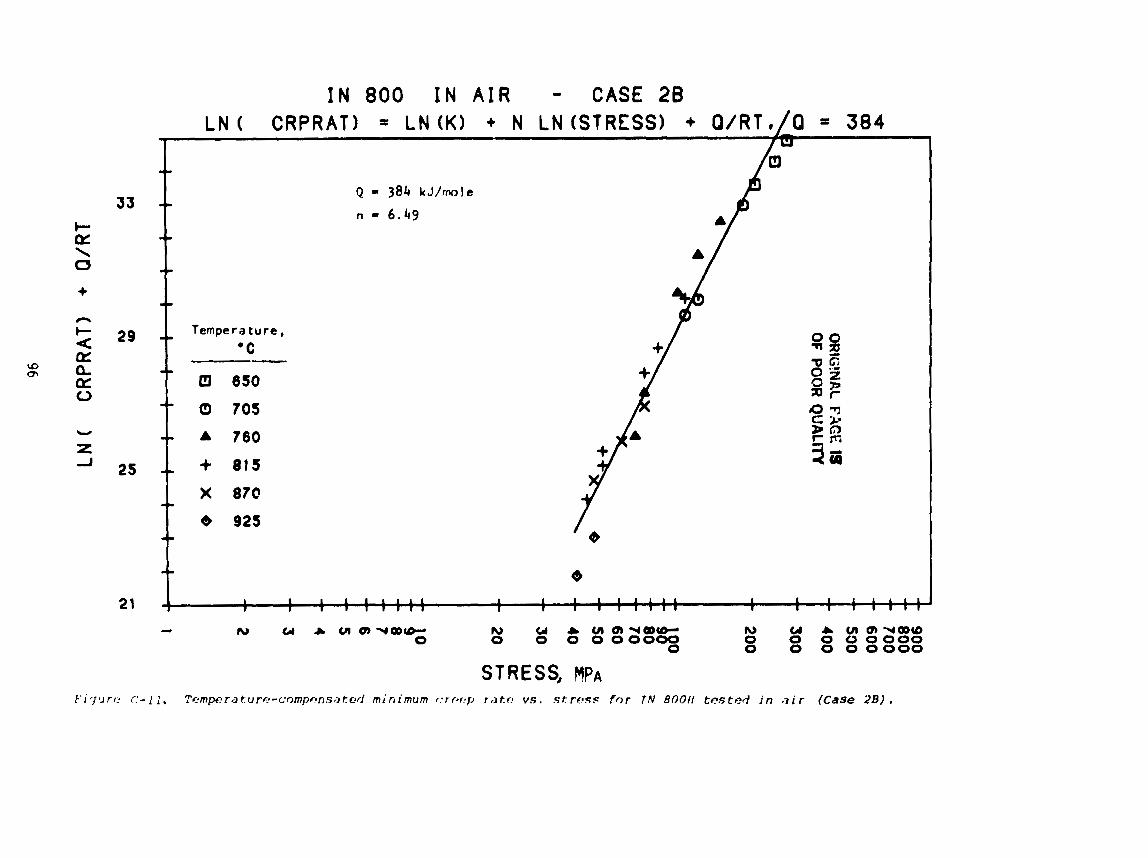
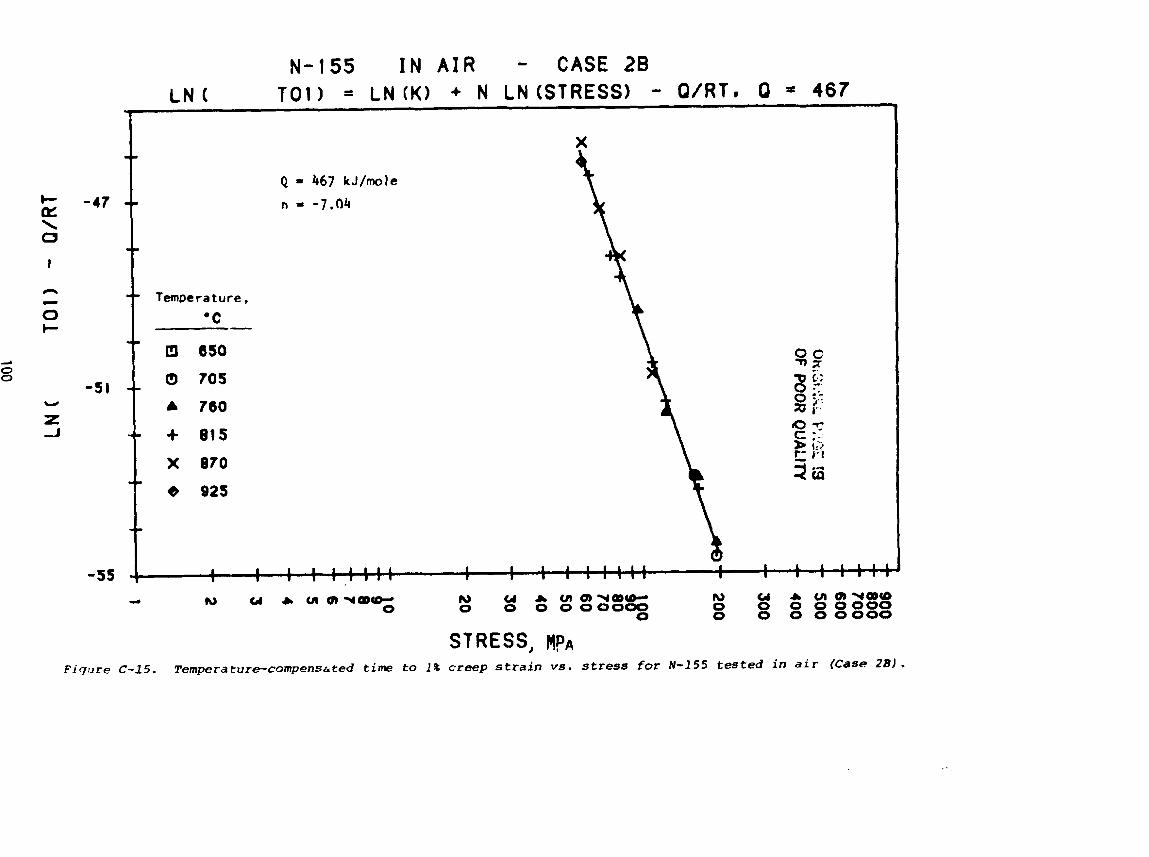
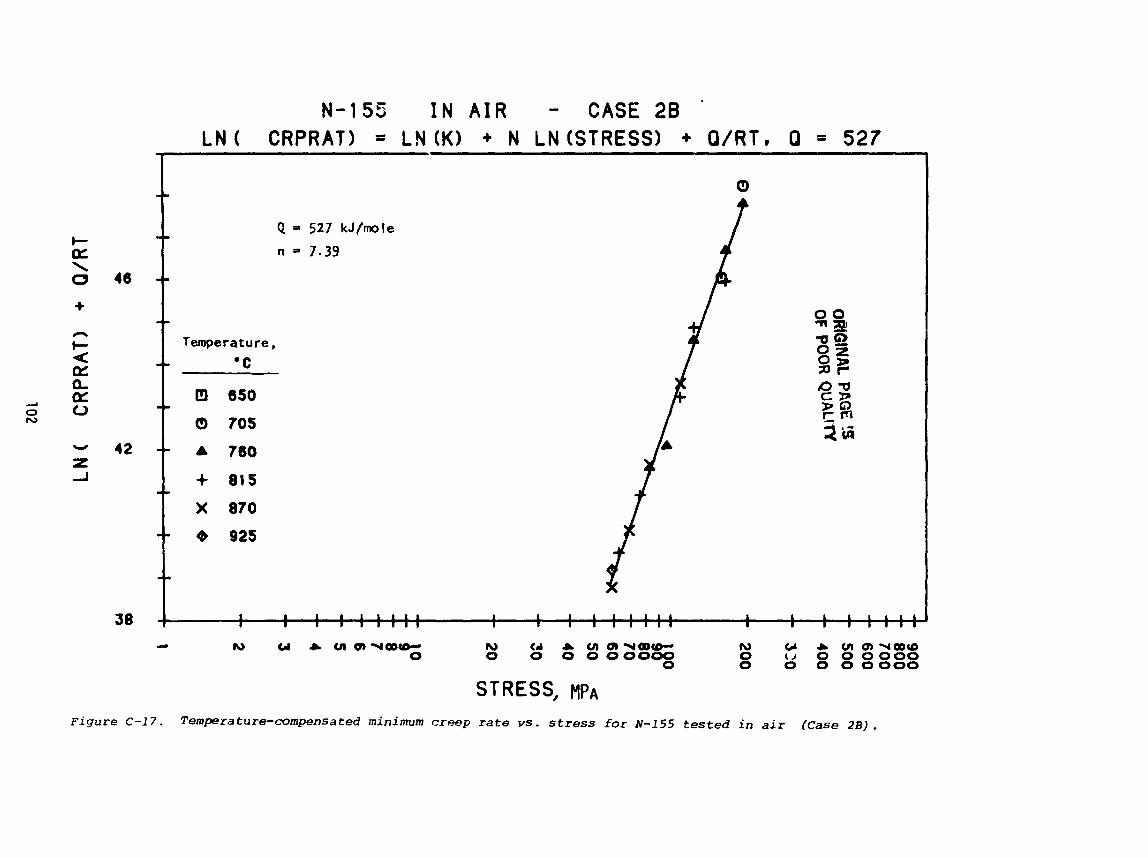
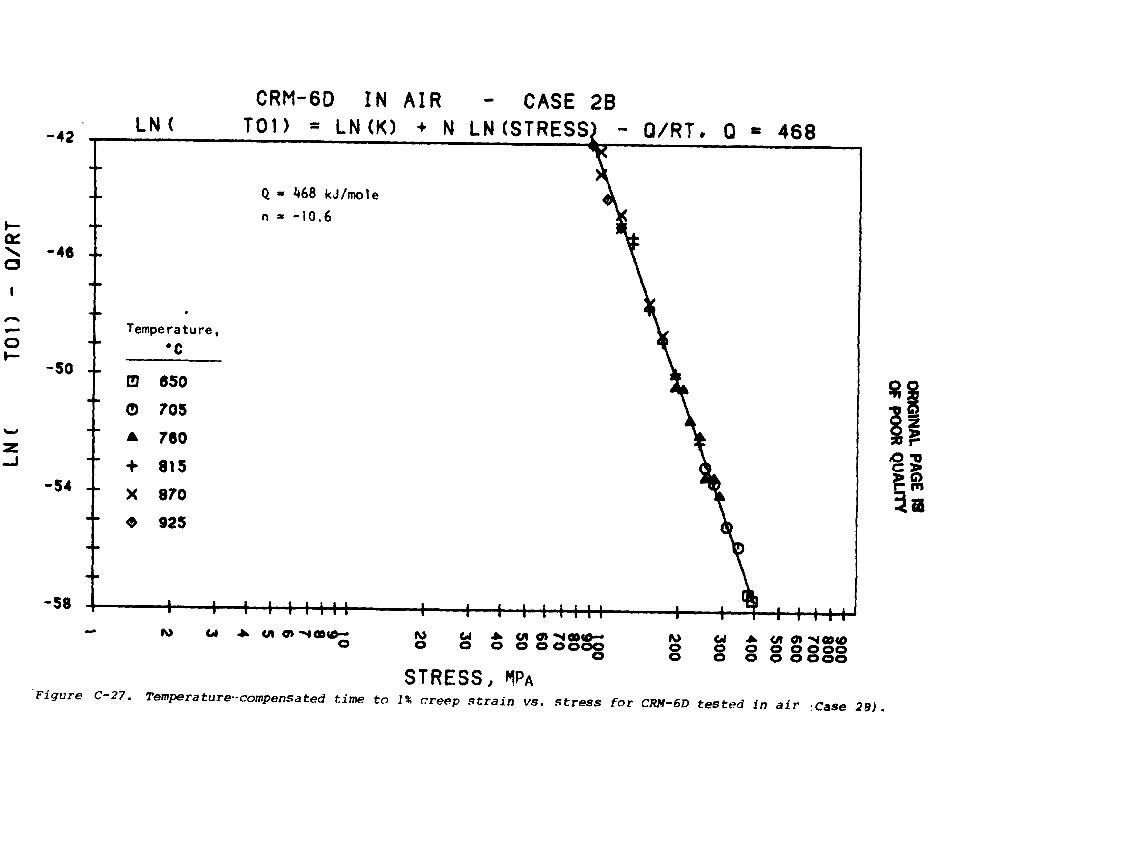
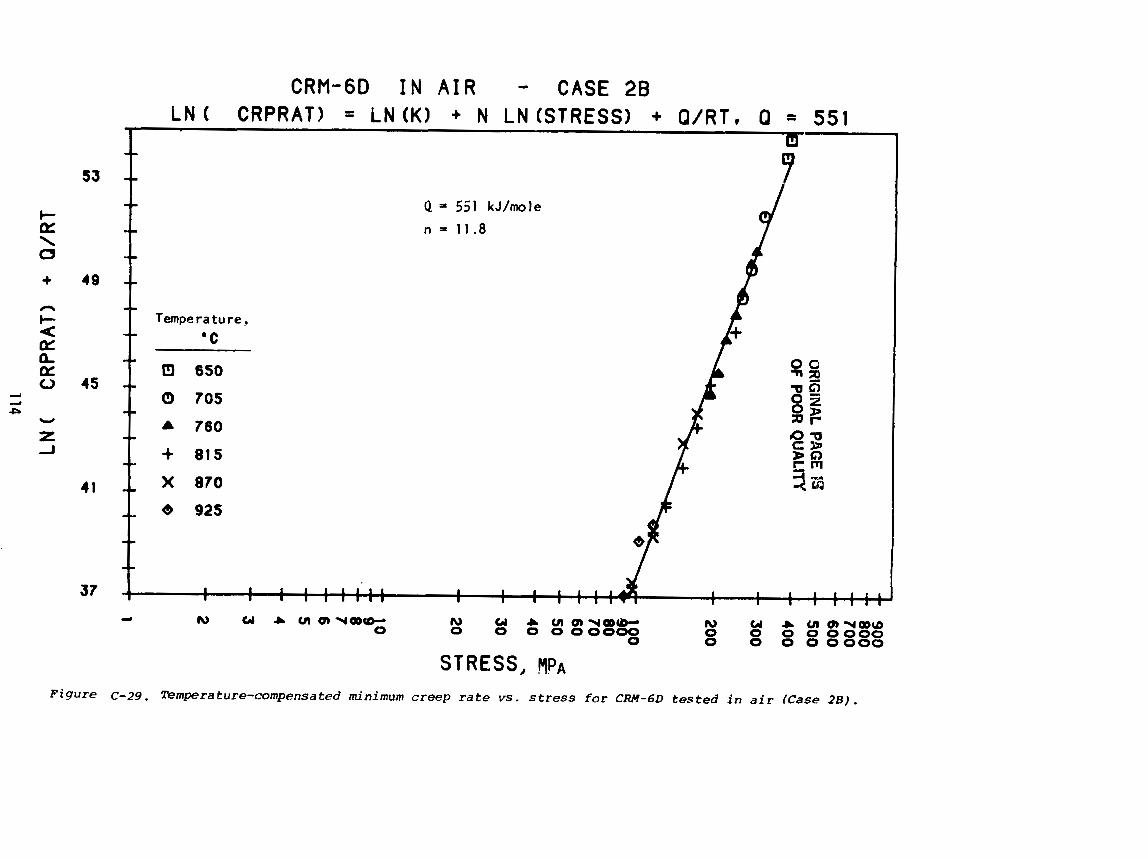
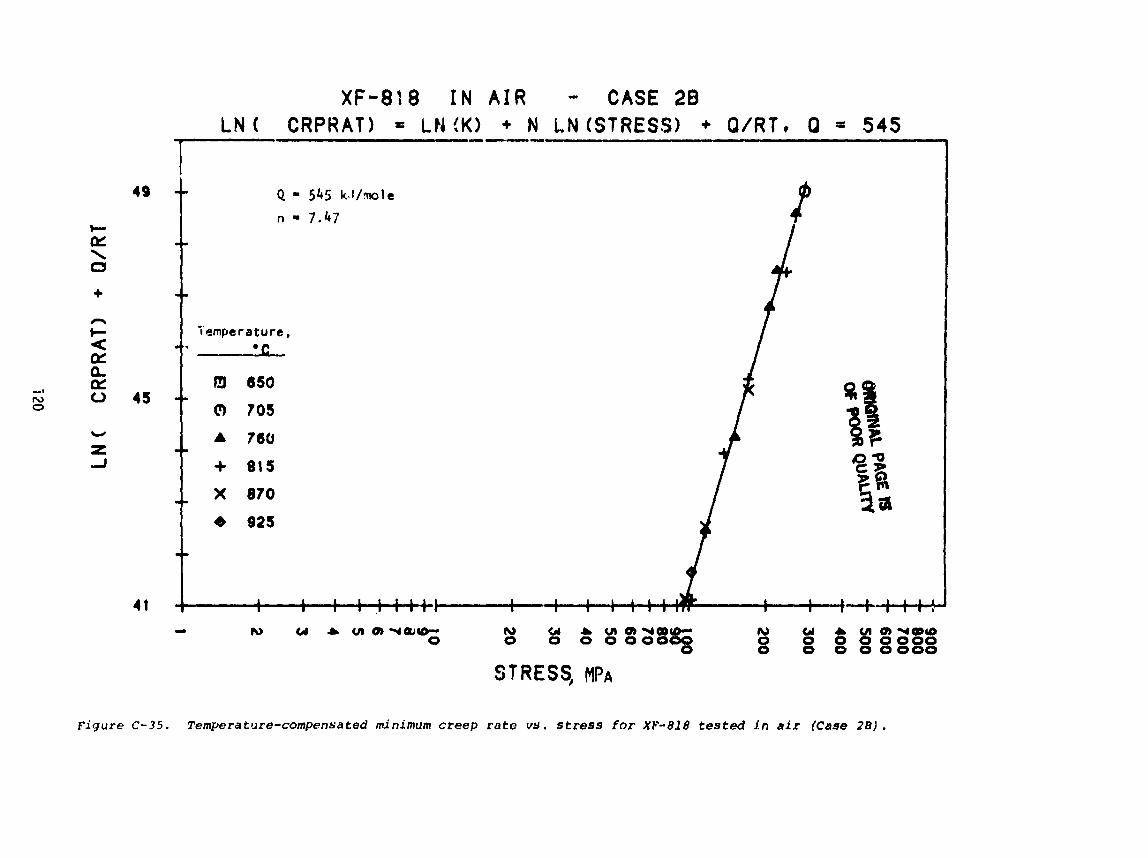
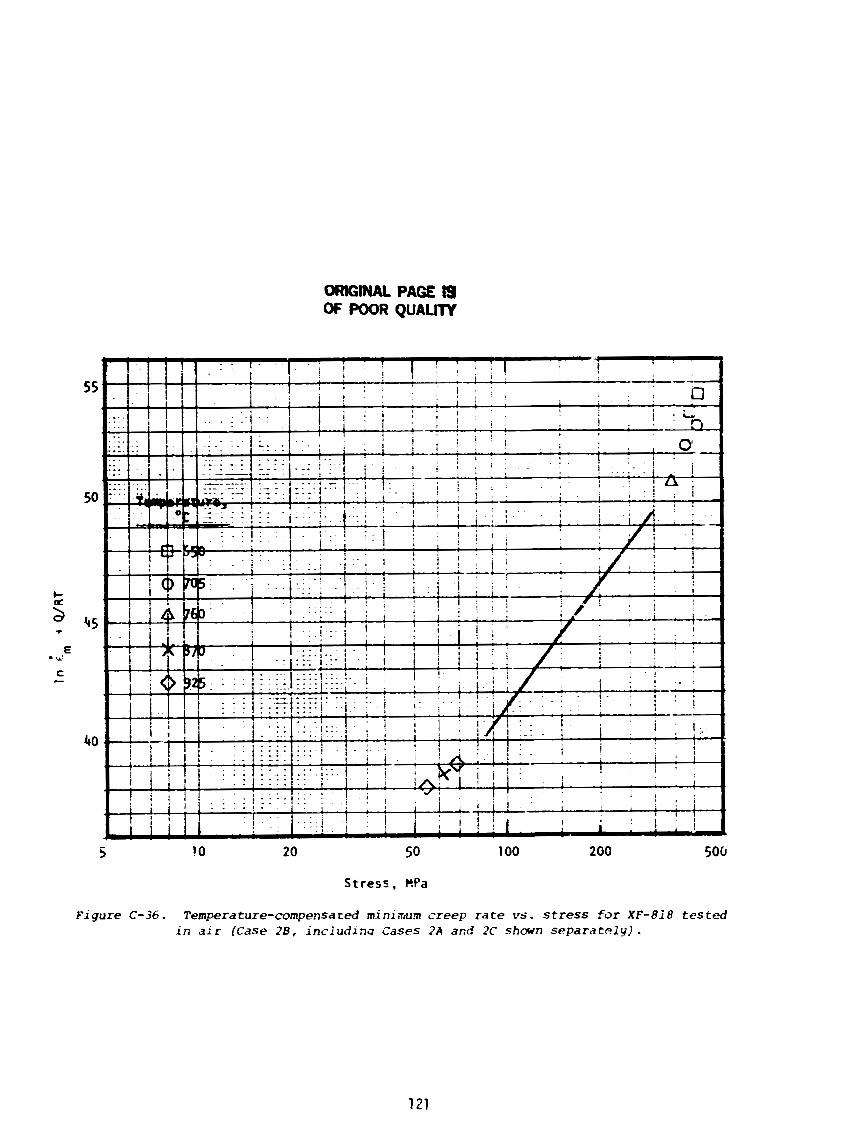
A l l the basic ana ly t ica l s t a t i s t i c a l parameters f o r Case 28 only are given i n Table 11. Based on these analyses, graphical cor re la t ions of the data are shown i n Figs. C - 1 t o C-36, i n Appendix C. For two selected a l loys, N-155 and XF-818, the associated graph'cal cor re la t ions f o r minimum creep ra te are shorn i n Figs. 24 and 25, respectively.
For the three d i f f e r e n t cases, the creep ra te equations f o r N-155 may be wrStten as follows:
Case 2A I n fm = 15.9 + 7.36 i n o - 593/RT ( 3 )
Case 28 l a Em = 8.85 + 7.39 I n u - 527/RT ( 4 )
The stress slopes are 7.36, 7.39, and 8.80 f o r the three d i f f e ren t sub- sets o f a l l the N-155 data and compare well w i th the slope o f 6.84 obtained e a r l f e r assuming a comnon creep mechanism !n the intermedSate stress range which covers the bulk o f the data and corresponds t o Case 26 of t h ? s analysjs.
For XF-818, t he f i v e d i f f e r e n t cases w y be w r i t t e n as:
Case 2A I n = 12.8 + 6.44 I n c - 554/RT ( 6 )
Case 20 in Cm = 6.85 + 7.47 l q :; - 545/RT ( 7 )
Case 20 I n Em = 0.70U + 6.42 I n o - 461/5T (9 )
Case 2E I n Z m = 0.524 + 6.83 I n o - 456/RT (10)
Except fo. Case 2C ( f o r a > 300 MPa, a t 650" and 705OC). t he average slope i s 6.92 and compares w e l l w i t h t he s imp le r e a r l i e r ana lys is which gave a value o f 7.35. The h lg9er value o f 12.6 f o r case 2C j s a l so s imi j a r t o the ear ! ier value of 12.5 f o r s i m f l a r subset condi t ions.
The extreme temperature and s t r ess i eve l data (Cases 2A and 2C) are p l o t t e d on TSgs. 24 and 25 (based i n Equations 4 and 7, r espec t i ve l y ) t o i n d f c a t e t he t r end in c o r r e l a t i o n a t these extreme leve ls .
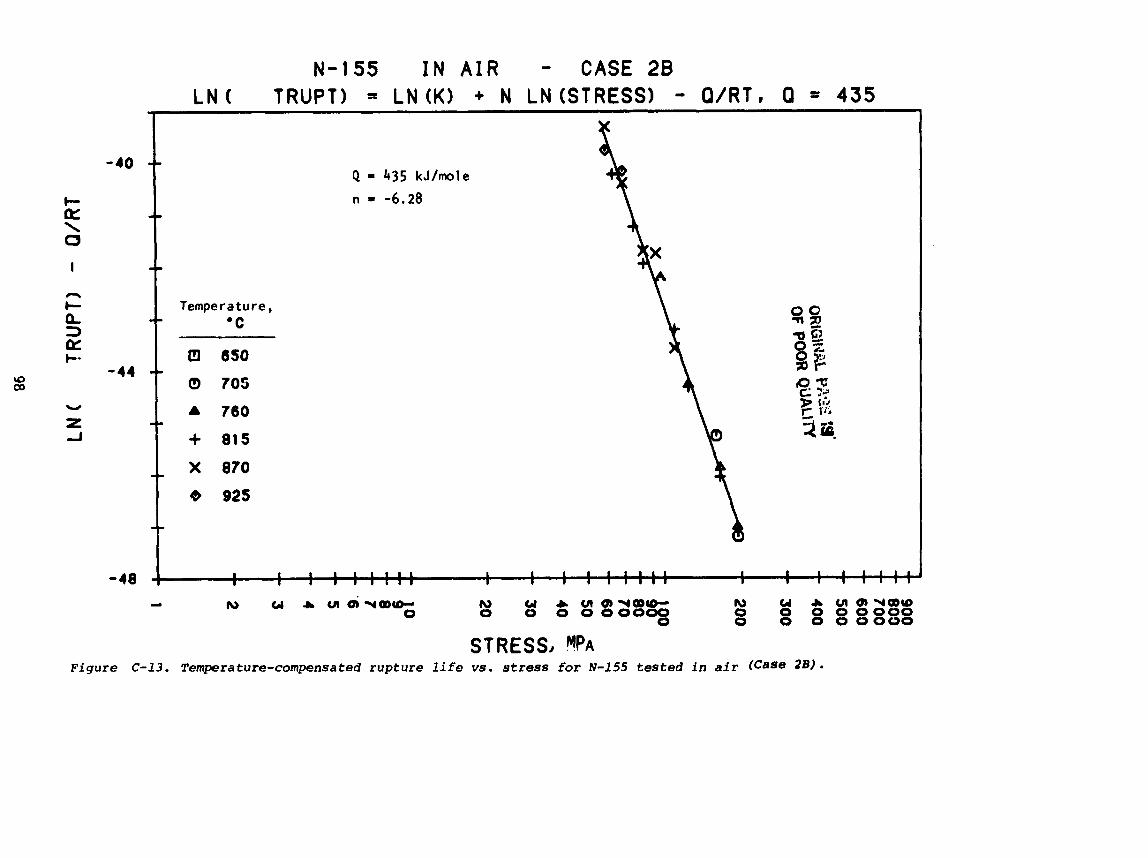
The a n a l y t i c a l data f o r temperature-compensated ana lys is f o r tr and tg Ol (Case 28) are a l s o given i n Table 11. GraphEcal c o r r e l a t i o n s o f rup tu re 1:fe and t ime t o 1% creep s t r a i n data f c r N-155 and XF-818 fc,. Case 28 are given i n Figs. 26 t o 29, where the data f o r Caes 2 A and 2C are p l o t t e d t o i n d i c a t e the t r end a t the extreme tenperature and s t ress leve ls .
For a l l o y N-i55, the a n ~ l y t ' c a l r e l a t i o n s h i p s f a r tr a ~ d ( f o r Case 26) are as fo l l ows :
The s t r ess slopes o f -6.28 and -7.04 compare we l l w i t h the s t ress slopes o f -6.71 and -7.01 obtalned e a r l i e r .
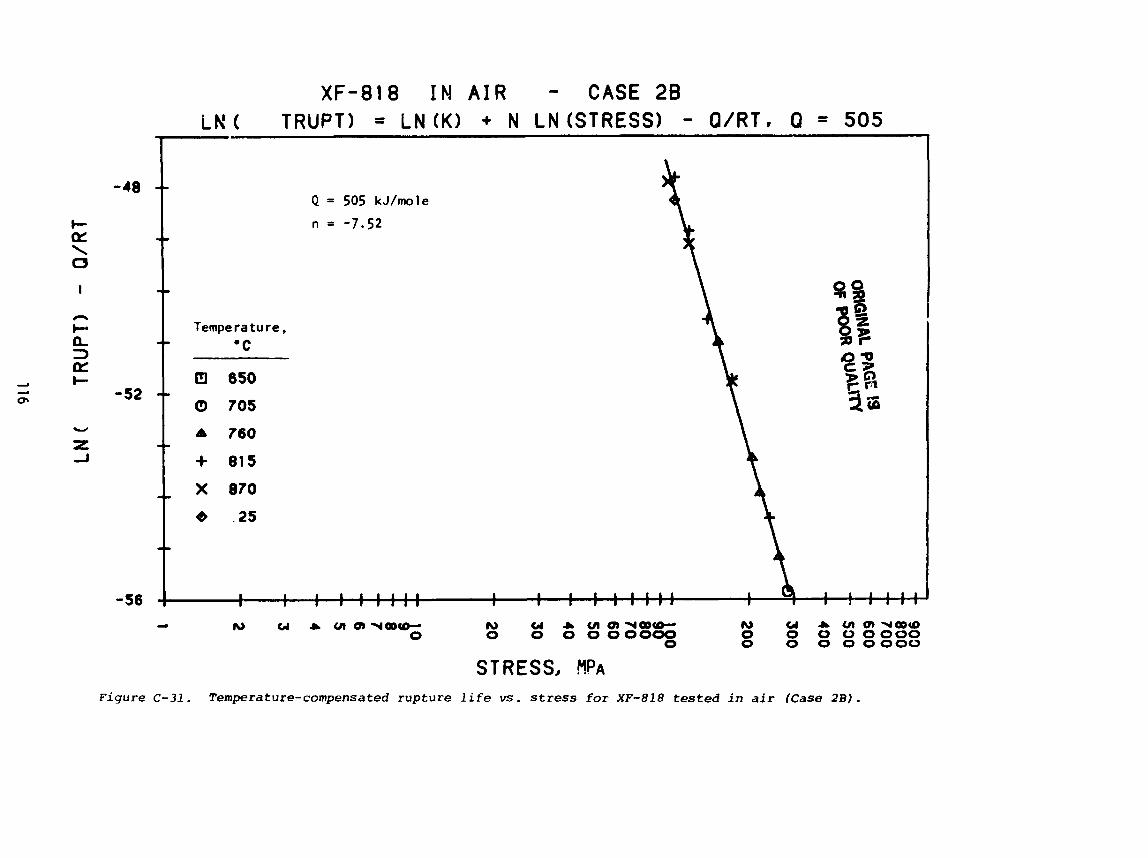
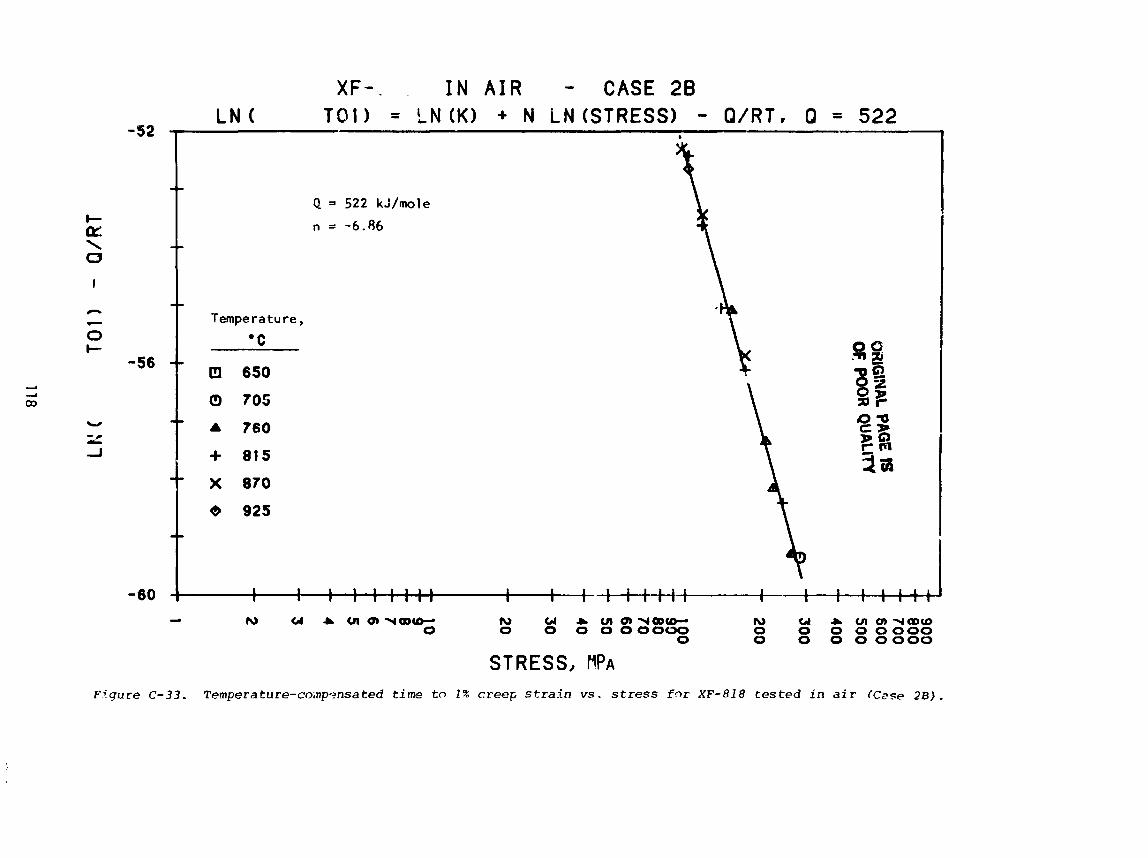
f o r a l l o y XF-818. the ana ly t ' ca l re la t ionsh 'ps f o r t, and ( f o r Case 2R) are as fo l l ows :
Again, the s t ress slopes of -7.52 and -6.86 compare very we l l wft.h the s t ress slopes o f -7.66 and -6.84 obtained e a r l i e r .
For Case 2C i n XF-818, wh'ch deals w'th the lowest temperatures (and very h igh s t resses) , the s t ress slopes observed i n the temperature-compensated analys's were -13.2 and -14.8 f o r t and to . respec t i ve l y ; the correspond- i n g values obtained e a r l i e r were -15.3 f o r 60th tr dnd and a l s o i n d j - ca te good c o r r e l a t i o n w i t h the above data.
Activatitm Energy, Q OF POOR QLIALiT'f
Thc ac t i va t i on ecergies aetemined from th's analysis are a1 so summarized i n Table 11. Out o f 170 data, about 110 data (Case 28) essen t i a l l y f a l l under a s ing le creep mode a t intermediate st ress and temperature levels. Thus, the Q values of Case 2B (Table 11) represent b e t t e r co r re la t i on w i th a higher R~ and a narrower 90% cxtf jdence l i r ~ i l t on tne est inated Q values. The ac t i va t i on energies f o r the d i f f e ren t creep parameters ranged as fol lows:
Lonest Highest
Minimum creep r a t e 384 ( I N 800H) 613 (A-286)
Rupture l i f e 406 (IN 80GH) 544 (A-286)
The much higher Q f o r en f n A-286 merely re f l ec t s the observed large separation i n the 760"-870°C'range i n the E vs. o curves (Fig. 18). S i m i - l a r l y . the low Q f o r C i n I N 800H ind'cate!' the much c loser spacfng observed i n E vs. o curves ( ~ f t . 19) j n the 815O-925OC range. A s i m i l a r explanat ion may k noted f o r the h igh and low 3 values of tr for A-286 and I N 800H. respect ive ly (Figs. 12 and 13).
N i t h the exceptions o f A-286 and I N 800H, the ac t i va t i on energies f o r em of the four other a l l o y s were very s im i l a r :
Q f o r € , kJ/mclg
The average Q o f these four a l l o y s i s 549 kJ/noie, d i f f e r i n g by less than 5% from the ind iv idua l Q values.
S im i l 3 r l y , the ac t i va t i on energies f o r t, f o r these four a l l oys were:
Again, the average Q c f these four a l l oys i s 466 kJ/mole and close t~ the f r ~ d i v i d u a l values.
The ac t i va t i on energj f o r time t o rupture i s less than tha t governing the creep phenomenon. Simi lar observz,tior!s may be noted from Q values det2rmined i n other s tud iesO2 The d i f ference i n these two Q values may be re la ted t o the addf t ional considerations o f primary and t e r t i a r y creep stages i n t4e case ~f
rupture when compared s t r i c t l y t o the secondary creep phenomenon !n the case of minimum creep rate.
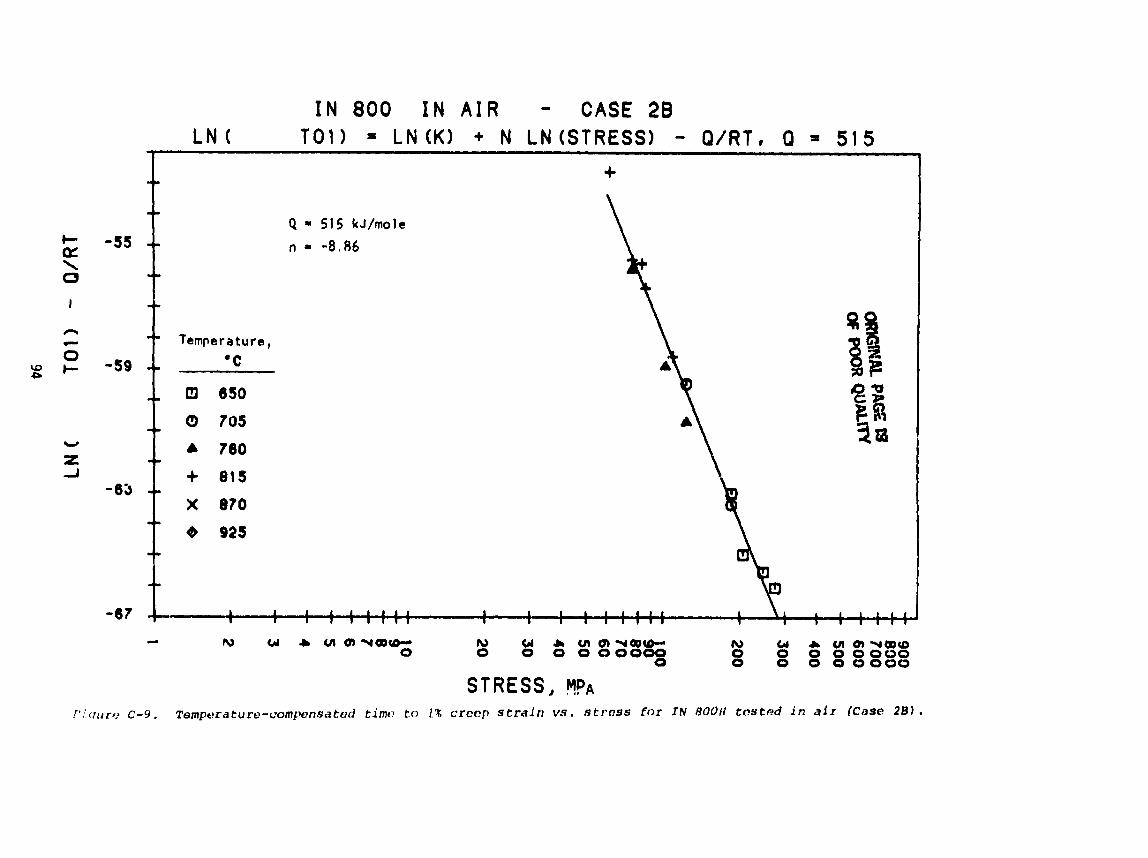
The a c t i v a t i w energv f o r time t o 1% creep s t r a i n (tOmOl) has a f a i r l y narrow range (Case 28) letween the s i x al!dys w i th an average o f 511 kJ/mole and a range of 467 t o 553 kJ/mole. As expected, the average Q for s t ress t o 1% creep s t r a i n f s h igher than tha t f o r t and less than t , because the average Q f o r to i s on ly affected by t&e primary creep Tondftions preceding i t s reaching them!4 creep s t r a i n whi le i n the secondary creep mode.
The 90% confidence l i m i t s vary between a l l o y s and between the three d i f f e ren t parameters and are a l so s i g n i f i c a n t l y a f fec ted by the amount o f data av8i lable. For Case 28 analyses, wf th between 12 and 28 data po in ts f o r each of the three parameters, the 90% confidence l i m i t s are usual ly wel l w i th in tlOX of the estimated mean Q values f o r € and tr, and occasional ly scmewhat more for to analysis. The major deviar ions were noted i n A-286 ~d IN 800H and the lea:? i n the two cast a l loys, CRM-6D and XF-818.
Predicted Stmsses for Rupture and 1% Creep in 3500 Hours
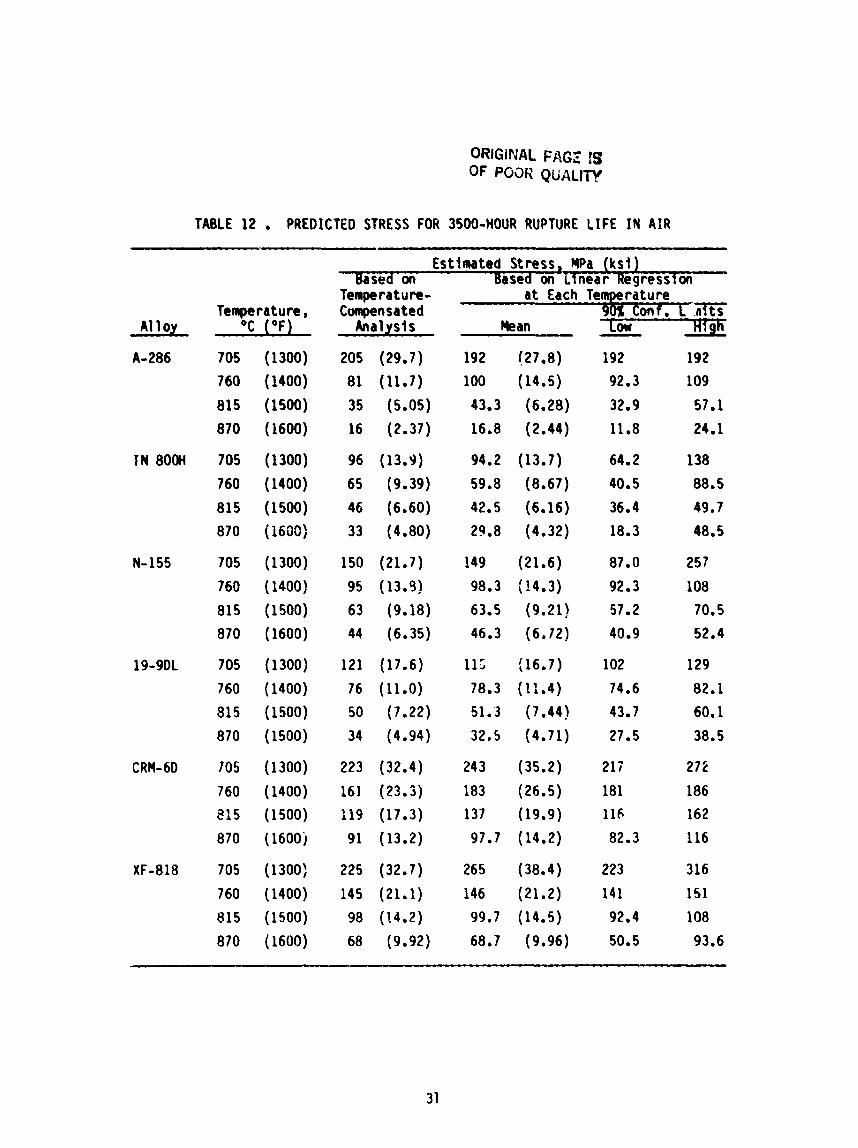
Based on the temperature-compensated ana ly t i ca l regression data given i n Table 11, stresses f o r 3500-h rupture l i v e s were estimated and are given i n Table 12. Along w i t h these data, the 3500-h rupture l i f e stresses estimated from l i n e a r regression a t i nd i v idua l temperatures ( inc lud ing 90% confidence l eve l s ) are a lso tzbulated. I n p r a c t i c a l l y a l l cases, the two estimated mean stresses are w i th in 210% cf t h e i r mean values Ind fca t i ng the r e l i a b i l i t y o f the data and the p red i c t f ve ana ly t i ca l techniques used t o determine the e s t i - mated stresses.
The 3500-h estjmated rupture stresses based on temperature-compeniated analys is were f i t t e d w i t h regression l i n e s as a funct ion o f inverse absolute tempera t~res , as shown i n F!g. 30. The MOD 1 and Reference Enqtne operation temperatures o f 770' and 87!I0c,l respect ive ly , are shown as v e r t i c a l l i n e s on Fig. 30. A t the Mod l Engine temperature, IN 800H, A-286, and 19-9DL are con- sidered inadequate t o meet the requirements o f the engine operat ing s t ress l eve l .' The two cast a1 loys, CRM-6D and XF-818, as w l l as the wrought a1 loy, N-155, have adequate st rength for MOD 1 engine service. A t the higher operat- i n g temperature :f 870°C fo r the Reference Engine, a l l o y A-286 st rength i s qu i te inadequate and IN 800H and 19-9DL *come marginal a t the design st ress l eve l o f 28 H P ~ . ~ Wrcught a l l o y N-155 reta ined the best s t rength proper t ies, whereas cast a l l o y CRM-60 remained twice as strong as N-155 a t 870°C.
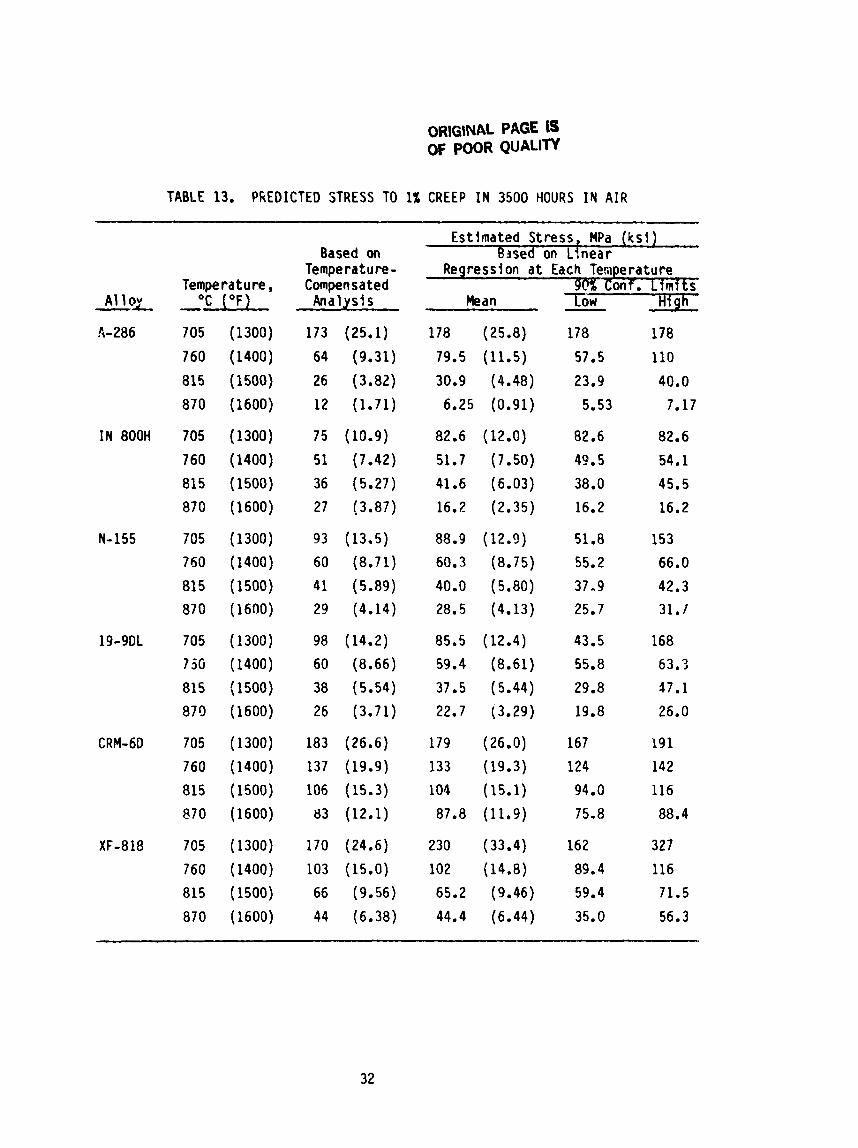
Table 13 summarizes the predic ted stresses t o 1% creep s t r a i n i n 3500 h based on temperature-compensated znalysls. Along w i th these data, estimated st ress l eve l s t o 1% creep s t r a i n i n 3500 h based on regression analysis a t i nd i v idua l temperatures are a lso tabulated w i t h t h e i r 90% confidence levels . The d i f ferences between these two estimates are wel l w i th in f l O % o f the mean estimated values, except f o r a l l o y s A-286 and I N 300H.
Fractography and mcrostructural h a l y s i s
Fracture Locat ion n d Appearance
A1 1 the specimen f rac tures were c a r e f u l l y examined and f rac tu re loca t ions i den t i f i ed . I n the two cast a l loys, w i t h one exception, a l l the f rac tures were located well w i t h i n the reduced p a r a l l e l section. I n the wrought a l loys, A-286 had 8 specimens where the f rac tures were located beymd the p a r a l l e l section, though i n a l l cases very close t o the end o f the section. F ive o r s i x specimens showed s i m i l a r f rac tu re loca t ions i n IN 800H, N-155, and 19-9DL.
I n genera1, a t the lower tentperatures m u l t i p l e f i n e cracking near the f rac tu re region was minimal. L igh t t o heavy m u l t i p l e cracking appeared a t 760°C and higher.
b l y small degrees of l oca l i zed area reduct ion were noted w i th most wrought specimens, i n d i c a t i n g uniform extension, I n the cast a l loys, a s imi- l a r pat tern was -1so cbserved w i t h a strong e f fec t o f s t ress l eve l and t ime t o rupture a f f e c t i n g the degree o f necking. A t the higher temperatures o f 870" and 925OC, XF-818 specimens showed more necking than CRM-60 specimens w i th reduct ion i n area as h igh as 48%.
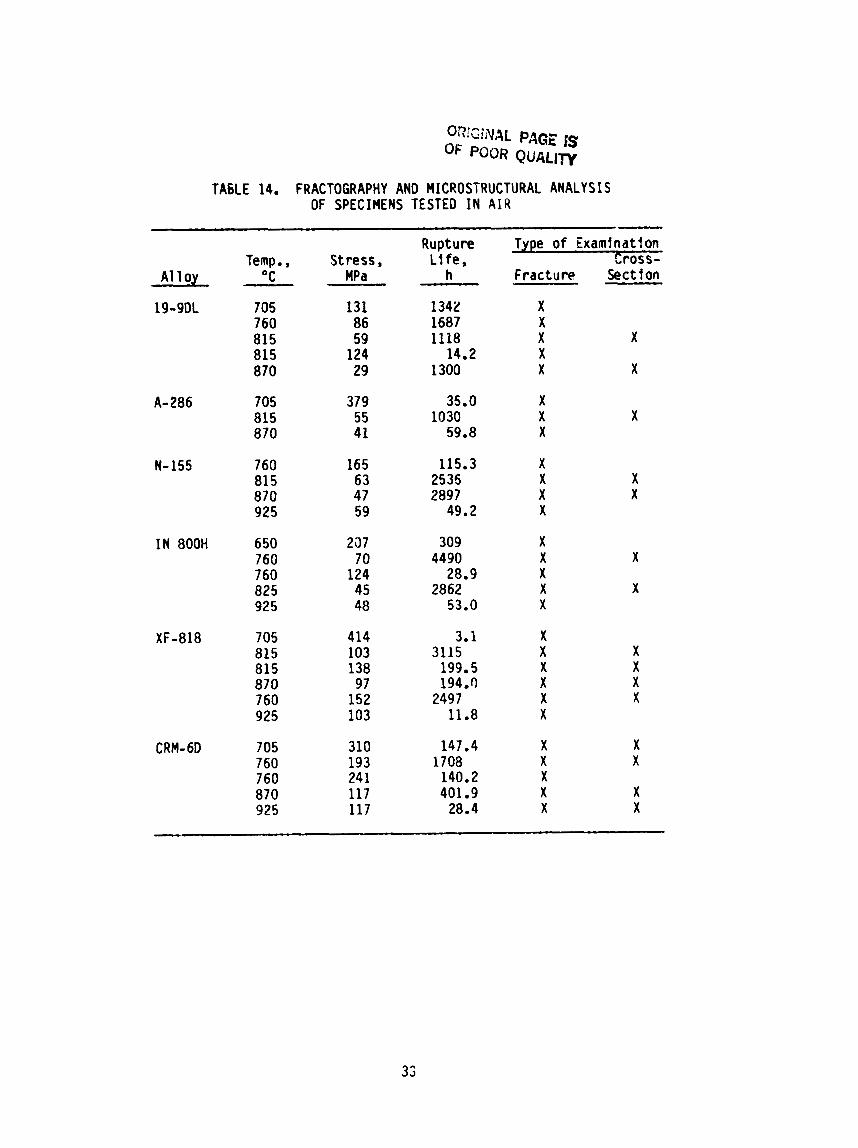
A number o f ruptured specimens from d i f f e r e n t creep t e s t s were selected f o r the meta l lu rg ica l examination of creep fractures (Table 14). Since creep f rac tu re may be associated w i th s i g n i f i c a n t mic ros t ruc tura l changes, some o f the creep f rac tu re specimens (Table 14) were pol ished i n t h e i r long i tud ina l cross-sectfon t o examine the microstructure extending from undeformed areas t o the f rac ture edge. Results of t h i s study are presented below w i t h some t y p i - c a l i l lus t ra t i ons ,
Fracture Examination
Fracture analys is was performed on a selected number of creep-rupture specimens o f various a l l o y s tested i n a i r . This study reveals the modes and mechanisms of f a i l u r e i n each case and t h e i r r e l a t i o n t o a l l o y composition, fabr fca t ion mode (wrought o r cast), stress, and t e s t temperatures. Typical f r ac tu re surfaces from wrought and cast a l l o y s are shown i n Figs. 31 t o 34.
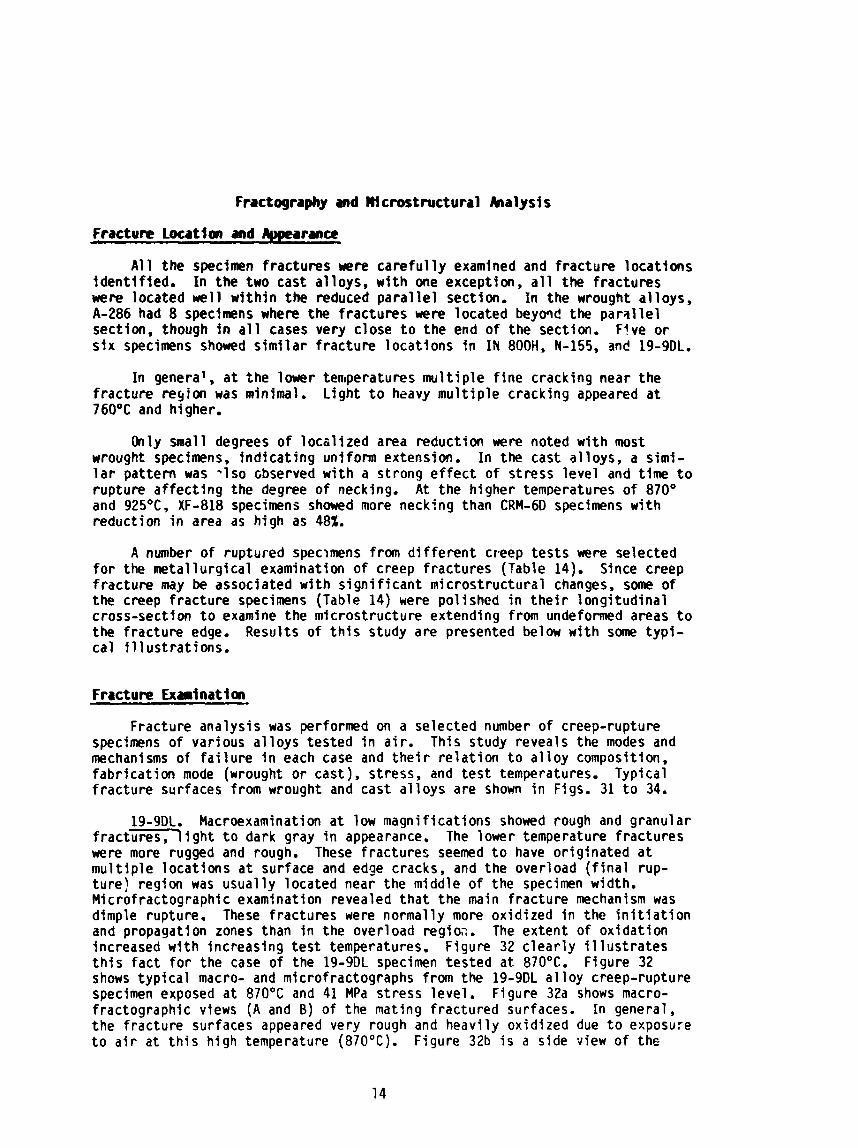
19-9DL. Macroexamination a t low magni f icat ions showed rough and granular f r a c t m i g h t t o dark gray i n appearance. The lower temperature f rac tures were more rugged and rough. These f rac tures seemed t o have or ig ina ted a t m u l t i p l e loca t ions a t surface and edge cracks, and the overload ( f i n a l rup- t u r e ) region was usual ly located near the middle o f the specimen width. Mfcrofractographic examination revealed t h a t the main f rac tu re mechanism was dimple rupture. These fractures were normal ly more ox id ized i n the i n i t i a t i o n and propagatlon zones than i n the overload regio;. The extent o f ox idat ion Increased w i t h increasing t e s t temperatures. Figure 32 c l e a r l y i l l u s t r a t e s t h i s f a c t f o r the case of the 19-9DL specimen tes ted a t 870°C. Figure 32 shows t y p i c a l macro- and microfractographs from the 19-9DL a1 loy creep-rupture specimen exposed a t 870°C and 41 MPa st ress level . Figure 32a shows macro- fractographic views ( A and B) o f the mating f rac tured surfaces. I n general, the f rac ture surfaces appeared very rough and heavi ly oxidized due t o exposure t o a i r a t t h i s high temperature (870°C). Figure 32b i s a side view o f the
f racture surface i n Fig. 32a (B). Many surface cracks are v i s ib le . This f rac tu re a l so s ta r ted a t mu l t i p le loca t ions a t the outer surface. The separa- t i o n of the fractured surfaces seemed t o have progressed from the l e f t end of the specimen t o the r i g h t , becausc the f racture appeared increasingly rougher toward the r i g h t due t o overload. Figure 32c presents a t y p i c a l m i c ~ o f r a c t o - graph from the center o f the specimen on surface B (Fig. 32a)- Again, dimple rupture i s the main mode o f fracture. Figure 32c a lso s h w s a t h i c k granular oxide l aye r covering near ly the e n t i r e area.
A-286. A l l the three f rac tures examined f o r t h i s a l l o y (Tabie 14) showed very rougTi and granular f rac tures a t low magnif icat ions (Fig. 31c). For the specimens tes ted a t 705' and 81S°C, the main f rac ture mode was decohesive rup- ture. A t 870°C, the f rac tu re showed mixed modes ranging from in te rgranu lar f rac tu re i n the i n i t i a t i o n zone t o f rac tu re by dimple-rupture mode i n the overload zone. The degree o f ox ida t ion increased w i t h increasing t e s t temper- ature. A l l the f rac tures examined had or ig ina ted a t m u l t i p l e s i t e s from sur- face cracks.
N-155. Figures 31d and e show t y p i c a l low-magnification views o f f rac- t u r e sur faces f o r t h i s a l loy. Fractures from t h i s a l l o y exh ib i ted varying degrees of roughness and colors rangfng from ye l lowish brown t o deep blue. The b l u i s h area tended t o be more oxidized. I n the 650°C specimen, a rough in te rgranu lar f rac tu re showing f i n e dimple covered facets was observed. I n the 760°C, 165 MPa specimen, the f rac tu re appeared rough near both ends and r e l a t i v e l y smoother, d u l l gray and ox id ized i n the middle region. A t 815' and 870°C, f rac tures had a rough, f i n e granular appearance and were considerably oxidized. The 925°C f racture was very rugged. I t s one end and middle regions were heav i ly oxidized, and the less ox id ized other end showed la rge dtmples surrounded by a h igh densi ty o f smaller dimples (overload region). A l l these specimens showed abundant surface cracks (Figs. 31d and e) which probably acted as m u l t i p l e i n i t i a t i o n s i tes.
IN 800H. In the specimen tested a t 650°C and 207 MPa, the f rac tu re was very r o u g h n d uneven. It had or ig ina ted a t m u l t i p l e loca t ions near one end and progressed by dimple-rupture mechanism. For the 760°C specimen tested a t 124 MPa, the f rac tu re showed sharp r idges wf th shiny slopes showing f i n e gran- u l a r f racture. For the 760°C specimen tested a t 70 MPa, the f rac tu re was rough and had propagated from the ends toward the middle a t sharp angles (Fig. 31f). Figure 319 shows a view o f the f rac tu re i n the specimen tested a t 815°C and 45 MPa. This f rac tu re showed a coarse granular topography and extensive surface cracking. A t 925OC and 48 MPa, the f rac tu re was very rugged and showed very prominent edge cracks. A l l the above f rac tures showed varying degrees of oxidat ion, and the heavy ox idat ion i n the 925°C specimen had completely masked the f i n e r f racture features.
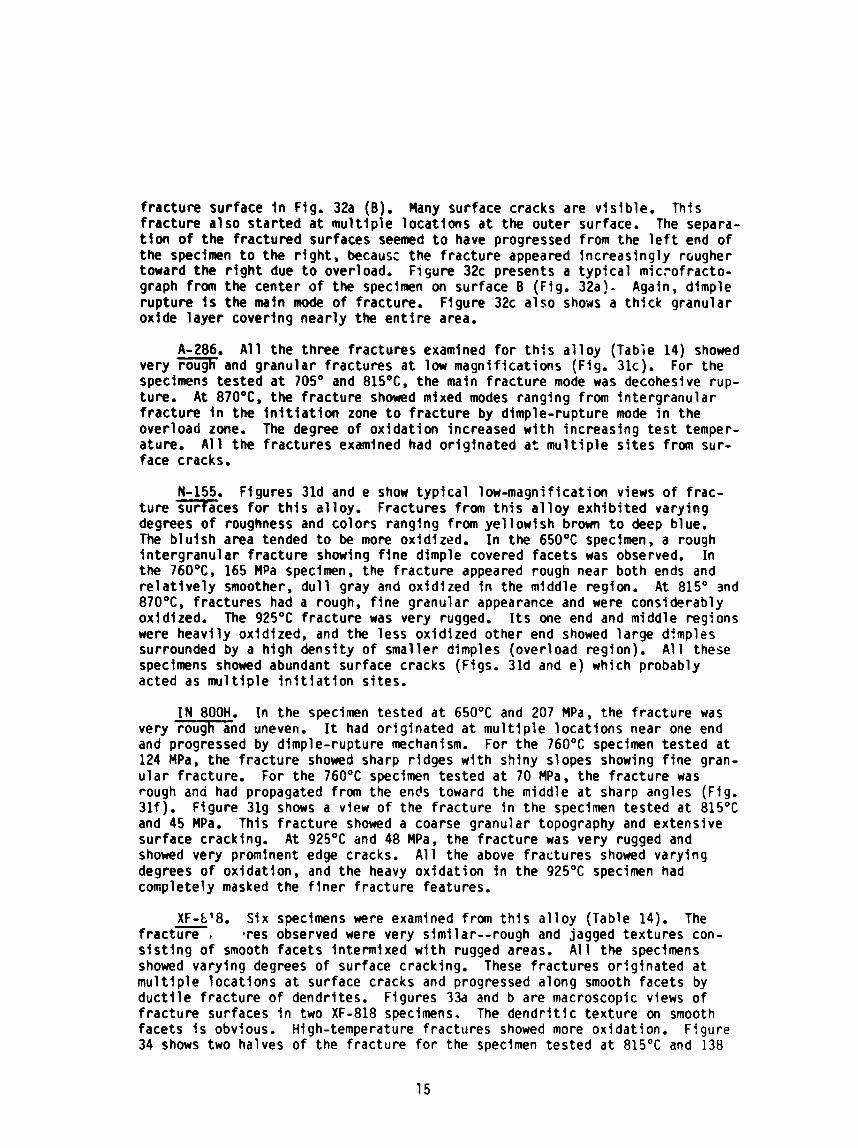
XF-6'8. Six specimens were examined from t h i s a l l o y (Table 14). The - frac tu re , +res observed were very simi lar--rough and jagged textures con- s i s t i n g of smooth facets intermixed w i t h rugged areas. A l l the specimens showed varying degrees o f surface cracking. These f ractures or ig ina ted a t m u l t i p l e locat ions a t surface cracks and progressed along smooth facets by d u c t i l e f rac tu re o f dendrites. Figures 33a and b are macroscopic views o f f rac tu re surfaces i n two XF-818 specimens. The dendr i t i c tex ture on smooth facets i s obvious. High-temperature fractures showed more oxidat ion. Ffgure 34 shows two halves o f the f rac ture f o r the specimen tested a t 815°C and 138
MPa. This f rac tu re apparently i n i t i a t e d a t the edge of the specimen (areas a and b o f Fig. 34a) where the f rac tu re was r e l a t i v e l y smoother and f i n e tex- tured. The e n t i r e f rac tu re displayed a jagged topography, and the areas c and d (Fig. 34a) were rough i n appearance. The fina; separation occurred near the center o f the specimen. Many surface cracks which could act as i n i t i a t i o n s i t e s were observed. I n the i n i t i a t i o n regions (areas a and b, Fig. 34a), the primary mode o f fractcire was dimple rupture, e x h i b i t i n g a l aye r o f f ractured dendr i t ts . The e n t i r e f rac tu re surface was oxidized. espec id l l y areas c a t~d d (Fig. 34a) where ox idat ion masked the e n t i r e f racture area. Heavy ox idat ion was observed i n the area a t the center o f the specimen where the f i n a l separa- t i o n seemed t o have occurred.
CRM-6D. Five specimens were analyzed f o r t h i s d l l o y (Table 14). The g e n e r m c t u r e features observed were qu i te s i m i l a r t c those for the XF-818 f rac tures discussed e a r l i e r . A t low magnif icat ions, f rac tures appeared rough and rugged, d is9 lay ing smooth facets of various sizes intermixed w i th rough and rugged areas. Surface cracks were observed invar iab ly , espec ia l l y close t o the f racture, i n d i c a t i n g m u l t i p l e i n i t i a t i o n s i tes. Figures 33c and d show f rac tures from two CRM-6D specimens. M i c r o f ractographic exarninaifon general l y showed d u c t i l e dimple rupture o f f i n e and coarse coltlmnar dendri tes i n the smoother areas. Rougher areas showed e i t h e r a coarse columnar f rac tu re o r duc t f l e t ea r ing w i th banded dimples i n sore cases. Overload regions were normal i y l ess oxidized than the i n i t i a t i o r ~ and propagation reg: ons.
Cross-Section Exarinatl on
Mating halves o f some o f the f rac ture specimens l i s t e d i n Table 14 were metal l u r g i ca l l y pol ished i n t h e i r long i tud ina l cross-section d i rec t i on approx- imately halfway through the specimen thickness. I n order t o preserve the in tegr i t ; o f the f rac ture edge and surface oxides, these specimens were n icke l -p la ted hefore pol isning. A f te r pol ish ing, a1 1 the specimens were e l e c t r o l y t i c s l l y etched wf th 10% oxa l i c acid t o reveal v a r i o ~ s const i tuents and t h e l r microstructures. They were examined under op t i ca l microscope and SEM. Id most cases creep rupture f a i l u r e was found t o be a r e s u l t o f i n t e r - granular cracking propaoating from the surface o r from w i t h i n the matrix. These cracks usual ly o r ig ina ted a t gra in boundary regions.
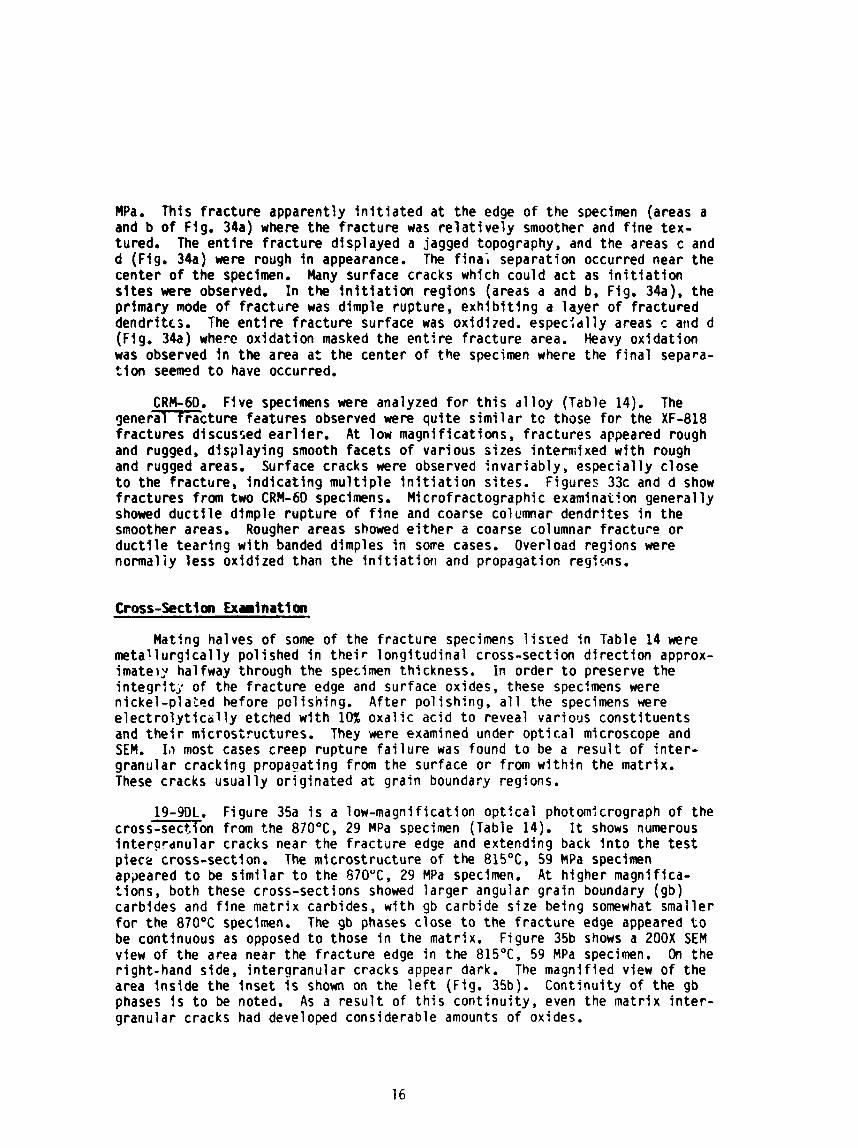
19-9DL. Figure 35a i s a low-magni f i c a t i o n op t i ca l photomicrograph o f the c r o s s x o n from the 870°C, 29 MPa specimen (Table 14). It shows numerous in te rardnu lar cracks near the f rac ture edge and extending back i n t o the t e s t piece cross-section. The microstructure o f the 815"C, 59 kPa specimen apgeared t o be s i m i l a r t o the 870°C, 29 MPa specimen. A t higher magnifica- t ions , both these cross-sections showed la rger angular g ra in boundary (gb) carbides and f i n e matr ix carbides, wf th gb carbide s ize being somewhat smaller f o r the 870°C specimen. The gb phases close t o the f racture edge appeared t o be continuous as opposed t o those i n the matrix. Figure 35b shows a 200X SEM view o f the area near the f rac ture edge i n the 815OC, 59 MPa specimen. On the r ight-hand side, in te rgranu lar cracks appear dark. The magnified view o f the area ins ide the i nse t i s shown on the l e f t (Fig. 35b). Cont inui ty o f the gb phases i s t o be noted. As a r e s u l t of t h i s cont inu i ty , even the matr ix i n t e r - granular cracks had developed considerable amounts o f oxides.
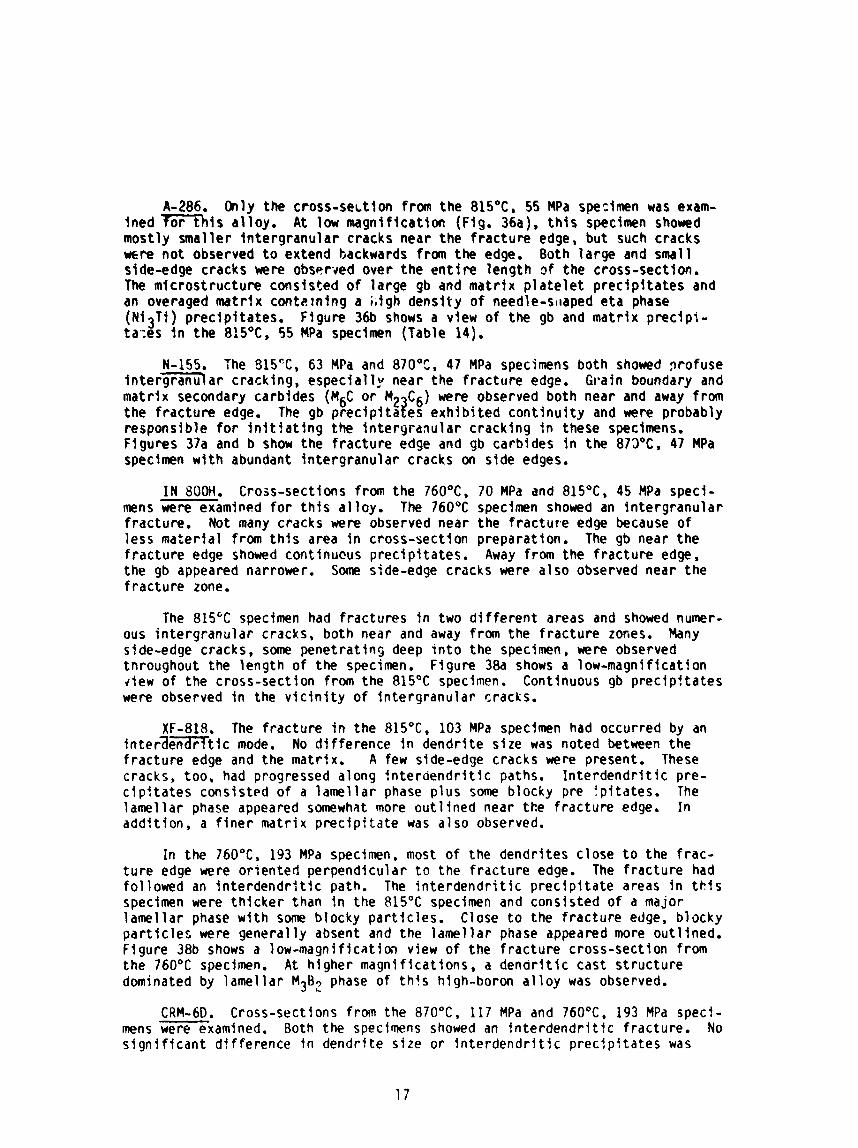
A-286. Only the cross-section from the 815OC, 55 MPa spezimen was exam- ined f o r i s a l loy . A t low m a g n i f i c a t i m (Fig. 36a), t h i s specimen showed mostly smaller in te rgranu lar cracks near the f racture edge, but such cracks mre not observed t o extend backwards from the edge. Both la rge and small side-edge cracks were observed over the e n t i r e length 3 f the cross-section. The microstructure consisted of large gb and matr ix p l a t e l e t p rec ip i t a tes and an overaged mat r ix cantarning a L igh densi ty o f needle-sliaped e ta phase (Ni3Ti) prec ip i ta tes. Figure 36b shows a view of the gb and matr ix p rec ip i - ta:es i n the 8!S°C, 55 MPa speclmen (Table 14).
N-155. The 31SCC, 63 MPa and 870°C, 47 MPa specimens both showed profuse i n t e r a a r cracking, espec ia l l y near the f rac ture edge. Grain boundary and matr ix secondary carbides (M6C o r Mp C6) were observed both near and away from the f rac tu re edge. The gb precipi ta?es exh ib i ted con t i nu i t y and were probably responsible f o r Initiating the ln te rgranu lar cracking i n these specimens. Figures 37a and b show the f rac tu re edge and gb carbides i n the 87CI0C, 47 MPa speclmen w i t h abundant in tergranul a r cracks on side edges.
IN 600H. Cross-sections from the 760°C, 70 MPa and 815OC, 45 MPa speci- mens were examined f o r t h f s a l loy . The 760°C specimen showed an in te rgranu lar fracture. Not many cracks were observed near the f rac tu re edge because o f less mater ia l from t h i s area i n cross-section preparation. The gb near the f rac tu re edge showed continucus preci p i ta tes . Away from the f racture edge, the gb appeared narrower. Some side-edge cracks were a lso observed near the f rac ture zone.
The 815°C specimen had f ractures I n two d i f f e r e n t areas and showed numer- ous in te rgranu lar cracks, both near and away from the f rac ture zones. Many side-edge cracks, some penetrat ing deep i n t o the specimen, were observed tnroughout the length o f the specimen. Figure 38a shows a low-magnification diew o f the cross-section from the 81S°C specimen. Continuous gb prec ip t ta tes were observed i n the v i c i n i t y o f in te rgranu lar cracks.
XF-818. The f rac ture i n the 81S°C, 103 MPa speclmen had occurred by an i n t e r a e m t i c mode. No d i f ference i n dendr i te size was noted between the f rac ture edge and the matrlx. A few side-edge cracks were present. These cracks, too, had progressed along I n t e r d e n d r i t i c paths. I n te rdendr i t i c pre- c i p i t a t e s consisted o f a lamel lar phase p lus some blocky pre fp i ta tes . The lamel lar phase appeared somewhat more ou t l ined near the f rac ture edge. I n addi t ion, a f i n e r matr ix p r e c i p i t a t e was a lso observed.
In the 760°C, 193 MPa specimen, most o f the dendri tes close t o the f rac- t u r e edge were or iented perpendicular t o the f rac tu re edge. The f racture had followed an 1nterdendr:tic path. The i n t e r d e n d r i t i c p rec ip i t a te areas i n t k i s specimen were th i cke r than i n the 81S°C specimen and consisted of a major lamel lar phase w i th some blocky par t i c les . Close t o the f racture edge, blocky p a r t i c l e s were general ly absent and the lamel lar phase appeared more out l ined. Figure 38b shows a low-magni f icat im view o f the f rac tu re cross-section from the 760°C specimen. A t h igher magnlf icat lons, a denar i t i c cast s t ruc ture dominated by lamel lar M3B2 phase of th!s high-boron a l l o y was observed.
CRM-6D. Cross-sections from the 870°C, 117 MPa and 760°C, 193 MPa specf- mens were examined. Both the specimens showed an i n t e r d e n d r i t i c fracture. No s i g n i f i c a n t d l fference i n dendri te s ize or ln te rdendr i t i c p rec ip i t a tes was
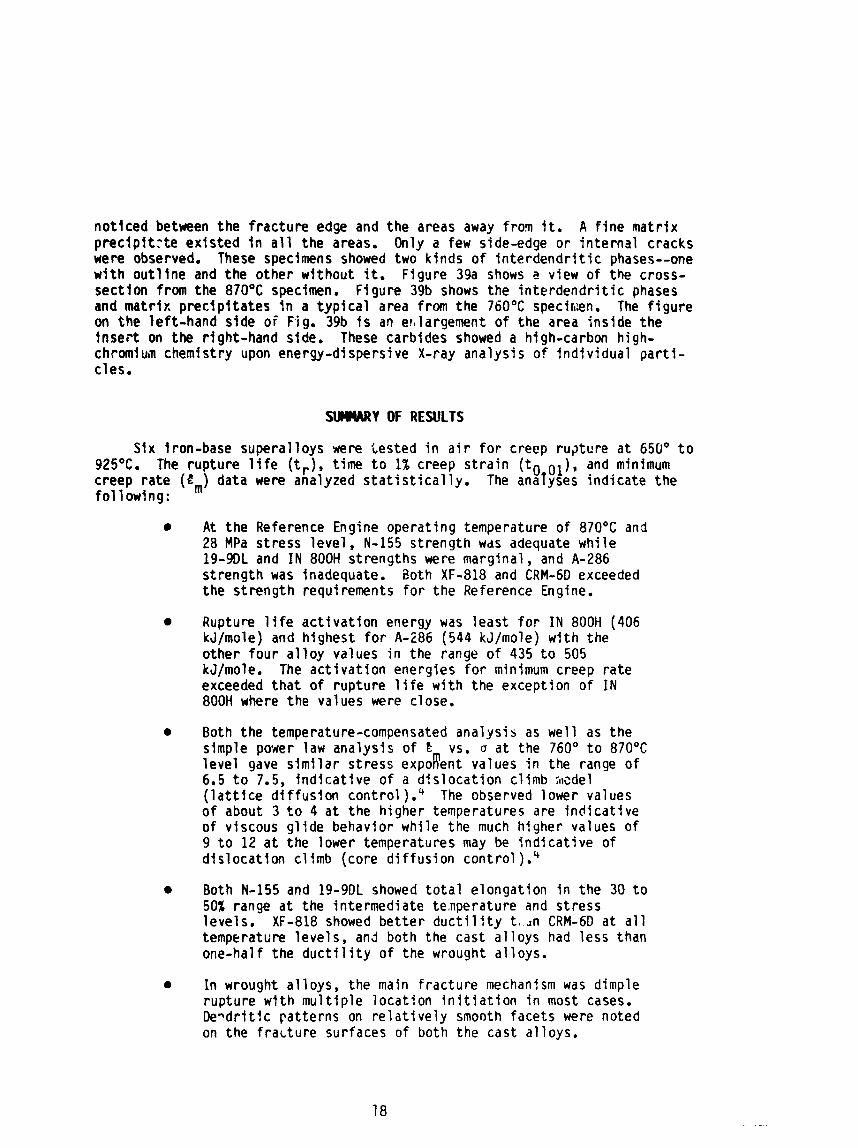
not lced between the f rac tu re edge and the areas away f ro9 it. A f i n e matr ix precip1t:te ex is ted i n a l l the areas. Only a few side-edge o r i n te rna l cracks were observed. These specimens showed two kinds o f i n t e r d e n d r i t i c phases--one w i t h ou t l l ne and the other without it. Figure 39a shows a view of the cross- sect ion from the 870°C specimen. Figure 39b shows the i n t e r d e n d r i t i c phases and mat r ix p rec ip i t a tes I n a t y p i c a l area from the 760°C specir t~n. The f i g u r e on the le f t -hand side o f F.ig. 39b i s an et,largement o f the area ins ide the I n s e r t on the right-hand side. These carbides showed a high-carbon high- chromiuin chemistry upon energy-di spersive X-ray analysis of ind iv idua l p a r t i - c l es.
SUmARY OF RESULTS
S I X iron-base superalloys were tested i n a i r f o r creep r u ~ t u r e a t 650' t o 92S°C. The rupture l i f e (t,), t ime t o 1% creep s t r a i n ( t o 01), and minimum creep ra te (ern) data were analyzed s t a t i s t i c a l l y . The analyses ind ica te the fo l low ing:
A t the Reference Engine operat ing temperature o f 870°C and 28 MPa stress leve l , N-155 st rength wds adequate whi le 19-9DL and I N 800H strengths were marginal, and A-286 st rength was inadequate. 30th XF-818 and CRM-6D exceeded the st rength requirements for the Reference Engine.
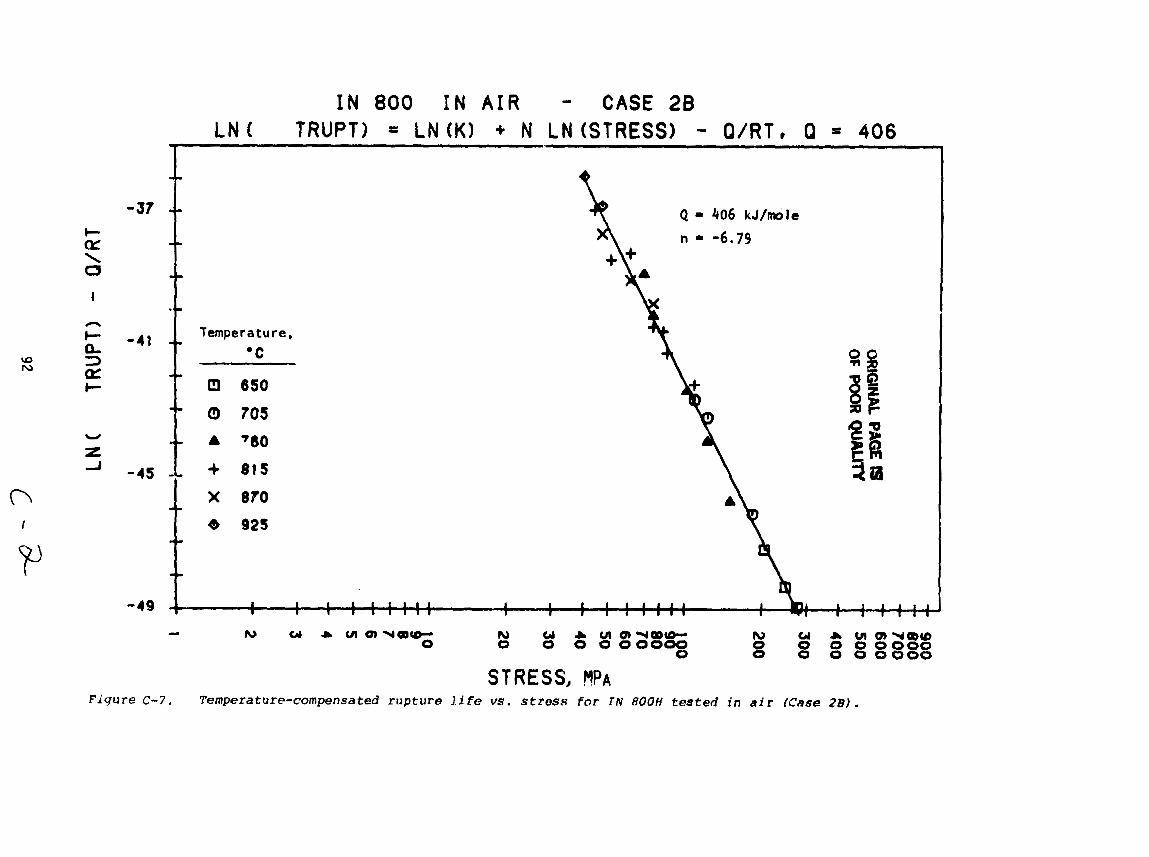
a Rupture l i f e ac t i va t i on energy was l eas t f o r I N 800H (406 kJ/rnole) and highest f o r A-286 (544 kJ/mole) w i th the other four a l l o y values i n the range o f 435 t o 505 kJ/mole. The a c t i v a t i o n energies f o r minimum creep ra te exceeded tha t o f rupture l i f e w i t h the exception o f I N 800H where the values were close.
Both the temperature-compensated analysis as wel l as the simple power law analysis o f E vs. a a t the 760' t o 870°C leve l gave s im i l a r s t ress expoRent values i n the range o f 6.5 t o 7.5, i nd i ca t i ve o f a d i s loca t i on cl imb :~cdel ( l a t t i c e d i f f u s i o n cont ro l )." The observed lower values o f about 3 t o 4 a t the higher temperatures are i nd i ca t i ve o f viscous g l i de behavior whi le the much higher values of 9 t o 12 a t the lower temperatures may be i nd i ca t i ve of d is loca t ion c l fmb (core d i f f u s i o n cont ro l ) ."
8 Both N-155 and 19-9DL showed t o t a l elongat ion i n the 30 t o 50% range a t the intermediate temperature and stress levels. XF-818 showed b e t t e r d u c t l l i t y t. ~n CRM-6D a t a l l temperature levels , and both the cast a l l oys had less than one-half the d u c t i l i t y o f the wrought a l loys.
I n wrought a l loys , the main f rac ture mechanism was dimple rupture w i th mu l t i p le loca t ion i n i t i a t i o n i n most cases. Deqdr i t ic patterns on r e l a t i v e l y smooth facets were noted on the f r a ~ t u r e surfaces of both the cast a l loys.
REFFRENCES
Joseph R. Stephens, "Host i le Envi ronmental Condi t i ons Facing Candidate A1 loys fo r the Automotive St1 r l i n g En~ ine , " Ccnference Proceedings on Environment Degradation of Engineering Mater fa ls i n Hydrcgen, Sept. 21-23, 1981, pp. 123-132, "i r g i n f a Polytechnic I n s t i t u t e , Blacksburg, V i r g i n i a 24061.
Walter R. Witzke and Joseph R. Stephens, "Creep-Rupture Behavior o f Seven Iron-Base Al loys A f t e r Long-Term Aging a t 760' i n Lou P r e s s ~ r e Hydrogen ," NASA TM-81534, August 1980, NASA-Lewis Research Center, Cleveland, Ohio.
Joseph R. Stephens, NASA-Lewi s. P r i va te Communication, 1982.
H. J. Frost and M. F. Ashby, "Deformation-Mechanism Maps f o r Pure Iron, Two Austen i t i c Sta in less Steels, and a Low-Alloy F e r r i t i c Steel ," Cambridge Un ivers t ty Report, Ju ly 1975, Cambridge, U.K.
F. R. Larson and J. M i l l e r , Trans. ASME, Vol. 74, 1952, p. 765.
S. S. Manson and A. M. Haferd, " A Linear Time-Temperature Relat ion f o r Extrapol a t i o n and Creep and S t ress-Rupture Data ," NACA Technical Note 2890, March 1952.
S. S. Mans011 and W. R. Brown, Proc. ASTM, ASTEA, Vol. 53, 1953, p. 693.
0. D. Sherby, "Factors A f fec t i ng the High Temperature Strength o f Po l yc rys ta l l i ne Solids," Acta Met., Vol. 10, No. 2, 1962, pp. 135- 147.
3. E. Dorn, "The Spectrum o f Ac t iva t ion Energies f o r Creep," i n Creep and Recovery, ASM, Metals Park, Ohio, 1957, pp. 255-283.
R. M. Goldhoff, "The Evaluat ion o f Elevated Temperature Creep and Rupture Strength Data: An H i s t o r i c a l Perspective ," i n Character- i z a t i o n o f Mater ia ls f o r Service a t Elevated Temperatures, G. V. Smith, ed., Publ. Ho. MPC - 7 ASME , New York, 1978, pp. 20-265.
TABLE 2. ALLOY SPECIFICATIONS AND HEAT TREATMENT CONDITION FCi4 TEST SPECIMENS
Heat Treatment A1 lg Spec i f i ca t i on ( i n vacuum)
A-286 55250~ So lu t ion 1149°C ( 2 1 0 0 ° F ) ~ ~ Age 718°C (1325°F)-16 hr/AC
Incc loy 800FI 58710~ So lu t ion 114g°C i 2 1 0 0 " ~ ) ~ * ~
5532ce So lu t ion 1177°C ( 2 1 5 0 ' ~ ) ~ ~ ~
o r 5 5 8 5 ~ ~
19-9DL 5526~9 So lu t ion 1204°C (2200°F)-10 minC
CRX-60 (None Age 650°C (1200°F)-100 h ava i l ab le )
XF-818 (None None speci f ted ava i l ab le )
"MS 55250 rev ised 10/15/79 supersedes AMS 5525C.
b ~ o l u t l m mneal!ng t ime c f 142 r/mn ( 1 h r l i n . ) th!ckness min!mun.
' ~ a p i d cool o r quench from so lu t i on temperature.
d~~~ 5871D i f sued 5/15,'72.
e~~~ 5532C rev ised 7/15/77 superseaes AMS 55328.
f~~~ 55858 rev ised 1/15/78 supersedes AWS 55851.
~ A M S 5526E rev ised 1;15/78 supersedes AMS 55260.
ORIGINAL PAGE iS OF POOR QUALITY
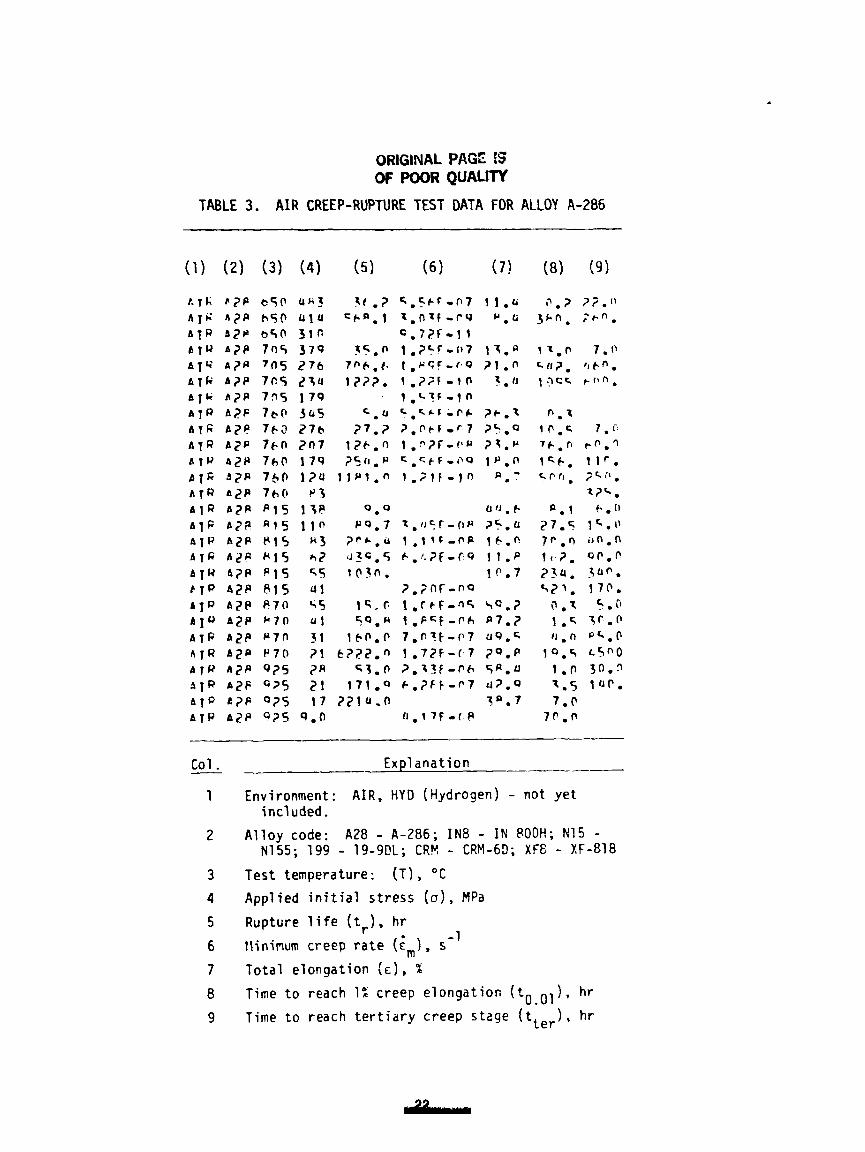
TABLE 3. AIR CREEP-RUPTURE TEST DATA FOR ALLOY A-286
Col . - 1
Explanat ion ----
Environment: AIR, HYD (Hydrogen) - not y e t incl uded .
A l l o y code: A28 - A-286; IN8 - I K 800H; N15 - N155; 199 - 19-9DL; CRM - CRM-69; XF6 - XF-818
Test temperature: (TI, O C
Appl ied i n i t i a l s t ress (a) , MPa
Rupture 1 i f e ( t , ) , h r
tlininum creep rate ( , s - '
T o t a l e longat ion ( E ) , Z
Time t o reach 1% creep e longat ion hr
Time t o reach t e r t i a r y creep s t z g e ( t t e r ) , hr
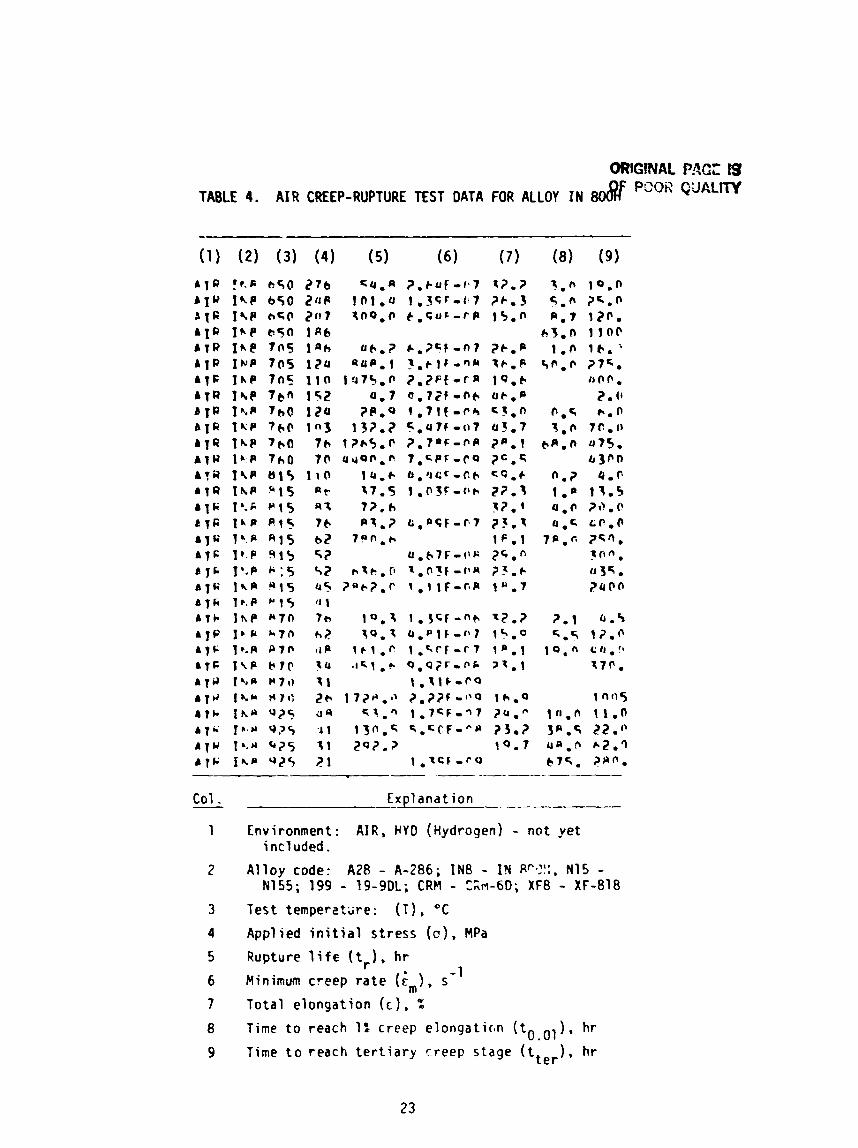
TABLE 4. A I R CREEP-RUPTURE TEST DATA FOR ALLOY IN BOWf P3OR QLIALIM
Col . -
!'.p 6 5 0 27b I k P 650 Z r l P I I ~ P fiqo ~ r t 7 I h P 6 5 0 f a 6 she t n s i n 6 IN@ 705 12u J h P 7n5 1 1 0 Is? 7 b n 152 ~ r , p 7b0 1 2 4 1rr.P 7 6 P I n 3 I h P 7aa 7 b l c C ' 7 b O 7 0 l \ P 813 110 I h P 915 R t
Ib.F. P 1 S R t
1 i P P.15 7 b I ' . p R 1 5 6 2 1e.P 919 5? J'.P "5 s2 1 k P W1S 05 1 r . f F f $ 1 1 1
I h P h 7 0 ?ti
I r e h 7 n h?
1r.R P I 0 r l P
T i e r 7 p ?u f % @ w71) \ \ I ~ M n r n zh I k Y 'J25 49
1 r . r 0 7 5 3 1 I . 5 5 1 I k r ' J 2 S 21
Explanat ion
Environment: A I R , FVD ( ~ y d r o g e n ) - not ye t included.
A l l oy code: A28 - A-286; IN8 - IN PP,2!:, N15 - N155; 199 - 19-9DL; CRM - CLI-60; XF8 - XF-818
Test temperztiire: (1) , O C
Applied i n i t i a l s t ress (o ) , MPa
Rupture 1 i f e (t,) . h r - 1
Minimum creep r a t e ) s
Total e longat ion ( c ) , %
Time t o reach 1: creep e longat i rm ( tOeo1) , hr
Time t o reach t e r t i a r y creep s t a g e ( t t e r ) , h r
OII#;INAL PA= IS OF POOR QUALITY
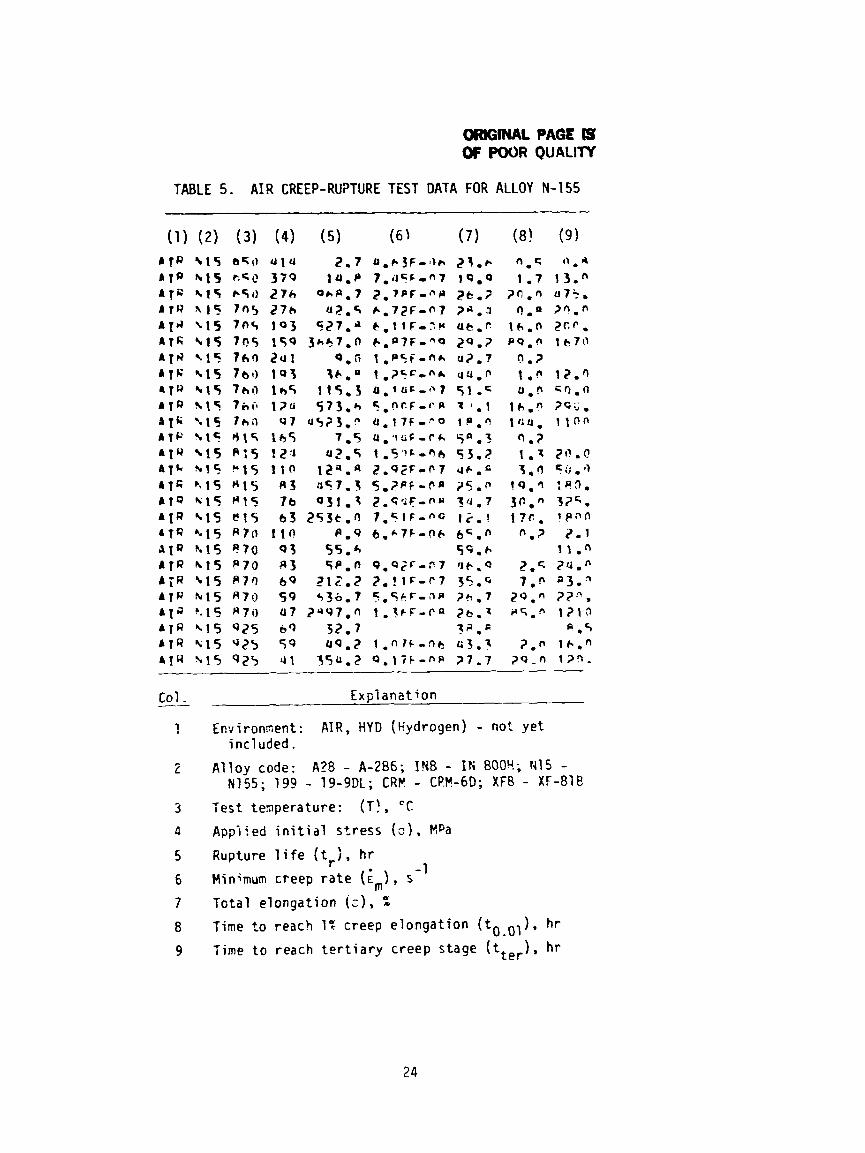
TABLE 5 . A I R CREEP-RUPTURE TEST DATA FOR ALLOY N-155
Col . - Explanation
1 Environnent: A I R , H Y D ( ~ ~ d r o g e n ) - not yet included .
3 Test temperature: (T!, 'C 4 App-i'ed i n i t i a l s t re s s ( a ) , HPa
5 R u p t u r e l i f e ( t , . ; , h r - 1
6 Minimun creep rate (;,), s
7 Total elongation i c ) , Z
8 Time to reach 1: creep elongation ( t o . o 1 ) , hr
9 Time t o reach tert iary creep stage ( t t e r ) . hr
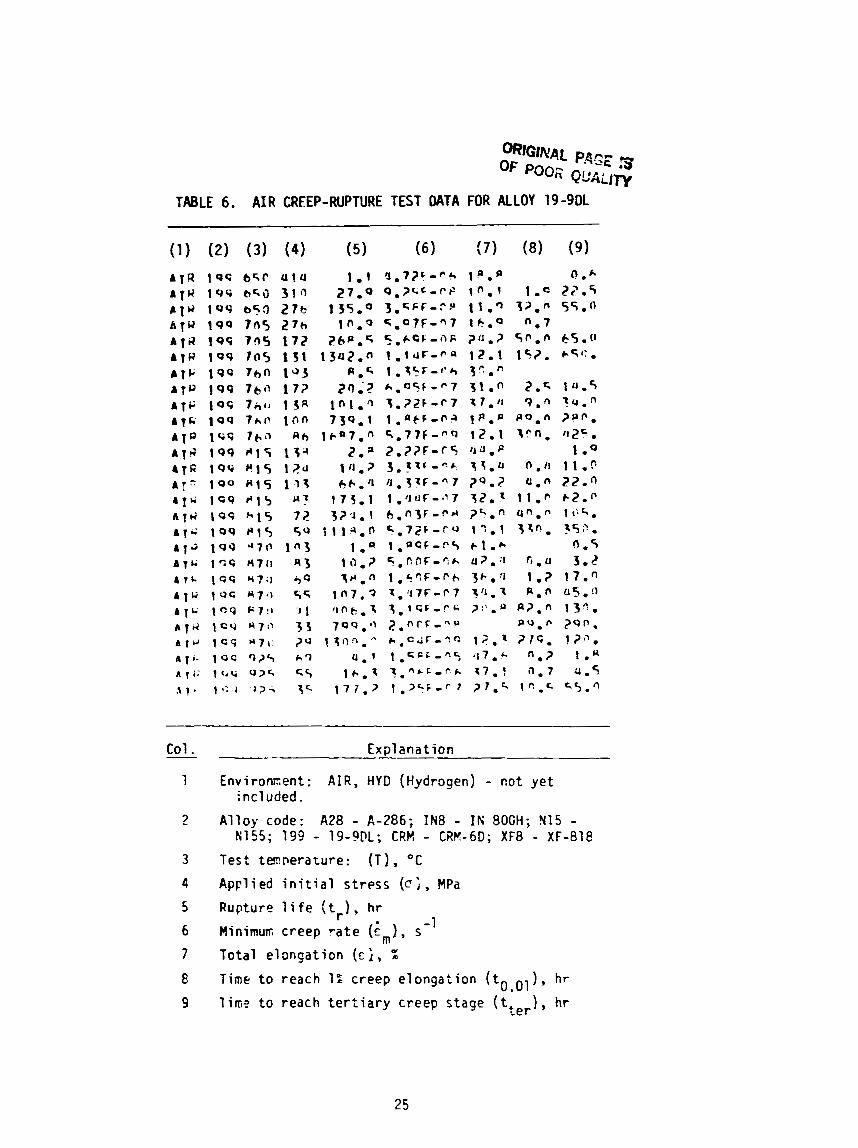
TABLE 6. AIR CREEP-RUPTURE TEST DATA FOR ALLOY 19-9Dl
Col .
1
Explanat ion
Environcent: AIR, HYD (Hydrogen) - not ye t included.
Alloy code: A28 - A-286; IN8 - IN 80GH; N15 - N155; 199 - 19-9DL; CRK - C R K - 6 D ; XF8 - XF-818
Test t m ~ e r a t u r e : ( T ) , "C
Applied i n i t i a l s t r e s s ( c ; , MPa
Rupture 1 i f e ( t r ) , hr -1 Minimuc creep pate (;.), s
Total elongation (r;, I
Time t o reach 1% creep elongation h r
li.3 t o reach t e r t i a r y creep stage ( t ter) , hr
TABLE 8. AIR CREEP-RUPTURE TEST DATA FOR ALLOY XF-818
ATG Y f P b50 U l U
r l u ~ F P a5n 3 0 5 b l R XFP 705 u l u a 1 R x c e 7 c 5 379 A T E I F P 7 0 5 3 7 1 r 1 a X F P 1 ~ 5 Z P ~ A f U XFP 760 3 ~ 5 A l l ? k F P 760 ? h z r l k L F C 7bO 271 AIR L F P 7 6 0 z n 7 A I R I F @ 760 15) A T E I F P P t S 2 4 1 A t R r F P P l S 1 7 2 AIR U F P R 1 5 1 3 R A T R Y F P n i + 117 A ~ L x F P a15 103 AIR r f e k7O 1 7 2 AIR t ~ n ~ 7 0 117 A T R X C P H7b Q ? AIR r F P rtu 6 3 A I R X F ? 125 1 0 5 AT^ k F P F?S h0
AIG WFP 9?5 55
Col . - Expl anzt ion
Envjronment: A I R , HY3 (Hydrogen) - not y e t i ncl uded.
*,a- !..A .*-. . I . - 4 - ........ ..... .,--A - i d - -- .--- -4. , <* ., -2-. -
LA... ../. .... - .. : ........ . . . . . . ::I: :::: -. . ---- --.- ---.- - .-..A. .-.-- A 2 - . . i L L I
---A A&-
sy .x ;;;, :. , -;.-.,-..... . .-
.......... .g. . .-- L. -,..;A- 1::. 22 <:.:l- U- 11.. ........ -j:I:j--: ::: l A L L '-A- .. . . . . . . . . . . . . . L . . . . . . . . . . 7% ....... .L . . ~ , 4 . ~ . * . - .*a. .A*. ..LA A a , , . ...
Stress, MPa
Figure 25. Temperature-compensated minimum c r e e p r a t e vs. stress for XF-818 t e s t e d i n a i r (Case 28, i n c l u d i n g Cases 2A and 2C shown s e p a r a t e l y ) .
Stress, MPa
Figure 26. Temperature-compensated rupture !ife vs. stress for N-155 tested in air (Case 2B, including Cases 2A and 2C data shown separately).
ORIGINAL PAGE IS OF POOR QUALIn
St ress , MPa
Figure 27. ~emperature-compensated time to 1% creep strain vs. stress for N-155 tested in air (Case 2B, inclcding Cases 2A and 2C shown separately).
Figure 28 . Temperature-compensated rupture 1 ife vs . stress for XF-81 8 tested in air (Case 28, including Cases 2 A and 2C data shown separately).
5 10 20 5 0 100 200
Stress, MPa
Figure 2 9 . Temperature-ccmpen3sted t i m e t o 1% c r e e p s t r a i n vs. stress for X F - 8 1 8 t e s t e d i n a i r (Case 2B, i n c : ~ d i n g Cases 2A and 2C shown s e p a r a t e l y ) .
lnversc Temperature, K - 1
F i g u r e 30. Estirn2ted ;.COO-hour r u p t u r e stross of six a l l c y s t es ted in a i r .
APPENDIX A
COMPLETE AIR CREEP-RUPTURE DATA
APPtNDlX A GRGINAL PAW 19
COMPLETE A I R CREEP-RUPTURE ; ' t OF POOR QUALlTy
.. m
.-
lu
N
P
IA
r
-u-
e-4-
wn
~ -
w
nm
fu
c
no
n-
*a-
oa
o
ry
-
J
o
-N
-I
IP
-
-W
OW
C
U-
wU
rV
U
lp
UO
lA
-&
nJ
I
Ud
Crlb
nN
O
'u-4-.u
ew
e*
-
aU
bn
fU
4
~r
~~
-C
lu
da
-o
mw
~~
J,
~-
~6
n,
.~
u~
ar
yr
.r
o-
4~
N~
wW
~~
O4
Jn
Jr
P~
h)
W
OW
*
- ..
....
....
....
....
....
....
....
....
....
....
....
o
--
~Y
~o
-o
~~
oL
~~
~Q
-w
N~
~~
'u
~~
~~
wu
~~
~~
~o
~~
~~
~~
D~
-
wa
aa
o
~
~~
-.
~~
ly
m-
ws
--
~~
wa
aa
~~
~n
~r
~~
~~
~r
~'
u~
au
~c
n~
--
o~
~r
ur
lo
-n
~-
~-
-a
..
....
....
....
....
....
....
....
....
....
....
....
....
-
~c
~~
~~
m~
a~
-~
un
~~
~~
~~
~~
~a
a~
rl
l~
~a
mo
-o
-~
~~
-~
~a
~w
fl
~~
~w
~
~W
~W
~~
J~
N~
~P
~J
~~
N~
~~
.~
~~
N~
~-
C~
NO
P~
OO
JI
~J
~N
~~
~~
U~
~~
~N
-~
m
,v
mm
mm
m,
nm
~~
mm
~~
~~
mm
~m
~m
m~
m.
n~
~m
~m
mm
m~
rr
lm
mr
rl
~~
~~
~m
m~
~*
.m
~m
1
l1
~#
l8
l1
l#
@#
#l
18
OI
lI
Il
I#
88
88
#I
8I
lI
~8
8l
8~
~8
88
88
88
o
00
3~
00
~0
~3
33
~)
~~
~r
~a
~~
~
~0
~~
~3
~~
03
00
03
O
.>
30
33
00
03
13
3O
O
EP
+4
0P
09
+4
0~
D4
3~
0Q
O4
Z%
.r
l4
4U
OD
Oo
40
~Q
P4
O~
~~
~~
4~
~~
%~
~0
~
-W
Un
JW
D-
-W
Ww
-N
-~
~r
WC
wN
hl
lA
CU
)O
-U
rY
Uf
lP
CU
~O
Pr
Y0
NW
~W
L
WW
-
W
O~
~~
UC
~Y
.J
-~
NC
O~
CP
.J
W~
~C
P~
J~
O~
JI
NC
~O
U~
~)
~~
CI
NU
~~
,W
&
WO
O
wd
....
....
....
....
....
....
....
....
....
....
....
....
n
~~
~e
m-
~~
~~
-n
O
Q~
D~
WP
W~
+)
OC
E~
-~
O~
DY
W~
-~
O-
JW
OP
4
-0
0
-
W-
DR
Jc
C
NW
--
0
0
UlW
-r
-
wm
W-
-
W-
-d
lh
l
-W
&J
l-
L
WW
O-
W
DW
-d
~
no
ru
ru
~r
rn
sr
r
mm
~
lu
o~
~a
~~
~u
uw
~,
r~
mo
o
-&
OW
Q
OO
~~
UO
ON
W~
O
4
3
fi*
8
Ut
0.
0.
r 0
.
-0
.
0
dJ
I3
.
00.
43
0 (
no
0
.
0
0
. .O3O
Q..
OJ
I
0
om
*.
0
-0
. 3O
OMO.
. 00
0.
30 0.
0. om
. oo
om
l
UU
-
- L
r.-u
N
r.
Cc
r=
6
rl
lr
ll
L
Qtn
-
WW
-
WO
O
a0
8n
w-
o
~.
~n
~~
~~
~+
-~
~~
-a
~~
~e
mm
~~
~~
~m
wo
or
ur
u~
~o
uc
~o
~~
oo
oo
~a
mo
-o
O
ee
ae
Oe
er
ea
~a
e~
Of
le
ee
aN
3e
ee
ee
eo
re
ee
ea
ae
..
e
ea
e O
ea
eu
*
a=
au
r
~1
wc
rc
a=
,e
ad.=,- r
=+
oo
e
o~
~n
e~
o~
~~
ao
e~
a~
~a
a~
-4
cu
e
OO
OW
~
@-
ON
urn
O
W-
N-
N
--
N-
r
U!
W-
u
o
r-
6N
W
WW
-4
r-
WU
bN
OfU
m
mr
yc
- DUO ouaumu
93
rw
m~
~
3.
aw
a
am
oe
aa
m
ra
w0
c\
r-
r~
-0
4r
~r
*-
r
Wr
y*
-
0
r 4.
L:
4-•
m
m+
e
m
-4
00
a
a
me
m
a
ma
d*
a
a
4- U
CI
r 0
43
n
we
C
ma
-+
dl.
a
a
Od
e
a P
ce
J.
0~
3a
OO
OU
ORIGINAL PAGE iS OF POOR QUALfIY
(cont . )
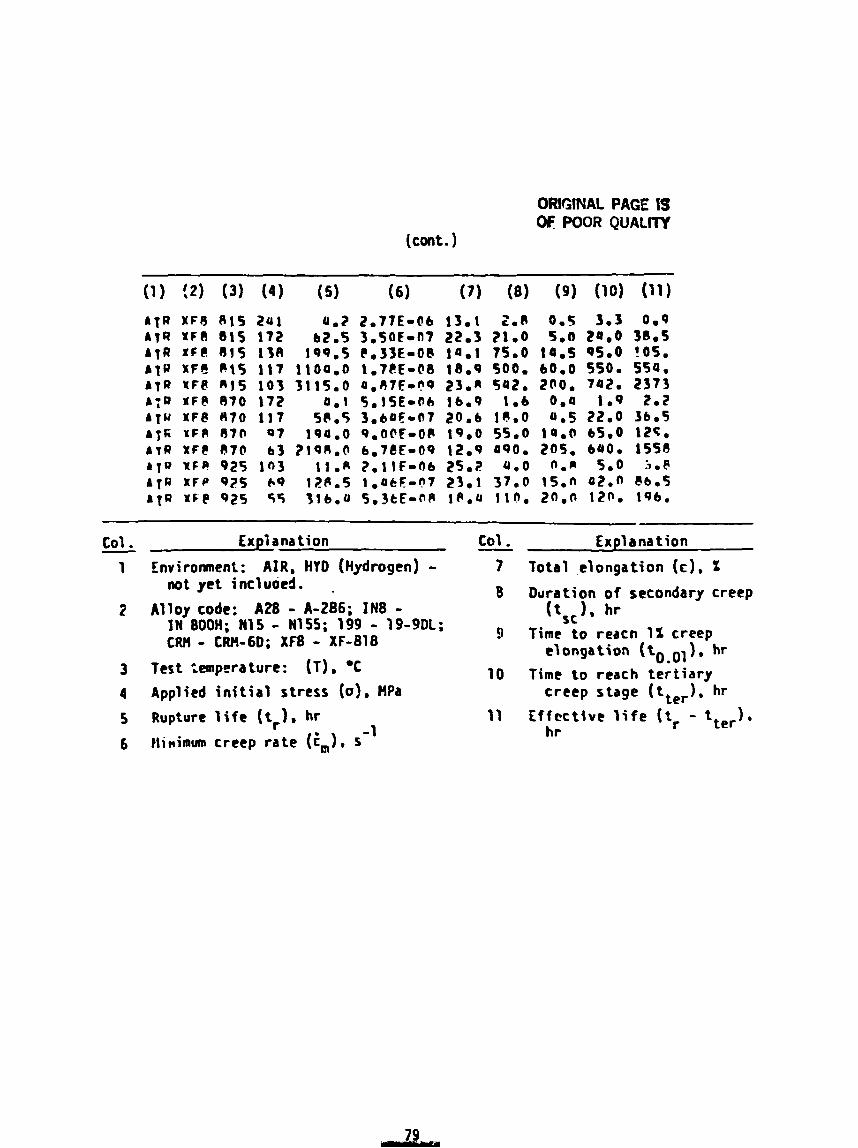
A f R XF8 815 241 4.3 2.77E-06 13.1 2.8 0.5 3.3 0.9 rta x F a 81s 172 b2.s ~ . 5 o ~ - a t 22.3 21.0 5.0 2o.O 38.5 A I R XFt! 815 Iff! 199,s Ce33E-08 1 o e l 75.0 I a . 5 QS.0 !OSw A I R XFt @I5 117 t l O a m O 1,7CE-@8 18.9 500. 60.0 SSOo 554, rtn XF@ 103 3 1 1 ~ ~ 0 a.~t~-n9 23.n S a t . too. 7oZ. 2373 r;a IFF 870 172 0.1 f,!S~-sb 16.9 1.6 0.0 1.9 2.2 A T U XFP 870 117 50.5 3,6aF-d7 20.6 1e.0 4.5 22.0 56.5 r f f i 'FP 870 07 1Qa.O 9,0@€-0b 19.0 55.0 1a.Q 65.0 12c. A T R XFe 870 6 3 ?198,0 b,7ef-09 12.9 090. 205. 6400 1558 r l Q XF9 925 In3 11.B 2,tlF-Ob 25.2 4.0 a 5 0 0 : 3 0 e
AIR X F P 92s 69 1 2 ~ ~ s ~ . a t ~ - w 23.1 37.0 1s.n a2.0 86 .5 A f R XFP Q t 5 55 31b.U S.3tE-fiP IPmo 114, Z o o s 1200 1qb.
Co1 . - Explanation Co1 . - Explanation
1 fnvirorment: AIR, HYD ( ~ ~ d r o g e n ) - 7 Total e longat ion (c) , not y e t incluoed. 0 Durat ion o f secondary creep - -
2 Alloy code: A28 - A-286; IN8 - (tsc). hr -
I N 800H; N15 - N155; 199 - 19-9DL; CRH - CRH-6D; XF8 - XF-018
9 Time t o re rcn 12 creep elongat ion hr
3 l e s t :emperature: (T ) , *C 10 Time t o reach t e r t i a r y 4 Applied i n i t i a l stress (a). HPa
- creep stage (tter). hr
5 Rupture l i f e (tr). hr 11 E f f e c t i v e l i f e ( t r - tter). - 1 h r 6 tlittirnm creep r a t e (tm). s
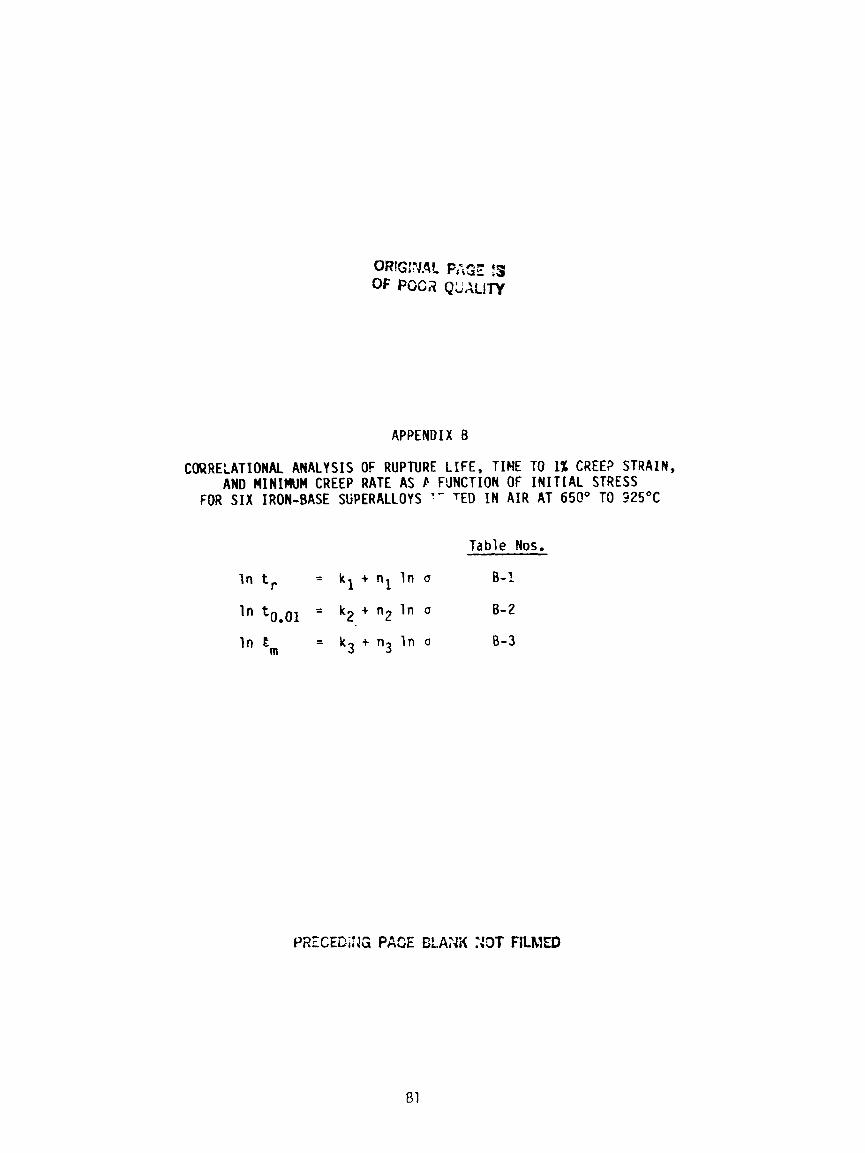
APPENDIX B
CORRELATIONAL ANALYSIS OF RUPTURE L I F E , TIHE TO 1% CREE? STRAIN, AND MINIMUM CREEP RATE AS F FUNCTION OF I N I T I A L STRESS
FOR S I X IRON-BASE SGPERALLOYS '- TED I N AIR AT 65Q0 TO S2S°C
Table Nos.
In t, = k l + nl l n o B- 2
I n = kZ + n2 11" CJ 8- 2
I n b,,, = k3 + n3 In o 8-3
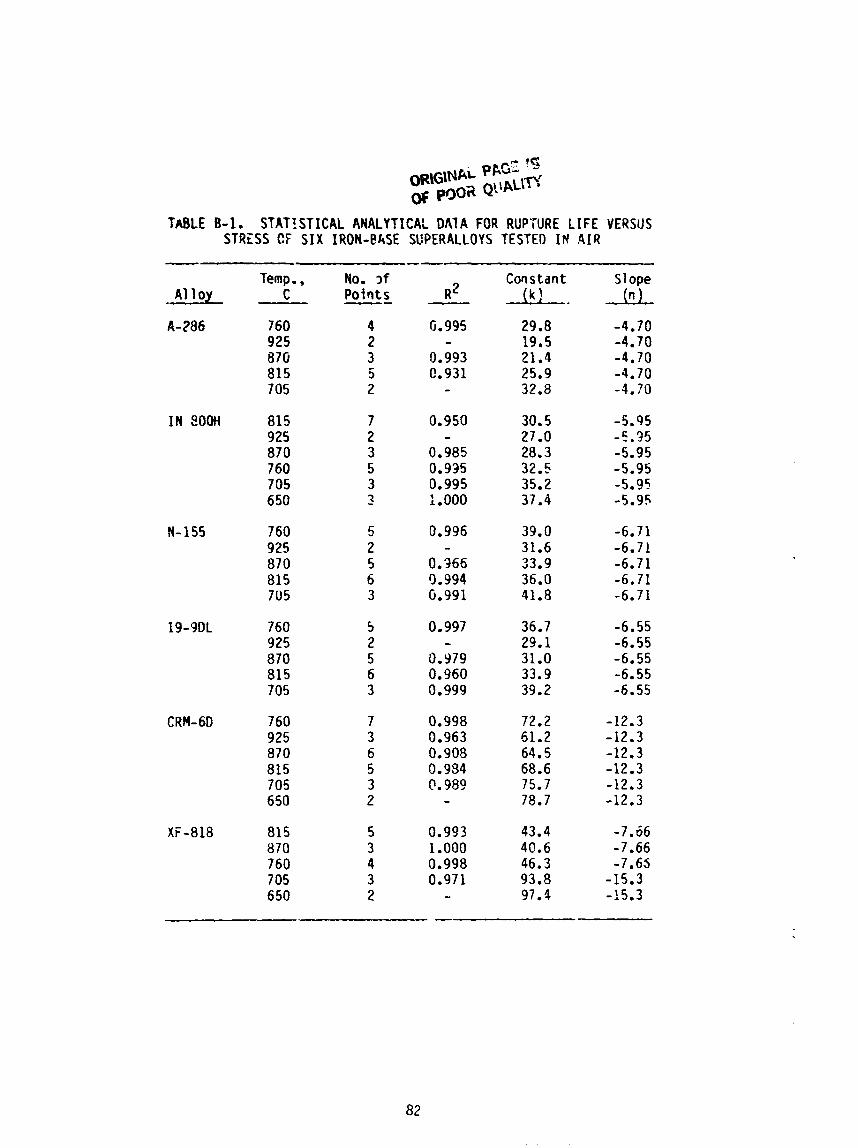
TABLE 0-1. STATISTICAL ANALYTICAL D A l A FOR RUP'iURE L IFE VERSUS STRESS CF S I X IRON-PkSE SCPERALLOYS TESTEO IN A I R
Temp. , No. 3 f Constant AA 1 oy c Points ~2 (kl. --
Sl ope 0
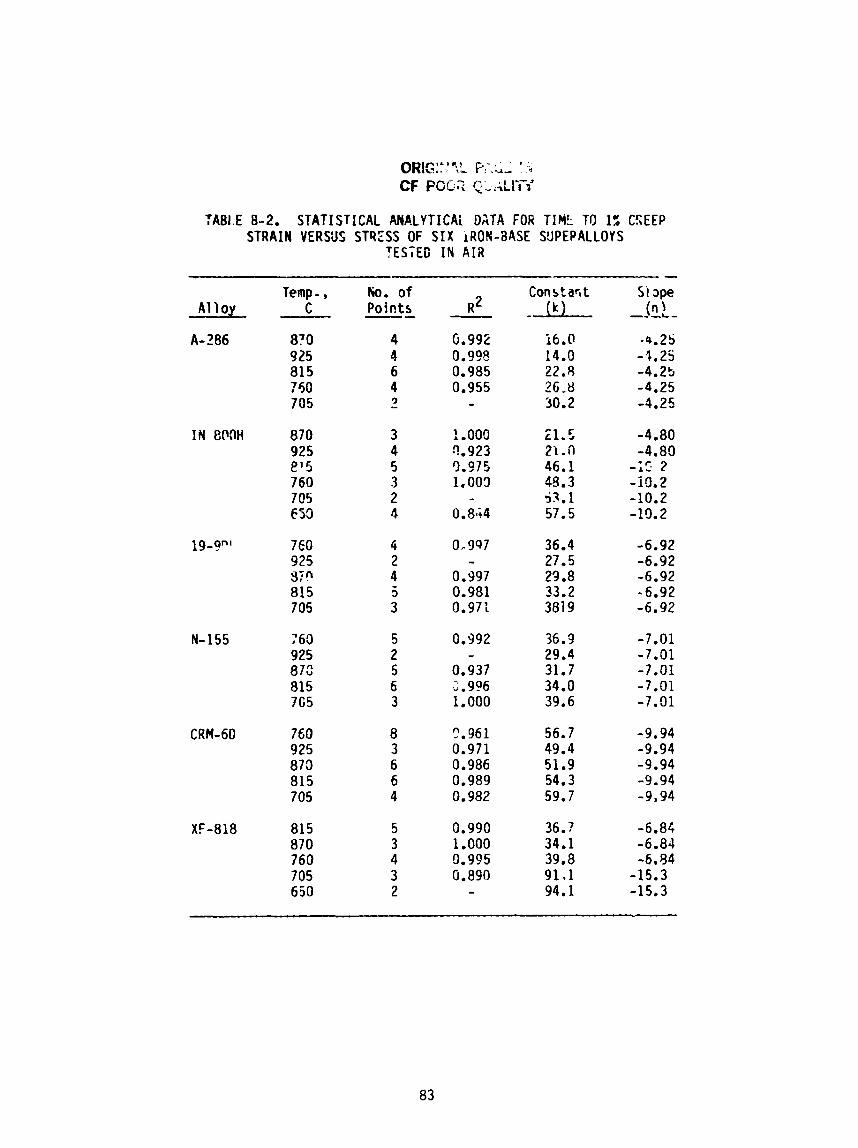
TAB1.E 8-2. S T A T I S T I C A L ANALYTICAL DATA FOR TIML TO 1% CZEEP STRAIN V E R W S STRESS OF S I X IRON-8ASE SUPEPALLOYS
TESTED I N 412
Temp - , ho. of Constaqt S i ape A1 loy C Points -- ~2 - -0 -,-L- (n'
IABLE 8-3. STATISTICAL ANALYTICAL DATA FOR MINIMUM CREEP HATE VE?S1-'f STRESS OF S I X IRON-BASE SUPERALLOYS TESTED I N A I R
Temp., A1 1 oy C
No, of Points
Constant Ik)
51 ope 0
APPENDIX C
TEMPERATURE-COMPENSATED RUPTURE L IFE, TIME TO 1 % CREEP STRAIN, AND MINIHUM CREEP RATE AS A FUNCTION OF I N I T I A L STRESS
FOR S IX IRON-BASE SUPERALLOYS TESTED I N AIR AT 650' TO 325OC
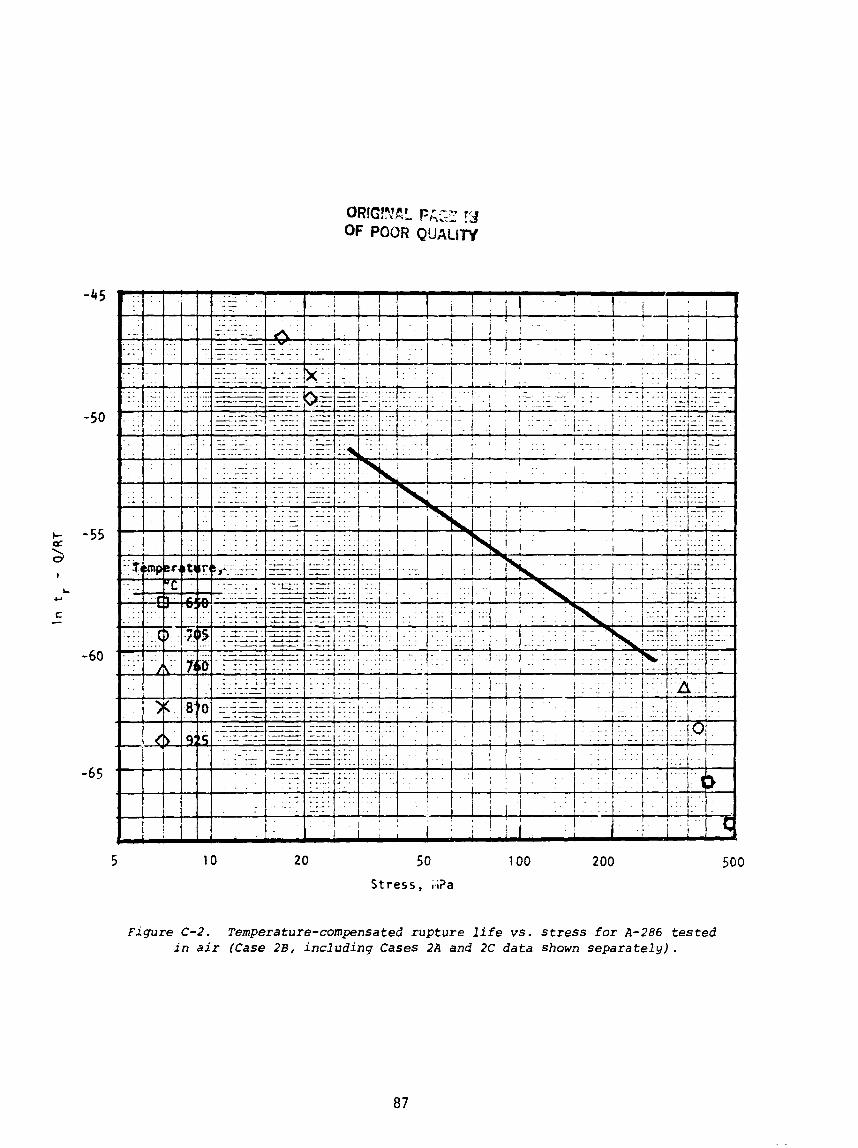
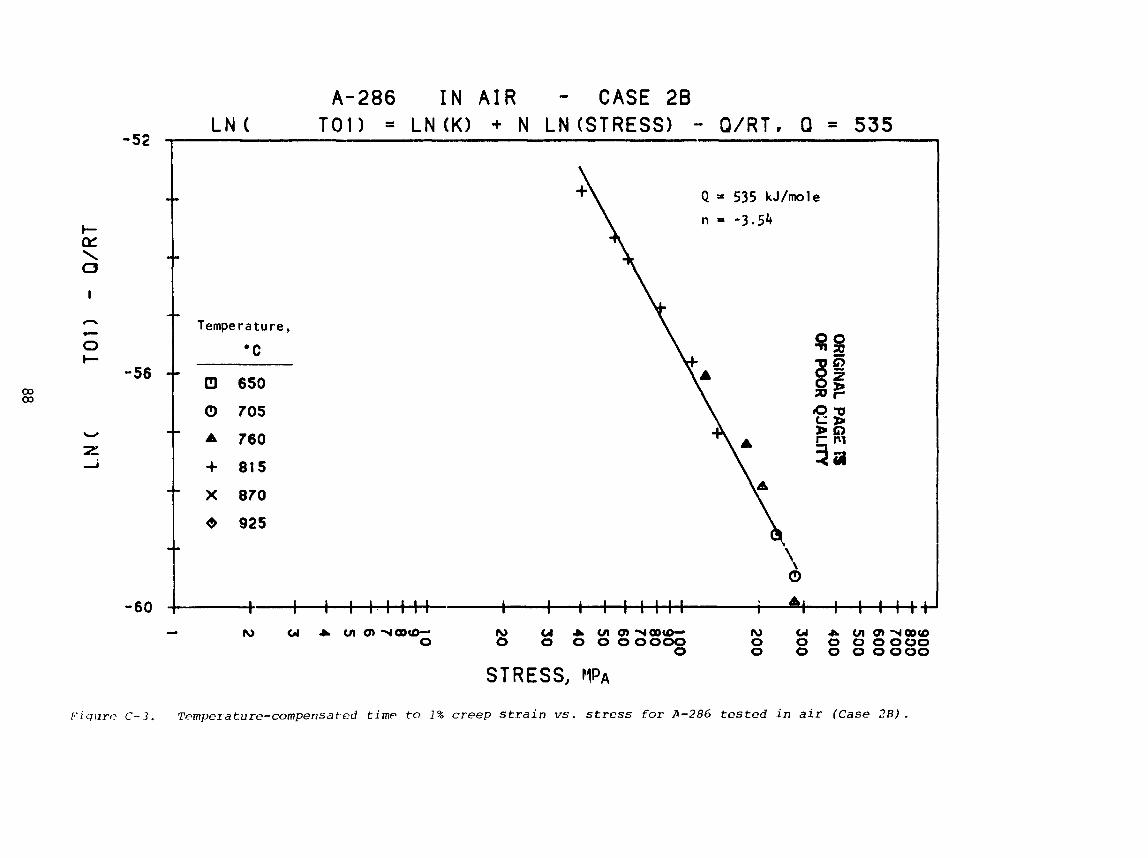
Figure C-2. Temperature-compensated rupture life vs. stress for A-286 tested in air (Case 2B, including Cases 2A and 2C data shown separately).
I m
N
V
) W
V)
V
) W
a E
0 I- V
) V
I Z
J
OR
IGIN
AL PA
GE fS
OF PO
OR
QU
ALITY
St ress , MPa
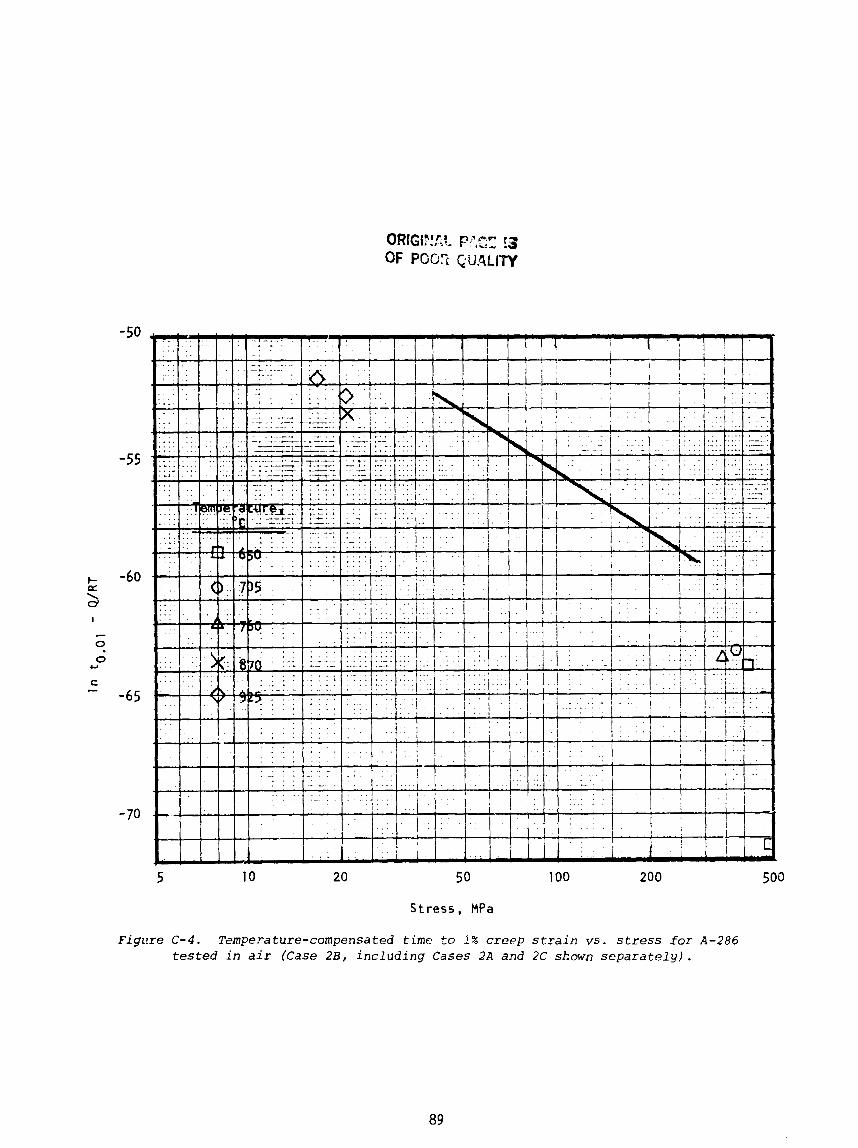
Figure C-4. Tsmperature-compensated time to 1% creep strain v s . stress for A-286 tested in air (Case 2B, including Cases 2A and 2C shown separately) .
900 eoo 7
00
ORIGINAL PAGE 131 OF POOH QUALITY
St ress , MPa
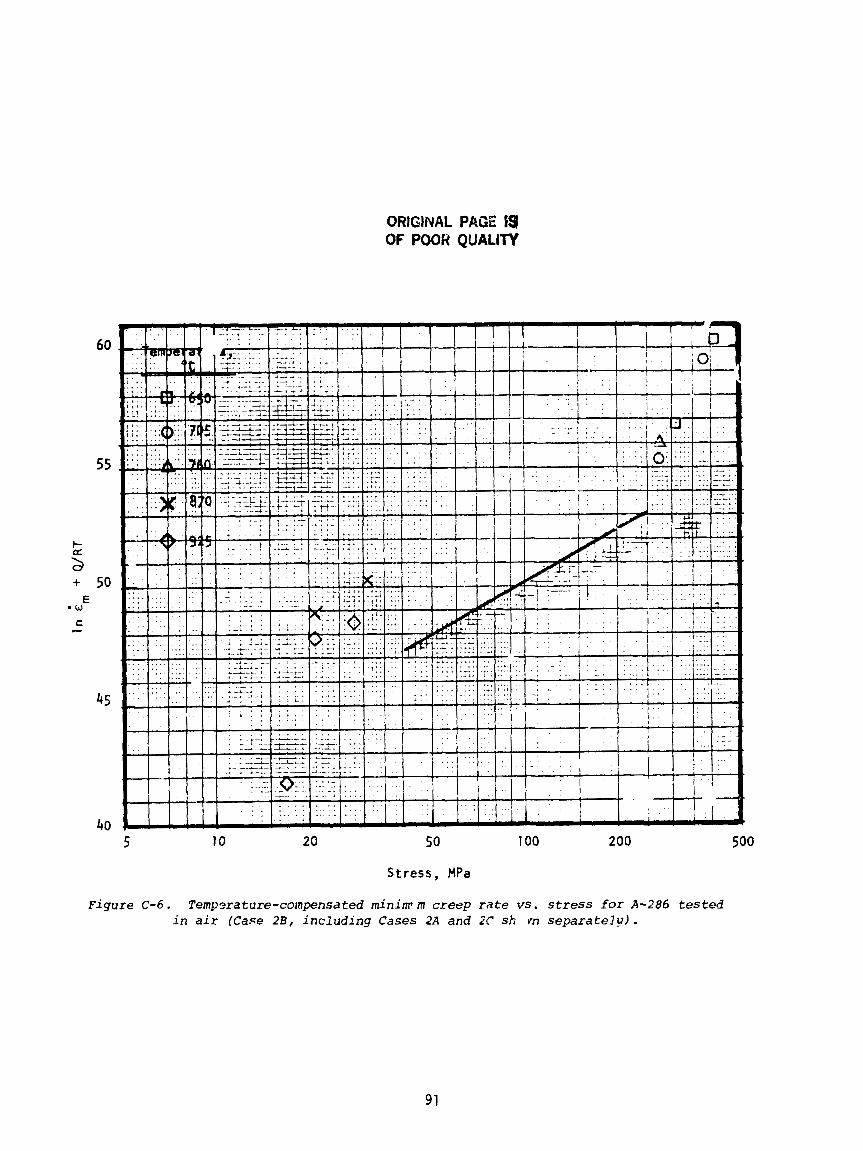
F i g u r e C - 6 . Temporature-comnpensated m i n i m t m c r e e p rate vs. stress f o r A-286 t e s t e d i n a i r (Case 2 B , i n c l u d i n g C a s e s 2A and 2f sh m s e p a r a t e l v ) .
I N 800 IN A I R - CASE 20 LN ( TRUPT) LN (K) + N LN (STRESS) - O/RT, 0 = 406
a-
- 8 .
- - - - ..
Temperature, - - 'C
- - (3 650
. b Q 705
- - A ' 6 0
- - + 815
X 870 - - Q 925
- b
-t I I
I I
1 1 I I 1 1 1 I 1 I I I , 1
I t
I I
STRESS, MPA Figure C-7. Temperature-compensated rupture life vs. Stress for I N ROOH tested i n a i r (Case 2 8 ) .
Stress, MPa
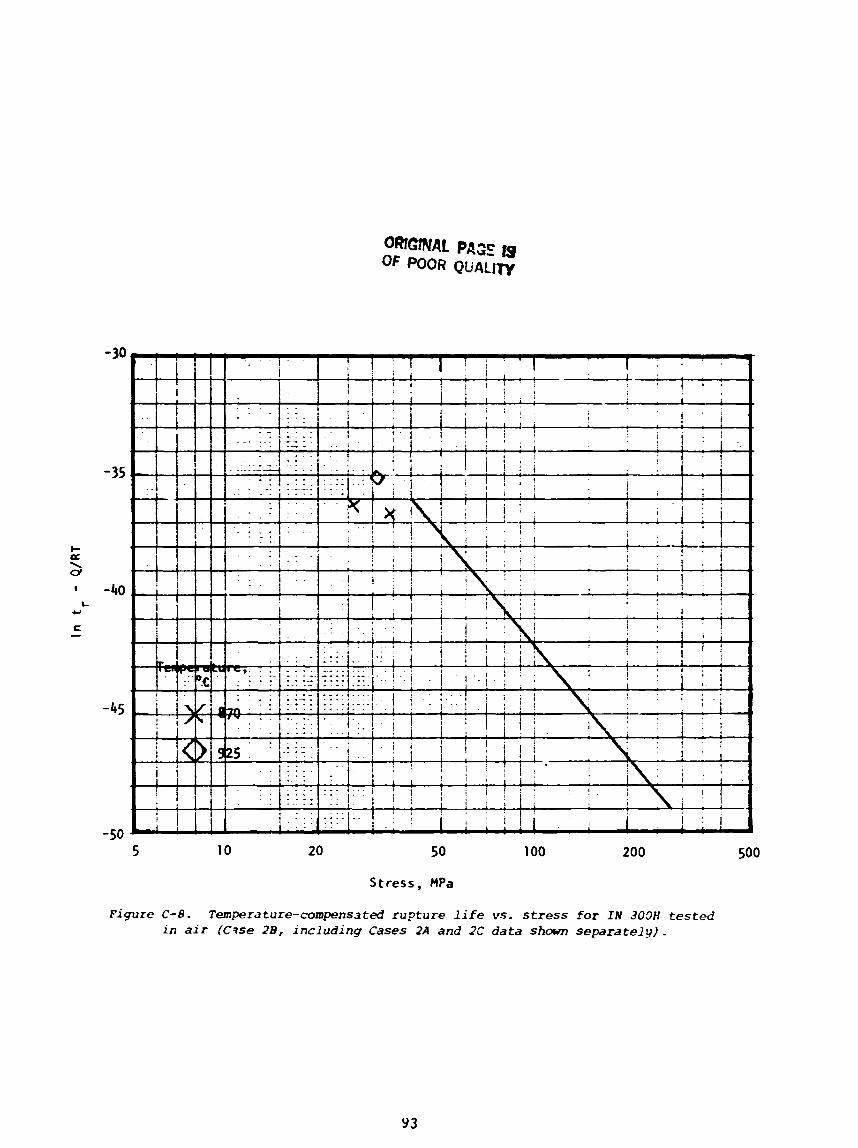
Figure C-8. Temperature-compensated rupture life vs. stress for IN 303H tested in air (Cqse ZB, including Cases 2A and 2C data shorn separately) .
S t ress . HPa
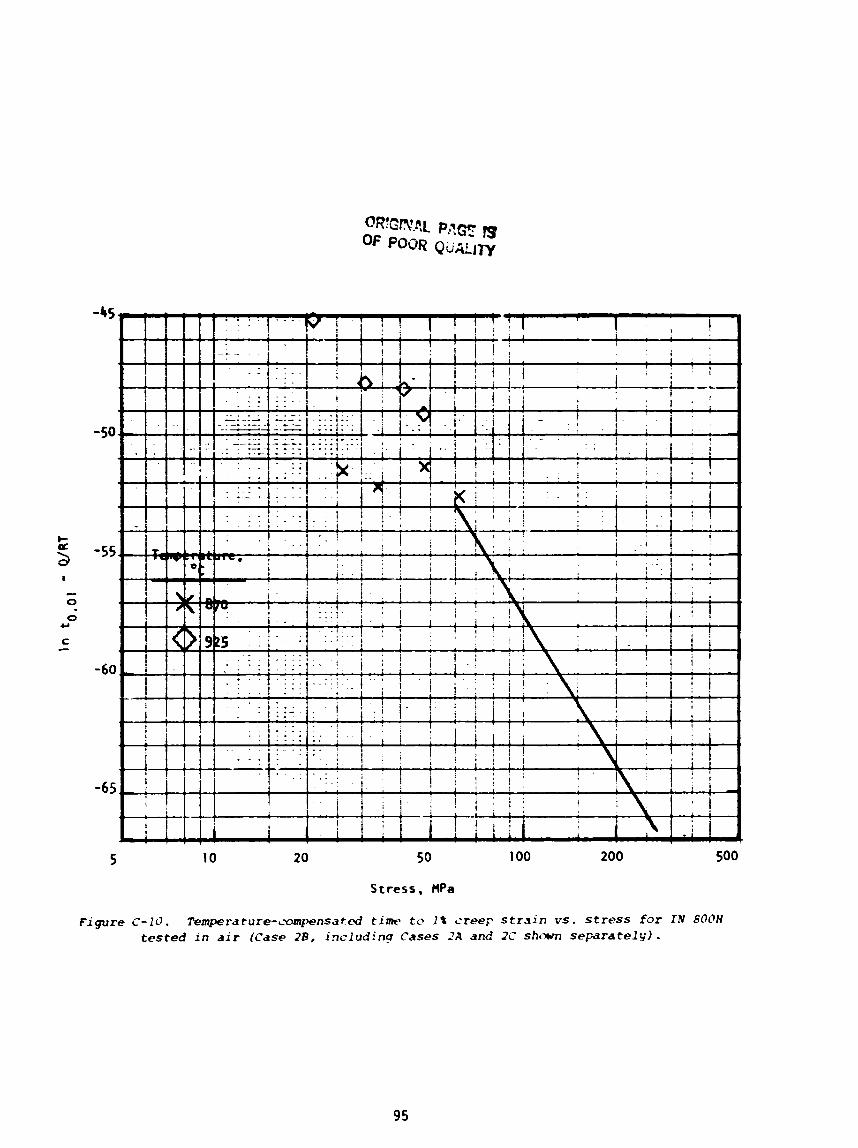
Figure C - I d . Temperature-~mmpensa*ed tim- to I t L-reep strain vs. stress for IN 600H tested in air (Case 2B, includinu Cases 2 A and IC sh;vn separately).
OR
!G!N
P;C F.%
GE IS
OF PO
OR
QU
AL
m
OAISMAL PAGE lq OF POOR QilALf'lY
Stress, MPa
Figure C-14. Temperature-compensated rupture life vs. stress for N-155 tested in air (Case 2B, including Cases 2 A and 3,' data shown separatel,') .
STRESS, MPA
N- 155 I N A I R - CASE 28 LN ( T O 1 1 = LN (K) + N LN (STRESS) - O/RTv 0 467
F i g u r e C-15 . Temperaturecompensated t ime to 1% c r e e p strain vs . stress for N-155 tested i n a i r (Case 2 8 ) .
v
*
. -
-
1
- - -
X - - -
Temperature,
'C - - 0 650
705 - A 760
- + 815
X 870 - 8 925
- 1 1 I 1 L 1 I I I I I I - r I T I 1 I I I I a ,
N-155 I N A I R - CASE 28 *
LN ( CRPRAT) = LN (K) + N LN (STRESS) + O / R T , 0 = 527
..1 h) U & VI Q,YQD(D.-. h) <rl & ul C n u a D c P - h) U L UlQ,YQD* 0 0 0 0 000000 0 0 0 0 0000
0 0 0 0 0 0 000
STRESS, MPA
- - - - - - - - - -
~igure C-17. Temperature-compensated minimum craep rate vs. stress for N-155 tested in air (Case 2B).
>
- - - -
Temperature,
.. 'C
D 650 - Q 705
m A 760
+ 815 - X 870
- 0 925
- - I
I I
I I I I I I I I I 1 I I I I l l
I I I l I l 1 1 I
1 I I I I I I I I
I I
I I
1 I I 1 I l l 1
ORIGINAL PAGE IS OF POOR QUALITY
Stress, MPa
Figure C-18. Tempera ture-compensa t e d minimum c r e e p r a t e vs . stress f o r N-155 t e s t e d i n a i r (Case 2 8 , i n c l u d i n g Cases 2A and 2C shown s e p a r a t e l y ) .
ORlGlNAL PAGE 19 OF POOR QUALITY
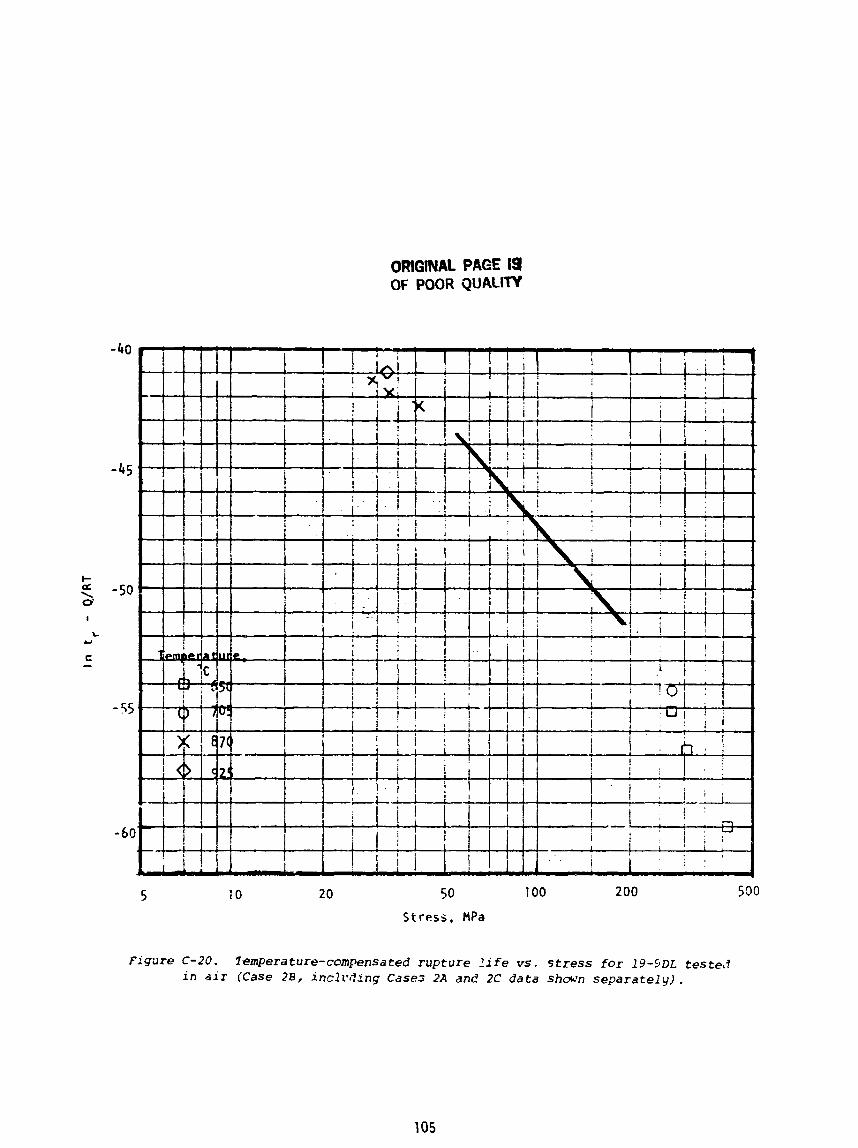
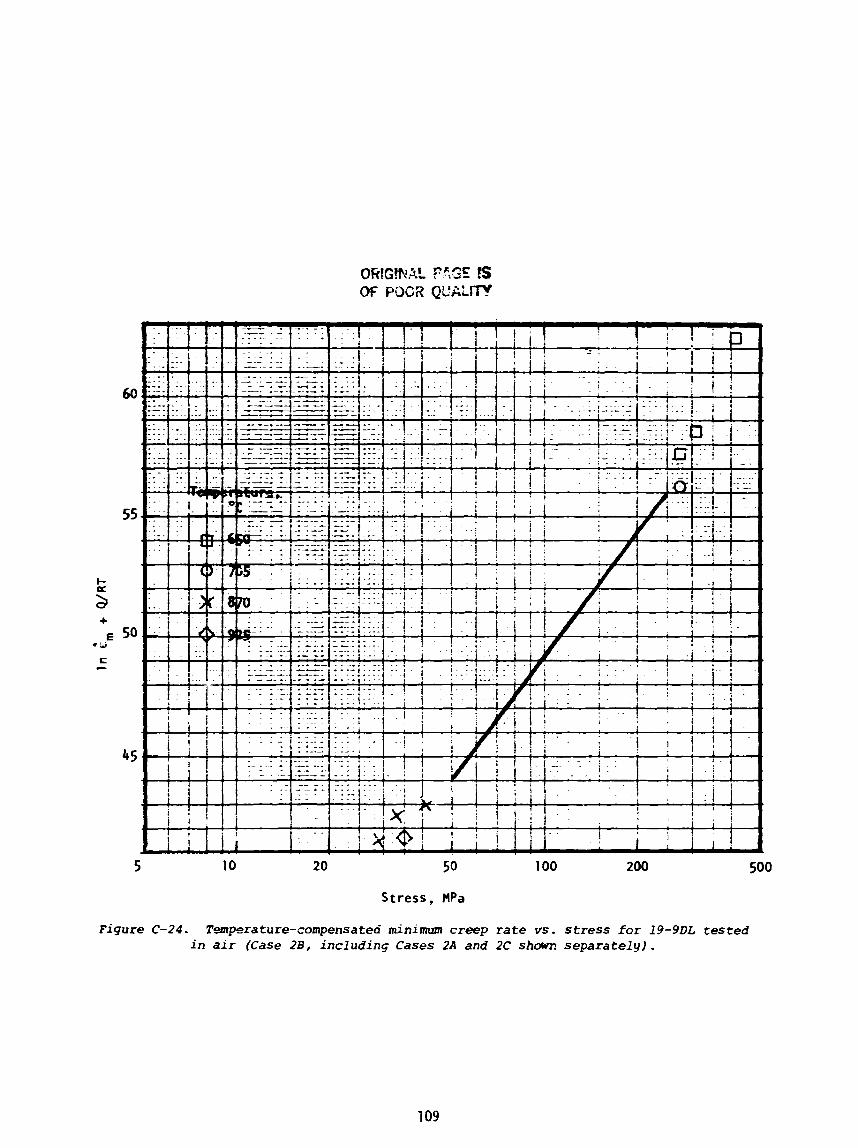
5 10 20 5 0 ! 00 200 500
S t r e s s , MPa
Figure C-20. 7emperature-compensated rupture 2ife vs. stress for 13-4DL tested in air (Case 2B, incl l '2fng Cases 2A and 2C data shown separately).
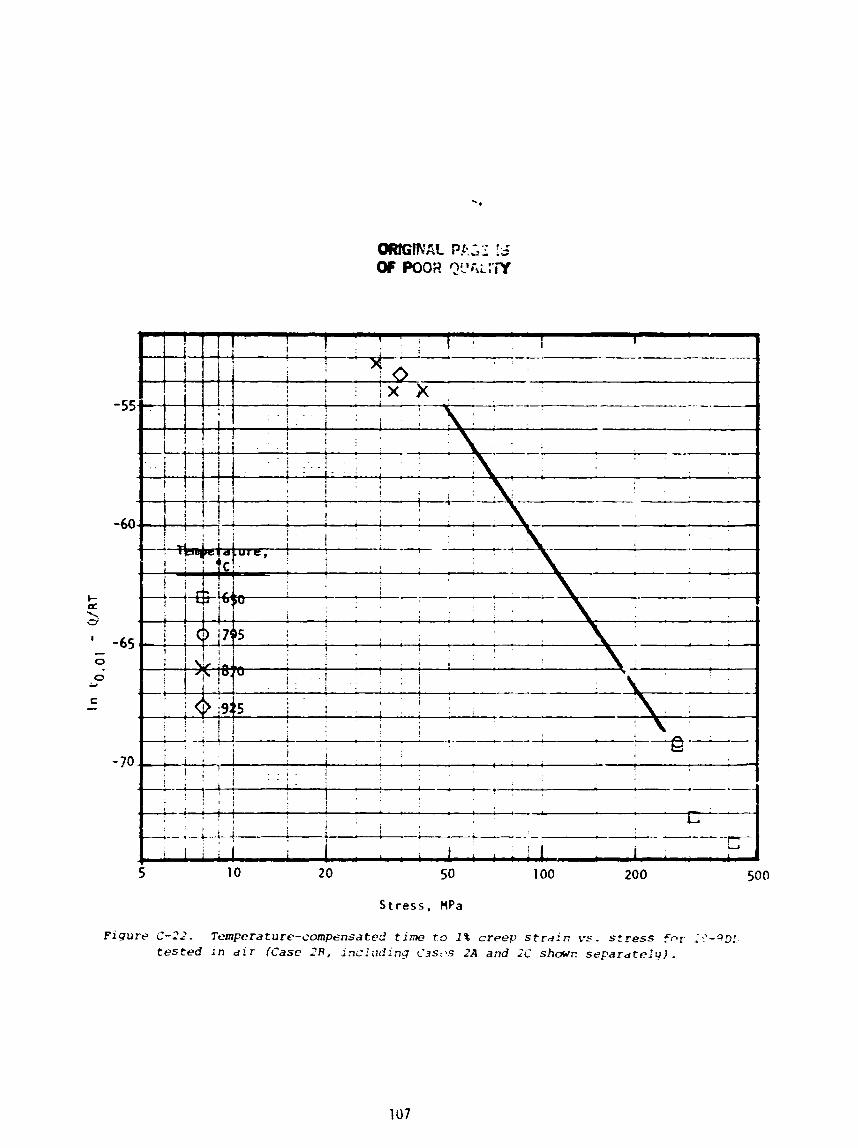
OlPtGiNAL PF,,: I,' Of PO02 ')t';ii:'rY
Stre s s , MPa
Fiqurr C-22- Temperature-compensated time t o :% creep s t r a i n vs. stress fa-r ;.'-?D: tested i n a i r (Case ?R, i n r l a d i n g ~ ' 3 ~ : ~ s 2A and ;C showr: s e p a r d t e 2 y ) .
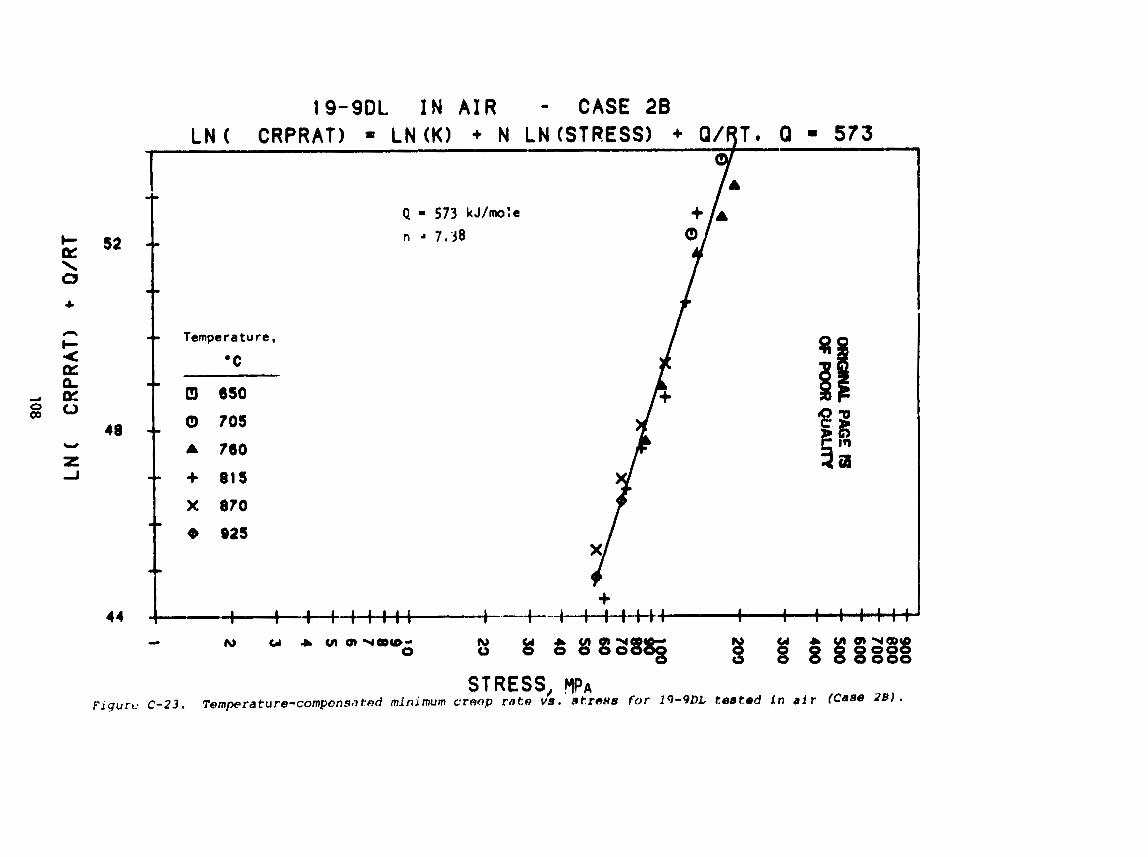
STRESS, PIPA F i 9 . u ~ ~ C-2). Temperature-compons,? t e d minimum craop rate v s , strevs for 19-9DL tealed i n ai r (CaHe Z B )
19-9DL I N A I R - CASE 28 LN ( CRPRAT) LN ( K ) + N LN (STRESS) + O / q T . 0 573
-,
- -L
-I
-- -I
- - I
.I
w
..
Temperature,
' C
650
Q 705 ii$
I f ? g A 760
- + 81s 5: X 870
I
925
m
+ 1 I 1 1 1 1 *+-I---'-- -+ - -4--t-+$-tt-t 1 I I I I I
4 h) U .b V)O,YQDCP.' a 8 a 8 e : a g ~ 3 I5iSQltf
St ress , HPa
Figure C-24. Tswra ture -compensa te6 minimum creep r a t e vs. stress f o r 19-9DL t e s t e d i n a i r (Case 2B, inc lud ing Cases 2A and 2C shown s e p a r a t e l y ) .
St ress , HPa
Figure C-26. Temperature-compensated rupture life vs. stress for CRH-6D tested in air (Case 2B, including Cases ?A and ZC data shown separately).
CRM-6D I N A I R - CASE 20
-42 s LN ( 101) = L N ( K ) + N LN(STRESS1 - Q / R T e 0 = 468
+ e \ -48 0
I -
n C
0 - C
-50 A A
1
u - Z -
-s4 -- - - - - - ..
-58 !
. - - - Q = 468 kJ/mole
n = -10.6 . - - - 11
.. Temperature, -
'C -- I3 650 - 6 705
- Sr A 780
QP a r - + 815 f 3 snm X 870
925 2ra
I I I 1
I 1
( I I I I , I I
I I
1 1 1 , I I
-. h) U a uIQ,UQP* h, a c tTQ,ug5cO 0
h) GI a OlmuaP* 0 0 0 000000
0 0 0 0 0 0 0 0 0 0 0 0 0 0 0 0 0
STRESS, WA @ - 7 . Temperature-compensated time to 1% creep strain us. stress f i r cm-6D tested in a i r !case 2 s ) .
ORIGINAL PAGE OF POOR QUALITY
Stress, MPa
Figure C-28. Temperature-compensated t ime t o 1% c r e e p s t r a i n vs. stress f o r CRM-6D t e s t e d i n a i r (Case ZB, inc lud ing Cases 2A and 2C shown s e p a r a t e l y ) .
OR
IGIN
AL PA
GE 19
OF PO
OR
QU
AL
ln
- 9
- 9
- - - - - - - - - - .3 -
2 7
L
9)
B I-
11
11
11
11
11
11
11
11
1
11
11
11
11
11
l1
~~
~~
~~
0V
)O
V)
OY
)
~~
V)
04
0-
hW
c
L)
hh
QD
QD
O,
EI
E)
6+
XO
-
Stress. HPa
Figure C-30. Tmpera ture-compensated minlmum creep rs te vs . stress for CRM-OD te.:ted in air (Case iB, insludlr~g Cases 2A and ?C shown separatelv).
ORIGINAL PAGE 18 OF POOR QUALITY
Stress, MPa
Figure C-32. Temperature-compensated rupture life vs. str?ss for XF-318 tested in air (Case 2B, including Cases 2A and 2C data a k w n separately) .
oCI1GMAt PAGE rS Of F W R QUALITY
S t r e s s , NPa
Figure C- 14. T o m ~ ~ ~ r ~ t u r r - c ~ ) m j w n s a t ~ ~ d t im. to 1 % crrtB,e strait1 v s . stress for XF- 81.9 tested i n s i r (Case JP, inc l t td ing Cascs 2A and 2C s h w n separately!.
sob
ORK;lML PAGE t9 OF POOR QUALITY
St ress , RPa
Fi qure C-36. Tempera ture-compensa red mini ;rrunr c r e e p r a t e rrs . stress f o r X F - 8 i 8 t e s t e d i n a i r (Case 28 , i n c l u d i n q Cases 2 A and 2C shown s e p a r a t e 1 y.; .