TECHNICAL DIGEST 2008–2009 CHAPTER 8 End-of-Course Assessments 189 Chapter 8 End-of-Course Assessments Overview EOC Participation Requirements Test Development Test Administrations Online Testing Testing Accommodations Scores and Reports Standard Setting Scaling Equating Reliability Validity Student Growth and Projection Measures Sampling Overview On December 16, 2005, Governor Rick Perry issued Executive Order RP53, which called for increased college readiness programs in Texas Public Schools and authorized “the development of a series of voluntary end-of-course assessments in Science, Mathematics, and other subjects, currently assessed by the 11th grade Texas Assessment of Knowledge and Skills, to measure student performance….” As a result of Executive Order RP53, the Texas Education Agency’s (TEA’s) Student Assessment Division began the development of EOC assessments in geometry, biology, chemistry, physics, and U.S. history and reestablished the development for Algebra I. In May 2007, the Texas Legislature enacted Senate Bill (SB) 1031, expanding the role of the EOC assessment program. The bill phases out the Texas Assessment of Knowledge and Skills (TAKS) for grades 9–11 and replaces them with the EOC assessments as a component of the new high school graduation requirements, beginning with the freshman class of 2011–2012. The bill authorized the development of six additional EOC assessments: Algebra II ■ ■ world geography ■ ■ world history ■ ■ English I ■ ■
Transcript
T E C H N I C A L D I G E S T 2 0 0 8 – 2 0 0 9
CHAPTER 8 End-of-Course Assessments 1 8 9
Chapter 8 End-of-Course AssessmentsOverview
EOC Participation Requirements
Test Development
Test Administrations
Online Testing
Testing Accommodations
Scores and Reports
Standard Setting
Scaling
Equating
Reliability
Validity
Student Growth and Projection Measures
Sampling
Overview
On December 16, 2005, Governor Rick Perry issued Executive Order RP53, which called for increased college readiness programs in Texas Public Schools and authorized “the development of a series of voluntary end-of-course assessments in Science, Mathematics, and other subjects, currently assessed by the 11th grade Texas Assessment of Knowledge and Skills, to measure student performance….” As a result of Executive Order RP53, the Texas Education Agency’s (TEA’s) Student Assessment Division began the development of EOC assessments in geometry, biology, chemistry, physics, and U.S. history and reestablished the development for Algebra I.
In May 2007, the Texas Legislature enacted Senate Bill (SB) 1031, expanding the role of the EOC assessment program. The bill phases out the Texas Assessment of Knowledge and Skills (TAKS) for grades 9–11 and replaces them with the EOC assessments as a component of the new high school graduation requirements, beginning with the freshman class of 2011–2012. The bill authorized the development of six additional EOC assessments:
Algebra II■■
world geography■■
world history■■
English I■■
CHAPTER 8 End-of-Course Assessments
T E C H N I C A L D I G E S T 2 0 0 8 – 2 0 0 9
1 9 0
English II■■
English III■■
Additionally, SB 1031 requires that EOC assessments include a series of special purpose items to measure college readiness. EOC assessments in lower-level courses will have items to determine readiness for advanced coursework.
In June 2009, the Texas Legislature enacted House Bill (HB) 3. In addition to requiring the development of a college readiness measure in the Algebra II and English III EOC assessments, HB 3 made the following key changes to the EOC assessment program:
The standards for all 12 EOC assessments will be set prior to the first ■■
mandatory administrations in 2011–2012 for graduation purposes.
The standards will be externally validated by means of several studies ■■
that will ensure the rigor and alignment of the EOC assessments.
TEA will develop and implement improvement measures for the EOC ■■
assessments prior to their being used for state and federal accountability.
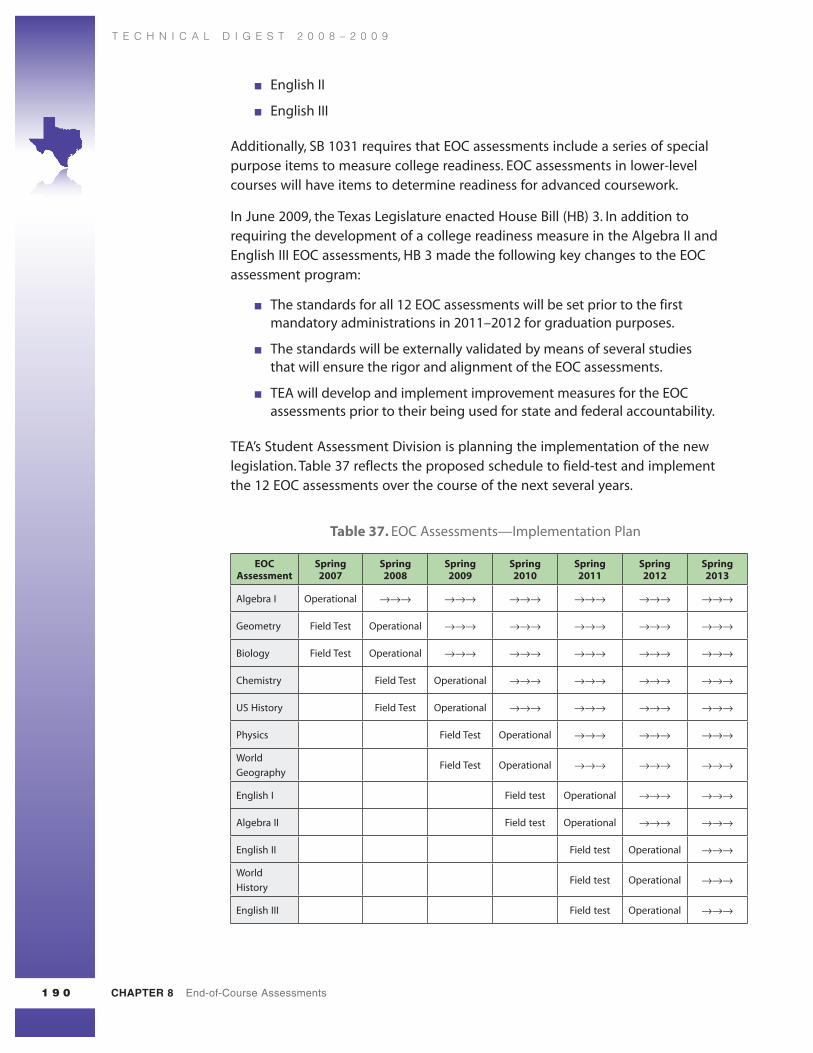
TEA’s Student Assessment Division is planning the implementation of the new legislation. Table 37 reflects the proposed schedule to field-test and implement the 12 EOC assessments over the course of the next several years.
Table 37. EOC Assessments—Implementation Plan
EOC Assessment
Spring 2007
Spring 2008
Spring 2009
Spring 2010
Spring 2011
Spring 2012
Spring 2013
Algebra I Operational →→→ →→→ →→→ →→→ →→→ →→→
Geometry Field Test Operational →→→ →→→ →→→ →→→ →→→
Biology Field Test Operational →→→ →→→ →→→ →→→ →→→
Chemistry Field Test Operational →→→ →→→ →→→ →→→
US History Field Test Operational →→→ →→→ →→→ →→→
Physics Field Test Operational →→→ →→→ →→→
World
GeographyField Test Operational →→→ →→→ →→→
English I Field test Operational →→→ →→→
Algebra II Field test Operational →→→ →→→
English II Field test Operational →→→
World
HistoryField test Operational →→→
English III Field test Operational →→→
T E C H N I C A L D I G E S T 2 0 0 8 – 2 0 0 9
CHAPTER 8 End-of-Course Assessments 1 9 1
EOC Participation Requirements
Any student enrolled in and completing a course in the spring semester for which an EOC assessment is offered is eligible to participate in testing, regardless of grade level. Participation in operational tests—those already implemented—was voluntary in 2008–2009 for each district. If a district chose to participate in testing, it had the flexibility to select participation on a district, campus, and individual student basis.
Test Development
Maintaining a student assessment system of the highest quality involves completing a set of tasks that must be executed during the test development process. The procedures described in chapter 2 outline the steps used to develop a framework for each EOC assessment and explain the ongoing development. Because it is believed that an equitable and accurate measure of learning can be achieved only if development is a shared responsibility, TEA involves educators at each step of the development process.
The following development activities occurred during the 2008–2009 school year:
Using the established test development processes, items were developed and ■■
field-tested in the following courses: Algebra I, geometry, biology, chemistry, physics, world geography, and U.S. history.
For English I, Algebra II, and world history, a focus group made up of curriculum ■■
specialists, teachers, and professors met to review the Texas Essential Knowledge and Skills (TEKS). The group provided input on draft objectives and guidance about how the test could be structured to align with the instruction of the curriculum. From this, a draft set of assessable student expectations and a draft test blueprint was developed for English I, Algebra II, and world history.
For English I and Algebra II, a set of prototype items was written to align with the ■■
draft assessed curriculum in each course. For each course, TEA convened an advisory committee made up of educators representing each of the 20 Texas Educational Service Centers (ESCs). This committee provided an additional review of the draft assessed curriculum and blueprint and also discussed how the prototype items reflected authentic assessment. The committee’s input informed a set of item specifications used by the item writers and item reviewers in developing the first submission of test items for English I and Algebra II.
In preparation for the move to a high-stakes assessment program in 2012, TEA ■■
began preparing to deliver the test in both online and paper versions. Test items were developed so that they could be delivered in both paper and online test formats. A plan was created to establish the comparability of items delivered in paper mode to items delivered in online mode. The plan also sought to minimize formatting issues during item development, such as scrolling, that are known to create a different student experience in paper than in online. The spring 2009 world geography EOC assessment was delivered in both paper and online modes, and a comparability study was conducted to identify field-test items that performed differently on the two modes.
In January 2008 TEA, in conjunction with the Texas Higher Education ■■
Coordinating Board (THECB), adopted a set of College and Career Readiness Standards (CCRS) that identified what students should be able to demonstrate in order to be successful during their first year in college. The CCRS are being incorporated into the TEKS, and the THECB and TEA started developing a college-readiness component for the EOC assessments. As part of the 2008–2009 item development for the Algebra II EOC assessment, items measuring the CCRS were identified, and a plan was established to include educator judgment regarding the appropriateness of items measuring college-readiness.
Test Administrations
The EOC assessments test students’ mastery of the curriculum in the specified courses. The assessable content is defined by the student expectations listed in the TEKS. Because the assessments are designed to be given at the end of the course, the majority of the student expectations are eligible for testing. Students may be given an EOC assessment upon completing the course of study.
All 2008–2009 EOC operational tests and field tests were offered online only with the exception of the 2009 world geography field test, which was offered in both an online and paper version. A comparability study was performed on the world geography field test.
Online Testing
This section briefly describes the online delivery system and provides data on the number of online EOC assessments administered.
The Online Test Delivery System
The online testing system provides a comprehensive set of secure tools for authoring, delivering, and reporting results of tests. It has been developed to meet the stringent requirements of the Texas assessment program and to protect the integrity of test items and student data.
Several key elements have been included in the system’s design to meet the needs of the state’s programs. The system was designed to take advantage of existing hardware and software installed in schools. Access to the site is controlled through specialized login credentials for administrators and students. All transmissions are encrypted and no test items or responses are stored on the local workstation.
Further information about the online system, including an overview of the system, information on delivery and reporting, and a list of frequently asked questions, can be found at http://www.etesttx.com/resources.
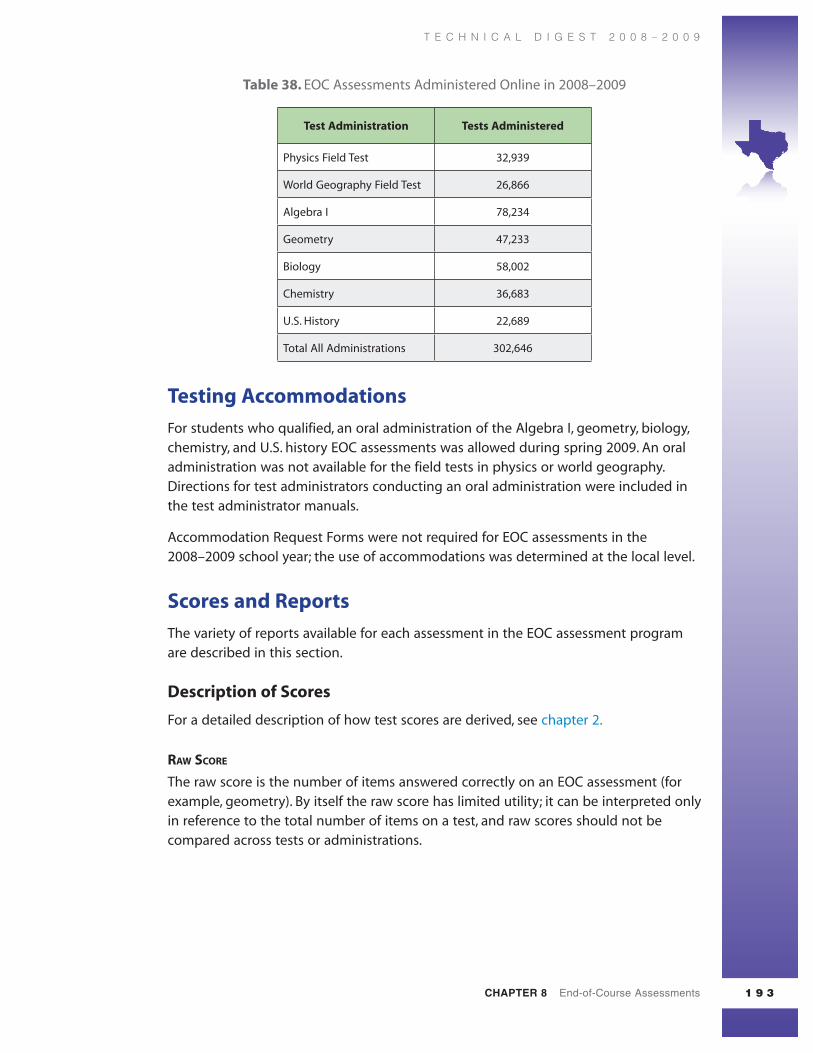
Table 38. EOC Assessments Administered Online in 2008–2009
Test Administration Tests Administered
Physics Field Test 32,939
World Geography Field Test 26,866
Algebra I 78,234
Geometry 47,233
Biology 58,002
Chemistry 36,683
U.S. History 22,689
Total All Administrations 302,646
Testing Accommodations
For students who qualified, an oral administration of the Algebra I, geometry, biology, chemistry, and U.S. history EOC assessments was allowed during spring 2009. An oral administration was not available for the field tests in physics or world geography. Directions for test administrators conducting an oral administration were included in the test administrator manuals.
Accommodation Request Forms were not required for EOC assessments in the 2008–2009 school year; the use of accommodations was determined at the local level.
Scores and Reports
The variety of reports available for each assessment in the EOC assessment program are described in this section.
Description of Scores
For a detailed description of how test scores are derived, see chapter 2.
rAW score
The raw score is the number of items answered correctly on an EOC assessment (for example, geometry). By itself the raw score has limited utility; it can be interpreted only in reference to the total number of items on a test, and raw scores should not be compared across tests or administrations.
Because Algebra I is the only EOC assessment with established passing standards, the Algebra I Confidential Student Report (CSR) also reported the student’s scale score and whether the student had achieved the Met Standard and Commended Performance standards for the Algebra I EOC assessment. See chapter 3 for detailed information about scaling.
Report Formats
Two types of reports are typically provided for the various testing programs: standard and optional. Standard reports are provided automatically to districts. Information contained in standard reports is sufficient to satisfy mandatory reporting requirements. Because the EOC assessment program is voluntary and not part of the reporting for accountability purposes, the EOC assessment program did not provide optional reports for 2008–2009.
Reports that include “Confidential” in the title contain student-level results. These reports are available for authorized users. All other reports present test results in an aggregated format and are considered public information.
Standard Reports
The standard reports available for the EOC assessment program include the CSR and Confidential List of Student Results (CLSR), which are available in PDF format via the online testing system within 24 hours from the close of the testing day session. In addition, Summary Reports and an EOC Data File (Confidential) are posted online for superintendent access shortly following the close of the testing window.
New reports in 2008–2009
To provide additional performance information to districts, three reports were designed for the operational EOC assessments for which performance standards have not yet been established (geometry, biology, chemistry, and U.S. history). These new reports were provided at the district and campus levels and contained aggregated information about students for whom an online record was submitted. A separate report was provided for each subject area.
The new reports designed in 2008–2009 included the Raw Score Frequency Distribution Report—All Students, Raw Score Distribution by Objective Summary Report—All Students, and Cumulative Raw Score Frequency Distribution Report—All Students.
In the EOC assessment program, performance standards currently exist for the Algebra I EOC assessment only. These standards include “Met Standard” at a scale score of 1100 and “Commended Performance” at a scale score of 1400. These standards were set and approved in the fall of 2005. Performance standards for all 12 assessments will be set (or reset, in the case of Algebra I) prior to the first mandatory administrations for graduation purposes in the 2011–2012 school year. Preliminary planning for setting performance standards on all 12 EOC assessments took place during the 2008–2009 school year. See chapter 3 for detailed information about standard setting.
Scaling
As with many of the other programs in the Texas assessment program, the EOC assessment program uses the Rasch Partial-Credit Model (RPCM) to place test items on the same scale across administrations for a given EOC assessment. Once performance standards have been set for an assessment, its initial scale is then transformed to a more user-friendly metric to facilitate interpretation of the test scores. Details of the RPCM scaling method used in Texas are provided in chapter 3.
Scale Score
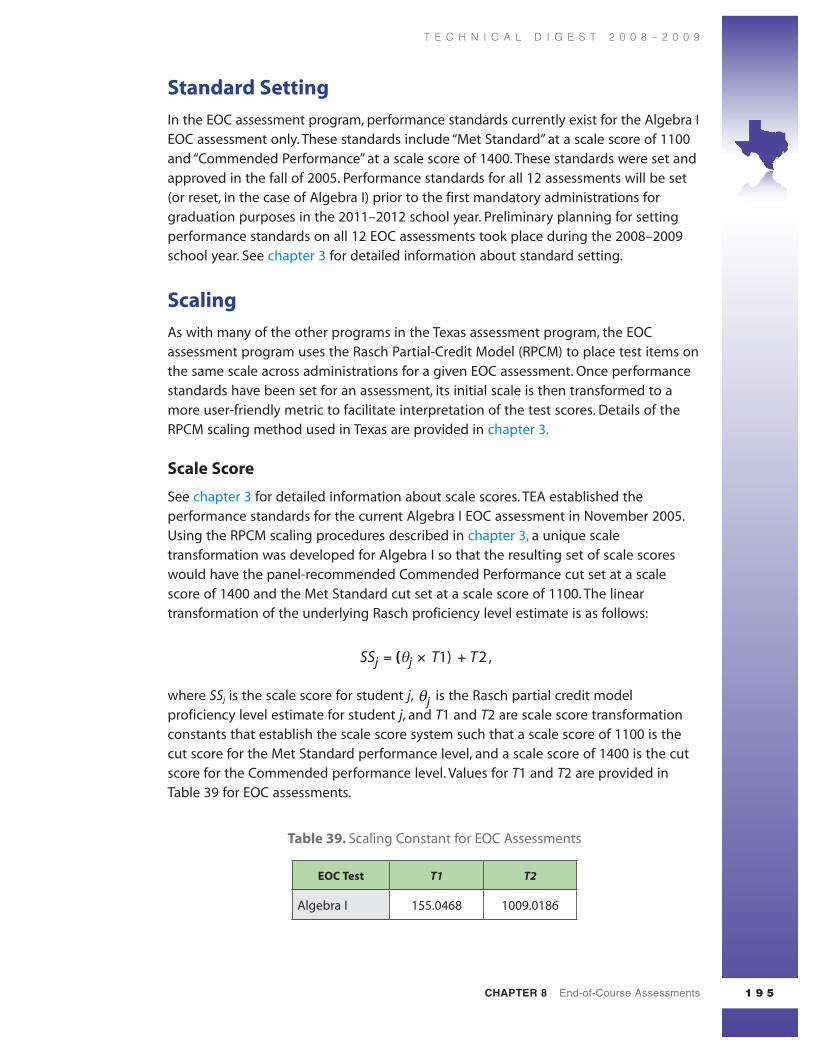
See chapter 3 for detailed information about scale scores. TEA established the performance standards for the current Algebra I EOC assessment in November 2005. Using the RPCM scaling procedures described in chapter 3, a unique scale transformation was developed for Algebra I so that the resulting set of scale scores would have the panel-recommended Commended Performance cut set at a scale score of 1400 and the Met Standard cut set at a scale score of 1100. The linear transformation of the underlying Rasch proficiency level estimate is as follows:
where SSj is the scale score for student j, jθ is the Rasch partial credit model proficiency level estimate for student j, and T1 and T2 are scale score transformation constants that establish the scale score system such that a scale score of 1100 is the cut score for the Met Standard performance level, and a scale score of 1400 is the cut score for the Commended performance level. Values for T1 and T2 are provided in Table 39 for EOC assessments.
In 2009, the EOC assessment program also reported results for several assessments using the raw score scale. Raw score is the number of items that a student answers correctly. These assessments include geometry, biology, chemistry, and U.S. history. The chemistry and U.S. history EOC assessments were administered operationally for the first time in May 2009 and RPCM scaling was conducted to set the baseline Rasch scale for future administrations of these tests. However, because no performance standards have been set for these EOC assessments and the reporting of scores on the Rasch scale would be difficult for test users to understand, only raw scores for these tests were reported. Similar scaling and reporting procedures were also used in the previous year for the geometry and biology EOC assessments.
Equating
During the 2008–2009 school year, two types of equating were conducted in the EOC assessment program: pre-equating and field-test equating. In addition, comparability analyses were conducted for the world geography EOC assessment based on the equating results for the two formats of that test. See chapter 3 for detailed information about equating.
Pre-Equating
In 2008–2009, pre-equating was conducted for Algebra I, the only EOC assessment that currently has scale scores and performance standards. For Algebra I, the 2009 test form was constructed from a bank of items that had been equated to the base-test scale that was established in 2005. Through this pre-equating process, a raw score to scale score conversion table for Algebra I was generated prior to the operational administration of the test. The pre-equating design allowed for student test results on Algebra I to be reported to districts and campuses rapidly after the test was administered. Refer to chapter 3 for a detailed description of the pre-equating process.
Field-Test Equating
To replenish the item bank as new tests are created each year, newly developed items must be field-tested and equated to the scale of the original form. During 2008–2009, field-test equating was conducted for seven EOC assessments: Algebra I, geometry, biology, chemistry, physics, world geography, and U.S. history. The field-test equating process for each test depended on the model in which field-test items was placed on the test form—either through embedded field testing or stand-alone field testing.
For the five EOC operational assessments (Algebra I, geometry, biology, chemistry, and U.S. history), because field-test items were embedded in a test, live test items common to each form of the test were used to place the embedded field-test items onto the baseline scale of each EOC assessment. Chapter 3 provides more details about the procedures for equating embedded field-test items.
For physics and world geography, where no operational test forms existed, newly constructed items were placed on stand-alone field-test forms. For these two assessments, a set of linking items common across all field-test forms were used to equate the field-test items to each other. The field-test form taken by the most students (that is, with the largest n-count) became the baseline scale and the items from the other field-test forms were moved onto that scale using the linking items. The specific procedure for equating stand-alone field-test items is described in further details in chapter 3.
Comparability Analyses
In 2009, the world geography EOC assessment was administered in both paper and online modes for the first time. Comparability analyses were therefore conducted between the online and paper versions of the world geography stand-alone field test. The comparability study was conducted to evaluate potential test-mode effects at the item and field-test form levels. Item level analyses included evaluation of differences in p-values, Rasch item difficulties, and differential item functioning. Field-test form level analyses included two different approaches for evaluating mean differences in raw scores for the total test form. Results of the study showed that very few items (6%) or test forms (18%) showed differences between the online and paper versions. The specific procedures used to evaluate comparability as well as the detailed results of the analyses can be found in the “2009 End-of-Course World Geography Online Comparability Study Report” in the TEA technical report series. The results from the comparability study were used to facilitate field-test equating and will be used in future test construction. See chapter 3 for detailed information about comparability analyses.
Reliability
During 2008–2009 school year, reliability for the five operational EOC assessments were estimated through several reliability indices, including internal consistency, classical standard error of measurement, conditional standard error of measurement, and classification accuracy. See chapter 3 for detailed information about reliability.
Internal Consistency
The Kuder-Richardson Formula 20 (KR20) was used to calculate the reliability estimates for all EOC assessments. As a general rule, reliability coefficients from 0.70 to 0.79 are considered adequate, 0.80 to 0.89 are considered good, and above 0.90 are considered excellent. However, appropriate levels of reliability depend on how an assessment is being used. For the EOC assessment program, the internal consistency estimates range
from 0.89 to 0.92. The internal consistency estimates for the EOC assessments can be found in Appendix F. See chapter 3 for detailed information about internal consistency.
Classical Standard Error of Measurement
For the EOC assessments, SEM values range from 2.88 to 3.6. The SEM values for the EOC assessments are provided in Appendix F. See chapter 3 for detailed information about standard error of measurement.
Conditional Standard Error of Measurement
During the 2008–2009 school year, only the Algebra I EOC assessment had Conditional Standard Error of Measurement (CSEM) estimates. The Algebra I EOC assessment has CSEM values because it is the only EOC assessment with performance standards. CSEM is typically only computed for assessments that have performance standards. The CSEM estimate for Algebra I at the scale score of 1100 (Met standard cut) is 48, and the CSEM estimate for Algebra I at the scale score of 1400 (Commended cut) is 75. Appendix F contains the Algebra I CSEM estimates.
Classification Accuracy
As with CSEM, classification accuracy was only calculated for Algebra I because it is the only EOC assessment with performance standards. In 2008–2009, the Algebra I assessment had an 87.5% agreement between expected and observed classifications for students who were in the two levels of performance (Met Standard and Commended Performance). Appendix F contains the classification accuracy table for Algebra I. See chapter 3 for detailed information about classification accuracy.
Validity
The sections that follow describe how validity evidence was collected for the EOC assessments in 2008–2009. See chapter 3 for detailed information about validity.
Evidence Based on Test Content
Evidence based on test content is information that shows the relationship between content of the test and the test constructs that are supposed to be measured by the test. The EOC assessments have been developed to align with the content defined by the TEKS. Content validity evidence has been collected at all stages of the test development process.
Established test development processes for the Texas assessment program were followed in developing the EOC assessments to support the use of EOC test scores in making inferences about students’ knowledge and understanding of the TEKS.
The following activities took place during the 2008–2009 school year to support the content validity of EOC assessments.
relAtionshiP to the stAteWide curriculum
Teachers, curriculum specialists, test development specialists, and TEA staff members worked together in focus groups and advisory committees to identify appropriate assessment objectives for new EOC assessments in Algebra II, English I, and world history. The input of the focus groups and advisory committees is reflected in EOC draft assessed curriculum documents and item specifications.
Prototype items were developed for the new assessments in English I and Algebra II. These prototypes were reviewed by educator committees to identify how well they measured the student expectations to which they were aligned, and to inform item-development guidelines and test-item types.
educAtor inPut
Following item development for each EOC assessment, committees of Texas educators met to review test items and confirm that each item appropriately measured the TEKS to which it is aligned. The committees also reviewed and edited the items for content and bias. These reviews occurred for Algebra I, geometry, biology, chemistry, physics, world geography, and U.S. history. There were two rounds of educator input per course: item review, in which the items were revised and edited before field testing occurred, and data review, in which the educators reviewed the field-test performance data of each item, and made a judgment about whether the item appropriately measured the construct and was eligible for placement on an operational, or live, test.
test develoPer inPut
Item writers and reviewers followed test development guidelines that informed how the content of the assessed TEKS should be measured. At each stage of development, writers and reviewers verified the alignment of the test items with the assessed objectives.
test exPert inPut
Planning for implementation of a college-readiness measure on the EOC assessments began in the 2008–2009 school year. In a joint initiative by TEA and THECB, a panel of national college-readiness experts was convened to provide input on how well Algebra II and English III might predict success in college-level courses, what assessment structure would best support the inclusion of a college-readiness component, how performance on the college-readiness component relates to a graduation standard, and ways in which the predictive ability and validity of the college-readiness measure might be verified.
CHAPTER 8 End-of-Course Assessments
T E C H N I C A L D I G E S T 2 0 0 8 – 2 0 0 9
2 0 0
As EOC assessments transition from the low-stakes environment in which they were developed and administered beginning in 2005 to the high-stakes graduation measure under which they are now developed and will be administered in 2012, evidence of curricular and instructional validity are being gathered to determine 1) if there is a match between the tested content drawn from the state curriculum standards and classroom curricular materials, and 2) if there is a match between the tested content and what is being taught in the classrooms. This evidence has been collected as part of both student surveys and the item-by-item judgments made by educators during item review.
TEA, in conjunction with Pearson, receives ongoing input from a panel of national testing experts related to all plans for collecting validity evidence for Texas testing programs, including EOC assessments. In November 2008, the Texas Technical Advisory Committee (TTAC) provided input on data collection methods for obtaining evidence of curricular and instructional validity.
Evidence Based on the Response Process
Response processes refer to the cognitive behaviors required to respond to a test item. For the EOC assessments, Texas collects validity evidence based on response process through the different item types on each test and the mode in which tests were administered. For the EOC assessments, this was reflected in the different item types on each test and the mode in which tests were administered.
Multiple-choice items were the primary type of items to which students were asked to respond on all EOC assessments. This type of item was used because it most closely resembles what students typically saw in classroom testing. The multiple-choice items were developed so that students were required to recall and, in some cases, to apply what they had learned about the subject area, thereby supporting an accurate measurement of the construct being assessed. For the Algebra I, geometry, chemistry, and physics assessments, griddable items, which required the students to perform a series of mathematical computations and then explicitly grid in (or type in, for online tests) their answers, were also administered. These item types facilitated the assessment of the students’ knowledge and skills at an even deeper level by requiring them to employ the mathematics techniques or strategies they had acquired in their learning. These skills were essential in assessing the construct in the mathematics and science content areas. In addition, cluster items were used for the biology, world geography, and U.S. history EOC assessments. Cluster items are a group of multiple-choice items associated with a common stimulus such as a reading passage, a graph, or a map. The use of cluster items typically required students to apply their knowledge and skills within the context introduced by the stimulus in order to respond correctly to the items. This skill was also important in assessing the construct in content areas such as science, social studies and English language arts.
T E C H N I C A L D I G E S T 2 0 0 8 – 2 0 0 9
CHAPTER 8 End-of-Course Assessments 2 0 1
Evidence Based on Internal Structure
Texas collects evidence that shows the relationship among test questions and test objectives to demonstrate that the parts of a test conform to the test construct. When tests are designed to measure a single construct, the internal components of the test should exhibit a high level of homogeneity, which can be evaluated in terms of the internal consistency estimates of reliability. Refer to the Reliability section for descriptions and estimates of internal consistency in the EOC assessments during 2008–2009.
Evidence Based on Relationship to Other Variables
Another source of validity evidence is the relationship between test performance and performance on some other measure, sometimes called criterion-related validity. Planning for validity studies that will correlate student performance between EOC assessments in the mathematics and English content areas began during the 2008–2009 school year. In addition, future studies that evaluate the relationship between the EOC assessments and other external assessments such as the SAT and ACT assessments are being planned. Results for these validity studies can be used to provide criterion-related validity evidence for the EOC assessments and may also be used in the standard-setting process to support the validity of the performance standards.
Evidence Based on the Consequences of Testing
Another way to provide validity evidence is by documenting the intended and unintended consequences of administering an assessment. Validity evidence showing the impact of EOC testing on students was collected through a question on the online survey at the end of each operational EOC assessment (Algebra I, geometry, biology, chemistry, and U.S. history). The survey was voluntary for students and asked them the question“Forwhatpercentofyourcoursegradedoesthistestcount?”Thesurveyresults showed that, across the five EOC assessments, most students (71–75%) who responded to the question did not know whether their EOC test scores would count toward their final grade in the course, but some students (about 12–24% across the five tests) responded that the EOC test scores did not affect their course grades. This provided evidence that the results from the EOC assessments had academic consequences for some students in 2008–2009.
Student Growth and Projection Measures
Student growth and projection measures track a student’s performance across time. Improvement measures track student performance from year to year, whereas projection measures use current student performance to predict future performance. No student growth or projection measures currently exist for the EOC assessment program. During the 2008–2009 school year, TEA and Pearson began initial planning for the development of student growth and projection measures in the EOC
CHAPTER 8 End-of-Course Assessments
T E C H N I C A L D I G E S T 2 0 0 8 – 2 0 0 9
2 0 2
assessments to meet federal and state accountability requirements. Growth and projection measures will become available as soon as practicable after the EOC assessments become mandatory for graduation purposes.
Sampling
In the EOC assessment program, sampling was used to select campuses to participate in an assessment’s first-time stand-alone field test for the 2008–2009 school year. Stand-alone field tests were conducted for the two new EOC assessments: physics and world geography. The field testing for physics was given in the online mode only, while the world geography field test was offered in both paper and online modes. Campuses were specifically sampled to participate in each of the EOC stand-alone field tests (physics or world geography). Campuses selected for the world geography field test were specifically assigned to test in one of the two modes: paper or online. Participation in the EOC field tests by all selected campuses was mandatory. Campuses not selected to participate in one of the stand-alone field tests could volunteer to take the test in one of the available modes. See chapter 3 for detailed information about sampling.
EOC Field-Test Sampling Process
The EOC stand-alone field test used a stratified sampling design in which the campus was the sampling unit, but student was the observation unit. Each campus was classified into one of three strata based on its campus size, or estimated student count for the field test. Because campus was the sampling unit, it was necessary to obtain the student course enrollment from each campus as an estimate of number of students that would participate in the field test. The estimated student counts for each campus were based on the number of students who were enrolled in the physics and world geography courses in fall 2007.
TEA initiated a sampling model in spring 2006 that provided a “relief year” to campuses so that each campus would have a minimum of one in every five years during which it would not be asked to participate in TAKS stand-alone field testing. This “relief year” process implemented originally for TAKS was extended to include the EOC field tests such that campuses that had participated in either the TAKS or EOC stand-alone field testing for the previous four years were exempted from selection in the 2009 EOC stand-alone field tests in physics and world geography.
In addition to the “relief year” process, the following factors were considered in determining each EOC field-test sample for 2009:
The sample was chosen to be representative of the overall population of ■■
Texas high school students taking the course (physics or world geography) in terms of ethnic composition and campus size.
The sample was selected to include a minimum of 280 students per form from ■■
each major ethnic and gender subgroup (i.e., African American, Hispanic, white, male and female groups).
Campuses were selected for inclusion in either the physics or world geography ■■
sample, but not both. Campuses selected to test in world geography were assigned to either the online or paper testing mode.
Each campus in a sample was required to test all of the enrolled students in the ■■
course (physics or world geography), regardless of grade, up to a maximum of 200 students during the testing window.
To reduce the district and campus field-testing burden, eligibility criteria were ■■
used to eliminate the following campuses from the sample:
Campuses who had been academically unacceptable (i.e., failed in ■ɶ
meeting the state standards) for 3 or more years.
Campuses who had failed in meeting Adequate Yearly Progress (AYP) for 5 ■ɶ
or more years.
Campuses that are part of the Juvenile Justice Alternative Education ■ɶ
Program (JJAEP), Disciplinary Alternative Education Programs (DAEP), or Texas Youth Commission (TYC).
Campuses selected for testing as part of the National Assessment of ■ɶ
Educational Progress (NAEP) in 2009.
The process for selecting campuses to be included in each EOC field-test sample was as follows:
1. All eligible campuses were divided into three even-sized strata based on campus size (i.e., strata 1, 2, and 3). If a number of campuses of equal size appeared around the threshold between strata, the placement in the upper or lower strata was done randomly.
2. Campuses were sorted randomly within each stratum.
3. One campus was randomly selected from each stratum. Each campus was chosen into the sample in ascending and descending order of strata (e.g., 3-2-1-1-2-3-3-2-1-…). For example, the first campus was chosen from stratum 3, the second campus from stratum 2, the third campus from stratum 1, the fourth campus from stratum 1, the fifth campus from stratum 2, etc. Thus, one campus was selected in one stratum first before moving to the next stratum.
4. The number of students in the sample was evaluated relative to the target total number of students after the campus had been selected. Step 3 was repeated until the target number of students was reached.
5. A “fit index” was calculated for the resulting sample of campuses. This index indicated how well the selected campuses reflected the demographic breakdown of the students enrolled in the physics or world geography course statewide.
CHAPTER 8 End-of-Course Assessments
T E C H N I C A L D I G E S T 2 0 0 8 – 2 0 0 9
2 0 4
6. Steps 1 to 5 (from dividing campuses into three strata to calculating the fit index) were repeated up to 1,000 times. Any sample for which the fit index indicated that the sample was within 3 percent of the target demographic breakdown was reviewed by a psychometrician, who selected a final sample using professional judgment.
7. Once the final sample was determined, it was regenerated using the appropriate random number seed so that additional detailed output descriptive statistics for this sample could be generated.
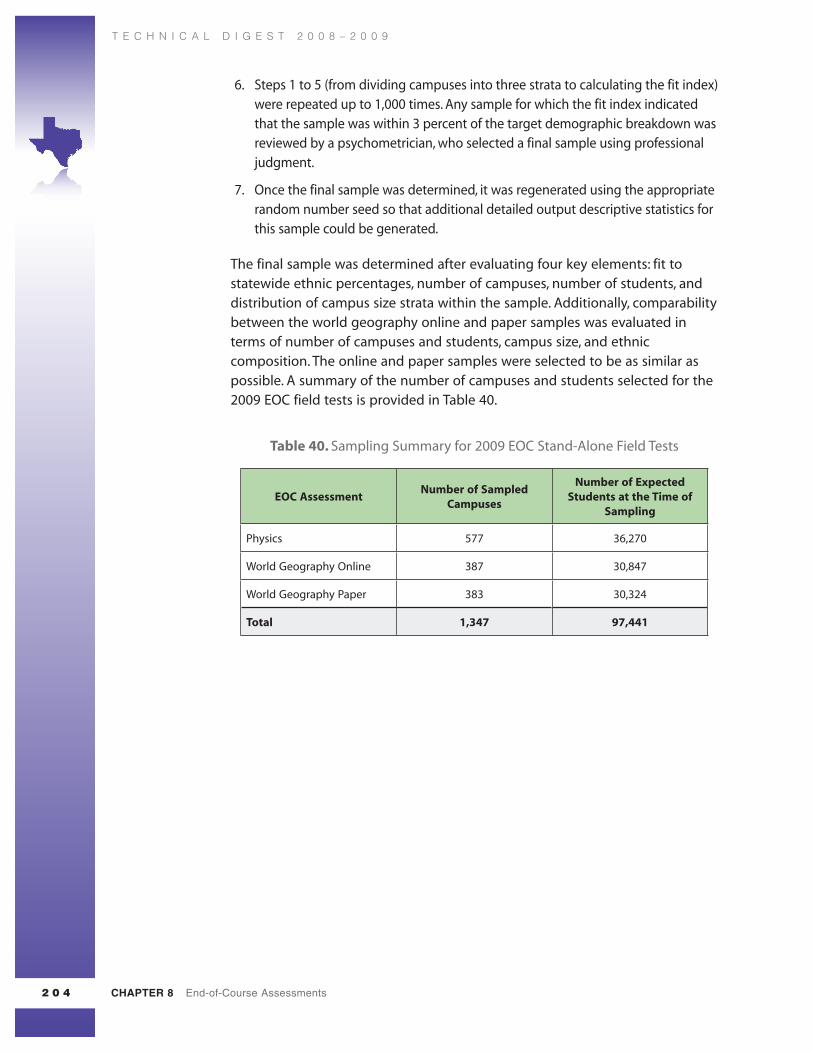
The final sample was determined after evaluating four key elements: fit to statewide ethnic percentages, number of campuses, number of students, and distribution of campus size strata within the sample. Additionally, comparability between the world geography online and paper samples was evaluated in terms of number of campuses and students, campus size, and ethnic composition. The online and paper samples were selected to be as similar as possible. A summary of the number of campuses and students selected for the 2009 EOC field tests is provided in Table 40.
Table 40. Sampling Summary for 2009 EOC Stand-Alone Field Tests