100
Department of Transportation Action Agenda Chicago Forward
| Date post: | 17-Jan-2023 |
| Category: |
Documents |
| Upload: | khangminh22 |
| View: | 0 times |
| Download: | 0 times |
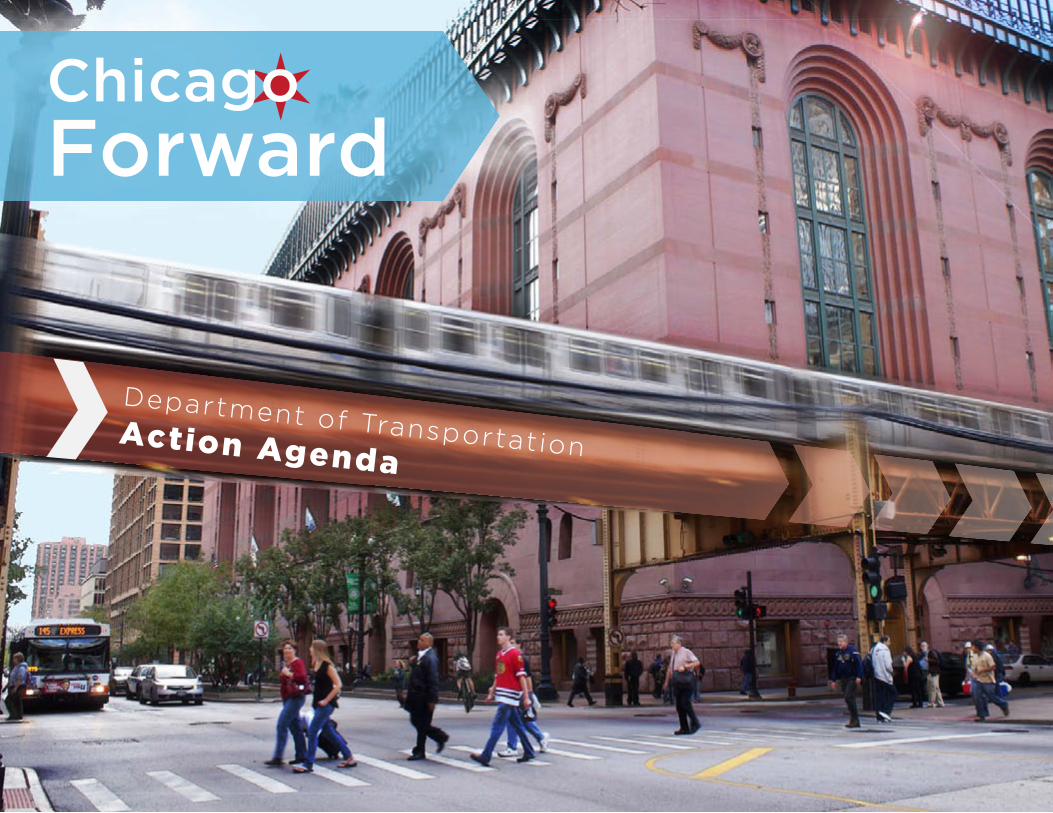
Department of Transportation Action Agenda
Chicago Forward
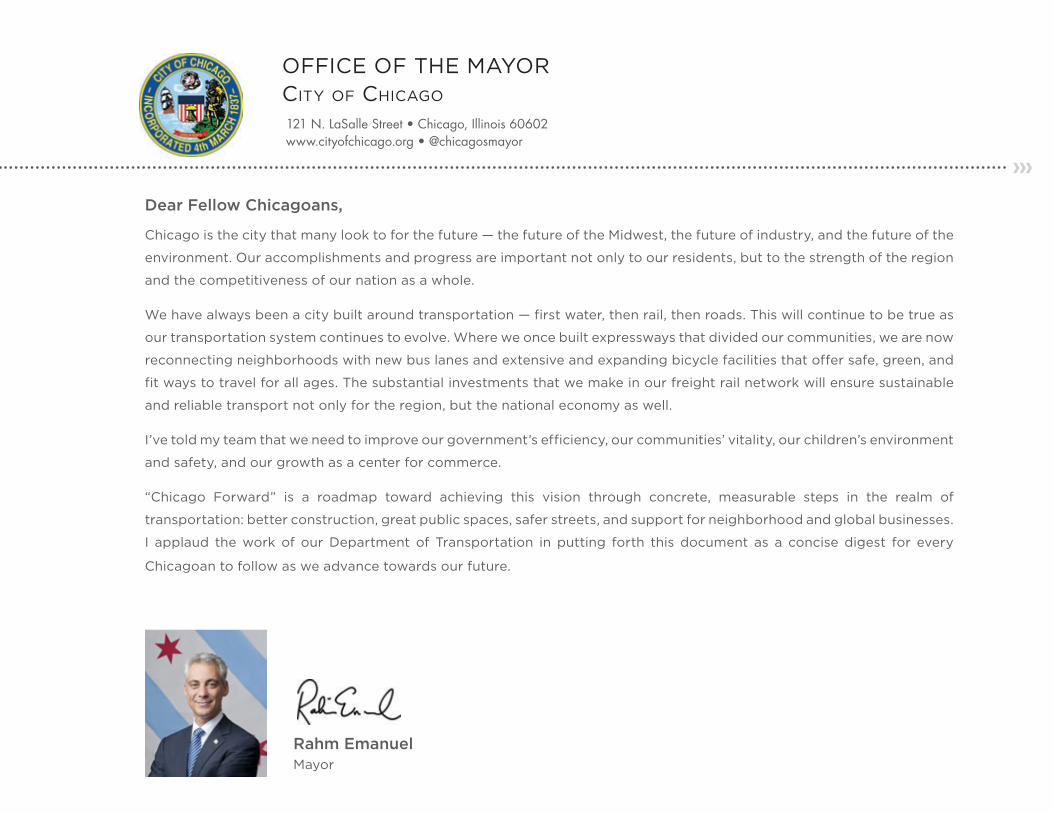
Dear Fellow Chicagoans,
121 N. LaSalle Street • Chicago, Illinois 60602 www.cityofchicago.org • @chicagosmayor
OFFICE OF THE MAYORCity of ChiCago
Rahm EmanuelMayor
Chicago is the city that many look to for the future — the future of the Midwest, the future of industry, and the future of the
environment. Our accomplishments and progress are important not only to our residents, but to the strength of the region
and the competitiveness of our nation as a whole.
We have always been a city built around transportation — first water, then rail, then roads. This will continue to be true as
our transportation system continues to evolve. Where we once built expressways that divided our communities, we are now
reconnecting neighborhoods with new bus lanes and extensive and expanding bicycle facilities that offer safe, green, and
fit ways to travel for all ages. The substantial investments that we make in our freight rail network will ensure sustainable
and reliable transport not only for the region, but the national economy as well.
I’ve told my team that we need to improve our government’s efficiency, our communities’ vitality, our children’s environment
and safety, and our growth as a center for commerce.
“Chicago Forward” is a roadmap toward achieving this vision through concrete, measurable steps in the realm of
transportation: better construction, great public spaces, safer streets, and support for neighborhood and global businesses.
I applaud the work of our Department of Transportation in putting forth this document as a concise digest for every
Chicagoan to follow as we advance towards our future.
Dear Friends,
30 N. LaSalle Street, Suite 1100 • Chicago, Illinois 60602 www.chicagodot.org • @ChicagoDOT
DEPARTMENT OF TRANSPORTATIONCity of ChiCago
Gabe KleinCommissioner, Department of Transportation
Chicago’s transportation network is the envy of the nation in many ways: we are the preeminent hub of the world’s most
extensive freight rail system; home to two of the nation’s busiest airports; have a well-established and well-used bicycle
network; support one of the nation’s busiest transit systems; and many Chicago sidewalks bustle with activity day and
night.
However, we face substantial challenges too: Chicago is first in the nation for regional traffic congestion; bottlenecks disrupt
and delay our freight and passenger rail services; roadway crashes cost time, money, and lives; and rates of childhood
obesity are well above national averages, endangering health over a lifetime.
But we are up to overcoming all of these challenges. I am honored to lead a team of the nation’s best transportation
professionals at CDOT. We aspire to plan, build, and maintain a transportation system that improves the quality of life for
everyone in Chicago — one that is balanced to serve the needs, safety, and health of all users, regardless of how or where
they are traveling, and regardless of their age or ability.
“Chicago Forward” outlines the critical values and principles we aspire to as protectors of the city’s transportation network
and the policies and actions that will help us continually make progress toward those ideals. It documents the specific,
measurable targets that I have established for the Department and the outcomes we expect to accomplish within the next
two years.
I look forward to working with the citizens and leadership of the city in achieving the goals of Chicago Forward. Doing so
will make Chicago an even stronger economic engine and environmental leader for the next generation.
6
7
This agenda has six principles, one for each point on the Chicago flag’s stars. Use the colors and the star in each upper left corner to find the pages about each principle.
Table of ConTenTs
Chicago Timeline 8
Vision Statement 10
Mission Statement 11
REWIND 12
SAFETY FIRST 14
REBUILD & RENEW 26
CHOICES FOR CHICAGO 38
SERVING CHICAGOANS 52
A MORE SUSTAINABLE CITY 64
FUEL OUR ECONOMY 78
ONWARD 92
Exhibit List 94
Photo Credits 96
End Notes 97
Policy Summary 98
Acknowledgements 99
1600
1700
1800
1900
1910
1920
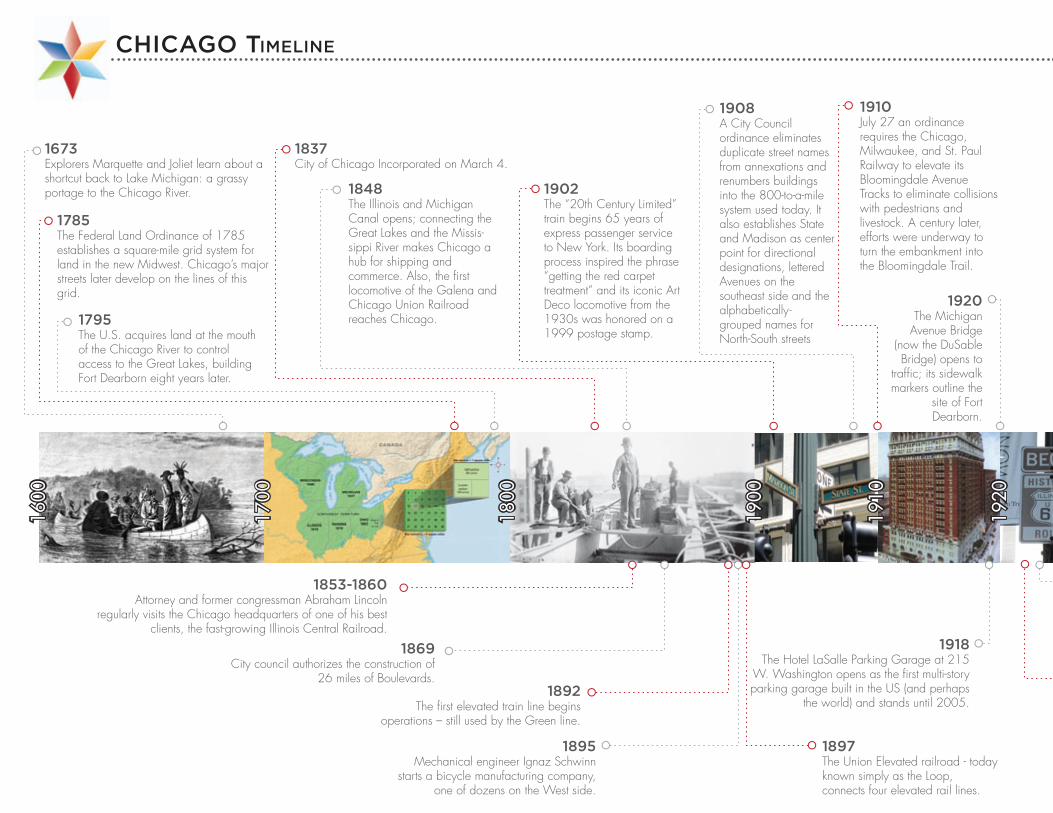
1902The “20th Century Limited” train begins 65 years of express passenger service to New York. Its boarding process inspired the phrase “getting the red carpet treatment” and its iconic Art Deco locomotive from the 1930s was honored on a 1999 postage stamp.
1673Explorers Marquette and Joliet learn about a shortcut back to Lake Michigan: a grassy portage to the Chicago River.
1785The Federal Land Ordinance of 1785 establishes a square-mile grid system for land in the new Midwest. Chicago’s major streets later develop on the lines of this grid.
1795The U.S. acquires land at the mouth of the Chicago River to control access to the Great Lakes, building Fort Dearborn eight years later.
1837City of Chicago Incorporated on March 4.
1848The Illinois and Michigan Canal opens; connecting the Great Lakes and the Missis-sippi River makes Chicago a hub for shipping and commerce. Also, the first locomotive of the Galena and Chicago Union Railroad reaches Chicago.
1853-1860Attorney and former congressman Abraham Lincoln
regularly visits the Chicago headquarters of one of his best clients, the fast-growing Illinois Central Railroad.
1869City council authorizes the construction of
26 miles of Boulevards.1892
The first elevated train line begins operations – still used by the Green line.
1892The first elevated train line begins
operations – still used by the Green line.
1895Mechanical engineer Ignaz Schwinn
starts a bicycle manufacturing company, one of dozens on the West side.
1897The Union Elevated railroad - today known simply as the Loop, connects four elevated rail lines.
1908A City Council ordinance eliminates duplicate street names from annexations and renumbers buildings into the 800-to-a-mile system used today. It also establishes State and Madison as center point for directional designations, lettered Avenues on the southeast side and the alphabetically-grouped names for North-South streets
1910July 27 an ordinance requires the Chicago, Milwaukee, and St. Paul Railway to elevate its Bloomingdale Avenue Tracks to eliminate collisions with pedestrians and livestock. A century later, efforts were underway to turn the embankment into the Bloomingdale Trail.
1918The Hotel LaSalle Parking Garage at 215
W. Washington opens as the first multi-story parking garage built in the US (and perhaps
the world) and stands until 2005.
1918The Hotel LaSalle Parking Garage at 215
W. Washington opens as the first multi-story parking garage built in the US (and perhaps
the world) and stands until 2005.
1920The Michigan
Avenue Bridge (now the DuSable Bridge) opens to
traffic; its sidewalk markers outline the
site of Fort Dearborn.
CHICaGo TImelIne
1930
1940
1950
1960
1970
1980
1990
2012
2000
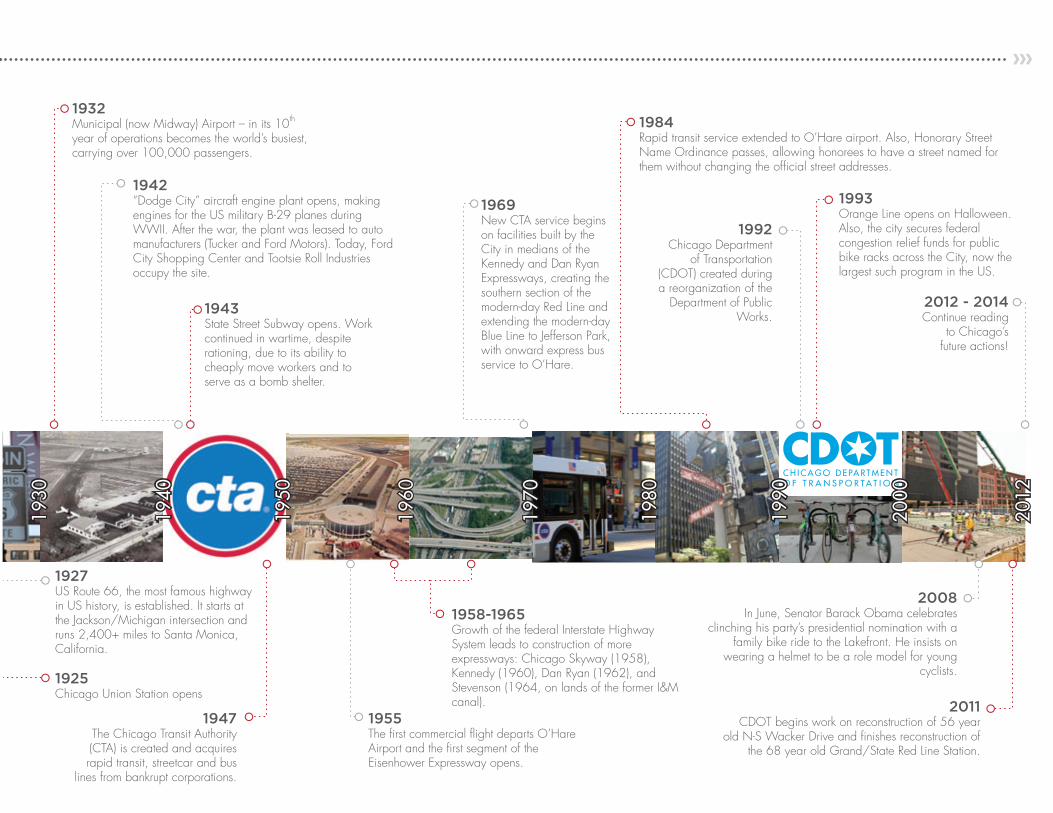
1925Chicago Union Station opens
1927US Route 66, the most famous highway in US history, is established. It starts at the Jackson/Michigan intersection and runs 2,400+ miles to Santa Monica, California.
1932Municipal (now Midway) Airport – in its 10th year of operations becomes the world’s busiest, carrying over 100,000 passengers.
1942“Dodge City” aircraft engine plant opens, making engines for the US military B-29 planes during WWII. After the war, the plant was leased to auto manufacturers (Tucker and Ford Motors). Today, Ford City Shopping Center and Tootsie Roll Industries occupy the site.
1943State Street Subway opens. Work continued in wartime, despite rationing, due to its ability to cheaply move workers and to serve as a bomb shelter.
1947The Chicago Transit Authority (CTA) is created and acquires rapid transit, streetcar and bus
lines from bankrupt corporations.
1955The first commercial flight departs O’Hare Airport and the first segment of the Eisenhower Expressway opens.
1958-1965Growth of the federal Interstate Highway System leads to construction of more expressways: Chicago Skyway (1958), Kennedy (1960), Dan Ryan (1962), and Stevenson (1964, on lands of the former I&M canal).
1984Rapid transit service extended to O’Hare airport. Also, Honorary Street Name Ordinance passes, allowing honorees to have a street named for them without changing the official street addresses.
1992Chicago Department
of Transportation (CDOT) created during a reorganization of the
Department of Public Works.
1993Orange Line opens on Halloween. Also, the city secures federal congestion relief funds for public bike racks across the City, now the largest such program in the US.
2008In June, Senator Barack Obama celebrates
clinching his party’s presidential nomination with a family bike ride to the Lakefront. He insists on
wearing a helmet to be a role model for young cyclists.
2011CDOT begins work on reconstruction of 56 year
old N-S Wacker Drive and finishes reconstruction of the 68 year old Grand/State Red Line Station.
2012 - 2014Continue reading
to Chicago’s future actions!
1969New CTA service begins on facilities built by the City in medians of the Kennedy and Dan Ryan Expressways, creating the southern section of the modern-day Red Line and extending the modern-day Blue Line to Jefferson Park, with onward express bus service to O’Hare.
10
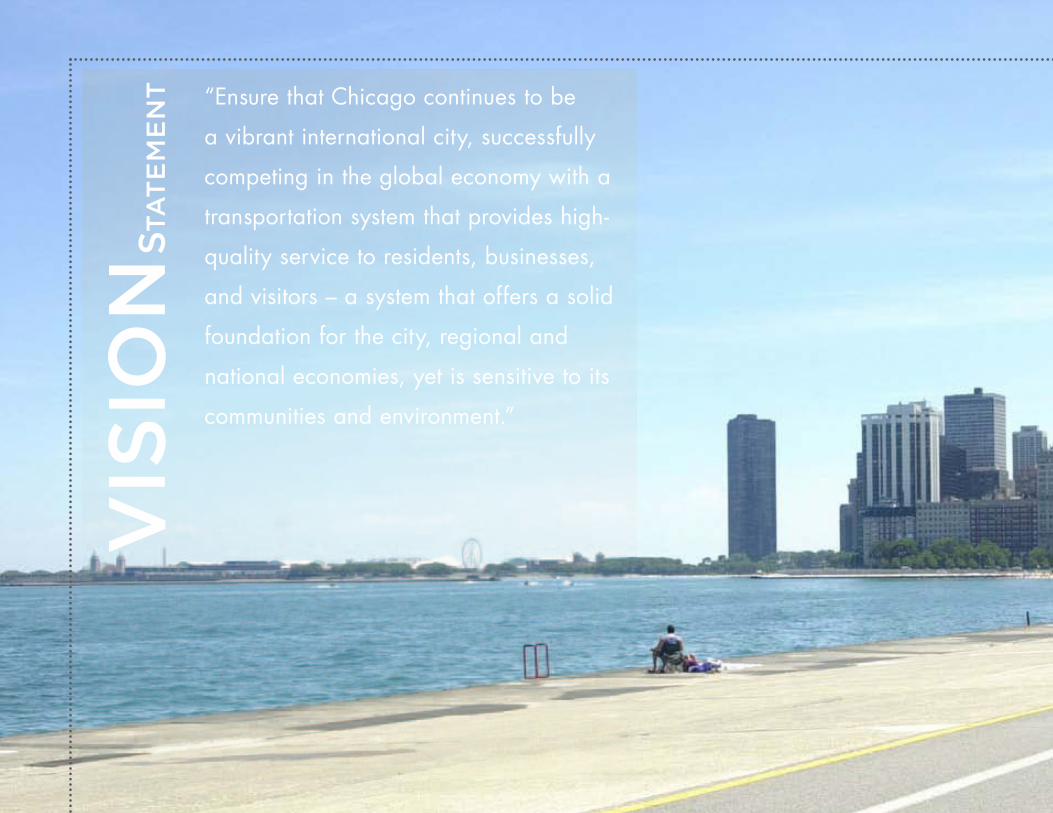
“Ensure that Chicago continues to be
a vibrant international city, successfully
competing in the global economy with a
transportation system that provides high-
quality service to residents, businesses,
and visitors – a system that offers a solid
foundation for the city, regional and
national economies, yet is sensitive to its
communities and environment.”
VIs
Ion
sTa
Te
me
nT
11
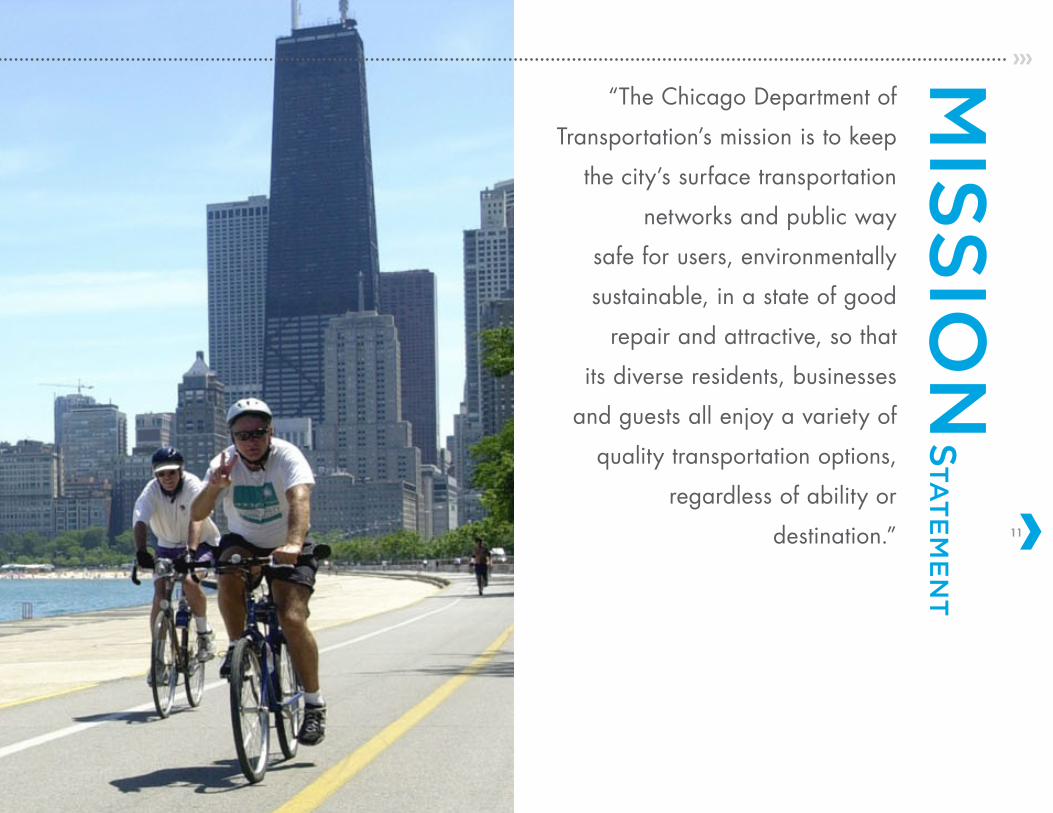
“The Chicago Department of
Transportation’s mission is to keep
the city’s surface transportation
networks and public way
safe for users, environmentally
sustainable, in a state of good
repair and attractive, so that
its diverse residents, businesses
and guests all enjoy a variety of
quality transportation options,
regardless of ability or
destination.”
mIs
sIo
ns
Ta
Te
me
nT
12
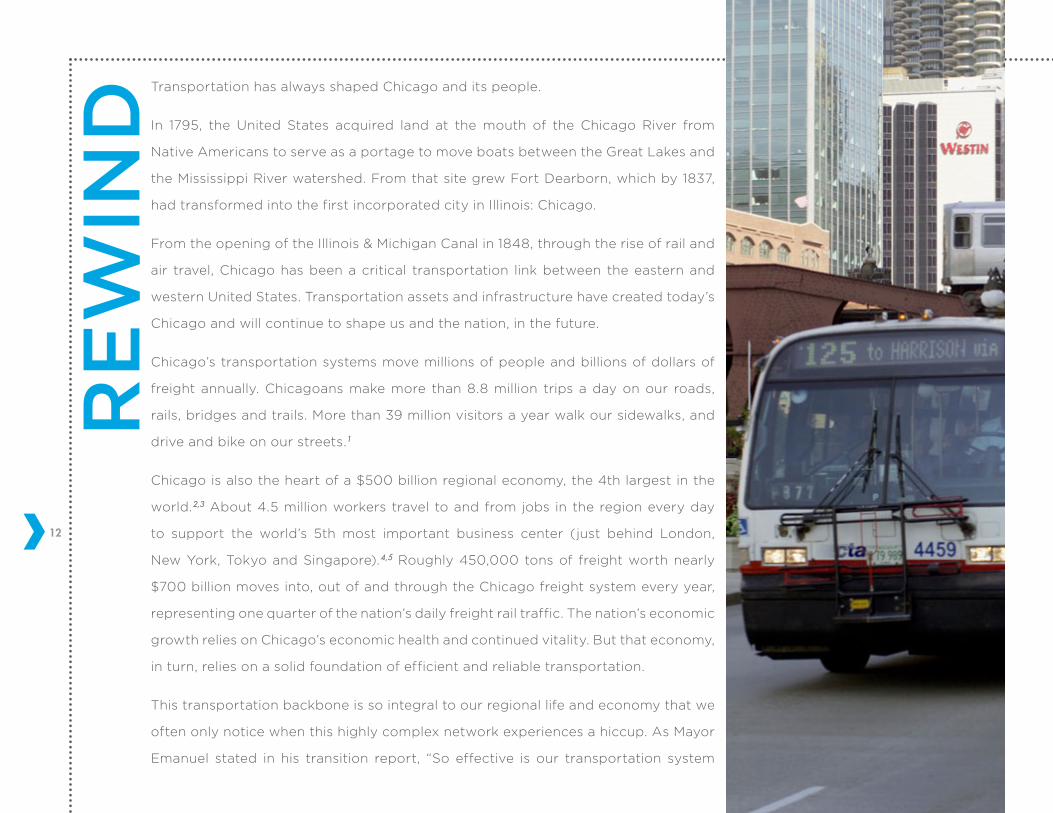
Transportation has always shaped Chicago and its people.
In 1795, the United States acquired land at the mouth of the Chicago River from
Native Americans to serve as a portage to move boats between the Great Lakes and
the Mississippi River watershed. From that site grew Fort Dearborn, which by 1837,
had transformed into the first incorporated city in Illinois: Chicago.
From the opening of the Illinois & Michigan Canal in 1848, through the rise of rail and
air travel, Chicago has been a critical transportation link between the eastern and
western United States. Transportation assets and infrastructure have created today’s
Chicago and will continue to shape us and the nation, in the future.
Chicago’s transportation systems move millions of people and billions of dollars of
freight annually. Chicagoans make more than 8.8 million trips a day on our roads,
rails, bridges and trails. More than 39 million visitors a year walk our sidewalks, and
drive and bike on our streets.1
Chicago is also the heart of a $500 billion regional economy, the 4th largest in the
world.2,3 About 4.5 million workers travel to and from jobs in the region every day
to support the world’s 5th most important business center (just behind London,
New York, Tokyo and Singapore).4,5 Roughly 450,000 tons of freight worth nearly
$700 billion moves into, out of and through the Chicago freight system every year,
representing one quarter of the nation’s daily freight rail traffic. The nation’s economic
growth relies on Chicago’s economic health and continued vitality. But that economy,
in turn, relies on a solid foundation of efficient and reliable transportation.
This transportation backbone is so integral to our regional life and economy that we
often only notice when this highly complex network experiences a hiccup. As Mayor
Emanuel stated in his transition report, “So effective is our transportation system
Re
WIn
D
13
that we tend to take it for granted. We assume that the “City of Broad Shoulders” can
carry any load for as long as needed.”
The responsibility of managing this complicated network can be overwhelming:
Chicago is tied for first in the nation in traffic congestion; over a hundred motorists
and dozens of pedestrians and cyclists lose their lives on Chicago roads each year;
hundreds of miles of roadway are in poor or very poor condition due to deferred
maintenance caused by budgetary constraints; 40% of Chicago Transit Authority
(CTA) stations are more than 50 years old and have not had major improvements in
their lifetime.
After housing, transportation remains the second highest household cost for most
Chicago families, in excess of 17% for many, and the combined expenses for housing
and transportation constitute more than half the income for many Chicagoans. This
leaves little additional money for other expenses, such as quality child care, higher
education, or healthy foods.
While the challenges of the city’s transportation system are great, the opportunities
are many. The following pages identify six principles that steer CDOT and over 170
specific and measurable actions the agency will undertake over the next two years.
These actions will help to fulfill the vision for a greater Chicago articulated by Mayor
Emanuel and advance prosperity for all Chicagoans, the Midwest and the nation as
a whole.
In this way, we will help move Chicago Forward.
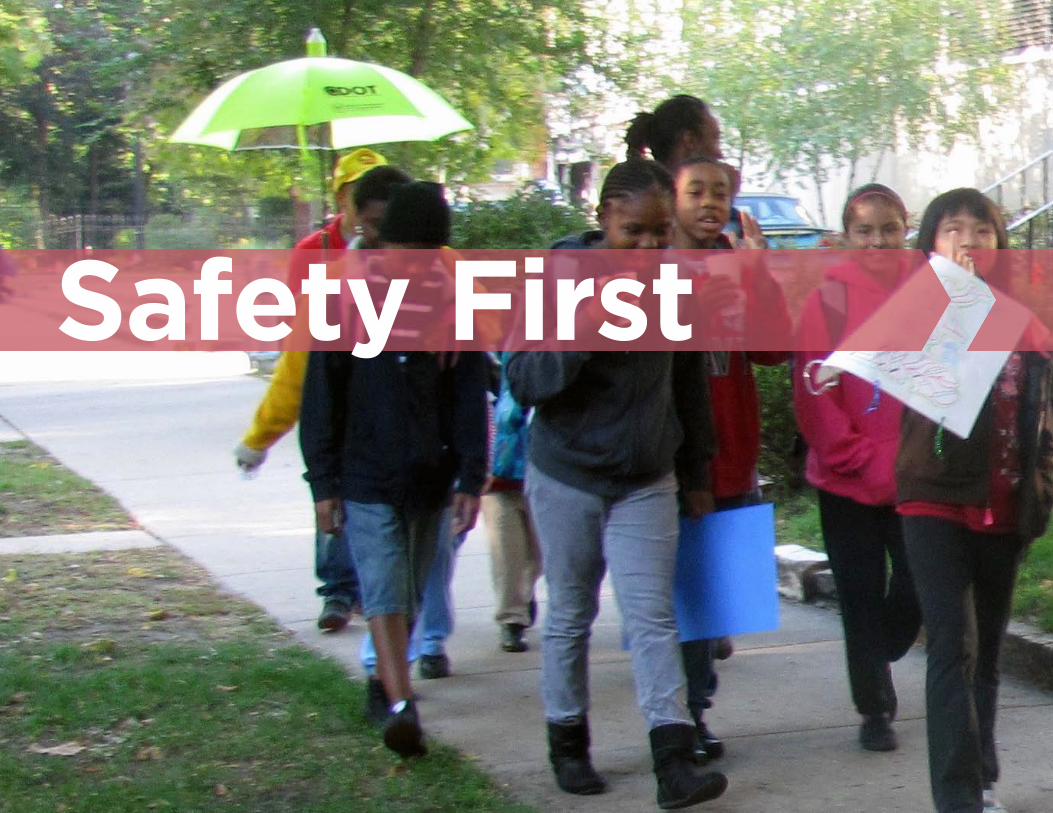
Safety First
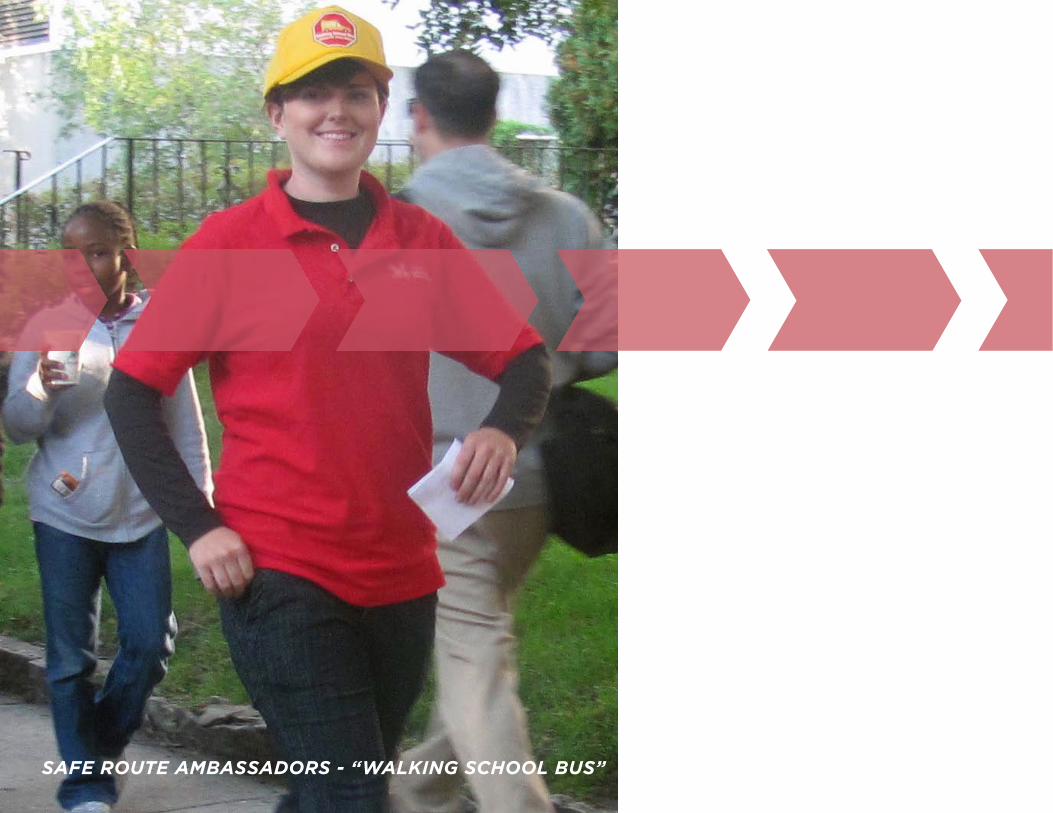
SAFE ROUTE AMBASSADORS - “WALKING SCHOOL BUS”
Safety First
SAFE ROUTE AMBASSADORS - “WALKING SCHOOL BUS”
16
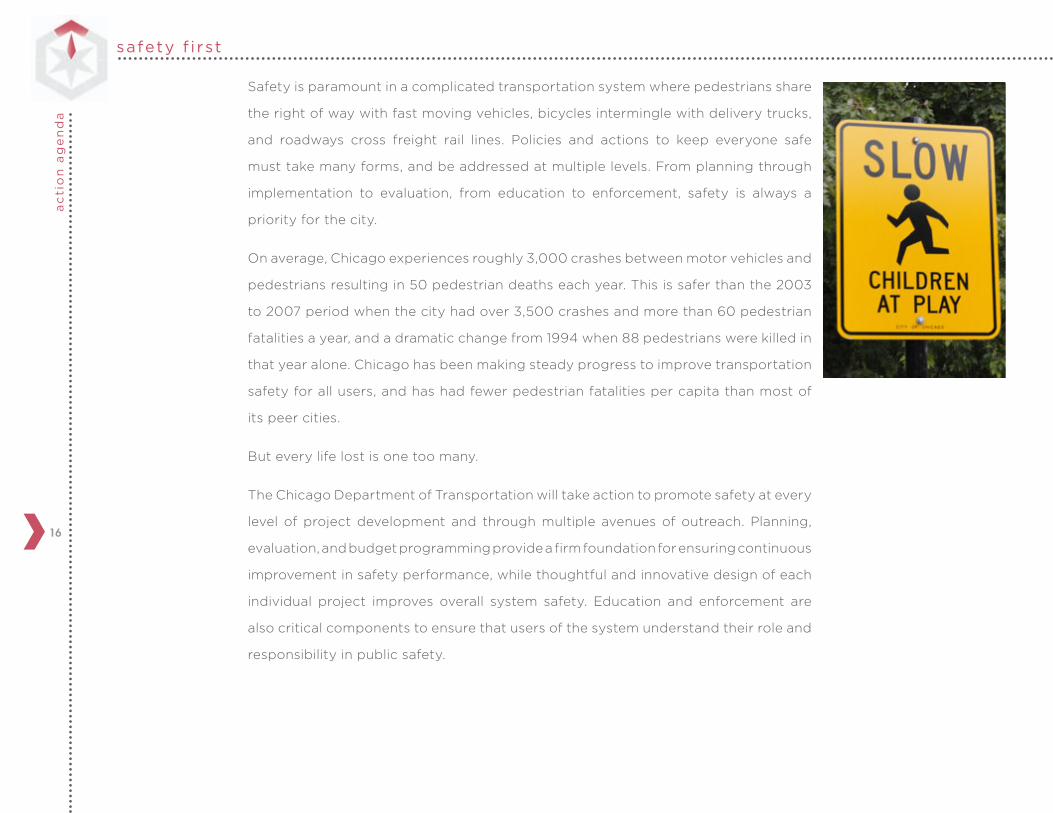
safety f i rsta
cti
on
ag
en
da
Safety is paramount in a complicated transportation system where pedestrians share
the right of way with fast moving vehicles, bicycles intermingle with delivery trucks,
and roadways cross freight rail lines. Policies and actions to keep everyone safe
must take many forms, and be addressed at multiple levels. From planning through
implementation to evaluation, from education to enforcement, safety is always a
priority for the city.
On average, Chicago experiences roughly 3,000 crashes between motor vehicles and
pedestrians resulting in 50 pedestrian deaths each year. This is safer than the 2003
to 2007 period when the city had over 3,500 crashes and more than 60 pedestrian
fatalities a year, and a dramatic change from 1994 when 88 pedestrians were killed in
that year alone. Chicago has been making steady progress to improve transportation
safety for all users, and has had fewer pedestrian fatalities per capita than most of
its peer cities.
But every life lost is one too many.
The Chicago Department of Transportation will take action to promote safety at every
level of project development and through multiple avenues of outreach. Planning,
evaluation, and budget programming provide a firm foundation for ensuring continuous
improvement in safety performance, while thoughtful and innovative design of each
individual project improves overall system safety. Education and enforcement are
also critical components to ensure that users of the system understand their role and
responsibility in public safety.
17
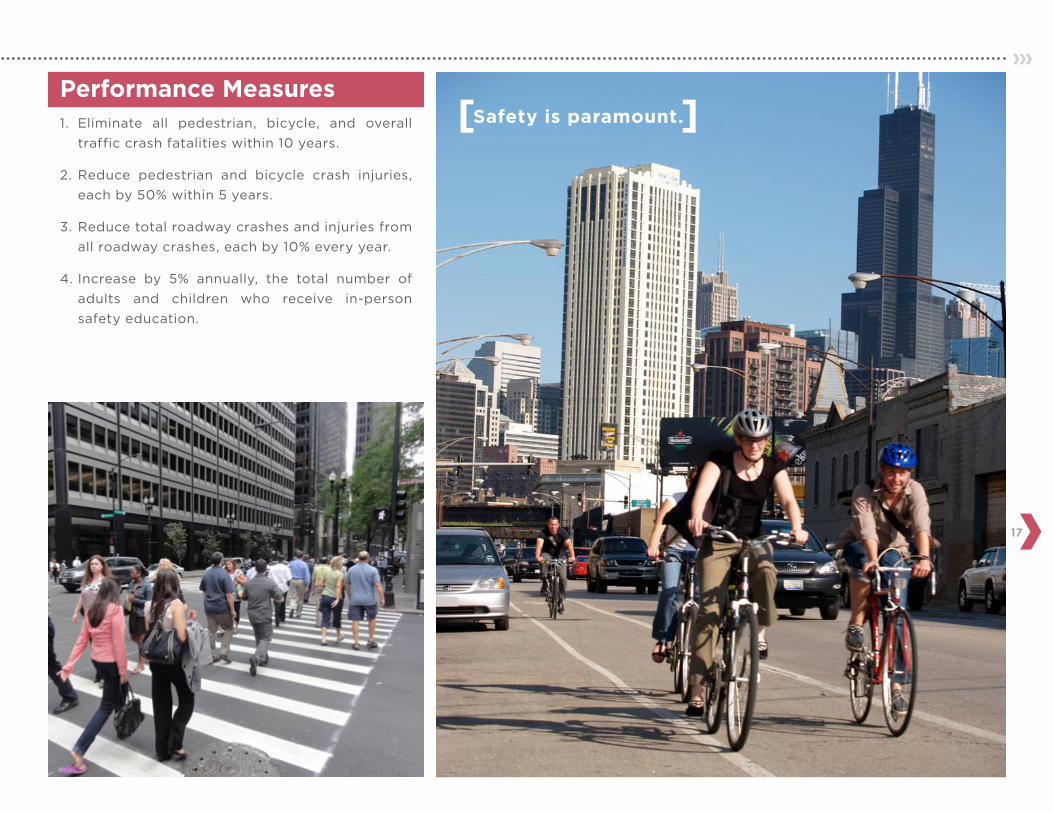
[ ]Safety is paramount.1. Eliminate all pedestrian, bicycle, and overall
traffic crash fatalities within 10 years.
2. Reduce pedestrian and bicycle crash injuries,
each by 50% within 5 years.
3. Reduce total roadway crashes and injuries from
all roadway crashes, each by 10% every year.
4. Increase by 5% annually, the total number of
adults and children who receive in-person
safety education.
Performance Measures
18
safety f i rsta
cti
on
ag
en
da
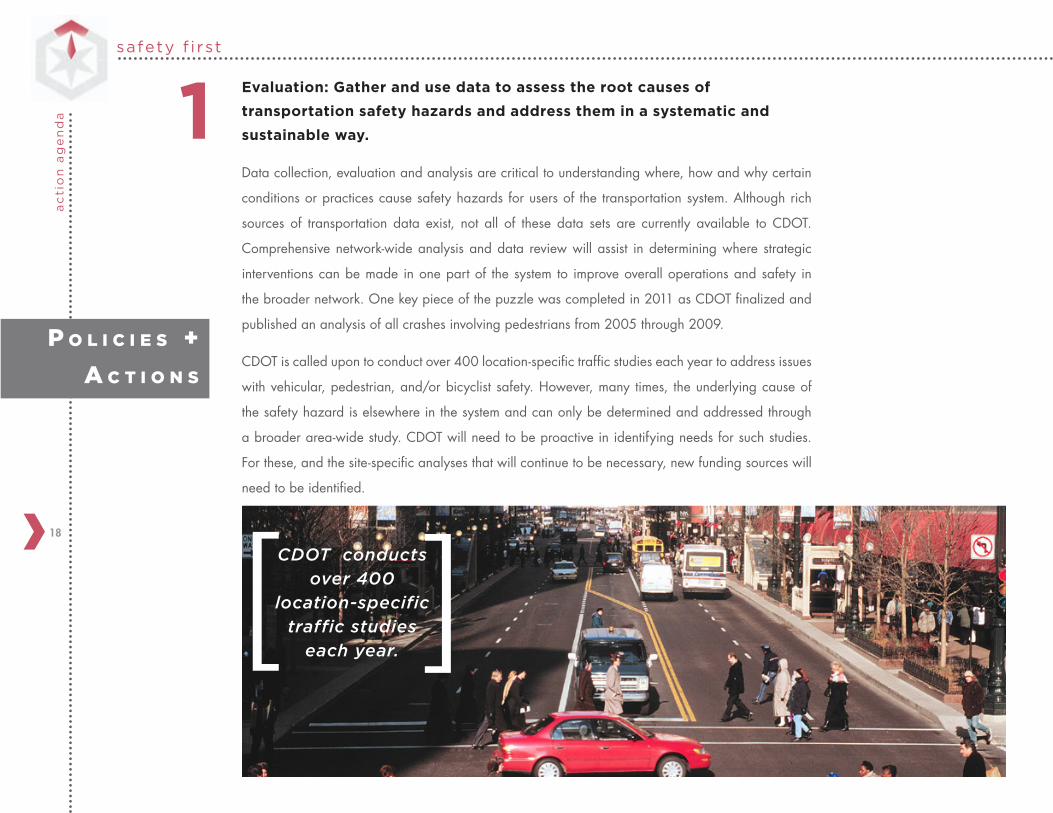
Evaluation: Gather and use data to assess the root causes of
transportation safety hazards and address them in a systematic and
sustainable way.
Data collection, evaluation and analysis are critical to understanding where, how and why certain
conditions or practices cause safety hazards for users of the transportation system. Although rich
sources of transportation data exist, not all of these data sets are currently available to CDOT.
Comprehensive network-wide analysis and data review will assist in determining where strategic
interventions can be made in one part of the system to improve overall operations and safety in
the broader network. One key piece of the puzzle was completed in 2011 as CDOT finalized and
published an analysis of all crashes involving pedestrians from 2005 through 2009.
CDOT is called upon to conduct over 400 location-specific traffic studies each year to address issues
with vehicular, pedestrian, and/or bicyclist safety. However, many times, the underlying cause of
the safety hazard is elsewhere in the system and can only be determined and addressed through
a broader area-wide study. CDOT will need to be proactive in identifying needs for such studies.
For these, and the site-specific analyses that will continue to be necessary, new funding sources will
need to be identified.
P o l i c i e s +
A c t i o n s
1
CDOT conducts over 400
location-specific traffic studies
each year.[
[
19
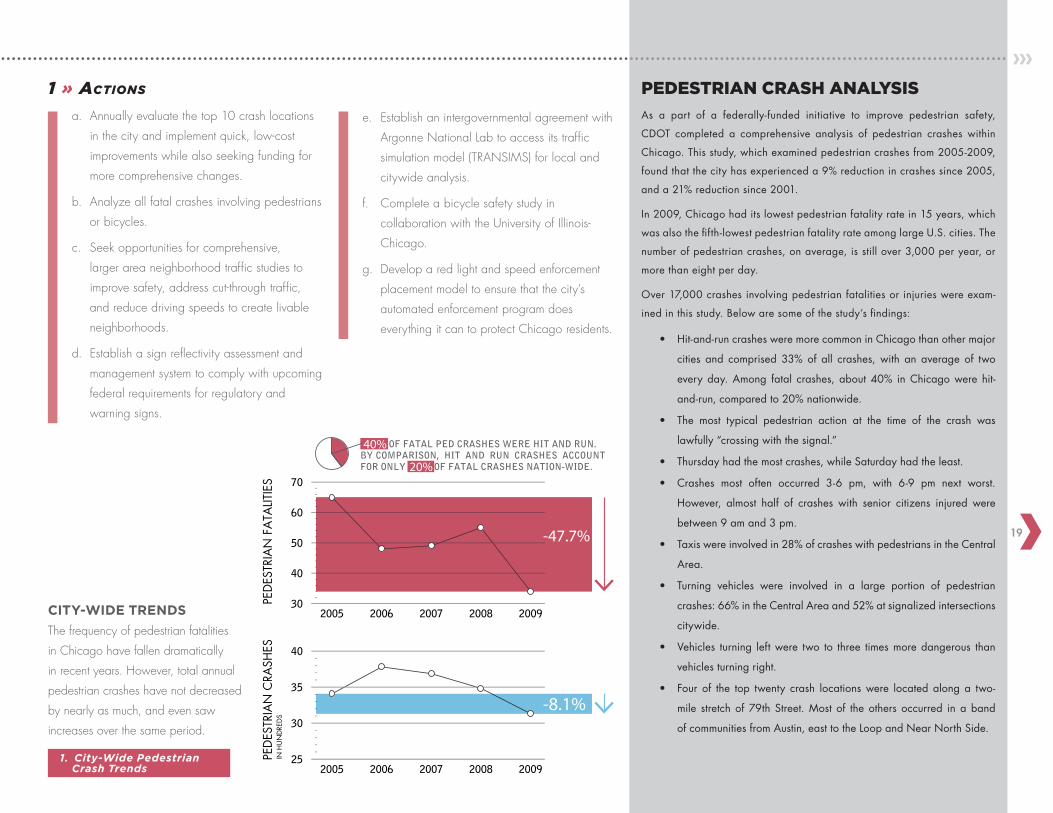
COMPARED TO OTHER CITIES WITH POPULATION DENSITIES HIGHER THAN 10,000 RESIDENTS PER SQUARE MILE [ ], CHICAGO’S PEDESTRIAN CRASH FATALITY RATE IS QUITE LOW.
PHOENIX
DALLAS
WASHINGTON, D.C.
SAN FRANCISCO
LOS ANGELESBALTIMORE
PHILADELPHIA
HOUSTON
SAN ANTONIO
NEW YORK
CHICAGO
SAN DIEGO
SAN JOSE
SEATTLE
BOSTON
POPU
LATI
ON
DEN
SITY
THO
USA
ND
S O
F RE
SID
ENTS
PER
SQ
UA
RE M
ILE L
AN
D A
REA
PED
ESTR
IAN
CRA
SHES
IN H
UN
DRE
DS
PEDESTRIAN CRASH FATALITY RATE [2005 - 2009]DEATHS PER 100 PEDESTRIAN CRASHES
-8.1%
-47.7%
0
5
10
15
20
25
30
25
30
35
40
0.5 1 1.5 2 2.5 3
2005 2006 2007 2008 2009
PED
ESTR
IAN
FA
TALIT
IES
40
30
50
60
70
2005 2006 2007 2008 2009
3.5
OF FATAL PED CRASHES WERE HIT AND RUN. BY COMPARISON, HIT AND RUN CRASHES ACCOUNT FOR ONLY OF FATAL CRASHES NATION-WIDE.
40%
20%
AND THE FREQUENCY OF PEDESTRIAN FATALITIES IN CHICAGO HAVE FALLEN DRAMATICALLY IN RECENT YEARS. HOWEVER, TOTAL ANNUAL PEDESTRIAN CRASHES HAVE NOT DECREASED BY NEARLY AS MUCH, AND EVEN SAW INCREASES OVER THE SAME PERIOD.
NATIONAL CONTEXT CITY-WIDE TRENDS
CITY-WIDE TRENDS
The frequency of pedestrian fatalities
in Chicago have fallen dramatically
in recent years. However, total annual
pedestrian crashes have not decreased
by nearly as much, and even saw
increases over the same period.
PEDESTRIAN CRASH ANALYSIS
As a part of a federally-funded initiative to improve pedestrian safety,
CDOT completed a comprehensive analysis of pedestrian crashes within
Chicago. This study, which examined pedestrian crashes from 2005-2009,
found that the city has experienced a 9% reduction in crashes since 2005,
and a 21% reduction since 2001.
In 2009, Chicago had its lowest pedestrian fatality rate in 15 years, which
was also the fifth-lowest pedestrian fatality rate among large U.S. cities. The
number of pedestrian crashes, on average, is still over 3,000 per year, or
more than eight per day.
Over 17,000 crashes involving pedestrian fatalities or injuries were exam-
ined in this study. Below are some of the study’s findings:
• Hit-and-run crashes were more common in Chicago than other major
cities and comprised 33% of all crashes, with an average of two
every day. Among fatal crashes, about 40% in Chicago were hit-
and-run, compared to 20% nationwide.
• The most typical pedestrian action at the time of the crash was
lawfully “crossing with the signal.”
• Thursday had the most crashes, while Saturday had the least.
• Crashes most often occurred 3-6 pm, with 6-9 pm next worst.
However, almost half of crashes with senior citizens injured were
between 9 am and 3 pm.
• Taxis were involved in 28% of crashes with pedestrians in the Central
Area.
• Turning vehicles were involved in a large portion of pedestrian
crashes: 66% in the Central Area and 52% at signalized intersections
citywide.
• Vehicles turning left were two to three times more dangerous than
vehicles turning right.
• Four of the top twenty crash locations were located along a two-
mile stretch of 79th Street. Most of the others occurred in a band
of communities from Austin, east to the Loop and Near North Side.
1. City-Wide Pedestrian Crash Trends
1 » Actions
a. Annually evaluate the top 10 crash locations
in the city and implement quick, low-cost
improvements while also seeking funding for
more comprehensive changes.
b. Analyze all fatal crashes involving pedestrians
or bicycles.
c. Seek opportunities for comprehensive,
larger area neighborhood traffic studies to
improve safety, address cut-through traffic,
and reduce driving speeds to create livable
neighborhoods.
d. Establish a sign reflectivity assessment and
management system to comply with upcoming
federal requirements for regulatory and
warning signs.
e. Establish an intergovernmental agreement with
Argonne National Lab to access its traffic
simulation model (TRANSIMS) for local and
citywide analysis.
f. Complete a bicycle safety study in
collaboration with the University of Illinois-
Chicago.
g. Develop a red light and speed enforcement
placement model to ensure that the city’s
automated enforcement program does
everything it can to protect Chicago residents.
20
safety f i rsta
cti
on
ag
en
da
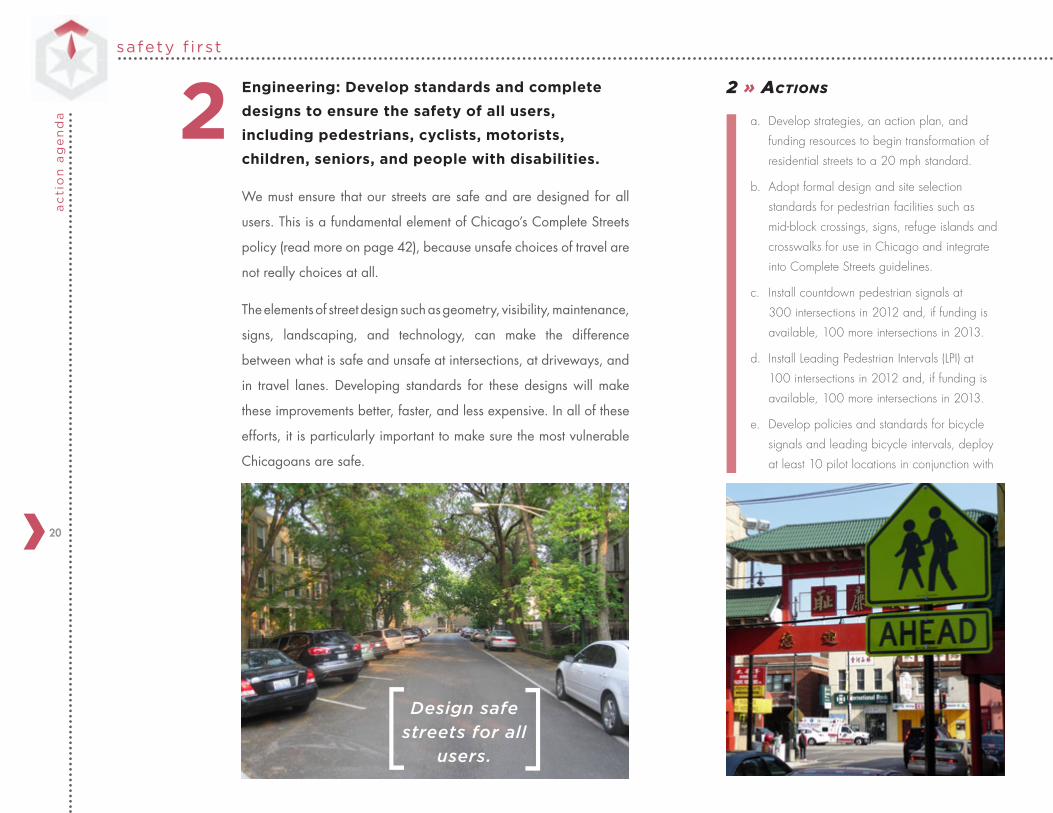
Engineering: Develop standards and complete
designs to ensure the safety of all users,
including pedestrians, cyclists, motorists,
children, seniors, and people with disabilities.
We must ensure that our streets are safe and are designed for all
users. This is a fundamental element of Chicago’s Complete Streets
policy (read more on page 42), because unsafe choices of travel are
not really choices at all.
The elements of street design such as geometry, visibility, maintenance,
signs, landscaping, and technology, can make the difference
between what is safe and unsafe at intersections, at driveways, and
in travel lanes. Developing standards for these designs will make
these improvements better, faster, and less expensive. In all of these
efforts, it is particularly important to make sure the most vulnerable
Chicagoans are safe.
2 » Actions
a. Develop strategies, an action plan, and
funding resources to begin transformation of
residential streets to a 20 mph standard.
b. Adopt formal design and site selection
standards for pedestrian facilities such as
mid-block crossings, signs, refuge islands and
crosswalks for use in Chicago and integrate
into Complete Streets guidelines.
c. Install countdown pedestrian signals at
300 intersections in 2012 and, if funding is
available, 100 more intersections in 2013.
d. Install Leading Pedestrian Intervals (LPI) at
100 intersections in 2012 and, if funding is
available, 100 more intersections in 2013.
e. Develop policies and standards for bicycle
signals and leading bicycle intervals, deploy
at least 10 pilot locations in conjunction with
2
Design safe streets for all
users.[ [
21
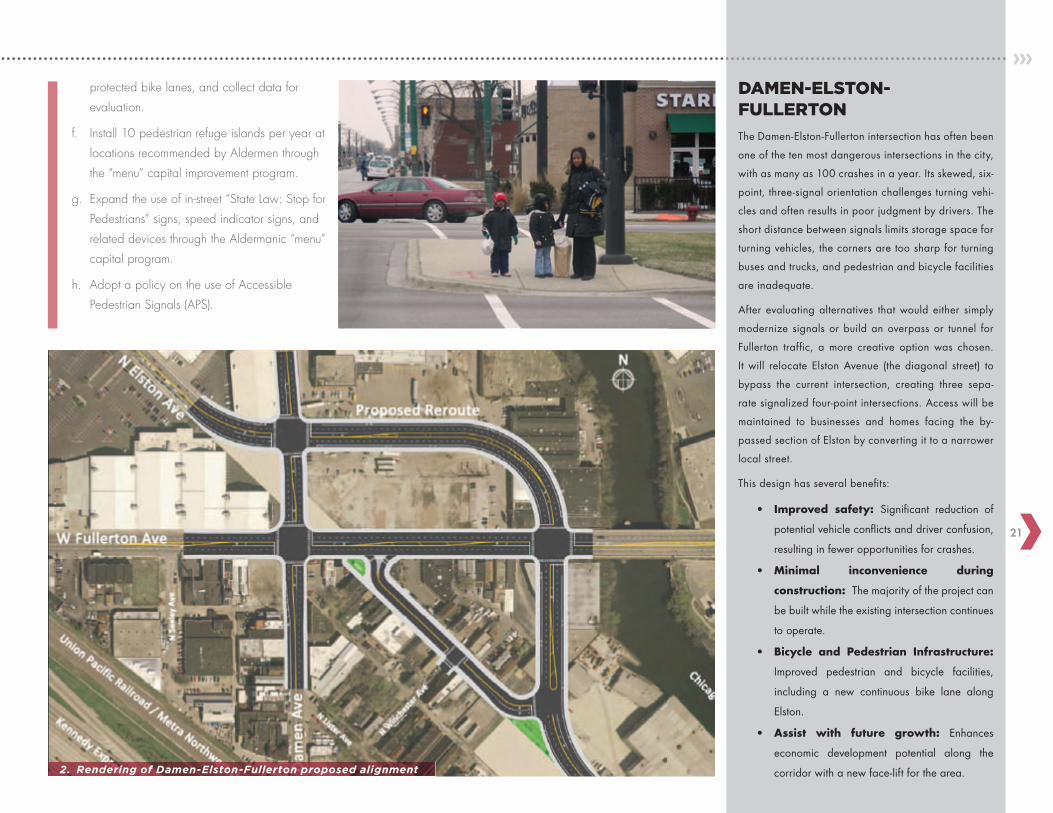
DAMEN-ELSTON-FULLERTON
The Damen-Elston-Fullerton intersection has often been
one of the ten most dangerous intersections in the city,
with as many as 100 crashes in a year. Its skewed, six-
point, three-signal orientation challenges turning vehi-
cles and often results in poor judgment by drivers. The
short distance between signals limits storage space for
turning vehicles, the corners are too sharp for turning
buses and trucks, and pedestrian and bicycle facilities
are inadequate.
After evaluating alternatives that would either simply
modernize signals or build an overpass or tunnel for
Fullerton traffic, a more creative option was chosen.
It will relocate Elston Avenue (the diagonal street) to
bypass the current intersection, creating three sepa-
rate signalized four-point intersections. Access will be
maintained to businesses and homes facing the by-
passed section of Elston by converting it to a narrower
local street.
This design has several benefits:
• Improved safety: Significant reduction of
potential vehicle conflicts and driver confusion,
resulting in fewer opportunities for crashes.
• Minimal inconvenience during
construction:The majority of the project can
be built while the existing intersection continues
to operate.
• Bicycle and Pedestrian Infrastructure:
Improved pedestrian and bicycle facilities,
including a new continuous bike lane along
Elston.
• Assist with future growth: Enhances
economic development potential along the
corridor with a new face-lift for the area.2. Rendering of Damen-Elston-Fullerton proposed alignment
protected bike lanes, and collect data for
evaluation.
f. Install 10 pedestrian refuge islands per year at
locations recommended by Aldermen through
the “menu” capital improvement program.
g. Expand the use of in-street “State Law: Stop for
Pedestrians” signs, speed indicator signs, and
related devices through the Aldermanic “menu”
capital program.
h. Adopt a policy on the use of Accessible
Pedestrian Signals (APS).
22
3safety f i rst
ac
tio
n a
ge
nd
a
45 ft to
85 ft to
145 ft to
20 mph 95%
55%
15%
30 mph
40 mph
STOP
STOP
STOP
Chance a person would survive if hit by a car travelling at this speed
3. Vehicle and Pedestrian Collision Speed Survival Percentage
Enforcement: Partner with sister agencies
to refocus enforcement efforts to protect
the safety of all users, particularly the most
vulnerable.
While it would be nice if everyone complied with safety regulations
all of the time, the fact is many of us are often tempted to try to push
the limits of safe behavior. Enforcement is a necessary reminder
that these laws are a social compact with one another that can
keep our entire community safe. For example, our network of red-
light cameras has helped reduce angle (“T-Bone”) crashes by 29%
in the two years after installation compared to the two-year period
prior to installation.
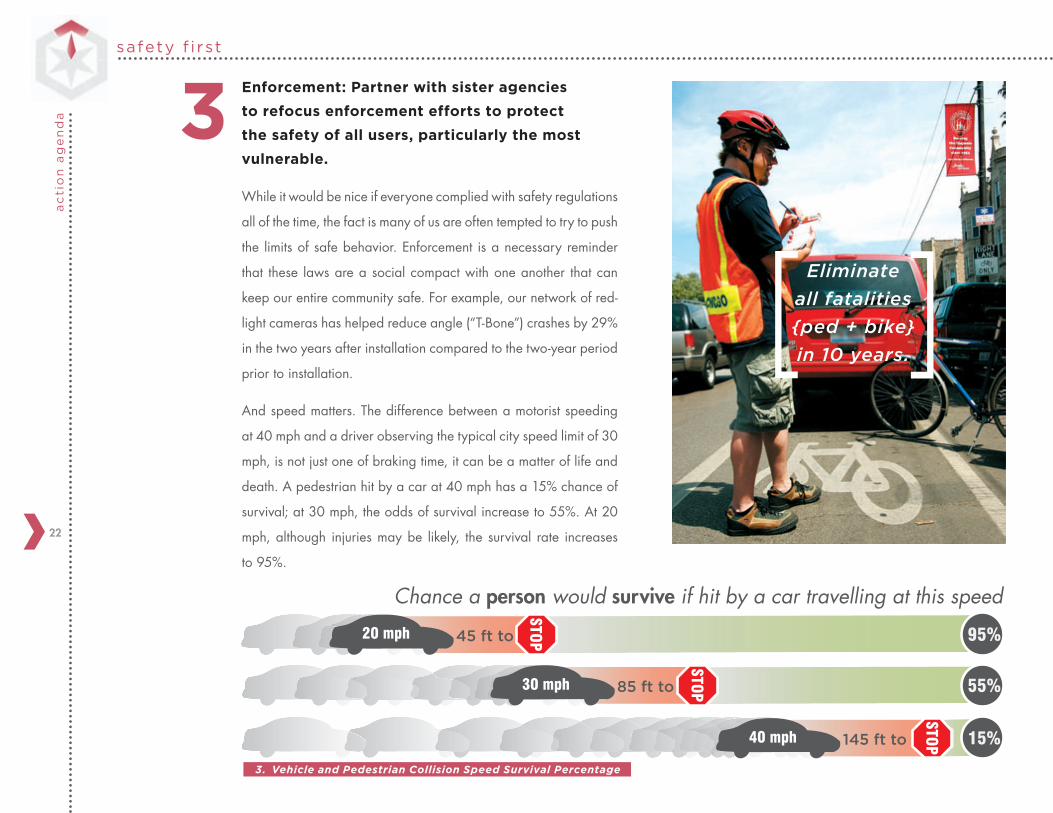
And speed matters. The difference between a motorist speeding
at 40 mph and a driver observing the typical city speed limit of 30
mph, is not just one of braking time, it can be a matter of life and
death. A pedestrian hit by a car at 40 mph has a 15% chance of
survival; at 30 mph, the odds of survival increase to 55%. At 20
mph, although injuries may be likely, the survival rate increases
to 95%.
[ [Eliminate
all fatalities
{ped + bike}
in 10 years.
23
O’Hare Airport
Midway Airport
Lake Michigan
Madison St
North Ave
Irving Park Rd
Pula
ski R
d
Wes
tern
Ave
Hal
sted
St
Cermak Rd
47th St
63rd St
95th St
79th St
Cen
tral A
ve
4. Red-Light Camera Locations
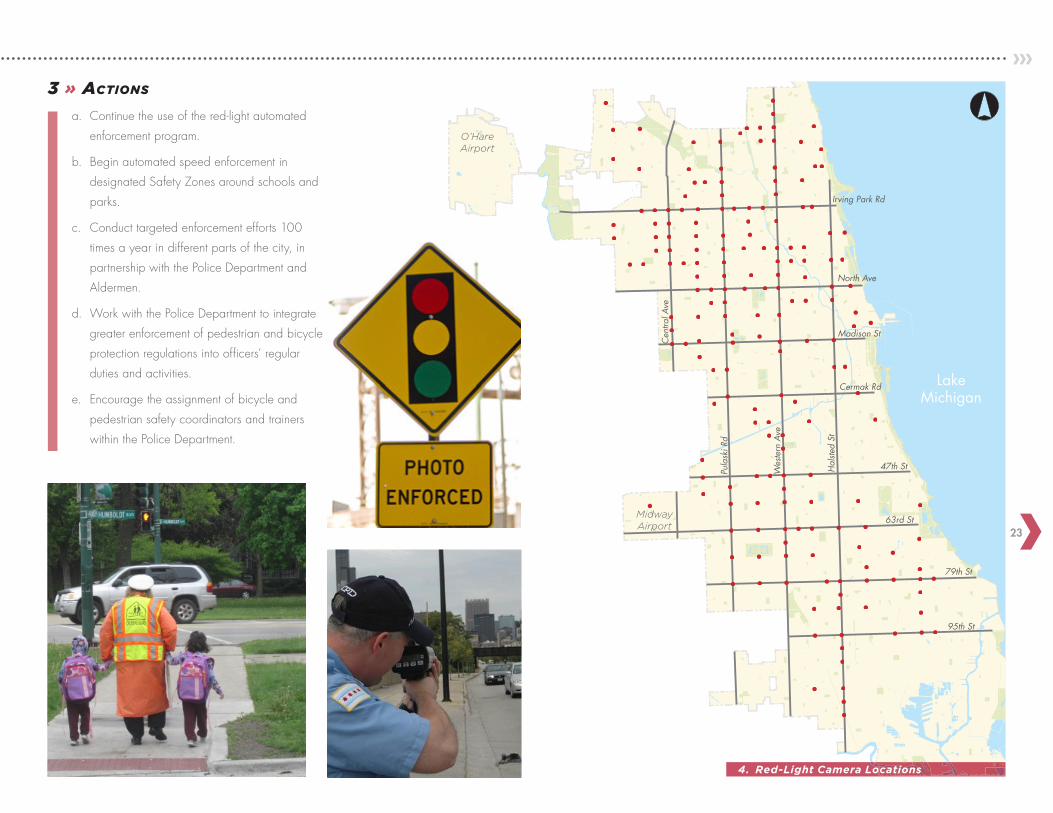
3 » Actions
a. Continue the use of the red-light automated
enforcement program.
b. Begin automated speed enforcement in
designated Safety Zones around schools and
parks.
c. Conduct targeted enforcement efforts 100
times a year in different parts of the city, in
partnership with the Police Department and
Aldermen.
d. Work with the Police Department to integrate
greater enforcement of pedestrian and bicycle
protection regulations into officers’ regular
duties and activities.
e. Encourage the assignment of bicycle and
pedestrian safety coordinators and trainers
within the Police Department.
24
safety f i rsta
cti
on
ag
en
da
Education: Promote awareness to all residents and travelers
on safe habits to decrease transportation risks and increase
safe, efficient, and enjoyable travel in the city.
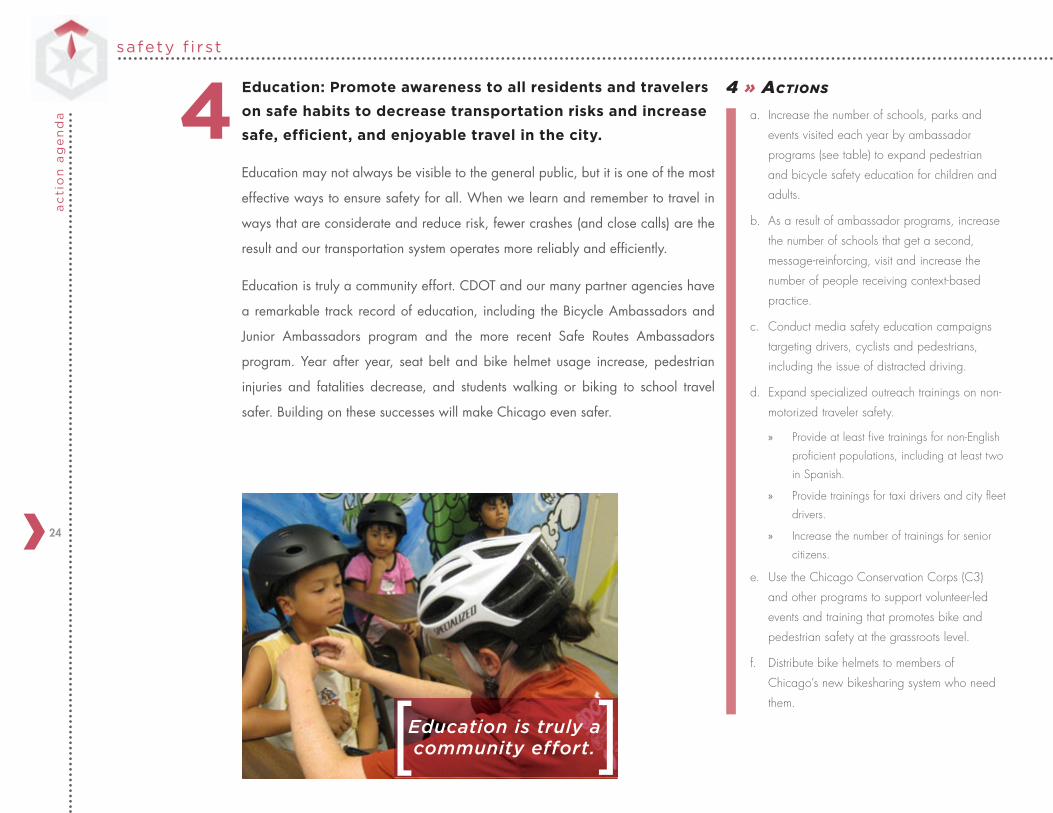
Education may not always be visible to the general public, but it is one of the most
effective ways to ensure safety for all. When we learn and remember to travel in
ways that are considerate and reduce risk, fewer crashes (and close calls) are the
result and our transportation system operates more reliably and efficiently.
Education is truly a community effort. CDOT and our many partner agencies have
a remarkable track record of education, including the Bicycle Ambassadors and
Junior Ambassadors program and the more recent Safe Routes Ambassadors
program. Year after year, seat belt and bike helmet usage increase, pedestrian
injuries and fatalities decrease, and students walking or biking to school travel
safer. Building on these successes will make Chicago even safer.
[ [
Education is truly a community effort.
44 » Actions
a. Increase the number of schools, parks and
events visited each year by ambassador
programs (see table) to expand pedestrian
and bicycle safety education for children and
adults.
b. As a result of ambassador programs, increase
the number of schools that get a second,
message-reinforcing, visit and increase the
number of people receiving context-based
practice.
c. Conduct media safety education campaigns
targeting drivers, cyclists and pedestrians,
including the issue of distracted driving.
d. Expand specialized outreach trainings on non-
motorized traveler safety.
» Provide at least five trainings for non-English
proficient populations, including at least two
in Spanish.
» Provide trainings for taxi drivers and city fleet
drivers.
» Increase the number of trainings for senior
citizens.
e. Use the Chicago Conservation Corps (C3)
and other programs to support volunteer-led
events and training that promotes bike and
pedestrian safety at the grassroots level.
f. Distribute bike helmets to members of
Chicago’s new bikesharing system who need
them.
25
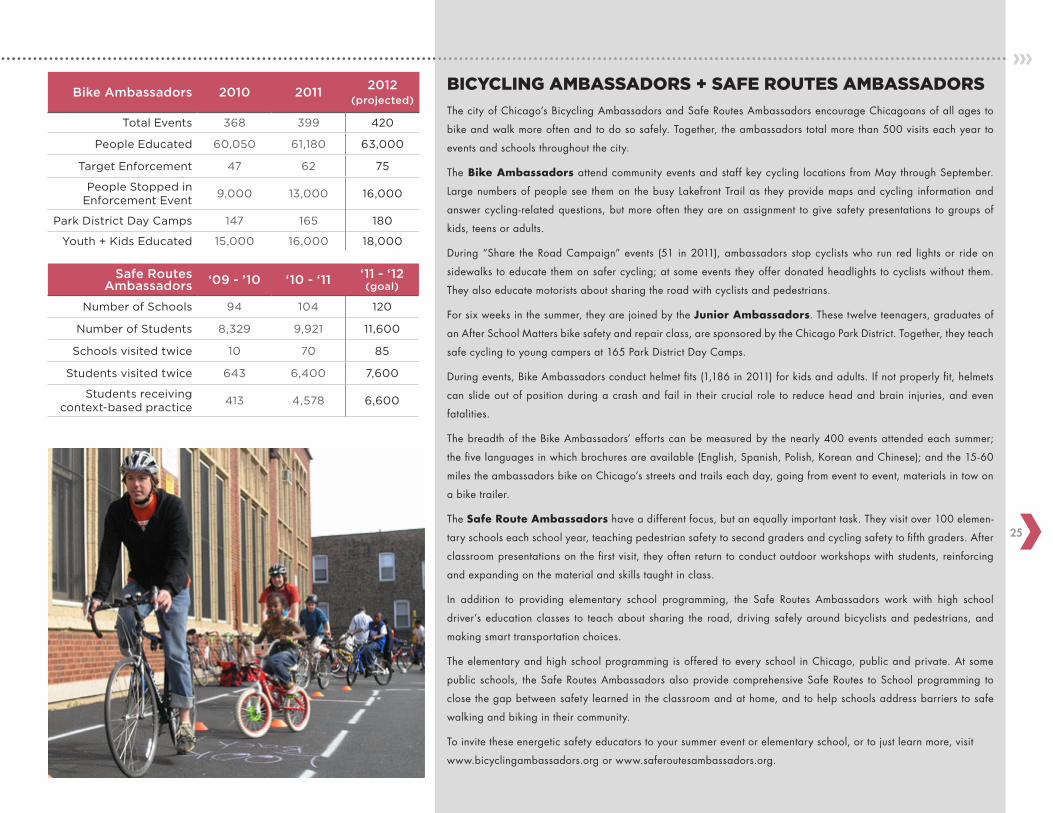
BICYCLING AMBASSADORS + SAFE ROUTES AMBASSADORS
The city of Chicago’s Bicycling Ambassadors and Safe Routes Ambassadors encourage Chicagoans of all ages to
bike and walk more often and to do so safely. Together, the ambassadors total more than 500 visits each year to
events and schools throughout the city.
TheBikeAmbassadors attend community events and staff key cycling locations from May through September.
Large numbers of people see them on the busy Lakefront Trail as they provide maps and cycling information and
answer cycling-related questions, but more often they are on assignment to give safety presentations to groups of
kids, teens or adults.
During “Share the Road Campaign” events (51 in 2011), ambassadors stop cyclists who run red lights or ride on
sidewalks to educate them on safer cycling; at some events they offer donated headlights to cyclists without them.
They also educate motorists about sharing the road with cyclists and pedestrians.
For six weeks in the summer, they are joined by the JuniorAmbassadors. These twelve teenagers, graduates of
an After School Matters bike safety and repair class, are sponsored by the Chicago Park District. Together, they teach
safe cycling to young campers at 165 Park District Day Camps.
During events, Bike Ambassadors conduct helmet fits (1,186 in 2011) for kids and adults. If not properly fit, helmets
can slide out of position during a crash and fail in their crucial role to reduce head and brain injuries, and even
fatalities.
The breadth of the Bike Ambassadors’ efforts can be measured by the nearly 400 events attended each summer;
the five languages in which brochures are available (English, Spanish, Polish, Korean and Chinese); and the 15-60
miles the ambassadors bike on Chicago’s streets and trails each day, going from event to event, materials in tow on
a bike trailer.
The SafeRouteAmbassadors have a different focus, but an equally important task. They visit over 100 elemen-
tary schools each school year, teaching pedestrian safety to second graders and cycling safety to fifth graders. After
classroom presentations on the first visit, they often return to conduct outdoor workshops with students, reinforcing
and expanding on the material and skills taught in class.
In addition to providing elementary school programming, the Safe Routes Ambassadors work with high school
driver’s education classes to teach about sharing the road, driving safely around bicyclists and pedestrians, and
making smart transportation choices.
The elementary and high school programming is offered to every school in Chicago, public and private. At some
public schools, the Safe Routes Ambassadors also provide comprehensive Safe Routes to School programming to
close the gap between safety learned in the classroom and at home, and to help schools address barriers to safe
walking and biking in their community.
To invite these energetic safety educators to your summer event or elementary school, or to just learn more, visit
www.bicyclingambassadors.org or www.saferoutesambassadors.org.
Safe Routes Ambassadors ‘09 - ’10 ‘10 - ‘11 ‘11 - ‘12
(goal)
Number of Schools 94 104 120
Number of Students 8,329 9,921 11,600
Schools visited twice 10 70 85
Students visited twice 643 6,400 7,600
Students receiving context-based practice
413 4,578 6,600
Bike Ambassadors 2010 20112012
(projected)
Total Events 368 399 420
People Educated 60,050 61,180 63,000
Target Enforcement 47 62 75
People Stopped in Enforcement Event
9,000 13,000 16,000
Park District Day Camps 147 165 180
Youth + Kids Educated 15,000 16,000 18,000
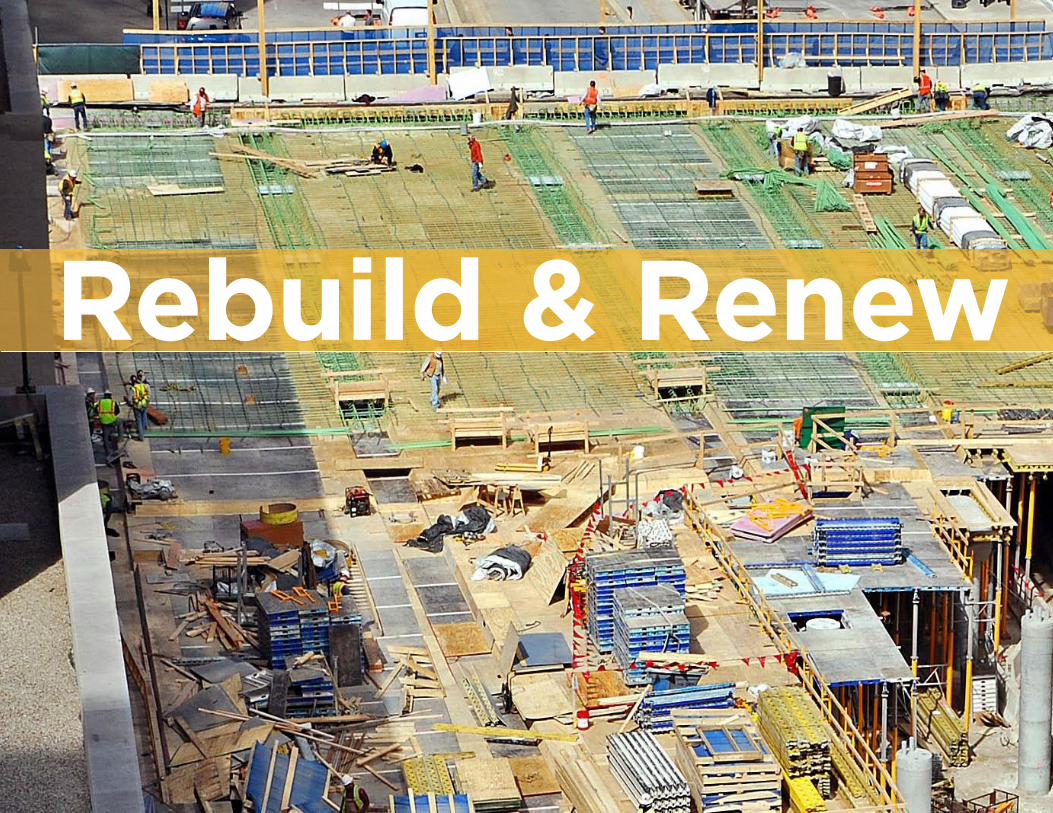
Rebuild & Renew
Rebuild & Renew
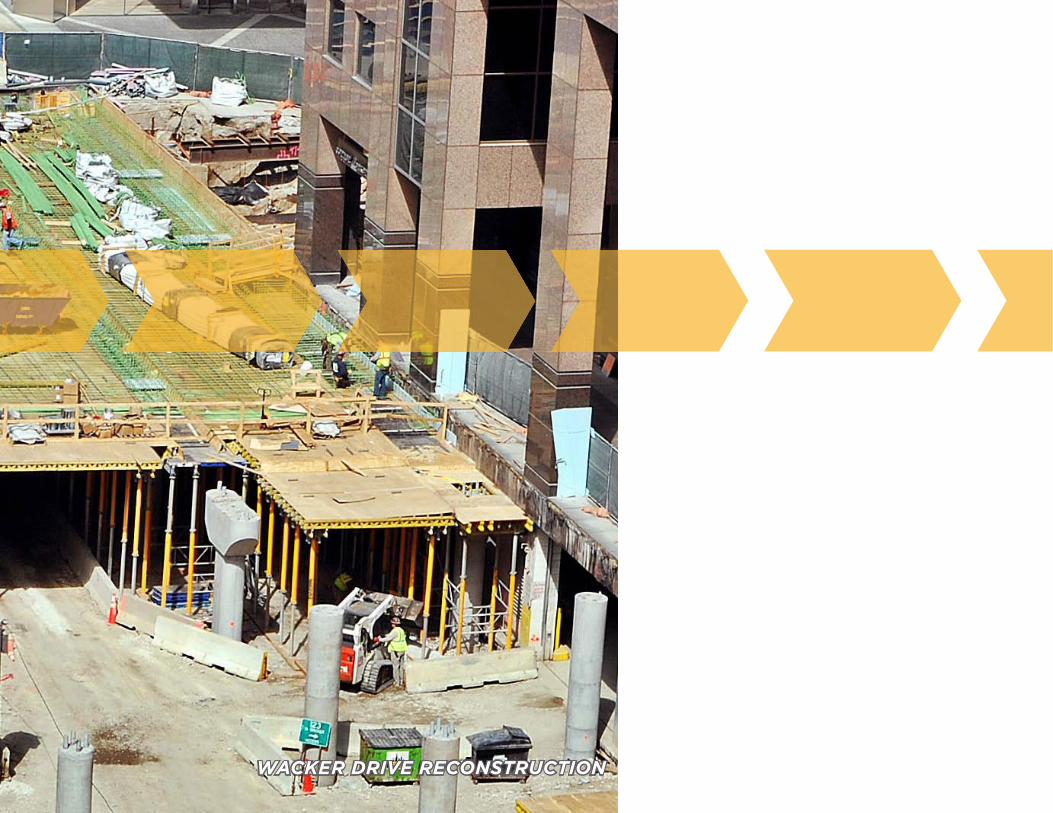
WACKER DRIVE RECONSTRUCTION
rebui ld & renewa
cti
on
ag
en
da
28
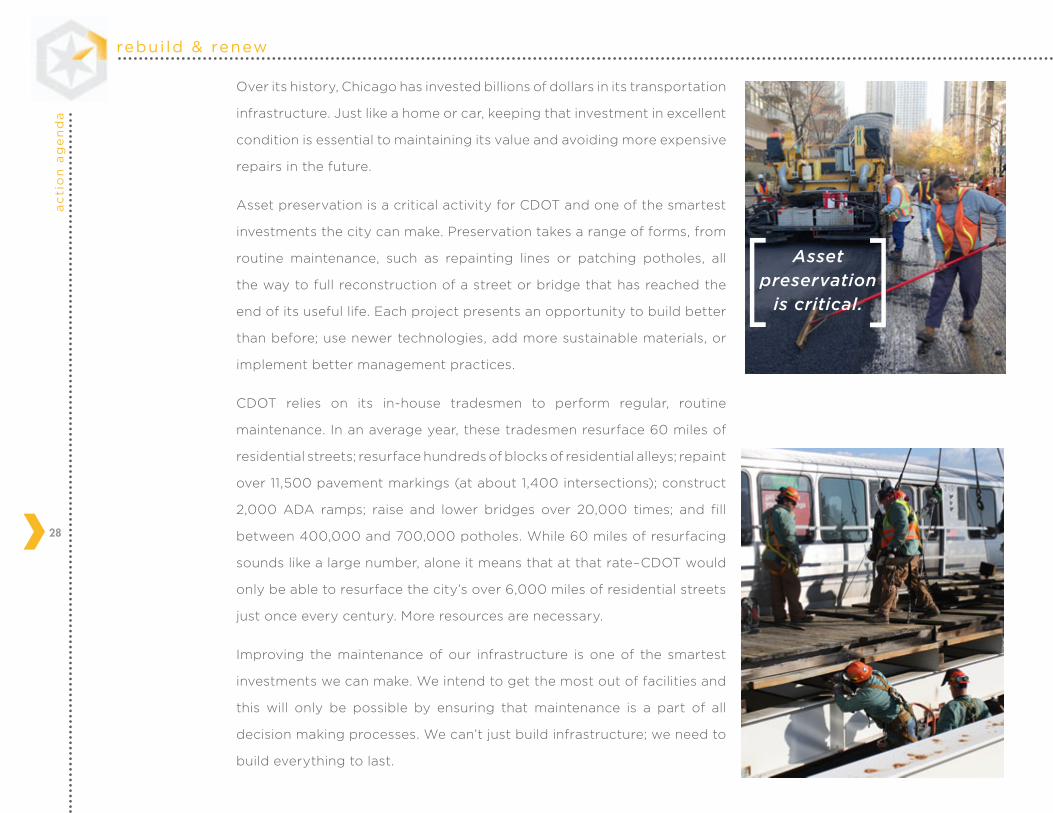
Over its history, Chicago has invested billions of dollars in its transportation
infrastructure. Just like a home or car, keeping that investment in excellent
condition is essential to maintaining its value and avoiding more expensive
repairs in the future.
Asset preservation is a critical activity for CDOT and one of the smartest
investments the city can make. Preservation takes a range of forms, from
routine maintenance, such as repainting lines or patching potholes, all
the way to full reconstruction of a street or bridge that has reached the
end of its useful life. Each project presents an opportunity to build better
than before; use newer technologies, add more sustainable materials, or
implement better management practices.
CDOT relies on its in-house tradesmen to perform regular, routine
maintenance. In an average year, these tradesmen resurface 60 miles of
residential streets; resurface hundreds of blocks of residential alleys; repaint
over 11,500 pavement markings (at about 1,400 intersections); construct
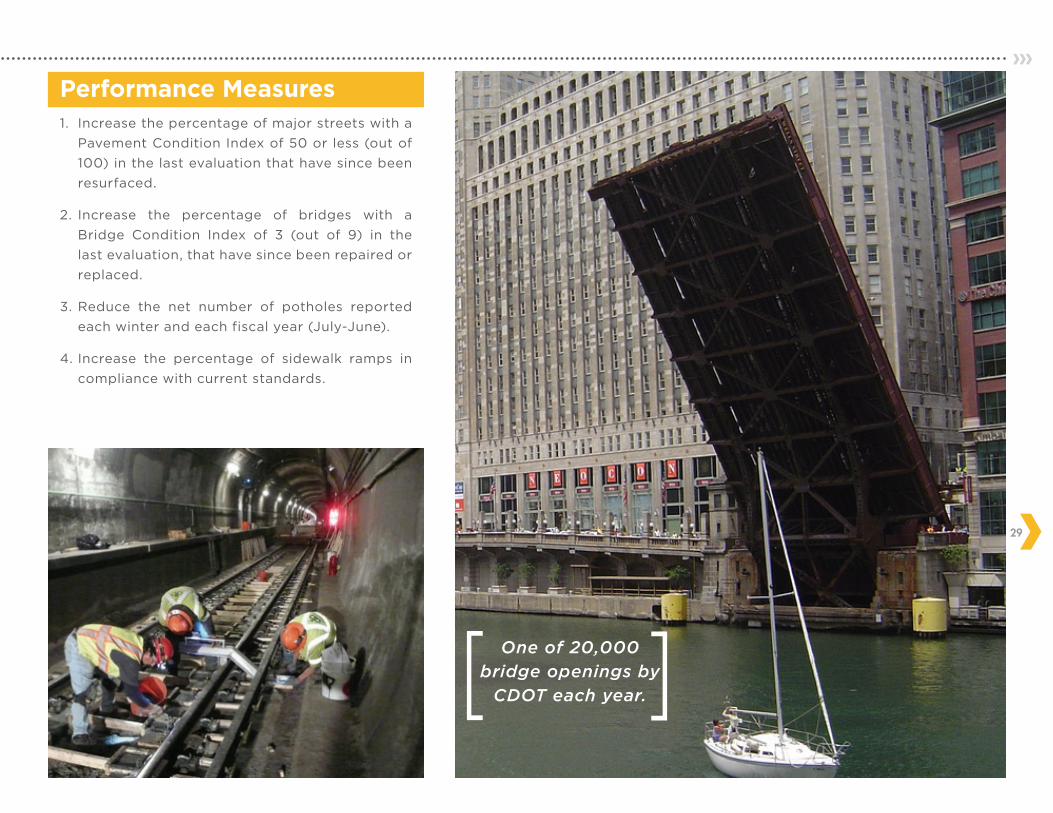
2,000 ADA ramps; raise and lower bridges over 20,000 times; and fill
between 400,000 and 700,000 potholes. While 60 miles of resurfacing
sounds like a large number, alone it means that at that rate–CDOT would
only be able to resurface the city’s over 6,000 miles of residential streets
just once every century. More resources are necessary.
Improving the maintenance of our infrastructure is one of the smartest
investments we can make. We intend to get the most out of facilities and
this will only be possible by ensuring that maintenance is a part of all
decision making processes. We can’t just build infrastructure; we need to
build everything to last.
Asset preservation
is critical.[ [
29
1. Increase the percentage of major streets with a
Pavement Condition Index of 50 or less (out of
100) in the last evaluation that have since been
resurfaced.
2. Increase the percentage of bridges with a
Bridge Condition Index of 3 (out of 9) in the
last evaluation, that have since been repaired or
replaced.
3. Reduce the net number of potholes reported
each winter and each fiscal year (July-June).
4. Increase the percentage of sidewalk ramps in
compliance with current standards.
Performance Measures
One of 20,000 bridge openings by
CDOT each year.[ [
rebui ld & renewa
cti
on
ag
en
da
30
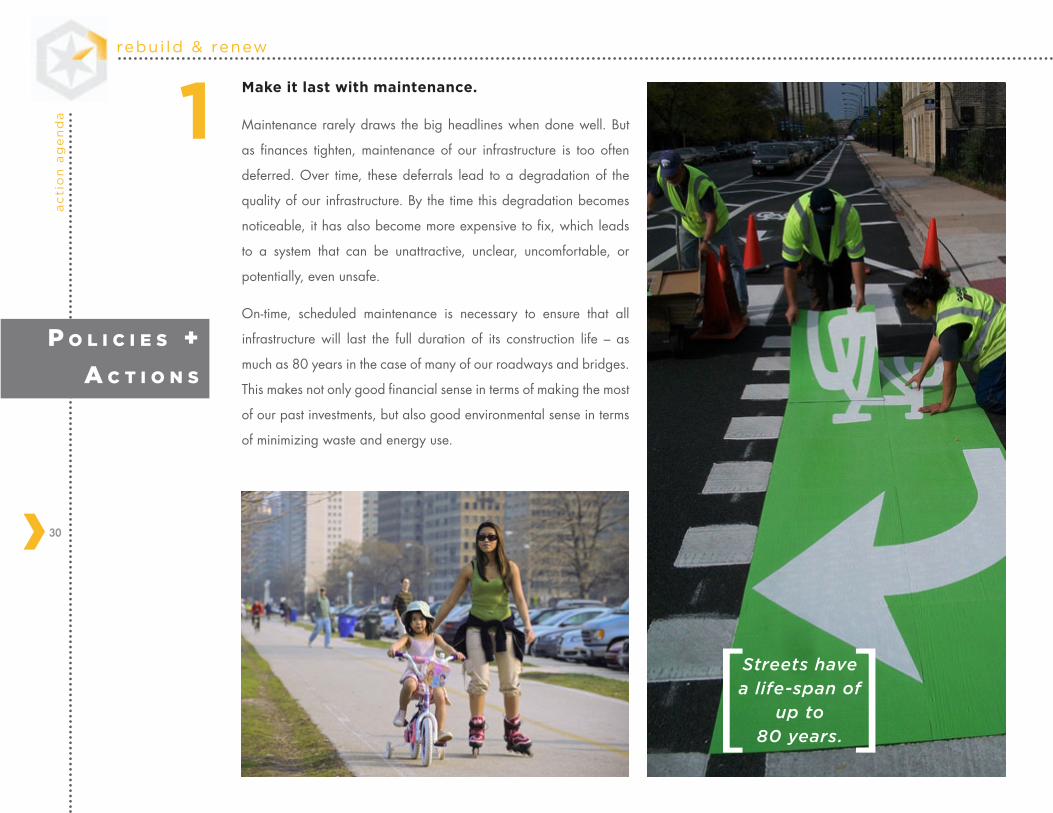
Streets have a life-span of
up to 80 years.[
[1
Make it last with maintenance.
Maintenance rarely draws the big headlines when done well. But
as finances tighten, maintenance of our infrastructure is too often
deferred. Over time, these deferrals lead to a degradation of the
quality of our infrastructure. By the time this degradation becomes
noticeable, it has also become more expensive to fix, which leads
to a system that can be unattractive, unclear, uncomfortable, or
potentially, even unsafe.
On-time, scheduled maintenance is necessary to ensure that all
infrastructure will last the full duration of its construction life – as
much as 80 years in the case of many of our roadways and bridges.
This makes not only good financial sense in terms of making the most
of our past investments, but also good environmental sense in terms
of minimizing waste and energy use.
P o l i c i e s +
A c t i o n s
31
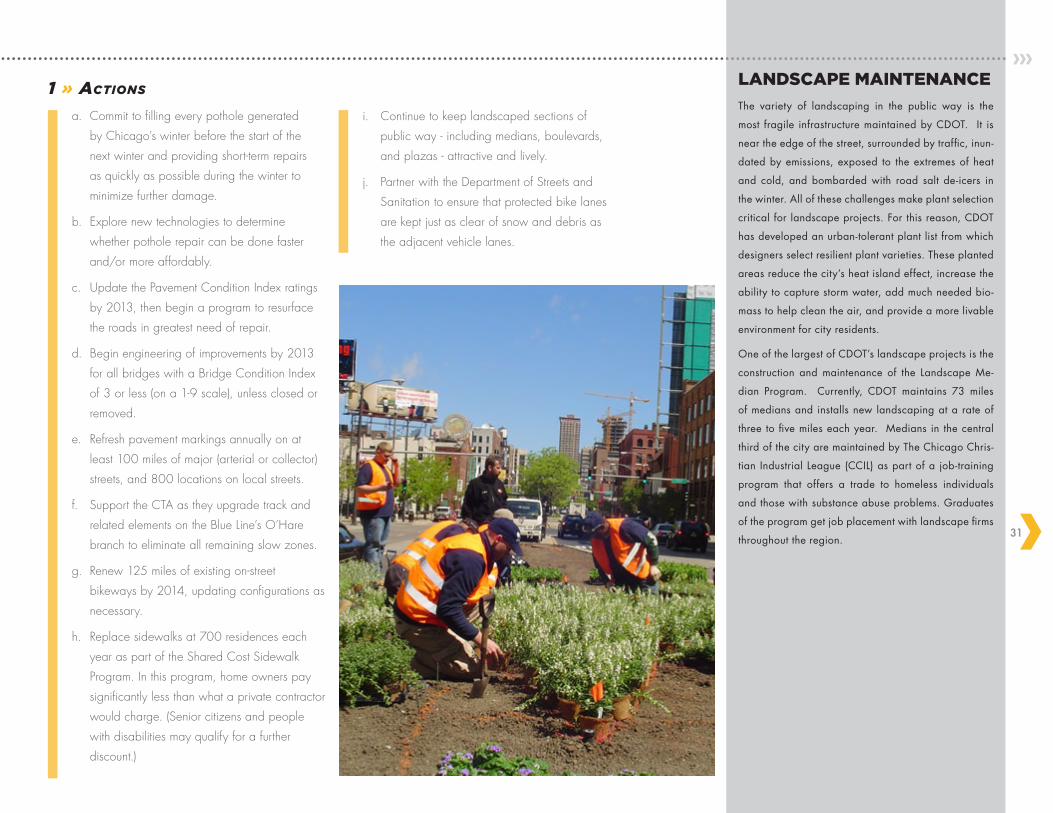
LANDSCAPE MAINTENANCE
The variety of landscaping in the public way is the
most fragile infrastructure maintained by CDOT. It is
near the edge of the street, surrounded by traffic, inun-
dated by emissions, exposed to the extremes of heat
and cold, and bombarded with road salt de-icers in
the winter. All of these challenges make plant selection
critical for landscape projects. For this reason, CDOT
has developed an urban-tolerant plant list from which
designers select resilient plant varieties. These planted
areas reduce the city’s heat island effect, increase the
ability to capture storm water, add much needed bio-
mass to help clean the air, and provide a more livable
environment for city residents.
One of the largest of CDOT’s landscape projects is the
construction and maintenance of the Landscape Me-
dian Program. Currently, CDOT maintains 73 miles
of medians and installs new landscaping at a rate of
three to five miles each year. Medians in the central
third of the city are maintained by The Chicago Chris-
tian Industrial League (CCIL) as part of a job-training
program that offers a trade to homeless individuals
and those with substance abuse problems. Graduates
of the program get job placement with landscape firms
throughout the region.
1 » Actions
a. Commit to filling every pothole generated
by Chicago’s winter before the start of the
next winter and providing short-term repairs
as quickly as possible during the winter to
minimize further damage.
b. Explore new technologies to determine
whether pothole repair can be done faster
and/or more affordably.
c. Update the Pavement Condition Index ratings
by 2013, then begin a program to resurface
the roads in greatest need of repair.
d. Begin engineering of improvements by 2013
for all bridges with a Bridge Condition Index
of 3 or less (on a 1-9 scale), unless closed or
removed.
e. Refresh pavement markings annually on at
least 100 miles of major (arterial or collector)
streets, and 800 locations on local streets.
f. Support the CTA as they upgrade track and
related elements on the Blue Line’s O’Hare
branch to eliminate all remaining slow zones.
g. Renew 125 miles of existing on-street
bikeways by 2014, updating configurations as
necessary.
h. Replace sidewalks at 700 residences each
year as part of the Shared Cost Sidewalk
Program. In this program, home owners pay
significantly less than what a private contractor
would charge. (Senior citizens and people
with disabilities may qualify for a further
discount.)
i. Continue to keep landscaped sections of
public way - including medians, boulevards,
and plazas - attractive and lively.
j. Partner with the Department of Streets and
Sanitation to ensure that protected bike lanes
are kept just as clear of snow and debris as
the adjacent vehicle lanes.
rebui ld & renewa
cti
on
ag
en
da
32
2
Proposed Lakefront Trail access bridge at 35th Street
Existing Historic Torrence Bridge - Reconstruction beginning in 2012
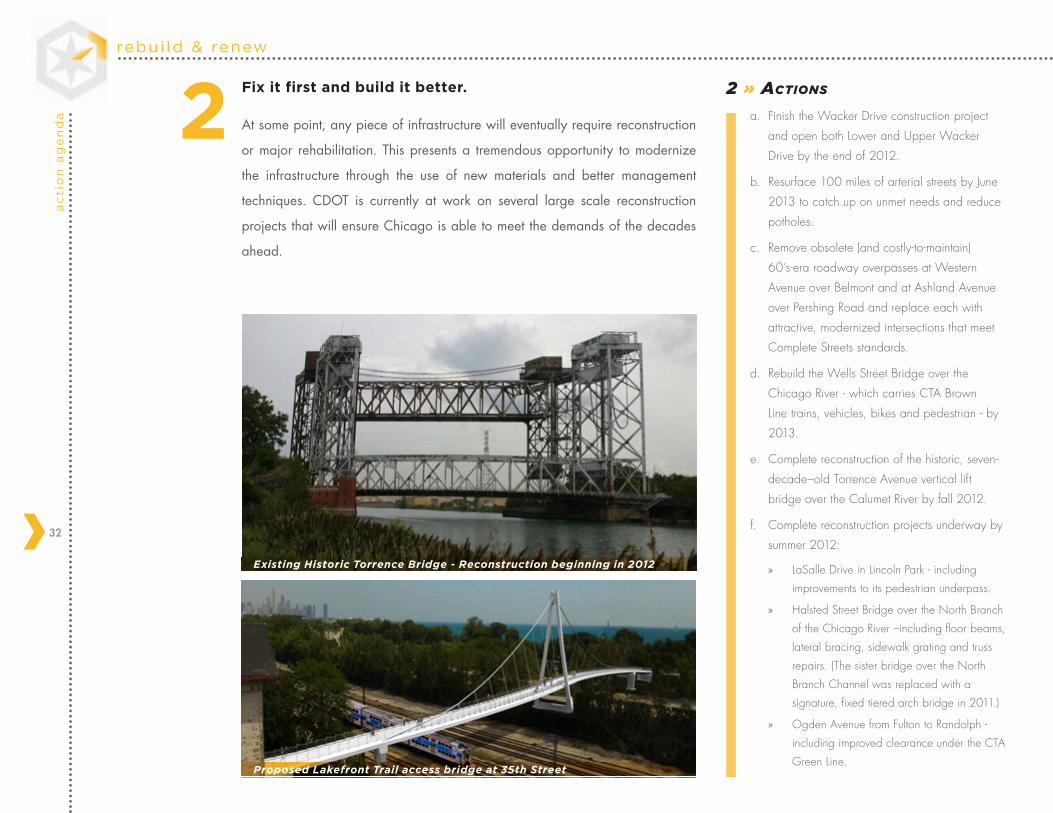
Fix it first and build it better.
At some point, any piece of infrastructure will eventually require reconstruction
or major rehabilitation. This presents a tremendous opportunity to modernize
the infrastructure through the use of new materials and better management
techniques. CDOT is currently at work on several large scale reconstruction
projects that will ensure Chicago is able to meet the demands of the decades
ahead.
2 » Actions
a. Finish the Wacker Drive construction project
and open both Lower and Upper Wacker
Drive by the end of 2012.
b. Resurface 100 miles of arterial streets by June
2013 to catch up on unmet needs and reduce
potholes.
c. Remove obsolete (and costly-to-maintain)
60’s-era roadway overpasses at Western
Avenue over Belmont and at Ashland Avenue
over Pershing Road and replace each with
attractive, modernized intersections that meet
Complete Streets standards.
d. Rebuild the Wells Street Bridge over the
Chicago River - which carries CTA Brown
Line trains, vehicles, bikes and pedestrian - by
2013.
e. Complete reconstruction of the historic, seven-
decade–old Torrence Avenue vertical lift
bridge over the Calumet River by fall 2012.
f. Complete reconstruction projects underway by
summer 2012:
» LaSalle Drive in Lincoln Park - including
improvements to its pedestrian underpass.
» Halsted Street Bridge over the North Branch
of the Chicago River –including floor beams,
lateral bracing, sidewalk grating and truss
repairs. (The sister bridge over the North
Branch Channel was replaced with a
signature, fixed tiered arch bridge in 2011.)
» Ogden Avenue from Fulton to Randolph -
including improved clearance under the CTA
Green Line.
33
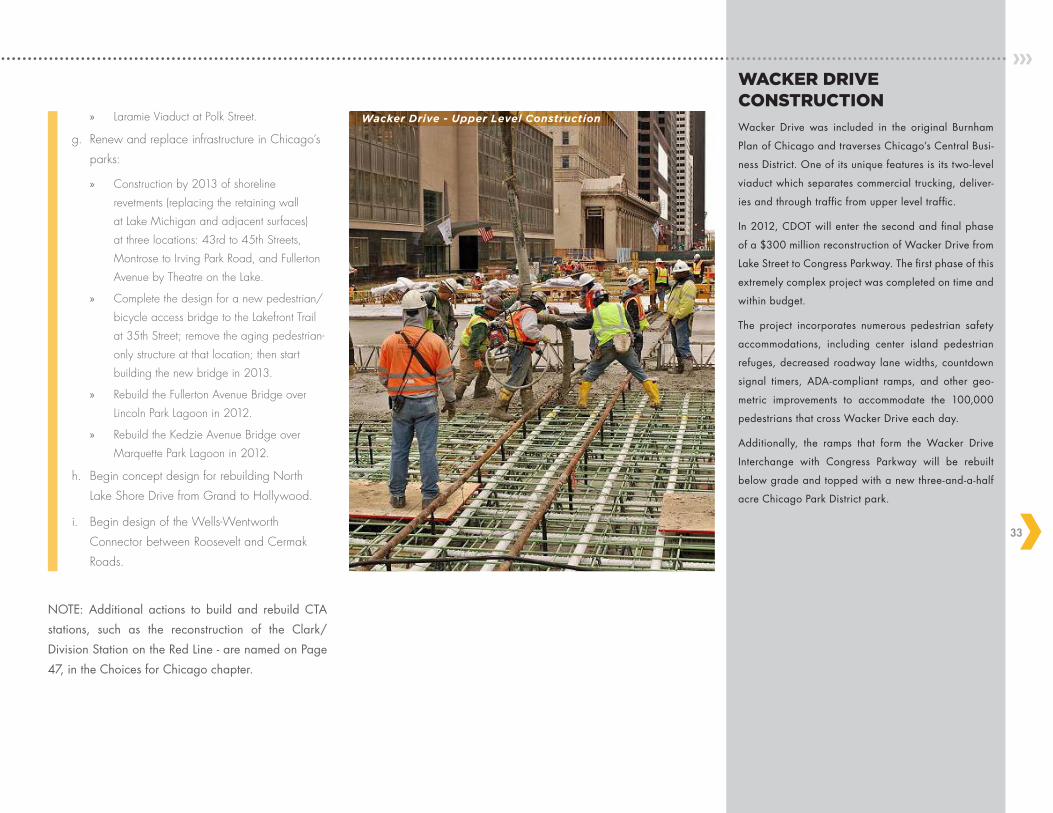
WACKER DRIVE CONSTRUCTION
Wacker Drive was included in the original Burnham
Plan of Chicago and traverses Chicago’s Central Busi-
ness District. One of its unique features is its two-level
viaduct which separates commercial trucking, deliver-
ies and through traffic from upper level traffic.
In 2012, CDOT will enter the second and final phase
of a $300 million reconstruction of Wacker Drive from
Lake Street to Congress Parkway. The first phase of this
extremely complex project was completed on time and
within budget.
The project incorporates numerous pedestrian safety
accommodations, including center island pedestrian
refuges, decreased roadway lane widths, countdown
signal timers, ADA-compliant ramps, and other geo-
metric improvements to accommodate the 100,000
pedestrians that cross Wacker Drive each day.
Additionally, the ramps that form the Wacker Drive
Interchange with Congress Parkway will be rebuilt
below grade and topped with a new three-and-a-half
acre Chicago Park District park.
Wacker Drive - Upper Level Construction » Laramie Viaduct at Polk Street.
g. Renew and replace infrastructure in Chicago’s
parks:
» Construction by 2013 of shoreline
revetments (replacing the retaining wall
at Lake Michigan and adjacent surfaces)
at three locations: 43rd to 45th Streets,
Montrose to Irving Park Road, and Fullerton
Avenue by Theatre on the Lake.
» Complete the design for a new pedestrian/
bicycle access bridge to the Lakefront Trail
at 35th Street; remove the aging pedestrian-
only structure at that location; then start
building the new bridge in 2013.
» Rebuild the Fullerton Avenue Bridge over
Lincoln Park Lagoon in 2012.
» Rebuild the Kedzie Avenue Bridge over
Marquette Park Lagoon in 2012.
h. Begin concept design for rebuilding North
Lake Shore Drive from Grand to Hollywood.
i. Begin design of the Wells-Wentworth
Connector between Roosevelt and Cermak
Roads.
NOTE: Additional actions to build and rebuild CTA
stations, such as the reconstruction of the Clark/
Division Station on the Red Line - are named on Page
47, in the Choices for Chicago chapter.
rebui ld & renewa
cti
on
ag
en
da
34
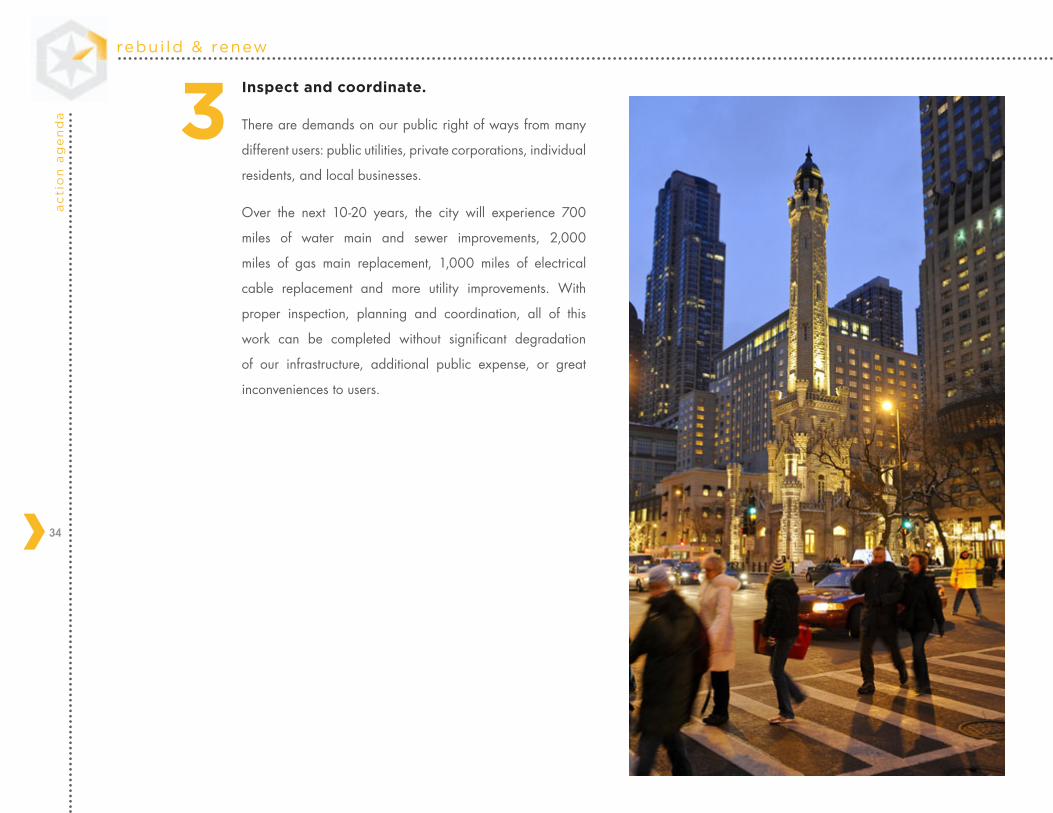
3Inspect and coordinate.
There are demands on our public right of ways from many
different users: public utilities, private corporations, individual
residents, and local businesses.
Over the next 10-20 years, the city will experience 700
miles of water main and sewer improvements, 2,000
miles of gas main replacement, 1,000 miles of electrical
cable replacement and more utility improvements. With
proper inspection, planning and coordination, all of this
work can be completed without significant degradation
of our infrastructure, additional public expense, or great
inconveniences to users.
35
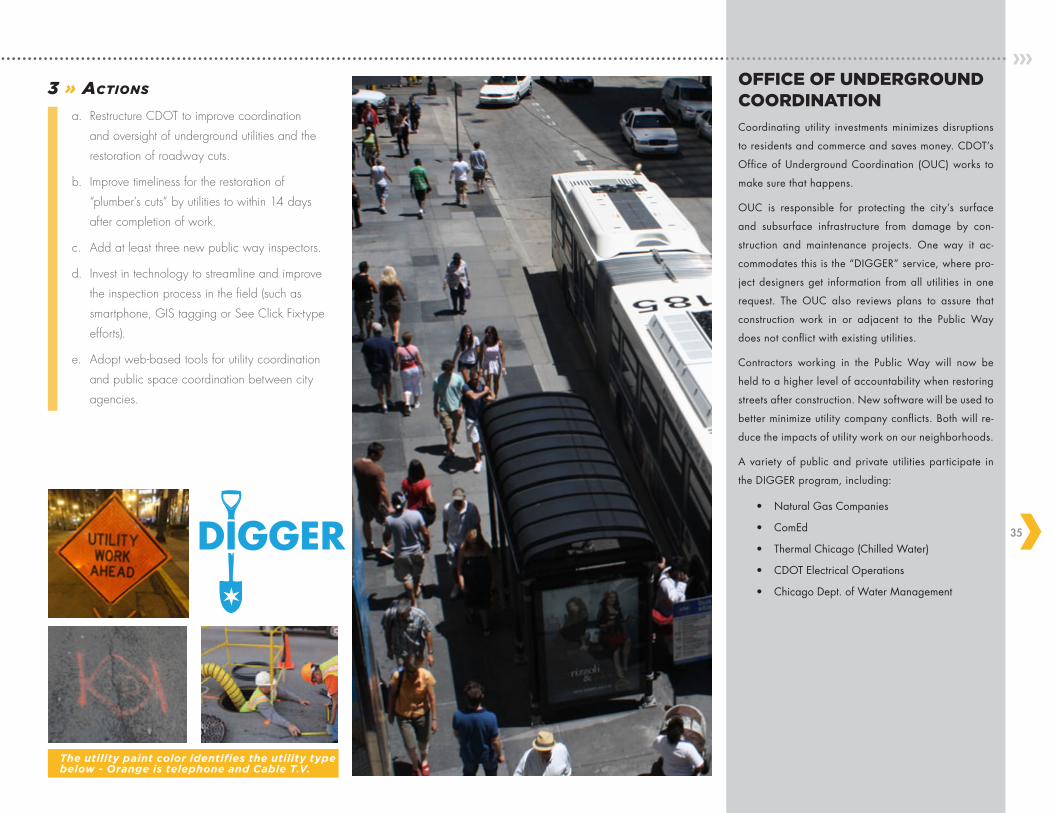
OFFICE OF UNDERGROUND COORDINATION
Coordinating utility investments minimizes disruptions
to residents and commerce and saves money. CDOT’s
Office of Underground Coordination (OUC) works to
make sure that happens.
OUC is responsible for protecting the city’s surface
and subsurface infrastructure from damage by con-
struction and maintenance projects. One way it ac-
commodates this is the “DIGGER” service, where pro-
ject designers get information from all utilities in one
request. The OUC also reviews plans to assure that
construction work in or adjacent to the Public Way
does not conflict with existing utilities.
Contractors working in the Public Way will now be
held to a higher level of accountability when restoring
streets after construction. New software will be used to
better minimize utility company conflicts. Both will re-
duce the impacts of utility work on our neighborhoods.
A variety of public and private utilities participate in
the DIGGER program, including:
• Natural Gas Companies
• ComEd
• Thermal Chicago (Chilled Water)
• CDOT Electrical Operations
• Chicago Dept. of Water Management
The utility paint color identifies the utility type below - Orange is telephone and Cable T.V.
3 » Actions
a. Restructure CDOT to improve coordination
and oversight of underground utilities and the
restoration of roadway cuts.
b. Improve timeliness for the restoration of
“plumber’s cuts” by utilities to within 14 days
after completion of work.
c. Add at least three new public way inspectors.
d. Invest in technology to streamline and improve
the inspection process in the field (such as
smartphone, GIS tagging or See Click Fix-type
efforts).
e. Adopt web-based tools for utility coordination
and public space coordination between city
agencies.
rebui ld & renewa
cti
on
ag
en
da
36
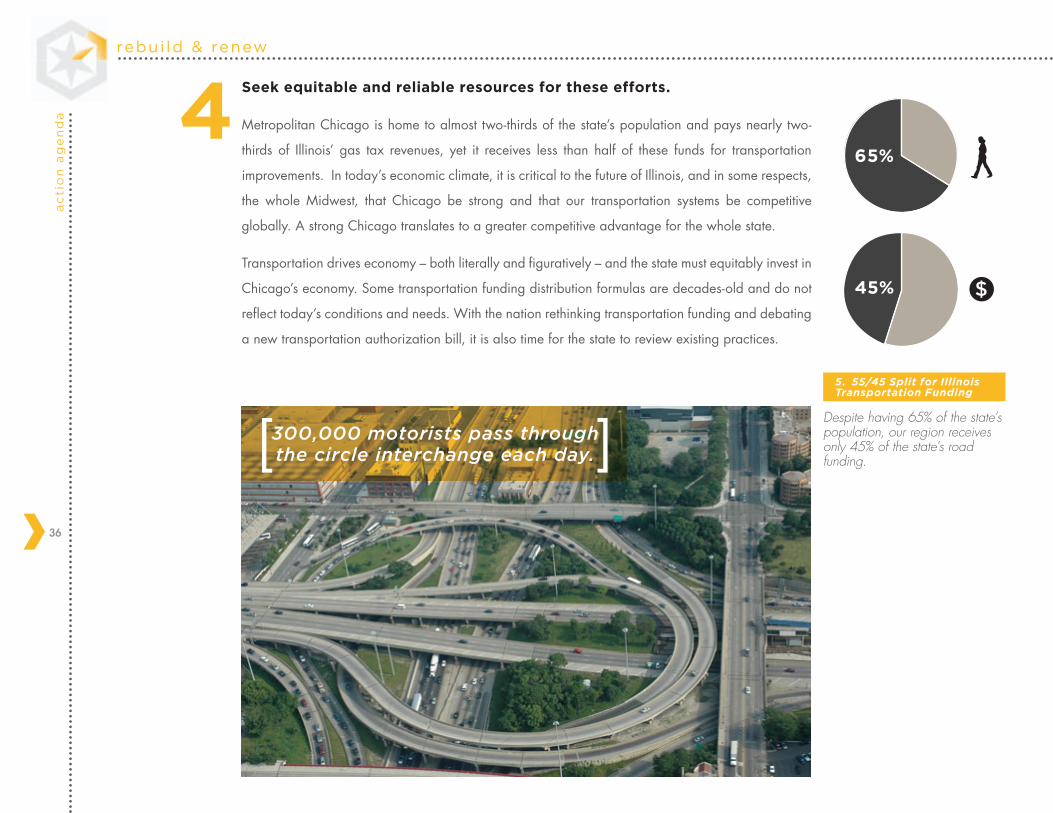
4Seek equitable and reliable resources for these efforts.
Metropolitan Chicago is home to almost two-thirds of the state’s population and pays nearly two-
thirds of Illinois’ gas tax revenues, yet it receives less than half of these funds for transportation
improvements. In today’s economic climate, it is critical to the future of Illinois, and in some respects,
the whole Midwest, that Chicago be strong and that our transportation systems be competitive
globally. A strong Chicago translates to a greater competitive advantage for the whole state.
Transportation drives economy – both literally and figuratively – and the state must equitably invest in
Chicago’s economy. Some transportation funding distribution formulas are decades-old and do not
reflect today’s conditions and needs. With the nation rethinking transportation funding and debating
a new transportation authorization bill, it is also time for the state to review existing practices.
5. 55/45 Split for Illinois Transportation Funding
[ [300,000 motorists pass through the circle interchange each day.
Despite having 65% of the state’s population, our region receives only 45% of the state’s road funding.
65%
45% $
37
4 » Actions
a. Work through the Chicago Metropolitan
Agency for Planning (CMAP) and the
Metropolitan Mayor’s Caucus to eliminate the
archaic entitlement-based formula distribution
of state/federal funds in favor of need-based
allocations.
b. Encourage the Illinois Department of
Transportation (IDOT) to remove the arbitrary
cap placed on Safe Routes to School funding;
instead, apply the formula the federal
government uses in providing the funding to
states (i.e., by number of school-age children
enrolled).
c. Determine the amount of funds needed for high
safety risk location improvements and identify
additional, dedicated funding sources beyond
the Federal Highway Administration’s (FHWA)
discretionary Highway Safety Improvement
Program.
d. Establish a city transportation enterprise fund to
support continuous and reliable transportation
investments in our local system.
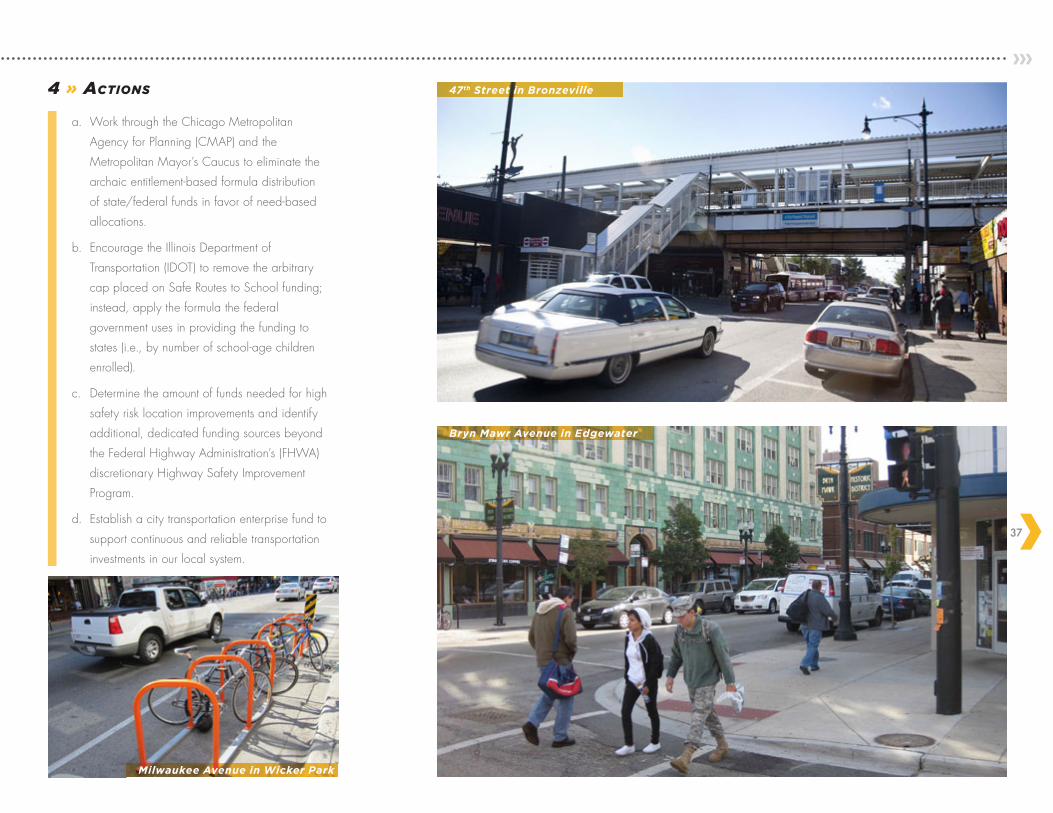
47th Street in Bronzeville
Bryn Mawr Avenue in Edgewater
Milwaukee Avenue in Wicker Park
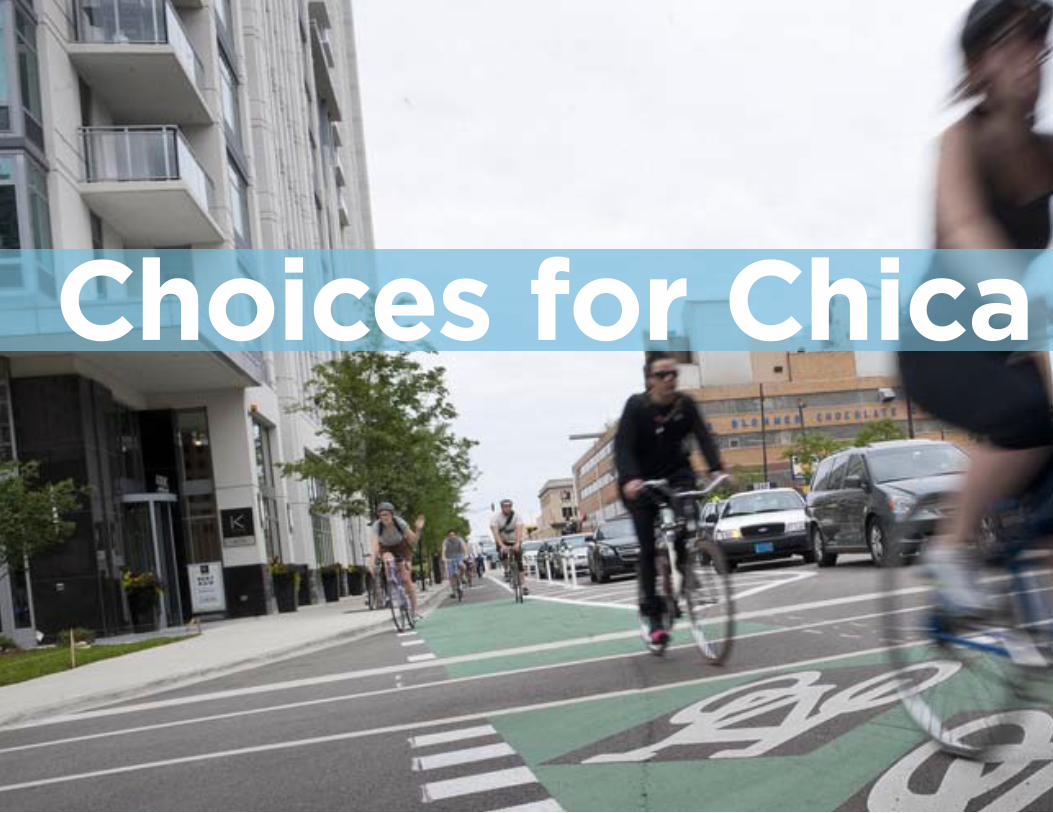
Choices for Chica go
KINZIE STREET, AFTER INSTALLATION OF PROTECTED BIKE LANE
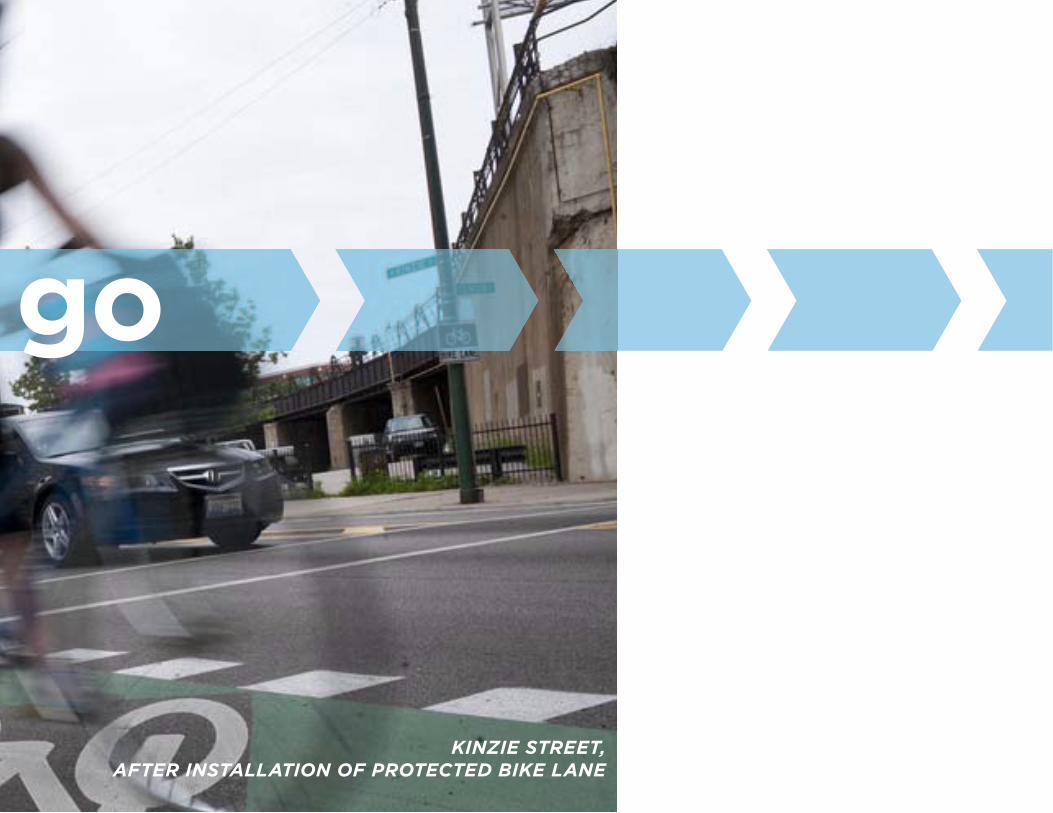
Choices for Chica go
KINZIE STREET, AFTER INSTALLATION OF PROTECTED BIKE LANE
choices for chicagoa
cti
on
ag
en
da
40
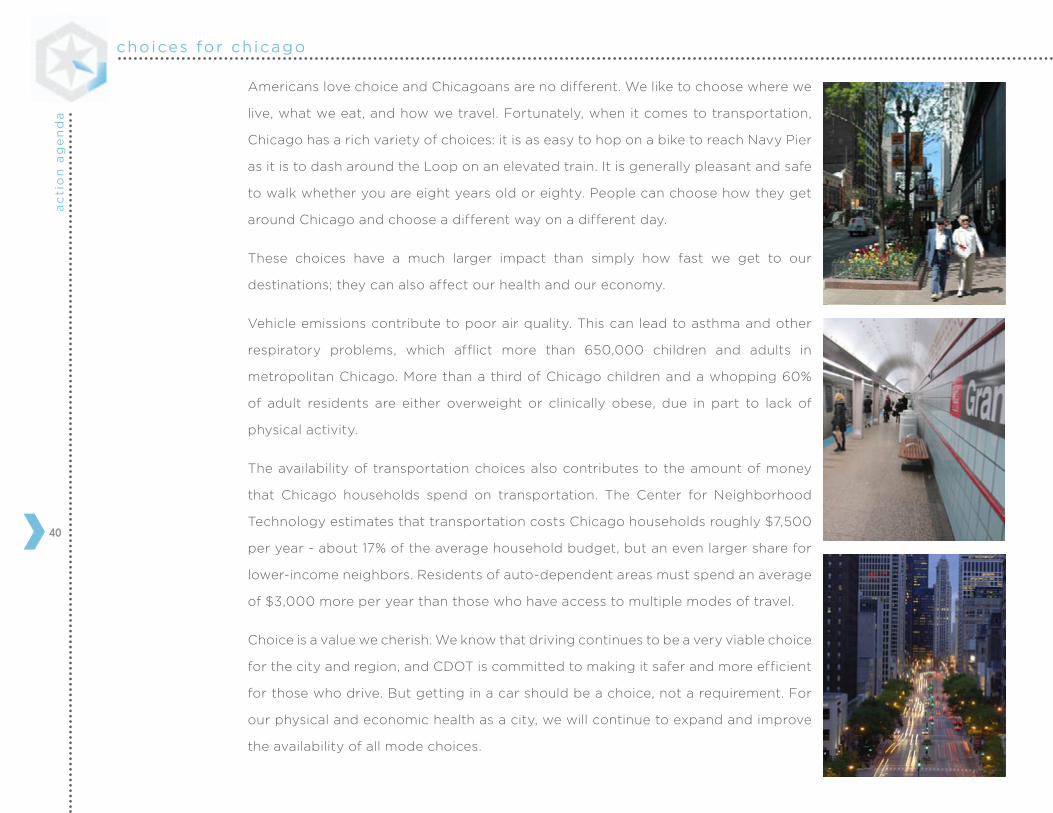
Americans love choice and Chicagoans are no different. We like to choose where we
live, what we eat, and how we travel. Fortunately, when it comes to transportation,
Chicago has a rich variety of choices: it is as easy to hop on a bike to reach Navy Pier
as it is to dash around the Loop on an elevated train. It is generally pleasant and safe
to walk whether you are eight years old or eighty. People can choose how they get
around Chicago and choose a different way on a different day.
These choices have a much larger impact than simply how fast we get to our
destinations; they can also affect our health and our economy.
Vehicle emissions contribute to poor air quality. This can lead to asthma and other
respiratory problems, which afflict more than 650,000 children and adults in
metropolitan Chicago. More than a third of Chicago children and a whopping 60%
of adult residents are either overweight or clinically obese, due in part to lack of
physical activity.
The availability of transportation choices also contributes to the amount of money
that Chicago households spend on transportation. The Center for Neighborhood
Technology estimates that transportation costs Chicago households roughly $7,500
per year - about 17% of the average household budget, but an even larger share for
lower-income neighbors. Residents of auto-dependent areas must spend an average
of $3,000 more per year than those who have access to multiple modes of travel.
Choice is a value we cherish. We know that driving continues to be a very viable choice
for the city and region, and CDOT is committed to making it safer and more efficient
for those who drive. But getting in a car should be a choice, not a requirement. For
our physical and economic health as a city, we will continue to expand and improve
the availability of all mode choices.
41
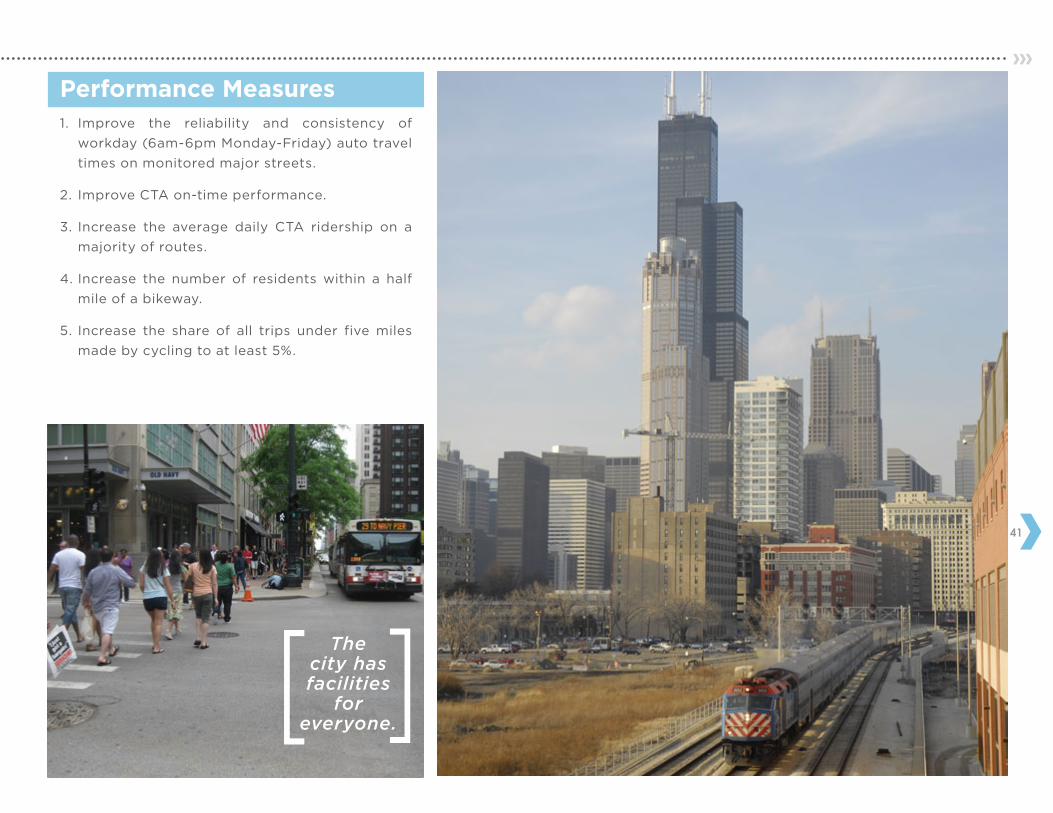
1. Improve the reliability and consistency of
workday (6am-6pm Monday-Friday) auto travel
times on monitored major streets.
2. Improve CTA on-time performance.
3. Increase the average daily CTA ridership on a
majority of routes.
4. Increase the number of residents within a half
mile of a bikeway.
5. Increase the share of all trips under five miles
made by cycling to at least 5%.
Performance Measures
The city has facilities
for everyone.
[[

choices for chicagoa
cti
on
ag
en
da
42
More fully and consistently implement Chicago’s
Complete Streets Policy:
“The safety and convenience of all users of the
transportation system, including pedestrians, bicyclists,
transit users and motor vehicle drivers, shall be
accommodated and balanced in all types of transportation
and development projects and through all phases of
a project, so that even the most vulnerable – children,
elderly, and persons with disabilities – can travel safely
within the public right of way.”
Complete Streets not only increase safety but also add to the economic
competitiveness of the city. A transportation system that encourages walking,
biking, and transit attracts an increasingly mobile workforce that looks for
places that provide a rich quality of life. Implementing Complete Streets and
encouraging people to drive less often will also bring environmental benefits.
Chicago has been a national leader in designing and implementing Complete
Streets. Each and every project is an opportunity for CDOT to improve our
overall transportation system for all of its users.
1 » Actions
a. Improve at least 8,000 curb cuts in
2012–2013 to further enhance access for
people with disabilities.
b. Develop and adopt Complete Streets Design
Guidelines in tandem with Sustainable Design
Standards and in collaboration with the
Consortium to Lower Obesity in Chicago
Children.
c. Train all design engineers in Complete Streets
approaches.
d. Update CDOT’s project delivery system to
ensure Complete Streets design of roadway
projects, and potentially include the use of
a Complete Streets checklist during the first
phase of design.
e. Review all major street resurfacing projects for
opportunities to incorporate Complete Streets
elements (curb cut replacement, “zebra stripe”
crosswalks, refuge islands, bike lanes) and
implement selected elements.
f. Prepare an updated Complete Streets
ordinance or resolution for City Council
approval.
g. Require all “maintenance of traffic” plans
submitted for private and public construction
projects to show compliance with Complete
Streets standards.
Streets should accommodate and protect all users.[ [
1
P o l i c i e s +
A c t i o n s
43
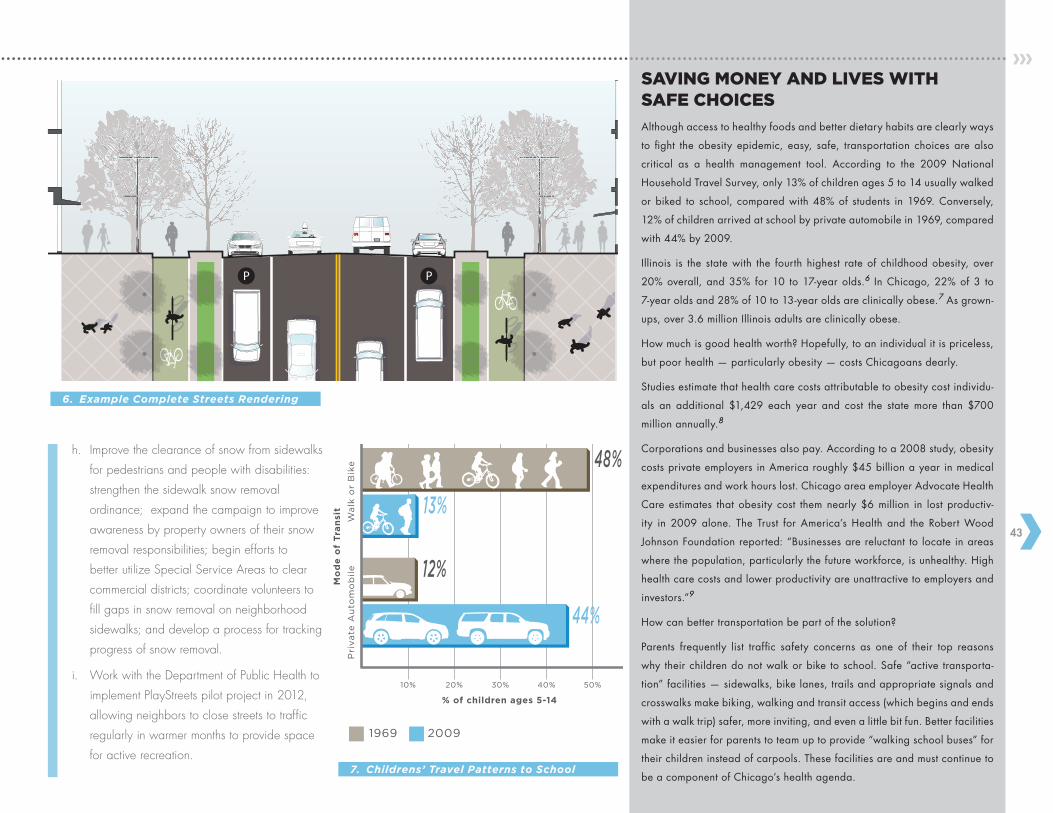
10%
% of children ages 5-14
Mo
de
of
Tra
nsit 13%
44%
12%
48%
Wa
lk o
r B
ike
Pri
va
te A
uto
mo
bil
e
20% 30% 40% 50%
1969 2009
10%
% of children ages 5-14
Mo
de
of
Tra
nsi
t 13%
44%
12%
48%
Wa
lk o
r B
ike
Pri
va
te A
uto
mo
bil
e
20% 30% 40% 50%
1969 2009
PP
6. Example Complete Streets Rendering
7. Childrens’ Travel Patterns to School
SAVING MONEY AND LIVES WITH SAFE CHOICES
Although access to healthy foods and better dietary habits are clearly ways
to fight the obesity epidemic, easy, safe, transportation choices are also
critical as a health management tool. According to the 2009 National
Household Travel Survey, only 13% of children ages 5 to 14 usually walked
or biked to school, compared with 48% of students in 1969. Conversely,
12% of children arrived at school by private automobile in 1969, compared
with 44% by 2009.
Illinois is the state with the fourth highest rate of childhood obesity, over
20% overall, and 35% for 10 to 17-year olds.6 In Chicago, 22% of 3 to
7-year olds and 28% of 10 to 13-year olds are clinically obese.7 As grown-
ups, over 3.6 million Illinois adults are clinically obese.
How much is good health worth? Hopefully, to an individual it is priceless,
but poor health — particularly obesity — costs Chicagoans dearly.
Studies estimate that health care costs attributable to obesity cost individu-
als an additional $1,429 each year and cost the state more than $700
million annually.8
Corporations and businesses also pay. According to a 2008 study, obesity
costs private employers in America roughly $45 billion a year in medical
expenditures and work hours lost. Chicago area employer Advocate Health
Care estimates that obesity cost them nearly $6 million in lost productiv-
ity in 2009 alone. The Trust for America’s Health and the Robert Wood
Johnson Foundation reported: “Businesses are reluctant to locate in areas
where the population, particularly the future workforce, is unhealthy. High
health care costs and lower productivity are unattractive to employers and
investors.”9
How can better transportation be part of the solution?
Parents frequently list traffic safety concerns as one of their top reasons
why their children do not walk or bike to school. Safe “active transporta-
tion” facilities — sidewalks, bike lanes, trails and appropriate signals and
crosswalks make biking, walking and transit access (which begins and ends
with a walk trip) safer, more inviting, and even a little bit fun. Better facilities
make it easier for parents to team up to provide “walking school buses” for
their children instead of carpools. These facilities are and must continue to
be a component of Chicago’s health agenda.
h. Improve the clearance of snow from sidewalks
for pedestrians and people with disabilities:
strengthen the sidewalk snow removal
ordinance; expand the campaign to improve
awareness by property owners of their snow
removal responsibilities; begin efforts to
better utilize Special Service Areas to clear
commercial districts; coordinate volunteers to
fill gaps in snow removal on neighborhood
sidewalks; and develop a process for tracking
progress of snow removal.
i. Work with the Department of Public Health to
implement PlayStreets pilot project in 2012,
allowing neighbors to close streets to traffic
regularly in warmer months to provide space
for active recreation.
choices for chicagoa
cti
on
ag
en
da
44
2
Cyclists + Runners on Lakefront Trail
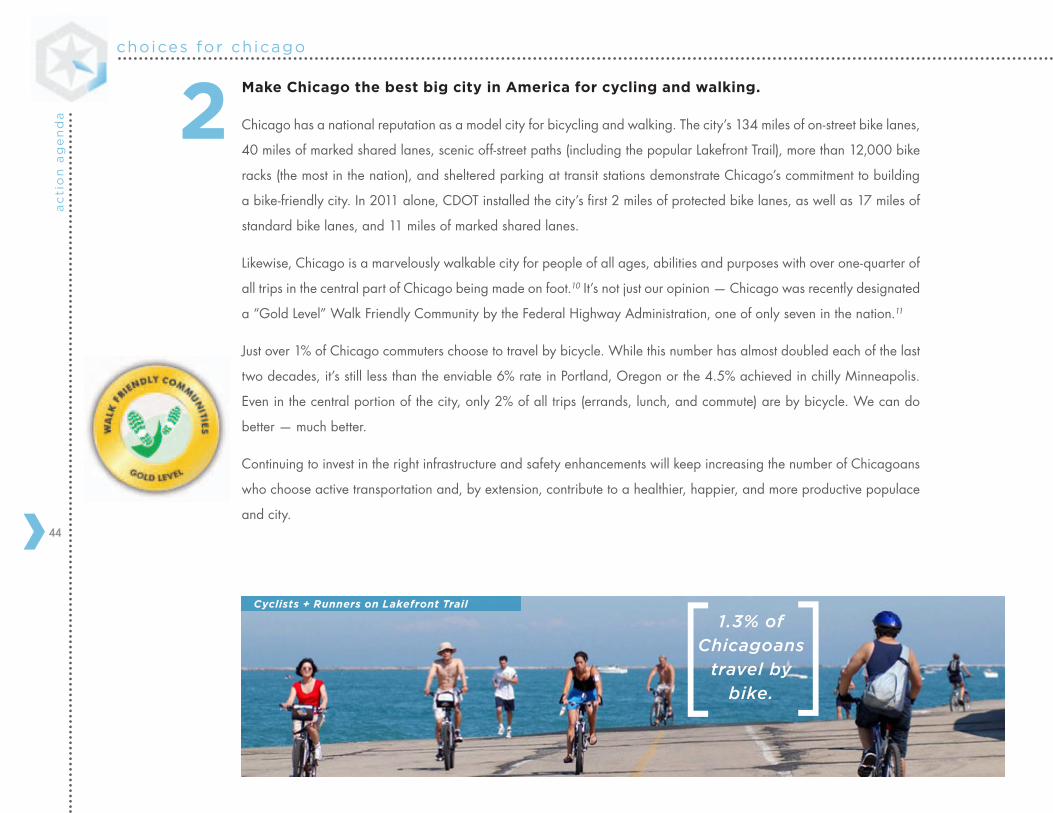
Make Chicago the best big city in America for cycling and walking.
Chicago has a national reputation as a model city for bicycling and walking. The city’s 134 miles of on-street bike lanes,
40 miles of marked shared lanes, scenic off-street paths (including the popular Lakefront Trail), more than 12,000 bike
racks (the most in the nation), and sheltered parking at transit stations demonstrate Chicago’s commitment to building
a bike-friendly city. In 2011 alone, CDOT installed the city’s first 2 miles of protected bike lanes, as well as 17 miles of
standard bike lanes, and 11 miles of marked shared lanes.
Likewise, Chicago is a marvelously walkable city for people of all ages, abilities and purposes with over one-quarter of
all trips in the central part of Chicago being made on foot.10 It’s not just our opinion — Chicago was recently designated
a “Gold Level” Walk Friendly Community by the Federal Highway Administration, one of only seven in the nation.11
Just over 1% of Chicago commuters choose to travel by bicycle. While this number has almost doubled each of the last
two decades, it’s still less than the enviable 6% rate in Portland, Oregon or the 4.5% achieved in chilly Minneapolis.
Even in the central portion of the city, only 2% of all trips (errands, lunch, and commute) are by bicycle. We can do
better — much better.
Continuing to invest in the right infrastructure and safety enhancements will keep increasing the number of Chicagoans
who choose active transportation and, by extension, contribute to a healthier, happier, and more productive populace
and city.
1.3% of Chicagoans
travel by bike.[ [
45
= 1% of commuters
In the central zone of the city, only 2% of all trips are done by bicycle
Chicago- 1.3%
San Francisco- 3.5%
Sacramento- 2.5%Denver- 2.2%
Washington D.C.- 3.1%
Tuscon- 3.0%Austin- 1.0%
New Orleans- 1.8%
Tampa- 1.9%
St. Louis- 0.9%
Seattle- 3.6%
Portland- 6.0%
Minneapolis- 3.5%
Boston- 1.4%
Baltimore- 0.7%
Anchorage- 1.5%
Honolulu- 1.6%
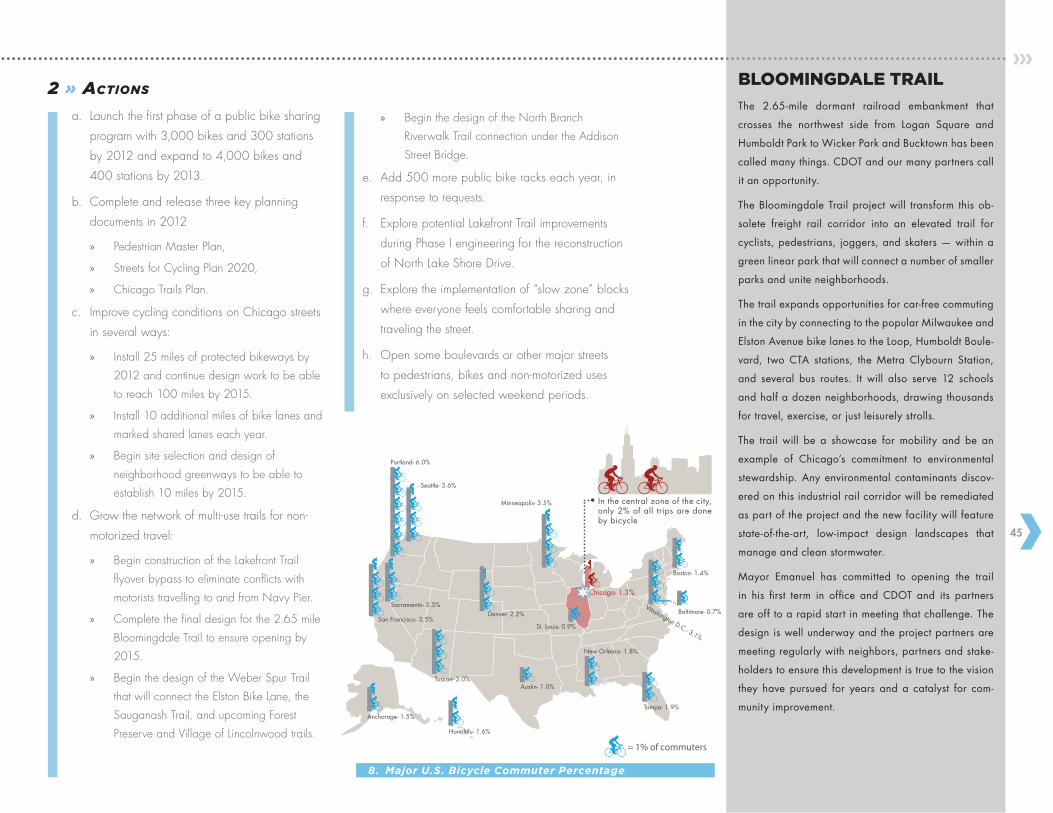
8. Major U.S. Bicycle Commuter Percentage
2 » Actions
a. Launch the first phase of a public bike sharing
program with 3,000 bikes and 300 stations
by 2012 and expand to 4,000 bikes and
400 stations by 2013.
b. Complete and release three key planning
documents in 2012
» Pedestrian Master Plan,
» Streets for Cycling Plan 2020,
» Chicago Trails Plan.
c. Improve cycling conditions on Chicago streets
in several ways:
» Install 25 miles of protected bikeways by
2012 and continue design work to be able
to reach 100 miles by 2015.
» Install 10 additional miles of bike lanes and
marked shared lanes each year.
» Begin site selection and design of
neighborhood greenways to be able to
establish 10 miles by 2015.
d. Grow the network of multi-use trails for non-
motorized travel:
» Begin construction of the Lakefront Trail
flyover bypass to eliminate conflicts with
motorists travelling to and from Navy Pier.
» Complete the final design for the 2.65 mile
Bloomingdale Trail to ensure opening by
2015.
» Begin the design of the Weber Spur Trail
that will connect the Elston Bike Lane, the
Sauganash Trail, and upcoming Forest
Preserve and Village of Lincolnwood trails.
» Begin the design of the North Branch
Riverwalk Trail connection under the Addison
Street Bridge.
e. Add 500 more public bike racks each year, in
response to requests.
f. Explore potential Lakefront Trail improvements
during Phase I engineering for the reconstruction
of North Lake Shore Drive.
g. Explore the implementation of “slow zone” blocks
where everyone feels comfortable sharing and
traveling the street.
h. Open some boulevards or other major streets
to pedestrians, bikes and non-motorized uses
exclusively on selected weekend periods.
BLOOMINGDALE TRAIL
The 2.65-mile dormant railroad embankment that
crosses the northwest side from Logan Square and
Humboldt Park to Wicker Park and Bucktown has been
called many things. CDOT and our many partners call
it an opportunity.
The Bloomingdale Trail project will transform this ob-
solete freight rail corridor into an elevated trail for
cyclists, pedestrians, joggers, and skaters — within a
green linear park that will connect a number of smaller
parks and unite neighborhoods.
The trail expands opportunities for car-free commuting
in the city by connecting to the popular Milwaukee and
Elston Avenue bike lanes to the Loop, Humboldt Boule-
vard, two CTA stations, the Metra Clybourn Station,
and several bus routes. It will also serve 12 schools
and half a dozen neighborhoods, drawing thousands
for travel, exercise, or just leisurely strolls.
The trail will be a showcase for mobility and be an
example of Chicago’s commitment to environmental
stewardship. Any environmental contaminants discov-
ered on this industrial rail corridor will be remediated
as part of the project and the new facility will feature
state-of-the-art, low-impact design landscapes that
manage and clean stormwater.
Mayor Emanuel has committed to opening the trail
in his first term in office and CDOT and its partners
are off to a rapid start in meeting that challenge. The
design is well underway and the project partners are
meeting regularly with neighbors, partners and stake-
holders to ensure this development is true to the vision
they have pursued for years and a catalyst for com-
munity improvement.
choices for chicagoa
cti
on
ag
en
da
46
3
50
0
100
150
200
250
300
350
1997
1998
1999
2000
2001
2002
2003
2004
2005
2006
2007
2008
2009
2010
Rid
ers
(in
mil
lio
ns)
39.338.6
34.8 34.1
38.0 40.4
35.1
74.5 78.8
76.874.4 80.8 86.8
81.4
153.6
291.7
176.3
303.3 304.8
296 299.6
328.2
306
180.4
178.7 195.2
198.1 210.9
CTA Bus PaceCTA Rail Metra
9. Annual Transit Ridership: 1997 - 2010
Provide all residents, workers, and visitors
with efficient, affordable, and attractive transit
services.
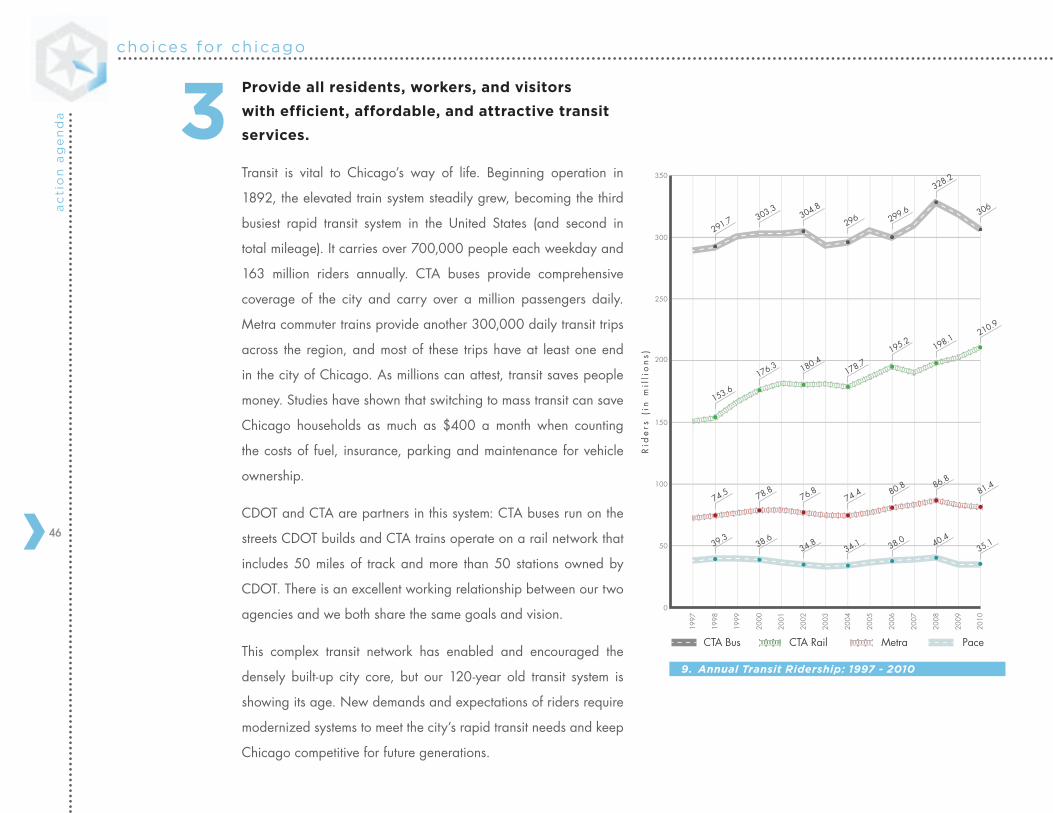
Transit is vital to Chicago’s way of life. Beginning operation in
1892, the elevated train system steadily grew, becoming the third
busiest rapid transit system in the United States (and second in
total mileage). It carries over 700,000 people each weekday and
163 million riders annually. CTA buses provide comprehensive
coverage of the city and carry over a million passengers daily.
Metra commuter trains provide another 300,000 daily transit trips
across the region, and most of these trips have at least one end
in the city of Chicago. As millions can attest, transit saves people
money. Studies have shown that switching to mass transit can save
Chicago households as much as $400 a month when counting
the costs of fuel, insurance, parking and maintenance for vehicle
ownership.
CDOT and CTA are partners in this system: CTA buses run on the
streets CDOT builds and CTA trains operate on a rail network that
includes 50 miles of track and more than 50 stations owned by
CDOT. There is an excellent working relationship between our two
agencies and we both share the same goals and vision.
This complex transit network has enabled and encouraged the
densely built-up city core, but our 120-year old transit system is
showing its age. New demands and expectations of riders require
modernized systems to meet the city’s rapid transit needs and keep
Chicago competitive for future generations.
47
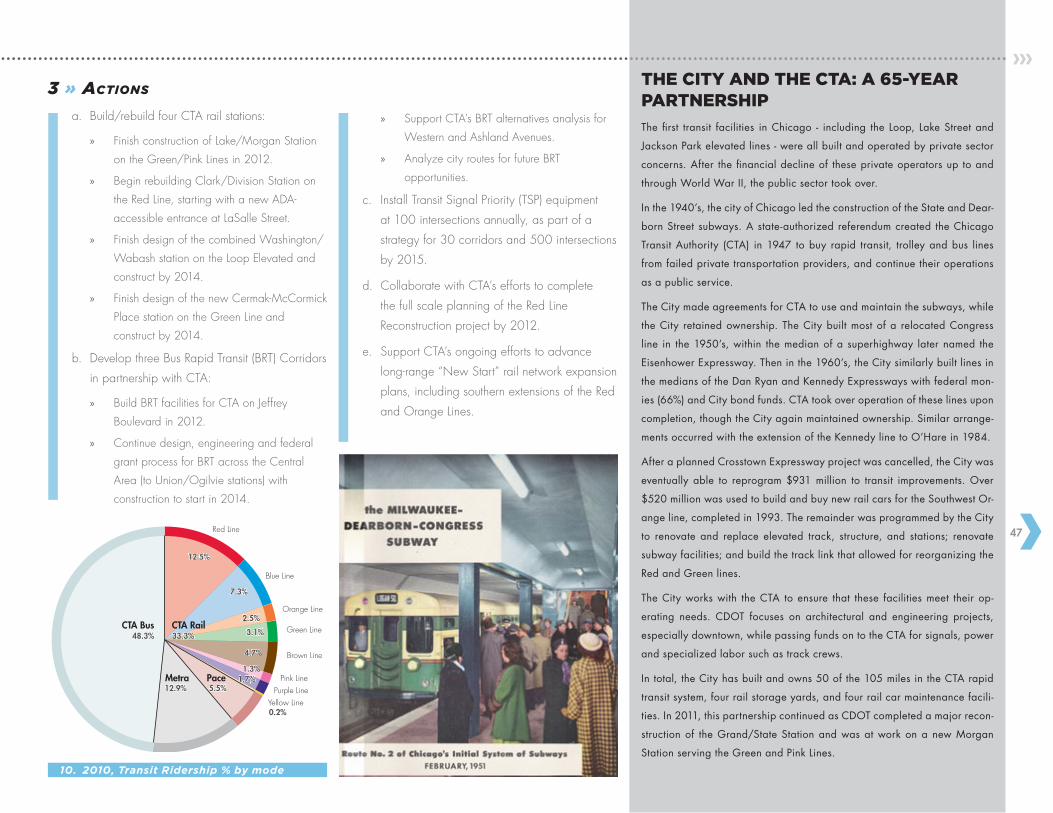
10. 2010, Transit Ridership % by mode
Red Line
Blue Line
Orange Line
Green Line
Brown Line
Pink LinePurple Line
Yellow Line
Metra Pace
CTA Bus CTA Rail
12.5%
7.3%
2.5%
3.1%
4.7%
1.3%1.7%
0.2%
5.5%12.9%
33.3%48.3%
3 » Actions
a. Build/rebuild four CTA rail stations:
» Finish construction of Lake/Morgan Station
on the Green/Pink Lines in 2012.
» Begin rebuilding Clark/Division Station on
the Red Line, starting with a new ADA-
accessible entrance at LaSalle Street.
» Finish design of the combined Washington/
Wabash station on the Loop Elevated and
construct by 2014.
» Finish design of the new Cermak-McCormick
Place station on the Green Line and
construct by 2014.
b. Develop three Bus Rapid Transit (BRT) Corridors
in partnership with CTA:
» Build BRT facilities for CTA on Jeffrey
Boulevard in 2012.
» Continue design, engineering and federal
grant process for BRT across the Central
Area (to Union/Ogilvie stations) with
construction to start in 2014.
THE CITY AND THE CTA: A 65-YEAR PARTNERSHIP
The first transit facilities in Chicago - including the Loop, Lake Street and
Jackson Park elevated lines - were all built and operated by private sector
concerns. After the financial decline of these private operators up to and
through World War II, the public sector took over.
In the 1940’s, the city of Chicago led the construction of the State and Dear-
born Street subways. A state-authorized referendum created the Chicago
Transit Authority (CTA) in 1947 to buy rapid transit, trolley and bus lines
from failed private transportation providers, and continue their operations
as a public service.
The City made agreements for CTA to use and maintain the subways, while
the City retained ownership. The City built most of a relocated Congress
line in the 1950’s, within the median of a superhighway later named the
Eisenhower Expressway. Then in the 1960’s, the City similarly built lines in
the medians of the Dan Ryan and Kennedy Expressways with federal mon-
ies (66%) and City bond funds. CTA took over operation of these lines upon
completion, though the City again maintained ownership. Similar arrange-
ments occurred with the extension of the Kennedy line to O’Hare in 1984.
After a planned Crosstown Expressway project was cancelled, the City was
eventually able to reprogram $931 million to transit improvements. Over
$520 million was used to build and buy new rail cars for the Southwest Or-
ange line, completed in 1993. The remainder was programmed by the City
to renovate and replace elevated track, structure, and stations; renovate
subway facilities; and build the track link that allowed for reorganizing the
Red and Green lines.
The City works with the CTA to ensure that these facilities meet their op-
erating needs. CDOT focuses on architectural and engineering projects,
especially downtown, while passing funds on to the CTA for signals, power
and specialized labor such as track crews.
In total, the City has built and owns 50 of the 105 miles in the CTA rapid
transit system, four rail storage yards, and four rail car maintenance facili-
ties. In 2011, this partnership continued as CDOT completed a major recon-
struction of the Grand/State Station and was at work on a new Morgan
Station serving the Green and Pink Lines.
» Support CTA’s BRT alternatives analysis for
Western and Ashland Avenues.
» Analyze city routes for future BRT
opportunities.
c. Install Transit Signal Priority (TSP) equipment
at 100 intersections annually, as part of a
strategy for 30 corridors and 500 intersections
by 2015.
d. Collaborate with CTA’s efforts to complete
the full scale planning of the Red Line
Reconstruction project by 2012.
e. Support CTA’s ongoing efforts to advance
long-range “New Start” rail network expansion
plans, including southern extensions of the Red
and Orange Lines.
choices for chicagoa
cti
on
ag
en
da
48
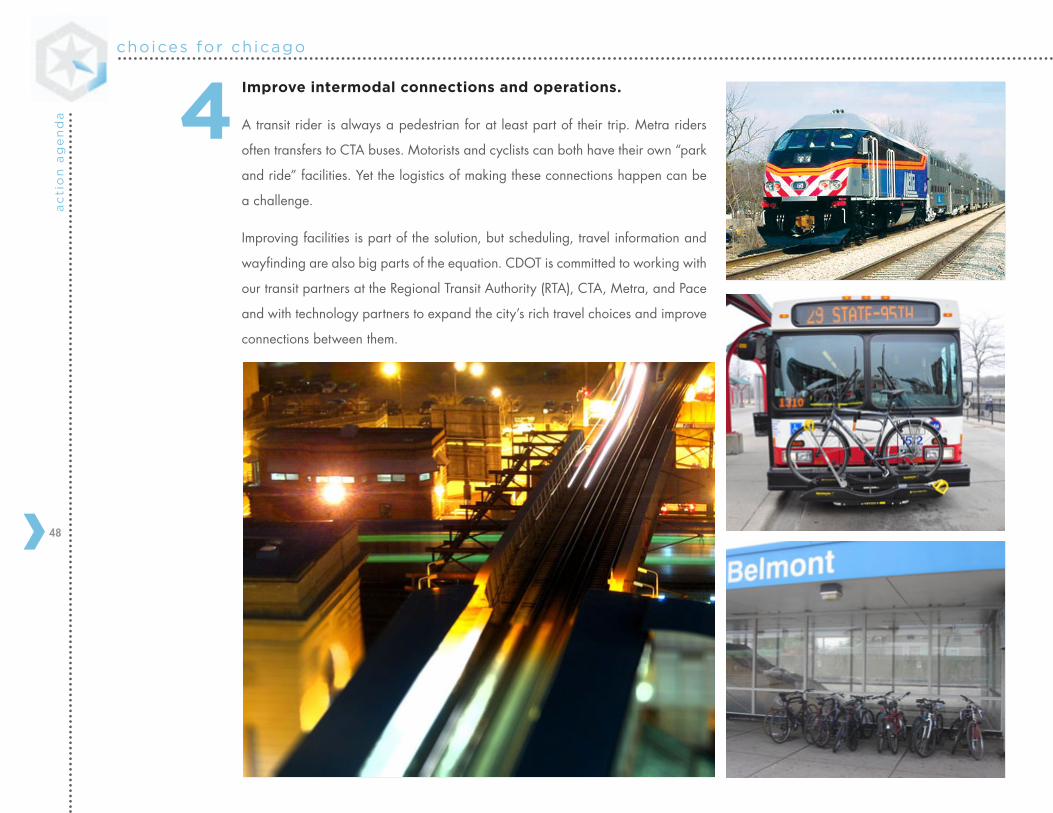
4Improve intermodal connections and operations.
A transit rider is always a pedestrian for at least part of their trip. Metra riders
often transfers to CTA buses. Motorists and cyclists can both have their own “park
and ride” facilities. Yet the logistics of making these connections happen can be
a challenge.
Improving facilities is part of the solution, but scheduling, travel information and
wayfinding are also big parts of the equation. CDOT is committed to working with
our transit partners at the Regional Transit Authority (RTA), CTA, Metra, and Pace
and with technology partners to expand the city’s rich travel choices and improve
connections between them.
49
4 » Actions
a. Improve transfers at Union Station, the region’s
busiest transit facility:
» Begin design and acquire land for a new
rail-bus transfer center south of Jackson
Street, to open in 2014 along with Central
Area BRT.
» Finish a station master plan study to assess
future options for improving transfers and
increasing capacity. Begin computer
simulations to further refine these options.
» Coordinate with Amtrak (owner of the
station) on their overall plans for changes
in operations and facilities over the next 20
years.
b. Work to add customized BusTracker and
intermodal information on monitors in bus
shelters, beginning with Bus Rapid Transit
routes.
c. Upgrade “first mile/last mile” transit access.
» Install high-capacity, double-deck bike racks
in five additional CTA or Metra stations to
improve transit connections for cyclists.
» Install Bike Sharing stations at or near all
CTA or Metra stations in the bike sharing
service area, including the four downtown
Metra terminals (Union, Ogilvie, Millennium,
LaSalle).
» Make sidewalk, crosswalk, and bike
parking improvements where needed.
» Complete the Access to Transit Data Study,
reporting mode of access information and
user perception of transit access conditions
for 48 CTA stations in Chicago.
d. Support the RTA’s project to improve
wayfinding signs at interagency transit transfer
points, beginning with the Jackson-Van Buren
corridor.
e. Support CTA and RTA efforts to implement a
unified fare system and/or electronic payment
system for transit operators.
f. Work with the Department of Housing and
Economic Development to identify city-owned
properties for expanded car-sharing and bike
parking locations at transit stations.
g. Work with CTA and Metra to designate
agency pedestrian and bicycle coordinators.
BUS RAPID TRANSIT
What do you get when you combine the limited stops and
fast boarding of rapid transit with the service flexibility,
fast implementation and affordability of bus transit ser-
vice? Bus Rapid Transit, or “BRT” for short.
Details of BRT service in Chicago will vary from corridor
to corridor based on context (and will have a catchier
name than “BRT”), but each starts with clearly dedicated
bus lanes. Other options in the “toolbox” to be used in
some projects include:
• Fewer stops
• Traffic Signal Priority – including “queue jumps”
• Boarding area canopies
• Real time bus arrival signs
• Wide doors/Bus floor level boarding
• Prepaid boarding
• Streetscaping
• Increased capacity
There are several BRT projects in the works. The Jeffrey
Corridor project will be the first demonstration in the city
of the potential of BRT. It reduces the number of stops
and improves rush hour travel on one of Chicago’s most
popular express routes, more than two miles from the
nearest rail rapid transit service.
The Central Area East-West corridor will cross the heart
of the Loop, improving travel times and comfort for users
of seven bus routes (including the Jeffrey Express) that
serve Ogilvie and/or Union stations, but also continue
onward to Navy Pier, Streeterville, River East, the Illinois
Medical District, the United Center, Milwaukee Avenue,
Madison Street, and Blue Island Avenue.
Western and Ashland Avenues are currently being stud-
ied as future BRT routes. These popular bus routes trav-
erse the city and provide access to several different CTA
and Metra rail stations.
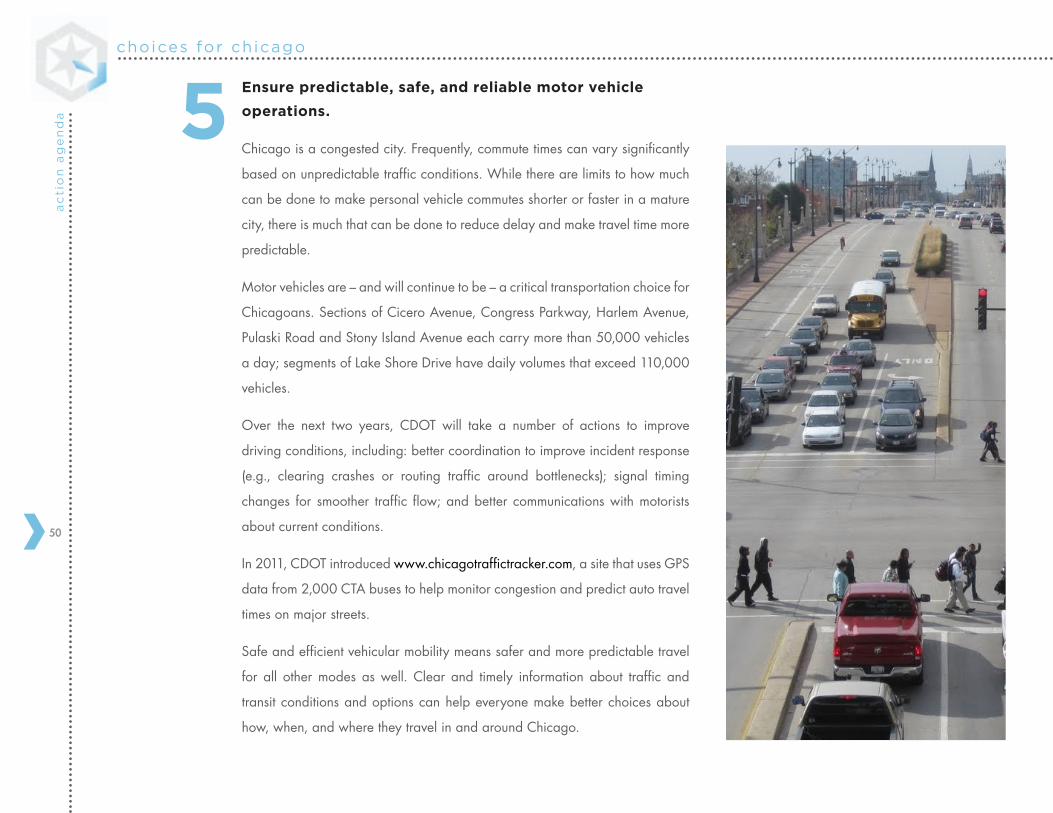
choices for chicagoa
cti
on
ag
en
da
50
5Ensure predictable, safe, and reliable motor vehicle
operations.
Chicago is a congested city. Frequently, commute times can vary significantly
based on unpredictable traffic conditions. While there are limits to how much
can be done to make personal vehicle commutes shorter or faster in a mature
city, there is much that can be done to reduce delay and make travel time more
predictable.
Motor vehicles are – and will continue to be – a critical transportation choice for
Chicagoans. Sections of Cicero Avenue, Congress Parkway, Harlem Avenue,
Pulaski Road and Stony Island Avenue each carry more than 50,000 vehicles
a day; segments of Lake Shore Drive have daily volumes that exceed 110,000
vehicles.
Over the next two years, CDOT will take a number of actions to improve
driving conditions, including: better coordination to improve incident response
(e.g., clearing crashes or routing traffic around bottlenecks); signal timing
changes for smoother traffic flow; and better communications with motorists
about current conditions.
In 2011, CDOT introduced www.chicagotraffictracker.com, a site that uses GPS
data from 2,000 CTA buses to help monitor congestion and predict auto travel
times on major streets.
Safe and efficient vehicular mobility means safer and more predictable travel
for all other modes as well. Clear and timely information about traffic and
transit conditions and options can help everyone make better choices about
how, when, and where they travel in and around Chicago.
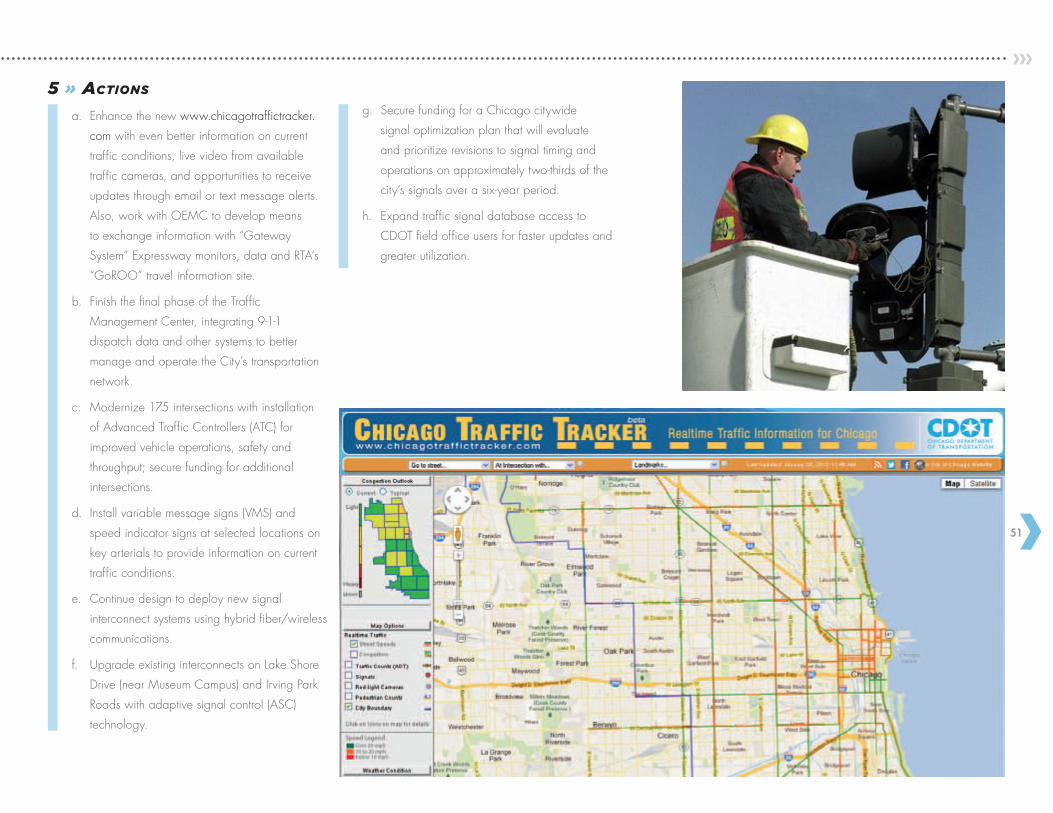
51
5 » Actions
a. Enhance the new www.chicagotraffictracker.
com with even better information on current
traffic conditions, live video from available
traffic cameras, and opportunities to receive
updates through email or text message alerts.
Also, work with OEMC to develop means
to exchange information with “Gateway
System” Expressway monitors, data and RTA’s
“GoROO” travel information site.
b. Finish the final phase of the Traffic
Management Center, integrating 9-1-1
dispatch data and other systems to better
manage and operate the City’s transportation
network.
c. Modernize 175 intersections with installation
of Advanced Traffic Controllers (ATC) for
improved vehicle operations, safety and
throughput; secure funding for additional
intersections.
d. Install variable message signs (VMS) and
speed indicator signs at selected locations on
key arterials to provide information on current
traffic conditions.
e. Continue design to deploy new signal
interconnect systems using hybrid fiber/wireless
communications.
f. Upgrade existing interconnects on Lake Shore
Drive (near Museum Campus) and Irving Park
Roads with adaptive signal control (ASC)
technology.
g. Secure funding for a Chicago citywide
signal optimization plan that will evaluate
and prioritize revisions to signal timing and
operations on approximately two-thirds of the
city’s signals over a six-year period.
h. Expand traffic signal database access to
CDOT field office users for faster updates and
greater utilization.
Serving Chicagoa ns
Serving Chicagoa ns
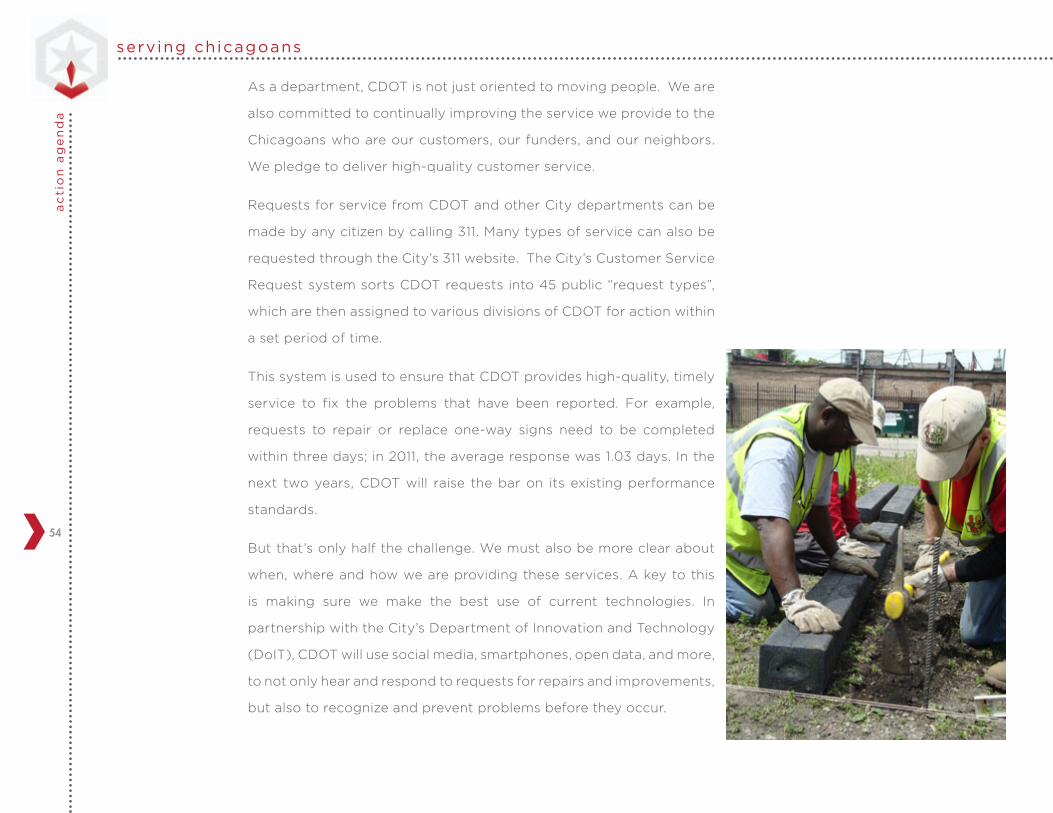
serv ing chicagoansa
cti
on
ag
en
da
54
As a department, CDOT is not just oriented to moving people. We are
also committed to continually improving the service we provide to the
Chicagoans who are our customers, our funders, and our neighbors.
We pledge to deliver high-quality customer service.
Requests for service from CDOT and other City departments can be
made by any citizen by calling 311. Many types of service can also be
requested through the City’s 311 website. The City’s Customer Service
Request system sorts CDOT requests into 45 public “request types”,
which are then assigned to various divisions of CDOT for action within
a set period of time.
This system is used to ensure that CDOT provides high-quality, timely
service to fix the problems that have been reported. For example,
requests to repair or replace one-way signs need to be completed
within three days; in 2011, the average response was 1.03 days. In the
next two years, CDOT will raise the bar on its existing performance
standards.
But that’s only half the challenge. We must also be more clear about
when, where and how we are providing these services. A key to this
is making sure we make the best use of current technologies. In
partnership with the City’s Department of Innovation and Technology
(DoIT), CDOT will use social media, smartphones, open data, and more,
to not only hear and respond to requests for repairs and improvements,
but also to recognize and prevent problems before they occur.
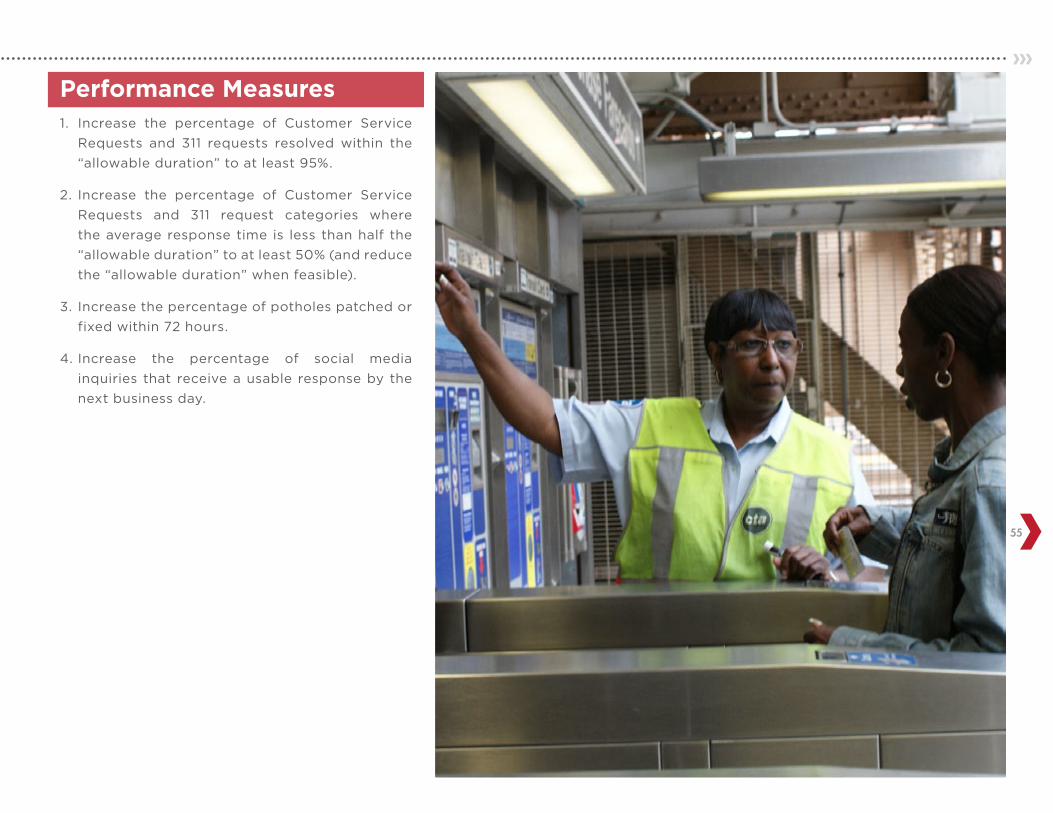
55
1. Increase the percentage of Customer Service
Requests and 311 requests resolved within the
“allowable duration” to at least 95%.
2. Increase the percentage of Customer Service
Requests and 311 request categories where
the average response time is less than half the
“allowable duration” to at least 50% (and reduce
the “allowable duration” when feasible).
3. Increase the percentage of potholes patched or
fixed within 72 hours.
4. Increase the percentage of social media
inquiries that receive a usable response by the
next business day.
Performance Measures
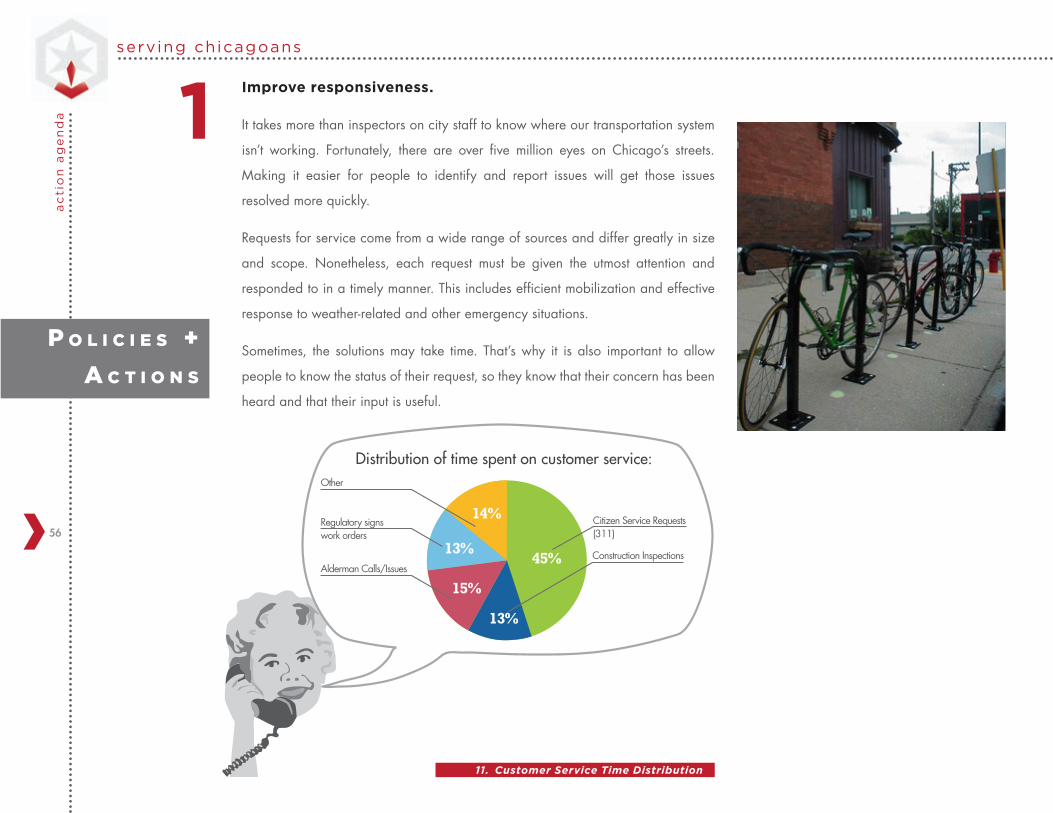
serv ing chicagoansa
cti
on
ag
en
da
56
P o l i c i e s +
A c t i o n s
14%
13%
15%
13%
45%
Citizen Service Requests (311)
Construction InspectionsAlderman Calls/Issues
Regulatory signs work orders
Other
Distribution of time spent on customer service:
11. Customer Service Time Distribution
Improve responsiveness.
It takes more than inspectors on city staff to know where our transportation system
isn’t working. Fortunately, there are over five million eyes on Chicago’s streets.
Making it easier for people to identify and report issues will get those issues
resolved more quickly.
Requests for service come from a wide range of sources and differ greatly in size
and scope. Nonetheless, each request must be given the utmost attention and
responded to in a timely manner. This includes efficient mobilization and effective
response to weather-related and other emergency situations.
Sometimes, the solutions may take time. That’s why it is also important to allow
people to know the status of their request, so they know that their concern has been
heard and that their input is useful.
1
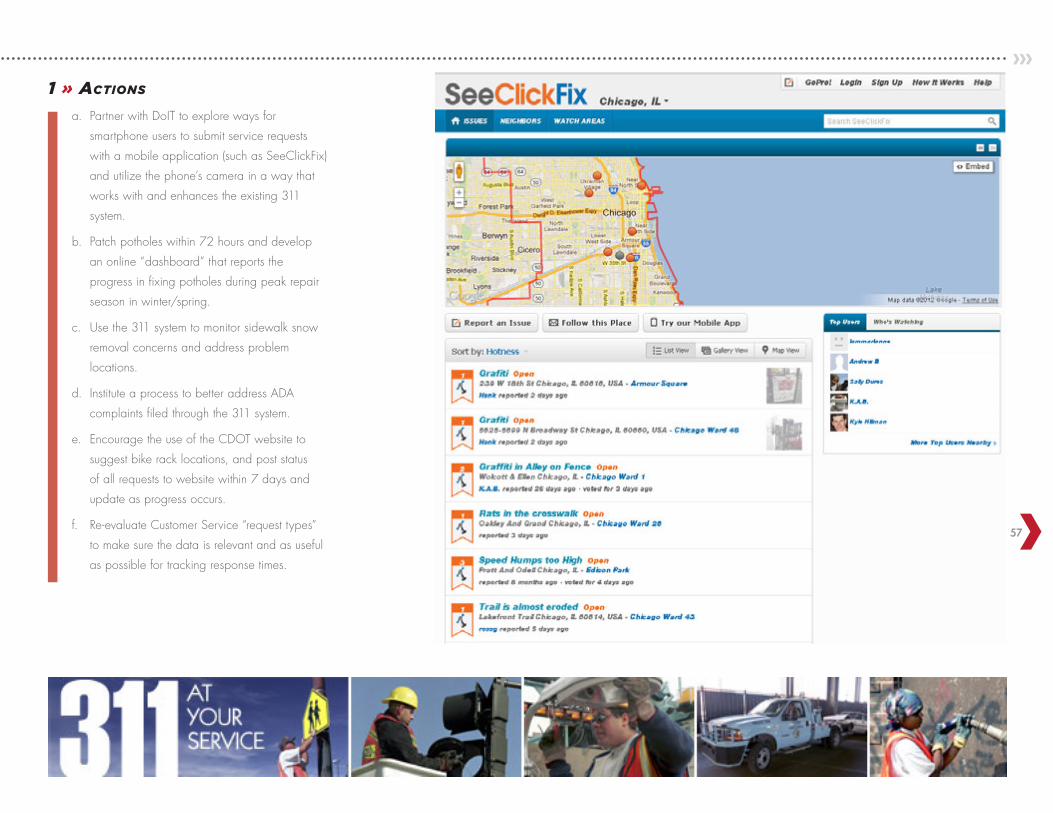
57
1 » Actions
a. Partner with DoIT to explore ways for
smartphone users to submit service requests
with a mobile application (such as SeeClickFix)
and utilize the phone’s camera in a way that
works with and enhances the existing 311
system.
b. Patch potholes within 72 hours and develop
an online “dashboard” that reports the
progress in fixing potholes during peak repair
season in winter/spring.
c. Use the 311 system to monitor sidewalk snow
removal concerns and address problem
locations.
d. Institute a process to better address ADA
complaints filed through the 311 system.
e. Encourage the use of the CDOT website to
suggest bike rack locations, and post status
of all requests to website within 7 days and
update as progress occurs.
f. Re-evaluate Customer Service “request types”
to make sure the data is relevant and as useful
as possible for tracking response times.
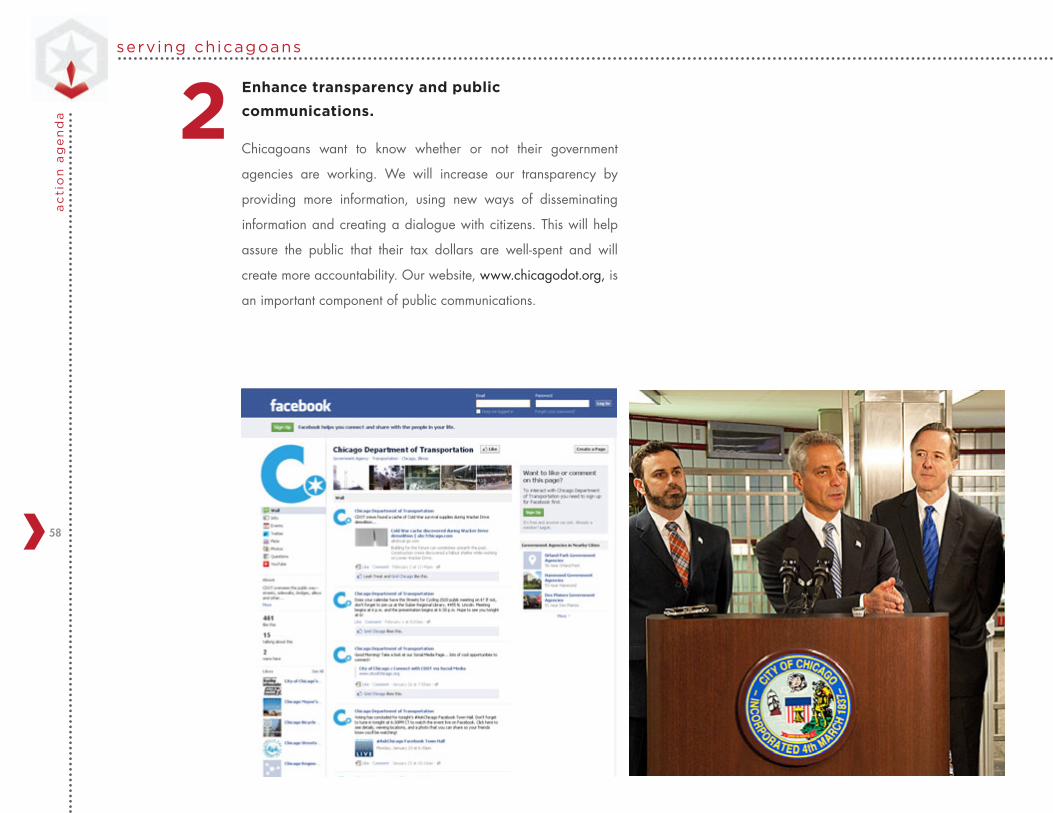
serv ing chicagoansa
cti
on
ag
en
da
58
Enhance transparency and public
communications.
Chicagoans want to know whether or not their government
agencies are working. We will increase our transparency by
providing more information, using new ways of disseminating
information and creating a dialogue with citizens. This will help
assure the public that their tax dollars are well-spent and will
create more accountability. Our website, www.chicagodot.org, is
an important component of public communications.
2
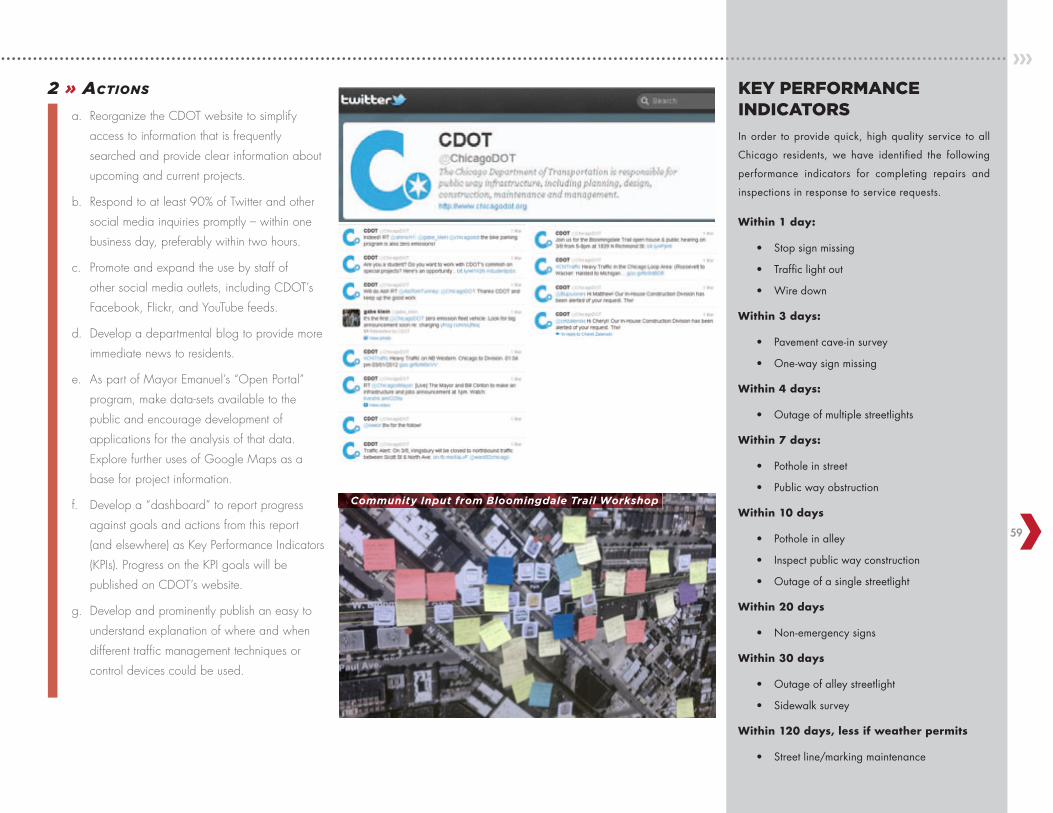
59
KEY PERFORMANCE INDICATORS
In order to provide quick, high quality service to all
Chicago residents, we have identified the following
performance indicators for completing repairs and
inspections in response to service requests.
Within1day:
• Stop sign missing
• Traffic light out
• Wire down
Within3days:
• Pavement cave-in survey
• One-way sign missing
Within4days:
• Outage of multiple streetlights
Within7days:
• Pothole in street
• Public way obstruction
Within10days
• Pothole in alley
• Inspect public way construction
• Outage of a single streetlight
Within20days
• Non-emergency signs
Within30days
• Outage of alley streetlight
• Sidewalk survey
Within120days,lessifweatherpermits
• Street line/marking maintenance
Community Input from Bloomingdale Trail Workshop
2 » Actions
a. Reorganize the CDOT website to simplify
access to information that is frequently
searched and provide clear information about
upcoming and current projects.
b. Respond to at least 90% of Twitter and other
social media inquiries promptly – within one
business day, preferably within two hours.
c. Promote and expand the use by staff of
other social media outlets, including CDOT’s
Facebook, Flickr, and YouTube feeds.
d. Develop a departmental blog to provide more
immediate news to residents.
e. As part of Mayor Emanuel’s “Open Portal”
program, make data-sets available to the
public and encourage development of
applications for the analysis of that data.
Explore further uses of Google Maps as a
base for project information.
f. Develop a “dashboard” to report progress
against goals and actions from this report
(and elsewhere) as Key Performance Indicators
(KPIs). Progress on the KPI goals will be
published on CDOT’s website.
g. Develop and prominently publish an easy to
understand explanation of where and when
different traffic management techniques or
control devices could be used.
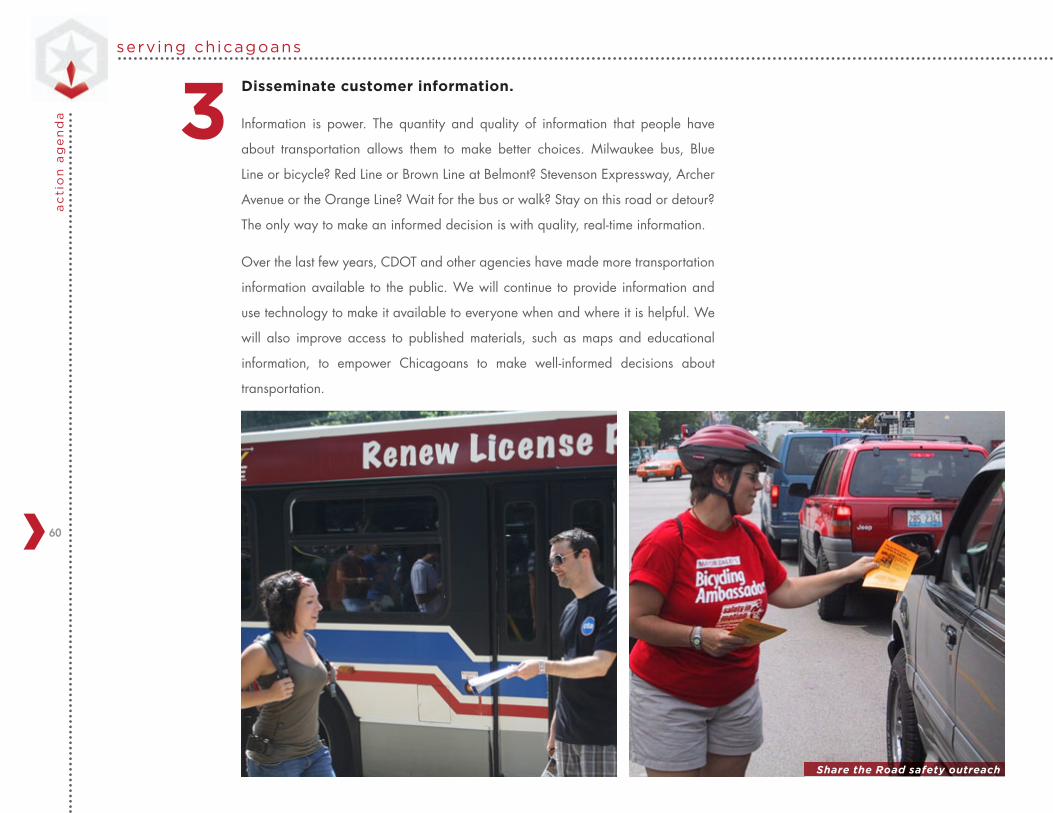
serv ing chicagoansa
cti
on
ag
en
da
60
Share the Road safety outreach
Disseminate customer information.
Information is power. The quantity and quality of information that people have
about transportation allows them to make better choices. Milwaukee bus, Blue
Line or bicycle? Red Line or Brown Line at Belmont? Stevenson Expressway, Archer
Avenue or the Orange Line? Wait for the bus or walk? Stay on this road or detour?
The only way to make an informed decision is with quality, real-time information.
Over the last few years, CDOT and other agencies have made more transportation
information available to the public. We will continue to provide information and
use technology to make it available to everyone when and where it is helpful. We
will also improve access to published materials, such as maps and educational
information, to empower Chicagoans to make well-informed decisions about
transportation.
3
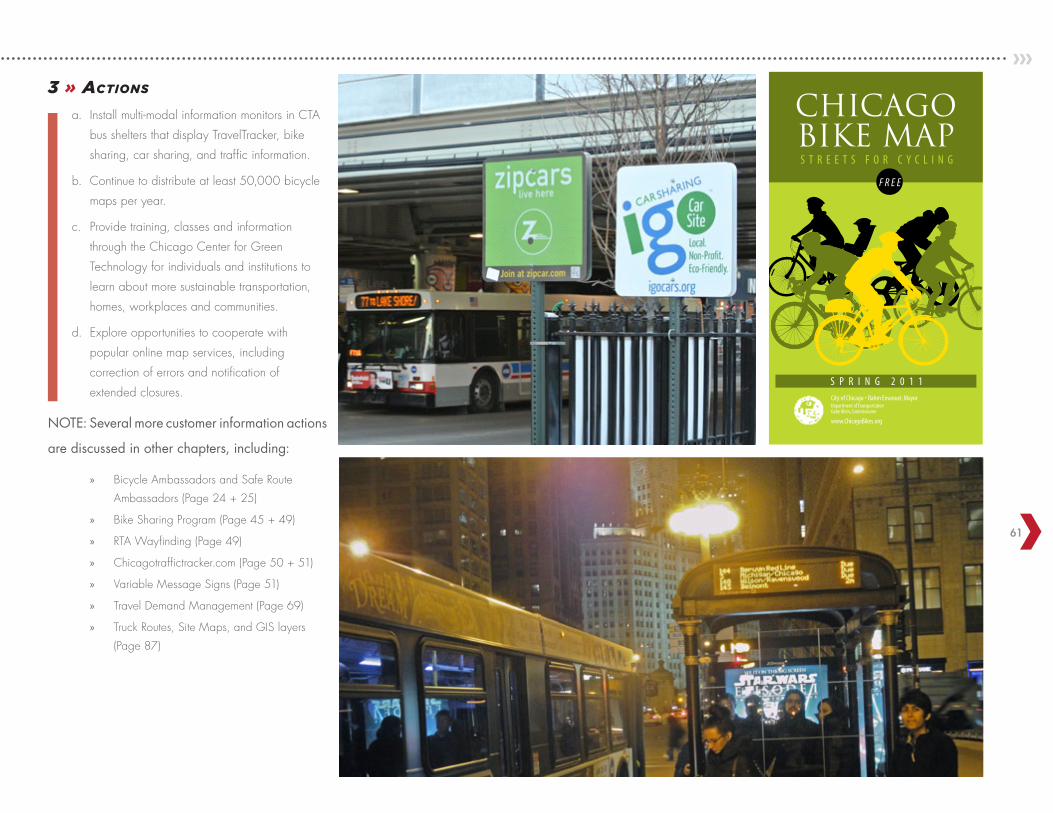
61
City of Chicago • Rahm Emanuel, MayorDepartment of TransportationGabe Klein, Commissioner
www.ChicagoBikes.org
CHICAGOBIKE MAP
S P R I N G 2 0 1 1
S T R E E T S F O R C Y C L I N G
F R E E
City of Chicago • Rahm Emanuel, MayorDepartment of TransportationGabe Klein, Commissioner
www.ChicagoBikes.org
CHICAGOBIKE MAP
S P R I N G 2 0 1 1
S T R E E T S F O R C Y C L I N G
F R E E
3 » Actions
a. Install multi-modal information monitors in CTA
bus shelters that display TravelTracker, bike
sharing, car sharing, and traffic information.
b. Continue to distribute at least 50,000 bicycle
maps per year.
c. Provide training, classes and information
through the Chicago Center for Green
Technology for individuals and institutions to
learn about more sustainable transportation,
homes, workplaces and communities.
d. Explore opportunities to cooperate with
popular online map services, including
correction of errors and notification of
extended closures.
NOTE: Several more customer information actions
are discussed in other chapters, including:
» Bicycle Ambassadors and Safe Route
Ambassadors (Page 24 + 25)
» Bike Sharing Program (Page 45 + 49)
» RTA Wayfinding (Page 49)
» Chicagotraffictracker.com (Page 50 + 51)
» Variable Message Signs (Page 51)
» Travel Demand Management (Page 69)
» Truck Routes, Site Maps, and GIS layers
(Page 87)
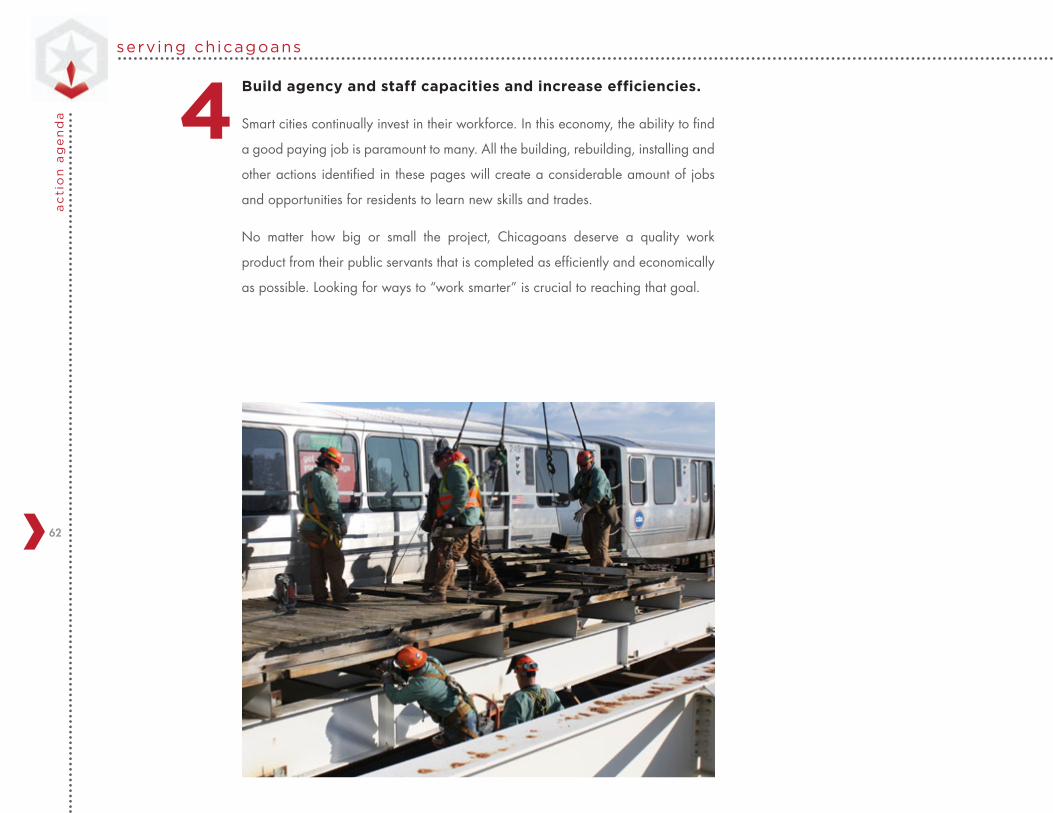
serv ing chicagoansa
cti
on
ag
en
da
62
Build agency and staff capacities and increase efficiencies.
Smart cities continually invest in their workforce. In this economy, the ability to find
a good paying job is paramount to many. All the building, rebuilding, installing and
other actions identified in these pages will create a considerable amount of jobs
and opportunities for residents to learn new skills and trades.
No matter how big or small the project, Chicagoans deserve a quality work
product from their public servants that is completed as efficiently and economically
as possible. Looking for ways to “work smarter” is crucial to reaching that goal.
4
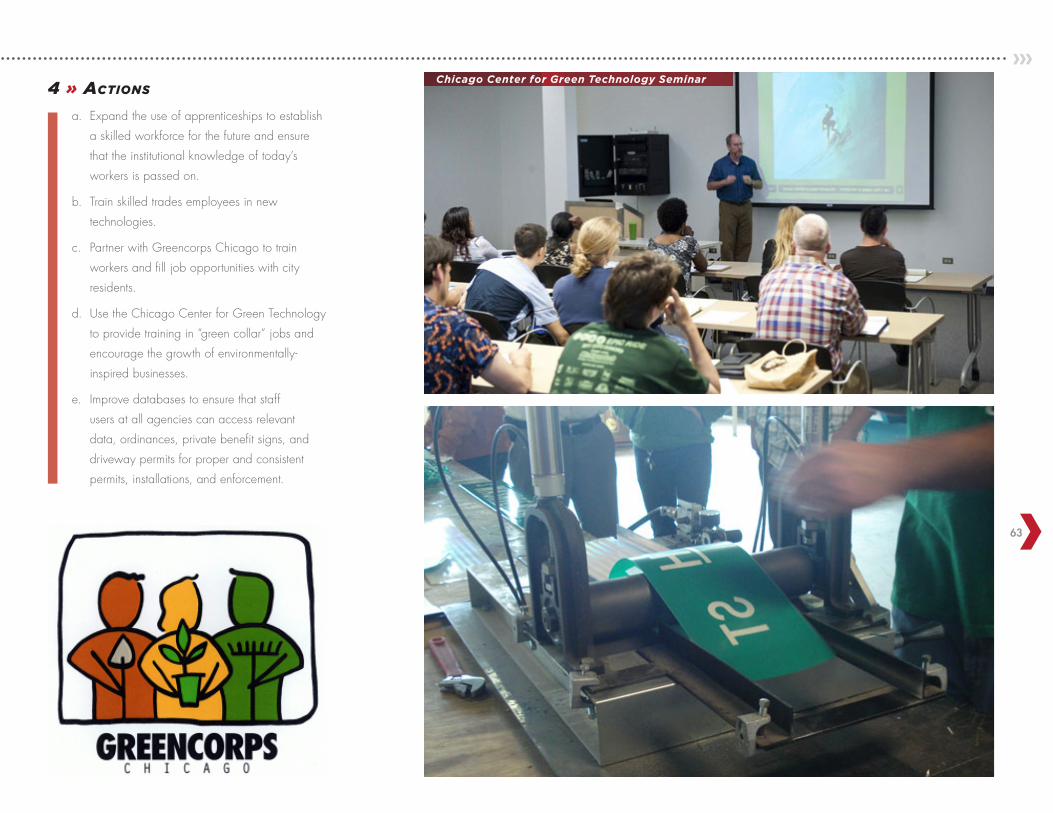
63
Chicago Center for Green Technology Seminar4 » Actions
a. Expand the use of apprenticeships to establish
a skilled workforce for the future and ensure
that the institutional knowledge of today’s
workers is passed on.
b. Train skilled trades employees in new
technologies.
c. Partner with Greencorps Chicago to train
workers and fill job opportunities with city
residents.
d. Use the Chicago Center for Green Technology
to provide training in “green collar” jobs and
encourage the growth of environmentally-
inspired businesses.
e. Improve databases to ensure that staff
users at all agencies can access relevant
data, ordinances, private benefit signs, and
driveway permits for proper and consistent
permits, installations, and enforcement.
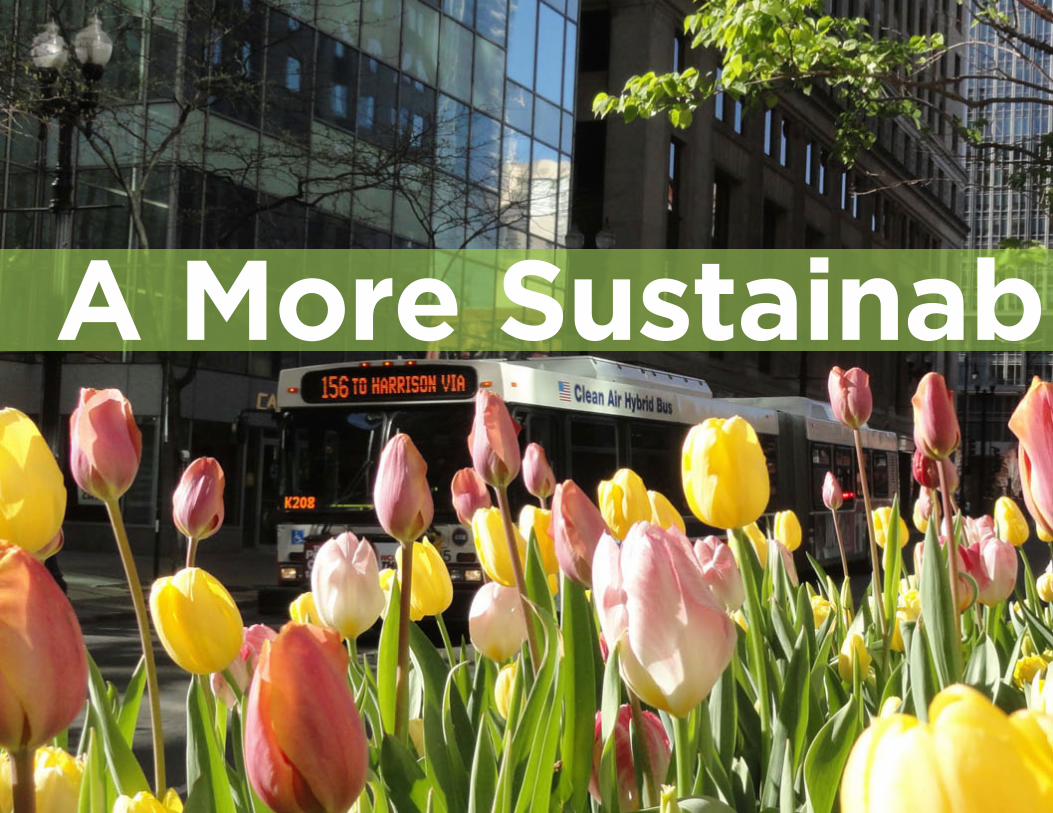
A More Sustainab le City
LASALLE STREET MEDIAN IN APRIL
A More Sustainab le City
LASALLE STREET MEDIAN IN APRIL
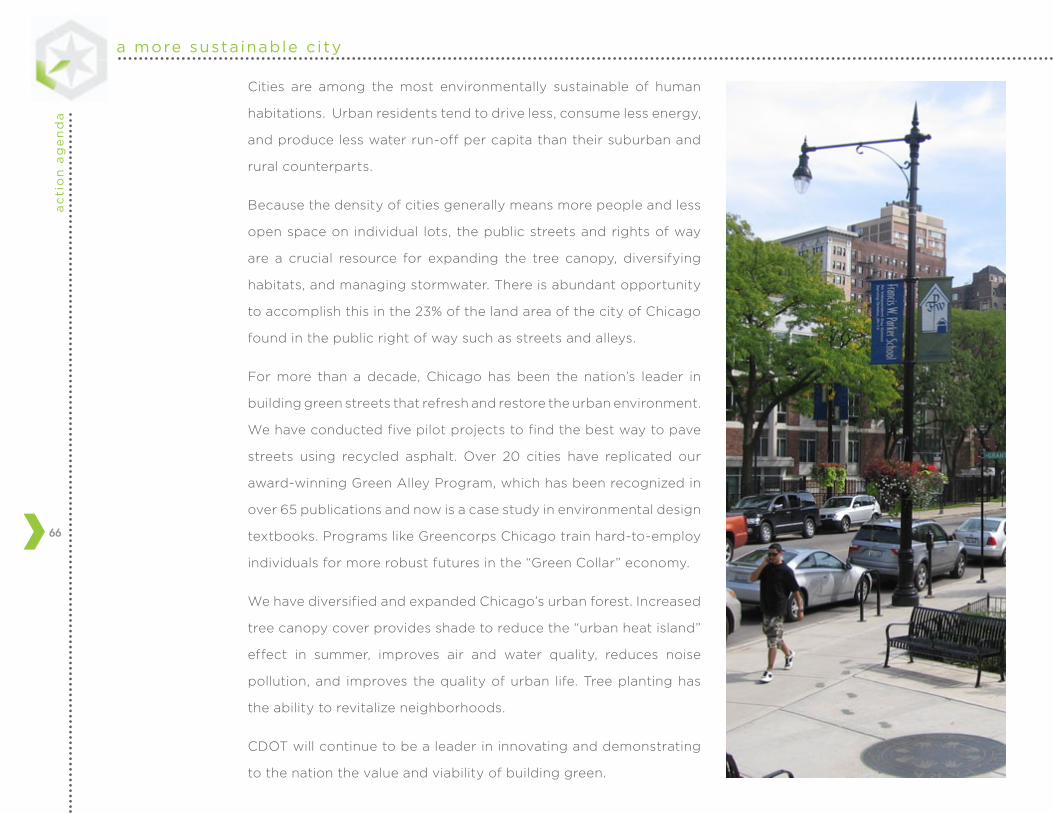
a more susta inable c i tya
cti
on
ag
en
da
66
Cities are among the most environmentally sustainable of human
habitations. Urban residents tend to drive less, consume less energy,
and produce less water run-off per capita than their suburban and
rural counterparts.
Because the density of cities generally means more people and less
open space on individual lots, the public streets and rights of way
are a crucial resource for expanding the tree canopy, diversifying
habitats, and managing stormwater. There is abundant opportunity
to accomplish this in the 23% of the land area of the city of Chicago
found in the public right of way such as streets and alleys.
For more than a decade, Chicago has been the nation’s leader in
building green streets that refresh and restore the urban environment.
We have conducted five pilot projects to find the best way to pave
streets using recycled asphalt. Over 20 cities have replicated our
award-winning Green Alley Program, which has been recognized in
over 65 publications and now is a case study in environmental design
textbooks. Programs like Greencorps Chicago train hard-to-employ
individuals for more robust futures in the “Green Collar” economy.
We have diversified and expanded Chicago’s urban forest. Increased
tree canopy cover provides shade to reduce the “urban heat island”
effect in summer, improves air and water quality, reduces noise
pollution, and improves the quality of urban life. Tree planting has
the ability to revitalize neighborhoods.
CDOT will continue to be a leader in innovating and demonstrating
to the nation the value and viability of building green.
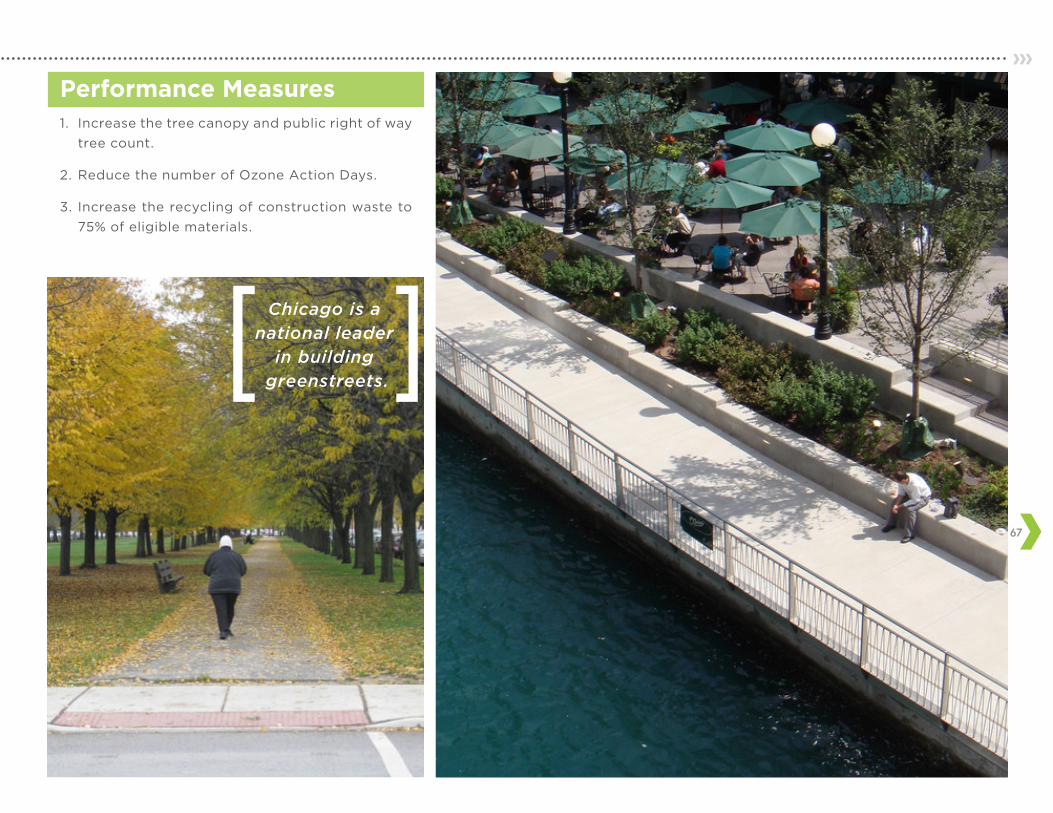
67
Chicago is a national leader
in building greenstreets.
[[
1. Increase the tree canopy and public right of way
tree count.
2. Reduce the number of Ozone Action Days.
3. Increase the recycling of construction waste to
75% of eligible materials.
Performance Measures
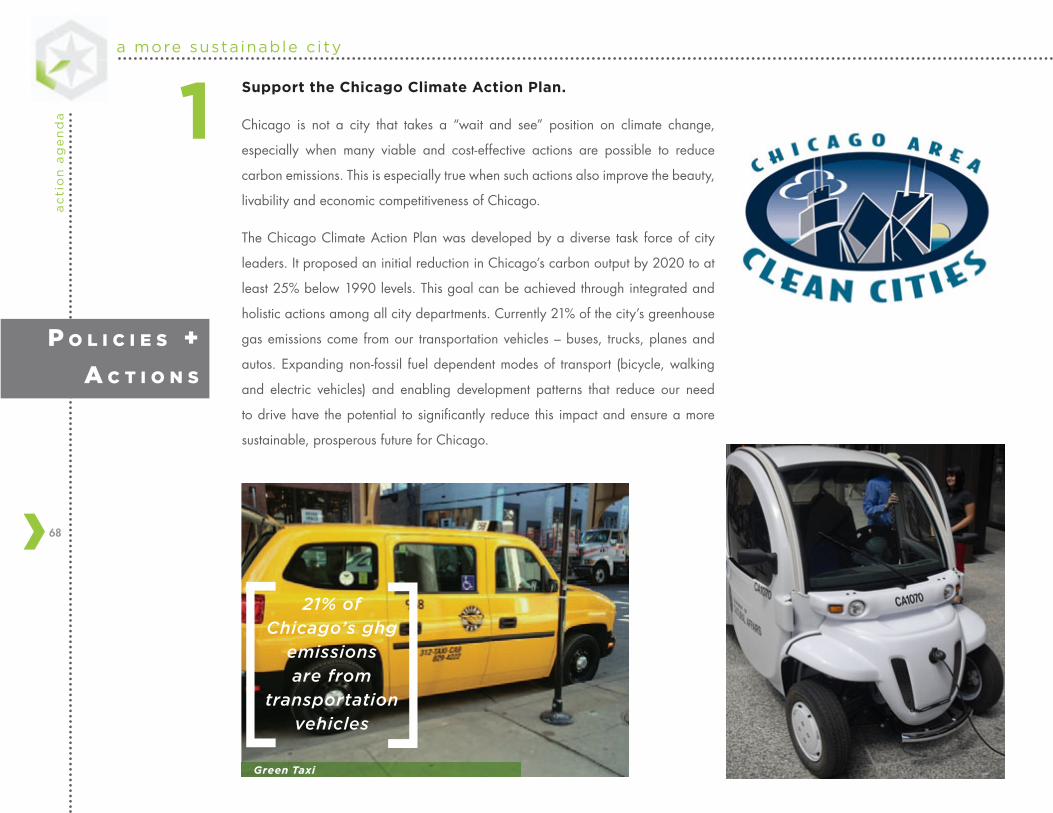
a more susta inable c i tya
cti
on
ag
en
da
68
Green Taxi
Support the Chicago Climate Action Plan.
Chicago is not a city that takes a “wait and see” position on climate change,
especially when many viable and cost-effective actions are possible to reduce
carbon emissions. This is especially true when such actions also improve the beauty,
livability and economic competitiveness of Chicago.
The Chicago Climate Action Plan was developed by a diverse task force of city
leaders. It proposed an initial reduction in Chicago’s carbon output by 2020 to at
least 25% below 1990 levels. This goal can be achieved through integrated and
holistic actions among all city departments. Currently 21% of the city’s greenhouse
gas emissions come from our transportation vehicles – buses, trucks, planes and
autos. Expanding non-fossil fuel dependent modes of transport (bicycle, walking
and electric vehicles) and enabling development patterns that reduce our need
to drive have the potential to significantly reduce this impact and ensure a more
sustainable, prosperous future for Chicago.
21% of Chicago’s ghg
emissions are from
transportation vehicles
[[
1
P o l i c i e s +
A c t i o n s
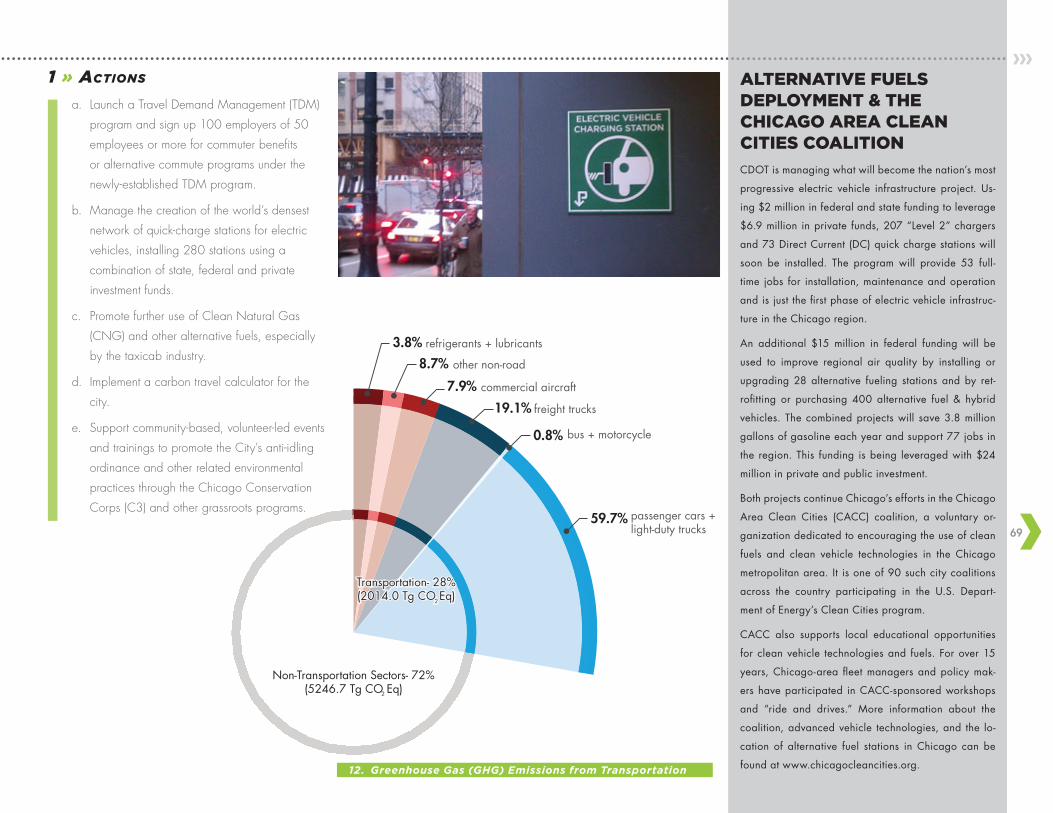
69
Non-Transportation Sectors- 72%(5246.7 Tg CO Eq)2
Transportation- 28%(2014.0 Tg CO Eq)2
refrigerants + lubricants
other non-road
commercial aircraft
freight trucks
bus + motorcycle
59.7%
19.1%
7.9%
8.7%
3.8%
0.8%
passenger cars + light-duty trucks
ALTERNATIVE FUELS DEPLOYMENT & THE CHICAGO AREA CLEAN CITIES COALITION
CDOT is managing what will become the nation’s most
progressive electric vehicle infrastructure project. Us-
ing $2 million in federal and state funding to leverage
$6.9 million in private funds, 207 “Level 2” chargers
and 73 Direct Current (DC) quick charge stations will
soon be installed. The program will provide 53 full-
time jobs for installation, maintenance and operation
and is just the first phase of electric vehicle infrastruc-
ture in the Chicago region.
An additional $15 million in federal funding will be
used to improve regional air quality by installing or
upgrading 28 alternative fueling stations and by ret-
rofitting or purchasing 400 alternative fuel & hybrid
vehicles. The combined projects will save 3.8 million
gallons of gasoline each year and support 77 jobs in
the region. This funding is being leveraged with $24
million in private and public investment.
Both projects continue Chicago’s efforts in the Chicago
Area Clean Cities (CACC) coalition, a voluntary or-
ganization dedicated to encouraging the use of clean
fuels and clean vehicle technologies in the Chicago
metropolitan area. It is one of 90 such city coalitions
across the country participating in the U.S. Depart-
ment of Energy’s Clean Cities program.
CACC also supports local educational opportunities
for clean vehicle technologies and fuels. For over 15
years, Chicago-area fleet managers and policy mak-
ers have participated in CACC-sponsored workshops
and “ride and drives.” More information about the
coalition, advanced vehicle technologies, and the lo-
cation of alternative fuel stations in Chicago can be
found at www.chicagocleancities.org.12. Greenhouse Gas (GHG) Emissions from Transportation
1 » Actions
a. Launch a Travel Demand Management (TDM)
program and sign up 100 employers of 50
employees or more for commuter benefits
or alternative commute programs under the
newly-established TDM program.
b. Manage the creation of the world’s densest
network of quick-charge stations for electric
vehicles, installing 280 stations using a
combination of state, federal and private
investment funds.
c. Promote further use of Clean Natural Gas
(CNG) and other alternative fuels, especially
by the taxicab industry.
d. Implement a carbon travel calculator for the
city.
e. Support community-based, volunteer-led events
and trainings to promote the City’s anti-idling
ordinance and other related environmental
practices through the Chicago Conservation
Corps (C3) and other grassroots programs.
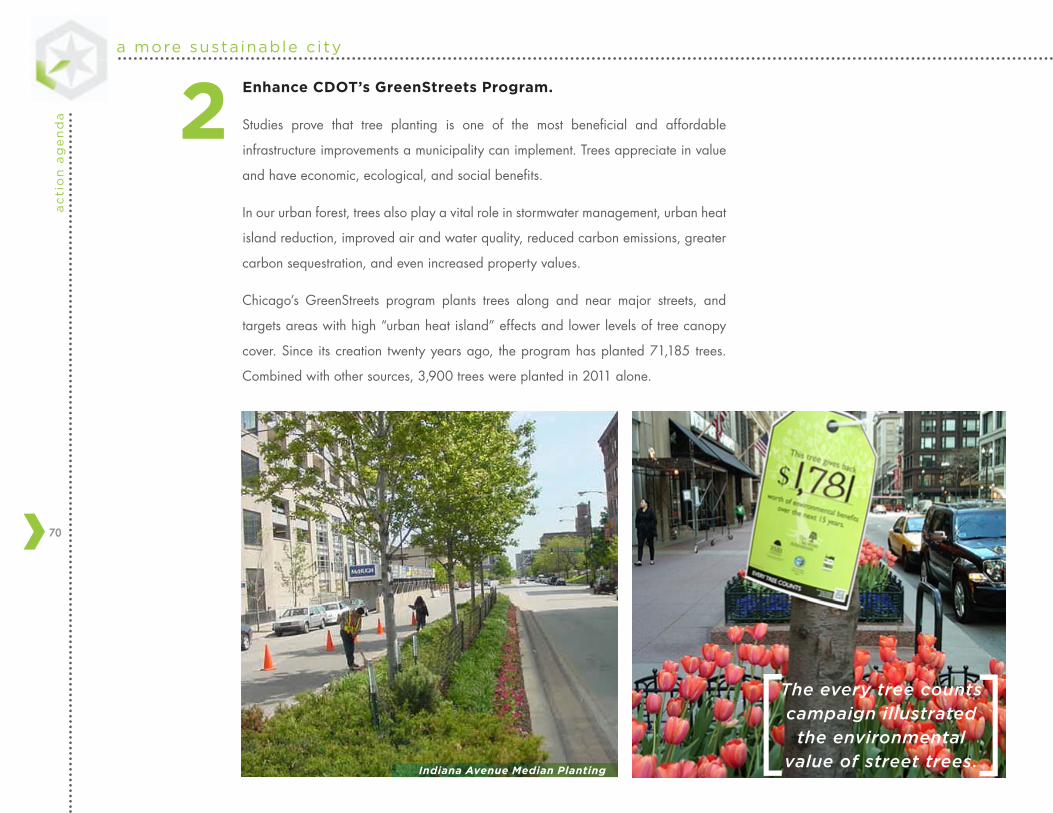
a more susta inable c i tya
cti
on
ag
en
da
70
Indiana Avenue Median Planting
Enhance CDOT’s GreenStreets Program.
Studies prove that tree planting is one of the most beneficial and affordable
infrastructure improvements a municipality can implement. Trees appreciate in value
and have economic, ecological, and social benefits.
In our urban forest, trees also play a vital role in stormwater management, urban heat
island reduction, improved air and water quality, reduced carbon emissions, greater
carbon sequestration, and even increased property values.
Chicago’s GreenStreets program plants trees along and near major streets, and
targets areas with high “urban heat island” effects and lower levels of tree canopy
cover. Since its creation twenty years ago, the program has planted 71,185 trees.
Combined with other sources, 3,900 trees were planted in 2011 alone.
2
The every tree counts campaign illustrated
the environmental value of street trees.
[[
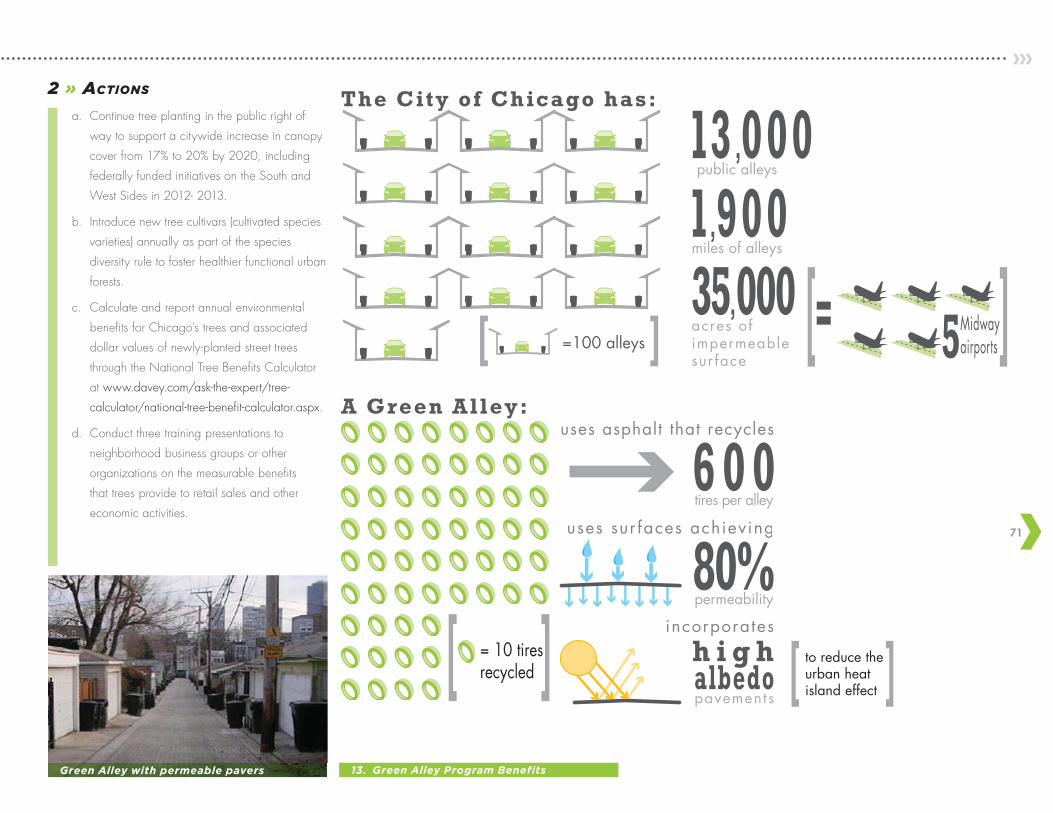
71
The City of Chicago has:
[ ] =100 alleys
public alleys13 ,000miles of alleys1,900acres of impermeable sur face
35,000 [ ] =
[ ] = 10 tires recycled
A Green Alley:
[ ] to reduce the urban heat island effect
uses asphalt that recycles
uses sur faces achievinguses sur faces achievinguses sur faces achieving
incorporates
tires per alley6 0 0
permeability80%
pavements
h i g h albedo
Green Alley with permeable pavers 13. Green Alley Program Benefits
2 » Actions
a. Continue tree planting in the public right of
way to support a citywide increase in canopy
cover from 17% to 20% by 2020, including
federally funded initiatives on the South and
West Sides in 2012- 2013.
b. Introduce new tree cultivars (cultivated species
varieties) annually as part of the species
diversity rule to foster healthier functional urban
forests.
c. Calculate and report annual environmental
benefits for Chicago’s trees and associated
dollar values of newly-planted street trees
through the National Tree Benefits Calculator
at www.davey.com/ask-the-expert/tree-
calculator/national-tree-benefit-calculator.aspx.
d. Conduct three training presentations to
neighborhood business groups or other
organizations on the measurable benefits
that trees provide to retail sales and other
economic activities.
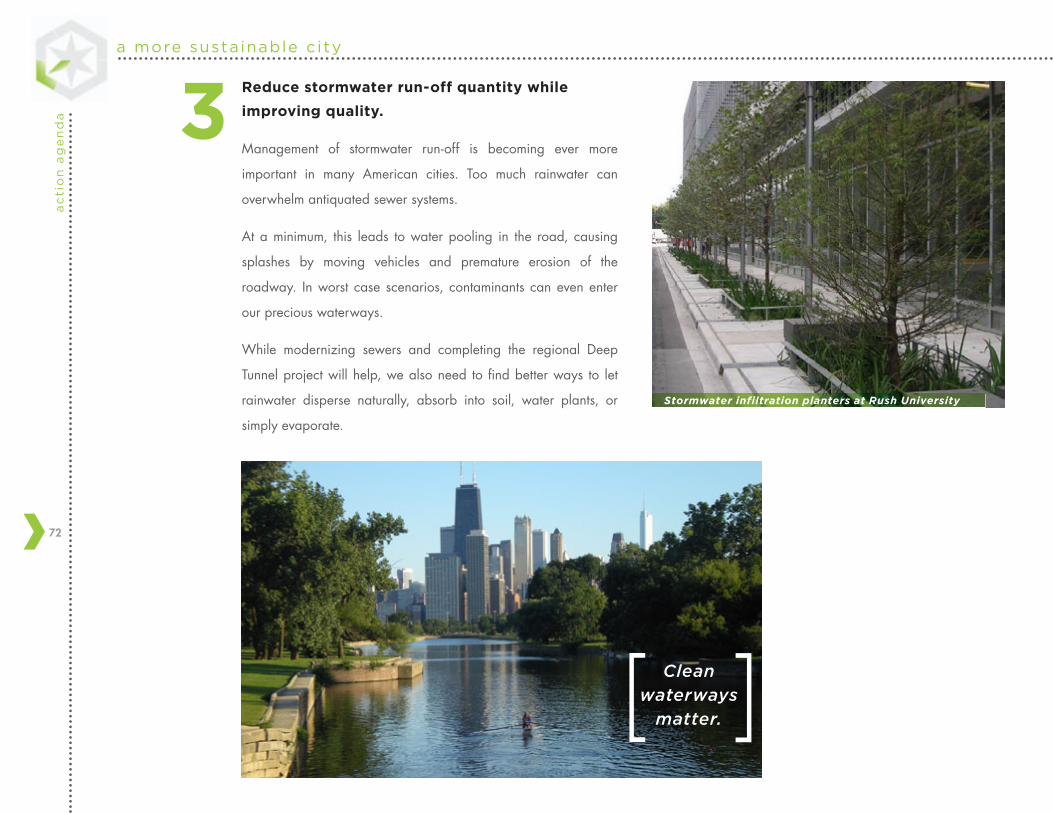
a more susta inable c i tya
cti
on
ag
en
da
72
Clean waterways
matter.[ [
Stormwater infiltration planters at Rush University
Reduce stormwater run-off quantity while
improving quality.
Management of stormwater run-off is becoming ever more
important in many American cities. Too much rainwater can
overwhelm antiquated sewer systems.
At a minimum, this leads to water pooling in the road, causing
splashes by moving vehicles and premature erosion of the
roadway. In worst case scenarios, contaminants can even enter
our precious waterways.
While modernizing sewers and completing the regional Deep
Tunnel project will help, we also need to find better ways to let
rainwater disperse naturally, absorb into soil, water plants, or
simply evaporate.
3
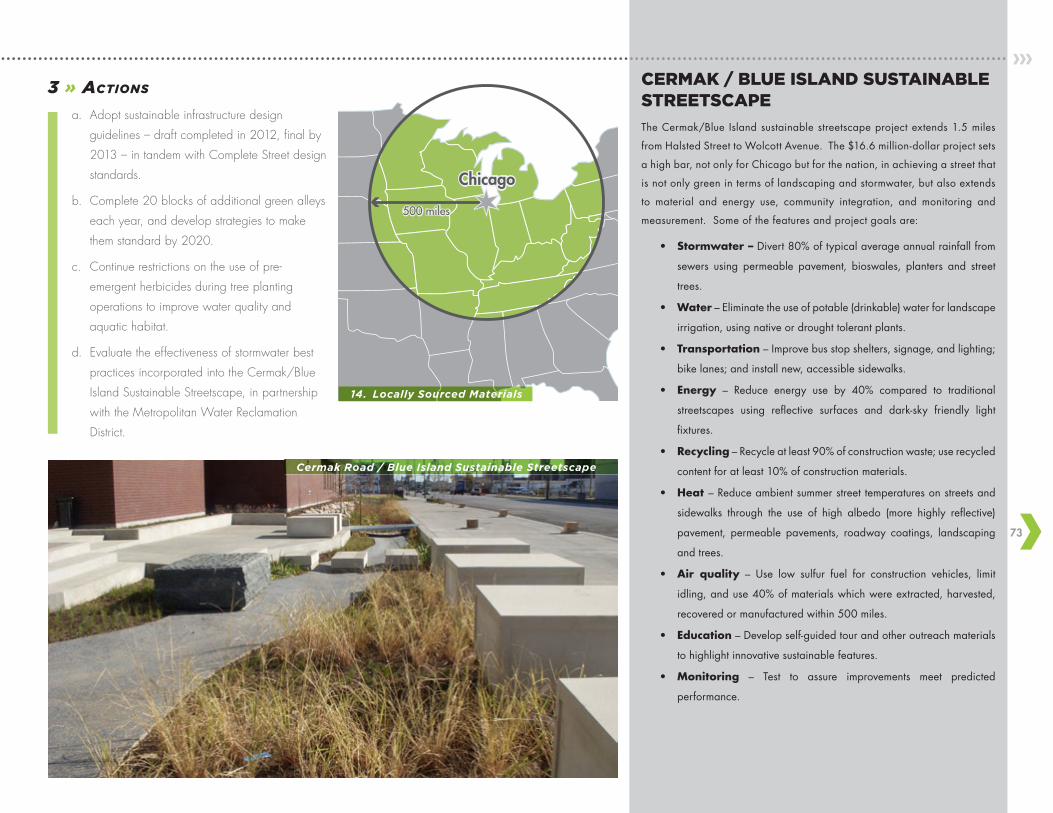
73
500 miles
Chicago
CERMAK / BLUE ISLAND SUSTAINABLE STREETSCAPE
The Cermak/Blue Island sustainable streetscape project extends 1.5 miles
from Halsted Street to Wolcott Avenue. The $16.6 million-dollar project sets
a high bar, not only for Chicago but for the nation, in achieving a street that
is not only green in terms of landscaping and stormwater, but also extends
to material and energy use, community integration, and monitoring and
measurement. Some of the features and project goals are:
• Stormwater– Divert 80% of typical average annual rainfall from
sewers using permeable pavement, bioswales, planters and street
trees.
• Water – Eliminate the use of potable (drinkable) water for landscape
irrigation, using native or drought tolerant plants.
• Transportation – Improve bus stop shelters, signage, and lighting;
bike lanes; and install new, accessible sidewalks.
• Energy – Reduce energy use by 40% compared to traditional
streetscapes using reflective surfaces and dark-sky friendly light
fixtures.
• Recycling – Recycle at least 90% of construction waste; use recycled
content for at least 10% of construction materials.
• Heat– Reduce ambient summer street temperatures on streets and
sidewalks through the use of high albedo (more highly reflective)
pavement, permeable pavements, roadway coatings, landscaping
and trees.
• Air quality – Use low sulfur fuel for construction vehicles, limit
idling, and use 40% of materials which were extracted, harvested,
recovered or manufactured within 500 miles.
• Education – Develop self-guided tour and other outreach materials
to highlight innovative sustainable features.
• Monitoring – Test to assure improvements meet predicted
performance.
Cermak Road / Blue Island Sustainable Streetscape
3 » Actions
a. Adopt sustainable infrastructure design
guidelines – draft completed in 2012, final by
2013 – in tandem with Complete Street design
standards.
b. Complete 20 blocks of additional green alleys
each year, and develop strategies to make
them standard by 2020.
c. Continue restrictions on the use of pre-
emergent herbicides during tree planting
operations to improve water quality and
aquatic habitat.
d. Evaluate the effectiveness of stormwater best
practices incorporated into the Cermak/Blue
Island Sustainable Streetscape, in partnership
with the Metropolitan Water Reclamation
District.
14. Locally Sourced Materials
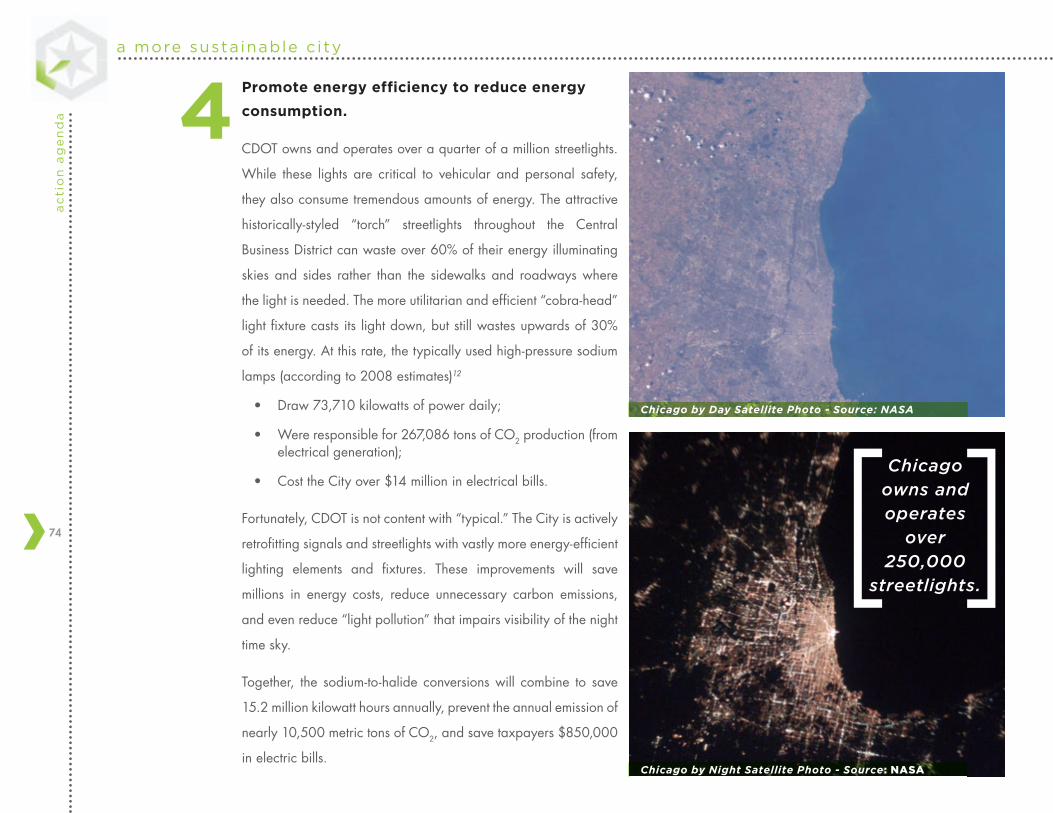
a more susta inable c i tya
cti
on
ag
en
da
74
Chicago by Day Satellite Photo - Source: NASA
Chicago by Night Satellite Photo - Source: NASA
Promote energy efficiency to reduce energy
consumption.
CDOT owns and operates over a quarter of a million streetlights.
While these lights are critical to vehicular and personal safety,
they also consume tremendous amounts of energy. The attractive
historically-styled “torch” streetlights throughout the Central
Business District can waste over 60% of their energy illuminating
skies and sides rather than the sidewalks and roadways where
the light is needed. The more utilitarian and efficient “cobra-head”
light fixture casts its light down, but still wastes upwards of 30%
of its energy. At this rate, the typically used high-pressure sodium
lamps (according to 2008 estimates)12
• Draw 73,710 kilowatts of power daily;
• Were responsible for 267,086 tons of CO2 production (from electrical generation);
• Cost the City over $14 million in electrical bills.
Fortunately, CDOT is not content with “typical.” The City is actively
retrofitting signals and streetlights with vastly more energy-efficient
lighting elements and fixtures. These improvements will save
millions in energy costs, reduce unnecessary carbon emissions,
and even reduce “light pollution” that impairs visibility of the night
time sky.
Together, the sodium-to-halide conversions will combine to save
15.2 million kilowatt hours annually, prevent the annual emission of
nearly 10,500 metric tons of CO2, and save taxpayers $850,000
in electric bills.
Chicago owns and operates
over 250,000
streetlights.
[[
4
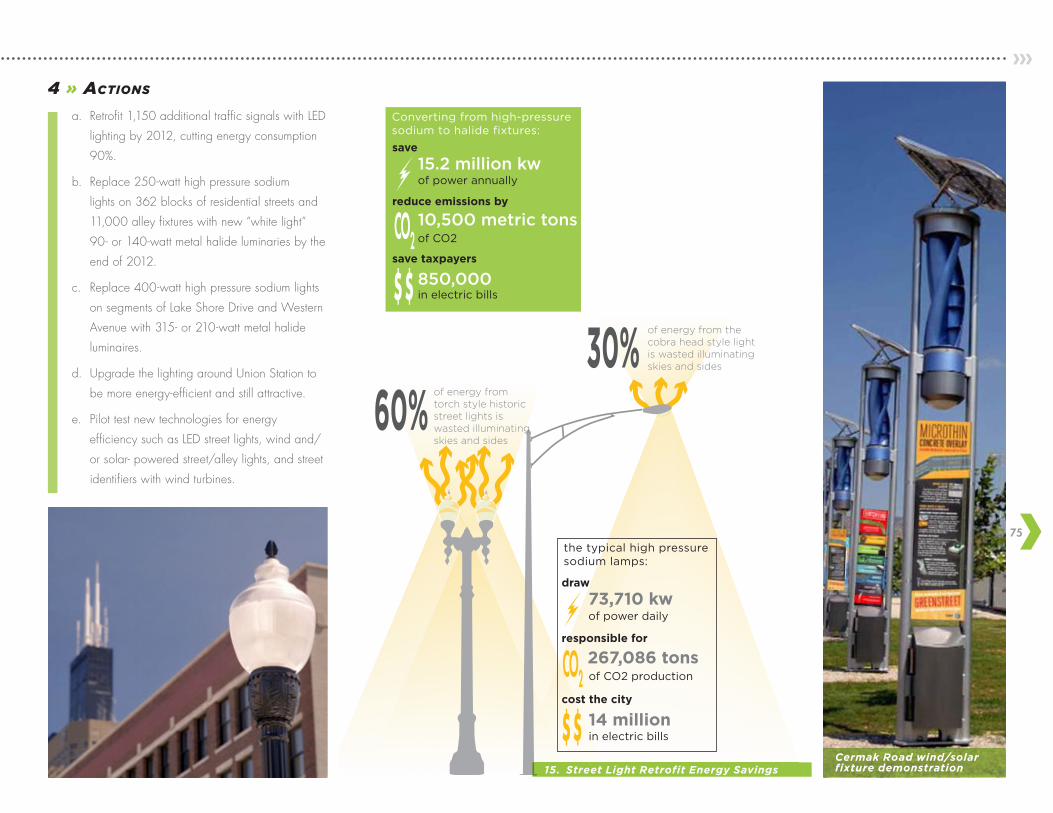
75
60%of energy from torch style historic street lights is wasted illuminating skies and sides
the typical high pressure sodium lamps:
of power daily
of power annually
30%of energy from the cobra head style light is wasted illuminating skies and sides
73,710 kw
15.2 million kw
10,500 metric tons
850,000
of CO2 production
of CO2
267,086 tons
in electric bills
in electric bills
14 million$ $
CO2
$ $
CO2
Converting from high-pressure sodium to halide fixtures:
save
reduce emissions by
save taxpayers
draw
responsible for
cost the city
15. Street Light Retrofit Energy Savings Cermak Road wind/solar fixture demonstration
4 » Actions
a. Retrofit 1,150 additional traffic signals with LED
lighting by 2012, cutting energy consumption
90%.
b. Replace 250-watt high pressure sodium
lights on 362 blocks of residential streets and
11,000 alley fixtures with new “white light”
90- or 140-watt metal halide luminaries by the
end of 2012.
c. Replace 400-watt high pressure sodium lights
on segments of Lake Shore Drive and Western
Avenue with 315- or 210-watt metal halide
luminaires.
d. Upgrade the lighting around Union Station to
be more energy-efficient and still attractive.
e. Pilot test new technologies for energy
efficiency such as LED street lights, wind and/
or solar- powered street/alley lights, and street
identifiers with wind turbines.
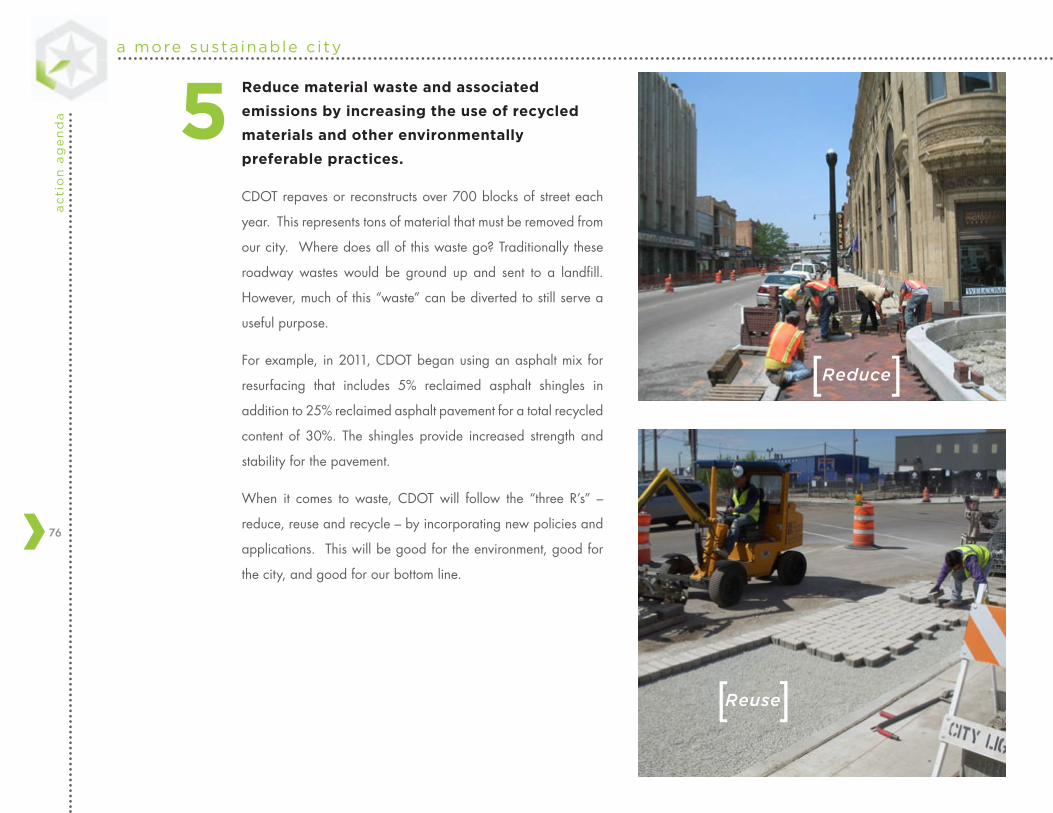
a more susta inable c i tya
cti
on
ag
en
da
76
Reduce material waste and associated
emissions by increasing the use of recycled
materials and other environmentally
preferable practices.
CDOT repaves or reconstructs over 700 blocks of street each
year. This represents tons of material that must be removed from
our city. Where does all of this waste go? Traditionally these
roadway wastes would be ground up and sent to a landfill.
However, much of this “waste” can be diverted to still serve a
useful purpose.
For example, in 2011, CDOT began using an asphalt mix for
resurfacing that includes 5% reclaimed asphalt shingles in
addition to 25% reclaimed asphalt pavement for a total recycled
content of 30%. The shingles provide increased strength and
stability for the pavement.
When it comes to waste, CDOT will follow the “three R’s” –
reduce, reuse and recycle – by incorporating new policies and
applications. This will be good for the environment, good for
the city, and good for our bottom line.
5
Reuse
Reduce
[
[
[
[
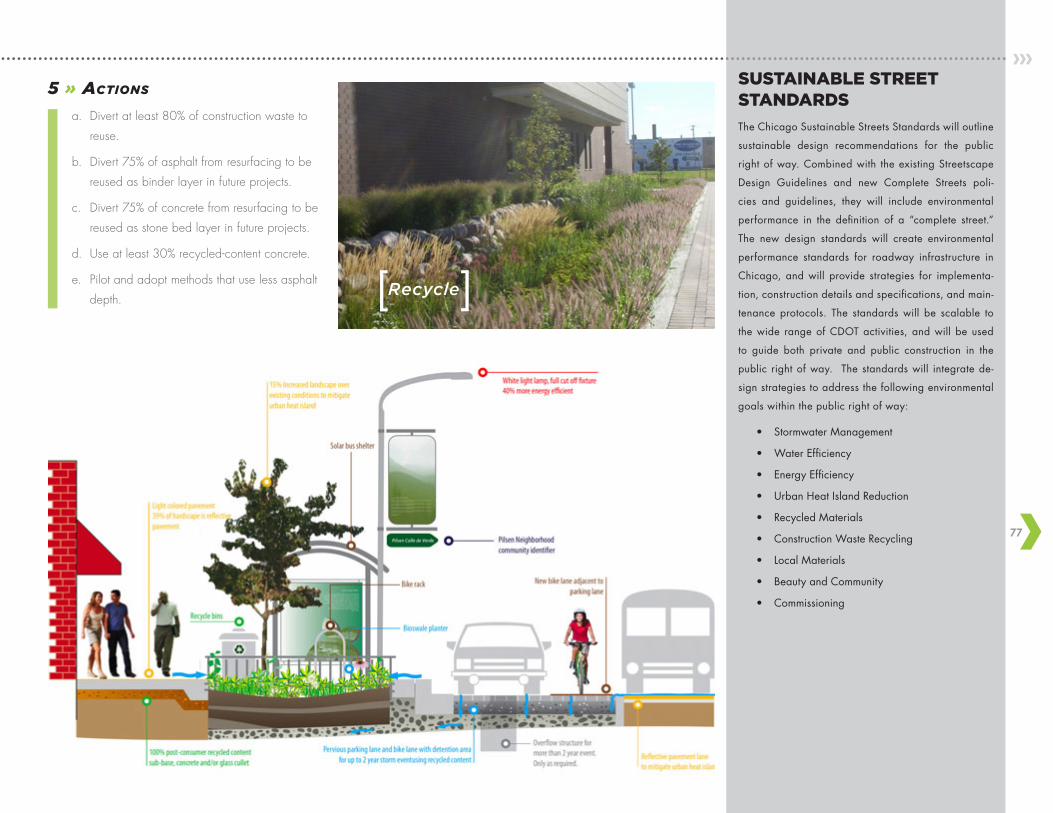
77
SUSTAINABLE STREET STANDARDS
The Chicago Sustainable Streets Standards will outline
sustainable design recommendations for the public
right of way. Combined with the existing Streetscape
Design Guidelines and new Complete Streets poli-
cies and guidelines, they will include environmental
performance in the definition of a “complete street.”
The new design standards will create environmental
performance standards for roadway infrastructure in
Chicago, and will provide strategies for implementa-
tion, construction details and specifications, and main-
tenance protocols. The standards will be scalable to
the wide range of CDOT activities, and will be used
to guide both private and public construction in the
public right of way. The standards will integrate de-
sign strategies to address the following environmental
goals within the public right of way:
• Stormwater Management
• Water Efficiency
• Energy Efficiency
• Urban Heat Island Reduction
• Recycled Materials
• Construction Waste Recycling
• Local Materials
• Beauty and Community
• Commissioning
Recycle
[[
5 » Actions
a. Divert at least 80% of construction waste to
reuse.
b. Divert 75% of asphalt from resurfacing to be
reused as binder layer in future projects.
c. Divert 75% of concrete from resurfacing to be
reused as stone bed layer in future projects.
d. Use at least 30% recycled-content concrete.
e. Pilot and adopt methods that use less asphalt
depth.
Fuel our Economy
Fuel our Economy
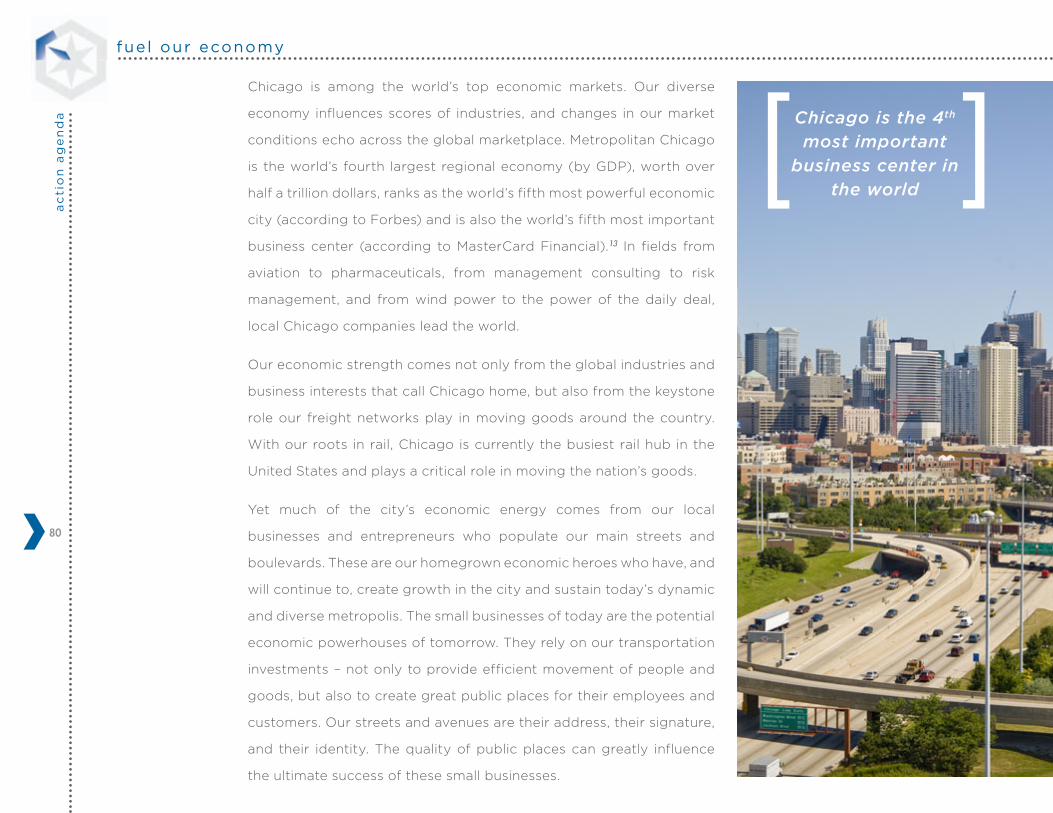
fuel our economya
cti
on
ag
en
da
80
Chicago is among the world’s top economic markets. Our diverse
economy influences scores of industries, and changes in our market
conditions echo across the global marketplace. Metropolitan Chicago
is the world’s fourth largest regional economy (by GDP), worth over
half a trillion dollars, ranks as the world’s fifth most powerful economic
city (according to Forbes) and is also the world’s fifth most important
business center (according to MasterCard Financial).13 In fields from
aviation to pharmaceuticals, from management consulting to risk
management, and from wind power to the power of the daily deal,
local Chicago companies lead the world.
Our economic strength comes not only from the global industries and
business interests that call Chicago home, but also from the keystone
role our freight networks play in moving goods around the country.
With our roots in rail, Chicago is currently the busiest rail hub in the
United States and plays a critical role in moving the nation’s goods.
Yet much of the city’s economic energy comes from our local
businesses and entrepreneurs who populate our main streets and
boulevards. These are our homegrown economic heroes who have, and
will continue to, create growth in the city and sustain today’s dynamic
and diverse metropolis. The small businesses of today are the potential
economic powerhouses of tomorrow. They rely on our transportation
investments – not only to provide efficient movement of people and
goods, but also to create great public places for their employees and
customers. Our streets and avenues are their address, their signature,
and their identity. The quality of public places can greatly influence
the ultimate success of these small businesses.
Chicago is the 4th most important
business center in the world
[ [
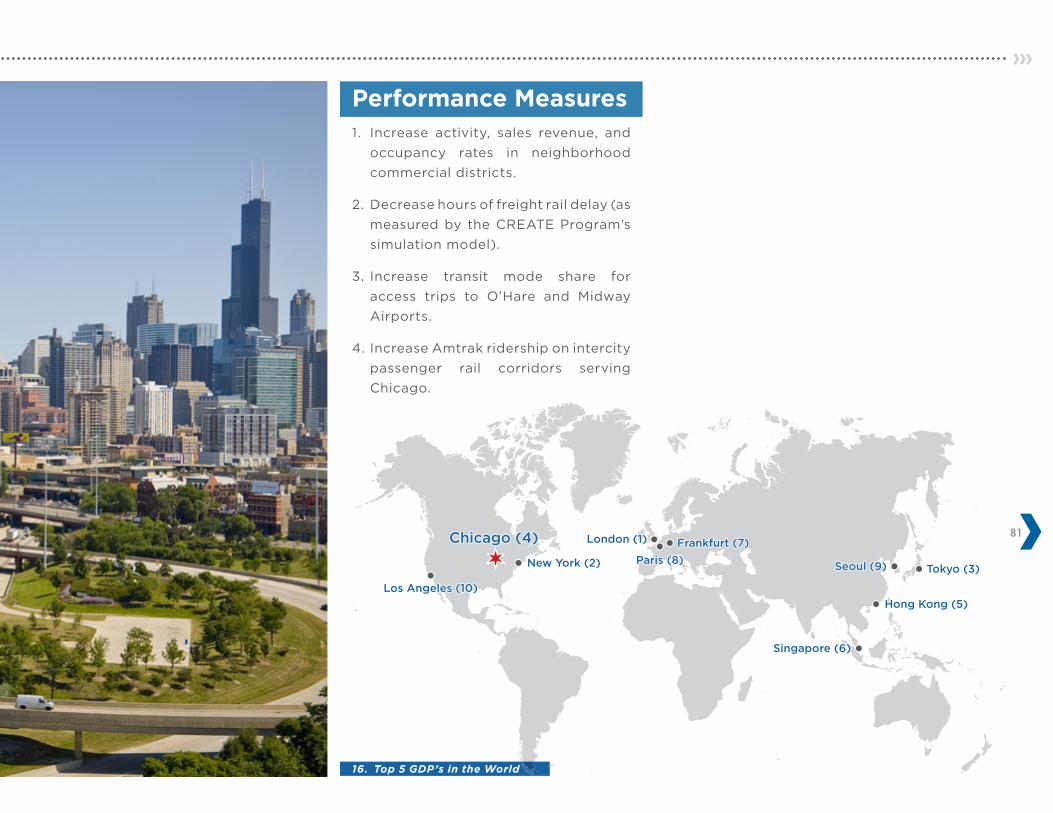
81
1. Increase activity, sales revenue, and
occupancy rates in neighborhood
commercial districts.
2. Decrease hours of freight rail delay (as
measured by the CREATE Program’s
simulation model).
3. Increase transit mode share for
access trips to O’Hare and Midway
Airports.
4. Increase Amtrak ridership on intercity
passenger rail corridors serving
Chicago.
Performance Measures
New York (2)
Chicago (4) London (1)
Paris (8)
Frankfurt (7)
Singapore (6)
Hong Kong (5)
Seoul (9) Tokyo (3)
Los Angeles (10)
16. Top 5 GDP’s in the World
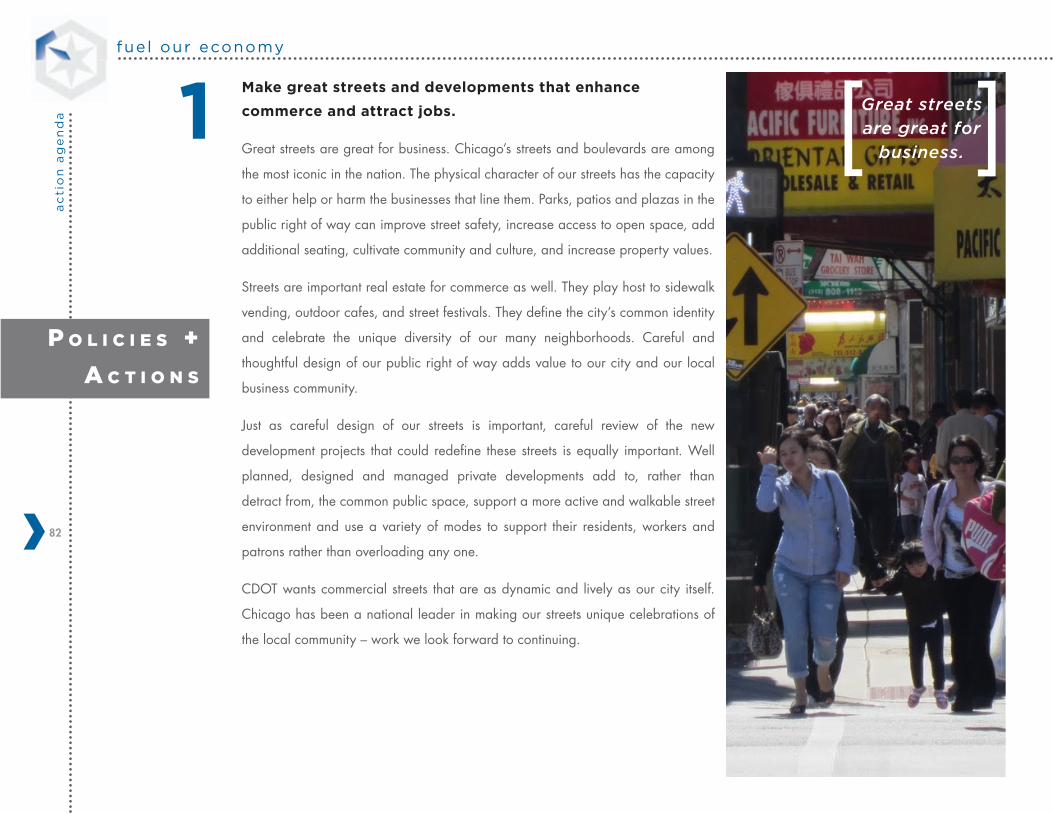
fuel our economya
cti
on
ag
en
da
82
Make great streets and developments that enhance
commerce and attract jobs.
Great streets are great for business. Chicago’s streets and boulevards are among
the most iconic in the nation. The physical character of our streets has the capacity
to either help or harm the businesses that line them. Parks, patios and plazas in the
public right of way can improve street safety, increase access to open space, add
additional seating, cultivate community and culture, and increase property values.
Streets are important real estate for commerce as well. They play host to sidewalk
vending, outdoor cafes, and street festivals. They define the city’s common identity
and celebrate the unique diversity of our many neighborhoods. Careful and
thoughtful design of our public right of way adds value to our city and our local
business community.
Just as careful design of our streets is important, careful review of the new
development projects that could redefine these streets is equally important. Well
planned, designed and managed private developments add to, rather than
detract from, the common public space, support a more active and walkable street
environment and use a variety of modes to support their residents, workers and
patrons rather than overloading any one.
CDOT wants commercial streets that are as dynamic and lively as our city itself.
Chicago has been a national leader in making our streets unique celebrations of
the local community – work we look forward to continuing.
1
P o l i c i e s +
A c t i o n s
Great streets are great for
business.[ [
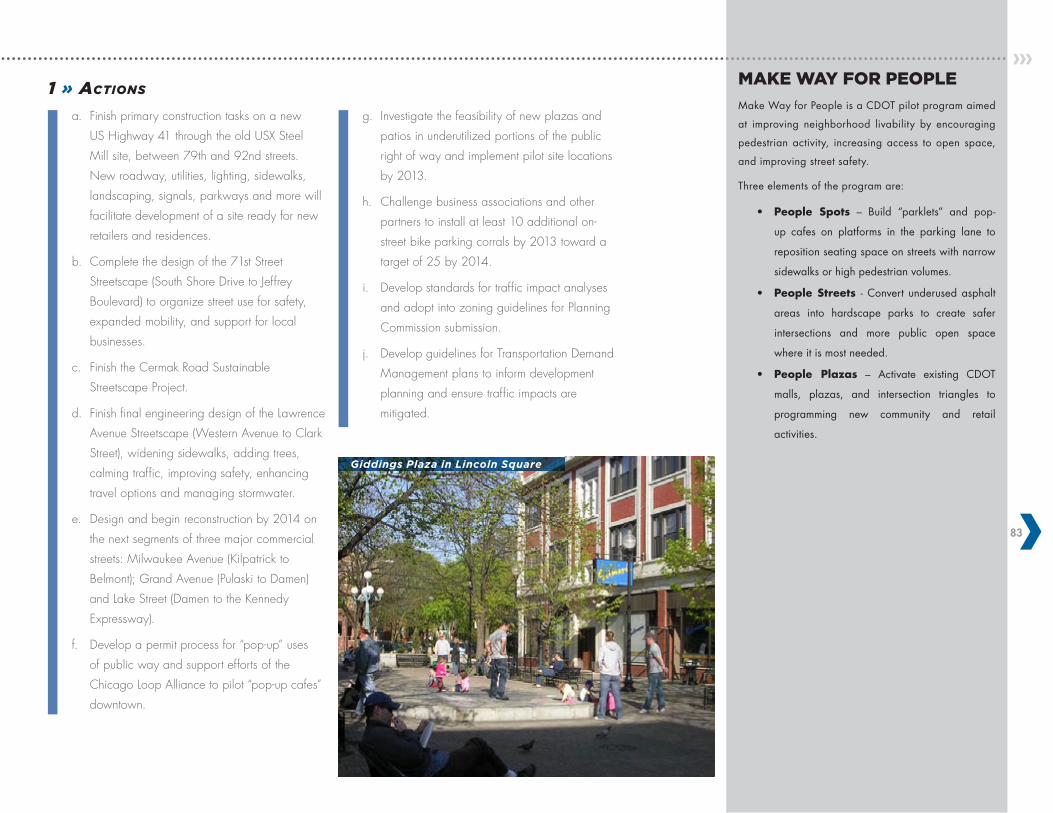
83
1 » Actions
a. Finish primary construction tasks on a new
US Highway 41 through the old USX Steel
Mill site, between 79th and 92nd streets.
New roadway, utilities, lighting, sidewalks,
landscaping, signals, parkways and more will
facilitate development of a site ready for new
retailers and residences.
b. Complete the design of the 71st Street
Streetscape (South Shore Drive to Jeffrey
Boulevard) to organize street use for safety,
expanded mobility, and support for local
businesses.
c. Finish the Cermak Road Sustainable
Streetscape Project.
d. Finish final engineering design of the Lawrence
Avenue Streetscape (Western Avenue to Clark
Street), widening sidewalks, adding trees,
calming traffic, improving safety, enhancing
travel options and managing stormwater.
e. Design and begin reconstruction by 2014 on
the next segments of three major commercial
streets: Milwaukee Avenue (Kilpatrick to
Belmont); Grand Avenue (Pulaski to Damen)
and Lake Street (Damen to the Kennedy
Expressway).
f. Develop a permit process for “pop-up” uses
of public way and support efforts of the
Chicago Loop Alliance to pilot “pop-up cafes”
downtown.
g. Investigate the feasibility of new plazas and
patios in underutilized portions of the public
right of way and implement pilot site locations
by 2013.
h. Challenge business associations and other
partners to install at least 10 additional on-
street bike parking corrals by 2013 toward a
target of 25 by 2014.
i. Develop standards for traffic impact analyses
and adopt into zoning guidelines for Planning
Commission submission.
j. Develop guidelines for Transportation Demand
Management plans to inform development
planning and ensure traffic impacts are
mitigated.
Giddings Plaza in Lincoln Square
MAKE WAY FOR PEOPLE
Make Way for People is a CDOT pilot program aimed
at improving neighborhood livability by encouraging
pedestrian activity, increasing access to open space,
and improving street safety.
Three elements of the program are:
• People Spots – Build “parklets” and pop-
up cafes on platforms in the parking lane to
reposition seating space on streets with narrow
sidewalks or high pedestrian volumes.
• PeopleStreets - Convert underused asphalt
areas into hardscape parks to create safer
intersections and more public open space
where it is most needed.
• People Plazas – Activate existing CDOT
malls, plazas, and intersection triangles to
programming new community and retail
activities.
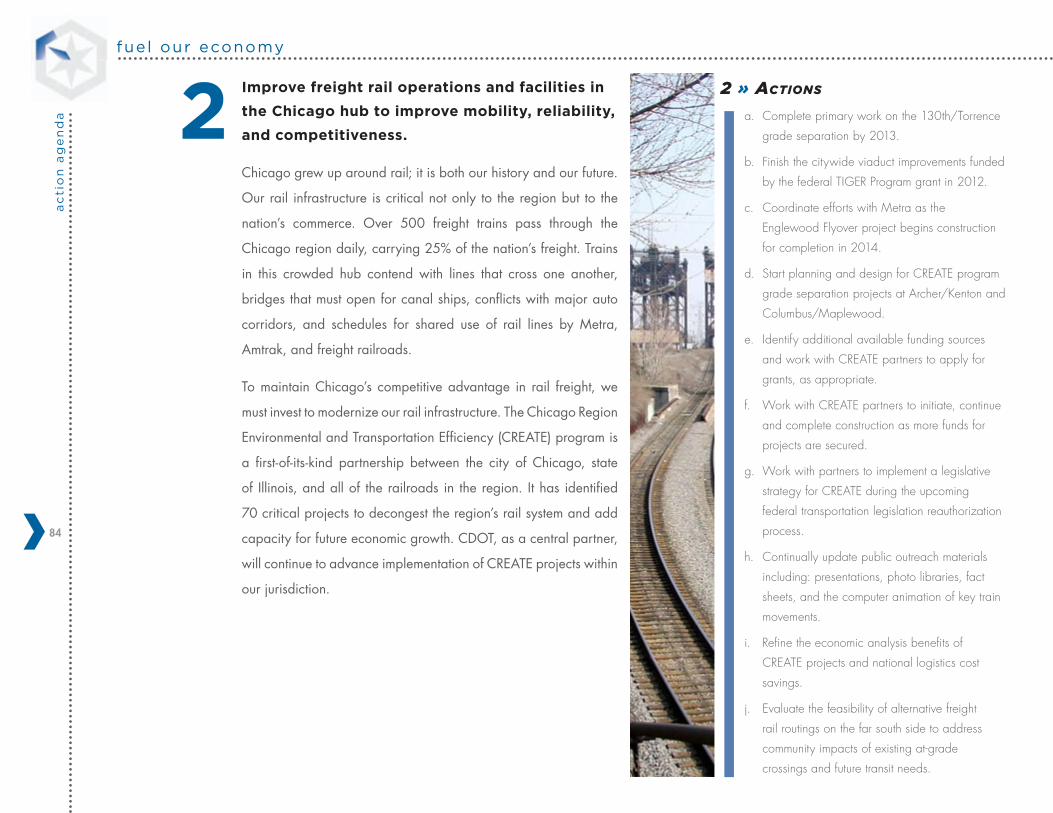
fuel our economya
cti
on
ag
en
da
84
Improve freight rail operations and facilities in
the Chicago hub to improve mobility, reliability,
and competitiveness.
Chicago grew up around rail; it is both our history and our future.
Our rail infrastructure is critical not only to the region but to the
nation’s commerce. Over 500 freight trains pass through the
Chicago region daily, carrying 25% of the nation’s freight. Trains
in this crowded hub contend with lines that cross one another,
bridges that must open for canal ships, conflicts with major auto
corridors, and schedules for shared use of rail lines by Metra,
Amtrak, and freight railroads.
To maintain Chicago’s competitive advantage in rail freight, we
must invest to modernize our rail infrastructure. The Chicago Region
Environmental and Transportation Efficiency (CREATE) program is
a first-of-its-kind partnership between the city of Chicago, state
of Illinois, and all of the railroads in the region. It has identified
70 critical projects to decongest the region’s rail system and add
capacity for future economic growth. CDOT, as a central partner,
will continue to advance implementation of CREATE projects within
our jurisdiction.
2 » Actions
a. Complete primary work on the 130th/Torrence
grade separation by 2013.
b. Finish the citywide viaduct improvements funded
by the federal TIGER Program grant in 2012.
c. Coordinate efforts with Metra as the
Englewood Flyover project begins construction
for completion in 2014.
d. Start planning and design for CREATE program
grade separation projects at Archer/Kenton and
Columbus/Maplewood.
e. Identify additional available funding sources
and work with CREATE partners to apply for
grants, as appropriate.
f. Work with CREATE partners to initiate, continue
and complete construction as more funds for
projects are secured.
g. Work with partners to implement a legislative
strategy for CREATE during the upcoming
federal transportation legislation reauthorization
process.
h. Continually update public outreach materials
including: presentations, photo libraries, fact
sheets, and the computer animation of key train
movements.
i. Refine the economic analysis benefits of
CREATE projects and national logistics cost
savings.
j. Evaluate the feasibility of alternative freight
rail routings on the far south side to address
community impacts of existing at-grade
crossings and future transit needs.
2
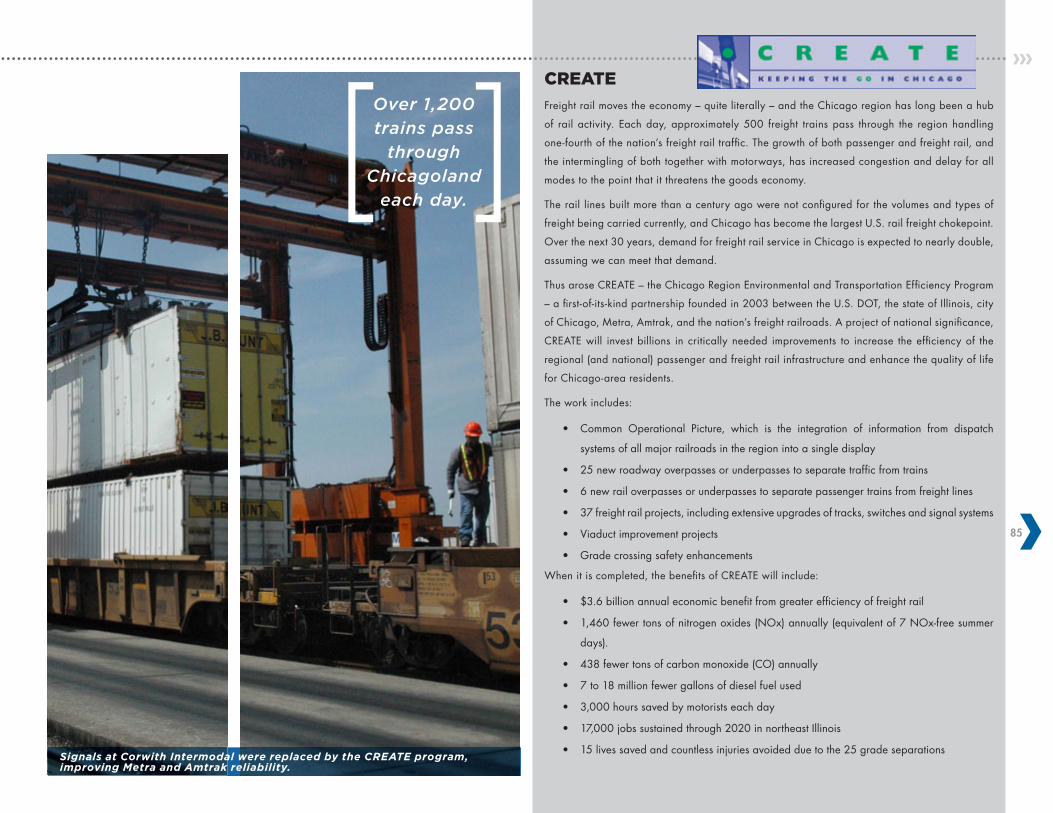
85
Signals at Corwith Intermodal were replaced by the CREATE program, improving Metra and Amtrak reliability.
CREATE
Freight rail moves the economy – quite literally – and the Chicago region has long been a hub
of rail activity. Each day, approximately 500 freight trains pass through the region handling
one-fourth of the nation’s freight rail traffic. The growth of both passenger and freight rail, and
the intermingling of both together with motorways, has increased congestion and delay for all
modes to the point that it threatens the goods economy.
The rail lines built more than a century ago were not configured for the volumes and types of
freight being carried currently, and Chicago has become the largest U.S. rail freight chokepoint.
Over the next 30 years, demand for freight rail service in Chicago is expected to nearly double,
assuming we can meet that demand.
Thus arose CREATE – the Chicago Region Environmental and Transportation Efficiency Program
– a first-of-its-kind partnership founded in 2003 between the U.S. DOT, the state of Illinois, city
of Chicago, Metra, Amtrak, and the nation’s freight railroads. A project of national significance,
CREATE will invest billions in critically needed improvements to increase the efficiency of the
regional (and national) passenger and freight rail infrastructure and enhance the quality of life
for Chicago-area residents.
The work includes:
• Common Operational Picture, which is the integration of information from dispatch
systems of all major railroads in the region into a single display
• 25 new roadway overpasses or underpasses to separate traffic from trains
• 6 new rail overpasses or underpasses to separate passenger trains from freight lines
• 37 freight rail projects, including extensive upgrades of tracks, switches and signal systems
• Viaduct improvement projects
• Grade crossing safety enhancements
When it is completed, the benefits of CREATE will include:
• $3.6 billion annual economic benefit from greater efficiency of freight rail
• 1,460 fewer tons of nitrogen oxides (NOx) annually (equivalent of 7 NOx-free summer
days).
• 438 fewer tons of carbon monoxide (CO) annually
• 7 to 18 million fewer gallons of diesel fuel used
• 3,000 hours saved by motorists each day
• 17,000 jobs sustained through 2020 in northeast Illinois
• 15 lives saved and countless injuries avoided due to the 25 grade separations
Over 1,200 trains pass
through Chicagoland
each day.[ [
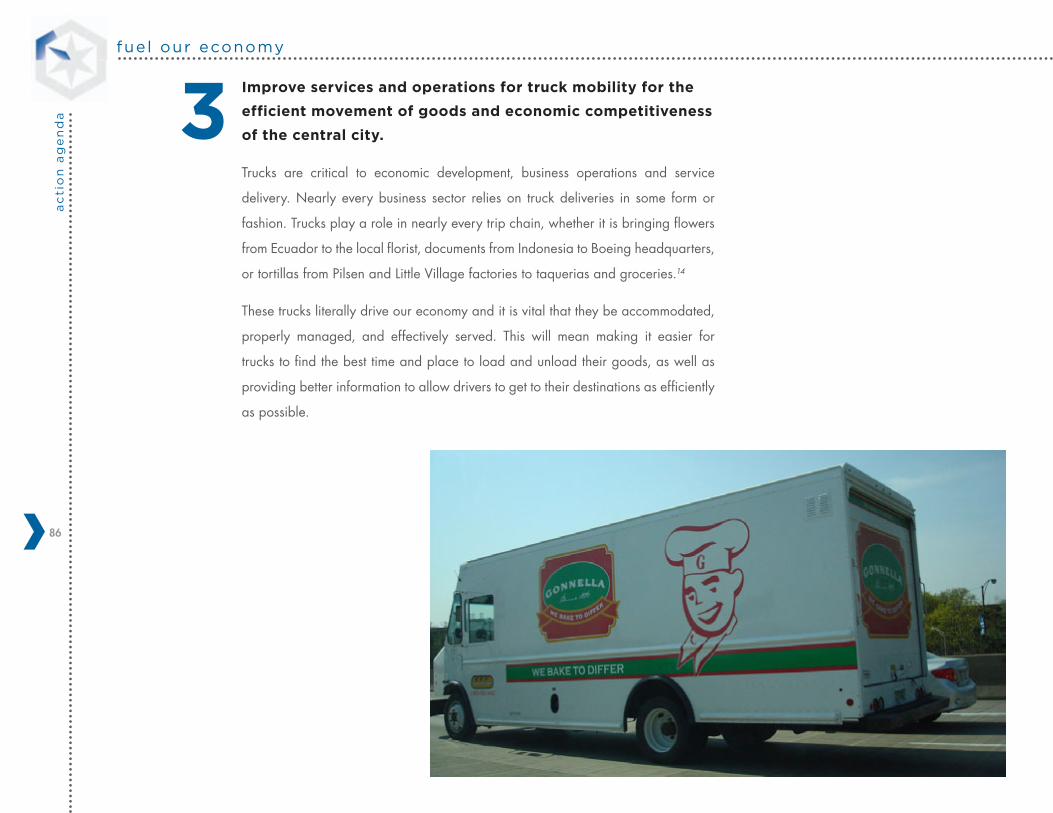
fuel our economya
cti
on
ag
en
da
86
Improve services and operations for truck mobility for the
efficient movement of goods and economic competitiveness
of the central city.
Trucks are critical to economic development, business operations and service
delivery. Nearly every business sector relies on truck deliveries in some form or
fashion. Trucks play a role in nearly every trip chain, whether it is bringing flowers
from Ecuador to the local florist, documents from Indonesia to Boeing headquarters,
or tortillas from Pilsen and Little Village factories to taquerias and groceries.14
These trucks literally drive our economy and it is vital that they be accommodated,
properly managed, and effectively served. This will mean making it easier for
trucks to find the best time and place to load and unload their goods, as well as
providing better information to allow drivers to get to their destinations as efficiently
as possible.
3
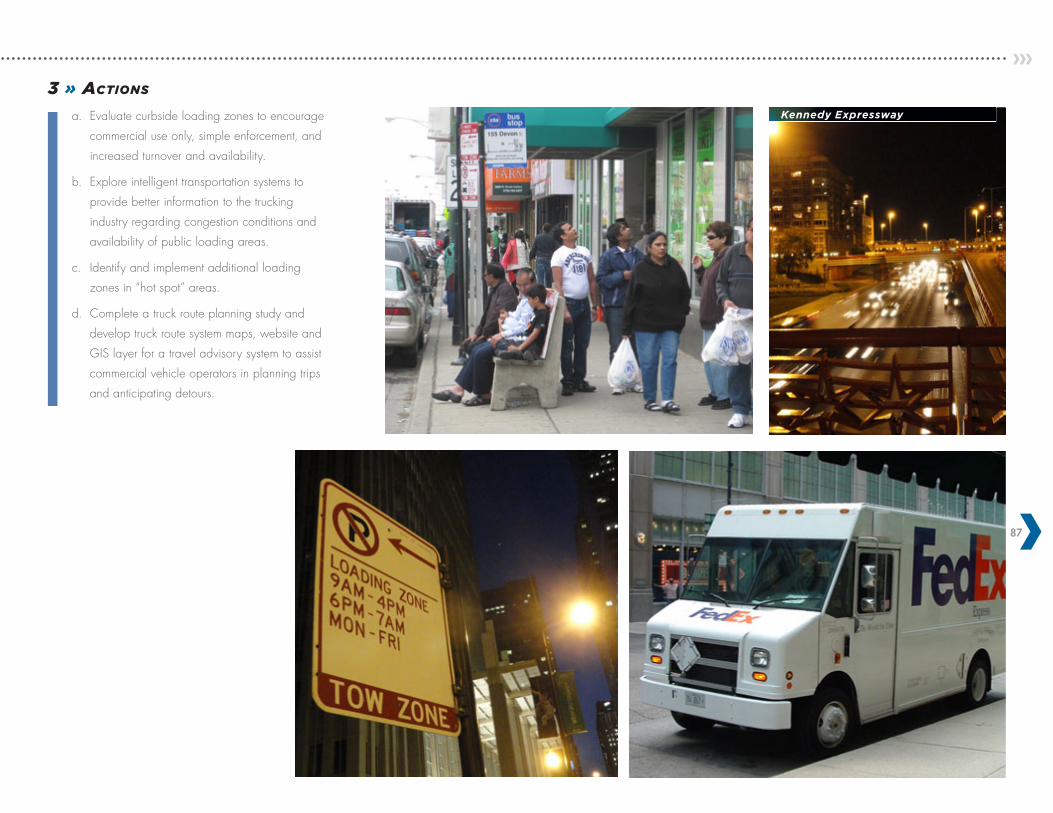
87
Kennedy Expressway
3 » Actions
a. Evaluate curbside loading zones to encourage
commercial use only, simple enforcement, and
increased turnover and availability.
b. Explore intelligent transportation systems to
provide better information to the trucking
industry regarding congestion conditions and
availability of public loading areas.
c. Identify and implement additional loading
zones in “hot spot” areas.
d. Complete a truck route planning study and
develop truck route system maps, website and
GIS layer for a travel advisory system to assist
commercial vehicle operators in planning trips
and anticipating detours.
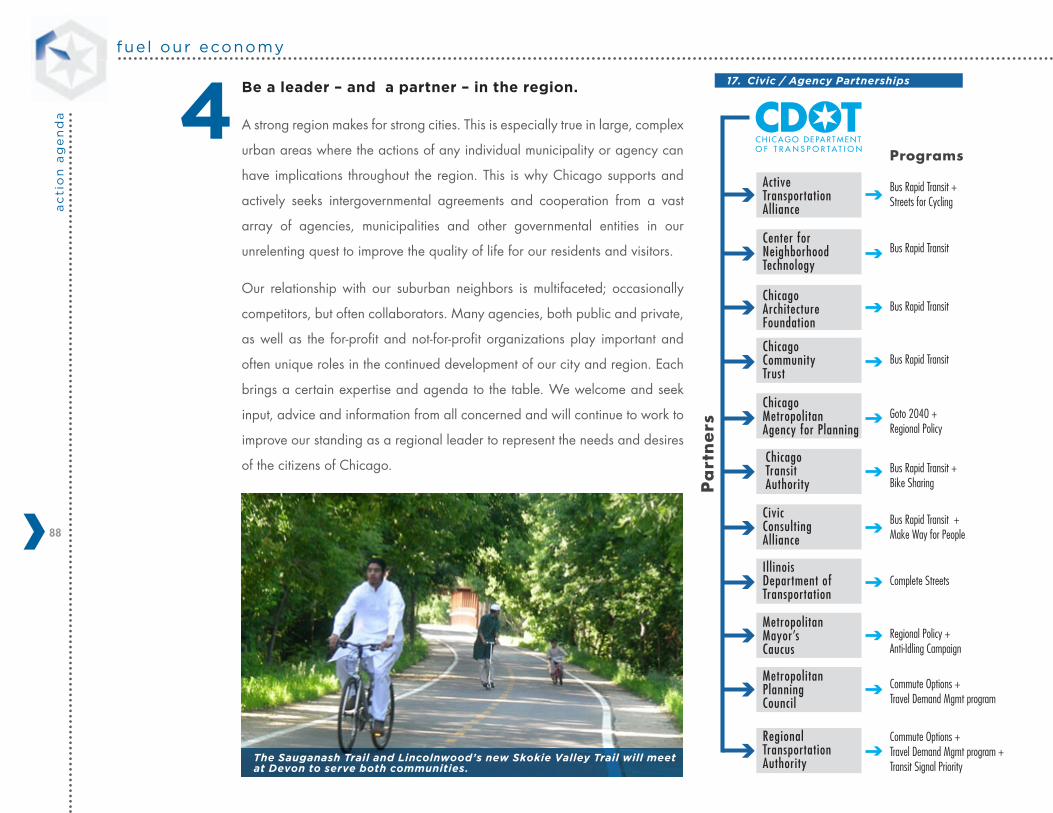
fuel our economya
cti
on
ag
en
da
88
17. Civic / Agency PartnershipsBe a leader – and a partner – in the region.
A strong region makes for strong cities. This is especially true in large, complex
urban areas where the actions of any individual municipality or agency can
have implications throughout the region. This is why Chicago supports and
actively seeks intergovernmental agreements and cooperation from a vast
array of agencies, municipalities and other governmental entities in our
unrelenting quest to improve the quality of life for our residents and visitors.
Our relationship with our suburban neighbors is multifaceted; occasionally
competitors, but often collaborators. Many agencies, both public and private,
as well as the for-profit and not-for-profit organizations play important and
often unique roles in the continued development of our city and region. Each
brings a certain expertise and agenda to the table. We welcome and seek
input, advice and information from all concerned and will continue to work to
improve our standing as a regional leader to represent the needs and desires
of the citizens of Chicago.
4ActiveTransportation Alliance
Center for Neighborhood Technology
ChicagoArchitectureFoundation
ChicagoCommunity Trust
Chicago MetropolitanAgency for Planning
Chicago Transit Authority
Civic ConsultingAlliance
IllinoisDepartment of Transportation
MetropolitanMayor’sCaucus
MetropolitanPlanningCouncil
RegionalTransportationAuthority
Bus Rapid Transit + Streets for Cycling
Bus Rapid Transit
Bus Rapid Transit
Bus Rapid Transit
Goto 2040 + Regional Policy
Bus Rapid Transit + Bike Sharing
Bus Rapid Transit + Make Way for People
Complete Streets
Regional Policy + Anti-Idling Campaign
Commute Options + Travel Demand Mgmt program
Commute Options + Travel Demand Mgmt program + Transit Signal Priority
Programs
Pa
rtn
ers
The Sauganash Trail and Lincolnwood’s new Skokie Valley Trail will meet at Devon to serve both communities.
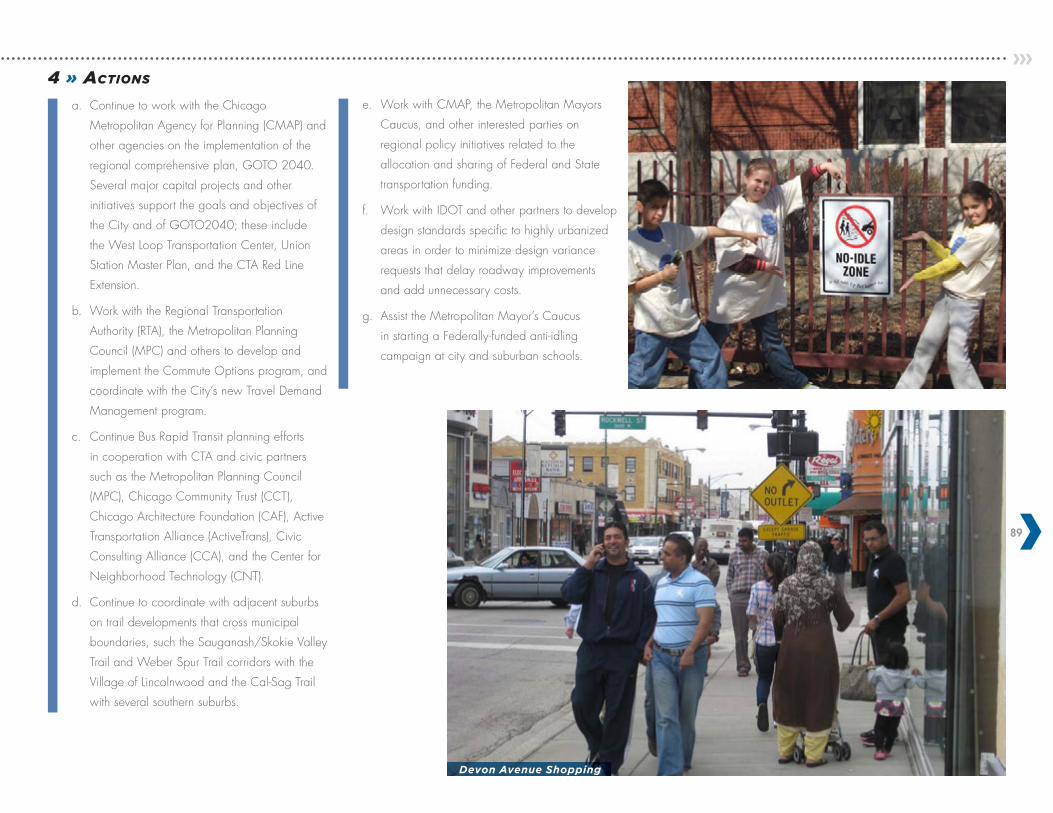
89
Devon Avenue Shopping
e. Work with CMAP, the Metropolitan Mayors
Caucus, and other interested parties on
regional policy initiatives related to the
allocation and sharing of Federal and State
transportation funding.
f. Work with IDOT and other partners to develop
design standards specific to highly urbanized
areas in order to minimize design variance
requests that delay roadway improvements
and add unnecessary costs.
g. Assist the Metropolitan Mayor’s Caucus
in starting a Federally-funded anti-idling
campaign at city and suburban schools.
4 » Actions
a. Continue to work with the Chicago
Metropolitan Agency for Planning (CMAP) and
other agencies on the implementation of the
regional comprehensive plan, GOTO 2040.
Several major capital projects and other
initiatives support the goals and objectives of
the City and of GOTO2040; these include
the West Loop Transportation Center, Union
Station Master Plan, and the CTA Red Line
Extension.
b. Work with the Regional Transportation
Authority (RTA), the Metropolitan Planning
Council (MPC) and others to develop and
implement the Commute Options program, and
coordinate with the City’s new Travel Demand
Management program.
c. Continue Bus Rapid Transit planning efforts
in cooperation with CTA and civic partners
such as the Metropolitan Planning Council
(MPC), Chicago Community Trust (CCT),
Chicago Architecture Foundation (CAF), Active
Transportation Alliance (ActiveTrans), Civic
Consulting Alliance (CCA), and the Center for
Neighborhood Technology (CNT).
d. Continue to coordinate with adjacent suburbs
on trail developments that cross municipal
boundaries, such the Sauganash/Skokie Valley
Trail and Weber Spur Trail corridors with the
Village of Lincolnwood and the Cal-Sag Trail
with several southern suburbs.
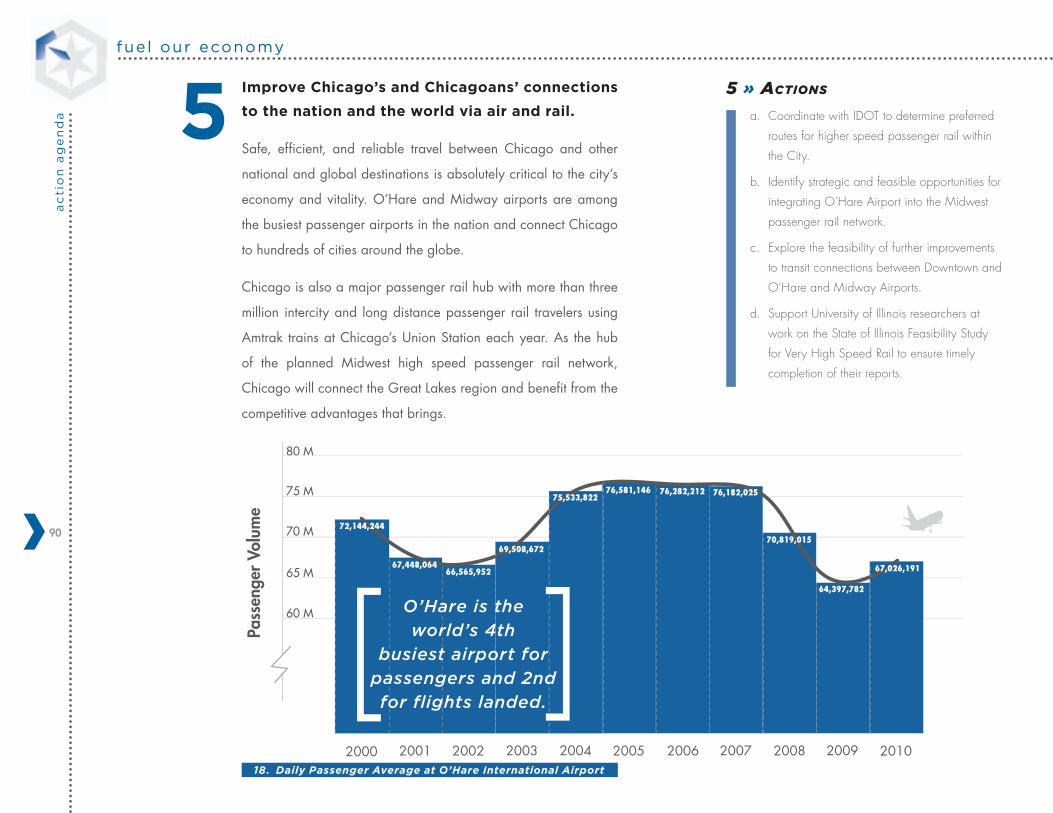
fuel our economya
cti
on
ag
en
da
90
80 M
75 M
65 M
70 M
60 M
80 M
Calendar Year
Pass
enge
r Vo
lum
e
2000
72,144,244
2001 2002 2003 2004 2005 2006 2007 2008 2009 2010
67,448,06466,565,952
69,508,672
75,533,82276,581,146 76,282,212 76,182,025
70,819,015
64,397,782
67,026,191
Daily Average of O’hare Passengers
18. Daily Passenger Average at O’Hare International Airport
Improve Chicago’s and Chicagoans’ connections
to the nation and the world via air and rail.
Safe, efficient, and reliable travel between Chicago and other
national and global destinations is absolutely critical to the city‘s
economy and vitality. O’Hare and Midway airports are among
the busiest passenger airports in the nation and connect Chicago
to hundreds of cities around the globe.
Chicago is also a major passenger rail hub with more than three
million intercity and long distance passenger rail travelers using
Amtrak trains at Chicago’s Union Station each year. As the hub
of the planned Midwest high speed passenger rail network,
Chicago will connect the Great Lakes region and benefit from the
competitive advantages that brings.
5 » Actions
a. Coordinate with IDOT to determine preferred
routes for higher speed passenger rail within
the City.
b. Identify strategic and feasible opportunities for
integrating O’Hare Airport into the Midwest
passenger rail network.
c. Explore the feasibility of further improvements
to transit connections between Downtown and
O’Hare and Midway Airports.
d. Support University of Illinois researchers at
work on the State of Illinois Feasibility Study
for Very High Speed Rail to ensure timely
completion of their reports.
5
O’Hare is the world’s 4th
busiest airport for passengers and 2nd for flights landed.[ [
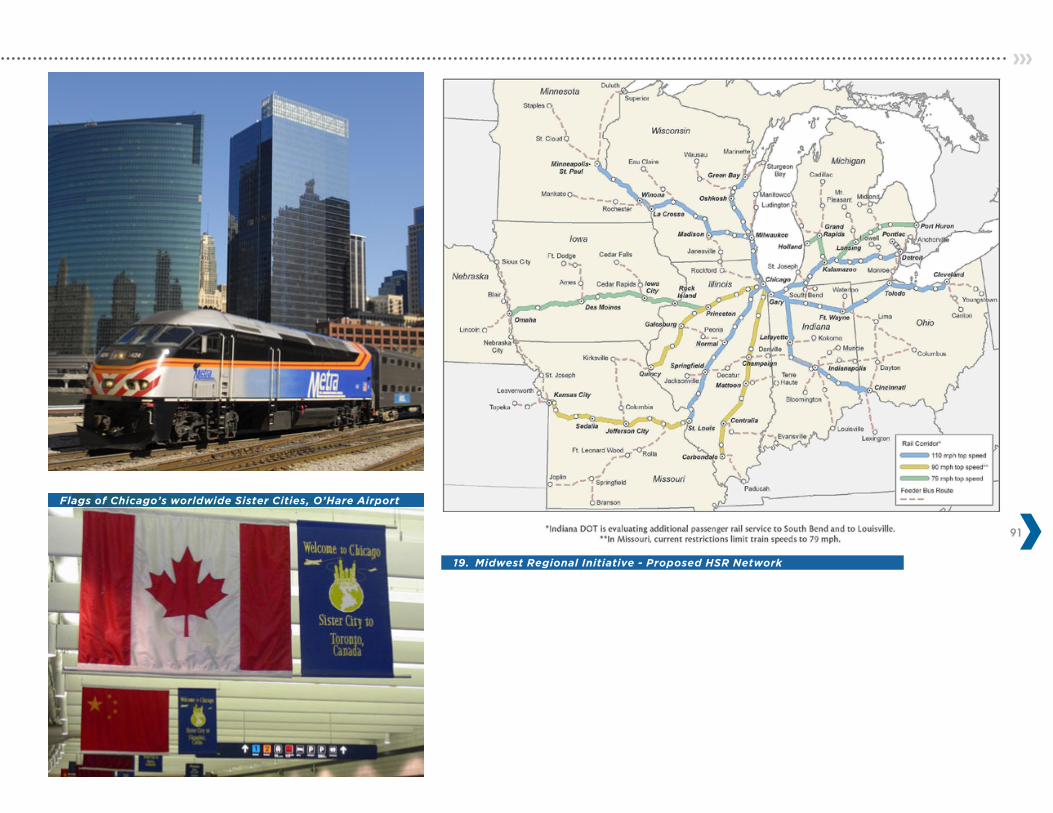
91
19. Midwest Regional Initiative - Proposed HSR Network
Flags of Chicago’s worldwide Sister Cities, O’Hare Airport
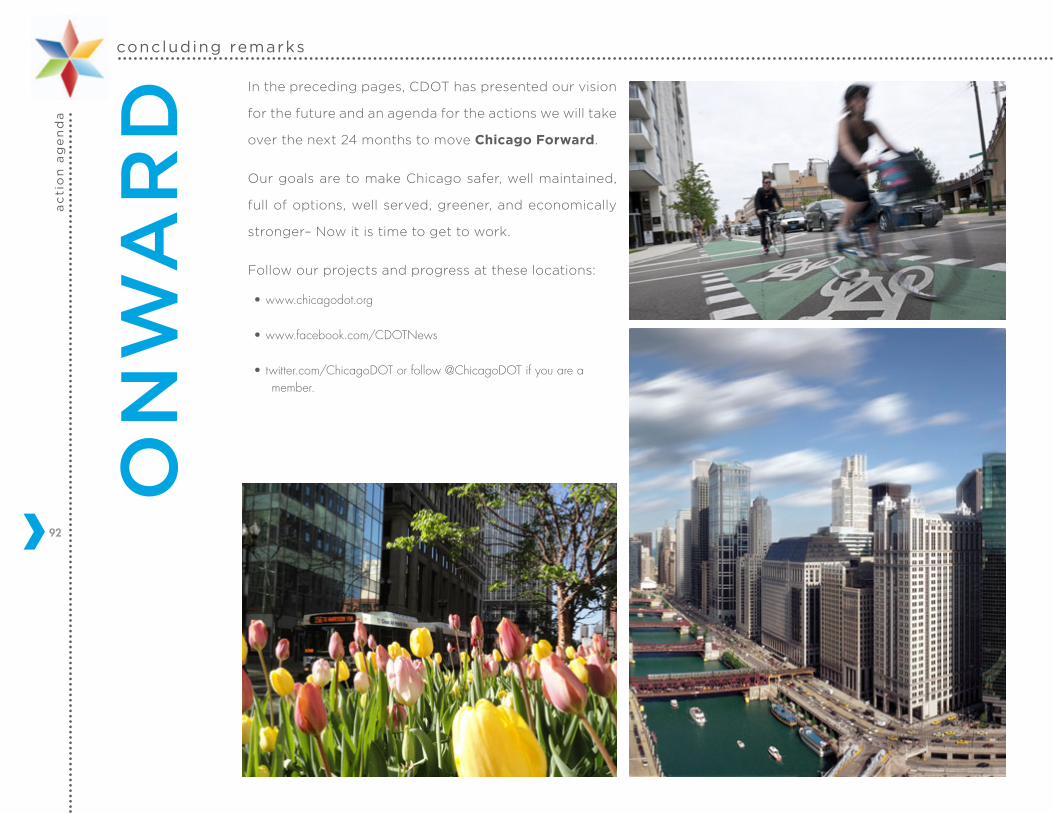
concluding remarksa
cti
on
ag
en
da
92
In the preceding pages, CDOT has presented our vision
for the future and an agenda for the actions we will take
over the next 24 months to move Chicago Forward.
Our goals are to make Chicago safer, well maintained,
full of options, well served, greener, and economically
stronger– Now it is time to get to work.
Follow our projects and progress at these locations:
•www.chicagodot.org
•www.facebook.com/CDOTNews
•twitter.com/ChicagoDOT or follow @ChicagoDOT if you are a member.
on
Wa
RD
93
concluding remarksa
cti
on
ag
en
da
94
exHIbIT lIsT
SAFETY FIRST 14
1. City-Wide Pedestrian Crash Trends 19
Source: City of Chicago 2011 Pedestrian Crash analysis summary report - 2010 Census Summary File 3
2. Rendering of Damen-Elston-Fullerton proposed alignment 21
Source: CDOT
3. Vehicle and Pedestrian Collision Speed Survival Percentage 22
Source: U.K. Department of Transportation, Killing Speed and Saving Lives, London, 1987
4. Red-Light Camera Locations 23
Source: CDOT
REBUILD & RENEW 26
5. 55/45 Split for Illinois Transportation Funding 36
Source: GOTO 2040 Plan, pg. 260. <http://www.cmap.illinois.gov/2040/main>
CHOICES FOR CHICAGO 38
6. Example Complete Streets Rendering 43
Source: Sam Schwartz Engineering
7. Childrens’ Travel Patterns to School 43
Source: 2009 National Household Travel Survey
8. Major U.S. Bicycle Commuter Percentage 45
Source: 2010 American Community Survey Statistics
9. Chicago Annual Ridership (1997 - 2010) 46
Source: 2011 Annual Ridership: CDOT, CTA, METRA, PACE
10. 2010, Chicago Transit Ridership Percentage by mode 47
Source: 2011 Annual Ridership: CDOT, CTA, METRA, PACE
95
SERVING CHICAGOANS 52
11. Customer Service Time Distribution 56
Source: CDOT
A MORE SUSTAINABLE CITY 64
12. Greenhouse Gas (GHG) Emissions from Transportation 69
Source: John Davies + Christiano Facanha, “Greenhouse Gas Emissions From Freight Trucks”, May 16, 2007: International Emissions Inventory Conference
13. Green Alley Program Benefits 71
Source: CDOT, “The Chicago Green Alley Handbook, an action guide to create a greener, environmentally sustainable Chicago”; 2010
14. Locally Sourced Materials 73
15. Street Light Retrofit Energy Savings 75
Source: CDOT
FUEL OUR ECONOMY 78
16. Top 5 GDP’s in the World 81Source: CNN, <www.edition.cnn.com/2007/business/06/13/global.economy/>, December 17, 2011.
17. Civic / Agency Partnerships 88
Source: CDOT
18. Daily Passenger Average at O’Hare International Airport 90
Source: O’Hare International Airport, < http://www.flychicago.com/BusinessInformation/Statistics/Default.aspx>, December 17, 2011.
19. Midwest Regional Initiative - Proposed HSR Network 91
Source: Midwest Interstate Passenger Rail Commission, <http://www.miprc.org/Advocacy/MidwestRegionalRailInitiative/tabid/88/Default.aspx>, April 02, 2012.
concluding remarksa
cti
on
ag
en
da
96
PHoTo CReDITs
All photos are courtesy of the City of Chicago and Sam Schwartz Engineering, except for
the following:
Chicago Transit Authority (CTA),
» Original front and back cover images, pages 4, 28 (bottom), 29 (left), 34 (right), 35 (right), 48 (left, top, middle), 49 (all), 55, 60 (left), 62
Chicago History Museum, Library of Congress - Chicago Daily news historical
» Pages 8–9 (images incorporated into the Timeline - 1800 and 1920)
CREATE
» Pages 84, 85
flickr.com and private collections
» Pages 2, 6, 8–9 (timeline images), 17 (left), 20 (left), 22 (left), 30 (right), 34 (left), 35 (top left), 37 (all), 40 (middle, bottom), 42, 48 (bottom), 50, 58 (right), 61 (top left, bottom), 69 (top), 72 (bottom), 74, 81, 86, 87 (top left, top right, bottom left), 88, 89 (bottom)
NASA
» Page 74
97
enD noTes
1. Page 12 - http://explorechicago.org/etc/medialib/explore_chicago/tourism/pdfs_press_releases/chica go_office_of.Par.83640.File.dat/Statistics_2009.pdf
2. Page 12 - http://www.businessinsider.com/gdp-by-city-2011-3#3-chicago-ill-23
3. Page 12 - http://www.skyscrapercity.com/showthread.php?t=1247573
4. Page 12 - http://www.bls.gov/eag/eag.il_chicago_msa.htm
5. Page 12 - http://goo.gl/w03Ma
6. Page 43 - http://archive.chicagobreakingnews.com/2009/07/illinois-obesity-children-obesity.html
7. Page 43 - http://www.clocc.net/coc/prevalence.html
8. Page 43 - Illinois Cardio Vascular Task Force, June 2000
9. Page 43 - http://kaiserhealthnews.org/Stories/2010/July/16/FT-obesity-workplace-costs.aspx
10. Page 44 - http://www.cmap.illinois.gov/travel-tracker-survey
11. Page 44 - http://www.walkfriendly.org/communities/community.cfm?ID=83
12. Page 74 - http://www.illinoislighting.org/chicago.html
13. Page 80 - http://www.skyscrapercity.com/showthread.php?t=1247573
» http://www.forbes.com/2008/07/15/economic-growth-gdp-biz-cx_jz_0715powercities.html
» http://goo.gl/w03Ma
» http://www.citymayors.com/economics/financial-cities.html
14. Page 86 - http://www.wbez.org/story/news/economy/blizzard-spurs-temporary-tortilla-shortage
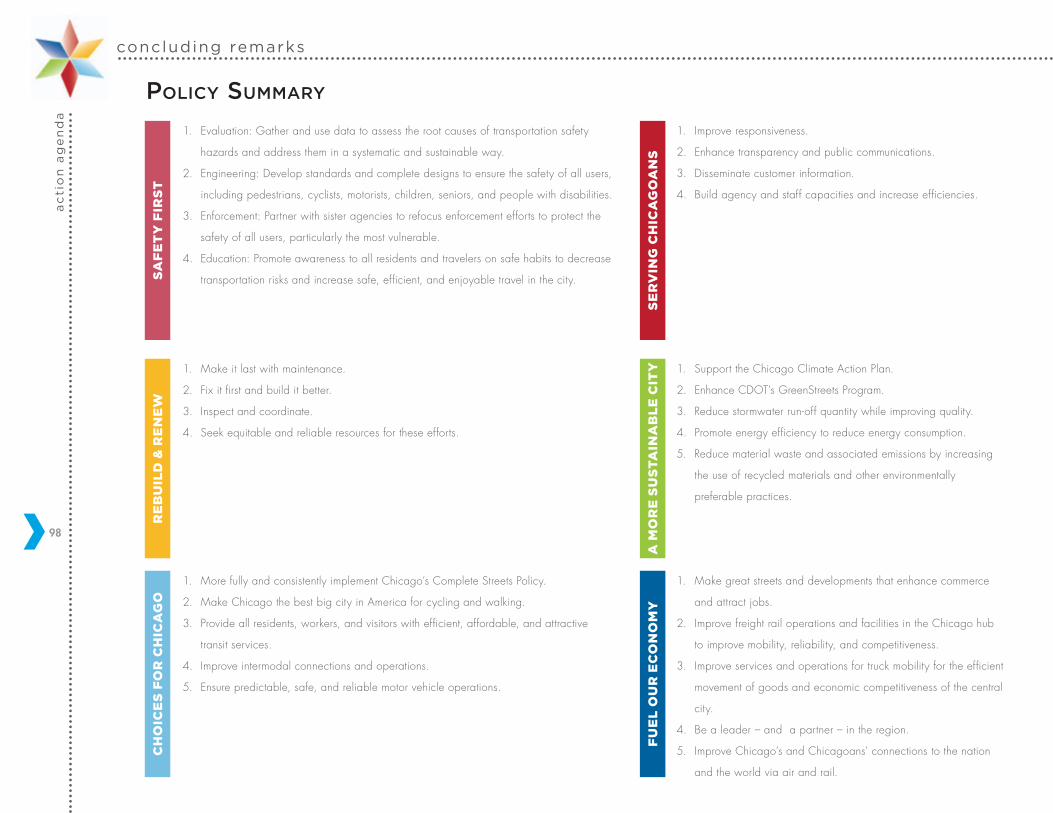
concluding remarksa
cti
on
ag
en
da
98
1. Make it last with maintenance.
2. Fix it first and build it better.
3. Inspect and coordinate.
4. Seek equitable and reliable resources for these efforts.
1. Evaluation: Gather and use data to assess the root causes of transportation safety
hazards and address them in a systematic and sustainable way.
2. Engineering: Develop standards and complete designs to ensure the safety of all users,
including pedestrians, cyclists, motorists, children, seniors, and people with disabilities.
3. Enforcement: Partner with sister agencies to refocus enforcement efforts to protect the
safety of all users, particularly the most vulnerable.
4. Education: Promote awareness to all residents and travelers on safe habits to decrease
transportation risks and increase safe, efficient, and enjoyable travel in the city.
1. More fully and consistently implement Chicago’s Complete Streets Policy.
2. Make Chicago the best big city in America for cycling and walking.
3. Provide all residents, workers, and visitors with efficient, affordable, and attractive
transit services.
4. Improve intermodal connections and operations.
5. Ensure predictable, safe, and reliable motor vehicle operations.
1. Make great streets and developments that enhance commerce
and attract jobs.
2. Improve freight rail operations and facilities in the Chicago hub
to improve mobility, reliability, and competitiveness.
3. Improve services and operations for truck mobility for the efficient
movement of goods and economic competitiveness of the central
city.
4. Be a leader – and a partner – in the region.
5. Improve Chicago’s and Chicagoans’ connections to the nation
and the world via air and rail.
1. Support the Chicago Climate Action Plan.
2. Enhance CDOT’s GreenStreets Program.
3. Reduce stormwater run-off quantity while improving quality.
4. Promote energy efficiency to reduce energy consumption.
5. Reduce material waste and associated emissions by increasing
the use of recycled materials and other environmentally
preferable practices.
1. Improve responsiveness.
2. Enhance transparency and public communications.
3. Disseminate customer information.
4. Build agency and staff capacities and increase efficiencies.
SA
FE
TY
FIR
ST
CH
OIC
ES
FO
R C
HIC
AG
O
FU
EL
OU
R E
CO
NO
MY
A M
OR
E S
US
TA
INA
BL
E C
ITY
SE
RV
ING
CH
ICA
GO
AN
S
RE
BU
ILD
& R
EN
EW
PolICy summaRy
99
aCknoWleDGemenTs
Contributors
Jennifer Altin, Mike Amsden, Janet Attarian, Samantha Bingham, Jeff Brink, Dan Burke, Oswaldo Chaves, William Cheaks, Abraham Emanuel, Chris Gagnon, Jeff Goliber, Ben Gomberg, Kiersten Grove, Jill Hayes, Hannah Higgins, Vasile Jurca, Soliman Khudiera, David Leopold, Kenneth Martin, Brenda McGruder, Dolan McMillan, Sarah Miller, Yadollah Montazery, Johnny Morcos, Jay Orlando, Anthony Pellegrini, Rajiv Pinto, Anthony Rainey, Chelsea Richer, John Sadler, Malihe Samadi, Julian Silva, David Seglin, Charlie Short, Bridget Stalla, Jeff Sriver, Charlene Walsh, Sean Wiedel, Chris Wuellner, Jesus Yepez, John Yonan, David Zavattero
Special Thanks
Graham Garfield + Joe Iacobucci, CTA
Printing by:
The Blueprint Shoppe, Inc.
Rahm Emanuel, Mayor
Publishers
Gabe Klein | CDOT Commissioner
Scott Kubly | CDOT Managing Deputy Commissioner
Luann Hamilton | CDOT Deputy Commissioner, Project Development
Editor + Project Manager
Keith Privett | Project Manager
Head Writer
Karina Ricks | Consultant/Writer
Graphics + Design
Sam Schwartz EnginEEring
Mark de la Vergne | Project Director
Matthew Bernstine | Project Manager + Designer
Jee Mee Kim | QA/QC Manager
Danny Garwood | Designer
Dan Miodonski | Planner
Stacey Meekins | Planner
altamanu
John Mac Manus | Principal
Sean McKay | Designer
BUILDING A NEW
CHICAGO


