Page 1
Climate-driven spatial mismatches between Britishorchards and their pollinators: increased risks ofpollination deficitsCH IARA POLCE 1 , M ICHAEL P GARRATT 2 , METTE TERMANSEN3 ,
JUL IAN RAMIREZ -V I LLEGAS 4 , 5 , ANDREW J CHALL INOR 4 , MART IN G LAPPAGE 1 ,
N IGEL D BOATMAN6 , ANDREW CROWE 6 , AYENEW MELESE ENDALEW4 ,
S IMON G POTTS 2 , KATE E SOMERWILL 6 and JACOBUS C BIESMEIJER1 , 7
1School of Biology, Faculty of Biological Sciences, University of Leeds, Leeds, LS2 9JT, UK, 2School of Agriculture, Policy and
Development, Reading University, Reading, RG6 6AR, UK, 3Department of Environmental Science, Aarhus University, Roskilde
4000, Denmark, 4School of Earth and Environment, University of Leeds, Leeds, LS2 9JT, UK, 5CGIAR Research Program on
Climate Change, Agriculture and Food Security (CCAFS), Cali, DC, USA, 6Food and Environment Research Agency, Sand
Hutton, York, YO41 1LZ, UK, 7Naturalis Biodiversity Center, PO Box 9517, RA Leiden 2300, The Netherlands
Abstract
Understanding how climate change can affect crop-pollinator systems helps predict potential geographical mis-
matches between a crop and its pollinators, and therefore identify areas vulnerable to loss of pollination services. We
examined the distribution of orchard species (apples, pears, plums and other top fruits) and their pollinators in Great
Britain, for present and future climatic conditions projected for 2050 under the SRES A1B Emissions Scenario. We
used a relative index of pollinator availability as a proxy for pollination service. At present, there is a large spatial
overlap between orchards and their pollinators, but predictions for 2050 revealed that the most suitable areas for
orchards corresponded to low pollinator availability. However, we found that pollinator availability may persist in
areas currently used for fruit production, which are predicted to provide suboptimal environmental suitability for
orchard species in the future. Our results may be used to identify mitigation options to safeguard orchard production
against the risk of pollination failure in Great Britain over the next 50 years; for instance, choosing fruit tree varieties
that are adapted to future climatic conditions, or boosting wild pollinators through improving landscape resources.
Our approach can be readily applied to other regions and crop systems, and expanded to include different climatic
scenarios.
Keywords: climate change, Maxent, perennial fruit, pollination services, range shifts, species distribution models
Received 15 December 2013 and accepted 4 February 2014
Introduction
Numerous examples show how predicted climate
change will affect land suitability and crop yields; and
how increased frequency and intensity of extreme
weather events can increase fluctuations in crop yields
(Schmidhuber & Tubiello, 2007; Lobell et al., 2008;
Challinor et al., 2010; Hawkins et al., 2013). Minimizing
the negative effects that these fluctuations have on food
security, requires an understanding of the effects of
climate change on the resilience of crop growth and
yield (Fraser et al., 2013) and, where relevant, of crop-
pollinator systems. Eighty-seven of the leading global
food crops, accounting for about 35% of the global pro-
duction, benefit from animal pollination, in particular
from insects (Klein et al., 2007); yet, pollination is rarely
accounted for in projections of the impacts of climate
change on crop yields.
The importance of insect pollinators has been valued
at €153 billion to agricultural production (Gallai et al.,
2009) worldwide. The documented declines in insect
pollinators (Biesmeijer et al., 2006; Potts et al., 2010;
Carvalheiro et al., 2013) may therefore threaten food
security, which in turn may lead to an increased
demand for agricultural land (Aizen et al., 2009).
Climate change, together with land-use intensification
and the spread of alien species and diseases, is one of
the main anthropogenic pressures on insect pollinators
(Vanbergen & The Insect Pollinators Initiative, 2013).
Several authors have investigated how climate change
can affect plant-pollinator interactions (e.g. Devoto
et al., 2007; Memmott et al., 2007). Recent work by
Kuhlmann et al. (2012), for instance, has highlighted
how climate-induced range shifts of dominant bee
Correspondence: Jacobus C. Biesmeijer, tel. +31 (0)71 5687444,
fax +31 (0)71 5687666,
e-mail: [email protected]
2815© 2014 The Authors Global Change Biology Published by John Wiley & Sons Ltd.
This is an open access article under the terms of the Creative Commons Attribution License, which permits use,
distribution and reproduction in any medium, provided the original work is properly cited.
Global Change Biology (2014) 20, 2815–2828, doi: 10.1111/gcb.12577
Global Change Biology
Page 2
species are likely to affect specialized plant-pollinators
mutualisms, with negative consequences for the repro-
duction of these plants. Other studies have looked at
specific crop-pollinator systems, examining the cost of
replacing pollination service (Allsopp et al., 2008), the
predicted decline in suitable bee habitat due to climate
change (Giannini et al., 2012), and the potential envi-
ronmental suitability of nearby regions allowing the
persistence of crop-pollinators mutualisms (Giannini
et al., 2010, 2011).
Understanding how climate change will affect
crop-pollinator systems helps highlight areas poten-
tially vulnerable to pollinator shortage, or predict
potential geographical mismatches between crops and
their pollinators. Similarly, such information can be
used to identify areas suitable for the persistence of
both the crop and its wild pollinators, or direct local
interventions to boost pollination service, thereby
strengthening food security.
In this study, we examined the impact of projected
climate change on the distribution and likelihood of
occurrence of commercial orchards and their pollina-
tors in Great Britain (GB). Commercial orchards (orch-
ards hereafter) occupy about 19 000 ha in UK, which
equates to nearly 13% of the total area dedicated to the
production of fruit and vegetables. Of the area used for
fruit production, orchards occupy 65.5%, with the
remainder used for the production of soft fruits, such
as strawberries. The major products of orchards in the
UK are apples, pears, plums and cherries, with dessert
apples alone accounting for nearly 28% of the planted
area and having a net value of £70 million annually
(Department for Environment, Food & Rural Affairs,
2013). Bees and hoverflies are the predominant pollen
vectors for these plants (Klein et al., 2007). To ensure
marketable fruits, therefore, it is important that the
activity of pollinators overlaps spatially and temporally
with the flowering period of the fruit trees.
Here, we used the projected climate for 2050 from the
SRES A1B Emissions Scenario (Naki�cenovi�c et al., 2000)
to estimate the nation-wide environmental suitability
for orchard species and their pollinators. Recent trajec-
tories of greenhouse gas emissions are higher than
those considered under the SRES A1B (Raupach et al.,
2007), so the projections used here may be interpreted
as conservative estimates of climate change. We used
present day distributional data to characterize the
climatic conditions most favourable to the orchard
species and to their pollinators. We excluded land-
cover/land-use information, since its distribution can-
not readily be predicted with sufficient certainty
beyond the current time. We then projected the poten-
tial distribution of orchards and pollinators, on the
basis of the climate projected for 2050, and derived a
relative measure of pollination service available to
orchards for present and future conditions. This
approach allowed us to highlight changes in environ-
mental suitability which may threaten the persistence
of the orchard-pollinator system, and identify geo-
graphical mismatches between orchards and pollina-
tors potentially affecting pollination service provision.
We used this information to suggest appropriate inter-
vention measures which could be used to mitigate
against future loss of pollination services to orchards.
Materials and methods
Overview
We used the species distribution model (SDM) Maxent, (Phil-
lips et al., 2006; Aguirre-Guti�errez et al., 2013; Polce et al.,
2013) to predict the distributions of orchards and pollinators
in relation to climatic conditions. Pollinator and orchard data
were collected using different methodologies, thus requiring
different modelling approaches; we describe these datasets in
the following subsections ‘Pollinator data’ and ‘Orchard data’
respectively. Details of the climate data used to characterize
the environmental space of orchards and pollinators are pro-
vided in the subsection ‘Climate data’. We modelled pollina-
tor species individually, using available records to predict
current potential distribution and then future projections. We
modelled future distribution of orchard species as an entire
category since information on orchard composition was not
available from the current agricultural survey data. The model
settings for pollinator species and orchards are described sep-
arately, under ‘Distribution models’. We then describe how
we used the outputs from the SDMs to identify:
1. The climatic predictors that contributed most to the final
models (subsection ‘Contribution of predictors’).
2. How the climatic predictors for the pollinators and orch-
ards are projected to change in 2050 (subsection ‘Similari-
ties between current and predicted climate’).
3. An index of relative pollinator availability to orchards,
which we used as a proxy for potential pollination service
(subsection ‘Pollinator availability’).
Pollinator data
We used presence-only sightings of wild bees and hoverflies
recorded in GB within the period 2000–2010 (‘Bees, Wasps
and Ants Recording Society’, BWARS, http://www.bwars.
com/; ‘Hoverfly Recording Scheme’, HRS, http://www.
hoverfly.org.uk/). On the basis of literature (Free, 1993; Marini
et al., 2012) and knowledge gained by our team members dur-
ing the past years of pollinator-related field projects (e.g.
http://www.reading.ac.uk/caer/Project_IPI_Crops/project_
ipi_crops_index.html; http://www.step-project.net/; http://
www.alarmproject.net/alarm/; all accessed February 2014),
we selected 22 species of wild bees and 8 species of hoverflies,
© 2014 The Authors Global Change Biology Published by John Wiley & Sons Ltd., 20, 2815–2828
2816 C. POLCE et al.
Page 3
known to be visitors of fruit trees and therefore potential
pollinators of orchard crop flowers in GB. The spatial resolu-
tion of the records varied from 100 m2 to 4 km2. We aggre-
gated all sightings for each species on the 25 km2 grid (5 by
5 km cells) and removed any duplicate records, so that for
each species, there was at the most one entry per grid cell. The
number of available records per bee species ranged from 26 to
2096 (mean � SD = 650 � 580; median = 471); records per
hoverfly species ranged from 150 to 1981 (mean � SD =1032 � 616; median = 1033). Pollinator species and numbers
of records are listed in the Data S1 (Table S1 in Data S1).
Orchard data
The current distribution of orchards was derived from the
2010 Defra June Agricultural Survey (http://www.defra.gov.
uk/statistics/foodfarm/landuselivestock/junesurvey/junesur
veyresults/). Orchards included areas of at least 1 ha, planted
with top fruit such as apples, cherries, pears, plums and nuts
(walnuts and hazelnuts mainly); their distribution was origi-
nally mapped on a grid of 2 9 2 km cells (‘tetrads’) and
included information on the extent of the orchards within each
tetrad. We superimposed a 5 9 5 km grid onto the crop tetr-
ads, proportionally allocating each tetrad’s orchard extent to
the overlapping 5 km grid cell(s). The final extent of the orch-
ards within each cell was the sum of the proportional extent
from all tetrads intersecting the cell. Of the 9726 grid cells
used to represent GB, around 14% contained orchards (1354),
with a total mapped extent greater than 12 200 ha. The differ-
ence between the Defra figures for orchards and the actual
mapped hectares are due to insufficient spatial information
for some of the orchard fields to be mapped.
Climate data
We used total annual precipitation and monthly minimum
and maximum temperature to derive a set of environmental
descriptors commonly used in species distribution models
(e.g. Hijmans & Graham, 2006; Warren et al., 2010; Warren
et al., 2013; Wolmarans et al., 2010): growing degree days
greater than 5 °C (GDD5, used only for crop), calculated fol-
lowing Sork et al. (2010); and 19 bioclimatic variables (Hijmans
et al., 2005, 2011). This choice reflected the need to satisfy two
main criteria: the same predictors needed to be available for
both the present and the future projections; they needed to be
relevant for the modelled group. The three input variables
were obtained from UKCP09 (http://www.metoffice.gov.uk/
climatechange/science/monitoring/ukcp09/). Baseline data
for pollinator distribution models were made of the 25 km2
gridded monthly averages for the decade 1990–1999, while for
the orchard distribution model, we used gridded data for the
30 year period 1977–2006 (the most recent available complete
30 year period). We used a longer time series for orchard
crops, to reflect the longer life cycle of fruit trees compared to
insect pollinators. Future projections of monthly averages
were derived from the UKCP09 projections (Murphy et al.,
2010) for the SRES A1B storyline (‘Medium’ Emissions Sce-
nario, as referred in the UKCP09 report). We used the 30 year
period from 2040 to 2069; we will refer to the baseline data as
the ‘Present’ and to the future projections as the ‘M2050’.
These data are located on a rotated-pole grid with a spatial
resolution of approximately 25 by 25 km. We rescaled them to
the 5 9 5 km British National Grid, to match the orientation
and resolution of the baseline data. Additional information on
this dataset and details of the rescaling procedure are pro-
vided in the Data S1 (Data S1, Material and Methods, ‘Climate
data for future projections’).
All the variables were computed within R (R Development
Core Team, 2011). To minimize colinearity between predictors
(Guisan & Thuiller, 2005), subsets were created for pollinators
and orchards. For pollinators, due to lack of a general set of
commonly used variables, we used Jolliffe’s Principal Compo-
nent Analysis with the rejection method ‘B2’ and k0 = 0.70
(Jolliffe, 1972, 1973); we reduced the original set to six predic-
tors (Table 1). For orchards, we based the choice on literature
(Thuiller, 2004; Termansen et al., 2006; Sork et al., 2010; Frank-
lin et al., 2013; Warren et al., 2013), and we selected five pre-
dictors (Table 1). The Pearson’s correlation between the
selected crop and pollinator variables is reported in the Data
S1 (Data S1, Material and Methods, ‘Correlation between
selected climatic predictors’, Tables S2 to S5).
Distribution models
Pollinator distribution models. Detailed settings for the Max-
ent pollinators’ distribution models (PDM) follow Polce et al.
(2013) and are summarized in the Data S1 (Data S1, Material
and Methods, ‘Pollinator distribution model’). Model training
and testing was performed through 10-fold cross-validation,
and ‘10th percentile of training presence’ was used as a
threshold to convert probability of occurrence into binary pre-
dictions (‘presence-absence maps’). We chose this threshold
since it retains as suitable environmental conditions, those
characterizing 90% of the training locations, thus excluding
records that were found at the extreme of the species’ suitable
environment. We assumed unlimited dispersal capability for
each species, but we restricted the predicted presence to areas
where all 10 model runs had predicted ‘presence’; we
assigned average probability of occurrence (p) to these areas,
and ‘absence’ outside them.
We assessed the models using the Area Under the Receiver
Operating Characteristic Curve (AUC), which, despite known
assumptions and limitations (Termansen et al., 2006; Austin,
2007), is commonly used as a threshold-independent measure of
model performance within SDMs. With presence-only data such
as the pollinators’ sightings, the maximum achievable AUC is
<1 (Wiley et al., 2003) so standard thresholds for evaluating
goodness of fit do not apply. Instead, we followed Raes & ter
Steege (2007) and we compared the average AUC value of each
species PDM (AUCPDM) with the average AUC value of a set of
null models (AUCNM) where species records were replaced by
randomly chosen locations. We expected AUCPDM > AUCNM.
Orchard distribution models. After running Maxent models
using different feature classes (i.e. including different possible
relationships between species data and climate variables from
© 2014 The Authors Global Change Biology Published by John Wiley & Sons Ltd., 20, 2815–2828
ORCHARDS AND POLLINATORS CLIMATE-DRIVEN SHIFT 2817
Page 4
linear to hinge to quadratic) to predict present orchards distri-
butions, we retained the models that used hinge features,
which were then used to predict orchards’ future probability of
occurrence. For the orchard distribution model (ODM), Maxent
was trained on 75% sample points, and the remainder was
used for testing. This procedure was repeated 10 times. We
used areas where at least seven model runs had predicted pres-
ence (based on the ‘10th percentile of training presence’), to
indicate suitable conditions for crop growing under the M2050
scenario, and assigned to these areas the average probability of
occurrence obtained from the 10 model runs. We used a more
relaxed criterion for orchards than pollinators (7 vs. 10 model
runs to indicate presence), to account for the fact that orchards
are a managed resource and so can overcome some of the barri-
ers which would prevent colonization and establishment of
wild organisms such as the pollinators that were modelled.
Contribution of different predictors to distribution models
The contribution of each predictor to the final PDMs and
ODM was derived from the drop in AUC observed after per-
muting the values of each variable with those of the back-
ground, with larger drops indicating that the model depended
heavily on that variable (Data S1, Material and Methods, ‘Con-
tribution of different predictors’). Average and confidence
interval for the observed drops were derived through 10 000
bootstrap replicates.
We used a linear mixed effects model (Pinheiro et al., 2013)
to test if the contribution of different predictors differed
between pollinator species and/or model runs. We used
predictors as fixed factors and model run as a random factor.
Model run was nested within species and group (bees or
hoverflies) when analysing the results from the PDM. Multiple
pairwise comparisons of different predictors were then
performed using Tukey’s post hoc test for a general linear
hypothesis (Hothorn et al., 2013).
Similarities between current and predicted climate
The PDM and ODM were required to predict conditions not
sampled in training data. Computing the similarity between
conditions at training locations and conditions where predic-
tions are to be made can be done within Maxent, through
Multivariate Environmental Similarity Surfaces (MESS) (Elith
et al., 2010). MESS measure the similarity of any given point to
a set of reference points, for each model predictor. The lowest
similarity obtained for that point is used as the point’s MESS.
Negative values indicate conditions that are outside the range
of references values, while positive values indicate greater
similarity to the set of reference points, with 100 assigned to a
point not novel at all (i.e. having a predicted value within the
range of reference points). In addition to mapping the MESS
across the region of interest (GB), an accompanying map also
showed, at any given location, the variable that drove the
MESS. We used these two maps to spatially quantify predicted
climatic changes.
Pollinator availability
We used pollinator availability (PA) as a proxy for pollination
service. Pollinator availability resulted from the contribution
of each species probability of occurrence predicted by the
Maxent model. We assumed that all pollinator species are
equally efficient in pollinating orchard flowers. For each grid
cell, where the presence of orchards was predicted or
observed, PA was defined as:
PAm ¼Ps
s¼1 psmS
ð1Þ
Where: PAm = pollinator availability to the orchards in grid
cell m, resulting from all pollinator species; psm = Maxent
probability of occurrence for species s on cell m; S = total
number of pollinator species. Eqn 1 is loosely based on
Table 1 Variables used for orchards and pollinators distribution modelling. The table shows the final set of predictors used to
model the distribution of orchards (ODM) and pollinators (PDM). The selection of predictors was based on several criteria, includ-
ing their use in published literature and minimizing multicollinearity
Original
code Definition Abbreviation Model
Bio03 *Isothermality Isoth PDM
Bio04 Temperature Seasonality (SD 9 100) TSeasSD ODM
Bio06 Min Temperature of Coldest Month mTCM ODM
Bio07 Temperature annual range TAR PDM
Bio08 Mean Temperature of Wettest Quarter MTWQ ODM
Bio09 Mean temperature of driest quarter MTDQ PDM; ODM
Bio11 Mean temperature of coldest quarter MTCQ PDM
Bio15 Precipitation seasonality
(Coefficient of variation)
RainSeasCV PDM
Bio18 Precipitation of Warmest Quarter RainWQ ODM
Bio19 Precipitation of coldest quarter RainCQ PDM
*Isothermality = Mean diurnal range/Temperature annual range 9 100. Isothermality quantifies how large is the day-to-night tem-
perature oscillation in comparison to the summer-to-winter oscillation, with 100 representing a site where the diurnal temperature
range is equal to the annual temperature range.
© 2014 The Authors Global Change Biology Published by John Wiley & Sons Ltd., 20, 2815–2828
2818 C. POLCE et al.
Page 5
Lonsdorf et al.(2009) and Polce et al. (2013), with the main dif-
ference being that the weighted term allowing pollinators to
reach an orchard located on neighbouring cells is excluded, as
the model resolution is coarser than the typical pollinator
foraging distance.
We used Eqn 1 to derive the PA where:
• Orchards are currently present: the baseline PA;
• Orchards are predicted to occur based on the M2050 future
scenario: to assess whether the most suitable areas for fruit
trees are also suitable for their pollinators;
• Orchards are currently present, but climatic conditions are
those predicted for M2050: to derive the difference in PA
between the present and the M2050 scenario, assuming that
fruit trees can continue to persist where currently present,
despite changes in climatic conditions.
Results
Climate and bioclimatic variables
Plotting the climatic variables used for pollinators and
crop models highlighted any distributional difference
in the predictor values between Present and M2050
(Figure S1 in Data S1). We identified three patterns: (i)
No major differences in range of values or distribution;
(ii) Similar distribution with systematic shift; (iii)
Change in the mean and the shape of the distribution.
Table 2 groups the predictors according to the observed
change.
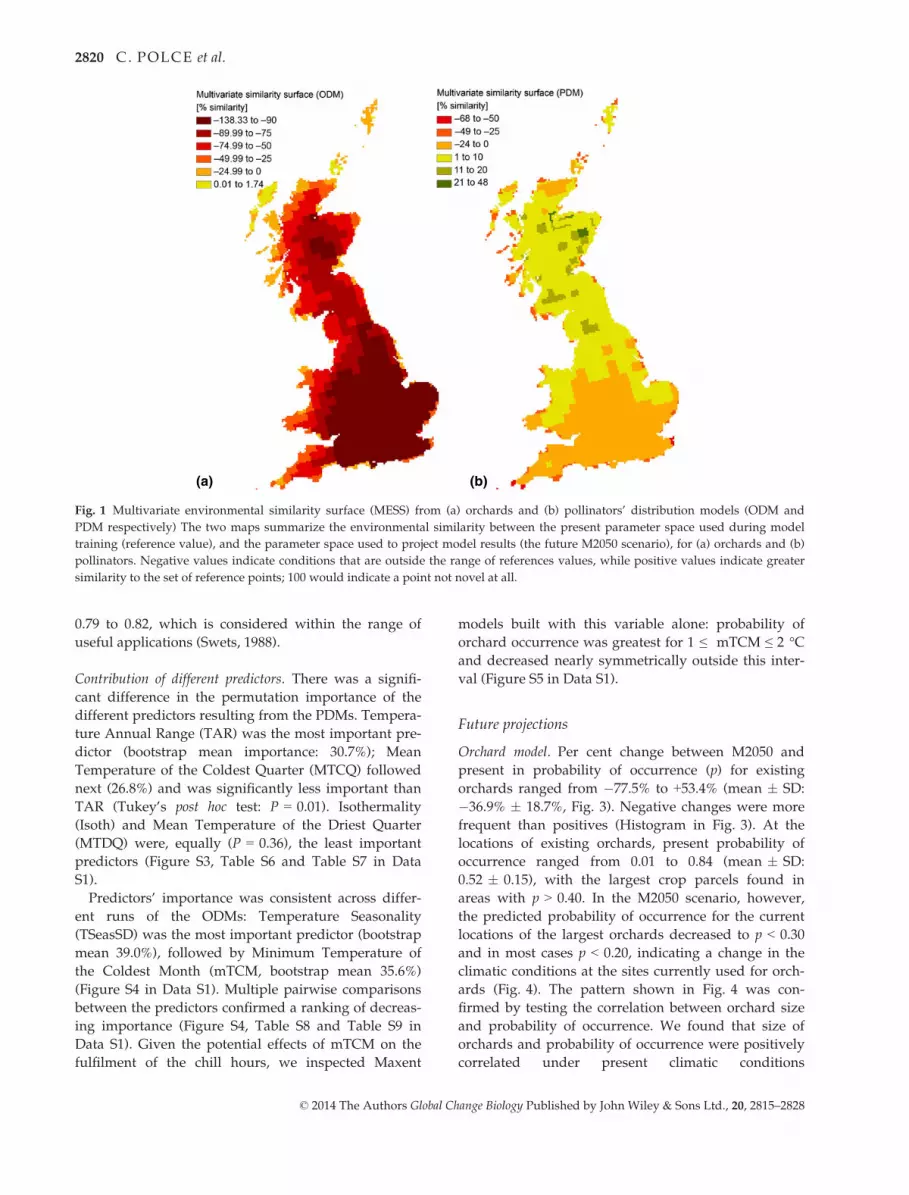
The environmental similarities between the parame-
ter space used during model training and the parame-
ter space used for the M2050 projections are
summarized in Fig. 1 and Fig. 2. The two maps in
Fig. 1 show the MESS: they have to be read in relation
to the predictors used to build the model, hence the dif-
ferences between the orchards- and pollinators-MESS.
The pattern of the orchards-MESS reveals a latitudinal
gradient, with dissimilarity increasing southwards, and
coastal areas generally holding environmental condi-
tions within the present range (Fig. 1a). With between
species subtle differences in the decimal values, the
pollinators-MESS showed a zoned similarity, with
novel climate concentrated in the South and often along
the coast (Fig. 1b).
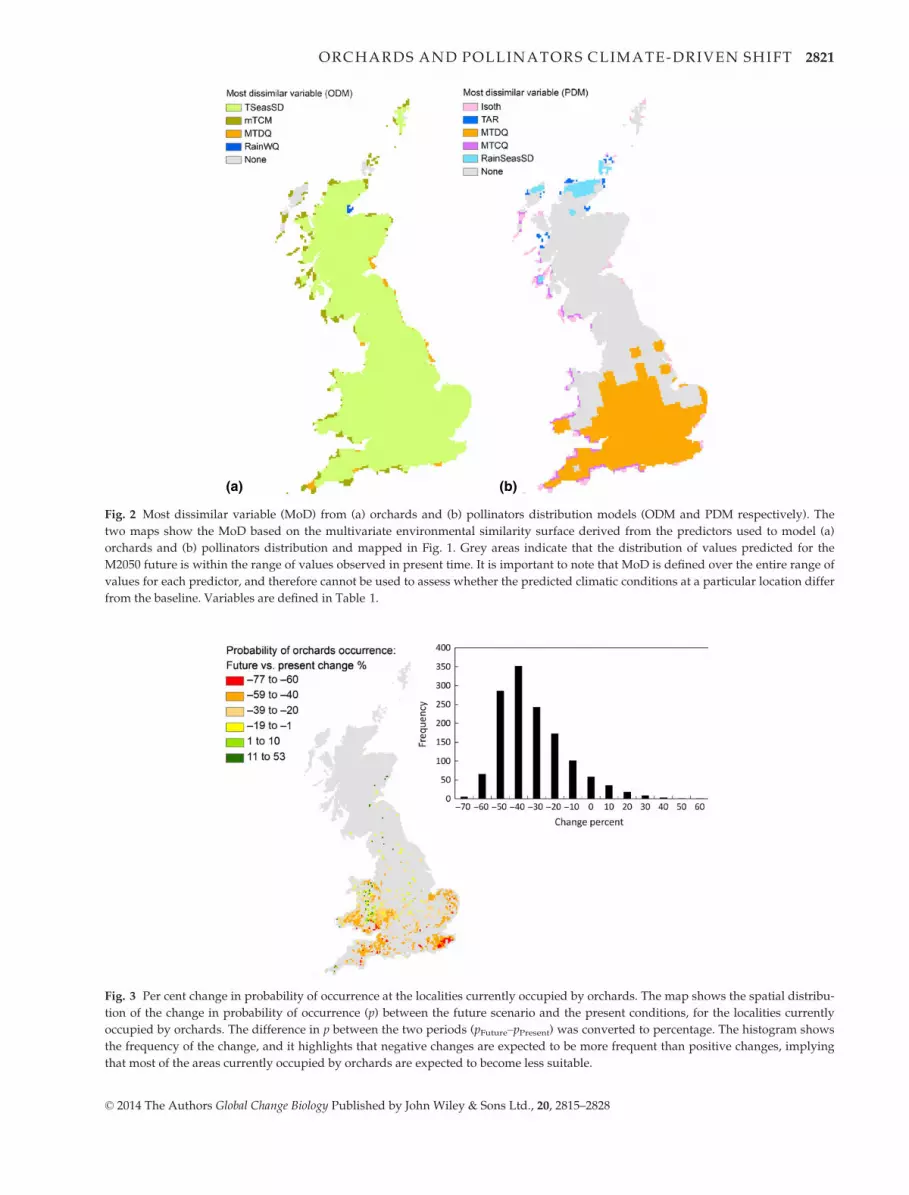
The most dissimilar variable at any given locality
across the orchards- and pollinators-MESS is shown
in Fig. 2. The most dissimilar variable from the orch-
ards-MESS was Temperature Seasonality (TSeasSD) in
almost the entire region (92%), while the area that
had not experienced shifts in the parameter space
summed to only 2% (Fig. 2a). The most dissimilar
variable derived from the pollinators-MESS showed a
different pattern: the vast majority (55%) of the area
was characterized by climatic conditions within the
present range. For areas characterized by novel cli-
matic conditions (novel in relation to the training
points), Mean Temperature of the Driest Quarter
(MTDQ) was the most dissimilar variable, covering
the Southern part of the region, for 36% of the total
extent (Fig. 2b).
Pollinator and crop distribution models
Model performance. Pollinators distribution models pro-
vided a significantly better fit than expected by chance
alone for all the species: AUC of model testing ranged
from 0.57 to 0.92 (average AUC = 0.72), while null
model AUC ranged from 0.48 to 0.51 (average
AUC = 0.49) (Figure S2 in Data S1). A similar pattern
was observed for the model training AUC. ODMs ren-
dered average model testing AUC = 0.80, varying from
Table 2 Qualitative assessment of the changes observed
between present and future climatic predictors. The table
groups the climatic predictors according to the changes
observed between present and M2050 projections. Three main
types of changes were identified (in Italics). Climatic predic-
tors are defined in Table 1
Observed change Characteristics of the future projections
No major differences
MTCQ
TAR
RainWQ
Similar distribution
with systematic shift
mTCM Warmer
MTWQ Warmer
TSeas Twice as big
Change in the mean
and the shape of the
distribution
Isoth Expanded to include lower values,
indicating areas with a greater
difference between the diurnal
temperature range and the
summer-to-winter oscillations
MTDQ Changed from a normal distribution
towards a bimodal distribution, with
a small peak towards lower
temperature, and a greater one
towards temperature 5 degrees higher
than then present mean
RainSeas Changed from having two peaks and a
trough to having one peak, around
the values currently characterized by
the trough (i.e. 25%), indicating a
greater number of sites with similar
rainfall pattern
© 2014 The Authors Global Change Biology Published by John Wiley & Sons Ltd., 20, 2815–2828
ORCHARDS AND POLLINATORS CLIMATE-DRIVEN SHIFT 2819
Page 6
0.79 to 0.82, which is considered within the range of
useful applications (Swets, 1988).
Contribution of different predictors. There was a signifi-
cant difference in the permutation importance of the
different predictors resulting from the PDMs. Tempera-
ture Annual Range (TAR) was the most important pre-
dictor (bootstrap mean importance: 30.7%); Mean
Temperature of the Coldest Quarter (MTCQ) followed
next (26.8%) and was significantly less important than
TAR (Tukey’s post hoc test: P = 0.01). Isothermality
(Isoth) and Mean Temperature of the Driest Quarter
(MTDQ) were, equally (P = 0.36), the least important
predictors (Figure S3, Table S6 and Table S7 in Data
S1).
Predictors’ importance was consistent across differ-
ent runs of the ODMs: Temperature Seasonality
(TSeasSD) was the most important predictor (bootstrap
mean 39.0%), followed by Minimum Temperature of
the Coldest Month (mTCM, bootstrap mean 35.6%)
(Figure S4 in Data S1). Multiple pairwise comparisons
between the predictors confirmed a ranking of decreas-
ing importance (Figure S4, Table S8 and Table S9 in
Data S1). Given the potential effects of mTCM on the
fulfilment of the chill hours, we inspected Maxent
models built with this variable alone: probability of
orchard occurrence was greatest for 1 ≤ mTCM ≤ 2 °Cand decreased nearly symmetrically outside this inter-
val (Figure S5 in Data S1).
Future projections
Orchard model. Per cent change between M2050 and
present in probability of occurrence (p) for existing
orchards ranged from �77.5% to +53.4% (mean � SD:
�36.9% � 18.7%, Fig. 3). Negative changes were more
frequent than positives (Histogram in Fig. 3). At the
locations of existing orchards, present probability of
occurrence ranged from 0.01 to 0.84 (mean � SD:
0.52 � 0.15), with the largest crop parcels found in
areas with p > 0.40. In the M2050 scenario, however,
the predicted probability of occurrence for the current
locations of the largest orchards decreased to p < 0.30
and in most cases p < 0.20, indicating a change in the
climatic conditions at the sites currently used for orch-
ards (Fig. 4). The pattern shown in Fig. 4 was con-
firmed by testing the correlation between orchard size
and probability of occurrence. We found that size of
orchards and probability of occurrence were positively
correlated under present climatic conditions
(a) (b)
Fig. 1 Multivariate environmental similarity surface (MESS) from (a) orchards and (b) pollinators’ distribution models (ODM and
PDM respectively) The two maps summarize the environmental similarity between the present parameter space used during model
training (reference value), and the parameter space used to project model results (the future M2050 scenario), for (a) orchards and (b)
pollinators. Negative values indicate conditions that are outside the range of references values, while positive values indicate greater
similarity to the set of reference points; 100 would indicate a point not novel at all.
© 2014 The Authors Global Change Biology Published by John Wiley & Sons Ltd., 20, 2815–2828
2820 C. POLCE et al.
Page 7
(a) (b)
Fig. 2 Most dissimilar variable (MoD) from (a) orchards and (b) pollinators distribution models (ODM and PDM respectively). The
two maps show the MoD based on the multivariate environmental similarity surface derived from the predictors used to model (a)
orchards and (b) pollinators distribution and mapped in Fig. 1. Grey areas indicate that the distribution of values predicted for the
M2050 future is within the range of values observed in present time. It is important to note that MoD is defined over the entire range of
values for each predictor, and therefore cannot be used to assess whether the predicted climatic conditions at a particular location differ
from the baseline. Variables are defined in Table 1.
Fig. 3 Per cent change in probability of occurrence at the localities currently occupied by orchards. The map shows the spatial distribu-
tion of the change in probability of occurrence (p) between the future scenario and the present conditions, for the localities currently
occupied by orchards. The difference in p between the two periods (pFuture–pPresent) was converted to percentage. The histogram shows
the frequency of the change, and it highlights that negative changes are expected to be more frequent than positive changes, implying
that most of the areas currently occupied by orchards are expected to become less suitable.
© 2014 The Authors Global Change Biology Published by John Wiley & Sons Ltd., 20, 2815–2828
ORCHARDS AND POLLINATORS CLIMATE-DRIVEN SHIFT 2821
Page 8
(q = 0.153), but negatively correlated for the M2050 sce-
nario (q = �0.233). Both correlations were significant
based on 9999 samples with replacement taken at ran-
dom from the two distributions (Figure S6 in Data S1).
The predicted probability of occurrence for orchards
in M2050 from the average of 10 model runs ranged
from 0.01 to 0.69, with the highest values in the Wes-
tern part of GB, in areas currently not occupied by
orchards. If we only include regions where at least
seven of the 10 model runs have predicted crop pres-
ence, the minimum probability of occurrence becomes
0.32, while the maximum remains unchanged (Fig. 5).
These regions, chosen by the vast majority of the
model runs, were taken as the most likely locations for
fruit tree production under the M2050 scenario (i.e.
those with most suitable climate; soil and other grow-
ing conditions may still be limiting) for subsequent
estimates of the service provision. In addition, the min-
imum probability of occurrence found for these
regions (0.32) was within 2 SD of the mean obtained at
the localities of orchards based on current predictions
(mean–2SD: 0.22).
Pollinator models. Pollinators distribution models
predicted a range expansion for 20 species and range
contraction for 10 species. Range expansion varied from
8% to 165% (Andrena haemorroa and Megachile maritima
respectively); range contraction varied from 1% to 99%
(Osmia bicornis and O. bicolor respectively) (Fig. 6). The
overall mean and median were 18% and 33% respec-
tively, indicating a greater change in the direction of
range expansion than in range contraction.
The areas with greatest species richness (SR) were
predicted to occur in a large part of Southern GB for
present time (SR = 25–30); for the M2050 only a small
area in the Eastern part of the country was predicted to
Fig. 4 Current orchards’ extent in relation to current and pre-
dicted probability of occurrence based on climate suitability.
Current extent measured in hectares is mapped with propor-
tional symbols, using five intervals from <1 ha to 324 ha. The
map suggests that most of the largest orchards are currently in
areas where the model has predicted probability of occurrence
(p) > 0.4, while the same orchards will be in areas with future
p < 0.3 and in most cases p < 0.2. The red line marks where cur-
rent p = future p and highlights that the predicted environmen-
tal suitability for larger orchards is lower than the current one.
(a) (b) (c)
Fig. 5 Current orchards locations and future probability of occurrence. From left to right: the first map (a) shows the locations of the
current orchards. The second map (b) shows the orchards’ average probability of occurrence (p) in the M2050 future, as predicted from
10 model runs. The third map (c) indicates the average p for areas where at least seven of the 10 model runs have predicted crop pres-
ence, based on the threshold defined in the main text.
© 2014 The Authors Global Change Biology Published by John Wiley & Sons Ltd., 20, 2815–2828
2822 C. POLCE et al.
Page 9
reach a similar richness (SR = 25–29) (Fig. 7). In addi-
tion, comparing the predicted SR for the two periods,
revealed an area of greatest species loss in the Western
part of GB (11–21 species lost), and an extensive area
with the opposite trend along the East coast (11–21 spe-
cies gained). The largest areas where SR did not change
were in the Northern part of GB, mainly in the Eastern
and Western part of Scotland.
Pollinator availability. The present pollination availabil-
ity (PA) ranged from 0 (absence of pollinator) to 0.48
(Fig. 8a and Figure S7 in Data S1): complete absence of
pollinators for crops was predicted for <1% of the horti-
cultural areas (Fig. 9) and was localized mainly in the
Western part of Wales; 73% of the area was predicted
within the range 0.06 ≤ PA ≤ 0.35, while the highest
class of PA (0.35 < PA ≤ 0.5) was predicted for 19% of
the areas, mainly in the Southern part of GB. The PA to
orchards for the locations predicted by the M2050 sce-
nario ranged again from 0 to 0.48 (Fig. 8b and Figure S8
in Data S1), but its distribution differed from present.
Absence of PA characterized 7% of the horticultural
areas (Fig. 9) and was mainly localized along the
North-west coast (Scotland); the majority of the area
(89%) was predicted to have 0.01 ≤ PA ≤ 0.2, along the
central and Western part of the country. The highest
class of PA was only predicted for 1% of the potential
future horticultural areas, which was made up of a few
isolated fragments. The last scenario shows the PA
available for M2050, but at the locations where orchards
are currently planted. PA ranged from 0.01 to 0.77
(Fig. 8c and Figure S9 in Data S1) indicating a change
in the pollinator distribution from the present patterns.
All the orchards were predicted to be exposed to pollin-
ators, and thus to potentially benefit from their service.
The class of PA corresponding to the highest currently
Fig. 6 Predicted change in species’ range. Per cent change is
obtained by comparing each species’ predicted future range to
its current range, under a universal expansion hypothesis (i.e.
no barriers to expansion). Negative values indicate loss of suit-
able areas (i.e. range contraction) while positive value indicate
gain of areas (i.e. range expansion). Within each group (bees,
hoverflies), species are listed alphabetically, with the dot sepa-
rating the first three letters of the genus from the first three and
last two letters of the species.Fig. 7 Change in species richness between current and future
predictions. The maps in the inset show the predicted number
of pollinator species, based on the Maxent models. Species rich-
ness (SR) was predicted within the range of 0–30 for present,
and 0–29 for the M2050 scenario. SR is displayed using intervals
and coloured using blue shades for areas with lower SR (i.e.
diversity cold spots) to green shades for areas with higher SR
(i.e. diversity hot spots). The larger map shows the change in
SR, resulting from comparing the predicted SR for the two peri-
ods. Gains of species are mapped in green, with darker shades
indicating greater species gain. Losses of species are mapped in
red, with darker shades indicating greater species loss. Grey
indicates areas where SR was not predicted to change.
© 2014 The Authors Global Change Biology Published by John Wiley & Sons Ltd., 20, 2815–2828
ORCHARDS AND POLLINATORS CLIMATE-DRIVEN SHIFT 2823
Page 10
predicted (0.36–0.5) occupied 53% of the area (Fig. 9),
while it was 1% for present conditions. An even greater
PA, namely 0.51 < PA < 0.8 was predicted for 22% of
the area, generally corresponding to the regions cur-
rently receiving the greatest PA (the Southern part of
GB). However, looking at the future orchards, p shown
in Fig. 8d reveals that these areas are characterized by
low p, indicating that the climatic conditions may not
favour crop growth.
Discussion
It has been widely documented that shifts in species
ranges are correlated with climatic change (Parmesan &
Yohe, 2003; Root et al., 2003; Chen et al., 2011). By act-
ing on the distribution and survival of single species,
climate change is likely to affect ecosystem functions
and, as a result, the provisioning of ecosystem services.
In this study, we examined the potential consequences
of climate change for pollination services as provided
by an array of 22 bee and 8 hoverfly species known to
be frequent visitors of orchards in Great Britain.
Changes in climatic conditions can affect plant-pollina-
tor interaction networks in several ways (Hegland et al.,
2009), for instance by causing phenological mismatches
(a) (b) (c) (d)
Fig. 8 Pollinator availability for different scenarios of orchards distribution and climatic conditions. Pollinator availability (PA) is used
as a proxy for pollination service, and measured with a relative index from 0 to 1. PA is mapped from red to green using intervals. Red
is used only to indicate areas where PA is predicted to be 0 (i.e. where pollinators are predicted to be absent). The first map (a) shows
the PA currently available to orchards. The second map (b) shows the future PA for areas most suitable to orchards based on the
M2050 scenario. The third map (c) shows the PA predicted where orchards are currently planted, but based on the pollinator availabil-
ity for M2050. The smaller map (d) shows the probability of occurrence (ρ) for orchards, based on the M2050 climatic conditions. Darker
areas indicate greater p: this map suggests that, under future climatic conditions, ρ for areas where orchards are currently planted is
predicted to be low.
Fig. 9 Distribution of classes of pollinator availability. Bars
show the distribution of classes of pollinator availability (PA)
mapped in Fig. 8, according to their per cent frequency. Fre-
quency was defined as the number of grid cell characterized by
a certain PA. Black bars represent current PA; light grey show
the PA for areas where orchards have the greatest probability of
occurrence based on the future scenario M2050; dark grey show
the PA based on climatic conditions predicted for M2050 but for
areas where orchards are currently planted.
© 2014 The Authors Global Change Biology Published by John Wiley & Sons Ltd., 20, 2815–2828
2824 C. POLCE et al.
Page 11
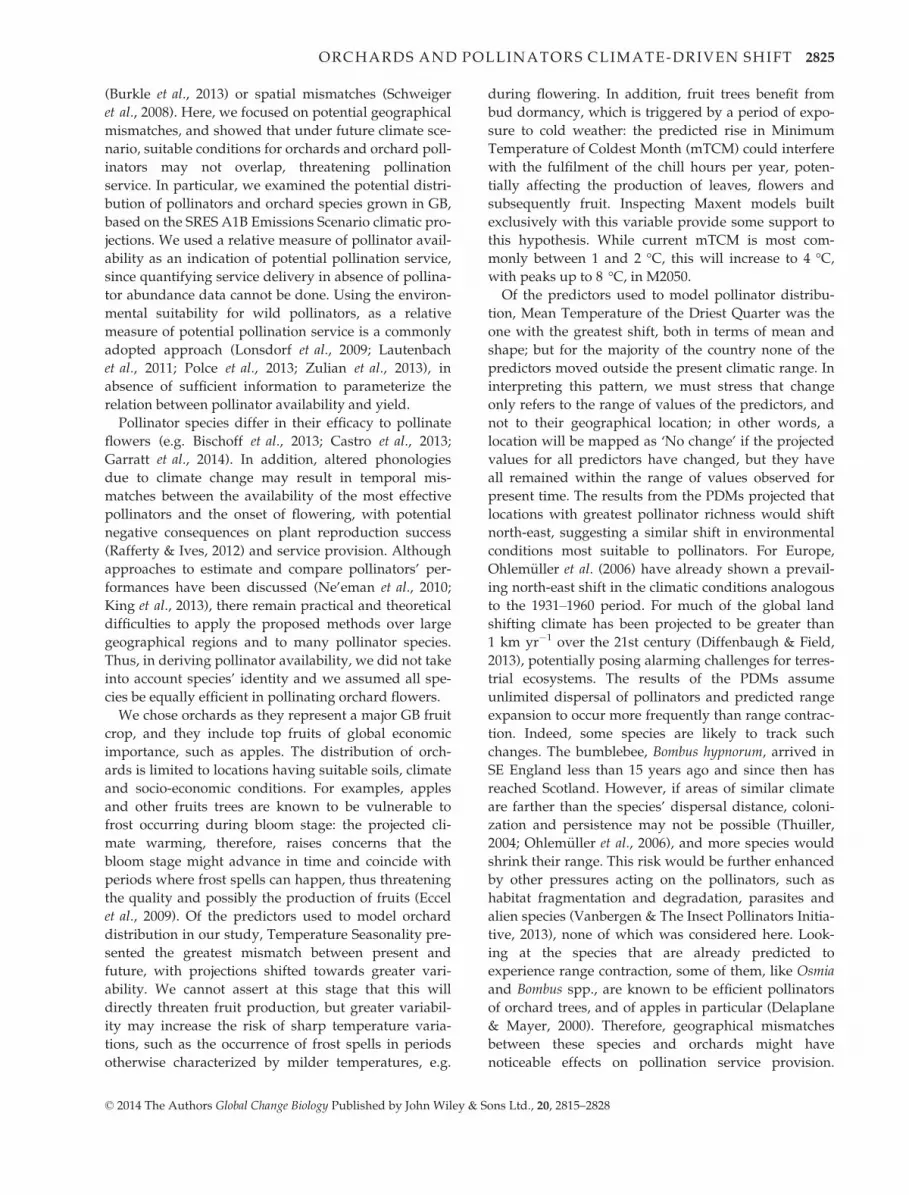
(Burkle et al., 2013) or spatial mismatches (Schweiger
et al., 2008). Here, we focused on potential geographical
mismatches, and showed that under future climate sce-
nario, suitable conditions for orchards and orchard poll-
inators may not overlap, threatening pollination
service. In particular, we examined the potential distri-
bution of pollinators and orchard species grown in GB,
based on the SRES A1B Emissions Scenario climatic pro-
jections. We used a relative measure of pollinator avail-
ability as an indication of potential pollination service,
since quantifying service delivery in absence of pollina-
tor abundance data cannot be done. Using the environ-
mental suitability for wild pollinators, as a relative
measure of potential pollination service is a commonly
adopted approach (Lonsdorf et al., 2009; Lautenbach
et al., 2011; Polce et al., 2013; Zulian et al., 2013), in
absence of sufficient information to parameterize the
relation between pollinator availability and yield.
Pollinator species differ in their efficacy to pollinate
flowers (e.g. Bischoff et al., 2013; Castro et al., 2013;
Garratt et al., 2014). In addition, altered phonologies
due to climate change may result in temporal mis-
matches between the availability of the most effective
pollinators and the onset of flowering, with potential
negative consequences on plant reproduction success
(Rafferty & Ives, 2012) and service provision. Although
approaches to estimate and compare pollinators’ per-
formances have been discussed (Ne’eman et al., 2010;
King et al., 2013), there remain practical and theoretical
difficulties to apply the proposed methods over large
geographical regions and to many pollinator species.
Thus, in deriving pollinator availability, we did not take
into account species’ identity and we assumed all spe-
cies be equally efficient in pollinating orchard flowers.
We chose orchards as they represent a major GB fruit
crop, and they include top fruits of global economic
importance, such as apples. The distribution of orch-
ards is limited to locations having suitable soils, climate
and socio-economic conditions. For examples, apples
and other fruits trees are known to be vulnerable to
frost occurring during bloom stage: the projected cli-
mate warming, therefore, raises concerns that the
bloom stage might advance in time and coincide with
periods where frost spells can happen, thus threatening
the quality and possibly the production of fruits (Eccel
et al., 2009). Of the predictors used to model orchard
distribution in our study, Temperature Seasonality pre-
sented the greatest mismatch between present and
future, with projections shifted towards greater vari-
ability. We cannot assert at this stage that this will
directly threaten fruit production, but greater variabil-
ity may increase the risk of sharp temperature varia-
tions, such as the occurrence of frost spells in periods
otherwise characterized by milder temperatures, e.g.
during flowering. In addition, fruit trees benefit from
bud dormancy, which is triggered by a period of expo-
sure to cold weather: the predicted rise in Minimum
Temperature of Coldest Month (mTCM) could interfere
with the fulfilment of the chill hours per year, poten-
tially affecting the production of leaves, flowers and
subsequently fruit. Inspecting Maxent models built
exclusively with this variable provide some support to
this hypothesis. While current mTCM is most com-
monly between 1 and 2 °C, this will increase to 4 °C,with peaks up to 8 °C, in M2050.
Of the predictors used to model pollinator distribu-
tion, Mean Temperature of the Driest Quarter was the
one with the greatest shift, both in terms of mean and
shape; but for the majority of the country none of the
predictors moved outside the present climatic range. In
interpreting this pattern, we must stress that change
only refers to the range of values of the predictors, and
not to their geographical location; in other words, a
location will be mapped as ‘No change’ if the projected
values for all predictors have changed, but they have
all remained within the range of values observed for
present time. The results from the PDMs projected that
locations with greatest pollinator richness would shift
north-east, suggesting a similar shift in environmental
conditions most suitable to pollinators. For Europe,
Ohlem€uller et al. (2006) have already shown a prevail-
ing north-east shift in the climatic conditions analogous
to the 1931–1960 period. For much of the global land
shifting climate has been projected to be greater than
1 km yr�1 over the 21st century (Diffenbaugh & Field,
2013), potentially posing alarming challenges for terres-
trial ecosystems. The results of the PDMs assume
unlimited dispersal of pollinators and predicted range
expansion to occur more frequently than range contrac-
tion. Indeed, some species are likely to track such
changes. The bumblebee, Bombus hypnorum, arrived in
SE England less than 15 years ago and since then has
reached Scotland. However, if areas of similar climate
are farther than the species’ dispersal distance, coloni-
zation and persistence may not be possible (Thuiller,
2004; Ohlem€uller et al., 2006), and more species would
shrink their range. This risk would be further enhanced
by other pressures acting on the pollinators, such as
habitat fragmentation and degradation, parasites and
alien species (Vanbergen & The Insect Pollinators Initia-
tive, 2013), none of which was considered here. Look-
ing at the species that are already predicted to
experience range contraction, some of them, like Osmia
and Bombus spp., are known to be efficient pollinators
of orchard trees, and of apples in particular (Delaplane
& Mayer, 2000). Therefore, geographical mismatches
between these species and orchards might have
noticeable effects on pollination service provision.
© 2014 The Authors Global Change Biology Published by John Wiley & Sons Ltd., 20, 2815–2828
ORCHARDS AND POLLINATORS CLIMATE-DRIVEN SHIFT 2825
Page 12
There could be expansion of orchard pollinators from
the continent into GB, although this element was not
included in our study; there could also be additional
pollination supply from managed pollinators (e.g. hon-
eybees), although the capacity to utilize honeybees for
additional pollination services is primarily independent
of climate.
Solely based on climatic projections, the most suitable
environmental conditions for orchards shifted north-
west, although probability of occurrence for these areas
never reached the maxima obtained for the present.
Since our projections were only based on climate, how-
ever, they must be read with caution: much of the areas
identified as suitable for orchards in M2050 occur in
uplands that may not be suitable for fruit tree cultiva-
tion owing to soil type and topography. In addition, the
pollinator availability predicted for these areas was for
the vast majority ≤0.2, in contrast with present predic-
tions which showed larger areas with 0.2 ≤ PA ≤ 0.5.
These results suggest that, over the next 50 years, the
most suitable areas for orchards may not be character-
ized by pollinator availability as high as now. Further-
more, while the present distribution of orchards largely
overlapped areas with the highest pollinator richness,
future predictions showed a geographical mismatch
between areas most suitable to orchards and areas rich-
est in pollinator species. Pollinator diversity has been
observed to increase fruit set in several crop systems
(Klein et al., 2003; Hoehn et al., 2008; Garibaldi et al.,
2013) and buffer negative effects of extreme weather
events such as strong winds (Brittain et al., 2013). Ade-
quate pollination could still be possible by a few species
of wild bees with high numbers of individuals, but
such a community would be more vulnerable to stres-
sors and stochastic variation. Landscape management
to increase pollinator diversity and abundance in these
areas of future orchard production could be imple-
mented to improve the stability of pollination services,
such as preservation of seminatural landscapes or
increasing pollinator habitat and forage resources
(Ricketts et al., 2008; Scheper et al., 2013), or additional
inputs from managed pollinators might become neces-
sary to achieve optimal yields.
In contrast, the areas currently occupied by orchards
are predicted to become even more suitable to pollina-
tors in M2050. Under this scenario, however, due to
unfavourable conditions the predicted probability of
the occurrence of orchards will decrease. New top fruit
varieties could be developed with future climatic condi-
tions in mind, particularly breeding for resistance to
those factors identified in this study as key to driving
the shift in orchard distribution, namely Temperature
Seasonality and Minimum Temperature of the Coldest
Month.
In this study, we have used species distribution mod-
els and climate projections to derive the environmental
suitability for the orchard-pollinator system in Great
Britain, under different scenarios. Due to the character-
istics of the pollinator data, we used a relative measure
of pollinator availability which cannot (yet) be trans-
lated into units of service delivery (Maes et al., 2012).
Our approach, however, detected a geographical mis-
match in climatic suitability for orchards and pollina-
tors, which may potentially lead to low pollination
service provision, unless production is moved towards
more (climatically) suitable north-westerly areas. How-
ever, we found that wild pollinator availability may be
preserved and possibly enhanced in areas already used
for orchards. The implications of trading off between
wild pollinator availability and lower climatic suitabil-
ity need further research. In particular, methods of
boosting wild pollinators through improving landscape
resources (Scheper et al., 2013), supplementing wild
pollination service with managed pollinators, or choos-
ing fruit tree varieties that are adapted to changed
climatic conditions may provide a combination of
adaptation options to support top fruit production in
GB over the next 50 years. The methods underlying our
study can be applied to other regions and crop systems,
and expanded to include different climatic scenarios.
Some of the most urgent challenges that need to be
addressed, are the inclusion of other factors limiting
future crop cultivation (e.g. soil type), and the transla-
tion of the relative measure of pollinator availability
into units of service delivery.
Acknowledgements
This study was carried out within the project ‘Sustainable polli-nation services for UK crops’ (http://www.reading.ac.uk/caer/Project_IPI_Crops/project_ipi_crops_index.html), fundedjointly by BBSRC, Defra, NERC, the Scottish Government, theWellcome Trust and the LWEC, under the Insect Pollinators Ini-tiative (https://wiki.ceh.ac.uk/display/ukipi/Home). JR-V wasfully supported and AJC was partly supported by the CGIARResearch Program on Climate Change, Agriculture and FoodSecurity (CCAFS).
References
Aguirre-Guti�errez J, Carvalheiro LG, Polce C, van Loon EE, Raes N, Reemer M, Bies-
meijer JC (2013) Fit-for-purpose: species distribution model performance depends
on evaluation criteria –Dutch hoverflies as a case study. PLoS ONE, 8, e63708.
Aizen MA, Garibaldi LA, Cunningham SA, Klein AM (2009) How much does agricul-
ture depend on pollinators? lessons from long-term trends in crop production.
Annals of Botany, 103, 1579–1588.
Allsopp MH, de Lange WJ, Veldtman R (2008) Valuing insect pollination services
with cost of replacement. PLoS ONE, 3, e3128.
Austin M (2007) Species distribution models and ecological theory: a critical assess-
ment and some possible new approaches. Ecological Modelling, 200, 1–19.
Biesmeijer JC, Roberts SPM, Reemer M et al. (2006) Parallel declines in pollinators
and insect-pollinated plants in Britain and the Netherlands. Science, 313, 351–354.
© 2014 The Authors Global Change Biology Published by John Wiley & Sons Ltd., 20, 2815–2828
2826 C. POLCE et al.
Page 13
Bischoff M, Campbell DR, Lord JM, Robertson AW (2013) The relative importance of
solitary bees and syrphid flies as pollinators of two outcrossing plant species in
the New Zealand alpine. Austral Ecology, 38, 169–176.
Brittain C, Kremen C, Klein A-M (2013) Biodiversity buffers pollination from changes
in environmental conditions. Global Change Biology, 19, 540–547.
Burkle LA, Marlin JC, Knight TM (2013) Plant-pollinator interactions over 120 years:
loss of species, co-occurrence and function. Science, 339, 1611–1615.
Carvalheiro LG, Kunin WE, Keil P et al. (2013) Species richness declines and biotic
homogenisation have slowed down for NW-European pollinators and plants. Ecol-
ogy Letters, 16, 870–878.
Castro S, Loureiro J, Ferrero V, Silveira P, Navarro L (2013) So many visitors and so
few pollinators: variation in insect frequency and effectiveness governs the repro-
ductive success of an endemic milkwort. Plant Ecology, 214, 1233–1245.
Challinor AJ, Simelton ES, Fraser EDG, Hemming D, Collins M (2010) Increased
crop failure due to climate change: assessing adaptation options using models
and socio-economic data for wheat in China. Environmental Research Letters, 5,
034012.
Chen IC, Hill JK, Ohlemuller R, Roy DB, Thomas CD (2011) Rapid range shifts of spe-
cies associated with high levels of climate warming. Science, 333, 1024–1026.
Delaplane KS, Mayer DF (2000) Crop Pollination by Bees. CABI Publishing, Walling-
ford, UK.
Department for Environment, Food and Rural Affairs (2013) Basic horticultural statis-
tics 2013. United Kingdom areas, production, valuations and trade statistics for
fruit and vegetables to 2012 with historic statistics for ornamental plants and flow-
ers. Available at: https://www.gov.uk/government/publications/basic-horticul-
tural-statistics (accessed 12 September 2013)
Devoto M, Zimmermann M, Medan D (2007) Robustness of plant-flower visitor webs
to simulated climate change. Ecologia Austral, 17, 37–50.
Diffenbaugh NS, Field CB (2013) Changes in ecologically critical terrestrial climate
conditions. Science, 341, 486–492.
Eccel E, Rea R, Caffarra A, Crisci A (2009) Risk of spring frost to apple production
under future climate scenarios: the role of phenological acclimation. International
Journal of Biometeorology, 53, 273–286.
Elith J, Kearney M, Phillips S (2010) The art of modelling range-shifting species. Meth-
ods in Ecology and Evolution, 1, 330–342.
Franklin J, Davis FW, Ikegami M, Syphard AD, Flint LE, Flint AL, Hannah L (2013)
Modeling plant species distributions under future climates: how fine scale do cli-
mate projections need to be? Global Change Biology, 19, 473–483.
Fraser EDG, Simelton E, Termansen M, Gosling SN, South A (2013) “Vulnerability
hotspots”: integrating socio-economic and hydrological models to identify where
cereal production may decline in the future due to climate change induced
drought. Agricultural and Forest Meteorology, 170, 195–205.
Free JB (1993) Insect Pollination of Crops. Academic Press Limited, London.
Gallai N, Salles J-M, Settele J, Vaissi�ere BE (2009) Economic valuation of the vulnera-
bility of world agriculture confronted with pollinator decline. Ecological Economics,
68, 810–821.
Garibaldi LA, Steffan-Dewenter I, Winfree R et al. (2013) Wild pollinators enhance
fruit set of crops regardless of honey bee abundance. Science, 339, 1608–1611.
Garratt MPD, Coston DJ, Truslove CL et al. (2014) The identity of crop pollinators
helps target conservation for improved ecosystem services. Biological Conservation,
169, 128–135.
Giannini TC, Saraiva AM, Alves-Dos-Santos I (2010) Ecological niche modeling and
geographical distribution of pollinator and plants: a case study of Peponapis Fer-
vens (Smith, 1879) (Eucerini: Apidae) and Cucurbita species (Cucurbitaceae). Eco-
logical Informatics, 5, 59–66.
Giannini TC, Lira-Saade R, Ayala R, Saraiva AM, Alves-Dos-Santos I (2011) Ecologi-
cal niche similarities of Peponapis bees and non-domesticated Cucurbita species.
Ecological Modelling, 222, 2011–2018.
Giannini TC, Acosta AL, Gar�ofalo CA, Saraiva AM, Alves-Dos-Santos I, Imperatriz-
Fonseca VL (2012) Pollination services at risk: bee habitats will decrease owing to
climate change in Brazil. Ecological Modelling, 244, 127–131.
Guisan A, Thuiller W (2005) Predicting species distribution: offering more than sim-
ple habitat models. Ecology Letters, 8, 993–1009.
Hawkins E, Osborne TM, Ho CK, Challinor AJ (2013) Calibration and bias correction
of climate projections for crop modelling: an idealised case study over Europe.
Agricultural and Forest Meteorology, 170, 19–31.
Hegland SJ, Nielsen A, Lazaro A, Bjerknes AL, Totland O (2009) How does climate
warming affect plant-pollinator interactions? Ecology Letters, 12, 184–195.
Hijmans RJ, Graham CH (2006) The ability of climate envelope models to predict the
effect of climate change on species distributions. Global Change Biology, 12, 2272–
2281.
Hijmans RJ, Cameron SE, Parra JL, Jones PG, Jarvis A (2005) Very high resolution
interpolated climate surfaces for global land areas. International Journal of Climatol-
ogy, 25, 1965–1978.
Hijmans RJ, Phillips S, Leathwick J, Elith J (2011) dismo: species distribution model-
ing. R package version 0.7-11. Available at: http://cran.r-project.org/web/
packages/dismo/index.html (accessed 20 October 2011).
Hoehn P, Tscharntke T, Tylianakis JM, Steffan-Dewenter I (2008) Functional group
diversity of bee pollinators increases crop yield. Proceedings of the Royal Society B-
Biological Sciences, 275, 2283–2291.
Hothorn T, Bretz F, Westfall P, Heiberger RM, Schuetzenmeister A (2013) multcomp:
simultaneous inference in general parametric models. R package version 1.2-18.
Available at: http://cran.r-project.org/web/packages/multcomp/index.html (acc-
essed 17May 2013)
Jolliffe IT (1972) Discarding variables in a principal component analysis. I: artificial
data. Applied Statistics, 2, 160–173.
Jolliffe IT (1973) Discarding variables in a principal component analysis, II: real data.
Applied Statistics, 22, 21–31.
King C, Ballantyne G, Willmer PG (2013) Why flower visitation is a poor proxy
for pollination: measuring single-visit pollen deposition, with implications for
pollination networks and conservation. Methods in Ecology and Evolution, 4, 811–
818.
Klein AM, Steffan-Dewenter I, Tscharntke T (2003) Fruit set of highland coffee
increases with the diversity of pollinating bees. Proceedings of the Royal Society B-
Biological Sciences, 270, 955–961.
Klein AM, Vaissi�ere BE, Cane JH, Steffan-Dewenter I, Cunningham SA, Kremen C,
Tscharntke T (2007) Importance of pollinators in changing landscapes for world
crops. Proceedings of the Royal Society B-Biological Sciences, 274, 303–313.
Kuhlmann M, Guo D, Veldtman R, Donaldson J (2012) Consequences of warming up
a hotspot: species range shifts within a centre of bee diversity. Diversity and Distri-
butions, 18, 885–897.
Lautenbach S, Kugel C, Lausch A, Seppelt R (2011) Analysis of historic changes in
regional ecosystem service provisioning using land use data. Ecological Indicators,
11, 676–687.
Lobell DB, Burke MB, Tebaldi C, Mastrandrea MD, Falcon WP, Naylor RL (2008) Pri-
oritizing climate change adaptation needs for food security in 2030. Science, 319,
607–610.
Lonsdorf E, Kremen C, Ricketts T, Winfree R, Williams N, Greenleaf S (2009) Model-
ling pollination services across agricultural landscapes. Annals of Botany, 103,
1589–1600.
Maes J, Hauck J, Paracchini ML et al. (2012) A spatial assessment of ecosystem ser-
vices in Europe: methods, case studies and policy analysis. - phase 2. PEER Report
No 4. Ispra: Partnership for European Environmental Research.
Marini L, Quaranta M, Fontana P, Biesmeijer JC, Bommarco R (2012) Landscape con-
text and elevation affect pollinator communities in intensive apple orchards. Basic
and Applied Ecology, 13, 681–689.
Memmott J, Craze PG, Waser NM, Price MV (2007) Global warming and the disrup-
tion of plant-pollinator interactions. Ecology Letters, 10, 710–717.
Murphy JM, Sexton DMH, Jenkins GJ et al. (2010) UK Climate Projections Science
Report: Climate change projections., Met Office Hadley Centre, Exeter. UK.
Naki�cenovi�c N, Alcamo J, Davis G et al. (2000) IPCC Special Report on Emissions Scenar-
ios (SRES), Cambridge University Press, UK.
Ne’eman G, Juergens A, Newstrom-Lloyd L, Potts SG, Dafni A (2010) A framework
for comparing pollinator performance: effectiveness and efficiency. Biological
Reviews, 85, 435–451.
Ohlem€uller R, Gritti ES, Sykes MT, Thomas CD (2006) Towards European climate risk
surfaces: the extent and distribution of analogous and non-analogous climates
1931–2100. Global Ecology and Biogeography, 15, 395–405.
Parmesan C, Yohe G (2003) A globally coherent fingerprint of climate change impacts
across natural systems. Nature, 421, 37–42.
Phillips SJ, Anderson RP, Schapire RE (2006) Maximum entropy modeling of species
geographic distributions. Ecological Modelling, 190, 231–259.
Pinheiro J, Bates D, Debroy S, Sarkar D, R Core Team (2013) nlme: linear and nonlin-
ear mixed effects models. R package version 3.1-110. Available at: http://cran.
r-project.org/web/packages/nlme/index.html (accessed 07 July 2013)
Polce C, Termansen M, Aguirre-Guti�errez J et al. (2013) Species distribution models
for crop pollination: a modelling framework applied to great Britain. PLoS ONE, 8,
e76308.
Potts SG, Roberts SPM, Dean R et al. (2010) Declines of managed honey bees and bee-
keepers in Europe. Journal of Apicultural Research, 49, 15–22.
R Development Core Team (2011) R: A Language and Environment for Statistical Com-
puting. R Foundation for Statistical Computing, Vienna, Austria.
© 2014 The Authors Global Change Biology Published by John Wiley & Sons Ltd., 20, 2815–2828
ORCHARDS AND POLLINATORS CLIMATE-DRIVEN SHIFT 2827
Page 14
Raes N, ter Steege H (2007) A null-model for significance testing of presence-only
species distribution models. Ecography, 30, 727–736.
Rafferty NE, Ives AR (2012) Pollinator effectiveness varies with experimental shifts in
flowering time. Ecology, 93, 803–814.
Raupach MR, Marland G, Ciais P, le Quere C, Canadell JG, Klepper G, Field CB
(2007) Global and regional drivers of accelerating CO2 emissions. Proceedings of the
National Academy of Sciences of the United States of America, 104, 10288–10293.
Ricketts TH, Regetz J, Steffan-Dewenter I et al. (2008) Landscape effects on crop polli-
nation services: are there general patterns? Ecology Letters, 11, 499–515.
Root TL, Price JT, Hall KR, Schneider SH, Rosenzweig C, Pounds JA (2003) Finger-
prints of global warming on wild animals and plants. Nature, 421, 57–60.
Scheper J, Holzschuh A, Kuussaari M, Potts SG, Rundlof M, Smith HG, Kleijn D (2013)
Environmental factors driving the effectiveness of European agri-environmental
measures in mitigating pollinator loss - a meta-analysis. Ecology Letters, 16, 912–920.
Schmidhuber J, Tubiello FN (2007) Global food security under climate change. Pro-
ceedings of the National Academy of Sciences of the United States of America, 104,
19703–19708.
Schweiger O, Settele J, Kudrna O, Klotz S, K€uhn I (2008) Climate change can cause
spatial mismatch of trophically interacting species. Ecology, 89, 3472–3479.
Sork VL, Davis FW, Westfall R, Flint A, Ikegami M, Wang H, Grivet D (2010) Gene
movement and genetic association with regional climate gradients in California
valley oak (Quercus lobata Nee) in the face of climate change. Molecular Ecology,
19, 3806–3823.
Swets JA (1988) Measuring the accuracy of diagnostic systems. Science, 240, 1285–
1293.
Termansen M, Mcclean CJ, Preston CD (2006) The use of genetic algorithms and Bayes-
ian classification to model species distributions. Ecological Modelling, 192, 410–424.
Thuiller W (2004) Patterns and uncertainties of species’ range shifts under climate
change. Global Change Biology, 10, 2020–2027.
Vanbergen AJ, The Insect Pollinators Initiative (2013) Threats to an ecosystem service:
pressures on pollinators. Frontiers in Ecology and the Environment, 11, 251–259.
Warren M, Robertson MP, Greeff JM (2010) A comparative approach to understand-
ing factors limiting abundance patterns and distributions in a fig tree-fig wasp
mutualism. Ecography, 33, 148–158.
Warren R, Vanderwal J, Price J et al. (2013) Quantifying the benefit of early climate
change mitigation in avoiding biodiversity loss. Nature Climate Change, 3, 678–682.
Wiley E, Mcnyset K, Peterson AT, Robins C, Stewart AM (2003) Niche modeling and
geographic range predictions in the marine environment using a machine-learning
algorithm. Oceanography, 16, 120–127.
Wolmarans R, Robertson MP, van Rensburg BJ (2010) Predicting invasive alien plant
distributions: how geographical bias in occurrence records influences model per-
formance. Journal of Biogeography, 37, 1797–1810.
Zulian G, Maes J, Paracchini M (2013) Linking land cover data and crop yields for
mapping and assessment of pollination services in Europe. Land, 2, 472–492.
Supporting Information
Additional Supporting Information may be found in theonline version of this article:
Data S1. Climate-driven spatial mismatches between Britishorchards and their pollinators: increased risks of pollinationdeficits.
© 2014 The Authors Global Change Biology Published by John Wiley & Sons Ltd., 20, 2815–2828
2828 C. POLCE et al.