Collapse of the fishery for Iceland scallop (Chlamys islandica) in Breidafjordur, West Iceland Jo ´nas P. Jonasson, Gudrun Thorarinsdottir, Hrafnkell Eiriksson, Jon Solmundsson, and Gudrun Marteinsdottir Jonasson, J. P., Thorarinsdottir, G., Eiriksson, H., Solmundsson, J., and Marteinsdottir, G. 2007. Collapse of the fishery for Iceland scallop (Chlamys islandica) in Breidafjordur, West Iceland. – ICES Journal of Marine Science, 64: 298–308. The stock index of the Iceland scallop (Chlamys islandica) in Breidafjordur on the west coast of Iceland has declined drastically in recent years. Total fishing mortality was very high throughout the study period from 1993 to 2003, a period characterized by a steady increase in summer sea surface temperature, in 2003 reaching the highest estimated level of the previous century. Between 1998 and 2005, estimates of chlorophyll a (food availability) fluctuated with periods of low chlorophyll followed by a reduction in muscle weight and high natural mortality. High levels of natural mortality were observed in the main fishing area in the southern part of Breidafjordur. There the stock index had been declining since 1994. Recruitment to the fishable stock was highly variable during the study period, with low recruitment towards the end of the 1990s. Subsequently the fishery has been on relatively few year classes, and the stock has been fragile because of several years of poor recruitment and high natural mortality. Consequently, the stock appeared unable to withstand the fishing pressure and declined to historically low levels, leading to a halt to fishing in 2004. Keywords: Chlamys islandica, fishery collapse, Iceland scallop, mortality, recruitment, temperature. Received 20 April 2006; accepted 6 November 2006; advance access publication 7 December 2006. J. P. Jonasson and G. Marteinsdottir: University of Iceland, Askja, Sturlugata 7, 101 Reykjavı ´k, Iceland. G. Thorarinsdottir, H. Eiriksson, and J. Solmundsson: Marine Research Institute, PO Box 1390 Skulagata 4, 121 Reykjavı ´k, Iceland. Correspondence to J. P. Jonasson: tel: þ354 525 5229; fax: þ354 575 2001; e-mail: [email protected]. Introduction Population fluctuations have long been recognized as common phenomena of both marine and terrestrial animals (Elton, 1924). In scallop stocks, population size can be influenced by numerous factors, including variability in recruitment and catastrophic mor- tality from various sources (Orensanz et al., 1991). Fish and shell- fish stocks have been classified into steady, cyclical, irregular, and spasmodic stocks according to their pattern of fluctuation (Caddy and Gulland, 1983). The Iceland scallop (Chlamys islandica) is distributed within the Subarctic transitional zone at maximum sea temperatures of 12–158C (Sundet, 1988; Hovgaard et al., 2001) and at depths ,100 m (Wiborg, 1963). It is relatively long-lived with a maximum observed age of at least 23 y (Vahl, 1981). Long-lived Arctic and boreal scallops, such as the Iceland scallop, may fall into the steady stock group (Orensanz et al., 1991), but fluctua- tions in populations of Iceland scallop caused by changes in temperature and/or salinity (Wiborg, 1963), predation (Brun, 1968), and heavy fishing have been observed at several locations in the North Atlantic (Hovgaard et al., 2001). In Iceland, the Iceland scallop has been fished since 1969 (Eiriksson, 1997). Population size decreased in all major subpopu- lations in Icelandic waters towards the end of the 1990s. Stock biomass indices for small scallop stocks in the northwest decreased by 45–80%, and the greatest decline was in the area where fishing was minimal (Marine Research Institute, MRI, Reykjavı ´k, unpublished data). The stock size index of the largest scallop population in Iceland, in Breidafjordur, declined by 70% during the period 2000– 2003. Landings (total weight) there peaked at 12 700 t in 1986, decreased slightly in the following years, then remained relatively stable at 8000–9000 t during most of the 1990s. Then, between 2000 and 2003, the stock collapsed and annual landings decreased from 8600 to 800 t. As a result, fishing was stopped in 2004 (Anon., 2005). The objective of the current study was to look for possible causes for the dramatic decline in the stock of Breidafjordur Iceland scallop between 1999 and 2003. Data from stock surveys, specific sampling, and fishery logbooks were explored in order to analyse stock biomass, natural and fishing mortality, recruitment, and muscle condition. Available environmental data (chlorophyll and temperature) were also analysed and are discussed in relation to the observed changes in the stock. Material and methods Survey data Data were collected during the annual scallop surveys con- ducted by the MRI in the inner part of Breidafjordur, West Iceland, in March/April of the years 1993–2003 (Figure 1). On each survey, some 120 fixed standardized tows were taken. From 1993 to 1997, a 470 kg sledge dredge 1.5 m wide was used. In 1998, this was substituted with a 835 kg roller dredge 1.2 m wide (Garcia et al., 2006). Both dredges were equipped with 60 mm steel rings. Earlier experiments on the sledge dredge had revealed that its efficiency was 20% (i.e. e ¼ 0.2). # 2006 International Council for the Exploration of the Sea. Published by Oxford Journals. All rights reserved. For Permissions, please email: [email protected]298 by guest on June 1, 2013 http://icesjms.oxfordjournals.org/ Downloaded from
Transcript
Collapse of the fishery for Iceland scallop (Chlamys islandica) inBreidafjordur, West Iceland
Jonas P. Jonasson, Gudrun Thorarinsdottir, Hrafnkell Eiriksson, Jon Solmundsson, andGudrun Marteinsdottir
Jonasson, J. P., Thorarinsdottir, G., Eiriksson, H., Solmundsson, J., and Marteinsdottir, G. 2007. Collapse of the fishery for Iceland scallop(Chlamys islandica) in Breidafjordur, West Iceland. – ICES Journal of Marine Science, 64: 298–308.
The stock index of the Iceland scallop (Chlamys islandica) in Breidafjordur on the west coast of Iceland has declined drastically inrecent years. Total fishing mortality was very high throughout the study period from 1993 to 2003, a period characterized by a steadyincrease in summer sea surface temperature, in 2003 reaching the highest estimated level of the previous century. Between 1998 and2005, estimates of chlorophyll a (food availability) fluctuated with periods of low chlorophyll followed by a reduction in muscleweight and high natural mortality. High levels of natural mortality were observed in the main fishing area in the southern part ofBreidafjordur. There the stock index had been declining since 1994. Recruitment to the fishable stock was highly variable during thestudy period, with low recruitment towards the end of the 1990s. Subsequently the fishery has been on relatively few year classes,and the stock has been fragile because of several years of poor recruitment and high natural mortality. Consequently, the stockappeared unable to withstand the fishing pressure and declined to historically low levels, leading to a halt to fishing in 2004.
Received 20 April 2006; accepted 6 November 2006; advance access publication 7 December 2006.
J. P. Jonasson and G. Marteinsdottir: University of Iceland, Askja, Sturlugata 7, 101 Reykjavık, Iceland. G. Thorarinsdottir, H. Eiriksson, andJ. Solmundsson: Marine Research Institute, PO Box 1390 Skulagata 4, 121 Reykjavık, Iceland. Correspondence to J. P. Jonasson: tel: þ354 525 5229;fax: þ354 575 2001; e-mail: [email protected].
IntroductionPopulation fluctuations have long been recognized as commonphenomena of both marine and terrestrial animals (Elton, 1924).In scallop stocks, population size can be influenced by numerousfactors, including variability in recruitment and catastrophic mor-tality from various sources (Orensanz et al., 1991). Fish and shell-fish stocks have been classified into steady, cyclical, irregular, andspasmodic stocks according to their pattern of fluctuation (Caddyand Gulland, 1983).
The Iceland scallop (Chlamys islandica) is distributed withinthe Subarctic transitional zone at maximum sea temperatures of12–158C (Sundet, 1988; Hovgaard et al., 2001) and at depths,100 m (Wiborg, 1963). It is relatively long-lived with amaximum observed age of at least 23 y (Vahl, 1981). Long-livedArctic and boreal scallops, such as the Iceland scallop, may fallinto the steady stock group (Orensanz et al., 1991), but fluctua-tions in populations of Iceland scallop caused by changes intemperature and/or salinity (Wiborg, 1963), predation (Brun,1968), and heavy fishing have been observed at several locations inthe North Atlantic (Hovgaard et al., 2001).
In Iceland, the Iceland scallop has been fished since 1969(Eiriksson, 1997). Population size decreased in all major subpopu-lations in Icelandic waters towards the end of the 1990s. Stockbiomass indices for small scallop stocks in the northwestdecreased by 45–80%, and the greatest decline was in the areawhere fishing was minimal (Marine Research Institute, MRI,Reykjavık, unpublished data). The stock size index of the largest
scallop population in Iceland, in Breidafjordur, declined by 70%during the period 2000–2003. Landings (total weight) therepeaked at 12 700 t in 1986, decreased slightly in the followingyears, then remained relatively stable at 8000–9000 t during mostof the 1990s. Then, between 2000 and 2003, the stock collapsedand annual landings decreased from 8600 to 800 t. As a result,fishing was stopped in 2004 (Anon., 2005).
The objective of the current study was to look for possiblecauses for the dramatic decline in the stock of BreidafjordurIceland scallop between 1999 and 2003. Data from stock surveys,specific sampling, and fishery logbooks were explored in order toanalyse stock biomass, natural and fishing mortality, recruitment,and muscle condition. Available environmental data (chlorophylland temperature) were also analysed and are discussed in relationto the observed changes in the stock.
Material and methodsSurvey dataData were collected during the annual scallop surveys con-ducted by the MRI in the inner part of Breidafjordur, WestIceland, in March/April of the years 1993–2003 (Figure 1).On each survey, some 120 fixed standardized tows were taken.From 1993 to 1997, a 470 kg sledge dredge 1.5 m wide wasused. In 1998, this was substituted with a 835 kg roller dredge1.2 m wide (Garcia et al., 2006). Both dredges were equippedwith 60 mm steel rings. Earlier experiments on the sledgedredge had revealed that its efficiency was 20% (i.e. e ¼ 0.2).
#2006 International Council for the Exploration of the Sea. Published by Oxford Journals. All rights reserved. For Permissions, pleaseemail: [email protected]
Comparative experiments between the roller and sledge dredgeshowed that the catch of scallops in roller dredge tows was onaverage 30% higher than in sledge tows, so e for the rollerdredge was set at 0.26 (n ¼ 46, MRI, unpublished data). Here,instead of using the average difference between the dredges, asingle parameter regression was forced through the origin(r ¼ 0.94). The regression had a slope of 0.70, correspondingto a fresh estimate for e of 0.285.
Each survey tow covered approximately 0.4 nautical miles andthe tow speed was 4 knots. For the analysis, all tow lengths werestandardized to 0.4 nautical miles. For each tow the total catchwas weighed and a random subsample of approximately 25 kgtaken. In each subsample, all live scallops were weighed and theheight of about 100 was recorded. The remaining scallops werecounted and the numbers of cluckers (dead scallops attached ontheir hinges, both damaged and whole shells) were noted.
The survey area was divided into subareas, based on a grid ofsquares of equal size. Squares positioned on the main scallopgrounds were split into two subareas (Figure 1). The total regionfished was divided into a northern area (subareas 31–42), northof Bjarneyjarall (a trench bisecting the fjord from west to east),and a southern area (subareas 2–14), south of the trench. The sizeof the scallop beds in each subarea was based on estimates con-ducted at the beginning of the surveys in the early 1970s, wherethe total area was estimated to be 72 km2.
Stock biomass indices were estimated from
By ¼Xn
i¼1
ð�xs � as=ðdw � tl � 1:852ÞÞe
; ð1Þ
where By is the total biomass (t), n the number of subareas, xs theaverage biomass per subarea, as the size of the scallop beds persubarea (km2), dw the width of the dredge (m), tl the tow length(nautical miles), and e the dredge efficiency.
Fishery dataCatch per unit effort (cpue) (landings per hour fishing) withineach subarea was based on logbook catch reports, which are man-datory in the fishery. The cpue data go back to 1972, but withprecise information from around 1985.
Fishing mortality and natural mortalityFishing mortality was calculated by two non-model methods forthe four major subareas in the fishery (12.1 and 12.2 in the south,and 42 and 32.2 in the north):
(i) A Beverton and Holt length-based fishing mortality (BHF)(Quinn and Deriso, 1999) was calculated from
BHFs ¼ KL1 � �Ls
�Ls � lc�Ms; ð2Þ
where in each subarea s, K is a growth constant from thevon Bertalanffy growth function (VBGF) (Ricker, 1975)[Equation (6)], L1 the asymptotic shell height (SH) from theVBGF, Ls the mean SH beyond lc (here 60 mm), and Ms is thecalculated natural mortality [Equation (4)].
(ii) Equilibrium fishing mortality (YF) (Quinn and Deriso, 1999)was calculated from
Y Fs ¼Yts
Bs; ð3Þ
where in each subarea s, Y is the landings of scallops (t) for a1-y period (t ¼ 1) and B is the estimated biomass [Equation(1)] in tonnes at the beginning of the period. The methoddoes not consider indirect fishing mortality (non-yield) fromfishing gear.
Natural mortality was based on the occurrence of cluckers insurvey tows (Dickie, 1955):
a ¼ 1� e�ðC=tÞð1=LÞ365; ð4Þ
where a is the yearly ratio of natural death, C the number of cluck-ers, t the average time in days required for the shells of the cluckersto separate (211 d) (Jonasson, 2005), and L is the number of livescallops in the sample. The exponent is equal to the instantaneousmortality rate. The number of cluckers was adjusted for thenumbers of scallop that disarticulate during the tow, by multiply-ing the number of cluckers in the sample by 1.211 (Naidu, 1988).
The geographical distribution of abundance and natural mor-tality of scallops from the surveys was plotted for the years 1994and 2001–2003. In the plots of natural mortality, stations with,5 kg of scallops or where fewer than five scallops were measuredwere excluded. Data were interpolated spatially using a krigingmethod (Kaluzny et al., 1998).
Figure 1. The study area in Breidafjordur, West Iceland. Each squarecontaining a subarea is labelled. Squares on the main scallopgrounds are divided into two subareas. Survey stations are markedwith dots. Stations used for temperature recordings (Flatey andStykkisholmur) are marked with triangles.
Collapse of the fishery for Iceland scallop in Breidafjordur, West Iceland 299
Environmental and biological dataOwing to the lack of a complete sea surface temperature (SST)data series for Breidafjordur, SST was estimated on the basis ofthe relationship of SST at Flatey (an island in the middle ofBreidafjordur) and the air temperature at Stykkisholmur(Figure 1). All available monthly mean SST data from Flatey(May–August of 1990–2001; n ¼ 35) were used (Jonasson et al.,2004; r2 ¼ 0.942, p , 0.001).
Estimates of chlorophyll a (Chl a) in Breidafjordur were derivedfrom the NASA SeaWiFS project. The information consisted ofLevel 3 data, which are statistical data products derived by mappingLevel 2 GAC data to a fixed global grid whose resolution elementsare approximately 9 � 9 km (Campbell et al., 1995). In all, 50monthly mean values were obtained from the region bounded by658020 –658290N and 228410 –238380W. Mean values from March toSeptember were calculated for each year of the period 1998–2005.
Measurements of adductor muscle wet weight were initiated inautumn 2000 when processing plants first experienced low meatyields. For those measurements, scallops were sampled from6581705 N 2285205W in subarea 32.2 and from 6580503 N2284207W in subarea 11 (Figure 1). Sampling was during themonths September–December of 2000–2005. Muscle wet weight(W) of scallop was fitted to shell height (SH) by the equation
W ¼ aSHb; ð5Þ
where a and b are constants from a linear regression model of wetweight on SH after log-transformations of the variables.
Age determination and recruitmentAge was determined from shell height using Bhattacharya’smethod (Sparre and Venema, 1998). Graphs were used for visualidentification of frequencies perceived to belong to one age group.General additive model (GAM)-smoothed data from 1993 to 2003in subarea 12.1 (south) were used for this procedure. The VBGF(Ricker, 1975) was fitted to the mean shell height at age by linearregression (Crawley, 2002), also using data from subarea 12.1. TheVBGF was formulated as
SHt ¼ SH1½1� expð�Kðt � t0ÞÞ�; ð6Þ
where SHt is the shell height (mm) at age t (y), SH1 the asymptoticshell height (108.1), K the growth constant (0.139), and t0 the inter-cept of the growth curve on the age axis. The VBGF fitted well theestimated mean age of the scallops (Figure 2).
For analysis of year-class strength, the divergences from themean shell height frequency indices of 1993–2003 were calculatedfor subarea 12.1 (south), during the same period, based upon acommon method (Sund, 1930). For each year, the height frequencywas weighted with the total numbers of scallops, estimated as
N ¼ �x � a=ðdw � tl � 1:852Þe
; ð7Þ
where N is the total number of scallops (in thousands), x theaverage number per station, a the size of the subarea (km2), dwthe dredge width (m), tl the tow length (nautical miles), and e thedredge efficiency. The data were smoothed with a GAM modelusing a cubic B-line smoother with 20 degrees of freedom(Venables and Ripley, 1997).
Stock fluctuations in relation to bioticand abiotic factorsMultiple regression was used to analyse the effects of several bioticand abiotic factors on the number of harvestable scallops(�60 mm) in all subareas for which data were available. Thedependent variable was log-transformed to attain normality(Shapiro–Wilk normality test, p ¼ 0.7238). The starting modelincluded the log-transformed numbers of 45–60 mm scalloprecruits 2 years earlier, the natural mortality determined from thesurveys, the mean summer temperature of the previous year, theYF for the preceding year, the BHF for the same year, and the effortof the previous year standardized by the number of harvestablescallops. Independent variables that did not contribute wereremoved by subtracting the least significant term in each step(Crawley, 2002).
All statistical analyses were performed using Version 6.0S–PLUS software (MathSoft, 2001), except for Bhattacharya’smethod, which was performed with the Version 1.0 FISAT IIstatistical program (Gayanilo et al., 2002).
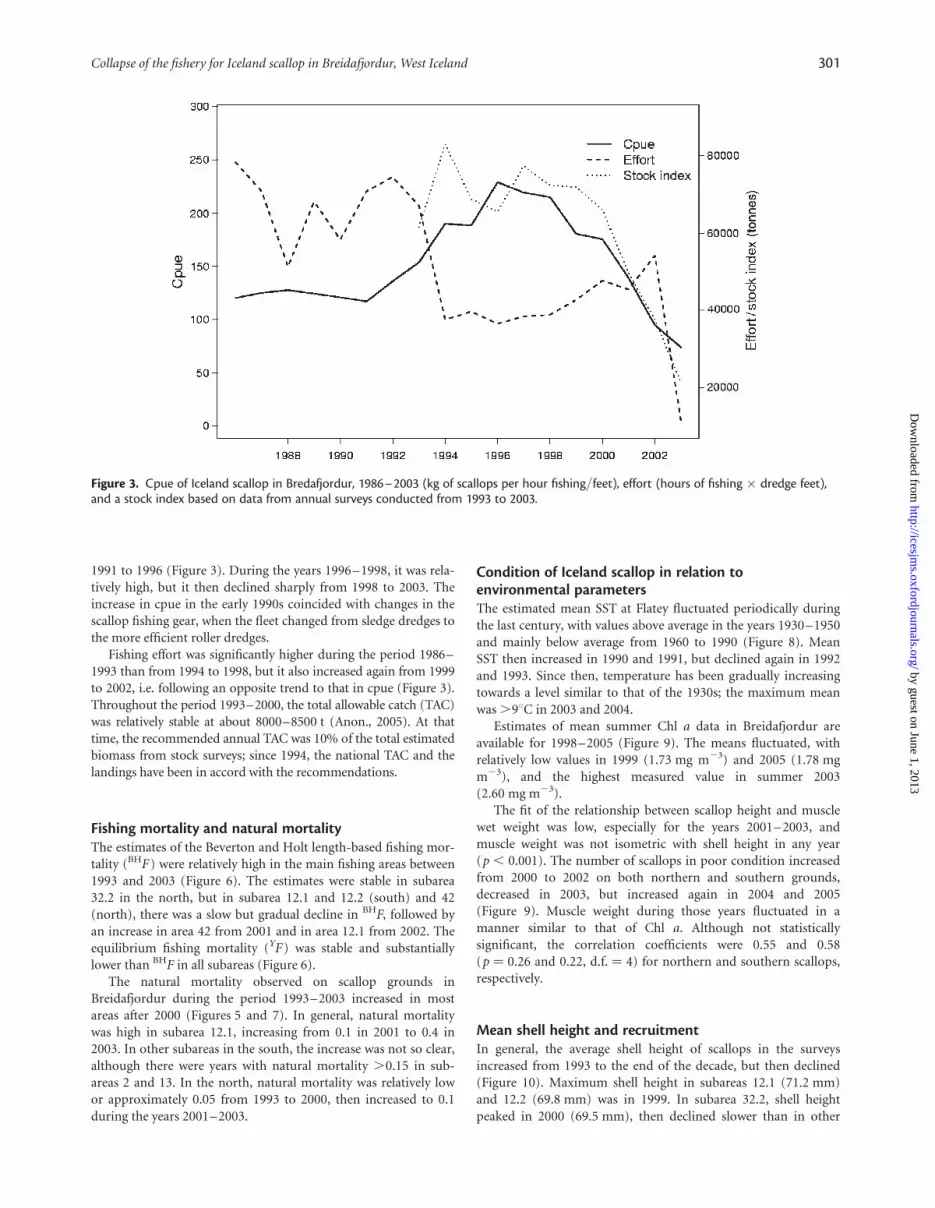
ResultsStock size and the fisheryThe stock index of Iceland scallop in Breidafjordur was rela-tively stable from 1993 to 1999, but it declined sharply from2000 to 2003 (Figure 3). In 2003 (22 000 t), it was at a histori-cally low level of some 30% of the average stock size duringthe 1990s.
The main trends in stock size differed between subareas(Figure 4). In subarea 12.1, the major fishing area in southernBreidafjordur, the stock index declined gradually from 1994. Insubarea 32.2, the major fishing area in the northern part ofBreidafjordur, the stock index fluctuated during the period 1993–2000, peaked in 1997, then steadily declined to a historical low in2003 (Figure 5). In other subareas, stock size generally onlydeclined (or was observed to do so) after 2000, although there wasa steady decline in subareas 13 and 3.1 from 1993 and 1994,respectively.
Cpue, pooled for all areas in Breidafjordur, was relatively stableduring the period 1986–1990, but it increased considerably from
Figure 2. Shell height at age based on survey data from subarea12.1 (south), 1993–2003, calculated using Bhattacharya’s method,fitted with the VBGF.
1991 to 1996 (Figure 3). During the years 1996–1998, it was rela-tively high, but it then declined sharply from 1998 to 2003. Theincrease in cpue in the early 1990s coincided with changes in thescallop fishing gear, when the fleet changed from sledge dredges tothe more efficient roller dredges.
Fishing effort was significantly higher during the period 1986–1993 than from 1994 to 1998, but it also increased again from 1999to 2002, i.e. following an opposite trend to that in cpue (Figure 3).Throughout the period 1993–2000, the total allowable catch (TAC)was relatively stable at about 8000–8500 t (Anon., 2005). At thattime, the recommended annual TAC was 10% of the total estimatedbiomass from stock surveys; since 1994, the national TAC and thelandings have been in accord with the recommendations.
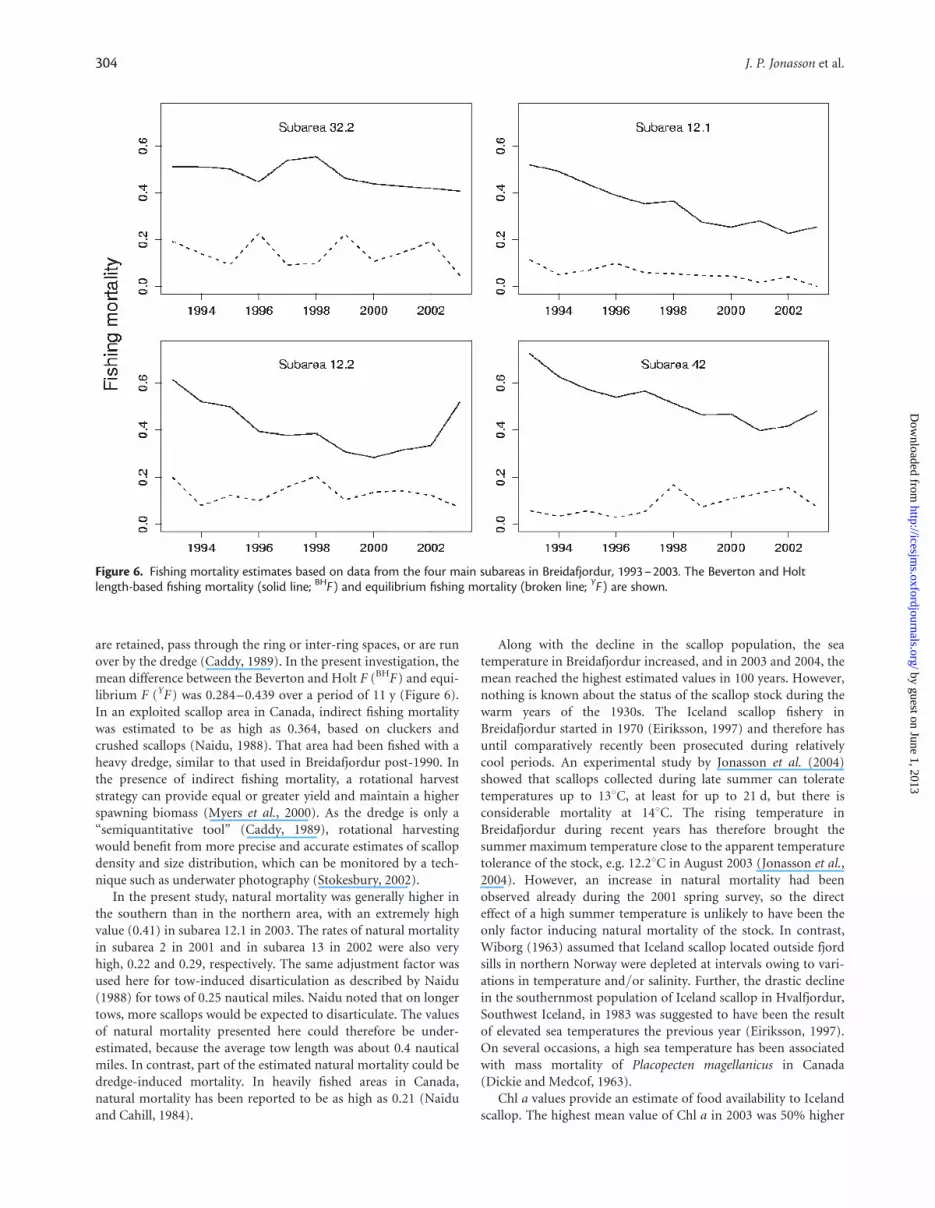
Fishing mortality and natural mortalityThe estimates of the Beverton and Holt length-based fishing mor-tality (BHF) were relatively high in the main fishing areas between1993 and 2003 (Figure 6). The estimates were stable in subarea32.2 in the north, but in subarea 12.1 and 12.2 (south) and 42(north), there was a slow but gradual decline in BHF, followed byan increase in area 42 from 2001 and in area 12.1 from 2002. Theequilibrium fishing mortality (YF) was stable and substantiallylower than BHF in all subareas (Figure 6).
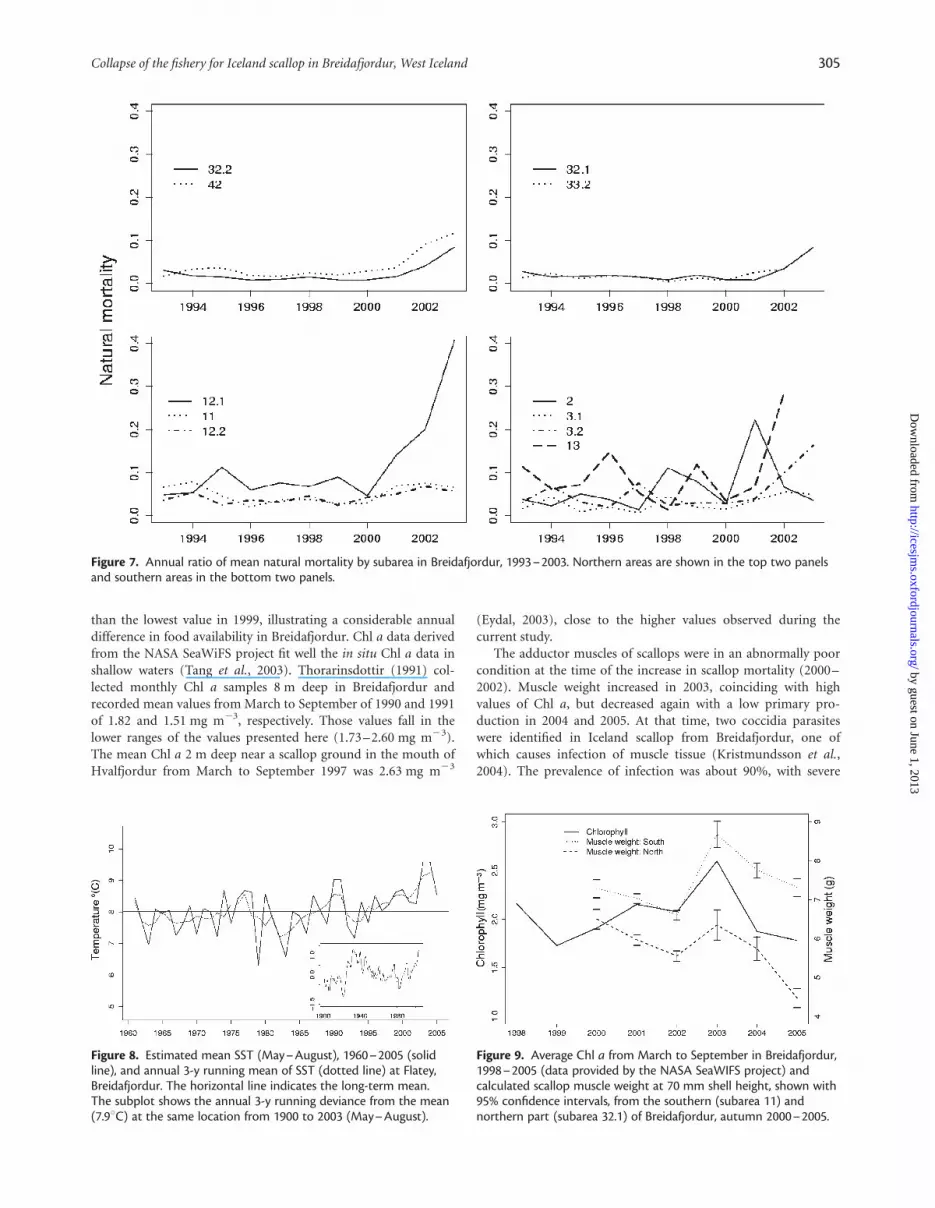
The natural mortality observed on scallop grounds inBreidafjordur during the period 1993–2003 increased in mostareas after 2000 (Figures 5 and 7). In general, natural mortalitywas high in subarea 12.1, increasing from 0.1 in 2001 to 0.4 in2003. In other subareas in the south, the increase was not so clear,although there were years with natural mortality .0.15 in sub-areas 2 and 13. In the north, natural mortality was relatively lowor approximately 0.05 from 1993 to 2000, then increased to 0.1during the years 2001–2003.
Condition of Iceland scallop in relation toenvironmental parametersThe estimated mean SST at Flatey fluctuated periodically duringthe last century, with values above average in the years 1930–1950and mainly below average from 1960 to 1990 (Figure 8). MeanSST then increased in 1990 and 1991, but declined again in 1992and 1993. Since then, temperature has been gradually increasingtowards a level similar to that of the 1930s; the maximum meanwas .98C in 2003 and 2004.
Estimates of mean summer Chl a data in Breidafjordur areavailable for 1998–2005 (Figure 9). The means fluctuated, withrelatively low values in 1999 (1.73 mg m23) and 2005 (1.78 mgm23), and the highest measured value in summer 2003(2.60 mg m23).
The fit of the relationship between scallop height and musclewet weight was low, especially for the years 2001–2003, andmuscle weight was not isometric with shell height in any year(p , 0.001). The number of scallops in poor condition increasedfrom 2000 to 2002 on both northern and southern grounds,decreased in 2003, but increased again in 2004 and 2005(Figure 9). Muscle weight during those years fluctuated in amanner similar to that of Chl a. Although not statisticallysignificant, the correlation coefficients were 0.55 and 0.58(p ¼ 0.26 and 0.22, d.f. ¼ 4) for northern and southern scallops,respectively.
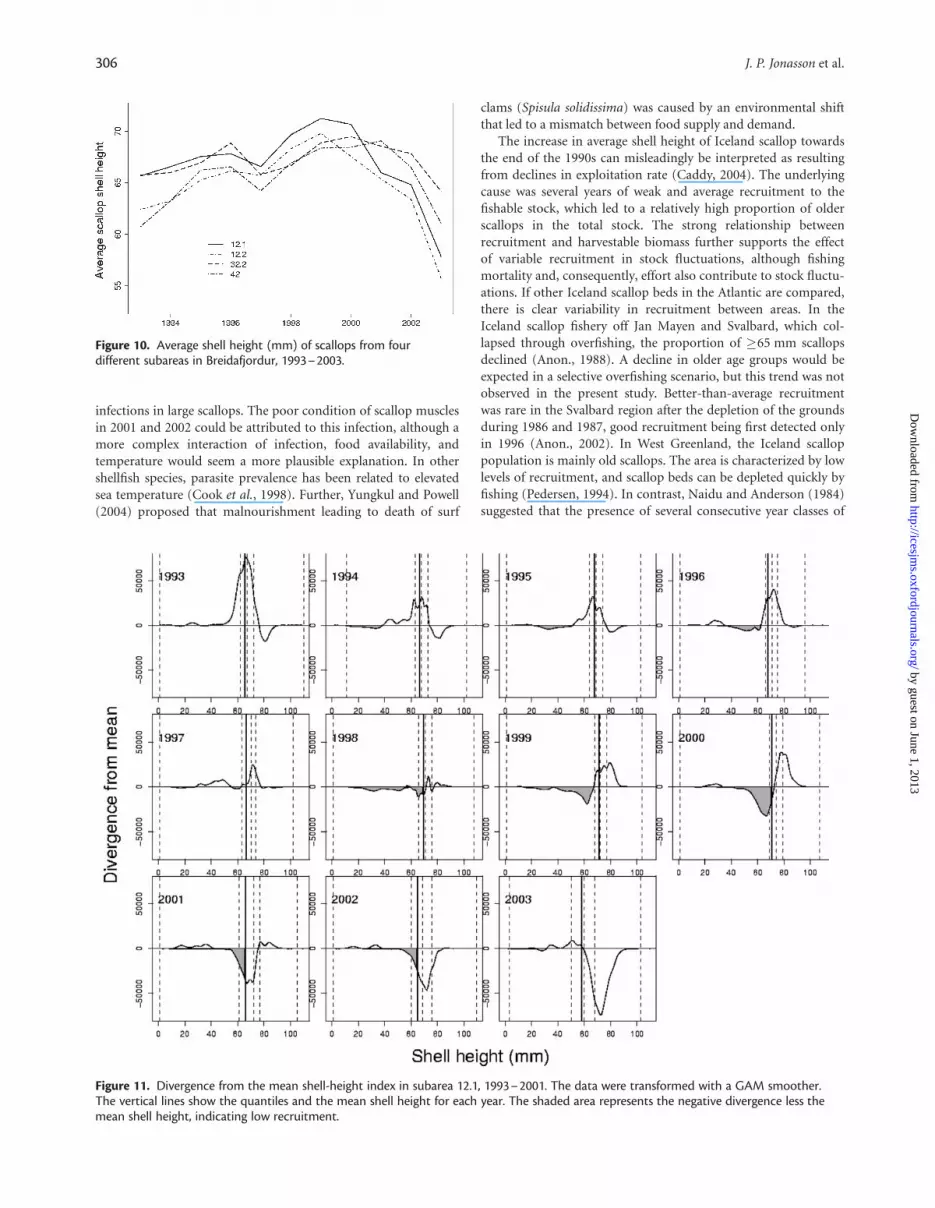
Mean shell height and recruitmentIn general, the average shell height of scallops in the surveysincreased from 1993 to the end of the decade, but then declined(Figure 10). Maximum shell height in subareas 12.1 (71.2 mm)and 12.2 (69.8 mm) was in 1999. In subarea 32.2, shell heightpeaked in 2000 (69.5 mm), then declined slower than in other
Figure 3. Cpue of Iceland scallop in Bredafjordur, 1986–2003 (kg of scallops per hour fishing/feet), effort (hours of fishing � dredge feet),and a stock index based on data from annual surveys conducted from 1993 to 2003.
Collapse of the fishery for Iceland scallop in Breidafjordur, West Iceland 301
subareas. Maximum shell height in subarea 42 was in 2001(69.1 mm).
Recruitment to the fishable stock (�60 mm) was highly vari-able during the study period in subarea 12.1, with low recruitmenttowards the end of the 1990s (Figure 11). Similar fluctuationswere observed in other subareas (Jonasson et al., 2005). Relativelystrong year classes entered the fishable stock between 1993 and1996 (year classes 1987–1990), but then medium and weak yearclasses dominated until 2003. In 1993, the survey catch was domi-nated by shells of approximately 70 mm, i.e. mostly 7–9 years old,according to a length-based conversion (Figure 2), but 80 mm(10 years old) scallops were rare (Figure 11). The fishable stockthen consisted, therefore, mainly of three year classes (1984–1986). During the period 1994–1996 the strong year classes of1987–1990 grew and filled the gap observed around 80 mm in1993. Medium or weak year classes from 1991 to 1992 appear tohave entered the fishable stock in 1997 and 1998, and small yearclasses from 1994 and 1995 seem to have recruited to the fishablestock in 1999 and 2000. As a result, a gap in shell height from 60to 70 mm was formed then. During 2001 and 2002, small yearclasses continued to enter the fishable stock, resulting in a scarcityof older age groups. In 2003, a year class from 1997 and a reason-ably large year class from 1998 appear to have recruited.
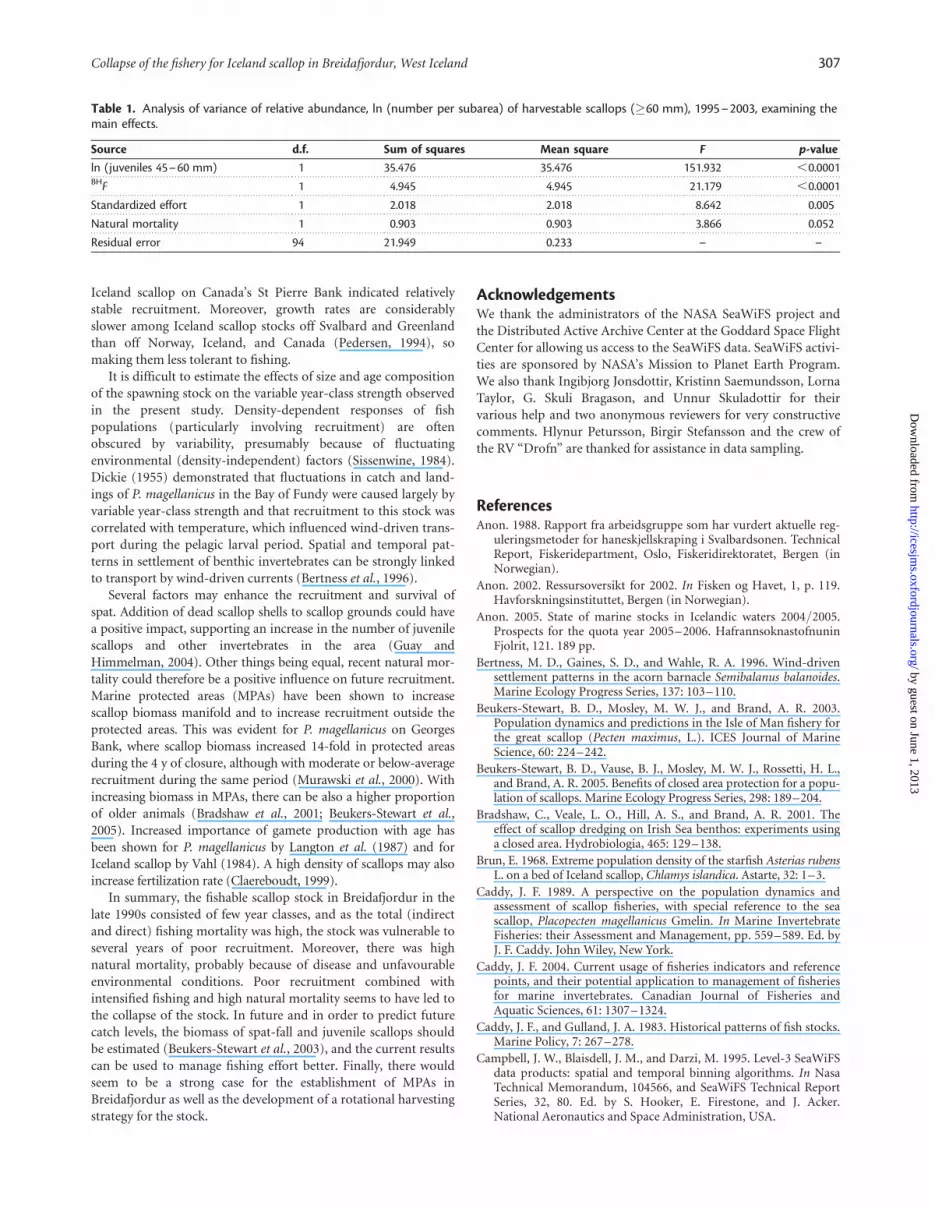
Stock fluctuations in relation to bioticand abiotic factorsThe relative abundance of harvestable scallops was significantlyaffected by the numbers of juvenile scallops (45–60 mm) 2 yearsearlier, BHF, standardized effort, and natural mortality
(marginally). Juvenile abundance had a positive effect on thenumber of harvestable scallops, whereas other factors had negativeeffects. The number of juveniles contributed most to theregression sum of squares (Table 1). Overall, the multipleregression explained some 66% of the variation in stock size abun-dance, and a good fit of the model was demonstrated by theapparent lack of structure in the deviance residuals relative to pre-dicted values. Temperature and YF were not statisticallysignificant.
DiscussionThe Iceland scallop stock in Breidafjordur has declined consi-derably since 2000. The period has been characterized by a steadyincrease in SST, increasingly poor condition of the scallops, andlimited recruitment to the fishable stock.
Fluctuations in the stock size of Iceland scallop have differedbetween subareas, perhaps because of spatially different patternsof recruitment and exploitation (Beukers-Stewart et al., 2003), butpossibly also through variable predation intensity or spread ofdisease. The effect of dredging on the seabed can also vary locally,but a new dredge introduced to the fishery around 1990 increasedfishing efficiency substantially. The new dredge was heavier, couldbe towed faster, and was easier to operate than its predecessor.Consequently, cpue increased in all subareas for several years afterthe new dredge was introduced, but the total catch was stable,restricted by catch quotas. The survey data have the disadvantageof containing information from two different dredge types,because estimated comparisons are likely to include errors andthus bias stock estimates in one or the other direction.
Figure 4. Stock indices in the major subareas of Breidafjordur based on data from the annual surveys conducted during the years 1993–2003. Northern areas are shown in the top two panels and southern areas in the bottom two panels. Note the different scale on the y-axis.
Fishing mortality was relatively high throughout the studyperiod. The equilibrium fishing mortality was low compared withthe Beverton and Holt fishing mortality, but it only representslandings and is negatively biased in the presence of non-yield
fishing mortality. The difference between the two estimates mayindicate a substantial indirect fishing mortality, which can accom-pany scallop dredge fisheries (Caddy, 1989). Heavy gear mayimpose high levels of incidental damage to scallops, whether they
Figure 5. Geographic distribution of mean scallop weight (kg per survey tow, left column) and natural mortality of scallops (annual ratio,right column) in Breidafjordur, during the 1994 and the 2001–2003 surveys (stations are marked with dots).
Collapse of the fishery for Iceland scallop in Breidafjordur, West Iceland 303
are retained, pass through the ring or inter-ring spaces, or are runover by the dredge (Caddy, 1989). In the present investigation, themean difference between the Beverton and Holt F (BHF) and equi-librium F (YF) was 0.284–0.439 over a period of 11 y (Figure 6).In an exploited scallop area in Canada, indirect fishing mortalitywas estimated to be as high as 0.364, based on cluckers andcrushed scallops (Naidu, 1988). That area had been fished with aheavy dredge, similar to that used in Breidafjordur post-1990. Inthe presence of indirect fishing mortality, a rotational harveststrategy can provide equal or greater yield and maintain a higherspawning biomass (Myers et al., 2000). As the dredge is only a“semiquantitative tool” (Caddy, 1989), rotational harvestingwould benefit from more precise and accurate estimates of scallopdensity and size distribution, which can be monitored by a tech-nique such as underwater photography (Stokesbury, 2002).
In the present study, natural mortality was generally higher inthe southern than in the northern area, with an extremely highvalue (0.41) in subarea 12.1 in 2003. The rates of natural mortalityin subarea 2 in 2001 and in subarea 13 in 2002 were also veryhigh, 0.22 and 0.29, respectively. The same adjustment factor wasused here for tow-induced disarticulation as described by Naidu(1988) for tows of 0.25 nautical miles. Naidu noted that on longertows, more scallops would be expected to disarticulate. The valuesof natural mortality presented here could therefore be under-estimated, because the average tow length was about 0.4 nauticalmiles. In contrast, part of the estimated natural mortality could bedredge-induced mortality. In heavily fished areas in Canada,natural mortality has been reported to be as high as 0.21 (Naiduand Cahill, 1984).
Along with the decline in the scallop population, the seatemperature in Breidafjordur increased, and in 2003 and 2004, themean reached the highest estimated values in 100 years. However,nothing is known about the status of the scallop stock during thewarm years of the 1930s. The Iceland scallop fishery inBreidafjordur started in 1970 (Eiriksson, 1997) and therefore hasuntil comparatively recently been prosecuted during relativelycool periods. An experimental study by Jonasson et al. (2004)showed that scallops collected during late summer can toleratetemperatures up to 138C, at least for up to 21 d, but there isconsiderable mortality at 148C. The rising temperature inBreidafjordur during recent years has therefore brought thesummer maximum temperature close to the apparent temperaturetolerance of the stock, e.g. 12.28C in August 2003 (Jonasson et al.,2004). However, an increase in natural mortality had beenobserved already during the 2001 spring survey, so the directeffect of a high summer temperature is unlikely to have been theonly factor inducing natural mortality of the stock. In contrast,Wiborg (1963) assumed that Iceland scallop located outside fjordsills in northern Norway were depleted at intervals owing to vari-ations in temperature and/or salinity. Further, the drastic declinein the southernmost population of Iceland scallop in Hvalfjordur,Southwest Iceland, in 1983 was suggested to have been the resultof elevated sea temperatures the previous year (Eiriksson, 1997).On several occasions, a high sea temperature has been associatedwith mass mortality of Placopecten magellanicus in Canada(Dickie and Medcof, 1963).
Chl a values provide an estimate of food availability to Icelandscallop. The highest mean value of Chl a in 2003 was 50% higher
Figure 6. Fishing mortality estimates based on data from the four main subareas in Breidafjordur, 1993–2003. The Beverton and Holtlength-based fishing mortality (solid line; BHF ) and equilibrium fishing mortality (broken line; YF ) are shown.
than the lowest value in 1999, illustrating a considerable annualdifference in food availability in Breidafjordur. Chl a data derivedfrom the NASA SeaWiFS project fit well the in situ Chl a data inshallow waters (Tang et al., 2003). Thorarinsdottir (1991) col-lected monthly Chl a samples 8 m deep in Breidafjordur andrecorded mean values from March to September of 1990 and 1991of 1.82 and 1.51 mg m23, respectively. Those values fall in thelower ranges of the values presented here (1.73–2.60 mg m23).The mean Chl a 2 m deep near a scallop ground in the mouth ofHvalfjordur from March to September 1997 was 2.63 mg m23
(Eydal, 2003), close to the higher values observed during thecurrent study.
The adductor muscles of scallops were in an abnormally poorcondition at the time of the increase in scallop mortality (2000–2002). Muscle weight increased in 2003, coinciding with highvalues of Chl a, but decreased again with a low primary pro-duction in 2004 and 2005. At that time, two coccidia parasiteswere identified in Iceland scallop from Breidafjordur, one ofwhich causes infection of muscle tissue (Kristmundsson et al.,2004). The prevalence of infection was about 90%, with severe
Figure 7. Annual ratio of mean natural mortality by subarea in Breidafjordur, 1993–2003. Northern areas are shown in the top two panelsand southern areas in the bottom two panels.
Figure 9. Average Chl a from March to September in Breidafjordur,1998–2005 (data provided by the NASA SeaWIFS project) andcalculated scallop muscle weight at 70 mm shell height, shown with95% confidence intervals, from the southern (subarea 11) andnorthern part (subarea 32.1) of Breidafjordur, autumn 2000–2005.
Figure 8. Estimated mean SST (May–August), 1960–2005 (solidline), and annual 3-y running mean of SST (dotted line) at Flatey,Breidafjordur. The horizontal line indicates the long-term mean.The subplot shows the annual 3-y running deviance from the mean(7.98C) at the same location from 1900 to 2003 (May–August).
Collapse of the fishery for Iceland scallop in Breidafjordur, West Iceland 305
infections in large scallops. The poor condition of scallop musclesin 2001 and 2002 could be attributed to this infection, although amore complex interaction of infection, food availability, andtemperature would seem a more plausible explanation. In othershellfish species, parasite prevalence has been related to elevatedsea temperature (Cook et al., 1998). Further, Yungkul and Powell(2004) proposed that malnourishment leading to death of surf
clams (Spisula solidissima) was caused by an environmental shiftthat led to a mismatch between food supply and demand.
The increase in average shell height of Iceland scallop towardsthe end of the 1990s can misleadingly be interpreted as resultingfrom declines in exploitation rate (Caddy, 2004). The underlyingcause was several years of weak and average recruitment to thefishable stock, which led to a relatively high proportion of olderscallops in the total stock. The strong relationship betweenrecruitment and harvestable biomass further supports the effectof variable recruitment in stock fluctuations, although fishingmortality and, consequently, effort also contribute to stock fluctu-ations. If other Iceland scallop beds in the Atlantic are compared,there is clear variability in recruitment between areas. In theIceland scallop fishery off Jan Mayen and Svalbard, which col-lapsed through overfishing, the proportion of �65 mm scallopsdeclined (Anon., 1988). A decline in older age groups would beexpected in a selective overfishing scenario, but this trend was notobserved in the present study. Better-than-average recruitmentwas rare in the Svalbard region after the depletion of the groundsduring 1986 and 1987, good recruitment being first detected onlyin 1996 (Anon., 2002). In West Greenland, the Iceland scalloppopulation is mainly old scallops. The area is characterized by lowlevels of recruitment, and scallop beds can be depleted quickly byfishing (Pedersen, 1994). In contrast, Naidu and Anderson (1984)suggested that the presence of several consecutive year classes of
Figure 11. Divergence from the mean shell-height index in subarea 12.1, 1993–2001. The data were transformed with a GAM smoother.The vertical lines show the quantiles and the mean shell height for each year. The shaded area represents the negative divergence less themean shell height, indicating low recruitment.
Figure 10. Average shell height (mm) of scallops from fourdifferent subareas in Breidafjordur, 1993–2003.
Iceland scallop on Canada’s St Pierre Bank indicated relativelystable recruitment. Moreover, growth rates are considerablyslower among Iceland scallop stocks off Svalbard and Greenlandthan off Norway, Iceland, and Canada (Pedersen, 1994), somaking them less tolerant to fishing.
It is difficult to estimate the effects of size and age compositionof the spawning stock on the variable year-class strength observedin the present study. Density-dependent responses of fishpopulations (particularly involving recruitment) are oftenobscured by variability, presumably because of fluctuatingenvironmental (density-independent) factors (Sissenwine, 1984).Dickie (1955) demonstrated that fluctuations in catch and land-ings of P. magellanicus in the Bay of Fundy were caused largely byvariable year-class strength and that recruitment to this stock wascorrelated with temperature, which influenced wind-driven trans-port during the pelagic larval period. Spatial and temporal pat-terns in settlement of benthic invertebrates can be strongly linkedto transport by wind-driven currents (Bertness et al., 1996).
Several factors may enhance the recruitment and survival ofspat. Addition of dead scallop shells to scallop grounds could havea positive impact, supporting an increase in the number of juvenilescallops and other invertebrates in the area (Guay andHimmelman, 2004). Other things being equal, recent natural mor-tality could therefore be a positive influence on future recruitment.Marine protected areas (MPAs) have been shown to increasescallop biomass manifold and to increase recruitment outside theprotected areas. This was evident for P. magellanicus on GeorgesBank, where scallop biomass increased 14-fold in protected areasduring the 4 y of closure, although with moderate or below-averagerecruitment during the same period (Murawski et al., 2000). Withincreasing biomass in MPAs, there can be also a higher proportionof older animals (Bradshaw et al., 2001; Beukers-Stewart et al.,2005). Increased importance of gamete production with age hasbeen shown for P. magellanicus by Langton et al. (1987) and forIceland scallop by Vahl (1984). A high density of scallops may alsoincrease fertilization rate (Claereboudt, 1999).
In summary, the fishable scallop stock in Breidafjordur in thelate 1990s consisted of few year classes, and as the total (indirectand direct) fishing mortality was high, the stock was vulnerable toseveral years of poor recruitment. Moreover, there was highnatural mortality, probably because of disease and unfavourableenvironmental conditions. Poor recruitment combined withintensified fishing and high natural mortality seems to have led tothe collapse of the stock. In future and in order to predict futurecatch levels, the biomass of spat-fall and juvenile scallops shouldbe estimated (Beukers-Stewart et al., 2003), and the current resultscan be used to manage fishing effort better. Finally, there wouldseem to be a strong case for the establishment of MPAs inBreidafjordur as well as the development of a rotational harvestingstrategy for the stock.
AcknowledgementsWe thank the administrators of the NASA SeaWiFS project andthe Distributed Active Archive Center at the Goddard Space FlightCenter for allowing us access to the SeaWiFS data. SeaWiFS activi-ties are sponsored by NASA’s Mission to Planet Earth Program.We also thank Ingibjorg Jonsdottir, Kristinn Saemundsson, LornaTaylor, G. Skuli Bragason, and Unnur Skuladottir for theirvarious help and two anonymous reviewers for very constructivecomments. Hlynur Petursson, Birgir Stefansson and the crew ofthe RV “Drofn” are thanked for assistance in data sampling.
ReferencesAnon. 1988. Rapport fra arbeidsgruppe som har vurdert aktuelle reg-
uleringsmetoder for haneskjellskraping i Svalbardsonen. TechnicalReport, Fiskeridepartment, Oslo, Fiskeridirektoratet, Bergen (inNorwegian).
Anon. 2002. Ressursoversikt for 2002. In Fisken og Havet, 1, p. 119.Havforskningsinstituttet, Bergen (in Norwegian).
Anon. 2005. State of marine stocks in Icelandic waters 2004/2005.Prospects for the quota year 2005–2006. HafrannsoknastofnuninFjolrit, 121. 189 pp.
Bertness, M. D., Gaines, S. D., and Wahle, R. A. 1996. Wind-drivensettlement patterns in the acorn barnacle Semibalanus balanoides.Marine Ecology Progress Series, 137: 103–110.
Beukers-Stewart, B. D., Mosley, M. W. J., and Brand, A. R. 2003.Population dynamics and predictions in the Isle of Man fishery forthe great scallop (Pecten maximus, L.). ICES Journal of MarineScience, 60: 224–242.
Beukers-Stewart, B. D., Vause, B. J., Mosley, M. W. J., Rossetti, H. L.,and Brand, A. R. 2005. Benefits of closed area protection for a popu-lation of scallops. Marine Ecology Progress Series, 298: 189–204.
Bradshaw, C., Veale, L. O., Hill, A. S., and Brand, A. R. 2001. Theeffect of scallop dredging on Irish Sea benthos: experiments usinga closed area. Hydrobiologia, 465: 129–138.
Brun, E. 1968. Extreme population density of the starfish Asterias rubensL. on a bed of Iceland scallop, Chlamys islandica. Astarte, 32: 1–3.
Caddy, J. F. 1989. A perspective on the population dynamics andassessment of scallop fisheries, with special reference to the seascallop, Placopecten magellanicus Gmelin. In Marine InvertebrateFisheries: their Assessment and Management, pp. 559–589. Ed. byJ. F. Caddy. John Wiley, New York.
Caddy, J. F. 2004. Current usage of fisheries indicators and referencepoints, and their potential application to management of fisheriesfor marine invertebrates. Canadian Journal of Fisheries andAquatic Sciences, 61: 1307–1324.
Caddy, J. F., and Gulland, J. A. 1983. Historical patterns of fish stocks.Marine Policy, 7: 267–278.
Campbell, J. W., Blaisdell, J. M., and Darzi, M. 1995. Level-3 SeaWiFSdata products: spatial and temporal binning algorithms. In NasaTechnical Memorandum, 104566, and SeaWiFS Technical ReportSeries, 32, 80. Ed. by S. Hooker, E. Firestone, and J. Acker.National Aeronautics and Space Administration, USA.
Claereboudt, M. 1999. Fertilization success in spatially distributedpopulations of benthic free-spawners: a simulation model.Ecological Modelling, 121: 221–233.
Cook, T., Folli, M., Klinck, J., Ford, S., and Miller, J. 1998. Therelationship between increasing sea-surface temperature and thenorthward spread of Perkinsus marinus (Dermo) disease epizooticsin oysters. Estuarine, Coastal and Shelf Science, 46: 587–597.
Crawley, M. J. 2002. Statistical Computing. An Introduction to DataAnalysis Using S–PLUS. John Wiley, Chichester, UK.
Dickie, L. M. 1955. Fluctuations in abundance of the giant scallop(Placopecten magellanicus (Gmelin)), in the Digby area of the Bayof Fundy. Journal of the Fisheries Research Board of Canada, 12:707–856.
Dickie, L. M., and Medcof, J. C. 1963. Causes of mass mortalities ofscallops (Placopecten magellanicus) in the southwestern Gulf ofSt Lawrence. Journal of the Fisheries Research Board of Canada,20: 451–482.
Eiriksson, H. 1997. The molluscan fisheries of Iceland. NOAATechnical Report, NMFS 129: 39–47.
Elton, C. S. 1924. Periodic fluctuations in the numbers of animals:their causes and effects. British Journal of Experimental Biology, 2:119–163.
Eydal, A. 2003. Ahrif naeringarefna a tegundasamsetningu og fjoldasvifthorunga i Hvalfirdi. Hafrannsoknastofnunin Fjolrit, 99. 44 pp.(in Icelandic).
Guijarro Garcia, E., Ragnarsson, S. A., and Eiriksson, H. 2006. Effectsof scallop dredging on macrobenthic communities in WestIceland. ICES Journal of Marine Science, 63: 434–443.
Gayanilo, F. C., Sparre, P., and Pauly, D. 2002. FAO–ICLARM stockassessment tools (FiSAT II). Users’ Guide 8. FAO ComputerizedInformation Series (Fisheries). FAO, Rome.
Guay, M., and Himmelman, J. H. 2004. Would adding scallop shells(Chlamys islandica) to the sea bottom enhance commercialspecies? Journal of Experimental Marine Biology and Ecology, 312:299–317.
Hovgaard, P., Mortensen, S., and Strand, O. 2001. Skjell, Biologi ogDyrkning. Kystnaeringen Forlag og bokklub AS, Norway. 255 pp.(in Norwegian).
Jonasson, J. P. 2005. The effect of environment and fisheries on thestatus of Iceland scallop. Master’s thesis, University of Iceland.
Jonasson, J. P., Thorarinsdottir, G. G., Eiriksson, H., andMarteinsdottir, G. 2004. Temperature tolerance of Iceland scallop,Chlamys islandica (O. F. Muller) under controlled experimentalconditions. Aquaculture Research, 35: 1405–1414.
Jonasson, J. P., Thorarinsdottir, G. G., Eiriksson, H., Solmundsson, J.,and Marteinsdottir, G. 2005. The effects of environment and fishingon the abundance and the condition of Iceland scallop, Chlamysislandica in Breidafjordur. ICES Document CM 2005/O: 24.
Kaluzny, S. P., Vdega, S. C., Cardoso, T. P., and Shelly, A. A. 1998. SþSpatial Statsw: User’s Manual for Windowsw and UNIXw.Springer, New York.
Kristmundsson, A., Eydal, M., Bambir, S. H., and Helgason, S. 2004.Snikjudyr i horpuskel Chlamys islandica vid Island. In LiffraediVaxandi Visindi, Afmaelisradstefna Liffraedifelags Islands ogLiffraedistofnunnar Haskolans. Haskoli Islands and LiffraedifelagIslands, p. 68. Book of Abstracts (in Icelandic).
Langton, R. W., Robinson, W. E., and Schick, D. 1987. Fecundity andreproductive effort of sea scallops Placopecten magellanicus fromthe Gulf of Maine. Marine Ecology Progress Series, 37: 19–25.
MathSoft. 2001. S–PLUS 6 for UNIX. Guide to Statistics. DataAnalysis Products Division, Seattle, USA.
Murawski, S. A., Brown, R., Lai, H. L., Rago, P. J., and Hendrickson,L. 2000. Large-scale closed areas as a fishery-management tool intemperate marine systems: the Georges Bank experience. Bulletinof Marine Science, 66: 775–798.
Myers, R. A., Fuller, S. D., and Kehler, D. G. 2000. A fisheries manage-ment strategy robust to ignorance: rotational harvest in the
presence of indirect fishing mortality. Canadian Journal ofFisheries and Aquatic Sciences, 57: 2357–2362.
Naidu, K. S. 1988. Estimating mortality rates in the Iceland scallop,Chlamys islandica (O.F. Muller). Journal of Shellfish Research, 7:61–71.
Naidu, K. S., and Anderson, J. T. 1984. Aspects of scallop recruitmenton St Pierre Bank in relation to oceanography and implicationsfor resource management. Canadian Atlantic Fisheries ScienceAdvisory Committee Research Document, 84/29. 15 pp.
Naidu, K., and Cahill, F. M. 1984. Status and assessment of St PierreBank scallop stocks, 1982–83. Canadian Atlantic Fisheries ScienceAdvisory Committee Research Document, 84/69. 56 pp.
Orensanz, J. M., Parma, A. M., and Iribarne, O. O. 1991. Populationdynamics and management of natural stocks. In Developments inAquaculture and Fisheries Science, 21, pp. 625–689. Ed. byS. E. Shumway. Elsevier, Amsterdam.
Pedersen, S. A. 1994. Population parameters of the Iceland scallop,Chlamys islandica (O.F. Muller) from West Greenland. Journal ofNorthwest Atlantic Fisheries Science, 16: 75–87.
Quinn, T. J., and Deriso, R. B. 1999. Quantitative Fish Dynamics.Oxford University Press, New York.
Ricker, W. E. 1975. Computation and interpretation of biologicalstatistics of fish populations. Bulletin of the Fisheries ResearchBoard of Canada, 191.
Sissenwine, M. P. 1984. Why do fish populations vary. In Exploitationof Marine Communities, pp. 59–94. Ed. by R. May. Springer,Berlin.
Sparre, P., and Venema, S. C. 1998. Introduction to tropical fish stockassessment. 1. Manual. FAO Fisheries Technical Paper, 306/1.
Stokesbury, K. D. E. 2002. Estimation of sea scallop abundance inclosed areas of Georges Bank, USA. Transactions of the AmericanFisheries Society, 131: 1081–1092.
Sund, O. 1930. The renewal of a fish population studied by means ofmeasurement of commercial catches. Example: the Arcto–Norwegian cod stock. Rapports et Proces-Verbaux des Reunionsdu Conseil Permanent International pour 10Exploration de la Mer,65: 10–17.
Sundet, J. H. 1988. Haneskjellets utbredelse og fangst av haneskjell.Ottar, 170: 8–12 (in Norwegian).
Tang, D. L., Kawamura, H., Lee, M. A., and Dien, T. V. 2003. Seasonaland spatial distribution of chlorophyll-a concentrations and waterconditions in the Gulf of Tonkin, South China Sea. RemoteSensing of the Environment, 85: 475–483.
Thorarinsdottir, G. G. 1991. The Iceland scallop, Chlamys islandica(O.F. Muller) in Breidafjordur, West Iceland. 1. Spat collectionand growth during the first year. Aquaculture, 97: 13–23.
Vahl, O. 1981. Energy transformation by the Iceland scallop Chlamysislandica (O. F. Muller, 1776) from 708N. 1. The age-specificenergy budget and net growth efficiency. Journal of ExperimentalMarine Biology and Ecology, 53: 281–296.
Vahl, O. 1984. Size-specific reproductive effort in Chlamys islandica:reproductive senility or stabilizing selection? In Proceedings of the19th European Marine Biology Symposium, pp. 521–527. Ed. byP. E. Gibbs. Cambridge University Press, Cambridge, UK.
Venables, W. N., and Ripley, B. D. 1997. Modern Applied Statisticswith S–PLUS. Springer, New York.
Wiborg, K. F. 1963. Some observations on the Iceland scallopChlamys islandica (Muller) in Norwegian waters.Fiskeridirektoratets Skrifter Serie Havundersogelser, 13: 38–53 (inNorwegian).
Yungkul, K., and Powell, E. N. 2004. Surfclam histopathology surveyalong the Delmarva mortality line. Journal of Shellfish Research,23: 429–441.