ConGUSTo: (HT)Condor Graphical Unified Supervising Tool Antonio Dorta 1,2 *, Nicola Caon 1,2 , Jorge Andr ´ es P ´ erez Prieto 1,2 Abstract HTCondor is a distributed job scheduler developed by the University of Wisconsin-Madison, which allows users to run their applications in other users’ machines when they are not being used, thus providing a considerably increase in the overall computational power and a more efficient use of the computing resources. Our institution has been successfully using HTCondor for more than ten years, and HTCondor is nowadays the most used Supercomputing resource we have. Although HTCondor provides a wide range of tools and options for its management and administration, there are currently no tools that can show detailed usage information and statistics in a clear, easy to interpret, interactive set of graphics displays. For this reason, we have developed ConGUSTo, a web-based tool that allows to collect HTCondor usage and statistics data in an easy way, and present them using a variety of tabular and graphics charts. Keywords ConGUSTo — HTCondor — statistics 1 Instituto de Astrof´ ısica de Canarias, E-38205 La Laguna, Tenerife, Spain 2 Universidad de La Laguna, Dpto. Astrof´ ısica, E-38206 La Laguna, Tenerife, Spain *Corresponding author: [email protected]Contents 1 Introduction 1 2 HTCondor and its current log options 2 2.1 What is HTCondor? ..................... 2 2.2 HTCondor logging and statistics options ...... 3 3 What ConGUSTo offers 3 4 Implementation of ConGUSTo 3 4.1 How ConGUSTo retrieves the data .......... 4 4.2 How ConGUSTo displays the data .......... 4 5 Some examples 5 5.1 Daily jobs execution on a machine (summary) . . 5 5.2 Daily jobs execution in a machine (details) ..... 5 5.3 Weekly and monthly jobs execution in a machine 5 5.4 HTCondor machine panoramic view ......... 5 6 Conclusions and future work 7 Software availability 8 Acknowledgments 8 1. Introduction The Instituto de Astrof´ ısica de Canarias (IAC) is the largest Spanish astrophysical research centre. The IAC manages two observatories located over 2000 meters ASL with more than 25 telescopes on the whole, including the current largest optical/infrared telescope in the world (GTC), all equipped with state-of-the-art instrumentation. These telescopes gener- ate large amounts of raw data which must be processed and reduced before they can be analyzed. The data processing is usually done with both general-purpose and specialized software packages that need a lot of computational power. Most of this data reduction work is carried out by applying the same tasks over a large number of independent inputs, so it is much more suitable for distributing computing than for parallel supercomputing. In fact, there are several research projects at the IAC which are viable only thanks to the use of these kind of resources, since they need several thousands of CPU hours to be completed. 1 So HTCondor, a software tool which will be briefly described in the following sections, plays a fundamental role at the IAC, with over 200 Linux desktops and 700 computing slots available to researchers when they are not being used by their owners. In the first semester of 2014, our staff executed jobs in HTCondor for a total of about 1,300,000 computing hours, that is the equivalent of one and a half century of sequential computing time in just six months. As HTCondor system administrators, our interest in moni- toring and supervising how HTCondor works is twofold. First, we must assure that HTCondor does not interfere with the regular use of the desktop PC by the user who is logged in. Both an imperfect knowledge of what HTCondor does (and what doesn’t), and some past failures in detecting user’s ac- tivity and evicting HTCondor jobs (a problem caused by an 1 As an example, one of the IAC research group is using holography techniques to create seismic maps of the solar interior, from observed velocity fields obtained by GONG (Global Oscillation Network Group). Maps are produced for about 500 depths, for observations spanning several months in order to study temporal variations. Each map requires about 10 minutes of computing time: HTCondor is the ideal resource for such kind of work, as it involves applying the same process to thousands of independent inputs. arXiv:1412.5847v1 [cs.DC] 18 Dec 2014
AbstractHTCondor is a distributed job scheduler developed by the University of Wisconsin-Madison, which allows usersto run their applications in other users’ machines when they are not being used, thus providing a considerablyincrease in the overall computational power and a more efficient use of the computing resources. Our institutionhas been successfully using HTCondor for more than ten years, and HTCondor is nowadays the most usedSupercomputing resource we have. Although HTCondor provides a wide range of tools and options for itsmanagement and administration, there are currently no tools that can show detailed usage information andstatistics in a clear, easy to interpret, interactive set of graphics displays. For this reason, we have developedConGUSTo, a web-based tool that allows to collect HTCondor usage and statistics data in an easy way, andpresent them using a variety of tabular and graphics charts.
KeywordsConGUSTo — HTCondor — statistics
1Instituto de Astrofısica de Canarias, E-38205 La Laguna, Tenerife, Spain2Universidad de La Laguna, Dpto. Astrofısica, E-38206 La Laguna, Tenerife, Spain*Corresponding author: [email protected]
Contents
1 Introduction 1
2 HTCondor and its current log options 22.1 What is HTCondor? . . . . . . . . . . . . . . . . . . . . . 22.2 HTCondor logging and statistics options . . . . . . 3
3 What ConGUSTo offers 3
4 Implementation of ConGUSTo 34.1 How ConGUSTo retrieves the data . . . . . . . . . . 44.2 How ConGUSTo displays the data . . . . . . . . . . 4
5 Some examples 55.1 Daily jobs execution on a machine (summary) . . 55.2 Daily jobs execution in a machine (details) . . . . . 55.3 Weekly and monthly jobs execution in a machine 55.4 HTCondor machine panoramic view . . . . . . . . . 5
6 Conclusions and future work 7
Software availability 8
Acknowledgments 8
1. IntroductionThe Instituto de Astrofısica de Canarias (IAC) is the largestSpanish astrophysical research centre. The IAC managestwo observatories located over 2000 meters ASL with morethan 25 telescopes on the whole, including the current largestoptical/infrared telescope in the world (GTC), all equippedwith state-of-the-art instrumentation. These telescopes gener-ate large amounts of raw data which must be processed and
reduced before they can be analyzed. The data processingis usually done with both general-purpose and specializedsoftware packages that need a lot of computational power.Most of this data reduction work is carried out by applyingthe same tasks over a large number of independent inputs, soit is much more suitable for distributing computing than forparallel supercomputing. In fact, there are several researchprojects at the IAC which are viable only thanks to the use ofthese kind of resources, since they need several thousands ofCPU hours to be completed.1 So HTCondor, a software toolwhich will be briefly described in the following sections, playsa fundamental role at the IAC, with over 200 Linux desktopsand 700 computing slots available to researchers when theyare not being used by their owners. In the first semester of2014, our staff executed jobs in HTCondor for a total of about1,300,000 computing hours, that is the equivalent of one and ahalf century of sequential computing time in just six months.
As HTCondor system administrators, our interest in moni-toring and supervising how HTCondor works is twofold. First,we must assure that HTCondor does not interfere with theregular use of the desktop PC by the user who is logged in.Both an imperfect knowledge of what HTCondor does (andwhat doesn’t), and some past failures in detecting user’s ac-tivity and evicting HTCondor jobs (a problem caused by an
1As an example, one of the IAC research group is using holographytechniques to create seismic maps of the solar interior, from observed velocityfields obtained by GONG (Global Oscillation Network Group). Maps areproduced for about 500 depths, for observations spanning several months inorder to study temporal variations. Each map requires about 10 minutes ofcomputing time: HTCondor is the ideal resource for such kind of work, as itinvolves applying the same process to thousands of independent inputs.
Operating System upgrade and fixed shortly after it showedup) have made the users suspicious of HTCondor, which theyhave started to blame whenever their computer becomes slow,unresponsive or freezes at times (HTCondor has thus becomethe favorite scapegoat). Second, we must respond to the en-ergy saving measures that are being studied and implementedby the IAC in order to reduce electricity bills. One of theproposals was to turn off all Linux desktops at night and onweekends, and we need to show that most of such desktops areindeed used by HTCondor outside regular work hours, and wecannot afford turning them off without seriously compromis-ing those research activities that heavily rely on HTCondor.
The standard HTCondor installation comes with severaltools and options for monitoring how each job was executedand to produce a log that can be interpreted by some HTCon-dor commands and external applications. It also generatessome general statistics about the pool and the allocated re-sources. However, we have found out that there is no easyway to track the detailed usage of each machine by HTCondor,which is a key factor for our purposes.
In particular, we are interested mainly in the followingpoints:
• To obtain detailed information about what jobs havebeen executed in each of our machines, at any time, withall the associated information such as owners, states,etc., as well as a comprehensive summary encompass-ing all machines. Such information must be easily ac-cessed, preferably shown online in a graphic way easyto interpret and understand, thereby allowing users tocheck the status of their machines and contact us whenexperiencing issues that could be related to HTCondor.
• To collect further information about when each machineis executing jobs, with the aim of implementing somepower saving measures like automatically suspendingor hibernating idle machines, and letting HTCondorwake them upon jobs allocation.
• To have a real-time graphical ”panoramic view” of thestatus of all our machines. We do not wish to merelycreate a graphical representation of the condor statuscommand output, but we want also to include additionalinformation that is not generated by that command andcould be very useful to detect problems: the last timethat a specific machine executed a job, if it has somespecific time restriction (for instance HTCondor jobsare allowed to run at night and on weekends only), ifthere is enough space in the scratch disk, and manyother parameters that allow us to do an in-depth assess-ment of individual machines.
• To avoid having to install additional software on eachmachine that belong to HTCondor pool.
With these goals in mind, we have developed ConGUSTo,a graphical online supervising and statistics system for HT-
Condor that we believe could be interesting for other HTCon-dor users and administrators. This paper presents ConGUSTo,and is organized as follows: Section 2 gives a brief descriptionof HTCondor and the current log options that it offers, whilein Section 3 we list the main ConGUSTo features. In Section4 we present how ConGUSTo has been implemented, and inSection 5 several illustrative examples are shown. Finally,Section 6 gathers our conclusions and proposes future linesof development.
2. HTCondor and its current log options
This section does not try to be a rigorous or exhaustive de-scription of HTCondor and all its log possibilities; any userinterested in that can consult the extensive documentationavailable at [http:// research.cs.wisc.edu/htcondor/ ]. Our in-tent here is to offer a very short account of how HTCondorworks, and explain briefly those common commands and op-tions available that can be used to obtain information aboutjobs and machines’ status.
2.1 What is HTCondor?HTCondor is an open source software that gives supportto High Throughput Computing (HTC) [http:// research.cs.wisc.edu/htcondor/htc.html ]. It was developed by the Centerfor High Throughput Computing at University of Wisconsin-Madison[http://chtc.cs.wisc.edu/ ]. In a nutshell, accordingto its developers, it is ”a specialized workload managementsystem for compute-intensive jobs”. Basically, HTCondormanages a pool of machines and a queue of jobs: whenevera machine is idle (not being used by their owners and with alow load) HTCondor will match a suitable job to run on it.
HTCondor will carry out all the operations needed tocorrectly match idle machines with queued jobs according tospecifications coming from both, execute those jobs and placethe outputs where the user has specified, successfully dealingwith a wide and complex set of circumstances.
Thus, using the HTCondor software, a group of off-the-shelf PCs connected by a local network can be transformedinto a powerful Supercomputer where users can simultane-ously run several instances of their programs over a varietyof data, reducing considerably the time needed to obtain theresults (up to a factor of several hundreds, depending on the ap-plication, the data and the number of available machines). Be-sides, HTCondor not only provides a substantial boost to com-putational capacity, but also enables a better and much moreefficient use of the available computing facilities, minimizingthe waste of energy and resources. HTCondor is used in manycompanies and institutions, among them the NASA AdvancedSupercomputing Division, the European Organization for Nu-clear Research (CERN) [http:// linuxsoft.cern.ch/cern/mrg/slc5X/x86 64/RPMS/repoview/condor.html ], etc. A moredetailed, technical introduction of HTCondor can be found at[http:// research.cs.wisc.edu/htcondor/description.html ].
2.2 HTCondor logging and statistics optionsHTCondor has several options in its configuration files to man-age logfiles, which are generated and updated by the differentdaemons that HTCondor runs. By default, each computingmachine keeps its own logs, with HTCondor providing a com-mand that allows administrators to consult log files locatedon those machines. As usual, administrators can set the loglevel to decide what information will be stored in the logfiles,specify the place where they will be created, impose a sizelimit, etc.
Users running their jobs with HTCondor can include acommand in their submit files in order to generate specific logfiles for each execution. Once the jobs are done and the logsgenerated, they can be the used to get detailed informationabout the execution. HTCondor provides a set of commandsfor that purpose, such as condor userlog, condor history, etc.If users are interested in getting a graphical visualization ofsuch data, they can use the java application logview or somethird-party applications like the HTCondor Log Analyzer[http:// condorlog.cse.nd.edu/ ].
Finally, if enabled, HTCondor is able to generate somegeneral statistics, which are stored in plain HTML format andcan be displayed graphically by means of a java applet. Thereare two kinds of information: the first is a graph and tabulardata for the Pool User (Job) Statistics (total allocation time,average and peaks of running and idle jobs), the second thePool Resource (Machine) Statistics (average and peak numberof machines according to their states). Information is givenfor the current day, week, month, or any month in the lastyear.
The latest stable versions of HTCondor that have beenrecently released (8.2.x) claim to have an enhanced moni-toring system integrated with the third-part software Ganglia[http://ganglia.info/ ]. We have tested the live demo and foundit much more powerful that any of the previous log and statis-tics systems available in HTCondor. However, it does not ful-fill our requirements, described above, as it seems to be too fo-cused on showing those physical parameters contained in theClassAds, and it does not appear to be compatible with previ-ous versions of HTCondor. There are other third-part softwarealternatives, like CycleServer [http://www.cyclecomputing.com/products-solutions/cycleserver] or Cumin [https:// fedorahosted.org/grid/wiki/CuminForUsers], but although they can bepowerful, they also need a more complex management and/orthe installation of software on each machine of the HTCondorpool.
3. What ConGUSTo offersAs we have just explained, the present HTCondor logging sys-tem is useful for debugging or check details about executions;however, trying to know, for instance, if a machine executedsome job a few days (or months) ago and what and whosejob it was could be really difficult, as it may require to diveinto huge log files all with a somewhat complicated format,or it may be even impossible if the log data are too old, since
logfiles are periodically deleted to save space.Motivated by these limitations, we have developed ConGUSTo,
which offers many features not available in the current HT-Condor implementations. The most important are:
• Graphical view of all jobs executed in a specific ma-chine, with more detailed info about each of them acces-sible online (using any web browser). For each machinein the pool we can show both summarized and detailedinfo about all the jobs that HTCondor has executed onit.
• Friendly and intuitive way to display data. Besidestables with numerical data, most information is alsopresented by means of interactive graphs.
• Data can be presented in periods of one day, one weekor one month, allowing users and administrators as wellto choose the starting day of that period.
• Panoramic view of all machines and slots to see thecurrent HTCondor status in a glance.
• Panoramic view is highly configurable with a widerange of options and filters.
• Easy installation: ConGUSTo only needs to be installedon one machine (typically the web server). No database is required: the data, stored in plain text with aformat similar to CSV, are generated by just one of themachines in the pool (in our case it is the HTCondormaster node, which is on 24/7) using a simple bashscript executed by crontab. Thus there is no need forHTCondor to be installed on the same machine whereConGUSTo is located.
• Fully compatible with previous versions of HTCondor.
• It shows data that at the present moment Ganglia cannotsupply, such as information per slot, time restrictions,last time a machine executed a HTCondor job, andmuch more.
• Adding new pieces of information to show is easy.
4. Implementation of ConGUSToAs already mentioned, our objective is to generate a morefriendly log system based on the information that we canobtain from HTCondor. We want this system to be able toshow, in a intuitive and interactive way, what each machinewas doing at any time, if it was executing a job (and thenwhich job and by whom), whether it was idle, or used bysomeone else. These data must be kept updated and availableonline in order for both HTCondor administrators and usersto be able to visualize them.
4.1 How ConGUSTo retrieves the dataThe jobs data we want to show in principle could be extractedfrom the log files generated by HTCondor. For instance, wecould parse the logs generated by the daemon STARTD oneach machine that executes jobs, in order to track what jobshave been executed in each slot. However, we decided to dis-card this option for a number of reasons: such files generallyhave a different location depending on each machine; theyare usually quite big and it may take a long while to parsethem; their specific format in plain text is quite complex andnot suitable for this purpose; while they contain many usefuldata, some basic, interesting info is missing, for instance thestatus of the job. User’s logs obtained when executing arenot useful either, since they depend on the users’ commandswritten in the submit files, and even if created, they will belocated wherever the user has specified. Finally, the statisticsgenerated by HTCondor are useful for knowing the globalstatus of the jobs queue or the machines’ pool at a given time,but cannot track what each machine has been doing.
Thus, we have implemented our own system to obtain therequired data. Instead of reading the data off the log files,we obtain the information using standard HTCondor shellcommands and then we process their output. We only needto execute the command once to get the information from allmachines, avoiding parsing hundreds of huge log files, onefor each machine.
In this way we obtain all the information we need, restrict-ing it to those jobs that are running or suspended, the oneswe are interested in. The output from this command is thenprocessed by a shell script using simple shell commands suchas grep, sed, awk, tr, cut, etc, and finally stored in a CSV-likeformat. Everything is managed by a bash script periodicallyexecuted by crontab. This script has fewer than 20 lines ofcode, which reflects the efficiency of our approach.
ConGUSTo has been designed in such a way that datadisplaying is totally independent from data generation. Thisperspective has the advantage of not requiring the web serverto run HTCondor itself (we think that web servers should bedoing their work and not running unrelated software pack-ages), and we can use any other machine where HTCondoris running to obtain all data (typically the HTCondor collec-tor). We evaluated the option of storing the collected data ina database, but to make it simple and to avoid the need for adatabase system, we chose to store the data in plain text fileskeeping the format as it is generated (CSV-like). So to letit work, we only need to make sure that data are stored in alocation accessible by the web server. For example, files canbe created in a shared directory accessible from the web servervia NFS, or transferred by FTP, etc. The file organization isalso simple: there is a root directory and then subdirectoriesfor years, months and days, in a tree structure where the nodesare files of a concrete date, one file per each machine. Thisorganization pattern based on dates and machines makes iteasy to find the data for a specific date or range, and alsomakes the installation of ConGUSTo in other systems much
simpler.On the other hand, there is also some information that does
not need to be stored, for instance the current state of machinesin the pool. This kind of data is obtained in real-time and sinceit is directly displayed, there is no need to save it. (Those dataare obtained by the use of the condor status command, forcingit to produce its output with a predetermined format.)
All the commands and applications that ConGUSTo usesto get and store the data are (or should be) available in anyLinux machine. We also expect that implementing the sametools in Windows should be relatively straightforward.
4.2 How ConGUSTo displays the dataConGUSTo has been developed from scratch. To generatethe web pages that display the information we have chosenPHP [http://php.net/ ]. PHP is a web programming languagewidely popular, available on virtually all Operating Systems,and used by such big enterprises or web projects as Wikipedia,Yahoo, (some parts of) Facebook, Wordpress, etc. [http://en.wikipedia.org/wiki/PHP ]. As it can be run in Linux andWindows Server (and Mac OS X as well), it helps make ourimplementation very portable.
All the calculations needed to process and display the dataare done by PHP scripts, while graphs are generated using theAPI of Google Charts [https://developers.google.com/chart/ ],also widely used and customizable. This allows us to showrich, interactive graphs where users can consult specific items.ConGUSTo translates the information stored in data files intoa representation that Google Charts can understand in orderto draw the graphs. We have customized this translationprocess in such a way that adding new data and graphs iseasy: most times it is sufficient to specify the new graphposition and type to automatically generate it. This proved tobe especially useful in the code that shows a panoramic viewof the current status of all machines, where dozens of optionshave been implemented to show or hide different kinds of datafor every machine and/or slot, filter them according a wideset of attributes, or select among a large number of predefinedgraphs. In particular, user can choose to show or hide threemain groups of information (machines, queue, graphs aboutattributes), while each of these groups can be independentlycustomized. For machines, a lot of different data are available,like name, number of slots, free disk space (total and perslot), memory (total and per slot), Operating System, averageload (both total and HTCondor), etc. Besides this generalinformation, our tool also stores some specific data, one of thestrong points of our implementation, since it is not commonlyoffered by other tools: time restrictions on jobs execution, lasttime a job was executed on each machine, etc.
To finish, we want to mention other third-party tools andsnippets we have used in our development, such as SCW(Simple Calendar Widget) to present the calendar [http://www.tarrget.info/calendar/ scw.htm], Tooltip [http:// jqueryui.com/ tooltip/ ] to display extra information according to thecontext, Chosen to allow searches on the lists [https://github.
5. Some examplesWe present in this section several screenshots of ConGUSToto illustrate its functionalities and main features.
The first contact you have with our tool is a screen whereyou can choose which date, machine and view you want tosee, as shown in Fig 1. All the options are displayed ina friendly style: users can choose the date pressing on anavigable calendar, while machines can be selected from a listthat includes a search box, so it is even easy in large systemswith hundreds of machines. Several views are available andthey will be explained next.
Figure 1. Users can select a specific machine for which todisplay usage statistics.
5.1 Daily jobs execution on a machine (summary)This first view will present summarized information about theselected day, as is shown in Fig. 2. Two graphs are displayedwith a timeline listing the number of jobs executed at anymoment (upper graph displays the AM hours and lower onethe PM). The number of jobs that are or were running areshown in blue, while those in red are the suspended ones. Thisgraph gives us in a glance an overview of what HTCondorhas been doing on that machine, when it has been executingjobs and when some activity has been detected and jobs weresuspended.
After the graphs, users can find a table that gathers quanti-tative data about the total time spent. The first row shows themaximum theoretical time limit; the second row displays thetotal amount of time the machine has been used by its owneror was idle (total time is printed alongside the average perslot and percentages), while the third row collects the totaltime consumed by HTCondor, broken down into time usedwhen jobs are running and when are suspended (fourth andfifth rows, respectively).
5.2 Daily jobs execution in a machine (details)If users want further information about the execution on anspecific day, they can choose the detailed view as shown in
Figure 2. Usage statistics for machine ”epico” for a specificday. The vertical axis represents the number of CPU cores (8in this case).
Fig. 3. This view is similar to the summary, but graphs showdetailed information about each job that was executed on eachslot of the selected machine. As in the summary, for a clearerview the timeline is split between AM and PM hours, andjobs are shown in blue when they are running and in red whensuspended. Among the information displayed is the ID of thejob, the current status, its user, initial and ending time, andthe total duration. If the job is long enough and there is space,part of that information will be printed on the job. If not, allinformation will be shown in a small pop-up window whenyou place the pointer over the job. Thanks to this view onecan get such data as what jobs and users were executing onan machine, and use this information to gather further data incase of any issue.
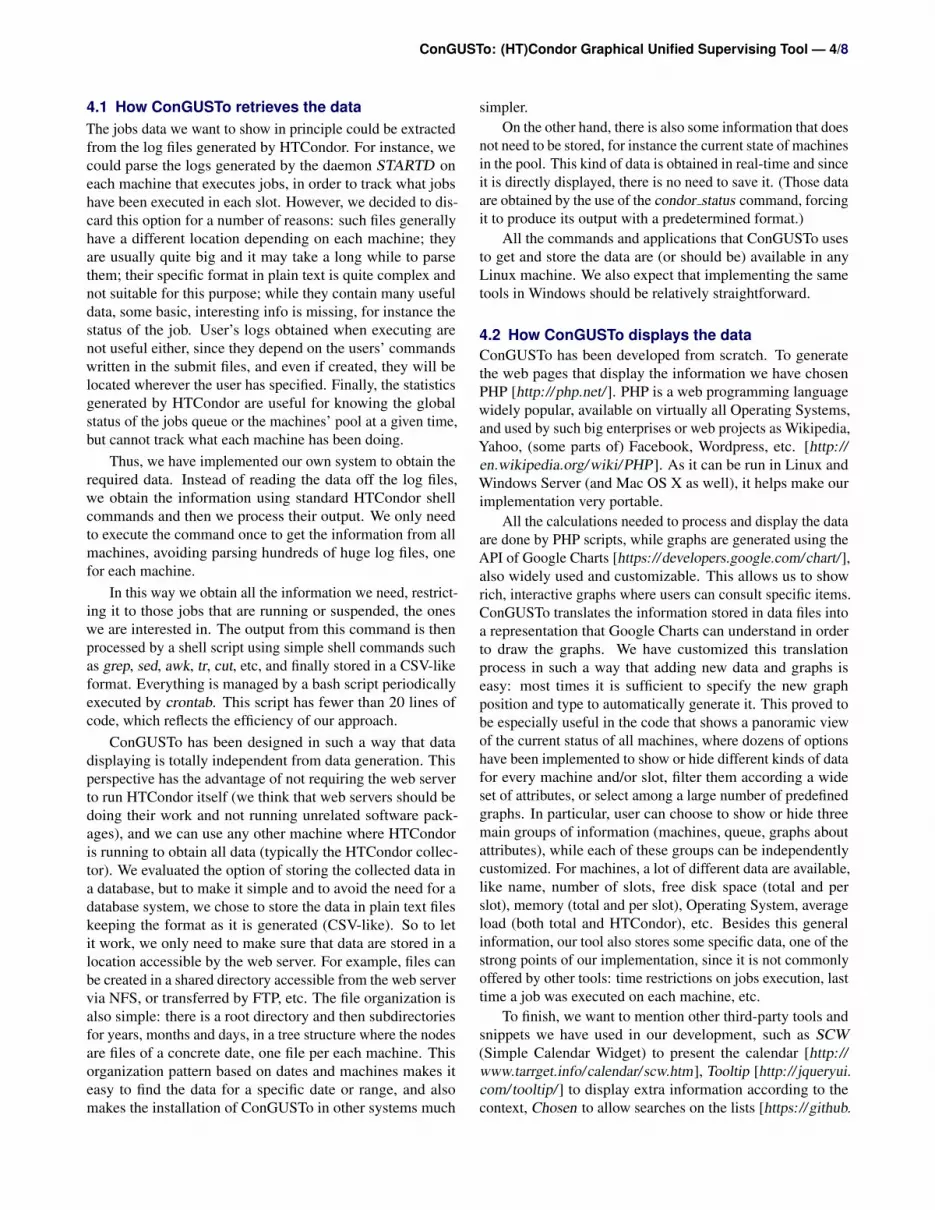
5.3 Weekly and monthly jobs execution in a machineBesides the summarized and detailed information for specificdays, our tool also offers an overview of HTCondor usagefor one-week and one-month periods. Users can choose thestarting date of those periods and then display the cumulativehours and percentage of time consumed by HTCondor. Fig. 4illustrates the one-week-period in both graphical and tabularway.
The month view is similar to the week one, as it is shownin Fig. 5. It offers a wider view of the performance of thatmachine, so it is easy to identify the days of highest or lowestusage, and then inspect summarized and/or detailed informa-tion about them with other views.
5.4 HTCondor machine panoramic viewThe previous views allowed us to know the past and currentstatus of a specific machine. Now we present a powerful,
Figure 3. Graphical representation of all jobs that wereexecuted on ”epico”. By positioning the cursor on a specificjob, a tooltip is produced with detailed information.
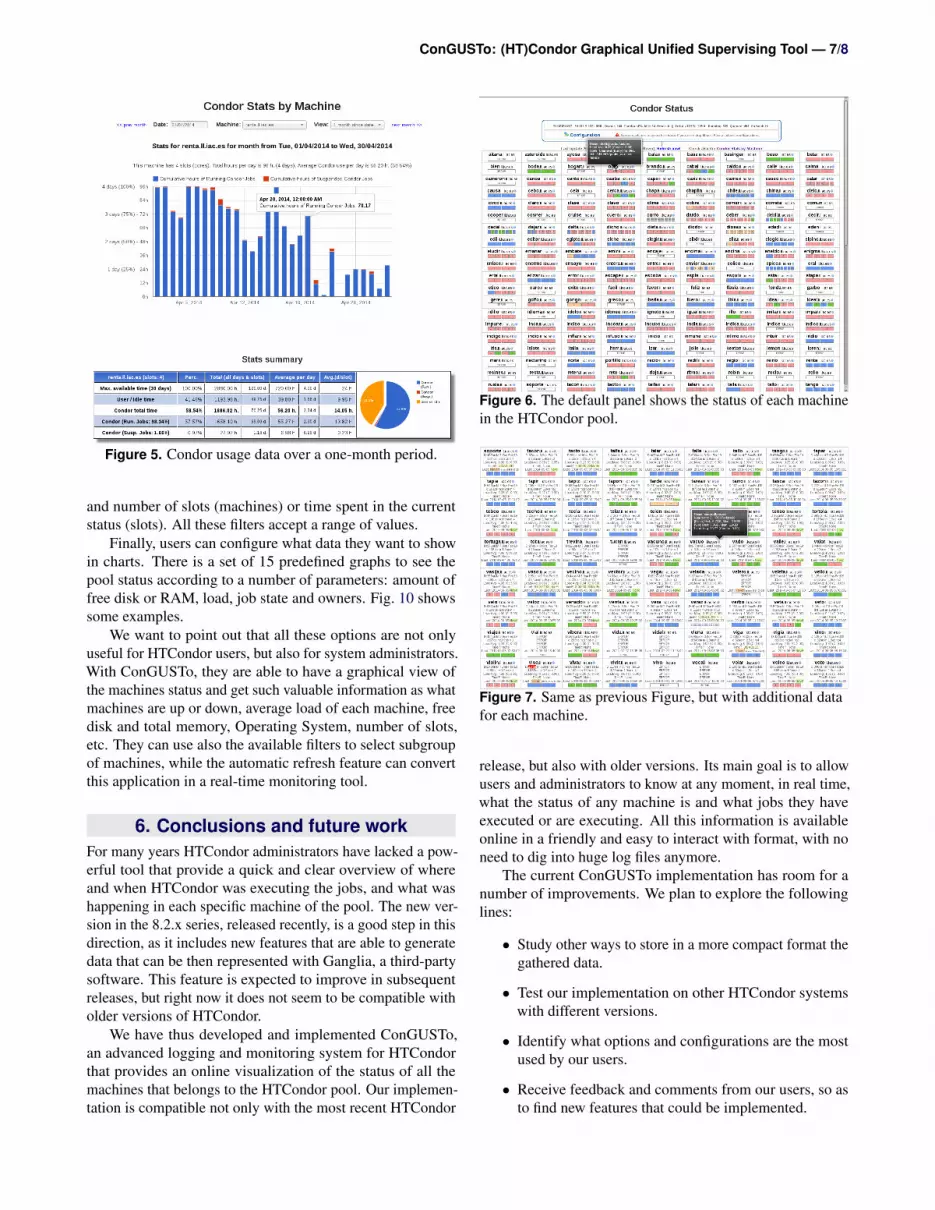
panoramic view that lets us know in a glance the global status,at the current time, of all machines in the HTCondor pool.This view can be seen as a complement of the condor statuscommand, where the data are graphically displayed instead ofbeing printed in a large text list, and with many more featuredadded. Fig. 6 shows the default, basic view.
Machines are represented with boxes and each slot is dis-played with a different color according to its state (blue whenthey are used by their owners, red when running HTCondorjobs, green when idle, etc.), preceded by a summary of thepool general status and the link to the configuration options.By default only the name of the machine and the state ofslots are displayed, since our aim is to keep the visualizationas clean as possible. Therefore, detailed information is notpresented by default, but our tool is able to gather much moreinformation that users can consult by just placing the pointerover one specific machine or slot. Then extra info is displayedin a contextual window: free disk space, RAM, number ofslots, Operating System, total average load and HTCondoraverage load, time restrictions, last time of HTCondor exe-cution, and many other indicators. However, if users wantsto have all these data in the main window, they can use thewide set of provided configuration options to exactly selectthe specific items to be displayed, as well as enable or disablethe contextual windows. For instance, Fig. 7 shows a moredetailed view of the pool status.
The above data are complemented with information about
Figure 4. Condor usage over a one-week period for machine”renta”. Blue color represents the time consumed by runningjobs, while red color is used for the suspended ones.Summary table shows total values, together with additionaldata to make comparisons easier, like the average data perday and per day/slot.
the number of machines and slots shown and the HTCondorqueue status that is shown right after. Fig. 8 shows the sum-mary of the queue, similar to the output of the condor status-submitters command. It consists of a table listing the totalnumber of jobs, further broken down by their state (running,queued or held) and by their users.
The real power of this tool lies in its configuration capa-bilities and in the many available filters. Fig. 9 shows theconfiguration window, which begins with general options toenable or disable the three main groups: info about machines,info about HTCondor queue, and graphs to represent the data.Users can configure which information and how they want todisplay for each machine and/or slot, such as hardware param-eters (free disk, RAM, etc.), software (OS, average load, etc.),and HTCondor specific data (time restrictions, last time of ex-ecution, etc.). Further options let users to order the machinesaccording to several criteria, display alerts if the free diskspace is lower than a specified limit, or enable the automaticupdate of the information in preconfigured time periods.
Next, blocks are used to apply filters on the machines,allowing users to have a more refined control of the HTCondorpool. In this way users can decide which machines and/orslots they want to display according to their communicationstatus (up or down), which Operating System and version isinstalled, the state of the slots, what user is running what jobon them, etc. Right after, there is a battery of filters to showor hide machines or slots according to attributes like memory,free disk space, system average load, HTCondor average load
Figure 5. Condor usage data over a one-month period.
and number of slots (machines) or time spent in the currentstatus (slots). All these filters accept a range of values.
Finally, users can configure what data they want to showin charts. There is a set of 15 predefined graphs to see thepool status according to a number of parameters: amount offree disk or RAM, load, job state and owners. Fig. 10 showssome examples.
We want to point out that all these options are not onlyuseful for HTCondor users, but also for system administrators.With ConGUSTo, they are able to have a graphical view ofthe machines status and get such valuable information as whatmachines are up or down, average load of each machine, freedisk and total memory, Operating System, number of slots,etc. They can use also the available filters to select subgroupof machines, while the automatic refresh feature can convertthis application in a real-time monitoring tool.
6. Conclusions and future workFor many years HTCondor administrators have lacked a pow-erful tool that provide a quick and clear overview of whereand when HTCondor was executing the jobs, and what washappening in each specific machine of the pool. The new ver-sion in the 8.2.x series, released recently, is a good step in thisdirection, as it includes new features that are able to generatedata that can be then represented with Ganglia, a third-partysoftware. This feature is expected to improve in subsequentreleases, but right now it does not seem to be compatible witholder versions of HTCondor.
We have thus developed and implemented ConGUSTo,an advanced logging and monitoring system for HTCondorthat provides an online visualization of the status of all themachines that belongs to the HTCondor pool. Our implemen-tation is compatible not only with the most recent HTCondor
Figure 6. The default panel shows the status of each machinein the HTCondor pool.
Figure 7. Same as previous Figure, but with additional datafor each machine.
release, but also with older versions. Its main goal is to allowusers and administrators to know at any moment, in real time,what the status of any machine is and what jobs they haveexecuted or are executing. All this information is availableonline in a friendly and easy to interact with format, with noneed to dig into huge log files anymore.
The current ConGUSTo implementation has room for anumber of improvements. We plan to explore the followinglines:
• Study other ways to store in a more compact format thegathered data.
• Test our implementation on other HTCondor systemswith different versions.
• Identify what options and configurations are the mostused by our users.
• Receive feedback and comments from our users, so asto find new features that could be implemented.
Figure 8. Summary of the current status of HTCondor usage,broken down by status and users.
Figure 9. Configuration panel with the list of all applicableoptions and filters to customize the panoramic view.
• Assess in detail the capabilities provided in the latestHTCondor release and see how they can be incorporatedinto ConGUSTo to enhance and expand it.
Software availabilityWhile at the moment ConGUSTo is not publicly available,interested users can contact us via email to get a copy. Wewill be more than happy if you wish to share your impressionsand feedback with us.
ConGUSTo is distributed in a .tar.gz file. Detailed in-stallation instructions will be provided to interested parties,however the basic steps are:
1. Decompress the tar file in a directory of your web serverwhere you can run PHP script files.
2. Build the file containing the list of machines (this isused to list all machines belonging to the pool, even if
Figure 10. Charts summarizing the current HTCondor usage.
they are not active at that moment), by using the scriptbuild machine file.sh in any machine in the HTCondorpool; and then move that file to the same directorywhere you decompressed the files in step 1.
3. Install crontab entry to get the periodic data. That canbe done in any machine running HTCondor, but sinceyou have to ensure it will be always working, we rec-ommend you install it on the HTCondor master node.If this machine is different from the web server, makesure that the web server have read access to the generatefiles.
4. Set the system up by setting the configuration variableswith the appropriate values.
AcknowledgmentsWe thank our colleagues in the IT Department who helped uswith many small problems related to HTCondor, especiallyissues with firewalls, HTCondor startup files, etc. A big thankis due to Angel de Vicente, who was the first to install andmaintain HTCondor in our Institute, and the main responsiblefor the big popularity it is having, in term of usage, amongour researchers.