Page 1
www.elsevier.com/locate/ijcard
International Journal of Cardio
Correlation between the tissue Doppler, strain rate, strain imaging during
the dobutamine infusion and coronary fractional flow reserve
during catheterization: a comparative study
Sinan Dagdelena,*, Murat Yucea, Yunus Emiroglub, Mehmet Ergelenb, Selcuk Palab,
Ali Cevat Tanalpb, Akin Izgib, Cevat Kirmab
aAcibadem Hastanesi, Tekin sk. No. 18, Acibadem, Kadikoy, Istanbul, TurkeybKosuyolu Heart and Research Hospital, Istanbul, Turkey
Received 1 December 2003; received in revised form 11 May 2004; accepted 18 May 2004
Available online 28 August 2004
Abstract
Coronary fractional flow reserve (FFR) as an invasive, and dobutamine stress echocardiography (DSE) as a noninvasive technique were
used to detect critical coronary stenosis. This study was undertaken to assess correlation between these two techniques by using tissue
Doppler, strain rate (SR), and strain imaging (S).
Methods: In 17 patients (aged 54.9F12.6, 4 F), a total of 22 vessels were studied. On dobutamine stress echocardiography, baseline and peak
systolic (Sm), early (Em) and late (Am) diastolic myocardial velocities, SR and S were recorded from parasternal view (mid-posterior
segment) for radial and apical view (mid-septum) for longitudinal deformation. Then coronary FFR was performed by using intracoronary
adenosine infusion, and the value of V0.75 was accepted as critical coronary stenosis.
Results: FFR was found to be significant in 10 vessels (FFR critical). Baseline Sm, Em/Am, SR, S values, and peak Em/Am, SR, S values
were similar between critical or noncritical FFR groups. Baseline Sm and Em, and change between baseline and peak Sm and S were
significantly higher in noncritical FFR group ( pb0.01, b0.05, b0.001, b0.001, respectively). In all vessels, FFR after adenosine infusion
showed a poor correlation with WMSI, Em, Am, Em/Am values, and the change in SR values (r=�0.22, 0.16, �0.14, 0.21, 18, respectively)
showed a good correlation with the change in S (r=0.51; p=0.014), and a very good correlation with the change in Sm values (r=0.77;
pb0.001) during DSE. When FFR values at left coronary system were analyzed for longitudinal SR and S values, it had a mild correlation
with SR (r=0.47, p=0.044) and a good correlation with S (r=0.66, p=0.002).
Conclusion: The quantification of regional myocardial deformation by using DSE rather than the motion would be more appropriate in
detecting the ischemic dysfunctional segment supplied by the critical coronary stenosis. Strain measurement during the dobutamine infusion
may provide an information on the FFR results of the culprit vessel.
D 2004 Elsevier Ireland Ltd. All rights reserved.
Keywords: Stress echocardiography; Strain rate; Coronary flow reserve
1. Introduction
Dobutamine stress echocardiography (DSE) is a well-
established method for detecting inducible ischemia. Ische-
mia is defined by a regional reduction or deterioration of
0167-5273/$ - see front matter D 2004 Elsevier Ireland Ltd. All rights reserved.
doi:10.1016/j.ijcard.2004.05.012
* Corresponding author. Tel.: +90 216 544 41 23; fax: +90 216 325 87
59.
E-mail address: [email protected] (S. Dagdelen).
myocardial thickening or inward motion of the endocardial
border [1,2]. However, visual assessment of regional
myocardial function during dobutamine stress echocardiog-
raphy has been shown to be highly subjective and dependent
on image quality [3,4]. These difficulties required a new
fully quantitative method to evaluate stress echocardio-
grams. Regional strain rate measuring the rate of myocardial
deformation and regional strain defining the total amount of
deformation can now be derived by post-processing a high
logy 102 (2005) 127–136
Page 2
S. Dagdelen et al. / International Journal of Cardiology 102 (2005) 127–136128
frame rate myocardial Doppler velocity data set [5]. Left
ventricular wall motion is depicted accurately at rest and
during ischemia, including dobutamine-induced ischemia
[6,7]. Recent reports on the use of strain rate (SR) imaging
during DSE for viability and ischemia are promising [8,9].
Also, it has been showed that Doppler SR imaging is
feasible and able to objectively differentiate between the
ischemic and the nonischemic myocardium compared to
conventional DSE [10].
The shortcomings of angiography to assess the physio-
logic significance of coronary atherosclerosis are well
known [11,12]. Particularly in patients with diffuse disease
or unstable coronary syndromes, the angiogram is of little
help to ascertain the potential of an individual stenosis to
cause reversible myocardial ischemia.
Fractional flow reserve (FFR) is such an index, and is
defined as the ratio of maximum blood flow in a stenotic
artery to normal maximum flow in the same vessel [13]. In
contrast to most other invasive indices, FFR has a direct
clinical relevance for determining critical coronary stenosis
which causes myocardial ischemia [14]. The characteristics
of FFR have been extensively described and validated over
recent years. Fractional flow reserve can be calculated by
taking the ratio of mean distal coronary pressure to aortic
pressure during maximum coronary hyperemia, which
generally is induced by intracoronary adenosine adminis-
tration. In contrast to other invasive indices, FFR is not
dependent on changes in heart rate, blood pressure, or
contractility [15]; it also accounts for the presence of
collaterals [16], and has a high threshold value to indicate
inducible ischemia [17]. The bgray zoneQ is very limited,
which is important for clinical decision making in an
individual patient. In recent years, both SR imaging during
the DSE as noninvasive and the FFR as an invasive
technique have been extensively used to differentiate
between clinically and angiographically significant coronary
stenosis. However, the relationship between SR imaging
parameters during DSE and FFR is not clear. Thus, this
study investigates regional myocardial strain rate and strain
response during the DSE and its correlation with FFR in
patients with coronary artery disease.
2. Methods
2.1. Study population
The study population comprised 17 selected patients
referred for DSE to detect the presence or absence of
inducible ischemia. After DSE study, all patients underwent
coronary angiography. Patients not in sinus rhythm, with
bundle-branch block, with a prior history of myocardial
infarction within the last 2 months, more than mild
myocardial hypertrophy, dilated cardiomyopathy, persistent
atrial or ventricular arrhythmia, hypertension (systolic and
diastolic blood pressure N200/120 mm Hg, respectively),
more than mild valvular heart disease, or left ventricular
ejection fraction less than 35% were not included to the
study. After coronary angiography, exclusion criteria were as
follow: (1) incessant chest pain not responding to medical
therapy; (2) left main or severe three coronary artery disease;
(3) prior coronary artery bypass grafting; and (4) vessels that
were totally occluded or supplying an akinetic territory by
visual assessment of the left ventricular angiogram.
3. Study protocol
The ethical committee approved the study and informed
consent was obtained from all patients. Patients who were
scheduled for DSE and who did not have exclusion criteria
were included in the study consecutively. All subjects
consented to participate in the study after receiving detailed
protocol information. The day before DSE, all antianginal
medications were discontinued, which include beta block-
ers, Ca antagonists, and nitrates. Following DSE, within 6 to
12 h, all patients underwent coronary angiography without
taking any long acting medications. In the case of an anginal
attack during or after DSE, only sublingual short acting
nitrates were given to the patients. After the coronary
angiograms were reviewed, eligible coronary arteries that
were found to have stenosis of intermediate severity were
undertaken for FFR study. In the patients who have more
than one critical coronary stenosis, FFR study was made on
the coronary stenosis which is more important to make
decision whether the patient is a candidate for bypass
surgery or percutaneous coronary intervention alone. Frac-
tional flow reserve was measured just after coronary
angiography at the same setting. After the FFR study, the
myocardial segments supplying the coronary arteries studied
with the FFR were compared with the SR imaging
parameters of the same segments on DSE. In 17 patients,
the presence of 40% coronary stenosis was noted in one in
six, two in eight, three in four, and four in four cases. A total
of 22 vessels were evaluated by the FFR, and 22 left
ventricular segments supplying these coronary vessels were
studied by DSE and tissue Doppler examination. Among the
vessels studied by the FFR, 16 were for left anterior
descending, three for circumflex and three for right coronary
artery. In the patients studied for the right coronary arteries,
the right system vessels were dominant.
3.1. Transthoracic echocardiography
Studies were performed with a Vivid Five instrument
(GE Vingmed Ultrasound, manufactured in Horten, Nor-
way) using a phased-array duplex multifrequency trans-
ducer. In all subjects, the transducer was set at 2.5 MHz for
Doppler examination and 2.5 to 3.5 MHz for tissue imaging,
and second harmonic imaging was used. Two-dimensional,
M-Mode and Doppler echocardiography were obtained by
imaging of the parasternal long and short axes, by apical
Page 3
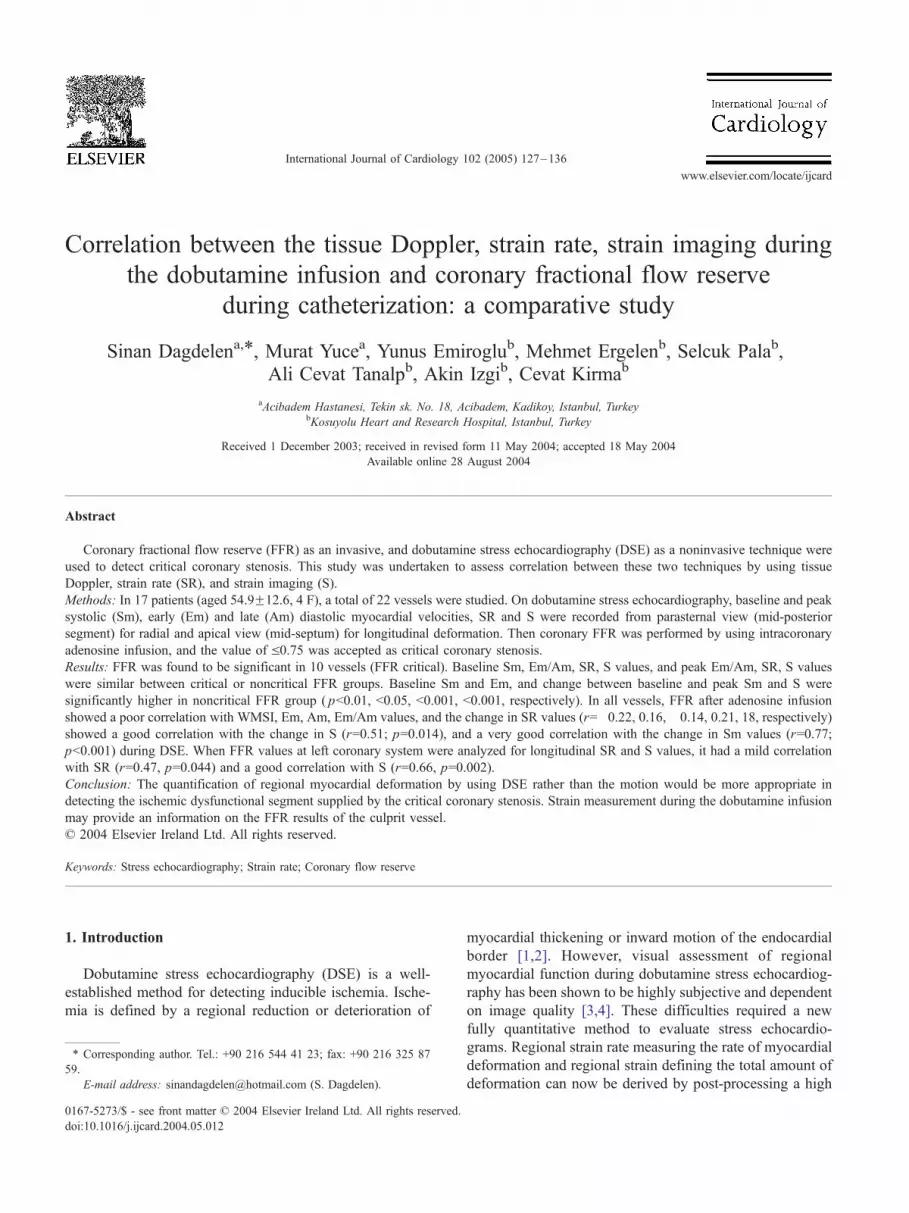
Fig. 1. Tissue Doppler imaging from the mid-apikoseptal segment at rest
(upper) and during dobutamine stress (bottom) shows significant decrease
in early and increase in late diastolic myocardial velocity with dobutamine.
S. Dagdelen et al. / International Journal of Cardiology 102 (2005) 127–136 129
four-chamber view, and by apical two-chamber view. The
left ventricle was divided according to the 16-segment
model of the American Society of Echocardiography [18].
Each left ventricular segment was scored at rest and during
dobutamine stimulation as normokinetic, hypokinetic, aki-
netic, dyskinetic or aneurysmatic.
3.2. Dobutamine stress echocardiography
A graded dobutamine infusion was administered through
a peripheral arm vein. Three-minute stages were used at
infusion rates of 5, 10, 20, 30 and 40 g/kg/min, respectively.
The infusion was stopped at the dose when N85% of age-
predicted heart rate was reached. Also, if the heart rate was
required to be increased, the infusion of dobutamine was
continued and supplemented with 0.25-mg doses of atropine
(to a maximal dose of 1 mg). Stress testing was terminated
either on patient request or when a new wall motion
abnormality, chest discomfort indicative of progressive
angina, dyspnea, decrease in systolic blood pressure (N40
mm Hg), arterial hypertension (RRN240/120 mm Hg),
severe arrhythmias or other serious adverse effects occurred.
During the DSE, the ischemic response has been defined
as a new wall motion abnormality, a decreased left
ventricular ejection fraction, and/or a worsening in the
abnormal myocardial segment at rest.
3.3. Tissue and strain Doppler imaging
Color tissue Doppler recordings were obtained at rest and
during dobutamine stress using the same apical transducer
positions. Longitudinally mid-apikoseptal segment from
apical four chamber view and mid-anterolateral segment
from apical two chamber view were used to evaluate left
anterior descending and diagonal coronary system; longi-
tudinally mid-posterolateral segment from apical four
chamber view was used for circumflex and optus marginal
coronary arteries; and radially mid-inferoposterior segment
from parasternal short axis view was used for dominant
right coronary artery. The ultrasonic beam was placed on the
two segments with less than 308 angles, between ultrasonic
beam direction and longitudinal axis of the myocardial
segment. Thus, instantaneous differences between the two
adjacent regions implied either compression or lengthening
of the tissue in between. Baseline and peak systolic (Sm),
early (Em) and late (Am) diastolic myocardial velocities
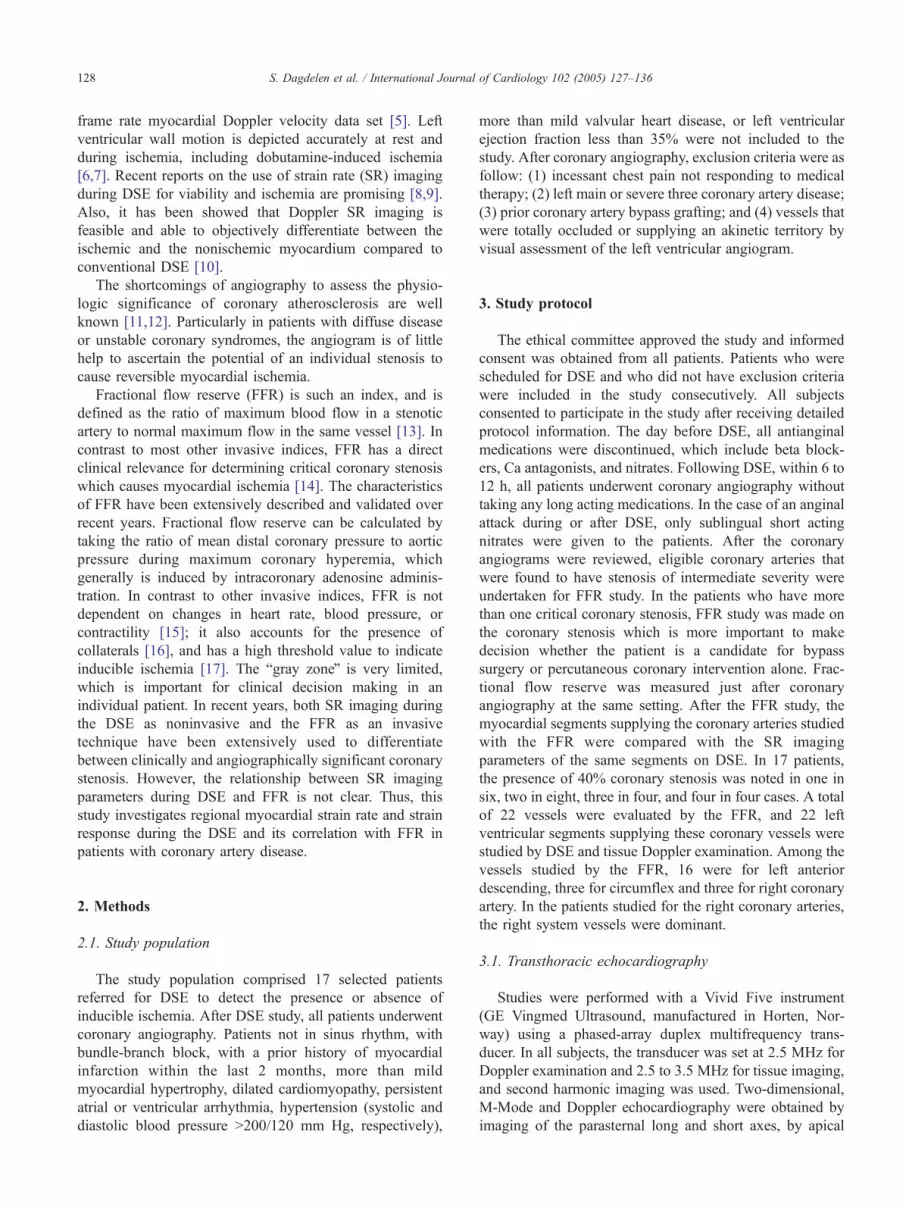
(Fig. 1), strain rate (SR) and strain (S) were measured from
the related segments (Fig. 2). The peak systolic tissue
velocity was determined as the maximal positive velocity
within 350 ms after the QRS complex. The tissue and strain
rate Doppler values were calculated as the difference
between the two velocity points along the ultrasonic beam
divided by the distance between the points (10 mm in our
analysis). Recordings were stored digitally as two-dimen-
sional cineloops and analyzed with customized dedicated
research software (EchoPAC, GE Vingmed Ultrasound,
Horten, Norway), and monitored with a Sony Multiscan
G200 (Vivid Five monitor assembly, Mexico). Digital loops
of single cardiac cycles were collected with a frame rate
varying from 60 to 65 frames/s, and to minimize the noise
level, the pulse repetition frequency was set to 250 to 300
Hz. The Nyquist limit for velocity was set between 8.9 and
14 mm/s. The differences between the two points per unit
length express instantaneous regional myocardial deforma-
tion or strain rate and have units of 1/s. By integrating the
velocity gradients over time, we obtained strain through the
cardiac cycle.
3.4. Pressure measurements and calculation of FFR
At the conclusion of coronary angiography, the coronary
artery was selectively engaged with a 7F guiding catheter. A
0.014-in. pressure guide wire (WaveWire, RADI Medical
Sytems, Upsala, Sweden) was set at zero, advanced into the
Page 4
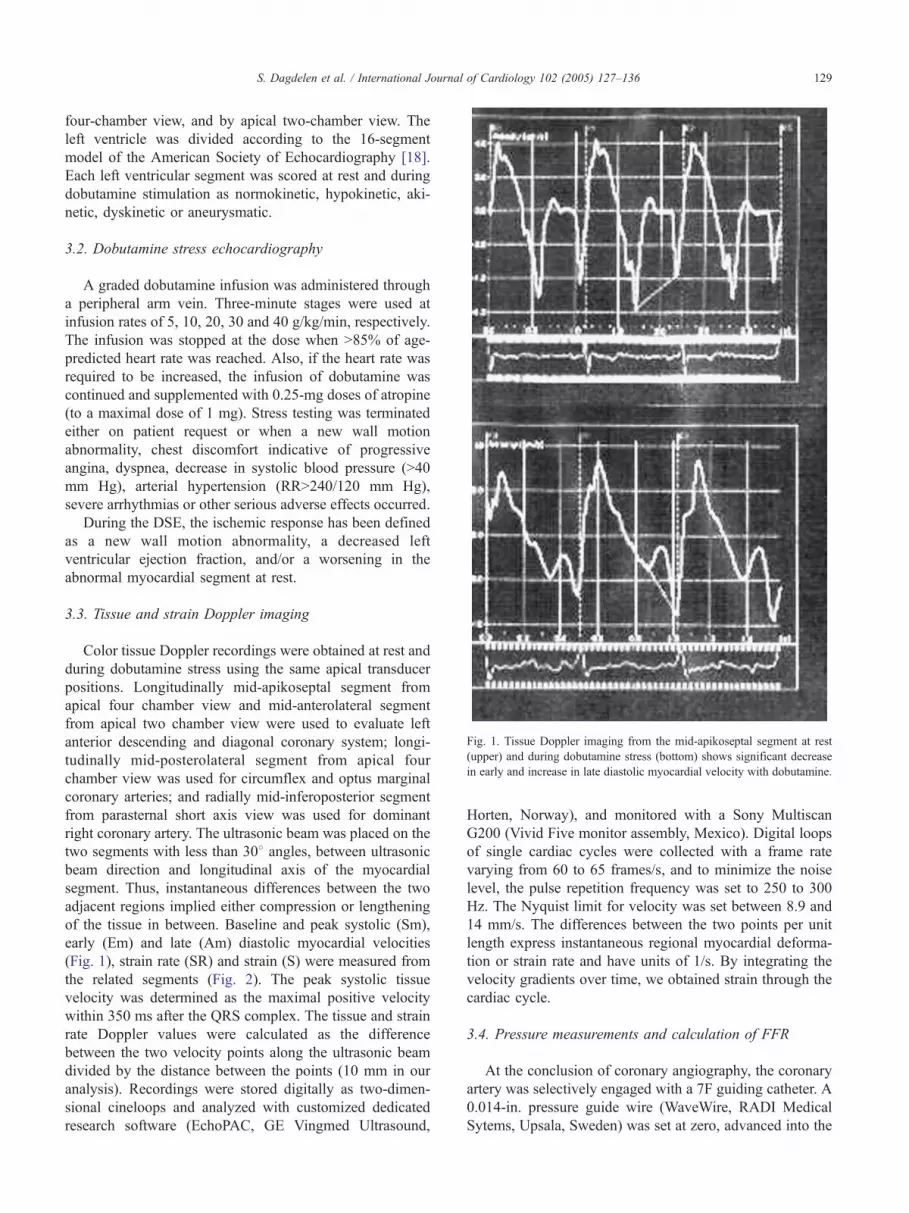
Fig. 3. Fractional flow reserve (FFR) from left anterior descending coronary
artery of the same patient depicted in Fig. 1. Before the adenosine infusion,
S. Dagdelen et al. / International Journal of Cardiology 102 (2005) 127–136130
coronary artery, normalized, and then positioned distal to
the stenosis to be measured. The aortic pressure and the
distal coronary pressure were measured continuously by the
guiding catheter and the pressure guide wire, respectively.
Fractional flow reserve was calculated as: FFR=Pd/Pa,
where Pd (distal coronary pressure) and Pa (aortic pressure)
were recorded simultaneously during maximal coronary
hyperemia induced by intracoronary bolus infusion of
adenosine (36 to 42 Ag in the left coronary artery system
and 18 to 24 Ag in the right coronary artery), as described
previously [19]. Coronary lesion in which FFR was 0.75
was accepted as noncritical stenosis; if the FFR was b0.75,
it was accepted as critical stenosis. The selection of 0.75 as
the cutoff value for the FFR in determining whether it is
critical or not was based on the results of previous studies
[14,20]; Fig. 3.
3.5. Statistics
Statistical analysis was performed using SPSS 11.0
statistical software (SPSS, Chicago, IL). In this study,
DSE, SR and S Doppler imaging parameters were obtained
from the left ventricular segment which is supplied by the
coronary artery investigated with the FFR. These were
analyzed and compared with the FFR values of the same
instrument calibration was 1.00 at rest (upper) and after adenosine infusion
(bottom), FFR value decreased from normal to 0.58.
Fig. 2. Strain rate imaging from the same patient depicted in Fig. 1 and left
ventricular segment at rest (upper) and during dobutamine stress (bottom)
shows significant decrease in strain with dobutamine.
vessels. Strain Rate and S imaging parameters obtained
longitudinally (19 vessels except the right coronary artery)
correlated with the FFR values. The changes in baseline and
peak SR, S and tissue Doppler parameters were correlated
with the FFR values in all vessels (N=22). Analyzing the
longitudinal deformation of the related left ventricular
segment, right coronary investigation (three cases) was not
included for the comparison and the correlation of the SR
and S values. Fractional flow reserve values of all the vessels
were correlated with the ratio of the change between the
baseline and peak Doppler parameters for both longitudinal
and radial strain imaging. All the data analyses and
comparisons between imaging modalities were performed
on a segmental level. Continuous parameters were expressed
as meanFS.D. Grouped data were tested for normal
distribution and equality of S.D. and compared by a two-
tailed t test. Categorical variables were tested with Fisher
exact test and Chi-square test. Probability values of pb0.05
were considered statistically significant.
4. Results
Patients with and without ischemic response did not
differ significantly with respect to age, gender, medication,
hypertension, diabetes and previous myocardial infarction
(Table 1). Baseline and peak heart rate and blood pressure
measurements were not significantly different in patients
Page 5
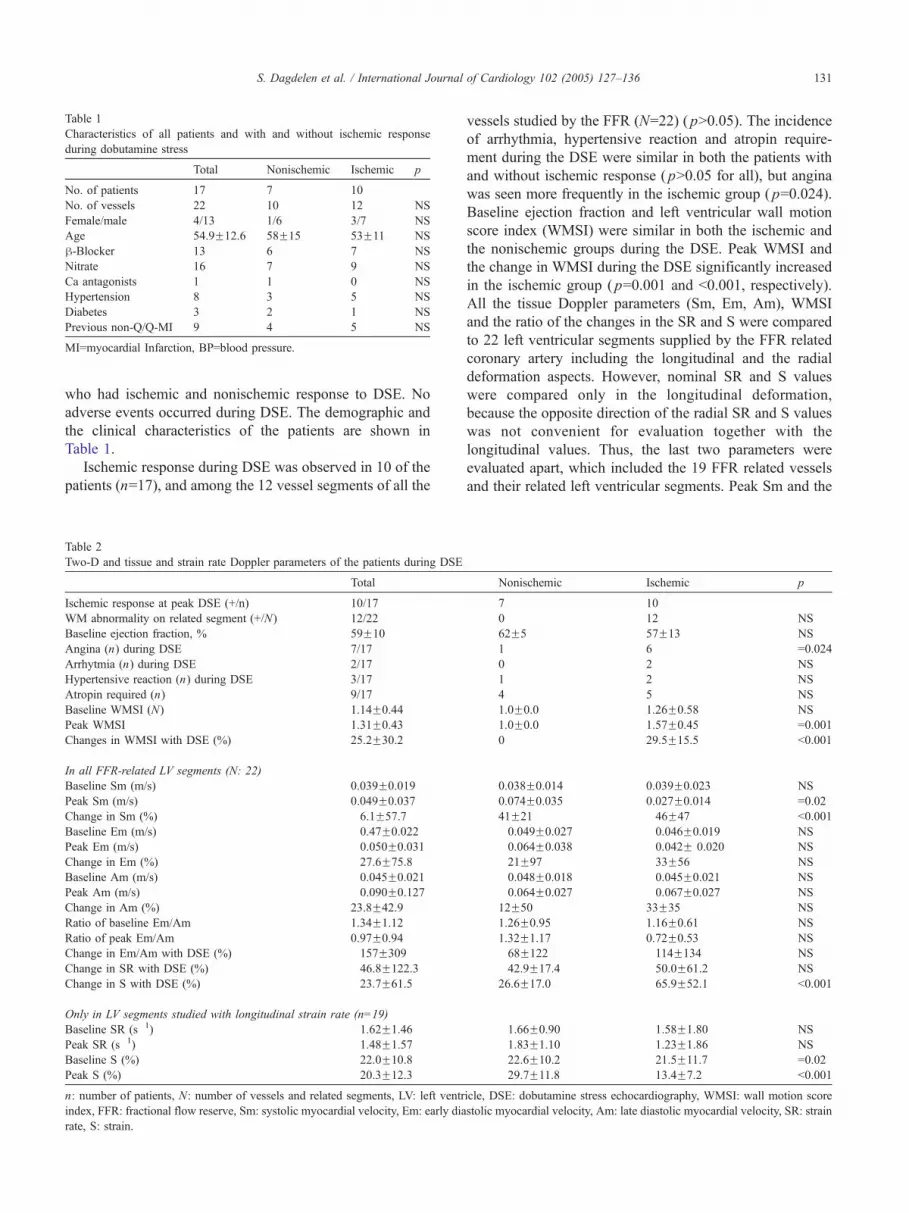
Table 1
Characteristics of all patients and with and without ischemic response
during dobutamine stress
Total Nonischemic Ischemic p
No. of patients 17 7 10
No. of vessels 22 10 12 NS
Female/male 4/13 1/6 3/7 NS
Age 54.9F12.6 58F15 53F11 NS
h-Blocker 13 6 7 NS
Nitrate 16 7 9 NS
Ca antagonists 1 1 0 NS
Hypertension 8 3 5 NS
Diabetes 3 2 1 NS
Previous non-Q/Q-MI 9 4 5 NS
MI=myocardial Infarction, BP=blood pressure.
S. Dagdelen et al. / International Journal of Cardiology 102 (2005) 127–136 131
who had ischemic and nonischemic response to DSE. No
adverse events occurred during DSE. The demographic and
the clinical characteristics of the patients are shown in
Table 1.
Ischemic response during DSE was observed in 10 of the
patients (n=17), and among the 12 vessel segments of all the
Table 2
Two-D and tissue and strain rate Doppler parameters of the patients during DSE
Total
Ischemic response at peak DSE (+/n) 10/17
WM abnormality on related segment (+/N) 12/22
Baseline ejection fraction, % 59F10
Angina (n) during DSE 7/17
Arrhytmia (n) during DSE 2/17
Hypertensive reaction (n) during DSE 3/17
Atropin required (n) 9/17
Baseline WMSI (N) 1.14F0.44
Peak WMSI 1.31F0.43
Changes in WMSI with DSE (%) 25.2F30.2
In all FFR-related LV segments (N: 22)
Baseline Sm (m/s) 0.039F0.019
Peak Sm (m/s) 0.049F0.037
Change in Sm (%) �6.1F57.7
Baseline Em (m/s) �0.47F0.022
Peak Em (m/s) �0.050F0.031
Change in Em (%) �27.6F75.8
Baseline Am (m/s) �0.045F0.021
Peak Am (m/s) �0.090F0.127
Change in Am (%) 23.8F42.9
Ratio of baseline Em/Am 1.34F1.12
Ratio of peak Em/Am 0.97F0.94
Change in Em/Am with DSE (%) �157F309
Change in SR with DSE (%) �46.8F122.3
Change in S with DSE (%) �23.7F61.5
Only in LV segments studied with longitudinal strain rate (n=19)
Baseline SR (s�1) �1.62F1.46
Peak SR (s�1) �1.48F1.57
Baseline S (%) �22.0F10.8
Peak S (%) �20.3F12.3
n: number of patients, N: number of vessels and related segments, LV: left ventr
index, FFR: fractional flow reserve, Sm: systolic myocardial velocity, Em: early dia
rate, S: strain.
vessels studied by the FFR (N=22) ( pN0.05). The incidence
of arrhythmia, hypertensive reaction and atropin require-
ment during the DSE were similar in both the patients with
and without ischemic response ( pN0.05 for all), but angina
was seen more frequently in the ischemic group ( p=0.024).
Baseline ejection fraction and left ventricular wall motion
score index (WMSI) were similar in both the ischemic and
the nonischemic groups during the DSE. Peak WMSI and
the change in WMSI during the DSE significantly increased
in the ischemic group ( p=0.001 and b0.001, respectively).
All the tissue Doppler parameters (Sm, Em, Am), WMSI
and the ratio of the changes in the SR and S were compared
to 22 left ventricular segments supplied by the FFR related
coronary artery including the longitudinal and the radial
deformation aspects. However, nominal SR and S values
were compared only in the longitudinal deformation,
because the opposite direction of the radial SR and S values
was not convenient for evaluation together with the
longitudinal values. Thus, the last two parameters were
evaluated apart, which included the 19 FFR related vessels
and their related left ventricular segments. Peak Sm and the
Nonischemic Ischemic p
7 10
0 12 NS
62F5 57F13 NS
1 6 =0.024
0 2 NS
1 2 NS
4 5 NS
1.0F0.0 1.26F0.58 NS
1.0F0.0 1.57F0.45 =0.001
0 29.5F15.5 b0.001
0.038F0.014 0.039F0.023 NS
0.074F0.035 0.027F0.014 =0.02
41F21 �46F47 b0.001
�0.049F0.027 �0.046F0.019 NS
�0.064F0.038 �0.042F 0.020 NS
�21F97 �33F56 NS
�0.048F0.018 �0.045F0.021 NS
�0.064F0.027 �0.067F0.027 NS
12F50 33F35 NS
1.26F0.95 1.16F0.61 NS
1.32F1.17 0.72F0.53 NS
�68F122 �114F134 NS
�42.9F17.4 �50.0F61.2 NS
26.6F17.0 �65.9F52.1 b0.001
�1.66F0.90 �1.58F1.80 NS
�1.83F1.10 �1.23F1.86 NS
�22.6F10.2 �21.5F11.7 =0.02
�29.7F11.8 �13.4F7.2 b0.001
icle, DSE: dobutamine stress echocardiography, WMSI: wall motion score
stolic myocardial velocity, Am: late diastolic myocardial velocity, SR: strain
Page 6
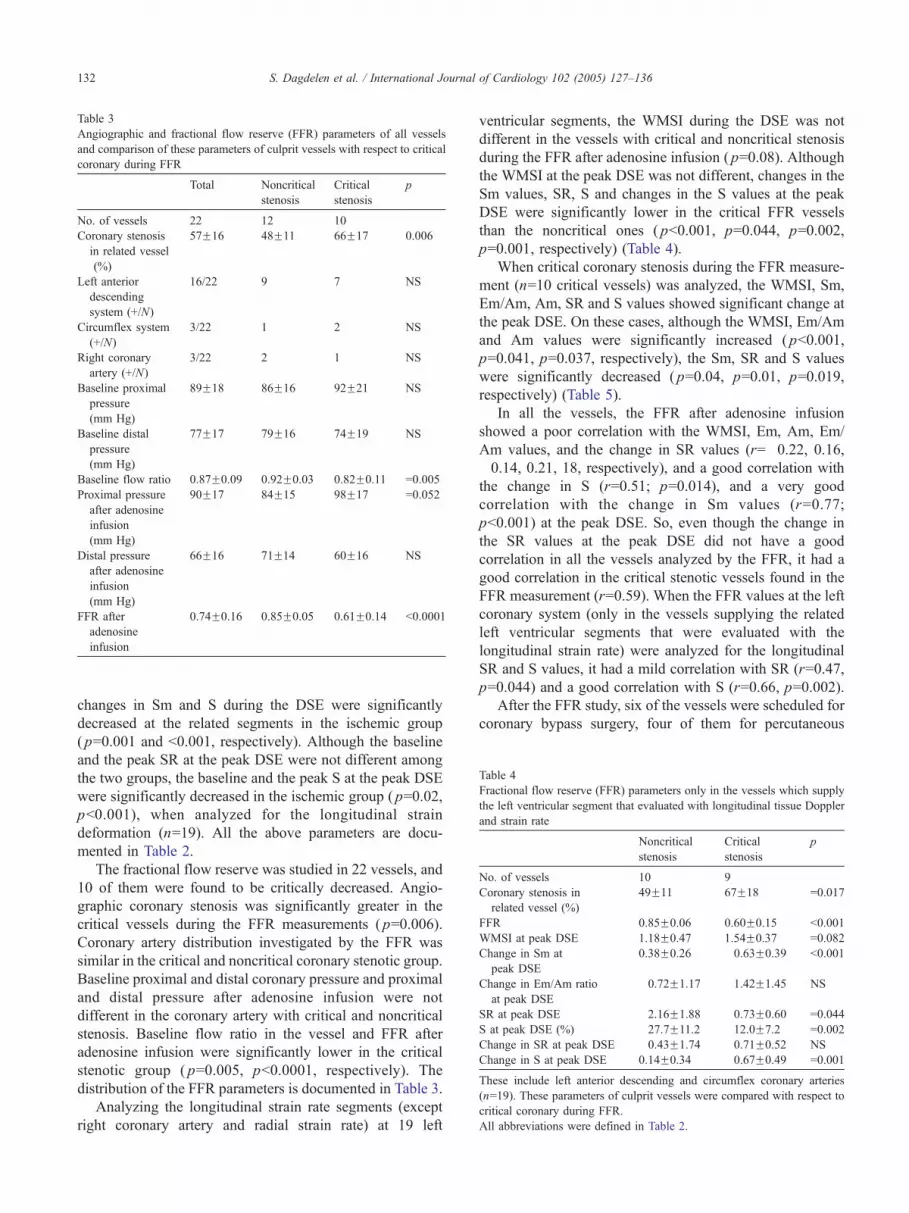
Table 3
Angiographic and fractional flow reserve (FFR) parameters of all vessels
and comparison of these parameters of culprit vessels with respect to critical
coronary during FFR
Total Noncritical
stenosis
Critical
stenosis
p
No. of vessels 22 12 10
Coronary stenosis
in related vessel
(%)
57F16 48F11 66F17 0.006
Left anterior
descending
system (+/N)
16/22 9 7 NS
Circumflex system
(+/N)
3/22 1 2 NS
Right coronary
artery (+/N)
3/22 2 1 NS
Baseline proximal
pressure
(mm Hg)
89F18 86F16 92F21 NS
Baseline distal
pressure
(mm Hg)
77F17 79F16 74F19 NS
Baseline flow ratio 0.87F0.09 0.92F0.03 0.82F0.11 =0.005
Proximal pressure
after adenosine
infusion
(mm Hg)
90F17 84F15 98F17 =0.052
Distal pressure
after adenosine
infusion
(mm Hg)
66F16 71F14 60F16 NS
FFR after
adenosine
infusion
0.74F0.16 0.85F0.05 0.61F0.14 b0.0001
Table 4
Fractional flow reserve (FFR) parameters only in the vessels which supply
the left ventricular segment that evaluated with longitudinal tissue Doppler
and strain rate
Noncritical
stenosis
Critical
stenosis
p
No. of vessels 10 9
Coronary stenosis in
related vessel (%)
49F11 67F18 =0.017
FFR 0.85F0.06 0.60F0.15 b0.001
WMSI at peak DSE 1.18F0.47 1.54F0.37 =0.082
Change in Sm at
peak DSE
0.38F0.26 �0.63F0.39 b0.001
Change in Em/Am ratio
at peak DSE
�0.72F1.17 �1.42F1.45 NS
SR at peak DSE �2.16F1.88 �0.73F0.60 =0.044
S at peak DSE (%) �27.7F11.2 �12.0F7.2 =0.002
Change in SR at peak DSE �0.43F1.74 �0.71F0.52 NS
Change in S at peak DSE 0.14F0.34 �0.67F0.49 =0.001
These include left anterior descending and circumflex coronary arteries
(n=19). These parameters of culprit vessels were compared with respect to
critical coronary during FFR.
All abbreviations were defined in Table 2.
S. Dagdelen et al. / International Journal of Cardiology 102 (2005) 127–136132
changes in Sm and S during the DSE were significantly
decreased at the related segments in the ischemic group
( p=0.001 and b0.001, respectively). Although the baseline
and the peak SR at the peak DSE were not different among
the two groups, the baseline and the peak S at the peak DSE
were significantly decreased in the ischemic group ( p=0.02,
pb0.001), when analyzed for the longitudinal strain
deformation (n=19). All the above parameters are docu-
mented in Table 2.
The fractional flow reserve was studied in 22 vessels, and
10 of them were found to be critically decreased. Angio-
graphic coronary stenosis was significantly greater in the
critical vessels during the FFR measurements ( p=0.006).
Coronary artery distribution investigated by the FFR was
similar in the critical and noncritical coronary stenotic group.
Baseline proximal and distal coronary pressure and proximal
and distal pressure after adenosine infusion were not
different in the coronary artery with critical and noncritical
stenosis. Baseline flow ratio in the vessel and FFR after
adenosine infusion were significantly lower in the critical
stenotic group ( p=0.005, pb0.0001, respectively). The
distribution of the FFR parameters is documented in Table 3.
Analyzing the longitudinal strain rate segments (except
right coronary artery and radial strain rate) at 19 left
ventricular segments, the WMSI during the DSE was not
different in the vessels with critical and noncritical stenosis
during the FFR after adenosine infusion ( p=0.08). Although
the WMSI at the peak DSE was not different, changes in the
Sm values, SR, S and changes in the S values at the peak
DSE were significantly lower in the critical FFR vessels
than the noncritical ones ( pb0.001, p=0.044, p=0.002,
p=0.001, respectively) (Table 4).
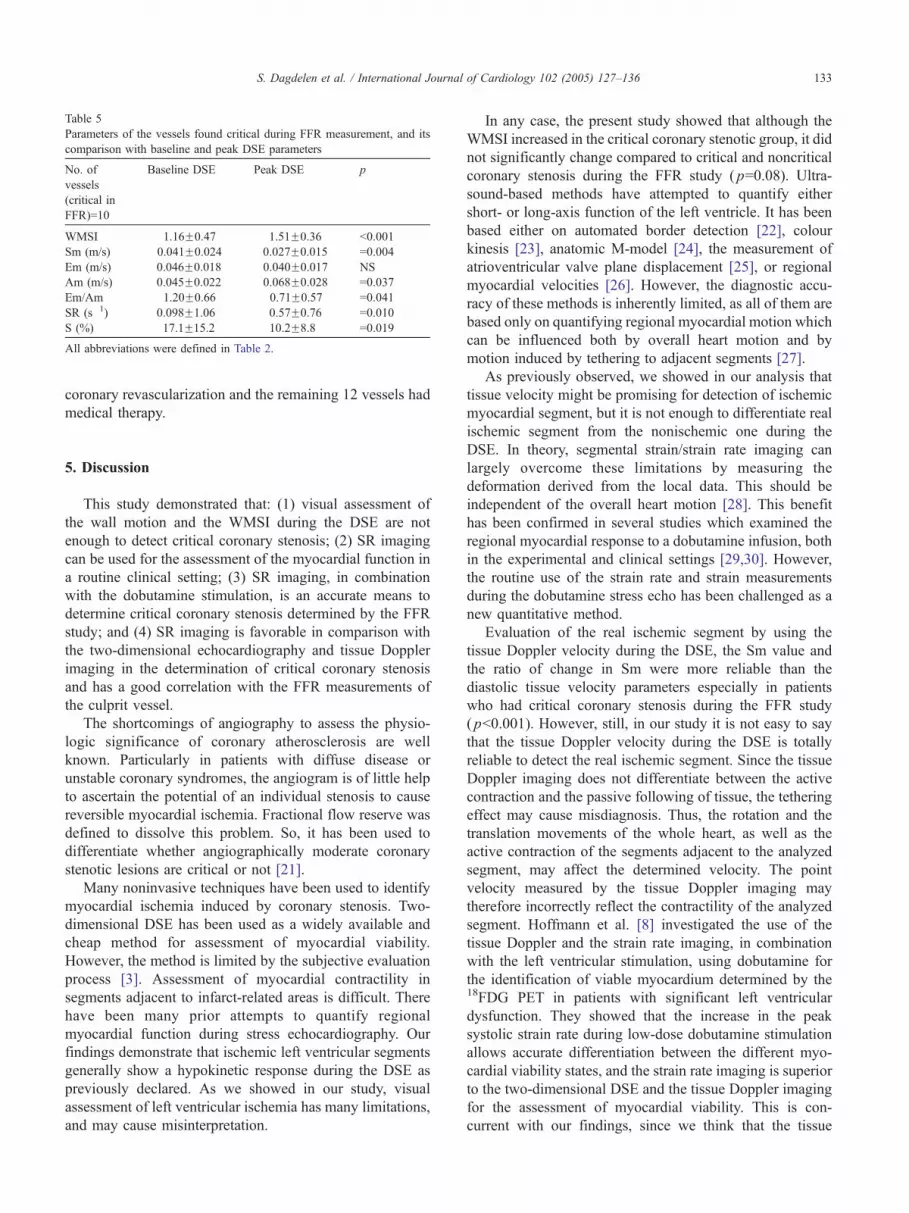
When critical coronary stenosis during the FFR measure-
ment (n=10 critical vessels) was analyzed, the WMSI, Sm,
Em/Am, Am, SR and S values showed significant change at
the peak DSE. On these cases, although the WMSI, Em/Am
and Am values were significantly increased ( pb0.001,
p=0.041, p=0.037, respectively), the Sm, SR and S values
were significantly decreased ( p=0.04, p=0.01, p=0.019,
respectively) (Table 5).
In all the vessels, the FFR after adenosine infusion
showed a poor correlation with the WMSI, Em, Am, Em/
Am values, and the change in SR values (r=�0.22, 0.16,
�0.14, 0.21, 18, respectively), and a good correlation with
the change in S (r=0.51; p=0.014), and a very good
correlation with the change in Sm values (r=0.77;
pb0.001) at the peak DSE. So, even though the change in
the SR values at the peak DSE did not have a good
correlation in all the vessels analyzed by the FFR, it had a
good correlation in the critical stenotic vessels found in the
FFR measurement (r=0.59). When the FFR values at the left
coronary system (only in the vessels supplying the related
left ventricular segments that were evaluated with the
longitudinal strain rate) were analyzed for the longitudinal
SR and S values, it had a mild correlation with SR (r=0.47,
p=0.044) and a good correlation with S (r=0.66, p=0.002).
After the FFR study, six of the vessels were scheduled for
coronary bypass surgery, four of them for percutaneous
Page 7
Table 5
Parameters of the vessels found critical during FFR measurement, and its
comparison with baseline and peak DSE parameters
No. of
vessels
(critical in
FFR)=10
Baseline DSE Peak DSE p
WMSI 1.16F0.47 1.51F0.36 b0.001
Sm (m/s) 0.041F0.024 0.027F0.015 =0.004
Em (m/s) �0.046F0.018 �0.040F0.017 NS
Am (m/s) �0.045F0.022 �0.068F0.028 =0.037
Em/Am 1.20F0.66 0.71F0.57 =0.041
SR (s�1) �0.098F1.06 �0.57F0.76 =0.010
S (%) �17.1F15.2 �10.2F8.8 =0.019
All abbreviations were defined in Table 2.
S. Dagdelen et al. / International Journal of Cardiology 102 (2005) 127–136 133
coronary revascularization and the remaining 12 vessels had
medical therapy.
5. Discussion
This study demonstrated that: (1) visual assessment of
the wall motion and the WMSI during the DSE are not
enough to detect critical coronary stenosis; (2) SR imaging
can be used for the assessment of the myocardial function in
a routine clinical setting; (3) SR imaging, in combination
with the dobutamine stimulation, is an accurate means to
determine critical coronary stenosis determined by the FFR
study; and (4) SR imaging is favorable in comparison with
the two-dimensional echocardiography and tissue Doppler
imaging in the determination of critical coronary stenosis
and has a good correlation with the FFR measurements of
the culprit vessel.
The shortcomings of angiography to assess the physio-
logic significance of coronary atherosclerosis are well
known. Particularly in patients with diffuse disease or
unstable coronary syndromes, the angiogram is of little help
to ascertain the potential of an individual stenosis to cause
reversible myocardial ischemia. Fractional flow reserve was
defined to dissolve this problem. So, it has been used to
differentiate whether angiographically moderate coronary
stenotic lesions are critical or not [21].
Many noninvasive techniques have been used to identify
myocardial ischemia induced by coronary stenosis. Two-
dimensional DSE has been used as a widely available and
cheap method for assessment of myocardial viability.
However, the method is limited by the subjective evaluation
process [3]. Assessment of myocardial contractility in
segments adjacent to infarct-related areas is difficult. There
have been many prior attempts to quantify regional
myocardial function during stress echocardiography. Our
findings demonstrate that ischemic left ventricular segments
generally show a hypokinetic response during the DSE as
previously declared. As we showed in our study, visual
assessment of left ventricular ischemia has many limitations,
and may cause misinterpretation.
In any case, the present study showed that although the
WMSI increased in the critical coronary stenotic group, it did
not significantly change compared to critical and noncritical
coronary stenosis during the FFR study ( p=0.08). Ultra-
sound-based methods have attempted to quantify either
short- or long-axis function of the left ventricle. It has been
based either on automated border detection [22], colour
kinesis [23], anatomic M-model [24], the measurement of
atrioventricular valve plane displacement [25], or regional
myocardial velocities [26]. However, the diagnostic accu-
racy of these methods is inherently limited, as all of them are
based only on quantifying regional myocardial motion which
can be influenced both by overall heart motion and by
motion induced by tethering to adjacent segments [27].
As previously observed, we showed in our analysis that
tissue velocity might be promising for detection of ischemic
myocardial segment, but it is not enough to differentiate real
ischemic segment from the nonischemic one during the
DSE. In theory, segmental strain/strain rate imaging can
largely overcome these limitations by measuring the
deformation derived from the local data. This should be
independent of the overall heart motion [28]. This benefit
has been confirmed in several studies which examined the
regional myocardial response to a dobutamine infusion, both
in the experimental and clinical settings [29,30]. However,
the routine use of the strain rate and strain measurements
during the dobutamine stress echo has been challenged as a
new quantitative method.
Evaluation of the real ischemic segment by using the
tissue Doppler velocity during the DSE, the Sm value and
the ratio of change in Sm were more reliable than the
diastolic tissue velocity parameters especially in patients
who had critical coronary stenosis during the FFR study
( pb0.001). However, still, in our study it is not easy to say
that the tissue Doppler velocity during the DSE is totally
reliable to detect the real ischemic segment. Since the tissue
Doppler imaging does not differentiate between the active
contraction and the passive following of tissue, the tethering
effect may cause misdiagnosis. Thus, the rotation and the
translation movements of the whole heart, as well as the
active contraction of the segments adjacent to the analyzed
segment, may affect the determined velocity. The point
velocity measured by the tissue Doppler imaging may
therefore incorrectly reflect the contractility of the analyzed
segment. Hoffmann et al. [8] investigated the use of the
tissue Doppler and the strain rate imaging, in combination
with the left ventricular stimulation, using dobutamine for
the identification of viable myocardium determined by the18FDG PET in patients with significant left ventricular
dysfunction. They showed that the increase in the peak
systolic strain rate during low-dose dobutamine stimulation
allows accurate differentiation between the different myo-
cardial viability states, and the strain rate imaging is superior
to the two-dimensional DSE and the tissue Doppler imaging
for the assessment of myocardial viability. This is con-
current with our findings, since we think that the tissue
Page 8
S. Dagdelen et al. / International Journal of Cardiology 102 (2005) 127–136134
Doppler has more limitators compared with the strain rate
imaging during the DSE. In the study published by
Hoffmann, they investigated the patients with severe left
ventricular dysfunction; however, we investigated the left
ventricular segments which were not akinetic or dyskinetic.
Tissue Doppler parameters during the DSE may be
comparable with other invasive and the noninvasive
techniques. Voigt et al. [10] investigated the regional
myocardial strain rate and the strain response during the
DSE in patients and compared the results with the conven-
tional DSE readings, perfusion scintigraphy, and coronary
angiography. They showed that the strain rate imaging is
feasible in the clinical setting. It measured longitudinal
myocardial deformation directly independent of translation,
and offered parameters comparable and possibly superior to
the visually assessed regional wall thickening. This allowed
them to quantify strain rate, providing a cutoff value of these
parameters for the detection of stress-induced ischemia. We
also showed that the strain rate and the strain parameters
during the DSE were more reliable for detecting the real
ischemic myocardial segment referred by the FFR study.
These parameters analyze the critical coronary stenosis
during the FFR measurements and determine the ischemic
left ventricular segment during the DSE (for all pb0.05).
Voigt and colleagues showed that 43% of the patients had an
ischemic response in myocardial scintigraphy, and all
patients with inducible myocardial ischemia had significant
coronary stenosis (N50%) in the supplying coronary artery.
As we showed in our study, a N50% coronary stenosis in
quantitative assessment of coronary angiography is not
exactly enough to detect myocardial ischemia caused by that
stenosis, and 50% coronary stenosis may cause coronary
ischemia when compared to both myocardial ischemia and
to the FFR measurements.
Edvardsen et al. [31] evaluated whether the strain rate
imaging could detect acute myocardial ischemia or not, and
compared this new method with the tissue Doppler imaging
and the WMSI during acute coronary ischemia. They
investigated the patients undergoing angioplasty of the left
anterior descending coronary artery, and assessed left
ventricular longitudinal wall motion by the tissue and strain
Doppler imaging from the apical four-chamber view before,
during and after angioplasty from multiple myocardial
segments simultaneously. They concluded that the strain rate
imaging detected longitudinal dyskinesia during occlusion of
the left anterior descending coronary artery more frequently
than the tissue Doppler velocity. This conclusion is consistent
with our findings; we also found that in the event of the real
coronary ischemia, measurement of the strain rate imaging
during the DSEwas more reliable than the tissue Doppler and
visual assessment of the wall motion alone.
However, the study published by Edvardsen has several
differences, and of course these bring some discussions to
the mind. All patients in their study had 75% coronary
stenosis angiographically; only the left anterior descending
coronary segment was investigated; all the strain rate
imaging were studied during total occlusion of the same
vessels; and their findings reflected acute myocardial
ischemia. However, in our study, the patients having 40%
coronary stenosis angiographically were admitted to the
study; vessels other than the left anterior descending
coronary artery were investigated. Also, we investigated
the possible chronic myocardial ischemia in these vessel
segments. In fact, we measured the fractional flow reserve
of the culprit vessels to determine the expressive action of
the strain rate imaging during the DSE in the event of any
mild-moderate to severe coronary stenosis.
Although the strain rate imaging during the DSE
measures longitudinal deformation, in our study, both the
SR and the change in SR were significantly reduced in the
ischemic segments, confirming earlier studies [6,32]. How-
ever, there are no studies to investigate the direct correlation
between the FFR measurement and the strain rate imaging
parameters of the left ventricular segment supplied by the
same vessel. We found that the strain rate imaging
parameters have a good correlation with the FFR measure-
ments of the culprit vessel. It is interesting that as
quantitative methods, the FFR study for coronary angiog-
raphy and strain rate imaging for the Doppler echocardiog-
raphy can be combined for evaluation and for planning
intervention. Both these techniques investigate maximal
reserve of the related parameters which interrogate criticism
of the coronary stenosis with adenosine infusion and the
ischemic expression of the myocardium during the DSE.
The correlation between SR imaging and FFR parameters
on stress in the vessels which have demonstrated critical
coronary stenosis is not surprising. The validity of a good
correlation between the same parameters in all 40% of
stenotic vessels is still interesting. We think that this finding
is very important, and is the most interesting result of this
study. The findings of the present study may be interpreted
such that angiographically chronic mild to moderate
coronary stenosis may insidiously cause myocardial injury.
5.1. Limitations
Strain measurements are angle-dependent, possibly more
so than any other Doppler modalities. Tissue deformation in
one direction is always associated with the deformations in
other directions to keep the mass of the structure constant.
Therefore, interpretations of the strains should be performed
with caution if the tissue direction deviates more than 308from the beam direction. The angle problem is a significant
limitation of this technique and repositioning of the trans-
ducer must be done to avoid the problem.
In this study, we assessed the longitudinal and radial
dimension to evaluate both left (longitudinal strain) and
right (radial strain from short axis view) coronary systems.
Important data about the radial and the circumferential strain
may therefore be misinterpretated. However, we analyzed
all the tissue Doppler parameters and the ratio of the change
in the strain rate parameters which are not mostly affected
Page 9
S. Dagdelen et al. / International Journal of Cardiology 102 (2005) 127–136 135
from the longitudinal and the radial planes. So, the SR and
the S values that parameters exactly change from radial to
longitudinal planes were analyzed only for the cases studied
with longitudinal strain rate imaging.
As far as coronary selectivity goes, our study population
did not contain only one vessel system. We investigated
mostly the left anterior descending system, but also included
the circumflex and the right coronary systems.
In the present study, we did not investigate inter- and intra-
observer variability, so this is another limitation of this study.
5.2. Conclusion and future perspectives
Conventional DSE is a well-established method to detect
wall motion abnormality, but it seems that this subjective
evaluation is not enough to be a good standard. It is certain
that the WMSI significantly increases in the event of critical
coronary stenosis in the FFR measurements, but this
certainty is not valid in all degree of coronary stenosis.
During the DSE, the SR imaging may be used to improve
the relation between the DSE and the FFR measurements.
Critical or noncritical coronary stenosis shown by the FFR
measurements may not cause any visual wall motion
abnormalities all the time, and also mild hypokinesia
induced by moderate coronary stenosis may not make a
difference. In our study, we showed that the tissue and the
strain Doppler imaging parameters (especially Sm, Em/Am,
SR and S values) during the DSE significantly reflect the
myocardial ischemia convenient with the FFR values of the
culprit vessel. Although there is a poor correlation between
the WMSI and the FFR values in the same culprit vessels,
the quantitative tissue Doppler and SR imaging parameters
during the DSE have a good correlation with the FFR
values, especially on the Sm, SR and S.
The quantitation of regional myocardial deformation by
using the DSE rather than the wall motion abnormality
alone would be more appropriate in detecting ischemic
dysfunctional segment supplied by the critical or the
noncritical stenotic coronary artery. Strain rate measure-
ments during the dobutamine infusion may provide infor-
mation on the FFR results of the culprit vessel. Our study
population is not large enough to detect more data. These
are limited in terms of the formulation of the data between
the SR imaging and the FFR values, and to calculate the cut
of point values of them. Future studies including a larger
study population and more selective cases will be needed to
show the accuracy of SR imaging results during the DSE
when compared with the FFR values. These studies may
predict the functional improvement after revascularization.
References
[1] Mairesse GH, Marwick TH, Vanoverschelde JL, et al. How accurate is
dobutamine stress electrocardiography for detection of coronary artery
disease? J Am Coll Cardiol 1994;24:920–7.
[2] Geleijnse ML, Fioretti PM, Roelandt JR. Methodology, feasibility,
safety and diagnostic accuracy of dobutamine stress echocardiogra-
phy. J Am Coll Cardiol 1997;30:595–606.
[3] Picano E, Lattanzi F, Orlandini A, Marini C, L’Abbate A. Stress
echocardiography and the human factor: the importance of being
expert. J Am Coll Cardiol 1991;17:666–9.
[4] Franke A, Hfmann R, Kuhl HP, et al. Non-contrast second harmonic
imaging improves interobserver agreement and accuracy of dobut-
amine stress echocardiography in patients with impaired image
quality. Heart 2000;83:133–40.
[5] Heimdal A, Stbylen A, Torp H, Skj&rpe T. Real-time strain rate
imaging of the left ventricle by ultrasound. J Am Soc Echocardiogr
1998;11:1013–9.
[6] Jamal F, Strotmann J, Weidemann F, et al. Noninvasive quantification
of the contractile reserve of stunned myocardium by ultrasonic strain
rate and strain. Circulation 2001;104:1059–65.
[7] Pislaru C, Belohlavek M, Bae R, et al. Regional asynchrony during
acute myocardial ischemia quantified by ultrasound SRI. J Am Coll
Cardiol 2001;37:1141–8.
[8] Hoffmann R, Ertune E, Nowak B, et al. Strain rate measurements by
Doppler echocardiography allows improved assessment of myocardial
viability in patients with depressed left ventricular function. J Am Coll
Cardiol 2002;39:443–9.
[9] Abraham TP, Belohlavek M, Thomson H, et al. Time to onset of
regional relaxation: feasibility, variability and utility of a novel index
of regional myocardial function by SRI. J Am Coll Cardiol 2002;
39:1531–7.
[10] Voigt JU, Exner B, Schmiedehausen K, et al. Strain-rate imaging
during dobutamine stress echocardiography provides objective evi-
dence of inducible ischemia. Circulation 2003;107:2120–6.
[11] Nissen SE, Gurley JC. Assessment of the functional significance of
coronary stenoses. Circulation 1990;81:1431–5.
[12] Bartunek J, Sys SU, Heyndrickx GR, et al. Quantitative
coronary angiography in predicting functional significance of
stenoses in an unselected patient cohort. J Am Coll Cardiol
1995;26:328–34.
[13] Pijls NHJ, Van Son JAM, Kirkeeide RL, et al. Experimental basis of
determining maximum coronary, myocardial, and collateral blood
flow by pressure measurements for assessing functional stenosis
severity before and after percutaneous transluminal coronary angio-
plasty. Circulation 1993;87:1354–67.
[14] Pijls NHJ, De Bruyne B, Peels K, et al. Measurement of fractional
flow reserve to assess the functional severity of coronary artery
stenoses. N Engl J Med 1996;334:1703–8.
[15] DeBruyne B, Bartunek J, Sys SU, et al. Simultaneous coronary
pressure and flow velocity measurements in humans: feasibility,
reproducibility, and hemodynamic dependence of coronary flow
velocity reserve, hyperemic flow versus pressure slope index, and
fractional flow reserve. Circulation 1996;94:1843–9.
[16] Matsuo H, Watanabe S, Kadosaki T, et al. Validation of collateral
fractional flow reserve by myocardial perfusion imaging. Circulation
2002;105:1060–5.
[17] Pijls NHJ, Van Gelder B, Van der Voort P, et al. Fractional flow
reserve. A useful index to evaluate the influence of an epicardial
coronary stenosis on myocardial blood flow. Circulation 1995;92:
3183–93.
[18] Schiller NB, Shah PM, Crawford M, et al. Recommendations for
quantitation of the left ventricle by two-dimensional echocardiogra-
phy. J Am Soc Echocardiogr 1989;2:358–67.
[19] Pijls NHJ, Kern MJ, Yock PG, de Bruyne B. Practice and potential
pitfalls of coronary pressure measurement. Catheter Cardiovasc Interv
2000;49:1–16.
[20] De Bruyne B, Pijls NH, Bartunek J, et al. Fractional flow reserve
in patients with prior myocardial infarction. Circulation 2001;104:
157–62.
[21] Pijls NHJ. Is it time to measure fractional flow reserve in all patients?
J Am Coll Cardiol 2003;41:1122–4.
Page 10
S. Dagdelen et al. / International Journal of Cardiology 102 (2005) 127–136136
[22] Perez JE, Waggoner AD, Davila-Roman VG, Cardona H, Miller JG.
On-line quantification of ventricular function during dobutamine
stress echocardiography. Eur Heart J 1992;13:1669–76.
[23] Koch R, Lang RM, Garcia MJ, et al. Objective evaluation of regional
left ventricular wall motion during dobutamine stress echocardio-
graphic studies using segmental analysis of color kinesis images. J Am
Coll Cardiol 1999;34:409–19.
[24] Iwado Y, Mizushige K, Watanabe K, et al. Quantitative analysis of
myocardial response to dobutamine by measurement of left ventricular
wall motion using omnidirectional M-mode echocardiography. Am J
Cardiol 1999;83:765–9.
[25] Carstensen S, Hbst U, Atar D, Saunam7ki K, Kelb&k H. Atrioven-
tricular plane motion during dobutamine atropine stress echocardiog-
raphy: the biphasic response in healthy subjects revisited. J Am Soc
Echocardiogr 2000;13:885–90.
[26] Wilkensho UM, Sovany A, Wigstrfm L, et al. Regional mean systolic
myocardial velocity estimation by real-time Color Doppler Myocar-
dial Imaging: a new technique for quantifying regional systolic
function. J Am Soc Echocardiogr 1998;11:683–92.
[27] Miyatake K, Yamagishi M, Tanaka N, et al. Newmethod for evaluating
left ventricular wall motion by color-coded tissue Doppler imaging: in
vitro and in vivo studies. J Am Coll Cardiol 1995;25:717–24.
[28] Urheim S, Edvardsen T, Torp H, Angelsen B, Smiseth OA.
Myocardial strain by Doppler echocardiography. Validation of a
new Doppler method to quantify regional myocardial function.
Circulation 2000;102:1158–64.
[29] Armstrong G, Pasquet A, Fukamachi K, Cardon L, Olstad B, Marwick
TH. Use of peak systolic strain as an index of regional left ventricular
function: comparison with tissue Doppler velocity during dobutamine
stress and myocardial ischemia. J Am Soc Echocardiogr 2000;13:
731–37.
[30] Gorcsan III J, Deswal A, Mankad S, et al. Quantification of the
myocardial response to low-dose dobutamine using tissue Doppler
echocardiographic measures of velocity and velocity gradient. Am J
Cardiol 1998;81:615–23.
[31] Edvardsen T, Skulstad H, Aakhus S, Urheim S, Ihlen H. Regional
myocardial systolic function during acute myocardial ischemia
assessed by strain Doppler echocardiography. J Am Coll Cardiol
2001;37:726–30.
[32] Weidemann F, Jamal F, Sutherland G, et al. Myocardial function
defined by strain rate and strain during alterations in inotropic states
and heart rate. Am J Physiol 2002;283:792–9.