Cortical organoids model early brain development disrupted by16p11.2 copy number variants in autismJorge Urresti1,8, Pan Zhang1,8, Patricia Moran-Losada1, Nam-Kyung Yu2, Priscilla D. Negraes3,4, Cleber A. Trujillo3,4, Danny Antaki1,3,Megha Amar 1, Kevin Chau 1, Akula Bala Pramod1, Jolene Diedrich2, Leon Tejwani3,4, Sarah Romero3,4, Jonathan Sebat 1,3,5,John R. Yates III 2, Alysson R. Muotri 3,4,6,7✉ and Lilia M. Iakoucheva 1✉
Reciprocal deletion and duplication of the 16p11.2 region is the most common copy number variation (CNV) associated with autismspectrum disorders. We generated cortical organoids from skin fibroblasts of patients with 16p11.2 CNV to investigate impactedneurodevelopmental processes. We show that organoid size recapitulates macrocephaly and microcephaly phenotypes observed inthe patients with 16p11.2 deletions and duplications. The CNV dosage affects neuronal maturation, proliferation, and synapsenumber, in addition to its effect on organoid size. We demonstrate that 16p11.2 CNV alters the ratio of neurons to neuralprogenitors in organoids during early neurogenesis, with a significant excess of neurons and depletion of neural progenitorsobserved in deletions. Transcriptomic and proteomic profiling revealed multiple pathways dysregulated by the 16p11.2 CNV,including neuron migration, actin cytoskeleton, ion channel activity, synaptic-related functions, and Wnt signaling. The level of theactive form of small GTPase RhoA was increased in both, deletions and duplications. Inhibition of RhoA activity rescued migrationdeficits, but not neurite outgrowth. This study provides insights into potential neurobiological mechanisms behind the 16p11.2 CNVduring neocortical development.
INTRODUCTIONOver the last decade, it has been convincingly demonstrated thatdeletions (DEL) and duplications (DUP) of large genomic regions,or copy number variants (CNVs), are associated with multipleneurodevelopmental disorders [1–4]. The DEL of a genomic regionspanning 29 genes on human chromosome 16, 16p11.2 CNV, hadbeen identified as one of the strongest risk factors for autismspectrum disorder (ASD) and intellectual disability (ID), whereasthe DUP of the same region were associated with ASD, ID,schizophrenia (SCZ) and bipolar disorder (BD) [2, 3, 5–7]. Mostimportantly, DEL and DUP were associated with macrocephaly andmicrocephaly in human carriers, respectively [8, 9]. This pheno-type, however, had not been fully recapitulated in mouse modelsat the whole-brain volume level, although some of the animalstudies have reported a mirror effect of 16p11.2 CNV on regionalbrain volumes [10–12]. There was also little direct concordance inthe brain cytoarchitecture, behavior and viability phenotypesbetween human and mouse models, and at least one of themouse models observed phenotypes opposite to humans: DEL16p11.2 mice were smaller and lean, whereas DUP 16p11.2 micewere larger and obese [12].Significant progress has been made for implicating various
biological mechanisms that may be impacted by the 16p11.2 CNV.
RNA sequencing of cortex from 16p11.2 deletion and duplicationmice identified altered expression of genes and networks thatconverged on general ASD-associated pathways including synap-tic function, chromatin modification and transcriptional regulation[13]. Dysregulation of ciliopathy genes [14], ERK/MAPK signaling[15, 16], and metabotropic glutamate receptor 5 (mGluR5)-dependent synaptic plasticity and protein synthesis [17] in mousemodels were also implicated. Transcriptome profiling of lympho-blastoid cell lines of 16p11.2 CNV human carriers identifiedexpression dysregulation of the neuronal-related gene in deletion,but not in duplication [18]. Despite the progress made with regardto the understanding of the general mechanisms disrupted by the16p11.2 CNV in animal models and non-neuronal human cells, thequestion of how 16p11.2 variants impact early human braindevelopment remained unanswered.Recent advances in stem cell technologies opened a window of
opportunities for investigating brain disorders using human-basedin vitro systems [19]. Patient-derived or CRISPR/Cas9 genome-edited induced pluripotent stem cells (iPSCs) reprogrammed intotwo-dimensional (2D) monolayer cultures are beginning toprovide new insights into neurodevelopmental disorders[20, 21]. Such 2D models were recently used to investigatecellular phenotypes of the 16p11.2 CNV, and observed reduced
Received: 19 October 2020 Revised: 12 July 2021 Accepted: 20 July 2021Published online: 26 August 2021
1Department of Psychiatry, University of California San Diego, La Jolla, CA, USA. 2Department of Molecular Medicine, The Scripps Research Institute, La Jolla, CA, USA.3Department of Cellular & Molecular Medicine, University of California San Diego, La Jolla, CA, USA. 4Department of Pediatrics/Rady Children’s Hospital San Diego, University ofCalifornia, San Diego, La Jolla, CA, USA. 5University of California San Diego, Beyster Center for Psychiatric Genomics, La Jolla, CA, USA. 6University of California San Diego, KavliInstitute for Brain and Mind, La Jolla, CA, USA. 7Center for Academic Research and Training in Anthropogeny (CARTA), La Jolla, CA, USA. 8These authors contributed equally: JorgeUrresti, Pan Zhang. ✉email: [email protected]; [email protected]
synaptic density in both genotypes, as well as an impact of thisCNV on neuronal size and dendrite length [22]. However, the 2Dmodels are known to have certain limitations, such as the loss ofthe complex 3D heterotypic environment in which the cellsnormally reside in vivo, as well as limited cell-cell communicationsand cell–matrix mechanics. These shortcomings of 2D models arebeginning to be addressed with 3D organoid models [23] thathave proven advantages over 2D models for investigating humanbrain diseases [24–26]. Characterization of these models demon-strated that they closely resemble the human fetal brain, formingstructures reminiscent of deeper cortical layers and sharing celltypes and transcriptomic signatures with the fetal brain [27–30].These models are particularly well-suited for investigating early-onset diseases because their maturity recapitulates fetal and earlypostnatal brain development [24–26, 30], despite noted certainlimitations [31]. Many studies had used 3D cortical organoids tomodel lissencephaly [32, 33], non-syndromic autism [34], auto-somal recessive primary microcephaly [23], and Timothy syn-drome [35]. Here, we used patient-derived cortical organoids toperform 3D modeling of fetal brain development of the mostcommon autism subtype associated with DEL and DUP of the16p11.2 CNV.In this study, we generated iPSCs and cortical organoids from
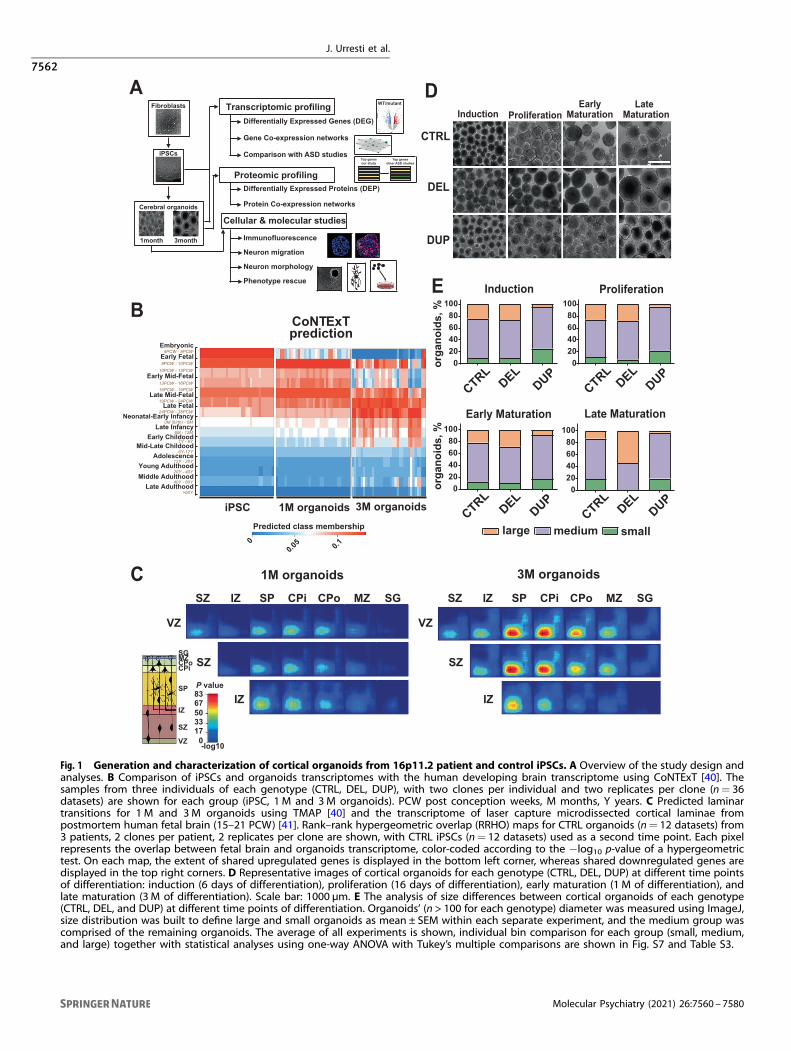
the 16p11.2 DEL and DUP patient fibroblasts and unrelatedhealthy control (CTRL) individuals and investigated molecular andcellular processes that were disrupted by this genetic variant(Fig. 1A). We found that the size of deletion organoids is larger,and duplication organoids are smaller, recapitulating the mirroreffect of 16p11.2 CNV on brain size in humans. Transcriptomic andproteomic profiling of organoids identified genes, proteins, andco-expression modules impacted by the 16p11.2 CNV. The resultswere validated by a panel of orthogonal assays. Cellular assaysconfirmed that 16p11.2 CNV impacts neuronal maturation,migration, morphology, and synaptic processes, implicatingdefects in neurogenesis. We identified multiple pathwaysdisrupted by the 16p11.2 CNV, including cell locomotion andmotility, ion channel activity, actin cytoskeleton, synaptic-relatedprocesses, along with Wnt and RhoA signaling. The activation ofRhoA signaling was a likely contributor to defects in neuronalmigration in both DELs and DUPs because of the inhibition ofRhoA activity with Rhosin rescued migration deficits in bothgenotypes. Our study makes a significant contribution to theunderstanding of neurobiological mechanisms that may bedisrupted during early human neocortical development in the16p11.2 CNV carriers, and offers a potential path for therapeuticinterventions.
RESULTSCortical organoids maturation resembles stages of humanbrain developmentTo investigate how 16p11.2 CNV impacts early stages of humanbrain development, and what molecular pathways are dysregu-lated by this genetic variant, we generated cortical organoids fromthe 16p11.2 CNV carriers. We first obtained iPSCs by reprogram-ming patient- and control-derived fibroblasts using episomaltransduction, and then differentiated iPSCs into cortical organoidsas previously described [36].We selected six male 16p11.2 CNV carriers with extreme head
size phenotypes (age-normalized head circumference Z-scorerange from 2.51 to 4.32 in DELs; and from −0.69 to −1.63 in DUPs)for this study. We decided to focus on this phenotype, becauseprevious studies from our and other laboratories using infectionwith Zika virus were able to successfully recapitulate microcephalyin organoid models [37, 38]. The restriction to only male genderwas due to samples availability. The details of patients’phenotypes are described in Table S1. Three gender-matchedhealthy unrelated individuals that did not carry 16p11.2 CNV were
used as controls. We performed rigorous quality control assess-ment of reprogrammed iPSCs clones using immunofluorescence(Fig. S1) and real-time quantitative polymerase chain reaction (RT-qPCR) (Fig. S2) for pluripotency markers, by comparing them toparental fibroblasts using single-nucleotide polymorphism arraygenotyping (Fig. S3), and by RT-qPCR for cell type-specific markersacross different developmental stages starting from iPSCs andending with organoids (Fig. S4). After confirming the presence of16p11.2 CNV in patient samples and ensuring that no additionalCNVs were introduced by reprogramming, we selected two clonesper individual for organoids production. We performed bulk RNAsequencing (RNA-seq) of a total of 108 samples derived fromiPSCs, 1-month-old (1 M) and 3-month-old (3 M) organoids(36 samples at each time point). We sequenced two clones perindividual, and two replicates per clone from for all threegenotypes (3 DELs, 3 DUPs, and 3 CTRLs) (Fig. S5). RNA sequencingquality control parameters are shown in Table S2.To investigate whether developmental maturity and laminar
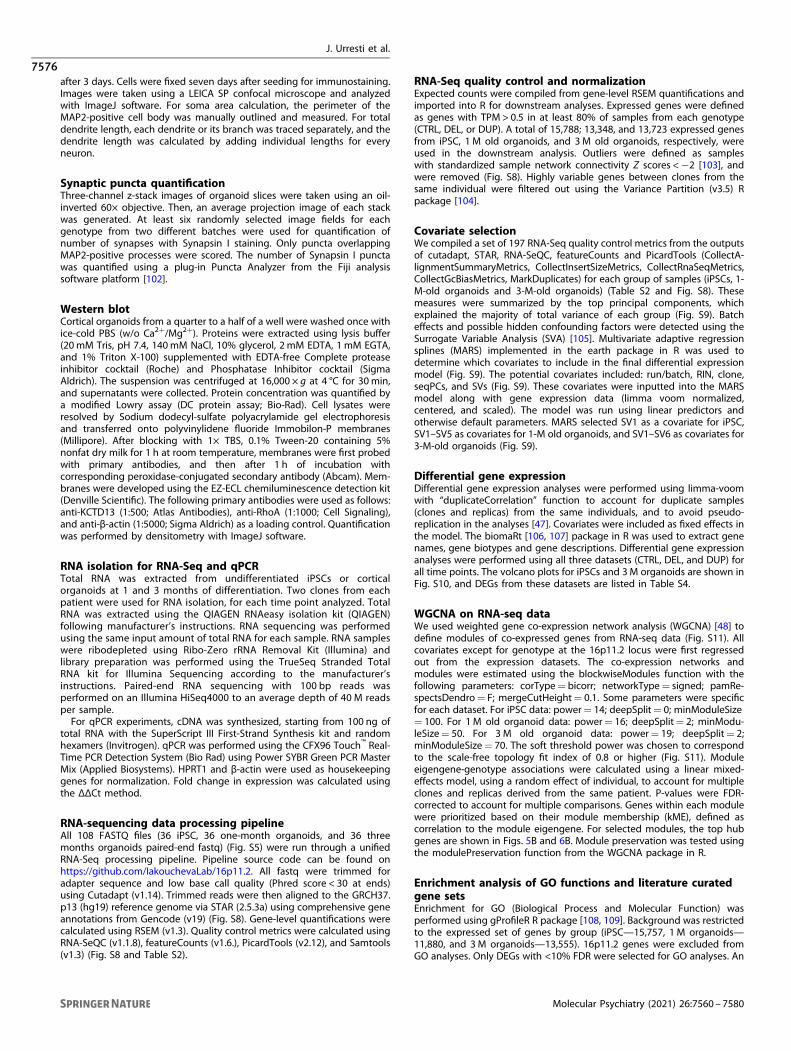
organization of produced organoids resembled the human brain,we compared transcriptional profiles of iPSCs and organoids withthe atlas of the developing human brain [39] using CoNTExT [40].Transcriptional profiles of iPSCs from all individuals closelymatched those of embryonic (4–8 PCW) and early fetal (8–10PCW) human brain, independently validating successful conver-sion of fibroblasts into a pluripotent state by reprogramming(Fig. 1B). Transcriptional profiles of 1-month-old organoidsresembled those of early mid-fetal (13–16 PCW) through latemid-fetal (19–24 PCW) periods. Likewise, transcriptional profiles of3-month-old organoids mostly recapitulated those of late mid-fetal (19–24 PCW) through neonatal-early infancy (birth to6 months) developmental periods.Next, we examined the degree of overlap between in vivo
cortical development of prenatal human brain and our in vitrodifferentiated organoids using TMAP [40]. We compared transcrip-tional profiles of our organoids with those derived from lasercapture microdissected cortical laminae of postmortem humanfetal brain (15–21 PCW) [41]. TMAP performs serialized differentialexpression analysis between any two in vivo developmentalperiods and any two in vitro differentiation time points, followedby quantification of overlap [40]. Laminar matching by TMAPdemonstrated transitions between proliferative layers (ventricularVZ, subventricular SZ, and intermediate IZ zones) and post mitoticupper layers for both, 1 M and 3M old organoids (Fig. 1C). Weobserved that laminar transition into upper layers manifested agreater shift in 3 M organoids than in 1 M organoids. For example,greater correspondence to upper layers (subplate SP, cortical plateinner CPi and outer CPo layers and marginal zone MZ) was visibleat 3 M compared to 1 M, consistent with the increased maturity at3 M. We replicated this maturation shift using an additionalindependent dataset from the fetal human brain [42] (Fig. S6).Together, the results suggest that cortical organoids from DEL,DUP, and CTRL individuals mature over time, closely recapitulatinghuman brain development in terms of temporal transitions andlaminar organization. Furthermore, organoids between 1M and 3M of differentiation most closely resemble human mid-fetal braindevelopment and represent suitable models for studying themolecular basis of neurodevelopmental disorders, considering aproven role of this period in ASD and SCZ pathogenesis [43–45].These results are in agreement with a previous study thatconcluded that brain organoids faithfully recapitulate fetaldevelopment at the transcriptional level [46].
Patient-derived organoids recapitulate macrocephaly andmicrocephaly phenotypesSince our patients with 16p11.2 DELs and DUPs were selectedbased on the extreme head circumference phenotypes (Table S1),we investigated whether organoids recapitulate these pheno-types. We measured the diameter of 16p11.2 and control
J. Urresti et al.
7561
Molecular Psychiatry (2021) 26:7560 – 7580
1234567890();,:
Fibroblasts
iPSCs
Cerebral organoids
1month 3month
Proteomic profiling
Cellular & molecular studies
Differentially Expressed Genes (DEG)
Gene Co-expression networks
Comparison with ASD studies
Differentially Expressed Proteins (DEP)
Protein Co-expression networks
Immunofluorescence
Neuron morphology
Phenotype rescue
Neuron migration
Top genesour study
Top genesother ASD studies
A
CTRL
Induction ProliferationEarly
Maturation
DEL
DUP
LateMaturation
D
EmbryonicEarly Fetal
Early Mid-Fetal
Late Mid-Fetal
0.10.050
CoNTExTprediction
iPSC 1M organoidsPredicted class membership
3M organoids
4PCW - 8PCW
8PCW - 10PCW10PCW - 13PCW
13PCW - 16PCW16PCW - 19PCW
19PCW - 24PCWLate Fetal
24PCW - 38PCWNeonatal-Early Infancy
0M (birth) - 6MLate Infancy
6M - 12MEarly Childood
1Y - 6YMid-Late Childood
6Y-12YAdolescence
12Y - 20YYoung Adulthood
20Y - 40YMiddle Adulthood
40Y - 60YLate Adulthood
>60Y
DUP
CTRLDEL
DUP
orga
noid
s, %
CTRLDEL
DUP
mediumlarge
BE
1M organoids 3M organoids
8367503317
0-log10
P value
VZ
SZ
IZ
VZ
SZ
IZ
SZ IZ SP CPi CPo MZ SG SZ IZ SP CPi CPo MZ SG
SGMZCPoCPi
SP
IZ
SZ
VZ
C
Transcriptomic profiling WT/mutant
orga
noid
s, %
CTRLDEL
DUP0
20406080
100
CTRLDEL
020406080
100
020406080
100
020406080
100
small
Induction Proliferation
Early Maturation Late Maturation
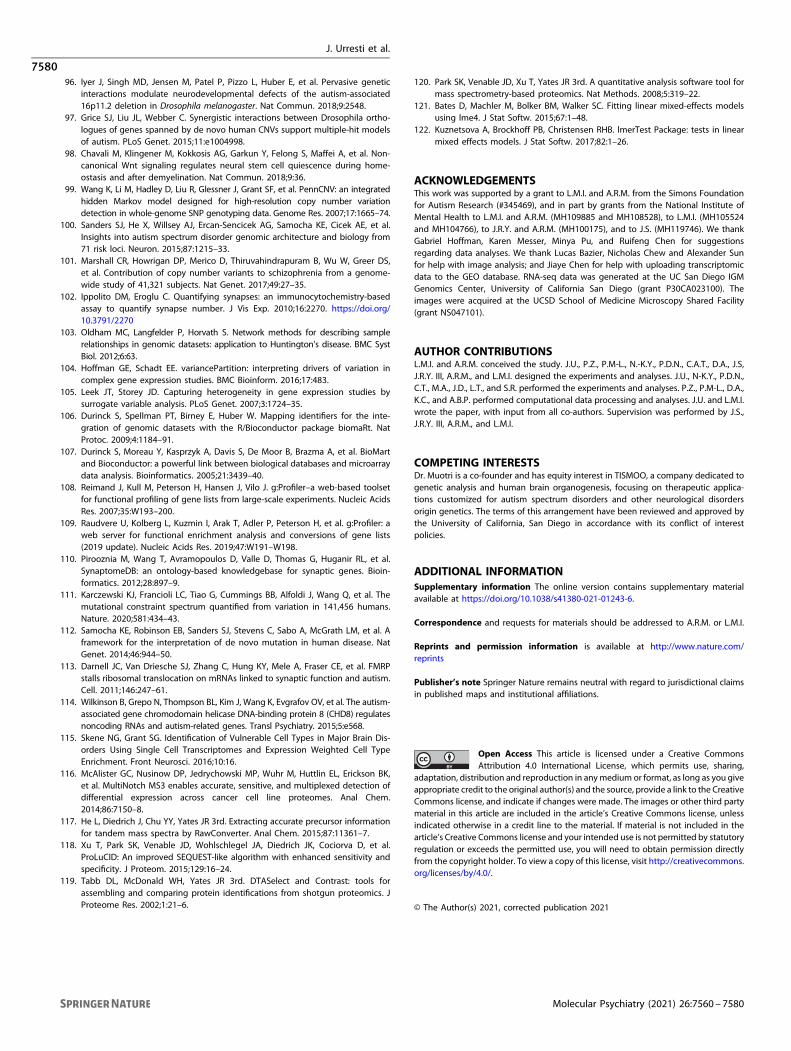
Fig. 1 Generation and characterization of cortical organoids from 16p11.2 patient and control iPSCs. A Overview of the study design andanalyses. B Comparison of iPSCs and organoids transcriptomes with the human developing brain transcriptome using CoNTExT [40]. Thesamples from three individuals of each genotype (CTRL, DEL, DUP), with two clones per individual and two replicates per clone (n= 36datasets) are shown for each group (iPSC, 1 M and 3M organoids). PCW post conception weeks, M months, Y years. C Predicted laminartransitions for 1 M and 3M organoids using TMAP [40] and the transcriptome of laser capture microdissected cortical laminae frompostmortem human fetal brain (15–21 PCW) [41]. Rank–rank hypergeometric overlap (RRHO) maps for CTRL organoids (n= 12 datasets) from3 patients, 2 clones per patient, 2 replicates per clone are shown, with CTRL iPSCs (n= 12 datasets) used as a second time point. Each pixelrepresents the overlap between fetal brain and organoids transcriptome, color-coded according to the −log10 p-value of a hypergeometrictest. On each map, the extent of shared upregulated genes is displayed in the bottom left corner, whereas shared downregulated genes aredisplayed in the top right corners. D Representative images of cortical organoids for each genotype (CTRL, DEL, DUP) at different time pointsof differentiation: induction (6 days of differentiation), proliferation (16 days of differentiation), early maturation (1 M of differentiation), andlate maturation (3 M of differentiation). Scale bar: 1000 µm. E The analysis of size differences between cortical organoids of each genotype(CTRL, DEL, and DUP) at different time points of differentiation. Organoids’ (n > 100 for each genotype) diameter was measured using ImageJ,size distribution was built to define large and small organoids as mean ± SEM within each separate experiment, and the medium group wascomprised of the remaining organoids. The average of all experiments is shown, individual bin comparison for each group (small, medium,and large) together with statistical analyses using one-way ANOVA with Tukey’s multiple comparisons are shown in Fig. S7 and Table S3.
J. Urresti et al.
7562
Molecular Psychiatry (2021) 26:7560 – 7580
organoids at four time points, at day 6 (D6, neural induction), day16 (D16, proliferation), 1 month (1 M, early maturation), and3 months (3 M, late maturation). We observed a higher proportionof large organoids in DELs and a higher proportion of smallorganoids in DUPs for DELs vs. DUPs comparison at almost all timepoints (Fig. 1D, E and Fig. S7), with the differences reachingstatistical significance at the late maturation stage for DELs vs.CTRL and at the induction and proliferation stages for DUPs vs.CTRL (Table S3). By three months, DELs were completely devoid ofsmall organoids, and the proportion of large organoids in DUPswas very low. These results demonstrate that cortical organoidsrecapitulate patients’ brain size phenotypes.
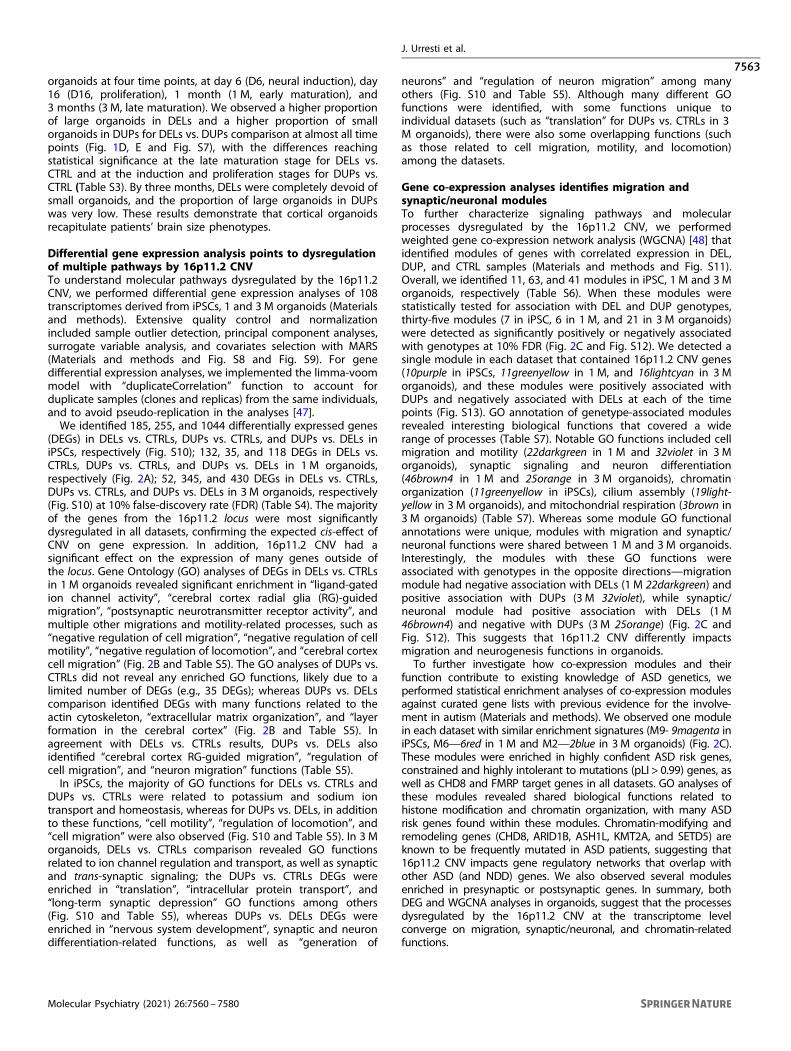
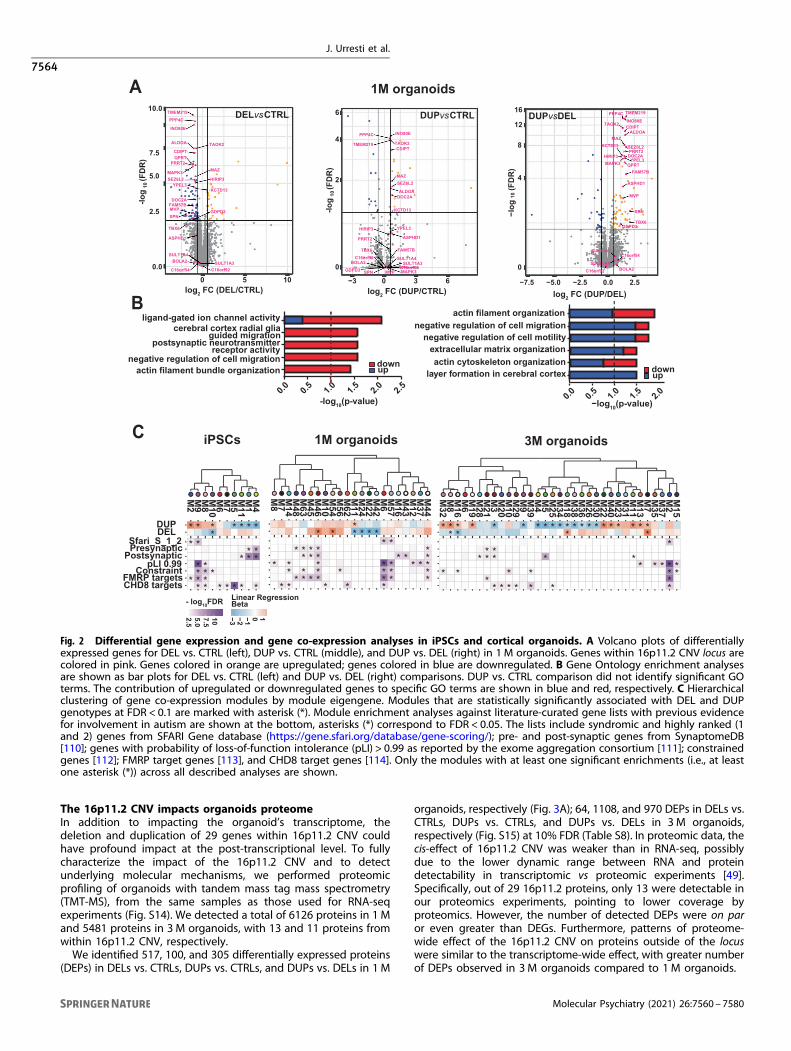
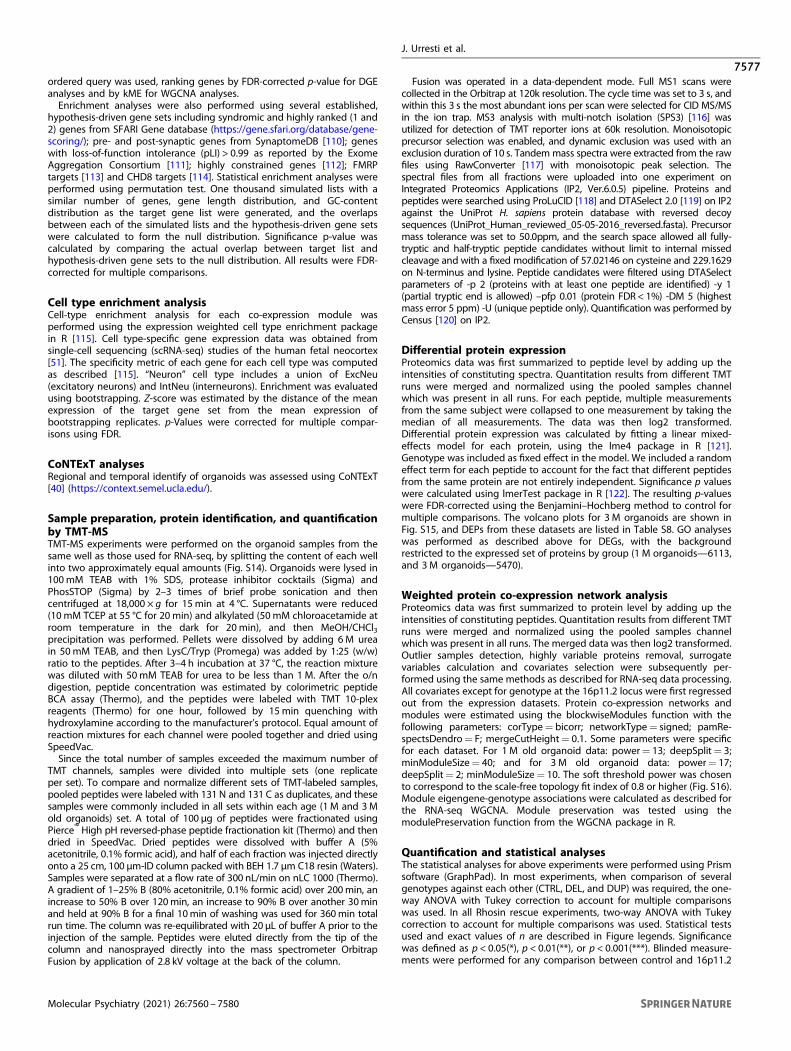
Differential gene expression analysis points to dysregulationof multiple pathways by 16p11.2 CNVTo understand molecular pathways dysregulated by the 16p11.2CNV, we performed differential gene expression analyses of 108transcriptomes derived from iPSCs, 1 and 3M organoids (Materialsand methods). Extensive quality control and normalizationincluded sample outlier detection, principal component analyses,surrogate variable analysis, and covariates selection with MARS(Materials and methods and Fig. S8 and Fig. S9). For genedifferential expression analyses, we implemented the limma-voommodel with “duplicateCorrelation” function to account forduplicate samples (clones and replicas) from the same individuals,and to avoid pseudo-replication in the analyses [47].We identified 185, 255, and 1044 differentially expressed genes
(DEGs) in DELs vs. CTRLs, DUPs vs. CTRLs, and DUPs vs. DELs iniPSCs, respectively (Fig. S10); 132, 35, and 118 DEGs in DELs vs.CTRLs, DUPs vs. CTRLs, and DUPs vs. DELs in 1 M organoids,respectively (Fig. 2A); 52, 345, and 430 DEGs in DELs vs. CTRLs,DUPs vs. CTRLs, and DUPs vs. DELs in 3 M organoids, respectively(Fig. S10) at 10% false-discovery rate (FDR) (Table S4). The majorityof the genes from the 16p11.2 locus were most significantlydysregulated in all datasets, confirming the expected cis-effect ofCNV on gene expression. In addition, 16p11.2 CNV had asignificant effect on the expression of many genes outside ofthe locus. Gene Ontology (GO) analyses of DEGs in DELs vs. CTRLsin 1 M organoids revealed significant enrichment in “ligand-gatedion channel activity”, “cerebral cortex radial glia (RG)-guidedmigration”, “postsynaptic neurotransmitter receptor activity”, andmultiple other migrations and motility-related processes, such as“negative regulation of cell migration”, “negative regulation of cellmotility”, “negative regulation of locomotion”, and “cerebral cortexcell migration” (Fig. 2B and Table S5). The GO analyses of DUPs vs.CTRLs did not reveal any enriched GO functions, likely due to alimited number of DEGs (e.g., 35 DEGs); whereas DUPs vs. DELscomparison identified DEGs with many functions related to theactin cytoskeleton, “extracellular matrix organization”, and “layerformation in the cerebral cortex” (Fig. 2B and Table S5). Inagreement with DELs vs. CTRLs results, DUPs vs. DELs alsoidentified “cerebral cortex RG-guided migration”, “regulation ofcell migration”, and “neuron migration” functions (Table S5).In iPSCs, the majority of GO functions for DELs vs. CTRLs and
DUPs vs. CTRLs were related to potassium and sodium iontransport and homeostasis, whereas for DUPs vs. DELs, in additionto these functions, “cell motility”, “regulation of locomotion”, and“cell migration” were also observed (Fig. S10 and Table S5). In 3 Morganoids, DELs vs. CTRLs comparison revealed GO functionsrelated to ion channel regulation and transport, as well as synapticand trans-synaptic signaling; the DUPs vs. CTRLs DEGs wereenriched in “translation”, “intracellular protein transport”, and“long-term synaptic depression” GO functions among others(Fig. S10 and Table S5), whereas DUPs vs. DELs DEGs wereenriched in “nervous system development”, synaptic and neurondifferentiation-related functions, as well as “generation of
neurons” and “regulation of neuron migration” among manyothers (Fig. S10 and Table S5). Although many different GOfunctions were identified, with some functions unique toindividual datasets (such as “translation” for DUPs vs. CTRLs in 3M organoids), there were also some overlapping functions (suchas those related to cell migration, motility, and locomotion)among the datasets.
Gene co-expression analyses identifies migration andsynaptic/neuronal modulesTo further characterize signaling pathways and molecularprocesses dysregulated by the 16p11.2 CNV, we performedweighted gene co-expression network analysis (WGCNA) [48] thatidentified modules of genes with correlated expression in DEL,DUP, and CTRL samples (Materials and methods and Fig. S11).Overall, we identified 11, 63, and 41 modules in iPSC, 1 M and 3Morganoids, respectively (Table S6). When these modules werestatistically tested for association with DEL and DUP genotypes,thirty-five modules (7 in iPSC, 6 in 1 M, and 21 in 3 M organoids)were detected as significantly positively or negatively associatedwith genotypes at 10% FDR (Fig. 2C and Fig. S12). We detected asingle module in each dataset that contained 16p11.2 CNV genes(10purple in iPSCs, 11greenyellow in 1 M, and 16lightcyan in 3 Morganoids), and these modules were positively associated withDUPs and negatively associated with DELs at each of the timepoints (Fig. S13). GO annotation of genetype-associated modulesrevealed interesting biological functions that covered a widerange of processes (Table S7). Notable GO functions included cellmigration and motility (22darkgreen in 1 M and 32violet in 3 Morganoids), synaptic signaling and neuron differentiation(46brown4 in 1 M and 25orange in 3 M organoids), chromatinorganization (11greenyellow in iPSCs), cilium assembly (19light-yellow in 3 M organoids), and mitochondrial respiration (3brown in3 M organoids) (Table S7). Whereas some module GO functionalannotations were unique, modules with migration and synaptic/neuronal functions were shared between 1 M and 3M organoids.Interestingly, the modules with these GO functions wereassociated with genotypes in the opposite directions—migrationmodule had negative association with DELs (1 M 22darkgreen) andpositive association with DUPs (3 M 32violet), while synaptic/neuronal module had positive association with DELs (1 M46brown4) and negative with DUPs (3 M 25orange) (Fig. 2C andFig. S12). This suggests that 16p11.2 CNV differently impactsmigration and neurogenesis functions in organoids.To further investigate how co-expression modules and their
function contribute to existing knowledge of ASD genetics, weperformed statistical enrichment analyses of co-expression modulesagainst curated gene lists with previous evidence for the involve-ment in autism (Materials and methods). We observed one modulein each dataset with similar enrichment signatures (M9- 9magenta iniPSCs, M6—6red in 1M and M2—2blue in 3M organoids) (Fig. 2C).These modules were enriched in highly confident ASD risk genes,constrained and highly intolerant to mutations (pLI > 0.99) genes, aswell as CHD8 and FMRP target genes in all datasets. GO analyses ofthese modules revealed shared biological functions related tohistone modification and chromatin organization, with many ASDrisk genes found within these modules. Chromatin-modifying andremodeling genes (CHD8, ARID1B, ASH1L, KMT2A, and SETD5) areknown to be frequently mutated in ASD patients, suggesting that16p11.2 CNV impacts gene regulatory networks that overlap withother ASD (and NDD) genes. We also observed several modulesenriched in presynaptic or postsynaptic genes. In summary, bothDEG and WGCNA analyses in organoids, suggest that the processesdysregulated by the 16p11.2 CNV at the transcriptome levelconverge on migration, synaptic/neuronal, and chromatin-relatedfunctions.
J. Urresti et al.
7563
Molecular Psychiatry (2021) 26:7560 – 7580
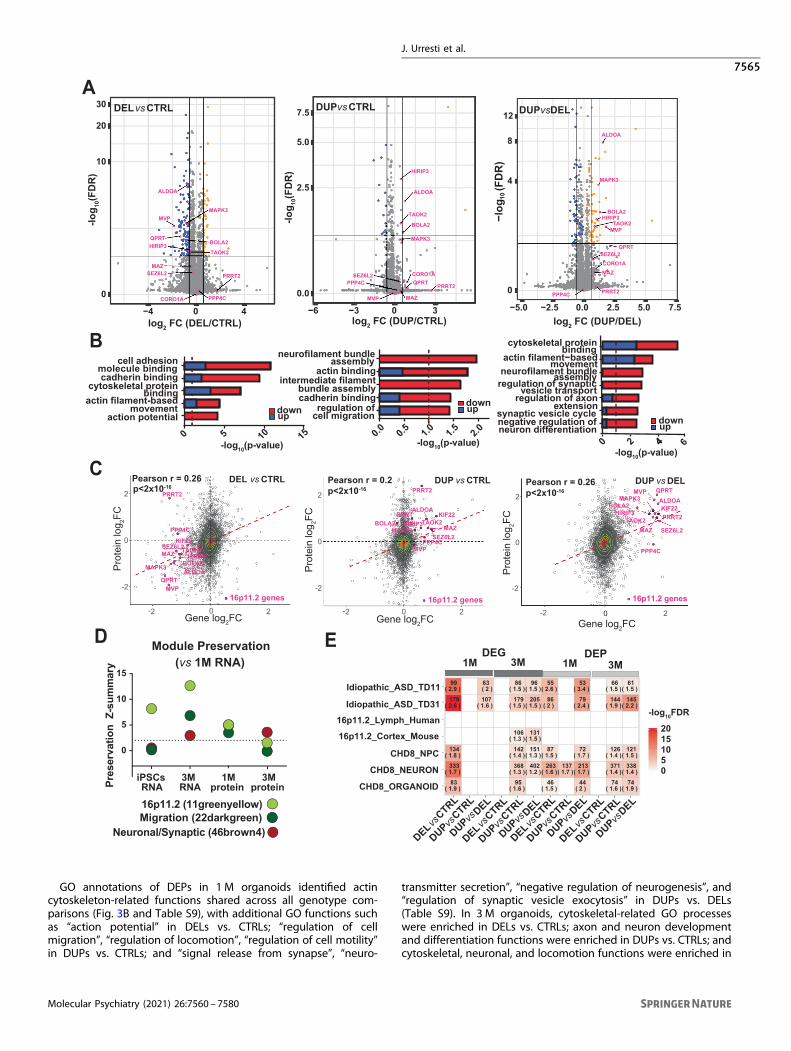
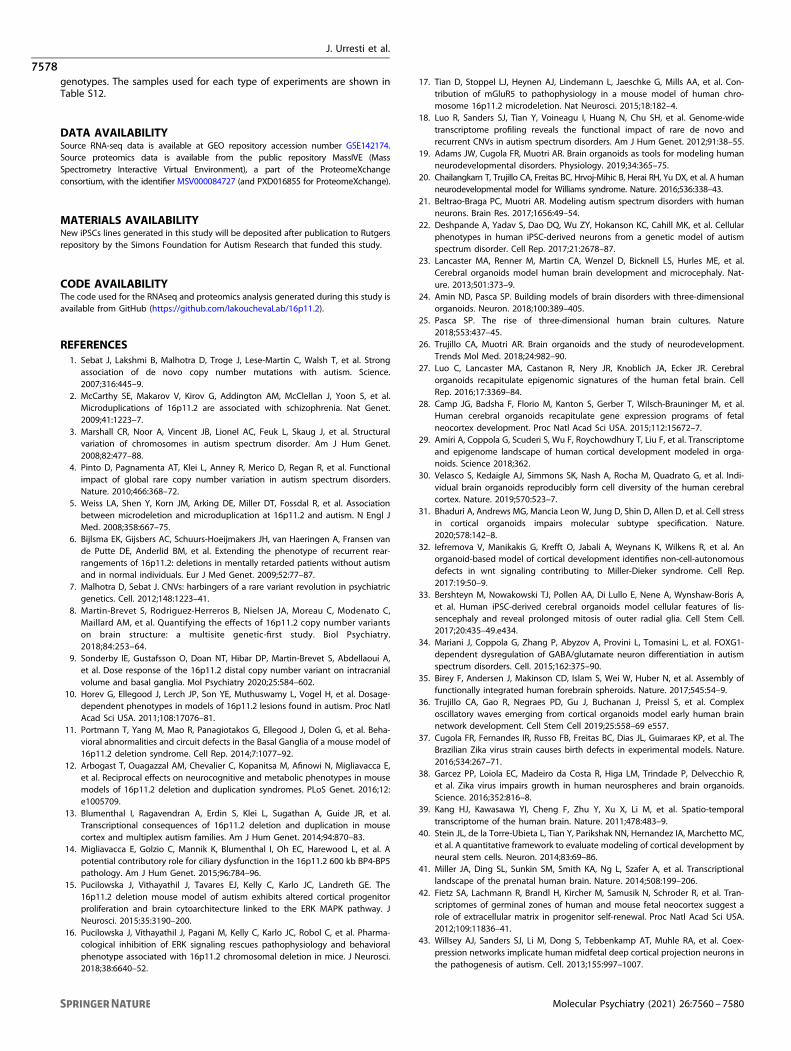
The 16p11.2 CNV impacts organoids proteomeIn addition to impacting the organoid’s transcriptome, thedeletion and duplication of 29 genes within 16p11.2 CNV couldhave profound impact at the post-transcriptional level. To fullycharacterize the impact of the 16p11.2 CNV and to detectunderlying molecular mechanisms, we performed proteomicprofiling of organoids with tandem mass tag mass spectrometry(TMT-MS), from the same samples as those used for RNA-seqexperiments (Fig. S14). We detected a total of 6126 proteins in 1 Mand 5481 proteins in 3 M organoids, with 13 and 11 proteins fromwithin 16p11.2 CNV, respectively.We identified 517, 100, and 305 differentially expressed proteins
(DEPs) in DELs vs. CTRLs, DUPs vs. CTRLs, and DUPs vs. DELs in 1 M
organoids, respectively (Fig. 3A); 64, 1108, and 970 DEPs in DELs vs.CTRLs, DUPs vs. CTRLs, and DUPs vs. DELs in 3 M organoids,respectively (Fig. S15) at 10% FDR (Table S8). In proteomic data, thecis-effect of 16p11.2 CNV was weaker than in RNA-seq, possiblydue to the lower dynamic range between RNA and proteindetectability in transcriptomic vs proteomic experiments [49].Specifically, out of 29 16p11.2 proteins, only 13 were detectable inour proteomics experiments, pointing to lower coverage byproteomics. However, the number of detected DEPs were on paror even greater than DEGs. Furthermore, patterns of proteome-wide effect of the 16p11.2 CNV on proteins outside of the locuswere similar to the transcriptome-wide effect, with greater numberof DEPs observed in 3M organoids compared to 1M organoids.
0.0
2.5
5.0
7.5
10.0
0 5 10log2 FC (DEL/CTRL)
-log
10(F
DR
)
TMEM219PPP4C
INO80E
ALDOA
CDIPTTAOK2
QPRTPRRT2
MAPK3 MAZ
SEZ6L2YPEL3
HIRIP3
KCTD13
DOC2AFAM57BMVPSPN
TBX6
GDPD3
ASPHD1
BOLA2
C16orf54 C16orf92SULT1A3
SULT1A4
DELvsCTRL
1M organoids
0
2
4
6
−3 0 3 6log2 FC (DUP/CTRL)
-log
10(F
DR
)
INO80E
TAOK2CDIPT
TMEM219
PPP4C
MAZSEZ6L2
DOC2AALDOA
KCTD13
YPEL3
ASPHD1
HIRIP3
PRRT2
FAM57B
SULT1A4SULT1A3
C16orf54MAPK3
TBX6
BOLA2C16orf92
SPNGDPD3 MVP
DUPvsCTRL
0.0 0.5 1.0 1.5 2.0 2.5
actin filament bundle organizationnegative regulation of cell migration
actin filament organizationnegative regulation of cell migration
negative regulation of cell motilityextracellular matrix organizationactin cytoskeleton organization
layer formation in cerebral cortex downup
0.0 1.50.5 1.0 2.0−log10(p-value)
Fig. 2 Differential gene expression and gene co-expression analyses in iPSCs and cortical organoids. A Volcano plots of differentiallyexpressed genes for DEL vs. CTRL (left), DUP vs. CTRL (middle), and DUP vs. DEL (right) in 1 M organoids. Genes within 16p11.2 CNV locus arecolored in pink. Genes colored in orange are upregulated; genes colored in blue are downregulated. B Gene Ontology enrichment analysesare shown as bar plots for DEL vs. CTRL (left) and DUP vs. DEL (right) comparisons. DUP vs. CTRL comparison did not identify significant GOterms. The contribution of upregulated or downregulated genes to specific GO terms are shown in blue and red, respectively. C Hierarchicalclustering of gene co-expression modules by module eigengene. Modules that are statistically significantly associated with DEL and DUPgenotypes at FDR < 0.1 are marked with asterisk (*). Module enrichment analyses against literature-curated gene lists with previous evidencefor involvement in autism are shown at the bottom, asterisks (*) correspond to FDR < 0.05. The lists include syndromic and highly ranked (1and 2) genes from SFARI Gene database (https://gene.sfari.org/database/gene-scoring/); pre- and post-synaptic genes from SynaptomeDB[110]; genes with probability of loss-of-function intolerance (pLI) > 0.99 as reported by the exome aggregation consortium [111]; constrainedgenes [112]; FMRP target genes [113], and CHD8 target genes [114]. Only the modules with at least one significant enrichments (i.e., at leastone asterisk (*)) across all described analyses are shown.
GO annotations of DEPs in 1 M organoids identified actincytoskeleton-related functions shared across all genotype com-parisons (Fig. 3B and Table S9), with additional GO functions suchas “action potential” in DELs vs. CTRLs; “regulation of cellmigration”, “regulation of locomotion”, “regulation of cell motility”in DUPs vs. CTRLs; and “signal release from synapse”, “neuro-
transmitter secretion”, “negative regulation of neurogenesis”, and“regulation of synaptic vesicle exocytosis” in DUPs vs. DELs(Table S9). In 3 M organoids, cytoskeletal-related GO processeswere enriched in DELs vs. CTRLs; axon and neuron developmentand differentiation functions were enriched in DUPs vs. CTRLs; andcytoskeletal, neuronal, and locomotion functions were enriched in
regulation of axonsynaptic vesicle cyclenegative regulation ofneuron differentiation
downup
bindingmovement assembly
extension
6
E
16p11.2 genes
ALDOABOLA2
HIRIP3KIF22
MAPK3
MAZ
MVP
PPP4C
PRRT2
QPRT
SEZ6L2TAOK2
Pearson r = 0.26p<2x10-16
-2
0
2
2Gene log2FC
Pro
tein
log 2F
C
0-2
DUP vs DEL
J. Urresti et al.
7565
Molecular Psychiatry (2021) 26:7560 – 7580
DUPs vs. DELs (Fig. S15). The DEPs shared by 1 M and 3Morganoids included synaptic (SYN1, STX1B, and SYNJ1), cytoske-letal (MAPT, TUBB4A, and TRIO) and cell adhesion (NCAM andCNTN1) proteins that were downregulated in DUPs and upregu-lated in DELs. Similar trends were observed for several high-confident autism-associated proteins (ANK2, DPYSL2, STXBP1, andDYNC1H1). This suggests that 16p11.2 CNV impacts proteinsoutside of the locus, with particular effect on cytoskeletal, synaptic,and autism-relevant proteins.To further investigate how protein co-expression modules are
impacted by the 16p11.2 CNV in DEL and DUP patient-derivedcortical organoids, we performed weighted protein co-expressionnetwork analysis (WPCNA) using TMT-MS proteomic data (Materi-als and methods and Fig. S16). We identified 21 and 17 protein co-expression modules in 1 M and 3M organoids, respectively(Table S10). Twelve modules (5 in 1 M and 7 in 3 M organoids)were significantly associated with DEL or DUP genotypes at 10%FDR (Fig. S17). The significant modules included those enriched inRNA splicing and chromatin organization (5green in 1 M orga-noids), ribosome and translation (2blue in 3 M organoids),cytoskeleton and microtubule (7black in 3 M organoids), andmitochondrial respiration (8pink in 3 M organoids) GO functions(Table S11). One module detected in 3 M organoids by WPCNA,1turquoise (M1), was enriched in pre- and postsynaptic, con-strained and FMRP target proteins (Fig. S18). It included proteinsinvolved in processes related to neuron differentiation andneurogenesis, neuron projection development, synaptic signaling,cytoskeleton organization, actin filament processes, as well asmigration and locomotion (Table S11). Many of these functionswere also identified by RNA-seq profiling, pointing to theconvergence of molecular processes at the transcriptome andproteome levels.
Biological convergence of organoids transcriptome andproteomeTo determine the extent of convergence between organoidstranscriptomes and proteomes, we calculated correlation coeffi-cient of expression levels for genes and proteins (Fig. 3C). Globally,we observed positive correlation between transcriptomes andproteomes in 1 M organoids (DELs vs. CTRLs Pearson r= 0.26;DUPs vs. CTRLs r= 0.2; DUPs vs. DELs r= 0.26; p < 2 × 10⁻¹⁶)(Fig. 3C) and in 3 M organoids (DELs vs. CTRLs Pearson r= 0.17;DUPs vs. CTRLs r= 0.19; DUPs vs. DELs r= 0.1; p < 2 × 10⁻¹⁶)(Fig. S19). The correlation increased further (Pearson r= 0.79, p <2 × 10⁻¹⁶) when we combined DEGs vs. proteome and DEPs vs.transcriptome, either with or without 16p11.2 genes/proteins(Fig. S20). We then carried out module preservation analyses toidentify conserved modules across these two levels of regulation.This analysis demonstrated a high degree of preservation (Z-summary > 2) at the RNA and protein level for most modules that
were significantly associated with genotype in 1 M organoids(Fig. S21), and slightly lower degree of preservation in 3 Morganoids (Fig. S21). The 16p11.2, migration and neuronal/synaptic modes had a high degree of preservation in both, 1 Morganoids (Fig. 3D) and 3 M organoids (Fig. S21). The modulecontaining 16p11.2 genes had the highest preservation at thetranscriptional level (Fig. 3D). Overall, we observed that organoidstranscriptomes and proteomes have a positive correlation,especially when normalized by the coverage (Fig. S20); geneand protein co-expression modules associated with DEL and DUPgenotypes demonstrate a high degree of preservation, especiallyin 1 M organoids; the DEGs and DEPs, as well as transcriptomicand proteomic modules, share GO functional annotations relatedto actin cytoskeletal processes, migration, and motility, neuronal/synaptic and other functions.To put our results into the context of previous studies, we
performed enrichment analyses our DEGs and DEPs against otherdatasets with relevance to ASD. Specifically, our DEGs and DEPswere compared with transcriptomes of 16p11.2 patients’ lympho-blast lines and cerebral cortex of 16p11.2 mice [13], idiopathic ASDpatient-derived organoids [34], and CHD8 KO organoids, NPCs,and neurons [50] (Fig. 3E). Overall, we observed a greater overlapof our DEGs and DEPs with DEGs identified in idiopathic ASDorganoid models, suggesting that 16p11.2 organoids sharetranscriptomic signatures with other ASD subtypes. There wereno overlap of our datasets with the transcriptomes from 16p11.2patients’ lymphoblastoid cell lines, and a very limited overlap (onlyfor 3 M DEGs) with the 16p11.2 mouse cortex. We observed agood overlap of our data with CHD8 neurons, NPCs, andorganoids. In summary, we observed greater overlap of our16p11.2 organoid data with organoid models of idiopathic ASDand other ASD genes (i.e., CHD8), than with 16p11.2 models fromhuman lymphocytes or mouse brain. These results highlight theimportance of using human-derived models for investigatingneurodevelopmental disorders and suggest similarities betweendifferent genetic subtypes of ASD.
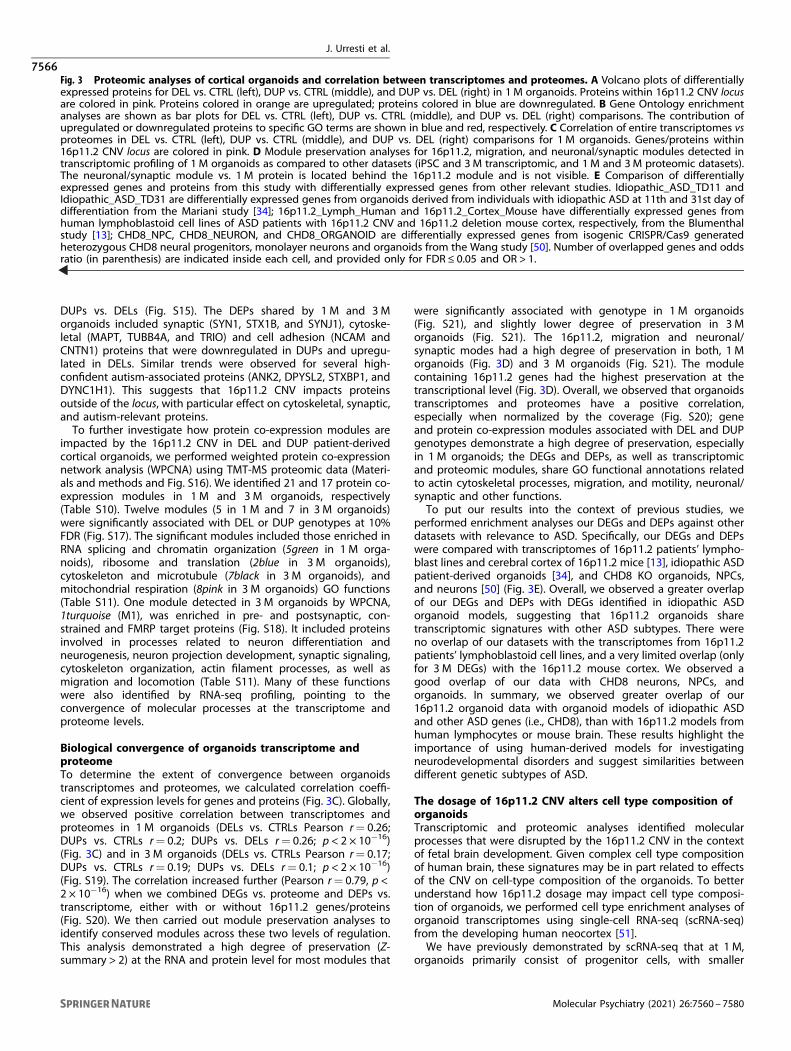
The dosage of 16p11.2 CNV alters cell type composition oforganoidsTranscriptomic and proteomic analyses identified molecularprocesses that were disrupted by the 16p11.2 CNV in the contextof fetal brain development. Given complex cell type compositionof human brain, these signatures may be in part related to effectsof the CNV on cell-type composition of the organoids. To betterunderstand how 16p11.2 dosage may impact cell type composi-tion of organoids, we performed cell type enrichment analyses oforganoid transcriptomes using single-cell RNA-seq (scRNA-seq)from the developing human neocortex [51].We have previously demonstrated by scRNA-seq that at 1 M,
organoids primarily consist of progenitor cells, with smaller
Fig. 3 Proteomic analyses of cortical organoids and correlation between transcriptomes and proteomes. A Volcano plots of differentiallyexpressed proteins for DEL vs. CTRL (left), DUP vs. CTRL (middle), and DUP vs. DEL (right) in 1 M organoids. Proteins within 16p11.2 CNV locusare colored in pink. Proteins colored in orange are upregulated; proteins colored in blue are downregulated. B Gene Ontology enrichmentanalyses are shown as bar plots for DEL vs. CTRL (left), DUP vs. CTRL (middle), and DUP vs. DEL (right) comparisons. The contribution ofupregulated or downregulated proteins to specific GO terms are shown in blue and red, respectively. C Correlation of entire transcriptomes vsproteomes in DEL vs. CTRL (left), DUP vs. CTRL (middle), and DUP vs. DEL (right) comparisons for 1 M organoids. Genes/proteins within16p11.2 CNV locus are colored in pink. D Module preservation analyses for 16p11.2, migration, and neuronal/synaptic modules detected intranscriptomic profiling of 1 M organoids as compared to other datasets (iPSC and 3M transcriptomic, and 1 M and 3M proteomic datasets).The neuronal/synaptic module vs. 1 M protein is located behind the 16p11.2 module and is not visible. E Comparison of differentiallyexpressed genes and proteins from this study with differentially expressed genes from other relevant studies. Idiopathic_ASD_TD11 andIdiopathic_ASD_TD31 are differentially expressed genes from organoids derived from individuals with idiopathic ASD at 11th and 31st day ofdifferentiation from the Mariani study [34]; 16p11.2_Lymph_Human and 16p11.2_Cortex_Mouse have differentially expressed genes fromhuman lymphoblastoid cell lines of ASD patients with 16p11.2 CNV and 16p11.2 deletion mouse cortex, respectively, from the Blumenthalstudy [13]; CHD8_NPC, CHD8_NEURON, and CHD8_ORGANOID are differentially expressed genes from isogenic CRISPR/Cas9 generatedheterozygous CHD8 neural progenitors, monolayer neurons and organoids from the Wang study [50]. Number of overlapped genes and oddsratio (in parenthesis) are indicated inside each cell, and provided only for FDR ≤ 0.05 and OR > 1.
J. Urresti et al.
7566
Molecular Psychiatry (2021) 26:7560 – 7580
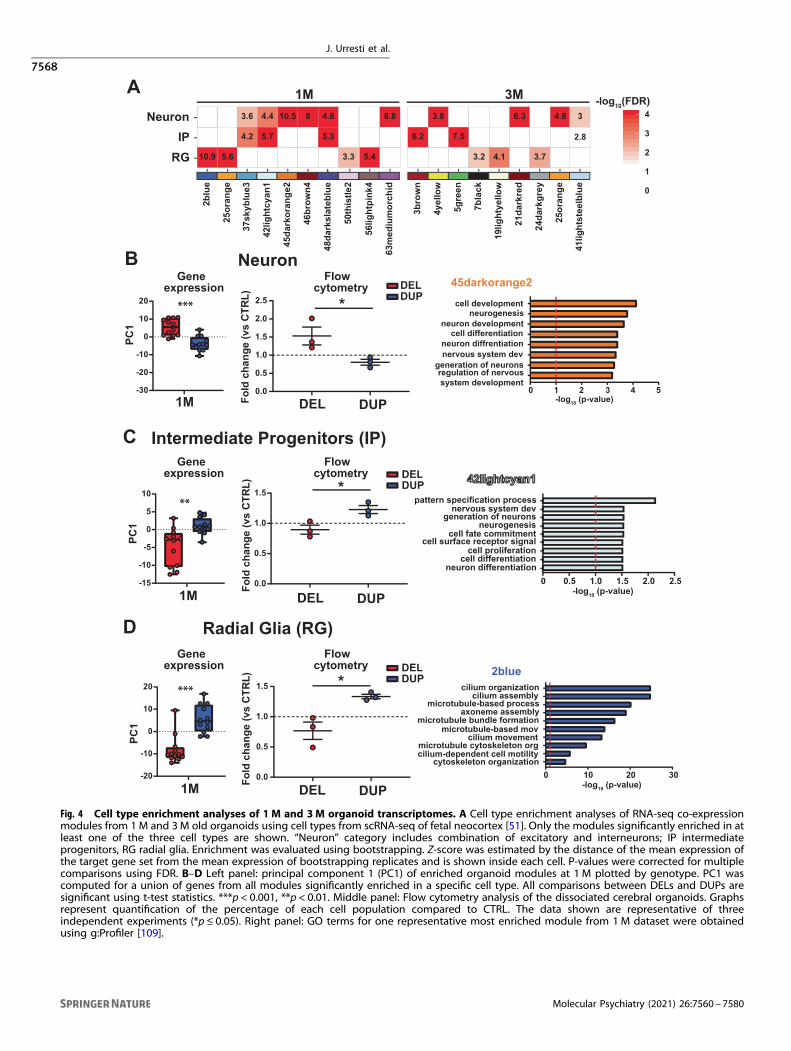
fractions of glutamatergic neurons, glial cells, and intermediateprogenitors (IPs) [36]. Here, we used recent scRNA-seq data fromfetal human neocortex [51] to identify cell types significantlyenriched in 1 M and 3M old organoids. We observed significantenrichment of different cell types in co-expression modules for1 M and 3M organoids (Fig. 4A). Further analyses revealed thatat 1 M DEL organoids were enriched in neuronal cell types (Fig. 4B),whereas DUPs were enriched in IPs and RG (Fig. 4C, D). In supportof cell-type enrichment results, GO functions of most enrichedmodules reflected processes typically associated with correspond-ing cell types (Fig. 4B–D). For example, GO functions for 1 M45darkorange2 “Neuron” cell type module included “neurogenesis”,“neuron development” and “neuron differentiation”. The GOfunctions for the “IP” 42lighcyan1 module included “patternspecification process”, “nervous system development”, and “gen-eration of neurons”, along with differentiation- and proliferation-related functions that are relevant to primary function of IP inproducing cortical neurons. The GO functions for “RG” 2bluemodule captured cilium that is frequently found in radial glial cells,and microtubule-based processes. These results support ahypothesis that 16p11.2 copy number has a quantitative effecton the ratio of neurons to progenitor cells, with DUPs having areduced proportion of neurons and DELs having an excess.We sought to test this hypothesis directly by flow cytometry
analysis on 1 M dissociated cerebral organoids (Materials andmethods). Single-cell suspensions were labeled with NeuN, TBR2,and SOX2 for neurons, IP, and RG, respectively, and thepercentages of positive cells were quantified (Fig. S22). Weobserved that the percentages of positively labeled cells betweengenotypes from flow cytometry experiments correlated well withsingle-cell enrichment analyses from gene expression. Thepercentage of NeuN+ cells was significantly higher in DELscompared to DUPs, suggesting an increase in the number ofneurons, in agreement with cell-type enrichment analyses (Fig. 4B).In contrast, the percentages of TBR2+ and SOX2+ cells weresignificantly higher in DUPs, suggesting an increase in progenitorpopulations of RG and IP (Fig. 4C, D). These results point topotentially increased neuronal maturation in DEL organoids, andthe opposite effect in DUP organoids. Overall, cell type enrich-ment and flow cytometry results provided further insight into cell-type composition of organoids and correlated with previousfindings from ASD brain. For instance, excess neuron number hasbeen observed as a hallmark of brain overgrowth in ASD patientsduring first year of life [52, 53], supporting “Neuron” cell typeenrichment and macrocephaly phenotype in DELs.
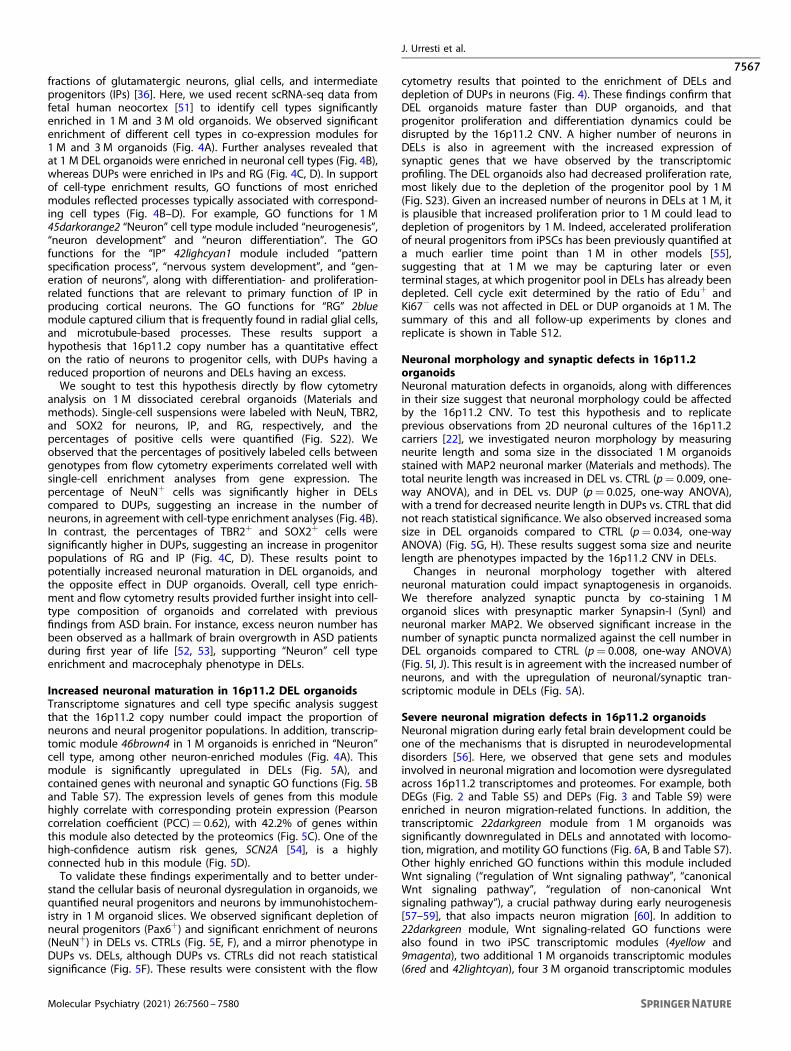
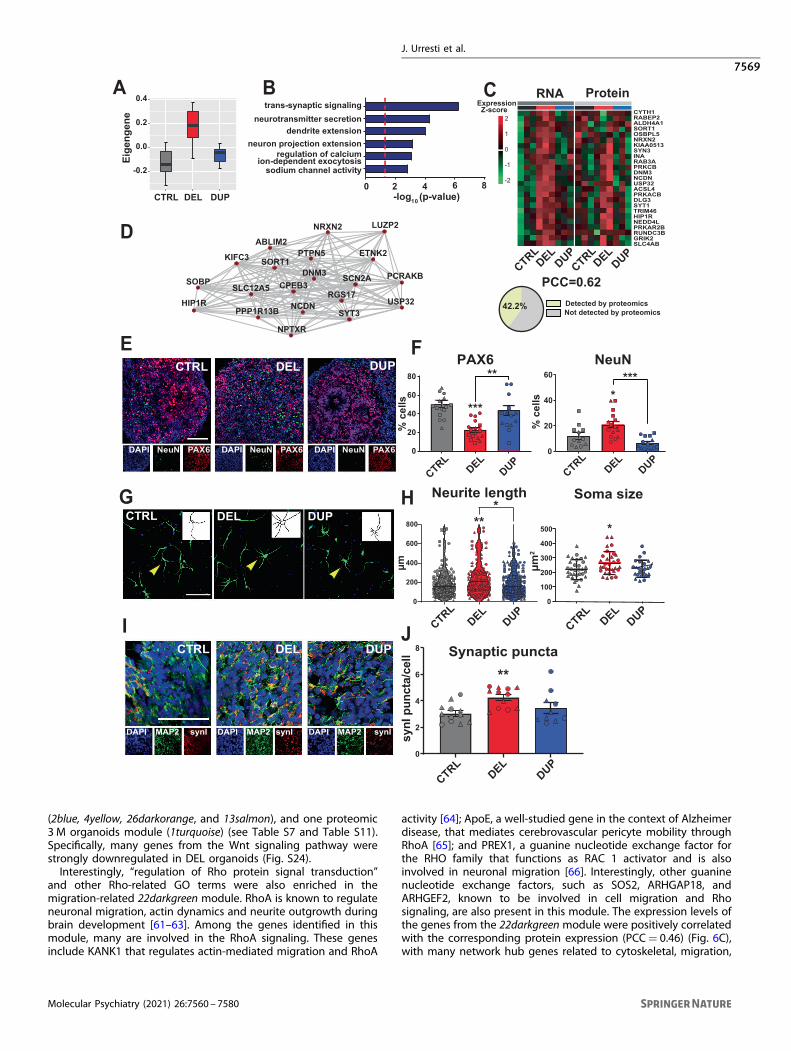
Increased neuronal maturation in 16p11.2 DEL organoidsTranscriptome signatures and cell type specific analysis suggestthat the 16p11.2 copy number could impact the proportion ofneurons and neural progenitor populations. In addition, transcrip-tomic module 46brown4 in 1 M organoids is enriched in “Neuron”cell type, among other neuron-enriched modules (Fig. 4A). Thismodule is significantly upregulated in DELs (Fig. 5A), andcontained genes with neuronal and synaptic GO functions (Fig. 5Band Table S7). The expression levels of genes from this modulehighly correlate with corresponding protein expression (Pearsoncorrelation coefficient (PCC)= 0.62), with 42.2% of genes withinthis module also detected by the proteomics (Fig. 5C). One of thehigh-confidence autism risk genes, SCN2A [54], is a highlyconnected hub in this module (Fig. 5D).To validate these findings experimentally and to better under-
stand the cellular basis of neuronal dysregulation in organoids, wequantified neural progenitors and neurons by immunohistochem-istry in 1 M organoid slices. We observed significant depletion ofneural progenitors (Pax6+) and significant enrichment of neurons(NeuN+) in DELs vs. CTRLs (Fig. 5E, F), and a mirror phenotype inDUPs vs. DELs, although DUPs vs. CTRLs did not reach statisticalsignificance (Fig. 5F). These results were consistent with the flow
cytometry results that pointed to the enrichment of DELs anddepletion of DUPs in neurons (Fig. 4). These findings confirm thatDEL organoids mature faster than DUP organoids, and thatprogenitor proliferation and differentiation dynamics could bedisrupted by the 16p11.2 CNV. A higher number of neurons inDELs is also in agreement with the increased expression ofsynaptic genes that we have observed by the transcriptomicprofiling. The DEL organoids also had decreased proliferation rate,most likely due to the depletion of the progenitor pool by 1 M(Fig. S23). Given an increased number of neurons in DELs at 1 M, itis plausible that increased proliferation prior to 1 M could lead todepletion of progenitors by 1 M. Indeed, accelerated proliferationof neural progenitors from iPSCs has been previously quantified ata much earlier time point than 1 M in other models [55],suggesting that at 1 M we may be capturing later or eventerminal stages, at which progenitor pool in DELs has already beendepleted. Cell cycle exit determined by the ratio of Edu+ andKi67− cells was not affected in DEL or DUP organoids at 1 M. Thesummary of this and all follow-up experiments by clones andreplicate is shown in Table S12.
Neuronal morphology and synaptic defects in 16p11.2organoidsNeuronal maturation defects in organoids, along with differencesin their size suggest that neuronal morphology could be affectedby the 16p11.2 CNV. To test this hypothesis and to replicateprevious observations from 2D neuronal cultures of the 16p11.2carriers [22], we investigated neuron morphology by measuringneurite length and soma size in the dissociated 1 M organoidsstained with MAP2 neuronal marker (Materials and methods). Thetotal neurite length was increased in DEL vs. CTRL (p= 0.009, one-way ANOVA), and in DEL vs. DUP (p= 0.025, one-way ANOVA),with a trend for decreased neurite length in DUPs vs. CTRL that didnot reach statistical significance. We also observed increased somasize in DEL organoids compared to CTRL (p= 0.034, one-wayANOVA) (Fig. 5G, H). These results suggest soma size and neuritelength are phenotypes impacted by the 16p11.2 CNV in DELs.Changes in neuronal morphology together with altered
neuronal maturation could impact synaptogenesis in organoids.We therefore analyzed synaptic puncta by co-staining 1 Morganoid slices with presynaptic marker Synapsin-I (SynI) andneuronal marker MAP2. We observed significant increase in thenumber of synaptic puncta normalized against the cell number inDEL organoids compared to CTRL (p= 0.008, one-way ANOVA)(Fig. 5I, J). This result is in agreement with the increased number ofneurons, and with the upregulation of neuronal/synaptic tran-scriptomic module in DELs (Fig. 5A).
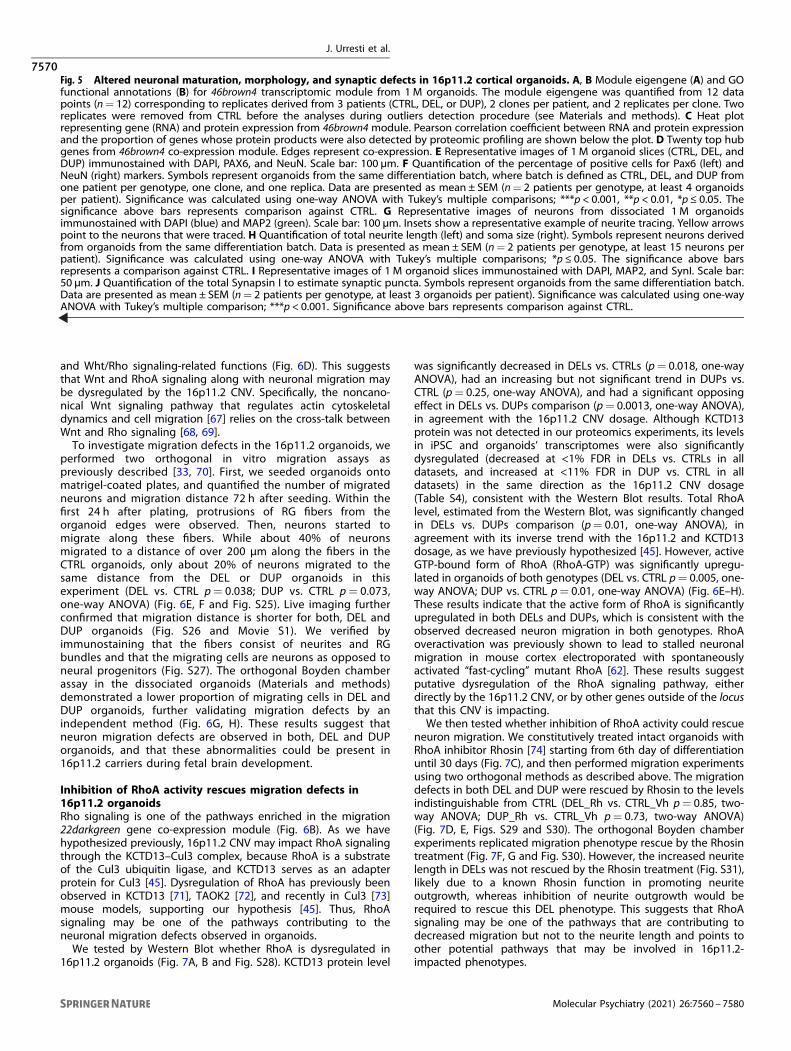
Severe neuronal migration defects in 16p11.2 organoidsNeuronal migration during early fetal brain development could beone of the mechanisms that is disrupted in neurodevelopmentaldisorders [56]. Here, we observed that gene sets and modulesinvolved in neuronal migration and locomotion were dysregulatedacross 16p11.2 transcriptomes and proteomes. For example, bothDEGs (Fig. 2 and Table S5) and DEPs (Fig. 3 and Table S9) wereenriched in neuron migration-related functions. In addition, thetranscriptomic 22darkgreen module from 1M organoids wassignificantly downregulated in DELs and annotated with locomo-tion, migration, and motility GO functions (Fig. 6A, B and Table S7).Other highly enriched GO functions within this module includedWnt signaling (“regulation of Wnt signaling pathway”, “canonicalWnt signaling pathway”, “regulation of non-canonical Wntsignaling pathway”), a crucial pathway during early neurogenesis[57–59], that also impacts neuron migration [60]. In addition to22darkgreen module, Wnt signaling-related GO functions werealso found in two iPSC transcriptomic modules (4yellow and9magenta), two additional 1 M organoids transcriptomic modules(6red and 42lightcyan), four 3 M organoid transcriptomic modules
J. Urresti et al.
7567
Molecular Psychiatry (2021) 26:7560 – 7580
regulation of nervous system development
generation of neuronsnervous system devneuron diffrentiation
Fig. 4 Cell type enrichment analyses of 1 M and 3M organoid transcriptomes. A Cell type enrichment analyses of RNA-seq co-expressionmodules from 1M and 3M old organoids using cell types from scRNA-seq of fetal neocortex [51]. Only the modules significantly enriched in atleast one of the three cell types are shown. “Neuron” category includes combination of excitatory and interneurons; IP intermediateprogenitors, RG radial glia. Enrichment was evaluated using bootstrapping. Z-score was estimated by the distance of the mean expression ofthe target gene set from the mean expression of bootstrapping replicates and is shown inside each cell. P-values were corrected for multiplecomparisons using FDR. B–D Left panel: principal component 1 (PC1) of enriched organoid modules at 1 M plotted by genotype. PC1 wascomputed for a union of genes from all modules significantly enriched in a specific cell type. All comparisons between DELs and DUPs aresignificant using t-test statistics. ***p < 0.001, **p < 0.01. Middle panel: Flow cytometry analysis of the dissociated cerebral organoids. Graphsrepresent quantification of the percentage of each cell population compared to CTRL. The data shown are representative of threeindependent experiments (*p ≤ 0.05). Right panel: GO terms for one representative most enriched module from 1M dataset were obtainedusing g:Profiler [109].
J. Urresti et al.
7568
Molecular Psychiatry (2021) 26:7560 – 7580
(2blue, 4yellow, 26darkorange, and 13salmon), and one proteomic3 M organoids module (1turquoise) (see Table S7 and Table S11).Specifically, many genes from the Wnt signaling pathway werestrongly downregulated in DEL organoids (Fig. S24).Interestingly, “regulation of Rho protein signal transduction”
and other Rho-related GO terms were also enriched in themigration-related 22darkgreen module. RhoA is known to regulateneuronal migration, actin dynamics and neurite outgrowth duringbrain development [61–63]. Among the genes identified in thismodule, many are involved in the RhoA signaling. These genesinclude KANK1 that regulates actin-mediated migration and RhoA
activity [64]; ApoE, a well-studied gene in the context of Alzheimerdisease, that mediates cerebrovascular pericyte mobility throughRhoA [65]; and PREX1, a guanine nucleotide exchange factor forthe RHO family that functions as RAC 1 activator and is alsoinvolved in neuronal migration [66]. Interestingly, other guaninenucleotide exchange factors, such as SOS2, ARHGAP18, andARHGEF2, known to be involved in cell migration and Rhosignaling, are also present in this module. The expression levels ofthe genes from the 22darkgreen module were positively correlatedwith the corresponding protein expression (PCC= 0.46) (Fig. 6C),with many network hub genes related to cytoskeletal, migration,
and Wht/Rho signaling-related functions (Fig. 6D). This suggeststhat Wnt and RhoA signaling along with neuronal migration maybe dysregulated by the 16p11.2 CNV. Specifically, the noncano-nical Wnt signaling pathway that regulates actin cytoskeletaldynamics and cell migration [67] relies on the cross-talk betweenWnt and Rho signaling [68, 69].To investigate migration defects in the 16p11.2 organoids, we
performed two orthogonal in vitro migration assays aspreviously described [33, 70]. First, we seeded organoids ontomatrigel-coated plates, and quantified the number of migratedneurons and migration distance 72 h after seeding. Within thefirst 24 h after plating, protrusions of RG fibers from theorganoid edges were observed. Then, neurons started tomigrate along these fibers. While about 40% of neuronsmigrated to a distance of over 200 μm along the fibers in theCTRL organoids, only about 20% of neurons migrated to thesame distance from the DEL or DUP organoids in thisexperiment (DEL vs. CTRL p= 0.038; DUP vs. CTRL p= 0.073,one-way ANOVA) (Fig. 6E, F and Fig. S25). Live imaging furtherconfirmed that migration distance is shorter for both, DEL andDUP organoids (Fig. S26 and Movie S1). We verified byimmunostaining that the fibers consist of neurites and RGbundles and that the migrating cells are neurons as opposed toneural progenitors (Fig. S27). The orthogonal Boyden chamberassay in the dissociated organoids (Materials and methods)demonstrated a lower proportion of migrating cells in DEL andDUP organoids, further validating migration defects by anindependent method (Fig. 6G, H). These results suggest thatneuron migration defects are observed in both, DEL and DUPorganoids, and that these abnormalities could be present in16p11.2 carriers during fetal brain development.
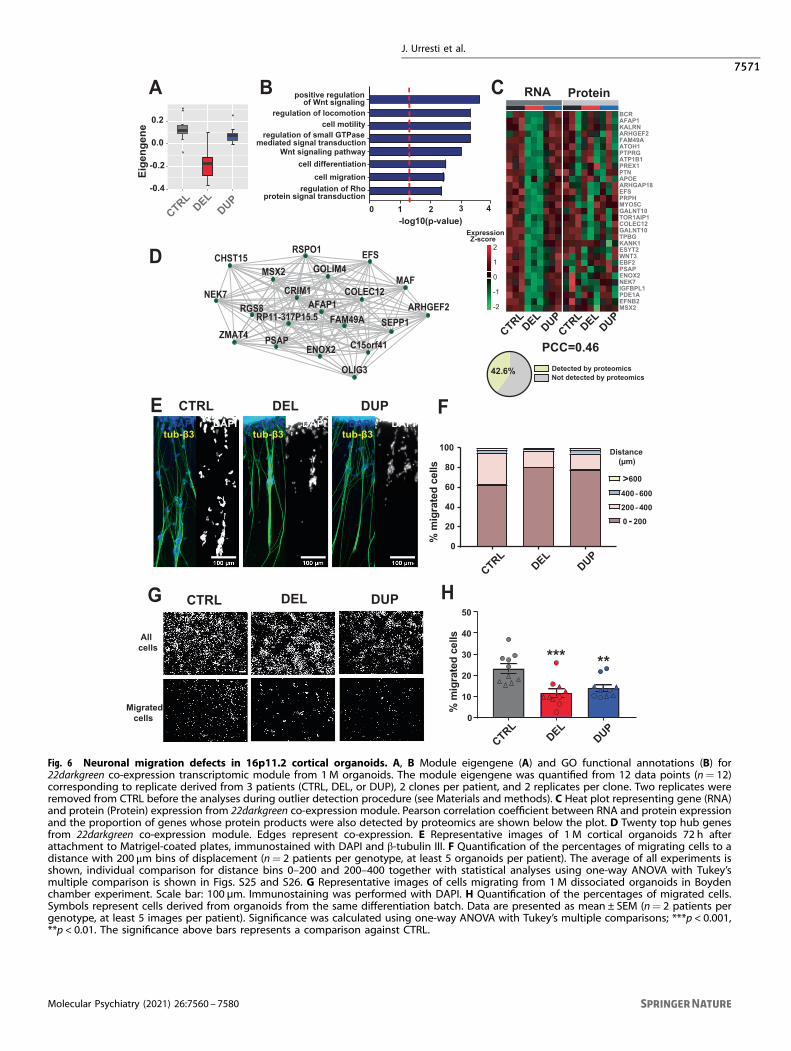
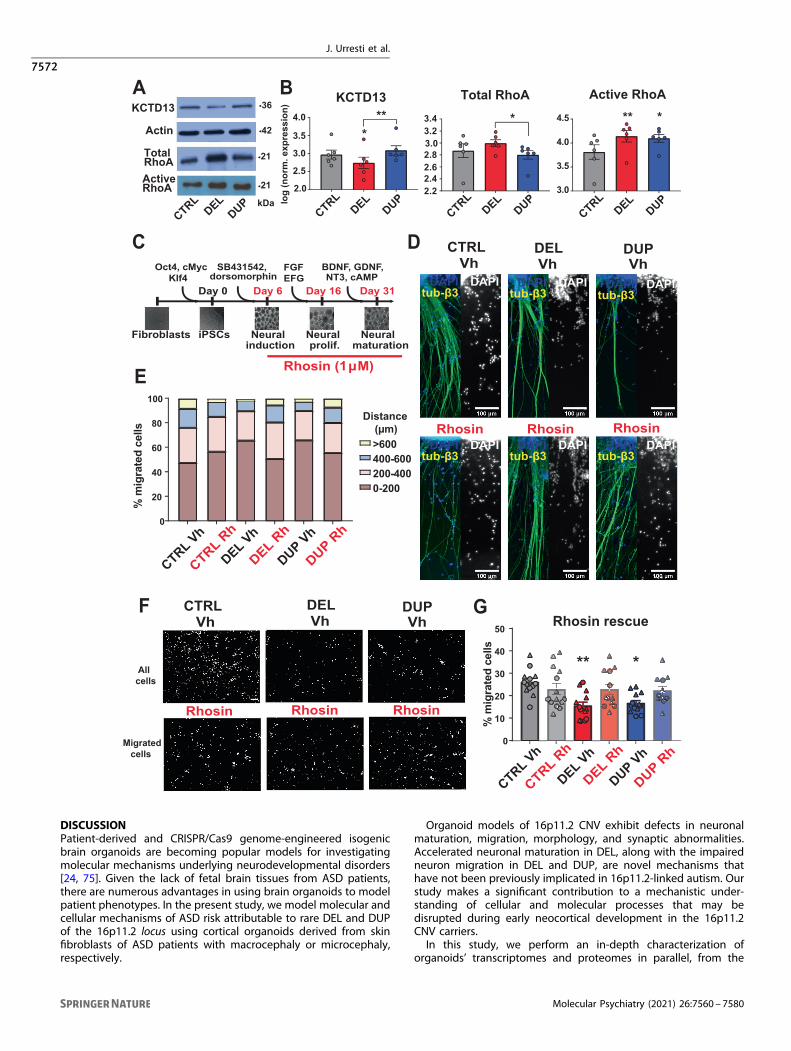
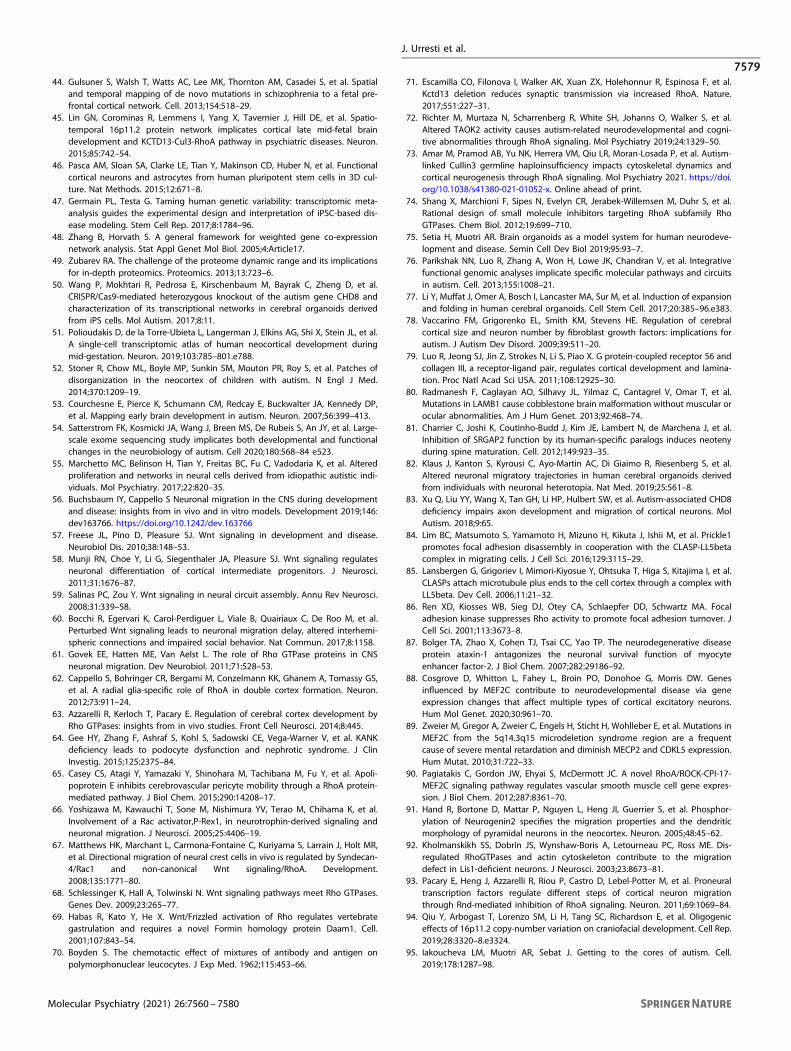
Inhibition of RhoA activity rescues migration defects in16p11.2 organoidsRho signaling is one of the pathways enriched in the migration22darkgreen gene co-expression module (Fig. 6B). As we havehypothesized previously, 16p11.2 CNV may impact RhoA signalingthrough the KCTD13–Cul3 complex, because RhoA is a substrateof the Cul3 ubiquitin ligase, and KCTD13 serves as an adapterprotein for Cul3 [45]. Dysregulation of RhoA has previously beenobserved in KCTD13 [71], TAOK2 [72], and recently in Cul3 [73]mouse models, supporting our hypothesis [45]. Thus, RhoAsignaling may be one of the pathways contributing to theneuronal migration defects observed in organoids.We tested by Western Blot whether RhoA is dysregulated in
16p11.2 organoids (Fig. 7A, B and Fig. S28). KCTD13 protein level
was significantly decreased in DELs vs. CTRLs (p= 0.018, one-wayANOVA), had an increasing but not significant trend in DUPs vs.CTRL (p= 0.25, one-way ANOVA), and had a significant opposingeffect in DELs vs. DUPs comparison (p= 0.0013, one-way ANOVA),in agreement with the 16p11.2 CNV dosage. Although KCTD13protein was not detected in our proteomics experiments, its levelsin iPSC and organoids’ transcriptomes were also significantlydysregulated (decreased at <1% FDR in DELs vs. CTRLs in alldatasets, and increased at <11% FDR in DUP vs. CTRL in alldatasets) in the same direction as the 16p11.2 CNV dosage(Table S4), consistent with the Western Blot results. Total RhoAlevel, estimated from the Western Blot, was significantly changedin DELs vs. DUPs comparison (p= 0.01, one-way ANOVA), inagreement with its inverse trend with the 16p11.2 and KCTD13dosage, as we have previously hypothesized [45]. However, activeGTP-bound form of RhoA (RhoA-GTP) was significantly upregu-lated in organoids of both genotypes (DEL vs. CTRL p= 0.005, one-way ANOVA; DUP vs. CTRL p= 0.01, one-way ANOVA) (Fig. 6E–H).These results indicate that the active form of RhoA is significantlyupregulated in both DELs and DUPs, which is consistent with theobserved decreased neuron migration in both genotypes. RhoAoveractivation was previously shown to lead to stalled neuronalmigration in mouse cortex electroporated with spontaneouslyactivated “fast-cycling” mutant RhoA [62]. These results suggestputative dysregulation of the RhoA signaling pathway, eitherdirectly by the 16p11.2 CNV, or by other genes outside of the locusthat this CNV is impacting.We then tested whether inhibition of RhoA activity could rescue
neuron migration. We constitutively treated intact organoids withRhoA inhibitor Rhosin [74] starting from 6th day of differentiationuntil 30 days (Fig. 7C), and then performed migration experimentsusing two orthogonal methods as described above. The migrationdefects in both DEL and DUP were rescued by Rhosin to the levelsindistinguishable from CTRL (DEL_Rh vs. CTRL_Vh p= 0.85, two-way ANOVA; DUP_Rh vs. CTRL_Vh p= 0.73, two-way ANOVA)(Fig. 7D, E, Figs. S29 and S30). The orthogonal Boyden chamberexperiments replicated migration phenotype rescue by the Rhosintreatment (Fig. 7F, G and Fig. S30). However, the increased neuritelength in DELs was not rescued by the Rhosin treatment (Fig. S31),likely due to a known Rhosin function in promoting neuriteoutgrowth, whereas inhibition of neurite outgrowth would berequired to rescue this DEL phenotype. This suggests that RhoAsignaling may be one of the pathways that are contributing todecreased migration but not to the neurite length and points toother potential pathways that may be involved in 16p11.2-impacted phenotypes.
Fig. 5 Altered neuronal maturation, morphology, and synaptic defects in 16p11.2 cortical organoids. A, B Module eigengene (A) and GOfunctional annotations (B) for 46brown4 transcriptomic module from 1M organoids. The module eigengene was quantified from 12 datapoints (n= 12) corresponding to replicates derived from 3 patients (CTRL, DEL, or DUP), 2 clones per patient, and 2 replicates per clone. Tworeplicates were removed from CTRL before the analyses during outliers detection procedure (see Materials and methods). C Heat plotrepresenting gene (RNA) and protein expression from 46brown4 module. Pearson correlation coefficient between RNA and protein expressionand the proportion of genes whose protein products were also detected by proteomic profiling are shown below the plot. D Twenty top hubgenes from 46brown4 co-expression module. Edges represent co-expression. E Representative images of 1 M organoid slices (CTRL, DEL, andDUP) immunostained with DAPI, PAX6, and NeuN. Scale bar: 100 µm. F Quantification of the percentage of positive cells for Pax6 (left) andNeuN (right) markers. Symbols represent organoids from the same differentiation batch, where batch is defined as CTRL, DEL, and DUP fromone patient per genotype, one clone, and one replica. Data are presented as mean ± SEM (n= 2 patients per genotype, at least 4 organoidsper patient). Significance was calculated using one-way ANOVA with Tukey’s multiple comparisons; ***p < 0.001, **p < 0.01, *p ≤ 0.05. Thesignificance above bars represents comparison against CTRL. G Representative images of neurons from dissociated 1 M organoidsimmunostained with DAPI (blue) and MAP2 (green). Scale bar: 100 µm. Insets show a representative example of neurite tracing. Yellow arrowspoint to the neurons that were traced. H Quantification of total neurite length (left) and soma size (right). Symbols represent neurons derivedfrom organoids from the same differentiation batch. Data is presented as mean ± SEM (n= 2 patients per genotype, at least 15 neurons perpatient). Significance was calculated using one-way ANOVA with Tukey’s multiple comparisons; *p ≤ 0.05. The significance above barsrepresents a comparison against CTRL. I Representative images of 1 M organoid slices immunostained with DAPI, MAP2, and SynI. Scale bar:50 µm. J Quantification of the total Synapsin I to estimate synaptic puncta. Symbols represent organoids from the same differentiation batch.Data are presented as mean ± SEM (n= 2 patients per genotype, at least 3 organoids per patient). Significance was calculated using one-wayANOVA with Tukey’s multiple comparison; ***p < 0.001. Significance above bars represents comparison against CTRL.
regulation of small GTPasemediated signal transduction
cell differentiationWnt signaling pathway
regulation of Rhoprotein signal transduction
Fig. 6 Neuronal migration defects in 16p11.2 cortical organoids. A, B Module eigengene (A) and GO functional annotations (B) for22darkgreen co-expression transcriptomic module from 1M organoids. The module eigengene was quantified from 12 data points (n= 12)corresponding to replicate derived from 3 patients (CTRL, DEL, or DUP), 2 clones per patient, and 2 replicates per clone. Two replicates wereremoved from CTRL before the analyses during outlier detection procedure (see Materials and methods). C Heat plot representing gene (RNA)and protein (Protein) expression from 22darkgreen co-expression module. Pearson correlation coefficient between RNA and protein expressionand the proportion of genes whose protein products were also detected by proteomics are shown below the plot. D Twenty top hub genesfrom 22darkgreen co-expression module. Edges represent co-expression. E Representative images of 1 M cortical organoids 72 h afterattachment to Matrigel-coated plates, immunostained with DAPI and β-tubulin III. F Quantification of the percentages of migrating cells to adistance with 200 μm bins of displacement (n= 2 patients per genotype, at least 5 organoids per patient). The average of all experiments isshown, individual comparison for distance bins 0–200 and 200–400 together with statistical analyses using one-way ANOVA with Tukey’smultiple comparison is shown in Figs. S25 and S26. G Representative images of cells migrating from 1M dissociated organoids in Boydenchamber experiment. Scale bar: 100 µm. Immunostaining was performed with DAPI. H Quantification of the percentages of migrated cells.Symbols represent cells derived from organoids from the same differentiation batch. Data are presented as mean ± SEM (n= 2 patients pergenotype, at least 5 images per patient). Significance was calculated using one-way ANOVA with Tukey’s multiple comparisons; ***p < 0.001,**p < 0.01. The significance above bars represents a comparison against CTRL.
J. Urresti et al.
7571
Molecular Psychiatry (2021) 26:7560 – 7580
DISCUSSIONPatient-derived and CRISPR/Cas9 genome-engineered isogenicbrain organoids are becoming popular models for investigatingmolecular mechanisms underlying neurodevelopmental disorders[24, 75]. Given the lack of fetal brain tissues from ASD patients,there are numerous advantages in using brain organoids to modelpatient phenotypes. In the present study, we model molecular andcellular mechanisms of ASD risk attributable to rare DEL and DUPof the 16p11.2 locus using cortical organoids derived from skinfibroblasts of ASD patients with macrocephaly or microcephaly,respectively.
Organoid models of 16p11.2 CNV exhibit defects in neuronalmaturation, migration, morphology, and synaptic abnormalities.Accelerated neuronal maturation in DEL, along with the impairedneuron migration in DEL and DUP, are novel mechanisms thathave not been previously implicated in 16p11.2-linked autism. Ourstudy makes a significant contribution to a mechanistic under-standing of cellular and molecular processes that may bedisrupted during early neocortical development in the 16p11.2CNV carriers.In this study, we perform an in-depth characterization of
organoids’ transcriptomes and proteomes in parallel, from the
KCTD13
Actin
Total RhoA
CTRLDEL
DUP
ActiveRhoA
36
42
21
21
Fibroblasts
Day 0
iPSCs
Day 6
Neural induction
Day 16
Neural prolif.
Day 31
Neural maturation
Oct4, cMyc Klf4
SB431542,dorsomorphin
FGFEFG
BDNF, GDNF,NT3, cAMP
Rhosin (1 μM)
CTRL DEL DUP
DAPItub-β3
DAPI
DAPItub-β3
DAPI
DAPItub-β3
DAPI DAPItub-β3
DAPI
DAPItub-β3
DAPIDAPItub-β3
DAPI
0
10
20
30
40
50
CTRL Vh
CTRL Rh
DEL Vh
DEL Rh
DUP Vh
DUP Rh
** *
A B
C D
E
F G
kDa
CTRL Vh0
20
40
60
80
100
CTRL Rh
DEL Rh
DEL Vh
DUP Vh
DUP Rh
Vh Vh Vh
Rhosin Rhosin Rhosin
0-200200-400400-600>600
Distance (μm)
% m
igra
ted
cells
% m
igra
ted
cells
Rhosin rescue
All cells
Migrated cells
CTRL DEL DUPVh Vh Vh
Rhosin Rhosin Rhosin
CTRL2.0
DELDUP
KCTD13
3.0
3.5
4.0
4.5
CTRLDEL
DUP
Active RhoA
** **
**
2.5
3.0
3.5
4.0
log
(nor
m. e
xpre
ssio
n)
CTRLDEL
DUP
Total RhoA
*
2.22.42.62.83.03.23.4
J. Urresti et al.
7572
Molecular Psychiatry (2021) 26:7560 – 7580
same samples, at different developmental time points. Thisstrategy provides the leverage for comparing phenotypes of DELsand DUPs at two levels of regulation, transcriptional, andtranslational. RNA-seq and quantitative proteomics identify DEGsand proteins, as well as co-expression modules that are impactedby the 16p11.2 CNV. We observe convergence at the level ofbiological processes and pathways for some functions, in additionto identifying unique GO terms from each approach.At the molecular level, we observe perturbations of transcrip-
tional programs associated with key processes involved inneurodevelopment. Transcriptional dysregulation of genes relatedto actin cytoskeleton and neuron migration were observed in 1 Morganoids, whereas genes related to ion channels, synapticsignaling and nervous system development were observed in 3M organoids (Fig. 2 and Fig. S10). This suggests that disruption ofneural processes, which may not be apparent at the earlierdevelopmental time point at 1 M, becomes more pronouncedduring later organoids maturation time point. The examples of theunique enriched GO terms are those related to translationaldysregulation, observed in DUPs vs. CTRLs comparison at 3 M(Fig. S10 and Table S5). Many ribosomal subunit genes involved intranslation initiation, mRNA catabolism, and protein transportwere detected to be dysregulated in this analysis (Table S5).The global transcriptional signatures of one to three month old
organoids recapitulate those of the late mid-fetal human braindevelopment (Fig. 1B), the most critical period for establishingnetwork connectivity among 16p11.2 CNV genes [45]. This periodwas also implicated in ASD by other studies [43, 76]. Mostimportantly, transcriptional co-expression modules associatedwith neuronal/synaptic functions (Fig. 5A–D) and neuronalmigration/Wnt/RhoA-signaling (Fig. 6A–D) identified in organoidswere preserved at the proteomic level. Preservation of transcrip-tional signatures at the translational level further reinforces andvalidates our findings.Our results are in agreement with other studies that include
either organoids produced from idiopathic ASD individuals [34], orCHD8 organoids [50]. Significant overlap between DEGs andproteins from our study with DEGs from these studies is observed(Fig. 3E), suggesting shared signatures among different geneticsubtypes of ASD. Importantly, synaptic gene co-expressionmodule is also dysregulated in organoids from idiopathic ASDpatients. The overlap of our data with DEGs from organoidsengineered to knockdown CHD8, a top autism gene [50] is alsoapparent (Fig. 3E). However, no overlap was observed with16p11.2 carriers’ lymphoblastoid cell lines [13], potentiallyemphasizing different transcriptional signatures captured bybrain- and blood-derived models.As observed previously in other brain diseases, organoid models
can recapitulate patient’s microcephaly [23, 33, 37] and macro-cephaly [50, 77] phenotypes. Here, we demonstrate that dosagechanges of the same genetic variant could lead to opposite trends
of organoids sizes (Fig. 1E and Fig. S7). In addition, we replicatealtered neuronal morphology in DELs that was previously noted in2D models [22]. Aberrant control of cell proliferation and excessneuron number has been previously hypothesized to cause earlybrain overgrowth in ASD patients [53, 78]. Consistent with thishypothesis, we observe excess of neurons and depletion of neuralprogenitors in DEL organoids, and a mirror phenotype in DUPorganoids, in the DEL vs. DUP comparison. We also founddecreased proliferation in 1-M-old DEL organoids. Interestingly,previous ASD studies either did not find differences in prolifera-tion [22], or demonstrated accelerated proliferation of progenitorsin ASD [34]. It is possible that decreased proliferation at 1 M in ourstudy is a result of the accelerated progenitor proliferation atearlier time points that leads to premature depletion of neuralprogenitor pool by 1 M, and a subsequent decreased proliferationthat we observed here. Further investigation of proliferation ratesat various developmental time points (iPSCs, NPCs, and earlymaturation in organoids) is needed, and could uncover time-dependent mechanisms of proliferation defects in ASD.One of the most important findings from our study is impaired
cortical neuron migration in 16p11.2 organoids (Fig. 6E–H). Wedetected many DEGs and/or proteins that are involved in theregulation of neuronal migration from our DEG (Table S5) and DEP(Table S9) GO analyses. They included COL3A1 and GPR56, aligand–receptor pair that regulates cortical development andmigration through activation of the RhoA pathway [79]; LAMB1, alaminin subunit beta, implicated in Lissencephaly 5 (LIS5) [80] thatmediates the attachment, migration, and organization of cells intotissues during embryonic development; and SRGAP2C, a SLIT-ROBO Rho GTPase activating protein 2C, that is involved inneuronal migration and dendritic spine maturation throughinhibition of SRGAP2 [81]. We confirmed reduced migration inDEL and DUP organoids by two orthogonal methods, recordingsfrom intact organoids (Fig. 6E, F), and experiments in dissociatedorganoids (Boyden chamber) (Fig. 6G, H). Previously, neuronalmigration defects have also been observed in organoids derivedfrom patients with lissencephaly [33], periventricular heterotopia[82], and in CHD8 deficient mice [83]. Our results suggest thataberrant neuronal migration may be present in the brains ofsubjects with 16p11.2 CNV during early neurogenesis. Notably,observations from post-mortem ASD brains show patches ofdisorganized cortical neurons that may not be migrating properlyduring early brain development [52].Another important finding from our study is dysregulation of
RhoA signaling by the 16p11.2 CNV. As noted above, many DEGsand DEPs with migration-related functions are also involved inRhoA signaling. For example, PHLDB2, also known as LL5beta,regulates microtubule and focal adhesion (FA) dynamics [84, 85]by forming a complex at the edges of the cell, and microtubulepolymerization and disassembly of FA points are processes thatare regulated by Rho GTPases [86]. MEF2C is a transcription factor
Fig. 7 Active RhoA upregulation and Rhosin treatment rescue of neuronal migration deficits in 16p11.2 cortical organoids. ARepresentative images of Western Blot analysis of 1 M organoids for KCTD13, total RhoA, actin as loading control, and active RhoA (RhoA-GTP).All Western Blots used for quantification are shown in Fig. S28. B Densitometry analysis of Western Blot. Data are represented as mean ± SEM(n= 6 differentiation batches with at least one batch for each patient or control for KCTD13, total RhoA, and active RhoA). Significance wascalculated using one-way ANOVA with Tukey’s multiple comparisons; **p < 0.01, *p ≤ 0.05. The significance above bars represents comparisonagainst CTRL. C Schematic representation of constitutive Rhosin treatment of organoids during differentiation. D Representative images of 1M vehicle- or Rhosin-treated cortical organoids 72 h after attachment to Matrigel-coated plates, immunostained with DAPI and β-tubulin III. EQuantification of the percentages of migrating cells to a distance with 200-μm bins of displacement (n= 2 patients per genotype, at least 5organoids per patient). The average of all experiments is shown, individual comparison for distance bins 0–200 and 200–400 together withstatistical analyses using two-way ANOVA with Tukey’s multiple comparisons are shown in Figs. S29 and S30. F Representative images of cellsmigrating from vehicle- or Rhosin-treated 1M dissociated organoids in Boyden chamber experiment. Scale bar: 100 µm. Immunostaining wasperformed with DAPI. G Quantification of the percentages of migrated cells. Symbols represent cells derived from organoids from the samedifferentiation batch. Data are presented as mean ± SEM (n= 2 patients per genotype, at least five images per patient). Significance wascalculated using two-way ANOVA with Tukey’s multiple comparisons; **p < 0.01, *p ≤ 0.05. Significance above bars represents comparisonagainst CTRL Vh. Statistical analyses by batch are shown in Fig. S30.
J. Urresti et al.
7573
Molecular Psychiatry (2021) 26:7560 – 7580
that plays important role in neuronal survival and differentiation[87]. Dysregulation of this gene has been linked to neurodevelop-mental disorders, including mental retardation [88, 89], and thetranscription activity of MEF2C is regulated by RhoA signaling in akinase cascade that also involves ERK6 [90]. Our observationlinking RhoA activity in 16p11.2 organoids with defects in neuronmigration is also consistent with neuron migration phenotypesobserved in mouse conditional knockout of RhoA [62]. This modelrevealed that RhoA-depleted neurons migrated faster and reachedcortical plate sooner than control neurons in the cerebral cortex ofE14 mouse embryos. In addition, electroporation of spontaneouslyactivated (“fast-cycling”) mutant of RhoA caused slower neuronalmigration in the condition of activated RhoA. Thus, over-activationof RhoA stalls migration of neurons, in agreement with our resultsfrom the 16p11.2 CNV human organoid model. Our data are alsoin agreement with previous work that demonstrated the rescue ofdelayed neuronal migration by inactivation of RhoA or inhibitionof ROCK, a direct target of RhoA [91–93]. Here, we show thatinhibition of activated RhoA with Rhosin rescues the delayedmigration in 16p11.2 DEL and DUP organoids.There is a myriad of biological pathways that could be
dysregulated by the 16p11.2 CNV in ASD [94, 95]. Due to itspolygenic nature, with 29 genes within the locus and hundreds ofgenes impacted outside of the locus, as demonstrated here,genetic and epistatic interactions among these genes are likelyresponsible for neuroanatomical and cellular phenotypesobserved in the patients and animal models [94, 96]. Investigationof this CNV creates apparent challenges in implicating a specificpathway, mostly due to the combinatorial and synergistic effect ofmultiple genes [97]. Rather, dysregulation of multiple pathwayscould lead to the observed cellular and molecular phenotypes. Forexample, a number of genes within 16p11.2 CNV (MAPK3, MVPand TAOK2), are involved in MAPK/ERK and phosphatidylinositol3-kinase PI3K/AKT signaling pathways. These pathways, regulatingcell cycle and proliferation of neural progenitors, were shown tobe dysregulated in the 16p11.2 deletion mouse model [15], andare likely to also be impacted by this CNV. Here, we identifiedmodules with genes and proteins involved in Wnt signaling,suggesting that 16p11.2 CNV may also impact this pathway. Giventhe cross-talk between Rho and Wnt signaling pathways [68, 98]that are both involved in the regulation of neuronal cytoskeletonduring axon and dendrite growth, along with synapse formation, itis plausible that Wnt signaling could contribute to the neuritelength phenotype in our 16p11.2 CNV organoid model. Thispossibility need to be investigated in the follow-up studies. Finally,as we demonstrated here, RhoA signaling is likely regulatingneuronal migration in our 16p11.2 organoid model, and inhibitionof RhoA activity rescues migration deficits. Thus, pleiotropy andepistasis of 16p11.2 CNV genes at the pathway level is a hallmarkof its functional impact. Future studies using organoid models orfetal brain tissues from 16p11.2 CNV carriers are required tountangle the complexity of the phenotype-pathway relationshipsin ASD.
MATERIALS AND METHODSStudy designThe aim of this study was to investigate the impact of the autism-associated 16p11.2 CNV on early brain development using human-derivedmodels. Specifically, our goal was to detect molecular pathwaysdysregulated by the dosage changes (i.e. DEL and DUP) of this CNVcomprising 29 genes. To address this question, we generated corticalorganoids derived from fibroblasts, reprogrammed into iPSCs, of 16p11.2patients and healthy controls. We selected three patients of each genotype(three DEL, three DUP, and three CTRL), on the basis on the extreme headsize phenotype, ASD diagnosis, and samples availability (Table S1). Due tolimited availability, our study has been restricted to the males. Toinvestigate changes in RNA and protein expression caused by the 16p11.2,bulk RNA sequencing and quantitative label-free TMT-MS proteomics
experiments were performed. We profiled two clones per patient, and tworeplicas per clone, at three developmental stages (iPSCs, 1 and 3-month-old organoids), in 9 patients, for a total of 108 transcriptomes and 72proteomes (iPSCs were not profiled by proteomics). The number ofsamples analyzed and the pipeline for the analysis are shown in Figs. S5and S14. Changes in cell populations and neuron morphology wereexamined by immunostaining, and neuron migration phenotype observedin the transcriptomic/proteomics experiment was validated using in vitroexperiments. Finally, RhoA and KCTD13 levels were examined usingWestern Blot. For all quantifiable experiments, investigators were blindedfor the analyses. Different numbers of samples and replicates were used fordifferent experiments, as specified in the Figure legends and Table S12.Raw data for all figures are provided in Table S13.
Tissue collectionSkin fibroblasts of three patients with 16p11.2 DEL and three patients with16p11.2 DUP were obtained from the Simons Searchlight https://www.sfari.org/resource/simons-searchlight/; formerly Simons Variation in Indivi-duals Project or Simons VIP). Patients were selected based on fibroblastsavailability, head circumference, ASD diagnosis, and were gender and age-matched (see detailed information about the patients in Table S1). De-identified patients tissue samples are distributed to Simons Investigatorsfollowing approved IRB protocol to Simons Foundation through ColumbiaUniversity Medical Center (PIs Drs. Gerald Fischbach and Wendy Chung).Collection and use for research of fibroblasts from three de-identifiedcontrol individuals (CTRL) were approved by UCSD IRB. Skin fibroblastswere maintained in DMEM F-12 (Life Technologies) containing 10% FBS.
Generation and maintenance of iPSCsTo generate iPSCs, skin fibroblasts were infected with Sendai virus vectorscontaining coding sequences of human OCT4, SOX2, KLF4, and c-MYC(Cytotune reprogramming kit, Thermo Fisher). Four days post-infection,fibroblasts were trypsinized to single cells, plated on the inactivated mouseembryonic fibroblast feeders, and cultured using a human embryonic stemcell medium (Gibco). After 3–4 weeks, iPSC clones were manually pickedand propagated clonally on feeders. After 8–10 passages, iPSCs weretransferred to a feeder-free system and grown on matrigel-coated dishes(Corning) in mTeSR1 media (StemCell Technologies). The cells werepassaged by manually picking colonies.
Quality control of generated iPSC clonesThe generated iPSC clones were examined for genomic integrity bymicroarray genotyping. Parental fibroblasts and eight iPSC clones for eachpatient were genotyped using BeadChip Illumina microarray platform.CNVs were called using PennCNV (v1.0.3) [99] with default parameters. DELor DUP were stitched as previously described [100, 101]. Briefly, variantswere joined if the gap between two CNVs of the same type was less than50% of the number of markers within the larger CNV. This rule was appliedrecursively until no more CNVs could be stitched. Only CNVs of over 100kbp in size were retained for the subsequent analysis. In addition, if over50% of the CNV overlapped with the regions that can confound CNVcalling (such as assembly gaps, segmental DUP, centromeres, andtelomeres), they were omitted from the analyses. We also removed CNVsif the number of markers supporting the call was less than 8 and/or if thePennCNV confidence score was less than 20. After applying these filters,we confirmed the presence of 16p11.2 DELs or DUPs in all fibroblast andiPSC clones. We then sought to remove those iPSC clones, for which CNVburden was significantly greater than that of parental fibroblasts. Tocompare iPSC clones and fibroblasts, we defined CNV burden as a totalsum of base pairs that are copy number variables (excluding 16p11.2 CNV).For each patient, we defined the mean CNV burden as the CNV burden infibroblasts, and standard deviation as the burden in all iPSC clones fromthe same patient. We then compared CNV burden between fibroblasts andiPSC clones for each patient, and discarded clones with the Z-scores > 1.5SD. Most clones passed these filtering steps. Two iPSC clones with CNVburden closest to the parental fibroblasts of each patient were used forsubsequent experiments.
Generation of cortical organoidsTo generate cortical organoids from iPSCs, we used the protocol describedin Trujillo et al. [36]. Briefly, feeder-free iPSCs at passage 15 or later werefed daily with mTeSR1 for at least 7 days before differentiation. Colonieswere dissociated using Accutase (Life Technologies) in PBS (1:1) for 10min
at 37 °C and centrifuged for 3 min at 100 × g. The cell pellet wasresuspended in mTeSR1 supplemented with 10 μM SB431542 (SB, Tocris)and 1 μM Dorsomorphin (Dorso, R&D Systems). Approximately, 5 × 10⁶ cellswere transferred to each well of a 6-well plate and kept in suspensionunder rotation (95 rpm) in the presence of 5 μM ROCK inhibitor (StemCellTechnologies) for 24 h to form free-floating spheres. Then, the media wasreplaced with mTeSR1 for additional 48 h. After 72 h, Media1 [Neurobasal(Life Technologies) supplemented with Glutamax, 2% Gem21 NeuroPlex(Gemini Bio-Products), 1% N2 NeuroPlex (Gemini Bio-Products), 1% MEMnonessential amino acids (NEAA, Life Technologies), 1% penicillin/streptomycin (PS, LifeTechnologies), 10 μM SB and 1 μM Dorso] was usedfor maintenance for 7 days, with media changes every other day.Subsequently, Media1 was replaced with Media2 [Neurobasal withGlutamax, 2% Gem21 NeuroPlex, 1% NEAA and 1% PS] supplementedwith 20 ng/mL FGF2 (Life Technologies) for additional 7 days. Then, Media2was supplemented with both 20 ng/mL FGF2 and 20 ng/mL EGF (LifeTechnologies) and spheres were cultured for additional 7 days with mediachanges every other day. Next, organoids were transferred into Media3[Media2 supplemented with 10 ng/mL BDNF, 10 ng/mL GDNF, 10 ng/mLNT-3 (all from Life Technologies), 200 μM L-ascorbic acid (Tocris), and 1mMdibutyryl-cAMP (StemCell Technologies)] for another 7 days with mediachanges every other day. After 28 days, cortical organoids were maintainedin Media2 for as long as needed, with media changes every 3–4 days. Allorganoids were generated, grown, and used for all experiments in thesame plate with one DEL, one DUP and one CTRL (called a “batch”thereafter) to reduce batch effect from genotypes.
Mycoplasma testingAll iPSC and organoid cultures were routinely tested for mycoplasma by PCR.Media supernatants (with no antibiotics) were collected, centrifuged, andresuspended in saline buffer. Ten microliters of each sample were used forMycosplama testing using a commercially available LookOut MycoplasmaPCR Detection Kit (Sigma Aldrich) following the manufacturer’s instructions.
Organoid size analysesThe diameter of individual organoids was measured using ImageJ software.Size measurements for organoid batches (1 DEL, 1 DUP, and 1 CTRL) followeda normal distribution, as verified with Prism software (GraphPad). For sizecomparison, the “large” group was defined as a proportion of organoids withsize higher than 1 standard deviation (SD) within the batch; the “small” groupas a proportion of organoids with a size lower than 1 SD within the batch,and the “medium” group comprised the remaining organoids. Theproportions for each batch were averaged for final quantification.
Immunofluorescence stainingCortical organoids were fixed in 4% paraformaldehyde (PFA) overnight.Next morning they were washed in PBS, transferred to a 30% sucrosesolution, and kept at 4 °C. After the 3D structures sink, they weretransferred into Tissue-Tek OCT medium (Sakura). Subsequently, 20 μmthick sections were obtained using a cryostat. For immunostaining of iPSCclones, cells were grown directly on Matrigel-coated coverslips.Slides containing organoid slices were air-dried and then washed with
PBS to remove excess OCT. Permeabilization and blocking was performedwith 4% fetal bovine serum (FBS, Gibco), 0.1% Triton X-100 (Sigma Aldrich)diluted in PBS for one hour at room temperature. The slides were thenincubated overnight at 4 °C with primary antibodies diluted in a solutioncontaining 4% FBS and 0.1% Triton X-100. PBS was used to wash theprimary antibodies and the slides were incubated with secondaryantibodies in solution containing 4% FBS for 1 h at room temperature.The following primary antibodies were used for immunostaining: NANOG(goat, 1:500, R&D Systems), Oct4 (mouse, 1:500, Abcam), Tra-1-60 (mouse,1:500, Abcam), Lin28 (rabbit, 1:500, Abcam), PAX6 (mouse, 1:300; DSHB),NeuN (mouse, 1:500, Millipore), NeuN (rabbit, 1:500, Cell Signaling), MAP2(chicken, 1:2000; Abcam), Ki67 (rabbit, 1:1000, Abcam), β-tubulin III (mouse,1:500, Abcam), Synapsin I (rabbit, 1:500, Abcam), SOX2 (rabbit, 1:500,Abcam). Alexa Fluor Dyes (Abcam) were used at 1:1000 dilution assecondary antibodies. Nuclei were visualized with Hoechst 33258 (1:25,000,Life Technologies). EdU was visualized using the Edu Staining Kit (Abcam)following manufacturer’s instructions. Slides were mounted using ProLongGold antifade reagent (Invitrogen) and analyzed under a fluorescencemicroscope (Leica SP8). Image analysis was performed with ImageJsoftware. All cells expressing a particular marker were counted on sectionsand normalized to the total number of cells.
Flow cytometry analysisCortical organoids were first dissociated to a single cell suspension. Then,cells were fixed for 15min in ice-cold 1% PFS in PBS, washed twice withcold PBS, and incubated for 2 h at room temperature with primaryantibodies for specific cell markers (NeuN, SOX2, TBR2; Abcam) at 1:500dilutions. Following a washing step with PBS, cells were incubated with1:500 Alexa 488-conjugated antibodies (Abcam) for 20min at roomtemperature. Analysis was performed on a flow cytometer (Accuri C6, BDBiosciences). Fifty thousand events were acquired for each sample withfluorescence measured in logarithmic scale. Background fluorescence wasmeasured using cells labeled only with secondary antibody alone and usedto set the gating parameters between positive and negative cellpopulations. Forward and side light-scatter gates were used to excludecell aggregates and small debris. Data were analyzed using the FlowJosoftware and plotted in a histogram format. All histograms were smoothedby the software. Fluorescence gates were set below 2% of blank histogramand events corresponding to a fluorescence signal exceeding thispercentage were considered as positive events.
Cell migration assayFor the in vitro migration assay, intact organoids were seeded in Matrigel-coated 24-well plates (3–4 organoids per well), using Media2. Organoidswere allowed to attach to the bottom of the plate for 24 h, then media wasreplaced with fresh Media2 carefully not to disrupt organoids attachment.After 72 h, immunostaining was performed. Images were taken using EVOSFL Cell Imaging System. Cell counting and image analysis were performedwith ImageJ software.For live-imaging, intact organoids were seeded in Matrigel-coated p35
glass-bottom culture dishes (Greiner). After 24 h, pictures were taken every15min using a LEICA SP8 microscope. Videos were mounted using LEICASP8 software.
Organoids dissociationCortical organoids were dissociated into single-cell suspension usingAccumax (Sigma Aldrich) for 30min at 37 °C with rotation (95 rpm). Then,organoids were disaggregated using a 1000 µl pipette tip, incubated foranother 10min at 37 °C in suspension with rotation (95 rpm), andcentrifuged for 3 min at 100 × g. The cell pellet was resuspended inMedia2 containing 5 μM of ROCK inhibitor, filtered through a 100 µm mesh(Gibco) and centrifuged again for 3 min at 100 × g. To further remove un-dissociated organoid tissue, the procedure was repeated but with filteringthrough the 40 µm mesh (Gibco). Cells from suspension were countedusing a Bio-Rad TC10 Cell Counter.
Boyden chamber migration assayApproximately, 3 × 10⁵ cells from the dissociated organoids were seededon top of a Millicell Cell Culture 8 µm Insert (Millipore) in 24-well plates. Thebottom of the Cell Culture Insert was filled with 500 µl ofMedia2 supplemented with 20 ng/mL of FGF2 and 10 ng/mL of BDNF aschemo-attractants. Cells were left to freely migrate for 24 h, then washedwith PBS and fixed with 4% PFA for immunostaining.After immunostaining, images were taken using EVOS FL Cell Imaging
System, visualizing all cells on the Cell Culture Inserts. Then, cells on thetop of the Cell Culture Insert were removed using a cell scrapper. Afterthree washes with PBS, only cells on the bottom of the insert werevisualized. Cell counting was performed with ImageJ software.
Pharmacological treatment of cortical organoidsFor phenotype rescue experiments, organoids were grown in Rhosin-treated media. Rhosin (Tocris) was added to the media during thedifferentiation stage starting from day 6 (Rhosin was first added to secondMedia1 to the final concentration of 1 µM). The same amount of Rhosinwas added during all subsequent media changes. The organoids weregrown for 1 month, at which cell migration assays were carried out. Anequivalent amount of vehicle (0.1% Dimethylsulfoxide, DMSO) was addedto grow untreated CTRL, DEL, and DUP organoids.
Neuronal morphology analysisCortical organoids were dissociated and approximately 3 × 10⁵ cells perwell were seeded on a 24-well plate coated with poly-ornithine (SigmaAldrich) and Laminin (Invitrogen). Media2 was changed after 24 h toremove the ROCK inhibitor, and a second media change was performed
J. Urresti et al.
7575
Molecular Psychiatry (2021) 26:7560 – 7580
after 3 days. Cells were fixed seven days after seeding for immunostaining.Images were taken using a LEICA SP confocal microscope and analyzedwith ImageJ software. For soma area calculation, the perimeter of theMAP2-positive cell body was manually outlined and measured. For totaldendrite length, each dendrite or its branch was traced separately, and thedendrite length was calculated by adding individual lengths for everyneuron.
Synaptic puncta quantificationThree-channel z-stack images of organoid slices were taken using an oil-inverted 60× objective. Then, an average projection image of each stackwas generated. At least six randomly selected image fields for eachgenotype from two different batches were used for quantification ofnumber of synapses with Synapsin I staining. Only puncta overlappingMAP2-positive processes were scored. The number of Synapsin I punctawas quantified using a plug-in Puncta Analyzer from the Fiji analysissoftware platform [102].
Western blotCortical organoids from a quarter to a half of a well were washed once withice-cold PBS (w/o Ca2+/Mg2+). Proteins were extracted using lysis buffer(20mM Tris, pH 7.4, 140mM NaCl, 10% glycerol, 2 mM EDTA, 1 mM EGTA,and 1% Triton X-100) supplemented with EDTA-free Complete proteaseinhibitor cocktail (Roche) and Phosphatase Inhibitor cocktail (SigmaAldrich). The suspension was centrifuged at 16,000 × g at 4 °C for 30min,and supernatants were collected. Protein concentration was quantified bya modified Lowry assay (DC protein assay; Bio-Rad). Cell lysates wereresolved by Sodium dodecyl-sulfate polyacrylamide gel electrophoresisand transferred onto polyvinylidene fluoride Immobilon-P membranes(Millipore). After blocking with 1× TBS, 0.1% Tween-20 containing 5%nonfat dry milk for 1 h at room temperature, membranes were first probedwith primary antibodies, and then after 1 h of incubation withcorresponding peroxidase-conjugated secondary antibody (Abcam). Mem-branes were developed using the EZ-ECL chemiluminescence detection kit(Denville Scientific). The following primary antibodies were used as follows:anti-KCTD13 (1:500; Atlas Antibodies), anti-RhoA (1:1000; Cell Signaling),and anti-β-actin (1:5000; Sigma Aldrich) as a loading control. Quantificationwas performed by densitometry with ImageJ software.
RNA isolation for RNA-Seq and qPCRTotal RNA was extracted from undifferentiated iPSCs or corticalorganoids at 1 and 3 months of differentiation. Two clones from eachpatient were used for RNA isolation, for each time point analyzed. TotalRNA was extracted using the QIAGEN RNAeasy isolation kit (QIAGEN)following manufacturer’s instructions. RNA sequencing was performedusing the same input amount of total RNA for each sample. RNA sampleswere ribodepleted using Ribo-Zero rRNA Removal Kit (Illumina) andlibrary preparation was performed using the TrueSeq Stranded TotalRNA kit for Illumina Sequencing according to the manufacturer’sinstructions. Paired-end RNA sequencing with 100 bp reads wasperformed on an Illumina HiSeq4000 to an average depth of 40 M readsper sample.For qPCR experiments, cDNA was synthesized, starting from 100 ng of
total RNA with the SuperScript III First-Strand Synthesis kit and randomhexamers (Invitrogen). qPCR was performed using the CFX96 Touch™ Real-Time PCR Detection System (Bio Rad) using Power SYBR Green PCR MasterMix (Applied Biosystems). HPRT1 and β-actin were used as housekeepinggenes for normalization. Fold change in expression was calculated usingthe ΔΔCt method.
RNA-sequencing data processing pipelineAll 108 FASTQ files (36 iPSC, 36 one-month organoids, and 36 threemonths organoids paired-end fastq) (Fig. S5) were run through a unifiedRNA-Seq processing pipeline. Pipeline source code can be found onhttps://github.com/IakouchevaLab/16p11.2. All fastq were trimmed foradapter sequence and low base call quality (Phred score < 30 at ends)using Cutadapt (v1.14). Trimmed reads were then aligned to the GRCH37.p13 (hg19) reference genome via STAR (2.5.3a) using comprehensive geneannotations from Gencode (v19) (Fig. S8). Gene-level quantifications werecalculated using RSEM (v1.3). Quality control metrics were calculated usingRNA-SeQC (v1.1.8), featureCounts (v1.6.), PicardTools (v2.12), and Samtools(v1.3) (Fig. S8 and Table S2).
RNA-Seq quality control and normalizationExpected counts were compiled from gene-level RSEM quantifications andimported into R for downstream analyses. Expressed genes were definedas genes with TPM > 0.5 in at least 80% of samples from each genotype(CTRL, DEL, or DUP). A total of 15,788; 13,348, and 13,723 expressed genesfrom iPSC, 1 M old organoids, and 3M old organoids, respectively, wereused in the downstream analysis. Outliers were defined as sampleswith standardized sample network connectivity Z scores <−2 [103], andwere removed (Fig. S8). Highly variable genes between clones from thesame individual were filtered out using the Variance Partition (v3.5) Rpackage [104].
Covariate selectionWe compiled a set of 197 RNA-Seq quality control metrics from the outputsof cutadapt, STAR, RNA-SeQC, featureCounts and PicardTools (CollectA-lignmentSummaryMetrics, CollectInsertSizeMetrics, CollectRnaSeqMetrics,CollectGcBiasMetrics, MarkDuplicates) for each group of samples (iPSCs, 1-M-old organoids and 3-M-old organoids) (Table S2 and Fig. S8). Thesemeasures were summarized by the top principal components, whichexplained the majority of total variance of each group (Fig. S9). Batcheffects and possible hidden confounding factors were detected using theSurrogate Variable Analysis (SVA) [105]. Multivariate adaptive regressionsplines (MARS) implemented in the earth package in R was used todetermine which covariates to include in the final differential expressionmodel (Fig. S9). The potential covariates included: run/batch, RIN, clone,seqPCs, and SVs (Fig. S9). These covariates were inputted into the MARSmodel along with gene expression data (limma voom normalized,centered, and scaled). The model was run using linear predictors andotherwise default parameters. MARS selected SV1 as a covariate for iPSC,SV1–SV5 as covariates for 1-M old organoids, and SV1–SV6 as covariates for3-M-old organoids (Fig. S9).
Differential gene expressionDifferential gene expression analyses were performed using limma-voomwith “duplicateCorrelation” function to account for duplicate samples(clones and replicas) from the same individuals, and to avoid pseudo-replication in the analyses [47]. Covariates were included as fixed effects inthe model. The biomaRt [106, 107] package in R was used to extract genenames, gene biotypes and gene descriptions. Differential gene expressionanalyses were performed using all three datasets (CTRL, DEL, and DUP) forall time points. The volcano plots for iPSCs and 3M organoids are shown inFig. S10, and DEGs from these datasets are listed in Table S4.
WGCNA on RNA-seq dataWe used weighted gene co-expression network analysis (WGCNA) [48] todefine modules of co-expressed genes from RNA-seq data (Fig. S11). Allcovariates except for genotype at the 16p11.2 locus were first regressedout from the expression datasets. The co-expression networks andmodules were estimated using the blockwiseModules function with thefollowing parameters: corType= bicorr; networkType= signed; pamRe-spectsDendro= F; mergeCutHeight= 0.1. Some parameters were specificfor each dataset. For iPSC data: power= 14; deepSplit= 0; minModuleSize= 100. For 1 M old organoid data: power= 16; deepSplit= 2; minModu-leSize= 50. For 3 M old organoid data: power= 19; deepSplit= 2;minModuleSize= 70. The soft threshold power was chosen to correspondto the scale-free topology fit index of 0.8 or higher (Fig. S11). Moduleeigengene-genotype associations were calculated using a linear mixed-effects model, using a random effect of individual, to account for multipleclones and replicas derived from the same patient. P-values were FDR-corrected to account for multiple comparisons. Genes within each modulewere prioritized based on their module membership (kME), defined ascorrelation to the module eigengene. For selected modules, the top hubgenes are shown in Figs. 5B and 6B. Module preservation was tested usingthe modulePreservation function from the WGCNA package in R.
Enrichment analysis of GO functions and literature curatedgene setsEnrichment for GO (Biological Process and Molecular Function) wasperformed using gProfileR R package [108, 109]. Background was restrictedto the expressed set of genes by group (iPSC—15,757, 1 M organoids—11,880, and 3M organoids—13,555). 16p11.2 genes were excluded fromGO analyses. Only DEGs with <10% FDR were selected for GO analyses. An
ordered query was used, ranking genes by FDR-corrected p-value for DGEanalyses and by kME for WGCNA analyses.Enrichment analyses were also performed using several established,
hypothesis-driven gene sets including syndromic and highly ranked (1 and2) genes from SFARI Gene database (https://gene.sfari.org/database/gene-scoring/); pre- and post-synaptic genes from SynaptomeDB [110]; geneswith loss-of-function intolerance (pLI) > 0.99 as reported by the ExomeAggregation Consortium [111]; highly constrained genes [112]; FMRPtargets [113] and CHD8 targets [114]. Statistical enrichment analyses wereperformed using permutation test. One thousand simulated lists with asimilar number of genes, gene length distribution, and GC-contentdistribution as the target gene list were generated, and the overlapsbetween each of the simulated lists and the hypothesis-driven gene setswere calculated to form the null distribution. Significance p-value wascalculated by comparing the actual overlap between target list andhypothesis-driven gene sets to the null distribution. All results were FDR-corrected for multiple comparisons.
Cell type enrichment analysisCell-type enrichment analysis for each co-expression module wasperformed using the expression weighted cell type enrichment packagein R [115]. Cell type-specific gene expression data was obtained fromsingle-cell sequencing (scRNA-seq) studies of the human fetal neocortex[51]. The specificity metric of each gene for each cell type was computedas described [115]. “Neuron” cell type includes a union of ExcNeu(excitatory neurons) and IntNeu (interneurons). Enrichment was evaluatedusing bootstrapping. Z-score was estimated by the distance of the meanexpression of the target gene set from the mean expression ofbootstrapping replicates. p-Values were corrected for multiple compar-isons using FDR.
CoNTExT analysesRegional and temporal identify of organoids was assessed using CoNTExT[40] (https://context.semel.ucla.edu/).
Sample preparation, protein identification, and quantificationby TMT-MSTMT-MS experiments were performed on the organoid samples from thesame well as those used for RNA-seq, by splitting the content of each wellinto two approximately equal amounts (Fig. S14). Organoids were lysed in100mM TEAB with 1% SDS, protease inhibitor cocktails (Sigma) andPhosSTOP (Sigma) by 2–3 times of brief probe sonication and thencentrifuged at 18,000 × g for 15 min at 4 °C. Supernatants were reduced(10mM TCEP at 55 °C for 20min) and alkylated (50mM chloroacetamide atroom temperature in the dark for 20min), and then MeOH/CHCl3precipitation was performed. Pellets were dissolved by adding 6M ureain 50mM TEAB, and then LysC/Tryp (Promega) was added by 1:25 (w/w)ratio to the peptides. After 3–4 h incubation at 37 °C, the reaction mixturewas diluted with 50mM TEAB for urea to be less than 1 M. After the o/ndigestion, peptide concentration was estimated by colorimetric peptideBCA assay (Thermo), and the peptides were labeled with TMT 10-plexreagents (Thermo) for one hour, followed by 15min quenching withhydroxylamine according to the manufacturer’s protocol. Equal amount ofreaction mixtures for each channel were pooled together and dried usingSpeedVac.Since the total number of samples exceeded the maximum number of
TMT channels, samples were divided into multiple sets (one replicateper set). To compare and normalize different sets of TMT-labeled samples,pooled peptides were labeled with 131 N and 131 C as duplicates, and thesesamples were commonly included in all sets within each age (1M and 3Mold organoids) set. A total of 100 μg of peptides were fractionated usingPierce™ High pH reversed-phase peptide fractionation kit (Thermo) and thendried in SpeedVac. Dried peptides were dissolved with buffer A (5%acetonitrile, 0.1% formic acid), and half of each fraction was injected directlyonto a 25 cm, 100 μm-ID column packed with BEH 1.7 μm C18 resin (Waters).Samples were separated at a flow rate of 300 nL/min on nLC 1000 (Thermo).A gradient of 1–25% B (80% acetonitrile, 0.1% formic acid) over 200min, anincrease to 50% B over 120min, an increase to 90% B over another 30minand held at 90% B for a final 10min of washing was used for 360min totalrun time. The column was re-equilibrated with 20 μL of buffer A prior to theinjection of the sample. Peptides were eluted directly from the tip of thecolumn and nanosprayed directly into the mass spectrometer OrbitrapFusion by application of 2.8 kV voltage at the back of the column.
Fusion was operated in a data-dependent mode. Full MS1 scans werecollected in the Orbitrap at 120k resolution. The cycle time was set to 3 s, andwithin this 3 s the most abundant ions per scan were selected for CID MS/MSin the ion trap. MS3 analysis with multi-notch isolation (SPS3) [116] wasutilized for detection of TMT reporter ions at 60k resolution. Monoisotopicprecursor selection was enabled, and dynamic exclusion was used with anexclusion duration of 10 s. Tandemmass spectra were extracted from the rawfiles using RawConverter [117] with monoisotopic peak selection. Thespectral files from all fractions were uploaded into one experiment onIntegrated Proteomics Applications (IP2, Ver.6.0.5) pipeline. Proteins andpeptides were searched using ProLuCID [118] and DTASelect 2.0 [119] on IP2against the UniProt H. sapiens protein database with reversed decoysequences (UniProt_Human_reviewed_05-05-2016_reversed.fasta). Precursormass tolerance was set to 50.0ppm, and the search space allowed all fully-tryptic and half-tryptic peptide candidates without limit to internal missedcleavage and with a fixed modification of 57.02146 on cysteine and 229.1629on N-terminus and lysine. Peptide candidates were filtered using DTASelectparameters of -p 2 (proteins with at least one peptide are identified) -y 1(partial tryptic end is allowed) –pfp 0.01 (protein FDR < 1%) -DM 5 (highestmass error 5 ppm) -U (unique peptide only). Quantification was performed byCensus [120] on IP2.
Differential protein expressionProteomics data was first summarized to peptide level by adding up theintensities of constituting spectra. Quantitation results from different TMTruns were merged and normalized using the pooled samples channelwhich was present in all runs. For each peptide, multiple measurementsfrom the same subject were collapsed to one measurement by taking themedian of all measurements. The data was then log2 transformed.Differential protein expression was calculated by fitting a linear mixed-effects model for each protein, using the lme4 package in R [121].Genotype was included as fixed effect in the model. We included a randomeffect term for each peptide to account for the fact that different peptidesfrom the same protein are not entirely independent. Significance p valueswere calculated using lmerTest package in R [122]. The resulting p-valueswere FDR-corrected using the Benjamini–Hochberg method to control formultiple comparisons. The volcano plots for 3 M organoids are shown inFig. S15, and DEPs from these datasets are listed in Table S8. GO analyseswas performed as described above for DEGs, with the backgroundrestricted to the expressed set of proteins by group (1 M organoids—6113,and 3M organoids—5470).
Weighted protein co-expression network analysisProteomics data was first summarized to protein level by adding up theintensities of constituting peptides. Quantitation results from different TMTruns were merged and normalized using the pooled samples channelwhich was present in all runs. The merged data was then log2 transformed.Outlier samples detection, highly variable proteins removal, surrogatevariables calculation and covariates selection were subsequently per-formed using the same methods as described for RNA-seq data processing.All covariates except for genotype at the 16p11.2 locus were first regressedout from the expression datasets. Protein co-expression networks andmodules were estimated using the blockwiseModules function with thefollowing parameters: corType= bicorr; networkType= signed; pamRe-spectsDendro= F; mergeCutHeight= 0.1. Some parameters were specificfor each dataset. For 1 M old organoid data: power= 13; deepSplit= 3;minModuleSize= 40; and for 3 M old organoid data: power= 17;deepSplit= 2; minModuleSize= 10. The soft threshold power was chosento correspond to the scale-free topology fit index of 0.8 or higher (Fig. S16).Module eigengene-genotype associations were calculated as described forthe RNA-seq WGCNA. Module preservation was tested using themodulePreservation function from the WGCNA package in R.
Quantification and statistical analysesThe statistical analyses for above experiments were performed using Prismsoftware (GraphPad). In most experiments, when comparison of severalgenotypes against each other (CTRL, DEL, and DUP) was required, the one-way ANOVA with Tukey correction to account for multiple comparisonswas used. In all Rhosin rescue experiments, two-way ANOVA with Tukeycorrection to account for multiple comparisons was used. Statistical testsused and exact values of n are described in Figure legends. Significancewas defined as p < 0.05(*), p < 0.01(**), or p < 0.001(***). Blinded measure-ments were performed for any comparison between control and 16p11.2
genotypes. The samples used for each type of experiments are shown inTable S12.
DATA AVAILABILITYSource RNA-seq data is available at GEO repository accession number GSE142174.Source proteomics data is available from the public repository MassIVE (MassSpectrometry Interactive Virtual Environment), a part of the ProteomeXchangeconsortium, with the identifier MSV000084727 (and PXD016855 for ProteomeXchange).
MATERIALS AVAILABILITYNew iPSCs lines generated in this study will be deposited after publication to Rutgersrepository by the Simons Foundation for Autism Research that funded this study.
CODE AVAILABILITYThe code used for the RNAseq and proteomics analysis generated during this study isavailable from GitHub (https://github.com/IakouchevaLab/16p11.2).
association of de novo copy number mutations with autism. Science.2007;316:445–9.
2. McCarthy SE, Makarov V, Kirov G, Addington AM, McClellan J, Yoon S, et al.Microduplications of 16p11.2 are associated with schizophrenia. Nat Genet.2009;41:1223–7.
3. Marshall CR, Noor A, Vincent JB, Lionel AC, Feuk L, Skaug J, et al. Structuralvariation of chromosomes in autism spectrum disorder. Am J Hum Genet.2008;82:477–88.
4. Pinto D, Pagnamenta AT, Klei L, Anney R, Merico D, Regan R, et al. Functionalimpact of global rare copy number variation in autism spectrum disorders.Nature. 2010;466:368–72.
5. Weiss LA, Shen Y, Korn JM, Arking DE, Miller DT, Fossdal R, et al. Associationbetween microdeletion and microduplication at 16p11.2 and autism. N Engl JMed. 2008;358:667–75.
6. Bijlsma EK, Gijsbers AC, Schuurs-Hoeijmakers JH, van Haeringen A, Fransen vande Putte DE, Anderlid BM, et al. Extending the phenotype of recurrent rear-rangements of 16p11.2: deletions in mentally retarded patients without autismand in normal individuals. Eur J Med Genet. 2009;52:77–87.
7. Malhotra D, Sebat J. CNVs: harbingers of a rare variant revolution in psychiatricgenetics. Cell. 2012;148:1223–41.
8. Martin-Brevet S, Rodriguez-Herreros B, Nielsen JA, Moreau C, Modenato C,Maillard AM, et al. Quantifying the effects of 16p11.2 copy number variantson brain structure: a multisite genetic-first study. Biol Psychiatry.2018;84:253–64.
9. Sonderby IE, Gustafsson O, Doan NT, Hibar DP, Martin-Brevet S, Abdellaoui A,et al. Dose response of the 16p11.2 distal copy number variant on intracranialvolume and basal ganglia. Mol Psychiatry 2020;25:584–602.
10. Horev G, Ellegood J, Lerch JP, Son YE, Muthuswamy L, Vogel H, et al. Dosage-dependent phenotypes in models of 16p11.2 lesions found in autism. Proc NatlAcad Sci USA. 2011;108:17076–81.
11. Portmann T, Yang M, Mao R, Panagiotakos G, Ellegood J, Dolen G, et al. Beha-vioral abnormalities and circuit defects in the Basal Ganglia of a mouse model of16p11.2 deletion syndrome. Cell Rep. 2014;7:1077–92.
12. Arbogast T, Ouagazzal AM, Chevalier C, Kopanitsa M, Afinowi N, Migliavacca E,et al. Reciprocal effects on neurocognitive and metabolic phenotypes in mousemodels of 16p11.2 deletion and duplication syndromes. PLoS Genet. 2016;12:e1005709.
13. Blumenthal I, Ragavendran A, Erdin S, Klei L, Sugathan A, Guide JR, et al.Transcriptional consequences of 16p11.2 deletion and duplication in mousecortex and multiplex autism families. Am J Hum Genet. 2014;94:870–83.
14. Migliavacca E, Golzio C, Mannik K, Blumenthal I, Oh EC, Harewood L, et al. Apotential contributory role for ciliary dysfunction in the 16p11.2 600 kb BP4-BP5pathology. Am J Hum Genet. 2015;96:784–96.
15. Pucilowska J, Vithayathil J, Tavares EJ, Kelly C, Karlo JC, Landreth GE. The16p11.2 deletion mouse model of autism exhibits altered cortical progenitorproliferation and brain cytoarchitecture linked to the ERK MAPK pathway. JNeurosci. 2015:35:3190–200.
16. Pucilowska J, Vithayathil J, Pagani M, Kelly C, Karlo JC, Robol C, et al. Pharma-cological inhibition of ERK signaling rescues pathophysiology and behavioralphenotype associated with 16p11.2 chromosomal deletion in mice. J Neurosci.2018;38:6640–52.
17. Tian D, Stoppel LJ, Heynen AJ, Lindemann L, Jaeschke G, Mills AA, et al. Con-tribution of mGluR5 to pathophysiology in a mouse model of human chro-mosome 16p11.2 microdeletion. Nat Neurosci. 2015;18:182–4.
18. Luo R, Sanders SJ, Tian Y, Voineagu I, Huang N, Chu SH, et al. Genome-widetranscriptome profiling reveals the functional impact of rare de novo andrecurrent CNVs in autism spectrum disorders. Am J Hum Genet. 2012;91:38–55.
19. Adams JW, Cugola FR, Muotri AR. Brain organoids as tools for modeling humanneurodevelopmental disorders. Physiology. 2019;34:365–75.
20. Chailangkarn T, Trujillo CA, Freitas BC, Hrvoj-Mihic B, Herai RH, Yu DX, et al. A humanneurodevelopmental model for Williams syndrome. Nature. 2016;536:338–43.
22. Deshpande A, Yadav S, Dao DQ, Wu ZY, Hokanson KC, Cahill MK, et al. Cellularphenotypes in human iPSC-derived neurons from a genetic model of autismspectrum disorder. Cell Rep. 2017;21:2678–87.
23. Lancaster MA, Renner M, Martin CA, Wenzel D, Bicknell LS, Hurles ME, et al.Cerebral organoids model human brain development and microcephaly. Nat-ure. 2013;501:373–9.
24. Amin ND, Pasca SP. Building models of brain disorders with three-dimensionalorganoids. Neuron. 2018;100:389–405.
25. Pasca SP. The rise of three-dimensional human brain cultures. Nature2018;553:437–45.
26. Trujillo CA, Muotri AR. Brain organoids and the study of neurodevelopment.Trends Mol Med. 2018;24:982–90.
27. Luo C, Lancaster MA, Castanon R, Nery JR, Knoblich JA, Ecker JR. Cerebralorganoids recapitulate epigenomic signatures of the human fetal brain. CellRep. 2016;17:3369–84.
28. Camp JG, Badsha F, Florio M, Kanton S, Gerber T, Wilsch-Brauninger M, et al.Human cerebral organoids recapitulate gene expression programs of fetalneocortex development. Proc Natl Acad Sci USA. 2015;112:15672–7.
29. Amiri A, Coppola G, Scuderi S, Wu F, Roychowdhury T, Liu F, et al. Transcriptomeand epigenome landscape of human cortical development modeled in orga-noids. Science 2018;362.
30. Velasco S, Kedaigle AJ, Simmons SK, Nash A, Rocha M, Quadrato G, et al. Indi-vidual brain organoids reproducibly form cell diversity of the human cerebralcortex. Nature. 2019;570:523–7.
31. Bhaduri A, Andrews MG, Mancia Leon W, Jung D, Shin D, Allen D, et al. Cell stressin cortical organoids impairs molecular subtype specification. Nature.2020;578:142–8.
32. Iefremova V, Manikakis G, Krefft O, Jabali A, Weynans K, Wilkens R, et al. Anorganoid-based model of cortical development identifies non-cell-autonomousdefects in wnt signaling contributing to Miller-Dieker syndrome. Cell Rep.2017:19:50–9.
33. Bershteyn M, Nowakowski TJ, Pollen AA, Di Lullo E, Nene A, Wynshaw-Boris A,et al. Human iPSC-derived cerebral organoids model cellular features of lis-sencephaly and reveal prolonged mitosis of outer radial glia. Cell Stem Cell.2017;20:435–49.e434.
34. Mariani J, Coppola G, Zhang P, Abyzov A, Provini L, Tomasini L, et al. FOXG1-dependent dysregulation of GABA/glutamate neuron differentiation in autismspectrum disorders. Cell. 2015;162:375–90.
35. Birey F, Andersen J, Makinson CD, Islam S, Wei W, Huber N, et al. Assembly offunctionally integrated human forebrain spheroids. Nature. 2017;545:54–9.
36. Trujillo CA, Gao R, Negraes PD, Gu J, Buchanan J, Preissl S, et al. Complexoscillatory waves emerging from cortical organoids model early human brainnetwork development. Cell Stem Cell 2019;25:558–69 e557.
37. Cugola FR, Fernandes IR, Russo FB, Freitas BC, Dias JL, Guimaraes KP, et al. TheBrazilian Zika virus strain causes birth defects in experimental models. Nature.2016;534:267–71.
38. Garcez PP, Loiola EC, Madeiro da Costa R, Higa LM, Trindade P, Delvecchio R,et al. Zika virus impairs growth in human neurospheres and brain organoids.Science. 2016;352:816–8.
39. Kang HJ, Kawasawa YI, Cheng F, Zhu Y, Xu X, Li M, et al. Spatio-temporaltranscriptome of the human brain. Nature. 2011;478:483–9.
40. Stein JL, de la Torre-Ubieta L, Tian Y, Parikshak NN, Hernandez IA, Marchetto MC,et al. A quantitative framework to evaluate modeling of cortical development byneural stem cells. Neuron. 2014;83:69–86.
41. Miller JA, Ding SL, Sunkin SM, Smith KA, Ng L, Szafer A, et al. Transcriptionallandscape of the prenatal human brain. Nature. 2014;508:199–206.
42. Fietz SA, Lachmann R, Brandl H, Kircher M, Samusik N, Schroder R, et al. Tran-scriptomes of germinal zones of human and mouse fetal neocortex suggest arole of extracellular matrix in progenitor self-renewal. Proc Natl Acad Sci USA.2012;109:11836–41.
43. Willsey AJ, Sanders SJ, Li M, Dong S, Tebbenkamp AT, Muhle RA, et al. Coex-pression networks implicate human midfetal deep cortical projection neurons inthe pathogenesis of autism. Cell. 2013;155:997–1007.
44. Gulsuner S, Walsh T, Watts AC, Lee MK, Thornton AM, Casadei S, et al. Spatialand temporal mapping of de novo mutations in schizophrenia to a fetal pre-frontal cortical network. Cell. 2013;154:518–29.
45. Lin GN, Corominas R, Lemmens I, Yang X, Tavernier J, Hill DE, et al. Spatio-temporal 16p11.2 protein network implicates cortical late mid-fetal braindevelopment and KCTD13-Cul3-RhoA pathway in psychiatric diseases. Neuron.2015;85:742–54.
46. Pasca AM, Sloan SA, Clarke LE, Tian Y, Makinson CD, Huber N, et al. Functionalcortical neurons and astrocytes from human pluripotent stem cells in 3D cul-ture. Nat Methods. 2015;12:671–8.
47. Germain PL, Testa G. Taming human genetic variability: transcriptomic meta-analysis guides the experimental design and interpretation of iPSC-based dis-ease modeling. Stem Cell Rep. 2017;8:1784–96.
48. Zhang B, Horvath S. A general framework for weighted gene co-expressionnetwork analysis. Stat Appl Genet Mol Biol. 2005;4:Article17.
49. Zubarev RA. The challenge of the proteome dynamic range and its implicationsfor in-depth proteomics. Proteomics. 2013;13:723–6.
50. Wang P, Mokhtari R, Pedrosa E, Kirschenbaum M, Bayrak C, Zheng D, et al.CRISPR/Cas9-mediated heterozygous knockout of the autism gene CHD8 andcharacterization of its transcriptional networks in cerebral organoids derivedfrom iPS cells. Mol Autism. 2017;8:11.
51. Polioudakis D, de la Torre-Ubieta L, Langerman J, Elkins AG, Shi X, Stein JL, et al.A single-cell transcriptomic atlas of human neocortical development duringmid-gestation. Neuron. 2019;103:785–801.e788.
52. Stoner R, Chow ML, Boyle MP, Sunkin SM, Mouton PR, Roy S, et al. Patches ofdisorganization in the neocortex of children with autism. N Engl J Med.2014;370:1209–19.
53. Courchesne E, Pierce K, Schumann CM, Redcay E, Buckwalter JA, Kennedy DP,et al. Mapping early brain development in autism. Neuron. 2007;56:399–413.
54. Satterstrom FK, Kosmicki JA, Wang J, Breen MS, De Rubeis S, An JY, et al. Large-scale exome sequencing study implicates both developmental and functionalchanges in the neurobiology of autism. Cell 2020;180:568–84 e523.
55. Marchetto MC, Belinson H, Tian Y, Freitas BC, Fu C, Vadodaria K, et al. Alteredproliferation and networks in neural cells derived from idiopathic autistic indi-viduals. Mol Psychiatry. 2017;22:820–35.
56. Buchsbaum IY, Cappello S Neuronal migration in the CNS during developmentand disease: insights from in vivo and in vitro models. Development 2019;146:dev163766. https://doi.org/10.1242/dev.163766
57. Freese JL, Pino D, Pleasure SJ. Wnt signaling in development and disease.Neurobiol Dis. 2010;38:148–53.
58. Munji RN, Choe Y, Li G, Siegenthaler JA, Pleasure SJ. Wnt signaling regulatesneuronal differentiation of cortical intermediate progenitors. J Neurosci.2011;31:1676–87.
59. Salinas PC, Zou Y. Wnt signaling in neural circuit assembly. Annu Rev Neurosci.2008;31:339–58.
60. Bocchi R, Egervari K, Carol-Perdiguer L, Viale B, Quairiaux C, De Roo M, et al.Perturbed Wnt signaling leads to neuronal migration delay, altered interhemi-spheric connections and impaired social behavior. Nat Commun. 2017;8:1158.
61. Govek EE, Hatten ME, Van Aelst L. The role of Rho GTPase proteins in CNSneuronal migration. Dev Neurobiol. 2011;71:528–53.
62. Cappello S, Bohringer CR, Bergami M, Conzelmann KK, Ghanem A, Tomassy GS,et al. A radial glia-specific role of RhoA in double cortex formation. Neuron.2012;73:911–24.
63. Azzarelli R, Kerloch T, Pacary E. Regulation of cerebral cortex development byRho GTPases: insights from in vivo studies. Front Cell Neurosci. 2014;8:445.
64. Gee HY, Zhang F, Ashraf S, Kohl S, Sadowski CE, Vega-Warner V, et al. KANKdeficiency leads to podocyte dysfunction and nephrotic syndrome. J ClinInvestig. 2015;125:2375–84.
65. Casey CS, Atagi Y, Yamazaki Y, Shinohara M, Tachibana M, Fu Y, et al. Apoli-poprotein E inhibits cerebrovascular pericyte mobility through a RhoA protein-mediated pathway. J Biol Chem. 2015;290:14208–17.
66. Yoshizawa M, Kawauchi T, Sone M, Nishimura YV, Terao M, Chihama K, et al.Involvement of a Rac activator,P-Rex1, in neurotrophin-derived signaling andneuronal migration. J Neurosci. 2005;25:4406–19.
67. Matthews HK, Marchant L, Carmona-Fontaine C, Kuriyama S, Larrain J, Holt MR,et al. Directional migration of neural crest cells in vivo is regulated by Syndecan-4/Rac1 and non-canonical Wnt signaling/RhoA. Development.2008;135:1771–80.
68. Schlessinger K, Hall A, Tolwinski N. Wnt signaling pathways meet Rho GTPases.Genes Dev. 2009;23:265–77.
69. Habas R, Kato Y, He X. Wnt/Frizzled activation of Rho regulates vertebrategastrulation and requires a novel Formin homology protein Daam1. Cell.2001;107:843–54.
70. Boyden S. The chemotactic effect of mixtures of antibody and antigen onpolymorphonuclear leucocytes. J Exp Med. 1962;115:453–66.
71. Escamilla CO, Filonova I, Walker AK, Xuan ZX, Holehonnur R, Espinosa F, et al.Kctd13 deletion reduces synaptic transmission via increased RhoA. Nature.2017;551:227–31.
72. Richter M, Murtaza N, Scharrenberg R, White SH, Johanns O, Walker S, et al.Altered TAOK2 activity causes autism-related neurodevelopmental and cogni-tive abnormalities through RhoA signaling. Mol Psychiatry 2019;24:1329–50.
73. Amar M, Pramod AB, Yu NK, Herrera VM, Qiu LR, Moran-Losada P, et al. Autism-linked Cullin3 germline haploinsufficiency impacts cytoskeletal dynamics andcortical neurogenesis through RhoA signaling. Mol Psychiatry 2021. https://doi.org/10.1038/s41380-021-01052-x. Online ahead of print.
74. Shang X, Marchioni F, Sipes N, Evelyn CR, Jerabek-Willemsen M, Duhr S, et al.Rational design of small molecule inhibitors targeting RhoA subfamily RhoGTPases. Chem Biol. 2012;19:699–710.
75. Setia H, Muotri AR. Brain organoids as a model system for human neurodeve-lopment and disease. Semin Cell Dev Biol 2019;95:93–7.
76. Parikshak NN, Luo R, Zhang A, Won H, Lowe JK, Chandran V, et al. Integrativefunctional genomic analyses implicate specific molecular pathways and circuitsin autism. Cell. 2013;155:1008–21.
77. Li Y, Muffat J, Omer A, Bosch I, Lancaster MA, Sur M, et al. Induction of expansionand folding in human cerebral organoids. Cell Stem Cell. 2017;20:385–96.e383.
78. Vaccarino FM, Grigorenko EL, Smith KM, Stevens HE. Regulation of cerebralcortical size and neuron number by fibroblast growth factors: implications forautism. J Autism Dev Disord. 2009;39:511–20.
79. Luo R, Jeong SJ, Jin Z, Strokes N, Li S, Piao X. G protein-coupled receptor 56 andcollagen III, a receptor-ligand pair, regulates cortical development and lamina-tion. Proc Natl Acad Sci USA. 2011;108:12925–30.
80. Radmanesh F, Caglayan AO, Silhavy JL, Yilmaz C, Cantagrel V, Omar T, et al.Mutations in LAMB1 cause cobblestone brain malformation without muscular orocular abnormalities. Am J Hum Genet. 2013;92:468–74.
81. Charrier C, Joshi K, Coutinho-Budd J, Kim JE, Lambert N, de Marchena J, et al.Inhibition of SRGAP2 function by its human-specific paralogs induces neotenyduring spine maturation. Cell. 2012;149:923–35.
82. Klaus J, Kanton S, Kyrousi C, Ayo-Martin AC, Di Giaimo R, Riesenberg S, et al.Altered neuronal migratory trajectories in human cerebral organoids derivedfrom individuals with neuronal heterotopia. Nat Med. 2019;25:561–8.
83. Xu Q, Liu YY, Wang X, Tan GH, Li HP, Hulbert SW, et al. Autism-associated CHD8deficiency impairs axon development and migration of cortical neurons. MolAutism. 2018;9:65.
84. Lim BC, Matsumoto S, Yamamoto H, Mizuno H, Kikuta J, Ishii M, et al. Prickle1promotes focal adhesion disassembly in cooperation with the CLASP-LL5betacomplex in migrating cells. J Cell Sci. 2016;129:3115–29.
85. Lansbergen G, Grigoriev I, Mimori-Kiyosue Y, Ohtsuka T, Higa S, Kitajima I, et al.CLASPs attach microtubule plus ends to the cell cortex through a complex withLL5beta. Dev Cell. 2006;11:21–32.
87. Bolger TA, Zhao X, Cohen TJ, Tsai CC, Yao TP. The neurodegenerative diseaseprotein ataxin-1 antagonizes the neuronal survival function of myocyteenhancer factor-2. J Biol Chem. 2007;282:29186–92.
88. Cosgrove D, Whitton L, Fahey L, Broin PO, Donohoe G, Morris DW. Genesinfluenced by MEF2C contribute to neurodevelopmental disease via geneexpression changes that affect multiple types of cortical excitatory neurons.Hum Mol Genet. 2020;30:961–70.
89. Zweier M, Gregor A, Zweier C, Engels H, Sticht H, Wohlleber E, et al. Mutations inMEF2C from the 5q14.3q15 microdeletion syndrome region are a frequentcause of severe mental retardation and diminish MECP2 and CDKL5 expression.Hum Mutat. 2010;31:722–33.
91. Hand R, Bortone D, Mattar P, Nguyen L, Heng JI, Guerrier S, et al. Phosphor-ylation of Neurogenin2 specifies the migration properties and the dendriticmorphology of pyramidal neurons in the neocortex. Neuron. 2005;48:45–62.
92. Kholmanskikh SS, Dobrin JS, Wynshaw-Boris A, Letourneau PC, Ross ME. Dis-regulated RhoGTPases and actin cytoskeleton contribute to the migrationdefect in Lis1-deficient neurons. J Neurosci. 2003;23:8673–81.
93. Pacary E, Heng J, Azzarelli R, Riou P, Castro D, Lebel-Potter M, et al. Proneuraltranscription factors regulate different steps of cortical neuron migrationthrough Rnd-mediated inhibition of RhoA signaling. Neuron. 2011;69:1069–84.
94. Qiu Y, Arbogast T, Lorenzo SM, Li H, Tang SC, Richardson E, et al. Oligogeniceffects of 16p11.2 copy-number variation on craniofacial development. Cell Rep.2019;28:3320–8.e3324.
95. Iakoucheva LM, Muotri AR, Sebat J. Getting to the cores of autism. Cell.2019;178:1287–98.
96. Iyer J, Singh MD, Jensen M, Patel P, Pizzo L, Huber E, et al. Pervasive geneticinteractions modulate neurodevelopmental defects of the autism-associated16p11.2 deletion in Drosophila melanogaster. Nat Commun. 2018;9:2548.
97. Grice SJ, Liu JL, Webber C. Synergistic interactions between Drosophila ortho-logues of genes spanned by de novo human CNVs support multiple-hit modelsof autism. PLoS Genet. 2015;11:e1004998.
98. Chavali M, Klingener M, Kokkosis AG, Garkun Y, Felong S, Maffei A, et al. Non-canonical Wnt signaling regulates neural stem cell quiescence during home-ostasis and after demyelination. Nat Commun. 2018;9:36.
99. Wang K, Li M, Hadley D, Liu R, Glessner J, Grant SF, et al. PennCNV: an integratedhidden Markov model designed for high-resolution copy number variationdetection in whole-genome SNP genotyping data. Genome Res. 2007;17:1665–74.
100. Sanders SJ, He X, Willsey AJ, Ercan-Sencicek AG, Samocha KE, Cicek AE, et al.Insights into autism spectrum disorder genomic architecture and biology from71 risk loci. Neuron. 2015;87:1215–33.
101. Marshall CR, Howrigan DP, Merico D, Thiruvahindrapuram B, Wu W, Greer DS,et al. Contribution of copy number variants to schizophrenia from a genome-wide study of 41,321 subjects. Nat Genet. 2017;49:27–35.
102. Ippolito DM, Eroglu C. Quantifying synapses: an immunocytochemistry-basedassay to quantify synapse number. J Vis Exp. 2010;16:2270. https://doi.org/10.3791/2270
103. Oldham MC, Langfelder P, Horvath S. Network methods for describing samplerelationships in genomic datasets: application to Huntington’s disease. BMC SystBiol. 2012;6:63.
106. Durinck S, Spellman PT, Birney E, Huber W. Mapping identifiers for the inte-gration of genomic datasets with the R/Bioconductor package biomaRt. NatProtoc. 2009;4:1184–91.
107. Durinck S, Moreau Y, Kasprzyk A, Davis S, De Moor B, Brazma A, et al. BioMartand Bioconductor: a powerful link between biological databases and microarraydata analysis. Bioinformatics. 2005;21:3439–40.
108. Reimand J, Kull M, Peterson H, Hansen J, Vilo J. g:Profiler–a web-based toolsetfor functional profiling of gene lists from large-scale experiments. Nucleic AcidsRes. 2007;35:W193–200.
109. Raudvere U, Kolberg L, Kuzmin I, Arak T, Adler P, Peterson H, et al. g:Profiler: aweb server for functional enrichment analysis and conversions of gene lists(2019 update). Nucleic Acids Res. 2019;47:W191–W198.
110. Pirooznia M, Wang T, Avramopoulos D, Valle D, Thomas G, Huganir RL, et al.SynaptomeDB: an ontology-based knowledgebase for synaptic genes. Bioin-formatics. 2012;28:897–9.
111. Karczewski KJ, Francioli LC, Tiao G, Cummings BB, Alfoldi J, Wang Q, et al. Themutational constraint spectrum quantified from variation in 141,456 humans.Nature. 2020;581:434–43.
112. Samocha KE, Robinson EB, Sanders SJ, Stevens C, Sabo A, McGrath LM, et al. Aframework for the interpretation of de novo mutation in human disease. NatGenet. 2014;46:944–50.
113. Darnell JC, Van Driesche SJ, Zhang C, Hung KY, Mele A, Fraser CE, et al. FMRPstalls ribosomal translocation on mRNAs linked to synaptic function and autism.Cell. 2011;146:247–61.
114. Wilkinson B, Grepo N, Thompson BL, Kim J, Wang K, Evgrafov OV, et al. The autism-associated gene chromodomain helicase DNA-binding protein 8 (CHD8) regulatesnoncoding RNAs and autism-related genes. Transl Psychiatry. 2015;5:e568.
115. Skene NG, Grant SG. Identification of Vulnerable Cell Types in Major Brain Dis-orders Using Single Cell Transcriptomes and Expression Weighted Cell TypeEnrichment. Front Neurosci. 2016;10:16.
116. McAlister GC, Nusinow DP, Jedrychowski MP, Wuhr M, Huttlin EL, Erickson BK,et al. MultiNotch MS3 enables accurate, sensitive, and multiplexed detection ofdifferential expression across cancer cell line proteomes. Anal Chem.2014;86:7150–8.
117. He L, Diedrich J, Chu YY, Yates JR 3rd. Extracting accurate precursor informationfor tandem mass spectra by RawConverter. Anal Chem. 2015;87:11361–7.
118. Xu T, Park SK, Venable JD, Wohlschlegel JA, Diedrich JK, Cociorva D, et al.ProLuCID: An improved SEQUEST-like algorithm with enhanced sensitivity andspecificity. J Proteom. 2015;129:16–24.
119. Tabb DL, McDonald WH, Yates JR 3rd. DTASelect and Contrast: tools forassembling and comparing protein identifications from shotgun proteomics. JProteome Res. 2002;1:21–6.
120. Park SK, Venable JD, Xu T, Yates JR 3rd. A quantitative analysis software tool formass spectrometry-based proteomics. Nat Methods. 2008;5:319–22.
121. Bates D, Machler M, Bolker BM, Walker SC. Fitting linear mixed-effects modelsusing lme4. J Stat Softw. 2015;67:1–48.
122. Kuznetsova A, Brockhoff PB, Christensen RHB. lmerTest Package: tests in linearmixed effects models. J Stat Softw. 2017;82:1–26.
ACKNOWLEDGEMENTSThis work was supported by a grant to L.M.I. and A.R.M. from the Simons Foundationfor Autism Research (#345469), and in part by grants from the National Institute ofMental Health to L.M.I. and A.R.M. (MH109885 and MH108528), to L.M.I. (MH105524and MH104766), to J.R.Y. and A.R.M. (MH100175), and to J.S. (MH119746). We thankGabriel Hoffman, Karen Messer, Minya Pu, and Ruifeng Chen for suggestionsregarding data analyses. We thank Lucas Bazier, Nicholas Chew and Alexander Sunfor help with image analysis; and Jiaye Chen for help with uploading transcriptomicdata to the GEO database. RNA-seq data was generated at the UC San Diego IGMGenomics Center, University of California San Diego (grant P30CA023100). Theimages were acquired at the UCSD School of Medicine Microscopy Shared Facility(grant NS047101).
AUTHOR CONTRIBUTIONSL.M.I. and A.R.M. conceived the study. J.U., P.Z., P.M-L., N.-K.Y., P.D.N., C.A.T., D.A., J.S,J.R.Y. III, A.R.M., and L.M.I. designed the experiments and analyses. J.U., N-K.Y., P.D.N.,C.T., M.A., J.D., L.T., and S.R. performed the experiments and analyses. P.Z., P.M-L., D.A.,K.C., and A.B.P. performed computational data processing and analyses. J.U. and L.M.I.wrote the paper, with input from all co-authors. Supervision was performed by J.S.,J.R.Y. III, A.R.M., and L.M.I.
COMPETING INTERESTSDr. Muotri is a co-founder and has equity interest in TISMOO, a company dedicated togenetic analysis and human brain organogenesis, focusing on therapeutic applica-tions customized for autism spectrum disorders and other neurological disordersorigin genetics. The terms of this arrangement have been reviewed and approved bythe University of California, San Diego in accordance with its conflict of interestpolicies.
ADDITIONAL INFORMATIONSupplementary information The online version contains supplementary materialavailable at https://doi.org/10.1038/s41380-021-01243-6.
Correspondence and requests for materials should be addressed to A.R.M. or L.M.I.
Reprints and permission information is available at http://www.nature.com/reprints
Publisher’s note Springer Nature remains neutral with regard to jurisdictional claimsin published maps and institutional affiliations.
Open Access This article is licensed under a Creative CommonsAttribution 4.0 International License, which permits use, sharing,
adaptation, distribution and reproduction in anymedium or format, as long as you giveappropriate credit to the original author(s) and the source, provide a link to the CreativeCommons license, and indicate if changes were made. The images or other third partymaterial in this article are included in the article’s Creative Commons license, unlessindicated otherwise in a credit line to the material. If material is not included in thearticle’s Creative Commons license and your intended use is not permitted by statutoryregulation or exceeds the permitted use, you will need to obtain permission directlyfrom the copyright holder. To view a copy of this license, visit http://creativecommons.org/licenses/by/4.0/.