13
CREATING FANCY MAPS AND PIE CHARTS USING GOOGLE API CHARTS Lionel Page and Franz Buscha Centre for Employment Centre for Employment Research Research
| Date post: | 17-Nov-2023 |
| Category: |
Documents |
| Upload: | independent |
| View: | 0 times |
| Download: | 0 times |
CREATING FANCY MAPS AND PIE CHARTS USING GOOGLE API CHARTS
Lionel Page and Franz Buscha
Centre for Employment Centre for Employment ResearchResearch

INTRODUCTION These ado files use Stata’s ability to easily interface
with the internet and contact:
chart.apis.google.com
Google chart API (Application Programming Interface) allows users to dynamically create charts and maps by sending a pre-programmed URL to Google
Google then returns a PNG-image which, with a bit of luck, is a useable piece of information!

GOOGLE CHARTS API Stata’s unique and powerful data-management
abilities make it a good complement in order to pre-format data and then send it to Google and allow it to compile this data into a different array of graphs/figures.
How does Google API work?http://chart.apis.google.com/chart?chs=250x100 [size]&chd=t:60,40 [data]&cht=p3 [type]&chl=Hello|World [labels]

Google-o-meter
Chart colors Yes Yes Yes Yes Yes Yes Yes YesSolid fill
Yes Yes Yes Yes Yes Yes Background only
Background only
Data scaling Yes Yes Yes Yes Yes Yes YesLinear gradient Yes Yes Yes Yes Yes
Background only
Linear stripesYes Yes Yes Yes Yes
Background only
Chart title Yes Yes Yes Yes Yes YesChart legend
Yes Yes Yes Yes Yes
Multiple axis labels Yes Yes Yes Yes
Grid lines Yes Yes Yes YesShape markers Yes Yes Yes Yes
Horizontal range markers
Yes Yes Yes Yes
Vertical range markers
Yes Yes Yes Yes
Line styles Yes Yes YesFill area Yes Yes YesBar width and spacing Yes
Bar chart zero line Yes
Pie chart and Google-o-meter labels Yes Yes
Pie chart MapsParameter Bar chart Line and Sparkline chart
Radar chart
Scatter plot
Venn diagram
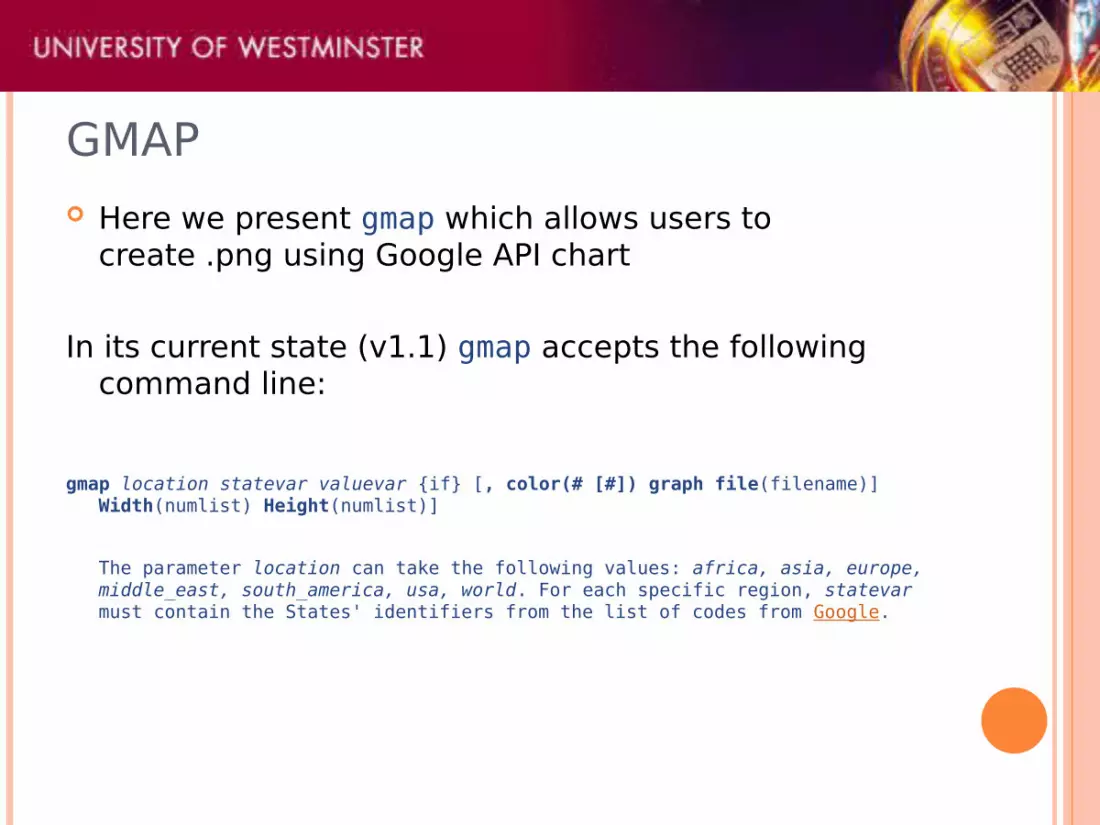
GMAP Here we present gmap which allows users to
create .png using Google API chart
In its current state (v1.1) gmap accepts the following command line:
gmap location statevar valuevar {if} [, color(# [#]) graph file(filename)] Width(numlist) Height(numlist)]
The parameter location can take the following values: africa, asia, europe, middle_east, south_america, usa, world. For each specific region, statevar must contain the States' identifiers from the list of codes from Google.
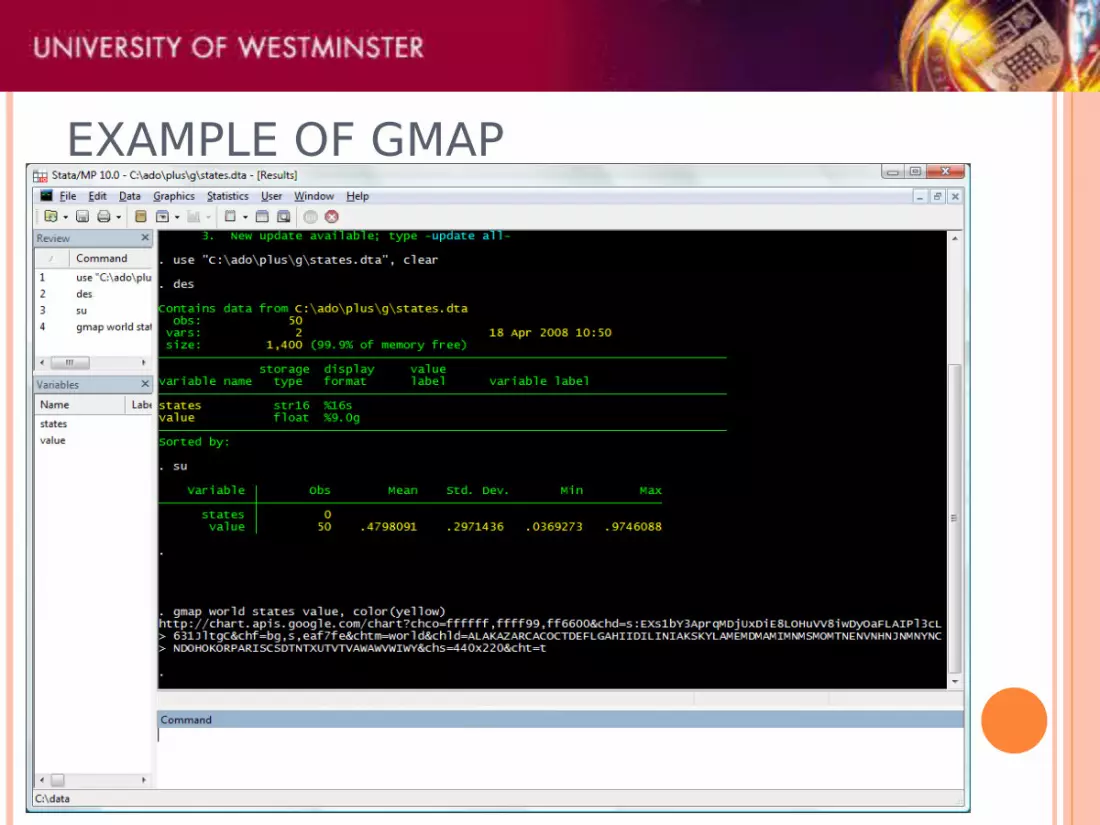
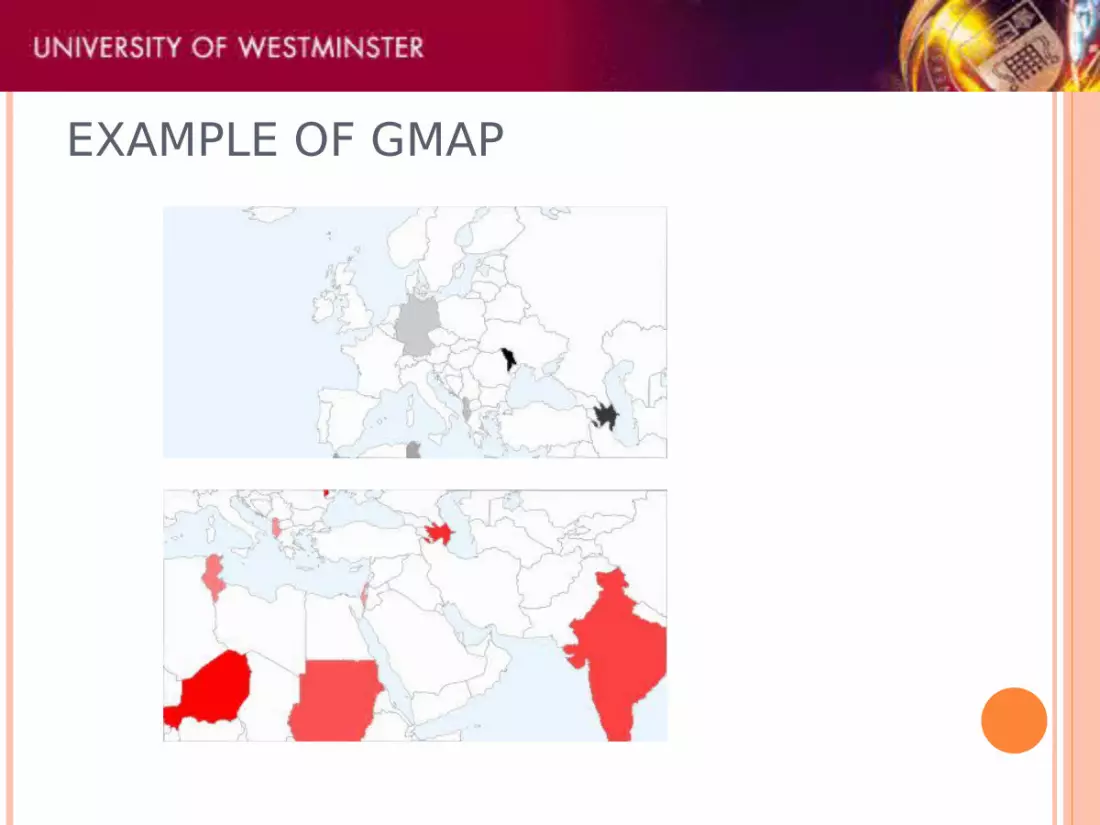
EXAMPLE OF GMAP

EXAMPLE OF GMAP The following picture will be saved in your local
directory
gmap usa states value, color(yellow green) graph h(100) w(200)
EXAMPLE OF GMAP
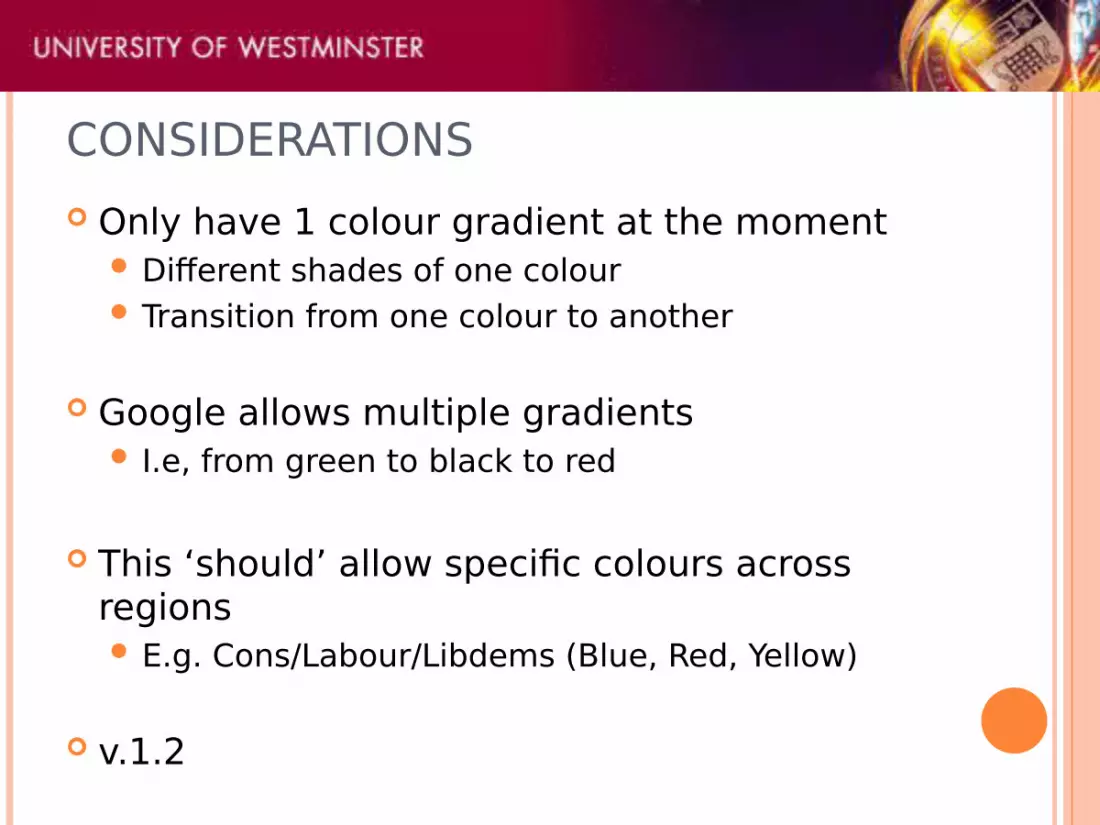
CONSIDERATIONS Only have 1 colour gradient at the moment
Different shades of one colour Transition from one colour to another
Google allows multiple gradients I.e, from green to black to red
This ‘should’ allow specific colours across regions E.g. Cons/Labour/Libdems (Blue, Red, Yellow)
v.1.2
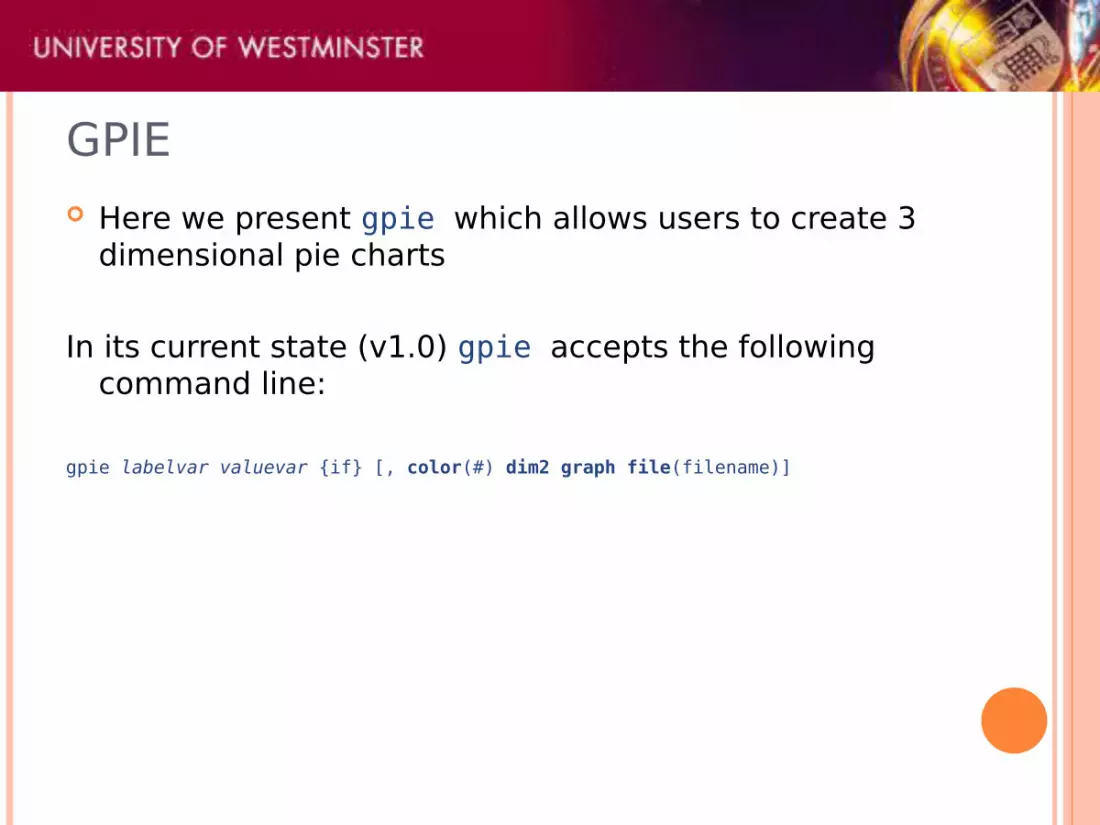
GPIE Here we present gpie which allows users to create 3
dimensional pie charts
In its current state (v1.0) gpie accepts the following command line:
gpie labelvar valuevar {if} [, color(#) dim2 graph file(filename)]
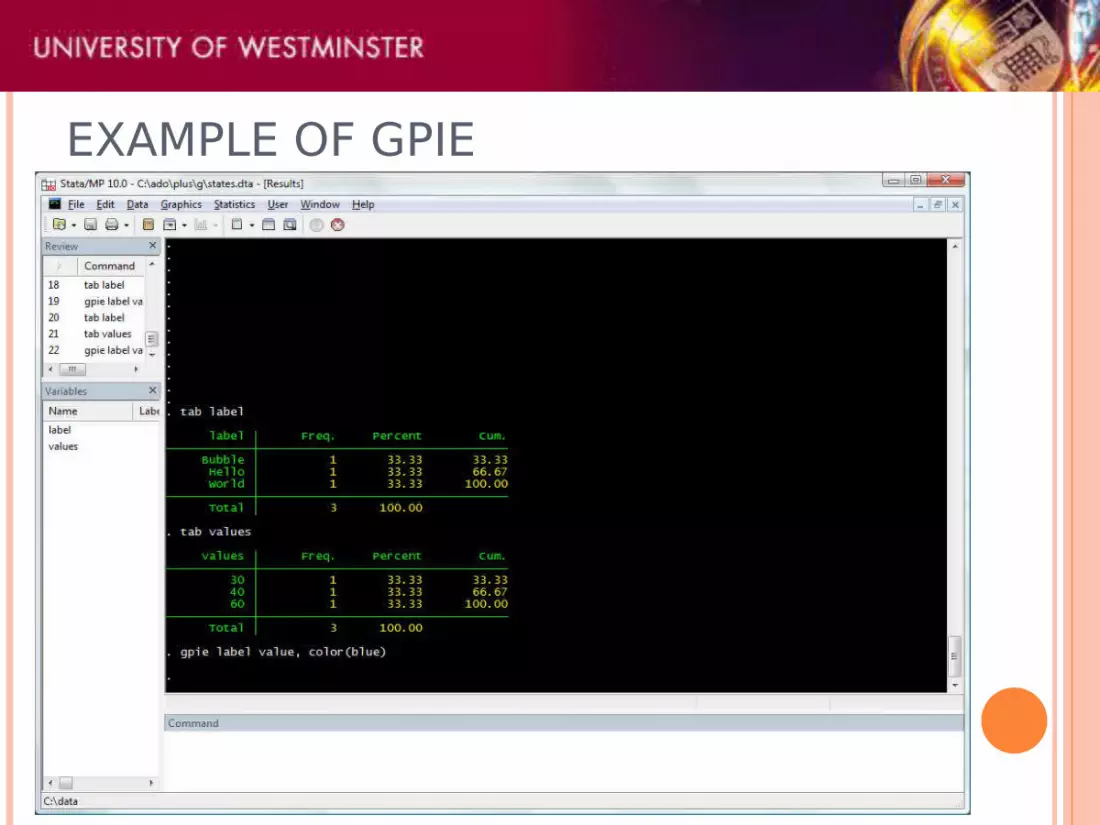
EXAMPLE OF GPIE
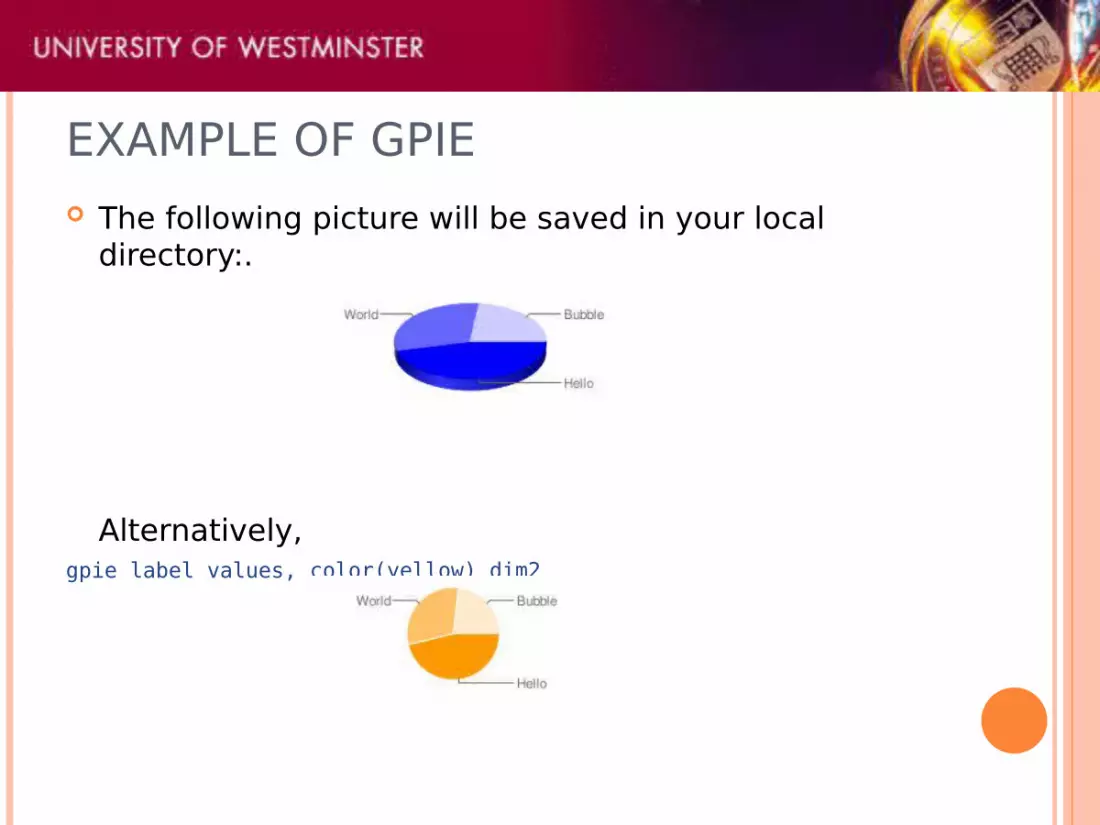
EXAMPLE OF GPIE The following picture will be saved in your local
directory:.
Alternatively,gpie label values, color(yellow) dim2

USEAGE AND LIMITATIONS Google API charts is aimed at web-based
developments such as blogs and websites and therefore offers little in terms statistical analysis
gmap should be seen as a informational and explorative tool
Limited to 250,000 API calls per day No labels! Maximum picture size is 440x220 pixels Country labels must be in ISO 3166-1-alpha-2 code Only United States supports state level mapping Please findit tmap (Pisati, 2004, SJ) for more
complicated thematic mapping futures using Stata’s graphics engine


