G E O S C I E N C E A U S T R A L I A Edited by R.J. Korsch & N. Kositcin APPLYING GEOSCIENCE TO AUSTRALIA’S MOST IMPORTANT CHALLENGES Record 2010/39 GeoCat #71141 GOMA (Gawler Craton–Officer Basin– Musgrave Province–Amadeus Basin) Seismic and MT Workshop 2010 Extended Abstracts
Transcript
G E O S C I E N C E A U S T R A L I A
Edited by R.J. Korsch & N. Kositcin
APPLYING GEOSCIENCE TO AUSTRALIA’S MOST IMPORTANT CHALLENGES
GOMA (Gawler Craton-Officer Basin-Musgrave Province-Amadeus Basin) Seismic and MT Workshop 2010 Extended Abstracts GEOSCIENCE AUSTRALIA RECORD 2010/39 Edited by R.J. Korsch1 & N. Kositcin1
1. Onshore Energy and Minerals Division, Geoscience Australia, GPO Box 378, Canberra, ACT 2601, Australia
ii
Department of Resources, Energy and Tourism Minister for Resources and Energy: The Hon. Martin Ferguson, AM MP Secretary: Mr Drew Clarke Geoscience Australia Chief Executive Officer: Dr Chris Pigram
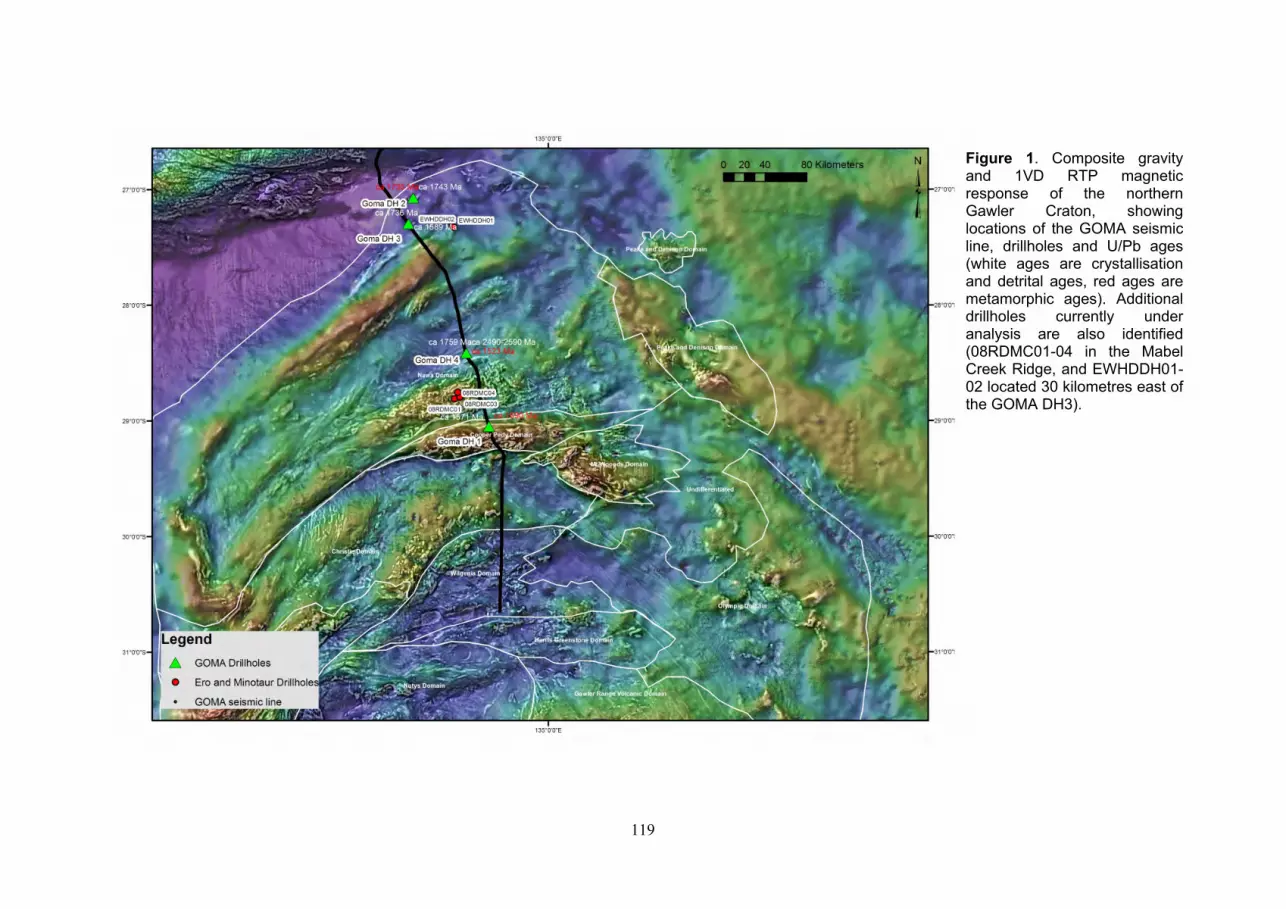
Contents R.D. Costelloe and J. Holzschuh ................................................................................. 1 2008 Gawler Craton-Officer Basin-Musgrave Province-Amadeus Basin (GOMA) seismic survey, 08GA-OM1: acquisition and processing J. Duan, P.R. Milligan and A. Nakamura ...................................................................... 7 Magnetotelluric survey along the GOMA deep seismic reflection transect in the northern Gawler Craton to Musgrave Province, South Australia S.A. Menpes, R.J. Korsch and L.K. Carr .................................................................... 16 2008 Gawler Craton-Officer Basin-Musgrave Province-Amadeus Basin (GOMA) seismic survey, 08GA-OM1: Geological interpretation of the Arckaringa Basin W.V. Preiss, R.J. Korsch and L.K. Carr ......................................................................................... 32 2008 Gawler Craton-Officer Basin-Musgrave Province-Amadeus Basin (GOMA) seismic survey, 08GA-OM1: Geological interpretation of the Officer Basin A. Woodhouse, A.J. Reid, W.M. Cowley and G.L. Fraser ............................................................ 47 Overview of the geology of the northern Gawler Craton and adjoining Musgrave Province, South Australia R.J. Korsch, R.S. Blewett, D. Giles, A.J. Reid, N.L. Neumann, G.L. Fraser, J. Holzschuh, R.D. Costelloe, I.G. Roy, B.L.N. Kennett, W.M. Cowley, G. Baines, L.K. Carr, J. Duan, P.R. Milligan, R. Armit, P.G. Betts, W.V. Preiss and B.R. Bendall ..................................................................................... 63 Geological interpretation of the deep seismic reflection and magnetotelluric line 08GA-OM1: Gawler Craton-Officer Basin-Musgrave Province-Amadeus Basin (GOMA), South Australia and Northern Territory B.L.N. Kennett.................................................................................................................................. 87 Understanding the lithosphere in the vicinity of seismic line 08GA-OM1 from passive seismic studies G. Baines, D. Giles and P.G. Betts.................................................................................................95 3D geophysical modelling of the northern Gawler Craton, South Australia E.A. Jagodzinski and A.J. Reid ....................................................................................................108 New zircon and monazite geochronology using SHRIMP and LA-ICPMS, from recent GOMA drilling, on samples from the northern Gawler Craton R. Armit, P.G. Betts and B.F. Schaefer........................................................................................118 Lu-Hf isotope characteristics of the marginal terranes of the northern Gawler Craton P.G. Betts, R. Armit, G. Baines, D. Giles and B.F. Schaefer ..................................................... 128 Crustal boundaries of the marginal terranes of the northern Gawler Craton R.J. Korsch, N. Kositcin, R.S. Blewett, G.L. Fraser, G. Baines, B.L.N. Kennett, N.L. Neumann, A.J. Reid, W.V. Preiss, D. Giles, R. Armit and P.G. Betts ............................... 138 Geodynamic implications of the deep seismic reflection line 08GA-OM1: Gawler Craton- Officer Basin-Musgrave Province-Amadeus Basin (GOMA), South Australia and Northern Territory N.L. Neumann, R.G. Skirrow, G.L. Fraser, R.J. Korsch, W.V. Preiss, W.M. Cowley and R.S. Blewett ............................................................................................................................152 Implications for regional energy and mineral systems of the 08GA-OM1 (GOMA) deep seismic reflection survey in the northern Gawler Craton to Amadeus Basin, South Australia and the Northern Territory
Introduction Geoscience Australia, in collaboration with Primary Industries and Resources South Australia (PIRSA), Auscope and the Northern Territory Geological Survey (NTGS), contracted Terrex Seismic to collect the Gawler Craton – Officer Basin – Musgrave Province – Amadeus Basin (GOMA, 08GA-OM1) deep seismic reflection survey data in November and December 2008. Deep seismic reflection data and gravity measurements were acquired along the 634 km GOMA transect. 240 km of MT data were also acquired on the southern end of the transect (Duan et al., 2010). The survey was partially funded by Geoscience Australia’s Onshore Energy Security Program, PIRSA, and AuScope’s Earth Imaging and Structure Program. The aim of the survey was to:
1. Image the crust and upper mantle structure of Paleo- and Mesoproterozoic basement of the northern Gawler Craton,
2. Image the transition between the northern Gawler Craton and southern Musgrave Province, and
3. Image intracratonic fault structures within the Neoproterozoic cover rocks of the northeastern Officer Basin.
Acquisition of the seismic reflection data Acquisition of the reflection seismic survey commenced on 3 November 2008, 15 km south of the Impadna rail siding in the Northern Territory. The traverse continued south on the eastern side of the rail line corridor, which links Alice Springs to Port Augusta, and finished about 3 km northwest of Tarcoola in South Australia on 13 December 2008. The location of the line is shown in Figure 1. Acquisition parameters for the survey are shown in Table 1. The seismic data were collected with 300 live channels spread over 12 km, with the source array located at the centre of the spread. The maximum offset receiver groups were 6 km from the source. The seismic data were recorded using a Sercel SN388 recording system in SEG-D demultiplexed format. The recording system cross-correlated each of the 3 recorded sweeps for each vibration point (VP) with its respective reference sweep, and stacked the cross-correlated sweeps, creating a single 20 second record for each VP, which was then written to a 3490E tape. Each tape held about 68 VPs, the total number depending on the number of recording system test records acquired each morning. Generally, three 3490E tapes were created each day, with an average survey production rate of 184.5 VPs or 14.76 km per day. Processing of the seismic reflection data The reflection seismic data for the GOMA survey was processed by the Seismic Acquisition and Processing team of the Onshore Energy and Minerals Division at Geoscience Australia, using the Disco/Focus processing software on a Red Hat Enterprise Linux Sun Fire X4600 M2 server. The basic processing sequence applied to the data is shown in Table 2. A reduced processing stream was used in the field to produce field stacks to QC and monitor data quality while the
2
survey was in progress. As the line was essentially a 2D transect, it was processed using algorithms that are based on assumed 2D geometry. This 2D assumption has implications for processing, and for the interpretation of the resulting processed data, which is explained in the description of the key processing steps. Table 1. Acquisition Parameters used for the GOMA Seismic Survey. Line 08GA-OM1 Source type 3 IVI Hemi-60 vibrators Source array 15 m pad-to-pad, 15 m moveup Sweep length 3 x 12 s Sweep frequency 6-64 Hz, 12-96 Hz, 8-72 Hz Vibration Point (VP) interval 80 m Receiver group 12 geophones @ 3.3 m spacing Group interval 40 m Number of recorded channels 300 Fold (nominal) 75 Record length 20 s @ 2 ms Table 2. Seismic reflection processing sequence for line 08GA-OM1. Crooked line geometry definition (CDP interval 20 m) SEG-D to SEG-Y to Disco format conversion, resample to 4 ms Quality control displays Inner trace edits Common midpoint sort Gain recovery (spherical divergence) Spectral equalisation over 6 to 90 Hz (1000 ms AGC gate) Application of floating datum residual refraction statics Velocity Analysis Application of automatic residual statics Normal moveout correction with 13% stretch mute Band pass filter Velocity Analysis Offset regularisation and dip moveout (DMO) correction Common Midpoint stack Omega-x migration Signal coherency enhancement (digistack 0.5 and fkpower) Application of mean datum statics, datum 500 m (AHD), replacement velocity 5500 m s-1 Trace amplitude scaling for display Crooked line geometry definition The seismic line followed the rail corridor and hence was not straight. To process crooked line data using the Common Depth Point (CDP) method, it is necessary to bin the data into common midpoint gathers based on a calculated CDP line. The CDP line is a curve of best fit through the source-receiver midpoints, which optimises the fold of the data while minimising the subsurface area of reflections contributing to each CDP. Each trace (source-receiver pair) is allocated to the nearest CDP bin to its midpoint. The CDP bins were defined to be 20 metres along the line, and 2400 metres wide across the line. The effect of the bin size and midpoint scatter within the bin is most critical at shallow depths. Where the line has sharp bends, there is likely to be smearing and poor resolution of shallow data. The effect of bends on deeper data can also be significant, depending of the relative directions of the seismic line and the dip of the structures to be imaged. The CDP line was processed as if it were straight, ignoring the effects of changing azimuth along the line. This simplification of the processing to a 2D geometry at the start of the processing sequence is reasonable for large sections of the line which are relatively straight, although, it is not possible to correctly migrate reflections and, therefore, correctly image reflectors at significant bends in the line.
3
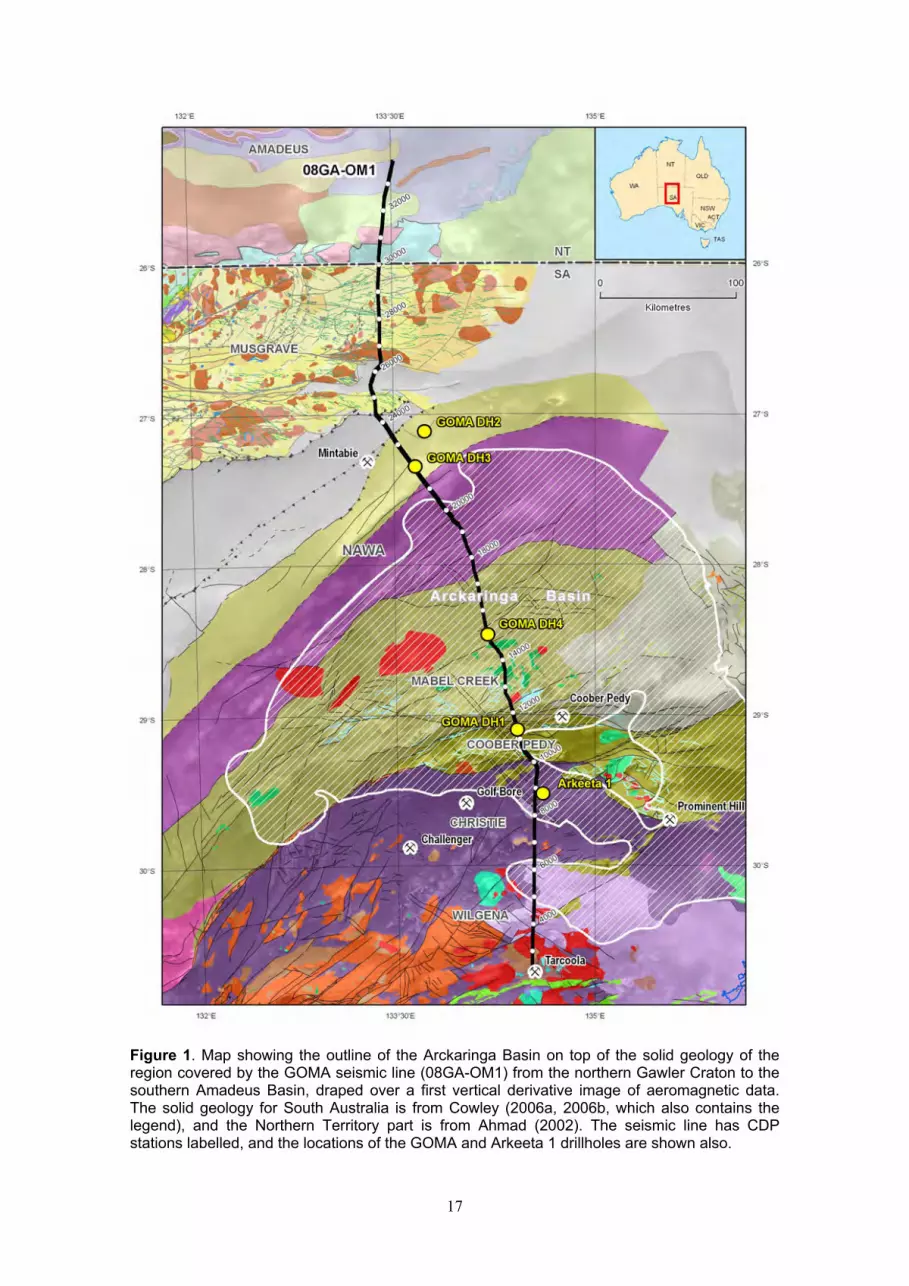
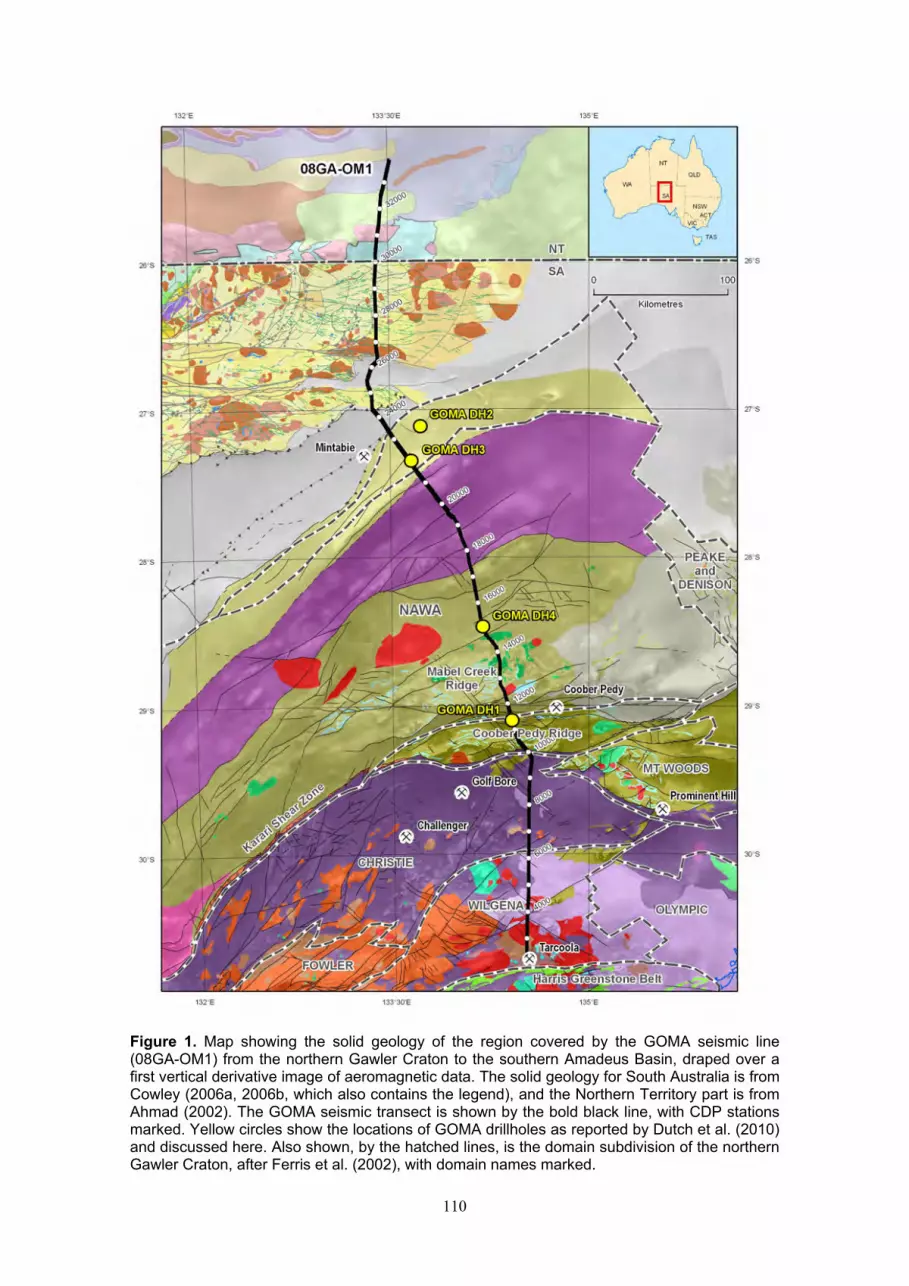
Figure 1. Map showing the solid geology of the region covered by the GOMA seismic line (08GA-OM1) from the northern Gawler Craton to the southern Amadeus Basin, draped over a first vertical derivative image of aeromagnetic data. The solid geology for South Australia is from Cowley (2006a, 2006b, which also contains the legend), and the Northern Territory part is from Ahmad (2002). The seismic line has CDP stations labelled, and the locations of the GOMA drillholes are shown also.
4
Refraction statics Variations in surface elevation, weathering layer depth and weathering layer velocity can produce significant time delays in land seismic data. Variations over a short distance relative to the spread length can degrade the stack, as the reflections do not align across the traces to be stacked. Variations over distances longer than a spread length will not significantly affect the stack quality, but can introduce spurious long wavelength structure on the stacked reflections. Static corrections are applied in the processing stream in order to remove these effects. Static corrections for the GOMA reflection seismic processing were calculated, based on picking first break refracted arrivals from shot records, and creating a near surface refractor model of the weathering layer. The refraction statics were applied in two stages using a floating datum. An intermediate step of automatic residual statics produced fine tuning of the corrections. The final statics were calculated relative to a datum of 500 m (AHD) using a replacement velocity of 5500 m s-1. The process of picking first breaks for each shot is time consuming. Although automatic methods of picking the first breaks are used, each set of first breaks needs to be checked and frequently requires editing. Also, the quality of the first break wavelets depend on the nature of the geology at both the source and the receiver arrays. In some parts of the line, a significant proportion of the first break picks were discarded, owing to poor signal-to-noise ratio of the first breaks. The number of picks for each shot contributing to the model may need to vary along the line and the number of layers modelled has to be selected. Once the first breaks for the line have been picked and edited, and the number of layers to be modelled is selected, the refractor model can be calculated. Usually, a one or two layer model can provide a suitable solution to the effect of the weathering. For the GOMA line, a single layer model was selected as best representing the weathering over the entire transect. Spectral equalisation Spectral Equalisation is a process used to sharpen the reflection wavelet and suppress low frequency energy, primarily ground roll energy, which is surface wave energy that is generated by the vibrators. The frequency spectrum of the data is flattened over a specified frequency range and within a specified time gate. The high energy, low frequency surface wave noise is thereby reduced relative to the higher frequency energy of the reflections. The resulting data has better resolution, particularly in the shallow (0-2 s two-way travel time, TWT) section. The selection of appropriate frequency range and time gate is based on selective testing and spectral analysis of the data. Normal moveout correction Normal moveout (NMO) correction removes time variations across CDP gathers by adjusting for the time delays caused by increasing offset between source and receivers across the gather. The NMO correction is applied as a stacking velocity which best aligns the reflections in the CDP gather. To calculate the stacking velocities to apply to the GOMA data, two different techniques were used. Both velocity scans and constant velocity stacks were used to define the stacking velocity field. Both techniques result in a velocity field varying in time and space (along the line) which maximises the stack response of the data. Velocity analysis requires interactive selection of optimal stack responses and is one of the most time consuming processes in the processing sequence. Velocity analysis is usually made on Spectral Equalised CDP gathers, then after automatic residual statics, and then also after dip moveout. Analyses can also be iterated where required, and areas of complex geology or poor stacking quality may require more closely spaced velocity analyses. The velocity boxes annotated on the seismic sections are the final velocities picked from the dip moveout gathers, with all corrections except the mean refraction statics applied, that is, velocities were applied prior to moving the data to its final datum. Dip moveout correction Dip moveout (DMO) correction, also known as partial prestack migration, adjusts the NMO correction for the increase in stacking velocity as structural dip increases, and has the effect of correcting the NMO to account for different dips occurring along the line. The process effectively
5
moves reflection energy between traces within and between CDP gathers based on apparent dip of the reflectors, and creates a new set of DMO corrected CDP gathers. After DMO, intersecting dipping and flat reflections will correctly stack with the same stacking velocity. DMO is a highly computationally intensive processing step.
Common midpoint stack Common midpoint stack is simply the summing of traces in a CDP gather to produce a single trace at the CDP location. The traces in the gather are aligned by the NMO and DMO processes to sum optimally. Stacking the data improves the signal to noise ratio of the data by √n, where n is the number of traces summed (the fold). A nominal fold of 75 resulted from the acquisition geometry for the GOMA survey. (A)
(B)
Figure 2. (A) Final stacked section for part of GOMA seismic line. (B) Final migrated section for the same part of the line, showing how the migration process collapses diffraction energy and moves dipping reflections to the correct location. Post stack time migration Migration is the final processing step and moves dipping reflections to their most likely lateral positions. Reflections which appear as dipping on the stack section will be moved up dip and shortened after migration. Diffraction hyperbolas which result from discontinuities, such as terminations of reflectors at faults, and which are visible on the stack section, should collapse to a small region after migration. Note that areas of poor signal to noise ratio, and sharp bends in the line, can produce artefacts in the data which will not migrate successfully. The main parameters to be selected when performing migration are the velocity field and dip ranges to process. The velocity field used is usually a percentage of the stacking velocity. Tests are run
6
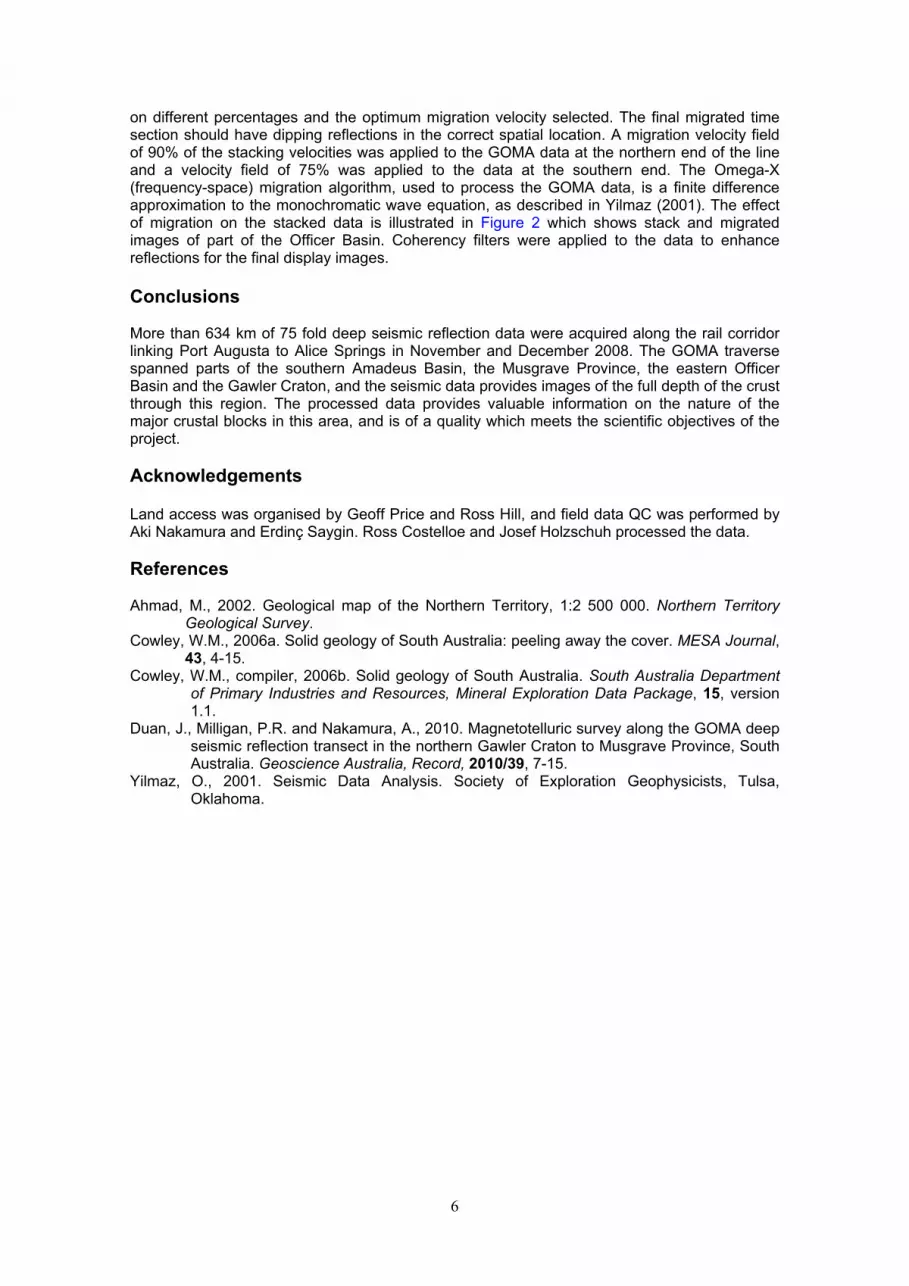
on different percentages and the optimum migration velocity selected. The final migrated time section should have dipping reflections in the correct spatial location. A migration velocity field of 90% of the stacking velocities was applied to the GOMA data at the northern end of the line and a velocity field of 75% was applied to the data at the southern end. The Omega-X (frequency-space) migration algorithm, used to process the GOMA data, is a finite difference approximation to the monochromatic wave equation, as described in Yilmaz (2001). The effect of migration on the stacked data is illustrated in Figure 2 which shows stack and migrated images of part of the Officer Basin. Coherency filters were applied to the data to enhance reflections for the final display images. Conclusions More than 634 km of 75 fold deep seismic reflection data were acquired along the rail corridor linking Port Augusta to Alice Springs in November and December 2008. The GOMA traverse spanned parts of the southern Amadeus Basin, the Musgrave Province, the eastern Officer Basin and the Gawler Craton, and the seismic data provides images of the full depth of the crust through this region. The processed data provides valuable information on the nature of the major crustal blocks in this area, and is of a quality which meets the scientific objectives of the project. Acknowledgements Land access was organised by Geoff Price and Ross Hill, and field data QC was performed by Aki Nakamura and Erdinç Saygin. Ross Costelloe and Josef Holzschuh processed the data. References Ahmad, M., 2002. Geological map of the Northern Territory, 1:2 500 000. Northern Territory
Geological Survey. Cowley, W.M., 2006a. Solid geology of South Australia: peeling away the cover. MESA Journal,
43, 4-15. Cowley, W.M., compiler, 2006b. Solid geology of South Australia. South Australia Department
of Primary Industries and Resources, Mineral Exploration Data Package, 15, version 1.1.
Duan, J., Milligan, P.R. and Nakamura, A., 2010. Magnetotelluric survey along the GOMA deep seismic reflection transect in the northern Gawler Craton to Musgrave Province, South Australia. Geoscience Australia, Record, 2010/39, 7-15.
Yilmaz, O., 2001. Seismic Data Analysis. Society of Exploration Geophysicists, Tulsa, Oklahoma.
7
Magnetotelluric survey along the GOMA deep seismic reflection transect in the northern
Gawler Craton to Musgrave Province, South Australia
J. Duan, P.R. Milligan and A. Nakamura
Onshore Energy and Minerals Division, Geoscience Australia, GPO Box 378,
In December 2008, broadband and long-period magnetotelluric (MT) data were acquired by Geoscience Australia (GA) along the southern part of the GOMA (Gawler Craton, Officer Basin, Musgrave Province, Amadeus Basin) deep seismic reflection transect (GA08-OM1) from Tarcoola to near Coober Pedy in South Australia (beside the Adelaide-Darwin railway line) as part of the Australian Government’s Onshore Energy Security Program. With pre-existing long period MT data to the north (Selway, 2006; Selway et al., 2011), there are now MT data for a 540 km profile along most of the seismic line (Figure 1). The new MT data were acquired along a ~230 km profile at 27 sites, with site spacings ranging from 5 to 20 km. The aim of the MT survey was to produce a two-dimensional image of the electrical resistivity structure of the crust and uppermost mantle. A very preliminary model of the GA data is presented here. The MT information is complementary to that obtained from deep seismic reflection, gravity, magnetic and geological data, which together provide new knowledge of the crustal architecture and geodynamics of the region, which is important for helping to assess the potential for both mineral and energy resources. Methodology The MT method is a passive electromagnetic (EM) technique which utilises variations in the Earth's natural magnetic and electric fields to determine the electrical resistivity structure of the subsurface, from depths of tens of metres to hundreds of kilometres (Tikhonov, 1950; Cagniard, 1953; Vozoff, 1991). The MT magnetic source signal is generated by solar particle fluxes impinging on the Earth’s geomagnetic field, and by lightning, covering a range from about 20,000 Hz to 0.0001 Hz (10,000 s). The signal diffuses into the Earth and generates secondary electric fields, which have characteristics dependent on the resistivity distribution of the Earth. Field data are acquired by measuring either two or three orthogonal components of the magnetic field variations, and two orthogonal components of the electric field variations. The magnetic field variations are the source signal and the electric field variations are the induced Earth response; the response is related to the source by a complex impedance tensor, which contains information of the Earth’s resistivity distribution with depth. Different rocks and geological structures display a wide range of different resistivity values, across 14 orders of magnitude (Nover, 2005). Resistivity is a complex property of Earth materials, and is very dependent on factors other than composition, such as porosity and permeability, fluids, fractures, faults and temperature. Thus, although measuring electrical resistivity can be useful for distinguishing different types of rock, and for understanding tectonic processes and geological structures, the complex nature of the property always must be considered. Resistivity
8
measurements are used widely for mineral, petroleum, geothermal and groundwater exploration. Especially significant is that the depth of investigation of the MT method is much greater than other EM methods, such as controlled source ground and airborne EM. The penetration of MT signals depends on their frequency and the resistivity of the subsurface of Earth. Lower frequencies penetrate to greater depths than higher frequencies, but the depth of penetration is also greater into more highly resistive material. For higher frequency MT, the source field is mainly generated by lightning strikes (from worldwide thunderstorm activity). The frequency range is approximately 1–20,000 Hz, which allows investigation to depths ranging from a few tens or hundreds of metres to the top few kilometres in the crust. The source field of long-period MT is generated by solar activity (magnetospheric and ionospheric currents). This provides periods from 1 s to about 10,000 s, and the depth of investigation can be up to several hundreds of kilometres. Conventional broadband MT (often using different magnetic sensors for high and low frequency measurements) collects data from a frequency range of 300–0.001 Hz, which allows a depth of investigation from tens or hundreds of metres to about 40 km (Simpson and Bahr, 2005). As the MT method relies on naturally-occurring variations in the Earth’s magnetic and electric fields, the measured time signals are highly variable in power across their frequency range. There is a region in the spectrum around 1 s called the ‘dead band’ where there is very little natural signal. In general, it is often difficult to acquire high quality MT data; signals are often contaminated by natural or man-made noise, and they can be strongly distorted. This may lead to serious errors in data processing and interpretation. Several methods have been developed to solve these issues. MT utilising a remote magnetic reference has been used widely in practice. This method requires simultaneous recordings at two or more sites, separated by a sufficiently large distance, such that the noise is uncorrelated between these sites (Gamble, 1979; Chave et al., 1987; Egbert and Booker, 1986; Egbert, 1997; Chave and Thomson, 2004). Data acquisition and specifications The GOMA GA MT data were acquired at 27 sites with site spacing 5-20 km, offset by about 50 m from the seismic line (Figure 1). At 12 sites, both broadband and long period data were acquired. In the northern section, along approximately 310 km of the seismic traverse, long period MT data were acquired previously by Selway (2006) and Selway et al. (2011). Nine sets of ANSIR (National Research Facility for Earth Sounding) MT systems (broadband and long-period) were used for data acquisition. Data were recorded on high-precision, high-dynamic-range, Earth Data Loggers. The instrumentation used for sensing magnetic data included two induction coils for the higher frequencies (broadband) and three component fluxgate magnetometers for the lower frequencies (long period). Orthogonal electric field measurements were made using three non-polarising copper/copper sulphate electrodes. GPS provided the accurate timing required for synchronization between simultaneous sites, as well as for the determination of the site location, and precise time-stamping of the observed magnetic and electric field measurements. Precise timing is critical for use of the remote referencing technique in the processing stage. More than three sites were usually deployed at a time to enable remote-referencing. MT data were recorded as either 4 or 5 channels of time series over two bands (sample rates of 500 and 10 samples per second) onto a removable local hard-drive for a total of about 30 hours (broadband) and for 7 days (long-period). Data QA/QC was conducted during the acquisition (Figure 2). At the broadband MT sites, two induction coils (LEMI-120 model) were used to measure the magnetic fields in two orthogonal horizontal directions (north-south and east-west). The horizontal electric fields were measured using two orthogonal dipoles (north-south and east-west directions) having an average length of 50 main an L-shaped configuration. Electrodes were buried to a depth of about 20 cm to reduce temperature variations and to ensure a wet environment and low contact resistance of electrodes. Recorded at a sampling rate of 500 Hz, this gives an effective frequency bandwidth of approximately 150−0.001 Hz. The broadband survey was used to gain information within the top 40 km of the crust, and deployments of 30-50 hours were sufficient.
9
Figure 1. Map showing the solid geology of the region covered by the GOMA seismic line (08GA-OM1) from the northern Gawler Craton to the southern Amadeus Basin, draped over a first vertical derivative image of aeromagnetic data. The solid geology for South Australia is from Cowley (2006a, 2006b, which also contains the legend), and the Northern Territory part is from Ahmad (2002). Black line – GOMA reflection seismic traverse; red points – sites of broadband and long-period MT data acquired by GA (combined sites denoted by prefix BL); green points – sites of long period MT data acquired by Selway (2006) and Selway et al. (2011).
10
At long-period MT sites, magnetic data were acquired in three orthogonal directions (two horizontal and one vertical) by a fluxgate magnetometer (Bartington Mag-03MS). Electric field acquisition remained the same as for broadband. The sensitivity range of the fluxgate magnetometers is 0.2−0.0001 Hz, and a 10 Hz sampling rate was used. Long-period data are used for identifying regional features in the crust and upper mantle, with a longer recording period of 5−7 days being required for the deeper signal penetration with a target depth of 150 km.
Figure 2. Example of field deployment, with the Adelaide to Darwin railway line just visible in the background. Data processing Data processing involves several standard steps, such as, the conversion of raw time-series into spectral estimates, which can then be combined to produce the complex components of the two-dimensional impedance tensor. MT time series data were processed using the robust algorithm BIRRP (Chave et al., 1987; Chave and Thomson, 2004), with remote reference data when available. The aim of the process was to remove outliers in the time-series measurements (e.g., from a passing train) and produce a robust estimation of the EM transfer functions between the electric and magnetic fields for each MT site. The data were first Fourier transformed to obtain a series of power spectral estimates from which the impedance tensor (Z) values were calculated. The apparent resistivity, and phase as a function of frequency (or period), were then derived from Z. The long period and broadband MT data of coincident location sites were merged into single responses to obtain these estimates, covering periods of 0.005 s to about 10,000 s for these sites (Figure 3). The impedance tensor values, and other fundamental quantities, are stored in a standard EDI file format. The data then can be used for inversion to produce 2-D sections displaying resistivity as a function of depth along the profile.
11
At most of the sites, good quality MT data were recorded. There are a number of factors that must be considered for the MT responses, however, such as static shift, strike direction, magnetic or electric field distortion, and noise. This is especially in the dead band periods around 0.1−10 s, so the MT data from some sites are contaminated by noise and were discarded. MT data can be affected by static shift (Jones, 1988). There are several common techniques to address static shift issues: external measurements of near surface resistivity, time-domain electromagnetic measurements and direct-current resistivity measurements. For this survey, the static shifts were solved as part of the inversion. Some of the data contain significant levels of random noise, which is evident particularly in plots showing the low coherency between the electric and magnetic fields. Such noise can result from several possible sources, such as the induction coils being moved by strong winds, which cause significant ground vibration. A modest improvement in results was obtained by use of the remote reference technique at some sites.
Figure 3. Example plots of apparent resistivity and phase from site BL03, which combines broadband and long-period frequency estimates. Circles represent Zxy and triangles Zyx. Colours represent period, from short (blue) to long (red). Dimensionality and data analysis Before MT data can be used to obtain a regional electrical resistivity model of the subsurface, it is essential to analyse the dimensionality of the data at each site. Several methods were tested in this analysis and, for practical use, two-dimensionality was assumed for at least a certain period range. This enables estimates to be obtained of the geoelectric strike direction, and its variation with increasing period (Marti et al., 2005). The phase tensor approach to MT analysis (Groom and Bailey, 1989; Bahr, 1991; Lilley, 1998a, b; Caldwell et al., 2004) is useful in helping to determine both strike and dimensionality of MT data independently of distortion effects, such as static shift. A preliminary analysis of phase tensors has been undertaken. There is a 90° ambiguity between the two possible orthogonal directions in the geoelectric strike determination by using phase tensor ellipses, and external information is required to resolve this ambiguity, for example, geological surface strike of major terrane boundaries and vertical-field magnetic induction vectors (Parkinson Arrows; Parkinson, 1959). Skew is a measure of asymmetry of a medium, a frequency-dependent 3D parameter derived from the MT transfer function (Swift, 1967; Berdichevsky and Dimitriev, 2002). Skew values
12
must approach zero for 1D or 2D structures, and imply 3D effects when greater than 0.2. Skew values for the majority of sites were generally below 0.2 in this survey, which indicates a 1D or 2D structure for these regions. The largest skew value about 10 was at frequencies less than 0.01 Hz at site BL25, which suggests three-dimensional effects, probably resulting from geological complexity at depth. The three Kao and Orr (1982) dimensionality indices D1, D2 and D3 are expected to vary from 0 to 1. For 1D structures, the condition D1>D2>D3 should be satisfied. D2 and D3 greater than 0.2 are may indicate 2D or 3D structures. For the majority of the GOMA MT sites, the Kao and Orr indices were 0.4<D1<1.0, 0.0<D2<0.5 and 0.0<D3<0.2. Although the condition D1>D2>D3 was satisfied at most of the MT sites, a 1D structure could not be assumed, as D2 values were observed to be generally greater than 0.2 at periods greater than 5 s at most sites, and at periods shorter than 5 s from sites in the southern section of the profile. Inversion and modelling The 12 combined broadband and long-period sites typically each contributed data in 40 periods to the inversion, with periods ranging from 0.005 s to 10,000 s. The remaining 15 sites recorded only broadband data, and each site contributed about 30 periods to the inversion, with periods ranging from 0.005 s to 100 s. All sites were projected onto one profile, which was chosen to be perpendicular to the estimated electrical strike, and data from all sites were rotated to the direction of electrical strike. Data points from some sites, which have scattered values or large error bars in the dead band and longer periods, were removed, as they were thought to be unreliable. The data of B10 was not included for inversion, due to poor quality electrical signal. BL25 was not included in the transverse magnetic mode (TM) for the final inversion. A preliminary 1D inversion of data from all MT sites was undertaken to provide a reasonable starting model and information useful for determining starting parameters for the 2D inversion. The inverse problem of MT is to convert a finite set of noisy MT data into a resistivity model of the subsurface of Earth. This is a nonlinear, non-unique problem. If a solution can be found, then an infinite set of models may also be found. Regularisation is generally required to find the better solution. A practical approach uses some constraints for the regularisation to find the smoothest model. A priori geological constraints should be included where possible, but is not used for the preliminary models presented here. The dimensionality analysis, described above, showed that a 2D approach is appropriate. The higher frequencies image near-surface structure, the lower frequencies are sensitive to deeper structure. The 2D modelling was carried out by using the Non-Linear Conjugate Gradient (NLCG) algorithm of Rodi and Mackie (2001). The TM mode, transverse electric mode (TE) and vertical magnetic field (Tz) data were inverted individually and together. Inversions using several different starting models, and a wide range of regularisation parameters, were tested. The effects of static shifts on the model were evaluated through using the inversion to estimate the static shift coefficients, and through the use of a large error floor to down-weight the apparent resistivities. A similar basic resistivity model was obtained in most cases. The very preliminary model (Figure 4) represents a best trade-off between data misfit and model smoothness. The roughness of the model is less than one magnitude. A low root-mean-square (rms) misfit of 2.3 was achieved by the NLCG inversion. The rms misfit for the observed data is within 2.5 overall and is within 5.18 at sites B11, B21, BL22 and BL23. Further iterations did not significantly change the model. Discussion Regional MT acquisition, with large site spacings, detects broad-scale features within the lithosphere, as shown by the modelled conductivity distribution in Figure 4. Small, near-surface, low or high resistivity anomalies can distort the MT responses, which then will not reflect accurately the regional structures. The effects of distortion in the MT responses require further investigation.
13
Horizontal smoothness, incorporated into the modelling process, attempts to provide a continuity of nearer-surface conductivity variations, where the site spacing is not adequate. Although the data have been modelled as two-dimensional, with the removal of some data analysed as three-dimensional, this is a compromise necessary at present until the data can be modelled with three-dimensional routines. Properly, 3D structures and off-profile structures should be taken into consideration.
Figure 4. Very preliminary two dimensional model of TM and TE modes for the magnetotelluric data, to a depth of 180 km, covering the southern half of the GOMA traverse. The display shows the vertical scale equal to the horizontal scale. Domains are named. Fault abbreviations: CBF - Cedric Bore Fault, KSZ – Karari Shear Zone, HCF – Horse Camp Fault, BHCF – Box Hole Creek Fault. Conclusion Geoscience Australia has acquired broadband and long-period MT data along the southern part of the GOMA reflection seismic line from Tarcoola in South Australia, parallel and close to the Adelaide to Darwin railway until just north of Coober Pedy. These data are being combined with data previously acquired by Selway (2006) and Selway et al. (2011) to the north. As shown in Figure 1, there is now coverage of MT data along most of the reflection seismic line between the northern Gawler Craton and the Musgrave Province. The GA component of the data acquisition, processing, analysis, limitations and preliminary model, has been described briefly here. Geological interpretations, incorporating the MT results, along with those from seismic, potential fields and geological observations, are reported elsewhere in this volume. Although the MT results provide evidence of some of the main subsurface electrical conductivity features along the GOMA transect, the inversion results are very preliminary. Further work is required, particularly in testing the robustness of the GA modelling, combining the two sets of the MT data, and in applying prior information from other sources, for example, the seismic interpretation and potential field models, to help constrain the inversions.
14
Acknowledgements The MT equipment deployed along the GOMA transect by GA was supplied under the ANSIR agreement. Jenny Maher and other colleagues at GA are thanked for their help in data acquisition. We thank Kate Selway from the University of Adelaide for providing her MT data, and for her useful suggestions for improvement of our work. We thank Russell Korsch, Josef Holzschuh, Tanya Fomin and Richard Blewett for their comments. References Ahmad, M., 2002. Geological map of the Northern Territory, 1:2 500 000. Northern Territory
Geological Survey. Bahr, K., 1991. Geological noise in magnetotelluric data: a classification of distortion types.
Physics of the Earth and Planetary Interiors, 66, 24-38. Berdichevsky, M.N. and Dmitriev, V.I., 2002. Magnetotellurics in the context of the theory of ill-
Posed Problems. Society of Exploration Geophysicists, Investigations in Geophysics, 11, 215 pp.
Cagniard, L., 1953. Basic theory of the magneto-telluric method of geophysical prospecting. Geophysics, 18, 605-635.
Caldwell, T.G., Bibby, H.M. and Brown, C., 2004. The magnetotelluric phase tensor. Geophysical Journal International, 158, 457-457.
Chave, A.D., Thompson, D.J. and Ander, M.E., 1987. On the robust estimation of power spectra, coherences and transfer functions. Journal of Geophysical Research, 92, 633-648.
Chave, A.D. and Thomson, D.J., 2004. Bounded influence magnetotelluric response function estimation. Geophysical Journal International, 157, 988-1006.
Cowley, W.M., 2006a. Solid geology of South Australia: peeling away the cover. MESA Journal, 43, 4-15.
Cowley, W.M., compiler, 2006b. Solid geology of South Australia. South Australia Department of Primary Industries and Resources, Mineral Exploration Data Package, 15, version 1.1.
Egbert, G.D. and Booker, J.R., 1986. Robust estimation of geomagnetic transfer functions. Geophysical Journal of the Royal Astronomical Society, 87, 173-194.
Gamble, T.D., Goubau, W.M. and Clarke, J., 1979. Magnetotellurics with a remote reference. Geophysics, 44, 53-68.
Groom, R.W. and Bailey, R.C., 1989. Decomposition of magnetotelluric impedance tensors in the presence of local three-dimensional galvanic distortion. Journal of Geophysical Research, 94, 1913-1925.
Jones, A.G., 1988. Static shift of magnetotelluric data and its removal in a sedimentary basin environment. Geophysics, 53, 967-978.
Kao, D. and Orr, D., 1982. Magnetotelluric studies in the Market Weighton area of eastern England: Geophysical Journal of the Royal Astronomical Society, 70, 323-327.
Lilley, F.E.M., 1998a. Magnetotelluric tensor decomposition: Part I, Theory for a basic procedure. Geophysics, 63, 1885-1897.
Lilley, F.E.M., 1998b. Magnetotelluric tensor decomposition: Part II, Examples of a basic procedure. Geophysics, 63, 1898-1907.
Martí, A., Queralt, P., Jones, A.G. and Ledo, J., 2005, Improving Bahr’s invariant parameters using the WAL approach: Geophysical Journal International, 163, 38-41.
Nover, G., 2005. Electrical Properties of Crustal and Mantle Rocks: A Review of Laboratory Measurements and their Explanation. Surveys in Geophysics, 26, 593-651.
Parkinson, W.D., 1959. Directions of rapid geomagnetic fluctuations. Geophysical Journal of the Royal Astronomical Society, 2, 1-14.
Rodi, W. and Mackie, R.L., 2001. Nonlinear conjugate gradients algorithm for 2-D magnetotelluric inversion. Geophysics, 66, 174-187.
Selway, K., 2006. Magnetotelluric experiments in central and southern Australia and their implications for tectonic evolution. University of Adelaide, PhD thesis (unpublished).
15
Selway, K., Hand, M., Payne, J.L., Heinson, G.S. and Reid, A., 2011. Magnetotelluric constraints on the tectonic setting of Grenville-aged orogenesis in central Australia. Journal of the Geological Society, London, 168, in press.
Simpson, F. and Bahr, K., 2005. Practical magnetotellurics. Cambridge University Press. Swift, C.M., 1967. A magnetotelluric investigation of electrical conductivity anomaly in the
southwestern United States. Massachusetts Institute of Technology, PhD thesis (unpublished).
Tikhonov, A.N., 1950. The determination of the electrical properties of deep layers of the Earth’s crust. Doklady Academii Nauk SSSR, 73, 295-297.
Vozoff, K., 1991. The Magnetotelluric Method. In: Nabighian, M.N. (ed.) Electromagnetic methods in applied geophysics. Society of Exploration Geophysicists, 641-711.
Introduction The Permian Arckaringa Basin has two major depocentres, separated by shallow basement covered by a thin veneer of the Permian sediments. The entire basin is covered by younger sediments of the Mesozoic Eromanga Basin and Cenozoic surficial cover. The two major depocentres are the Boorthanna Trough, adjacent to the Peake and Denison Ranges on the eastern basin margin, and the West, Phillipson, Penrhyn and Wallira troughs along the southern margin of the basin. The 2008 Gawler Craton-Officer Basin-Musgrave Province-Amadeus Basin seismic line (GOMA, 08GA-OM1) transects the Arckaringa Basin along the Adelaide-Alice Springs railway line (Figure 1), and crossed the West, Phillipson and Penrhyn troughs, but lies west of the Boorthanna Trough. This paper focuses primarily on the West, Phillipson and Penrhyn troughs in the southern Arckaringa Basin. The Boorthanna Trough is underlain, in part, by a thick succession of Adelaide rift sedimentary rocks, including evaporites, and salt tectonics may have influenced deposition in this area. The West, Phillipson and Penrhyn troughs are underlain by Archean to Early Mesoproterozoic rocks of the Gawler Craton (Wilgena, Christie and Coober Pedy domains, Woodhouse et al., 2010). The stratigraphy and depositional environments of the Arckaringa Basin are discussed in detail by Wopfner (1970), and the geology and resource potential of the basin are described by Hibburt (1984) and Moore (1982). Wopfner (1964) and Ludbrook (1967) considered that the marine sediments of the Arckaringa Basin were deposited in erosional features formed by glacial scour, for example, fjords. Following the acquisition of seismic and drilling data, however, Wopfner (1970) proposed that deposition occurred in graben structures. Debate over the origin of the troughs continues today – a case for both origins will be presented in this paper. Glacial interpretation for the troughs (SAM) Stratigraphy and depositional environments of the Arckaringa Basin in the Phillipson and Penrhyn troughs The Arckaringa Basin consists of three major Early Permian units, the Boorthanna, Stuart Range and Mount Toondina formations (Figure 2). The Boorthanna Formation, which possibly extends down into the Late Carboniferous, consists of a lower glacigene succession, with subsequent marine facies (PIRSA, 2010). Lithologies include diamictite, rhythmically bedded sandstone and laminated mudstone.
17
Figure 1. Map showing the outline of the Arckaringa Basin on top of the solid geology of the region covered by the GOMA seismic line (08GA-OM1) from the northern Gawler Craton to the southern Amadeus Basin, draped over a first vertical derivative image of aeromagnetic data. The solid geology for South Australia is from Cowley (2006a, 2006b, which also contains the legend), and the Northern Territory part is from Ahmad (2002). The seismic line has CDP stations labelled, and the locations of the GOMA and Arkeeta 1 drillholes are shown also.
18
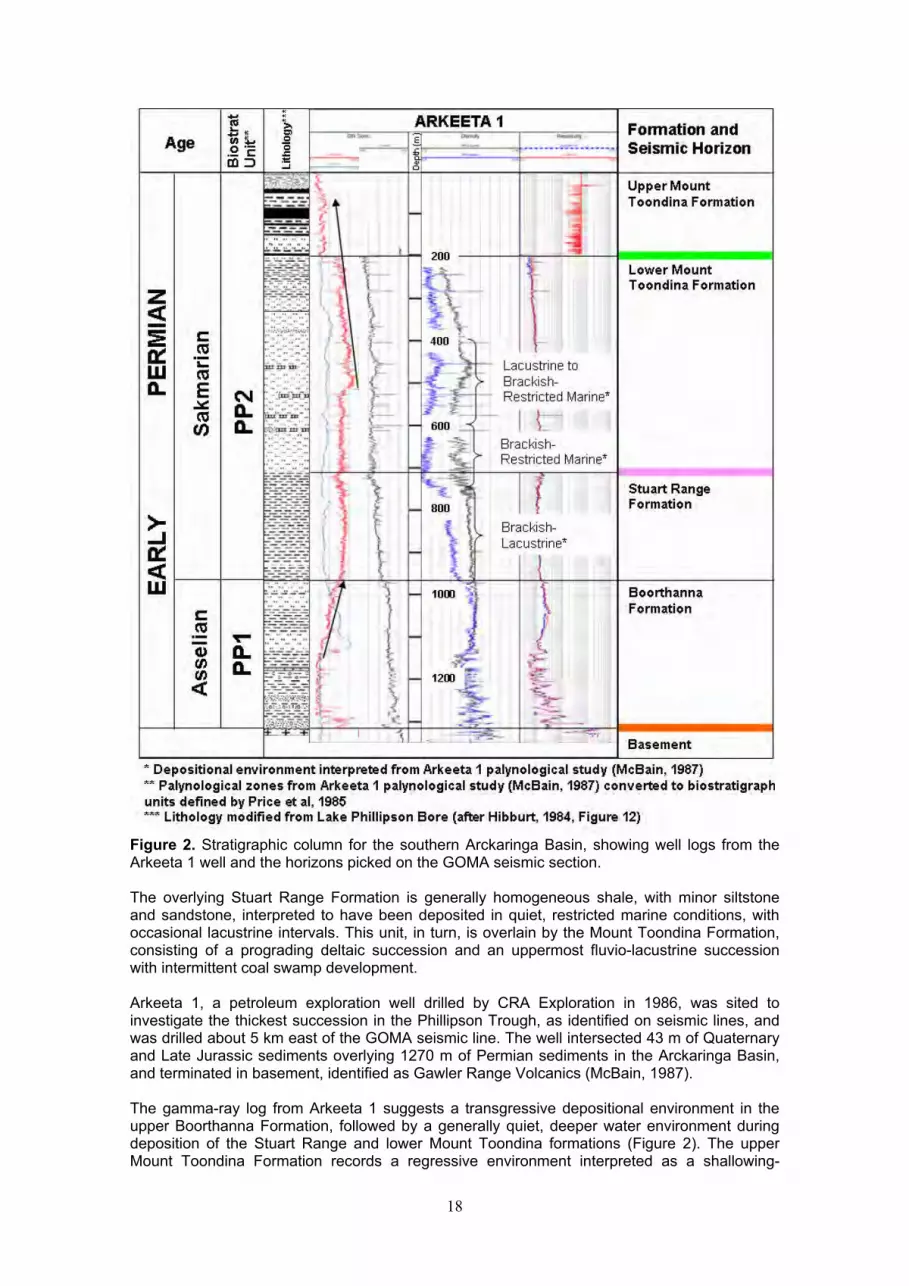
Figure 2. Stratigraphic column for the southern Arckaringa Basin, showing well logs from the Arkeeta 1 well and the horizons picked on the GOMA seismic section. The overlying Stuart Range Formation is generally homogeneous shale, with minor siltstone and sandstone, interpreted to have been deposited in quiet, restricted marine conditions, with occasional lacustrine intervals. This unit, in turn, is overlain by the Mount Toondina Formation, consisting of a prograding deltaic succession and an uppermost fluvio-lacustrine succession with intermittent coal swamp development. Arkeeta 1, a petroleum exploration well drilled by CRA Exploration in 1986, was sited to investigate the thickest succession in the Phillipson Trough, as identified on seismic lines, and was drilled about 5 km east of the GOMA seismic line. The well intersected 43 m of Quaternary and Late Jurassic sediments overlying 1270 m of Permian sediments in the Arckaringa Basin, and terminated in basement, identified as Gawler Range Volcanics (McBain, 1987). The gamma-ray log from Arkeeta 1 suggests a transgressive depositional environment in the upper Boorthanna Formation, followed by a generally quiet, deeper water environment during deposition of the Stuart Range and lower Mount Toondina formations (Figure 2). The upper Mount Toondina Formation records a regressive environment interpreted as a shallowing-
19
upward delta sequence with coals deposited at the top. A detailed palynological study of cuttings and sidewall core samples from Arkeeta 1 indicates a lacustrine to brackish-restricted marine environment during deposition of the Stuart Range Formation and lower Mount Toondina Formation. The high organic contents (TOC up to 7.4%, HI up to 654, McBain, 1987), of the upper Stuart Range Formation and lower Mount Toondina Formation, suggest anoxic bottom water conditions suitable for the preservation of organic matter. The presence of mixed lacustrine to brackish marine environments and anoxic bottom water conditions is analogous with a Baltic Sea environment, where high fresh-water runoff into a restricted seaway results in density stratification of the water column. High fresh-water runoff (including melt-water) into restricted seaways in the long, narrow troughs of the southern Arckaringa Basin is likely to have resulted in similar conditions. The Boorthanna Formation and lower Stuart Range Formation are assigned to zone PP1 (Asselian), and the upper part of the Stuart Range Formation and the Mount Toondina Formation are zone PP2 (Sakmarian) (Price et al., 1985). The succession in the Arckaringa Basin is correlated with the Merrimelia Formation, Tirrawarra Sandstone, and lower Patchawarra Formation of the Cooper Basin (Alley, 1995). The Arckaringa Basin is overlain by Late Jurassic and Early Cretaceous sediments of the Eromanga Basin. The angular nature of this contact is highlighted in cross sections constructed from extensive drilling of the Lake Phillipson Coal Deposit by the Utah Development Company (Rowlands et al., 1982).
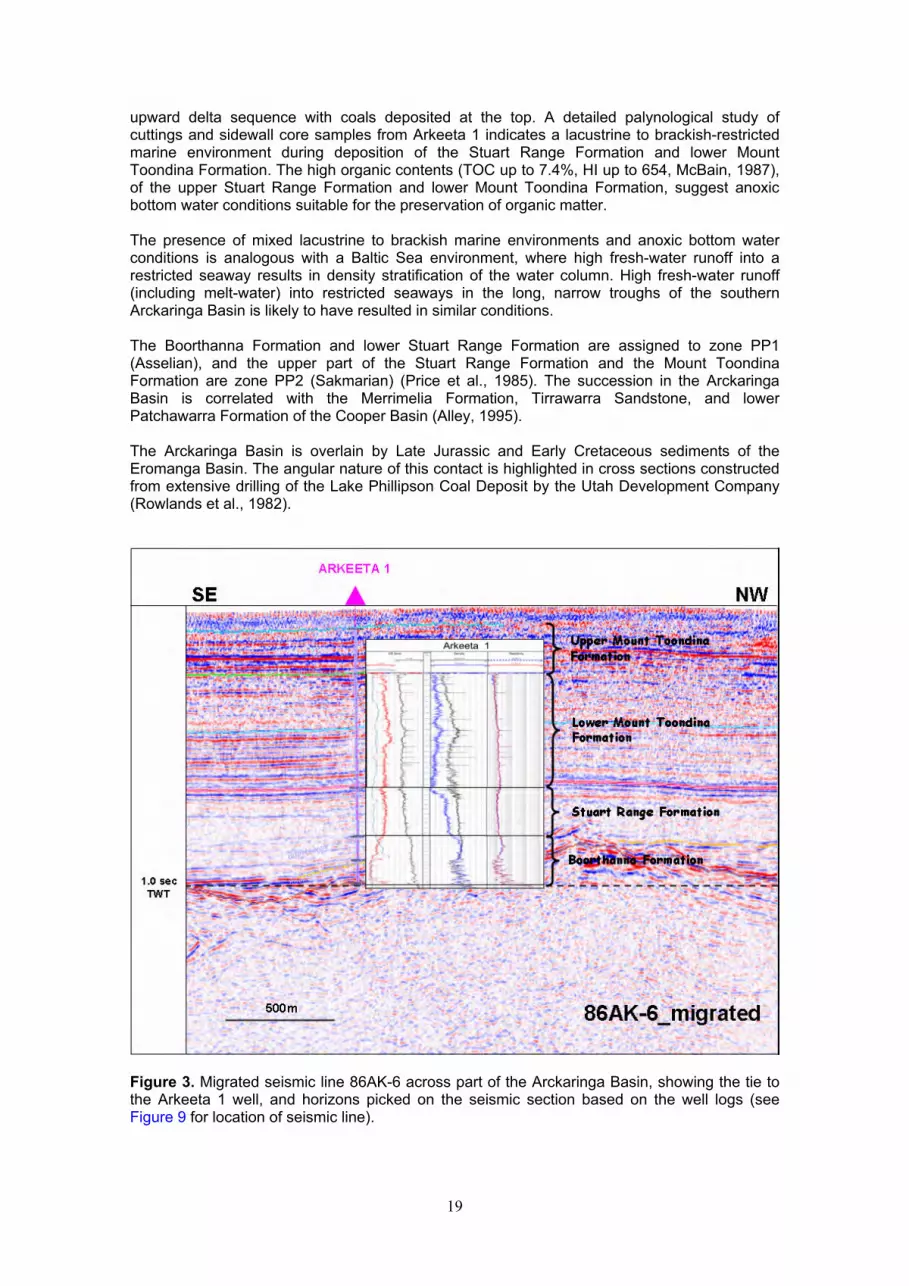
Figure 3. Migrated seismic line 86AK-6 across part of the Arckaringa Basin, showing the tie to the Arkeeta 1 well, and horizons picked on the seismic section based on the well logs (see Figure 9 for location of seismic line).
20
Figure 4. Location of troughs in the southern Arckaringa Basin, showing the inferred glacier flow direction. Interpretation of the seismic data Seismic data in the southern Arckaringa Basin include several lines of single fold data acquired by SADME in 1970, 419 line kilometres of multifold (24-375 fold) data acquired by CRA Exploration in 1985 and 1986, and the 2008 GOMA seismic line (Figure 1). Arkeeta 1 well was sited on seismic line 86AK-6 which was crossed by the GOMA line in the vicinity of CDP 9150. A checkshot survey was acquired in Arkeeta 1, and the two seismic lines tie reasonably well; hence the succession in the troughs crossed by the GOMA line can be interpreted with reasonable confidence (Figure 3). Three horizons have been interpreted with some confidence, being Basement (orange), Top Stuart Range Formation (pink) and Top Lower Mount Toondina Formation (green) (Figure 2). In addition, an intra-Mount Toondina Formation horizon (light blue) has been picked for the purposes of flattening, and a Base Mesozoic horizon has been picked to highlight the angular unconformity with the underlying succession, although this surface is too shallow to be seismically resolved. The GOMA seismic line over the southern Arckaringa Basin shows three prominent troughs, the West Trough (after Utah Development Company), Phillipson Trough and Penrhyn Trough (Figure 4). Flattening of the line on successive horizons indicates the following depositional and tectonic history (Figure 5):
21
1. Incision of deep glacial valleys. 2. Valley fill with glacial and marine sediments of the Boorthanna and Stuart Range
formations. 3. Valley fill continues, although minor contraction begins to influence deposition, as
indicated by onlap of the lowermost reflections of the Lower Mount Toondina Formation onto the Top Stuart Range horizon in the West Trough. Differential compaction of the underlying valley fill may also have influenced deposition.
4. Valley fill is completed and the Mount Toondina delta progrades out over the basin. Minor differential growth of this succession, as indicated by seismic and coal seam geometries, may be the result of ongoing minor contraction and differential compaction.
5. Contraction culminates with gentle folding of the succession, uplift and erosion. The vitrinite reflectance profile at Arkeeta 1 suggests that approximately 500 m of the Early Permian section was stripped from the centre of the Phillipson Trough. The coal seam correlations map out the subcrop relationship of the coal seams beneath the Eromanga Basin, indicating that folding and erosion occurred prior to deposition of the Eromanga Basin (Figure 6).
The absence of sediments younger than Early Permian (Sakmarian) in age suggests that the termination of deposition in the Arckaringa Basin, and gentle folding of the succession, may be related to the breaks in deposition identified in the Patchawarra Formation of the Cooper Basin (Gravestock and Jensen-Schmidt, 1998). Alternatively, the final contractional event may be related to the Daralingie unconformity between the Early and Late Permian in the Cooper Basin, or the unconformity at the top of the Cooper Basin succession, which is equivalent to the end of the Hunter-Bowen Orogeny in eastern Australia. Interpretation of five of the 1986 seismic lines in the vicinity of the GOMA line indicates a depositional and tectonic history consistent with that described for the GOMA line (Figure 7). Discussion Widespread glaciation affected Gondwana in the late Paleozoic, and glacigene sediments are widespread throughout South Australia (Figure 8). Glacigene sediments occupy glacially eroded valleys in the Troubridge Basin (e.g., Inman Valley on the Fleurieu Peninsula), and Gravestock and Jensen-Schmidt (1998) interpret the early fill history of the South Australian component of the Cooper Basin as being dominated by glacial geomorphology, rather than fault growth. Glacial erosion consists of several processes, including abrasion, plucking (quarrying), subglacial fluvial erosion, and chemical dissolution by subglacial water (Harbor, 1992). Dühnforth et al. (2010) concluded that fracture spacing in bedrock controls rates of erosion, and whether glacial quarrying or abrasion is the dominant erosion process. The preponderance of one or the other process is largely responsible for the small-scale morphology of a glacially sculpted landscape. The geology and structural features of the basement underlying the Arckaringa Basin has been interpreted from geophysical and drilling data. The location and orientation of the glacial valleys appears to be controlled, in part, by structural grain and rock types in the underlying basement (Figure 9). The three valleys crossed by the GOMA seismic line trend northwest, parallel to the Adelaidean Gairdner dolerite, dykes which intrude the Archean to Early Mesoproterozoic metamorphic rocks of the Gawler Craton (Wilgena, Christie and Coober Pedy domains). West of the GOMA seismic line, the Wallira Trough has an east-west orientation (Figure 9), and appears to be related to the shear zone between the Christie Domain to the south, and the Coober Pedy Domain to the north, referred to as the Karari Shear Zone by Korsch et al. (2010). According to Wopfner (1980), glacial pavement features and sediment transport directions indicate that the ice flow was west to northwest in the Arckaringa Basin, originating from glaciers located to the east, on the uplifted Adelaide Fold Belt. This fits with an interpretation of the three glacial valleys meeting to the west of the GOMA line to form a single valley, the Wallira Trough (Figure 4).
22
Figure 5. Interpretation of the GOMA (08GA-OM1) seismic line showing the West Trough (left) and the Phillipson Tough (right). (a) Section flattened on the Top Stuart Range horizon (pink). (b) Section flattened on the intra-Mount Toondina horizon (light blue). (c) Present day geometry (unflattened).
23
Figure 6. Map and cross section of the Lake Phillipson coal deposit in the West and Phillipson troughs. Note that north is to the top left of the map.
Figure 7. Interpretation of seismic line 86AK-7, showing the West Trough (left) and the Phillipson Tough (right). (a) Section flattened on the Top Stuart Range horizon (pink). (b) Section flattened on the intra-Mount Toondina horizon (light blue). (c) Present day geometry (unflattened). See Figure 9 for location of seismic line.
24
Figure 8. Migration of major ice centres across Gondwana from the Devonian to the Permian. The position of the South Pole is shown fort the time of the Carboniferous-Permian boundary (from Alley, 1995, and references therein). Conclusion The 2008 GOMA seismic line crosses three troughs in the southern Arckaringa Basin. Interpretation of this seismic line, and seismic lines acquired for petroleum exploration in the mid 1980s, incorporates data from the Arkeeta 1 petroleum exploration well, and the results of coal exploration drilling in the area. Deposition in the troughs records a cycle of glacial scour, deglaciation and marine transgression (Boorthanna and Stuart Range formations), quiet, deeper water deposition (lower Mount Toondina Formation) and regression (upper Mount Toondina Formation). Palynological and Rock-Eval data indicate lacustrine to brackish-restricted marine environments, with periods of anoxic bottom water conditions during deposition of the Stuart Range and lower Mount Toondina formations. This suggests a Baltic Sea analogy, where high fresh-water runoff into a restricted seaway results in density stratification of the water column. The three troughs are interpreted as glacial valleys in which glacial and marine sediments of the Boorthanna and Stuart Range formations accumulated. Minor, syndepositional contraction commencing in the Sakmarian (palynostratigraphic zone PP2), resulted in differential growth, with thinning and onlap of the Mount Toondina Formation onto basement ridges. Contraction culminated with gentle folding of the succession, uplift and erosion. The absence of sediments younger than Sakmarian in age suggests the termination of deposition in the Arckaringa Basin, and gentle folding of the succession, may be related to the breaks in deposition identified in the Patchawarra Formation of the Cooper Basin. Alternatively, the final contractional event may be related to the Daralingie unconformity between the Early and Late Permian in the Cooper Basin, or was coincident with the Mid-Triassic unconformity at the top of the Cooper Basin succession.
25
Figure 9. Location of the troughs in the southern Arckaringa Basin with underlying basement domains, Archean-Early Mesoproterozoic faults and shear zones, and the Neoproterozoic Gairdner Dolerite. Non-glacial interpretation for the troughs (RJK and LKC) Introduction The Permian Arckaringa Basin is a basin which unconformably overlies older sedimentary rocks and basement in South Australia. It variously overlies undifferentiated Cambrian to Devonian sedimentary rocks of the Warburton, Officer and Amadeus basins, and the Gawler Craton. The mostly subsurface basin consists of a wide, platform area in the north, and a series of troughs (e.g., Boorthanna and Phillipson troughs) in the south, overlain by the Jurassic to Cretaceous sediments of the Eromanga Basin. Sedimentary rocks of the Officer Basin underlie the Arckaringa Basin to the west, but, in the south and east, sediments of the Arckaringa Basin were deposited directly onto basement, as imaged by the GOMA seismic line. The basin is bounded by unconformities at its top and
26
bottom. The lowermost unit, the Boorthanna Formation, consists of shallow marine to fluvial periglacial facies. This unit is conformably overlain by marginal marine shales of the Stuart Range Formation. The Mount Toondinna Formation overlies the Stuart Range Formation, partly conformably and partly disconformably. It contains lacustrine, meandering fluvial black swamp deposits, and also coal beds (SADME, 1989). During deposition of the Arckaringa Basin, the environment progressed from glacial marine to onshore swamp and lacustrine deposits. Between 500 m and 1000 m of section are considered to have been eroded before the deposition of the Eromanga Basin, as determined by the rank of the coal seams in the Mount Toondinna Formation (PIRSA, 2010). Interpretation of the seismic data In seismic line 08GA-OM1, between CDP 7500-10290 (Figure 1), the Permian Arckaringa Basin is imaged as a series of depocentres forming the West, Phillipson and Penrhyn troughs, with a much thinner succession connecting the depocentres, and extending well to the north. To assist with the interpretation of the GOMA seismic section, information from drillholes up to 15 km away were projected onto the seismic line. Some of these drillholes intersect the Arckaringa Basin (Figure 9). The succession in the Arckaringa Basin is interpreted to contain three packages, each with distinctive seismic character. The lowermost Boorthanna Formation consists of strong, irregular reflections. The Stuart Range Formation is a package with weak reflections, consistent with this unit being dominated by shale lithologies. The uppermost Mount Toondina Formation consists of a thick package of strong, subparallel reflections, which become increasingly indistinct up section. Strong reflections of the Upper Mount Toondina Formation, at the top of the succession, are interpreted as coal measures. The GOMA seismic line crosses a large part of the Arckaringa Basin, from about CDP 5400 in the south to about CDP 20540 in the north, a distance of over 300 km (Figure 1). In the south, the GOMA seismic line intersects a 10 km wide part of the basin margin, between CDP 5400 and CDP 5900, where the Boorthanna and Stuart Range formations are over 500 m thick. From CDP 7600, northwards, the Arckaringa Basin is essentially continuous, with the exception of a basement high between CDP 10200 and CDP 11120. West Trough The GOMA seismic line crosses a 16 km wide section of the West Trough (Figure 10). In the trough, the basal Boorthanna Formation consists of a series of strong, irregular reflections, from about CDP 7850 to CDP 8650, which maintains a relatively constant thickness of about 200 ms two-way travel time (TWT, ~250 m) across the trough. This suggests that the Boorthanna Formation was deposited on a relatively flat surface. The reflections now have dips of about 20º, which is too steep for the angle of repose for clastic sediments, which is usually a maximum of about 3º. Thus, the beds have been tilted to this position after initially being deposited subhorizontally. The Stuart Range Formation consists of a package of weak reflections, which occur between the strong, irregular reflections of the underlying Boorthanna Formation and the series of strong, subparallel reflections of the Lower Mount Toondina Formation. The reflections in the Stuart Range Formation can be observed to onlap the Boorthanna Formation on both sides of the trough, indicating that the trough was actively subsiding at the time of deposition, and the trough was growing through time. This symmetrical geometry suggests that subsidence was driven by thermal relaxation, and indicates that the surface on which the Stuart Range Formation was deposited was essentially horizontal prior to subsidence and deposition of this unit. Thus, the geometry of the Boorthanna and Stuart Range Formations observed in the GOMA seismic data does not support an interpretation of incision of deep glacial valleys. Onlap onto the Boorthanna Formation continued during deposition of the lower part of the Lower Mount Toondina Formation, again indicating subsidence of the basin at this time. The upper part of the Lower Mount Toondina Formation and the Upper Mount Toondina Formation
27
predominantly have parallel reflections, indicating deposition on a relatively flat surface. Strong reflections in the Upper Mount Toondina Formation represent coal measures. There is evidence for post-depositional deformation on the northern margin of the West Trough. A series of south-dipping faults, some with rollover anticlines in the hangingwall, indicate that these are minor thrusts, which formed during a period of contraction. The trough is overlain unconformably by the Mesozoic Eromanga Basin, placing an upper limit of Jurassic for the age of the deformation.
Figure 10. Portion of the GOMA (08GA-OM1) seismic line across the West Trough, Arckaringa Basin showing (a) uninterpreted migrated seismic section, and (b) interpretation. Phillipson Trough The upper section of the Phillipson Trough is similar in appearance to the West Trough, but shows a different geometry in its lower section (Figure 11). The trough is interpreted to be fault bounded, and is possibly extensional in origin. The Boorthanna Formation is of variable thickness, but considerably thicker in the bottom of the trough, compared with the West Trough. It is possible that some of the irregular reflections in the Boorthanna Formation could represent glacial channels (compare this to those described from the Permian Grant Group, Canning Basin, by O’Brien et al., 1998, Figure 7). Nevertheless, these only have a relief of less than 200 ms TWT (~250 m). On the northern side of the trough, onlap of the Stuart Range Formation and the lower part of the Lower Mount Toondina Formation onto the Boorthanna Formation again indicates that basin subsidence was occurring during deposition of these units.
28
Figure 11. Portion of the GOMA (08GA-OM1) seismic line across the Phillipson Trough, Arckaringa Basin showing (a) uninterpreted migrated seismic section, and (b) interpretation. Penrhyn Trough In the north, the Penrhyn Trough is relatively small, about 6 km wide where it is crossed by the GOMA seismic line. It contains two basin-bounding faults on its southern margin (Figure 12). The asymmetric nature of the reflections in the Boorthanna and Stuart Range formations suggests active growth faults during deposition, and that the basin subsided due to mechanical extension at this time. Northern succession From CDP 11120, northwards, for a distance of nearly 190 km, the Arckaringa Basin is imaged in the GOMA seismic line as a relatively thin, continuous succession, up to 300 m thick (Korsch et al., 2010). The GOMA 1 and GOMA 4 drillholes (Figure 1) both intersect this part of the Arckaringa Basin, before ending in basement of the Gawler Craton (Dutch et al., 2010; Jagodzinski and Reid, 2010). The basin is overlain, for its entire length, by a thin cover (~30 to 200 m thick) of the Mesozoic Eromanga Basin and Cenozoic sediments.
29
Figure 12. Portion of the GOMA (08GA-OM1) seismic line across the Penrhyn Trough, Arckaringa Basin showing (a) uninterpreted migrated seismic section, and (b) interpretation.
30
Discussion and conclusions In the GOMA seismic section, the Arckaringa Basin is interpreted to consist of three sedimentary packages, each with distinctive seismic character. The lowermost Boorthanna Formation consists of strong, irregular reflections. The Stuart Range Formation is a package of weak reflections, whereas the uppermost Mount Toondina Formation consists of a thick section of strong, subparallel reflections, becoming increasingly indistinct up section. Strong reflections of the Upper Mount Toondina Formation, at the top of the succession, are interpreted as coal measures. In the West Trough, the Boorthanna Formation has a relatively constant thickness, indicating deposition on a relatively flat surface. The overlying Stuart Range Formation, and the lower part of the Lower Mount Toondina Formation, onlap onto the Boorthanna Formation, indicating that the basin was undergoing subsidence at this time, possibly driven by thermal relaxation. Subparallel reflections in the upper part of the Lower Mount Toondina Formation again indicate deposition on a relatively flat surface. The Phillipson and Penrhyn troughs have geometries which suggest an extensional, fault-controlled origin, at least for the lower part of the succession in the Arckaringa Basin. At some time following deposition of the Arckaringa Basin, mild deformation occurred. The rank of coals in the Upper Mount Toondina Formation, and the angular unconformity between the Arckaringa and Eromanga basins indicate that the deformation was followed by significant erosion, which removed the upper Arckaringa Basin sediments prior to deposition of the Eromanga Basin. Acknowledgements Geoscience Australia’s contribution forms part of its Onshore Energy Security Program. RJK and LKC thank Phil O’Brien and Jennie Totterdell for their comments on the seismic interpretation. We thank Bridgette Lewis and Jennie Totterdell for their reviews of the manuscript. References Ahmad, M., 2002. Geological map of the Northern Territory, 1:2 500 000. Northern Territory
Geological Survey. Alley, N.F., 1995. Late Palaeozoic – Introduction. In: Drexel, J.F. and Preiss, W.V. (eds) The
geology of South Australia. Volume 2, The Phanerozoic. South Australia Geological Survey, Bulletin 54.
Cowley, W.M., 2006a. Solid geology of South Australia: peeling away the cover. MESA Journal, 43, 4-15.
Cowley, W.M., compiler, 2006b. Solid geology of South Australia. South Australia Department of Primary Industries and Resources, Mineral Exploration Data Package, 15, version 1.1.
Dühnforth, M., Anderson, R.S., Ward, D., and Stock, G.M., 2010. Bedrock fracture control of glacial erosion processes and rates. Geology, 38(5), 423-426.
Dutch, R., Davies, M.B. and Flintoft, M., 2010. GOMA basement drilling program, northern Gawler Craton. PIRSA, Report Book, 2010/2, 228 pp.
Gravestock, D. I., and Jensen-Schmidt, B., 1998. Chapter 5: Structural Setting. In: Gravestock, D.I., Hibburt, J.E. and Drexel, J.F. (eds) Petroleum Geology of South Australia, Volume 4, Cooper Basin, pp 47-67. Primary Industries and Resources South Australia.
Hibburt, J.E., 1984. Review of Exploration Activity in the Arckaringa Basin Region 1858-1983. South Australia Department of Mines and Energy, Report Book, 84/1.
Harbor, J.M., 1992. Numerical modelling of the development of U-shaped valleys by glacial erosion. Geological Society of America Bulletin, 104, 1364-1375.
Jagodzinski, E.A. and Reid, A.J., 2010. New zircon and monazite geochronology using SHRIMP and LA-ICPMS, from recent GOMA drilling, on samples from the northern Gawler Craton. Geoscience Australia, Record, 2010/39, 108-117.
Milligan, P.R., Armit, R., Betts, P.G., Preiss, W.V. and Bendall, B.R., 2010. Geological interpretation of the deep seismic reflection and magnetotelluric line 08GA-OM1: Gawler Craton-Officer Basin-Musgrave Province-Amadeus Basin (GOMA), South Australia and Northern Territory. Geoscience Australia, Record, 2010/39, 63-86.
Ludbrook, N.H., 1967. Permian deposits of South Australia and their fauna. Transactions of the Royal Society of South Australia, 91, 65-87.
McBain, D.,1987. Arkeeta No. 1 Well Completion Report. PEL 24, South Australia. CRA Exploration Pty Limited, CRAE Report No. 302889 (unpublished).
Moore, P.S., 1982. Hydrocarbon potential of the Arckaringa region, central South Australia. Australian Petroleum Exploration Association (APEA) Journal, 22(1), 237-253.
O’Brien, P.E., Lindsay, J.F., Knauer, K. and Sexton, M.J., 1998. Sequence stratigraphy of a sandstone-rich Permian glacial succession, Fitzroy Trough, canning Basin, Western Australia. Australian Journal of Earth Sciences, 45(4), 533-545.
PIRSA, 2010. Petroleum and Geothermal in South Australia, 2010. Arckaringa Basin. Primary Industries and Resources South Australia, DVD, 22nd Edition.
Price, P.L., Filatoff, J., Williams, A.J., Pickering, S.A and Wood, G.R., 1985. Late Palaeozoic and Mesozoic palynostratigraphical units. CSR Oil and Gas Division, Report, 274/25 (unpublished).
Rowlands, N.J., Jarvis, D.M., Circosta, G., Pointon, T., Wright, P., Bateman, K.W. and Arnold, J.J., 1982. South Australian Coal Project. EL 806 – Lake Phillipson. Utah Development Company, Report No. 360, (unpublished).
SADME, 1989. Petroleum exploration opportunity north eastern Arckaringa Basin; data package brochure – area D. Department of Mines and Energy, South Australia, Envelope, 8081.
Woodhouse, A., Reid, A.J., Cowley, W.M. and Fraser, G.L., 2010. Overview of the geology of the northern Gawler Craton and adjoining Musgrave Province, South Australia. Geoscience Australia, Record, 2010/39, 47-62.
Wopfner, H., 1964. Permian-Jurassic history of the western Great Artesian Basin. Transactions of the Royal Society of South Australia, 88, 117-128.
Wopfner, H., 1970. Permian palaeogeography and depositional environment of the Arckaringa Basin, South Australia. In: Haughton, S.H. (ed.) Second Gondwana Symposium, Pretoria, South Africa, 1970, Proceedings and papers. Council for Scientific and Industrial Research, 273-291.
Wopfner, H., 1980. Development of Permian intracratonic basins in Australia. In: Cresswell, M.M. and Vella, P. (eds) Gondwana Five. Proceedings of the Fifth International Gondwana Symposium, Wellington, New Zealand, 185-190.
Introduction As part of the Onshore Energy Security Program, funded by the Australian Government over five years (2006-2011), deep seismic reflection data have been acquired across several frontier sedimentary basins to stimulate exploration for petroleum and other energy resources in onshore Australia. In 2008, Geoscience Australia, in conjunction with Primary Industries and Resources South Australia (PIRSA), AuScope and the Northern Territory Geological Survey, acquired a 634 km long deep seismic line across the northern Gawler Craton-Officer Basin-Musgrave Province-southern Amadeus Basin (GOMA, 08GA-OM1). The Officer Basin, situated between the Gawler Craton and the Musgrave Province in South Australia and Western Australia, is a Neoproterozoic to Devonian basin which formed part of the Centralian Superbasin (Walter et al., 1995). The southern, partly onlapping and partly faulted, boundary with the Gawler Craton is entirely obscured by younger sediments of the Arckaringa and Eromanga basins, as well as Cenozoic surficial cover. The northern margin of the basin was tectonically active in the latest Neoproterozoic and mid- to late Paleozoic, with major, mainly south-directed, thrusting. The GOMA seismic survey transects the eastern Officer Basin along the Adelaide-Alice Springs railway line, at a high angle to many of the basin trends and controlling tectonic features (Figure 1). Basin geology and petroleum prospectivity are described in Zang (1995) and Morton and Drexel (1997). Sedimentation in the Officer Basin was largely coeval with deposition in the Adelaide Geosyncline to the southeast and the Amadeus Basin to the north, and there was at least partial connection with these basins through much of their history. Previous seismic data have shown that, as in the Adelaide Geosyncline, there was a period of rifting and deposition of clastic, carbonate and evaporate-bearing sediments in the early Neoproterozoic history of the Officer Basin, followed by more continuous and extensive sag-phase accumulations. Unlike the Adelaide Geosyncline, however, sedimentation was not terminated by the mid-Cambrian Delamerian Orogeny, which had little effect in the Officer and Amadeus basins. Instead, the Petermann Range Orogeny at the end of the Neoproterozoic, and the Alice Springs Orogeny in the ?Silurian to Carboniferous, had profound effects on the Officer Basin. Both orogenies involved intraplate deformation on a large scale. The Petermann Orogeny was focussed mainly within the Musgrave Province, and involved several kilometres of mantle uplift in its central zone (Lambeck and Burgess, 1992).
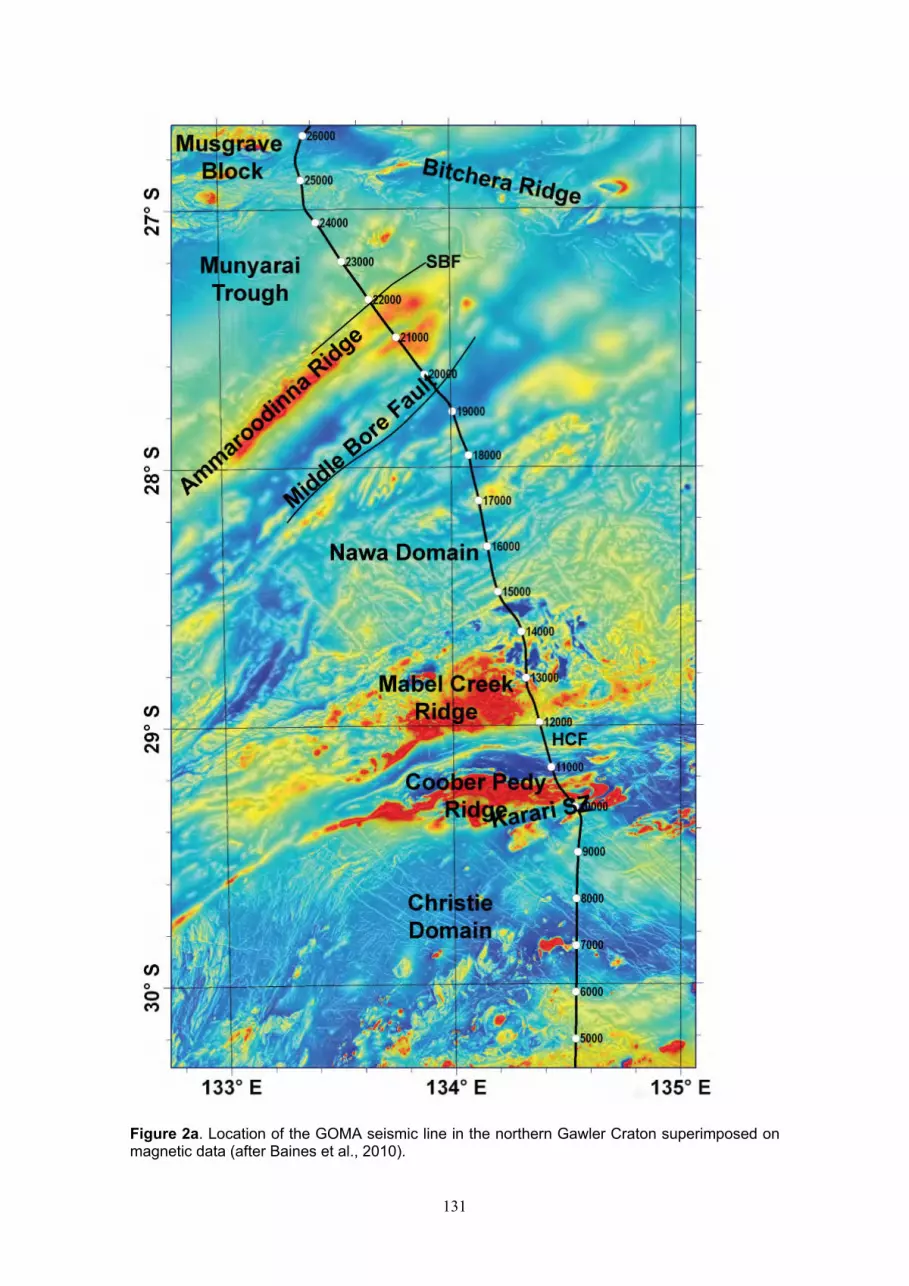
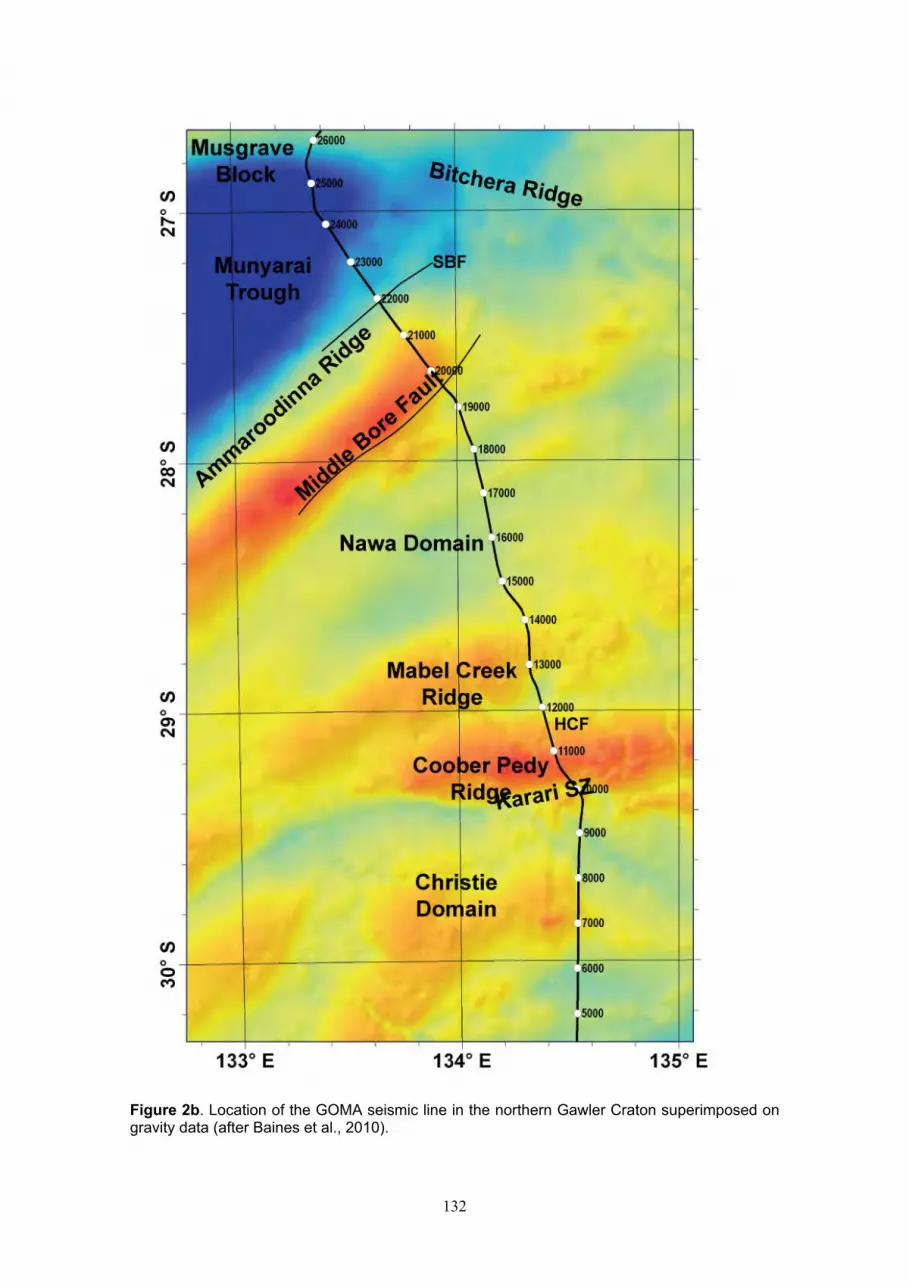
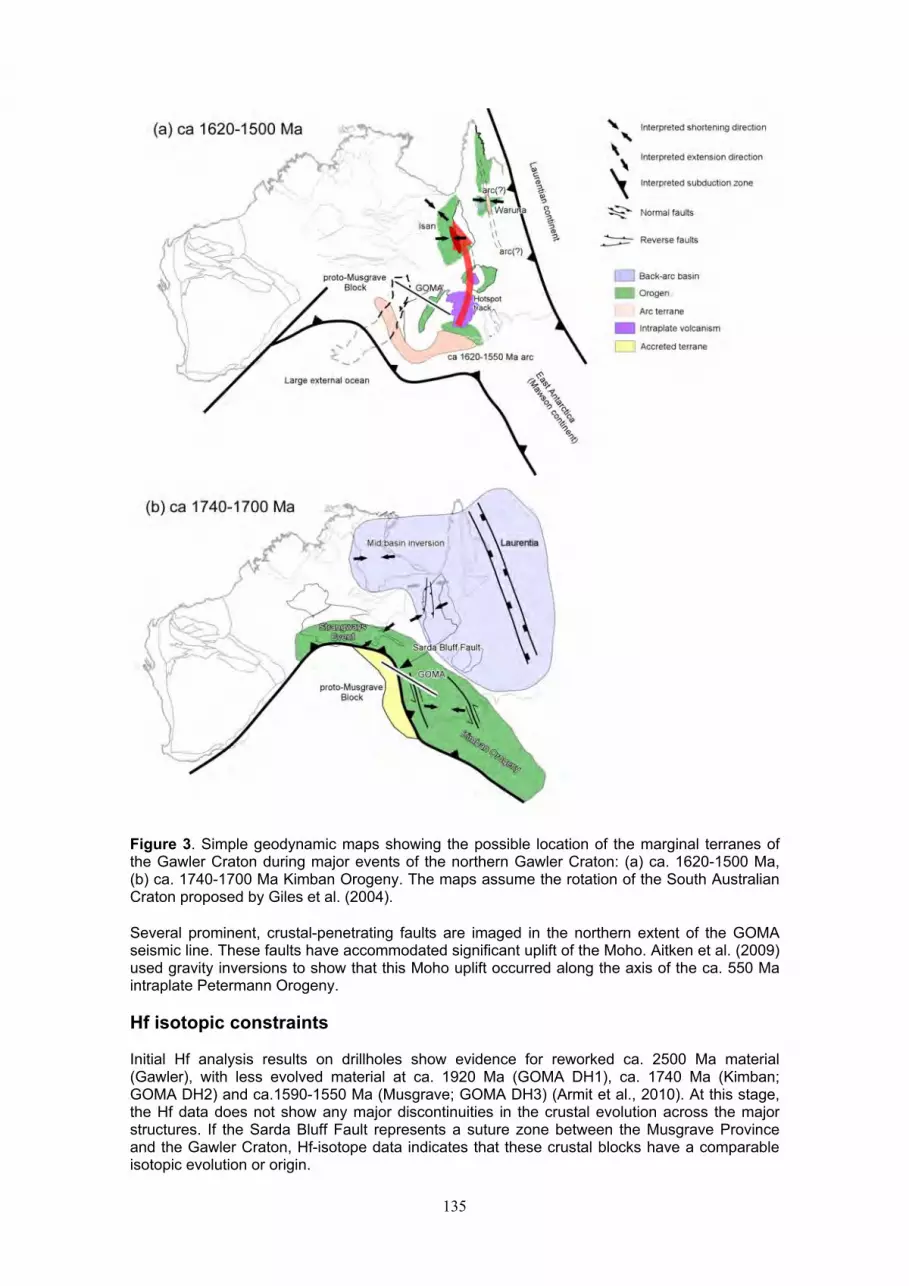
33
Figure 1. Map showing the outline of the Officer Basin on top of the solid geology of the region covered by the GOMA seismic line (08GA-OM1) from the northern Gawler Craton to the southern Amadeus Basin, draped over a first vertical derivative image of aeromagnetic data. The solid geology for South Australia is from Cowley (2006a, 2006b, which also contains the legend), and the Northern Territory part is from Ahmad (2002). The seismic line has CDP stations labelled, and the locations of the GOMA drillholes are shown also.
34
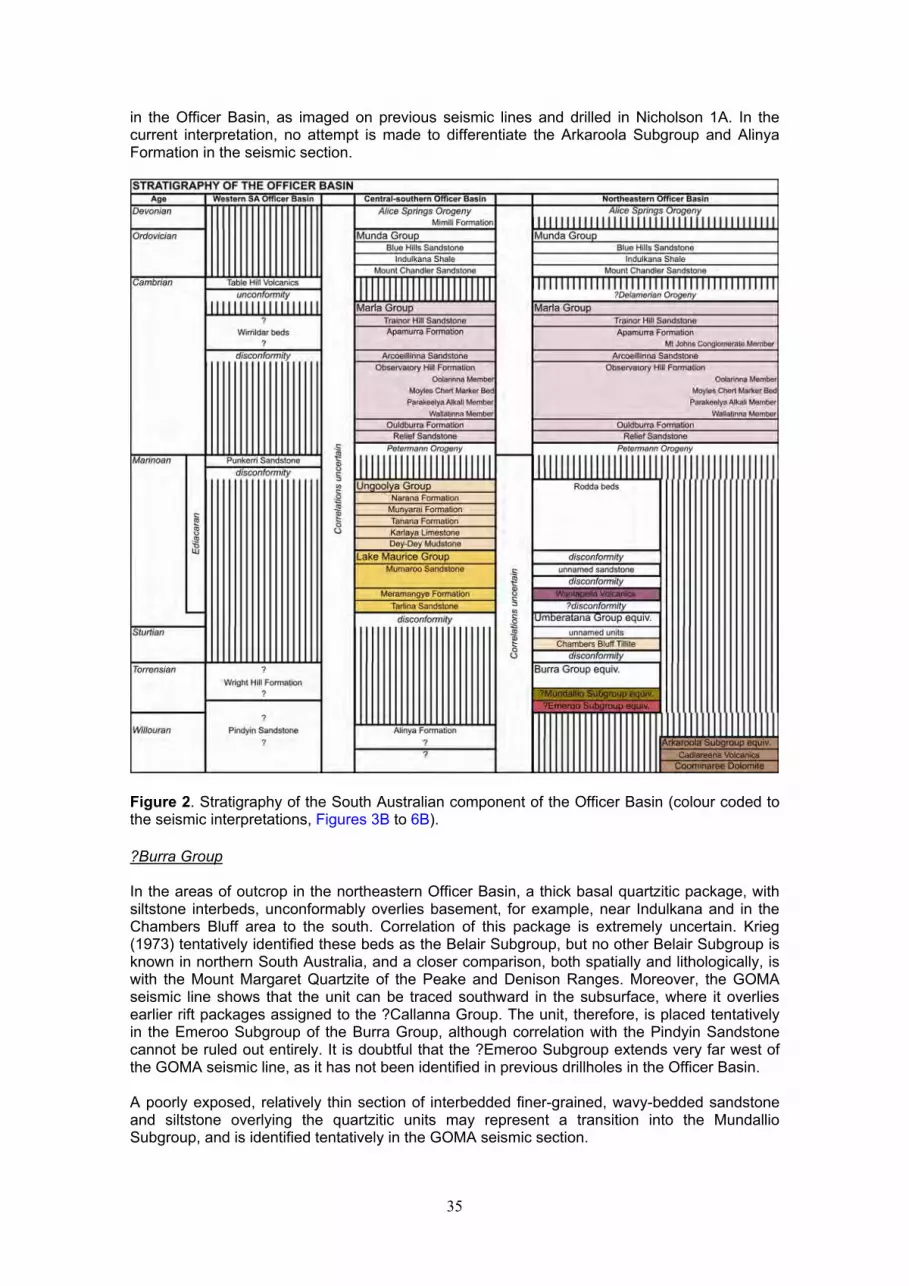
The Musgrave Province was established as a structural entity at this time, forming a barrier between the Officer Basin and the remainder of the Centralian Superbasin. South-directed thrusting, at the southern margin of the exposed part of the Musgrave Province, converted the former sag phase of the Officer Basin into a foreland basin during the latest Neoproterozoic. As deformation propagated southward from the Musgrave Province into the basin, sedimentation was temporarily terminated and there was differential erosion of various fault blocks. Sedimentation resumed in the Officer Basin, as well as in the rest of the Centralian Superbasin and the Adelaide Geosyncline, with early Cambrian transgression. The uplifted Musgrave Province continued to shed detritus to the north and south, until carbonate and finer clastic sedimentation became dominant. Ordovician sand and mud were deposited over eroded basement and basin sediments as part of the Larapinta seaway, which originally were much more extensive than the preserved remnants. Stratigraphy of the Officer Basin Basement Paleoproterozoic-Mesoproterozoic basement gneiss and granite of the Musgrave Province, discussed in a companion paper (Korsch et al., 2010), are exposed lying unconformably beneath the basal sedimentary rocks of the Officer Basin in the Indulkana area. At the southern limit of the Officer Basin, Neoproterozoic and Cambrian sedimentary rocks onlap Neoarchean to Mesoproterozoic basement of the Gawler Craton, as described by Korsch et al. (2010). The stratigraphy of the Officer Basin is summarised in Figure 2. Western Officer Basin Near the Western Australian border, the basal clastic unit of the Officer Basin is the fine- to coarse-grained, quartzose and feldspathic Pindyin Sandstone, inferred to be overlain by the Wright Hill Formation, consisting of siltstone, sandstone and oolitic chert. Correlation of these units with the eastern Officer Basin is extremely uncertain, and will not be attempted here. Sandstone at the bottom of the Giles 1 drillhole in the central-southern Officer Basin has been correlated previously with the Pindyin Sandstone (Zang, 1995) on very little evidence. Correlation of the Pindyin Sandstone with the Townsend Quartzite in Western Australia, and possibly with the Dean and Heavitree Quartzites at the base of the Amadeus Basin succession, is also speculative. The Punkerri Sandstone forms isolated outcrops, but it may correlate with the latest Neoproterozoic Pound Subgroup of the Flinders Ranges on lithostratigraphic and limited fossil evidence (Major, 1974).
Eastern and central-southern Officer Basin ?Callanna Group An early Neoproterozoic rift succession has been interpreted in previous seismic surveys, and can be identified in places at the base of the Officer Basin along the GOMA line. This package is correlated tentatively with the Callanna Group of the Adelaide Geosyncline, which was also deposited in early extensional grabens. There are very few drillhole intersections. The Arkaroola Subgroup is represented in Manya 5, drilled on an uplifted fault block, where altered basalt (Cadlareena Volcanics equivalent) overlies stromatolitic dolomite and fine-grained clastic rocks (Coominaree Dolomite equivalent) (Preiss et al., 1993). These units are inferred to extend northwestward from outcrop in the Peake and Denison Ranges, but have not been intersected in any other Officer Basin drillholes. The Alinya Formation, defined in Giles 1 drillhole (Morton and Drexel 1997), consists of siltstone, shale, dolomite and anhydrite. It may correlate with the evaporitic Curdimurka Subgroup of the Adelaide Geosyncline, and is likewise the probable source of diapiric intrusions
35
in the Officer Basin, as imaged on previous seismic lines and drilled in Nicholson 1A. In the current interpretation, no attempt is made to differentiate the Arkaroola Subgroup and Alinya Formation in the seismic section.
Figure 2. Stratigraphy of the South Australian component of the Officer Basin (colour coded to the seismic interpretations, Figures 3B to 6B). ?Burra Group In the areas of outcrop in the northeastern Officer Basin, a thick basal quartzitic package, with siltstone interbeds, unconformably overlies basement, for example, near Indulkana and in the Chambers Bluff area to the south. Correlation of this package is extremely uncertain. Krieg (1973) tentatively identified these beds as the Belair Subgroup, but no other Belair Subgroup is known in northern South Australia, and a closer comparison, both spatially and lithologically, is with the Mount Margaret Quartzite of the Peake and Denison Ranges. Moreover, the GOMA seismic line shows that the unit can be traced southward in the subsurface, where it overlies earlier rift packages assigned to the ?Callanna Group. The unit, therefore, is placed tentatively in the Emeroo Subgroup of the Burra Group, although correlation with the Pindyin Sandstone cannot be ruled out entirely. It is doubtful that the ?Emeroo Subgroup extends very far west of the GOMA seismic line, as it has not been identified in previous drillholes in the Officer Basin. A poorly exposed, relatively thin section of interbedded finer-grained, wavy-bedded sandstone and siltstone overlying the quartzitic units may represent a transition into the Mundallio Subgroup, and is identified tentatively in the GOMA seismic section.
36
Equivalents of the Umberatana Group Diamictite of inferred glacial origin overlies the interpreted Burra Group in the Chambers Bluff area with a sharp contact, inferred to be a disconformity. There is no structural discordance at this boundary. Diamictite interfingers upward with feldspathic sandstone lenses, and the whole succession has been included in the Sturtian Chambers Bluff Tillite (Krieg, 1973). The basaltic Wantapella Volcanics overlie the Chambers Bluff Tillite (Krieg, 1973). Their age is uncertain because of the lack of datable minerals or associated correlatable sedimentary rocks. If the contact with the Chambers Bluff Tillite is conformable, the basalt also may be of Sturtian age. Alternatively, Preiss et al. (1993) identified a thin, possibly basal, Tapley Hill Formation equivalent, overlain by further feldspathic sandstone, of possible Marinoan age, within the currently mapped Chambers Bluff Tillite. If this speculation is correct, the volcanics would also be Marinoan. The Wantapella Volcanics are overlain in outcrop by basalt-cobble conglomerate deposited on a down-cutting surface. It is uncertain whether this is a local feature or a regional sequence boundary. There are no other representatives of the Nepouie, Upalinna or Yerelina Subgroups of the Adelaide Geosyncline known in the Officer Basin. Clearly, there was a long hiatus in deposition in late Sturtian-early Marinoan time when these units were deposited in the Adelaide Geosyncline and, to a lesser extent, as equivalents in the Amadeus Basin (Aralka Formation, Pioneer Sandstone and Olympic Formation). Equivalents of the Wilpena Group Equivalents of the Wilpena Group are represented in the Officer Basin by the older Lake Maurice Group and younger Ungoolya Group, which have been intersected in many drillholes and extensively imaged on previous seismic sections. The Lake Maurice Group is divided into Tarlina Sandstone at the base, silty Meramangye Formation in the middle, and Murnaroo Sandstone at the top, the latter being the most widespread unit of the Lake Maurice Group. On the basis of a detailed sedimentological study by Sukanta (1993), the Ungoolya Group has been divided into the following formations, in ascending order: Dey-Dey Mudstone, Karlaya Limestone, Tanana Formation, Munyarai Formation and ?canyon-filling Narana Formation (Morton and Drexel, 1997). In an area of outcrop in the northeastern Officer Basin, the Ungoolya Group is represented by the very thick Rodda beds (about 2.7 km plus 1 km drilled in Rodda 2; Preiss and Krieg, 1992). The exposed Rodda beds are traversed by the GOMA seismic line and, thus, provide outcrop control, but so far it has not been possible to match specific units within them to the defined formations of the Ungoolya Group. The Rodda beds are dominated by dark grey to green-grey, partly calcareous siltstone deposited in relatively deep water, showing an overall upward increase in down-slope sediment slumping, including slumped limestone lenses, and an influx of poorly-sorted, coarse-grained detritus (Preiss and Krieg, 1992). Such detritus is not present in the Ungoolya Group in drillholes distal to the Musgrave Province. The Ungoolya Group correlates generally with the Bunyeroo and Wonoka formations of the Adelaide Geosyncline. Like the Wonoka Formation, the Ungoolya Group shows evidence of submarine canyon-cutting. No attempt has been made in this study to subdivide the Ungoolya Group in the GOMA seismic section. Poor exposures of siltstone and gritty sandstone at the base of the Rodda beds near Chambers Bluff overlie the basalt conglomerate (Preiss and Krieg, 1992), and could represent the Lake Maurice Group, but are too thin to resolve on the seismic section. Marla Group Early Cambrian sedimentary rocks of the Officer Basin are placed in the Marla Group (Benbow, 1982), and disconformably overlie the Ungoolya Group in outcrop and drillholes. In the Mount Johns Range northwest of Marla and west of the GOMA line, there is no significant structural discordance between the Rodda beds and the Marla Group.
37
The Marla Group commences with the Relief Sandstone, overlain by carbonates of the Ouldburra Formation, the evaporitic and organic-rich silty and sandy Observatory Hill Formation, the Arcoellina Sandstone, the calcareous and silty Apamurra Formation, and the Trainor Hill Sandstone (Benbow, 1982; Morton and Drexel, 1997). No attempt has been made to subdivide the Marla Group in the preliminary interpretation of the GOMA seismic section. Coarse- to very coarse-grained basement detritus was shed northward and southward from the Musgrave Province uplifted by the Petermann Range Orogeny. This detritus forms tongues (Wallatinna Member of the Observatory Hill Formation and Mount Johns Conglomerate Member of the Apamurra Formation) that interfinger southwards with finer-grained sediments of the Marla Group. Within the Musgrave Province, two graben structures were developed, possibly as strike-slip pull-apart basins, adjacent to the Mann Fault and related structures. The basins were filled with thick, upward-fining packages of conglomeratic and feldspathic clastic rocks, the Moorilyanna and Levenger formations (Coats, 1962; Major and Conor, 1993). Although originally considered Sturtian and of glacial origin, these units have no direct age constraints. Their facies are similar to the coarse-grained clastic wedges of the Marla Group; their preservation within the greatly uplifted and unroofed central block of the Musgrave Province suggests that they are synchronous with, or postdate, the main uplift during the Petermann Orogeny and, thus, are consistent with an early Cambrian age. Munda Group In the Indulkana Range, the Ordovician Munda Group overlies folded Neoproterozoic strata with strong angular unconformity, and also oversteps these units onto basement of the Musgrave Province. The Marla Group is absent, yet in the Mount Johns Syncline to the south, the whole succession from the Neoproterozoic to the Munda Group is complete and structurally concordant, with the only disconformities found at the base of the Marla Group and Munda Group (Benbow, 1982). The Munda Group is overlain, presumably disconformably, by the Devonian Mimili Formation, dated by fish fauna and palynology. This arkosic sandstone is the youngest unit of the Officer Basin, and was intersected in the Munyarai 1 drillhole. No Ordovician or Devonian rocks are traversed by the GOMA seismic survey. Structure of the Officer Basin Gravestock (1997) described the structural setting and history of the Officer Basin, which was further refined by Boult and Rankin (2004) using seismic, gravity and aeromagnetic data. The main depocentres are the Birksgate Subbasin and Munyarai Trough adjacent to the southern margin of the Musgrave Province, whereas the Tallaringa Trough lies along the Karari Shear Zone in the south. The Murnaroo Platform consists of thinner platform cover over the Gawler Craton in the south-central part of the basin. The Ammaroodina, Middle Bore and Nawa Ridges are northeast-trending, upfaulted, basement highs. Boult and Rankin (2004) identified sets of basement faults which were active at various times during the 450 million year history of the Officer Basin, and many of these structures can be identified in the GOMA seismic line. These include early Neoproterozoic, northwest-striking extensional faults related to the Willouran and Torrensian-age rifts of the Adelaide Geosyncline, northeast-striking, southeast-verging thrusts of the Petermann and Alice Springs orogenies, and east-southeast-striking strike-slip faults of the Alice Springs Orogeny. Although the seismic section provides no age constraint on the major thrust fault between the Musgrave Province and the Officer Basin, the outcrop geology shows that the fault is overlapped by the Munda Group, and is therefore pre-Ordovician in age (either Petermann or Delamerian orogenies). Other thrusts and gentle folding affect the whole Neoproterozoic and Paleozoic succession, and are therefore related to the Alice Springs Orogeny. Contractional deformation during the latter orogeny was focussed in the southern part of the Arunta Region and the Amadeus Basin, yet its distal effects are seen as far south as the upthrust Ammaroodinna and Nawa Ridges in the Officer Basin. This implies the existence of very shallow-dipping thrusts extending deep into the crust beneath the Musgrave Province.
38
Interpretation of the GOMA (08GA-OM1) seismic line The GOMA seismic line provides the longest single cross section of the Officer Basin available, extending from the northern margin, where the basin is overthrust by the Musgrave Province, to the southern limit of Neoproterozoic and Cambrian sedimentary rocks (Figure 1). Here, we present two, alternative interpretations (Figures 3 to 7), one by WP, which has attempted to map the stratigraphy and structure in detail, and the other by RJK and LKC, where much of the stratigraphic interpretation is accepted, but which presents a much more simplified structural interpretation. The gradual northward increase in thickness of the sediments in the basin is evident, as are the influences of at least three major episodes of faulting which have controlled and modified the basin architecture:
Willouran and Torrensian (early Neoproterozoic) extensional faulting, Latest Neoproterozoic thrusting associated with the Petermann Ranges Orogeny, and Mid-late Paleozoic thrusting associated with the Alice Springs Orogeny.
The thrusts are not thin-skinned, but are rooted in the basement, and there is no decollement within the cover succession. Many thrusts are likely to result from reactivation of Proterozoic structures in the basement. Vertical zones of interruption of otherwise continuous reflections are, in one interpretation, tentatively identified as diapirs derived from mobilisation and upward intrusion of the ?Callanna Group. There is no evidence of doming, however, above these zones (although many diapirs in the Flinders Ranges intrude by stoping rather than doming) or, alternatively, they may simply be zones of poorer data quality (Figures 3, 4). The interpretation is described from south to north along the transect, using the following seismic mapping units: basement, ?Callanna Group, ?Emeroo Subgroup, ?Mundallio Subgroup, Chambers Bluff Tillite, Wantapella Volcanics, Lake Maurice Group, Ungoolya Group, Marla Group, Moorilyanna Formation, Arckaringa Basin, Eromanga Basin and Cenozoic. The Cambrian Marla Group is interpreted to have a southern pinchout at CDP 17180, at a series of minor extensional faults, and to overstep relatively thin Ungoolya Group onto basement of the Gawler Craton at CDP 17490. The Cambrian rocks are unconformably overlain by Permian sediments of the Arckaringa Basin and the Mesozoic Eromanga Basin. An alternative interpretation includes all sediments down to about 700 ms two-way travel time (TWT) in the Arckaringa Basin, and is supported by a change in velocity at that point. In this interpretation, the southern limit of the Officer Basin is at CDP ~18270 (the Cadney Park Fault; Korsch et al., 2010). Further north, the Arckaringa Basin is much thinner, and is interpreted to cut out somewhere between CDP 20550 and CDP 20750. By contrast, the Marla Group thickens generally northward. In one interpretation, at CDP 17700, the first of a series of Willouran-aged extensional faults controls the southern limit of grabens of ?Callanna Group preserved beneath the Ungoolya Group. At about CDP 18400, a complex of extensional faults controls grabens, of inferred early Torrensian age, which contain sandy sediments of the ?Emeroo Subgroup beneath the Ungoolya Group. An alternative interpretation has the southern limit of the Officer Basin defined by the north-dipping Cadney Park Fault at CDP ~18270. Further north, at CDPs 18920 and 19570, two south-dipping extensional faults bound half-grabens in the lower part of the Neoproterozoic succession. Strong reflections within the ?Emeroo Subgroup are inferred to be due to the lithological alternation of quartzitic and silty sedimentary rocks. GOMA 3 drillhole, at CDP 22014 (Dutch et al., 2010), intersected quartzite interpreted as ?Emeroo Subgroup, and provides additional control on seismic interpretation. There was pronounced downthrow of the ?Callanna Group to the north on Torrensian-age faults in this area.
39
Figure 3. A. Uninterpreted migrated part of the GOMA seismic line between CDPs 17000 and 19000. B. Interpretation of the Officer Basin by WP. Red lines are unconformities, green lines extensional faults and blue lines Alice Springs age faults. Note early Neoproterozoic grabens and possible intrusive diapirs (alternatively simply zones of poor data). C. Interpretation of the Officer Basin by RJK and LKC. Coloured horizons are: Purple – Base ?Callanna Group; Blue – Base ?Emeroo Subgroup; Light green – Base Lake Maurice Group; Orange – Base Ungoolya Group; crimson (pink) – Base Marla Group; dark green – Base Boorthanna Formation (Arckaringa Basin); light brown – Base Stuart Range Formation (Arckaringa Basin); medium green – Base Mesozoic. Both interpretations show the major sedimentary packages – Neoproterozoic ?Callanna Group, ?Emeroo Subgroup, Lake Maurice Group and Ungoolya Group, overlain by Cambrian Marla Group and sediments of the Permian Arckaringa Basin and Mesozoic Eromanga Basin.
40
Figure 4. A. Uninterpreted migrated part of the GOMA seismic line between CDPs 19000 and 21000. B. Interpretation of the Officer Basin by WP. Red lines are unconformities, green lines extensional faults and blue lines Alice Springs age faults. Note early Neoproterozoic grabens and possible intrusive diapirs (alternatively simply zones of poor data). C. Interpretation of the Officer Basin by RJK and LKC. Coloured horizons are: Purple – Base ?Callanna Group; Blue – Base ?Emeroo Subgroup; Light green – Base Lake Maurice Group; Orange – Base Ungoolya Group; crimson (pink) – Base Marla Group; dark green – Base Boorthanna Formation (Arckaringa Basin); light brown – Base Stuart Range Formation (Arckaringa Basin); medium green – Base Mesozoic. Both interpretations show the major sedimentary packages – Neoproterozoic ?Callanna Group, ?Emeroo Subgroup, Lake Maurice Group and Ungoolya Group, overlain by Cambrian Marla Group and sediments of the Permian Arckaringa Basin and Mesozoic Eromanga Basin.
41
Figure 5. A. Uninterpreted migrated part of the GOMA seismic line between CDPs 21000 and 23000. B. Interpretation of the Officer Basin by WP. Red lines are unconformities, green lines extensional faults and blue lines Alice Springs age faults. C. Interpretation of the Officer Basin by RJK and LKC. Coloured horizons are: Purple – Base ?Callanna Group; Blue – Base ?Emeroo Subgroup; Yellow – Base ?Mundallio Subgroup; Turquoise- Base Chambers Bluff Tillite; Orange – Base Ungoolya Group; crimson (pink) – Base Marla Group; medium green – Base Mesozoic. Both interpretations show the major sedimentary packages – Neoproterozoic ?Callanna Group, ?Emeroo Subgroup, Lake Maurice Group and Ungoolya Group, overlain by Cambrian Marla Group and the Mesozoic Eromanga Basin.
42
Figure 6. A. Uninterpreted migrated part of the GOMA seismic line between CDPs 23000 and 25000. B. Interpretation of the Officer Basin by WP. Red lines are unconformities, green lines extensional faults and blue lines Alice Springs age faults. Note early Neoproterozoic grabens and possible intrusive diapirs (alternatively simply zones of poor data). C. Interpretation of the Officer Basin by RJK and LKC. Coloured horizons are: Purple – Base ?Callanna Group; Blue – Base ?Emeroo Subgroup; Yellow – Base ?Mundallio Subgroup; Turquoise- Base Chambers Bluff Tillite; Orange – Base Ungoolya Group. Both interpretations show the major sedimentary packages – Neoproterozoic ?Callanna Group, ?Emeroo Subgroup, Lake Maurice Group and Ungoolya Group.
43
Figure 7. Interpretation (A) by WP and (B) by RJK and LKC of the GOMA seismic line between CDP 25000 and CDP 26700 across the Moorilyanna Graben, which is interpreted as a strike-slip pullapart basin rapidly filled with clastic sedimentary rocks. Note that the southern boundary is a Cambrian transtensional fault which was reactivated as a thrust during the Alice Springs Orogeny. In one interpretation, possible diapirism of the ?Callanna Group into the ?Emeroo Subgroup is inferred to have nucleated along an extensional fault at CDP 18560. Alternatively, the reflections can be interpreted to represent a simple, subhorizontal succession. All units thicken northward along this part of the transect, although the ?Callanna Group is contained within separate fault-controlled troughs and is absent on intervening horsts. One early Torrensian extensional fault, at CDP 18330, appears to have been reactivated in mid-Marinoan time to form the southern limit of the Lake Maurice Group. Alternatively, this is the possible southern limit of the entire basin succession.
44
Further diapirs are interpreted to intrude up as high as the Lake Maurice and Ungoolya Groups at CDPs 18850, 19270 and 19780. No diapirs are interpreted north of this point. In the alternative interpretation, at CDP 18910, a south-dipping thrust and a north-dipping backthrust show significant uplift in the hanging wall. At CDP 19200, a rollover anticline is interpreted in the hangingwall of a north-dipping thrust. At CDP 19780, a relatively non-reflective zone is interpreted as a basement high; the southern boundary of this fault block is the Middle Bore Fault. An abrupt thickening of the Ungoolya Group at CDP 20580 is interpreted as submarine canyon fill, but alternatively, the lower resolution of the seismic reflectivity in this area suggests the possibility of a subhorizontal succession. Reverse faults, with small displacements in beds as young as Cambrian around CDP 21700 to CDP 21900, mark the southern limit of significant effects of the Alice Springs Orogeny. These can be traced into basement faults that probably had a Proterozoic history before being reactivated. More displacement occurs on a thrust fault at CDP 21900, which is interpreted to juxtapose lower Adelaidean strata against Marla Group. The upthrust block appears to show Marla Group unconformable on lower Adelaidean rocks, suggesting earlier thrusting during the Petermann Orogeny leading to stripping of the Ungoolya and Lake Maurice groups, as well as its reactivation in the Alice Springs Orogeny. A north-dipping fault at CDP 22340 appears to have an extensional displacement in the Cambrian, and marks the northern limit of the upthrust block. Ungoolya Group reappears north of this fault and is itself affected by Alice Springs-age thrusts of small to moderate displacement. South-directed displacement of the basement over the ?Emeroo Subgroup along the deeper levels of this fault suggests earlier thrusting during the Petermann Orogeny. The Ungoolya Group is interpreted to overlie Chambers Bluff Tillite, wedging in at CDP 22580 or CDP 22720, with a downcutting disconformity. An Alice Springs-age fault at CDP 22600 is interpreted to juxtapose Ungoolya Group against Marla Group, and a small popup of possible Emeroo Subgroup at CDP 22660 to 22700, or 22880, may imply some transpressional deformation on the controlling faults. Thrusts north of CDP 23100 have not been shown to displace Cambrian beds, and are suggested to form during the Petermann Orogeny, although they may also have been reactivated in the Alice Springs Orogeny. The thrusts involve duplication of the Chambers Bluff Tillite, which also shows a northward increase in stratigraphic thickness. A short segment of strong reflections at CDP 23300 to 23350 is interpreted tentatively as an erosional remnant of Wantapella Volcanics, similar to that seen in outcrop in the Chambers Bluff area. Alternatively, the reflections could represent stronger reflections within the Ungoolya Group. A small-displacement backthrust in the basement, with its tip at the basement-cover contact at CDP 23400, has caused an open hangingwall anticline above it. Between CDP 23100 and CDP 23780, the whole Neoproterozoic succession occupies a large, open syncline, with greatly thickened Ungoolya Group. Internal reflections in the Ungoolya Group show that individual packages within it thicken to the north. Small, Willouran-age extensional faults in the basement formed half-graben structures (rotating anticlockwise on the section against north-side-down faults), which were filled with ?Callanna Group. At CDPs 24170 to 24290, there is another interpreted remnant of Wantapella Volcanics, disconformably overlain by Ungoolya Group, or it could be the base of a packet of strong reflections in the Ungoolya Group. The Ungoolya Group at CDP 24290 is terminated by a system of northward-listric thrusts, which juxtapose and tectonically thicken the Chambers Bluff Tillite in the footwall of the major basement overthrust. In the subsurface, the footwall of the major thrust shows further complication, with great thickening and arching of the ?Emeroo Subgroup beneath the Chambers Bluff Tillite. This could be interpreted as a large-scale duplex, although such a structure would require much greater shortening of the ?Emeroo Subgroup than is evident in overlying rocks. Since there is no evidence of a major deformation at the Sturtian disconformity, all of the contraction is attributed to the Petermann Orogeny (or even the Delamerian Orogeny). The interpretation of a basement-cored, hangingwall anticline above lesser thrusts within the
45
?Emeroo Subgroup greatly reduces the need for tectonically thickened ?Emeroo Subgroup (Figure 3). Within the Musgrave Province, the fault-bounded Moorilyanna Graben is clearly imaged (Figure 7). The depth extent of graben fill (down to 2.7 s TWT, approximately 8 km) exceeds even the great thicknesses measured from incomplete outcrop sections (Coats, 1962). The geometry of the controlling faults is consistent with an origin as a strike-slip pullapart basin, which allowed rapid sedimentation of this thick graben fill. The southern bounding fault, the Wintiginna Fault (previously Wintiginna Lineament), is interpreted to have an Alice Springs-age thrust reactivation of an original strike-slip fault, and the succession thins to the north, away from this fault. Sheared conglomerate and siltstone adjacent to this fault is well exposed in the railway cutting adjacent to the Stuart Highway, and displays a steeply north-northwest - dipping foliation, consistent with the fault imaged on the GOMA seismic line. Small-scale folding and crenulation of the foliation suggest north-side-up, that is, thrust movement. The northern bounding fault, the Echo Fault (previously Echo Lineament), was also a strike-slip fault during basin formation during, or subsequent to, the Petermann Orogeny. The fault was reactivated as a thrust or transpressive strike-slip fault during the Alice Springs Orogeny. This is demonstrated in one interpretation, where it is shown as a flower structure, with rotation of the blocks between individual fault splays. Summary The GOMA seismic survey records a substantial part of the sedimentary and tectonic history of the Officer Basin. Rifting in the early Neoproterozoic led to formation of small half-grabens with evaporitic sedimentation, followed by more extensive clastic packages. Sturtian glacial sediments occur only in the north and thicken toward the Musgrave Province. Sag-phase sedimentation preserved in the Adelaide Geosyncline is much reduced or absent in the platformal Officer Basin, but onset of the Petermann Orogeny towards the end of the Neoproterozoic converted the platform into a deeply subsiding foreland basin. Cambrian transgression followed large-scale uplift and erosion of the Musgrave Province. Sedimentation continued intermittently until the Devonian, and was terminated by the Alice Springs Orogeny. Acknowledgements We thank Michelle Cooper and Simon van der Wielen for their reviews of the manuscript. References Ahmad, M., 2002. Geological map of the Northern Territory, 1:2 500 000. Northern Territory
Geological Survey. Benbow, M.C., 1982. Stratigraphy of the Cambrian-?Early Ordovician Mount Johns Range, NE
Officer Basin, South Australia. Transactions of the Royal Society of South Australia, 106,191-211.
Boult, P.J. and Rankin, L.R., 2004. Eastern Officer Basin – new play – sleeping giant? PESA Eastern Australian Basins Symposium II, Adelaide, 19-22 September, 2004.
Coats, R.P., 1962. Geology of the ALBERGA 4-mile military sheet. Explanation of the geological map. South Australia. Geological Survey. Report of Investigations, 22, 22 pp.
Cowley, W.M., 2006a. Solid geology of South Australia: peeling away the cover. MESA Journal, 43, 4-15.
Cowley, W.M., compiler, 2006b. Solid geology of South Australia. South Australia Department of Primary Industries and Resources, Mineral Exploration Data Package, 15, version 1.1.
Dutch, R., Davies, M.B. and Flintoft, M., 2010. GOMA basement drilling program, northern Gawler Craton. PIRSA, Report Book, 2010/2, 228 pp.
Gravestock, D.I.,1997. Geological setting and structural history. In: Morton, J.G.G. and Drexel, J.F. (eds) Petroleum Geology of South Australia. Volume 3: Officer Basin. South Australia Department of Mines and Energy Resources, Report Book, 97/19, 35-45.
interpretation of the deep seismic reflection and magnetotelluric line 08GA-OM1: Gawler Craton-Officer Basin-Musgrave Province-Amadeus Basin (GOMA), South Australia and Northern Territory. Geoscience Australia, Record, 2010/39, 63-86.
Krieg, G.W., 1973. EVERARD, South Australia, sheet SH53-13. South Australia Geological Survey, 1:250 000 series – Explanatory Notes.
Lambeck, K. and Burgess, G., 1992. Deep crustal structure of the Musgrave Block, central Australia: results from teleseismic travel time anomalies. Australian Journal of Earth Sciences, 39(1), 1-19.
Major, R.B., 1974. The Punkerri Beds. South Australia, Geological Survey, Quarterly Geological Notes, 51, 1-5.
Major, R.B. and Conor, C.H.H., 1993. Musgrave Block. In: Drexel, J.F., Preiss, W.V. and Parker, A.J. (eds) The Geology of South Australia. Volume I. The Precambrian. South Australia Geological Survey, Bulletin, 54,156-167.
Morton, J.G.G. and Drexel, J.F., editors, 1997. Petroleum Geology of South Australia. Volume 3: Officer Basin. South Australia, Department of Mines and Energy Resources, Report Book, 97/19.
Preiss, W.V. and Krieg, G.W., 1992. Stratigraphic drilling in the northeastern Officer Basin: Rodda 2 well. Mines and Energy Review, South Australia, 158, 48-51.
Preiss, W.V., Belperio, A.P., Cowley, W.M. and Rankin, L.R., 1993. Neoproterozoic. In: Drexel, J.F., Preiss, W.V. and Parker, A.J. (eds) The Geology of South Australia. Volume I. The Precambrian. South Australia, Geological Survey, Bulletin, 54, 171-203.
Sukanta, U., 1993. Sedimentology, sequence stratigraphy and palaeogeography of Marinoan sediments in the eastern Officer Basin, South Australia. Flinders University (South Australia). Ph.D. thesis (unpublished).
Walter, M.R., Veevers, J.J., Calver, C.R., and Grey, K., 1995. Neoproterozoic stratigraphy of the Centralian Superbasin, Australia. Precambrian Research, 73, 173-196.
Zang, W-L., 1995. Neoproterozoic depositional sequences and tectonics, eastern Officer Basin, South Australia. South Australia, Department of Mines and Energy, Report Book, 95/21.
47
Overview of the geology of the northern Gawler Craton and adjoining Musgrave Province,
South Australia
A. Woodhouse1, A.J. Reid 1, W.M. Cowley1 and G.L. Fraser2
1Geological Survey of South Australia, Primary Industries and Resources South
Australia (PIRSA), GPO Box 1671, Adelaide, SA 5001, Australia 2Onshore Energy and Minerals Division, Geoscience Australia, GPO Box 378,
Introduction In 2008, as part of the Onshore Energy Security Program (OESP), Geoscience Australia, in collaboration with Primary Industries and Resources South Australia (PIRSA), Auscope and the Northern Territory Geological Survey, acquired deep seismic reflection data along a north-south transect of ~634 km, through northern South Australia and into the southern part of the Northern Territory (Figures 1 to 3). The seismic line traverses two major Precambrian tectonic elements; the Gawler Craton and the Musgrave Province (Figure 1). Together, these tectonic elements occupy some ~560 000 km2, with the Gawler Craton being located solely within South Australia, whereas the Musgrave Province straddles the South Australian, Western Australian and Northern Territory borders. The Gawler Craton records a protracted history of crustal growth spanning the Mesoarchean to early Mesoproterozoic, whereas the Musgrave Province is predominantly composed of younger (Mesoproterozoic to Neoproterozoic), more isotopically juvenile material. The nature of the boundary, or transition zone, between these two major tectonic elements is poorly understood, and the deep seismic data acquired during the GOMA traverse represents a major opportunity to investigate this possible boundary. Our understanding of these tectonic elements is hindered by large portions being covered by Neoproterozoic to Pleistocene sedimentary basins, making this one of the more poorly understood regions of Australia. A significant proportion of the GOMA seismic line crosses regions in which there is little or no surface exposure of basement; consequently, what is known about large tracts of these elements comes from drillhole samples and geophysical data. Indeed, this lack of previous knowledge provides one of the reasons for the current seismic transect, and associated studies. This overview presents a review of the known geological features of the Gawler Craton and Musgrave Province, including a review of the tectonothermal history of both terranes, in order to provide a framework for interpretation of the GOMA seismic data.
Gawler Craton The Gawler Craton records a prolonged period of crustal growth, sedimentation and tectonothermal reworking, which spans over half of Earth’s history, with the oldest units having magmatic ages of ~3150 Ma, and the youngest phases of tectonic activity ceasing at ~1400 Ma. Review papers, which cover the geology of the Gawler Craton, include Daly et al. (1998), Ferris et al. (2002), Hand et al. (2007), Fraser and Reid (2007), Payne et al. (2009) and Kositcin (2010), along with Bulletin 54, The Geology of South Australia (Drexel et al., 1993). Metallogenic aspects of the Gawler Craton, with emphasis on the Mesoproterozoic Olympic Dam IOCG deposit and associated mineral systems, are well covered in Daly et al. (1998) and Skirrow et al. (2007), and references therein.
48
Figure 1. Map showing the solid geology of the region covered by the GOMA seismic line (08GA-OM1) from the northern Gawler Craton to the southern Amadeus Basin, draped over a first vertical derivative image of aeromagnetic data. The solid geology for South Australia is from Cowley (2006a, 2006b, which also contains the legend), and the Northern Territory part is from Ahmad (2002). The GOMA seismic transect is shown by the bold black line, with CDP stations marked. Yellow circles show the locations of GOMA drillholes as reported by Dutch et al. (2010) and discussed by Jagodzinski and Reid (2010). Also shown, by the hatched lines, is the domain subdivision of the northern Gawler Craton, after Ferris et al. (2002), with domain names marked.
49
Figure 2. Total magnetic intensity image (TMI) of the same area as shown in Figure 1. The GOMA seismic transect is shown by the bold black line, with CDP stations marked. Yellow circles show the locations of GOMA drillholes as reported by Dutch et al. (2010).
50
Figure 3. Gravity image of the same area as shown in Figures 1 and 2. The GOMA seismic transect is shown by the bold black line, with CDP stations marked. Yellow circles show the locations of GOMA drillholes as reported by Dutch et al. (2010).
51
Mesoarchean, ~3150 Ma basement of the Gawler Craton is represented by granitic gneisses found in outcrop on northeast Eyre Peninsula, and inferred to potentially underlie a significant portion of the eastern Gawler Craton (Fraser et al., 2010). These gneisses are overlain by Neoarchean to earliest Paleoproterozoic metasedimentary and metavolcanic rocks of the Sleaford Complex and Mulgathing Complex, which together, are the volumetrically dominant portion of Archean material within the Gawler Craton (Daly and Fanning, 1993; Swain et al., 2005a; Jagodzinski et al., 2009; Reid and Daly, 2009). These rock packages include komatiites and juvenile felsic volcanics, along with chemical and clastic sedimentary rocks (Hoatson et al., 2005; Reid et al., 2009b). Sedimentation was terminated by shortening associated with high heat flow metamorphism during the early Paleoproterozoic Sleafordian Orogeny at ~2470-2420 Ma (Jagodzinski et al., 2009). The Paleoproterozoic phase of crustal evolution within the Gawler Craton is dominated by widespread volcano-sedimentary basin formation over the interval ~1860-1730 Ma (e.g., Nawa Domain, Hutchison Group, Wallaroo Group, Parker et al., 1993; Payne et al., 2006; Fanning et al., 2007). This phase of widespread basin formation was terminated by craton-wide orogenesis, termed the Kimban Orogeny, between ~1730 and 1690 Ma. The Kimban Orogeny is manifest as regional transpressional deformation and associated granulite facies metamorphism and felsic magmatism (Moody Suite) in the southern Gawler Craton (Parker et al., 1993; Vassallo and Wilson, 2002; Dutch et al., 2008), discrete shear zones at greenschist facies in the central Gawler Craton (Daly, 1981), and widespread, high grade metamorphism in the northern Gawler Craton (Payne et al., 2006; Fanning et al., 2007; Jagodzinski and Reid, 2010). Following the Kimban Orogeny, there was a predominance of magmatism over sedimentation, with regionally significant magmatism occurring at ~1690-1670 Ma (Tunkillia Suite) and ~1630-1610 Ma (St Peter Suite, Flint et al., 1990; Swain et al., 2008). Volumetrically minor sedimentation occurred in the central Gawler Craton, with deposition of the Tarcoola Formation at ~1650 Ma, interpreted to have occurred within a narrow rift basin (Daly, 1993). Widespread early Mesoproterozoic magmatism of the Hiltaba Suite and the Gawler Range Volcanics occurred at ~1595-1575 Ma, and forms the final major phase of magmatism in the Gawler Craton. Deformation and metamorphism occurred within the Gawler Craton at around this time, as did widespread mineralising events associated with iron-oxide copper gold (IOCG) and gold-dominated mineral systems (Daly et al., 1998; Skirrow et al., 2002, 2007). Minor magmatism is recorded in the southern Gawler Craton at ~1500 Ma, with only a few instances of granites and/or pegmatites of this age being recorded (e.g., Spilsby Suite, Jagodzinski et al., 2006; Rankin et al., 2006; Fanning et al., 2007). The youngest phase of tectonism within the Gawler Craton appears to focus around ~1450 Ma, when regional cooling and/or reactivation of some of the major shear zones occurred. Fraser and Lyons (2006) provide some of the most robust data on this phase of tectonism in the western Gawler Craton, in particular the Fowler Domain, and were able to show that muscovite and K-feldspar 40Ar/39Ar ages from within shear zones are significantly younger than equivalent thermochronological ages from the blocks which occur between the shear zones. Consequently, Fraser and Lyons (2006) envisaged that this youngest phase of tectonism in the Gawler Craton was related to large-scale block shuffling, resulting from bulk transpressional deformation. Finally, we note that in the far northern Nawa Domain (Ammaroodinna Inlier, see below), Rb-Sr and K-Ar data give apparent cooling ages of ~1100-970 Ma, suggesting that there has been some effect of the Musgrave Orogeny (see below) on this portion of the northernmost Gawler Craton (Webb, 1985). Although a number of authors have suggested the Musgrave Orogeny may have had a widespread influence across the Gawler Craton (Foster and Ehlers, 1998; Teasdale, 1997; Tomkins et al., 2004), only in the Ammaroodinna Inlier have unambiguously Musgrave Orogeny isotopic ages been recorded. In other cases, the effects are subtle, being present only in the initial low temperature outgassing steps in 40Ar/39Ar step heating experiments. Therefore, although some authors have speculated that ~1190 Ma Musgrave magmatism may be present (Belousova et al., 2009), or that the Musgrave Orogeny may represent an important time for deformation within the western Gawler Craton (Teasdale, 1997), no rocks of this age have yet been dated (Fanning et al., 2007). It appears more likely that this was a time of little, if any, tectonothermal activity in the Gawler Craton, restricted to the
52
reworking at the northern margin adjacent to the Musgrave Province, as revealed by the Rb-Sr and K-Ar data from the Ammaroodinna Inlier. The Gawler Craton has been divided into a number of geological domains based on geological and geophysical data, with the domains being separated typically by major structural and/or stratigraphic breaks. The reviews by Ferris et al. (2002) and Kositcin (2010) cover the nature of each of these domains in detail. Here we focus only on the domains that are crossed by the GOMA seismic line, which are from south to north, the Wilgena, Christie, Coober Pedy Ridge and Nawa domains (Figure 1). Wilgena Domain From Tarcoola, the GOMA seismic transect runs northwards across the Wilgena Domain (Figure 1). The oldest rocks in the Wilgena Domain are Mulgathing Complex gneisses, which crop out to the south of the east-west railway line and west of the start of the GOMA transect. The Mulgathing Complex in this region consists of quartzofeldspathic gneisses, along with banded iron formations and syntectonic granites. To the south of the Wilgena Domain lies the Harris Greenstones, which contains komatiites and interlayered volcaniclastic material (Davies, 2002). Although not known from outcrop in the Wilgena Domain, it is possible that similar rock units are to be found at depth within the Mulgathing Complex in this domain. Recent geochronology on quartzofeldspathic gneiss exposed near Tarcoola indicated a maximum depositional age of 2505 ± 8 Ma, with bimodal detrital zircon age components of ~2544 Ma and ~2525 Ma (Jagodzinski et al., 2009). The restricted source material for this interpreted volcaniclastic rock is consistent with the data obtained by Swain et al. (2005a) for a similar gneiss interlayered with iron formation. These ~2500 Ma volcanosedimentary rocks were metamorphosed during the Sleafordian Orogeny between ~2475 Ma and ~2425 Ma (Jagodzinski et al., 2009). The Mulgathing Complex is overlain by Paleoproterozoic metasedimentary rocks which have been divided into three separate basin successions: the Wilgena Hill Jaspilite, Eba Formation and Labyrinth Formation, of which the latter two are relatively well constrained temporally, while the age of the first can only be inferred. The Wilgena Hill Jaspilite is the oldest unit, and is a distinctive, finely-laminated banded iron formation exposed in the vicinity of Tarcoola, and inferred to be present within the Hawks Nest and Giffen Well iron ore prospects to the northeast (Morris et al., 1998). At Hawks Nest, jaspilite is intercalated with thick packages of carbonate and quartzite, and similar successions are known from the central Wilgena Domain near the No 17 Bore Prospect (Reid et al., 2009a). The Wilgena Hill Jaspilite is of unknown age, although it overlies the Mulgathing Complex and occurs as pebbles within the basal conglomerates of the younger Eba Formation (Cowley and Martin, 1991), bracketing deposition to be younger than ~2440 Ma and older than at least ~1715 Ma (the age of the Labyrinth Formation, see below). It has been interpreted to be a correlative of the Paleoproterozoic basin successions which predate the Kimban Orogeny, such as the Hutchison Group (Daly et al., 1998). The lower age constraint for the Wilgena Hill Jaspilite is less well defined, since the Eba Formation itself has no direct geochronological constraints. The Eba Formation consists of thickly-bedded quartzite, which is pebbly in part, and is interpreted to have been deposited in a moderate energy fluvial environment (Cowley and Martin, 1991). The Eba Formation is unconformably overlain by the Labyrinth Formation, which consists of a basal chert overlain by pebbly sandstone and conglomerate (Cowley and Martin, 1991). A thin 1715 ± 9 Ma rhyolite unit occurs within the Labyrinth Formation, which constrains the timing of deposition of this unit (Fanning et al., 2007). The regional distribution of the Eba and Labyrinth formations is poorly constrained due to limited outcrop, but, at least in the case of the latter, the poor sorting and discontinuous strike lengths suggest that these basins were likely local, fault-controlled basins of limited extent (Daly et al., 1998). The youngest succession within the Wilgena Domain is the Tarcoola Formation (Daly et al., 1998). This >2000 m thick formation crops out in the vicinity of Tarcoola and consists of a basal pebbly conglomerate (Peela Conglomerate Member) overlain by quartzite (Fabian Quartzite Member) and shale (Sullivan Shale Member). Intercalated with the upper shale member are
53
altered dacitic to andesitic, water-lain tuffs, which have been dated at 1656 ± 7 Ma (Daly et al., 1998). Although 1730-1690 Ma metamorphic ages have been obtained from rocks of the northern and western Gawler Craton, the structural and metamorphic architecture of the Kimban Orogeny is not well established in the central Gawler Craton. Only the Wilgena Hill Jaspilite is inferred to have undergone deformation during the Kimban Orogeny (Parker et al., 1993), and Daly et al. (1998) inferred that the Bulgunnia Fault developed during the Kimban Orogeny. In fact, some regions of the Wilgena Domain were depocentres during the Kimban Orogeny, rather than undergoing deformation, as evidenced by the syn-Kimban age for the Labyrinth Formation. Although the structural effects of the Kimban Orogeny in the central Gawler Craton are not well established, syn-Kimban Orogeny plutonism is documented in the Wilgena Domain in the form of the ~1720 Ma Paxton Granite (Budd and Fraser, 2004) and the unnamed ~1730 Ma granite at the No 17 Bore Prospect (Reid et al., 2009a). Following the Kimban Orogeny, I-type granites of the 1690-1670 Ma Tunkillia Suite (e.g., Symons Granite, Fanning et al., 2007), were emplaced within the Wilgena Domain. The northernmost extent of granites of the Tunkillia Suite forms the boundary between the Wilgena Domain and the Christie Domain to the north. More voluminous, and metallogenically significant, magmatism occurred at ~1595-1575 Ma, with emplacement of granitoids of the Hiltaba Suite and eruption of the Gawler Range Volcanics. The Hiltaba Suite crop out as undeformed granites and are evident as oval-shaped plutons in magnetic images. The Gawler Range Volcanics occupy a large portion of the eastern Wilgena Domain, extending far to the north and are crossed by the GOMA seismic line south of the Wilgena-Christie domain boundary. Around 90 km west of CDP 5200 on the GOMA seismic line, a large ovoid pluton, evident in magnetic intensity images, corresponds to the Muckanippie Suite, and consists of anorthosite, gabbroic anorthosite and gabbro. The age of this mafic intrusion is poorly constrained, with Jagodzinski et al. (2006) inferring a maximum age for crystallisation of 1871 ± 4 Ma from only 9 zircon grains within two separate samples of metaanorthosite; further work is recommended to define the crystallisation age of this mafic intrusive complex. The Paleoproterozoic volcanosedimentary basins of the central Gawler Craton have undergone generally low-grade metamorphism during the Kararan Orogeny (~1580-1550 Ma) synchronous with emplacement of granites of the Hiltaba Suite. Syn-Hiltaba Suite fold-thrust structures within the Tarcoola Formation control the localisation of gold mineralisation at the Tarcoola Goldfield (Budd and Fraser, 2004). A flower structure is evident within the Muckanippie Suite, which is possibly Kararan in age, and related to widespread ~1580-1560 Ma deformation in shear zones across the central and western Gawler Craton (Direen et al., 2005; Swain et al., 2005b). Christie Domain The Christie Domain is dominated by the Neoarchean to early Paleoproterozoic Mulgathing Complex. The Mulgathing Complex includes metaigneous rocks and metasedimentary material, often interlayered at a variety of scales. The main stratigraphic units within the Mulgathing Complex are the Kenella Gneiss and the Christie Gneiss (Daly and Fanning, 1993), with the former being dominantly metaigneous and the latter dominantly metasedimentary-volcanic material. The Christie Gneiss includes within it a variety of sedimentary precursors, including banded iron formation, carbonate, calcsilicate and clastic to volcaniclastic material (Daly and Fanning, 1993). Importantly, the ~2 million ounce Challenger gold mine is hosted within granulite facies garnetiferous gneisses of the Christie Gneiss (Tomkins and Mavrogenes, 2002). Recent SHRIMP geochronology of the Christie Gneiss has shown that the maximum depositional age of the metasedimentary protolith in the type section at Mt Christie is 2480 ± 4 Ma (Jagodzinski et al., 2009). This is very similar to the age of the youngest zircons in a number of samples of metasedimentary material from the Mulgathing Complex (e.g., Swain et al., 2005a; McFarlane et al., 2007). The new geochronological interpretation shifts the age of deposition of the bulk of
54
the Christie Gneiss to ~2480 Ma, which is very close to the timing of the start of high grade metamorphism at ~2470 Ma during the Sleafordian Orogeny (Jagodzinski et al., 2009). Other locations within the Christie Gneiss yield slightly older maximum depositional ages; for example, samples from Golf Bore gold prospect have been deposited no earlier than 2512 ± 5 Ma (Jagodzinski et al., 2009), and weakly metamorphosed sandstone located within the Stuart Range prospect gives a unimodal age population of 2543 ± 6 Ma (Jagodzinski, 2005). These older ages suggest there that is a stratigraphic succession within the Christie Gneiss which ranges in depositional age from ~2555 Ma to as young as ~2480 Ma. Reid and Daly (2009) suggest deposition is likely to have occurred within a restricted, actively subsiding basin. A restricted marine environment is indicated by the extensive banded iron formations together with the interlayered carbonates. Based on detrital zircon populations in the gneisses, it may be that the volcano-sedimentary basin had been undergoing synsedimentary tectonism, with some exhumation of underlying strata, permitting localised sedimentary reworking of volcanic detritus (Reid et al., 2007). The Mulgathing Complex is intruded by a series of newly-recognised, broadly synsedimentary, ~2495-2480 Ma magmas of tonalite composition (Jagodzinski et al., 2009). This magmatic event is very close to the timing of the maximum depositional ages for the Christie Gneiss, and immediately predates the Sleafordian Orogeny. The Mulgathing Complex was deformed and metamorphosed during the early Paleoproterozoic Sleafordian Orogeny (Daly and Fanning, 1993). Sleafordian deformation is typically high-strain, characterised by isoclinal folding of the gneissic fabric and subsequent open, upright folding, documented at both Mt Christie (Daly and Fanning, 1993) and at Challenger (Tomkins and Mavrogenes, 2002), and observable on magnetic intensity images across the TALLARINGA and COOBER PEDY map sheets. Metamorphism reached granulite facies at both Mt Christie and Challenger. Teasdale (1997) estimated peak metamorphic conditions of the Christie Gneiss at Mt Christie to have been 750-800 °C and 4.5-5.5 kb, with cooling following an essentially isobaric path. Peak metamorphism at Challenger reached higher-grade conditions of 800-850°C and 7.5 kb (Tomkins and Mavrogenes, 2002), and it appears that much of the Christie Domain underwent high-grade metamorphism, up to granulite facies, during the earliest Paleoproterozoic. Regions of lower metamorphic grade are preserved, with one of the oldest units, the subsurface Devils Playground Volcanics (2558 ± 6 Ma, Reid et al., 2009b), being only weakly deformed, and preserving chlorite-muscovite metamorphic assemblages, indicative of greenschist facies metamorphism. The relationship between the regions of high metamorphic grade and those regions where Sleafordian metamorphic grade is much lower, is not certain, due to lack of exposure; nevertheless, Reid et al. (2007) suggested it may be transitional, and therefore reflect something of the primary orogenic architecture of the Sleafordian event. Further work on the metamorphic evolution of the Sleafordian is required to understand this event more fully. The region underwent significant reworking within major shear zones which dissect the pre-existing early Paleoproterozoic Sleafordian structures; mylonite zones are commonly observed in the field. At present, reworking of the Mulgathing Complex has only been assessed geochronologically in the vicinity of Lake Ifould on the BARTON 1:250 000 mapsheet, where high-strain deformation occurred at ~1500 Ma (Fraser and Lyons, 2006). Brittle faulting has been dated, using K-Ar on clay, at ~1405 Ma from the Challenger Mine, suggesting the region was likely to have been at a shallow crustal level by this time (Reid et al., 2010). Coober Pedy Domain The Coober Pedy Domain is separated from the Christie Domain by the Karari Shear Zone. This shear zone forms a significant boundary within the geophysical images of the Gawler Craton. The shear zone is inferred to dip steeply to the north and to have had north-side-up movement, with a component of strike-slip (Rankin et al., 1989; Direen et al., 2005).
55
Paragneisses within the Coober Pedy Domain are entirely subsurface, and include granulite-grade (up to 9 kb and 1000°C) iron formations and iron-rich metasedimentary rocks (Daly et al., 1998), which appear to have been deposited prior to the Kimban Orogeny, with maximum depositional ages of ~1750 Ma; they were metamorphosed at ~1590 Ma (Fanning et al., 2007), synchronous with emplacement of a nearby gneissic granodiorite (1589 ± 11Ma, Fanning et al., 2007), and the more widespread Hiltaba Suite and Gawler Range Volcanics. In the eastern part of the domain, a metagabbro was emplaced at 1725 ± 7 Ma, a further instance of plutonism during the Kimban Orogeny. It contains metamorphic zircon rims formed at 1566 ± 9 Ma during the Kararan Orogeny (Jagodzinski et al., 2007). Nawa Domain The following summary of the geology of the Nawa Domain is based on that provided in the report on the GOMA basement drilling program by Dutch et al. (2010). Very little is known about the geology of the basement units in the Nawa Domain, as they are extensively covered by the Neoproterozoic to Mesozoic sedimentary units of the Officer, Arckaringa and Eromanga Basins, and surficial Cenozoic sediment. Only two basement outcrops are known from within the Nawa Domain, the Yoolperlunna and Ammaroodinna Inliers in the far north of the domain. There are also relatively few basement-intersecting drillholes in the region, with 80 drillholes in total, including 32 diamond drillholes. Most of these diamond drillholes are <10m long diamond tails on the end of exploration percussion or rotary mud drillholes. The Nawa Domain consists of metamorphosed mudstone to sandstone units, and also includes the iron-rich Moondrah Gneiss, iron formation, carbonate and granitic-gneiss (Parker et al., 1993; Daly et al., 1998). A recent provenance study, conducted using metasedimentary units from the Nawa Domain, showed that the sediments contained little or no Archean detritus, and appear to be derived from a terrain more juvenile than the Gawler Craton, possibly the Arunta Region in central Australia (Payne et al., 2006). Maximum depositional ages suggest that these metasedimentary units were deposited between ~1750 and 1720 Ma, immediately prior to the Kimban Orogeny (Payne et al., 2006, 2008; Jagodzinski and Reid, 2010). Possible basement to these ~1750-1720 Ma metasedimentary successions is poorly constrained. No definitive geochronology has emerged which shows an older basement. Pb-Pb dating of zircons from the Moondrah Gneiss within the Ooldea 3 drillhole gave an age of 2424 ± 6 Ma (Teasdale, 1997); SHRIMP dating from the same drillhole by Fanning et al. (2007), however, failed to yield zircons older than ~1715 Ma, and were interpreted to reflect detrital components within a 1659 ± 6 Ma gneiss. The metamorphic grade of the Nawa Domain is variable, ranging from greenschist facies schist to granulites, including the ultra-high temperature quartz-sapphirine-bearing granulites of the Moondrah Gneiss from the Ooldea DDH2 drillhole (Teasdale, 1997; Daly et al., 1998; Payne et al., 2008). The Nawa Domain has experienced several metamorphic and igneous events:
1. an interpreted igneous crystallisation age of 1740 ± 31 Ma has been obtained from a granitic gneiss from the Yoolperlunna Inlier (Fanning et al., 2007),
2. the 1730–1690 Ma Kimban Orogeny (Payne et al., 2008; Jagodzinski and Reid, 2010), 3. the ~1660 Ma Ooldean Event in the Moondrah Gneiss (Teasdale, 1997; Fanning et al.,
2007; Dutch and Hand, 2009), 4. the ~1580–1550 Ma Kararan Orogeny (Daly et al., 1998, Payne et al., 2008), which
occurred synchronously with both felsic and mafic magmatism (Jagodzinski and Reid, 2010),
5. reactivation of existing structures at ca. 1450 Ma (Fraser and Lyons, 2006), and, 6. the very small Ammaroodinna Inlier exposes weathered schist, gneiss and granitic
rocks. A K-Ar cooling age of 1104 Ma (Webb, 1985), was obtained on muscovite from a granitic gneiss. This is the only rock in the Gawler Craton to unambiguously record the effects of the Musgrave Orogeny (~1200-1160 Ma).
56
Recent SHRIMP geochronology from the GOMA drilling program in the Nawa Domain has identified a new magmatic episode, with a granite from GOMA DDH 1, in the northern Coober Pedy Domain, yielding a crystallisation age of ~1920 Ma. Rocks of this age are previously unknown from the Gawler Craton (Jagodzinski and Reid, 2010). Furthermore, SHRIMP zircon data from a biotite–quartz–feldspar paragneiss from GOMA DDH 4, located north of the Mabel Creek Ridge, indicate a wide age range of Archean provenance from 3170-2680 Ma, a major cluster between 2590-2490 Ma and a maximum depositional age of ~2460 Ma (see Jagodzinski and Reid, 2010). This sample may indicate that the metasedimentary rocks of the southern Nawa Domain, at least, rest upon a Neoarchean to early Paleoproterozoic basement, and, possibly, are equivalent in age to the Mulgathing Complex (Jagodzinski and Reid, 2010). Yoolperlunna and Ammaroodinna Inliers The Yoolperlunna and Ammaroodinna Inliers are small, isolated basement outcrops within the eastern Officer Basin, providing a window into the basement between the Gawler Craton and the Musgrave Province. Granitic gneiss from the Yoolperlunna Inlier yields a magmatic crystallisation age of 1738 ± 17 Ma (Fanning et al., 2007), of similar age to widespread magmatism within the Gawler Craton. Recent geochronology from a sample of sillimanite-bearing metasedimentary rock from GOMA DDH 2, close to the Yoolperlunna Inlier, yielded a maximum depositional age of ~1745 Ma, whereas metamorphic monazites from the same sample are slightly younger at ~1735 Ma, indicating a narrow interval in which deposition occurred (see Jagodzinski and Reid, 2010). This suggests affinities with the Gawler Craton to the south rather than the Musgrave Province to the north. The Ammaroodinna Inlier consists of biotite-muscovite schist, gneiss and granitoids (Krieg, 1993) of unknown age. Musgrave Province The Musgrave Province is a Mesoproterozoic to Neoproterozoic high-grade metamorphic belt located at the junction between the three older and thicker cratonic blocks of the Northern, Southern and Western Australian Cratons (Myers, 1990). The province is composed predominantly of amphibolite-granulite facies gneisses, which formed during the Musgrave Orogeny (ca. 1200-1160 Ma), intruded by voluminous syntectonic granites of the Pitjantjatjara Supersuite (ca. 1200-1140 Ma), and magmatic rocks associated with the Giles Event (ca. 1080-1040 Ma), then subsequently reworked during the high-strain, low-temperature intracratonic Petermann Orogeny at ca. 570-530 Ma (Major and Conor, 1993; Camacho and Fanning, 1995; Glikson et al., 1996; Scrimgeour and Close, 1999; Edgoose et al., 2004; Wade, 2006). The age and tectonic setting of the Musgrave Province prior to the Musgrave Orogeny is the subject of ongoing research and debate. In particular, the spatial, temporal and tectonic relationship between protoliths of the Musgrave Province and rocks from the northern Gawler Craton remains uncertain, where orogenic events experienced in the Musgrave Province are distinctly younger than tectonothermal events known to have affected the Gawler Craton to the south. Investigating this uncertainty was a major objective for the GOMA seismic line. Recent models advocating a Mesoproterozoic (~1550 Ma) magmatic arc origin for the oldest Musgrave protoliths (Wade et al., 2006; Payne et al., 2009) imply the presence of a relic suture zone either north or south of the Musgrave Province. A comprehensive review of the geology of the Musgrave Province can be found in Wade et al. (2008), with more recent work summarised in Smithies et al. (2008, 2010). The GOMA transect crosses the eastern edge of the Musgrave Province, where a reconnaissance TerraneChron TM study (Gum, 2006) identified an abundance of 2800 Ma aged zircons in modern drainage systems proximal to the town of Indulkana. This suggestion of the presence of evolved Archean crust is in strong contrast to the comparatively more juvenile character which dominates the remainder of the province and is, as yet, unexplained. The limited number of robust geochronological studies, combined with the pervasive effects of the Musgrave Orogeny, hinder our current understanding of the crustal evolution of the province pre-1200 Ma (Smithies et al., 2008; Wade et al., 2008). On a regional scale, the subdivision of sedimentary and igneous protoliths to these metamorphic rocks is not feasible, although some broad stratigraphic relationships have been resolved. The oldest exposed magmatic protoliths
57
are the ca. 1600-1540 Ma orthogneisses identified in the NT and SA (referred to as the Musgravian gneiss in the NT), which are dominated by felsic gneiss with granitic and possible volcanic precursors (Maboko et al., 1991; Camacho and Fanning, 1995; Edgoose et al., 2004). These orthogneisses have relatively juvenile Nd isotopic compositions (εNd(1600) +1 to -1), compared with similar aged rocks elsewhere in Proterozoic Australia, including the Gawler Craton, and have been suggested to have formed in an island arc setting (Wade et al., 2006). Metasedimentary rocks occur in the South Australian and Western Australian portions of the Musgrave Province, although published data currently only exist for successions from the western and eastern extents. Detrital zircons typically give Paleo-Mesoproterozoic ages, with maximum depositional ages around ca. 1400-1350 Ma (Wade, 2006; Evins et al., 2007). The successions are often interlayered with felsic, mafic and calcsilicate gneisses, and have been interpreted to represent a metavolcanic succession (Conor, 1987). Sm-Nd isotopes suggest that the majority of metasedimentary rocks are, on average, derived from relatively juvenile sources with εNd(1400) of +3 to -5 (Wade, 2006; Smithies et al., 2008), with the exception of the Latitude Hills in the western Musgrave Province, which have been derived from significantly more evolved crust, with εNd(1400) of -12 to -15 (Smithies et al., 2008). Historically, these metasedimentary rocks have been considered to have potential to host Broken Hill-type base metal mineralisation (Conor, 1987; Woodhouse and Gum, 2003), with copper sulfide mineralisation identified in small strata-bound deposits in granulites in the eastern Musgrave Ranges (Conor, 1987). Deformed granitoid intrusions, with protolith ages around ca. 1300 Ma, were identified originally in the Tomkinson Ranges in the western Musgrave Province (Gray, 1978; White et al., 1999), with more recent work by the Geological Survey of Western Australia confirming that the ca. 1330-1290 Ma Wankanki Supersuite is volumetrically significant. These orthogneisses consist of a series of calcalkaline, I-type granites, which may reflect magmatism within a continental arc, or remelts of earlier, arc related crust (Smithies et al., 2008, 2010). In the western Musgrave Province, the Wankanki Supersuite is observed often to intrude the metasedimentary packages. The Musgrave Province underwent regional, upper-amphibolite to granulite facies metamorphism during the Musgrave Orogeny (ca. 1200-1160 Ma) which was associated with the widespread intrusion of voluminous syntectonic granites of the Pitjantjatjara Supersuite at ca. 1220-1140 Ma (Major and Conor, 1993; Camacho and Fanning, 1995; Glikson et al., 1996; Scrimgeour and Close, 1999; Edgoose et al., 2004; Wade, 2006; Smithies et al., 2010). The Pitjantjatjara Supersuite is characterised by an anhydrous, relatively Ti- and P-rich charnockite series, indicative of very high intrusion temperatures (>1000°C), which persisted at the level of granite emplacement more or less continuously for ~80 Ma (Kelsey et al., 2010; Smithies et al., 2010). The tectonic setting of the Musgrave Orogeny remains unclear, although the long lived, pervasive nature of this event, and associated high-temperature granitic intrusions, have led to the suggestion that the orogeny may have been characterised by a restricted extensional and/or upwelling zone within an intracontinental setting (Kelsey et al., 2010; Smithies et al., 2010). The Musgrave Orogeny was followed shortly afterwards by the Giles Event (1080-1040 Ma), predominantly a bimodal igneous event, accompanied by localised granulite facies metamorphism, and the development of vertical high-strain zones. The event was characterised by the emplacement of large, layered, mafic-ultramafic intrusions of the Giles Complex (ca. 1075 Ma) in the central and western Musgrave Province (Glikson et al., 1996; Sun et al., 1996), widespread intrusion of the Alcurra Dolerite (Zhao and McCulloch, 1993; Edgoose et al., 2004), small volumes of felsic intrusives and the deposition of coeval bimodal volcanics and rift-related sediments of the Tjauwata Group and Bentley Supergroup (ca. 1080-1040 Ma), which are preserved on the northwestern and southwestern margins respectively (Zhao and McCulloch, 1993; Sheraton and Sun, 1995; Glikson et al., 1996; Sun et al., 1996; Scrimgeour and Close, 1999; Edgoose et al., 2004). The layered intrusives of the Giles Complex are host to the Babel-Nebo Ni-Cu-PGE deposit in the western Musgrave Province (Seat et al., 2007, 2009) and are considered highly prospective for Ni, Cu, Cr and PGE mineralisation (Woodhouse and Gum, 2003; Gum and Katona, 2010).
58
The intrusion of mafic dyke swarms of the Amata Dolerite at ca. 820 Ma is the youngest recognised magmatic event in the province, and are considered to be equivalent to dykes of the ca. 820 Ma Gairdner Dolerite, which intrude the eastern Gawler Craton (Zhao and McCulloch, 1993; Zhao et al., 1994; Glikson et al., 1996). The youngest phase of tectonism in the Musgrave Province occurred at ca. 620-530 Ma, during the Petermann Orogeny, which was a high-strain, low-temperature event, characterised by crustal-scale mylonitic structures, which were associated with the uplift and exhumation of the province (Hand and Sandiford, 1999; Scrimgeour and Close, 1999; Edgoose et al., 2004). The Petermann Orogeny led to the present east-west dominated structural architecture of the Musgrave Province. Interpreted ?Cambrian conglomerate, sandstone, siltstone and shale are preserved in the downfaulted Levenger and Moorilyanna Grabens in the eastern part of the Musgrave Province; the latter is crossed by the GOMA transect (Preiss et al., 2010).
Acknowledgements This review covers an enormous amount of Southern Australian geology, and we would like to acknowledge the work of the many geologists, industry, academic and government, who have contributed to the incremental construction of the picture we have attempted to present here. Our thanks to Russell Korsch and others at Geoscience Australia for their expertise in introducing us to seismic interpretation, many discussions on the geology of Southern Australia, and preparation of the figures. AW and AR would also like to specifically acknowledge Martin Hand and Karin Barovich from the University of Adelaide for their support and discussions. References Ahmad, M., 2002. Geological map of the Northern Territory, 1:2 500 000. Northern Territory
Geological Survey. Belousova, E.A., Reid, A., Griffin, W.L. and O'Reilly, S.Y., 2009. Rejuvenation vs. recycling of
Archean crust in the Gawler Craton, South Australia: Evidence from U–Pb and Hf isotopes in detrital zircon. Lithos, 117, 570-582.
Budd, A.R. and Fraser, G.L., 2004. Geological relationships and 40Ar/39Ar age constraints on gold mineralisation at Tarcoola, central Gawler gold province, South Australia. Australian Journal of Earth Sciences, 51, 685-700.
Camacho, A. and Fanning, C.M., 1995. Some Isotopic Constraints on the Evolution of the Granulite and Upper Amphibolite Facies Terranes in the Eastern Musgrave Block, Central Australia. Precambrian Research, 71, 155-181.
Conor, C.H.H., 1987. The geology of the Eateringinna 1:100 000 sheet area eastern Musgrave Block, South Australia. University of Adelaide, Msc Thesis (unpublished).
Cowley, W.M., 2006a. Solid geology of South Australia: peeling away the cover. MESA Journal, 43, 4-15.
Cowley, W.M., compiler, 2006b. Solid geology of South Australia. South Australia Department of Primary Industries and Resources, Mineral Exploration Data Package, 15, version 1.1.
Cowley, W.M. and Martin, A.R., 1991. Geology of the Kingoonya 1:250 000 map sheet area. Department of Mines and Energy, South Australia, Report Book, 91/041, 203pp.
Daly, S.J., 1981. Stratigraphy of the TARCOOLA 1:250 000 map sheet area: South Australia. Department of Mines and Energy, Report Book, 81/5.
Daly, S.J., 1993. Tarcoola Formation. In: Drexel, J. F., Preiss, W. V. and Parker, A. J. (eds) The geology of South Australia; Volume 1, The Precambrian. Geological Survey of South Australia, Bulletin, 54, 68-69.
Daly, S.J. and Fanning, C.M., 1993. Archaean. In: Drexel, J. F., Preiss, W. V. and Parker, A. J. (eds) The geology of South Australia; Volume 1, The Precambrian. Geological Survey of South Australia, Bulletin, 54, 32-49.
Daly, S.J., Fanning, C.M. and Fairclough, M.C., 1998. Tectonic evolution and exploration potential of the Gawler Craton, South Australia. AGSO Journal of Australian Geology and Geophysics, 17, 145-168.
59
Davies, M.B., 2002. Harris Greenstone Domain bedrock drilling, May-August 2001: South Australia. Department of Primary Industries and Resources, Report Book, 2002/11.
Direen, N.G., Cadd, A.G., Lyons, P. and Teasdale, J.P., 2005. Architecture of Proterozoic shear zones in the Christie Domain, western Gawler Craton, Australia: Geophysical appraisal of a poorly exposed orogenic terrane. Precambrian Research, 142, 28-44.
Drexel, J.F., Preiss, W.V. and Parker, A.J., editors, 1993. The Geology of South Australia: Volume 1, The Precambrian. Geological Survey South Australia, Bulletin, 54.
Dutch, R., Hand, M. and Kinny, P.D., 2008. High-grade Paleoproterozoic reworking in the southeastern Gawler Craton, South Australia. Australian Journal of Earth Sciences, 55, 1063-1081.
Dutch, R.A. and Hand, M., 2009. EPMA monazite geochronological constraints on the timing of ultra-high temperature reworking in the western Gawler Craton: South Australia. Department of Primary Industries and Resources, Report Book, 2009/2.
Dutch, R., Davies, M. and Flintoft, M., 2010. GOMA basement drilling program, northern Gawler Craton: South Australia. Department of Primary Industries and Resources, Report Book, 2010/2.
Edgoose, C.J., Scrimgeour, I.R. and Close, D.F., 2004. Geology of the Musgrave Block, Northern Territory. Northern Territory Geological Survey, Report, 15.
Evins, P.M., Smithies, H., Bodorkos, S. and Howard, H., 2007. Blame it on the Mann, differences across the Mann Fault, West Musgrave Complex. In: Deformation in the Desert. Alice Springs, Northern Territory. Geological Society of Australia, Specialist Group in Tectonics and Structural Geology, p.36.
Fanning, C.M., Reid, A. and Teale, G., 2007. A geochronological framework for the Gawler Craton, South Australia. South Australia Geological Survey, Bulletin, 55.
Ferris, G.M., Schwarz, M.P. and Heithersay, P., 2002. The geological framework, distribution and controls of Fe-oxide and related alteration, and Cu-Au mineralisation in the Gawler Craton, South Australia. Part I: geological and tectonic framework. In: Porter, T.M. (ed.) Hydrothermal iron oxide copper-gold and related deposits: A global perspective. Porter GeoConsultancy Publishing, Adelaide, 9-31.
Flint, R.B., Rankin, L.R. and Fanning, C.M., 1990. Definition; the Palaeoproterozoic St. Peter Suite of the western Gawler Craton. Geological Survey of South Australia Quarterly Geological Notes, 114, 2-8.
Foster, D.A. and Ehlers, K., 1998. 40Ar/39Ar thermochronology of the southern Gawler Craton, Australia; implications for Mesoproterozoic and Neoproterozoic tectonics of East Gondwana and Rodinia. Journal of Geophysical Research, B, Solid Earth and Planets, 103, 10177-10193.
Fraser, G. and Lyons, P., 2006. Timing of Mesoproterozoic tectonic activity in the northwestern Gawler Craton constrained by 40Ar/39Ar geochronology. Precambrian Research, 151, 160-184.
Fraser, G., McAvaney, S., Neumann, N., Szpunar, M. and Reid, A., 2010. Discovery of early Mesoarchean crust in the eastern Gawler Craton, South Australia. Precambrian Research, 179, 1-21.
Fraser, G.L. and Reid, A.J., 2007. Time-Space evolution of the Gawler Craton. In: Neumann, N.L. and Fraser, G.L. (eds) Geochronological synthesis and Time-Space plots for Proterozoic Australia. Geoscience Australia, Record, 2007/06.
Glikson, A.Y., Stewart, A.J., Ballhaus, C.G., Clarke, G.L., Feeken, E.H.J., Leven, J.H., Sheraton, J.W. and Sun, S.-S., 1996. Geology of the western Musgrave Block, central Australia, with particular reference to the mafic-ultramafic Giles complex. AGSO Bulletin, 239, 206.
Gray, C.M., 1978. Geochronology of granulite-facies gneisses in the western Musgrave Block, Central Australia. Journal of the Geological Society of Australia, 25, 403-414.
Gum, J., 2006. Musgrave Province reconnaissance using TerraneChronTM. In: Denham, D. (ed.) Australian Earth Sciences Convention, 2006, 18th international geophysical conference and exhibition. Geological Society of Australia, Abstracts, 82, 260.
Gum, J. and Katona, L., 2010. Mineral potential and prospectivity analysis, Musgrave Province, including APY Lands. South Australia. Department of Primary Industries and Resources, Report Book, 2010/7.
Hand, M., Reid, A. and Jagodzinski, E., 2007. Tectonic framework and evolution of the Gawler Craton, South Australia. Economic Geology, 102, 1377-1395.
60
Hand, M. and Sandiford, M., 1999. Intraplate deformation in central Australia, the link between subsidence and fault reactivation. In: Marshak, S., van der Pluijm Ben, A. and Hamburger, M. (eds) Tectonics of continental interiors. Tectonophysics, 305, 121-140.
Hoatson, D.M., Sun, S.-S., Duggan, M.B., Davies, M.B., Daly, S.J. and Purvis, A.C., 2005. Late Archaean Lake Harris Komatiite, central Gawler Craton, South Australia: geologic setting and geochemistry. Economic Geology, 100, 349-374.
Jagodzinski, E.A., Black, L., Frew, R.A., Foudoulis, C., Reid, A., Payne, J., Zang, W. and Schwarz, M.P., 2006. Compilation of SHRIMP U-Pb geochronological data for the Gawler Craton, South Australia 2005-2006. Primary Industries and Resources South Australia, Report Book, 2006/20.
Jagodzinski, E., Reid, A. and Fraser, G., 2009. Compilation of SHRIMP U-Pb geochronological data for the Mulgathing Complex, Gawler Craton, South Australia, 2007-2009: South Australia. Department of Primary Industries and Resources, Report Book, 2009/16.
Jagodzinski, E.A. and Reid, A.J., 2010. New zircon and monazite geochronology using SHRIMP and LA-ICPMS, from recent GOMA drilling, on samples from the northern Gawler Craton. Geoscience Australia, Record, 2010/39, 108-117.
Kelsey, D.E., Smithies, R H., Hand, M., Evins, P.M., Clark, C. and Kirkland, C.L., 2010. What is the tectonic setting of long-lived Grenvillian-aged ultrahigh temperature, high geothermal gradient metamorphism in the Musgrave Province, central Australia? Geological Society of America, Abstracts with Programs, 42(5), in press.
Kositcin, N., 2010. Geodynamic synthesis of the Gawler Craton and Curnamona Province. Geoscience Australia, Record, 2010/27, 113p.
Krieg, G.W., 1993. Basement Inliers southeast of the Musgrave Block. In: Drexel, J.F., Preiss, W.V. and Parker, A.J. (eds) The geology of South Australia: Volume 1, The Precambrian. Geological Survey of South Australia, Bulletin, 54.
Maboko, M.A.H., McDougall, I., Zeitler, P.K. and Fitz Gerald, J.D., 1991. Discordant 40Ar/39Ar ages from the Musgrave Ranges, Central Australia - implications for the significance of hornblende 40Ar/39Ar spectra. Chemical Geology, 86, 139-160.
Major, R.B. and Conor, C.H.H., 1993. The Musgrave Block. In: Drexel, J.F., Preiss, W.P. and Parker, A.J. (eds) The Geology of South Australia, Volume 1. The Precambrian. Geological Survey of South Australia, Bulletin, 54, 156-167.
McFarlane, C.R.M., Mavrogenes, J.A. and Tomkins, A.G., 2007. Recognizing hydrothermal alteration through a granulite facies metamorphic overprint at the Challenger Au deposit, South Australia. Chemical Geology, 243, 64-89.
Morris, B.J., Davies, M.B. and Newton, A.W., 1998. Iron ore deposits of the northern Gawler Craton. In: Berkman, D.A. and Mackenzie, D.H. (eds) Geology of Australian and Papua New Guinean mineral deposits. Australasian Institute of Mining and Metallurgy, Melbourne, Victoria, Australia, 401-406.
Myers, J.S., 1990. Precambrian tectonic evolution of part of Gondwana, southwestern Australia. Geology, 18, 537-540.
Parker, A.J., Daly, S.J., Flint, D.J., Flint, R.B., Preiss, W.V. and Teale, G.S., 1993. Palaeoproterozoic. In: Drexel, J. F., Preiss, W. V. and Parker, A. J. (eds) The geology of South Australia; Volume 1. The Precambrian. Geological Survey of South Australia, Bulletin, 54, 50-105.
Payne, J., Barovich, K. and Hand, M., 2006. Provenance of metasedimentary rocks in the northern Gawler Craton, Australia: Implications for Palaeoproterozoic reconstructions. Precambrian Research, 148, 275-291.
Payne, J., Hand, M., Barovich, K. and Wade, B., 2008. Temporal constraints on the timing of high-grade metamorphism in the northern Gawler Craton: implications for assembly of the Australian Proterozoic. Australian Journal of Earth Sciences, 55, 623-640.
Payne, J.L., Hand, M., Barovich, K., Reid, A.J. and Evans, D.A.D., 2009. Correlations and reconstruction models for the 2500-1500 Ma evolution of the Mawson Continent. In: Reddy, S.M., Mazumder, R., Evans, D.A.D. and Collins, A.S. (eds) Palaeoproterozoic supercontinents and global evolution. Geological Society, London, Special Publication, 323, 319-355.
61
Preiss, W., Korsch, R.J. and Carr, L.K., 2010. 2008 Gawler Craton-Officer Basin-Musgrave Province-Amadeus Basin (GOMA) seismic survey, 08GA-OM1: Geological interpretation of the Officer Basin. Geoscience Australia, Record, 2010/39, 32-46.
Rankin, L.R., Fanning, C.M., Flint, R.B. and Chalmers, N.C., 2006. Proterozoic geology of islands in southern Spencer Gulf, southern Gawler Craton: South Australia. Department of Primary Industries and Resources. Report Book, 2006/8.
Rankin, L.R., Martin, A.R. and Parker, A.J., 1989. Early Proterozoic history of the Karari fault zone, Northwest Gawler Craton, South Australia. Australian Journal of Earth Sciences, 36, 123-133.
Reid, A., Birt, T., Fraser, G. and Daly, S.J., 2007. The geology of the Mulgathing Complex, from eastern Tallaringa to Glenloth Goldfield: South Australia. Department of Primary Industries and Resources, Report Book, 2007/17.
Reid, A., Flint, R., Maas, R., Howard, K. and Belousova, E.A., 2009a. Geochronological and isotopic constraints on Palaeoproterozoic skarn base metal mineralisation in the central Gawler Craton, South Australia. Ore Geology Reviews, 36, 350-362.
Reid, A., Fricke, C. and Cowley, W.M., 2009b. Extent of the low-grade Archaean Devils Playground Volcanics in the north-eastern Gawler Craton: evidence from recent PACE drilling. MESA Journal, 54, 9-19.
Reid, A., Zwingmann, H. and Giles, A., 2010. Constraints on the timing of brittle faulting at Challenger Mine: South Australia. Department of Primary Industries and Resources, Report Book, 2010/15.
Reid, A.J. and Daly, S.J., 2009. The Mulgathing and Sleaford complexes of the Gawler Craton: a historical perspective of the geology and mineral potential. MESA Journal, 52, 4-12.
Scrimgeour, I.R. and Close, D.F., 1999. Regional high pressure metamorphism during intracratonic deformation: the Petermann Orogeny, central Australia. Journal of Metamorphic Geology, 17, 557-572.
Seat, Z., Beresford, S.W., Grguric, B.A., Waugh, R.S, Hronsky, J.M.A, Gee, M. Groves, D.I. and Mathison, C.I., 2007. Architecture and emplacement of the Nebo-Babel gabbronorite-hosted magmatic Ni-Cu-PGE sulphide deposit, West Musgrave, Western Australia. Mineralium Deposita, 42, 551-581.
Seat, Z., Beresford, S.W., Grguric, B.A., Gee, M.A.M. and Grassineau, N.V., 2009. Reevaluation of the role of external sulfur addition in the genesis of Ni-Cu-PGE deposits: evidence from the Nebo-Babel Ni-Cu-PGE Deposit, West Musgrave, Western Australia. Economic Geology, 104, 521-538.
Sheraton, J.W. and Sun, S.-S., 1995. Geochemistry and Origin of felsic igneous rocks of the western Musgrave Block. AGSO Journal of Geology and Geophysics, 16, 107-125.
Skirrow, R.G., Bastrakov, E., Davidson, G., Raymond, O.L. and Heithersay, P., 2002. The geological framework, distribution and controls of Fe oxide Cu-Au mineralisation in the Gawler Craton, South Australia. Part II. Alteration and mineralisation. In: Porter, T.M. (ed.) Hydrothermal iron oxide copper-gold and related deposits: A global perspective. Porter GeoConsultancy Publishing, Adelaide, 33-47.
Skirrow, R.G., Bastrakov, E., Barovich, K., Fraser, G., Fanning, C.M., Creaser, R. and Davidson, G., 2007. The Olympic Cu-Au province: timing of hydrothermal activity, sources of metals, and the role of magmatism. Economic Geology, 102, 1441-1470.
Smithies, R.H., Howard, H.M., Evins, P.M., Kirkland, C.L., Bodorkos, S. and Wingate, M.T.D., 2008. The west Musgrave Complex - new geological insights from recent mapping, geochronology and geochemical studies. Geological Survey of Western Australia, Record, 2008/19, 20 pp.
Smithies, R.H., Howard, H.M., Evins, P.M., Kirkland, C.L., Kelsey, D.E., Hand, M., Wingate, M. T.D., Collins, A.S., Belousova, E. and Allchurch, S., 2010. Geochemistry, geochronology and petrology of Mesoproterozoic felsic rocks in the west Musgrave Province, central Australia and implications for the Mesoproterozoic tectonic evolution of the region. Geological Survey of Western Australia, Report, 106, 73 pp.
Sun, S.-S., Sheraton, J.W., Glikson, A.Y. and Stewart, A.J., 1996. A major magmatic event during 1050-1080 in central Australia and an emplacement age for the Giles Complex. AGSO Research Newsletter, 24, 13-15.
Swain, G., Woodhouse, A., Hand, M., Barovich, K., Schwarz, M. and Fanning, C.M., 2005a. Provenance and tectonic development of the late Archaean Gawler Craton, Australia; U-Pb zircon, geochemical and Sm-Nd isotopic implications. Precambrian Research, 141, 106-136.
62
Swain, G., Hand, M., Teasdale, J., Rutherford, L. and Clark, C., 2005b. Age constraints on terrane-scale shear zones in the Gawler Craton, southern Australia. Precambrian Research, 139, 164-180.
Swain, G., Barovich, K., Hand, M., Ferris, G. and Schwarz, M., 2008. Petrogenesis of the St Peter Suite, southern Australia: Arc magmatism and Proterozoic crustal growth of the South Australian Craton. Precambrian Research, 166, 283-296.
Teasdale, J., 1997. Methods for understanding poorly exposed terranes: the interpretive geology and tectonothermal evolution of the western Gawler Craton. The University of Adelaide, PhD thesis (unpublished).
Tomkins, A.G., Dunlap, W.J. and Mavrogenes, J.A., 2004. Geochronological constraints on the polymetamorphic evolution of the granulite-hosed Challenger gold deposit: implications for assembly of the northwest Gawler Craton. Australian Journal of Earth Sciences, 51, 1-14.
Tomkins, A.G. and Mavrogenes, J.A., 2002. Mobilization of gold as a polymetallic melt during pelite anatexis at the Challenger Deposit, South Australia; a metamorphosed Archean gold deposit. Economic Geology, 97, 1249-1271.
Vassallo, J.J. and Wilson, C.J.L., 2002. Palaeoproterozoic regional-scale non-coaxial deformation; an example from eastern Eyre Peninsula, South Australia. Journal of Structural Geology, 24, 1-24.
Wade, B.P., 2006. Unravelling the tectonic framework of the Musgrave Province, central Australia. The University of Adelaide, PhD thesis (unpublished).
Wade, B.P., Barovich, K.M., Hand, M., Scrimgeour, I.R. and Close, D.F., 2006. Evidence for early Mesoproterozoic arc magmatism in the Musgrave Block, central Australia: Implications for Proterozoic crustal growth and tectonic reconstructions of Australia. Journal of Geology, 114, 43-63.
Wade, B.P., Kelsey, D.E., Hand, M. and Barovich, K.M., 2008. The Musgrave Province: stitching north, west and south Australia. Precambrian Research, 166, 370-386.
Webb, A.W., 1985. Geochronology of the Musgrave Block. Mineral Resources Review, South Australia, 155, 23-37.
White, R.W., Clarke, G.L. and Nelson, D.R., 1999. SHRIMP U-Pb zircon dating of Grenville-age events in the western part of the Musgrave Block, central Australia. Journal of Metamorphic Geology, 17, 465-481.
Woodhouse, A. and Gum, J., 2003. Musgrave Province-geological summary and exploration history. South Australia. Department of Primary Industries and Resources, Report Book, 2003/21.
Zhao, J.X. and McCulloch, M.T., 1993. Sm-Nd mineral isochron ages of Late Proterozoic dyke swarms in Australia - evidence for two distinctive events of mafic magmatism and crustal extension. Chemical Geology, 109, 341-354.
Zhao, J., McCulloch, M.T. and Korsch, R.J., 1994. Characterisation of a plume-related approximately 800 Ma magmatic event and its implications for basin formation in central-southern Australia. Earth and Planetary Science Letters, 121, 349-367.
63
Geological interpretation of the deep seismic reflection and magnetotelluric line 08GA-OM1:
Gawler Craton-Officer Basin-Musgrave Province-Amadeus Basin (GOMA), South
Australia and Northern Territory
R.J. Korsch1, R.S. Blewett1, D. Giles2, A.J. Reid3, N.L. Neumann1, G.L. Fraser1, J. Holzschuh1, R.D. Costelloe1, I.G. Roy1, B.L.N. Kennett4, W.M. Cowley3, G.
Baines2, L.K. Carr1, J. Duan1, P.R. Milligan1, R. Armit5, P.G. Betts5, W.V. Preiss3 and B.R. Bendall6
1Onshore Energy and Minerals Division, Geoscience Australia, GPO Box 378,
Canberra, ACT 2601, Australia 2School of Earth and Environmental Sciences, University of Adelaide, SA 5005,
Australia 3Geological Survey of South Australia, Primary Industries and Resources South
Australia (PIRSA), GPO Box 1671, Adelaide, SA 5001, Australia 4Research School of Earth Sciences, Australian National University, Canberra,
ACT 0200, Australia 5School of Geosciences, Building 28, Monash University, VIC 3800, Australia 6Petroleum and Geothermal Group, Primary Industries and Resources South
Australia (PIRSA), GPO Box 1671, Adelaide, SA 5001, Australia
Introduction In 2008, as part of its Onshore Energy Security Program, Geoscience Australia, in conjunction with AuScope, Primary Industries and Resources South Australia (PIRSA) and the Northern Territory Geological Survey, acquired 634 km of vibroseis-source, deep seismic reflection data and gravity data along a single traverse from about 25 km southeast of Erldunda in the southern Northern Territory to near Tarcoola in central South Australia. This traverse, 08GA-OM1, followed the Adelaide to Alice Springs railway line, utilising the railway access road, and is referred to as GOMA as it traversed the northern Gawler Craton, eastern Officer Basin, eastern Musgrave Province and the southern Amadeus Basin (Figures 1 to 3). Crustal-scale, magnetotelluric data were also collected along the southern part of the seismic route. Here, we report the results of an initial geological interpretation of the seismic and magnetotelluric data, with the geodynamic implications being discussed by Korsch et al. (2010). Aim of the seismic survey The regional scale of this seismic traverse aims to enhance the understanding of the geological history of large parts of central Australia and ultimately provide the energy and mineral exploration industry with new data which will assist in focusing future exploration efforts. The seismic survey acquired new data across the Archean-Mesoproterozoic Gawler Craton and the Mesoproterozoic Musgrave Province, as well as across the Permian Arckaringa Basin and the Neoproterozoic-Devonian Officer and southern Amadeus Basins. The survey will contribute significantly to the understanding of the boundaries between the major provinces, as well as the initiation, architecture and evolution of the basins.
64
Figure 1. Map showing the solid geology of the region covered by the GOMA (08GA-OM1) seismic line, from the northern Gawler Craton to the southern Amadeus Basin, draped over a first vertical derivative image of aeromagnetic data. The solid geology for South Australia is from Cowley (2006a, 2006b, which also contains the legend); the Northern Territory part is from Ahmad (2002). The seismic line has CDP stations labelled, and the locations of GOMA drillholes and key mineral deposits are shown also. Names in capitals refer to the key provinces and domains.
65
Figure 2. Map showing regional aeromagnetic data for the region covered by the GOMA (08GA-OM1) seismic line, from the northern Gawler Craton to the southern Amadeus Basin. Warm colours are high magnetic intensities; cool colours are low magnetic intensities. The seismic line has CDP stations labelled, and the locations of the GOMA drillholes and key mineral deposits are shown also.
66
Figure 3. Map showing a regional gravity image for the region covered by the GOMA (08GA-OM1) seismic line, from the northern Gawler Craton to the southern Amadeus Basin. Warm colours are gravity highs, cool colours are gravity lows. The seismic line has CDP stations labelled, and the locations of the GOMA drillholes and key mineral deposits are shown also.
67
It is of great interest to understand the formation of early crust, and subsequent rock-forming processes, which could include the generation of ore-bearing fluids and subsequent deposition as extractable orebodies. For this reason, the seismic survey crossed a variety of geological provinces and related boundaries. Specific Objectives The specific objectives of the Onshore Energy Security Program component of the GOMA seismic survey are:
To collect seismic reflection data at a regional scale in central Australia, targeting especially the hydrocarbon-bearing eastern Officer and southern Amadeus basins.
To improve the understanding of the relationship between Archean-Mesoproterozoic crust and Neoproterozoic-Paleozoic sedimentary basins.
To image structural features which provide insights into the extent and effects of younger orogenic events, specifically the Petermann and Alice Springs orogenies.
Identify new areas with potential for hot rock geothermal energy and uranium mineralisation.
To examine the relationship between the Gawler Craton and the Musgrave Province, and to assess their mineral potential.
The AuScope investment was directed at an improved understanding of the full crustal structure and architecture and, in particular, the nature of the transition at depth between the Gawler Craton and the Musgrave Province. Seismic acquisition and processing The GOMA seismic line (08GA-OM1) was acquired in November and December 2008, with project management undertaken by the Seismic Acquisition and Processing Project from Geoscience Australia. For the GOMA seismic line, 75-fold seismic reflection data were acquired to 20 s two-way travel time (TWT), using three Hemi-60 (60 000 lb) peak force vibrators. A Sercel SN388 recording system was used to record and correlate the seismic data. Three sweeps, 6-64 Hz, 12-96 Hz, 8-72 Hz, each 12 s long, with an 80 m vibration point interval, were selected as source acquisition parameters for this survey. A summary of acquisition parameters is given in Costelloe and Holzschuh (2010). Data were processed in the DISCO/FOCUS seismic processing package. The final processing flow for seismic line 08GA-OM1 is summarised in Costelloe and Holzschuh (2010). Magnetotelluric acquisition and processing Magnetotelluric (MT) data were acquired for Geoscience Australia along the southern part of the GOMA (08GA-OM1) seismic traverse from November 2008 to January 2009. The new MT data were acquired along an ~230 km profile at 27 broadband and 12 long-period sites, with the distance between sites ranging from 5 to 20 km. These data are being merged with data collected by Selway (2006; see also Selway et al., 2011) farther to the north along the profile. Details of the acquisition and processing of the magnetotelluric data are provided by Duan et al. (2010). Preliminary geological interpretation of seismic line 08GA-OM1 The north-south orientation of the seismic line is essentially perpendicular to the major domains and structures in the region (Figures 1 to 3), and provides crustal geometries which can be compared with existing geological interpretations. Almost the entire route of the seismic traverse was over concealed basement (Figure 4). The geology, determined by very limited outcrop, was projected along strike onto the seismic line. Also, there are several, usually shallow, drillholes which were used as control points. Overall, the crust in the vicinity of the seismic section has variable reflectivity, with some parts of the section containing strong reflections, and other areas having very low reflectivity (Figure 5). In general, the lower crust tends to be only weakly reflective.
68
Figure 4. Map showing the surface geology (from Raymond, 2009) of the region covered by the GOMA (08GA-OM1) seismic line from the northern Gawler Craton to the southern Amadeus Basin. Green and yellow colours respectively represent Mesozoic and Cenozoic sedimentary cover. The seismic line has CDP stations labelled, and the locations of the GOMA drillholes and key mineral deposits are shown also.
69
Moho In the region of the seismic section, the Moho is generally poorly imaged, but is interpreted across most of the GOMA seismic line to occur usually at the base of a weakly reflective package, below which the nonreflective material is considered to represent the upper mantle. The transition from crust to mantle is most likely gradational along a number of parts of the line. The depth to the Moho is extremely variable, ranging from about 18 s TWT (~54 km) under the Christie Domain, to about 12 s TWT (~36 km) under the Musgrave Province (see also Kennett, 2010). Although the Moho appears to have an undulating topography, with localised thickening of the crust, we interpret it to be cut by faults in at least three places (Figure 5). There is a very complex pattern of crustal thickness beneath the Musgrave Province, with substantial localised offsets in the Moho, which are reflected in the very strong gravity anomalies. Gawler Craton The Gawler Craton is an ancient geological province in central South Australia, which contains a Mesoarchean (~3150 Ma) to Mesoproterozoic (~1450 Ma) record of crustal development. For further details of the geology and evolution, refer to Daly et al. (1998), Neumann and Fraser (2007), Hand et al. (2007), Fraser et al. (2010), Kositcin (2010) and Woodhouse et al. (2010). The craton is well known for one of the world’s largest orebodies, at Olympic Dam (IOCG + U; see also Neumann et al., 2010), and other significant ore deposits, such as the IOCG Prominent Hill deposit and the iron ore mines in the Middleback Ranges. Compared to other Australian Archean to Proterozoic provinces, such as the Yilgarn Craton in Western Australia and the North Australian Craton, mineral exploration expenditure and discovery rates in the region have remained relatively low. The seismic traverse crossed several domains which make up the northern part of the Gawler Craton. Wilgena Domain The Wilgena Domain extends from the southern limit of the seismic section to its northern boundary with the Christie Domain at CDP ~6080, which is interpreted to be a north-dipping, crustal-scale fault, the Cedric Bore Fault (new name) (Figure 5a). Beneath thin Cenozoic cover at the southern end of the line is the Paleoproterozoic Tarcoola Formation, with the near surface to the north being dominated by the Mesoproterozoic Gawler Range Volcanics and plutons of the Hiltaba Suite. The Gawler Range Volcanics are interpreted as a relatively thin subhorizontal package, and the plutons of the Hiltaba Suite are interpreted to have a relatively flat pancake shape, up to about 900 ms TWT (about 2.7 km) thick. The domain extends to the Moho and has a moderately-reflective upper crust, with a less reflective lower crust. Form lines in the upper crust suggest the presence of broad folds, or enveloping surfaces, with wavelengths on the order of 10 km (Figure 5a). The Bulgunnia Fault, which occurs close to the Prominent Hill mineral deposit farther to the east, occurs in the seismic section within the Wilgena Domain at CDP ~3780, and is interpreted as a south-dipping listric fault which soles onto the top of a strongly reflective domal package at a depth of ~3 s TWT (~9 km). This domal package is interpreted as a north-dipping fault which transects the entire crust and offsets the Moho, with an apparent extensional displacement. The Tarcoola gold deposit, just to the south of the seismic line, appears to sit above this mantle-tapping fault. The Bulgunnia Fault cannot be tracked to the surface, and might be blind beneath a thin subhorizontal layer of Gawler Range Volcanics. The Wilgena Domain is overlain by the southern part of the Permian Arckaringa Basin between CDPs 5500 and 5900. In this region, the Arckaringa Basin is ~0.5 s TWT (>500 m) thick. Christie Domain The Christie Domain is bounded in the south by the Cedric Bore Fault and, in the north at CDP ~10060, by the Karari Shear Zone. The Karari Shear Zone is interpreted to be a north-dipping, crustal-scale fault, which eventually soles onto the Moho (Figure 5). It is defined by high-level magnetic and gravity worms (Figures 6, 7). The domain extends to the Moho, is only weakly reflective in the upper crust, but is more strongly reflective in the lower crust. It is predominantly of low magnetic intensity, compared to the Wilgena Domain the south (Figure 2). The Christie
70
Domain is overlain by the West, Phillipson and Penrhyn Troughs of the Arckaringa Basin (see below, and Menpes et al., 2010), which are the likely cause of the near-surface, high conductivity zones in the magnetotelluric image (Figure 8). Coober Pedy Domain The Coober Pedy Domain is bounded to the south by the Karari Shear Zone and to the north by the Horse Camp Fault (new name, CDP ~11530), which is a south-dipping fault that soles onto the Karari Shear Zone. It contains predominantly north-dipping reflections and is interpreted as a triangular wedge in the seismic section, confined to the upper ~3.7 s TWT (~11 km) of the crust. It corresponds to a pronounced gravity high anomaly (Figure 3), has high magnetic intensity (Figure 2), and is more electrically conductive than the domains on either side (Figure 8). The GOMA DH1 drillhole (Dutch et al., 2010; Jagodzinski and Reid, 2010), at CDP 11351, penetrated orthogneiss and an undeformed granitic dyke in the northernmost part of the Coober Pedy Domain, beneath 305 m of sedimentary cover. Mabel Creek Domain The Mabel Creek Ridge generally has been considered to be form the southernmost part of the Nawa Domain but, based on the interpretation of the GOMA seismic line, we consider it to be a separate domain. It occurs between the Horse Camp Fault and a north-dipping fault at CDP 14020, the Box Hole Creek Fault (new name), and has a triangular shape extending to deep in the crust. The domain is moderately reflective, with the upper crust containing reflections which dip gently to the south. The domain corresponds to a gravity high anomaly (Figure 3) and has a very resistive magnetotelluric signature, with values over 5000 ohm.m (Figure 8). Within the Mabel Creek Domain, the Broken Bit Bore Fault (new name) at CDP 13530, dips to the south and also soles onto the Karari Shear Zone. Nawa Domain The Nawa Domain is the northernmost domain of the Gawler Craton, and one of the largest in the craton. Nevertheless, the GOMA seismic line shows that the Nawa Domain is composite, and that it can be subdivided into several distinctive seismic subdomains, based on differences in seismic reflectivity. [Note that we use the term ‘seismic subdomain’ to describe a body of rock which has a seismic reflection character which is different to that of adjacent seismic subdomains. The seismic subdomains appear to be bounded by a series of crustal-scale thrust slices. Box Hole Creek Seismic Subdomain Following the naming convention in thrust belts, of naming thrust sheets after the fault on which they sit, the Box Hole Creek Seismic Subdomain (new name) sits on the Box Hole Creek Fault, which dips gently to the north and cuts through the entire crust. In the north, the subdomain is bounded by the Big Swamp Bore Fault (new name) at CDP 17350, which also dips to the north, and is marked by a magnetic worm with an inferred dip to the north (Figure 6). It is equivalent to the Nawa Ridge of Cowley (2006a, 2006b). The Box Hole Creek Seismic Subdomain is less reflective than the Mabel Creek Domain to the south. It contains a series of packages of varying seismic reflectivity, which we interpret to be bounded by a series of north-dipping faults. The subdomain has a wedge shape, and extends to the Moho. The GOMA DH4 drillhole (Dutch et al., 2010; Jagodzinski and Reid, 2010), at CDP 15090, terminated in paragneiss in this subdomain. Big Swamp Bore Seismic Subdomain The Big Swamp Bore Seismic Subdomain (new name) sits on the Big Swamp Bore Fault at CDP 17350. It is a relatively small subdomain, but is distinctive by its pronounced lack of reflectivity, and has a wedge shape which terminates in the middle crust. It is bounded to the north by the north-dipping Cadney Park Fault (new name) at CDP 18270. The domain is marked by a strong gravity high anomaly (Figure 3) and has low magnetic intensity (Figure 2).
71
Figure 5a. Migrated seismic section for the GOMA (08GA-OM1) seismic line between CDP 2278 and CDP 13000, showing both uninterpreted and interpreted versions. Provinces, domains, seismic subdomains and key faults are named. The display is to ~60 km depth, and shows the vertical scale equal to the horizontal scale, assuming an average crustal velocity of 6000 m s-1.
72
Figure 5b. Migrated seismic section for the GOMA (08GA-OM1) seismic line between CDP 13000 and CDP 23500, showing both the uninterpreted and interpreted versions. Provinces, domains, seismic subdomains and key faults are named. The display is to ~60 km depth, and shows the vertical scale equal to the horizontal scale, assuming an average crustal velocity of 6000 m s-1.
73
Figure 5c. Migrated seismic section for the GOMA (08GA-OM1) seismic line between CDP 23500 and CDP 33859, showing both the uninterpreted and interpreted versions. Provinces, domains, seismic subdomains and key faults are named. The display is to ~60 km depth, and shows the vertical scale equal to the horizontal scale, assuming an average crustal velocity of 6000 m s-1.
74
Cadney Park Seismic Subdomain The Cadney Park Seismic Subdomain (new name) sits on the north-dipping Cadney Park Fault at CDP 18270. This fault appears to have been reactivated in the Neoproterozoic, as it possibly defines the southern limit of the Officer Basin in the GOMA seismic section (see Preiss et al., 2010). It is a weakly-reflective subdomain, with no distinguishing seismic characteristics. It is bounded in the north by the north-dipping Wintinna Hill Fault (new name) at CDP 21310, which is a well-defined boundary in the magnetic data (Figure 2). The domain corresponds to a strong gravity high anomaly, the southern boundary of which coincides with the Middle Bore Fault (Figure 3). In the middle of the Cadney Park Seismic Subdomain, the GOMA seismic line crosses the Middle Bore Ridge (Mackie and Gravestock, 1993). The southern margin of the ridge, at CDP ~19700, is the Middle Bore Fault (Figure 5b) which, in the GOMA seismic line, we interpret to be the bounding fault on the southern side of a narrow basement high forming part of the ridge. In the GOMA seismic section, the Middle Bore Fault is in the middle of a weakly reflective zone, and hence cannot be interpreted deeper than about 2 s TWT (~6 km depth). Wintinna Hill Seismic Subdomain The Wintinna Hill Seismic Subdomain (new name) is a relatively small domain between the Wintinna Hill Fault in the south at CDP 21310 and the north-dipping Sarda Bluff Fault (new name) in the north at CDP 22000, where gravity worms suggest an inferred dip to the north (Figure 7). The subdomain contains north-dipping reflections, distinguishing it from the weakly reflective Cadney Park Seismic Subdomain to the south. In contrast to the Cadney Park Seismic Subdomain, it corresponds to a magnetic high (Figure 2) and has only a moderate gravity signature (Figure 3). The Sarda Bluff Fault is important in that we consider that it marks the northern limit of the Gawler Craton at depth below the Officer Basin, with the Musgrave Province occurring to the north of the fault. Below about 3 s TWT, the fault separates zones of markedly different seismic reflectivity (Figure 5). The GOMA DH2 drillhole was drilled about 22 km to the east of the GOMA seismic line, and projects to about CDP 23200 on the seismic line. The drillhole terminated in basement rocks (paragneiss) of the Yoolperlunna Inlier, which has affinities with the Gawler Craton (Fanning et al., 2007; Dutch et al., 2010; Jagodzinski and Reid, 2010). In the seismic data, we interpret the projected Inlier to occur between the Sarda Bluff Fault at CDP 22000 and the Mount Johns Fault (new name), which dips gently to the south at CDP 23400 (at 1.5 s TWT). We consider that the Yoolperlunna Inlier is a thrust slice of the Wintinna Hill Subdomain, which has been backthrust to the north over the southern margin of the Musgrave Province. This thrusting occurred before deposition of the Officer Basin, which extends continuously to both the north and south of the inlier. The Officer Basin above the Yoolperlunna Inlier is folded and faulted, with reactivation on the faults, which probably occurred during the Petermann Orogeny (570-530 Ma). The GOMA DH3 drillhole, at CDP 22014, was drilled just to the north of the Sarda Bluff Fault on the seismic line. The drillhole terminated in quartzite (Dutch et al., 2010; Jagodzinski and Reid, 2010), considered to be possibly part of the Neoproterozoic succession in the Officer Basin. In the GOMA seismic line, the drillhole is interpreted to be in an upthrust block, which forms part of the Ammaroodinna Ridge in the Officer Basin (Gravestock, 1997), and contains Neoproterozoic rocks overlying the basement Yoolperlunna Inlier. Musgrave Province The Musgrave Province is a large east–west-trending Mesoproterozoic basement inlier in central Australia, which extends along the Northern Territory-South Australia border and into Western Australia. The oldest rocks are gneisses, which have intrusive, volcanic and rare sedimentary precursors yielding ages of 1600-1540 Ma, and were metamorphosed to granulite to amphibolite grade during the Musgrave Orogeny at 1200-1160 Ma (Wade et al., 2008; Woodhouse et al., 2010). To date very little mineral exploration has been carried out.
75
Figure 6. Map showing magnetic worms for the region covered by the GOMA (08GA-OM1) seismic line from the northern Gawler Craton to the southern Amadeus Basin, generated from the upward continuation of the regional aeromagnetic data. Warm colours are from higher levels of upward continuation, and more likely to image deeper features, whereas cool colours are from lower levels of upward continuation, and more likely to image shallower features. The seismic line has CDP stations labelled.
76
Figure 7. Map showing gravity worms for the region covered by the GOMA (08GA-OM1) seismic line from the northern Gawler Craton to the southern Amadeus Basin, generated from the upward continuation of the regional gravity data. Warm colours are from higher levels of upward continuation, and more likely to image deeper features, whereas cool colours are from lower levels of upward continuation, and more likely to image shallower features. The seismic line has CDP stations labelled.
77
On the GOMA seismic line, we consider that the Musgrave Province extends from the Sarda Bluff Fault in the south at CDP 22000 to the Woodroffe Thrust in the north at CDP 32370. The Musgrave Province consists of a two-layered crust, with a reasonably reflective upper crust and a weakly reflective lower crust. It is broadly V-shaped, with the Sarda Bluff Fault dipping to the north and the Woodroffe Thrust dipping to the south. These faults have been interpreted to cut the Moho, displacing it upwards beneath the Musgrave Province (Figure 5c). Although the Musgrave Province has been subdivided into several domains (e.g., Edgoose et al., 2004; Aitken and Betts, 2009), there is no noticeable change in the reflective character at possible domain boundaries, and hence we treat the province as a single entity. The GOMA seismic line has imaged several faults which cut the Musgrave Province. The north-dipping Everard Thrust (Ivic, 1986) occurs at CDP 24400 and defines the southernmost outcrop of Musgrave Province, where it has been thrust over the northernmost outcrops of the Officer Basin. Zang (1995) considered that the Everard Thrust formed during the Alice Springs Orogeny (400-300 Ma), whereas Preiss et al. (2010) considered that the movement was predominantly during the Petermann Orogeny. The Wintiginna Fault (previously Wintiginna Lineament), at CDP 25200, is a north-dipping fault which forms the southern margin of the ?Cambrian Moorilyanna Graben, which is a pullapart basin. The fault has a pronounced gravity worm with an inferred dip to the north (Figure 3), and it cuts deep into the crust, linking with the Woodroffe Thrust at a depth of 10 s TWT (~30 km). The Wintiginna Fault was probably a basement fault which was reactivated in the Cambrian as a transtensional, strike-slip fault. In the GOMA seismic line, we interpret the Wintiginna Fault to merge with the Everard Thrust at a depth of about 6 s TWT (~18 km). The Echo Fault (previously Echo Lineament), at CDP 26470, defines the northern boundary of the Moorilyanna Graben, and dips to the south to link with the Wintiginna Fault at a depth of ~3 s TWT (~9 km). Near the surface it has several splays, with internal block rotation of the Cambrian units, indicating that it has been reactivated, probably as a strike-slip fault, after deposition of the graben fill. Based on aeromagnetic data, the seismic line is interpreted to cross the Marryat Fault at about CDP 28100 (Figure 2), but a fault at about this position is not obvious in the seismic data, where there is a series of subhorizontal reflections extending to several kilometres depth. The Kalamurta Creek Fault (new name), at CDP 31340, is a south-dipping, crustal-scale fault, which roots onto the Wintiginna Fault at a depth of about 7.3 s TWT (~22 km). It forms the boundary between granulite-grade metamorphic rocks to the south (where there is a large gravity high anomaly, Figure 3), and amphibolite-grade rocks to the north. In the granulite-grade rocks to the south of the Kalamurta Creek Fault, the reflections in the upper crust are generally gently dipping, and appear to define two long wavelength antiforms and synforms over a horizontal distance of about 90 km (Figure 5c). Maximum metamorphic grade at the surface should occur at about CDP 26900, in the core of one of the antiforms. Between the Kalamurta Creek Fault and the Woodroffe Thrust, there is a thin veneer of Late Devonian sedimentary rocks, below which are rocks with relatively fast stacking velocities. Three drillholes, AUP2, AUP3 and AUP5 intersected 68 to 127 m of Devonian sedimentary rock before terminating in granite (described as fresh, massive, pinkish-grey quartz-feldspar-biotite granite by Agip Nucleare, 1978). Below the Devonian sedimentary rocks, there is a thin subhorizontal, nonreflective zone, below which are a series of subhorizontal reflections from about 0.3 s TWT to about 1.8 s TWT (at CDP 31850), giving this package a thickness of about 4.5 km. The internal character of these reflections, with terminations, truncations and slight angular relationships indicates that these are not multiples, and are considered to be geological in origin. Thus, the granite may be confined to a thin subhorizontal sheet, about 0.2 s TWT (~600 m) thick, between the Devonian sedimentary rocks and the underlying layered package.
78
Figure 8. Migrated seismic section for the GOMA (08GA-OM1) showing the (a) uninterpreted and (b) interpreted versions, and (c) the very preliminary two dimensional model of TM and TE modes for the magnetotelluric data, to a depth of 60 km, covering the southern half of the GOMA traverse (see details in Duan et al., 2010). The displays show the vertical scale equal to the horizontal scale (assuming a crustal velocity of 6000 m s-1). Simplified linework from the interpretation of the seismic section is overlain on the MT model. Provinces, domains and seismic subdomains are named. Fault abbreviations: CBF - Cedric Bore Fault, KSZ – Karari Shear Zone, HCF – Horse Camp Fault, BHCF – Box Hole Creek Fault, BSBF – Big Swamp Bore Fault, CPF – Cadney Park Fault, MBF – Middle Bore Fault, WHF – Wintinna Hill Fault, SBF - Sarda Bluff Fault, MJF – Mount Johns Fault, WT – Woodroffe Thrust.
79
The Woodroffe Thrust, at CDP 32370, is a south-dipping, planar fault which cuts the entire crust; we have interpreted it to a depth of about 16 s TWT (~48 km). It is a basement structure, forming the suture between the Musgrave Province and the Warumpi Province (see below) and has been reactivated at least twice. The Woodroffe Thrust has thrust the Musgrave Province over the Neoproterozoic package of the Amadeus Basin, presumably during the Petermann Orogeny (570-530 Ma). Devonian sedimentary rocks of the Finke Group were deposited across the thrust, which was then reactivated during the Alice Springs Orogeny, again as a thrust, to displace the Devonian sedimentary rocks. Warumpi Province North of the Woodroffe Thrust, the crustal reflectivity is distinctly different to that forming the Musgrave Province south of the thrust (Figure 5c). Wright et al. (1991) observed a zone of mid crustal reflections on the 1985 Amadeus-Arunta seismic survey under the southern part of the Amadeus Basin on seismic line BMR85.1E. We equate these reflections with those observed on the GOMA seismic line at depths of 5-8 s TWT (~15-24 km) between CDPs 30800 and the northern end of the line at 38859. Wright et al. (1991) also noted the similarity of these mid crustal reflections with those observed under the southernmost margin of the Arunta Region on seismic line BMR85.1A, and Korsch et al. (1998) tracked this mid-crustal reflective zone from the Redbank Thrust Zone to the southern limit of the 1985 seismic survey, under the southern Amadeus Basin. Korsch and Goleby (2006) considered that the mid-crustal reflective zone was part of the Warumpi Province. Hence, we consider that the mid-crustal reflective zone, seen on the northernmost part of the GOMA seismic line, is part of the Warumpi Province which, thus, extends from the Redbank Thrust Zone in the north, beneath the Amadeus Basin, to the Woodroffe Thrust in the south. Gravity modelling (Wright et al., 1991) showed a sharp increase in the densities of this reflective zone (2870 kgm-3) compared to the crust immediately above it (2720 kgm-3). Officer Basin The eastern Officer Basin formed during multiple phases of subsidence from the Neoproterozoic to the Devonian, and contains several depocentres filled with up to 10 km of sediment. The basin was deformed during the Petermann (Early Cambrian) and Alice Springs (Devonian) orogenies, whereas the Delamerian Orogeny (Late Cambrian) had only minor impact. A description of the basin and interpretations of the seismic data are presented in Preiss et al. (2010). A ?Cambrian pullapart basin, the Moorilyanna Graben, occurs to the north of the Officer Basin, and is bounded in the south at CDP 25200 by the Wintiginna Fault (previously Wintiginna Lineament) and in the north at CDP 26470 by the Echo Fault (previously Echo Lineament) (see Preiss et al., 2010). Both faults appear to have had dextral movement during formation of the pullapart. Amadeus Basin The Amadeus Basin (NT), like the Officer Basin, contains a Neoproterozoic to Late Devonian sedimentary section, which reaches a maximum thickness of about 17 km in the northern part of the basin. In the southern Amadeus Basin, outcrops of Late Devonian Finke Group and Neoproterozoic Winnall beds have been mapped in the vicinity of the seismic line on the Kulgera 1:250 000 geological map sheet (Edgoose et al., 1992). Farther north, in the vicinity of the seismic line on the Finke 1:250 000 geological map, Wells et al. (1966) mapped Neoproterozoic Inindia beds and Winnall beds, Ordovician Stairway Sandstone and Devonian Finke Group. Due to the sparse nature of drilling there are no petroleum exploration wells close to this section of the GOMA seismic line. The Erldunda 1 well (McTaggart and Pemberton, 1965) is about 30 km to the northwest, and intersected, from bottom to top, Neoproterozoic Bitter Springs Formation, Inindia beds and Winnall beds, unconformably overlain by Ordovician sedimentary rocks which, in turn, are unconformably overlain by Late Devonian sedimentary rocks.
80
On the GOMA seismic line, the Amadeus Basin is imaged between CDP 31300 and the northern end of the line at CDP 38859. South of the Woodroffe Thrust, only the Late Devonian Finke Group occurs. To the north of the thrust, the basin has a maximum thickness of ~1.6 s TWT (~3800 m), with the lowermost unit consisting of high amplitude irregular reflections, which we interpret to be the Neoproterozoic Bitter Springs Formation. This unit has a near-planar base, sitting on basement of the Warumpi Province. The upper surface of this unit is interpreted as a décollement surface, a characteristic common in the Bitter Springs Formation further to the north, where it occurs at a thick salt horizon. Above the décollement surface, there is a package of high amplitude, continuous reflections, overlain by a weakly reflective package, which grades up into a more reflective package. Overall, this unit has a maximum thickness in the seismic section of about 1.1 s TWT (~2700 m), and appears to be a cohesive package lacking obvious internal unconformities; we interpret this package to represent the Neoproterozoic Inindia beds and Winnall beds. A marked angular unconformity at the top of this package is interpreted to be the unconformity at the base of the Late Devonian succession. A second unconformity could not be picked on the seismic line, and hence we consider that no Ordovician sedimentary rocks were crossed by the seismic line. Alternatively, if the Ordovician units do occur, they may be too thin to resolve on the seismic line. The décollement in the Bitter Springs Formation extends from the northern limit of the seismic data to the southern limit of the Neoproterozoic section of the Amadeus Basin at the Woodroffe Thrust. There are two south-directed thrusts (one forming the décollement below the Woodroffe Thrust at CDP ~32230, and the other at CDP 32710), within a regime dominated by an overall north-directed shortening, focussed on the Woodroffe Thrust and possibly subparallel faults further to the south. Between the Woodroffe Thrust and the thrust at CDP 32710, we interpret a slice of basement between the Devonian sedimentary rocks and the Bitter Springs Formation; this interpretation is supported by fast stacking velocities for this interval, compared with slower stacking velocities for the same depth to the north of the thrust at CDP 32710. The geometry observed in the GOMA seismic line is very similar to that described for the Razorback Nappe on the northern margin of the Amadeus Basin by Flöttmann and Hand (1999). We consider that most of this deformation occurred during the Petermann Orogeny, along with the long-wavelength folding seen in the Neoproterozoic sedimentary rocks between CDP 32970 and CDP 33859, because it occurred before Devonian sedimentary rocks were overlain unconformably on the folded succession. Between CDP 32710 and 32970, there are outcrops of Winnall beds, separated by Devonian sedimentary rocks to the north and south. We interpret the Winnall beds to occur in a popup structure, related to a backthrust off the south-directed thrust fault; because these faults cut the Devonian sedimentary rocks, we interpret the popup to be due to the Alice Springs Orogeny. Arckaringa Basin The GOMA seismic line crosses a large part of the Permian Arckaringa Basin, from about CDP 5400 in the south to about CDP 20540 in the north, a distance of over 300 km. It crosses three discrete troughs in the southern Arckaringa Basin, as well as a broad, platform-like area to the north. A description of the basin and interpretations of the seismic data are presented in Menpes et al. (2010). Eromanga Basin Much of the pre-Mesozoic geology along the route of the GOMA seismic line is overlain by a thin cover (~30 to 200 m thick) of the Jurassic-Cretaceous Eromanga Basin and a veneer of Cenozoic sediments. Gravity forward modelling Here, we explore a series of gravity models, with the aim of integrating the interpretation from the potential modelling with the seismic interpretation. To reduce the barrier of non-uniqueness in the interpretation, we have taken following approach:
1. Constrain the potential field model wherever the seismically-derived interpretation seems to be more reliable, such as the Moho boundary,
81
2. Adopt a parsimonious approach by starting with a simple model, and add successive levels of geological complexity, using the likely distribution of density (that is, the bulk rock packages), and
3. Check, at every step, for a reasonable level of fit between the observed data and the computed response.
The final result is a possible solution which best satisfies the interpreted architecture of the crust and upper mantle. The rationale of this approach is to follow Occam’s Razor by keeping the level of geological complexity as reasonably as low as possible, but still maintain a satisfactory fit with the gravity data. Major changes in rock packages, seen in the various provinces, domains and sedimentary basins along the GOMA seismic line, have a corresponding major change in the gravity response along the line. In fact, some the largest gravity gradients in the world (>100 mGal) occur within the region of the GOMA seismic line (Figure 9a). The northern part of the Gawler Craton is a relative gravity high, around -20 mGal; this value drops sharply to over -100 mGal within the southern Musgrave Province, then rising sharply to -20 mGal within the northern Musgrave Province (Figure 9a). Two basic models are explored in Figures 9a and 9b. Both use a simple two layer model, of crust and mantle, with the Moho boundary provided by the interpretation of the seismic reflection data. The first model uses a crustal density of 2770 kgm-3 and the second uses a crustal density of 2870 kgm-3. The mantle is maintained in both models at 3200 kgm-3. The fit of the calculated response to the observed data in both models is not particularly good (compare Figure 9a with Figure 9b). This suggests that there is significant variation in the density distribution within the crust. The next model (Figure 9c) adds in the sedimentary basins in the upper crust, and assumes an average density of 2600 kgm-3. The shape of these basins is based on the seismic interpretation, so this simple constraint can be added to the model. There is a marginal improvement in the fit to the observed data with calculated response from the initial starting model (compare Figure 9a with Figure 9c). Adding this step in the modelling process removes a degree of freedom, but significant variations remain to be accounted for in crustal density. The variations in the crust are next modelled province by province (Figure 9d). The calculated gravity field for each of the three geological provinces are modelled as Gawler Craton = 2770 kgm-3, Musgrave Province = 2670 kgm-3 and Warumpi Province = 2700 kgm-3. The fit between the calculated and the observed gravity fields is improved, confirming the provincial control on the variability of crustal densities. The fit between observed and calculated gravity fields can be further improved by accounting for variations between the domains and subdomains. The final calculated model (Figure 9e) accounts for the observed gravity field by considering density variations within the main provinces, domains and subdomains, as well as between them. The calculated fit is excellent, with crustal variations from 2550 kgm-3 to 2920 kgm-3. The large gravity gradient across the Musgrave Province is accounted for by its shallow Moho, and a low density domain in the south, within an otherwise dense upper crust. This dense upper crust is likely to be caused by the presence of granulites (e.g., Aitken et al., 2009). Although a good model solution is obtained, an alternative model using a variable mantle density is calculated in an attempt to explain the large gravity gradient across the Musgrave Province. The model is used to test the hypothesis that there is an alteration zone in the mantle associated with a low resistivity area observed in the same region in the MT data (Selway et al., 2011). This simple two-layer model assumes a mantle density of 3200 kgm-3, an average crust of 2770 kgm-3, and a Moho with a gentle topography, except for the upthrust segment beneath the Musgrave Province. A steeply-dipping band of lower density mantle (2500 kgm-3) is added to simulate a boundary with possible alteration and/or metasomatism (Figure 9f). This model approximates the long-wavelength gravity variations and the large gradient within the Musgrave Province (Figure 9f). It is an alternative to the model of crustal variation (Figure. 9e). Despite having a resistivity anomaly in this region, there is no shear-wave velocity change (see Korsch et al., 2010). A mantle variation explanation for the gravity field is a possibility (Figure 9f) but, at this stage, remains unanswered.
82
Figure 9. A. Simple starting model of the gravity field along the GOMA transect, using a two layered model. The Moho topography and depth is derived from the interpreted Moho in the seismic reflection data. B. Variation on the simple starting model of the gravity field (A) along the GOMA transect, changing only the average density of the crust. C. Three layer model, with sedimentary basins (2600 kgm-3) added. See text for discussion.
83
Figure 9. D. Three layer model, with sedimentary basins, variable crust and mantle. The main geological provinces are modelled with differing densities: Gawler Craton (2770 kgm-3); Musgrave Province (2670 kgm-3); Warumpi Province (2700 kgm-3). E. Final model, with sedimentary basins, variable crust and mantle. The main geological provinces, domains and subdomains, derived from the seismic reflection data, are modelled with differing densities based on known or text-book densities. Note the colour change from the other models; here the model is colour coded from low densities (cool colours) to higher densities (warm colours). F. Alternative model to explain the large gravity gradient across the Musgrave Province. This model assumes a mantle density of 3200 kgm-3, an average crust of 2770 kgm-3, a simple Moho except for the upthrust segment beneath the Musgrave Province. A steeply dipping band of low density mantle (2900 kgm-3) is added to simulate a boundary with alteration/metasomatism. The model approximates the long-wavelength gravity variations and the large gradient within the Musgrave Province. See text for discussion.
84
Conclusions The GOMA deep seismic reflection line (08GA-OM1) provides a 634 km long, north-south image of the crust in northern South Australia and the southernmost Northern Territory, in a region where there is almost no exposure of basement rocks. The seismic line crosses basement rocks of the northern Gawler Craton, the Musgrave Province and the southernmost Warumpi Province. The Moho under the GOMA seismic line has quite a variable relief, with its depth ranging from about ~54 km under the Christie Domain to about ~36 km under the Musgrave Province. The crustal architecture of the northern Gawler Craton and the southern half of the Musgrave Province is dominated by north-dipping faults, many of which cut the entire crust, and are interpreted as thrusts. The Nawa Domain, the northernmost domain in the Gawler Craton, can be subdivided into a series of seismic subdomains, based on different seismic reflectivity between them, and are separated by inferred thrust faults. The Musgrave Province has a wedge shape in cross section, tapering with depth, and is bounded by two crustal scale faults; the province is separated from the Gawler Craton to the south by the Sarda Bluff Fault, and from the Warumpi Province to the north by the Woodroffe Thrust. The basement provinces are almost entirely covered by younger sedimentary basins; the Neoproterozoic Officer and southern Amadeus basins, the Permian Arckaringa Basin, the Jurassic-Cretaceous Eromanga Basin and surficial Cenozoic sediments. Acknowledgements This paper forms part of a collaborative project between Geoscience Australia, Primary Industries and Resources South Australia (PIRSA) and AuScope. We thank the following for their contributions to the project: Richard Chopping, Liz Jagodzinski, Natalie Kositcin, Jenny Maher, Tony Meixner, Sandy Menpes, Kate Selway, John Stewart and Ailsa Woodhouse. The contribution by Geoscience Australia forms part of its Onshore Energy Security Program. We thank Malcolm Nicoll, Lindsay Highet, Andrew Retter, Dan Connolly and Gerard Stewart for producing the maps and digital versions of the seismic section. We thank Richard Chopping and David Huston for reviewing this abstract. References Agip Nucleare, 1978. Final Report E.L. 1417. Agip Nucleare Australia Pty. Ltd. Northern
Territory Geological Survey, Report, CR1978-0157. Ahmad, M., 2002. Geological map of the Northern Territory, 1:250 000. Northern Territory
Geological Survey. Aitken, A.R.A. and Betts, P.G., 2009. Multi-scale integrated structural and aeromagnetic
analysis to guide tectonic models: An example from the eastern Musgrave Province, Central Australia. Tectonophysics, 476, 418-435.
Aitken, A.R.A., Betts, P.G., Weinberg, R.F. and Gray, D., 2009. Constrained potential field modelling of the crustal architecture of the Musgrave Province in central Australia: evidence for lithospheric strengthening due to crust-mantle boundary uplift. Journal of Geophysical Research, 114, doi:10.1029/2008JB006194.
Cowley, W.M., 2006a. Solid geology of South Australia: peeling away the cover. MESA Journal, 43, 4-15.
Cowley, W.M., compiler, 2006b. Solid geology of South Australia. South Australia Department of Primary Industries and Resources, Mineral Exploration Data Package, 15, version 1.1.
Daly, S.J., Fanning, C.M. and Fairclough, M.C. 1998. Tectonic evolution and exploration potential of the Gawler Craton, South Australia. AGSO Journal of Australian Geology and Geophysics, 17, 145-168.
85
Duan, J., Milligan, P.R. and Nakamura, A., 2010. Magnetotelluric survey along the GOMA deep seismic reflection transect in the northern Gawler Craton to Musgrave Province, South Australia. Geoscience Australia, Record, 2010/39, 7-15.
Dutch, R., Davies, M.B. and Flintoft, M., 2010. GOMA basement drilling program, northern Gawler Craton. PIRSA, Report Book, 2010/2, 228 pp.
Edgoose, C.J., Camacho, A. and Wakelin-King, G.A., 1992. Kulgera 1:250 000 geological map (Sheet SG 53-5), Second Edition. Northern Territory Geological Survey.
Edgoose, C.J., Scrimgeour, I.R. and Close, D.F., 2004. Geology of the Musgrave Block, Northern Territory. Northern Territory Geological Survey, Report, 15, 44 pp.
Fanning, C.M., Reid, A. and Teale, G., 2007. A geochronological framework for the Gawler Craton, South Australia. South Australia, Geological Survey, Bulletin, 55.
Flöttmann, T. and Hand, M., 1999. Folded basement-cored tectonic wedges along the northern edge of the Amadeus Basin, Central Australia: evaluation of orogenic shortening. Journal of Structural Geology, 21, 399-412.
Fraser, G., McAvaney, S., Neumann, N., Szpunar, M. and Reid, A., 2010. Discovery of early Mesoarchean crust in the eastern Gawler Craton, South Australia. Precambrian Research, 179, 1-21.
Gravestock, D.I., 1997. Geological setting and structural history. In: Morton, J.G.G. and Drexel, J.F. (eds) Petroleum Geology of South Australia. Volume 3: Officer Basin. South Australia, Department of Mines and Energy Resources, Report Book, 97/19, 35-45.
Hand, M., Reid, A. and Jagodzinski, E.A., 2007. Tectonic framework and evolution of the Gawler Craton, Southern Australia. Economic Geology, 102, 1377-1395.
Ivic, D., 1986. Summary of geophysical interpretations of the Everard Thrust, N.E. Officer Basin – South Australia. South Australia Department of Mines and Energy, Report Book, 1986/78, 26 pp.
Jagodzinski, E.A. and Reid, A.J., 2010. New zircon and monazite geochronology using SHRIMP and LA-ICPMS, from recent GOMA drilling, on samples from the northern Gawler Craton. Geoscience Australia, Record, 2010/39, 108-117.
Kennett, B.L.N., 2010. Understanding the lithosphere in the vicinity of seismic line 08GA-OM1 from passive seismic studies. Geoscience Australia, Record, 2010/39, 87-94.
Korsch, R.J. and Goleby, B.R., 2006. Deep seismic reflection profiling in the Arunta, Musgrave and McArthur regions: implications for Central and North Australian tectonics. In: Lyons, P. and Huston, D.L. (eds) Evolution and metallogenesis of the North Australia Craton. Geoscience Australia, Record, 2006/16, 47-48.
Korsch, R.J., Goleby, B.R., Leven, J.H. and Drummond, B.J., 1998. Crustal architecture of central Australia based on deep seismic reflection profiling. In: Proceedings of the 7th International Symposium on deep seismic profiling of the continents. Tectonophysics, 288, 57-69.
Korsch, R.J., Kositcin, N., Blewett, R.S., Fraser, G.L., Baines, G., Kennett, B.L.N., Neumann, N.L., Reid, A.J., Preiss, W.V., Giles, D., Armit, R. and Betts, P.G., 2010 Geodynamic implications of the deep seismic reflection line 08GA-OM1: Gawler Craton-Officer Basin-Musgrave Province-Amadeus Basin (GOMA), South Australia and Northern Territory. Geoscience Australia, Record, 2010/39, 138-151.
Kositcin, N., editor, 2010. Geodynamic synthesis of the Gawler Craton and Curnamona Province. Geoscience Australia, Record, 2010/27, 113 pp.
Mackie, S. and Gravestock, D., 1993. Summary of seismic interpretation, Marla area, Officer Basin. South Australian Department of Mines and Energy, Open File Envelope, 8591.
Neumann, N.L. and Fraser, G.L., editors, 2007. Geochronological synthesis and time-space plots for Proterozoic Australia. Geoscience Australia, Record, 2007/06, 216 pp.
Neumann, N.L., Skirrow, R.G., Fraser, G.L., Korsch, R.J., Preiss, W.V., Cowley, W.M. and Blewett, R.S., 2010. Implications for regional energy and mineral systems of the 08GA-OM1 (GOMA) deep seismic reflection survey in the northern Gawler Craton to Amadeus Basin, South Australia and the Northern Territory. Geoscience Australia, Record, 2010/39, 152-162.
86
Preiss, W.V., Korsch, R.J. and Carr, L.K., 2010. 2008 Gawler Craton-Officer Basin-Musgrave Province-Amadeus Basin (GOMA) seismic survey, 08GA-OM1: Geological interpretation of the Officer Basin. Geoscience Australia, Record, 2010/39, 32-46.
Raymond, O.L., coordinator, 2009. Surface geology of Australia 1:1 million scale digital geology data. Geoscience Australia, digital geology map. https://www.ga.gov.au/products/servlet/controller?event=GEOCAT_DETAILS&catno=69455
Selway, K.M., 2006. Magnetotelluric experiments in central and southern Australia and their implications for tectonic evolution. University of Adelaide, School of Earth and Environmental Sciences, PhD thesis, (unpublished).
Selway, K.M., Hand, M., Payne, J.L., Heinson, G.S. and Reid, A., 2011. Magnetotelluric constraints on the tectonic setting of Grenville-aged orogenesis in central Australia. Journal of the Geological Society, London, 168, in press.
Swain, G.M., Hand, M., Teasdale, J., Rutherford, L. and Clark, C. 2005b. Age constraints on terrane-scale shear zones in the Gawler Craton, Southern Australia. Precambrian Research, 139, 164-180.
Wade, B.P., Kelsey, D.E., Hand, M. and Barovich, K.M., 2008. The Musgrave Province: Stitching north, west and south Australia. Precambrian Research, 166(1-4), 370-386.
Wells, A.T., Stewart, A.J. and Skwarko, S.W., 1966. Geology of the south-eastern part of the Amadeus Basin, Northern Territory. Bureau of Mineral Resources, Geology and Geophysics, Report, 88, 59 pp.
Woodhouse, A., Reid, A.J., Cowley, W.M. and Fraser, G.L., 2010. Overview of the geology of the northern Gawler Craton and adjoining Musgrave Province, South Australia. Geoscience Australia, Record, 2010/39, 47-62.
Wright, C., Goleby, B.R., Shaw, R.D., Collins, C.D.N., Korsch, R.J., Barton, T., Greenhalgh, S.A. and Sugiharto, S., 1991. Seismic reflection and refraction profiling in central Australia: implications for understanding the evolution of the Amadeus Basin. In: Korsch, R.J. and Kennard, J.M. (eds) Geological and geophysical studies in the Amadeus Basin, central Australia. Bureau of Mineral Resources, Geology and Geophysics, Bulletin, 236, 41-57.
Zang, W.-L., 1995. Early Neoproterozoic sequence stratigraphy and acritarch biostratigraphy, eastern Officer Basin, South Australia. Precambrian Research, 74, 119-175.
87
Understanding the lithosphere in the vicinity of seismic line 08GA-OM1 from passive seismic
studies
B.L.N. Kennett
Research School of Earth Sciences, The Australian National University, Canberra ACT 0200, Australia
Introduction The Australian National University has carried out deployments of portable broadband seismic recorders across Australia since 1992. These instruments provide high-fidelity recording of ground motion, and record both regional and distant earthquakes. The seismograms can be analysed to generate information on lithospheric structure beneath the Australian region using a variety of styles of analysis; an early example is provided by van der Hilst et al. (1998), and an overview is provided by Kennett (2003). The principal information from regional earthquakes comes from the analysis of the large amplitude surface waves late in the seismograms. These surface waves travel almost horizontally through the lithosphere and, with a sufficient density of crossing paths, can be used in a tomographic inversion to determine 3D structure in the lithospheric mantle. Receiver-based studies at individual stations exploit the conversions and reverberations following the onset of the P wave energy. From distant earthquakes, information can be extracted about the structure in the crust and uppermost mantle. In recent years, additional information has begun to be extracted from the seismic noise field, through the stacked cross-correlation of signals at pairs of stations, which provide an approximation to the signal expected for a source at one station recorded at the other location. This ambient-noise tomography approach was pioneered in Australia by Saygin (2007), using the continuous data recordings at the portable stations, in association with permanent seismic stations, to link different experiments. The main signal comes from high-frequency surface waves which provide imaging of upper crustal structure and are particularly sensitive to the presence of sediments (Saygin and Kennett, 2010). Surface wave tomography The earthquake belts to the north of Australia along the Indonesian arc into New Guinea, and to the east in the Tonga-Fiji zone, provide frequent seismic events of suitable magnitude to be recorded well in Australia. There are less common events to the south, along the mid-oceanic ridge between Australia and Antarctica, but these are important in providing additional directional control. A number of different techniques have been used to analyse the large-amplitude surface waves which arrive late in the seismogram, and, from the combinations of results from many paths, to extract 3D models of the seismic shear wavespeed distribution (e.g., van der Hilst et al., 1998; Debayle and Kennett, 2000, 2003; Kennett et al., 2004a, b; Fishwick et al., 2005, 2008; Yoshizawa and Kennett, 2004; Fichtner et al., 2009, 2010). Most of the methods rely on some approximations to wave propagation in three dimensions, but the work of Fitchner et al. (2009, 2010) uses full seismogram calculations in a 3D model. In consequence, the frequency range used is restricted, to prevent excessive computational requirements. Fortunately, the results with this sophisticated analysis indicate that the longer wavelength features obtained with the approximate methods are confirmed.
88
Figure 1. Seismic shear-wavespeed structure in central and eastern Australia determined from surface wave tomography. (a)–(c) Continental scale measurements of seismic wavespeed variation and anisotropy at 100, 150, and 200 km depths, inferred from the analysis of surface waves. The direction of the solid blue lines reflects the orientation of the direction of fast propagation, and the length of the line is proportional to the magnitude of the anisotropy. (d) Orientation of the fast polarisation plane, as inferred from shear-wave splitting measurements performed on core refracted shear waves. The length of each line is proportional to the delay, dt, between the arrival of the fast and slow S waves. Null measurements are displayed as light blue crosses, with lines orientated parallel and perpendicular to the direction of propagation (after Fishwick et al., 2008). The position of seismic line 08GA-OM1 (GOMA) is indicated by the red line in each panel.
89
We can now have considerable confidence in the main structures in the lithosphere at a horizontal scale of about 200 km and a vertical resolution around 30 km. Figure 1 illustrates the shear wave structure in central and eastern Australia from the work of Fishwick et al. (2008). The variations in seismic S wave velocity are displayed as perturbations from the reference model ak135 (Kennett et al., 1995), whose shallow properties represent a reasonable continental average.
Regions with faster S wavespeed than the reference model are indicated by blue tones, and zones with slower S wavespeed are shown by brown tones in Figure 1. Reductions in seismic wavespeed are expected from the influence of temperature or the presence of volatiles. The strong reductions in S wavespeed beneath the Tasman Sea are likely to be related to the heat leading to the opening of the sea and the continuing, minor hotspot activity which has built the seamount chains. Faster wavespeeds are produced by cooler temperatures, but the very fast perturbations seen in Figure 1b are very difficult to produce by temperature alone, and suggest the presence of chemical heterogeneity. The analysis by Fishwick et al. (2008) allows for the possibility of variations in the speed of wave propagation with direction, and the blue lines in Figure 1 indicate the direction of fast propagation of the surface waves and the relative magnitude of the variations. In the uppermost mantle, the dominant direction has a strong easterly component (Figure 1a). There is a strong shift in the directions of fast wave propagation towards the north in the deeper lithosphere (Figure 1c), which is likely to arise from the interaction of the lithosphere and the underlying asthenosphere. The transition of the anisotropy within the lithosphere in Australia is globally distinct, and appears to be linked to the very high rates of movement of the lithospheric plate (around 7 cm y-1 to the north). There are very distinct horizontal contrasts in seismic wavespeeds, which shift in depth, and Fishwick et al. (2008) postulate three distinct steps in lithospheric thickness between the central Precambrian core of the continent and the east coast. As can be seen from Figure 1, there is a significant embayment in the fast wavespeeds at 200 km depth, close to the line of the (GOMA) seismic survey. A strong gradient in crustal thickness occurs in a similar zone (Figure 3), and so both features may be inherited from the complex evolution of lithospheric structure.
Figure 2. Seismic shear-wavespeed structure in central and eastern Australia, determined from surface wave tomography at a depth of 75 km showing the pronounced zone of reduced shear wavespeeds in central Australia. The position of the GOMA seismic line, 08GA-OM1, is indicated by the red line.
90
The mantle lithosphere below 100 km is marked by distinct fast seismic wavespeeds, but at about 75 km there is an indication of somewhat reduced wavespeeds (Figure 2), which may be linked in part to the presence of thickened crust. This feature is not associated with enhanced seismic attenuation, as might be expected if the cause was a concentration of radioactivity in the uppermost mantle. The cratons of Western Australia are very clear in Figure 2, with rather high seismic wavespeeds. Receiver function studies A powerful method to extract information on crustal structure is the analysis of the conversions and reverberations immediately following the onset of the P wave for distant earthquakes using the receiver function technique. The two horizontal components of motion are combined to produce records with polarisation along (radial) and perpendicular (tangential) to the great circle back to the source. The rotated components are then deconvolved using the vertical component of motion that represents dominantly P waves. In this way, the influence of the source is largely eliminated, and attention is focused on wave propagation processes close to the receiver. When there is little energy on the tangential receiver function, 3D structural variation is weak, and then an inversion may be made using a radial receiver function for an effective 1D structure in the neighbourhood of the receiver (see e.g., Shibutani, 1996; Sambridge, 1999). Alternative approaches use stacking of receiver functions to emphasis features such as the conversion from the crust-mantle boundary and hence constrain the Moho depth. The moveout pattern of conversions and multiples from different source distances can be used to constrain the depth of seismic boundaries and Vp/Vs ratios (Zhu and Kanamori, 2000). It also can be advantageous to make a partial allowance for the influence of the free-surface on the seismograms by a rotation of components in the vertical plane or a transformation (see, e.g., Reading et al., 2003). The first systematic treatment of receiver function results across Australia were made by Clitheroe et al. (2000a, b) with an emphasis on the thickness of the crust and also the base of sediments; a few of these stations lie in the zone near the GOMA seismic line. Saygin (2007) undertook receiver function studies for the stations in the TASMAL network deployed from 2003-2005, for which a number of stations lie along the Oodnadatta Track not far from the reflection profile. In 2008, a total of 25 broadband stations were deployed along the Stuart and Barkly highways in the BILBY experiment, with the aim of providing linking information between the southern and northern Australian cratons. The experimental design was modified somewhat to make sure that there would be broadband stations in close proximity to the GOMA seismic reflection line. In some parts, the Stuart Highway lies very close to the Adelaide to Darwin railway (the location of the GOMA line) and so nearly coincident information can be obtained. Additional information is available from AuScope deployments of short-period instruments in the Gawler Craton (2008-2009) and the Curnamona Province (2009-2010); in this case, the seismometers have a narrower frequency response than the broadband seismometers, but are still useful for defining major discontinuities within, and at the base of, the crust. The GOMA seismic reflection profile and the Stuart Highway lie close to a major transition in crustal structure, with substantial thinning of the crust towards the east. In consequence, some care needs to be taken to get the best results by concentrating attention on waves arriving from azimuthal segments close to north (or south), rather than using events from the Tonga-Kermadec subduction zone. With this restriction, it is possible to obtain effective results for the S wave distribution, through the crust and into the uppermost mantle, from the analysis of the receiver functions for most of the BILBY stations. The estimates of crustal thickness derived from the receiver function analysis are summarised in Figure 3, and are plotted alongside results derived from refraction experiments. In each case, the crust-mantle boundary is taken at the base of the transition to mantle seismic velocities (P wavespeeds above 7.9 km s-1 or shear wavespeeds above 4.4 km s-1). In addition, estimates of the depth to Moho derived from the GOMA line and other reflection lines in the vicinity are included. There is a close correspondence in the estimates from the different techniques and station deployments, even though the methods of analysis differ somewhat. Fortunately, most of the portable seismic stations appear to lie in zones without any dramatic steps in the Moho. The profile of crust thickness along the zone sampled by the GOMA profile has a similar
91
configuration to that seen on the reflection image and, in consequence, the receiver function results provide a check on the calibration of the time-depth conversion for the reflection results.
Figure 3. Estimates of crustal thickness derived from refraction experiments (triangles) and receiver function studies (diamonds – broadband stations, circles – short-period stations, pentagons – stations from the BILBY array closest to 08GA-OM1, less reliable results indicated by open symbols). Moho estimates from seismic reflection work are indicated by the dense lines of triangles. The reflection estimates for O8GA-OM1 are displaced very slightly west on the figure so that a comparison can be made with the BILBY stations. The background contours of Moho thickness have been derived without including the BILBY stations.
92
The background contour plot of the Moho in Figure 3 has been derived from a continent-wide synthesis of results, using all receiver functions (except BILBY) and the refraction data from the compilation of Collins et al. (2003), with some additional control from seismic reflection experiments. Additional data from the Flinders Ranges and Curnamona Province have yet to be incorporated, and will lead to modifications of the contours in these areas. Discussion and conclusions Passive seismic methods exploiting natural events provide valuable information on 3D variations in lithospheric structure, which can be helpful in the interpretation of other classes of information, such as reflection seismic profiles. Surface wave tomography provides information on mantle structure, with the most reliable results available below 75 km depth. At shallower depth, there is a strong influence from the crustal structure along the various paths, and crustal structure can be mapped into the uppermost mantle – especially where the crust is thick. Body wave tomography, exploiting the times of arrival of seismic phases from regional and teleseismic events, can provide constraints on crustal structure when stations are sufficiently close together. The body wave portion of the seismograms from distant earthquakes yields additional information on the structure in the crust and uppermost mantle from the analysis of receiver functions. Access issues meant that it was not possible to deploy a broad swath of stations around the GOMA seismic reflection line, but, when such a swath can be achieved, the arrival times of all available earthquakes can be used in a tomographic inversion to determine the 3D structure in the crust and upper part of the mantle (see, e.g., Rawlinson and Kennett, 2008). A further source of information on crustal structure comes from ambient noise studies, which provide fresh insight into horizontal variability in a depth range that hitherto has been hard to access. More than 1100 paths across the Australian continent have been analysed (Saygin and Kennett, 2010), and the results combined in a tomographic analysis at each frequency, working with the group velocity of the high frequency surface waves (the velocity of energy propagation). Because of the large contrasts in velocity, it is necessary to take care in the tomographic inversion, and the results in Figure 4 have employed nonlinear inversion, with multiple iterations and re-raytracing at each stage. (a) (b)
Figure 4. Images of seismic group velocity across the continent based on ambient noise tomography: (a) Map at 5 s period – dominated by influence of sediments, (b) Map at 12.5 s period – main influence from crustal variations (after Saygin and Kennett, 2010).The position of the GOMA line is indicated by the red line in each panel. The results at the higher frequencies show strong influence from sediments, particularly thicker sedimentary basins. The presence of sediments reduces the group velocity of the surface
93
waves, and hence registers as reddish colours in Figure 4a. There are also hints of internal structure in the faster (blue) zones, which in the centre and west of Australia mirror the presence of cratonic material. At lower frequencies (Figure 4b), the causes for velocity variation need to be sought in the mid-crust, and low group velocity is likely to arise from strong thermal input. There is good general agreement with the current estimates of crustal temperature, although the eastern anomalies in group velocity are more marked. The distribution of drillholes, from which temperature estimates have been derived, is very uneven and the ambient noise studies provide a much more even continental coverage. Across the zone traversed by the GOMA survey, the influence of the sediments in the Officer Basin is apparent in Figure 4a, but the zone of faster group velocity is almost continuous in Figure 4b. These results are consistent with the seismic reflection images which show a distinct surface sedimentary package, but general continuity of crustal structure. The dip in the group velocity in Figure 4b occurs in close to the zone (CDPs 26000-28000) where there is striking evidence for large displacements in the depth of the crust-mantle boundary. Acknowledgements The deployments of portable broadband stations across Australia have depended on the efforts of many people often working in trying circumstances. Particular thanks are due to John Grant, Steve Sirotjuk and Qi Li for their major role in maintaining equipment and logistics, and to Armando Arciadiaco for field support and a critical role in data handling and organisation. The BILBY experiment was led by Dr Sara Pozgay. Receiver function results draw on the work of Drs Geoff Clitheroe, Erdinc Saygin, Michelle Salmon and Elizabeth Vanacore. References Clitheroe, G., Gudmundsson, O. and Kennett, B.L.N., 2000a. The crustal thickness of Australia.
Journal of Geophysical Research, 105, 13697-13713. Clitheroe, G., Gudmundsson, O. and Kennett, B.L.N., 2000b. Sedimentary and upper-crustal
structure of Australia from receiver functions. Australian Journal of Earth Sciences, 47, 209-216.
Collins, C.D.N., Drummond, B.J. and Nicoll, M.G., 2003. Crustal thickness patterns in the Australian continent. In: Müller, D. and Hillis, R. (eds) The Evolution and Dynamics of the Australian Plate. Geological Society of Australia Special Publication 22 and Geological Society of America Special Paper, 372, 121-128.
Debayle, E. and Kennett, B.L.N., 2000. The Australian continental upper mantle - structure and deformation inferred from surface waves. Journal of Geophysical Research, 105, 25443-25540.
Debayle, E. and Kennett, B.L.N., 2003. Surface wave studies of the Australian region. In: Müller, D. and Hillis, R. (eds) The Evolution and Dynamics of the Australian Plate. Geological Society of Australia Special Publication 22 and Geological Society of America Special Paper, 372, 25-40.
Fichtner, A., Kennett, B.L.N., Igel, H. and Bunge, H.-P., 2009. Full seismic waveform tomography for upper-mantle structure in the Australasian region using adjoint methods. Geophysical Journal International, 179, 1703-1725.
Fichtner A., Kennett B.L.N., Igel H. and Bunge H.-P., 2010. Full seismic waveform tomography for radially anisotropic structure: New insights into the past and present states of the Australasian upper mantle. Earth and Planetary Science Letters, 290, 270-280.
Fishwick, S., Kennett, B.L.N. and Reading, A.M., 2005. Contrasts in lithospheric structure within the Australian Craton. Earth and Planetary Science Letters, 231, 163-176.
Fishwick, S., Heintz, M., Kennett, B.L.N., Reading, A.M. and Yoshizawa K., 2008. Steps in lithospheric thickness within eastern Australia, evidence from surface wave tomography. Tectonics, 27(4), TC0049, doi:10.129/2007TC002116.
Kennett, B.L.N., 2003. Seismic Structure in the mantle beneath Australia. In: Müller, D. and Hillis, R. (eds) The Evolution and Dynamics of the Australian Plate. Geological Society of Australia Special Publication 22 and Geological Society of America Special Paper, 372, 7-23.
Kennett, B.L.N., Engdahl, E.R. and Buland, R., 1995. Constraints on seismic velocities in the Earth from travel times. Geophysical Journal International, 122, 108-124.
94
Kennett, B.L.N., Fishwick, S., Reading, A.M. and Rawlinson N., 2004a. Contrasts in mantle structure beneath Australia – relation to Tasman Lines? Australian Journal of Earth Sciences, 51, 563-569.
Kennett, B.L.N., Fishwick, S. and Heintz M., 2004b. Lithospheric structure in the Australian region - a synthesis of surface wave and body wave studies. Exploration Geophysics, 35, 258-266.
Rawlinson, N. and Kennett, B.L.N., 2008. Teleseismic tomography of the upper mantle beneath the southern Lachlan Orogen, Australia. Physics of the Earth and Planetary Interiors, 167, 84-97.
Reading, A., Kennett, B. and Sambridge, M., 2003. Improved inversion for seismic structure using transformed S-wavector receiver functions: removing the effect of the free surface. Geophysical Research Letters, 30(19) 1981; doi: 10.1029/2003GL018090.
Saygin, E., 2007. Seismic receiver and noise correlation based studies in Australia. Australian National University, Canberra, PhD thesis (unpublished).
Saygin, E. and Kennett, B.L.N., 2010. Ambient noise tomography for the Australian Continent. Tectonophysics, 481, 116-125, doi:10.106/j.tecto.2008.11.013.
Shibutani, T., Sambridge, M. and Kennett, B.L.N., 1996. Genetic algorithm inversion for receiver functions with application to crust and uppermost mantle structure beneath Eastern Australia. Geophysical Research Letters, 23, 1829-1832.
Sambridge, M.S., 1999. Geophysical inversion with a neighbourhood algorithm – I. Searching a parameter space. Geophysical Journal International, 138, 479-494.
van der Hilst, R.D., Kennett, B.L.N. and Shibutani, T., 1998. Upper mantle structure beneath Australia from portable array deployments. In: Braun, J. et al. (eds) The Structure and Evolution of the Australian Lithosphere. Geodynamics Monograph 26, 39-58, American Geophysical Union.
Yoshizawa, K. and Kennett, B.L.N., 2004. Multi-mode surface wave tomography for the Australian region using a 3-stage approach incorporating finite frequency effects. Journal of Geophysical Research, 109, B02310; doi: 10.129/2002JB002254.
Zhu, L. and Kanamori, H., 2000. Moho depth variation in southern California from teleseismic receiver functions. Journal of Geophysical Research, 105, 2969-2980.
95
3D geophysical modelling of the northern Gawler Craton, South Australia
G. Baines1, D. Giles1 and P.G. Betts2
1 Centre for Mineral Exploration Under Cover, University of Adelaide, Adelaide,
SA 5005, Australia 2 School of Geosciences, Monash University, Melbourne, VIC 3800, Australia
Introduction The GOMA seismic reflection profile (Figures 1 to 3) provides a 2D whole of crust cross section of the Australian crust, from the northern Gawler Craton to the Amadeus Basin (Korsch et al., 2010). To better understand the broader context of the structures and features imaged along this profile, and the significance of interpretations made from it, we must look beyond this line at the complex 3D geology in the region. Here, we present the results of constrained 3D inversions of potential field data, used to determine the architecture of the northern Gawler Craton and its boundary with the Musgrave Province. Although inversions present physical property models which are inherently nonunique, by applying available a priori geological and geophysical constraints, including reflectors imaged on the GOMA line, the degrees of freedom available to these models are reduced, and they are more likely to reproduce the underlying geology. Results of these inversions are compared to the GOMA seismic reflection profile, and an integrated interpretation provides a better framework for the interpretation of the geology along this profile. For example, in the southern Coober Pedy Domain, high reflectivity in the upper crust coincides with dense, magnetic regions in the inversion models, and, therefore, is attributed to magnetite-rich banded iron formation. Major, north-dipping, crustal-scale reflections in the Nawa Domain are associated with shallowly sourced gravity and magnetic anomalies evident in the inversion results. This observation is consistent with anomalies sourced from heterogeneous and deformed metasedimentary rocks overlying a relatively uniform basement. Large potential field anomalies over the eastern Officer Basin are due to significant changes in the bulk physical properties of the basement. In the seismic data, this region marks a transition in reflectivity between the crust of the Musgrave Province and that of the Nawa Domain, but details of this transition are poorly imaged. Potential field data allow better constraints to be placed on this transition, and highlights a major boundary along the Middle Bore Fault at the northern margin of the Wintinna Trough. 3D potential field inversions Although the modelling of potential field data is nonunique, numerical inversions allow models to be generated objectively to indicate the characteristics of sources which can produce the observed potential field anomalies. We performed unconstrained and constrained inversions for density and magnetic susceptibility using the University of British Columbia’s grav3d and mag3d inversion software (Li and Oldenburg, 1996, 1998), of the region surrounding the GOMA seismic line, in order to better understand the significance of structures imaged on that line. The constrained inversion results are shown in Figure 4.
96
Figure 1. Reduced to pole magnetic anomaly map of the northern Gawler Craton, with a tilt derivative intensity drape.
97
Figure 2. Bouguer anomaly map of the northern Gawler Craton. Rectangles show the outlines of the 3D inverse models.
98
Figure 3. Solid geology map of the northern Gawler Craton interpreted from potential field data. Rectangles show the outlines of the 3D inverse models.
99
The part of the northern Gawler Craton which coincides with the GOMA seismic line was split into two separate regions in order to facilitate the inversion process. The first region corresponds to the eastern Officer Basin surrounding Marla, and the second region to the area of the Murloocoppie and Coober Pedy 1:250 000 map sheets. Models were defined with a lateral resolution of 1 km by 1 km over the central part of the region, with increasing cell size with depth, from a minimum cell size of 100 m, which was necessary to account for topography. In order to prepare the data, gravity data were taken from observed stations; where multiple data points were located in a single grid cell, the measurements were averaged using a block median approach. Magnetic data were upward continued to 1 km and then down-sampled. To maintain a tractable data set for inversion, the magnetic data were then decimated by a factor of two (~14 000 points). A regional scale model (5 km by 5 km lateral grid) for the entire northern Gawler Craton was used to calculate, and then remove, the regional gravity and magnetic anomalies from the data within the more detailed grids. Constrained inversions Although unconstrained inversions provide a useful first step in the modelling of potential field data (Figures 5b, f and 6b, f), it is possible to include several constraints into inverse models (Williams, 2008; Lelièvre and Oldenburg, 2009; Lelièvre et al., 2009). These constraints can be considered to fall into two general categories:
1. Property constraints: the property of a model cell is explicitly constrained either through the use of an initial or reference model, or properties are constrained to lie within certain limits (bounds). This is particularly useful when the physical properties have been measured.
2. Structural constraints: model properties are allowed to vary more in certain directions or across certain cell boundaries on the basis of known or inferred geological or geophysical data. For example, a seismic reflection represents a change in acoustic impedance which may or may not coincide with a change in magnetic properties. In this case, we can specify a structural constraint in our susceptibility inversion such that the inverse model will allow higher gradients in magnetic properties across the location of the reflection, without requiring there to be such a change in the magnetic properties.
Both techniques have their own benefits and limitations in terms of how rigorously or loosely they influence the resulting models, and both types of constraints are applied to generate the constrained inverse models presented here. In these inversions, we specify an initial model, constrain the model parameters to fall within certain bounds during subsequent inversions, and specify a complex weighting function to encourage structures to localise where seismic reflections are observed (Figures 7 and 8). We do not specify a reference model beyond the default used by the UBC-GIF software. Surface geology The mapped surficial geology was simplified into seven units on the basis of stratigraphic age, and constraints on model parameters were applied, as given in Table 1. Although the assigned constraints were defined on the basis of observations made across the region, the area of interest is large and encompasses significant geological variability, so the assigned properties bounds were specified so that they form relatively loose constraints. Drillhole stratigraphy Many drillholes penetrate the region and provide further constraints on the subsurface geology (information available from http://www.pir.sa.gov.au/sarig). The available drillhole stratigraphic data were simplified according to Table 1, and properties were applied to the models as bounds on parameters. Where multiple units are contained within a single cell, the assigned properties were calculated as an average which was weighted according to the length of drillhole intersection in that model cell.
100
(4a)
(4b)
Figure 4. 3D isosurface plots from the inversion models for the two regions modelled. a) Combined results of constrained susceptibility inversions (isosurface = 0.04 SI). b) Combined results from density inversions (the red isosurface is 0.05 g/cc whereas the blue isosurface is -0.1g/cc).
101
Table 1. Initial properties and bounds on properties used in the constrained models.
Density (gcm-3) Magnetic Susceptibility
(SI ×10-5) Unit Initial Lower Upper Initial Lower Upper
Figure 5. Results of preliminary 3D inversions overlain on the GOMA seismic line from the Christie Domain to the Nawa Domain (28-30°S), crossing major potential field anomalies associated with the Coober Pedy Domain (CPR) and Mabel Creek Ridge (MCR). KSZ – Karari Shear Zone, HCF – Horse Camp Fault (Korsch et al., 2010).
102
Figure 5 continued. Results of preliminary 3D inversions overlain on the GOMA seismic line from the Christie Domain to the Nawa Domain (28-30°S), crossing major potential field anomalies associated with the Coober Pedy Domain (CPR) and Mabel Creek Ridge (MCR). KSZ – Karari Shear Zone, HCF – Horse Camp Fault (Korsch et al., 2010).
Petrophysical measurements Where available, petrophysical measurements from drillholes provide the tightest constraints on physical property models. These constraints were applied as bounds on the model parameters, using the 95% confidence limits on the mean of measurements within individual cells. Seismic reflections The locations of seismic reflections from the GOMA seismic line, as well as previous seismic lines (74OF-01, 78OF-01, 83OF-01, 84OF-01, 85AK-01, 85OF-01, 86AK-01, 86OF-01, 87OF-01, 93OF-02), were used to apply structural constraints on the returned models by specifying a complex weighting function (Figures 7d and 8d). This weighting function has the effect of encouraging more structure in the models where reflections are observed. Geological structures often coincide with major changes or gradients in physical properties. Hence, major geological boundaries will be imaged as contrasts or gradients in physical properties, regardless of the technique which is applied. By modifying the inversion of one dataset to allow, but not require, large property gradients where there are structures imaged by another technique, we can produce results that more closely approximate the underlying geology.
103
Figure 6. Results of preliminary 3D inversions extracted along the GOMA seismic line, from the Nawa Domain to the Musgrave Province. This line crosses a major magnetic anomaly which coincides with the uplifted Ammaroodinna Ridge and Marla Overthrust Zone, and crosses the northeast limit of a major gravity anomaly, whose southern boundary is marked by the Middle Bore Fault (MBF).
Results A clear benefit of the constrained inversions is demonstrated by the modelling of negative gravity anomalies associated with the narrow Permian troughs (Figure 5, CDPs 8000-10000). In the unconstrained inversions, there is significant smearing of these anomalies to greater depths. By incorporating constraints, however, the low density anomalies associated with these basins are modelled at shallow depths, and the low density bodies at depth are much reduced in amplitude, highlighting that it is most likely an artefact of the inversion process, and this reflects the relative insensitivity of gravity and magnetic data to horizontal layering. A second example of this effect is shown by models of the Munyarai Trough (Figure 6, CDPs 22400-24500). Without constraints, a large negative density body is produced in the lower crust, but with constraints, this body is brought to shallow depths (Figure 6). Crosssections through the inversions along the GOMA seismic profile provide an independent means of constraining the nature and significance of the basement structures imaged by the seismic lines. We highlight several of these features: 1) the zone of high reflectivity in the upper crust of the Coober Pedy Domain, 2) the north-dipping crustal-scale shear zones in the Nawa Domain, and 3) large anomalies which coincide with the Marla Trough and Ammaroodinna Ridge.
104
Figure 6 continued. Results of preliminary 3D inversions extracted along the GOMA seismic line, from the Nawa Domain to the Musgrave Province. This line crosses a major magnetic anomaly which coincides with the uplifted Ammaroodinna Ridge and Marla Overthrust Zone, and crosses the northeast limit of a major gravity anomaly, whose southern boundary is marked by the Middle Bore Fault (MBF).
A region of high reflectivity in the upper crust of the Coober Pedy Domain coincides with an upper crustal density and magnetic susceptibility feature. Given the texture observed on magnetic data and drillhole observations in the region, the zone of high reflectivity is most feasibly interpreted as a region of deformed and folded magnetite-rich, banded iron formation. Major, north-dipping, crustal-scale reflections in the Nawa Domain are associated with shallowly-sourced anomalies. Positive density and magnetic susceptibility bodies preferentially occur in the hangingwalls of these structures. These shallow anomalies may reflect the relative deformation and uplift of slightly more dense and magnetic layers within the metasedimentary gneiss (Payne et al., 2006, 2008), and the lack of large or deep anomalous bodies implies that underlying crust is relatively uniform. This inference is confirmed by the observed similarities in crustal reflectivity across these structures. As a cautionary note, on the magnetic inversions a dipping susceptibility body is imaged which parallels these structures (Figure 5), however, this anomaly is largely due to a shallow remnantly magnetised intrusive body (R), so the apparent correlation with the north-dipping structures is most likely to be an artefact of the inversion process. Major potential field anomalies can be used to delineate the northern boundary of the Gawler Craton. In the Cadney Park Seismic Subdomain, where major basement structures are inferred to be located (e.g., Baines et al., 2009; Selway et al., 2011) the basement is relatively poorly imaged in the GOMA seismic line, in part possibly due to poor signal penetration through the overlying basins. But, importantly, this region marks a transition in reflectivity structure between crust of the Musgrave Province and that of the Nawa Domain (see Korsch et al., 2010). Although a major structure, the Sarda Bluff Fault, is interpreted to the north of the Ammaroodinna Ridge (Korsch et al., 2010), and coincides with the northern boundary of a crustal body with strong magnetic properties, this boundary in the potential field data is the
105
northernmost of three significant boundaries which delineate and separate large scale anomalous density and magnetic susceptibility bodies in the inversions (Figures 4 and 6). The significance of these bodies remains unclear, as two of these boundaries have a minimal basement reflectivity signature on the GOMA seismic line. The north-dipping boundary, between the positive density body and positive magnetic susceptibility body at CDP ~20500, corresponds to a poorly-resolved, north-dipping basement reflection imaged to the west during survey 93OF-02, which is older than the Cambrian Marla Group. Although, the steeply-dipping southern boundary to the largest density body, directly correlates with the Middle Bore Fault, a fault zone that appears to have been active most recently as a strike-slip fault and cuts sediments of the Arckaringa Basin (?Late Carboniferous to Early Permian), but was also active between the deposition of Neoproterozoic sediments preserved in the Wintinna Trough and the unconformably overlying Cambrian sediments of the Marla Group. This steeply-dipping fault is poorly resolved by the GOMA seismic profile within the basement and, consequently, potential field modelling remains one of the best methods to characterise the subsurface in this area of limited seismic signal.
Figure 7. Constraints applied to constrained 3D inversions (in Figure 5c, g) from the Christie Domain to the Nawa Domain (28-30°S) projected on the GOMA seismic line.
Significantly, the Middle Bore Fault represents a transition in the potential field data, from the shallow, coincident sources of positive gravity and magnetic anomalies in the south, to large, offset anomaly sources in the vicinity of the Ammaroodinna Ridge. The constrained inversions allow us to demonstrate that these anomalies are not solely the result of the uplifted basement of the Ammaroodinna Ridge but, instead, reflect a significant change in crustal properties.
106
Consequently, while basement to the north of the Sarda Bluff Fault is likely to have an affinity with the Musgrave Province, and crust to the south of the Middle Bore Fault with the Gawler Craton, the intervening region is significantly different in terms of its potential field signature, and is electrically resistive, suggesting greater affinity to the Musgrave Province (Selway et al., 2011). The geodynamic and tectonic significance of this region has yet to be fully established, but recent and ongoing geochronology and isotope work (Jagodzinski and Reid, 2010; Armit et al., 2010; Betts et al., 2010) has an important bearing on the interpretation of this region, and hence an understanding how the observed architecture developed.
Figure 8. Constraints applied to constrained 3D inversions (in Figure 6c, g) from the Nawa Domain to the Musgrave Province projected on the GOMA seismic line.
References Armit, R., Betts, P.G. and Schaefer, B.F., 2010. Lu-Hf isotope characteristics of the marginal
terranes of the northern Gawler Craton. Geoscience Australia, Record, 2010/39, 118-127.
Baines, G., Giles, D., Betts, P. and Backé, G., 2009. Geophysically imaging Paleoproterozoic terrane boundaries In the unexposed Northern Gawler Craton, Marla Region. Preview - Conference Handbook - 20th International Geophysical Conference and Exhibition, 138, 84.
Betts, P.G., Armit, R., Baines, G., Giles, D. and Schaefer, B., 2010. Crustal boundaries of the marginal terranes of the northern Gawler Craton. Geoscience Australia, Record, 2010/39, 128-137.
Jagodzinski, E.A. and Reid, A.J., 2010. New zircon and monazite geochronology using SHRIMP and LA-ICPMS, from recent GOMA drilling, on samples from the northern Gawler Craton. Geoscience Australia, Record, 2010/39, 108-117.
107
Korsch, R.J., Blewett, R.S., Giles, D., Reid, A.J., Neumann, N.L., Fraser, G.L., Holzschuh, J., Costelloe, Roy, I.G., Kennett, B.L.N., W.M. Cowley, Baines, G., Carr, L.K., Duan, J., Milligan, P.R., Armit, R., Betts, P.G., Preiss, W.V. and Bendall, B.R., 2010. Geological interpretation of the deep seismic reflection and magnetotelluric line 08GA-OM1: Gawler Craton-Officer Basin-Musgrave Province-Amadeus Basin (GOMA), South Australia and Northern Territory. Geoscience Australia, Record, 2010/39, 63-86.
Lelièvre, P.G. and Oldenburg, D.W., 2009. A comprehensive study of including structural orientation information in geophysical inversions. Geophysical Journal International, 178, 623-637.
Lelièvre, P.G., Oldenburg, D.W. and Williams, N.C., 2009. Integrating geological and geophysical data through advanced constrained inversions. Exploration Geophysics, 40, 334-341.
Li, Y. and Oldenburg, D.W., 1996. 3-D inversion of magnetic data. Geophysics, 61, 394-408. Li, Y. and Oldenburg, D.W., 1998. 3-D inversion of gravity data. Geophysics, 63, 109-119. Payne, J.L., Barovich, K.M. and Hand, M., 2006. Provenance of metasedimentary rocks in the
Payne, J.L., Hand, M., Barovich, K.M. and Wade, B.P., 2008. Temporal constraints on the timing of high-grade metamorphism in the northern Gawler Craton implications for assembly of the Australian Proterozoic. Australian Journal of Earth Sciences, 55, 623-640.
Selway, K.M., Hand, M., Payne, J.L., Heinson, G.S. and Reid, A., 2011. Magnetotelluric constraints on the tectonic setting of Grenville-aged orogenesis in central Australia. Journal of the Geological Society, London, 168, in press.
Williams, N.C., 2008. Geologically Constrained UBC-GIF Gravity and Magnetic Inversions with Examples from the Agnew-Wiluna Greenstone Belt, Western Australia. University of British Columbia, Vancouver, PhD Thesis (unpublished).
108
New zircon and monazite geochronology using SHRIMP and LA-ICPMS, from recent GOMA
drilling, on samples from the northern Gawler Craton
E.A. Jagodzinski and A.J. Reid
Geological Survey of South Australia, Primary Industries and Resources South
Australia (PIRSA), GPO Box 1671, Adelaide, SA 5001, Australia
New U-Pb zircon ages are available for the undercover and underexplored Nawa Domain on the northwest margin of the Gawler Craton (Table 1). The ages are derived from six samples collected from four drillholes located along the GOMA (Gawler Craton-Officer Basin-Musgrave Province-Amadeus Basin) seismic line (Figure 1). The drilling program was designed to compliment and contribute to the GOMA deep seismic reflection survey. The aim was to collect and study fresh Precambrian basement from diamond drillcore, and use the geological and geochronological information derived to constrain the interpretation of the new seismic data, and other geophysical data available for the region. The results of the drilling have been reported in Dutch et al. (2010). Paleoproterozoic basement gneisses and granitoids were intersected in three drillholes (GOMA DH1, DH2 and DH4). Drilling in GOMA DH3 failed to penetrate an overlying, thick, massive quartzite unit, thought to be Neoproterozoic to Cambrian in age. Samples from GOMA DH1 and 4 were analysed by SHRIMP at Geoscience Australia, whereas samples from GOMA DH2 and 3, including both zircon and monazite, were analysed at the University of Adelaide using the laser ablation-inductively coupled plasma mass spectrometry (LA-ICPMS) method. A detailed description of this geochronological study will be available in Jagodzinski et al. (in prep). 207Pb/206Pb age spectra for all samples are presented in Figure 2.
Geological setting Located on the northern margin of the Gawler Craton, the Nawa Domain lies at the junction between the South Australian Craton, the central Australian Mesoproterozoic Musgrave Province and the North and West Australian Cratons. Understanding the sedimentary provenance and the thermal and tectonic histories of this key region clearly has considerable significance to tectonic reconstructions of Proterozoic terranes. Lithostratigraphic information about the Nawa Domain is limited, based on only a limited number of drillholes that penetrate the Paleo-Mesoproterozoic crystalline basement. Known lithologies consist of pelitic to psammitic units, and include the iron-rich Moondrah Gneiss, iron formation, carbonate and granitic gneiss (Parker et al., 1993, Daly et al., 1998). An igneous crystallisation age of 1740 ± 31 Ma has been obtained previously from an interpreted granitic gneiss from the Yoolperlunna Inlier (Fanning et al., 2007). A recent provenance study found that metasedimentary rocks of the Nawa Domain were deposited between ca. 1740 Ma and 1720 Ma, immediately prior to the Kimban Orogeny (Payne et al., 2006). Detrital zircon ages range predominantly between 1740 Ma and 1840 Ma, with little or no Archean detritus, despite the current proximity of the region to the late Archean domains of the Gawler Craton. Significantly, no detrital age peak corresponding to the 1860–1850 Ma
109
Donington Suite, a large-volume felsic intrusive suite from the eastern Gawler Craton, was recorded. On this basis, Payne et al. (2006) suggest that the older parts of the Gawler Craton was not a major source of detritus for the metasedimentary rocks of the Nawa Domain, and postulate a more juvenile provenance, possibly the Arunta Region in central Australia. The metamorphic grade of the Nawa Domain is variable, ranging from greenschist facies schists to granulites, which include the ultra-high temperature quartz-sapphirine-bearing granulites of the Moondrah Gneiss from the Ooldea DDH2 drillhole. Available geochronology indicates that the region has experienced several metamorphic events. These include:
1. 1730–1690 Ma high-grade Kimban Orogeny (Payne et al., 2008); 2. ca. 1660 Ma Ooldean Event in the Moondrah Gneiss (Teasdale, 1997; Dutch and Hand,
2009); 3. ca. 1570–1550 Ma Kararan Orogeny (Daly et al., 1998; Payne et al., 2008); and 4. reactivation of pre-existing structures at ca. 1450 Ma (Fraser and Lyons, 2006).
Table 1. Summary of geochronology results for the 2009-2010 GOMA drilling program.
* MDA = maximum age of deposition. Ages are in Ma. Two possible interpretations are included for sample R1707908.
Results and interpretation GOMA DH1 GOMA DH1, located just south of the Horse Camp Fault (Korsch et al., 2010), between the Coober Pedy and Mabel Creek domains, penetrated ca. 5 metres of dark quartz–feldspar–biotite–magnetite orthogneiss, with a well-developed and intense gneissic fabric subparallel to the long axis of the drillcore. Contained within this unit are two thin, relatively-undeformed granitic units, which may be dykes. These units are medium-grained and have a dominantly quartz–feldspar ± biotite composition. SHRIMP data from concentrically-zoned, igneous zircon cores yield a crystallisation age of 1919 ± 8 Ma for the orthogneiss (MSWD = 1.3, probability = 0.18, n = 18; Figure 2A). Four analyses are slightly older (ca. 1970 Ma) and probably represent minor inheritance. This is the first evidence of a ca. 1920 Ma thermal event in the Gawler Craton. No magmatism has been recorded previously between ca. 2000 Ma, when the protoliths of the Miltalie Gneiss were emplaced, and intrusion of the Donington Suite at 1850-1860 Ma.
110
Figure 1. Map showing the solid geology of the region covered by the GOMA seismic line (08GA-OM1) from the northern Gawler Craton to the southern Amadeus Basin, draped over a first vertical derivative image of aeromagnetic data. The solid geology for South Australia is from Cowley (2006a, 2006b, which also contains the legend), and the Northern Territory part is from Ahmad (2002). The GOMA seismic transect is shown by the bold black line, with CDP stations marked. Yellow circles show the locations of GOMA drillholes as reported by Dutch et al. (2010) and discussed here. Also shown, by the hatched lines, is the domain subdivision of the northern Gawler Craton, after Ferris et al. (2002), with domain names marked.
111
Figure 2. 207Pb/206Pb age spectra for six samples from the Nawa Domain, combining probability density distributions and histograms of individual ages (generated using AgeDisplay, Sircombe, 2005). Frequency values on the y axis refer to the histograms. The probability curves have no scale. Light grey curves represent all data. Dark grey are data filtered at 95% concordance. Insets are cathodoluminescence zircon images (scalebar 100 µm). A backscattered electron image of monazite is inset in Figure 2D, which also has a different scalebar.
112
Metamorphic overgrowths yield a weighted mean 207Pb/206Pb age of 1686 ± 5 Ma (MSWD = 1.2, probability = 0.3, n = 15; Figure 2A), indicating that the gneissic fabric developed during the late stages of the Kimban Orogeny. Seven younger rim analyses range down to ca. 1600 Ma in age with a minor peak at ca. 1650 Ma (Figure 2A), suggesting post-Kimban resetting, possibly during the Ooldean Event (Teasdale, 1997; Fanning et al., 2007; Dutch and Hand, 2009). Further isotopic disturbance may have occurred coincident with ca. 1570 Ma emplacement of the granitic dykes (see below). Zircons within a comparatively undeformed granitic dyke have concentrically-zoned igneous cores, mantled by dark, homogenous metamorphic rims (Figure 2B inset). Cores and rims are chemically and morphologically distinct, indicating two distinct phases of zircon growth, but are indistinguishable in age. Six analyses of metamorphic rims yield a weighted mean 207Pb/206Pb age of 1568 ± 10 Ma (MSWD = 1.7, probability = 0.12; Figure 2B). Twelve of thirteen analyses of cores yield an age of 1569 ± 10 Ma (MSWD = 1.2, probability = 0.29). The near identical ages of the zircon cores and rims suggest that the granite dykes were metamorphosed soon after emplacement, and indicate possibly that the granite was emplaced during a high-heat flow tectonothermal event. All analyses are combined to produce the best estimate for the age of the thermal event of 1568 ± 6 Ma (MSWD = 1.3, probability = 0.19, n = 18), encompassing emplacement of the granites and penecontemporaneous heating. GOMA DH2 The dominant basement lithology in the northernmost drillhole, GOMA DH2, is a pervasively-weathered, medium-grained, highly-deformed and, in places, apparently migmatitic, sillimanite–biotite–quartz–feldspar–bearing paragneiss. Fine-grained biotite microgneiss, interpreted to be highly weathered amphibolite dykes, likely intruded into the sedimentary pile and were deformed along with the metasedimentary rocks. The paragneiss has a LA-ICPMS detrital zircon spectrum similar to those recorded by Payne et al. (2006), with deposition occurring between ca. 1740 Ma and 1720 Ma, ages predominantly ranging between 1900 Ma and 1740 Ma, and a notable absence of 1860-1850 Ma grains (Figure 2C). The late Paleoproterozoic-Neoarchean is more significantly represented, however, with about a third of the analyses falling into this age range (ca. 2570-1925 Ma, Figure 2C). The dominant zircon population is the youngest, and constrains the maximum age of deposition (Dmax) with a weighted mean 207Pb/206Pb age of 1743 ± 10 Ma (n = 16, MSWD = 0.54, probability = 0.92; Figure 2C). Monazite LA-ICPMS U-Pb data indicate that metamorphism and development of the biotite-sillimanite fabric occurred at 1734 ± 8 Ma (n= 24, MSWD = 1.01, probability = 0.44). Older monazite cores are preserved, and interestingly, suggest a ca. 1865 Ma source, although this age population is not represented in the zircons (Figure 2D). The precise age of formation of each of these ‘inherited’ monazite cores is not certain, however, despite the data being mostly concordant, as partial recrystallisation may have modified these ages, given the somewhat nebulous appearance of the older ‘cores’ in backscatter images. The timing of metamorphism within this sample is within uncertainty of the age of the Kimban Orogeny identified across the entire Gawler Craton, including the Nawa Domain (Payne et al., 2008). The Kimban Orogeny is generally inferred to have begun at ca. 1730 Ma in the southern Gawler Craton, with deformation, metamorphism and associated magmatism continuing until ca. 1690 Ma. GOMA DH3 Drilling intersected ca. 6 metres of local regolith, possibly part of the Pleistocene Russo beds, and ca. 70 metres of (interpreted) Bulldog Shale (Cretaceous), before penetrating a well-bedded, fine- to coarse-grained quartzite. This unit was unexpected and its stratigraphic position remains ambiguous. Dutch et al. (2010) suggest it may be a correlative of the Neoproterozoic Pindyin Sandstone, which is the basal unit of the Officer Basin (see Preiss et al., 2010) overlying the basement of the Yoolperlunna Inlier to the north.
113
The bulk of the LA-ICPMS zircon analyses form a bimodal age distribution (Figure 2E) with weighted mean 207Pb/206Pb ages of 1736 ± 10 Ma (n = 17, MSWD = 1.13, probability = 0.32) and 1589 ± 11 Ma (n = 17, MSWD = 1.05, probability = 0.40). Only one grain yielded a Mesoarchean age, ca. 3180 Ma. Eight grains are younger than ca. 1400 Ma. The five youngest concordant analyses, with a weighted mean 207Pb/206Pb age of 1131 ± 27 Ma (MSWD = 0.77, probability = 0.55; Figure 2E), provide a maximum depositional age of the sandstone. Clearly, the provenance of the sandstone is dominated by grains with ages between ca. 1790 Ma and 1550 Ma. Rock-forming events of this age are present within the northern Gawler Craton, including the 1740 ± 31 Ma granitic gneiss within the Yoolperlunna Inlier, and numerous rocks within the Peake and Dension Domain located further to the east (Fanning et al., 2007). The 1590-1570 Ma interval represents a major period of magmatic activity in the Gawler Craton, namely, the Hiltaba Suite-Gawler Range Volcanics magmatic event. Interestingly, in a number of geochronology studies from the northern Gawler Craton, there have been no ca. 1590 Ma magmatic rocks identified north of the Mabel Creek Domain or the Peake and Denison Domain (Payne et al., 2006, 2008; Fanning et al., 2007). Therefore, the present result is quite interesting in that it implies that either the source of these ca. 1590 Ma grains is distal to the depositional site of the sandstone, or that ca. 1590 Ma magmatic rocks could be located in the far northern Gawler Craton, much further north than previously documented. It is also important to recognise the contribution of ca. 1130 Ma grains to the provenance of this sample. These grains are derived most likely from the Musgrave Province, where voluminous I-type magmatism of the Pitjantjatjara Supersuite occurred between ca. 1190 and 1120 Ma (Edgoose et al., 2004). The present sample also preserves one grain with an age of ca. 1340 Ma, which also may be derived from volumetrically-minor metaigneous rocks found in the western Musgrave Province (White et al., 1999). Thus, there is evidence for at least some input of detrital zircons from the Musgrave Province into the provenance of the GOMA DH3 sandstone. This recognition makes it difficult to ascribe unequivocally the ca. 1590 Ma grains to a Gawler Craton origin, since ca. 1590 to 1550 Ma granitic rocks have also been dated in the Musgrave Province (Camacho and Fanning, 1995; Young et al., 1995; Scrimgeour et al., 1999). The stratigraphic position of this sandstone is uncertain; it may be either Neoproterozoic or Cambrian in age. The maximum depositional age from zircon dating cannot distinguish between these two alternatives. Until more work is done on type sections of sedimentary rocks in the Officer Basin, definitive correlations through detrital zircon dating is not possible. GOMA DH4 GOMA DH4, located north of Mabel Creek Domain, contains three different lithologies. The upper part of the drillcore is dominated by medium-grained, equigranular K-feldspar–quartz–plagioclase ± biotite granite, which has no visible structural fabric. The drillcore has an extremely pitted and vuggy surface. These cavities may indicate that this was a high level intrusion. Below the undeformed granite is a highly deformed biotite–quartz–feldspar orthogneiss, with pronounced gneissic layering at ~45° to the axis of the drillcore. The contact between the orthogneiss and the undeformed granite is distinct, and shows clearly that the granite is intrusive and crosscuts the gneissic foliation. There are also a number of granitic dykes of the same composition within the orthogneiss. Felsic pegmatitic veins, and a hornblende-bearing mafic dyke crosscut the gneissic fabric. The orthogneiss contains complex, multiphase zircons. The wide range of ages, illustrated in Figure 2G, reflects the presence of a large amount of inherited zircon (2680-3170 Ma), which occurs as older nuclei within zircon precipitated from the melt. The melt-precipitated zircon is represented by a dominant age peak at ca. 2520 Ma, which is the best estimate for the emplacement age of the granitoid protolith. The peak is asymmetric, with a tail of apparently young ages ranging down to ca. 2460 Ma, indicating the cores have seen some ancient Pb loss and/or isotopic resetting at this time. The zircon cores are mantled by low-U overgrowths, which are a distinctive white to light grey colour under cathodoluminescence (Figure 2G inset). The
114
overgrowths have a weighted mean 207Pb/206Pb age of 1521± 9 Ma (MSWD = 0.8, probability = 0.7, n = 16).
The age spectrum for the cores resembles those for metaigneous and metasedimentary rocks of the Mulgathing Complex (Jagodzinski et al., 2009), and ca. 2520 Ma volcanism is recorded in the komatiite sequences of the Harris Greenstone Belt (Swain et al., 2005). The orthogneiss might represent the northern extension of the Mulgathing Complex located, for the first time, north of the Karari Shear Zone in GOMA DH4, and forming the basement to the 1720-1740 Ma metasedimentary and metaigneous rocks of the Nawa domain.
Dating the high grade metamorphic event from these results is problematic, and we see two possible interpretations. The gneissic fabric could have developed at ca. 2460 Ma, coincident with the onset of the ca. 2470-2410 Ma Sleafordian Orogeny. Both zircon and monazite within metaigneous and metasedimentary rocks of the Mulgathing Complex commonly record prograde metamorphism at this time (McFarlane, 2006; Jagodzinski et al., 2009). The low-U rims then might represent a younger hydrothermal or magmatic event at ca. 1521 Ma. Alternately, the gneissic fabric could have developed at ca.1521 Ma, at the time the low-U overgrowths crystallised. Further work on the chemistry of these zircons is warranted to investigate the nature of the ca. 1521 zircon overgrowths and attempt to distinguish between a possible hydrothermal event or high grade metamorphism.
The undeformed granite intruding the GOMA DH4 paragneiss produced a low zircon yield, with a dominant age peak at 1757 ± 10 Ma (MSWD = 1.4, probability = 0.13, n = 15; Figure 2F), and two younger grains at ca. 1665 Ma (Figure 2F). The 1521 Ma overgrowths, which are a distinctive feature of the zircon population in the host orthogneiss, are not present in this sample. This implies that the granite is younger than ca. 1521 Ma, and that all zircon extracted and analysed is inherited.
Summary and conclusions The geochronology results outlined here both confirm existing age constraints and also present some exciting new timelines for magmatic and tectonothermal and/or fluid flow events in the northern Gawler Craton. Although derived from only three basement-intersecting drillholes, the geochronology reveals that the rocks record events which span nearly the entire spectrum of Gawler Craton geology from the Neoarchean to Mesoproterozoic. Significantly, the SHRIMP data from GOMA DH4 suggest that the basement to the metasedimentary material of the Nawa Domain is potentially Neoarchean to early Paleoproterozoic gneissic rocks similar to, and possibly directly correlative with, gneisses of the Mulgathing Complex. If this is substantiated, this has profound implications for the geodynamics of the Nawa Domain, and its relationship to that portion of the Gawler Craton to the south of the Karari Shear Zone. GOMA DH1 reveals a previously undocumented magmatic event at ca. 1920 Ma; an event not previously recognised in the Gawler Craton. Sedimentary rocks were then deposited onto this Paleoproterozoic (and possibly Neoarchean) basement, with maximum depositional ages of ca. 1740 Ma identified within GOMA DH2 as well as previous studies across the Nawa Domain (Payne et al., 2006). The widespread distribution of sediments with similar ca. 1740 Ma depositional ages suggests that the Nawa Domain hosts a significant Paleoproterozoic basin, or series of basins. Monazite geochronology from GOMA DH2 shows that the sediments of the Nawa Domain underwent high-metamorphic grade reworking during the Kimban Orogeny, with monazite ages clustering at ca. 1735 Ma. These monazite ages are significantly older than Kimban ages identified from metamorphic rims within the ca. 1920 Ma granite gneiss of GOMA DH1, which indicate metamorphism at ca. 1685 Ma. This, together with previous studies (see Payne et al., 2008, and references therein), point to the apparent diachroneity of the Kimban Orogeny across the northern Gawler Craton. In fact, the Kimban Orogeny is diachronous, and possibly discontinuous across the Gawler Craton as a whole (Parker, 1993). Some areas experienced metamorphism as early as 1735 to 1730 Ma (this study; Payne et al., 2008), others at ca. 1710-
115
1700 (e.g., Jagodzinski et al., 2006; Reid et al., 2007), and a number of localities yield younger ages, ca. 1690 Ma (e.g., Howard et al., 2008; Dutch et al., 2008); Dutch and Hand, 2009; this study). As previously recognised (Parker, 1993), the Kimban Orogeny was clearly a long-lived tectonothermal event, which resulted in craton-wide metamorphism, deformation and associated magmatism. Apart from several studies in the southern Gawler Craton (Parker et al., 1988; Parker, 1993; Tong et al., 2004; Dutch et al., 2008), a shortage of metamorphic studies on the Kimban Orogeny hampers our understanding of the style of this major orogenic event across the different regions of the craton, and more work on this event is clearly required. Geochronology from the granite in GOMA DH1 also reveals the presence of ca. 1570 Ma magmatism and near synchronous metamorphism, suggesting that the effects of the Kararan Orogeny, documented previously in the Coober Pedy Domain (e.g., Fanning et al., 2007; Hand et al., 2007), are also present in the Mabel Creek Domain. Aside from localised magmatism in the southern Gawler Craton (Spilsby Suite; Fanning et al., 2007), the presence of post-Kararan magmatism has not been demonstrated in the Gawler Craton, and the new dating from low U zircon rims within the paragneiss of GOMA DH4 may be an indication that fluid flow and/or magmatism continued across the Gawler Craton until ca. 1500 Ma. The extent of the youngest thermal events in the Gawler Craton is unknown, and further dating on undeformed granites in the Nawa Domain may lead to increased resolution of these younger events.
Acknowledgements We acknowledge the hard work of the team within the Geological Survey of South Australia responsible for the GOMA Drilling program, in particular Rian Dutch, Marc Davies and Mark Flintoft. SHRIMP geochronology is undertaken as part of a National Geoscience Agreement between Geoscience Australia (GA) and PIRSA. The Geochronology Project at GA is acknowledged for providing excellent preparation and analytical facilities, and for valuable discussions on the methods and specifics of the geochronology from the northern Gawler Craton. Thanks to Lindsay Highet for drafting Figure 1. Ben Wade at Adelaide Microscopy, the University of Adelaide, is acknowledged for his patient and cheerful assistance with the LA-ICPMS work undertaken by AR. References Ahmad, M., 2002. Geological map of the Northern Territory, 1:2 500 000. Northern Territory
Geological Survey. Camacho, A. and Fanning, C.M., 1995. Some isotopic constraints on the evolution of the
granulite and upper amphibolite facies terranes in the eastern Musgrave Block, central Australia. Precambrian Research, 71, 155-181.
Cowley, W.M., 2006a. Solid geology of South Australia: peeling away the cover. MESA Journal, 43, 4-15.
Cowley, W.M., compiler, 2006b. Solid geology of South Australia. South Australia Department of Primary Industries and Resources, Mineral Exploration Data Package, 15, version 1.1.
Daly, S.J., Fanning, C.M. and Fairclough, M.C., 1998. Tectonic evolution and exploration potential of the Gawler Craton, South Australia. AGSO Journal of Australian Geology and Geophysics, 17(3), 145-168.
Dutch, R., Hand, M. and Kinny, P.D., 2008. High-grade Paleoproterozoic reworking in the southeastern Gawler Craton, South Australia. Australian Journal of Earth Sciences, 55, 1063-1081.
Dutch, R. A. and Hand, M., 2009. EPMA monazite geochronological constraints on the timing of ultra-high temperature reworking in the western Gawler Craton. South Australia, Department of Primary Industries and Resources, Report Book, 2009/2.
Dutch, R., Davies, M.B., and Flintoft, M., 2010. Gawler-Officer-Musgrave-Amadeus (GOMA) drilling Project, northern Gawler Craton. South Australia, Department of Primary Industries and Resources, Report Book, 2010/02.
Edgoose, C., Scrimgeour, I. and Close, D., 2004. Geology of the Musgrave Block, Northern Territory. Northern Territory Geological Survey, Report, 15, 48 pp.
Fanning, C.M., Reid, A.J. and Teale, G.S., 2007. A geochronological framework for the Gawler Craton, South Australia. South Australia Geological Survey, Bulletin, 55, pp 258.
116
Ferris, G.M., Schwarz, M.P. and Heithersay, P., 2002. The geological framework, distribution and controls of Fe-oxide and related alteration, and Cu-Au mineralisation in the Gawler Craton, South Australia. Part I: geological and tectonic framework. In: Porter, T.M. (ed.) Hydrothermal iron oxide copper-gold and related deposits: A global perspective. Porter GeoConsultancy Publishing, Adelaide, 9-31.
Fraser, G.L. and Lyons, P., 2006. Timing of Mesoproterozoic tectonic activity in the northwestern Gawler Craton constrained by 40Ar/39Ar geochronology. Precambrian Research, 151, 160-184.
Hand, M., Reid, A. and Jagodzinski, E., 2007. Tectonic framework and evolution of the Gawler Craton, South Australia. Economic Geology, 102, 1377-1395.
Howard, K., Dutch, R., Hand, M., Barovich, K. and Reid, A., 2008. Unravelling the Fowler Domain: new geochronological data from the western Gawler Craton, South Australia. South Australia, Department of Primary Industries and Resources, Report Book, 2008/00010.
Jagodzinski, E.A., Black, L., Frew, R.A., Foudoulis, C., Reid, A., Payne, J., Zang, W. and Schwarz, M.P., 2006. Compilation of SHRIMP U-Pb geochronological data for the Gawler Craton, South Australia 2005-2006. South Australia, Department of Primary Industries and Resources, Report Book, 2006/20.
Jagodzinski, E.A., Reid, A.J. and Fraser, G., 2009. Compilation of SHRIMP U-Pb geochronological data for the Mulgathing Complex, Gawler Craton, South Australia, 2007–09. South Australia, Department of Primary Industries and Resources, Report Book, 2009/00016.
Jagodzinski, E.A., Reid, A.J. and Dutch R.A., in preparation. New zircon and monazite geochronology via SHRIMP and LA-ICPMS for the northern Gawler Craton, from recent Gawler-Officer-Musgrave-Amadeus (GOMA) drilling. South Australia, Department of Primary Industries and Resources, Report Book.
Korsch, R.J., Blewett, R.S., Giles, D., Reid, A.J., Neumann, N.L., Fraser, G.L., Holzschuh, J., Costelloe, Roy, I.G., Kennett, B.L.N., W.M. Cowley, Baines, G., Carr, L.K., Duan, J., Milligan, P.R., Armit, R., Betts, P.G., Preiss, W.V. and Bendall, B.R., 2010. Geological interpretation of the deep seismic reflection and magnetotelluric line 08GA-OM1: Gawler Craton-Officer Basin-Musgrave Province-Amadeus Basin (GOMA), South Australia and Northern Territory. Geoscience Australia, Record, 2010/39, 63-86.
McFarlane, C.R.M., 2006. Palaeoproterozoic evolution of the Challenger Au deposit, South Australia, from monazite geochronology. Journal of Metamorphic Geology, 24, 75–87.
Parker, A.J., Preiss, W.V. and Rankin, L.R., 1993. Geological framework. In: Drexel, J.F., Preiss, W.V. and Parker, A.J. (eds) The geology of South Australia; Volume 1, The Precambrian. Geological Survey of South Australia, Bulletin 54, 8-31.
Parker, A.J., 1993. Kimban Orogeny. In: Drexel, J.F., Preiss, W.V. and Parker, A.J. (eds) The geology of South Australia; Volume 1, The Precambrian. Geological Survey of South Australia, Bulletin, 54, 71-82.
Parker, A.J., Fanning, C.M., Flint, R.B., Martin, A.R. and Rankin, L.R., 1988. Archaean - early Proterozoic granitoids, metasediments and mylonites of southern Eyre Peninsula, South Australia. Geological Society of Australia, Specialist Group in Tectonics and Structural Geology, Field Guide, 2, 90 pp.
Payne, J.L., Barovich, K. and Hand M., 2006. Provenance of metasedimentary rocks in the northern Gawler Craton, Australia: implications for Palaeoproterozoic reconstructions. Precambrian Research, 148, 275–291.
Payne, J.L., Hand, M., Barovich, K.M. and Wade, B.P., 2008. Temporal constraints on the timing of high-grade metamorphism in the northern Gawler Craton: implications for assembly of the Australian Proterozoic. Australian Journal of Earth Sciences, 55, 623-640.
Preiss, W.V., Korsch, R.J. and Carr, L.K., 2010. 2008 Gawler Craton-Officer Basin-Musgrave Province-Amadeus Basin (GOMA) seismic survey, 08GA-OM1: Geological interpretation of the Officer Basin. Geoscience Australia, Record, 2010/39, 32-46.
Reid, A., Vassallo, J., Wilson, C.J.L. and Fanning, C.M., 2007. Timing of the Kimban Orogeny on southern Eyre Peninsula. South Australia, Department of Primary Industries and Resources, Report Book, 2007/5.
Scrimgeour, I.R., Close, D.F. and Edgoose, C.J., 1999. Petermann Ranges, N. T. Northern Territory Geological Survey sheet SG52-7 explanatory notes. Northern Territory Geological Survey, Darwin.
117
Sircombe, K.N., 2005. AgeDisplay: an EXCEL workbook to evaluate and display univariate geochronological data using binned frequency histograms and probability density distributions. Computers and Geosciences, 30, 21-31.
Swain, G., Woodhouse, A., Hand, M., Barovich, K., Schwarz, M. and Fanning, C.M., 2005. Provenance and tectonic development of the late Archaean Gawler Craton, Australia; U-Pb zircon, geochemical and Sm-Nd isotopic implications. Precambrian Research, 141, 106-136.
Teasdale, J., 1997. Methods for understanding poorly exposed terranes: the interpretive geology and tectonothermal evolution of the western Gawler Craton. University of Adelaide, PhD thesis (unpublished).
Tong, L., Wilson, C.J.L. and Vassallo, J.J., 2004. Metamorphic evolution and reworking of the Sleaford Complex metapelites in the southern Eyre Peninsula, South Australia. Australian Journal of Earth Sciences, 51, 571-589.
White, R.W., Clarke, G. and Nelson, D.R., 1999. SHRIMP U-Pb zircon dating of Grenville-age events in the western part of the Musgrave Block, central Australia. Journal of Metamorphic Geology, 17, 465-481.
Young, D.N., Fanning, C.M., Shaw, R.D., Edgoose, C.J., Blake, D.H., Page, R.W. and Camacho, A., 1995. U-Pb zircon dating of tectonomagmatic events in the northern Arunta Inlier, central Australia. Precambrian Research, 71, 45-68.
118
Lu-Hf isotope characteristics of the marginal terranes of the northern Gawler Craton
R. Armit1, P.G. Betts1 and B.F. Schaefer2
1 School of Geosciences, Building 28, Monash University, VIC 3800, Australia 2 GEMOC, Department of Earth and Planetary Sciences, Macquarie University,
Introduction The use of in situ Lu-Hf isotope analysis, in conjunction with high precision SHRIMP II or LA-ICPMS U-Pb data on zircons, provides information about the age and the crustal evolution of source regions. This approach is particularly informative where there is the potential for multiple and separate events which might have temporal similarities, such as Proterozoic Australia, the evolution of which is punctuated by a series of these temporally similar, but separate, events (e.g., Belousova et al., 2002, 2006a, 2009; Howard et al., 2009). The large area of buried marginal terranes along the northern margin of the Gawler Craton can provide information about the Paleo-Mesoproterozoic interface between the North Australian Craton and South Australian Craton. As a component of an ARC linkage project (LP0882000 – Unearthing the Marginal Terranes of the South Australian Craton: Keystone of Proterozoic Australia), a drilling program was located to coincide with the southern section (Gawler Craton, Figure 1) of a seismic transect produced by Geoscience Australia (Korsch et al., 2010), as part of its Onshore Energy Security Program (OESP), in conjunction with Auscope and Primary Industries and Resources South Australia (PIRSA). This transect acquired seismic reflection, gravity and magnetotelluric data across the northern Gawler Craton, Officer Basin, Musgrave Province and Amadeus Basin (GOMA) in 2008. The drilling program sampled four drillholes (160.6 metres of core was recovered after 1084.6 total metres drilled) (Dutch et al., 2010). The cores intersected Paleo-Neoproterozoic basement-cover successions, extending northward from the Coober Pedy Ridge. These samples provide important constraints on the Proterozoic crustal evolution of the region. The results of these isotopic studies, when integrated within a wider framework encompassing seismic, potential field and MT profiles along the GOMA seismic line, support a series of crustal blocks which have quite similar crustal evolutions. If a major boundary in the northern Gawler Craton does, in fact, coincide with the Middle Bore Fault (Korsch et al., 2010; Baines et al., 2010, in review), then the crustal evolution of the blocks juxtaposed at this boundary may be quite different. Isotopic analysis of samples from these crustal blocks is used in this study, in an attempt to establish the validity of such a crustal-scale boundary. Hf-isotope analysis In situ Lu-Hf isotope analysis on zircon was undertaken using LA-ICPMS facilities at the Department of Earth and Planetary Sciences, Macquarie University, Sydney for zircons with pre-existing precision SHRIMP II or LA-ICPMS U-Pb ages (Jagodzinski and Reid, 2010). Analysis of in situ Hf isotopes was undertaken on a New Wave/Merchantek LUV213 laser-ablation microprobe with a Nu Plasma multicollector attached. A 30 µm to 50µm spot was used, depending on the size of the sample zircon. A 5Hz repetition rate and 90% power output were used, with a 120 second acquisition time adjacent to the U-Pb pit, following the methodology in Griffin et al. (2004).
119
Figure 1. Composite gravity and 1VD RTP magnetic response of the northern Gawler Craton, showing locations of the GOMA seismic line, drillholes and U/Pb ages (white ages are crystallisation and detrital ages, red ages are metamorphic ages). Additional drillholes currently under analysis are also identified (08RDMC01-04 in the Mabel Creek Ridge, and EWHDDH01-02 located 30 kilometres east of the GOMA DH3).
120
176Hf/177Hf ratio precision in this study has a typical 2SE of + 0.000019. Calculations of the εHf values utilised the chondrite values of Blichert-Toft et al. (1997). Crustal model ages (TDM
C) were calculated (two stage model ages) from the initial 176Hf/177Hf, assuming that a parental magma for the zircons was produced from an average continental crust with a mean crustal value of176Lu/177Hf of 0.0015 (Griffin et al., 2002).
GOMA DH1 The southernmost GOMA drillhole (GOMA DH1) is located in the Coober Pedy Ridge, proximal to its northern limit (Figure 1). Drilling intersected basement of orthogneiss at 305.15 metres (Dutch et al., 2010). A sample (307.65-307.85 metres) of this quartz-feldspar-biotite-magnetite gneiss (R1707895) was taken for isotopic analysis. Zircons extracted from this interval have oscillatory zoned, igneous-derived cores, which yield a weighted mean 207Pb/206Pb crystallisation age of 1919 ± 9 Ma (Jagodzinski and Reid, 2010). More homogeneous metamorphic overgrowths around these cores have a 1690 ± 8 Ma weighted mean 207Pb/206Pb age (Jagodzinski and Reid, 2010). Intruding the Paleoproterozoic orthogneisses are a series of granitic dykes, which appear undeformed with respect to the surrounding orthogneiss. A sample of one of these intrusions was collected from the interval 308.7-308.9 metres (R1707896) and consists of a fine-grained biotite tonalite composition (Jagodzinski et al., 2010). Zircons recovered from this tonalite had distinct cores and rims but were impossible to differentiate temporally. The combined weighted mean average 207Pb/206Pb age of 1571 ± 5 Ma is recorded for the thermal event responsible for the emplacement of these tonalite bodies (Jagodzinski and Reid, 2010).
Figure 2. Hf characteristics of orthogneiss (R1707895) and biotite tonalite (R1707896) from GOMA DH1. Calculated crustal evolution trajectory range (grey path) are from two-stage model (crustal) ages, assuming that a parental magma for the zircons was produced from an average continental crust with a mean crustal value of176Lu/177Hf of 0.0015 (Griffin et al., 2002). The TDM
C range for the Paleoproterozoic orthogneiss and the intrusive biotite tonalite is 2.25-2.6 Ga. U-Pb ages are calculated 207Pb/206Pb ages from Jagodzinski and Reid (2010). The ca. 1919 Ma orthogneiss has relatively unevolved Hf characteristics, with quite a restricted range of initial 176Hf/177Hf values between 0.281556 and 0.281638 (εHf range of -1 to +4), and a TDM
c range between 2.25-2.6 Ga (Figure 2). This would indicate that the ca. 1919 Ma event represents intracrustal reworking of relatively juvenile ca. 2.5 Ga material. This integrated U-Pb-Hf ca. 1919 Ma event signature is similar to a number of detrital zircon populations from the Arunta Region to the north, such as the Utopia Quartzite and Ledan Schist (Hollis et al., 2010),
121
and is also similar to a quartzite in the Kingston Inlier of the Peake and Denison Inliers. This quartzite, which has a weighted mean average 207Pb/206Pb population at 1921 ± 11 Ma (n = 8, MSWD = 0.24, probability = 0.88) ,also has a similar, less evolved Hf signature to the orthogneiss in GOMA DH1, with initial 176Hf/177Hf values from 0.281595 to 0.281620 (εHf range of +2.9 to +3.5) and a 2.3-2.75 Ga TDM
c age range (Figure 3). As ca. 1919 Ma events are rare across the continent, the orthogneiss might represent a source terrane for the Paleoproterozoic sedimentary rocks.
Figure 3. Initial 176Hf/177Hf plots of metasedimentary rocks from the Peake (PK), Eastern (JI) and Kingston (KING) Inliers of the Peake and Denison region. U/Pb ages from Ross (unpublished data). Insert shows the relative probability plots for each of the inliers. Grey path shows a 2.3 to 2.75 range of TDM
c ages for all the Paleoproterozoic zircons in these sedimentary rocks. The subsequent metamorphism of the ca. 1919 Ma orthogneiss, at ca. 1690 Ma, produced zircon growth which retains the Hf characteristic of the pre-existing orthogneiss, and implies that the system remains relatively closed to additional Hf sources between 1919 Ma and 1690 Ma. The zircon Hf characteristics of the ca. 1571 Ma tonalite is relatively evolved, with a range of initial 176Hf/177Hf values between 0.281612 and 0.281742 (εHf (1571Ma) -7 to -2). This range straddles the crustal evolution line calculated for the older orthogneiss, and is consistent with a 2.25-2.6 Ga crustal model age (TDM
c). Hence the ca. 1571 Ma biotite tonalite can be interpreted as an anatectic body, derived from melting of the Paleoproterozoic orthogneiss. GOMA DH4 To the north of the Mabel Creek Ridge, in the Nawa Domain, GOMA DH4 (Figure 1) was drilled to a depth of 516.8 metres penetrating basement at a depth of 462 metres. 50.9 metres of core in the basement was retrieved to reveal an undeformed, vuggy, quartz monzonite with an intrusive contact with a quartz-feldspar-biotite-hornblende paragneiss (Dutch et al., 2010; Jagodzinski et al., 2010). A sample of this paragneiss (R1707908) was taken at 510 metres for geochronological analysis. Along with many older grains, this sample yielded a weighted mean average 207Pb/206Pb population of 2462 ± 17 Ma (n = 4, MSWD = 0.19, probability = 0.91), regarded as the maximum depositional age for this Late Archean to Early Paleoproterozoic paragneiss (Jagodzinski and Reid, 2010). Additional zircon populations within this paragneiss include a dominant ca. 2590-2490 Ma 207Pb/206Pb age range, with xenocrystic cores having a ca. 3170-2680 Ma 207Pb/206Pb age range. Analysis of metamorphic overgrowths on these detrital zircons revealed a 207Pb/206Pb age of 1523 ± 10 Ma (n =16, MSWD = 0.7, probability = 0.79) (Jagodzinski and Reid, 2010). A sample of the intruding quartz monzonite (R1707904), from 484 metres, yielded a single igneous population with a weighted mean average 207Pb/206Pb population at 1759 ± 11 Ma (n =15, MSWD = 1.4, probability = 0.14). The lack of deformation and metamorphism of the quartz monzonite is interpreted to constrain its emplacement to post
122
ca. 1523 Ma, implying that the ca. 1759 Ma zircon population is an inherited population (Jagodzinski et al., 2010; Jagodzinski and Reid, 2010). The Archean to Early Proterozoic detrital zircons share a similar Hf crustal evolution trajectory with a TDM
c of 3.08-3.52 Ga (Figure 4). The ca. 3170-2680 Ma xenocrystic cores have initial 176Hf/177Hf values between 0.280803 and 0.281031 (εHf range of -4 to +6), whereas the slightly younger ca. 2462-2590 Ma zircons have initial 176Hf/177Hf values between 0.280933 and 0.281133 (εHf range of -8 to +2). This indicates that the source region for these detrital zircons underwent reworking of relatively juvenile, pre-3.0 Ga crust, during a ca. 2.5 Ga event. The ca. 1523 Ma zircon overgrowths display highly evolved Hf signatures with initial 176Hf/177Hf values between 0.281011 and 0.281150 (εHf range of +23 to +28.5), which indicates that the Hf is sourced from the reworking of evolved Archean crust during the ca. 1523 Ma event. The Hf signature of the ca. 1759 Ma zircons from the quartz monzonite is markedly different from the paragneiss. These zircons have initial 176Hf/177Hf values between 0.28144 and 0.28172 (εHf range of -8 to +2), with a TDM
c range of 2.88-2.32 Ga. As such, the quartz monzonite most probably is sourced from intracrustal reworking of ca. 2.5 Ga material which was less evolved than the Late Archean-Early Proterozoic paragneiss it intrudes.
GOMA DH2 GOMA DH2 was positioned to target the basement Yoolperlunna Inlier some 30 kilometres northeast of the GOMA seismic transect line. A total of 88.6 metres were drilled, intersecting a basement of paragneiss at 52 metres (Dutch et al., 2010). A sample of this paragneiss (R1707899), consisting of a highly deformed and partially migmatitic assemblage of sillimanite-biotite-feldspar, was taken from the interval 75.4 to 75.8 metres. Zircons from this interval reveal a maximum depositional, weighted mean average 207Pb/206Pb age of 1743 ± 10 Ma (n = 16, MSWD = 0.54, probability = 0.92) (Jagodzinski and Reid, 2010), which is similar in age to other metasedimentary rocks of the Nawa Domain (Payne et al., 2006). The metamorphism, which affected the sedimentary protolith to the paragneiss in GOMA DH2, is recorded in the growth of monazite at 1735 ± 8 Ma (n = 24, MSWD = 1.01, probability = 0.44), and correlates with the high temperature, low pressure metamorphism during the ca. 1730-1700 Ma Kimban Orogeny, which affected parts of the Gawler Craton including the Nawa Domain (Payne et al., 2008).
Figure 4. Two-stage Hf model age for Archean paragneiss and younger Proterozoic quartz monzonite in GOMA DH4. TDM
c values show a distinctly younger 2.32 to 2.88 Ga range (light grey trajectory) for the quartz monzonite (R1707904), compared to the 3.08 to 3.52 Ga range (dark grey trajectory) for the Late Archean-Early Paleoproterozoic paragneiss (R1707908).
123
Figure 5. Initial 176Hf/177Hf plots of the GOMA DH2 Paleoproterozoic paragneiss (R1707899). Graph shows the isotopic similarity between the Paleoproterozoic zircons in the paragneiss (TDM
c range between 2.12 and 2.8 Ga) to those from the quartz monzonite in GOMA DH4 (TDMc
range of 2.32 to 2.88 Ga). The Hf character of the ca. 1743 Ma zircons shows a spread of initial 176Hf/177Hf values between 0.281492 and 0.281808 (εHf values from -7 to +5), indicating a mixed population source, with both less evolved and reworked components (Figure 5). The two-stage model ages (TDM
C), correspondingly, have a large range between 2.12 Ga and 2.8 Ga. This range is similar to the ca. 1759 Ma inherited zircon population in GOMA DH4 (Figure 5). These model ages correlate with ca. 1743 Ma zircon populations across the southern and central Gawler Craton (Belousova et al., 2009). The less evolved Hf component in ca. 1743 Ma zircons from the paragneiss in GOMA DH2, however, also can be correlated with units in the Arunta Region, such as the ca. 1730 Ma Kanandra Granulite, which has a TDM
c range between 2.28 and 2.72 Ga (Hollis et al., 2010). The Paleoproterozoic Lu-Hf evolution of the GOMA DH2 paragneiss also displays a similar pattern to that of wholerock Sm-Nd of metasedimentary rocks from the Nawa Domain (e.g., Payne et al., 2006), whereby the evolution of the Paleoproterozoic metasedimentary rocks in GOMA DH2 evolved, in part, from a less evolved source than the average Archean-derived crust of the Gawler Craton (Belousova et al., 2006b). Thus, the Paleoproterozoic paragneiss in GOMA DH2, which appears to be isotopically comparable to those in the Nawa Domain, also may have an Arunta provenance (Payne et al., 2006). Pre-2000 Ma detrital zircons in the GOMA DH2 paragneiss have a TDM
C of 2.72 to 2.92 Ga (Figure 5), indicating they evolved from reworked pre-2.72 Ga relatively juvenile material. GOMA DH3 Drilling 10 kilometres southeast of Marla was conducted to target the basement on the Amaroodinna Inlier (GOMA DH3). Drilling was ceased after 169.3 metres without intersecting basement (Dutch et al., 2010). Nevertheless, a sample of quartzite from 155.08-155.91 metres was processed for zircons (R1707903). These detrital zircons record an age spectra with a weighted mean average 207Pb/206Pb maximum depositional age of 1131 ± 27 (n =8, MSWD = 0.77, probability = 0.55). Additional populations at 1589 ± 11 (n = 17, MSWD = 1.05, probability = 0.40) and 1736 ± 10 Ma (n = 17, MSWD = 1.13, probability = 0.32) are also present in this quartzite sample (Jagodzinski and Reid, 2010).
124
The Hf characteristics of these zircon populations reveal two different model crustal evolution paths. A more evolved evolution, with a TDM
c range of 2.2 to 2.6 Ga (Figure 6) for a ca. 1736 Ma zircon population, is akin to the crustal Hf evolution of the Paleoproterozoic gneiss in GOMA DH2. These ca. 1736 zircons have an initial 176Hf/177Hf value range between 0.28155 and 0.28178 (εHf values from -3.3 to +3.4). Straddling the same crustal evolution path are a subset of more evolved, ca. 1589 Ma (176Hf/177Hf values below 0.2818) and ca. 1131 Ma zircon populations (176Hf/177Hf values below 0.28193). A second, less-evolved model crustal evolution is apparent for ca. 1589 Ma (176Hf/177Hf values above 0.28190), 1550-1500 Ma (176Hf/177Hf values above 0.28194) and ca. 1131 Ma (176Hf/177Hf values above 0.28213) zircon populations, with a TDM
c of 1.8 to 2.0 Ga (Figure 6). This notably less-evolved material is interpreted to represent provenance from the Musgrave Province, where arc-like Musgravian gneiss was emplaced at ca. 1590-1550 Ma, with a Nd (TDM) age range of 1.95-2.15 Ga (Wade et al., 2006) and subsequently reworked during 1190-1120 Ma magmatism (Pitjantjatjara Supersuite) (Edgoose et al., 2004). Therefore, it is possible that there are two separate source terranes for the post-1600 Ma zircons. Certainly, the Hf characteristics of the more evolved ca. 1589 Ma zircons resemble those found in the Gawler Craton (Belousova et al., 2009), Mount Painter Inlier and Curnamona Province (Figure 7). Mafic members of the Gawler Range Volcanics, however, have εHf(1592Ma) between -6.7 to +7.4 from wholerock Hf data (Fricke, 2005), and could also provide a source for the observed, more juvenile Hf in the post ca. 1600 Ma zircons found in the GOMA DH3 quartzite. Lu-Hf isotopic comparison of this quartzite with the ca. 882 Ma Irindina Metamorphics in the basal supersequence of the Irindina Province (Figure 6), indicates a similar, mixed crustal evolution, with a TDM
c range of 2400-1560 Ma (Hollis et al., 2010). Within the Officer Basin, Sm-Nd isotopic analysis reveals that only the lowermost Callana Group, consisting of the Pindyin Sandstone and Alinya Formation, has evolved, reworked Paleo-Mesoproterozoic compositions, with the upper units becoming progressively more dominated by Musgrave detritus (Wade et al., 2005). This supports correlation of the sandstone in GOMA DH3 with the Pindyin Sandstone of the Officer Basin (Jagodzinski and Reid, 2010).
Figure 6. Hf model crustal evolution plot for GOMA DH3 quartzite. Two distinct TDM
c ranges exist for detrital zircons in the sample (R1707903): a less evolved 1.8 to 2.0 Ga range (light grey trajectory), and a more evolved 2.2 to 2.6 Ga range (dark grey trajectory).
125
Figure 7. Initial 176/177Hf ratios for GOMA DH3 quartzite (R1707903) compared to Paleo-Mesoproterozoic zircon populations from the Mount Painter Inlier (Armit, unpublished), the Benagerie Ridge of the Curnamona Province (Jagodzinski and Fricke, 2010) and Terranechron dataset for the Gawler Craton (Belousova et al., 2009). A similar, evolved Hf signature (dark grey trajectory) is apparent for the Curnamona, Gawler, and a subset of the post-1600 Ma GOMA DH3 zircons. A less evolved signature (light grey trajectory) for a subset of post-1600 Ma zircons might indicate two separate sources existed for the post-1600 Ma zircon populations.
Summary Lu-Hf isotope analysis of the GOMA drillholes shows evidence for reworked 2.5 Ga Gawler-derived material, and the incorporation of younger, less-evolved, ca. 1743 Ma and 1590-1550 Ma, zircon populations. It is difficult to compare isotopically the Paleo-Neoproterozoic metasedimentary drillhole intersections in the northern holes (GOMA DH2 and GOMA DH3) to Paleoproterozoic orthogneisses and Archean paragneisses in the southern holes (GOMA DH1 and GOMA DH4). These basement intersections represent only small dataset over a large area (over 200 kilometres between GOMA DH1 and GOMA DH2), and, most probably correspond to a variety of crustal levels. Therefore, we are unable to validate the presence of any major crustal discontinuity in the marginal terranes of the northern Gawler Craton using the isotopic compositions of zircons from the GOMA drill program. Isotopic similarities, however, appear to exist between the Paleoproterozoic gneiss in GOMA DH2, to units in both the Arunta Region and Gawler Craton. The ca. 1919 Ma orthogneiss in GOMA DH1 is interpreted to have formed during intracrustal reworking of quite juvenile ca. 2.5 Ga material. Juvenile inputs are recorded at ca. 2.5 Ga across the Gawler Craton (e.g., Belousova et al., 2009) and, as such, the orthogneiss in GOMA DH1 most likely records a discrete phase of reworked Gawler material at ca. 1919 Ma. Similar Paleoproterozoic-aged zircons, reflecting reworked ca. 2.5 Ga material, are present also in detrital zircon populations in the Peake and Denison Inlier. This might indicate that the northern Gawler Craton could be a source region for these Paleoproterozoic sedimentary rocks. There is also evidence for reworking of pre-3.0 Ga material in the Late Archean-Early Paleoproterozoic GOMA DH4 paragneiss. Evidence of Musgrave-derived, less-evolved, post-1600 Ma material coexisting with more-evolved, but temporally equivalent, material in GOMA DH3, most likely represents provenance from two separate sources, and would support a Neoproterozoic association between the Musgrave Province and the Gawler Craton. The Mount Painter and Benagerie Ridge regions of
126
the Curnamona Province (Jagodzinski and Fricke, 2010) preserve only evolved ca. 1590 Ma material with a TDMc of ca. 2.5 Ga with no evidence of less evolved (Musgravian) material ca. 1590 Ma. References Baines, G.A., Giles, D. and Betts, P.G., 2010. 3D geophysical modelling of the northern Gawler
Craton, South Australia. Geoscience Australia, Record, 2010/39, 95-107. Baines, G.A., Giles, D., Betts, P.G. and Backe, G., in Review. Locating a major Proterozoic
crustal boundary beneath the eastern Officer Basin, Australia. Precambrian Research. Belousova, E., Griffin, W., O'Reilly, S. and Fisher, N., 2002. Igneous zircon: trace element
composition as an indicator of source rock type. Contributions to Mineralogy and Petrology, 143, 602-622.
Belousova, E.A., Preiss, W.V., Schwarz, M.P. and Griffin, W.L., 2006a. Tectonic affinities of the Houghton Inlier, South Australia: U-Pb and Hf-isotope data from zircons in modern stream sediments. Australian Journal of Earth Sciences, 53, 971 - 989.
Belousova, E.A., Reid, A.J., Griffin, W.L. and O'Reilly, S.Y., 2006b. Proterozoic rejuvenation of the Archean Crust tracked by U-Pb and Hf-isotopes in Detrital Zircon. Geochimica et Cosmochimica Acta, 70, A44-A44.
Belousova, E.A., Reid, A.J., Griffin, W.L. and O'Reilly, S.Y., 2009. Rejuvenation vs. recycling of Archean crust in the Gawler Craton, South Australia: Evidence from U-Pb and Hf isotopes in detrital zircon. Lithos, 113, 570-582.
Blichert-Toft, J., Chauvel, C. and Albarède, F., 1997. Separation of Hf and Lu for high-precision isotope analysis of rock samples by magnetic sector-multiple collector ICP-MS. Contributions to Mineralogy and Petrology, 127, 248-260.
Dutch, R., Davies, M. and Flintoft, M., 2010. GOMA basement drilling program, northern Gawler Craton: South Australia. Department of Primary Industries and Resources, Report Book, 2010/2.
Edgoose, C.J., Scrimgeour, I.R. and Close, D.F., 2004. Geology of the Musgrave Block, Northern Territory. Northern Territory Geological Survey, Report, 15.
Fricke, C.E., 2005. Source and origin of the Lower Gawler Range Volcanics (GRV), South Australia: Geochemical contraints from mafic magmas. School of Geosciences, Monash University, Melbourne, B.Sc. (Hons) Thesis (unpublished).
Griffin, W.L., Belousova, E.A., Shee, S.R., Pearson, N.J. and O'Reilly, S.Y., 2004. Archean crustal evolution in the northern Yilgarn Craton: U-Pb and Hf-isotope evidence from detrital zircons. Precambrian Research, 131, 231-282.
Griffin, W.L., Wang, X., Jackson, S.E., Pearson, N.J., O’Reilly, S.Y., Xu, X., Zhou, X., 2002. Zircon chemistry and magma mixing, SE China: In-situ analysis of Hf isotopes, Tonglu and Pingtan igneous complexes. Lithos, 61, 237-269.
Hollis, J.A., Beyer, E.E., Whelan, J.A., Kemp, A.I.S., Scherstén, A. and Greig, A., 2010. Summary of results. NTGS laser U-Pb and Hf geochronology project: Pine Creek Orogen, Murphy Inlier, McArthur Basin and Arunta Region, July 2007 – June 2008. Northern Territory Geological Survey, Record, 2010-001.
Howard, K.E., Hand, M., Barovich, K.M., Reid, A., Wade, B.P. and Belousova, E.A., 2009. Detrital zircon ages: Improving interpretation via Nd and Hf isotopic data. Chemical Geology, 262, 277-292.
Jagodzinski, E.A., Dutch, R.A., Davies, M. and Flintoff, M., 2010. Digging up the dirt on the GOMA line. South Australian Resources and Energy Investment Conference, 2010, Technical Forum, Presentation,
http://www.pir.sa.gov.au/__data/assets/pdf_file/0004/132754/Liz_Jagodzinski.pdf Jagodzinski, E.A. and Fricke, C.E., 2010. Compilation of new SHRIMP U-Pb geochronological
data for the southern Curnamona Province, South Australia. Department of Primary Industries and Resources, Report Book, 2010/00014.
Jagodzinski, E.A. and Reid, A.J., 2010. New zircon and monazite geochronology using SHRIMP and LA-ICPMS, from recent GOMA drilling, on samples from the northern Gawler Craton. Geoscience Australia, Record, 2010/39, 108-117.
Korsch, R.J., Blewett, R.S., Giles, D., Reid, A.J., Neumann, N.L., Fraser, G.L., Holzschuh, J., Costelloe, Roy, I.G., Kennett, B.L.N., W.M. Cowley, Baines, G., Carr, L.K., Duan, J., Milligan, P.R., Armit, R., Betts, P.G., Preiss, W.V. and Bendall, B.R., 2010. Geological interpretation of the deep seismic reflection and magnetotelluric line 08GA-OM1:
127
Gawler Craton-Officer Basin-Musgrave Province-Amadeus Basin (GOMA), South Australia and Northern Territory. Geoscience Australia, Record, 2010/39, 63-86.
Payne, J.L., Barovich, K.M. and Hand, M., 2006. Provenance of metasedimentary rocks in the northern Gawler Craton, Australia: Implications for Palaeoproterozoic reconstructions. Precambrian Research, 148, 275-291.
Payne, J.L., Hand, M., Barovich, K.M. and Wade, B.P., 2008. Temporal constraints on the timing of high-grade metamorphism in the northern Gawler Craton: implications for assembly of the Australian Proterozoic. Australian Journal of Earth Sciences, 55, 623 - 640.
Wade, B.P., Barovich, K.M., Hand, M., Scrimgeour, I.R. and Close, D.F., 2006. Evidence for early Mesoproterozoic arc magmatism in the Musgrave Block, central Australia: Implications for Proterozoic crustal growth and tectonic reconstructions of Australia. Journal of Geology, 114, 43-63.
Wade, B.P., Hand, M. and Barovich, K.M., 2005. Nd isotopic and geochemical constraints on provenance of sedimentary rocks in the eastern Officer Basin, Australia: implications for the duration of the intracratonic Petermann Orogeny. Journal of the Geological Society, London, 162, 513-530.
128
Crustal boundaries of the marginal terranes of the northern Gawler Craton
P.G. Betts1, R. Armit1, G. Baines2, D. Giles2 and B.F. Schaefer3
1 School of Geosciences, Monash University, Melbourne, VIC 3800, Australia
2 Centre for Mineral Exploration Under Cover, University of Adelaide, Adelaide, SA 5005, Australia
3 Department of Earth and Planetary Science, Macquarie University, NSW, 2109, Australia
Introduction Precambrian rocks form the building blocks of approximately two thirds of the Australian continent. The mechanisms by which these rocks formed and evolved underpin models for continental growth and reorganisation. In the last 15 years, it has become apparent that the Proterozoic era, between 2500-542 million years ago, is the key interval in the assembly of the Australian continent. A number of important questions concerning Australian Proterozoic geology remain matters of speculation, however:
1. What was the relative importance of crustal growth versus crustal reworking through time?
2. When did the various Precambrian component terranes amalgamate? 3. To what extent can modern plate tectonic processes be implicated, and where are the
convergent margin mobile belts and fossil subduction zones? The marginal terranes of the northern Gawler Craton include the Nawa Domain, Coober Pedy Domain, Mabel Creek Ridge, Peake and Denison Inlier, and the Mount Painter Inlier (Figure 1). These terranes represent one of the most important regions of Proterozoic Australian geology, because they are located between the Archean-Mesoproterozoic West Australian and North Australian Cratons, the Meso- to Neoproterozoic rocks of central Australia and the Phanerozoic accretionary belts of eastern Australia. In almost every attempt to reconstruct the Australian continent, it is the marginal terranes of the Gawler Craton which are the most speculative, and the cause of major differences in the interpretations of Paleo- to Mesoproterozoic continental architectural and tectonic process (compare Dawson et al., 2002; Giles et al., 2004; Betts and Giles, 2006; Wade et al., 2006). The marginal terranes are significant, nevertheless, because they should preserve the best record of interactions between the Gawler Craton and its neighbours during the amalgamation of Proterozoic Australia. Unfortunately, these marginal terranes are almost completely covered by Neoproterozoic and younger sedimentary basins (with less than 1% basement outcrop) and consequently are amongst the least studied rocks on the Australian continent. A collaborative Australian Research Council Linkage project between Monash University, University of Adelaide, and PIRSA endeavoured to address several of these issues by undertaking an integrated program of research, which included:
1. interpretation and modelling of regional gravity and aeromagnetic data to constrain the 3D architecture of the northern Gawler Craton (Baines et al., 2010; Figure 2);
2. a program of drilling into buried terranes of the northern Gawler Craton to intersect basement rocks for analysis (Dutch et al., 2010), and
3. geochronological and Hf isotope geochemistry of available samples to characterise the crustal evolution of different packages collected from drillholes (Jagodzinski and Reid, 2010; Armit et al., 2010).
129
Figure 1. Regional Bouguer gravity image with superimposed vertical derivative aeromagnetic image of the marginal terranes of the northern Gawler Craton, showing the location of the GOMA seismic line, drillhole locations, and interpreted geological domain boundaries.
130
The drilling program was designed to sample basement rocks along the GOMA seismic line for petrophysical, geochronology and geochemical analysis to add value to seismic data and to better constrain potential geophysical interpretations and modelling. The project also focussed research in the exposed marginal terranes, including the Peake and Denison Domain and the Mount Painter Inlier (Figure 1), as well as utilising rocks intersected during drilling programs conducted by Minotaur Exploration Ltd (Mabel Creek Ridge) and Eromanga Uranium Ltd (45 km east of GOMA DH3). Event chronology and potential terrane amalgamation events An important aspect of interpreting the evolution of the marginal terranes of the Gawler Craton is understanding the context in which the terranes evolved or formed. Payne et al. (2006) demonstrated that rocks of the Nawa Domain have undergone comparable evolutions to that defined for the interior of the Gawler Craton. The Gawler Craton records several major Paleo- to Mesoproterozoic continental growth events (Betts and Giles, 2006; Cawood and Korsch, 2008) and these events need to be considered in the context of the evolution of the marginal terranes. Importantly, the presence of several sedimentary successions older than the Kimban Orogeny (ca. 1790-1750 Ma), extending from the Nawa Domain to the Yorke Peninsula (South Australian Craton), suggest that the Archean nucleus of the Gawler Craton had amalgamated with the rest of the Australian continent before the Kimban Orogeny (Figure 3). Important orogenic event that may have influenced the marginal terranes include: The ca. 1850-1845 Ma Cornian Orogeny (Reid et al., 2008) represents the most likely event in which this amalgamation occurred. This event correlates with a series of ca. 1870-1840 Ma discrete orogenic events across the Australian continent associated with the amalgamation of the Aileron Province and Archaean nucleus of the Gawler Craton with the North Australian Craton, docking of a continental ribbon on the eastern margin of the North Australian Craton, and the collision between the Kimberley Craton and the North Australian Craton. The ca. 1740-1700 Ma Kimban Orogeny represents a craton-scale orogenic event (Figure 3b) affecting the northwestern and southeastern part of the craton. It represents a major thermal event, with granulite facies metamorphism and movement along major crustal structures, such as the Kalinjala Shear Zone and the Tallacootra Shear Zone. The end of the Kimban Orogeny has been considered to be ca. 1700-1690 Ma, but this may represent a discrete event, rather than as part of a protracted orogenic continuum. The drivers for the Kimban Orogeny and the Strangways Event in the Arunta Region are uncertain. The ca. 1610-1590 Ma Wartakan Orogeny (Hand et al., 2007; Stewart and Betts, 2010) correlates with the Olarian Orogeny in the Curnamona Province. This is a short-lived event constrained between the St Peter Suite (magmatic arc) and the Hiltaba Suite, and is expressed mainly in the southern Gawler Craton, as movement along major shear zones (Stewart and Betts, 2010). The ca. 1580-1540 Ma Kararan Orogeny (Hand et al., 2007) postdates the ca. 1600-1580 Ma Hiltaba Event. This orogenic event is characterised by ultra-high temperature granulite facies metamorphism, associated with southward translations of the marginal terranes of the northern Gawler Craton over the Archean nucleus of the Gawler Craton (Baines et al., 2010). The ca. 1450 Ma Coorabie Orogeny (Fraser and Lyons, 2006) is an event characterised by sinistral reactivation of north-northeast – striking shear zones in the western Gawler Craton.
131
Figure 2a. Location of the GOMA seismic line in the northern Gawler Craton superimposed on magnetic data (after Baines et al., 2010).
132
Figure 2b. Location of the GOMA seismic line in the northern Gawler Craton superimposed on gravity data (after Baines et al., 2010).
133
Figure 2c. Location of the GOMA seismic line in the northern Gawler Craton superimposed on interpreted solid geology (after Baines et al., 2010).
134
The final aspect to consider when interpreting the tectonic evolution of the marginal terrane of the Gawler Craton is the assumed architecture of the craton blocks of the continent. For example, if the present day architecture of the Gawler Craton is interpreted to be the same as in the Paleoproterozoic, then it is likely that major structures in these terranes represent zones of crustal reworking after amalgamation of the Gawler Craton and the remainder of the Australia continent. If rotation models of the Gawler Craton are considered (e.g., Giles et al., 2004), however, there are alternative ways to interpret the architecture of the marginal terranes because:
1. The rotations place the terranes proximal to the interpreted plate boundaries between ca. 1600 Ma and ca. 1550 Ma (Betts and Giles, 2006; Wade et al., 2006). It is possible that the western marginal terranes of the Gawler Craton faced an ocean, which allowed for continental growth rather than just reworking.
2. The rotation model of Giles et al. (2004) places the marginal terranes proximal to rocks of the Mount Isa Province, which have similar crustal isotopic, lithostratigraphy, and geochemical characteristics (Peake and Denison Domain and the Eastern Fold Belt) (Wilson, 1987). This provides potential opportunity to correlate and connect major crustal boundaries in the Mount Isa Province with those in the northern Gawler Craton.
Major boundaries Karari Shear Zone The Karari Shear Zone is a major crustal scale structure defined in regional aeromagnetic datasets as a curvilinear fault with a strike extent that exceeds 500 kilometres. In the vicinity of the Coober Pedy Domain, the Karari Shear Zone separates the marginal terranes to the north and west from the Archean Mulgathing Complex in the nucleus of the Gawler Craton. The GOMA seismic line crosses the Karari Shear Zone and the south-dipping Horse Camp Fault, which merges into the Karari Shear Zone at depth (Korsch et al., 2010) (Figure 2). At the southern margin of the Coober Pedy Domain, the boundary is constrained by a shallowly north-dipping thrust fault which forms the frontal thrust of a series of crustal-scale thrust duplexes. Seismic data suggests that Archean basement exists in the footwall of the frontal thrust and extends a significant distance to the north of the Coober Pedy Domain at depth. The timing of the movement along the Karari Shear Zone, in the vicinity of the Coober Pedy Domain, is constrained by regional aeromagnetic data. These data show that the Karari Shear Zone truncates northwest-striking faults active during the Hiltaba Event. This constrains movement to post-1590 Ma, most likely during the Kararan Orogeny. The absence of interpreted sutures within the Mabel Creek and Coober Pedy domains, suggests that the Kararan Orogeny represents either intraplate basin inversion of a Paleoproterozoic basin system, or the intense strain distal from a plate margin (Figure 3a). Middle Bore Fault and Sarda Bluff Fault The Middle Bore Fault marks a major crustal boundary imaged particularly well in gravity and magnetic datasets (Baines et al., in review, 2010; Figure 2). Baines et al. (in review) proposed that the Middle Bore Fault was a zone of significant movement during the ca. 1740 Ma Kimban Orogeny, based on metamorphic age constraints and comparisons with the transpressional deformation styles in the eastern Gawler Craton, although younger episodes of movement are also possible (e.g., Coorabie Orogeny). The Middle Bore Fault is poorly imaged in the GOMA seismic line (Korsch et al., 2010), but possibly marks the southern transition between reflective crust of the Musgrave Province and that of the Nawa Domain. The Sarda Bluff Fault, located to the north of the Ammaroodinna Ridge (Korsch et al., 2010), possibly represents the suture between the Gawler Craton and the proto-Musgrave Province at ca. 1740 Ma (Figure 3b), although the region between the Sarda Bluff Fault and the Middle Bore Fault possibly represents a mosaic of crustal blocks within the collision zone (Baines et al., 2010). The amalgamation of the Gawler Craton and Musgrave Province was the driver for the ca. 1740-1700 Ma Kimban Orogeny and the Strangways Orogeny in the Arunta Region to the north. Such a collision would require an architecture similar to that proposed by Giles et al. (2004) (Figure 3b).
135
Figure 3. Simple geodynamic maps showing the possible location of the marginal terranes of the Gawler Craton during major events of the northern Gawler Craton: (a) ca. 1620-1500 Ma, (b) ca. 1740-1700 Ma Kimban Orogeny. The maps assume the rotation of the South Australian Craton proposed by Giles et al. (2004). Several prominent, crustal-penetrating faults are imaged in the northern extent of the GOMA seismic line. These faults have accommodated significant uplift of the Moho. Aitken et al. (2009) used gravity inversions to show that this Moho uplift occurred along the axis of the ca. 550 Ma intraplate Petermann Orogeny. Hf isotopic constraints Initial Hf analysis results on drillholes show evidence for reworked ca. 2500 Ma material (Gawler), with less evolved material at ca. 1920 Ma (GOMA DH1), ca. 1740 Ma (Kimban; GOMA DH2) and ca.1590-1550 Ma (Musgrave; GOMA DH3) (Armit et al., 2010). At this stage, the Hf data does not show any major discontinuities in the crustal evolution across the major structures. If the Sarda Bluff Fault represents a suture zone between the Musgrave Province and the Gawler Craton, Hf-isotope data indicates that these crustal blocks have a comparable isotopic evolution or origin.
136
Summary Integration of geophysical techniques with isotopic studies is a powerful methodology to unravel crustal evolution in relatively poorly exposed provinces. This approach has been applied to the marginal terranes of the northern Gawler Craton, and has allowed recognition of major, terrane-bounding fault systems, and to determine if there are variations in the isotopic evolution across these structures. Preliminary results would suggest that geological provinces on either side of the Middle Bore Fault and Sarda Bluff Fault have a comparable isotopic evolution during the Paleoproterozoic and, therefore, do not represent allochthonous terranes. It is possible that the Musgrave crust represents a continental ribbon torn from the proto-Australian margin before ca. 1740 Ma, and was subsequently reamalgamated during the ca. 1740 Ma Kimban Orogeny. The Kararan Orogeny records an intraplate basin inversion event, in which basins of the marginal terranes of the northern Gawler Craton were inverted along major structures such as the Karari Shear Zone. It is unlikely that the Karari Shear Zone, in the vicinity of the GOMA seismic section, represents a boundary between crustal domains. Rather, it is a major, basin-bounding extensional fault system which reactivated as a frontal thrust during the later inversion of Paleoproterozoic basins. Inversion tectonics, in which younger and hotter rocks are thrust over older and colder rocks, occur in other Proterozoic terranes (e.g., Mount Isa Province). High temperature metamorphism, in the basin succession in the hangingwall of the inverted faults, is most likely influenced by the pre-orogenic thermal architecture of the basin system. We speculate that the thermal driver of high temperature metamorphism in the Coober Pedy Domain is caused by lithospheric thinning and elevated geothermal gradients in the basins developed in the margin terranes of the Gawler Craton. References Aitken, A.R.A., Betts, P.G., Weinberg, R.F., and Gray, D., 2009. Constrained potential field
modelling of the crustal architecture of the Musgrave Province in Central Australia: Evidence for lithospheric strengthening due to crust-mantle boundary uplift. Journal of Geophysical Research, 114, B12405, doi:10.1029/2008JB006194.
Armit, R., Betts, P.G., Schaefer, B.F., 2010. Lu-Hf isotope characteristics of the marginal terranes of northern Gawler Craton. Geoscience Australia, Record, 2010/39, 118-127.
Baines, G.A., Giles, D. and Betts, P.G., 2010. 3D geophysical modelling of the northern Gawler Craton, South Australia. Geoscience Australia, Record, 2010/39, 95-107.
Baines, G.A., Giles, D., Betts, P.G. and Backe, G., in review. Locating a major Proterozoic crustal boundary beneath the eastern Officer Basin, Australia. Precambrian Research.
Betts, P.G. and Giles, D., 2006. The 1800 Ma to 1100 Ma tectonic evolution of Australian. Precambrian Research, 144, 92-125.
Cawood, P.A. and Korsch, R.J., 2008. Assembling Australia: Proterozoic building of a continent. Precambrian Research, 166, 1-35.
Dawson, G.C., Krapez, B., Fletcher, I.R., McNaughton, N.J., and Rasmussen, B., 2002. Did late Palaeoproterozoic assembly of proto- Australia involve collision between the Pilbara Yilgarn and Gawler Cratons? Geochronological evidence from the Mount Barren Group in the Albany-Fraser Orogen of Western Australia. Precambrian Research, 118, 195-220.
Dutch, R., Davies, M. and Flintoft, M., 2010. GOMA basement drilling program, northern Gawler Craton: South Australia. Department of Primary Industries and Resources, Report Book, 2010/2.
Fraser, G. and Lyons, P., 2006. Timing of Mesoproterozoic tectonic activity in the northwestern Gawler Craton constrained by 40Ar/39Ar geochronology. Precambrian Research, 151, 160-184.
Giles, D., Betts, P.G., and Lister, G.S., 2004. 1.8-1.5 Ga links between the North and South Australian Cratons and the Palaeo- to Mesoproterozoic configuration of Australia. Tectonophysics, 380, 27-41.
Hand, M., A. Reid, and Jagodzinski, L., 2007. Tectonic framework and evolution of the Gawler Craton, southern Australia. Economic Geology, 102, 1377-1395.
Jagodzinski, E.A. and Reid, A.J., 2010. New zircon and monazite geochronology using SHRIMP and LA-ICPMS, from recent GOMA drilling, on samples from the northern Gawler Craton. Geoscience Australia, Record, 2010/39, 108-117.
137
Korsch, R.J., Blewett, R.S., Giles, D., Reid, A.J., Neumann, N.L., Fraser, G.L., Holzschuh, J., Costelloe, Roy, I.G., Kennett, B.L.N., W.M. Cowley, Baines, G., Carr, L.K., Duan, J., Milligan, P.R., Armit, R., Betts, P.G., Preiss, W.V. and Bendall, B.R., 2010. Geological interpretation of the deep seismic reflection and magnetotelluric line 08GA-OM1: Gawler Craton-Officer Basin-Musgrave Province-Amadeus Basin (GOMA), South Australia and Northern Territory. Geoscience Australia, Record, 2010/39, 63-86.
Payne, J.L., Barovich, K.M. and Hand, M., 2006. Provenance of metasedimentary rocks in the northern Gawler Craton, Australia: Implications for Palaeoproterozoic reconstructions. Precambrian Research, 148, 275-291.
Reid, A., Hand, M., Jagodzinski, E., Kelsey, D., and Pearson, N., 2008. Paleoproterozoic orogenesis in the southeastern Gawler Craton, South Australia. Australian Journal of Earth Sciences, 55, 449-471.
Stewart, J.R. and Betts, P.G., 2010. Late Paleo-Mesoproterozoic plate margin deformation in the southern Gawler Craton: Insights from structural and aeromagnetic analysis. Precambrian Research, 177, 55–72.
Wade, B.P., Barovich, K.M., Hand, M., Scrimgeour, I.R. and Close, D.F., 2006. Evidence for early Mesoproterozoic arc magmatism in the Musgrave Block, central Australia: Implications for Proterozoic crustal growth and tectonic reconstructions of Australia. Journal of Geology, 114, 43-63.
Wilson, I., 1987. Geochemistry of Proterozoic volcanics, Mount Isa Inlier, Australia. In: Pharaoh, T.C., Beckinsale, R.D. and Rickard, D. (eds) Geochemistry and Mineralisation of Proterozoic Volcanic Suites. Geological Society of London, Special Publication, 33, 409-424.
138
Geodynamic implications of the deep seismic reflection line 08GA-OM1: Gawler Craton-
Officer Basin-Musgrave Province-Amadeus Basin (GOMA), South Australia and Northern
Territory
R.J. Korsch1, N. Kositcin1, R.S. Blewett1, G.L. Fraser1, G. Baines2, B.L.N. Kennett3, N.L. Neumann1, A.J. Reid4, W.V. Preiss4, D. Giles2, R. Armit5 and
P.G. Betts5
1Onshore Energy and Minerals Division, Geoscience Australia, GPO Box 378, Canberra, ACT 2601, Australia
2School of Earth and Environmental Sciences, University of Adelaide, SA 5005, Australia
3Research School of Earth Sciences, Australian National University, Canberra, ACT 0200, Australia
4Geological Survey of South Australia, Primary Industries and Resources South Australia (PIRSA), GPO Box 1671, Adelaide, SA 5001, Australia
5School of Geosciences, Building 28, Monash University, VIC 3800, Australia
Introduction In 2008, as part of its Onshore Energy Security Program, Geoscience Australia, in conjunction with AuScope, Primary Industries and Resources South Australia (PIRSA) and the Northern Territory Geological Survey, acquired 634 km of vibroseis-source, deep seismic reflection data and gravity data along a single traverse from about 25 km southeast of Erldunda in the southern Northern Territory to near Tarcoola in central South Australia. This traverse, 08GA-OM1, followed the Adelaide to Alice Springs railway line, utilising the railway access road, and is referred to as GOMA as it crossed the northern Gawler Craton, eastern Officer Basin, eastern Musgrave Province and the southern Amadeus Basin (Figure 1). Crustal-scale, magnetotelluric data were also collected along the southern part the seismic route. The GOMA seismic line also crossed several basement domains of the Gawler Craton (as defined by Ferris et al., 2002). In companion papers, interpretations are presented of the seismic data across the Arckaringa Basin (Menpes et al., 2010) and the Officer Basin (Preiss et al., 2010), as well as an interpretation of the basement provinces and domains (Figure 2), based on the deep crustal seismic and magnetotelluric data (Korsch et al., 2010a). A time-space plot (Figure 3, based in part on Kositcin, 2010), shows that many of the provinces and domains have distinctive geological histories. Here, we discuss some of the geodynamic implications for central Australia which arise out of the interpretation of the new deep seismic and MT data.
139
Figure 1. Map showing the solid geology of the region covered by the GOMA seismic line (08GA-OM1) from the northern Gawler Craton to the southern Amadeus Basin, draped over a first vertical derivative image of aeromagnetic data. The solid geology for South Australia is from Cowley (2006a, 2006b, which also contains the legend), and the Northern Territory part is from Ahmad (2002). The seismic line has CDP stations labelled, and the locations of GOMA drillholes and key mineral deposits are shown also. Names in capitals refer to the key provinces and domains.
140
Relationship between Wilgena Domain and Christie Domain The Wilgena and Christie Domains (Figure 2) have similar geological histories (Daly et al., 1998; Neumann and Fraser, 2007; Hand et al., 2007; Kositcin, 2010; Woodhouse et al., 2010), with both domains dominated by the Neoarchean to early Paleoproterozoic Mulgathing Complex (Figure 3). Interpretation of the GOMA seismic line shows that these domains have very similar reflectivity (Korsch et al., 2010a), suggesting that there is very little difference between them. Swain et al. (2005a) favoured a continental margin arc-backarc setting for the generation of these rocks (see also Kositcin et al., 2010) (Figure 4A). Basin formation and associated magmatism were terminated by high-grade metamorphism and crustal thickening during the Sleafordian Orogeny (~2460-2400 Ma), which may have been the result of collision following ocean closure, and the arrival of a continent or continental fragment from the east or northeast (Warrakimbo Seismic Province of Korsch et al., 2010b; Figure 4B). In the southern Gawler Craton, well to the south of the GOMA seismic line, the suture was inferred to be the proto-Kalinjala Mylonite Zone by Korsch et al. (2010b) (Figure 4B). If this interpretation is valid, then a similar structure could be present in the northern Gawler Craton to separate the Archean rocks in the Wilgena and Christie Domains from the rocks in the domains to the north. Is this structure the Karari Shear Zone? The two domains contain no evidence of the 2000-1830 Ma history seen in the Gawler Craton further to the south, that is, the Miltalie Gneiss, Hutchison Group, Donington Suite, Cornian Orogeny, with the possible exception of the Wilgena Hill Jaspilite (Daly et al., 1998; Woodhouse et al., 2010). The next major event was the development of a series of extensional basins, at >1715 Ma to ca. 1656 Ma, recorded by sediments of the Eba, Labyrinth and Tarcoola formations and contemporaneous magmatism (see summary in Woodhouse et al., 2010). These sediments record a time of extensional basin development, possibly in a backarc environment, similar to the scenario proposed by Reid et al. (2008), Conor (2009) and Kositcin et al. (2010). The backarc was inferred to be behind a west- or northwest-dipping subduction zone, located to the east or southeast of the Curnamona Province (Figure 5). Evidence for the Kimban Orogeny (~1740-1690 Ma) is not well established in either of the Wilgena and Christie Domains, although the deformation of the Wilgena Hill Jaspilite and related metasedimentary rocks could have occurred during this event. Also, Daly et al. (1998) inferred that the Bulgunnia Fault developed during the Kimban Orogeny, and it is possible that the boundary between the two domains, the Cedric Bore Fault, also formed at this time. Relationship between Christie Domain and Coober Pedy Domain The Karari Shear Zone separates the Christie Domain from the Coober Pedy Domain (Figure 2). On the GOMA seismic line, the shear zone is interpreted to be a north-dipping, crustal-scale fault, which soles at depth onto the Moho (Korsch et al., 2010a). The geology of the Coober Pedy Domain is poorly known, but there is no evidence for the Mulgathing Complex in the domain, indicating that the Karari Shear Zone is a major structure separating domains of differing geological histories. Note, however, that based on a sample from the GOMA DH4 drillhole, well to the north, in the Nawa Domain, Jagodzinski and Reid (2010) provided the first suggestion that rocks equivalent in age to the Mulgathing Complex could be present to the north of the Karari Shear Zone. This raises the question whether the Coober Pedy Domain could be a deformed and preserved Paleoproterozoic sedimentary basin deposited on Neoarchean crust; obviously, further work is warranted to address this question. The Coober Pedy Domain apparently underwent high-grade metamorphism at ~1690 Ma (Jagodzinski and Reid, 2010) and again at ~1590 Ma to 1570 Ma (Daly et al., 1998; Fanning et al., 2007), whereas the Christie Domain was at relatively shallow-crustal levels by ~1700 Ma (Tomkins et al., 2004; Fraser and Lyons, 2006). Timing of juxtaposition of the Christie and Coober Pedy Domains across the Karari Shear Zone is unclear, but may have occurred at ~1690 Ma during late stages of the Kimban Orogeny (Swain et al., 2005b), or at ~1570 Ma during the Kararan Orogeny (Hand et al., 2007), and possibly was reactivated at ~1450 Ma during the Coorabie Orogeny (Fraser and Lyons, 2006).
141
Figure 2. Migrated seismic section for the GOMA (08GA-OM1) showing the (a) uninterpreted section and (b) interpreted section, with the names of the provinces, domains and seismic subdomains. Fault abbreviations: CBF - Cedric Bore Fault, KSZ – Karari Shear Zone, HCF – Horse Camp Fault, BHCF – Box Hole Creek Fault, BSBF – Big Swamp Bore Fault, CPF – Cadney Park Fault, MBF – Middle Bore Fault, WHF – Wintinna Hill Fault, SBF - Sarda Bluff Fault, MJF – Mount Johns Fault, WT – Woodroffe Thrust. The displays are to a depth of ~60 km, and show the vertical scale equal to the horizontal scale (assuming a crustal velocity of 6000 m s-1).
142
Figure 3. Time-space plot of provinces and domains crossed by the GOMA seismic line (in part after Kositcin, 2010), arranged from south (left hand side) to north (right hand side). In this plot, the Mabel Creek Domain has been included as part of the Nawa Domain.
143
Relationship between Coober Pedy Domain and Mabel Creek Domain The south-dipping Horse Camp Fault separates the Coober Pedy Domain from the Mabel Creek Domain, thus defining the Coober Pedy Domain as a V-shaped block in the upper crust, in the section of the GOMA seismic line (Korsch et al., 2010a). The Coober Pedy Domain has a classic popup shape, suggesting possible out-of-the-plane movement on its bounding faults, and implying the possibility of a component of strike-slip displacement. The oldest movement was probably during the Kimban Orogeny or slightly younger (Swain et al., 2005b), with reactivation likely to have occurred during the Kararan Orogeny (~1570 Ma; Hand et al., 2007) and/or the Coorabie Orogeny (~1450 Ma; Fraser and Lyons, 2006). Relationship between Mabel Creek Domain and Nawa Domain The Mabel Creek Domain is interpreted to extend deep into the crust, and is separated from the Nawa Domain by the north-dipping Box Hole Creek Fault (Korsch et al., 2010a). Within the Mabel Creek Domain, the Broken Bit Bore Fault and another unnamed fault structurally beneath it are more or less subparallel to the Horse Camp Fault (see Korsch et al., 2010a, Figure 5). This suggests that the Coober Pedy Domain and the upper part of the Mabel Creek Domain both have been thrust from the south, possibly as a duplex, over the top of the lower part of the Mabel Creek Domain. One implication is that the Mabel Creek Domain is more closely related to the Coober Pedy Domain to the south, rather than to the Nawa Domain to the north. Samples from the GOMA DH4 drillhole, in the southern part of the Nawa Domain (Figure 1), contain evidence of a Neoarchean to early Paleoproterozoic provenance, suggestive of the Mulgathing Complex to the south, and a metamorphic event at ca. 1520 Ma (Jagodzinski and Reid, 2010). The possible presence of rocks equivalent in age to the Mulgathing Complex, located to the north of the Mabel Creek Domain, raises the question as to whether the Coober Pedy Domain and at least the upper part of the Mabel Creek Domain are parts of younger successions which have been thrust to the north over Neoarchean basement. One possibility is that the two domains represent a deformed and preserved Paleoproterozoic sedimentary basin (or basins) deposited on Neoarchean crust, which have then been detached and thrust over the older basement. The presence of ~1580 Ma granulite-facies rocks in the Mabel Creek Domain, in the hangingwall of the Broken Bit Bore Fault (see Korsch et al., 2010a, Figure 5b), suggests that this fault was active during or after the Kararan Orogeny, probably at the same time as movement along the subparallel Horse Camp Fault to the south. Relationship between seismic subdomains within the Nawa Domain The Nawa Domain consists predominantly of metasedimentary rocks, with maximum depositional ages of ~1750-1720 Ma (e.g., Payne et al., 2006), which were metamorphosed to between greenschist and granulite facies, during the Kimban Orogeny (1730-1690 Ma) and the Kararan Orogeny (~1600-1550 Ma) (see summaries in Woodhouse et al., 2010; Betts et al., 2010). Based on distinctive seismic reflective characteristics observed in the GOMA seismic line (Figure 2), the Nawa Domain has been interpreted to consist of a series of discrete seismic subdomains by Korsch et al. (2010a). The boundaries between the seismic subdomains are, in the most part, a series of north-dipping, subparallel, reflections, which we interpret as crustal-scale faults. The internal geometry of most of the subdomains is usually defined by north-dipping reflections, also interpreted predominantly as faults, giving the Nawa Domain the overall appearance of an imbricated, crustal-scale, thrust stack. A strong possibility is that this imbrication occurred during the Kimban Orogeny, because many of the metamorphic ages in the Nawa Domain are Kimban in age (Woodhouse et al., 2010). Alternatively, the imbrication could have occurred during the Kararan Orogeny, with the shortening being driven by the collision of the North Australian Craton with the South Australian Craton at the northern edge of the Gawler Craton (see below), or the faults could have been reactivated at this time. Another possibility is that this imbrication occurred at ~1450 Ma, or was
144
reactivated at this time, which is the timing of apparent metamorphism and magmatism recently documented by Hand et al. (2010) from the drillholes Karkaroo 1, OBD8 and OBD9.
Figure 4. Schematic cross sections showing possible tectonic development of the Gawler Craton and Curnamona Province from ~2550 Ma to ~2430 Ma (after Kositcin et al., 2010; for details of the Yeltana and Warrakimbo seismic provinces, see Korsch et al., 2010b).
Figure 5. Schematic cross section showing possible tectonic development of the Gawler Craton and Curnamona Province from ~1790 Ma to ~1640 Ma. Relationship between Musgrave Province and Warumpi Province Towards the northern end of the GOMA seismic line, to the north of the Woodroffe Thrust, the crustal reflectivity is distinctly different to that forming the Musgrave Province south of the thrust (Korsch et al., 2010a), in that, to the north, there is a zone of strong reflectivity in the middle crust. Well to the north, in the southern Arunta Region, Korsch et al. (1998) tracked a mid-crustal reflective zone from the Redbank Thrust Zone to the southern limit of the 1985 deep seismic reflection survey. Korsch and Goleby (2006) considered that the mid-crustal reflective zone was part of the Warumpi Province. Thus, we consider that the mid-crustal reflective zone, seen on the northernmost part of the GOMA seismic line, is part of the Warumpi Province,
145
which extends from the Redbank Thrust Zone in the north, beneath the Amadeus Basin, to the Woodroffe Thrust in the south. In the vicinity of the GOMA seismic line, the Woodroffe Thrust is a south-dipping, planar fault which cuts the entire crust, forming the suture between the Musgrave Province and the Warumpi Province. In the Musgrave Province, age and geochemical constraints of early Mesoproterozoic rocks are poor, due to later overprinting tectonic events, but felsic orthogneisses (ca. 1607-1565 Ma) possibly represent juvenile felsic crust which was emplaced through subduction-related processes into an oceanic island arc (Wade et al., 2006; see also Cawood and Korsch, 2008; Kositcin et al., 2010). The mafic protolith gneisses compare well with modern island arcs, whereas the felsic orthogneisses have a signature more comparable with modern continental margin arcs; thus, the Musgravian island arc could have been built on a fragment of older continental crust (Korsch et al., in press). Wade et al. (2006) considered that the island arc, possibly built on a continental sliver, was associated with a south-dipping subduction zone, which operated from at least ca. 1607 Ma (Figure 6a). An oceanic backarc (marginal sea) was present to the south of the island arc. Consumption of the oceanic crust eventually led to the suturing of the island arc to the Warumpi Province of the North Australian Craton. We consider that the initiation of the Chewings Event in the southern part of the Arunta Region (e.g., Scrimgeour et al., 2005) is a reflection of this collision, with strong north-south directed deformation recorded by zircon metamorphic ages of 1594 ± 6 Ma (Williams et al., 1996) to 1562 ± 4 Ma (Rubatto et al., 2001).
Figure 6. (a) Cartoon cross section showing tectonic scenario at ca. 1607-1594 Ma, during formation of the Musgrave island arc. (b) Cartoon cross section showing tectonic scenario after collision and amalgamation of the Musgrave Province with the North Australia Craton (modified after Wade et al., 2006), just prior to collision with the Gawler Craton (part of the South Australian Craton). Relationship between Gawler Craton and Musgrave Province In the vicinity of the GOMA seismic line, we consider that the boundary between the Gawler Craton and the Musgrave Province is the Sarda Bluff Fault, at CDP 22000 (Figure 2). After the collision between the Warumpi Province and the Musgrave Province, at ca. 1594 Ma, we consider that the polarity of the subduction zone flipped, with the oceanic crust of the marginal sea now being consumed in a north-dipping subduction zone that dipped beneath the Musgravian arc (now proto-continental in setting), which was now being sutured to the North Australian Craton (Figure 6b). In the Gawler Craton, this resulted in the Kararan Orogeny of Hand et al. (2007), which possibly records the final amalgamation of the Gawler Craton with the
146
North Australian Craton. Deformation and associated high T-low P metamorphism of the Chewings Event continued in the northern part of the Arunta Region (Aileron Province) until about 1562 Ma, probably in an extensional continental backarc setting. Arc magmatism continued in the Musgrave Province until the marginal sea was consumed, and the South Australian Craton collided with the expanded North Australian Craton. Younger granitic protolith phases in the Musgravian gneiss (1550-1500 Ma) are related tentatively to post-collision activity. An alternative interpretation by Direen et al. (2005) has the Nawa Domain and Mabel Creek Ridge being located outboard of the main Gawler Craton at ca. 1600 Ma, and being amalgamated between ca. 1600 and 1550 Ma. The presence of Kimban (~1730-1690 Ma) metamorphism in the Mabel Creek Ridge, however, would suggest that the Mabel Creek Ridge, at least, was amalgamated with the Gawler Craton by this time, and therefore well prior to ~1600 Ma. The metamorphism and deformation observed in the Nawa Domain, Mabel Creek Domain, and Coober Pedy Domain is possibly related to the events at the northern margin of the Gawler Craton. We consider that high-grade metamorphism in the northern Gawler Craton reflects the collision between the South Australian Craton and the North Australian Craton; reported metamorphic ages for high grade rocks of ca. 1590 Ma (Fanning et al., 2007) and 1566 ± 9 Ma (Hand et al., 2007) occur in the Coober Pedy Domain, and ca. 1550 Ma (Fanning et al., 2007) 1569 ± 8 Ma from DDH AM/PB 1 (Payne et al., 2008) occur in the Mabel Creek Domain. Protoliths of the Musgravian gneiss aged between 1565 Ma and 1528 Ma are interpreted tentatively as late-collisional to post-collisional granites (Korsch et al., in press). The Yoolperlunna Inlier has affinities with the Gawler Craton (see Woodhouse et al., 2010), and the interpretation of the GOMA seismic line (Korsch et al., 2010a) suggests that it has been backthrust to the north over the southernmost (concealed) Musgrave Province. The timing of this backthrusting is unknown, but it occurred prior to the initiation of the Officer Basin, which was deposited continuously across the northern Nawa Domain (Cadney Park and Wintinna Hill seismic subdomains of Korsch et al., 2010a), the Yoolperlunna Inlier and the southern Musgrave Province. It likely occurred either as part of the suturing and amalgamation of the Gawler Craton and Musgrave Province (ca. 1594-1565 Ma) or, later, during the Musgrave Orogeny (1200-1160 Ma). Neoproterozoic extension Small half grabens occur in the basal part of the Officer Basin (see Preiss et al., 2010), and are part of a widespread extensional event forming the Centralian Superbasin of Walter et al. (1995). Petermann Orogeny Several examples of deformation during the Petermann Orogeny (570-530 Ma) can be seen in the GOMA seismic line. The Woodroffe Thrust has thrust the Musgrave Province northwards over the Neoproterozoic package of the Amadeus Basin, presumably during the Petermann Orogeny (570-530 Ma), prior to the deposition of Paleozoic sediments. The Wintiginna Fault is a north-dipping fault forming the southern margin of the Moorilyanna Graben, which is interpreted as a pullapart basin (Preiss et al., 2010). The Wintiginna Fault was probably a basement fault which was reactivated in the Cambrian as a transtensional, dextral strike-slip fault during the Petermann Orogeny, allowing rapid sedimentation of thick graben fill. The Echo Fault defines the northern boundary of the Moorilyanna Graben and also was a transtensional, dextral strike-slip fault during the Petermann Orogeny. Near the surface, it has several splays, with internal block rotation of the Cambrian units, indicating that it has been reactivated, probably as a strike-slip fault, after deposition of the graben fill, either during the later stages of the Petermann Orogeny or the Alice Springs Orogeny. The offset in the Moho on both the northern and southern boundaries of the Musgrave Province resulted in a crustal-scale popup, or flower structure geometry, which is very likely a feature of strike-slip tectonics during the Petermann Orogeny. Given the model presented above, this Petermann-age architecture is also heavily influenced by reactivation of pre-existing structures
147
which originated during Mesoproterozoic subduction, that is, the south-dipping, crustal-scale faults at the northern margin of the Musgrave Province and north-dipping, crustal-scale faults at the southern margin of the Musgrave Province. Alice Springs Orogeny The GOMA seismic line provides several examples of deformation during the Alice Springs Orogeny (450-300 Ma). The north-dipping Everard Thrust defines the southernmost outcrop of Musgrave Province, where it has been thrust over the northernmost outcrops of the Officer Basin. Zang (1995) considered that the Everard Thrust initiated during the Alice Springs Orogeny, although it is more likely a basement fault which was reactivated during the Petermann Orogeny and possibly the Alice Springs Orogeny. The basin-bounding faults to the Moorilyanna Graben, the southern Wintiginna Fault and the northern Echo Fault, as well as faults internal to the graben, are interpreted to have Alice Springs Orogeny-age reactivation, causing tilting and rotation of the sedimentary succession. Devonian sediments of the Finke Group were deposited across the Woodroffe Thrust, which was then reactivated during the latter stages of the Alice Springs Orogeny (either during the Brewer or Eclipse Movements), again as a thrust, to slightly displace the Devonian sediments across it (see Korsch et al., 2010a).
Figure 7. Very preliminary two dimensional model of TM and TE modes for the magnetotelluric data, to a depth of 180 km, covering the southern half of the GOMA traverse (see details in Duan et al., 2010). The display shows the vertical scale equal to the horizontal scale. Simplified line work from the interpretation of the seismic section is overlain on the MT model. Domains are named. Fault abbreviations: CBF - Cedric Bore Fault, KSZ – Karari Shear Zone, HCF – Horse Camp Fault, BHCF – Box Hole Creek Fault. Geodynamic significance of the lithospheric upper mantle A very preliminary model of the magnetotelluric data is displayed to a depth of 180 km, with the lithospheric upper mantle beneath the GOMA transect containing zones of contrasting resistivity (Figure 7; see also Selway, 2006; Selway et al., 2011). There is a zone of very low resistivity (<100 ohm.m) at a depth range of ~80 km to 180 km, beneath the Christie and Wilgena Domains (Figure 7). North of this, there is a zone of typical cratonic resistivity (>2000 ohm.m), and occurs from ~60 km to 250 km depth.
148
Figure 8. Seismic shear-wavespeed model, to a depth of 300 km, for the section along the GOMA seismic line, with the MT model for the southern part of the GOMA seismic line included as a transparent overlay. Note the correlation of the increase in resistivity at the northern part of the MT section with the increase in seismic shear-wavespeed.
149
Seismic shear-wavespeeds remain fast for at least 200 km beneath the GOMA seismic transect (Figure 8). Down to these depths, the fast propagation direction of shear waves is at a high angle to the likely asthenospheric direction (Kennett, 2010). Based on these data, the lithosphere in this region is of the order of 200 km thick. The largest gradient (nearly four orders of magnitude) seen in the very preliminary model of the resistivity of the lithosphere (Figure 7) is a significant boundary, likely marking fundamentally different lithospheric blocks. The boundary is subvertical to steeply north-dipping, and projects upwards into the crust approximately beneath the boundary between the Christie Domain and the Coober Pedy Domain (Figure 7). Fundamental lithospheric boundaries, such as this one, form important weaknesses, which focus mantle heat and fluid into specific zones. It is above these zones that major mineral deposits can form (see Heinson et al., 2006; Begg et al., 2010). In terms of prospectivity, at least within the southern part of the GOMA seismic section, the region at the southern margin of the Coober Pedy Domain is the most favourable (see also Neumann et al., 2010). Conclusion The GOMA deep seismic reflection line has provided an image of the entire crust in this part of central Australia. At a first approximation, the crust can be divided into five distinct regions, namely, the Wilgena and Christie Domains, the Coober Pedy and Mabel Creek Domains, the Nawa Domain (containing several seismic subdomains), the Musgrave Province and the Warumpi Province. Each of these regions is separated from each other by crustal-scale faults, most of which have an apparent dip to the north, with the exception of the Woodroffe Thrust, separating the Musgrave Province from the Warumpi Province, which dips to the south. The observed crustal architecture has implications for geodynamic models for the evolution of the region, implying amalgamation of these crustal blocks, mainly in the Paleoproterozoic to early Mesoproterozoic. Acknowledgements This paper forms part of a collaborative project between Geoscience Australia, Primary Industries and Resources South Australia (PIRSA) and AuScope. We thank the following for their contributions: Betina Bendall, Lidena Carr, Richard Chopping, Ross Costelloe, Wayne Cowley, Jingming Duan, Joseph Holzschuh, Jenny Maher, Tony Meixner, Sandy Menpes, Peter Milligan, Kate Selway and John Stewart. The contribution by Geoscience Australia forms part of its Onshore Energy Security Program. We thank Lindsay Highet, Andrew Retter, Dan Connolly and Gerard Stewart for producing the maps and digital versions of the seismic section. We thank David Huston and Roger Skirrow for reviewing this abstract. References Ahmad, M., 2002. Geological map of the Northern Territory, 1:2 500 000. Northern Territory
Geological Survey. Begg, G.C., Griffin, W.L., O’Reilly, S.Y. and Natapov, L. 2010. The lithosphere, geodynamics
and metallogeny of the early Earth. In: Tyler, I.A. and Knox-Robinson, C.M. (eds) Fifth International Archean Symposium Abstracts. Geological Survey of Western Australia, Record, 2010/18, 253-255.
Betts, P.G., Armit, R., Baines, G., Giles, D. and Schaefer, B., 2010. Crustal boundaries of the marginal terranes of the northern Gawler Craton. Geoscience Australia, Record, 2010/39, 128-137.
Cawood, P.A. and Korsch, R.J., 2008. Assembling Australia: Proterozoic building of a continent. Precambrian Research, 166, 1-35.
Conor, C.H.H., 2009. Stratigraphic, magmatic and tectonic evolution of the southern Curnamona Province. In: Korsch, R. (ed.) Broken Hill Exploration Initiative: Abstracts for the 2009 conference. Geoscience Australia, Record, 2009/28, 22-27.
Cowley, W.M., 2006a. Solid geology of South Australia: peeling away the cover. MESA Journal, 43, 4-15.
150
Cowley, W.M., compiler, 2006b. Solid geology of South Australia. South Australia Department of Primary Industries and Resources, Mineral Exploration Data Package, 15, version 1.1.
Daly, S.J., Fanning, C.M. and Fairclough, M.C. 1998. Tectonic evolution and exploration potential of the Gawler Craton, South Australia. AGSO Journal of Australian Geology and Geophysics, 17, 145-168.
Direen, N.G., Cadd, A.G., Lyons, P. and Teasdale, J.P., 2005. Architecture of Proterozoic shear zones in the Christie Domain, western Gawler Craton, Australia: geophysical appraisal of a poorly exposed orogenic terrane. Precambrian Research, 142, 28-44.
Duan, J., Milligan, P.R. and Nakamura, A., 2010. Magnetotelluric survey along the GOMA deep seismic reflection transect in the northern Gawler Craton to Musgrave Province, South Australia. Geoscience Australia, Record, 2010/39, 7-15.
Fanning, C. M., Reid, A. and Teale, G., 2007. A geochronological framework for the Gawler Craton, South Australia. South Australia, Geological Survey, Bulletin, 55.
Ferris, G. M., Schwarz, M. P. and Heithersay, P., 2002. The geological framework, distribution and controls of Fe-oxide and related alteration, and Cu-Au mineralisation in the Gawler Craton, South Australia. Part I: geological and tectonic framework. In: Porter, T.M. (ed.) Hydrothermal iron oxide copper-gold and related deposits: a global perspective. PGC Publishing, Adelaide, 9-31.
Fraser, G.L. and Lyons, P., 2006. Timing of Mesoproterozoic tectonic activity in the northwestern Gawler Craton constrained by 40Ar/39Ar geochronology. Precambrian Research, 151, 160-184.
Hand, M., Reid, A. and Jagodzinski., L., 2007. Tectonic framework and evolution of the Gawler Craton, southern Australia. Economic Geology, 102, 1377-1395.
Hand, M., Howard, K. and Cutts, K., 2010. New constraints on basin development and event timing in the Gawler Craton. South Australian Resources and Energy Investment Conference 2010, Technical Forum, Presentation,
http://www.pir.sa.gov.au/__data/assets/pdf_file/0006/132756/Martin_Hand.pdf Heinson, G.H., Direen, N.G. and Gill R.M., 2006. Magnetotelluric evidence for a deep-crustal
mineralizing system beneath the Olympic Dam iron oxide. Geology, 34, 573–576. Kennett, B.L.N., 2010. Understanding the lithosphere in the vicinity of seismic line 08GA-OM1
from passive seismic studies. Geoscience Australia, Record, 2010/39, 87-94. Korsch, R.J. and Goleby, B.R., 2006. Deep seismic reflection profiling in the Arunta, Musgrave
and McArthur regions: implications for Central and North Australian tectonics. In: Lyons, P. and Huston, D.L. (eds) Evolution and metallogenesis of the North Australia Craton. Geoscience Australia, Record, 2006/16, 47-48.
Korsch, R.J., Goleby, B.R., Leven, J.H. and Drummond, B.J., 1998. Crustal architecture of central Australia based on deep seismic reflection profiling. In: Proceedings of the 7th International Symposium on deep seismic profiling of the continents. Tectonophysics, 288, 57-69.
Korsch, R.J., Blewett, R.S., Giles, D., Reid, A.J., Neumann, N.L., Fraser, G.L., Holzschuh, J., Costelloe, Roy, I.G., Kennett, B.L.N., W.M. Cowley, Baines, G., Carr, L.K., Duan, J., Milligan, P.R., Armit, R., Betts, P.G., Preiss, W.V. and Bendall, B.R., 2010a. Geological interpretation of the deep seismic reflection and magnetotelluric line 08GA-OM1: Gawler Craton-Officer Basin-Musgrave Province-Amadeus Basin (GOMA), South Australia and Northern Territory. Geoscience Australia, Record, 2010/39, 63-86.
Korsch, R.J., Preiss, W.V., Blewett, R.S., Cowley, W.M., Neumann, N.L., Fabris, A.J., Fraser, G.L., Dutch, R., Fomin, T., Holzschuh, J., Fricke, C.E., Reid, A.J., Carr, L.K. and Bendall, B.R., 2010b. Deep seismic reflection transect from the western Eyre Peninsula in South Australia to the Darling Basin in New South Wales: Geodynamic implications. In: Korsch, R.J. and Kositcin, N. (eds) South Australian Seismic and MT Workshop, Extended Abstracts. Geoscience Australia, Record, 2010/10, 105-116.
Korsch, R.J., Kositcin, N. and Champion, D.C., in press. Australian island arcs through time: geodynamic implications for the Archean and Proterozoic. Gondwana Research.
Kositcin, N., 2010. Geological summaries and time-space event plots for the Gawler Craton and Curnamona Province. In: Kositcin, N. (ed.) Geodynamic synthesis of the Gawler Craton and Curnamona Province. Geoscience Australia, Record, 2010/27, 10-58.
Kositcin, N., Korsch, R.J., Champion, D.C. and Henson, P.A., 2010. Geodynamic model for the Gawler Craton and Curnamona Province. In: Kositcin, N. (ed.) Geodynamic synthesis of
151
the Gawler Craton and Curnamona Province. Geoscience Australia, Record, 2010/27, 82-93.
Neumann, N.L. and Fraser, G.L., editors, 2007. Geochronological synthesis and time-space plots for Proterozoic Australia. Geoscience Australia, Record, 2007/06, 216 pp.
Neumann, N.L., Skirrow, R.G., Fraser, G.L., Korsch, R.J., Preiss, W.V., Cowley, W.M. and Blewett, R.S., 2010. Implications for regional energy and mineral systems of the 08GA-OM1 (GOMA) deep seismic reflection survey in the northern Gawler Craton to Amadeus Basin, South Australia and the Northern Territory. Geoscience Australia, Record, 2010/39, 152-162.
Payne, J.L., Barovich, K.M. and Hand, M., 2006. Provenance of metasedimentary rocks in the northern Gawler Craton, Australia: Implications for Palaeoproterozoic reconstructions. Precambrian Research, 148, 275-291.
Payne, J., Hand, M., Barovich, K. and Wade, B., 2008. Temporal constraints on the timing of high-grade metamorphism in the northern Gawler Craton: implications for assembly of the Australian Proterozoic. Australian Journal of Earth Sciences, 55, 623-640.
Preiss, W.V., Korsch, R.J. and Carr, L.K., 2010. 2008 Gawler Craton-Officer Basin-Musgrave Province-Amadeus Basin (GOMA) seismic survey, 08GA-OM1: Geological interpretation of the Officer Basin. Geoscience Australia, Record, 2010/39, 32-46.
Reid, A., Hand, M., Jagodzinski, E.A., Kelsey, D. and Pearson, N.J., 2008. Palaeoproterozoic orogenesis within the southeastern Gawler Craton, South Australia. Australian Journal of Earth Sciences, 55, 449–471.
Rubatto, D., Williams, I.S., Buick, I.S., 2001. Zircon and monazite response to prograde metamorphism in the Reynolds Range, central Australia. Contributions to Mineralogy and Petrology, 140, 458-468.
Scrimgeour, I.R., Kinny, P.D., Close, D.F. and Edgoose, C.J., 2005. High-T granulites and polymetamorphism in the southern Arunta Region, central Australia: evidence for a 1.64 Ga accretional event. Precambrian Research, 142, 1-27.
Selway, K.M., 2006. Magnetotelluric experiments in central and southern Australia and their implications for tectonic evolution. University of Adelaide, School of Earth and Environmental Sciences, PhD thesis, (unpublished).
Selway, K.M., Hand, M., Payne, J.L., Heinson, G.S. and Reid, A., 2011. Magnetotelluric constraints on the tectonic setting of Grenville-aged orogenesis in central Australia. Journal of the Geological Society, London, 168, in press.
Swain, G., Woodhouse, A., Hand, M., Barovich, K. and Schwarz, M., 2005a. Provenance and tectonic development of the late Archean Gawler Craton, Australia; U-Pb zircon, geochemical and Sm-Nd isotopic implications. Precambrian Research, 141, 106-136.
Swain, G.M., Hand, M., Teasdale, J., Rutherford, L. and Clarke, C., 2005b. Age constraints on terrane-scale shear zones in the Gawler Craton, southern Australia. Precambrian Research, 139, 164–180.
Tomkins, A.G., Dunlap, W.J. and Mavrogenes, J.A., 2004. Geochronological constraints on the polymetamorphic evolution of the granulite-hosted Challenger gold deposit: implications for assembly of the northwest Gawler Craton. Australian Journal of Earth Sciences, 51, 1-14.
Wade, B.P., Barovich, K.M., Hand, M., Scrimgeour, I.R. and Close, D.F., 2006. Evidence for early Mesoproterozoic arc magmatism in the Musgrave Block, central Australia: implications for Proterozoic crustal growth and tectonic reconstructions of Australia. Journal of Geology, 114, 43-63.
Walter, M.R., Veevers, J.J., Calver, C.R., and Grey, K., 1995. Neoproterozoic stratigraphy of the Centralian Superbasin, Australia. Precambrian Research, 73, 173-196.
Williams, I.S., Buick, I.S., Cartwright, I., 1996. An extended episode of early Mesoproterozoic metamorphic fluid flow in the Reynolds Range, central Australia. Journal of Metamorphic Geology, 14, 29-47.
Woodhouse, A., Reid, A.J., Cowley, W.M. and Fraser, G.L., 2010. Overview of the geology of the northern Gawler Craton and adjoining Musgrave Province, South Australia. Geoscience Australia, Record, 2010/39, 47-62.
Zang, W.-L., 1995. Early Neoproterozoic sequence stratigraphy and acritarch biostratigraphy, eastern Officer Basin, South Australia. Precambrian Research, 74, 119-175.
152
Implications for regional energy and mineral systems of the 08GA-OM1 (GOMA) deep
seismic reflection survey in the northern Gawler Craton to Amadeus Basin, South Australia and
Introduction In 2008, Geoscience Australia, in conjunction with Primary Industries and Resources South Australia (PIRSA), AuScope and the Northern Territory Geological Survey (NTGS), acquired ~634 km of new deep seismic reflection data along a transect as part of the Australian Government’s Onshore Energy Security Program. This transect (08GA-OM1), informally called GOMA, crosses the northern Gawler Craton, Officer Basin, Musgrave Province and southern Amadeus Basin, and was acquired beside the Adelaide-Darwin railway line from Tarcoola in the south, to the west of the Black Hill Range in southern Northern Territory (Costelloe and Holzschuh, 2010). Magnetotelluric (MT) data were also collected along the southern part of the line, and processed with pre-existing MT data from the northern part of this region (Selway, 2006; Selway et al., 2011), to create an MT transect along most of the seismic line (Duan et al., 2010). This new seismic line adds to other deep seismic surveys collected in South Australia over the past 7 years: 1) two lines in the vicinity of Olympic Dam, Gawler Craton (03GA-OD1 and 03GA-OD2); 2) the east-west Curnamona Province line (03GA-CU1); 3) the north-south Curnamona line (08GA-C1); 4) the Arrowie Basin line (08GA-A1); 5) the Eyre Peninsula line (08GA-G1), and 6) the Curnamona Province -Gawler Craton Link line (09GA-CG1). The aims of the GOMA deep crustal seismic reflection survey were to:
1) determine whether the crustal architecture of the northern Gawler Craton is similar to that in the Olympic iron oxide copper-gold (IOCG) Province, which is variably uranium-mineralised, and whether this metallogenic province extends further northwestwards than previously defined;
2) image the crustal architecture of the Officer and Amadeus Basins, and their potential for petroleum systems;
3) refine the northern extension of the South Australia Heat Flow Anomaly (e.g., Neumann et al., 2000) and its implications for geothermal prospectivity; and
4) improve understanding of the geodynamic evolution of the region for use in prediction of possible undiscovered energy and mineral systems.
Here, we focus on the interpretation of the seismic data with regards to the regional extent and crustal geometry of the uranium-bearing Olympic IOCG Province within the Gawler Craton, the structural architecture of major fault systems along the GOMA seismic and MT transect, and the South Australia Heat Flow Anomaly for geothermal energy system plays. In this analysis, we incorporate seismic and MT data along the GOMA transect, together with geological and geophysical datasets (Figures 1 to 3).
153
Figure 1. Map showing the solid geology of the region covered by the GOMA seismic line (08GA-OM1) from the northern Gawler Craton to the southern Amadeus Basin, draped over a first vertical derivative image of aeromagnetic data. The solid geology for South Australia is from Cowley (2006a, 2006b, which also contains the legend), and the Northern Territory part is from Ahmad (2002). The GOMA seismic transect is shown by the bold black line, with CDP stations marked. Also shown are the locations of the Olympic Dam deep seismic reflection transects. Approximate boundaries of geological domains within the study area are indicated (from Ferris et al., 2002), along with the Olympic IOCG Province as defined by Skirrow et al. (2002, 2006), and major IOCG and gold deposits. Also included are published heat flow values (in mWm-2; from Cull, 1982, 1991; Houseman et al., 1989). Yellow circles show the locations of GOMA drillholes as reported by Dutch et al. (2010) and discussed by Jagodzinski and Reid (2010).
154
Figure 2. Enhanced TMI (total magnetic intensity) image of northern South Australia and southern Northern Territory with the location and CDP stations of the GOMA deep seismic reflection transect and location of the Olympic Dam deep seismic reflection transects. Warm colours represent magnetic high regions and cool colours represent magnetic low regions.
155
Figure 3. Bouguer gravity image of northern South Australia and southern Northern Territory with the location and CDP stations of the GOMA deep seismic reflection transect and location of the Olympic Dam deep seismic reflection transects. Warm colours represent gravity high regions, cool colours represent gravity low regions.
156
Northwestern extension of the Olympic IOCG Province The Olympic IOCG Province (equivalent to the Olympic Cu-Au province of Skirrow et al., 2002, 2006) is a >500 km long copper-gold-uranium metallogenic belt along the eastern margin of the Gawler Craton (Figure 1), and includes the Olympic Dam Cu-U-Au deposit, the Prominent Hill Cu-Au deposit on the southern flank of the Mount Woods Domain, and the Moonta-Wallaroo Cu-Au district to the south of Olympic Dam. The Olympic Dam deposit is the world’s largest known resource of uranium and fourth largest copper resource. Seismic data were previously collected along two orthogonal transects in the Olympic Dam region (Figure 1), to image the crustal architecture of the giant Olympic Dam IOCGU system. Using these data, Lyons and Goleby (2005) interpreted the Olympic Dam deposit to lie above the boundary between two distinct crustal blocks – one interpreted to be Archean-Paleoproterozoic in the southwest and the other interpreted as Meso-Neoproterozoic crust to the northeast. The boundary between these two blocks corresponds to the Elizabeth Creek Fault, a northwest-striking northeast-dipping fault zone, the trace of which would intersect the surface ~30 km southwest of the deposit (but is concealed beneath Neoproterozoic and younger cover). Another feature identified within the transects directly beneath the deposit was a mid- to lower crustal region ~40-50 km wide, with relatively low seismic amplitude and coherency, referred to as a bland zone (Lyons and Goleby, 2005; Drummond et al., 2006). Coincident with this seismic bland zone is a conductivity anomaly, imaged in magnetotelluric data, which extends from the Moho to the upper crust (Heinson et al., 2006). In the region below Olympic Dam, the Moho is poorly defined in the seismic data; elsewhere on the transect it lies at ~40 km depth. The boundaries of the Olympic IOCG Province were defined broadly to enclose known regions of early Mesoproterozoic IOCG±U hydrothermal systems and the major associated geological features (Figure 4). The metallogenic province spatially overlaps several of the geological domains of the Gawler Craton which were defined by Ferris et al. (2002). These include the Olympic Domain, Mt Woods Domain and Peake and Denison Domain, shown in Figure 1. The northwestern extent of the Olympic IOCG Province has not been well defined, partly due to limited outcrop and a paucity of geological data for the northern Gawler Craton. The location of the GOMA seismic line was selected, in part, to test whether the Olympic IOCG Province extends into the region of the Coober Pedy Domain and Mabel Creek Domain, or westwards from the Mt Woods Domain along the Bulgunnia Fault. The southern end of the GOMA seismic line occurs within the Wilgena Domain, and the seismic line crosses the Bulgunnia Fault at CDP ~3780 (in Zone A, Figure 5). Further northeast, this structure occurs close to the Prominent Hill deposit (Belperio et al., 2007). Within the seismic transect, the Bulgunnia Fault is imaged as a relatively shallow, south-dipping fault, which intersects a crustal-scale, north-dipping structure at a depth of ~3 s two-way travel time (TWT, ~9 km). The crustal-scale fault offsets the Moho with an extensional geometry. It is noteworthy that the Tarcoola goldfield (Figure 1) occurs in the region of the intersection of these fault systems, where lode gold mineralisation is associated with mantle-derived intermediate-mafic intrusions of the ~1580 Ma Lady Jane Diorite (Budd and Fraser, 2004; Budd and Skirrow, 2007). Although many other factors must be considered in assessing the mineral potential, these relationships lead us to speculate that the zone associated with the Bulgunnia Fault may be prospective for gold (-copper) systems related to mantle magmatism. Iron-rich host rocks adjacent to the fault zone are potentially favourable chemical environments for gold (and copper) deposition. Further north at CDP ~10060, the GOMA seismic line crossed the Karari Shear Zone (in Zone B, Figure 5). This fault separates Neoarchean high-grade metamorphic rocks of the Christie Domain from ~1595 Ma high-grade metamorphic rocks of the Coober Pedy Domain (Woodhouse et al., 2010). Here, the Karari Shear Zone is interpreted to be a north-dipping, crustal-scale fault which soles at depth onto the Moho (Korsch et al., 2010). Furthermore, the regional magnetic data for the region indicates that this major ~east-west shear zone is intersected by ~northeast-southwest striking faults which are subparallel to the Bulgunnia Fault.
157
Figure 4. Solid geology of Olympic IOCG Province (adapted from Skirrow et al., 2006) with the location and CDP stations of the GOMA deep seismic reflection transect and location of the Olympic Dam deep seismic reflection transects. This crustal architecture of intersecting major fault systems and juxtaposition of Paleoproterozoic and Archean terranes, is similar to that observed in the region of both the uranium-rich Olympic Dam and Prominent Hill IOCG deposits (Lyons and Goleby, 2005; Hayward and Skirrow, 2010). In this respect, the region extending along the Karari Shear Zone may be considered prospective for IOCG systems, particularly in the hangingwall of the crust-penetrating fault zone (i.e., Coober Pedy Domain). Indeed, the Cairn Hill IOCG deposit is
158
situated near the intersection of the Karari Shear Zone and the east-northeast trending fault marking the northern boundary of the Mt Woods Inlier (Figure 1). The widespread presence of mafic intrusive rocks in the Coober Pedy Domain may be a positive factor for IOCG mineralisation if they are of early Mesoproterozoic age (Skirrow et al., 2007). Additionally, in the deep crust below the Karari Shear Zone, the MT data indicate a zone of higher conductivity (~30 to 45 km depth). This conductivity variation may suggest that the lower crust in this region has been modified by fluids, a positive factor for IOCG system development. It is unclear at present, however, whether other components favourable for major IOCG deposit formation are present in the Coober Pedy Domain. Possible negative factors are the apparent scarcity of Hiltaba Suite or Gawler Range Volcanic rocks in the Coober Pedy Domain, which would signal the preservation of uppermost crustal levels. This is a necessary ingredient for uranium-rich IOCG systems if uranium is sourced from the upper crustal igneous rocks (Hitzman and Valenta, 2005; Skirrow, 2009). The early Mesoproterozoic high grade metamorphism recorded in the Coober Pedy Domain suggests that any preserved IOCG systems may be of a high temperature magnetite-rich Cu-Au style, similar to the relatively small Cairn Hill and Manxman deposits, rather than the hematite-rich and uranium-bearing IOCG style, such as Olympic Dam and Prominent Hill. The potential for U-rich IOCG systems will depend partly on whether any windows of preserved lower metamorphic grade Proterozoic or Archean host rocks, and particularly early Mesoproterozoic volcanic rocks, are present within, or to the south or north of, the Coober Pedy Domain. Crustal structures along the GOMA seismic line The fault and conductivity architecture interpreted from the GOMA seismic and MT transect can also be used to identify other areas which may be key areas for crustal-scale fluid migration; two examples are discussed below. Within the Box Hole Creek Seismic Subdomain (Korsch et al., 2010), there are a series of north-dipping structures which sole out onto the crustal-scale Box Hole Creek Fault (CDP 14020 in Zone C, Figure 5). This geometry is similar to the architecture interpreted from seismic lines in the Eastern Goldfields of the Yilgarn Craton, Western Australia (Goleby et al., 2004) and the Tanami region goldfields (Goleby et al., 2009). Within the Box Hole Creek Seismic Subdomain, the GOMA 4 drillhole intersected paragneisses with a late Archean-age zircon signature, and a metamorphic age of ~1523 Ma (Jagodzinski and Reid, 2010). This rock package and crustal architecture is similar to that in the Christie and Wilgena Domains, and may suggest the potential for gold systems in this region. Farther north along the GOMA transect (Zone D in Figure 5), the north-dipping Big Swamp Bore Fault (CDP 17350) and Cadney Park Fault (CDP 18270) bound the Big Swamp Bore Seismic Subdomain. The northern of these faults, the Cadney Park Fault, separates the Big Swamp Bore Seismic Subdomain from the Cadney Park Seismic Subdomain (Korsch et al., 2010). Both the Big Swamp Bore and Cadney Park Seismic Subdomains are characterised by low seismic reflectivity throughout the crust, and a slightly deeper Moho. The northern margin of the Cadney Park Seismic Subdomain is defined by the Wintinna Hill Fault, which is a north-dipping, crustal-scale structure. Within this region, the faults are also defined by significant gradients in both gravity and magnetic data (Figures 2 and 3). This combination of crustal-scale faults, and major gradients in both gravity and magnetic data, suggest that these zones may be major fluid migration zones. Geothermal energy systems: the extension of the South Australian Heat Flow Anomaly Hot Rock (HR) geothermal energy systems require high average geothermal gradients and good insulation by overlying sedimentary packages. One of Australia’s areas of highest geothermal gradient is associated with the South Australia Heat Flow Anomaly (SAHFA; Neumann et al., 2000), which is centred on the eastern Gawler Craton, Adelaide Rift System, and the western Curnamona Province. Although there are only a limited number of surface heat flow measurements in this region, the existing measurements define a broad (>250 km wide) zone of anomalously high surface heat flow (92 ± 10 mWm-2; Neumann et al., 2000).
159
Figure 5. GOMA deep seismic reflection line and a very preliminary model of the MT data, northern South Australia, with selected CDP stations (see Korsch et al., 2010; Duan et al., 2010, for details of the data sets). The boxes A-D are areas discussed in the text.
160
Within the region of the GOMA seismic line, there are only two published heat flow values (Figure 1). At Tarcoola, at the southern end of the seismic line, there is a measured heat flow value of 49 mWm-2 (Cull, 1982). There is also a provisional value of 75 mWm-2 reported from the Nicholson 2 drillhole (Cull, 1991), ~40km east of the GOMA seismic line near the Yoolperlunna Inlier. Although this value is only provisional, it is higher than values outside the SAHFA in the western Gawler Craton, and would suggest, therefore, that this region may have a higher potential for geothermal energy systems, if the overlying sedimentary packages are of the appropriate type. The presence of thick sedimentary successions associated with the Officer Basin and the overlying Arckaringa Basin suggest that regions near the GOMA seismic line have the overlying insulating successions required for HR geothermal systems. Detail on the heat production capacity of rocks underlying these successions is limited, however, due to the paucity of outcrop and drill core into basement rocks in this region. Available wholerock geochemistry from Stewart and Foden (2003), for two Hiltaba Suite plutons adjacent to the seismic line in the southern Wilgena Domain, can be used to calculate an average heat production value of ~5 μWm-3 for these granites, which is double the average granite value of 2.5 μWm-3. Further north in the Nawa Domain, granites and monzogranite dykes from the GOMA DH4 drillhole have elevated heat production values, ranging from 5 to 8 μWm-3 (Dutch et al., 2010), but the thickness and regional extent of these igneous units are unknown. Also within this region are granitic bodies interpreted within the solid geology map to be Hiltaba Suite granites, or equivalents (Figure 1), but their geochemical signature is unknown. Conclusions The new seismic data, integrated with existing transects and other geophysical and geological data, provide new insights into the uranium and geothermal potential of the northern Gawler Craton. The Karari Shear Zone is a north-dipping, crustal-scale structure separating Archean from Paleoproterozoic terranes, below which there is a high conductivity zone in the MT data. These crustal geometries are similar to those at the Olympic Dam and Prominent Hill uranium-bearing IOCG deposits, suggesting the Olympic IOCG Province may extend northwestwards into the Coober Pedy Domain and possibly the Mabel Creek Domain. The potential for uranium-bearing hematitic IOCG systems, however, is largely dependant on the presence of low-grade metamorphic Proterozoic host rocks or early Mesoproterozoic volcanic rocks indicating preserved uppermost crustal levels. Such rocks, so far, have not been identified in the region; the potential of the Coober Pedy Domain may be higher for magnetite-rich Cu-Au IOCG systems. Farther north along the transect, the boundaries of the seismically nonreflective Cadney Park Seismic Subdomain correspond to gradients in the gravity and magnetic data, suggesting that these boundary faults may also be significant conduits for crustal-scale fluid flow. Currently, the paucity of heat flow measurements and heat production values from basement rocks limits any interpretation on the northern extent of the South Australia Heat Flow Anomaly. The new seismic data along the GOMA transect, when combined with drillhole and gravity data, however, can be used to identify both the thickness and fault geometry of sedimentary packages, therefore providing a further guide for geothermal exploration. Acknowledgements We thank Martin Hand, David Giles, Peter Betts and Paul Henson for informative discussions on the geology of the northern Gawler Craton, and Lindsay Highet for preparing the figures. David Huston and Terry Mernagh are thanked for their comments on the manuscript. References Ahmad, M., 2002. Geological map of the Northern Territory, 1:2 500 000. Northern Territory
Geological Survey. Belperio, A., Flint, R., and Freeman, H., 2007. Prominent Hill: A hematite-dominated, iron oxide
copper-gold system. Economic Geology, 102, 1499–1510. Budd, A.R., and Fraser, G.L., 2004. Geological relationships and Ar/Ar constraints on gold
mineralisation at Tarcoola, central Gawler gold province, South Australia: Australian Journal of Earth Sciences, 51, 685-699.
161
Budd, A.R. and Skirrow, R.G., 2007. The nature and origin of gold deposits of the Tarcoola Goldfield, and implications for the central Gawler gold province, South Australia. Economic Geology, 102, 1541-1563.
Cowley, W.M., 2006a. Solid geology of South Australia: peeling away the cover. MESA Journal, 43, 4-15.
Cowley, W.M., compiler, 2006b. Solid geology of South Australia. South Australia Department of Primary Industries and Resources, Mineral Exploration Data Package, 15, version 1.1.
Cull, K.P., 1982. An appraisal of Australian heat flow data. BMR Journal of Australian Geology and Geophysics, 7, 11-21.
Cull, J.P., 1991. Heat flow and regional geophysics in Australia. In: Cermak, V. and Rybach, L. (eds) Terrestrial heat flow and the lithosphere structure. Springer-Verlag, 486-500.
Drummond, B., Lyons, P., Goleby, B. and Jones, L., 2006. Constraining models of the tectonic setting of the giant Olympic Dam iron oxide-copper-gold deposit, South Australia, using deep seismic reflection data. Tectonophysics, 420, 91-103.
Duan, J., Milligan, P.R. and Nakamura, A., 2010. Magnetotelluric survey along the GOMA deep seismic reflection transect in the northern Gawler Craton to Musgrave Province, South Australia. Geoscience Australia, Record, 2010/39, 7-15.
Dutch, R., Davies, M. and Flintoft, M., 2010. GOMA basement drilling program, northern Gawler Craton. South Australia, Department of Primary Industries and Resources, Report Book, 2010/02.
Ferris, G.M., Schwartz, M.P., and Heithersay, P., 2002. The geological framework, distribution and controls of Fe-Oxide and related alteration, and Cu-Au mineralisation in the Gawler Craton, South Australia. Part 1: geological and tectonic framework. In: Porter, T.M. (ed.) Hydrothermal iron oxide copper-gold and related deposits: A global perspective. Porter GeoConsultancy Publishing, Adelaide, 9-31.
Goleby, B.R., Blewett, R.S., Champion, D.C., Cassidy, K.F., Jones, L.E.A., Groenewald, P.B., Henson P.A., and Korsch, R.J., 2004. Deep seismic reflection profiling in the Archaean Northeastern Yilgarn Craton, Western Australia: Implications for crustal architecture and mineral potential. Tectonophysics, 388, 119-133.
Goleby, B.R., Huston, D.L., Lyons, P., Vandenberg, L., Bagas, L., Davies, B.M., Jones, L.E.A, Gebre-Mariam, M., Johnson, W., Smith, T., and English, L., 2009. The Tanami deep seismic reflection experiment: An insight into gold mineralization and Paleoproterozoic collision in the North Australian Craton. Tectonophysics, 472, 169-182.
Hand, M., Reid, A. and Jagodzinski, E., 2007. Tectonic Framework and evolution of the Gawler Craton, Southern Australia. Economic Geology, 102, 1377-1395.
Hayward, N. and Skirrow, R.G., 2010. Geodynamic Setting and Controls on Iron Oxide Cu-Au (±U) Ore in the Gawler Craton, South Australia. In: Porter, T.M. (ed.) Hydrothermal Iron Oxide Copper-Gold and Related Deposits: A Global Perspective, volume 3 - Advances in the Understanding of IOCG Deposits. Porter GeoConsultancy Publishing, Adelaide, in press.
Heinson, G.S., Direen, N.G., and Gill, R.M., 2006. Magnetotelluric evidence for a deep-crustal mineralizing system beneath the Olympic Dam iron oxide copper-gold deposit, southern Australia. Geology, 34, 573–576.
Hitzman, M.W. and Valenta, R.K., 2005. Uranium in iron oxide-copper-gold (IOCG) systems. Economic Geology, 100, 1657-1661.
Houseman, G.A., Cull, J.P., Muir, P.M., and Paterson, H.L., 1989. Geothermal signatures and uranium ore deposits on the Stuart Shelf of South Australia. Geophysics, 54, 158-170.
Jagodzinski, E.A. and Reid, A.J., 2010. New zircon and monazite geochronology using SHRIMP and LA-ICPMS, from recent GOMA drilling, on samples from the northern Gawler Craton. Geoscience Australia, Record, 2010/39, 108-117.
Korsch, R.J., Blewett, R.S., Giles, D., Reid, A.J., Neumann, N.L., Fraser, G.L., Holzschuh, J., Costelloe, Roy, I.G., Kennett, B.L.N., W.M. Cowley, Baines, G., Carr, L.K., Duan, J., Milligan, P.R., Armit, R., Betts, P.G., Preiss, W.V. and Bendall, B.R., 2010. Geological interpretation of the deep seismic reflection and magnetotelluric line 08GA-OM1: Gawler Craton-Officer Basin-Musgrave Province-Amadeus Basin (GOMA), South Australia and Northern Territory. Geoscience Australia, Record, 2010/39, 63-86.
162
Lyons, P. and Goleby, B.R., 2005. The 2003 Gawler seismic survey: notes of the seismic workshop held at Gawler Craton State of Play 2004. Geoscience Australia, Record, 2005/19, 85p.
Neumann, N., Sandiford, M. and Foden, J., 2000. Regional geochemistry and continental heat flow: implications for the origin of the South Australian Heat Flow anomaly. Earth and Planetary Science Letters, 183, 107-120.
Selway, K., 2006. Magnetotelluric experiments in central and southern Australia and their implications for tectonic evolution. University of Adelaide, PhD thesis (unpublished).
Selway, K.M., Hand, M., Payne, J.L., Heinson, G.S. and Reid, A., 2011. Magnetotelluric constraints on the tectonic setting of Grenville-aged orogenesis in central Australia. Journal of the Geological Society, London, 168, in press.
Skirrow, R.G., Bastrakov, E., Davidson, G., Raymond, O.L. and Heithersay, P., 2002. The geological framework, distribution and controls of Fe oxide Cu-Au mineralisation in the Gawler Craton, South Australia. Part II. Alteration and mineralisation. In: Porter, T.M. (ed.) Hydrothermal iron oxide copper-gold and related deposits: A global perspective. Porter GeoConsultancy Publishing, Adelaide, 33-47.
Skirrow, R., Fairclough, M., Budd, A., Lyons, P., Raymond, O., Milligan, P., Bastrakov, E., Fraser, G., Highet, L., Holm, O. and Williams, N., 2006. Gawler Craton iron oxide Cu-Au (-U) potential map. Geoscience Australia, Canberra, 1:500 000, 1st edition, www.ga.gov.au/minerals/research/regional/gawler/ gaw_mapgis.jsp
Skirrow, R.G., Bastrakov, E., Barovich, K., Fraser, G., Creaser, R., Fanning, C.M., Raymond, O.L. and Davidson, G., 2007. Timing of iron oxide Cu-Au-(U) hydrothermal activity and Nd isotope constraints on metal sources in the Gawler Craton. Economic Geology, 102, 1397-1426.
Skirrow, R.G., editor, 2009. Uranium ore-forming systems of the Lake Frome region, South Australia: regional spatial controls and exploration criteria. Geoscience Australia, Record, 2009/40, 147pp.
Stewart, K. and Foden, J., 2003. Mesoproterozoic Granites of South Australia. South Australia, Department of Primary Industries and Resources, Report Book, 2003/15, 142p.
Woodhouse, A., Reid, A.J., Cowley, W.M. and Fraser, G.L., 2010. Overview of the geology of the northern Gawler Craton and adjoining Musgrave Province, South Australia. Geoscience Australia, Record, 2010/39, 47-62.