87 Chapter 5 Cursed If You Do, Cursed If You Don’t The Contradictory Processes of Pastoral Sedentarization in Northern Kenya JOHN MCPEAK AND PETER D. LITTLE 1. INTRODUCTION The increased sedentarization of pastoral populations has characterized most arid and semi-arid regions of the world during the past two millennia. The origins of many towns in the Middle East, North Africa, and the Sudan stem in part from the historical process of pastoral sedentarization, whereby segments of mobile herders sought refuge or economic opportunity from settled life. The accelerated settlement of herder populations in Sub- Saharan Africa during the past century provoked claims of ‘an end to pastoralism’ as diversification into town-based activities was seen as a departure from pastoralism, rather than a supplement or support to it (Government of Kenya, 1980; Snow and Morris, 1984). Northern Kenya is unique in this respect since most settlements and towns have only arisen in the past 50 or so years, and mobile pastoralism still characterizes large parts of the region. The increased sedentarization in the area also reflects a series of external influ- ences, such as the widespread proliferation of food aid and other forms of development assistance, which complicates an understanding of longer-term trends toward settlement. It also questions whether or not increased sedentarization among herders in the region really reflects an enduring commitment away from pastoralism. JOHN MCPEAK ● Department of Public Administration, Syracuse University, Syracuse, New York 13244. PETER D. LITTLE ● Department of Anthropology, University of Kentucky, Lexington, Kentucky 40506-0024. Frat-05.qxd 07/05/2004 04:49 PM Page 87
Transcript
87
Chapter 5
Cursed If You Do,Cursed If You Don’t
The Contradictory Processes of PastoralSedentarization in Northern Kenya
JOHN MCPEAK AND PETER D. LITTLE
1. INTRODUCTION
The increased sedentarization of pastoral populations has characterized most arid andsemi-arid regions of the world during the past two millennia. The origins of many towns inthe Middle East, North Africa, and the Sudan stem in part from the historical process ofpastoral sedentarization, whereby segments of mobile herders sought refuge or economicopportunity from settled life. The accelerated settlement of herder populations in Sub-Saharan Africa during the past century provoked claims of ‘an end to pastoralism’ as diversification into town-based activities was seen as a departure from pastoralism, ratherthan a supplement or support to it (Government of Kenya, 1980; Snow and Morris, 1984).Northern Kenya is unique in this respect since most settlements and towns have only arisenin the past 50 or so years, and mobile pastoralism still characterizes large parts of theregion. The increased sedentarization in the area also reflects a series of external influ-ences, such as the widespread proliferation of food aid and other forms of developmentassistance, which complicates an understanding of longer-term trends toward settlement. It also questions whether or not increased sedentarization among herders in the regionreally reflects an enduring commitment away from pastoralism.
JOHN MCPEAK � Department of Public Administration, Syracuse University, Syracuse, New York 13244.PETER D. LITTLE � Department of Anthropology, University of Kentucky, Lexington, Kentucky 40506-0024.
Frat-05.qxd 07/05/2004 04:49 PM Page 87
This chapter presents some preliminary results from a three-year research effortexamining pastoral risk management in northern Kenya and southern Ethiopia. The materi-als here are only from the Kenyan research sites and are supplemented by the authors’earlier studies in the area: McPeak studied the Gabra of Marsabit District during1997–1998 and Little the Chamus of Baringo District, 1980–1998. One main finding of thecurrent study is that what is often called ‘sedentarization’ does not necessarily reflect a full-time departure from pastoralism, nor does it always jeopardize pastoral production. Whenone explores intra-family and intra-household dynamics, a changing pattern of diversecombinations of sedentary-like occupations and pastoral activities are revealed. We findthat sedentarization does not imply a lack of access to livestock, nor always a lack of mobil-ity for livestock owned by settled households. In addition, we identify a great deal of diver-sification into non-pastoral activities in areas where households remain involved in pastoralproduction, even while members are engaged in waged labor and other sedentary activities.The historical process of declining per capita livestock holdings noted by other studies(Fratkin, 1991; Little et al., 2001) has led households to respond by having certain familymembers leave the system to allow remaining members to pursue herding. Those whodepart from the pastoral sector can enter economic niches that generate resources for thepastoral economy through remittances and other transfers. Even agriculture can supportpastoralism by generating grains that reduce a family’s need to sell off livestock to financecereal purchases, a pattern that becomes very important in post-drought periods when livestock holdings are reduced (Little, 1983, 1992).
While this appears to be an important trend revealed in our data, our findings provideimportant counter-examples to this general pattern. In some cases we observe impover-ished households that leave the system cluster around towns and earn incomes insufficientto transfer back to the pastoral sector. It is this later vulnerable group that has attractedmuch of the attention of scholars and development practitioners, as well as those who claiman imminent end to pastoralism. We also find households which fared relatively well in oneof our more arid sites (Kargi) where highly mobile pastoral production was practiced dur-ing the most recent drought. In contrast, for one of our most sedentary sites (Dirib Gumbo),we find diversification into agriculture and investment in education did not provide house-holds with many benefits during the drought period. Finally, we suggest that the relation-ship between sedentarization and vulnerability in livestock wealth and sedentarization andvulnerability in food security need to be carefully distinguished. It is clear in our data thatsedentarization does make households more vulnerable to livestock losses in a drought, butthat the relationship between food security and sedentarization varies between our sites incomplicated ways that we will elaborate later in the chapter.
2. BACKGROUND TO RESEARCH REGION AND DESCRIPTION OF THE STUDY SITES
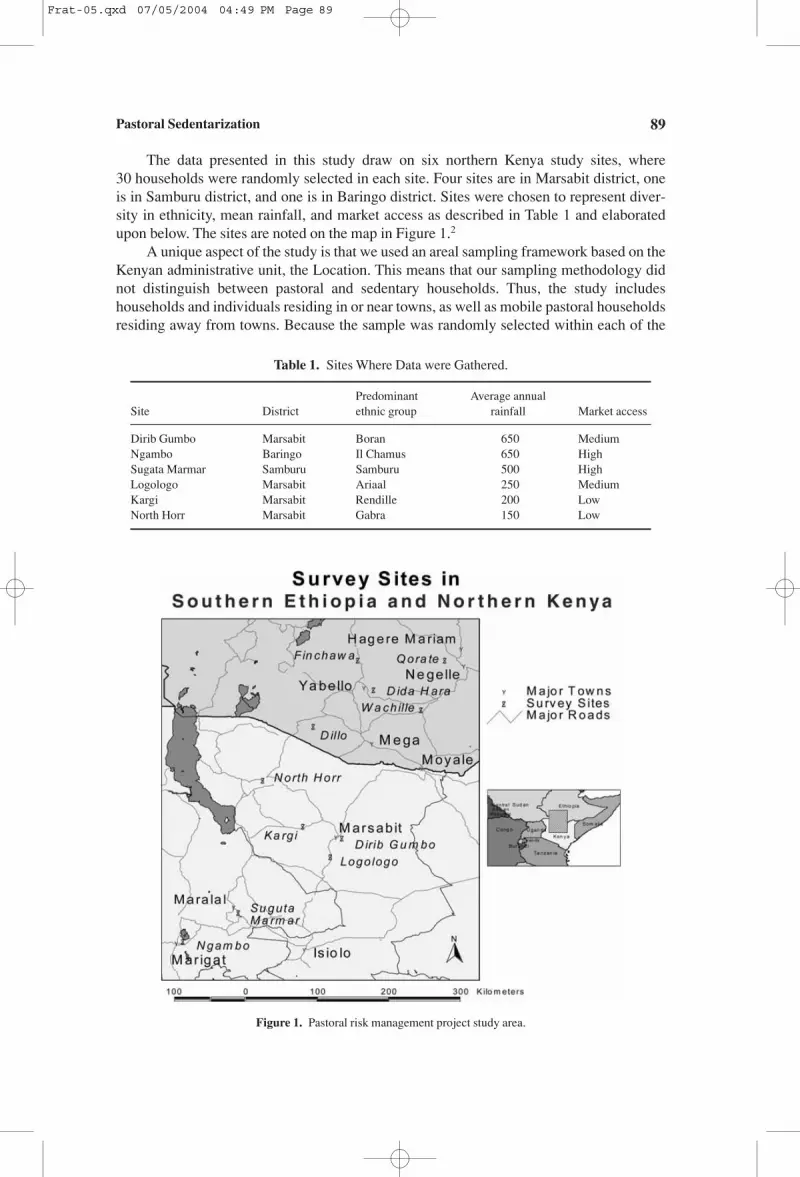
The chapter draws on research conducted by the Pastoral Risk Management Project(PARIMA) of the Global Livestock Collaborative Research Support Program.1 The studyarea covers approximately 10,000 square km and encompasses parts of the rangelands ofsouthern Ethiopia and northern Kenya. The study region is bounded by the towns of HagreMariam and Negelle in Ethiopia and Isiolo and Marigat in Kenya (see Figure 1) andincludes Boran, Gabra, and Guji of Ethiopia, and Ariaal, Boran, Il Chamus, Gabra,Rendille, Samburu, and Tugen peoples of Kenya.
John McPeak and Peter D. Little88
Frat-05.qxd 07/05/2004 04:49 PM Page 88
The data presented in this study draw on six northern Kenya study sites, where 30 households were randomly selected in each site. Four sites are in Marsabit district, oneis in Samburu district, and one is in Baringo district. Sites were chosen to represent diver-sity in ethnicity, mean rainfall, and market access as described in Table 1 and elaboratedupon below. The sites are noted on the map in Figure 1.2
A unique aspect of the study is that we used an areal sampling framework based on theKenyan administrative unit, the Location. This means that our sampling methodology didnot distinguish between pastoral and sedentary households. Thus, the study includeshouseholds and individuals residing in or near towns, as well as mobile pastoral householdsresiding away from towns. Because the sample was randomly selected within each of the
Pastoral Sedentarization 89
Figure 1. Pastoral risk management project study area.
Table 1. Sites Where Data were Gathered.
Predominant Average annualSite District ethnic group rainfall Market access
six locations, the degree of sedentarization reflected in the sample can be taken to be representative of the degree of sedentarization of the location level population.
Households were interviewed with a baseline survey in March 2000 and were re-interviewed at three-month intervals following this baseline. The data presented in thischapter draws on the baseline and the first six repeated surveys, covering the period March2000 to September 2001; and on a series of qualitative, structured interviews conductedduring July to October 2001. Table 1 summarizes the study sites, and is followed by briefdescriptions of the six sites ordered from highest rainfall to lowest rainfall.3
Dirib Gumbo is a Boran settlement approximately 10 km from Marsabit town.4 Themajority of the market activity undertaken by Dirib Gumbo residents takes place inMarsabit town. Most the residents of this area reside on the upper slopes of MarsabitMountain, and practice rain fed cultivation. Many households in this area also keep live-stock. In some cases these animals are used to plow fields. Very little large-scale migrationof animals takes place from this location, both due to relatively small herd sizes andbecause nearby pastures are controlled by other ethnic groups. Herders instead rely on cropresidues, forest products, or pasture on the lower slopes of Marsabit Mountain to feed theiranimals.
Ngambo is an Il Chamus settlement approximately 10 km east of Marigat town (seeLittle 1992). Marigat town is located 100 km north of Nakuru on an all-weather road.Marigat town is the major market center used by Ngambo residents. Marigat is particularlylively during the twice-monthly livestock auction held just outside town. Ngambo islocated near the Pekerra irrigation scheme, and a large number of households of this loca-tion either grow crops in this scheme themselves or work as laborers in these fields. Theirform of pastoralism is markedly sedentary, but does entail seasonal herd movementsof 20–30 km, during the dry season. The majority of family members rarely move duringthe year.
Sugata Marmar is a Samburu settlement on the Laikipia–Samburu District border,approximately 50 km south of Maralal on the Maralal–Rumuruti road. Significant popula-tions of impoverished Turkana and Pokot are resident in this location as well. SugataMarmar has a large weekly livestock market offering households the opportunity for alter-native income sources and a place to sell animals. Some rain-fed cultivation is practiced inthis area, particularly in the higher elevation areas towards Maralal town, the administrativecenter of Samburu District. Pastoralism in the area is moderately mobile and cattle can bemoved distances of 50� km during harsh dry seasons or droughts. Rather than the wholefamily moving with the herds, households mainly rely on a combination of satellite campsof young men (16 years and older) to care for and migrate with the animals and, for polygamous households, moving animals between households of different wives that areestablished in different areas. From interviews it seems that families themselves used tomigrate with the herds more frequently before the 1980s.
Logologo is an Ariaal settlement approximately 40 km south of Marsabit town on themain Isiolo–Marsabit road. Ariaal are a group that mixes elements of Samburu andRendille culture (see Fratkin, 1991). Logologo residents utilize markets in both Marsabittown and in Logologo town. Rain-fed agriculture is possible in the higher areas of this location, and a very small amount of small-scale irrigation is practiced in town. Mosthouseholds in Logologo settled there in the 1970s following a series of poor rainfall yearsand herd losses. Like the Samburu mentioned above, they no longer move the whole familywith their animals. Instead, they keep small herds in the area around town and send themajority of their animals to satellite camps in the surrounding rangelands.
John McPeak and Peter D. Little90
Frat-05.qxd 07/05/2004 04:49 PM Page 90
Kargi is a Rendille settlement approximately 75 km to the west of Marsabit town in aflat, arid basin. Kargi residents mostly conduct market activity in Kargi town, althoughthey make occasional use of Marsabit markets. No cultivation is practiced in this area. Overthe past 20 years, formerly nomadic Rendille have settled around the town center in clangroupings. Rendille in the Kargi area keep small herds in the area around town and rely onyoung men to stay with the remainder of the herd in highly mobile satellite camps. Theykeep relatively large numbers of camels and goats and it is not unusual for their camps tomove several times during a season.
North Horr is a Gabra settlement approximately 200 km west of Marsabit town onthe northern edge of the Chabi desert. Similar to Kargi, most market activity takes place inNorth Horr town, although residents do make occasional marketing trips to Marsabit town.No cultivation is practiced here. Many Gabra are nomadic in the traditional sense, ashouseholds move their house and household belongings to new areas with their animalswith some frequency. However, the time between these moves is becoming longer and thearea covered by these moves is becoming smaller as Gabra slowly appear to be movingtoward the satellite camp based system of their Rendille neighbors. Gabra also keep rela-tively large numbers of camels and goats in their herds.
3. PRELIMINARY SURVEY FINDINGS
In this section, we present some of our preliminary findings based on cross-community comparisons. At the time this chapter was prepared, we were still involved inthe data gathering process. Because of this, we have not yet prepared the data for analysis atthe individual and household levels. However, it is possible to analyze the data set in itscurrent form at the community level, but even in this case the findings should be treated aspreliminary. Therefore, we advance these findings as broad cross community comparisonsthat will be refined by further analysis at the household and individual levels when datagathering is complete.
3.1. Herd Size Change, Mobility, and Sedentarization
The period covered by the survey began with a generalized drought in northern Kenya.Figure 2 presents information on rainfall in our study sites. The main impact of the droughtwas felt throughout the study area in 2000. Overall, sample households lost an average ofaround 25% of their herds between March 2000 and March 2001. The overall rate of stock-less households in our sample increased from 7% in March 2000 to 12% in September 2001.
Survey results indicate there are large differences in herd size between sites and in thelosses experienced. With regard to herd size, these differences generally follow the patternthat larger household herds are located in the study region’s drier areas, such as North Horr and Kargi. The listing of sites from largest median herd to smallest median herd when all households and time period specific observations are included is as follows (Total Livestock Unit values in parentheses5): Kargi (21), North Horr (20), Logologo (9),Dirib Gumbo (6), Sugata Marmar (4), and Ngambo (2).6 However, as seen in Figure 3,there are major differences between locations in the pattern of herd size change over thesurvey period.
Figure 3 indicates that there are differences in the severity of herd losses when the different areas are compared. We propose that part of the explanation for these differences
is found in the degree of livestock mobility. Increased mobility has a relationship withdecreased herd loss. This is revealed by the information presented in Table 2. Table 2presents for each site the overall change in herd size between March 2000 and September2001, the maximum decline during this time period, the average number of water pointsused by a household having herds per period, the percent of these points that weredescribed as satellite camps, and the total number of water points used by households in
Frat-05.qxd 07/05/2004 04:49 PM Page 92
each location over the March 2000 to September 2001 period. Mobility is measured by thenumber of water points and reliance on satellite camps by the different communities.
With the exception of Sugata Marmar, the table indicates that higher levels of mobilityare associated with lower herd losses. In most sites, the higher the average number of waterpoints used per period, the lower the average herd size decrease. This is also true for satel-lite camp use. Findings from Sugata Marmar suggest that having many water points to visitmay also make a difference. Herders in Sugata mentioned more points than any other area,suggesting they are able to spread out over more area. Households use relatively fewerpoints per period than in other areas, but use more water points overall than in other areas.
When we turn to the issue of herd size change within areas, the data suggest that herdaccumulation is an effective strategy for ensuring a viable post-drought herd size. Figure 4presents (natural log transformed) herd size in March 2000 compared to (natural log trans-formed) herd size in March 2001 at the household level. A 45-degree line is added to thisgraph. In this graph, a dot above the line indicates a household herd increased in size overthe period, a dot on the line means the beginning and ending herd were the same size, and adot below the line means the household herd decreased in size over the study period.
The cloud of dots slightly below the 45-degree line reflects the decreases in averageherd size reported in figure one. However, note the pattern of the dots is generally upwardsloping. Households that had more animals in early 2000 tend to be the households thathave more animals in 2001. The relationship is not perfect, but it does help to explain whyherders attempt to maximize herd size in good (pre-drought) years—an attribute that many‘experts’ associate with pastoral irrationality. Some households did better than others, andactually realized increased herd size over the one-year interval. Others did much worse.The most extreme examples are found for the households represented by the dots along thelower axis. These dots indicate that households with herds of up to 25 TLU in March 2000had become stockless only a year later.7
While it is early in the herd rebuilding process, our preliminary results indicate herdrebuilding is more a matter of the biological process of animal birth within the family herd
Pastoral Sedentarization 93
0
1
2
3
4
5
6
0 1 2 3 4 5 6
ln(herd size 0300 +1)
ln(h
erd
siz
e 0
30
1 +
1)
Figure 4. Herd size in March 2000 compared to March 2001.
Frat-05.qxd 07/05/2004 04:49 PM Page 93
than restocking through transfers from other herders or restocking through use of the market. From March 2001 through September 2001, the average birth rate from the totalherd in TLU terms was an annualized 28 percent, compared to purchases in the markets andreceipts of livestock gifts and loans, which account for an annualized rate of 3 percent,respectively. In short, if a herder was more mobile and had a larger herd s/he generallyfared better during and immediately after a drought than others.
The following three case studies of individuals illustrate the kinds of strategies thatherders invoke to cope with and recover from drought.8
Case A. William is an Il Chamus from Ngambo who is in his mid-30s and is relativelywell-educated with two years of secondary school training. He lost about 75 percent of cat-tle during the 1999/2000 drought and is attempting to rebuild his herd through several dif-ferent mechanisms. First, he is relying on small stock, which reproduce faster than cattle.He even recently bought additional goats from the sale of a young bull that survived thedrought. Second, he is pursuing agriculture both to produce surplus grain which he can selllocally to buy livestock, and to have sufficient food so that he does not have to sell animalsto buy grain. This latter strategy is cited by a number of herders in our study region, butonly where cultivation is feasible. Finally, William is rebuilding his herds through the useof remittances from family members working outside Ngambo and from customary live-stock gifts and exchanges. In comparing his current herd rebuilding strategies with thosefollowing the equally devastating 1991–1992 disaster, he complains that local livestockgifts and transfers were more common in 1992 than now, because widespread poverty hasdiminished the capacity to help family members and friends. “A destitute person cannothelp other destitute persons,” he explains. According to William, it took about two years torebuild his livestock after the 1991–1992 drought, but he thinks it will take longer now.
Case B. Lenapir is an Ariaal Rendille from Logologo, living about 40 km south ofMarsabit town. She heads her own household and is engaged in farming and some pettytrade around Logologo town. She is a widow with six children. A lion killed her husband in1992. During the 1999–2000 drought she lost 75 percent of her animals and is now a fairlydestitute pastoralist. Her most important strategies for herd recovery are assistance fromher brothers (one of whom is relatively wealthy), receiving food aid so that she can meet subsistence needs without having to sell animals, and natural reproduction of herremaining herd. She was expecting that some of her cattle would give birth in late 2001,helping her on her way to recovery. Compared with the drought of 1991–1992 when shelost 60 percent of her cattle, she thinks herd recovery in 2001–2002 will be more difficult.The main reason for this is because her wealthy brother also lost many of his animals andwill not be able to help her as much as in the past. In addition, local assistance networks tohelp impoverished herders are not as salient as they were in the 1970s and 1980s.
Case C. Gondara is a Gabra household head form North Horr who lost more than 50 percent of his livestock during the 1999–2000 disaster. He practices a very mobile formof pastoralism but still lost more than 50 percent of his livestock holdings. In addition torelying on food assistance, he feels that herd reproduction will be the main mechanism toassist herd recovery. He does not receive any remittances and is too far from markets to relyon these sources to rebuild his battered livestock herd. Already he says that recovery is wellunderway because he is focusing on goats, which have been giving birth in large numberssince the end of the drought. He also says that his productive female camels are alreadypregnant (October 2001) and will soon give birth. He also has given two goats to a fellowclan member who was particularly affected by the recent drought. He remains optimisticthat his herds will recover within a few years.
John McPeak and Peter D. Little94
Frat-05.qxd 07/05/2004 04:49 PM Page 94
The three case studies presented above show the different strategies that herdersinvoke to recover from drought. Those households in areas with good access to markets andemployment sources, such as Ngambo, rely more on waged incomes and livestock pur-chases to recover, than the more remote sites (such as North Horr) where herd recovery ismainly through biological reproduction. Local livestock exchanges and gifts also seem tobe more important in areas without favorable access to markets; in both Ngambo andSuguta Marmar local exchange systems were described as playing minimal roles in herdrecovery.
3.2. Income and Expenditure
In the preceding section, we considered the issue of herd size and herd size change.This gave us some understanding of household welfare in terms of household assets (especially livestock) and household asset change. In this section, we investigate householdwelfare in terms of income and expenditure. We use these measures to provide some understanding of household welfare and food security during the study period.
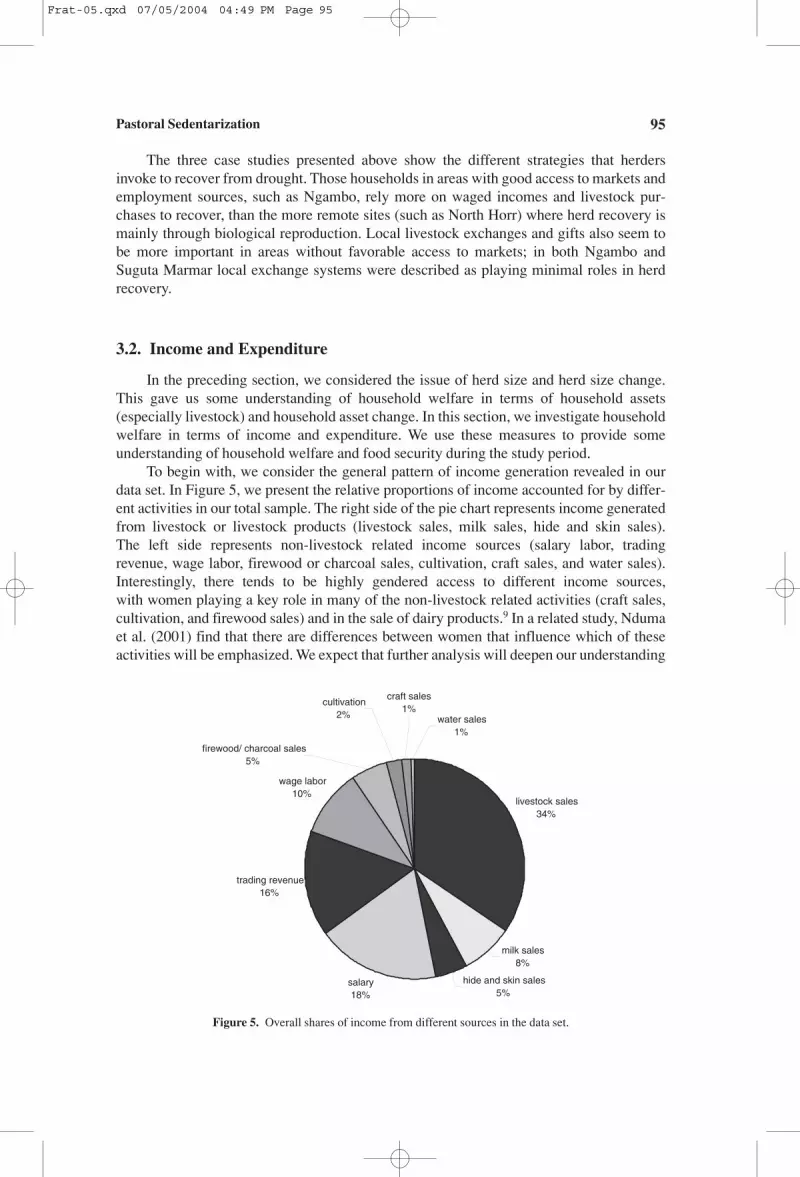
To begin with, we consider the general pattern of income generation revealed in ourdata set. In Figure 5, we present the relative proportions of income accounted for by differ-ent activities in our total sample. The right side of the pie chart represents income generatedfrom livestock or livestock products (livestock sales, milk sales, hide and skin sales). The left side represents non-livestock related income sources (salary labor, trading revenue, wage labor, firewood or charcoal sales, cultivation, craft sales, and water sales).Interestingly, there tends to be highly gendered access to different income sources,with women playing a key role in many of the non-livestock related activities (craft sales,cultivation, and firewood sales) and in the sale of dairy products.9 In a related study, Ndumaet al. (2001) find that there are differences between women that influence which of theseactivities will be emphasized. We expect that further analysis will deepen our understanding
Pastoral Sedentarization 95
livestock sales34%
milk sales8%
hide and skin sales5%
salary18%
trading revenue16%
wage labor10%
craft sales1%
water sales1%
cultivation2%
firewood/ charcoal sales5%
Figure 5. Overall shares of income from different sources in the data set.
Frat-05.qxd 07/05/2004 04:49 PM Page 95
John McPeak and Peter D. Little96
0
1000
2000
3000
4000
5000
6000
7000
8000
9000
10000
Logo
logo
Nga
mbo
Sug
ata
Mar
mar
Kar
gi
Dirib
Gum
bo
Nor
th H
orr
Sh
illin
gs in
th
ree m
on
th p
eri
od
Non Livestock
Livestock and
Livestock Products
Figure 6. Total income reported over a three-month period.
of how individual characteristics, particularly gender and wealth, influence activity choicein this area.
Figure 5 indicates that slightly over half (53%) of the total income recorded for ourhouseholds came from sources other than livestock or livestock product sales. When weturn to the site-specific data, we can see that this overall pattern varies significantlybetween sites. Figure 6 shows that non-livestock income sources provide the majority ofincome for three sites: Logologo, Ngambo, and Sugata Marmar. Intriguingly, these threesites have higher income than the sites where income from livestock accounts for themajority of income. It is also interesting to note that the income from livestock sales is less variable across sites than is the variability in income from non-livestock sources.10
Those households with better access to markets and infrastructure have higher and morediversified incomes. These households also tend to be characterized by a greater degree ofsedentarization and decreased mobility, but there are important exceptions to this tendencythat are discussed later in the chapter.
We also asked households to report their cash expenditures over a two-week period fora variety of commodity categories.11 The sum of these expenditures provides a measure of household well being, under the assumption that higher expenditures reflect higher consumption. We present these results as cash expenditures, which often provide a betterindicator of well being than reported incomes. This partly is due to difficulties involved inaccurately recording total income (see Little, 1997).
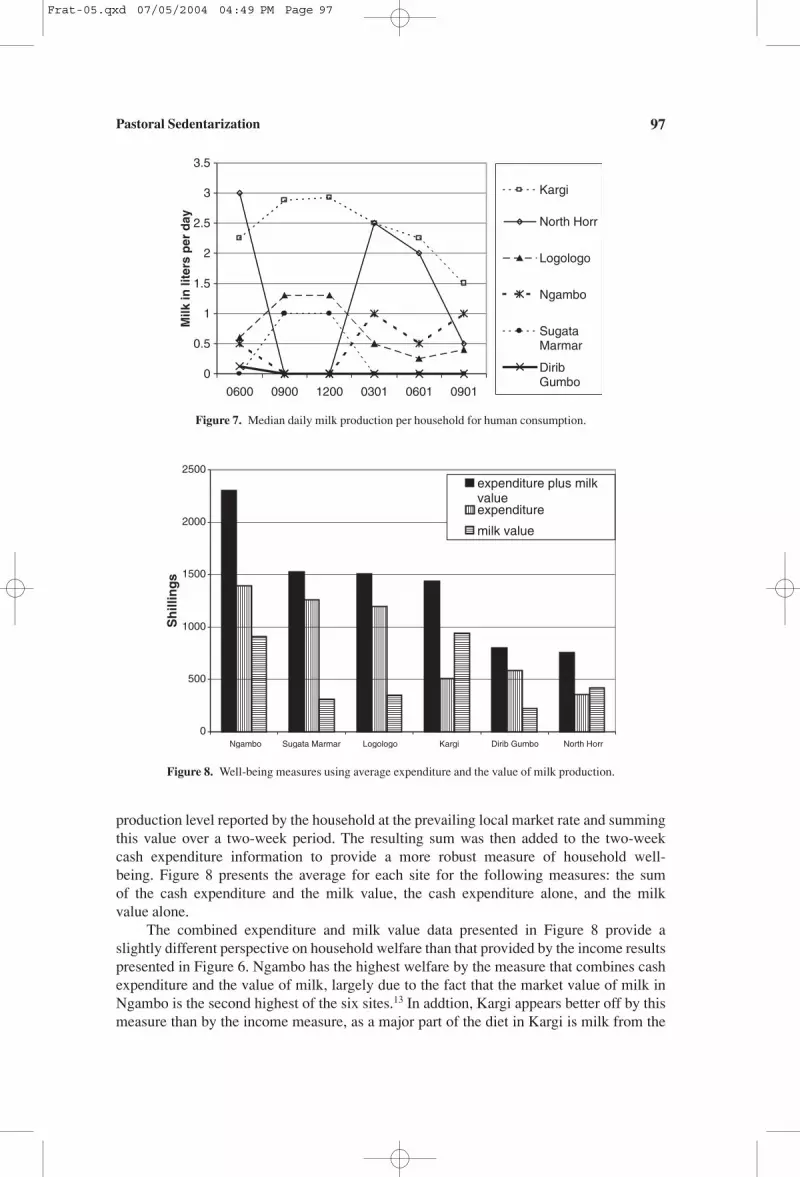
One problem with the cash expenditure measure is that it does not include the consumption of non-marketed goods. As milk consumed from household herds can consti-tute a major proportion of total household consumption in a pastoral setting, a low level ofmarket involvement—hence cash expenditures—may not reflect low welfare if householdsare meeting their consumption needs by consuming milk from their herds. Milk productionat the household level provides a significant contribution to household welfare, as seen inFigure 7, which presents the average amount of milk households reported was available forhuman consumption in each period.12
Recognizing the potential role home consumed milk plays in household well being,a measure of the value of home produced milk was constructed by valuing the daily milk
Frat-05.qxd 07/05/2004 04:49 PM Page 96
production level reported by the household at the prevailing local market rate and summingthis value over a two-week period. The resulting sum was then added to the two-week cash expenditure information to provide a more robust measure of household well-being. Figure 8 presents the average for each site for the following measures: the sum of the cash expenditure and the milk value, the cash expenditure alone, and the milk value alone.
The combined expenditure and milk value data presented in Figure 8 provide aslightly different perspective on household welfare than that provided by the income resultspresented in Figure 6. Ngambo has the highest welfare by the measure that combines cashexpenditure and the value of milk, largely due to the fact that the market value of milk inNgambo is the second highest of the six sites.13 In addtion, Kargi appears better off by thismeasure than by the income measure, as a major part of the diet in Kargi is milk from the
Pastoral Sedentarization 97
0
0.5
1
1.5
2
2.5
3
3.5
0600 0900 1200 0301 0601 0901
Milk
in li
ters
per
day
Kargi
North Horr
Logologo
Ngambo
SugataMarmar
DiribGumbo
Figure 7. Median daily milk production per household for human consumption.
0
500
1000
1500
2000
2500
Ngambo Sugata Marmar Logologo Kargi Dirib Gumbo North Horr
Sh
illin
gs
expenditure plus milkvalueexpenditure
milk value
Figure 8. Well-being measures using average expenditure and the value of milk production.
Frat-05.qxd 07/05/2004 04:49 PM Page 97
herds. Both measures indicate that average welfare in Dirib Gumbo and North Horr islower than that found in the other sites.
Variation in the expenditure and milk value measures provides one other perspectiveon household welfare (Figure 9). This is based on the idea that households attempt tosmooth consumption over time. A household having food surplus to household needs inone season and then confronted by a food deficit in the following period would almost cer-tainly be better off if they could consume the average of these two extremes in both periods.This would mean that higher variability in the expenditure and milk value measures is asso-ciated with lower welfare, as it is assumed that households would be happier if they couldavoid such fluctuations in consumption over time.
Again, households in Dirib Gumbo and North Horr are worse off than households inother sites on average. Not only is the average measure of expenditure plus milk valuelower than in other sites, it is also relatively more variable. We also find that Ngambo andLogologo are relatively better off by this measure. As shown earlier in Figure 5, salarylabor, wage labor, and trading account for a great deal of non-livestock and livestock prod-uct income. One explanation for the positive welfare indicators in Ngambo, Logologo andSugata Marmar is that these three activities account for 61%, 55%, and 41% of incomerespectively in these sites. In contrast, these three activities account for 30% in North Horrand Dirib Gumbo and 34% in Kargi. Increased welfare, as measured by higher average andless variable expenditure and higher income, are associated with higher levels of salarylabor, wage labor, and trading.14 Conversely, it should be noted that the three more diversi-fied sites suffered severe herd losses during the recent drought (see Figure 3). However, inspite of these losses, it appears that households in more diversified sites were not asexposed to the risk of food insecurity as households in less diversified sites. This leads tothe question, what allows one site to become more diversified than another site? Beyondissues of location and infrastructure discussed above, our findings suggest education mayplay a role in the diversification of household income generation activities. We turn to thistopic in the next section.
John McPeak and Peter D. Little98
0
50
100
150
200
250
Ngambo Logologo Kargi Sugata Marmar Dirib Gumbo North Horr
100*
(Sta
nd
ard
Dev
iati
on
/mea
n)
cv expenditure plus milkcv expenditurecv milk value
Figure 9. Coefficient of variation in average expenditure and the value of milk production.
Frat-05.qxd 07/05/2004 04:49 PM Page 98
3.3. Education
What role does education play in allowing access to the non-pastoral income sourcesnoted in the previous section? To investigate this question, we sum the ages of all house-hold members and the number of years each household member spent in school. This is used to derive the fraction of years spent by household members in a school, which provides a measure of past education. This is presented in Figure 10.
This measure of household education levels is closely related to the measure of theshare of income that comes from non-pastoral sources. The areas where households havespent more time in formal schooling are also the areas that derive a higher share of theirincome from non-pastoral sources. Also, with the exception of Dirib Gumbo, the areas inwhich households have higher human capital stock of education are better off in terms ofthe income and expenditure measures of Section II and in terms of food insecurity.
We can again draw on our case study material to elaborate on this issue. The case of Letamara of Ngambo is illustrative of the positive role that education can play in food
Pastoral Sedentarization 99
0%
2%
4%
6%
8%
10%
12%
14%
16%
18%
20%
Ngambo Logologo Dirib
Gumbo
Sugata
Marmar
North Horr Kargi
Figure 10. Percent of years household members spent in schooling.
0%
10%
20%
30%
40%
50%
60%
70%
80%
90%
100%
Ngambo SugataMarmar
DiribGumbo
Logologo Kargi North Horr
Figure 11. Enrollment of eligible children in school in 2000.
Frat-05.qxd 07/05/2004 04:49 PM Page 99
insecurity, even when livestock have been devastated by drought. Even before food reliefcame to Baringo in 2000, Letamara’s household was able to purchase adequate foodbecause he held a government job in Marigat and because his brother was employed inNakuru town. This occurred despite the fact that he lost almost 80 percent of his livestockholdings and there was virtually no milk available from his herd for household members.Both Letamara and his brother had graduated from secondary school and in the case of thebrother he had attained a college degree. Not only did remittances and wages allowLetamara’s household to fare better than other households—even those with more livestock—but they also were able to help numerous other family members and relativeswith food purchases.
We also present the enrollment rates for each of our sites for the 2000 school year.This provides a measure of current education levels. This information is presented inFigure 11.
The data indicate that enrollment of school age children differs drastically by site.When we compare these findings with the information on mobility presented in table two,it appears there is an inverse relationship between mobility and enrollment, a pattern that isespecially apparent by contrasting Letamara’s Ngambo area and Gondara’s North Horrarea. Sites where there is higher mobility have lower enrollment rates and vice versa. Thus,while Ngambo is the least mobile site in our study region (i.e., the most sedentarized), ithas the highest levels of education and is among the most economically diversified commu-nities in the area. Moreover, as we have shown above it has been able to parlay educationinto jobs and to avoid severe food insecurity by using wages and remittances to compensatefor herd losses and low herd productivity. Gondara, by way of contrast, has never been toschool and has none of his children in school. He finds it difficult to reconcile remainingnear towns with the nomadic lifestyle demanded by his herds. However, he is optimisticthat the mobile pastoral strategy will allow him to rebuild his herd quickly and thus avoidfuture food insecurity.
3.4. Comparisons of Different Communities
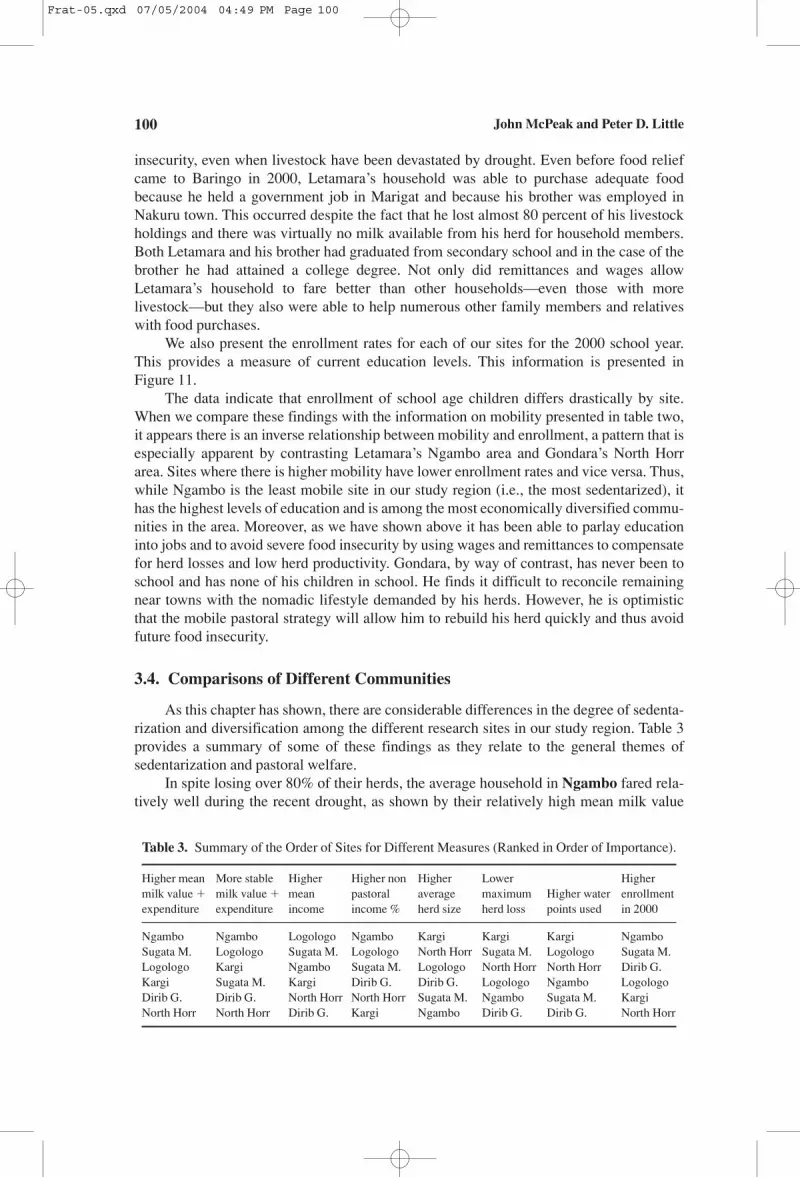
As this chapter has shown, there are considerable differences in the degree of sedenta-rization and diversification among the different research sites in our study region. Table 3provides a summary of some of these findings as they relate to the general themes of sedentarization and pastoral welfare.
In spite losing over 80% of their herds, the average household in Ngambo fared rela-tively well during the recent drought, as shown by their relatively high mean milk value
John McPeak and Peter D. Little100
Table 3. Summary of the Order of Sites for Different Measures (Ranked in Order of Importance).
Higher mean More stable Higher Higher non Higher Lower Highermilk value � milk value � mean pastoral average maximum Higher water enrollmentexpenditure expenditure income income % herd size herd loss points used in 2000
Ngambo Ngambo Logologo Ngambo Kargi Kargi Kargi NgamboSugata M. Logologo Sugata M. Logologo North Horr Sugata M. Logologo Sugata M.Logologo Kargi Ngambo Sugata M. Logologo North Horr North Horr Dirib G.Kargi Sugata M. Kargi Dirib G. Dirib G. Logologo Ngambo LogologoDirib G. Dirib G. North Horr North Horr Sugata M. Ngambo Sugata M. KargiNorth Horr North Horr Dirib G. Kargi Ngambo Dirib G. Dirib G. North Horr
Frat-05.qxd 07/05/2004 04:49 PM Page 100
plus expenditure value15. As we have demonstrated, Ngambo households have access towork opportunities in the nearby town of Marigat, which has a lively market and is con-nected by an all-weather road to Nakuru, and can also find work in the local irrigationcheme. Salary, wage labor, and trading account for over 60% of household income. Pasteducation levels and current enrollment rates are the highest of any site in our study region.
In contrast, the average Dirib Gumbo household lost over 80% of their herd and theirwell-being does appear to have been negatively impacted by the drought.16 Although DiribGumbo is not distant from the market town of Marsabit and Dirib Gumbo households haverelatively high education levels, they have a relatively low share of their income from non-pastoral sources.17 Salary, wage labor, and trading account for only 30% of householdincome. This is probably because most Dirib Gumbo households rely on rain fed agricul-ture in normal years. When the rains failed during the drought period covered by the study,many of the households sold livestock to meet consumption needs, which may explain whythe share of income from livestock and livestock products is relatively high.
The average household in Sugata Marmar was not severely impacted by the droughtin terms of herd loss or well-being. Partially, this may reflect the fact that the rainfall datafrom the area (see Figure 2) suggests the drought was less severe in Sugata Marmar than inother areas. It may also reflect the fact that households in this location have access toincome generating opportunities arising from the large weekly market held in this town.Households in Sugata Marmar earn a relatively higher share of their income from trading(25%), than is found in any other site, and combined with income from selling their ownlivestock and livestock products (45% of income), they earn considerable revenues fromtrade. The mobility of livestock in this area differs from that in other areas perhaps becausethere are more water points available in the Samburu grazing lands. By relying on satelliteherd camps and multiple established households, Sugata Marmar families appear to havefound a compromise between mobility and education, as is seen by the relatively highenrollment rates.
The average household in Logologo lost roughly half their herd in the recent drought,but this does not appear to have severely impacted welfare as measured by mean income,mean expenditure, or variability in expenditure. Logologo is the only site where the incomeshare from salary (42%) outweighs the income share from livestock and livestock products(35%). Just over half the salary earners work outside the area and are employed by NGO’s,the police, the army, the wildlife service or work as watchmen. Schools, governmentdepartments, and the police employ local salary earners. Households in Logologo haveestablished links to the larger national economy that allowed their welfare levels to be rela-tively unaffected during the recent drought.
The Kargi results provide an interesting nuance to our understanding of the process ofsedentarization. Although the households in Kargi have settled, their animals remain highlymobile. The Kargi results show that pastoral production remains a viable production strat-egy in some areas. Kargi herders are relatively well off in terms of the mean and variance ofthe expenditure plus milk value measure, and they lost a relatively small percentage of theirherd. Their isolation from market forces actually seems to have allowed them to pursue a form of mobile pastoralism well suited to their environment.
Contrasting the North Horr results with the Kargi results provides a fuller under-standing of these points. North Horr households are more mobile than Kargi households, asmany households still shift their entire household to a new area in search of pasture while inKargi only the animals are sent. However, results show that Kargi animals are more mobilethan North Horr animals. With regard to the viability of pastoral production, it should be
Pastoral Sedentarization 101
Frat-05.qxd 07/05/2004 04:49 PM Page 101
noted that the main difference in the welfare measures between North Horr and Kargi is thelarger and less variable milk production in the latter site. Although it is not well reflected in the rainfall data for 1999–2001, the spatial distribution of rainfall observed in this areaduring the study period appeared to create more abundant pasture in key pasture areas usedby Kargi herds compared to those used by North Horr herds.18
4. CONCLUSIONS
The causes and consequences of sedentarization are complex. In this chapter we havepresented information drawn from household level surveys and interviews conducted during 2000 and 2001 in six different sites in northern Kenya. The period of data collectioncovered the onset of a drought and continues through the early stages of a recovery fromthe drought.
With regard to livestock wealth, we have shown that larger herds tend to be located in drier areas, where herders derive a higher share of their income from livestock and live-stock products and also have more milk available for home consumption. With regard tochanges to herd wealth in the drought, we find that areas where herds were more mobilesuffered lower losses. We also have noted that households with larger herds before thedrought tended to have larger herds after the drought, showing that herd accumulation atthe household level provides a self-insurance role.
In contrast to our findings for livestock wealth, we find that areas with higher share ofincome from non-pastoral sources have higher welfare in terms of higher income, higherexpenditure, and lower variability in the measure of milk value plus expenditure. In somecases they also are more food secure because they convert wages into food purchases. In this respect, we find that education seems to play an important role in how householdsearn their income and cope with food insecurity. Areas where household members havespent more time in formal education have higher shares of their income from non-pastoralsources and tend to have higher incomes and expenditure levels, including on food. We alsofind there is an inverse relationship between enrollment in school and mobility.
The findings in this chapter corroborate earlier work on pastoralism that suggestssedentarization attracts both poor and relatively wealthy herders (Barth, 1964; Little,1985). The latter group appears ‘blessed’ in the kinds of opportunities they can pursue andthe degree of support that they can provide the pastoral sector and their mobile relatives and family members. In contrast, the poor appear ‘cursed’ in the kinds of unremunerativeactivities they engage in and the extent to which they are caught in a vicious cycle of lowincomes, low mobility, and high food insecurity.
Where this chapter departs from these and other studies of sedentarization in Africaand elsewhere is by showing how the process does not necessarily equate to less herdmobility. By utilizing mobile satellite camps, certain members of pastoral households canbe sedentary and pursue activities usually associated with sedentarization (waged employ-ment, agriculture, and/or education) while their animals continue to move opportunisticallyaccording to climate and resource conditions. These novel forms of adaptation show thatwhile serious development and food security problems still confront pastoral communitiesof northern Kenya, the pursuit of non-pastoral, sedentary-like activities does not forecast anend to pastoralism. Indeed, we have argued that the types of non-pastoral (‘supplemental’)activities discussed in this chapter may be what will allow mobile pastoralism to continuein the area for the foreseeable future.
John McPeak and Peter D. Little102
Frat-05.qxd 07/05/2004 04:49 PM Page 102
NOTES
1. The PARIMA project is a collaborative effort of Utah State University, the University of Kentucky,Cornell University, Egerton University (Kenya), and the International Livestock Research Institute(ILRI). It addresses the causes and consequences of different types of risk among pastoralists; the meansby which herders manage—economically, environmentally, and culturally—endemic and periodic risks;and the grassroots initiatives by herders to address the difficulties associated with high levels of risk. Thispaper has benefited from discussions with our project colleagues: Abdillahi Aboud, Christopher Barrett,D. Layne Coppock, Cheryl Doss, Getachew Gebru, and Hussein Mahmoud. PARIMA is supported by theGlobal Livestock Collaborative Research Support Program, funded by the Office of Agriculture and FoodSecurity, Global Bureau, USAID, under grants DAN-1328-G-00-0046-00 and PCE-G-98-00036-00. Theopinions expressed do not necessarily reflect the views of the U.S. Agency for International Development.
2. This map was prepared by Ingrid Rhinehart.3. An interesting variable that generally correlate both with rainfall and the extent of sedentarization is
ownership of poultry (chickens). From highest rainfall to lowest: the presence of poultry in the study areawas: Dirib Gumbo (57 percent own chickens); Ngambo (73 Percent); Suguta Marmar (40 percent);Logologo (60 percent); Kargi (20 percent); and North Horr (6 percent). As will become more evidentbelow, generally the more mobile the community is, the less important are poultry.
4. Although we describe each settlement by noting the majority ethnic group present in the location, it isimportant to note that in each site, there are minority populations from other ethnic groups. Given ourareal sampling method, members of these minority groups are often represented in our data.
5. Herd size is measured in Total Livestock Units (TLU) following the weighting of the Range ManagementHandbook of Kenya, where 1 head of cattle � 0.7 camels � 10 sheep � 11 goats.
6. Herd size per capita follows roughly the same pattern, as the average household size is 6 in Kargi andNorth Horr, 7 in Dirib Gumbo, and 8 in Logologo, Sugata Marmar, and Ngambo.
7. By September 2001 stockless households accounted for 25% of sample households in Dirib Gumbo, 16%in North Horr, 11% in Sugata Marmar and Ngambo, and 3% in Kargi and Logologo.
8. Peter Little developed the interview guidelines for these case histories and the interviews were conducedby Hussein Mahmoud and translated by local research enumerators.
9. One contradictory aspect of sedentarization this leads to is that while sedentarization often decreaseshousehold welfare, it frequently opens up new income opportunities for women (Fratkin and Smith 1995).The gendered dimensions of pastoral diversification in our study region are more fully reported in Little et al., 2001).
10. With regard to diversification of income sources, it is important to distinguish between a given householddiversifying into different activities and diversification of different households in a given community intodifferent activities. To make this distinction, we construct a measure of activity concentration that sumsthe square of the square of the percentage income from each activity. At the household level, concentra-tion of income sources from highest to lowest is as follows: Dirib Gumbo (.90), Kargi (.89), Logologo(.88), Ngambo (.82), North Horr (.76), and Sugata Marmar (.75). At the community level, concentrationof income sources from highest to lowest is as follows: Logologo (.28), Dirib Gumbo (.27), Kargi (.24),North Horr (.21), Sugata Marmar (.21), and Ngambo (.20). This indicates there is a great deal more diversification between households than there is within households.
12. The ordering of overall milk production is largely reflective of the overall ordering of herd size (medianliters of milk per day in parentheses): Kargi (2.5), North Horr (1.5), Logologo (0.6), Ngambo (0.5),Sugata Marmar (0.2), and Dirib Gumbo (0).
13. The cash value of milk is roughly 20 shillings per liter in Kargi and North Horr, 30 shillings per liter inLogologo and Sugata Marmar, 50 shillings per liter in Ngambo, and 60 shillings per liter in Dirib Gumbo.
14. Recall that this conclusion is drawn based on community level averages. Analysis at the household levelwill provide a more nuanced understanding of this relationship.
15. This assessment is relative to other sites and should not imply that Ngambo households, especially thepoorer units, did not suffer during the recent drought.
16. While we do not have firm data to confirm this, it is likely that at least part of the explanation for thesevere herd losses experienced in Dirib Gumbo are related to ongoing political conflict over territorialclaims and tension between ethnic groups on Marsabit mountain. In contrast to other groups, the Boran of
Pastoral Sedentarization 103
Frat-05.qxd 07/05/2004 04:49 PM Page 103
Dirib Gumbo do not have easy access to lowland pastures surrounding Marsabit mountain due to ongoingstruggles over land and water claims among the different groups in Marsabit District.
17. An intriguing topic for further research is an investigation of what causes, if any, can be identified for therelatively low rates of households with access to remittance income when compared to other sites aroundMarsabit Mountain.
18. This fact does not seem to have escaped the attention of Gabra and Rendille herders. During this period,a relative peace has held between the Gabra and Rendille. They have reached an agreement harmonizingpenalties for murder and other personal liabilities, and have used each other’s grazing land.
REFERENCES
Barth, F., 1964, ‘Capital Investment and the Social Structure of a Pastoral Nomadic Group in South Persia.’ InCapital, Savings and Credit in Peasant Societies, edited by R. Firth and B.S. Yamey, pp. 415–425. London:Allen and Unwin.
Fratkin, E., 1991, Surviving Drought and Development: Ariaal Pastoralists of Northern Kenya. Boulder:Westview Press.
Fratkin, E. and K. Smith, 1995, Women’s Changing Economic Roles and Pastoral Sedentarization: VaryingStrategies in Alternative Rendille Communities. Human Ecology 23 (4): 433–454.
Little, P.D., 1985, ‘Social Differentiation and Pastoralist Sedentarization in Northern Kenya.’ Africa 55 (3):243–261.
Little, P.D., 1992, The Elusive Granary: Herder, Farmer, and State in Northern Kenya. Cambridge: CambridgeUniversity Press.
Little, P.D., 1997, Income and Assets as Impact Indicators. Washington, DC: Management Systems International.Little, P.D., K. Smith, B.A. Cellarius, D.L. Coppock, and C.B. Barrett, 2001, Avoiding Disaster: Diversification
and risk management among East African herders. Development and Change 32 (3): 401–433.Kenya, Government of, 1980, District Development Plan, Baringo District, 1979–1983. Nairobi: Government
Printers.Nduma, I., P. Kristjanson, and J. McPeak, 2001, Diversity in Income-Generating Activities for Sedentarized
Pastoral Women in Northern Kenya. Human Organization 60 (4): 319–325.Snow, R. and J. Morris, 1984, Do Relief Efforts Beget Famine? Cultural Survival Quarterly 8 (1): 51–53.