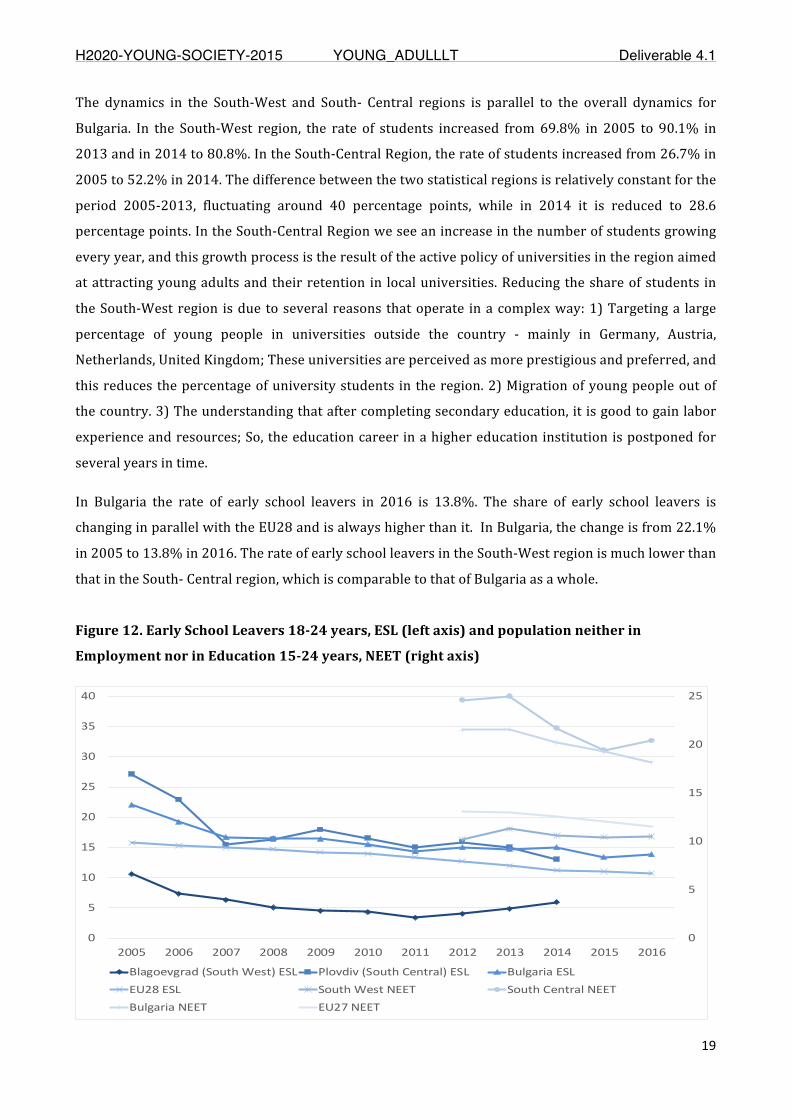
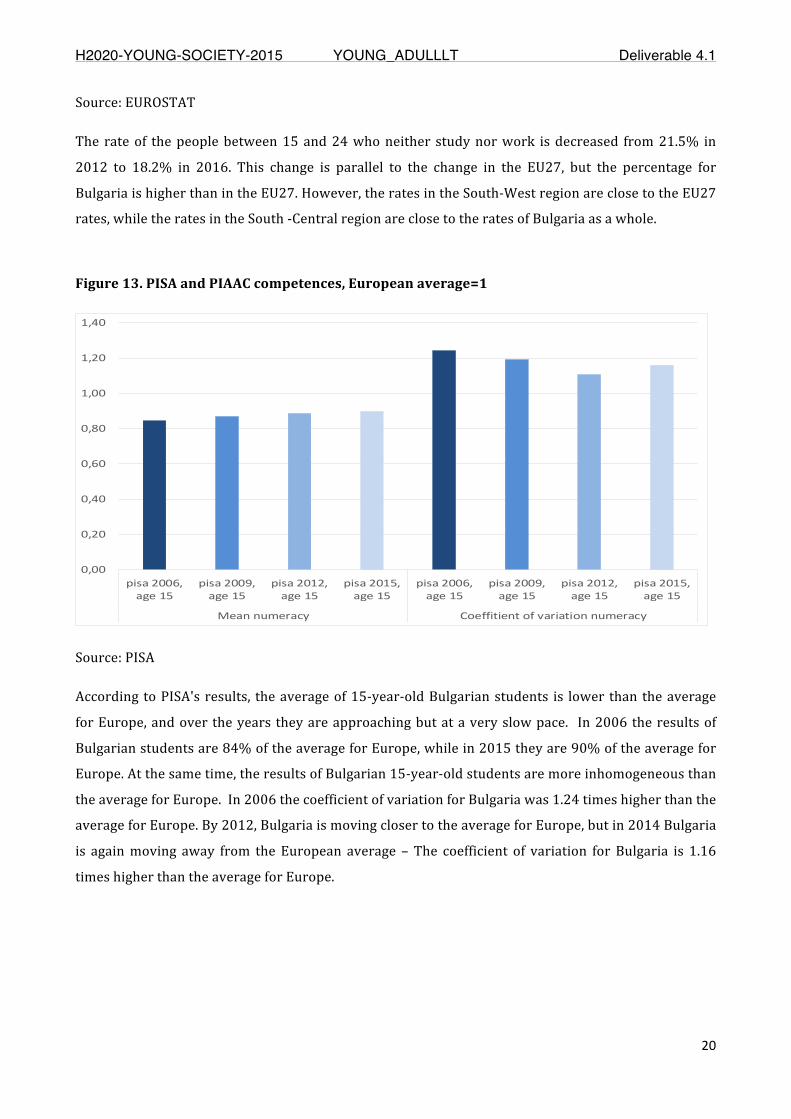
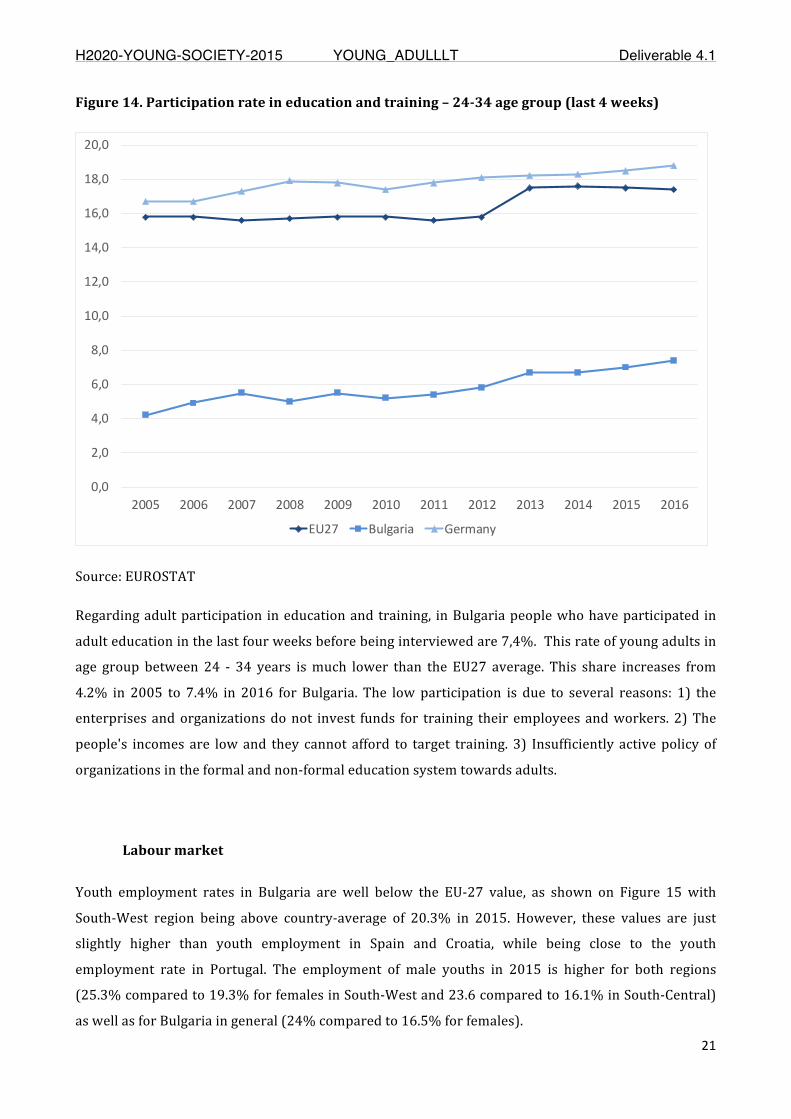
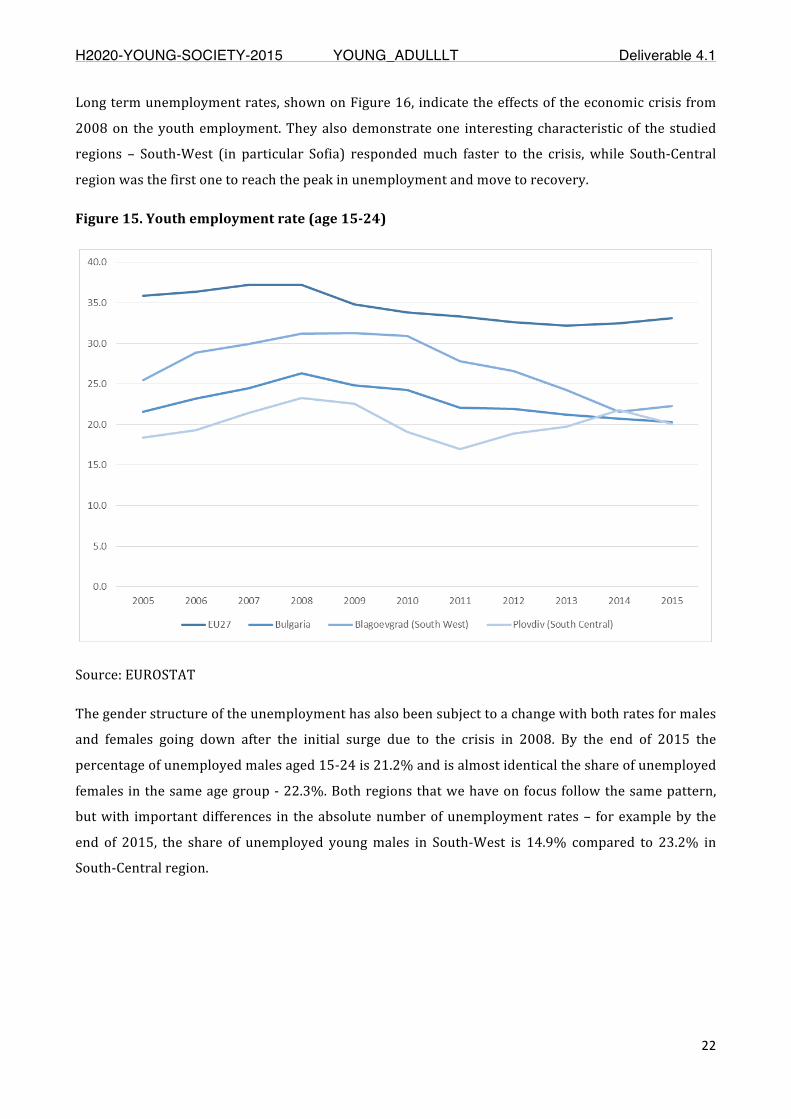
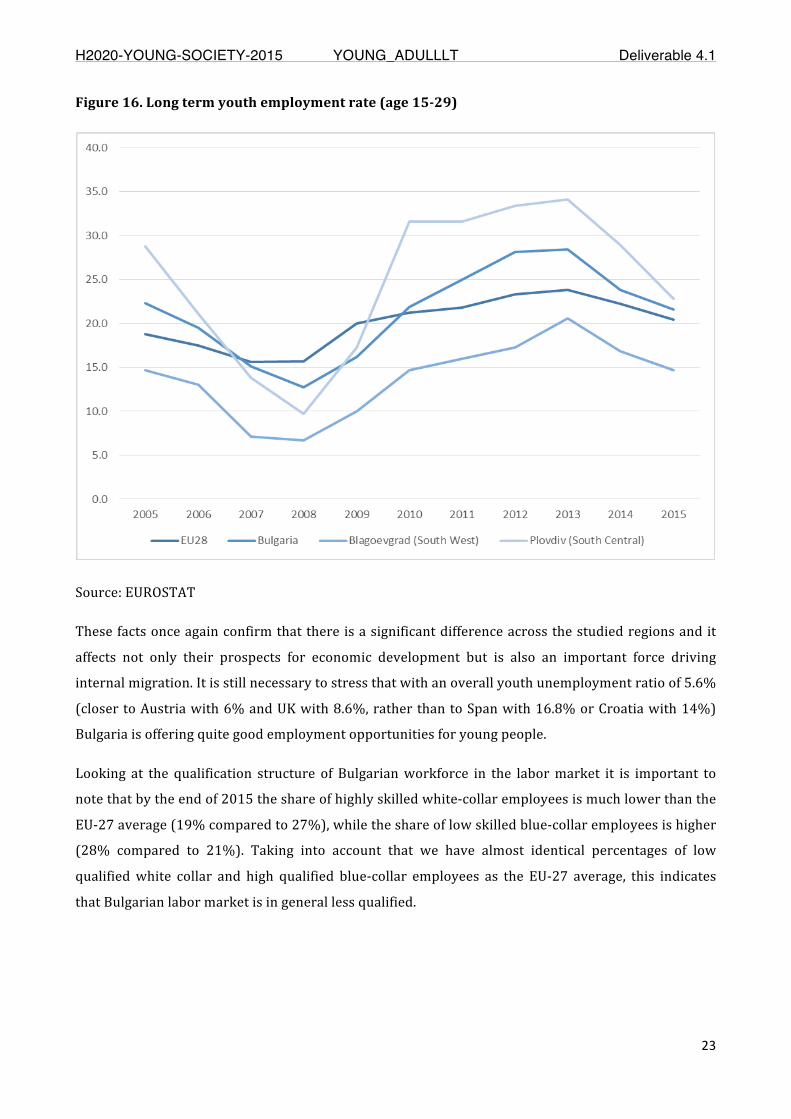
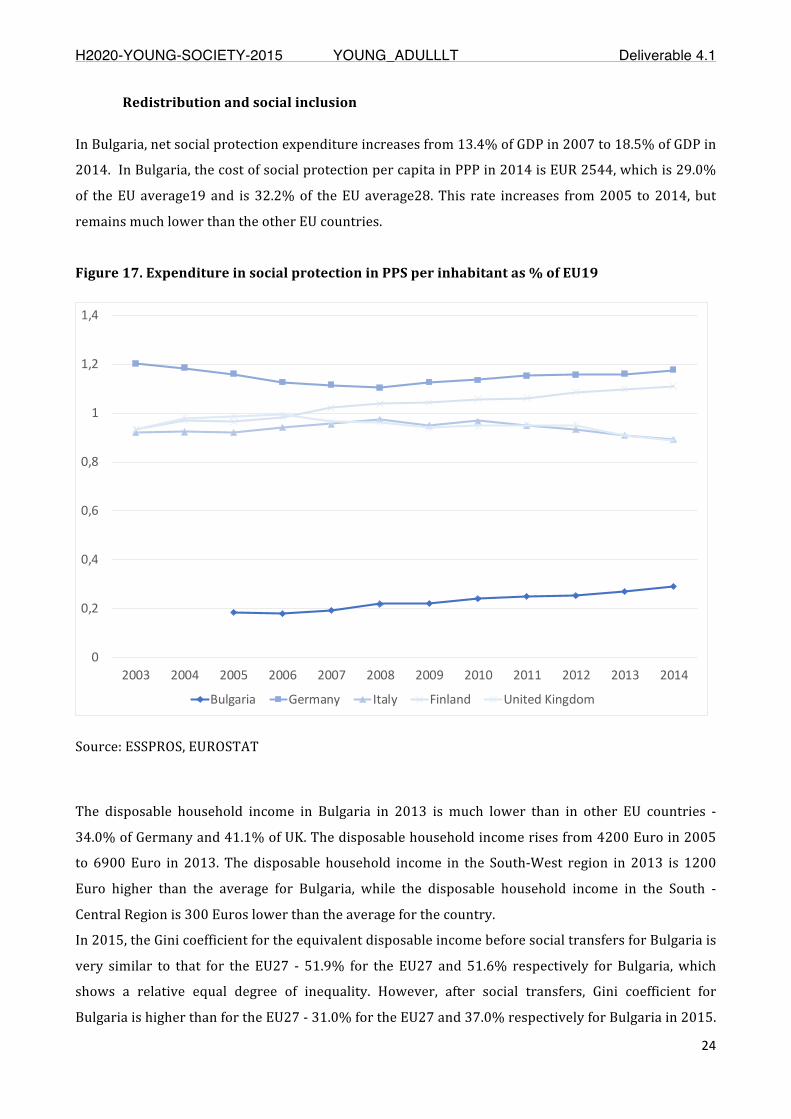
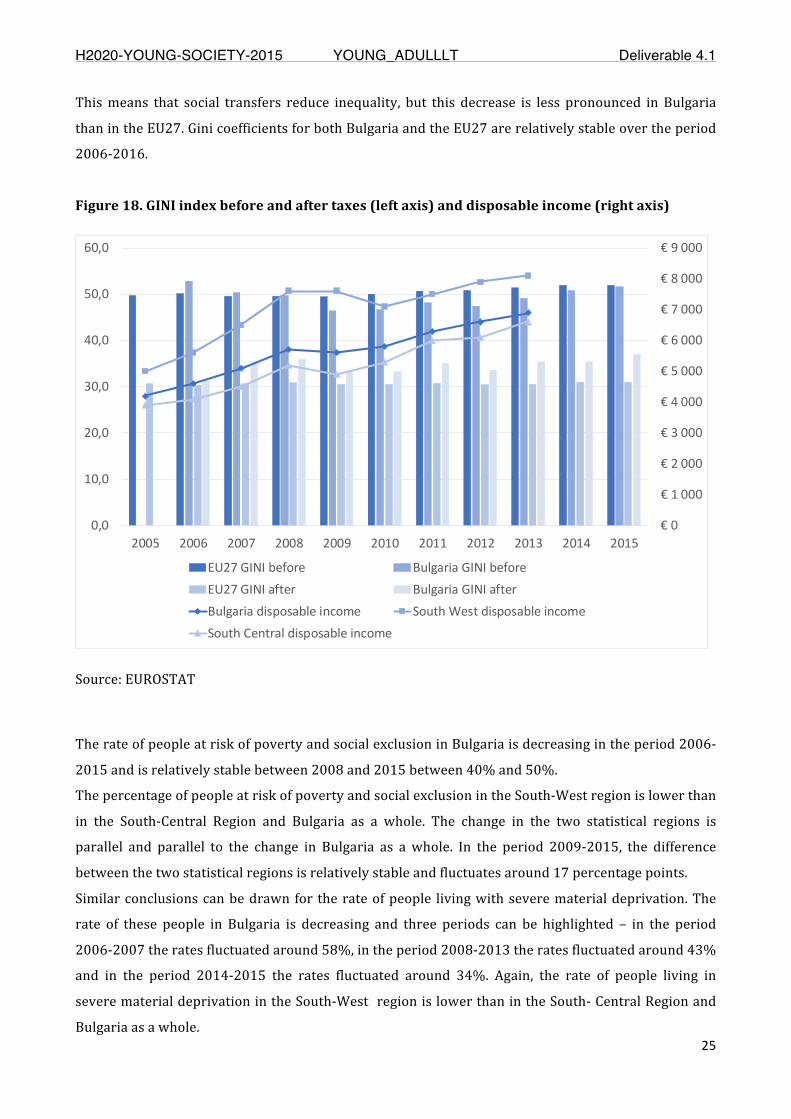
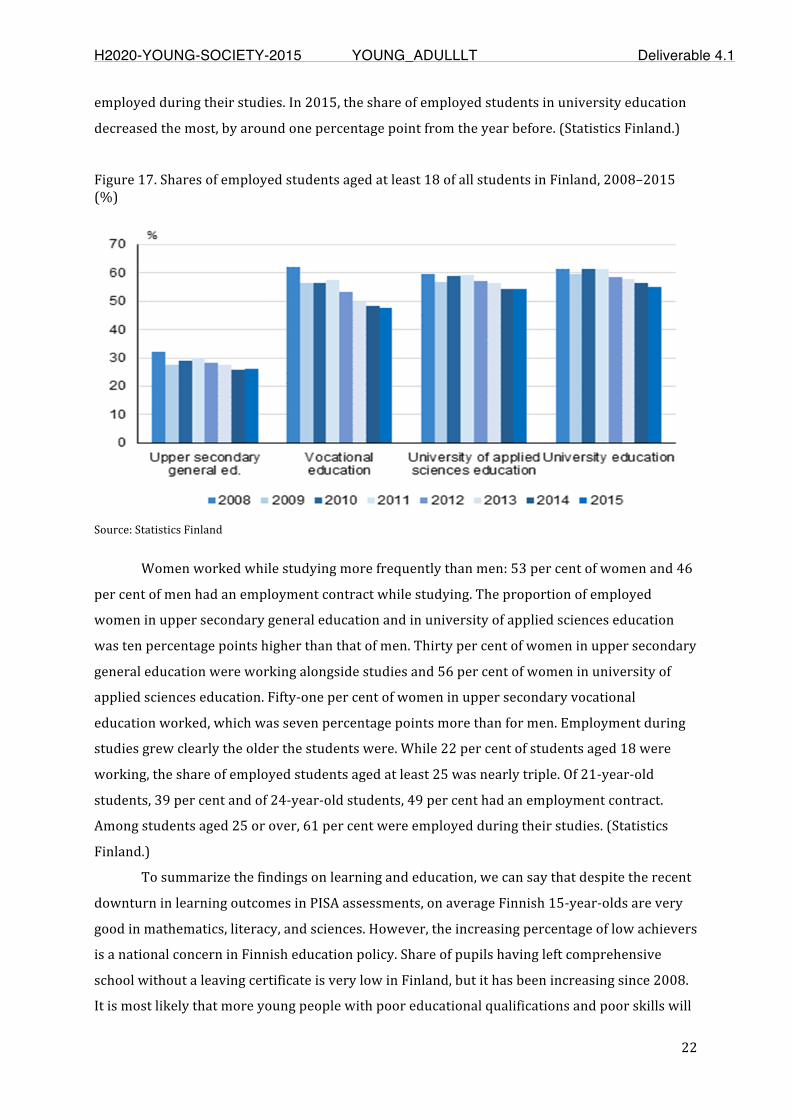
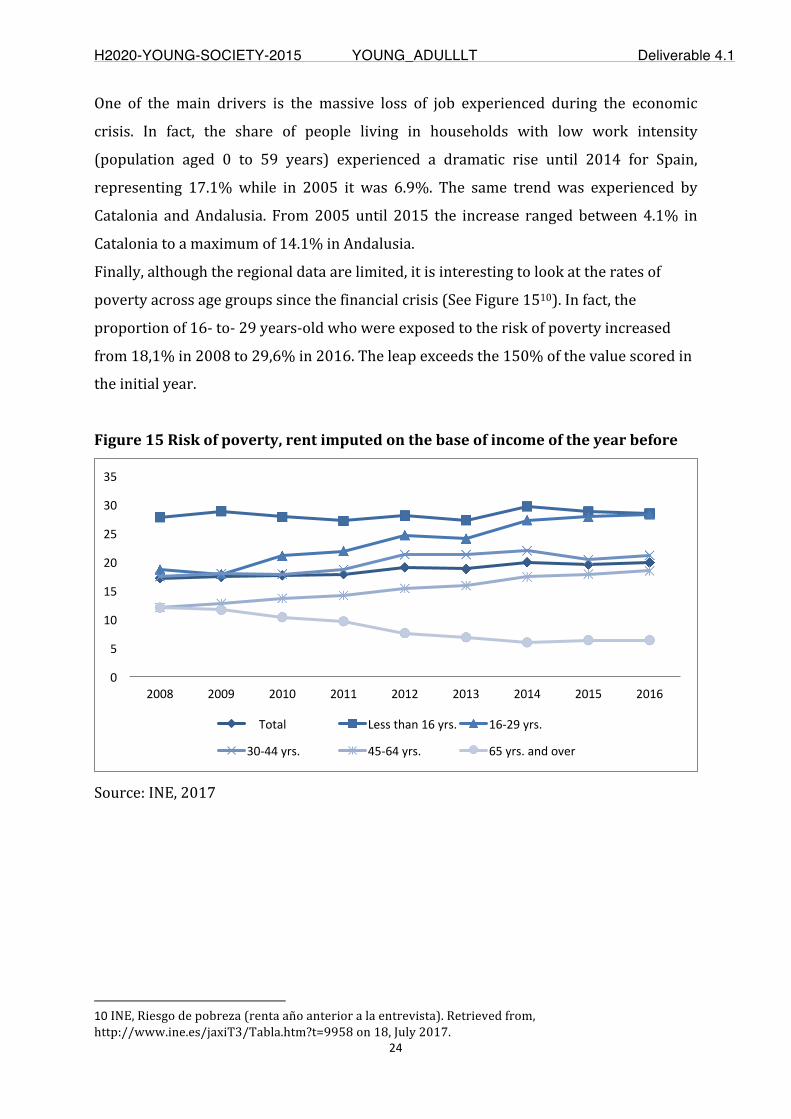
Page 1
H2020-YOUNG-SOCIETY-2015 YOUNG_ADULLLT Deliverable 4.1
Page1of31
Deliverable report for
YOUNG_ADULLLT
Grant Agreement Number 693167
Deliverable 4.1 National Briefing Papers with national and regional data
sets
Due date of deliverable: 1/10/2017 Actual submission date: 7/11/2017
Lead beneficiary for this deliverable: University of Granada (UGR)
Dissemination Level: PU Public X PP Restricted to other programme participants (including the Commission
Services)
RE Restricted to a group specified by the consortium (including the Commission Services)
CO Confidential, only for members of the consortium (including the Commission Services)
Page 2
H2020-YOUNG-SOCIETY-2015 YOUNG_ADULLLT Deliverable 4.1
Page2of31
TableofContents1. Descriptionoftask...........................................................................................................................3
2. Descriptionofwork&mainachievements...........................................................................4
2.1Activities.......................................................................................................................................4
2.2ExecutiveSummary.................................................................................................................5
3. DeviationsfromtheWorkplan.................................................................................................16
4. Performanceofthepartners.....................................................................................................16
5. Conclusions.......................................................................................................................................16
6. Annex–allnationalreportsandintroductiontothereports.....................................16
Page 3
H2020-YOUNG-SOCIETY-2015 YOUNG_ADULLLT Deliverable 4.1
Page3of31
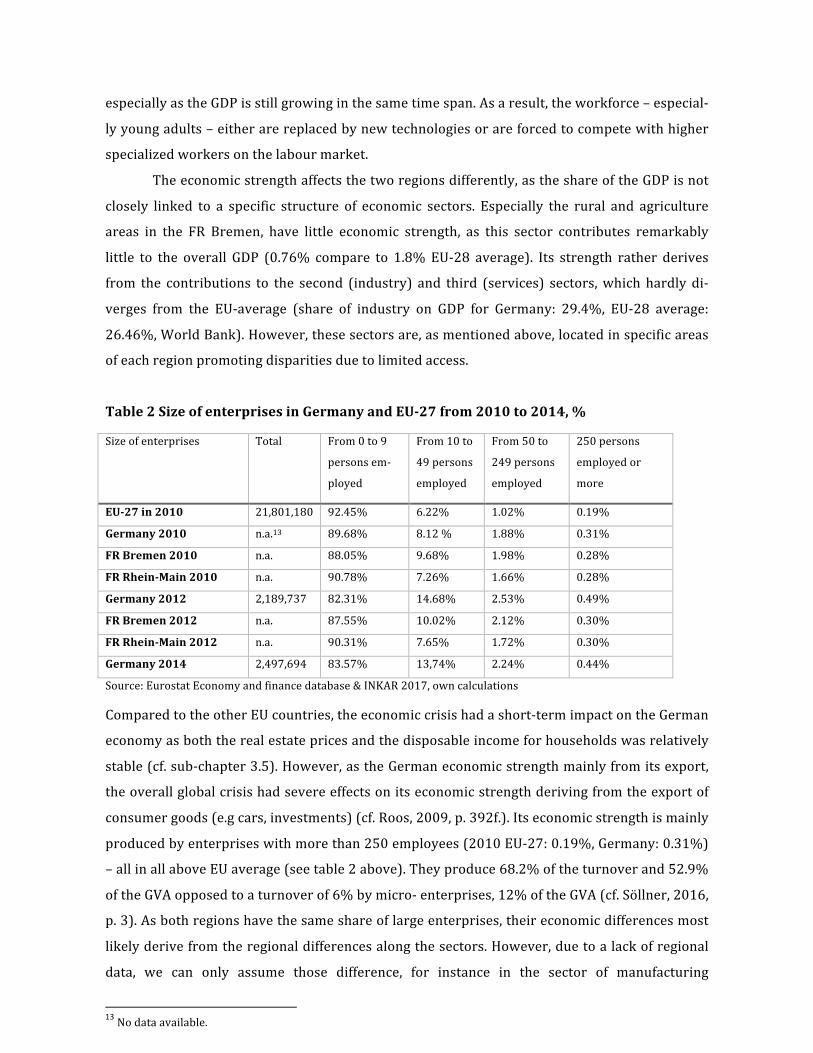
1. DescriptionoftaskTask4.1:Developaframeworkforthecollectionandanalysesofquantitativedata(months9-13):Developingaframeworkforthecollectionandanalysesofquantitativedatainvolvesidentifyingandselecting relevant sources and dimensions of the labour market and education/training atinternational/national (macro)andregional levels.The frameworkwill alsoaddress issuesofdataquality, reliability and validity necessary for its implementation and for analysing the results. Tocreate synergies, this task will draw from insights and experiences of previous research andmethodological guides (e.g., COE,2005; Iacovouet al., 2012; ISS,2008)and focuson the followingdimensions:• The socio-economic dimension (indicators: national youth work structures, youth work in theregionalsettings,qualification,noformalqualification,migrants,andtypesofoccupation);• The labour dimension (indicators: employment/ unemployment rate, youth unemployment rate,job quality levels, precarious forms of employment level; temporary or involuntary part-timecontractlevels);• The education, training and learning dimension (indicators: access to education, schooling form,drop-out rates, early school leavers, literacy levels, level of official language teaching, access tocommunicationtechnologieseducation,youngpopulationhavingcompletedcompulsoryeducation,populationhavingcompletedhigheducationlevel,accesstoparticipationinlifelonglearning);•TheSocialdimension(indicator:nationalLLLpoliciesforyoungadults)The data collection will be gathered according to gender, age, and other relevant differentiationcriteria.Roleofparticipants:WPleader(UGR)andcoreteams(GU,UNIVIE)developandcirculatetheresearchframeworkandprovideagridforthereportingtonationalparticipants,whoread,reviewandgivefeedbackontheframeworkdevelopedbytheWPleader.Task4.2:Obtainingspecificinformationanddatacollection(months13-17):The purpose is to obtain and analyse comparable information and data compiled by internationalorganisations suchas theEU (Eurostatgeneral and regional indicators, and surveys:LabourForceSurvey, EU-SILC, European Social Survey, Adult Education Survey) and the OECD (Education at aGlance,OECDSkillsOutlookwith resultsof theSurveyofAdult Skills -PIAAC,OECDEmploymentOutlook2013).Theanalyseswillallowforcontextualisedcomparisonofthedifferentnationalcases.Role of participants: National partners use the framework developed by theWP leader and coreteamstocollectandprepareallrelevantdataforanalyses.Task4.3:Conductanalysesofstatisticaldataonthespecificlivingconditionsofyoungadultsintheregionalsettings(months:17-19):Thistaskinvolvestheanalysisofstatisticaldataonthespecific livingconditionsofyoungadults inthe regional settings about LLL. It also includes interpreting data according to standards of livingconditions of young adults in the countries. Each national research team will be guided by thequestion as to themeaning of data on youth unemployment/employment, educational levels, andqualificationformal/non-formal,inthespecificcontexts.Roleofparticipants:Eachpartnerconductstheanalysesat thenationalandregional levelaccording to theWP framework,producingnationalbriefingpaperswithnationalandregionaldatasets,briefdescriptiveanalysisandcontextualisationofdata.
Page 4
H2020-YOUNG-SOCIETY-2015 YOUNG_ADULLLT Deliverable 4.1
Page4of31
2. Descriptionofwork&mainachievements
2.1ActivitiesTheoverallobjectiveoftheWP4focusesontheinterplayatmacro,mesoandlocallevel between Life Long Learning (LLL) policies, young people’s living conditionsand country and region specific contexts in promoting or deterring growth andsocialinclusion.ResearchconcerningthisWPinvolves:1)developingaframeworkfor analysingquantitativedataon the specific living conditionsof youngadults inregional contexts; 2) collating and analysing the data from international datasources3)conducttheanalysisandwritingthenationalreports.
ToattaintheseobjectivestheworkinvolvingWP4forthefirstyearconcentratedondevelopingaworkingpaperproposalwiththetheoreticalapproachandworktobedevelopedbynationalpartners.Differentversionsoftheworkingpaperwerefirst discussed with the core partners (UNIVIE & UG) and the Coordinator(WWU) and later with the rest of partners. After taking into account, thefeedback received from all partners, the final version ofWP4 proposal has beenusedastheguidelines.
To facilitate the attainment of the different objectives of the WP4nationalreports twomilestone activities were set. All partners had to conduct themand upload their pieces of work on the internal project server used by theConsortium.UGRandUNIVIEteamswereprovidingawork-in-progressexampleoftheworktobedoneforeachmilestoneactivityandprovidingindividualandgeneralfeedbacktoallpartnersforeachactivity.Thethreemilestoneactivities
referred to the three objectives mentioned above: 1) interpretating and solvingdoubtsabout thedata collation;2)evaluating the youngadults living conditionsacross different regionalunitsandcountry, and, 3) assessandcomplementthedataqualityprovidedbyinternationaldatasources.
Thesemilestoneactivitieswereusedasastartingpointtowritethefirstdraftofthenational reports.Allpartners submitteda firstdraftof thenational reports at theend of July 2017. TheUGR teamprovided feedback bymid-August. Each nationalpartnerintroducedthefeedbackasdeemedappropriateandsubmittedthefinalsubmission of the national report by mid-October,sothattheUGRteamcouldworkonDeliverable4.1.
Presentations and further discussions on the work to be done and theorganisation bymilestoneactivitiestookplaceduringtheconsortiummeetings inPorto(November2016)andinGranada(June2017),aswellasinthecoordinationmeetingwithallempiricalWPswithintheprojectinBarcelona(January2017).
Page 5
H2020-YOUNG-SOCIETY-2015 YOUNG_ADULLLT Deliverable 4.1
Page5of31
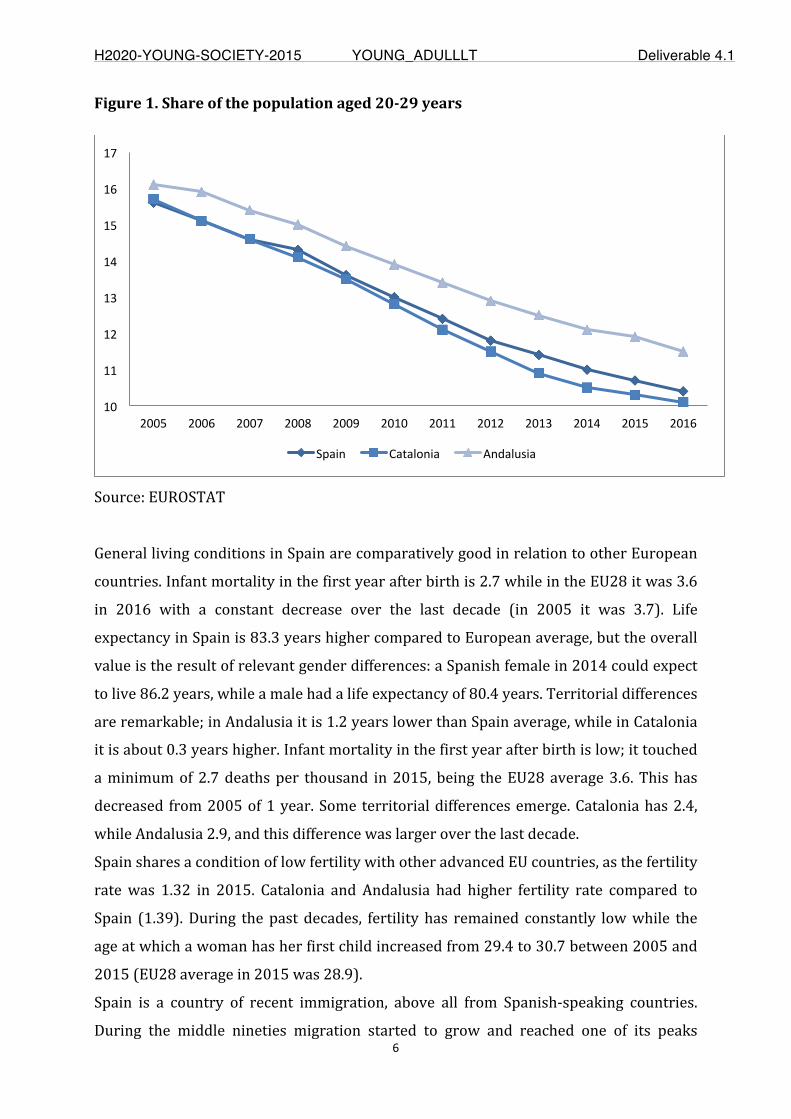
2.2ExecutiveSummaryTheoreticalframework
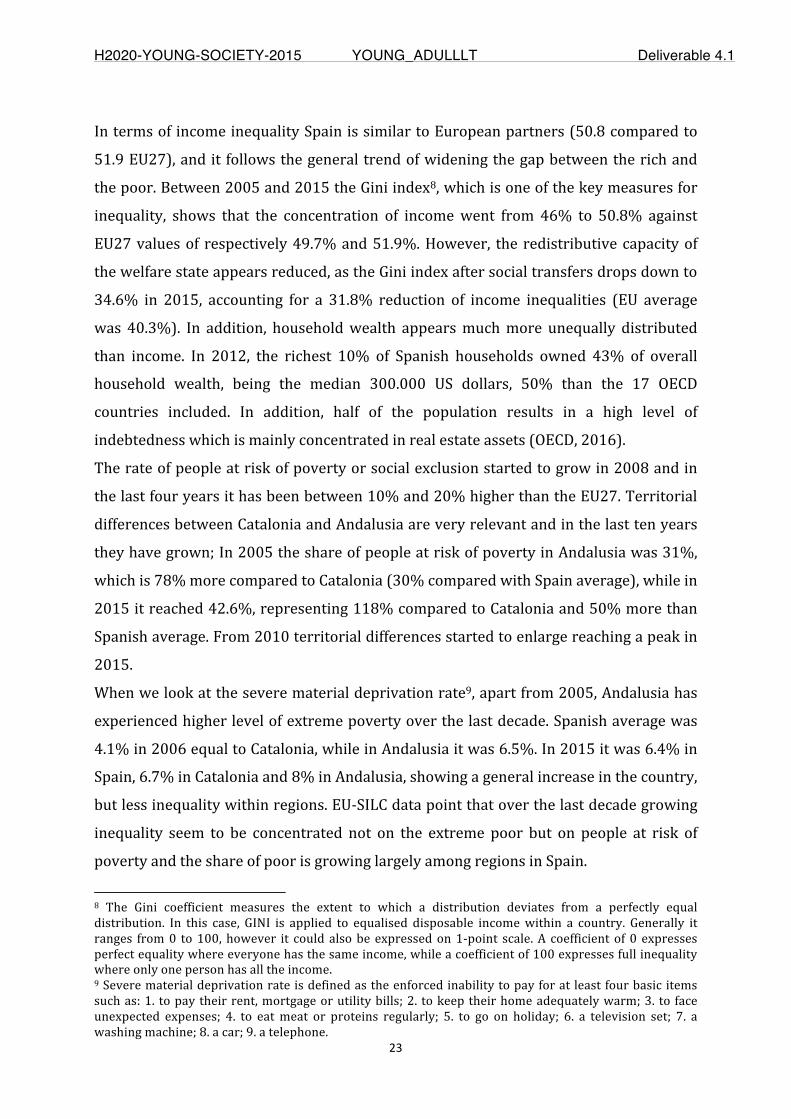
WP4conductsaquantitativeanalysisofyoungadults’socialand livingconditions,byanalysingsocio-economicdata(macrodata)aggregatedatthenationalandlocallevel on different dimensions in participating countries. YA living conditions aredefinedasresultingfromyoungpeople’spositionintheeducationsystems,orinthetransition fromeducation to employment, but their riskprofile requires a refinedmethodological operation. In WP4, we consider these risk profiles and analysecountry/regionspecificsettingsofyoungpeople’s livingconditions(seeFigure1)to set the stage for the investigation of LLL policies implications, which areaddressedinthesubsequentWPs(fromWP5toWP7).Thisapproachinformsaboutthe contextual dimensions that correlate with the production of different riskprofiles. We aim at identifying different profiles of young people at risk, to gainunderstanding of the contextual configurations of risks affecting young people indifferentcountriesandregions.
The complexity and multidimensionality of the phenomena analysed require anintegration of different methods of research. To set the stage for furtherinvestigation of how LLL policies affect young adults six basic dimensions areselected. Definitions and descriptions of these dimensions, as well as a list ofindicatorsanddataforeachofthem,isgiveninsection1.Thedatacollectedbythecore team fromofficial andcomparable statistical sourcesareaggregatedat threedifferent levels: national (the more widely comparable); regional (NUTS2). For acomplete discussion of the approach used, see the introduction section whichprecedesthenationalreports.
Belowitfollowsasummaryofthemainfindings:
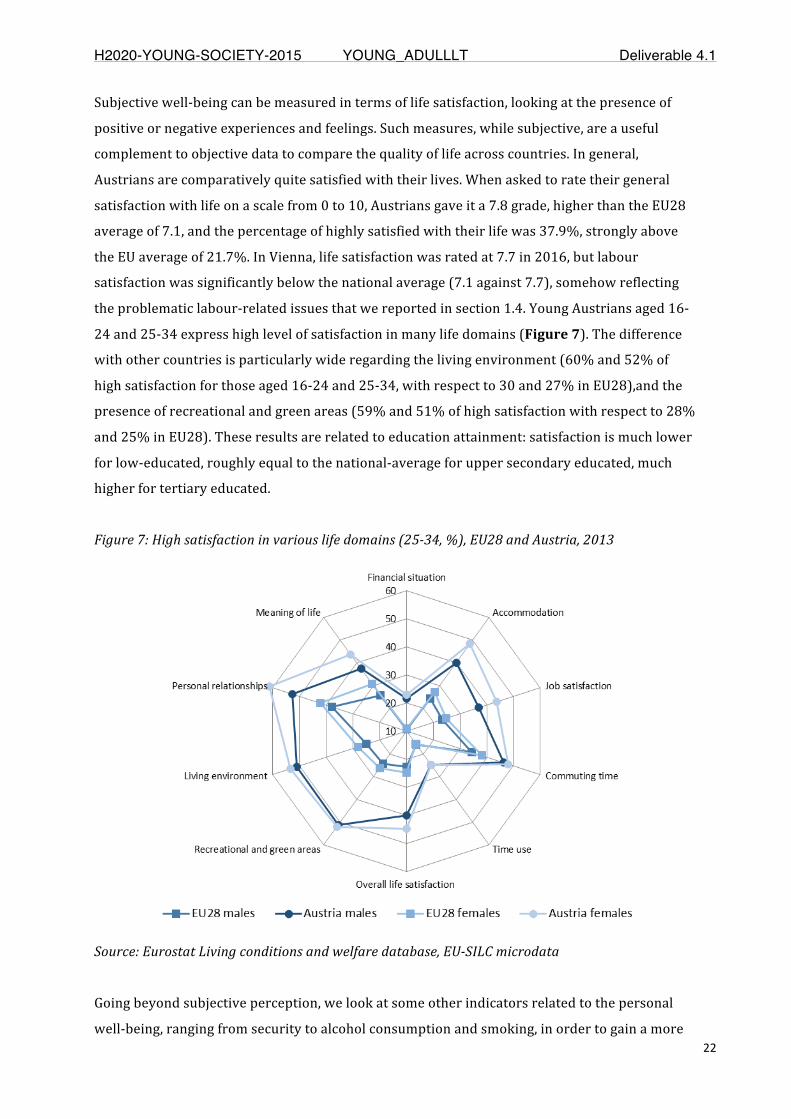
Austria: The national briefing paper will provide a short overview of the livingconditionsofyoungpeople inAustriaand,morespecifically, in the two functionalregionsselected,namely theregionofViennaandUpperAustria.The tworegionssharesomecharacteristicswithinthesamefederalregulatoryframework,buttheypresentdifferencesinthesocio-economicstructure,politicaltraditionanddegreeofurbanization, as well as in the way they react to common challenges like youthunemployment.
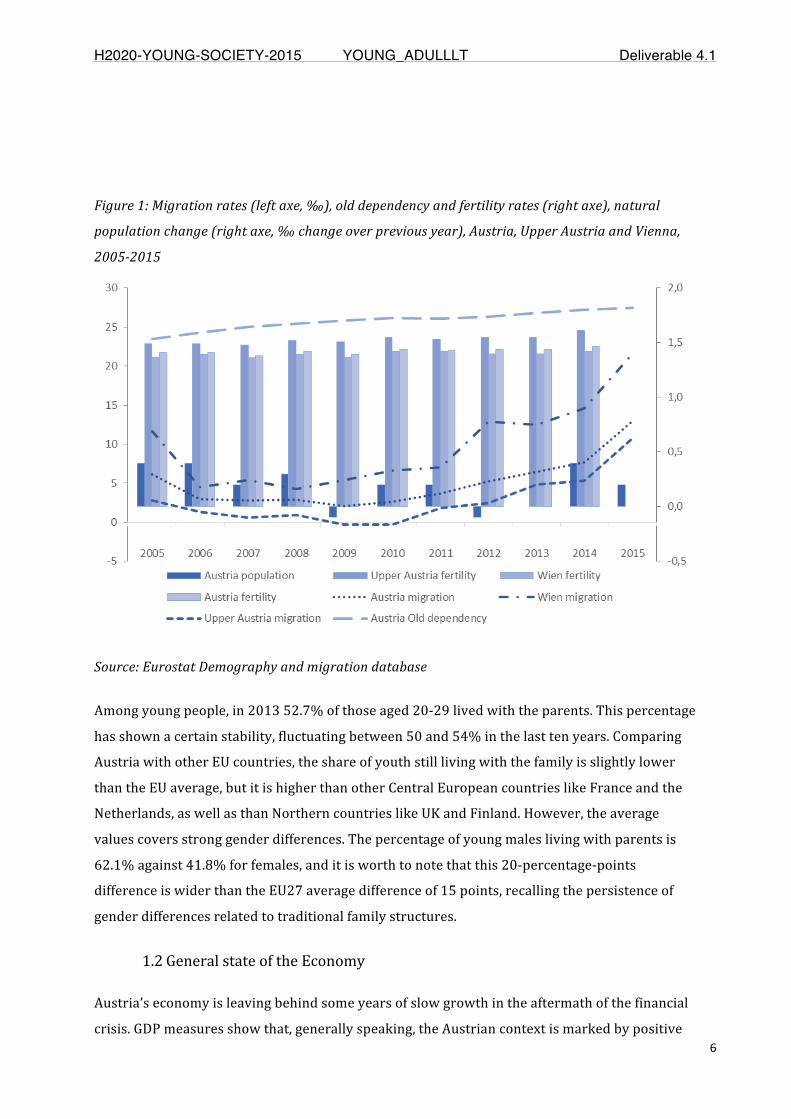
Population:Austriahasanincreasingold-dependencyrateandadecreasingyoung-agedependency.ValuesforUpperAustriaareclosetothecountryaveragewhileinViennatheweightofyoungpeopleisstrongerbecauseofmigrationinflows.
Economy:ViennahasaleadingroleintheAustrianeconomy,confirmedbythehighGDP per capita. Also, the industrial region of Upper Austria shows a remarkable
Page 6
H2020-YOUNG-SOCIETY-2015 YOUNG_ADULLLT Deliverable 4.1
Page6of31
economicperformance,astheGDPperinhabitantisabovethenationalaverage.
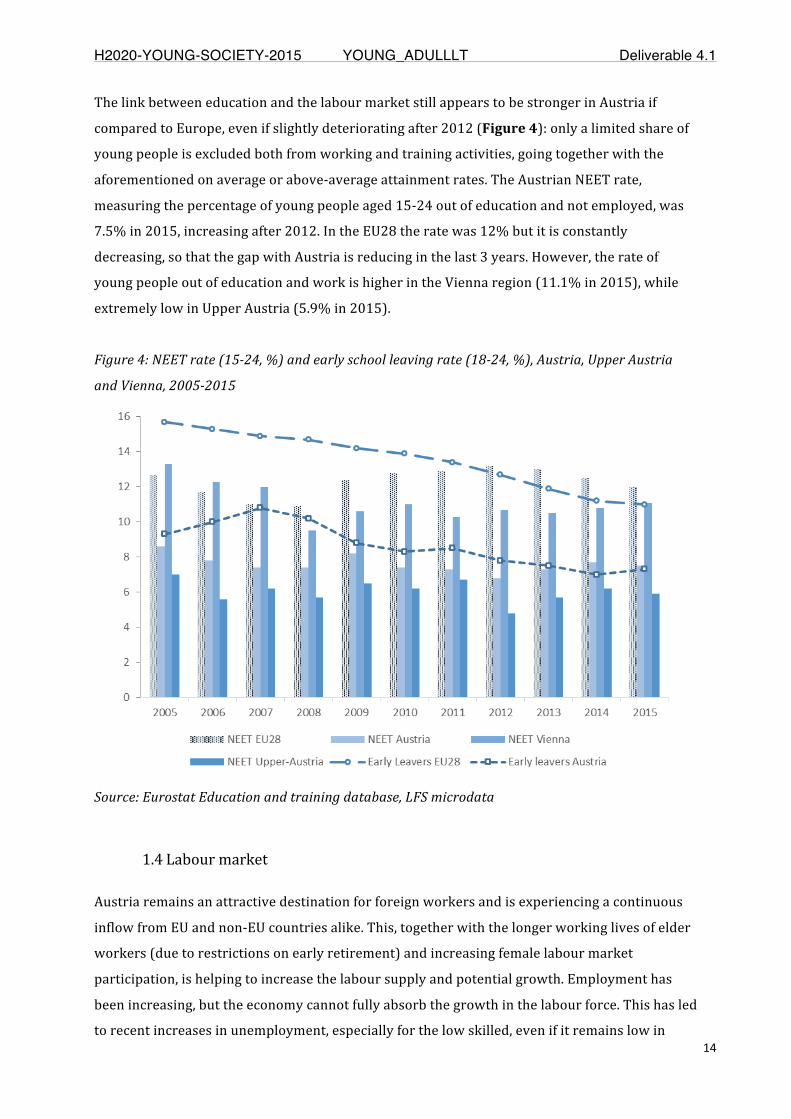
Education: in Upper Austria young people heavily participate especially in uppersecondary education, while higher education is more widespread in Vienna. Thepercentage of low-educated young adults increased after 2014. The link betweeneducationandthelabourmarketstillappearstobestrongerinAustriaifcomparedto theEuropeanaverage.However, the rateofyoungpeopleoutofeducationandworkishigherintheViennaregion,whileextremelylowinUpperAustria.
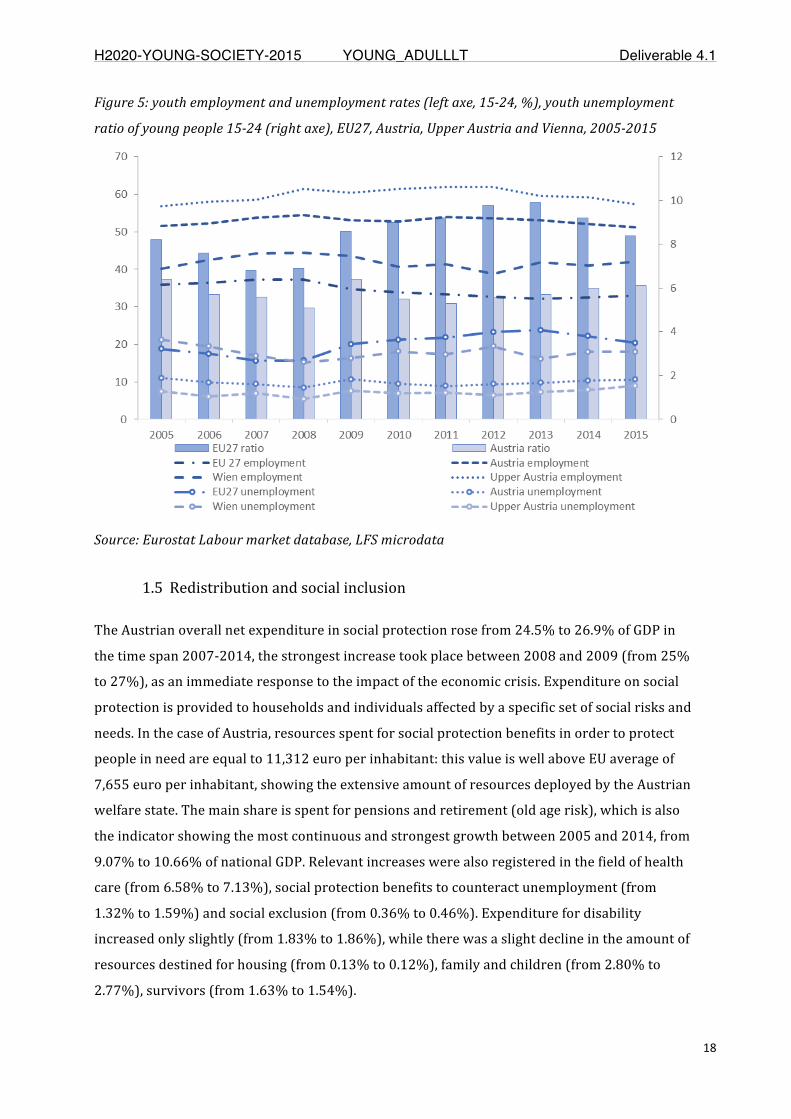
Labourmarket:EmploymentinAustriahasbeenincreasingespeciallyintemporaryand part-time jobs. However, the economy cannot fully absorb the growth in thelabourforce:thishasledtorecentincreasesinunemployment,especiallyforyounglow-skilledpeople.InVienna,youngpeoplefaceahigherunemploymentrisk,whileyouthunemploymentratesinUpperAustriaarelowerthanthecountryaverage.
Social protection: Austrian expenditure for social protection benefits to protectpeopleinneedisaboveEUaverage.Socialwelfarestandardsarestillhighoverall,astheproportionofthepopulationatriskofpovertyorsocialexclusionisoneofthelowest among EU Member States, but some groups must face greater risks, inparticular,olderwomenandchildrenofforeign-bornparents.
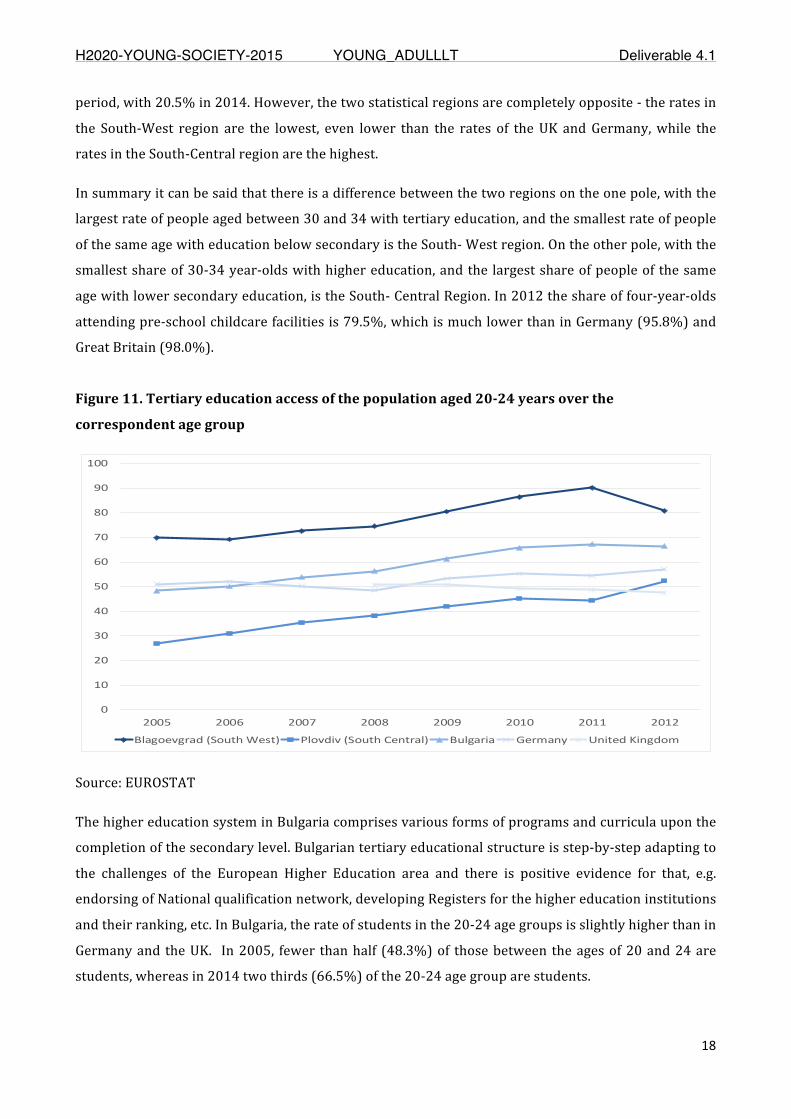
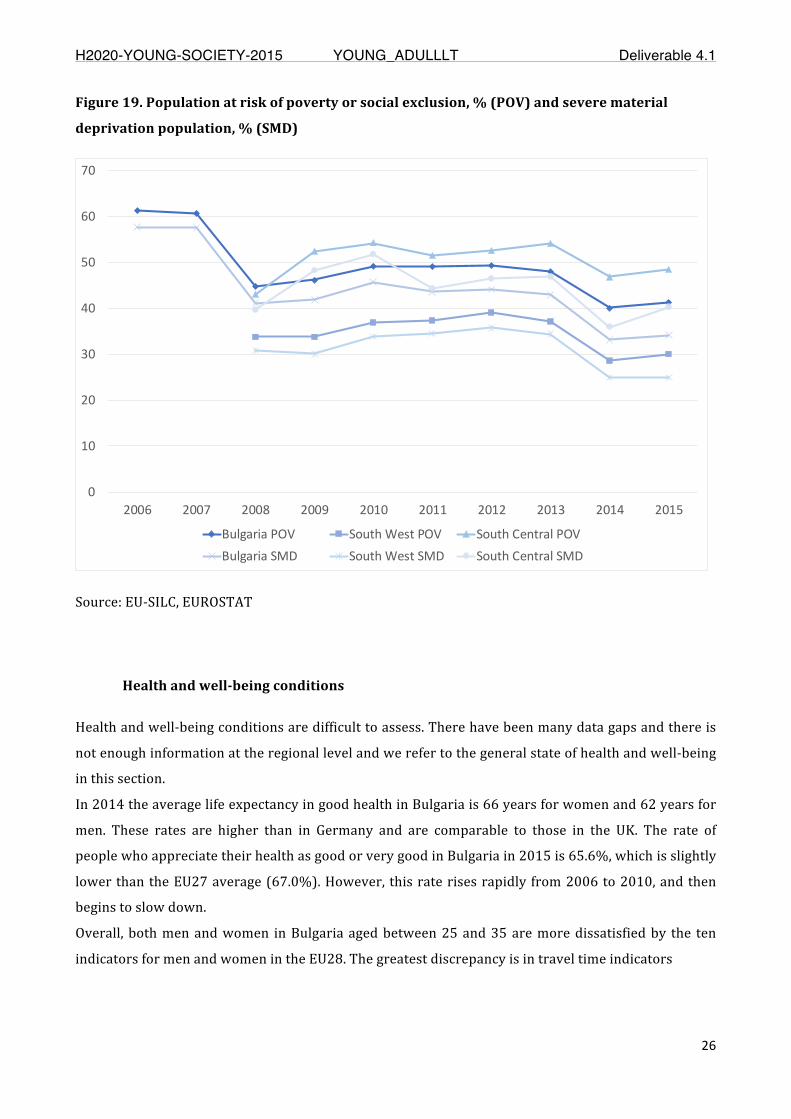
Bulgaria:The quantitative characteristics describing living conditions, education,structure of the economy and labor market in Bulgarian conditions are veryimportant for understanding the transitions of young adults from education toemploymentandtheopportunitiesforlifelonglearning.Thereportfocusesontwofunctionalregions:BlagoevgradandPlovdiv.
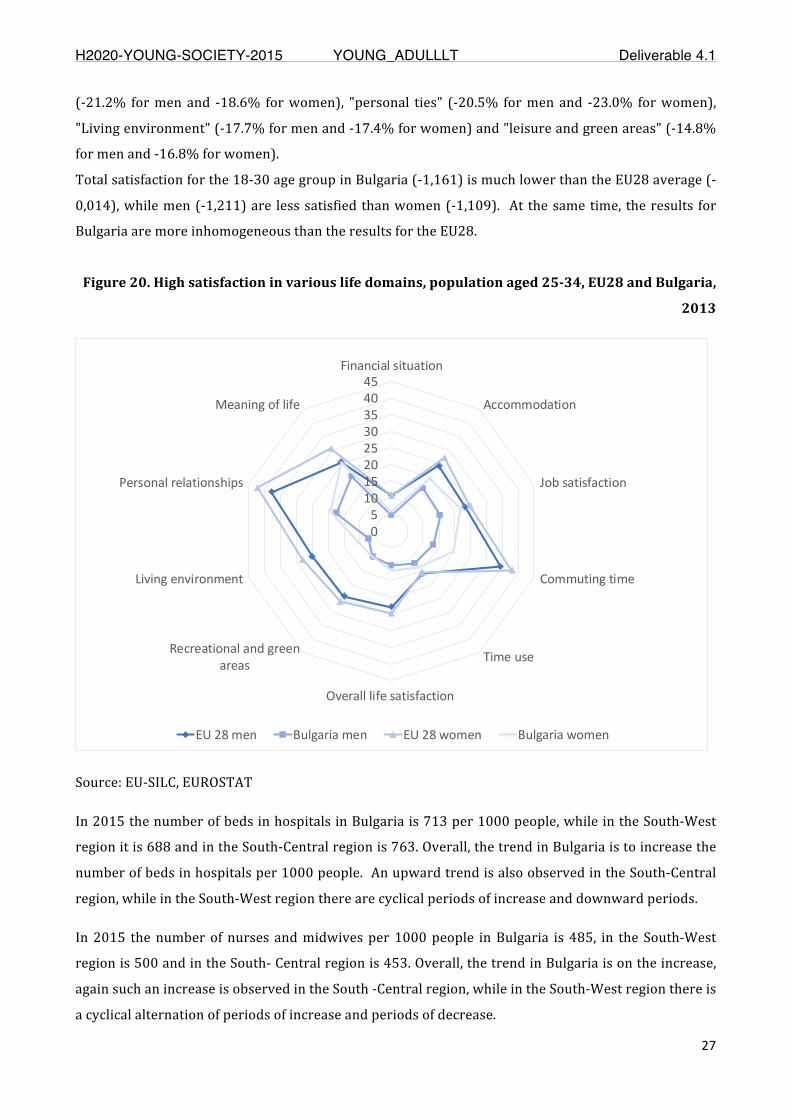
Bulgaria has very high shares of people with higher education compared toEuropean partners, and in 2014 two thirds (66.5%) of the 20-24 age group arestudents.Thisisasignthateducationisstillperceivedasavalue-added,beingalsoaresultofthehighereducationactivepolicytowardsyoungadults.Theproportionofpeople aged between 30 and 34 with upper secondary education (ISCED 3-4) ishigher than in the UK, and is comparable to Germany. When it comes to adulteducation,theshareoflearners(24-34years)ismuchlowerthantheEU27average.Afterhavingcompletedtheireducationqualification,peopletendtointerrupttheirformation,whichrequiresamoreactive involvementof the trainingorganizationsinformalandnon-formaleducationandlifelonglearning.
Important differences emerge in education characteristics between BlagoevgradandPlovdivregion.Apartfromeducation,InBulgaria,almostallotherdimensionsexamined in the report show poorer conditions compared to EU average. Socialprotectionexpenditurepercapita increasedfrom2005to2014butremainsmuchlowerthanthatofotherEUcountries.TheHouseholdsdisposableincomein2013is
Page 7
H2020-YOUNG-SOCIETY-2015 YOUNG_ADULLLT Deliverable 4.1
Page7of31
muchlowerthaninotherEUcountries.Theshareofpeopleatriskofpovertyandsocialexclusion inBulgariadecreased in theperiod2006-2015,and from2008 to2015itisrelativelystablebetween40%and50%.ThesevaluesdescribeBulgariaasthe poorest European countrywith low standard and poor living conditions. Theoverall satisfaction for those aged18-30years inBulgaria (-1.161) ismuch lowerthantheaverageforEU28(-0.014)asmen(-1.211)aremoresatisfiedthanwomen(-1.109). The overall conditions are characterized by a process of slow economicstabilization, income growth, poverty reduction, increasing youth employment,growthindisposablehouseholdincomeandhigheducationalattainment.However,thereisstillalottobedonetoreachtheaveragevaluesdescribingthequantitativecharacteristicsofthequalityoflifeintheotherEUcountries.
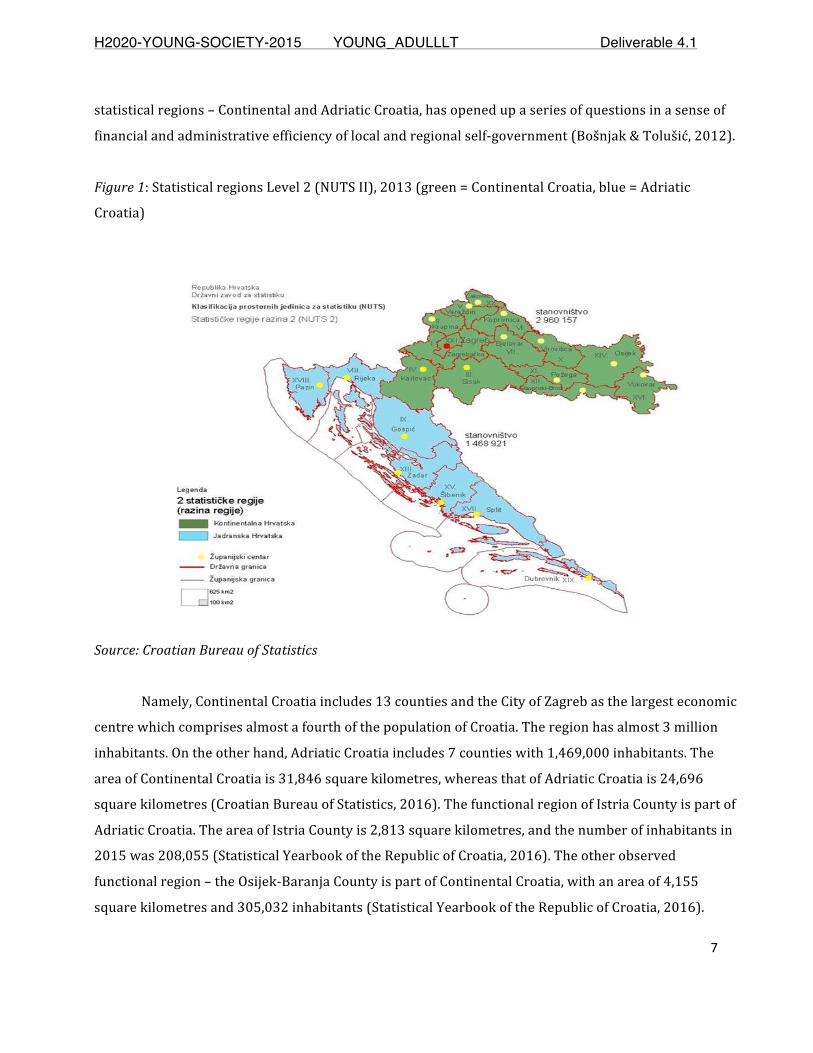
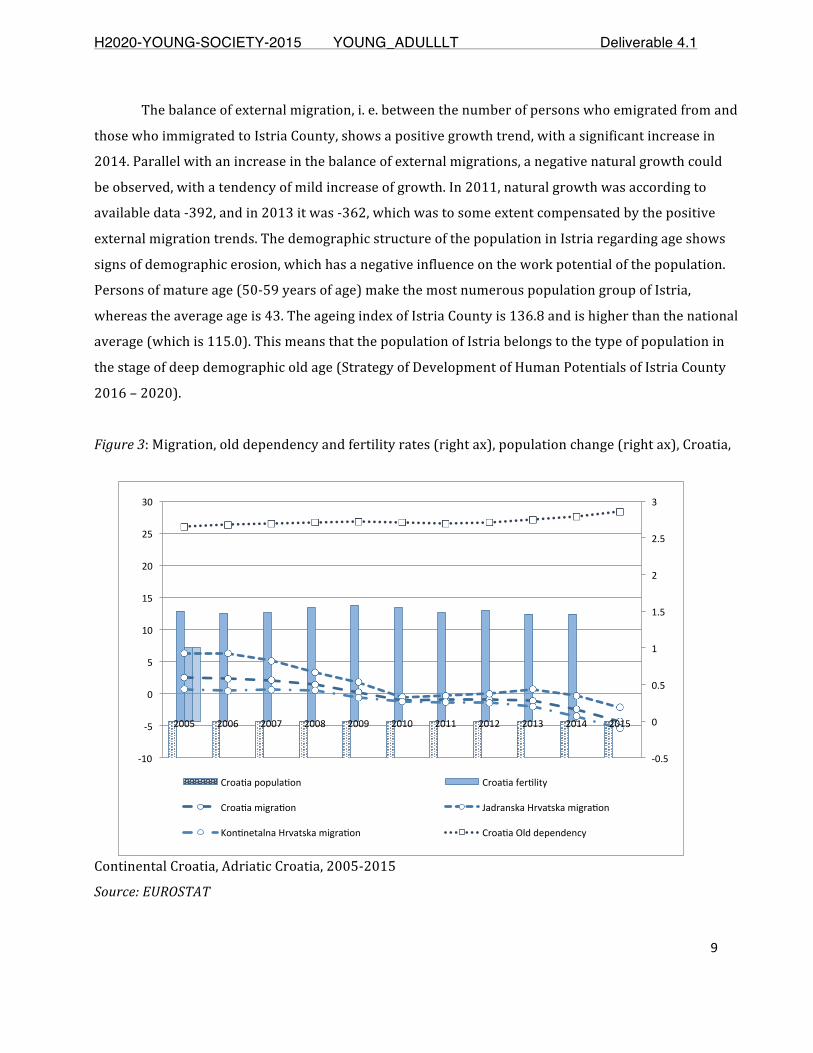
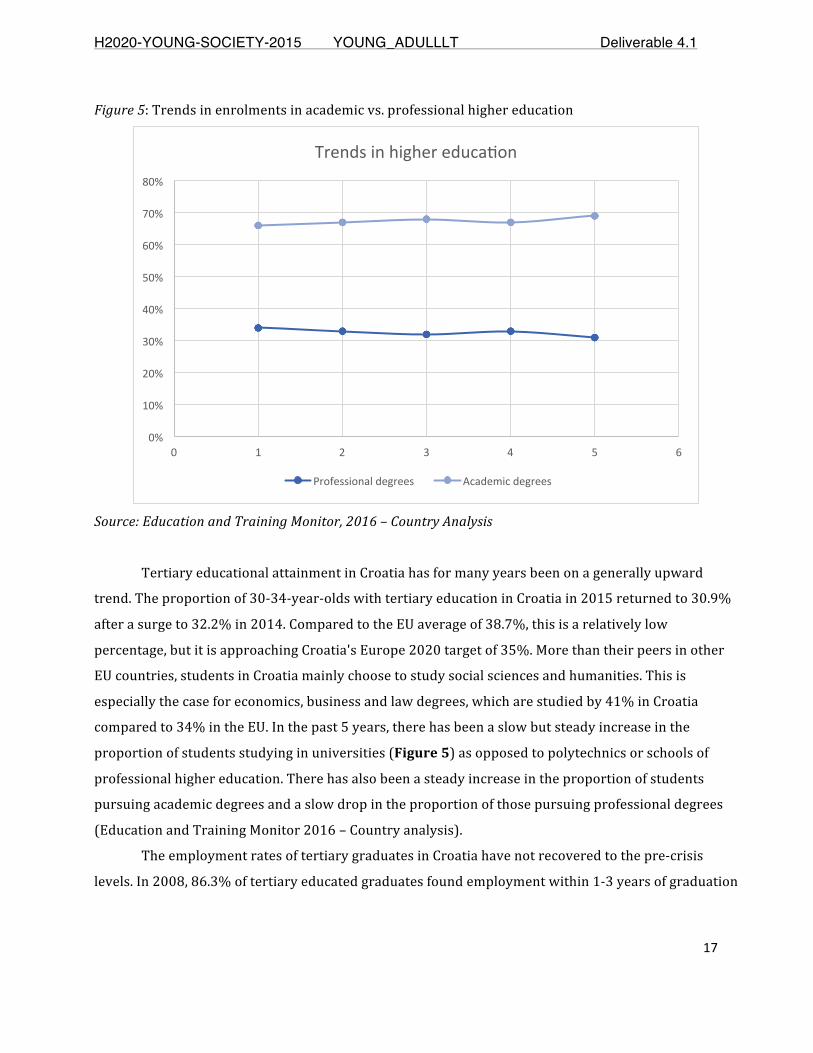
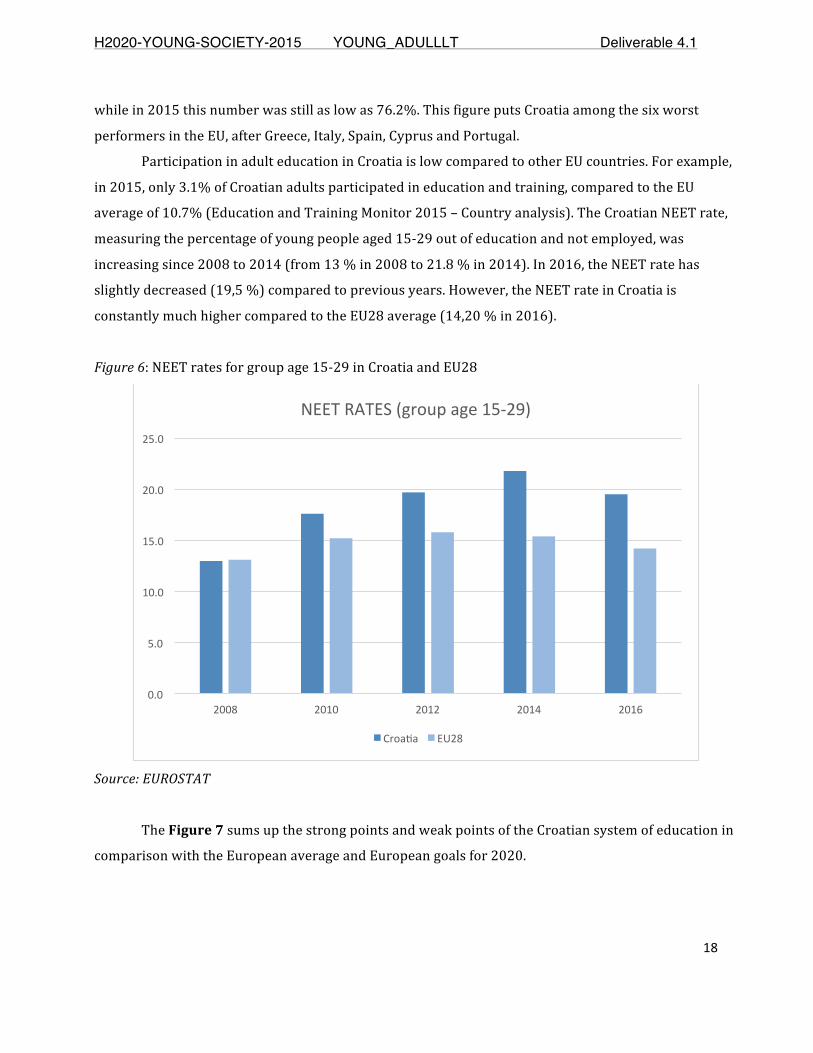
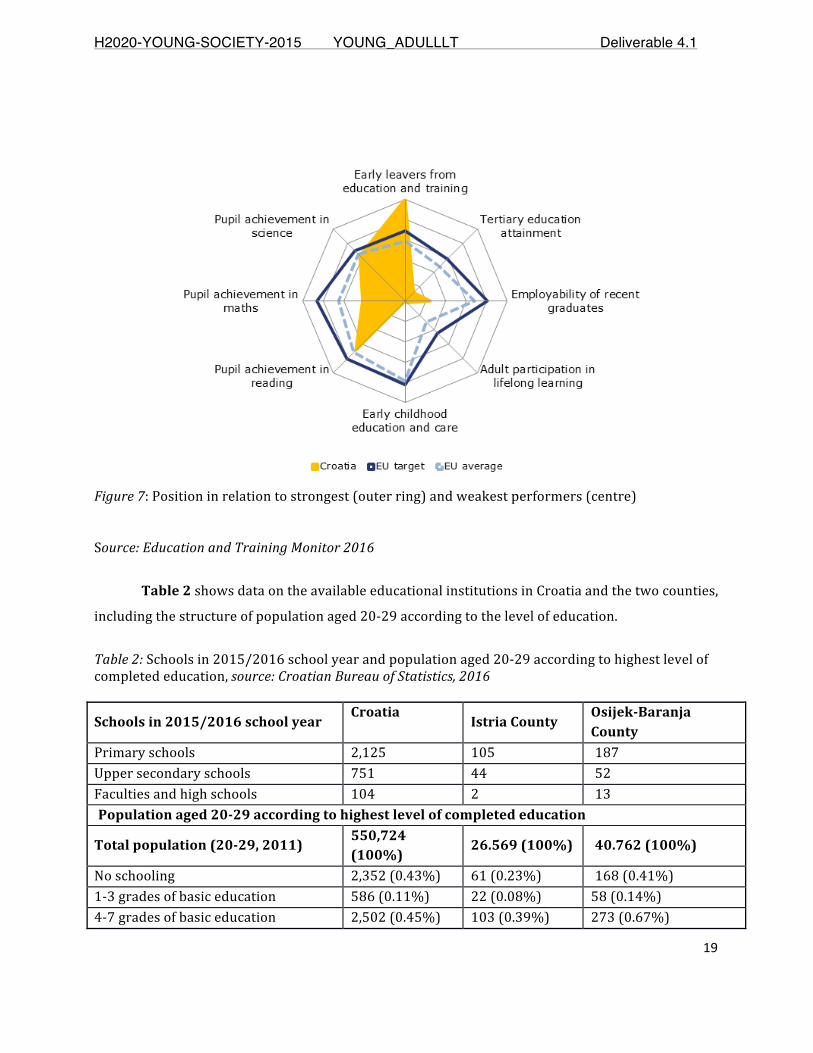
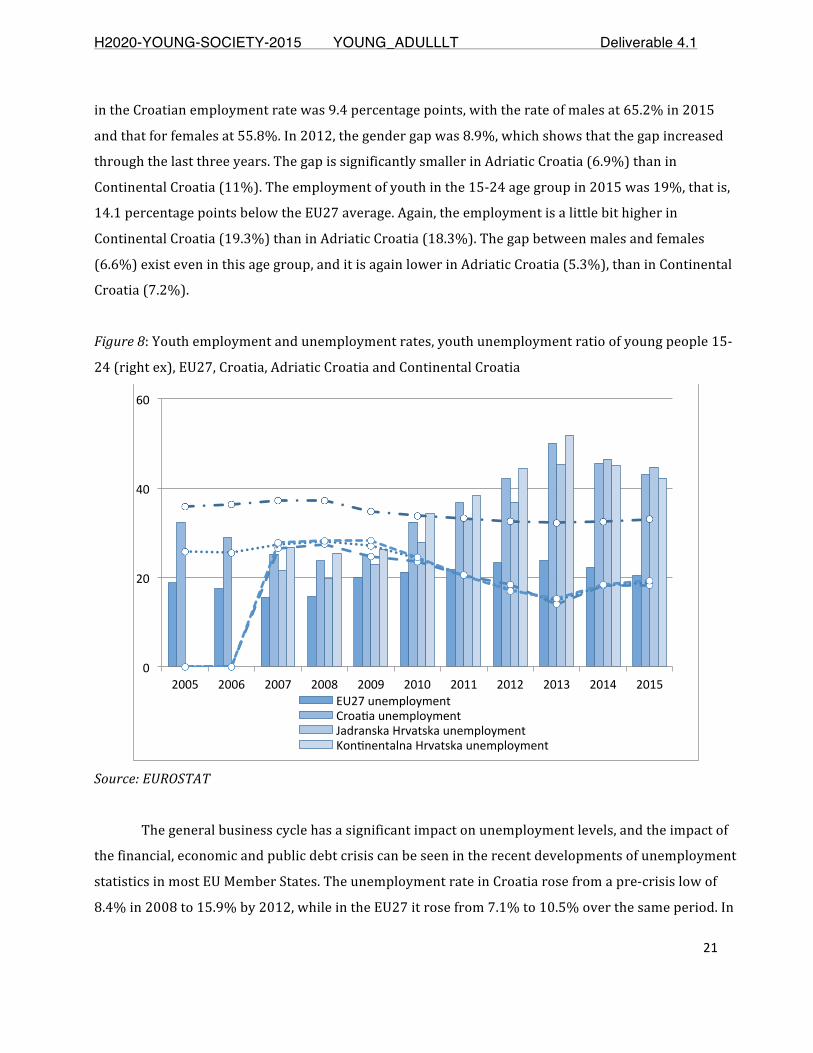
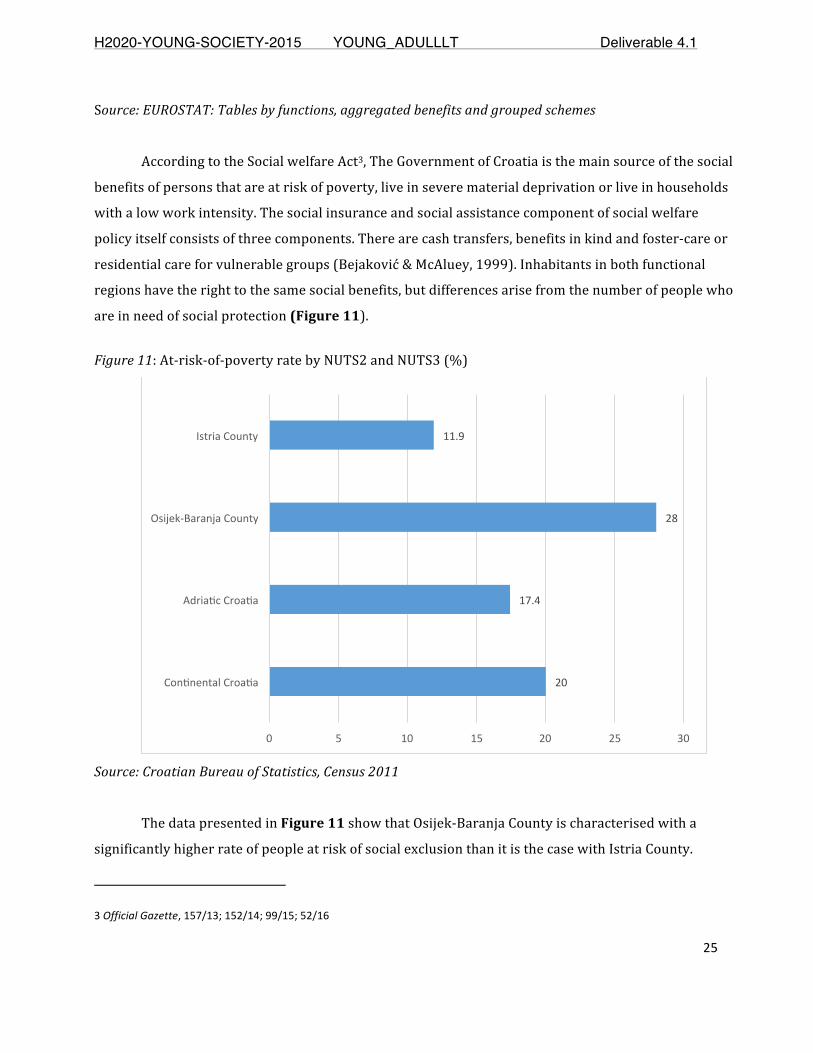
Croatia: This paper provides a short overview of the living conditions of youngpeople in Croatia, focusing on two Croatian functional regions (Istria County andOsijek-BaranjaCounty).Basedontheobtaineddata,youngpeopleinCroatialiveinconditionsarelessfavourableincomparisonwiththeEU28average.Thisconcernsyouth inboth functionalregions,eventhoughtheIstriaCounty ismoredevelopedthantheOsijek-BaranjaCounty.
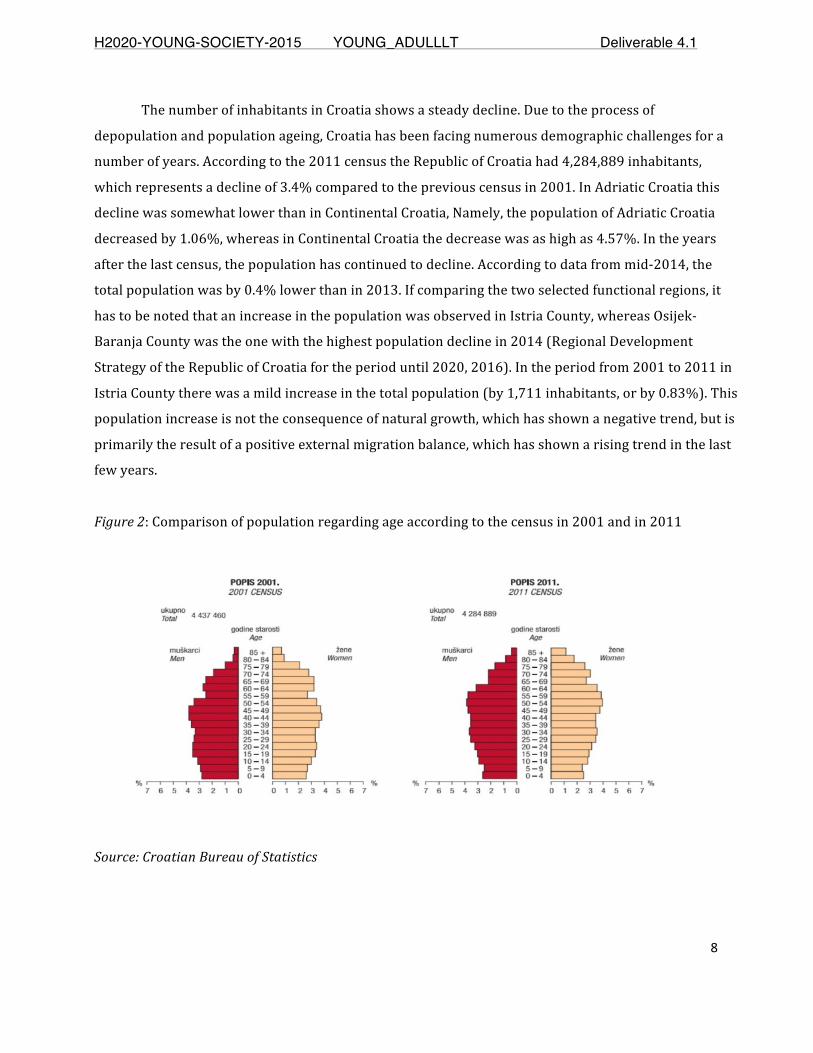
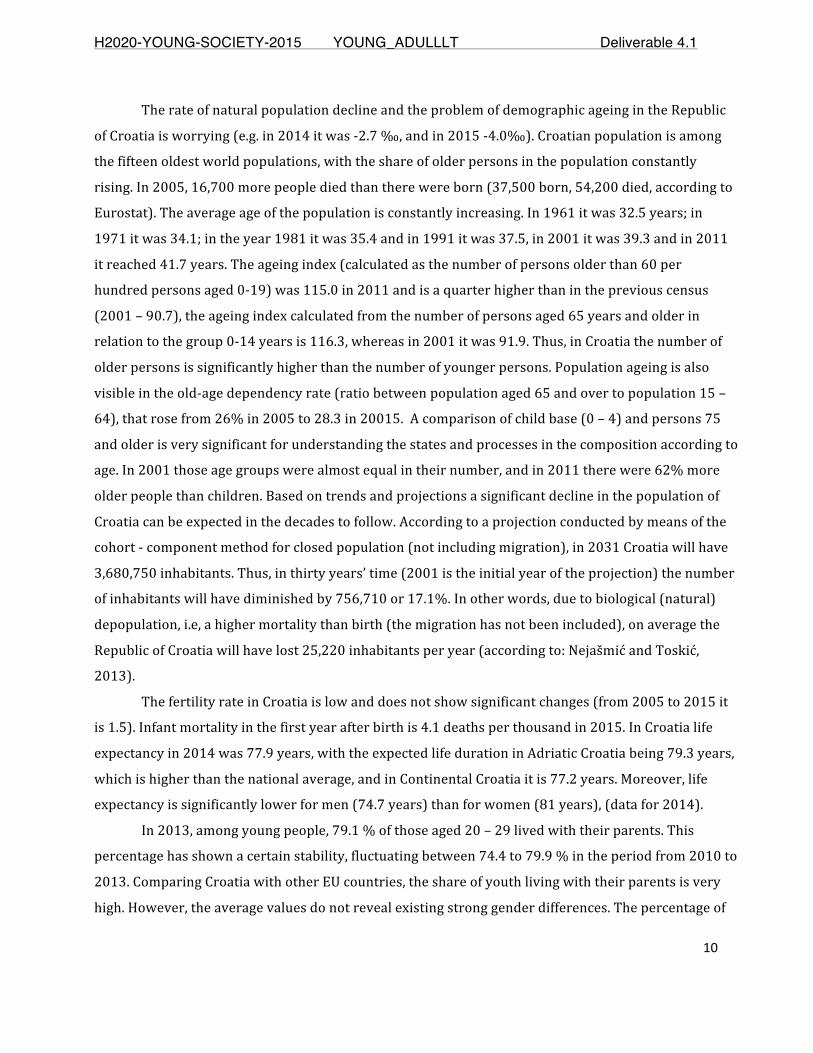
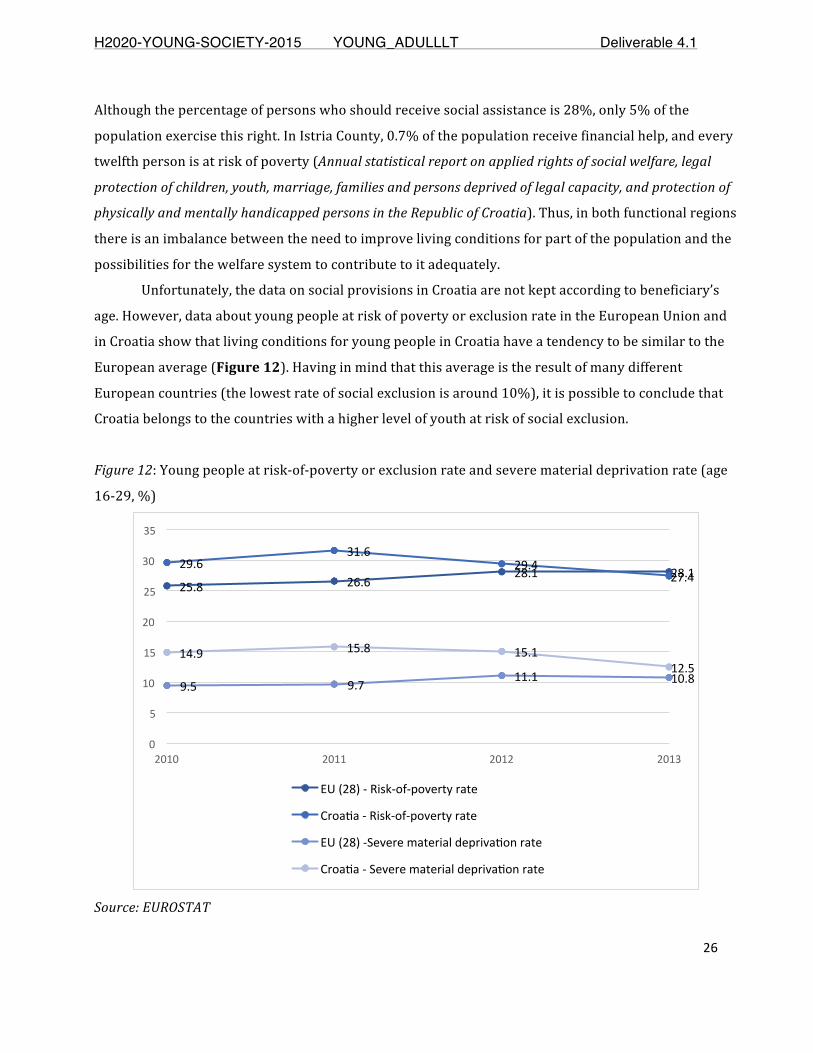
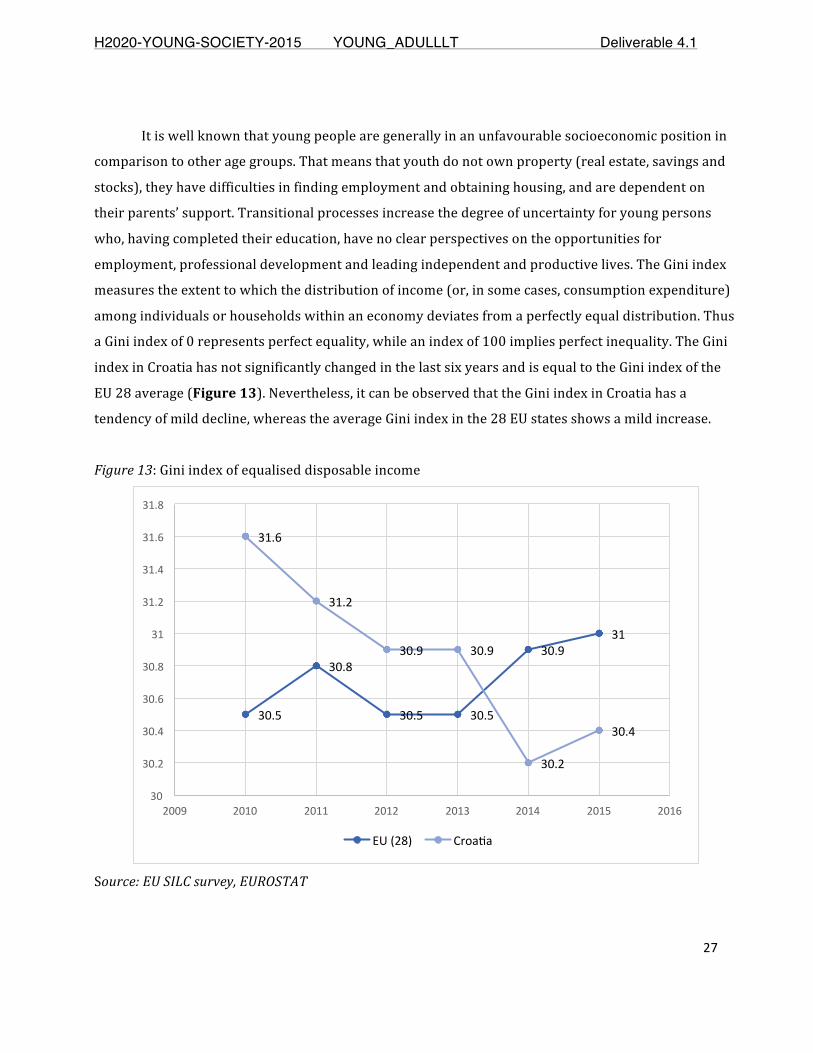
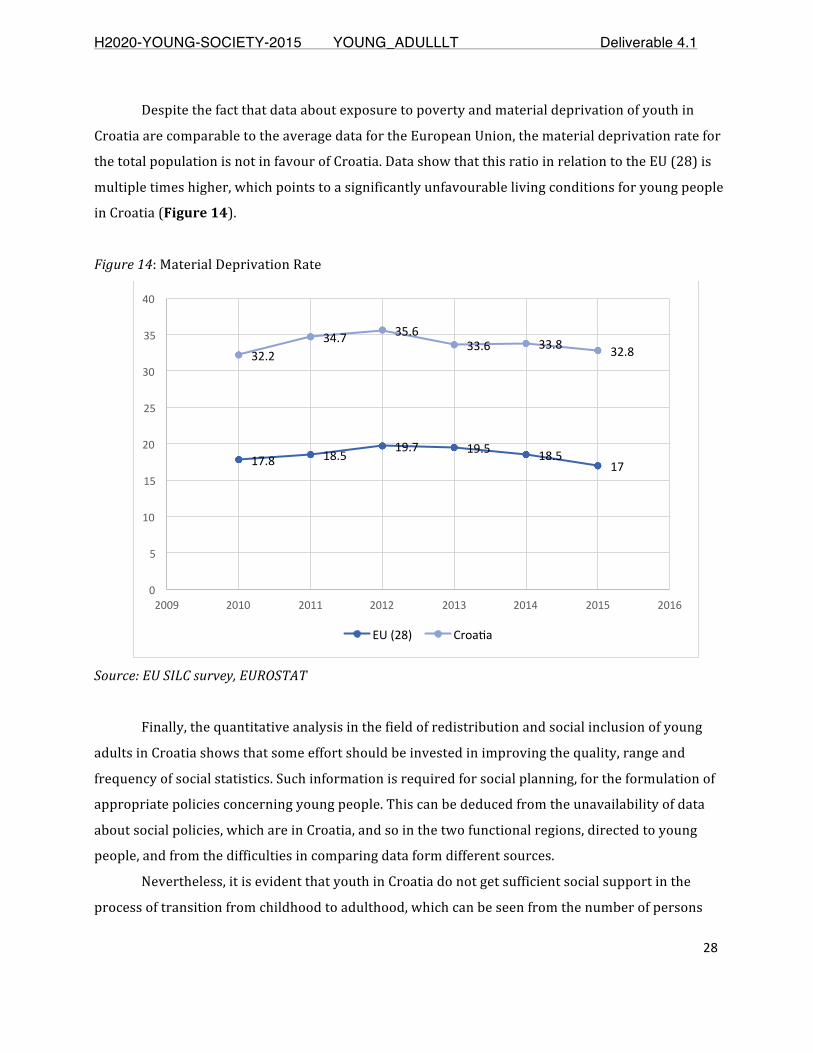
Themaindemographiccharacteristic isadeclineof therateofnaturalpopulation(including increasing the average age of the population and low fertility rate).Croatian economic conditions are significantly below the EU28 average (theCroatianGDPissignificantlylowerthantheEU28average,andtheCroatianlabourproductivity is significantly under the EU28 and Euro area countries average).Comparing Croatia with other EU countries, the share of youth living with theirparentsisveryhigh.ThemainstrengthsoftheCroatianeducationsystemareaverylowearlyschoolleavingrateandthehighproportionofsecondaryvocationalschoolgraduates entering higher education. The main weaknesses are low results ininternational studies of numeracy, literacy and reading skills of youth, aswell asextremely low participation in early childhood education and care and adulteducation.Theeconomicactivityrateofyouth(age15-24)hasdecreasedinthelastten years. Croatia is one of the three EU28 countries with the highest youthunemployment. The key issues faced by young people when entering the labourmarketinCroatiaarethelackofpreviousworkexperienceandmismatchbetweentheir qualifications and the skill demand.Moreover, economic active youth in thelabour market shows a great gender gap. Characteristics of the Croatian socialwelfaresystemshowthatthesocialprotectionexpendituresinthenationalGDParebehindtheexpendituresintheGDPofEU28average,whilethematerialdeprivationrateismuchhigher.However,thelivingconditionsforyoungpeopleinCroatiaandthe Gini index have a tendency to be similar to the European average. The bestaspect of healthcare in Croatia is the broadness that encompasses the population
Page 8
H2020-YOUNG-SOCIETY-2015 YOUNG_ADULLLT Deliverable 4.1
Page8of31
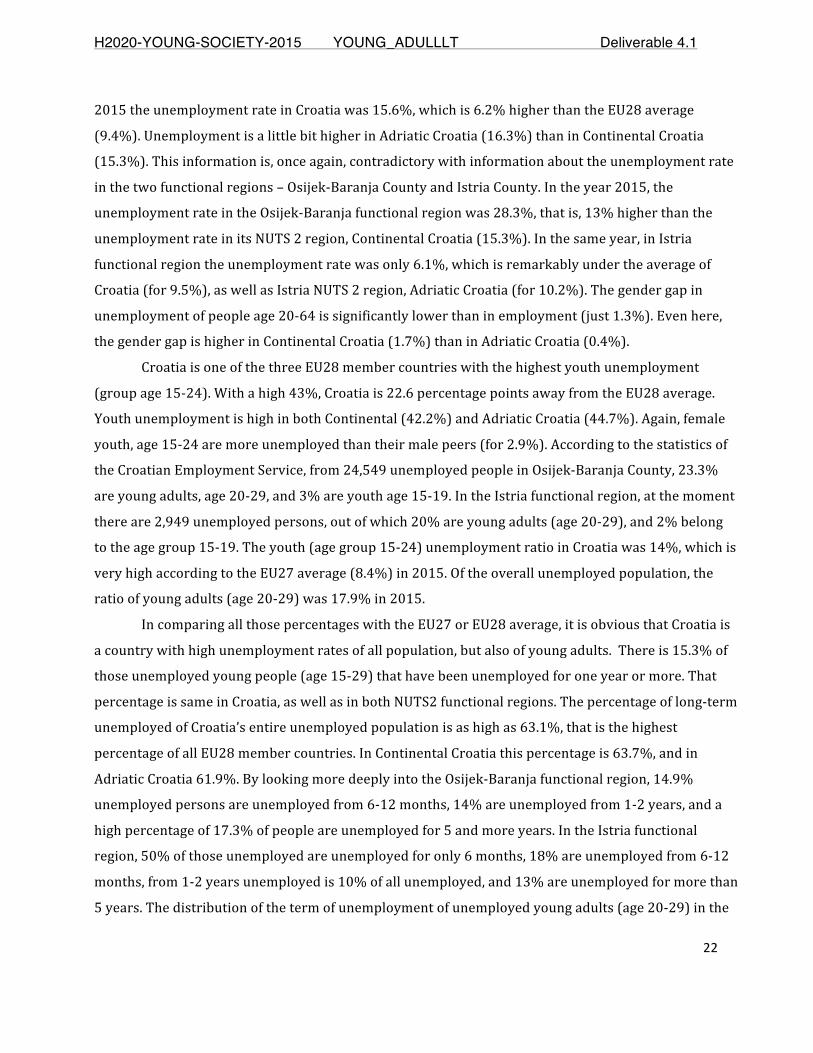
with free healthcare including persons in the regular system of education andpersons with low income. However, Croatian people are less satisfied than theaverage European citizens in the field of satisfaction with the financial situation,overall life, recreational and green areas and living environment. Moreover, theavailability of health services is not uniform in all regions of Croatia and it issignificantlyweakeraboutotherEUcountries.AllanalyseddatashowthatthelivingconditionsofyoungpeoplearebetterinIstriathaninthefunctionalregionOsijek-Baranja.
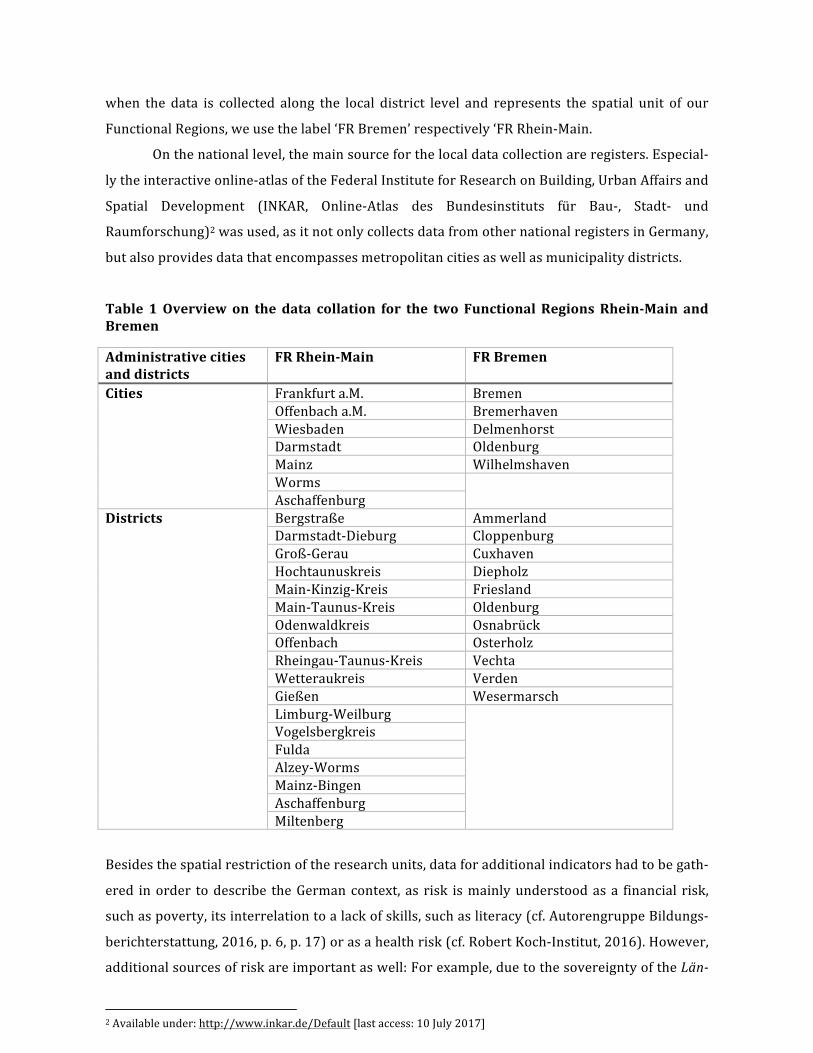
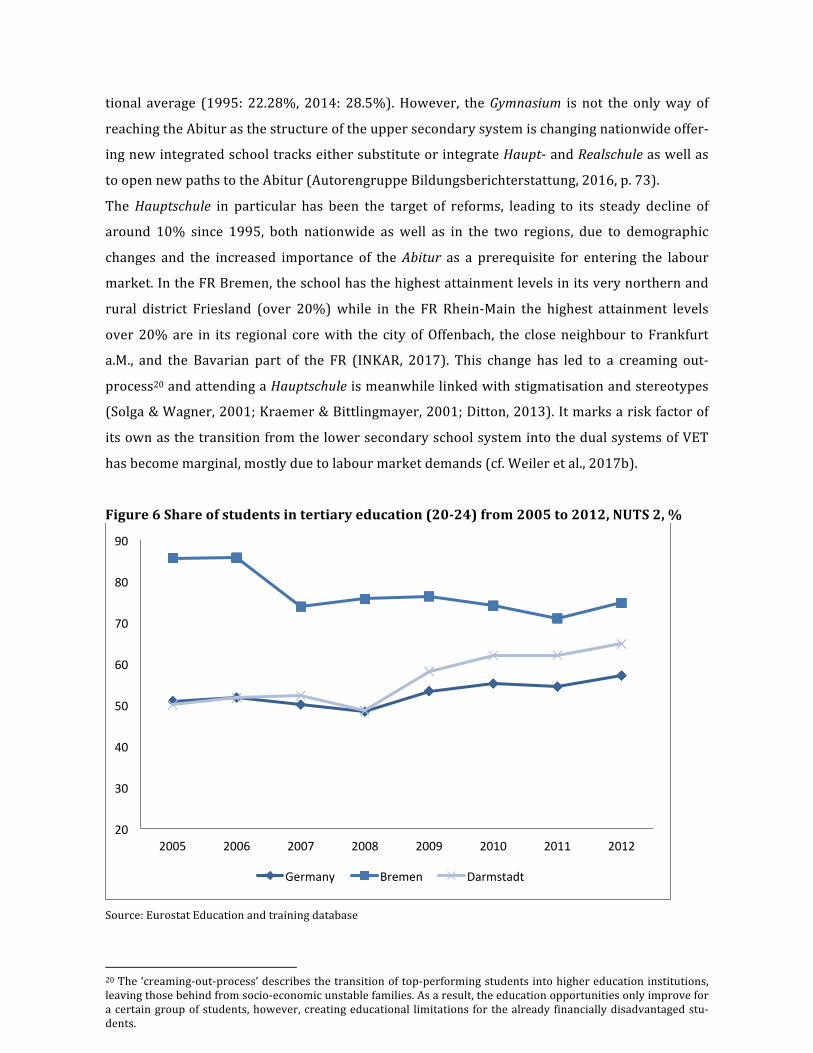
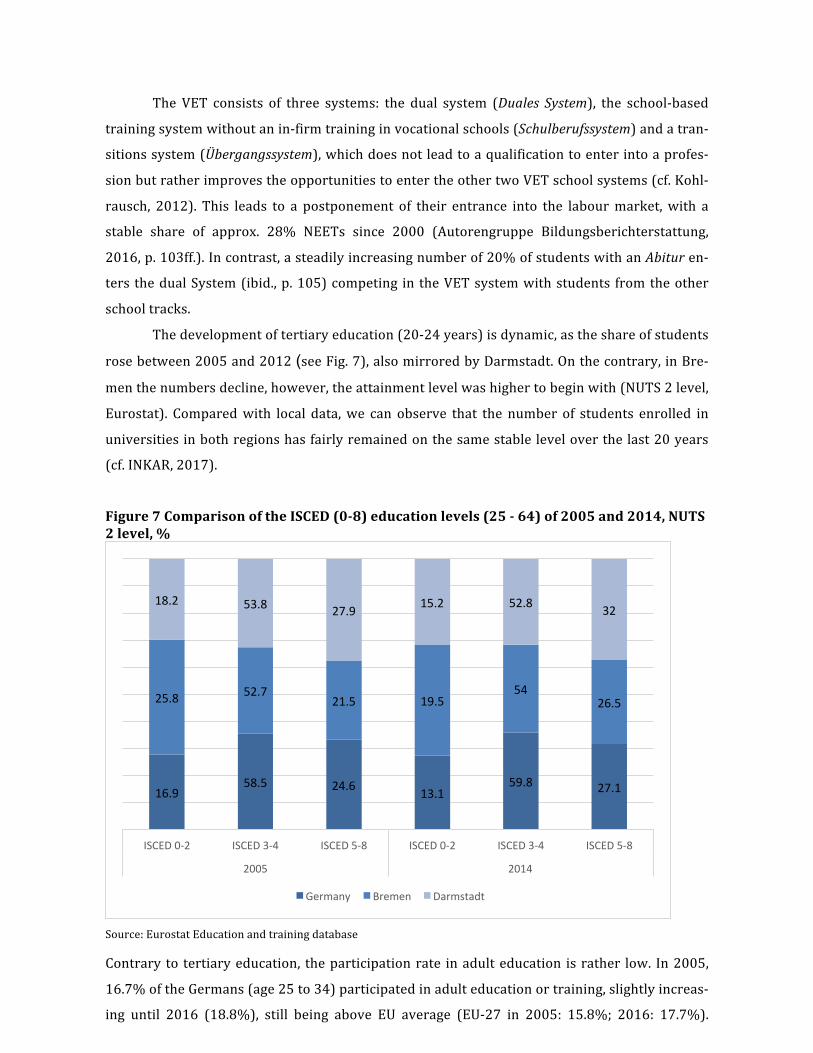
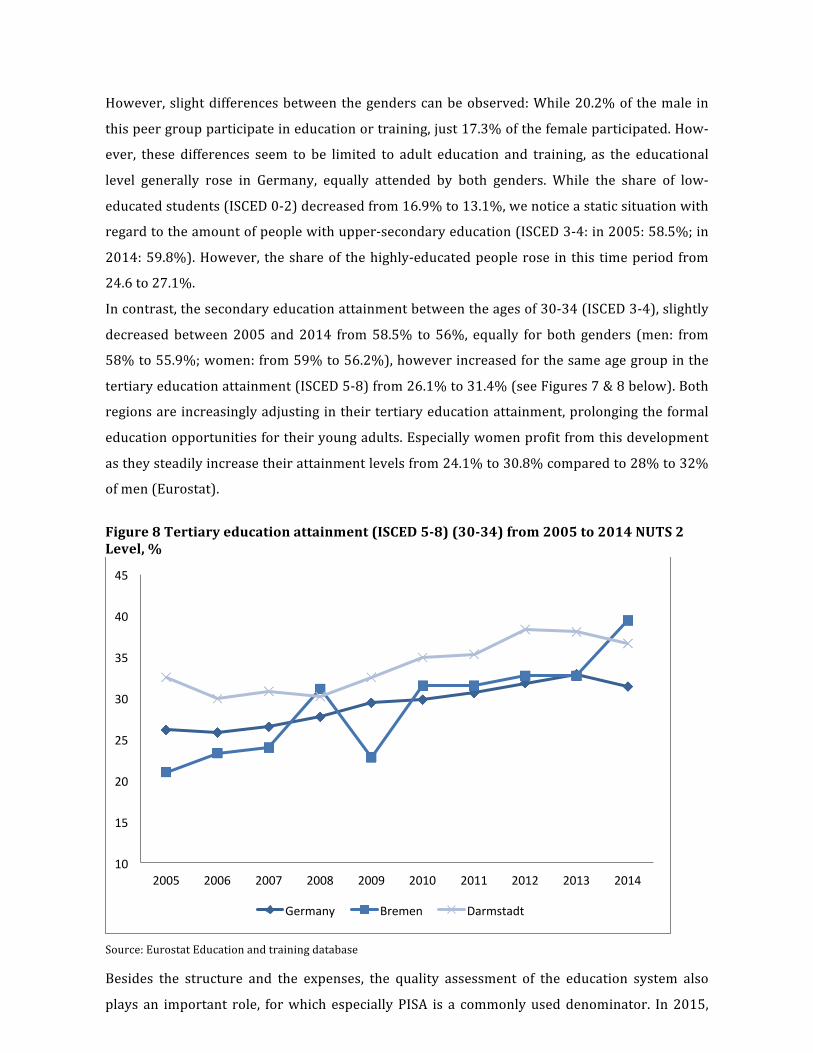
Germany: This report analyses young adults living conditions in Germany byfocusingontwofunctionalregionsasRhein-MainandBremen.TheGermansocietyis undergoing demographic changes due to an ageing society and an inflow ofmigrants.However, thegrowthof thetworegionsdiffers largely,as theFRRhein-Main is constantly growing due to worker inflow, whereas the population in FRBremen is shrinking. While in FR Bremen young adults are more likely to beresponsible in a young age for children, interrupting training and work in earlycareerstages,intheFRFrankfurt,especiallyinthemetropolitancore,youngpeoplearemore prone to postponing life projects of family and own children. The datashowsthattoday’syoungadultsgrowupunderdifferentcircumstancesanddealingwith different limitations (high living costs, uncertain career path, prolongededucational trajectories, etc.), which hinders them to move out of their parents’homeandachievefinancialindependentlives.Specifically,youngadultsunder25–who are recipients of welfare benefits (Harz IV) – are further prevented fromgaining autonomy by the legal regulations of social programs and labourmarketpolicies.
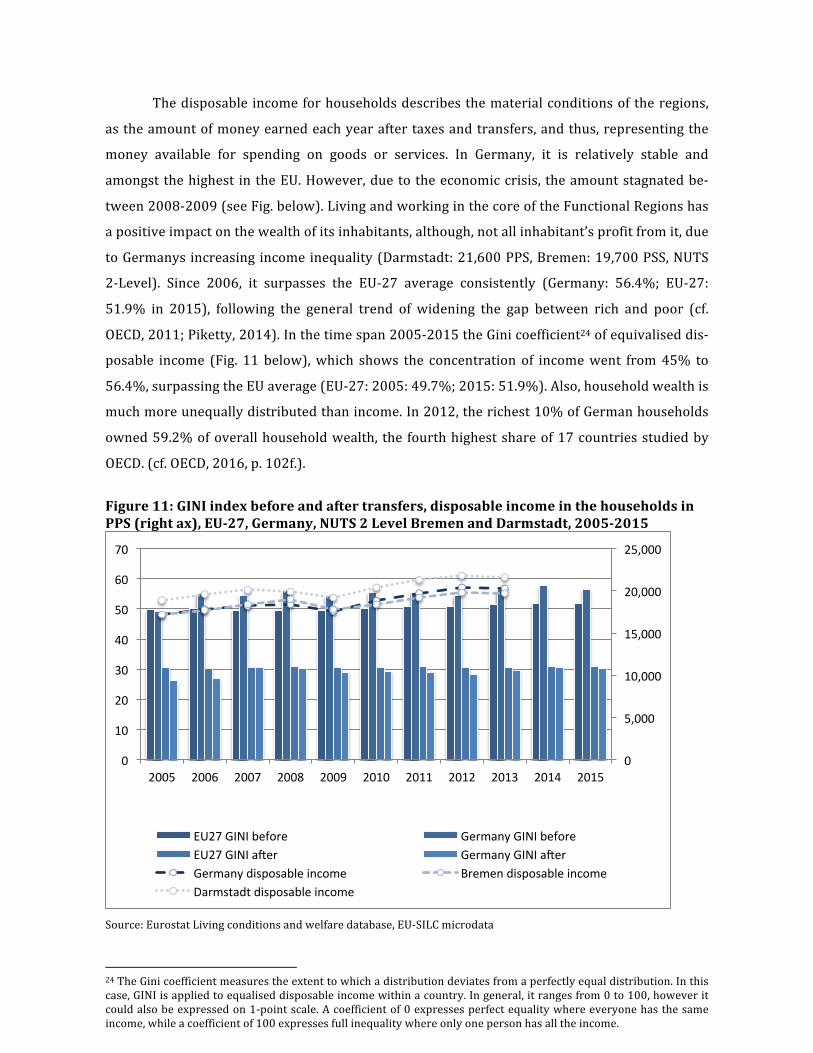
Wealth and economic productivity are unevenly distributed in the researchedlocales: While the core of both regions is rather wealthy, its periphery hardlyparticipatesfromtheeconomicturnover.Atthesametime,thehighlivingcostsinthe core areas hinder young adults to live and work in themore profitable coreareas. As a result, amismatch of economic opportunities and financial limitationsarises,especiallyconcerningyoungadultslivinginFRRhein-Main.Simultaneously,the regions face structural changes creating risks for career paths, particularlyaffecting young adults in FRBremen.While traditionally dominant sectors are onthedecline(suchaslogistics),otherlow-wagesectorsaregrowing,whichcouldleadtoarethinkingofyoungadults’careerchoices.
TheGermaneducationsystemischaracterisedbyatightcouplingofcertificatesandoccupationalbiographies.Withtheincreasingtrendtowardsacademisation,youngadults face a prolongation of formal education. However, this follows a peculiarinstitutional fragmentation due to themulti-tiered school system,which caters tolabourmarketswithsubstantiallydifferentneeds.Theopportunitiesforeducation,
Page 9
H2020-YOUNG-SOCIETY-2015 YOUNG_ADULLLT Deliverable 4.1
Page9of31
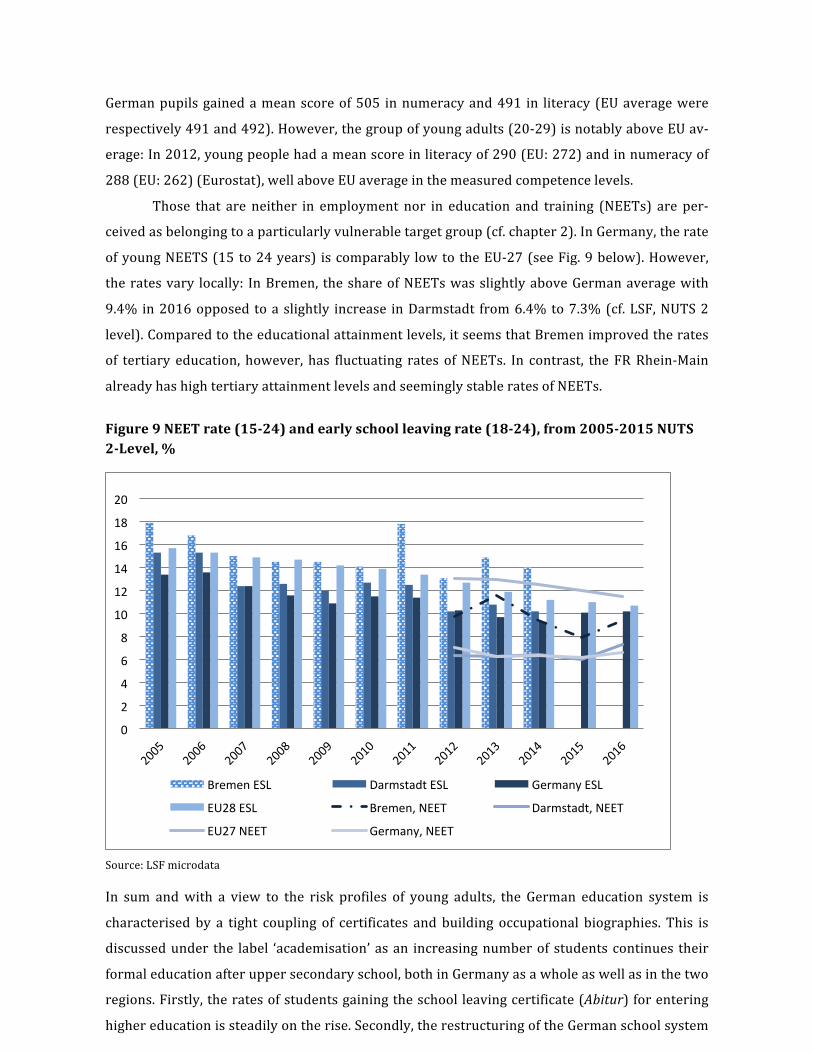
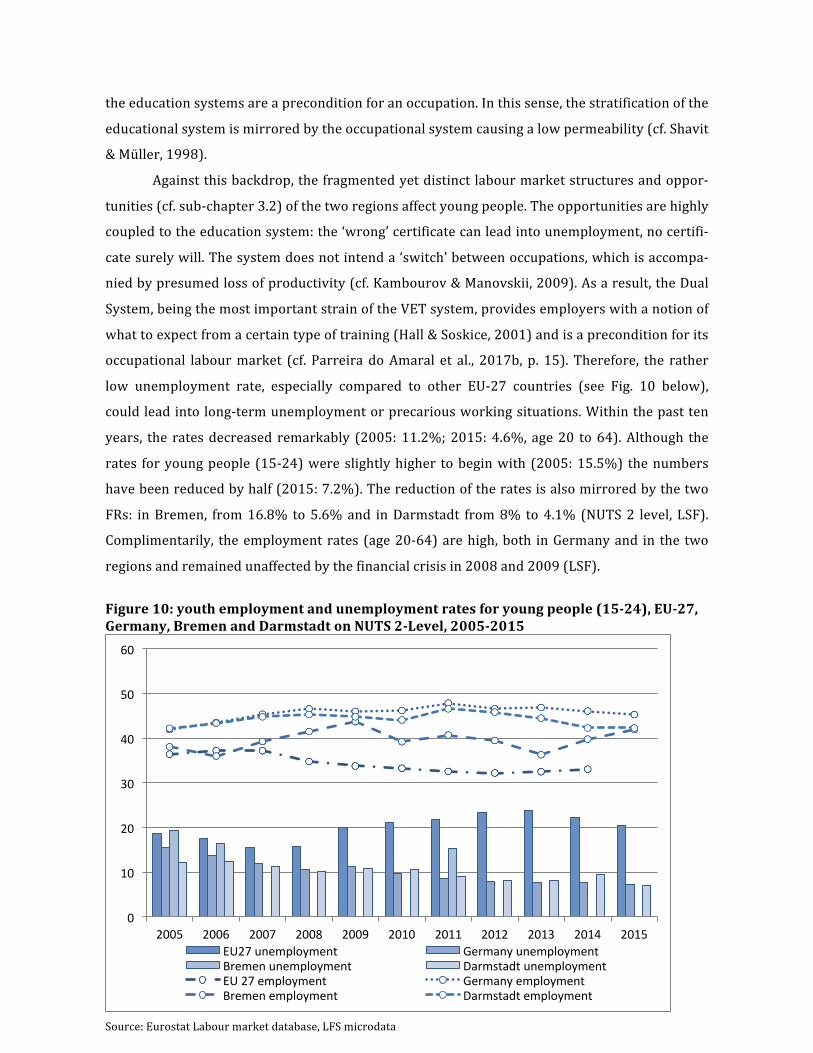
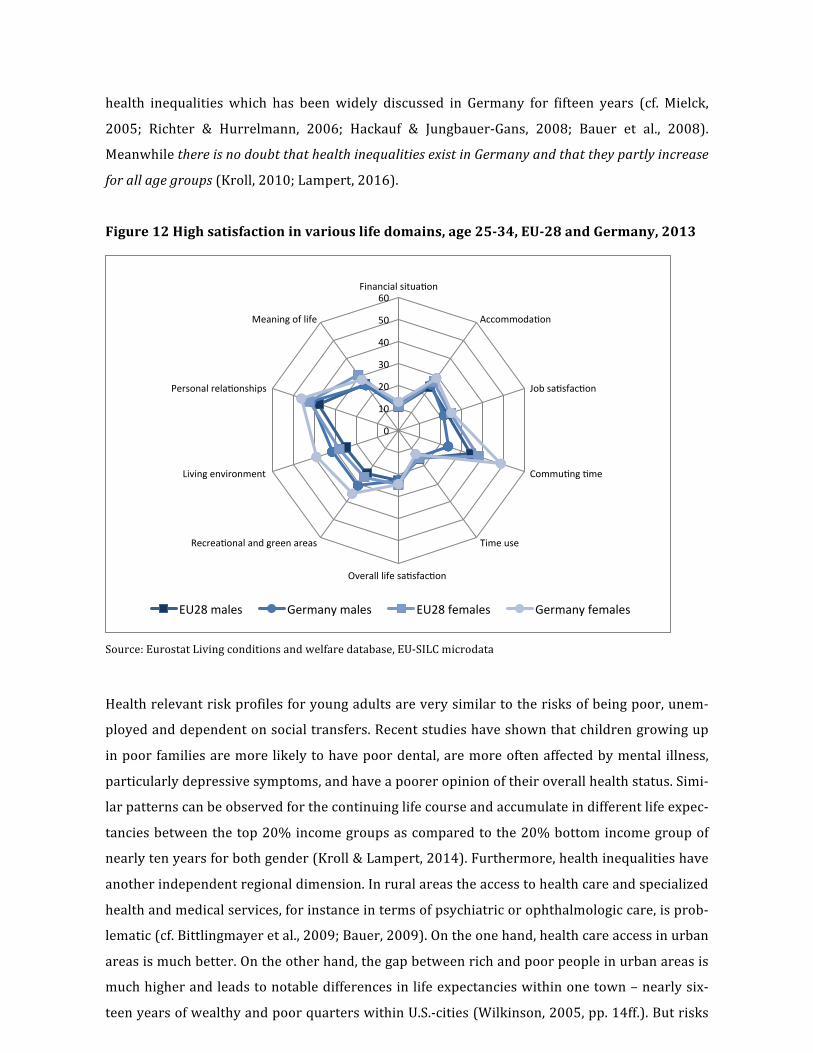
andthusoccupation,arelargelydeterminedbytheregiontheyoungadultsgrowup:GrowingupintheneighbouringpartsofFrankfurtamMainas,forinstance,thecityofOffenbachorAschaffenburg(theBavarianpartoftheFR)orintheruralareasofFR Bremen exponentially increases the odds of achieving at most the lowersecondary education certificate (Haupschule). Young adults living there areespecially at risk of exclusion, as this school track is continuously reduced inGermany thus also diminishing their chances in the transition into the labourmarket.Although youth unemployment rates are under the EU average, for young adultsliving in the FR Bremen, the risk is higher than in the FR Rhein-Main. Particularregionaldifferencesincontrastinglabourmarketspromoteandfostertheneedforspecific jobs as consequence of the regional structural changes. Especially the FRBremenhasahighlydynamicandcontrastinglabourmarket,howeverstilloffersalargenumberofjobsinproductionplants.Asaresult,thelabourmarketsarehighlypolarised, with focus on high and low skilled worker constantly reducing themedium-skilledworkers.Incontrast,theFRRhein-Mainoffersabroadervarietyofjobs in finance,air transportation,serviceandmedia,however,attractworkersallover Germany and worldwide who compete with the potential workers on site.Particularly as both Functional Regions attract high skilled worker in the corespreadingtheremainingskilled jobs in itsperipherycausingprecarioussituationsforNEETsandearlyschoolleavers.Being at riskof social exclusion andpoverty varies remarkablywithin andacrossboth Functional Regions. Living in the core of both regions enhances the risk ofreceivingbenefits for long term-unemployment.However, the riskvarieswith theregions.Theabove-mentionedpovertyriskprofilesaresimilarregardinghealth,asgrowingupinpoorfamiliesleadstoadecreasedhealthstatus.Thisriskenhancesforyoungadultslivinginmoreruralareas,astheaccesstohealthcareislimited.Asdetailedlocaldata ismissing,weconcludedbasedondataonpovertyandunemployment,that the health risk is also high in the cities of Bremerhaven andWilhelmshaven(bothFRBremen)andWormsandOffenbach(bothFRRhein-Main).
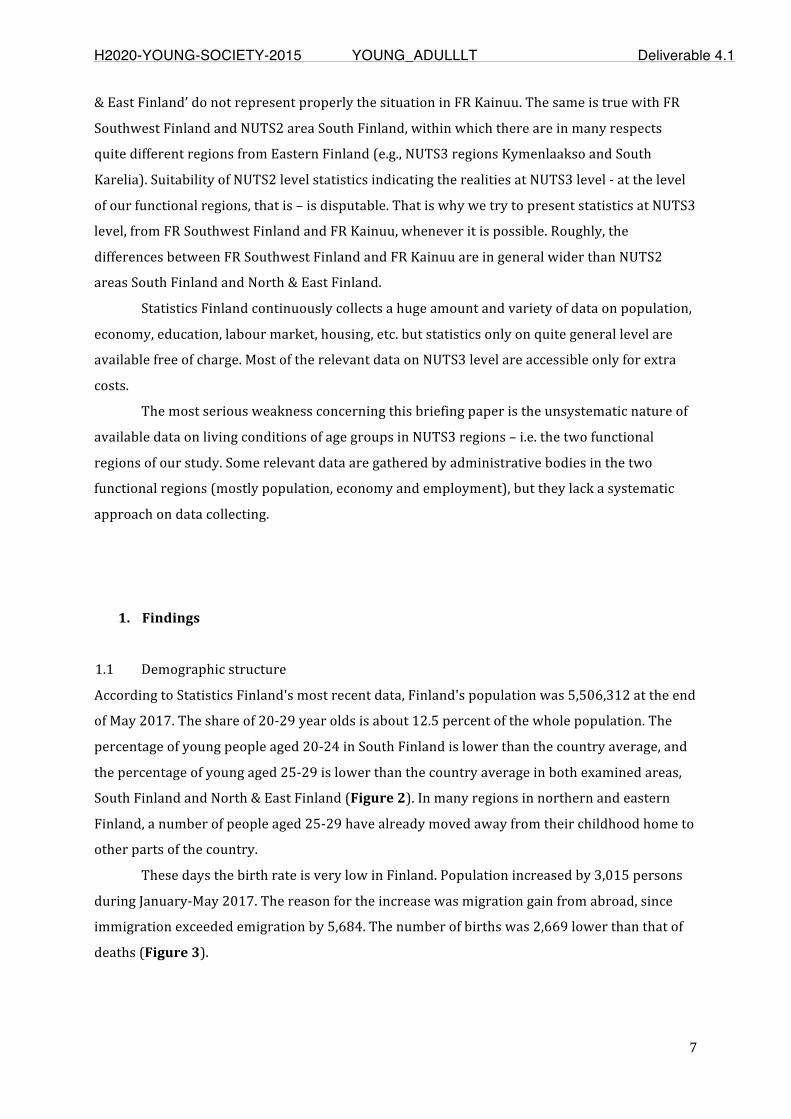
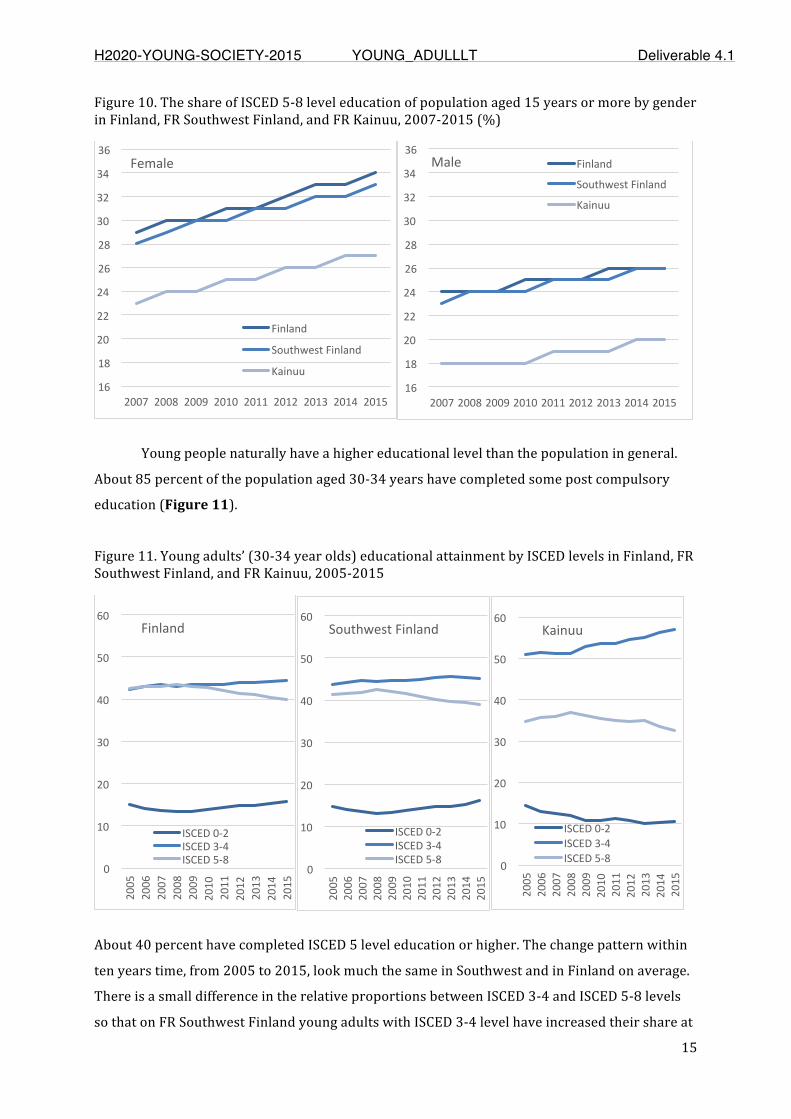
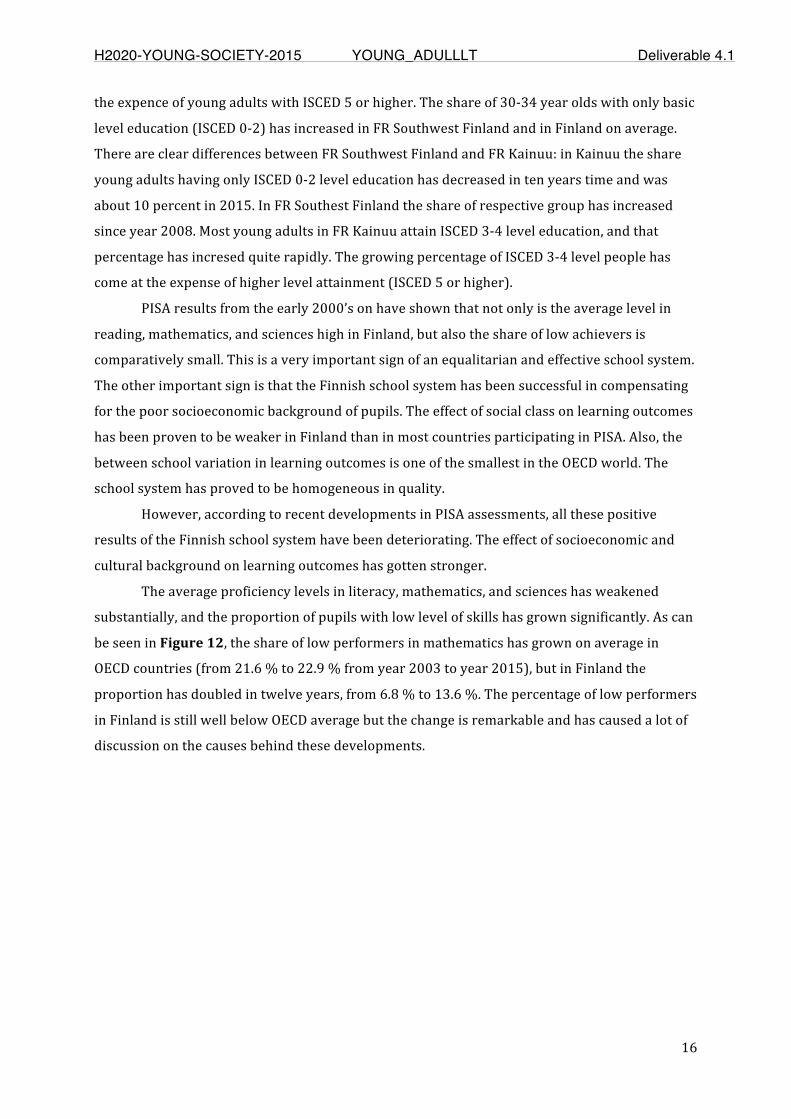
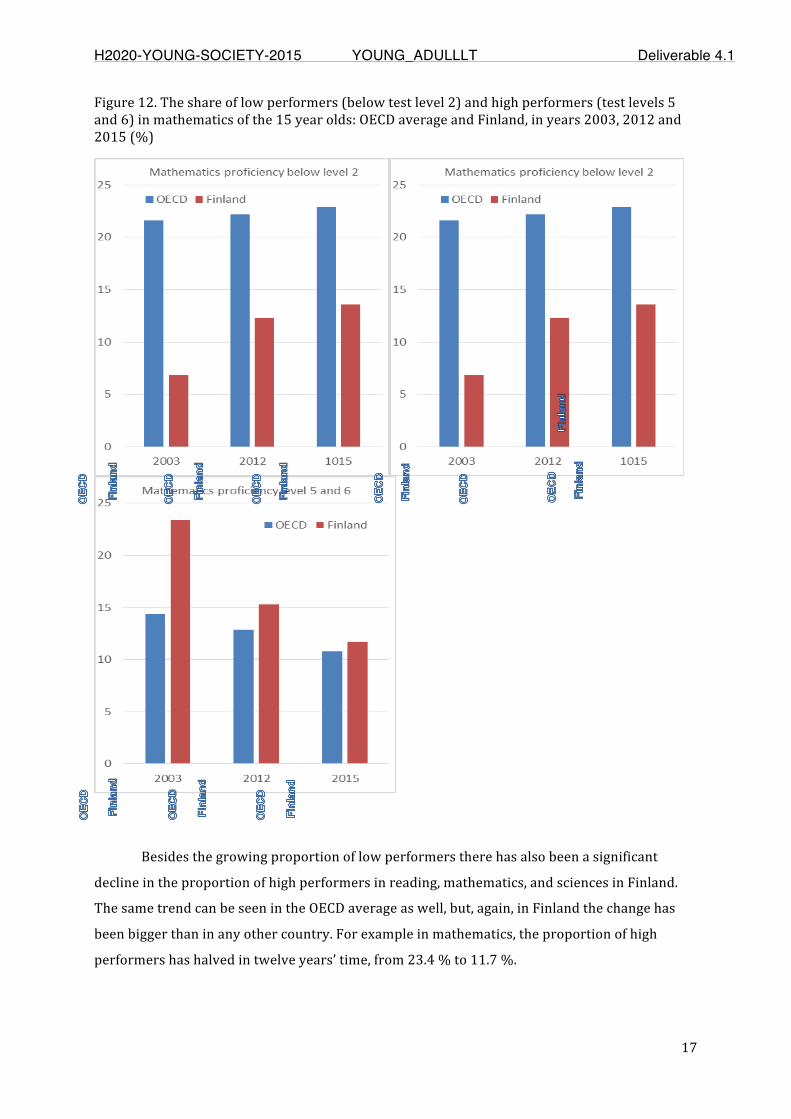
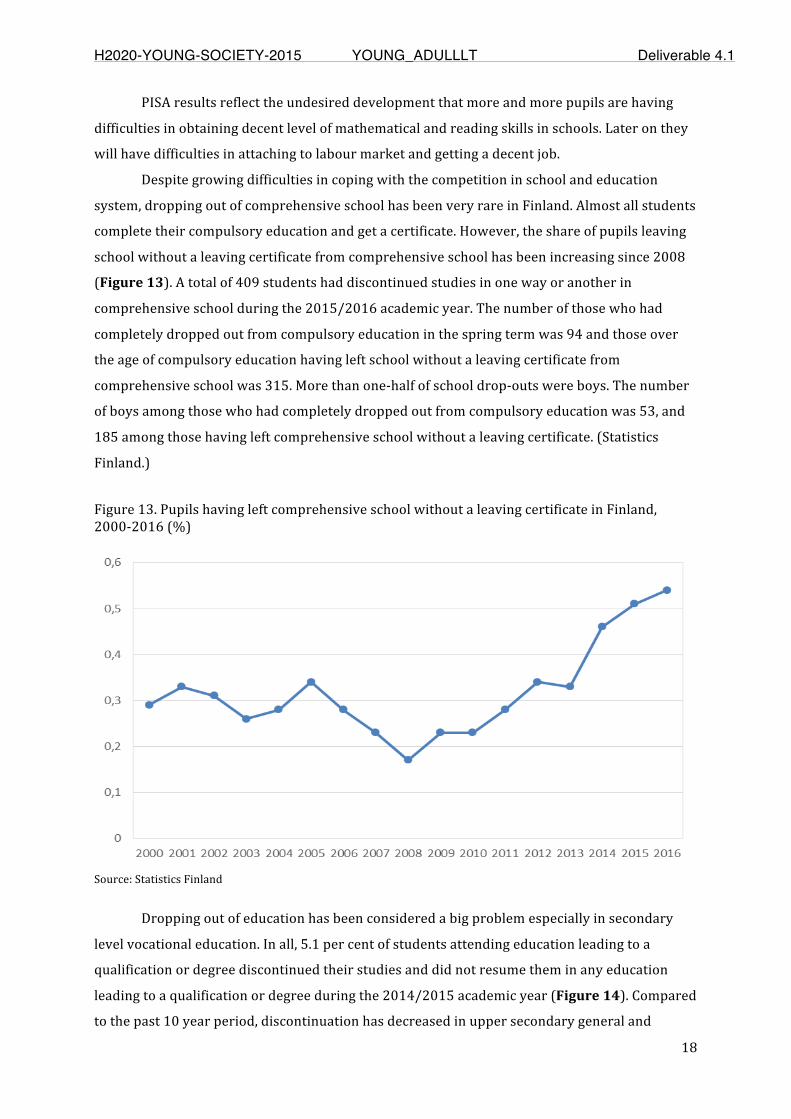
Finland: The Finnish education system, especially the comprehensive school, ischaracteristically intertwined with the Scandinavian notion of the welfare state,whichentailsastrongemphasisonequaleducationalopportunities.Asoneof thekeyelementsoftheScandinavianwelfaremodel,thecomprehensiveschoolsystemis identified by universal, non-selective, and free basic education provided by thepublicsector.PISAresultsfromtheearly2000’sonhaveshownthatnotonlyistheaverage level in reading, mathematics, and sciences high in Finland, but also theshareoflowachieversiscomparativelysmall.Theotherimportantsignisthatthe
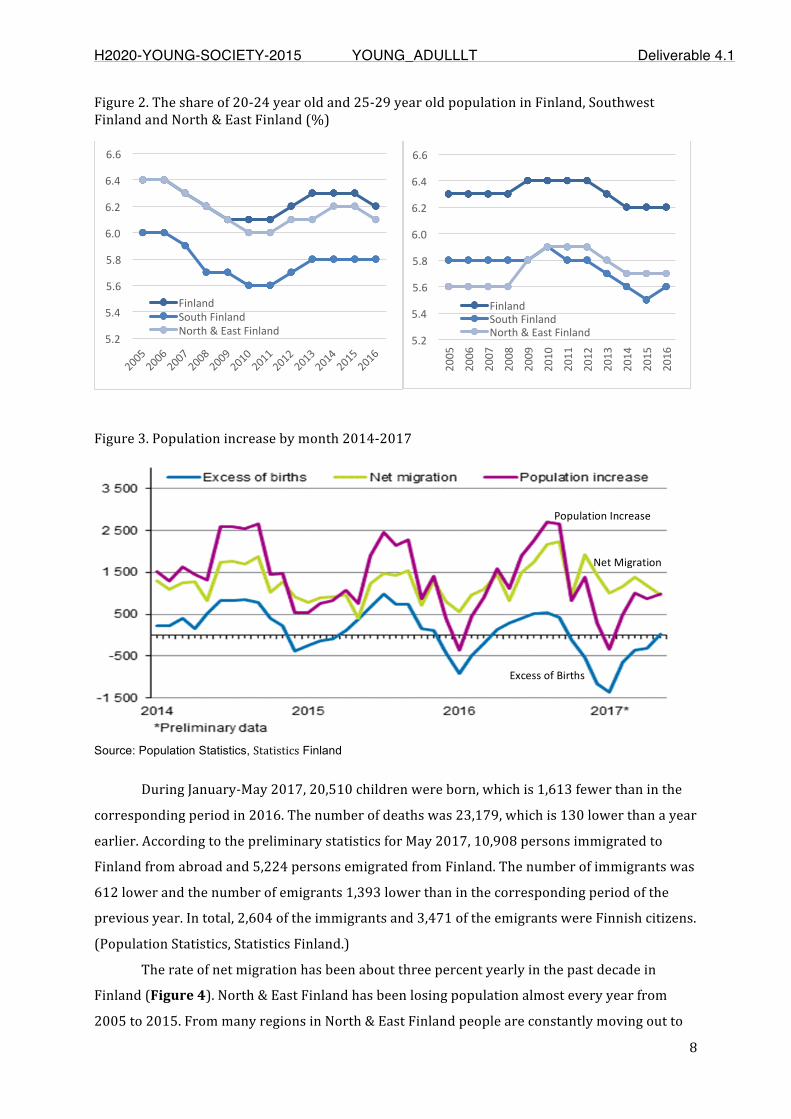
Page 10
H2020-YOUNG-SOCIETY-2015 YOUNG_ADULLLT Deliverable 4.1
Page10of31
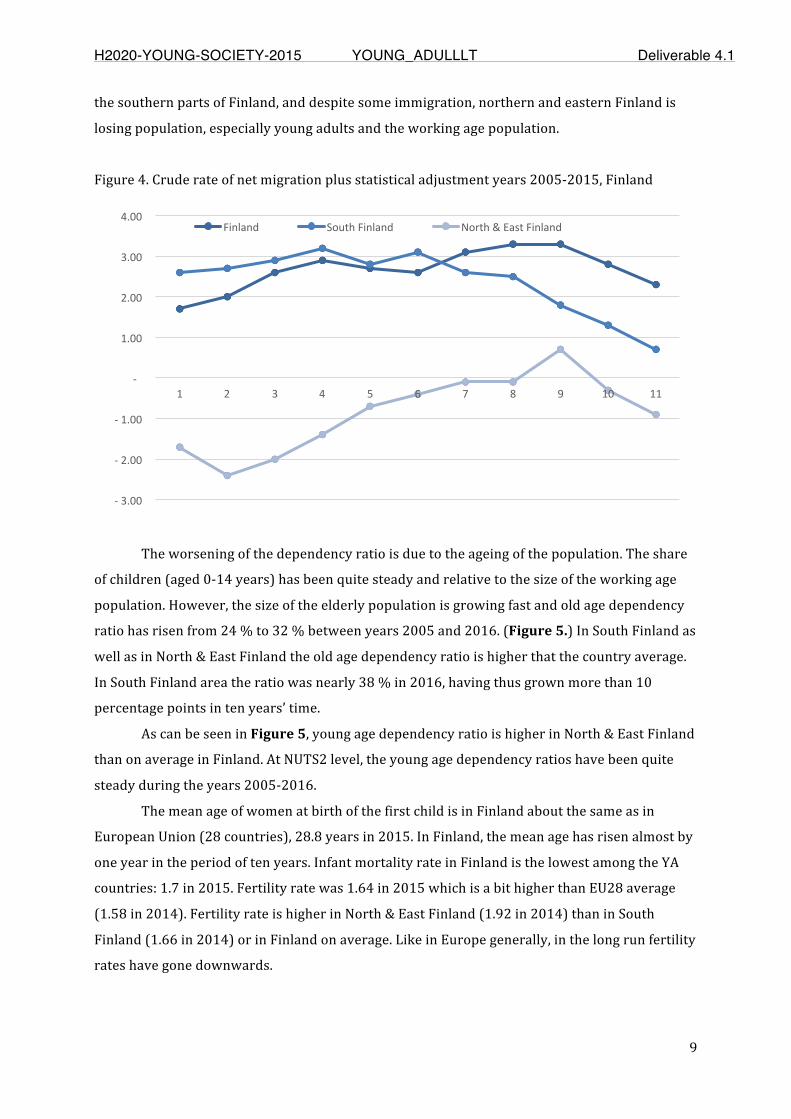
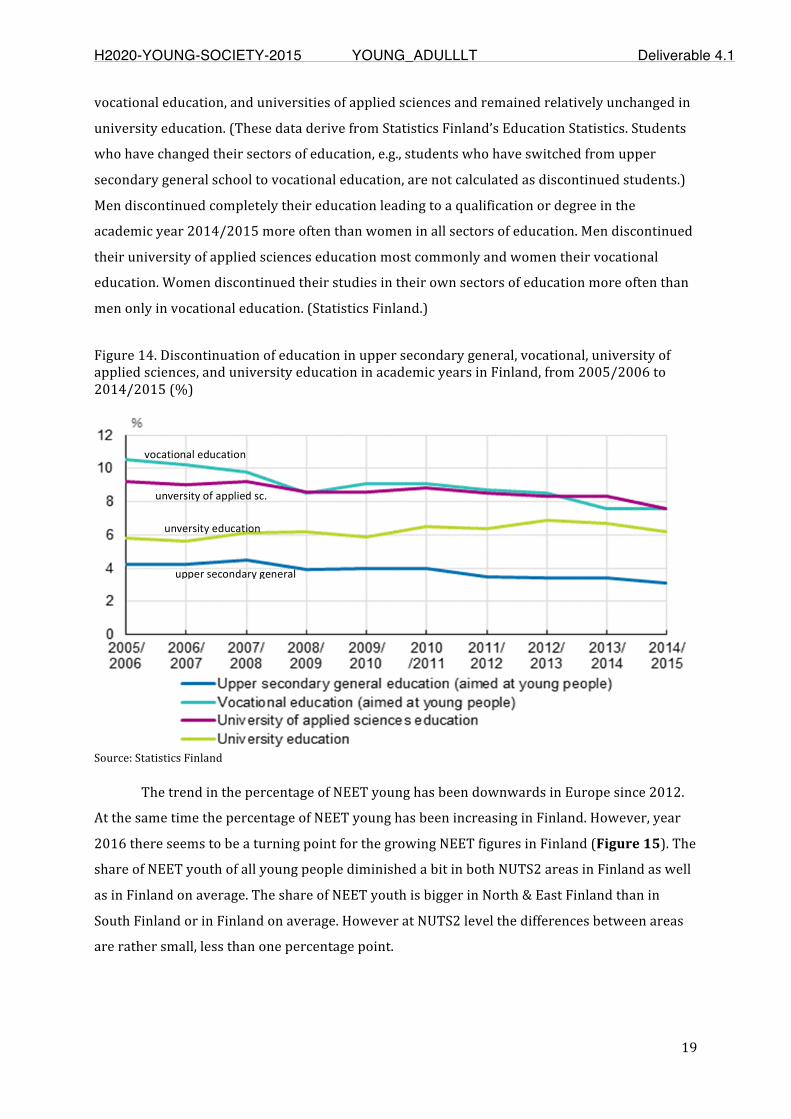
Finnish school system has been successful in compensating for the poorsocioeconomicbackgroundofpupils.Also,thebetweenschoolvariationinlearningoutcomesisoneofthesmallestintheOECDworld.Theschoolsystemhasprovedtobe homogeneous in quality. Young people have relatively good educationalopportunitiesattheuppersecondaryandtertiarylevel.However,about10percentineachagecohortyoungpeopledonotcontinueineducationortrainingafterbasiceducation. Their situation is getting worse while the competition in the labourmarket gets tighter. The other phenomenon is the decreasing level of averagelearningoutcomes tested inPISA,TIMSS, andPIRLS.The shareof lowperformershasbeengrowing.
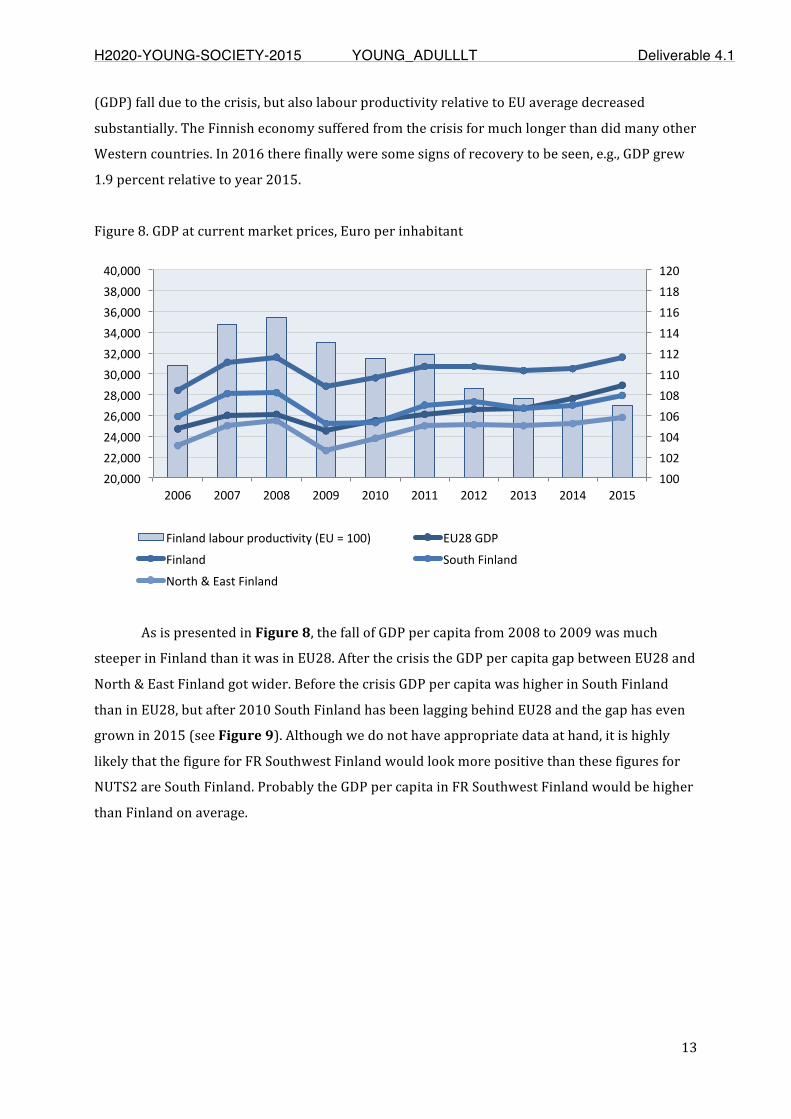
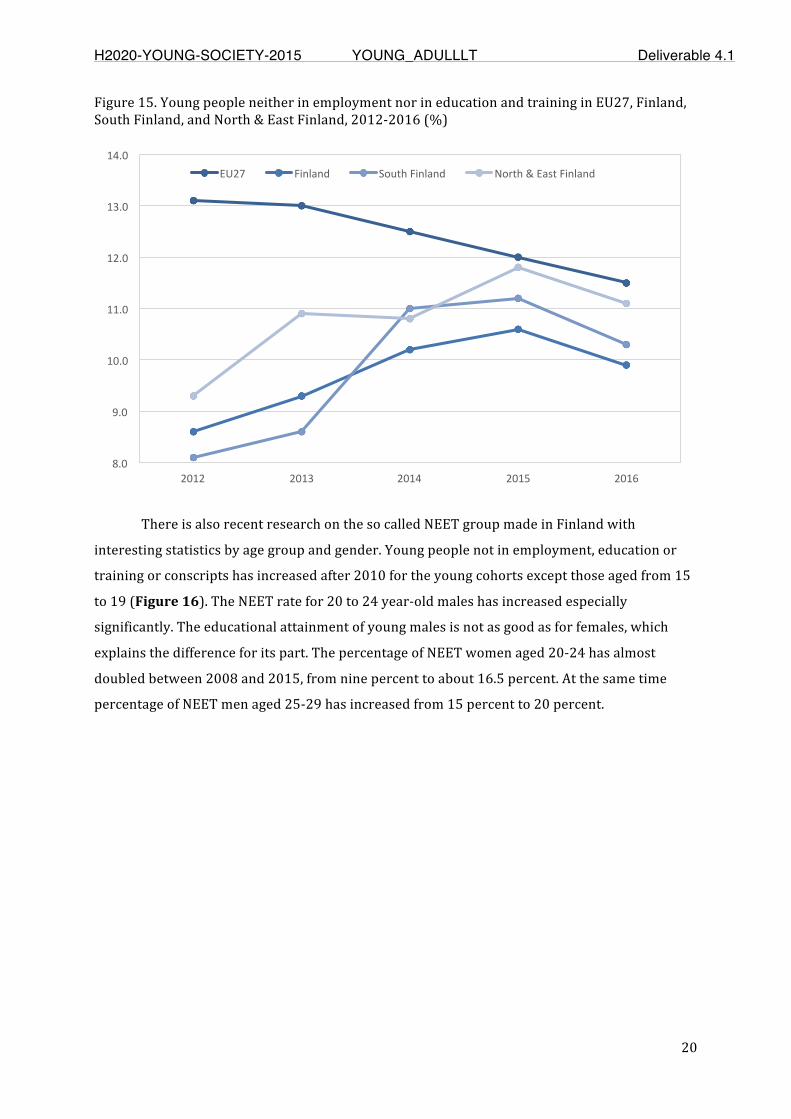
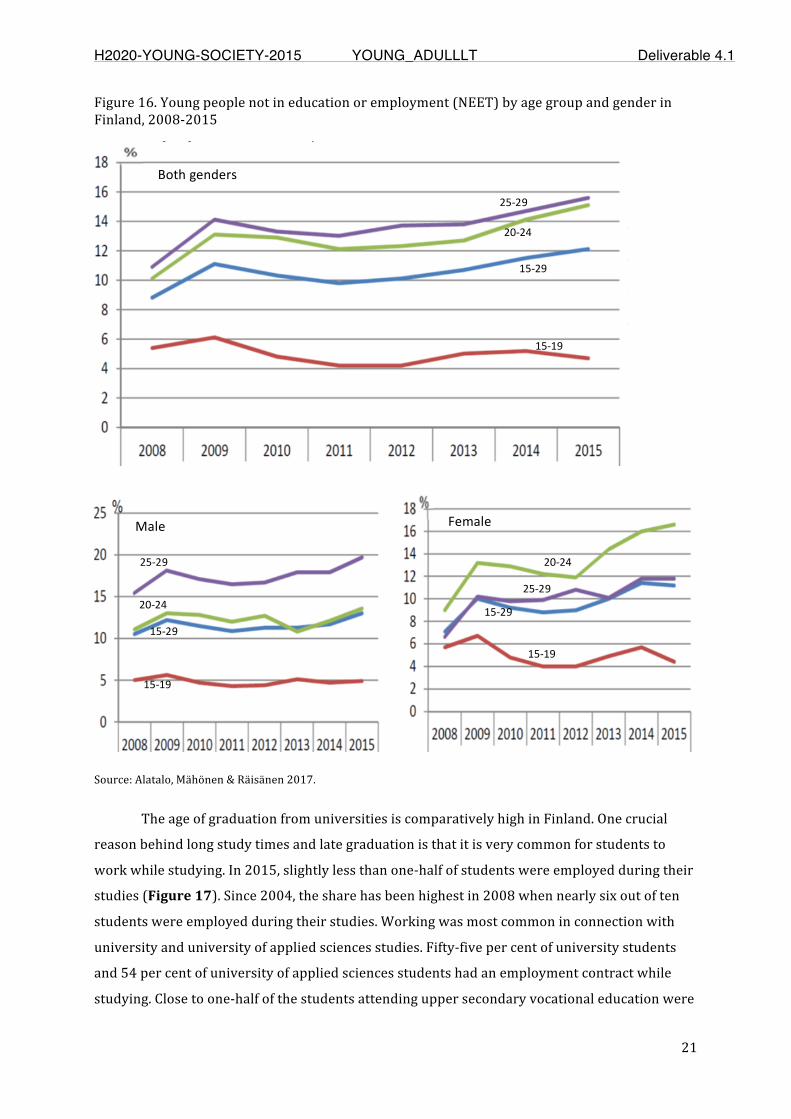
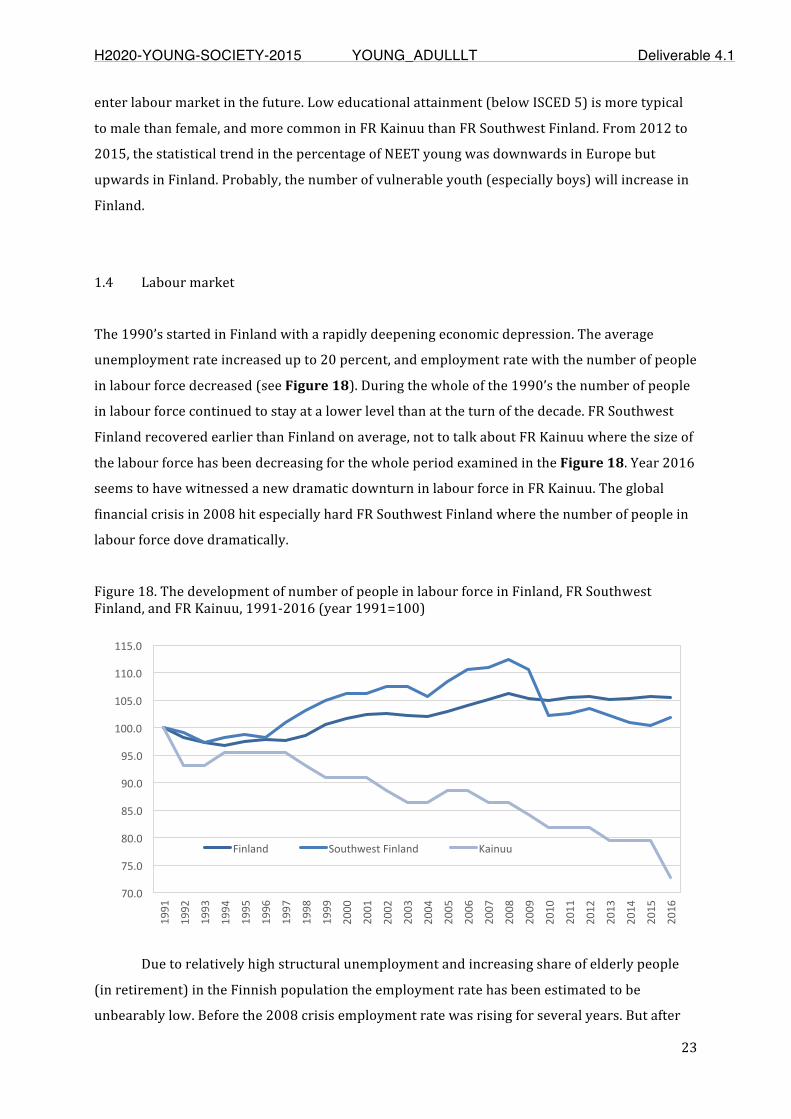
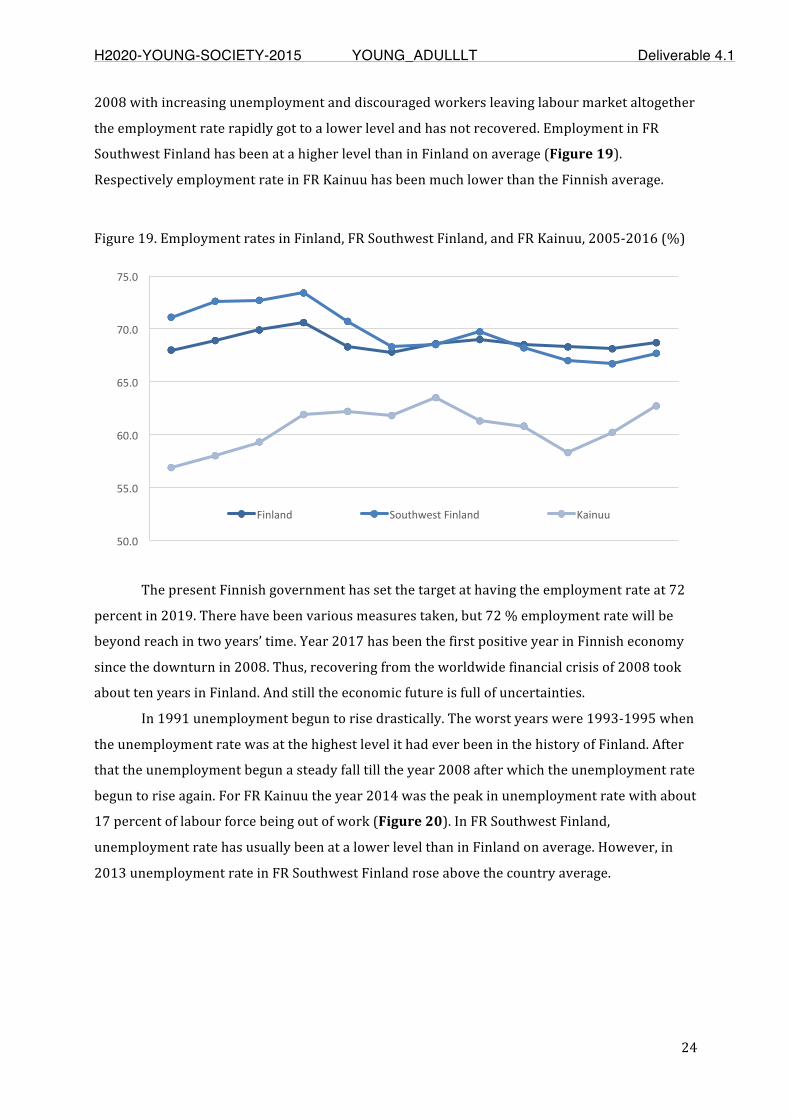
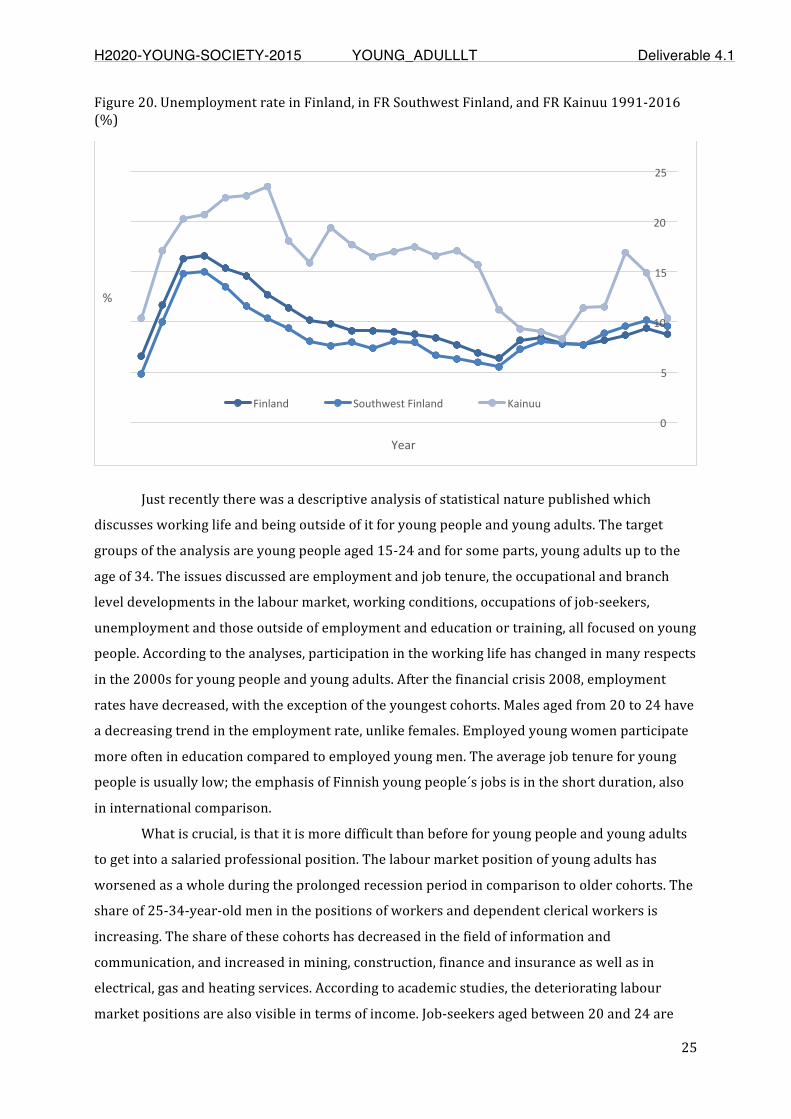
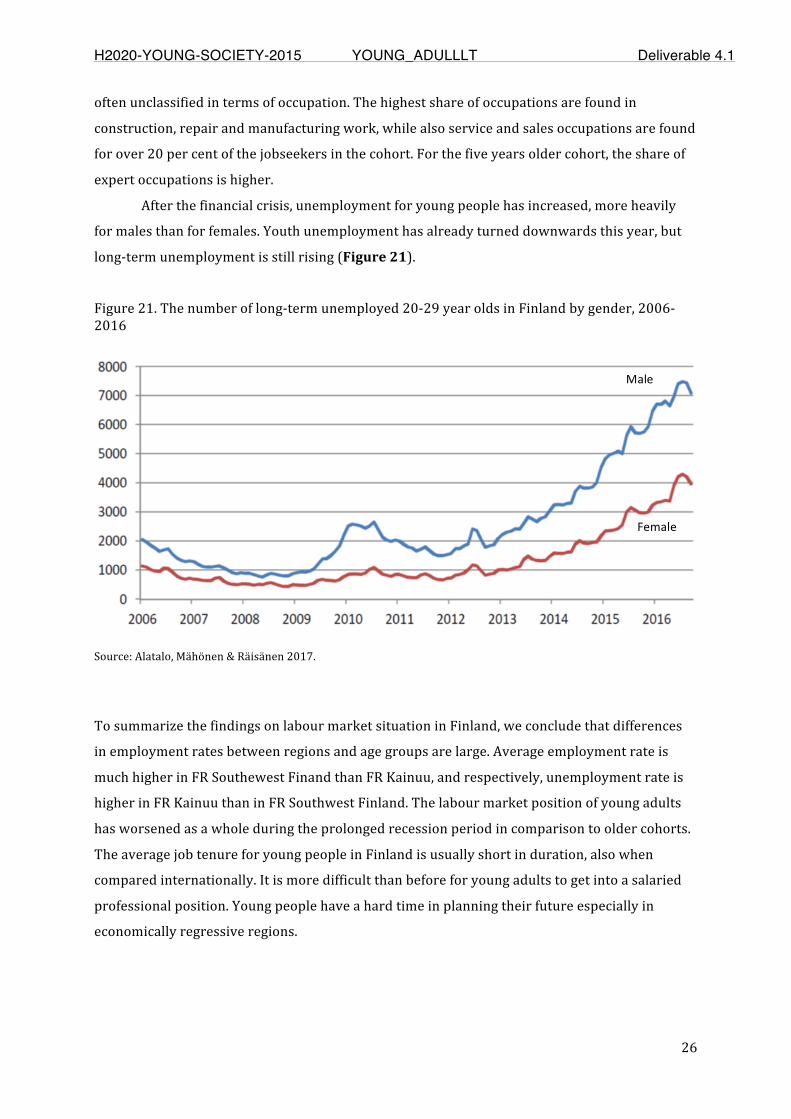
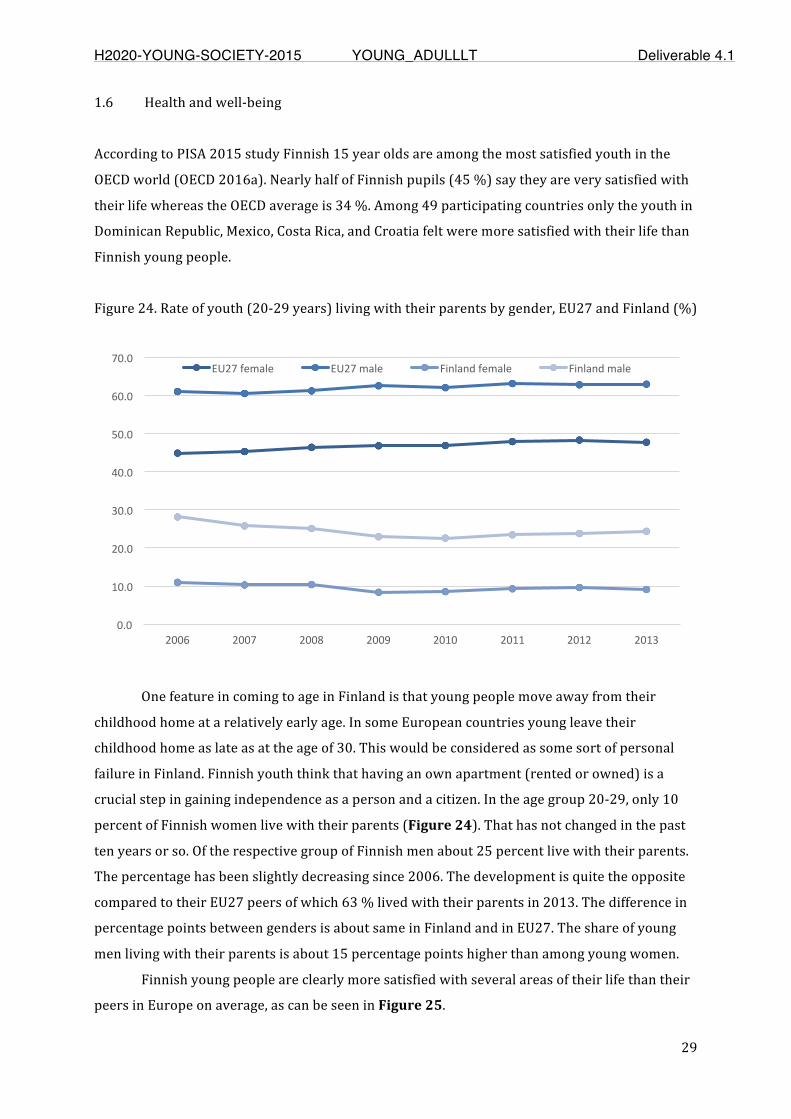
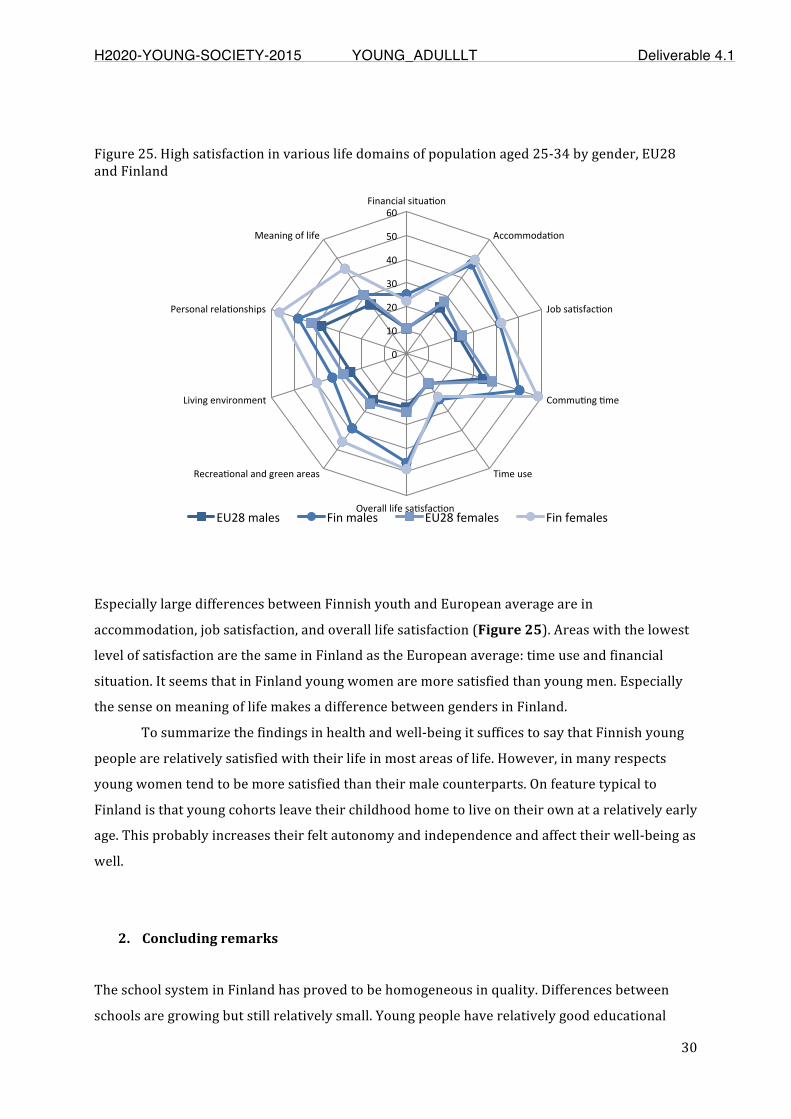
Finnisheconomyhassufferedtwoseverecrisessince the1980’s, first in theearly1990’sandthenasaneffectoftheglobalfinancialcrisisfrom2008onwards,whichhave had drastic effects on youth employment. After the financial crisis,unemployment for young people has increased, more heavily for males than forfemales.Long-termunemploymentof20-29agedmaleswasseventimeshigherandfemaleseighttimeshigherin2016thanin2008.Uncertainemploymentprospectshavealsodiscouragingeffectsoneducationalmotivationespeciallyofyoungpeopleinthelowendoftheachievementcurve.Incertainregionsofthecountrygettingajobwithoutworkexperienceandvocationaltrainingispracticallynon-existent.ThenumberofNEETyounghasbeen slightly increasingduring thepastdecadeor so.Actually, young adults living in the two functional regions, FR Southwest FinlandandFRKainuu,liveinquitedifferentrealitieswhatcomestotheirprospects.Peopleborn innorthernandeasternpartsof thecountry tendtomovetosoutherncitiesafter completing compulsory or upper secondary education. The overallemploymentinFRKainuuhasdecreasedquitedramaticallywithinthepastdecades:thenumberofemployedinFRKainuuisonlyabout70percentofthelevelitwasatthe beginning of the 1990’s. However, Finnish young people are clearly moresatisfied with several areas of their life than their peers in Europe on average.Especially large differences between Finnish youth and European average are inaccommodation,jobsatisfaction,andoveralllifesatisfaction.
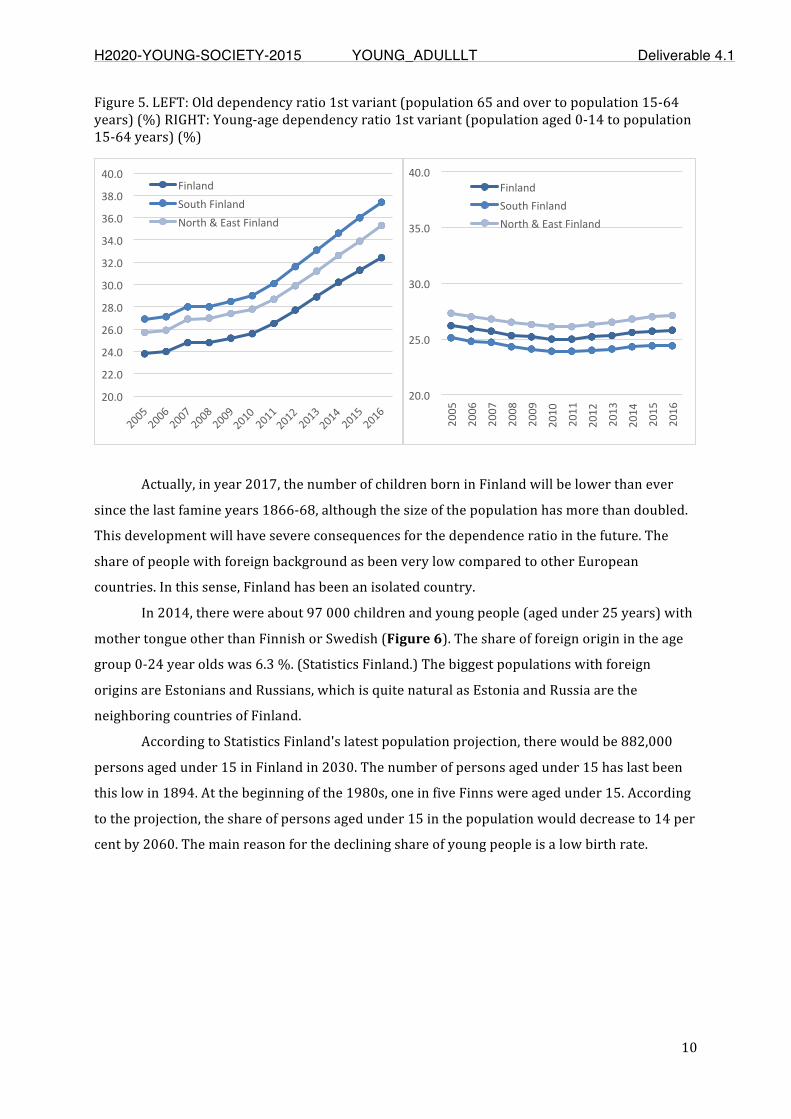
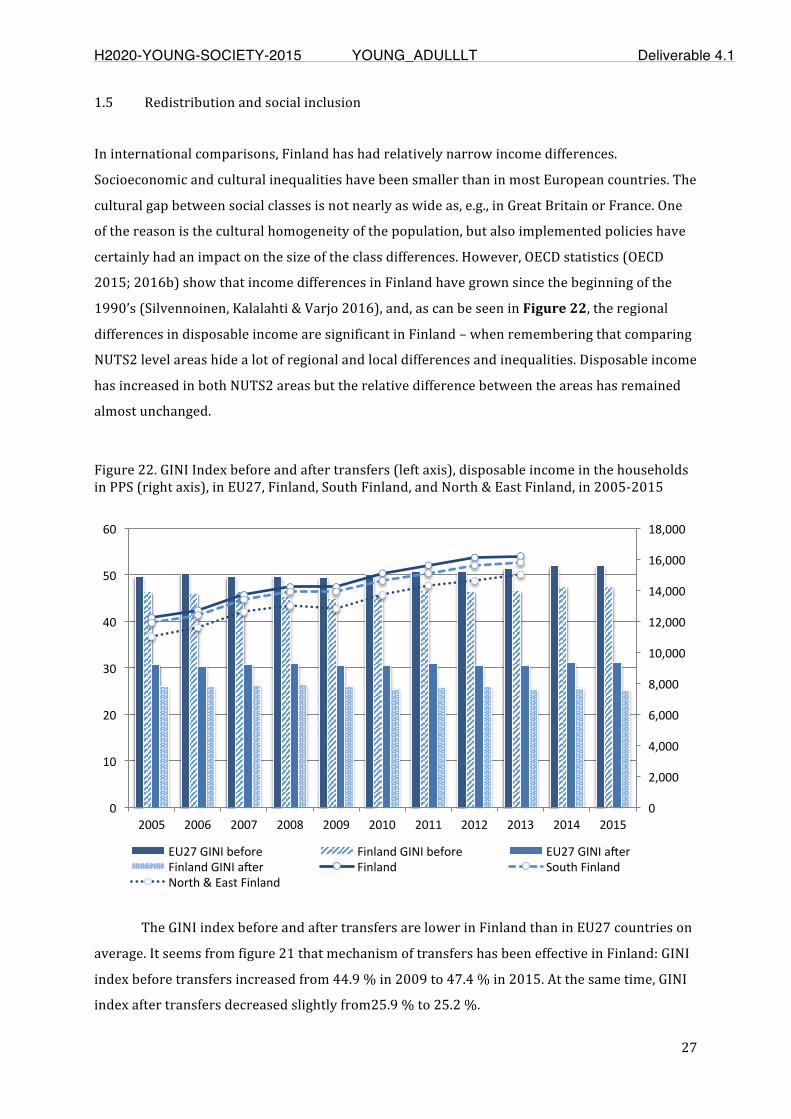
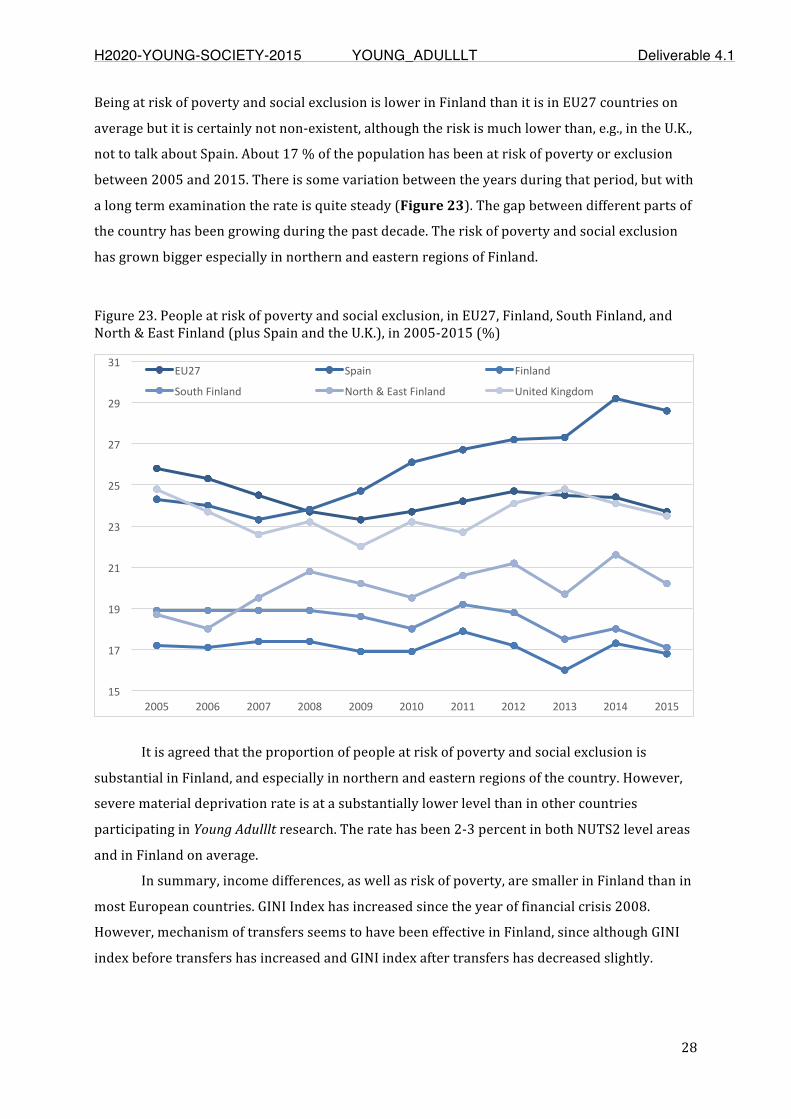
Beingatriskofpovertyandsocialexclusion is lower inFinlandthan it is inEU27countriesonaverage.About17%ofthepopulationhasbeenatriskofpovertyorexclusionbetween2005and2015.Thegapbetweendifferentpartsofthecountryhasbeengrowingduringthepastdecade.TheriskofpovertyandsocialexclusionhasgrownbiggerespeciallyinnorthernandeasternregionsofFinland.
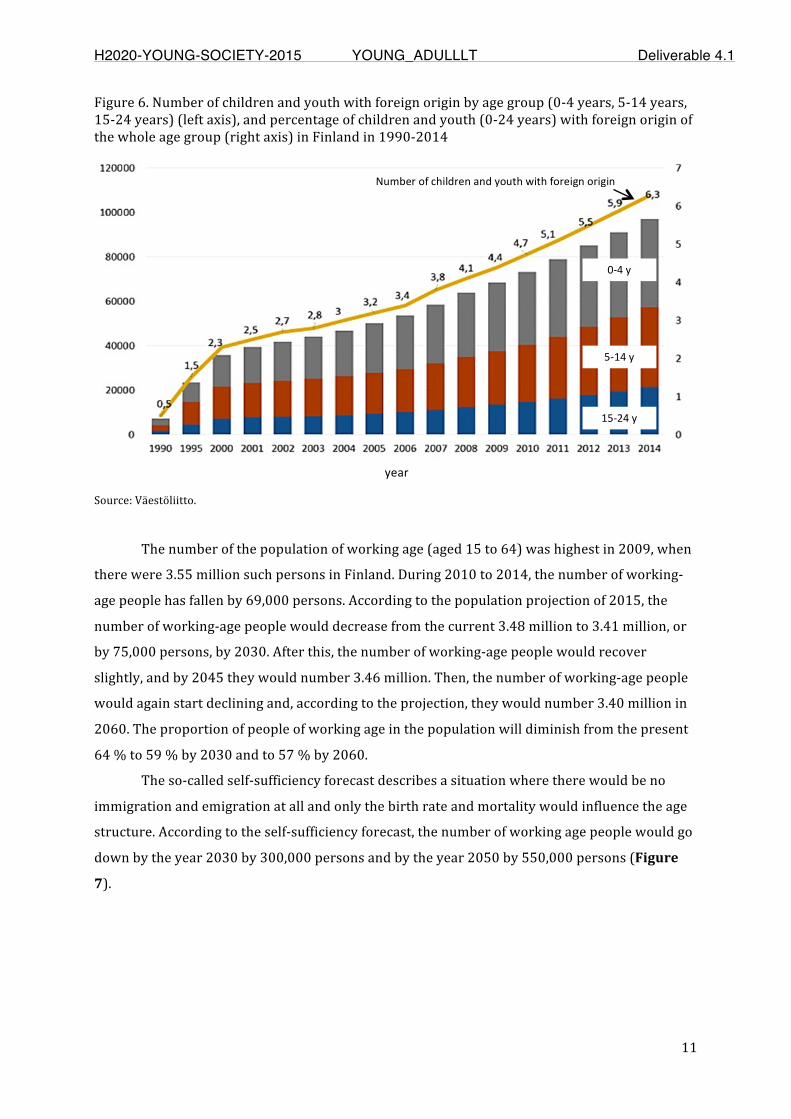
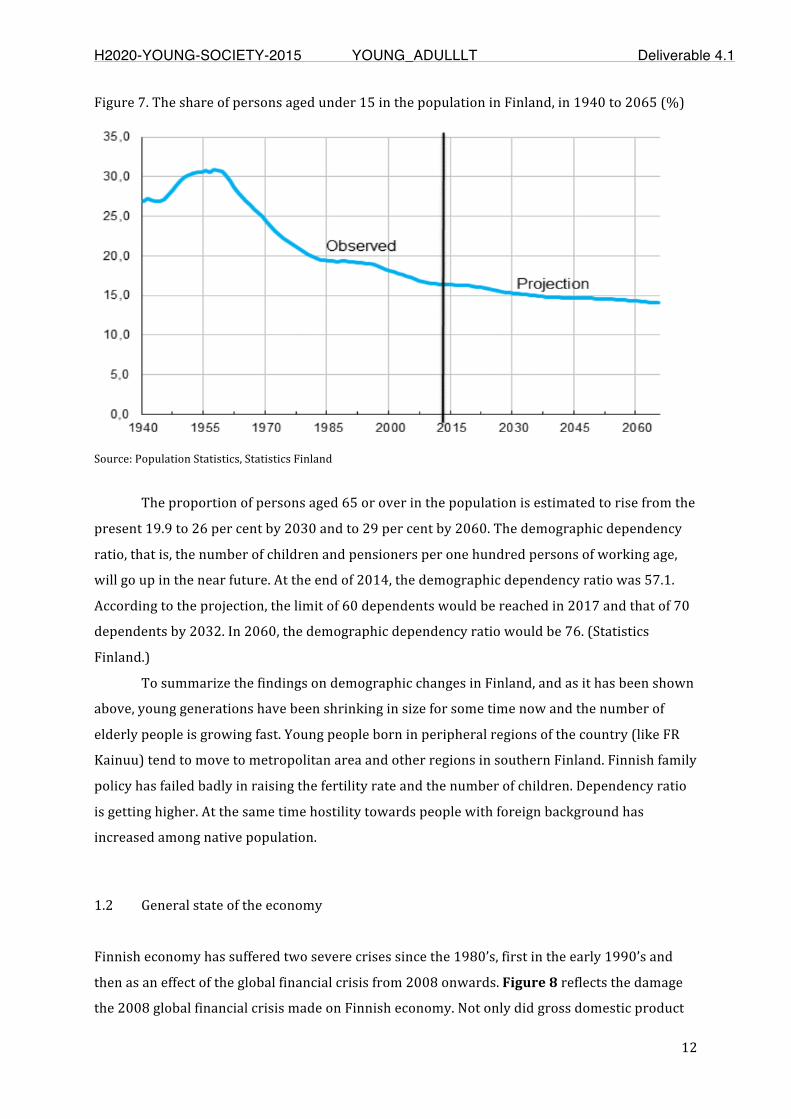
ThenumberofchildrenborninFinlandwillbelowerthaneversincethelastfamineyears 1866-68, although the size of the population has more than doubled.According to the projection, the share of people aged under 15 in the populationwould decrease to 14 per cent by 2060. The share of people with foreign
Page 11
H2020-YOUNG-SOCIETY-2015 YOUNG_ADULLLT Deliverable 4.1
Page11of31
background has been very low compared to other European countries. Hostilitytowardspeoplewithforeignbackgroundhasincreasedduringrecentyearsamongthenativepopulation.Thesedevelopmentswill have severe consequences for thedependenceratiointhefuture.
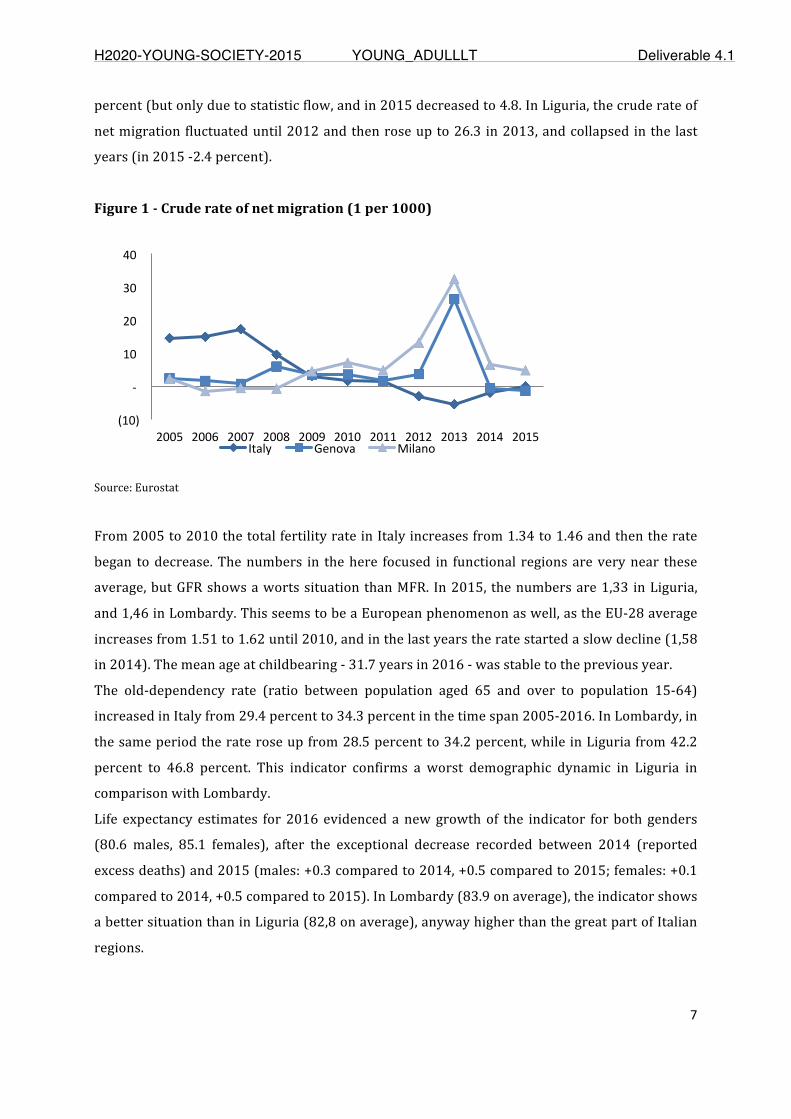
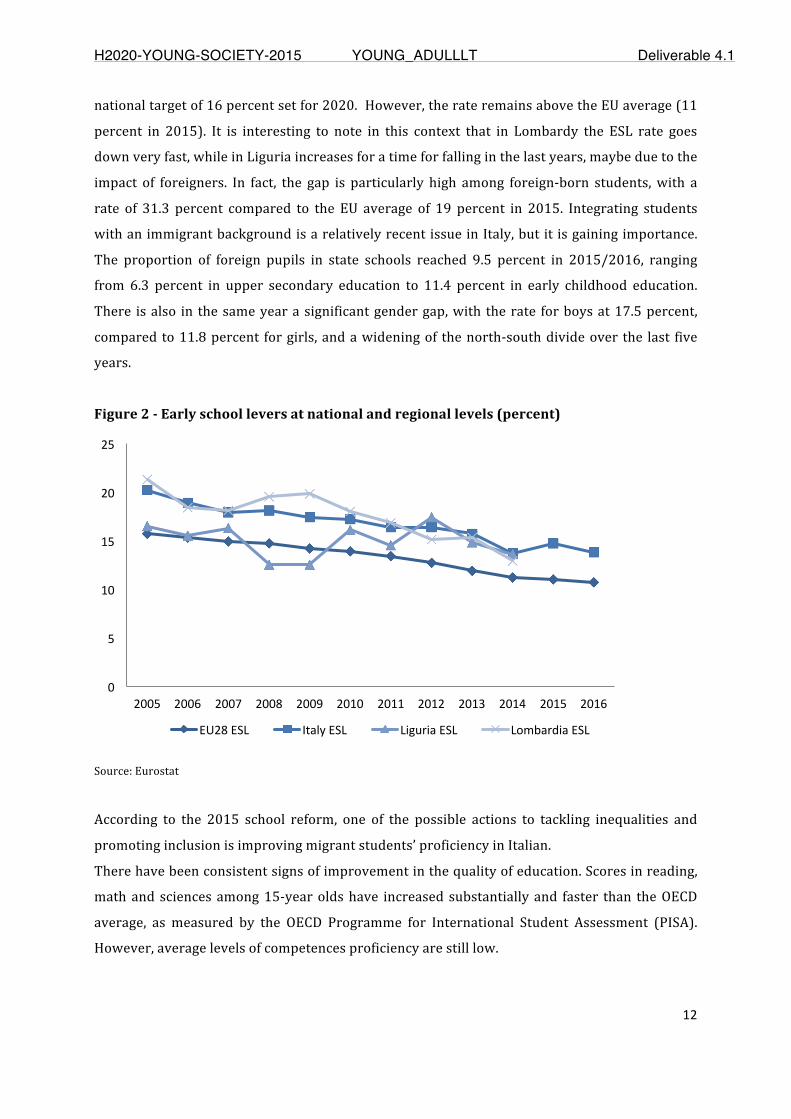
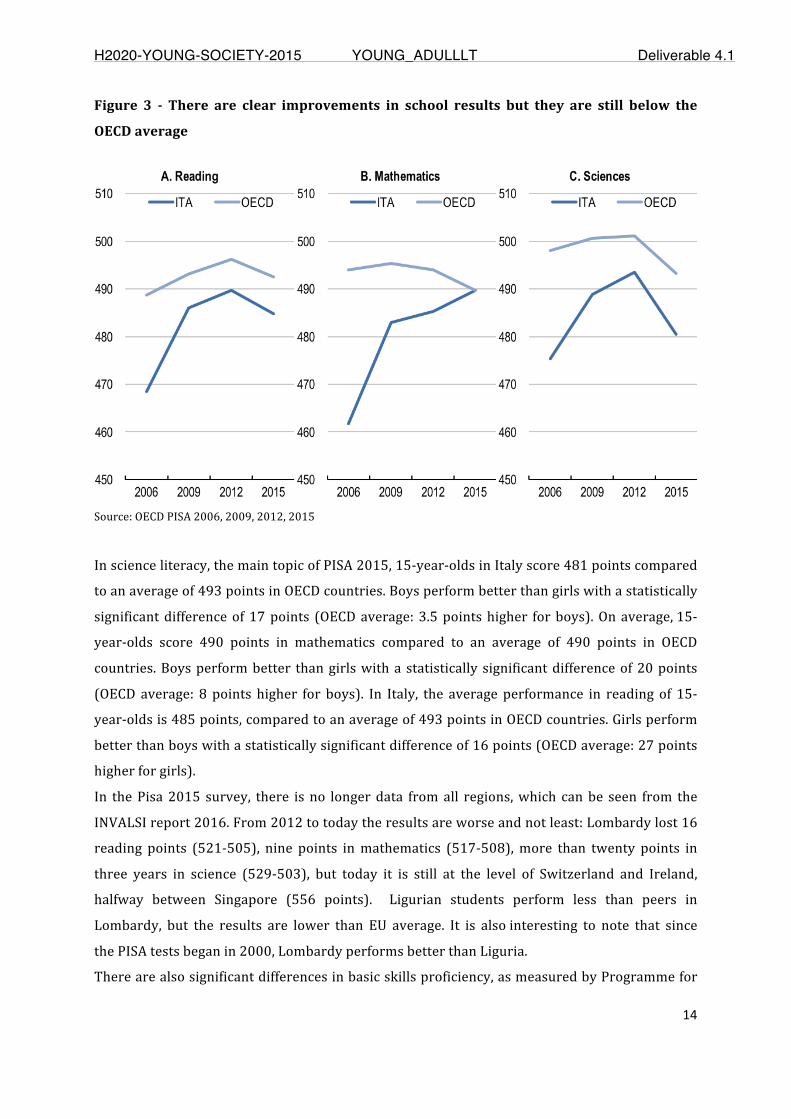
Italy:The contextual living conditions of young adults are analysed by looking atavailable indicators at national and regional (NUTS 2) level, focusing on twofunctional regions Liguria and Lombardia and integratedwithNUTS 3 datawhenavailable.Italyisoneoftheoldestcountrieswiththelowestreplacementrate.Thismakes thedemographicstabilityand thesamesystemofsocial securitymoreandmoredependentonmigrations,which,however,aretodayoneofthemostseriouschallenges. The old dependency ratio confirms a worst demographic dynamic inLiguria incomparisonwithLombardy.Productivitygrowthremainsweak,slowingthecorrectionofItaly’smacroeconomicimbalances.Ithasbeenaproblemforyears.Makingthe labourmarketmoreflexibleandreducingthe indirectcostshavebeenconsidered a pivotal part of a wider strategy aimed at reducing high structuralItalianunemployment. LombardyandLiguria remainaround theEUaveragewithregards to theGDP,butwhile the firstone is firmlyabove ItalianandEUaverage,thesecondismuchclosertotheaverage.
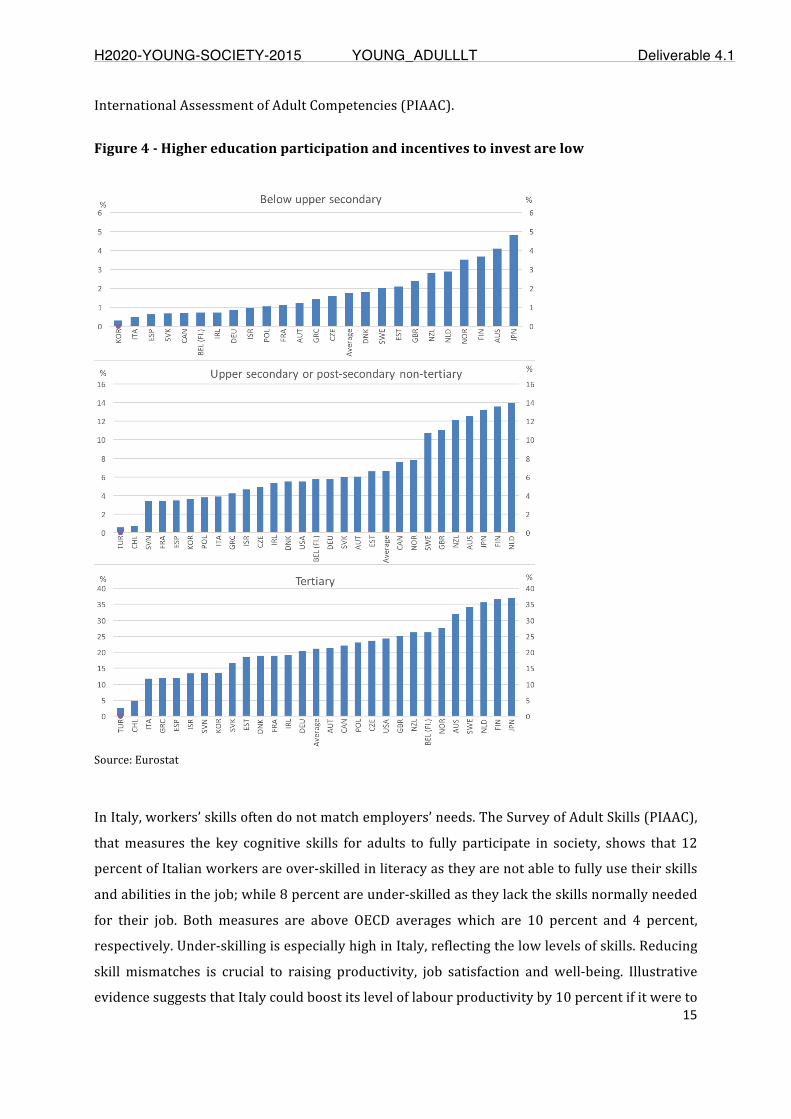
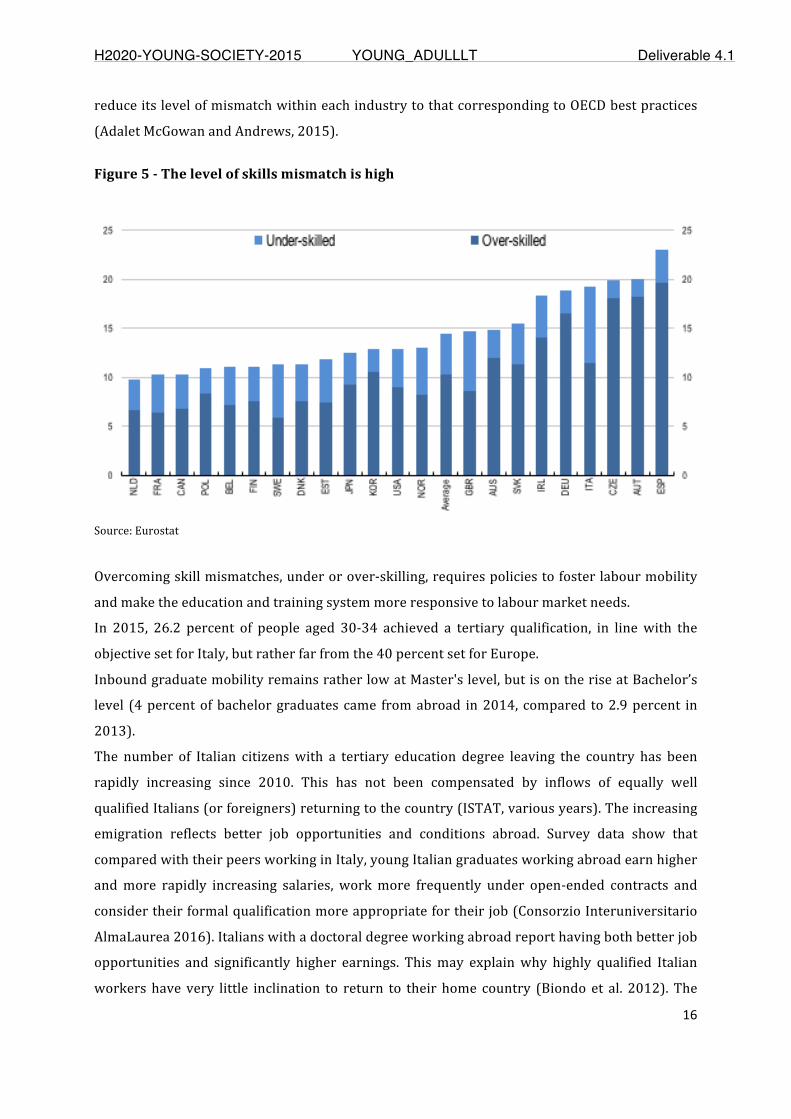
Participationinadultlearningremainsapersistentconcern,inparticularforthoseneedingitmost.Italylacksofshortdegrees(EQF5)makestheaveragerateofyoungwithtertiaryeducationlevellowerthanEUaverage(andfarfromtheLisboa2020target), but at the same time the absence of technical short degrees causes theoverqualificationofworkforce,becausetherateofdegreesthatdonotuseenoughtheirqualificationinthejobishigh(moreinLiguriathaninLombardy),andtherateof highly educated youngs that migrates is growing. Despite the gradualimprovement of the labour market, long-term and youth unemployment remainhigh.Theimplementationoftheactivelabourmarketpoliciesreform,includingthereinforcementofpublicemploymentservices, is stillatanearlystage.Also, in thepublicdebate,mismatchprevailsoverthelackingcapacityofproductivecontexttoabsorb skilled workers. In the last 15 years, profits have risen, and wages havefallen, but companies did not devote their highest profits to greater investments.Thepotentialof female labourmarketparticipationremains largelyunderutilised.Access to affordable childcare remains limited with wide regional disparities,paternityleaveisamongthelowestinEU,andtheeffectivenessofcashallowancesfor childcare has not been assessed. Young people and women are confirmedtheless protectedand needystrataof society, even if the female employment hasdeveloped over time (if less than the strong EU countries). The structure of theeconomy explains a large part of the different internal outcomes. For examples,aboutourfunctionalregions,thedatashowsthatinLiguriatheriskofpovertyand
Page 12
H2020-YOUNG-SOCIETY-2015 YOUNG_ADULLLT Deliverable 4.1
Page12of31
socialexclusionishigherthaninLombardy.
Significant barriers to competition remain in important sectors, includingprofessional services, local public services, concessions and the transport sector.Thepublicsectorisbeingreformedtotacklelongstandinginefficiencies.Newsocialpolicieshavebeenput forward to respond to the risingpoverty rate. It isunclearwhether the financial resources will be sufficient to address Italy’s povertychallenge.Activationpoliciesarenotyetwidespreadenough.TherateofpeopleatriskofpovertyorsocialexclusioniswellabovetheEUaverageandisparticularlyhighforchildren,temporaryworkersandindividualswithamigrantbackground.IngenerallivingconditionsinLombardyarebetter,andthisevaluationemergesbothfrom objective data, both from perceptions of citizens. We must consider thatLiguria is the region with the oldest population, as said heavily affected by theeconomic and demographic crisis, caused serious disturbance in educational andsocialsectors.Lessyoungpeopleinanageingcontextwithfeweropportunitiesandagreaterpartof thepopulationatriskofsocialexclusionalsocontributeto lowerlevelsofsubjectivewell-beingandlowerexpectationsforthefuture.
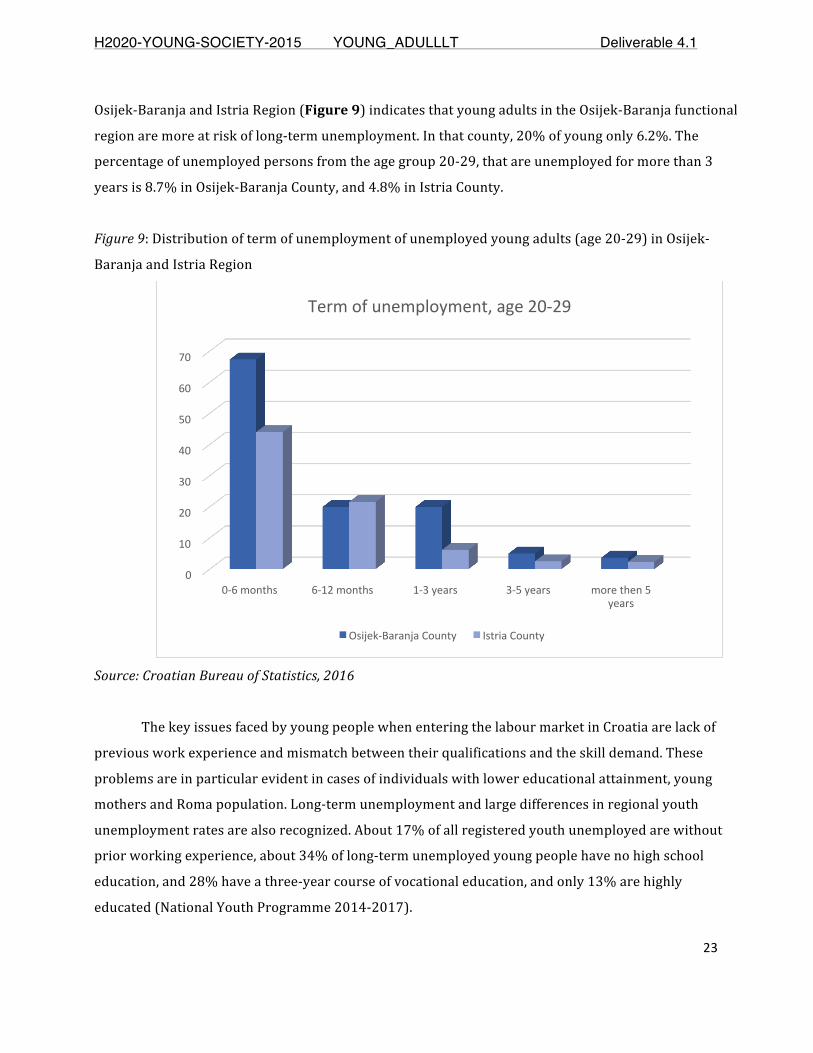
Tosummarise,thecurrentproblemsoftheItalianeconomicandsocialcontext(lowproductivity, high public debt, inefficiencies in some sectors, poor innovation,populationageing,overcrowdedsocialpolicycosts,oftenpassive)donotfavortheconditionofYoungAdults,whotoalargeextentcontinuetoliveinthefamily(78%of people aged 20-29, vs a EU average of 55,4%). Inatime of crisis such as this,familiesarethemainsafetyvalve,reducingtheautonomyofyoungpeople.
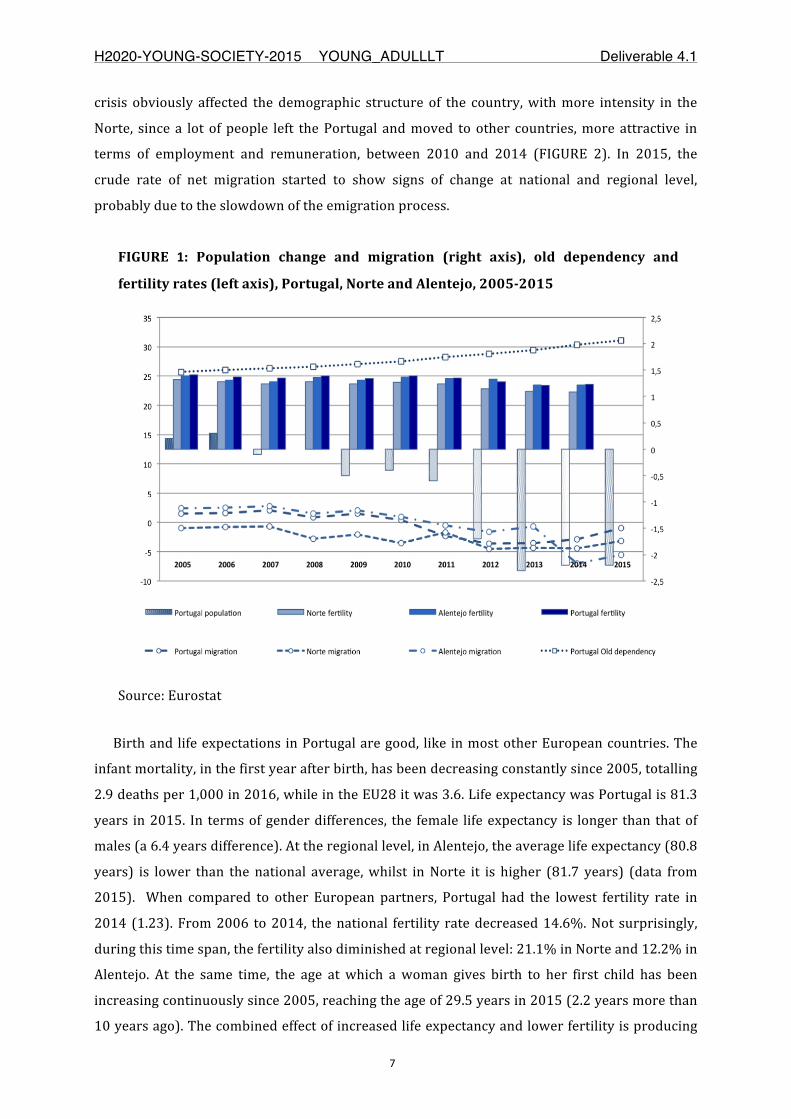
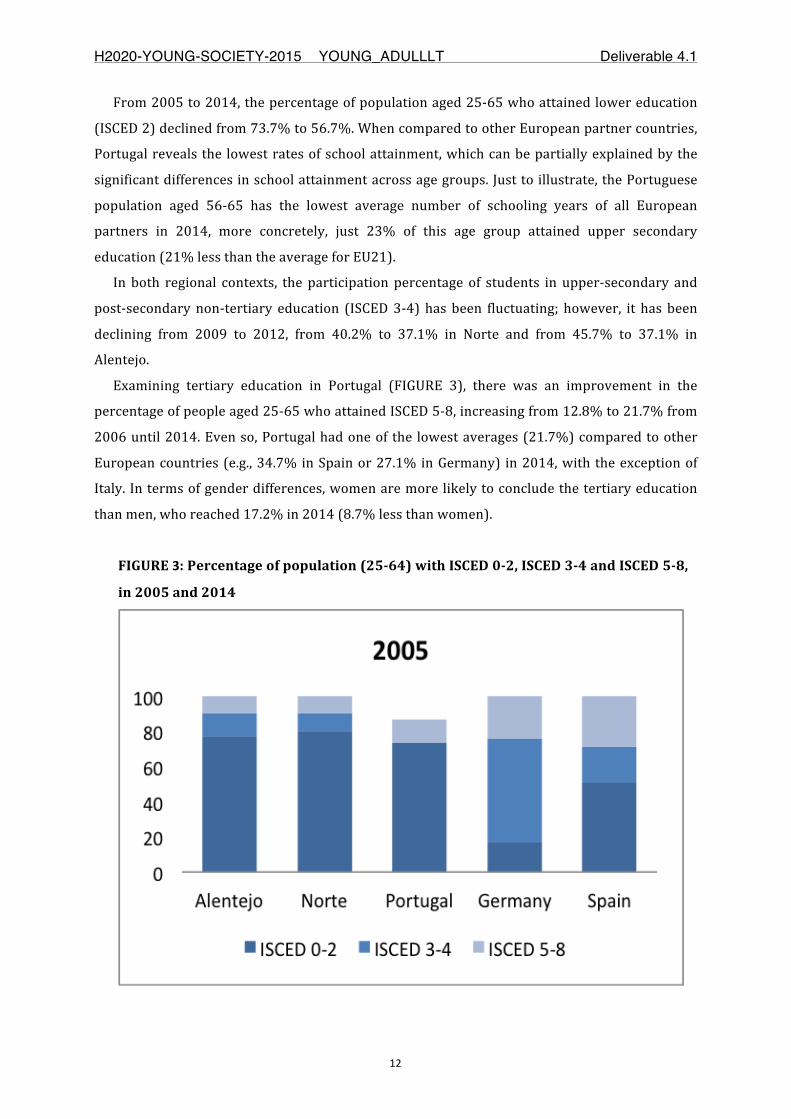
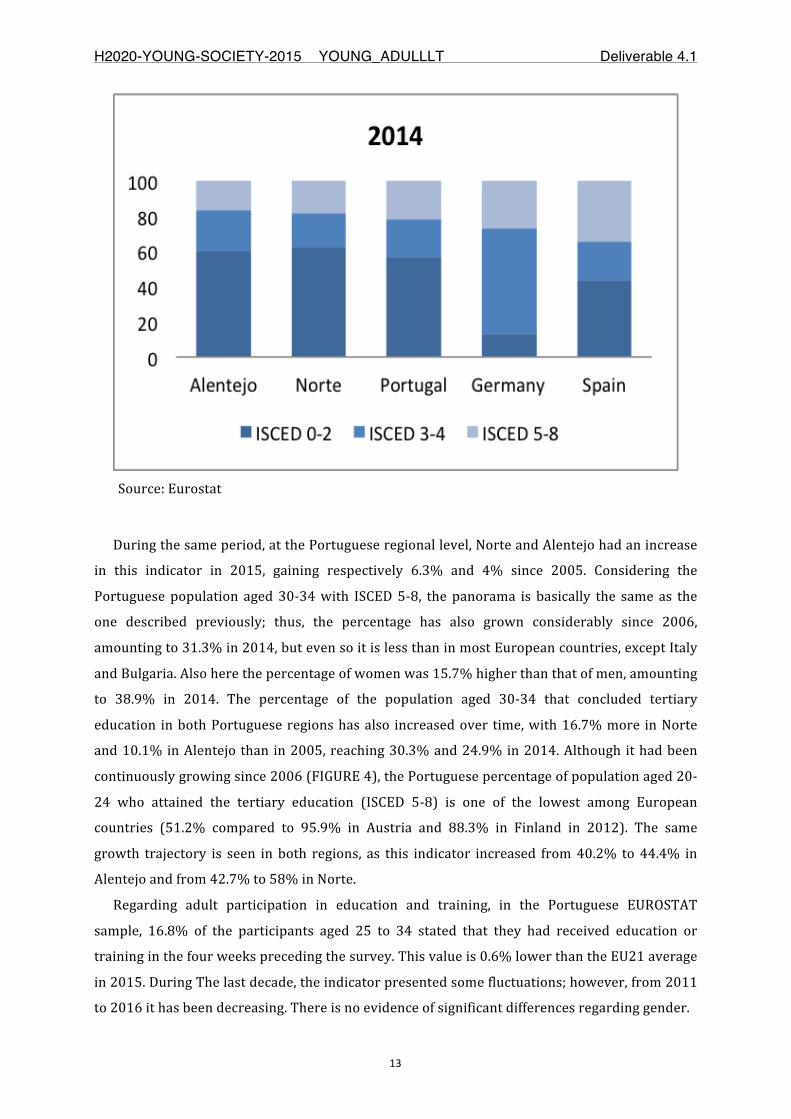
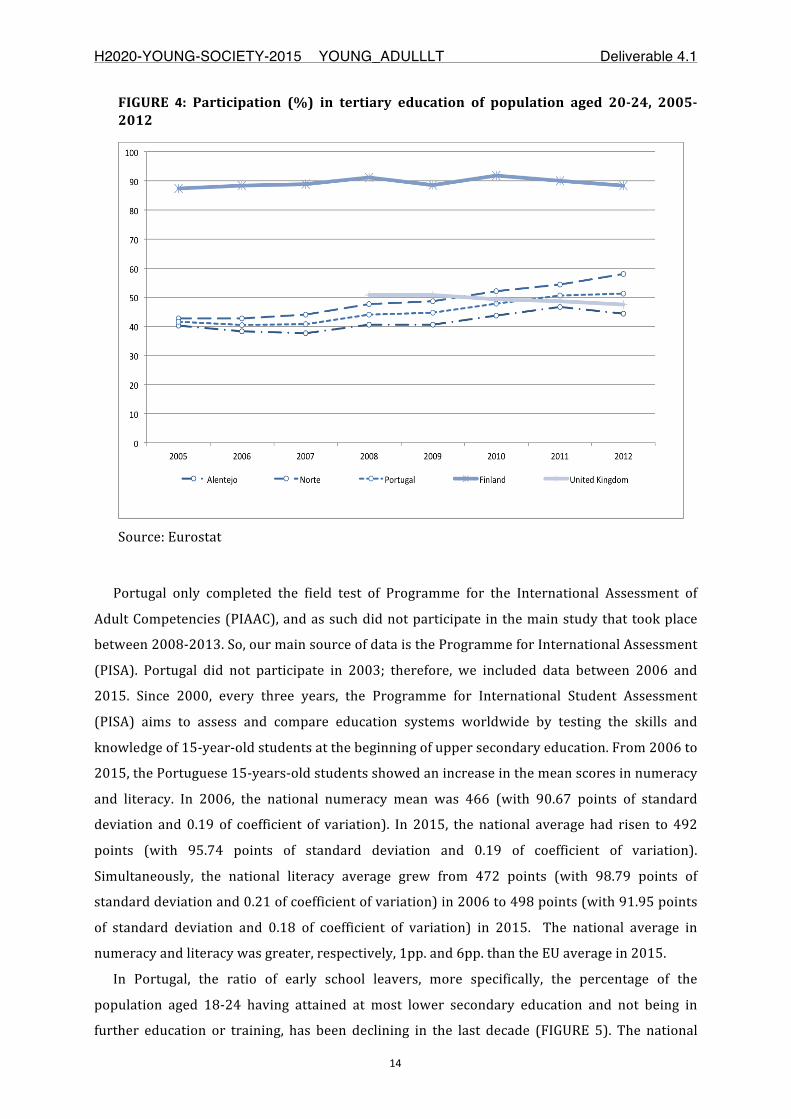
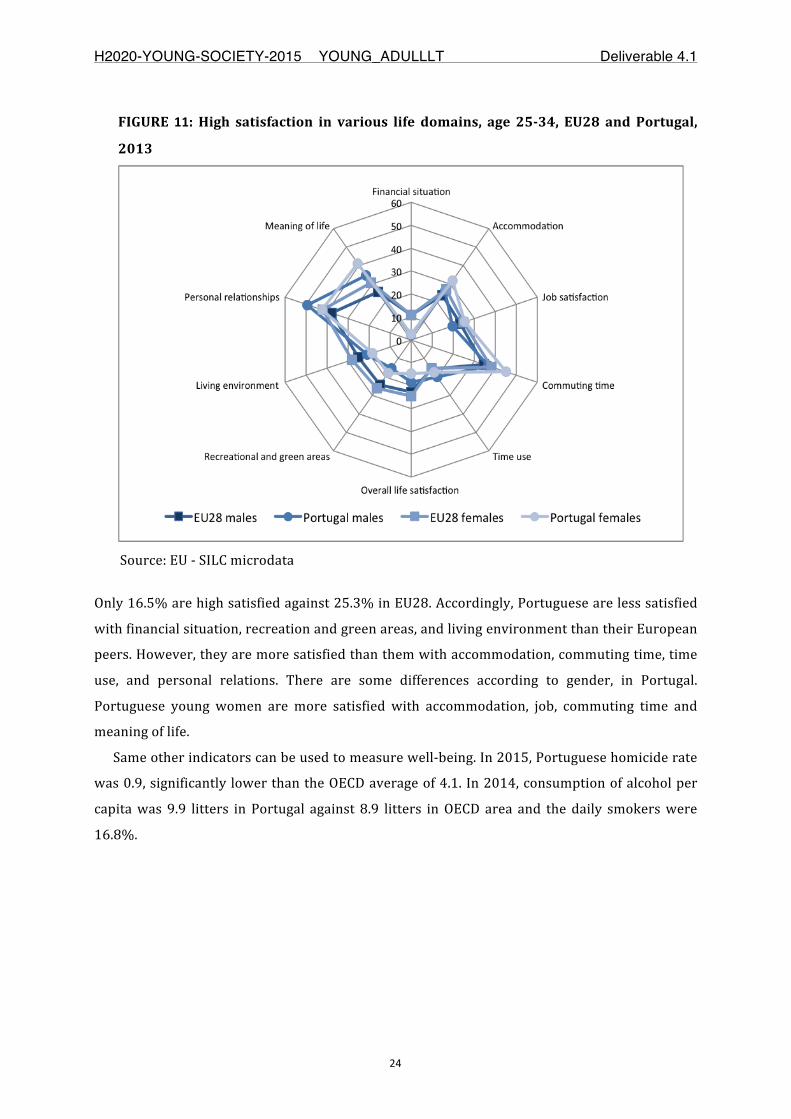
Portugal:Thecontextuallivingconditionsofyoungpeopleareanalysedbylookingatavailable indicatorsat thenationalandregional(NUTS2) level, integratedwithNUTS 3 data when available or provided by the Portuguese National StatisticsInstitute(INE)andtheDatabaseofContemporaryPortugal(PORDATA),aswellasbyotherinstitutionalsources.Twoofthemaindemographiccharacteristicarethegrowing ageingof thePortuguesepopulationboth at national and regional levels,andthehighpercentageofyoungadultsaged20-29livingwiththeirparents.Duringthetimespan,andinspiteofthefinancialcrisisandTroika’sinterventiontheGDPandtheGVAincreasedatnationalandregionallevels.However,theperformanceofthePortugueseeconomymeasuredbyGDPperinhabitantandlabourproductivityisstillconsiderablylowerthantheEU28average.
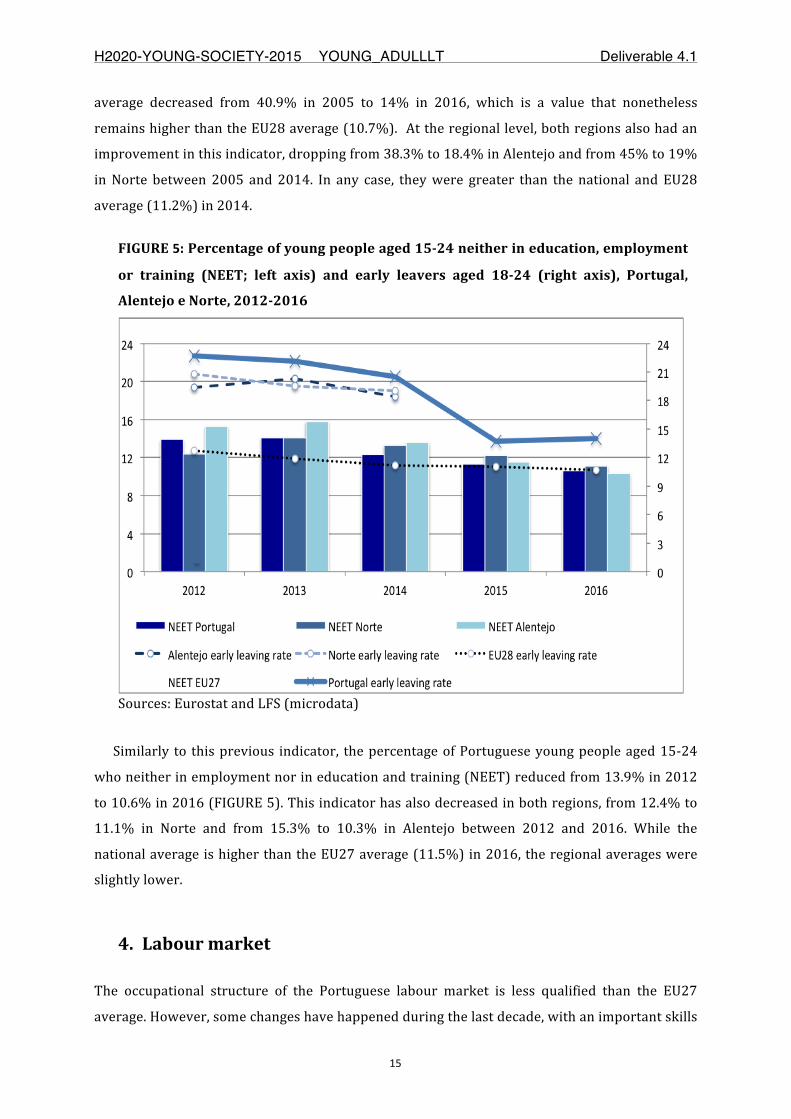
Between2005and2016,thestructureofacademicqualificationsofthePortuguesepopulationhas improved significantly bothnationally and regionally. The rates ofschoolattainmentincreasedinallagegroups,theratioofearlyschool leaversandtherateofNEETdeclinedsignificantly.However,whencomparedtootherEuropeanpartnercountries,Portugalstillrevealsthe lowestratesofschoolattainmenteven
Page 13
H2020-YOUNG-SOCIETY-2015 YOUNG_ADULLLT Deliverable 4.1
Page13of31
amongtheyoungergenerations.
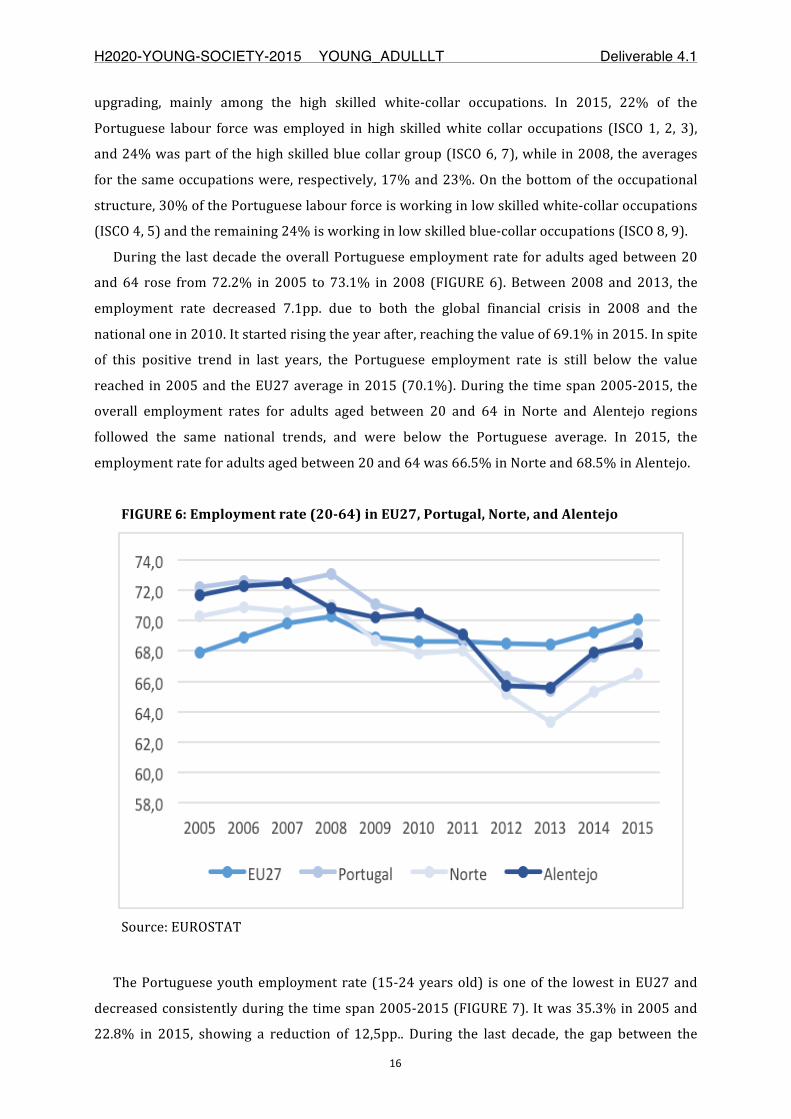
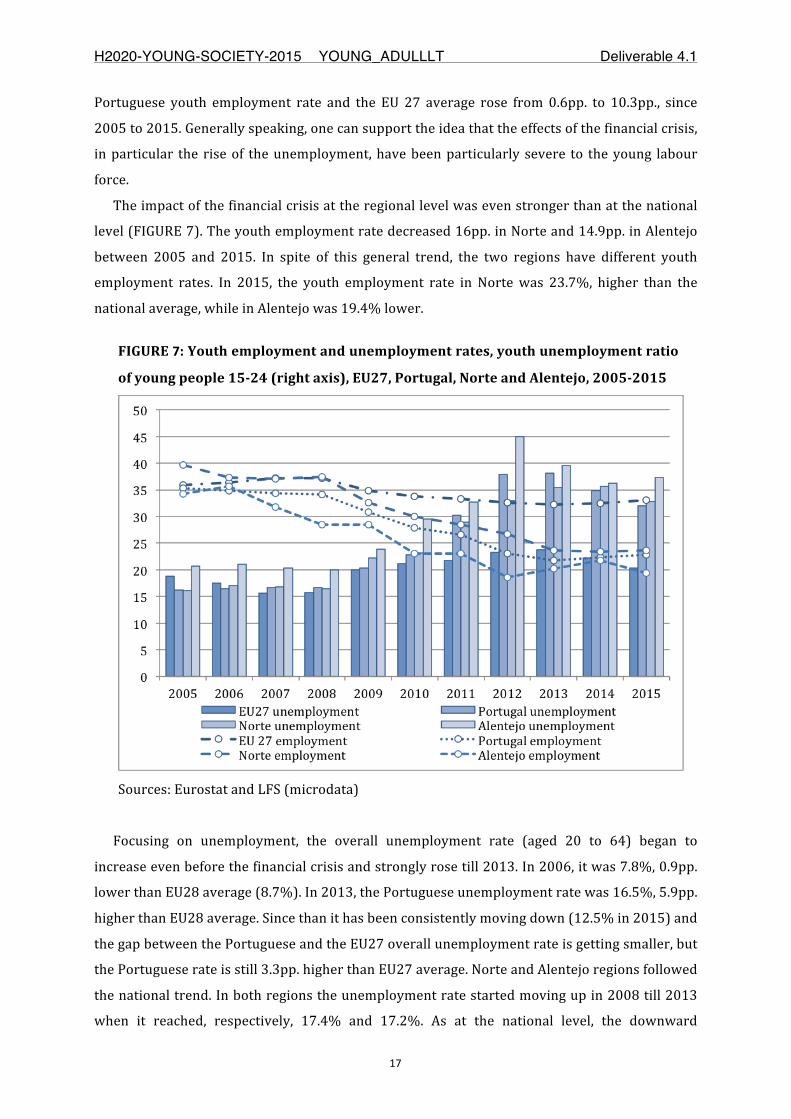
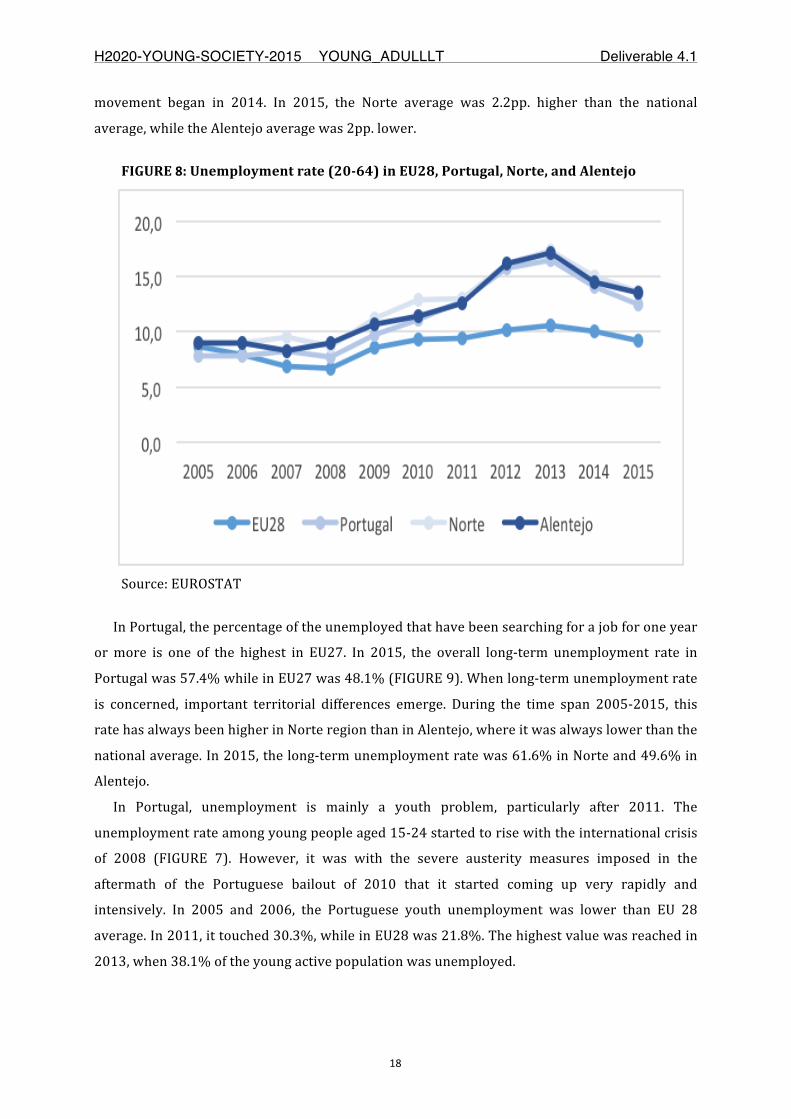
In spite of an important skills upgrading during the decade, the occupationalstructureofthePortuguese labourmarket is lessqualifiedthantheEU27average.The Portuguese youth employment rate (15-24 years old) is one of the lowest inEU27 and decreased consistently during the time span 2005-2015, showingimportantdifferencesat regional level.Unemployment ismainlyayouthproblem,particularly after 2011. In 2015, the Portuguese youth unemployment rate wasmorethanthedoubletherateofpeopleagedbetween20and64yearsandhigherthan the EU28 average. Once again, significant regional differences can be found.Generally, the Norte labour market seems to be more youth-friendly than theAlentejoone.
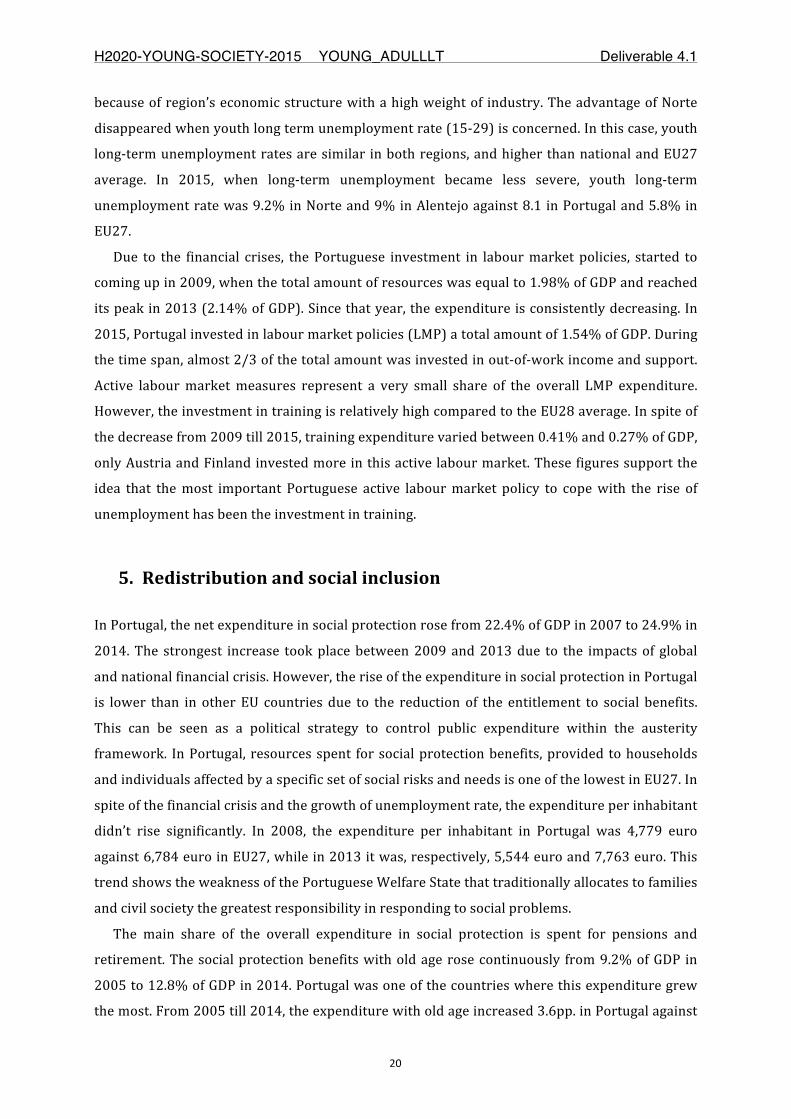
InPortugal, resourcesspent forsocialprotectionbenefits,provided tohouseholdsand individuals affected by a specific set of social risks and needs is one of thelowestinEU27.Inspiteofthefinancialcrisisandthegrowthofunemploymentrate,theexpenditureper inhabitantdidnotrisesignificantly,andtheexpenditurewithfamilyandchildrenandsocialexclusionare thosewere theunderfunding ismoresevere when compared with EU27. The income inequality started to increasestronglyafter2011,transformingPortugalinoneofthemostunequalcountriesinEU.
Duringthetimespan2005-2015,self-perceivedhealthinPortugalhasalwaysbeenlowerthantheEU27average.PortugalwasalsothecountryparticipatinginYOUNGADULLLT project with the lowest self-perceived health. In general, Portuguesepeopleagedbetween25-34yearsarecomparativelylesssatisfiedwiththeirlives.
ThedatashowthatthelivingconditionsofyoungpeopleinPortugalareworsethantheEU28average.TheyalsorevealsomeregionaldifferenceswhichpointtothefactthatthelivingconditionsareslightlybetterinNorte,whereValedoAveis locatedthaninAlentejowhereLitoralAlentejano’syoungpeoplelive.
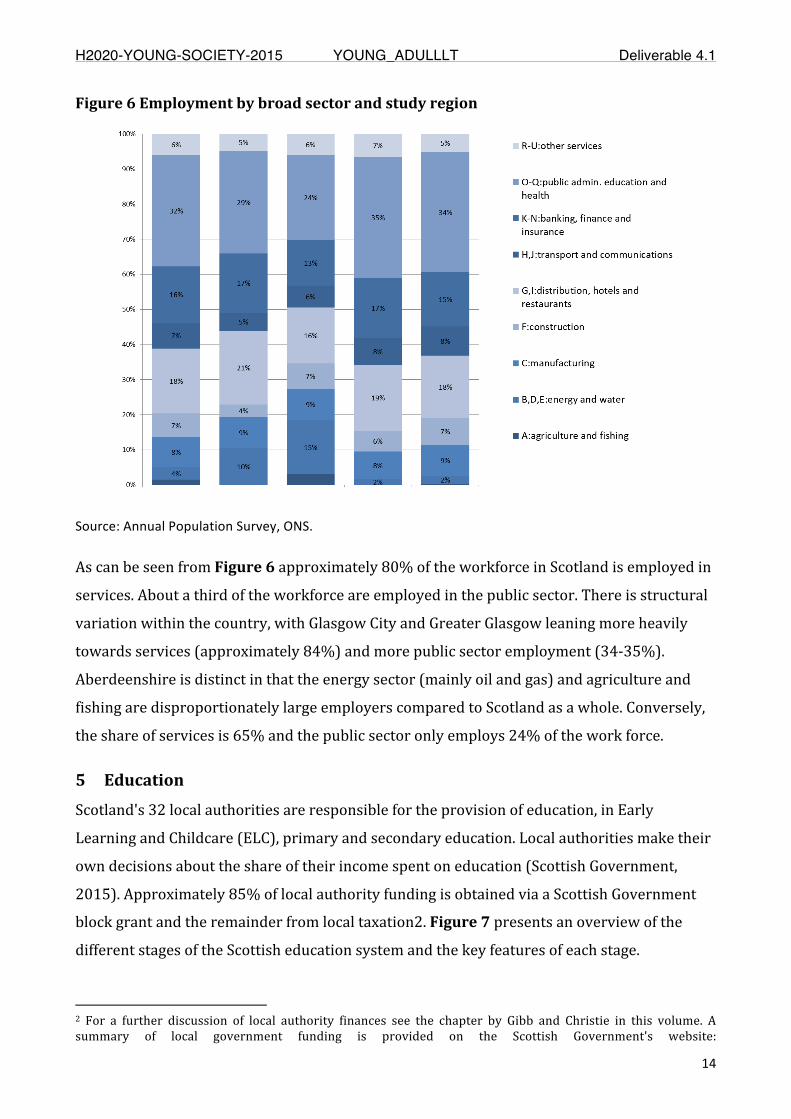
Scotland: This report analyses the contextual living conditionsof youngadults intwofunctionalregionswithinScotland,theGlasgowCityRegionandAberdeenshire.It iswillwell-known in Scotland that risk profiles of young adults correlatewithsocioeconomicbackground,asforinstancemanifestedintheeducationattainmentgradientandaccesstouniversities,issuesthatarethesubjectofanongoingpublicdebate. The analysis presented here, also illustrates regional differences acrossseveraldomains.
Fortuitously, the four NUTS2 statistical regions in Scotland represent anapproximate fit with major metropolitan areas of Glasgow, Edinburgh andAberdeen,inadditiontotheHighlandandIslands.Therefore,usefulinsightscanbe
Page 14
H2020-YOUNG-SOCIETY-2015 YOUNG_ADULLLT Deliverable 4.1
Page14of31
gained from using harmonised indicators. However, many policies operate at asmallerspatialscaleandthereforesuchaggregatedataisoftenunsatisfactory.TherearegoodexamplesofrichdatasetsmaintainedataUK-level,butalsospecificallyforScotland.However,thesearelimitedintermsoftimelinessandabilitytoregionaliseresults. Efforts are beingmade to rationalise, link and exploit administrative datasourcesinScotlandmoreeffectively,butthisisstillatanearlystage.
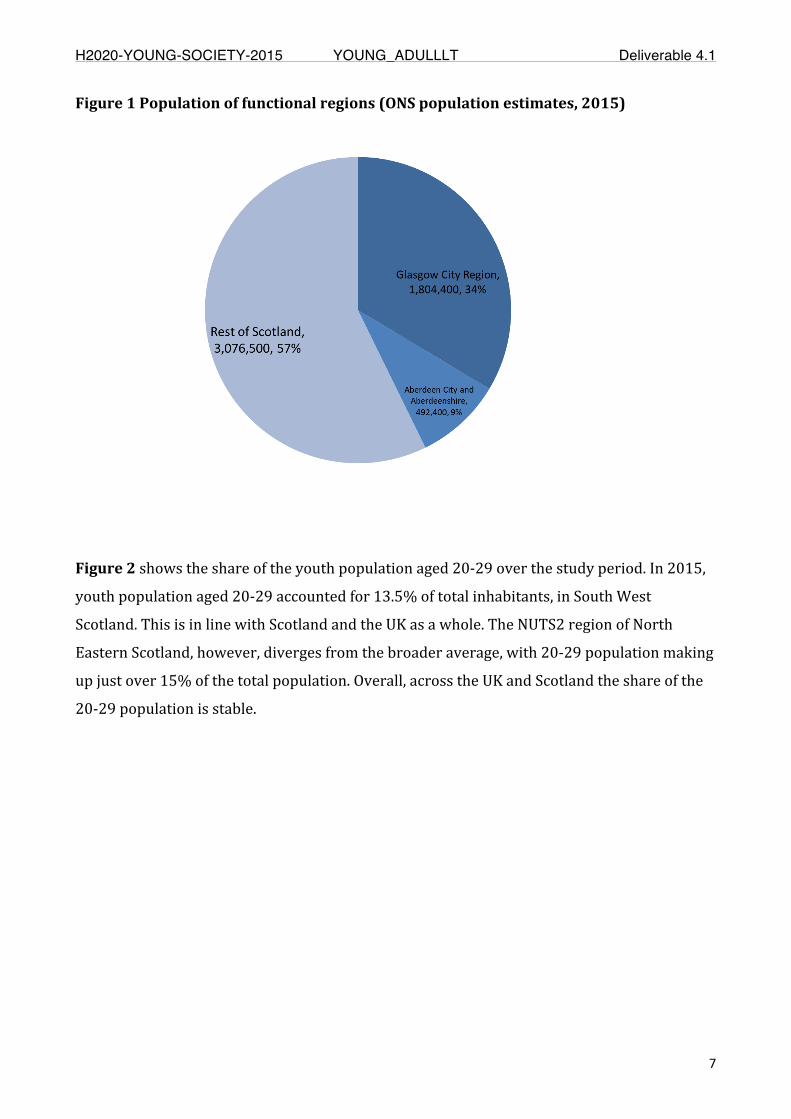
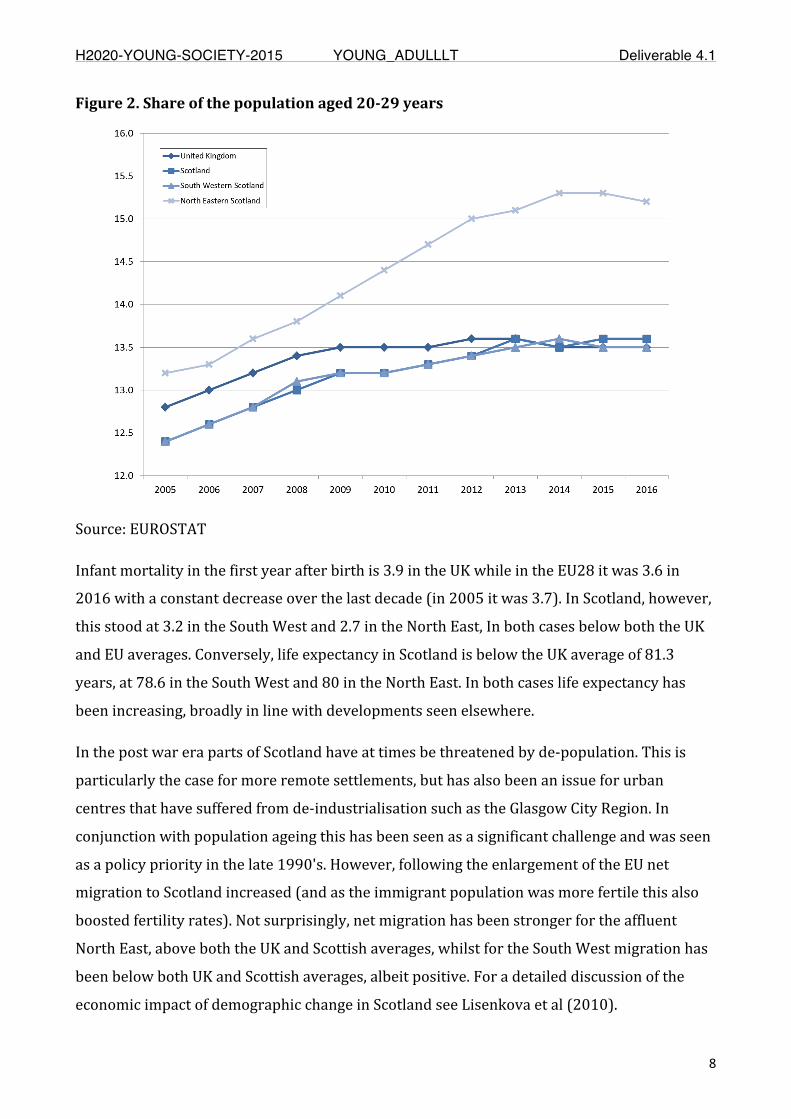
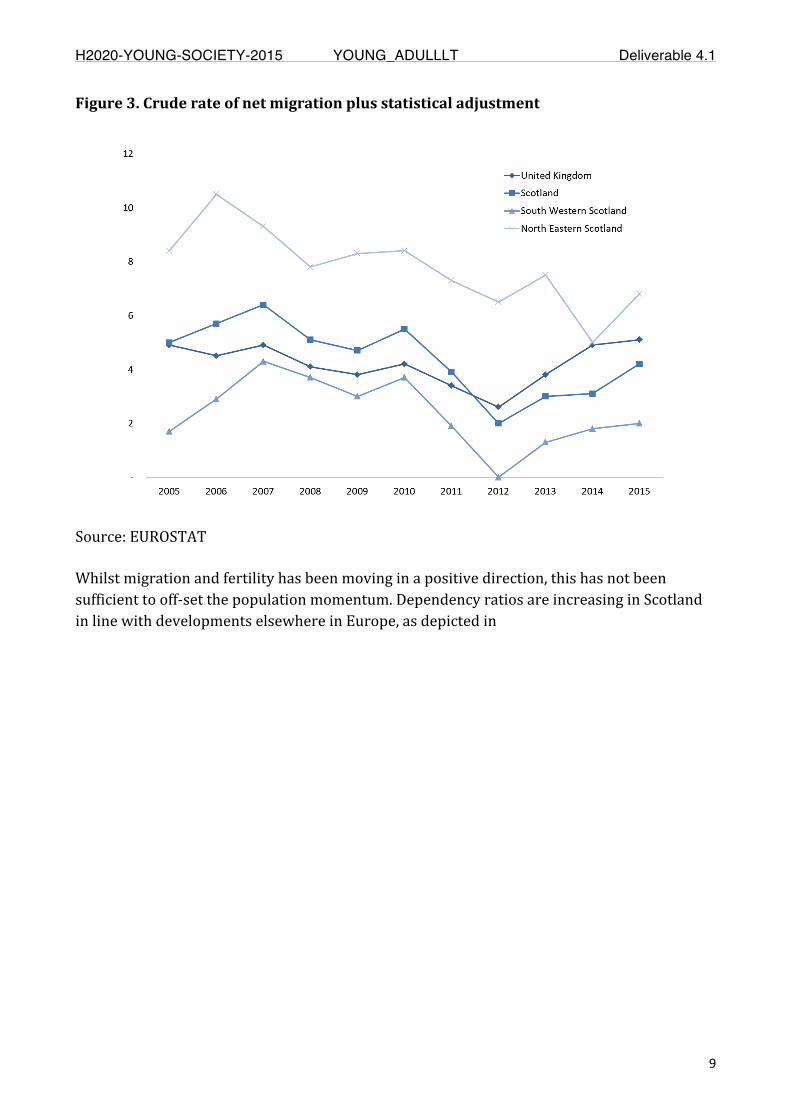
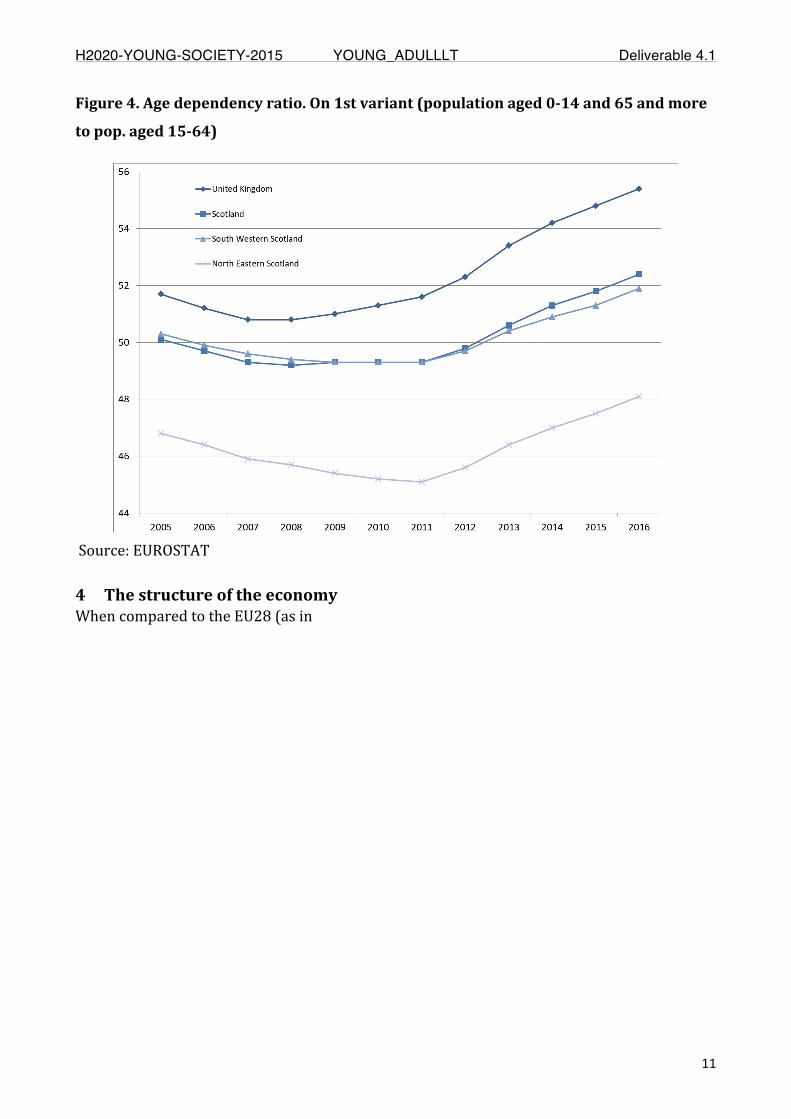
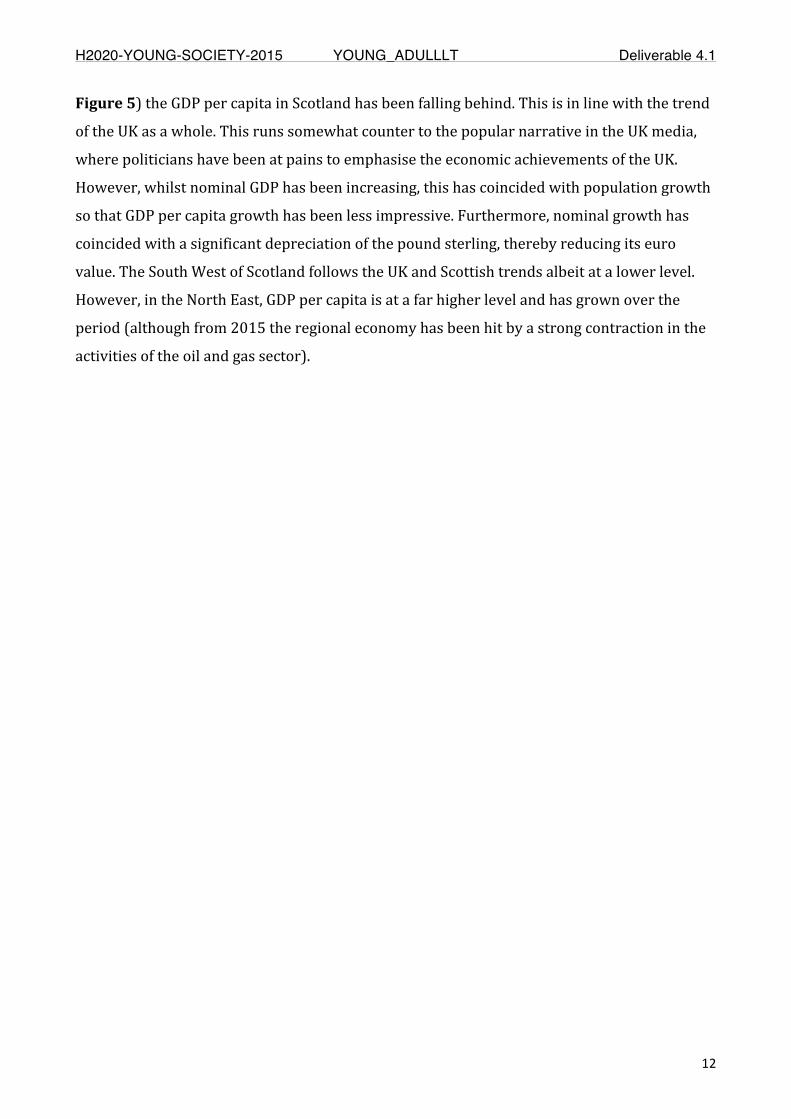
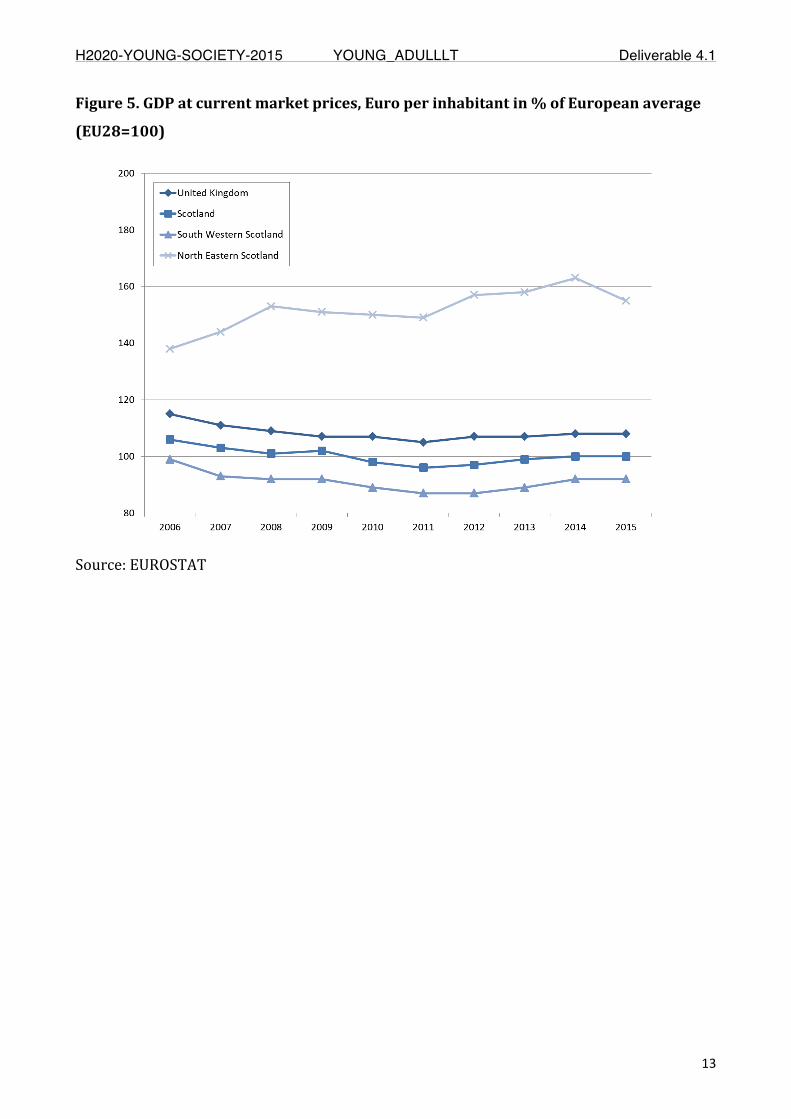
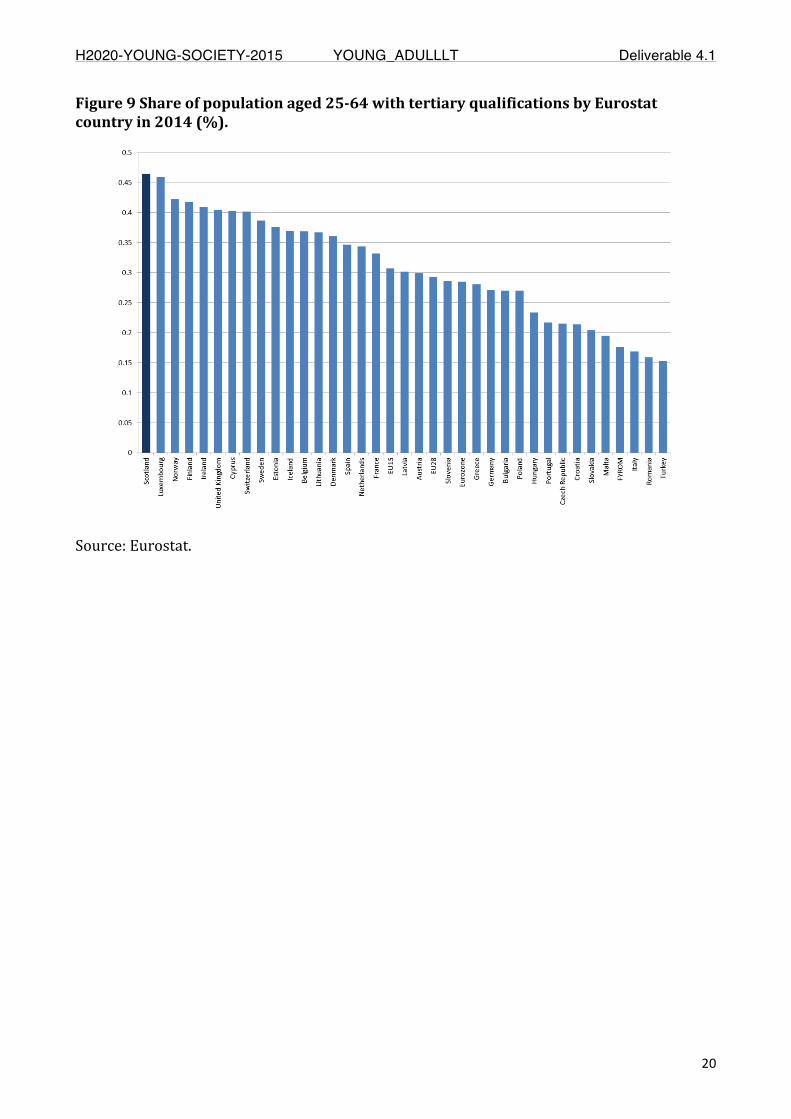
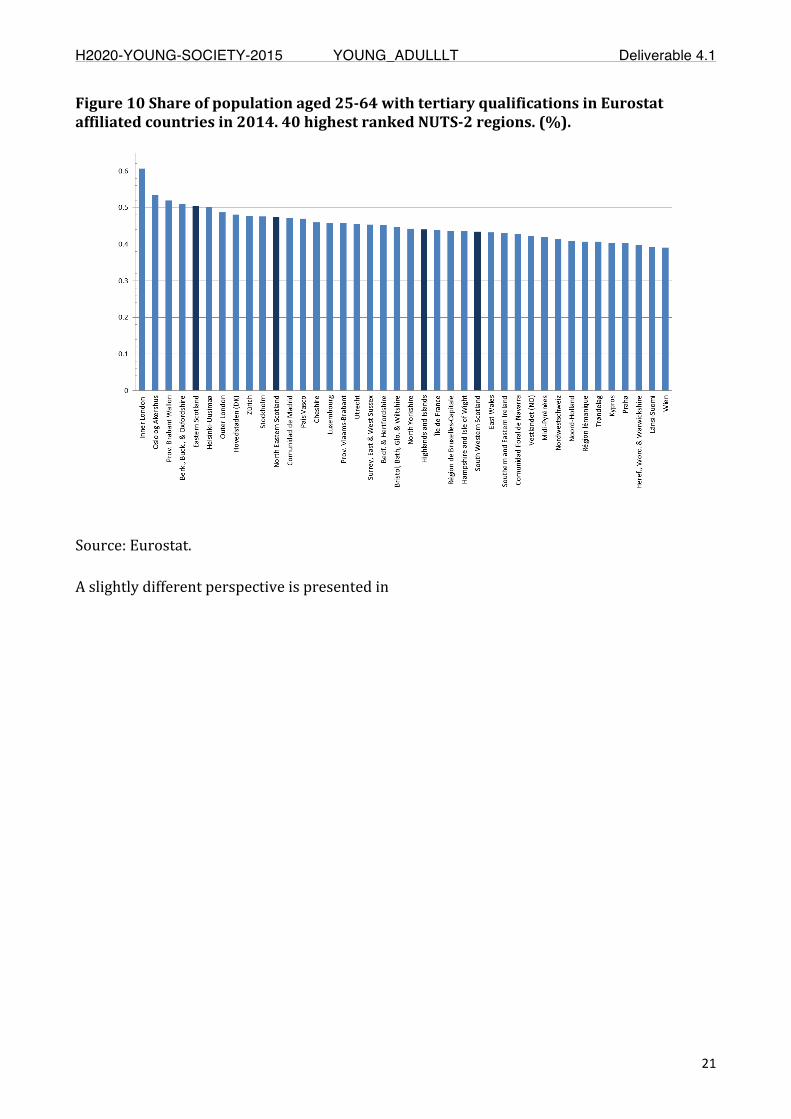
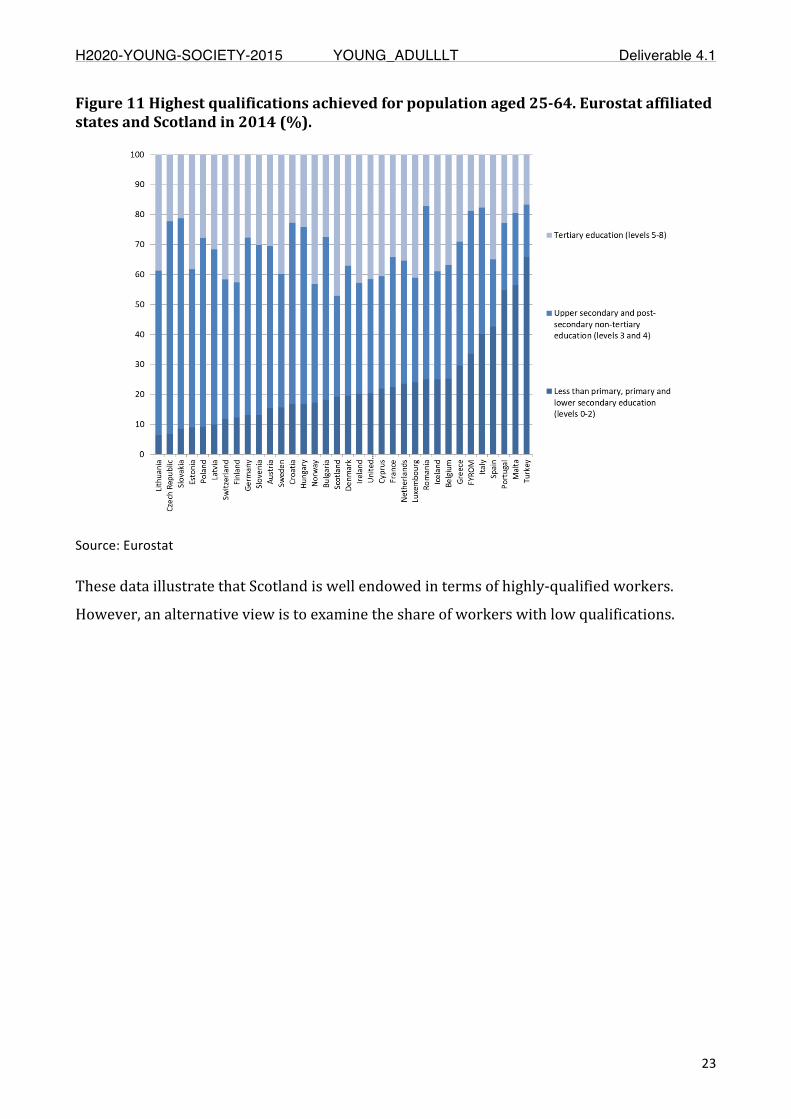
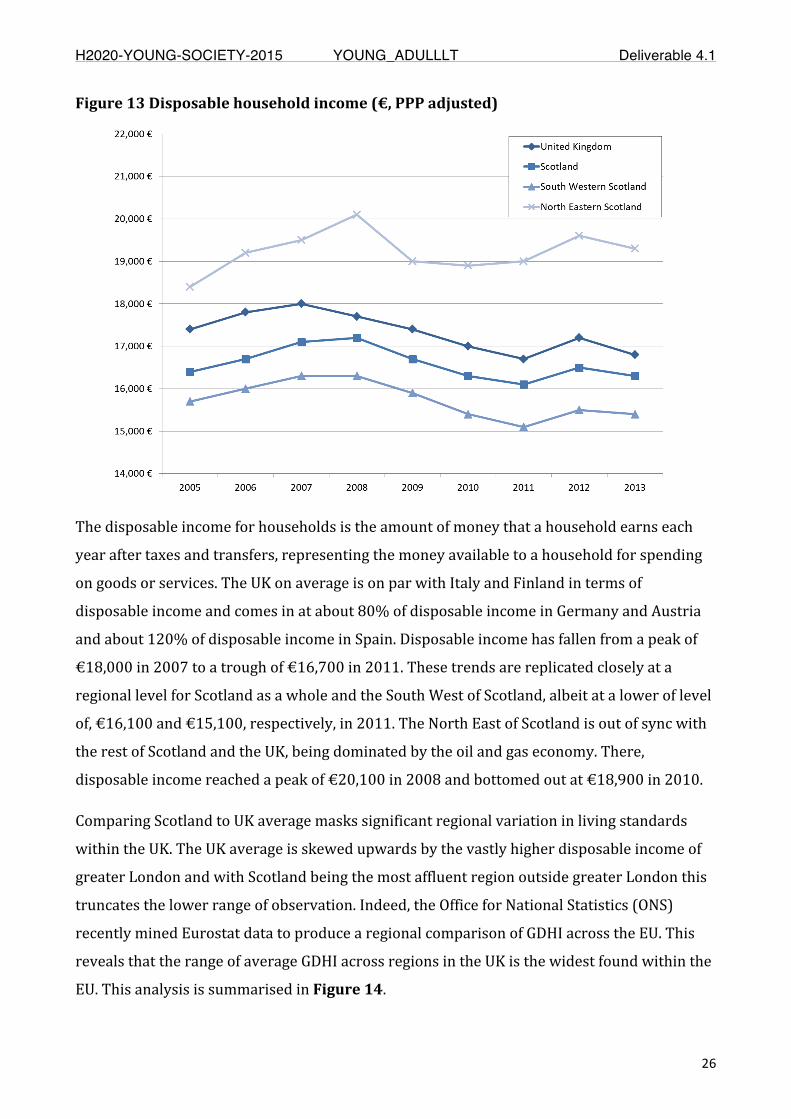
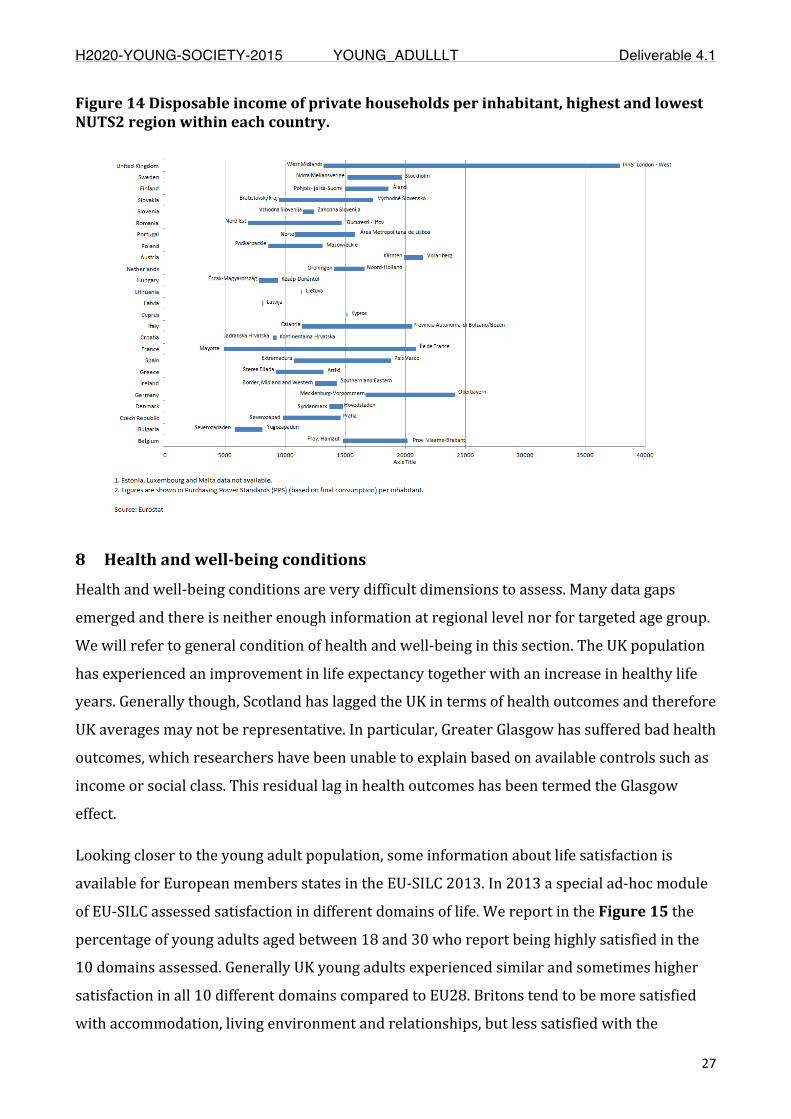
Population:Scotlandhasarisingdependencyration,albeitfromalowerlevelthanthe UK. Greater Glasgow is in line with Scottish average, but Aberdeenshire isstarting froma lowerbase.Economy:GDPpercapita inScotland is slightlybelowthe UK average. Whilst greater Glasgow is further below this average,Aberdeenshire,withitsoilandgasindustry,isoneoftheUK'smostaffluentregions.Youthemployment inScotlandonaverage is slightly stronger than in theUKasawhole and markedly so in Aberdeenshire. On the whole, the UK comparesfavourablytoanEUaverage.Educationandlabourmarket:Intermsoftheshareoftertiary education in the working age population, Scotland is the most educatedcountry in Europe. Overall, theUK compares favourably on thismetric. However,thisclaimisdoubtfulwhentheshareoflessqualifiedworkersisexamined.Inthisregards Scotland, and the UK, compare unfavourably with Eastern Europe andGerman-speaking countries. Social protection: Average household disposableincome (GDHI) in Scotland was just over EUR 16,000 in 2013, which is aboutEUR500belowtheUKaverage.GreatGlasgowtrails theScottishaveragebyaboutEUR1000,whenAberdeenshireisapproximatelyEUR3,000abovetheaverage.
Overall, regional variation inGDHI is starkacross theUKand the rangeof spatialinequalityisfarhigherthaninanyotherEuropeancountry.ThiscastsdoubtontheanalyticalmeritofbenchmarkingScotlandagainstaUKaverage,astheUKaveragemasks a stark contrast between the South East of England and the rest. Grossdisposablehousehold income in InnerLondon,where it ishighest, isnearly threetimesthatoftheWestMidlands,whereitislowest.
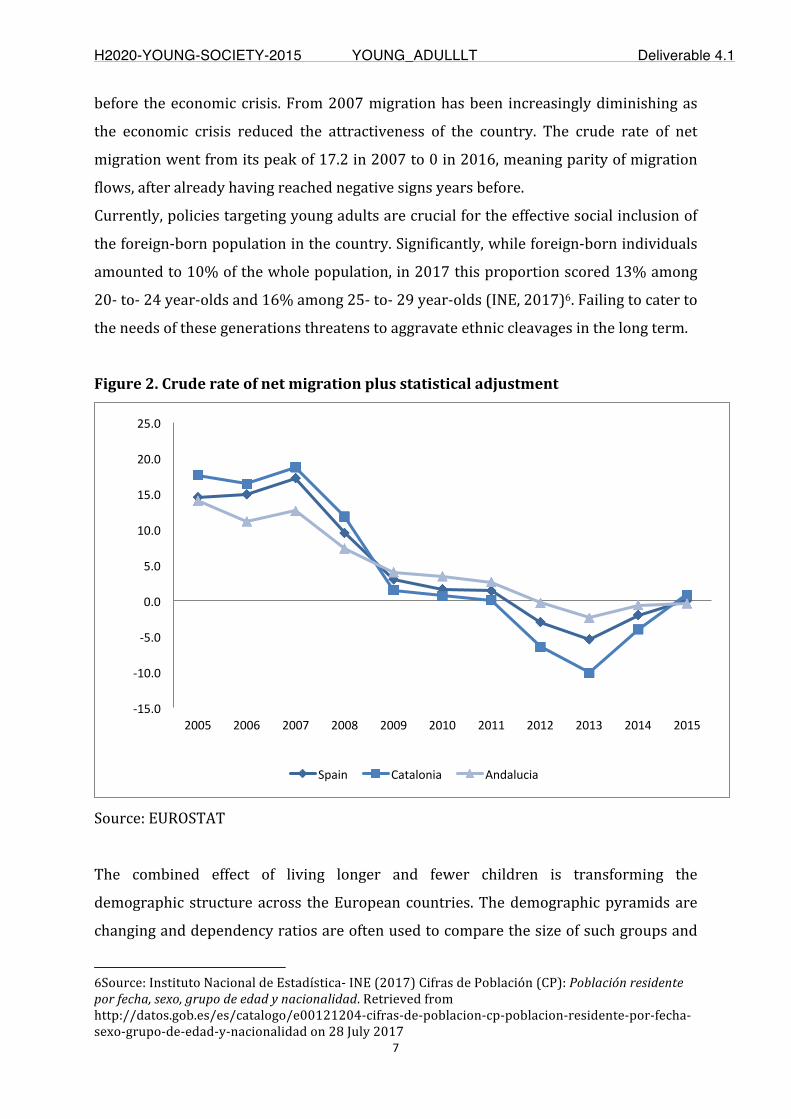
Spain: The contextual living conditions of Spanish young people are analysed bylookingatnationalandregional (NUTS2) indicators, integratedwithNUTS3datawhenavailableorprovidedby localsources.Limitations in theavailabilityofdataproduceascatteredoverviewoftheyoungadultslivingconditions.Inthissense,thepresentreportraisesawarenessofhugechallengesforfurtherresearchandpolicyevaluation.Limitedinformationconstrainsthescopeofacademicdebates,butalsothe partnership between the local administrative units both in Andalusia andCatalonia represents a huge challenge ahead. Although this briefing paper,unfortunately,cannotprovidedetailsatthelevelsofautonomouscommunitiesandNUTS3, a brief glance at data for the whole of Spain inspires a few generalconclusionsonthesocialconditionsofyoungadults.Themainresultsfromavailable
Page 15
H2020-YOUNG-SOCIETY-2015 YOUNG_ADULLLT Deliverable 4.1
Page15of31
dataaresummarizedbelow.
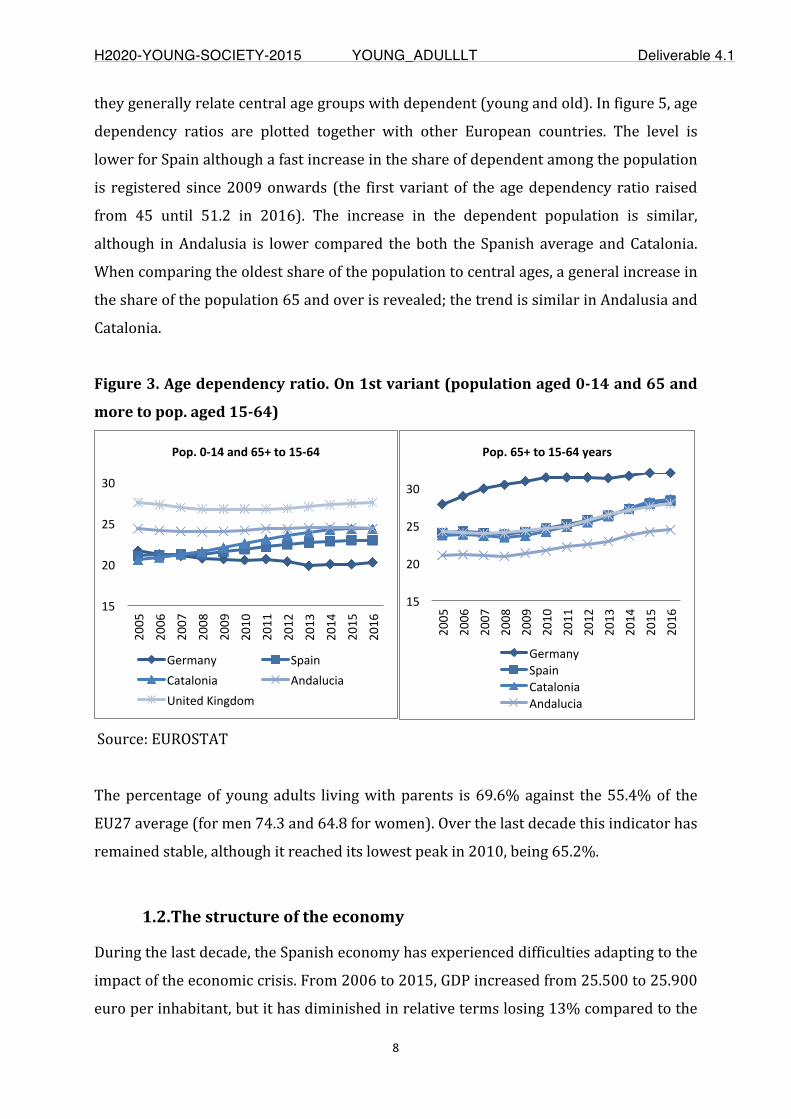
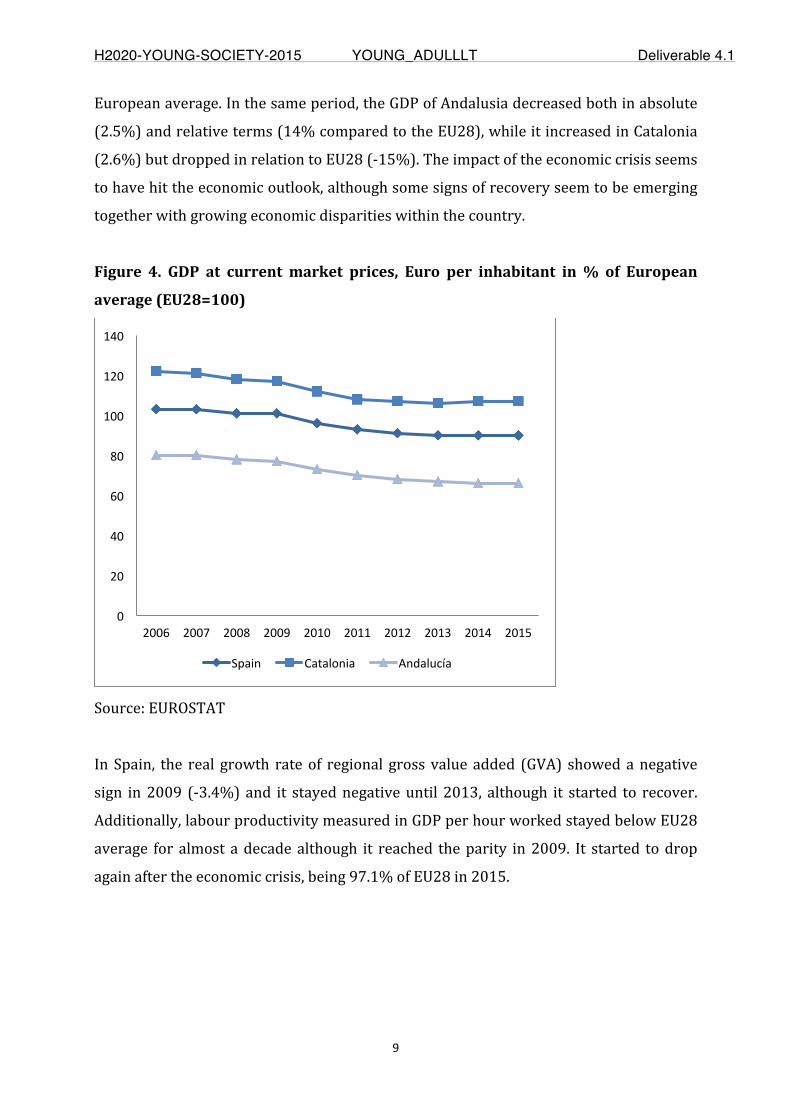
The impact of the economic crisis seems to have hit the general conditions ofSpanish economy, although some signs of recovery seem tobe emerging togetherwithgrowingsocio-economicdisparitieswithin thecountry.SpanishdemographicdependencyratioislowercomparedtoEUpartners,althoughafastincreaseintheshareofdependentamongthepopulationisregisteredsince2009onwards.
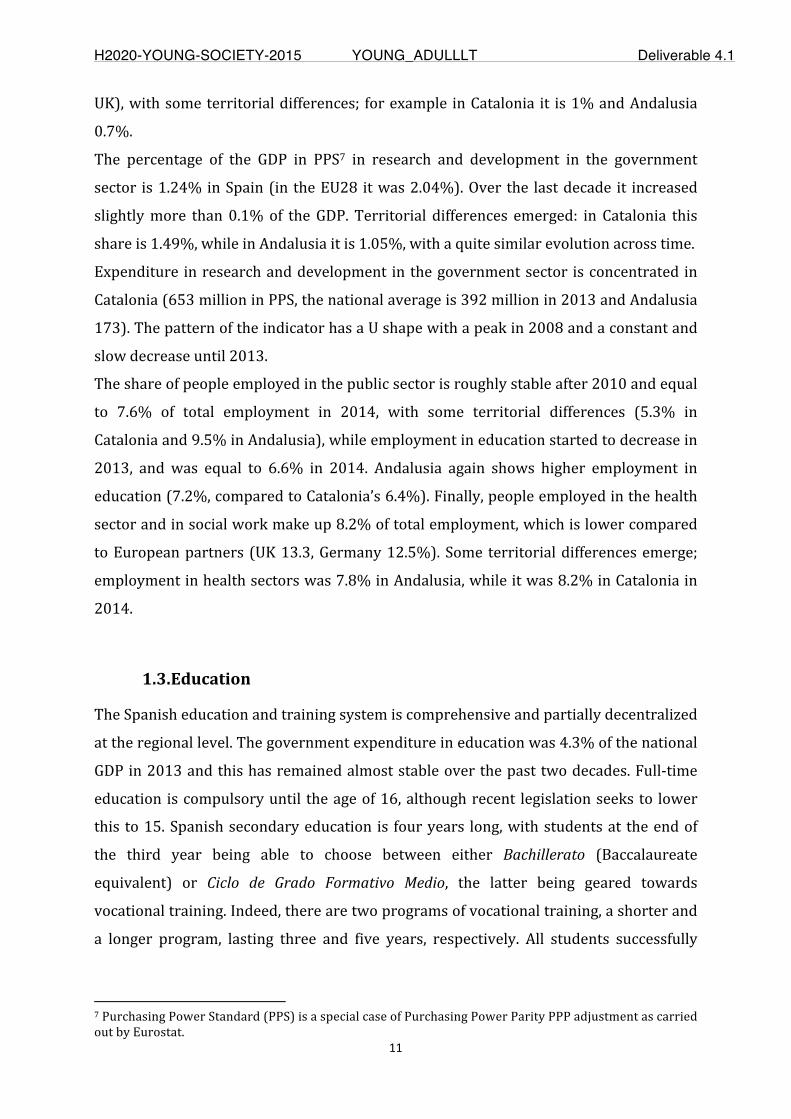
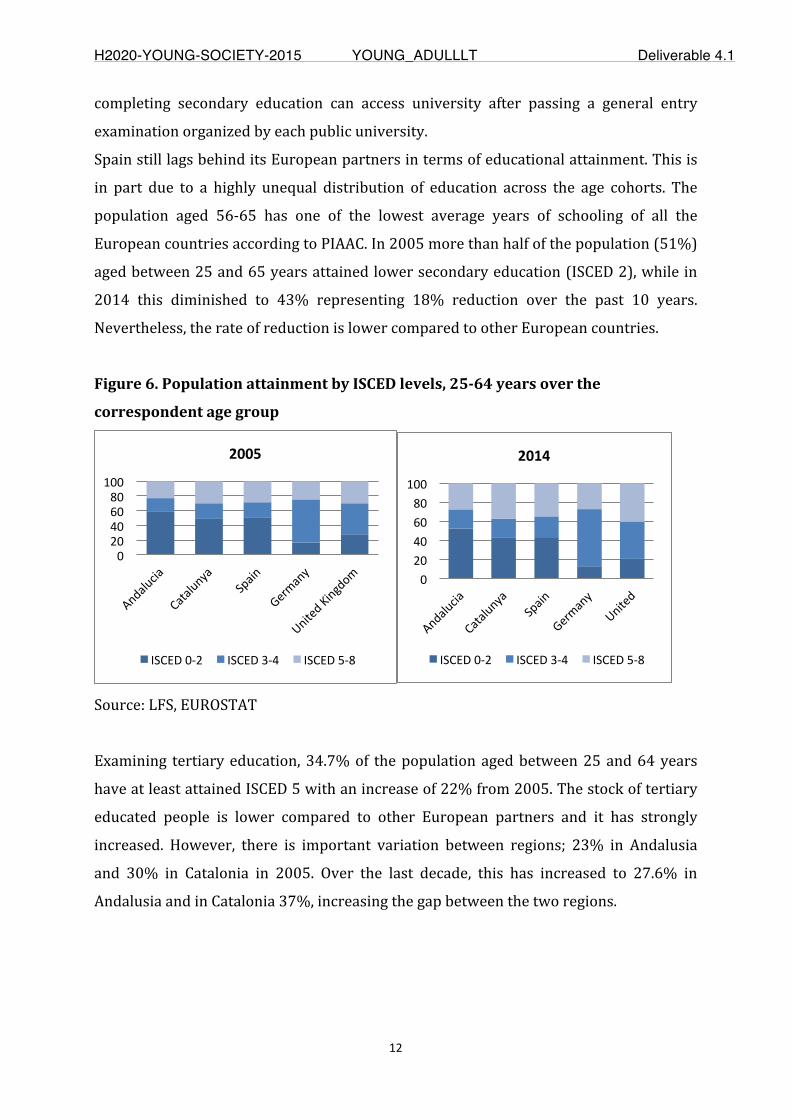
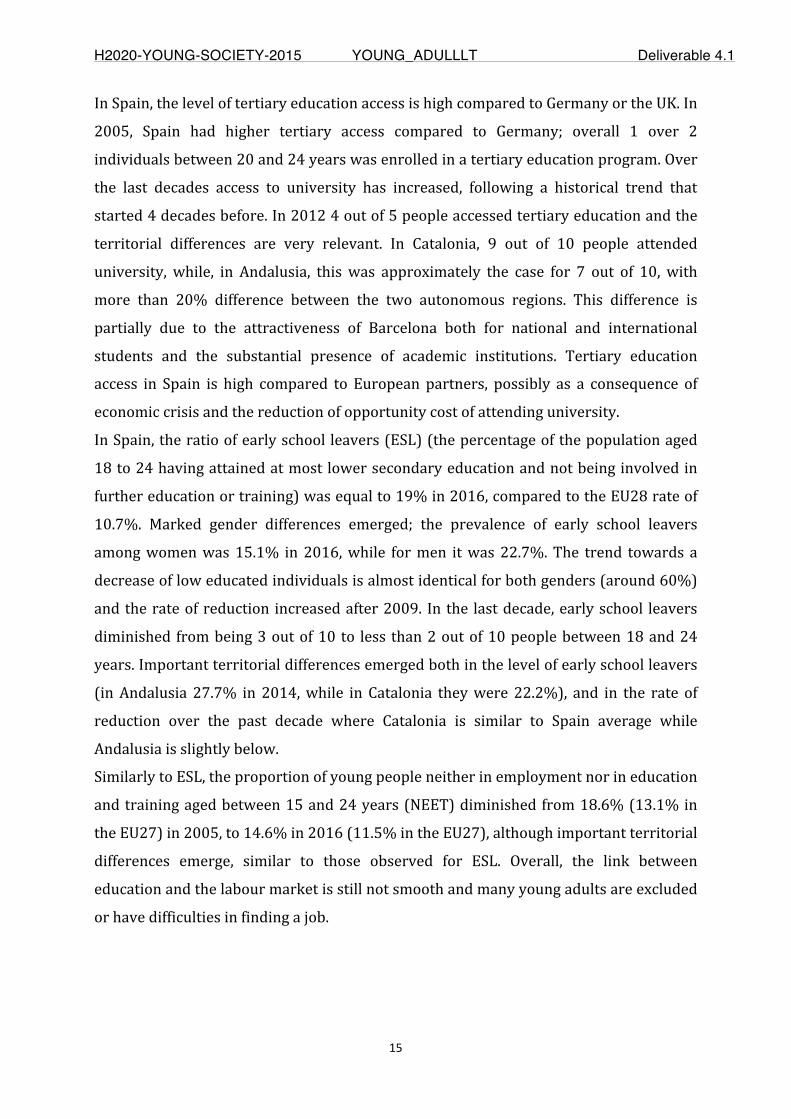
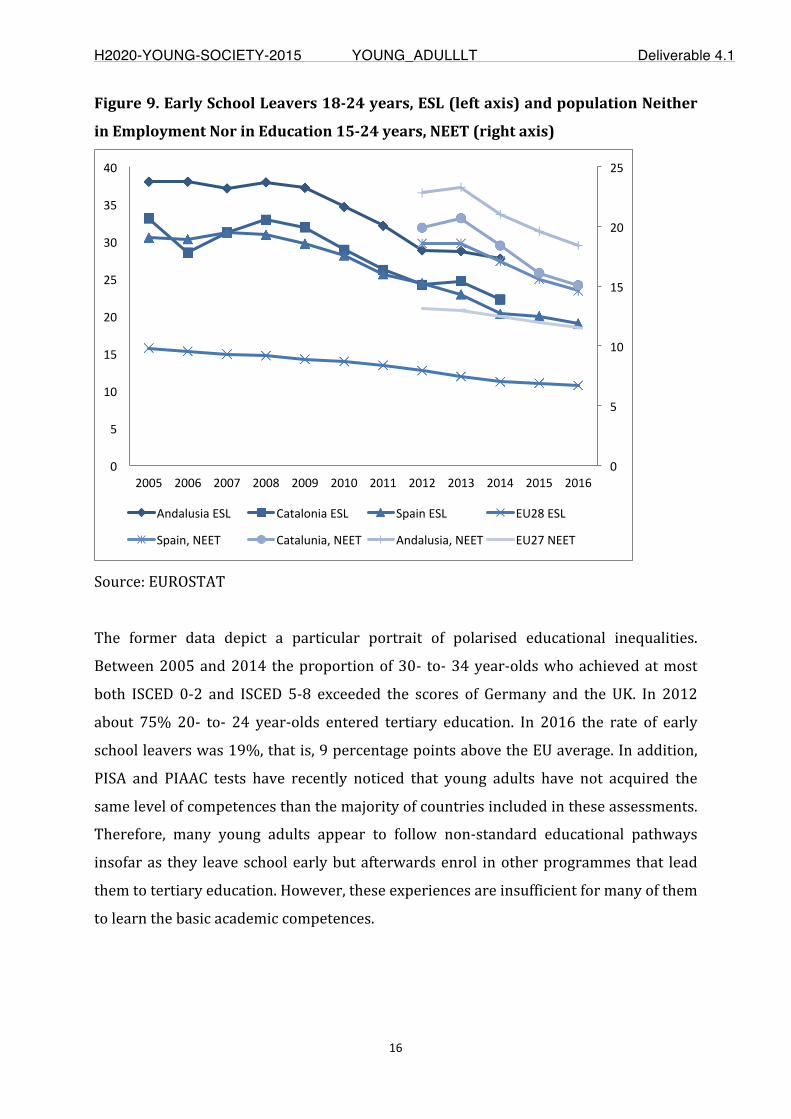
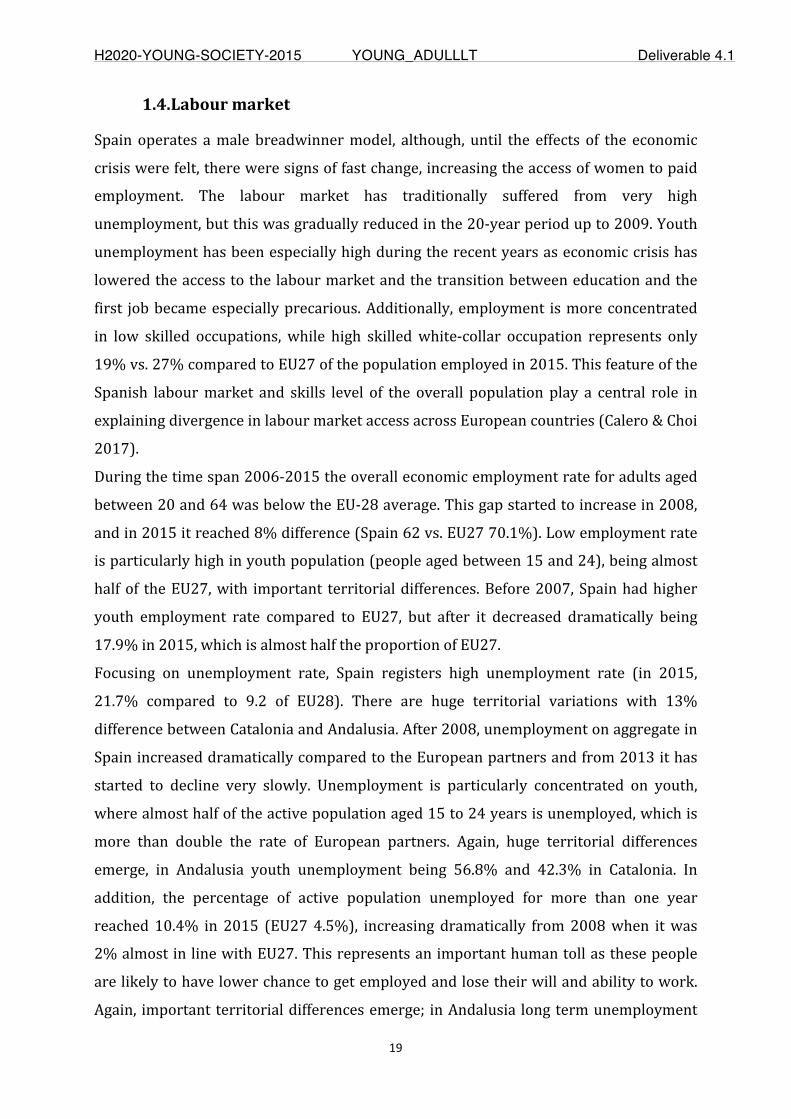
SpainstilllagsbehinditsEuropeanpartnersiregardingeducationalattainment.Thisisinpartduetoahighlyunequaldistributionofeducationacrosstheagecohorts.Athirdofthepopulation(34.7%)agedbetween25and64yearshaveatleastattainedISCED5withanincreaseof22%from2005.Thestockoftertiaryeducatedpeopleislower compared to other European partners, and it has strongly increased.However, there is important and increasing variation between regions. Whenconsidering young adults education attainment, (people aged between 30 and 34years),theirtertiaryeducationalattainmentishigherthanotherEuropeanpartners;in2005almost2outof5peopleaged30-34haveattainedtertiaryeducation,whilein2014theproportionincreasedbyroughly6%.In2005,inAndalusia,31%ofthepopulation aged between 30 and 34 had tertiary education, and this remainedalmoststableoverthepastdecade(theincreasewas0.9%),whileforCataloniatheattainmentwas41.2%and it increased to47% in2014.However, there is a highunequalterritorialdistribution.Theratioofearlyschoolleavers(ESL)wasequalto19% in 2016, compared to the EU28 rate of 10.7%. Marked gender differencesemerged;theprevalenceofearlyschoolleaversamongwomenwas15.1%in2016,whileformenitwas22.7%.SimilarlytoESL,theproportionofyoungpeopleneitherinemploymentnoreducationand trainingagedbetween15and24years (NEET)diminished from18.6%(13.1%in theEU27) in2005 to14.6%in2016(11.5%intheEU27),althoughimportantterritorialdifferencesemerge.
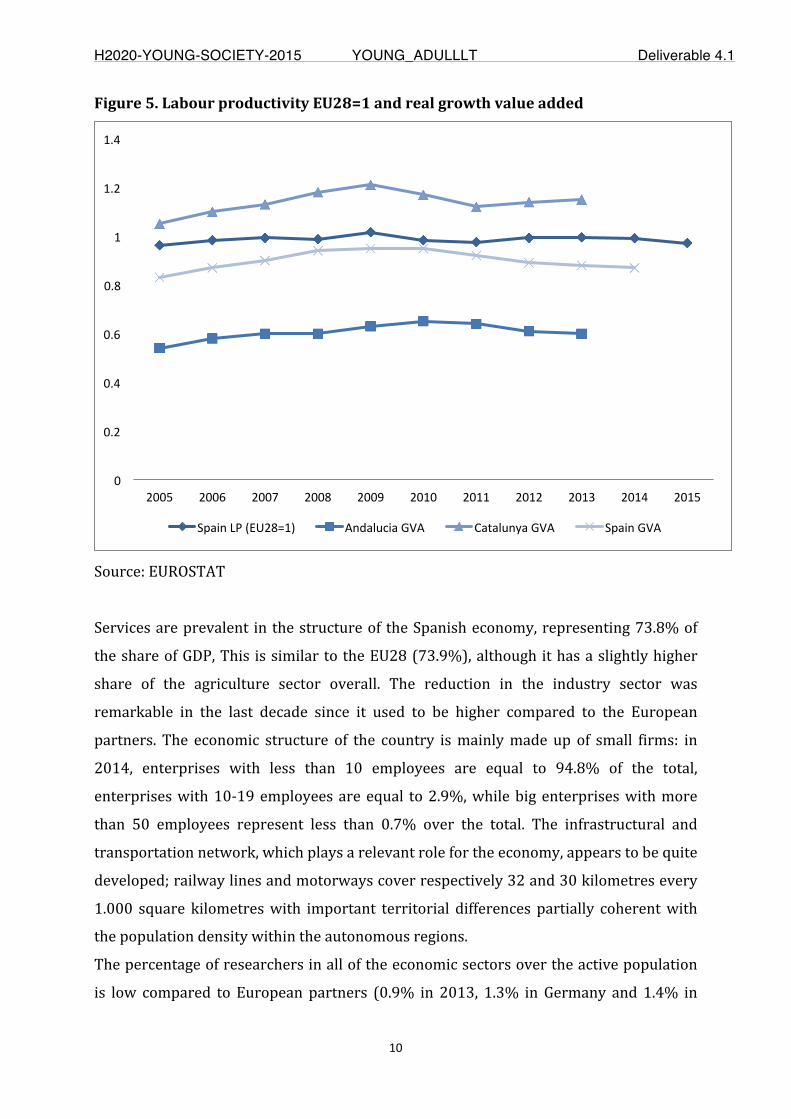
Thelabourmarkethastraditionallysufferedfromveryhighunemployment,butthiswasgraduallyreducedinthe20-yearperiodupto2009.Youthunemploymenthasbeenespeciallyhighduringtherecentyearsastheeconomiccrisishasloweredtheaccesstothelabourmarket,andthetransitionbetweeneducationandthefirstjobbecame especially precarious. Additionally, employment is more concentrated inlowskilledoccupations,whilehighskilledwhite-collaroccupationrepresentsonly19%vs27%comparedtoEU27ofthepopulationemployedin2015.ThisfeatureoftheSpanish labourmarketandskills levelof theoverallpopulationplaya centralrole in explaining the divergence in labour market access across Europeancountries. Many young adults are foreign-born, these cohorts are divided bypolarisededucational inequalities,andagrowingshareofyoungadultshavebeenexposedtoincomepovertysincethefinancialcrisis.Thesetrendshighlightboththecrucial relevanceof thepolicies addressed to this age-based target group and the
Page 16
H2020-YOUNG-SOCIETY-2015 YOUNG_ADULLLT Deliverable 4.1
Page16of31
hugechallengesthatthesepolicieshavetoovercome.
3. DeviationsfromtheWorkplan
Therehasbeenonevariationfromtheworkplan:
WP4 feeded was supposed to make an in depth triangulation and use of theempirical material produced in WP5 and WP6. However, the overlap of thefieldwork of the data collection WPs made it challenging to use the emergingevidencetorefineandfeedtheanalysesofWP4.
4. Performanceofthepartners
All partners have fulfilled their tasks satisfactorily. There was an intensecollaboration with UNIVIE during the elaboration of the proposal and the datacollation that was crucial to meet the challenging deadlines. The partners haveprovidedgoodqualityoutputsandhavemettheimportantdeadlines.
5. Conclusions
TheFullAssemblydeemsthisdeliverabletobefulfilledsatisfactory.
6. Annex–allnationalreportsandintroductiontothereports
OverviewIntroductiontotheNationalReports
Page 17
H2020-YOUNG-SOCIETY-2015 YOUNG_ADULLLT Deliverable 4.1
Page17of31
Work Package 4 Quantitative Analysis Young Adults’ Data
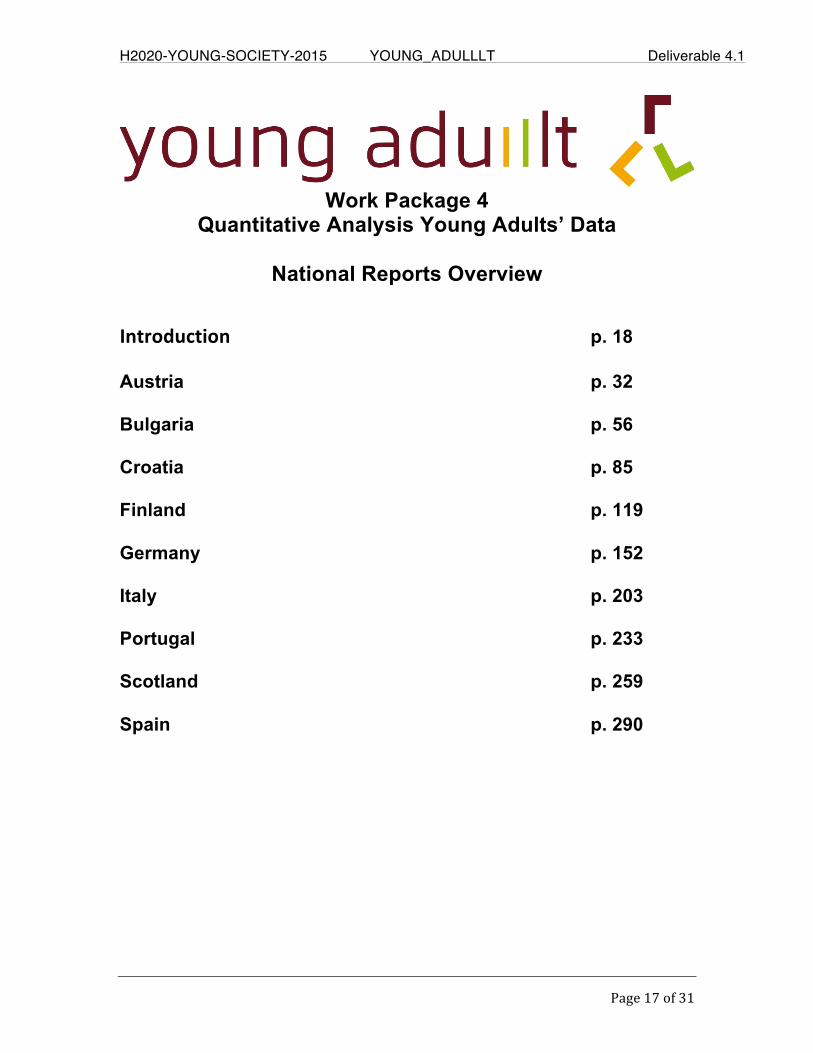
National Reports Overview
Introduction p. 18 Austria p. 32 Bulgaria p. 56 Croatia p. 85 Finland p. 119 Germany p. 152 Italy p. 203 Portugal p. 233 Scotland p. 259 Spain p. 290
Page 18
H2020-YOUNG-SOCIETY-2015 YOUNG_ADULLLT Deliverable 4.1
Page18of31
IntroductiontotheNationalReportsWP4conductsaquantitativeanalysisofyoungadults’socialand livingconditions,byanalysingsocio-economicdata(macrodata)aggregatedatthenationalandlocallevelondifferentdimensionsinparticipatingcountries.Theresearchquestionsthatderivecouldbesummarizedintotwomaintype:whatarethedataavailabilityandgaps at regional level about the living conditions of young adults?Andwhat datacouldtellaboutthelivingconditionsofyoungadultsandtheidentificationofrisksprofilesattheregionallevel?
Thespecifictargetgroupsfordatacollectionareyoungadultsagedbetween18and29 years, the indicators are disaggregated by gender, when suitable. However,different age range are considered in the data collection when suitable for thevalidityoftheindicators.AstargetgroupofLLLpolicies,youngadultsrepresentahighlydynamicandheterogeneousgroupconcerningoflivingconditionsincludingsocio-economicstratification, lifeprojectsandperspectives(cf.Weileretal,2016).Thisgroupvariessubstantiallyregardingthedifferentrealitiesofyoungpeople inthe participating countries, i.e. specific living conditions, levels of participation,individual perceptions and life projects are, for instance, different in Bulgaria,Finland,Germany,Italy,SpainandScotland(cf.Weileretal.,2017,p.73ff).Theyareaffectedbystructuraldevelopments,suchaseconomictrends,demographicchangeand life-course de-standardization processes, common trends that are howevermediated by the institutional frames in which individuals’ lives are embedded:institutions build the set of opportunities and constraints for individual’s choices.On the one hand, the interactions among labour market, welfare, education andtraining systems define different political economies of skills, as a result ofnegotiationprocessesofskillssupplyanddemand(cf.alsoParreiraetal.,2017).Ontheotherhand,theroleofthewelfarestatealsohastobespecificallyconsidered,asvarieties of welfare states perform differently at different stages of the life andsocial groups (Anxo et al., 2010). As noted by Esping-Andersen (1999), existingwelfare regimes differentiate by the ways they socialize risks: depending on therange of risks that are addressed and on the groups to be protected, thewelfarestate can assume a minimal-residual or, on the contrary, an inclusive andinstitutional rolewith respect toother sourcesofwelfare (family/communityandmarket).
The undergoing changes in contemporary societies are transforming thecharacteristicsanddimensionsofsocialproblems,causingaspreadingsituationofsocial vulnerability in the population (Ranci, 2010). Structural changes havegeneratedanewconfigurationofsocialrisks,stronglyaffectingyoungpeople,whicharelesspredictableandthereforedifficulttoaddressbytraditionalwelfaresystemsandpolicyinterventionsbasedonsocialinsurances(Moreletal.,2012;Palier2010).
Page 19
H2020-YOUNG-SOCIETY-2015 YOUNG_ADULLLT Deliverable 4.1
Page19of31
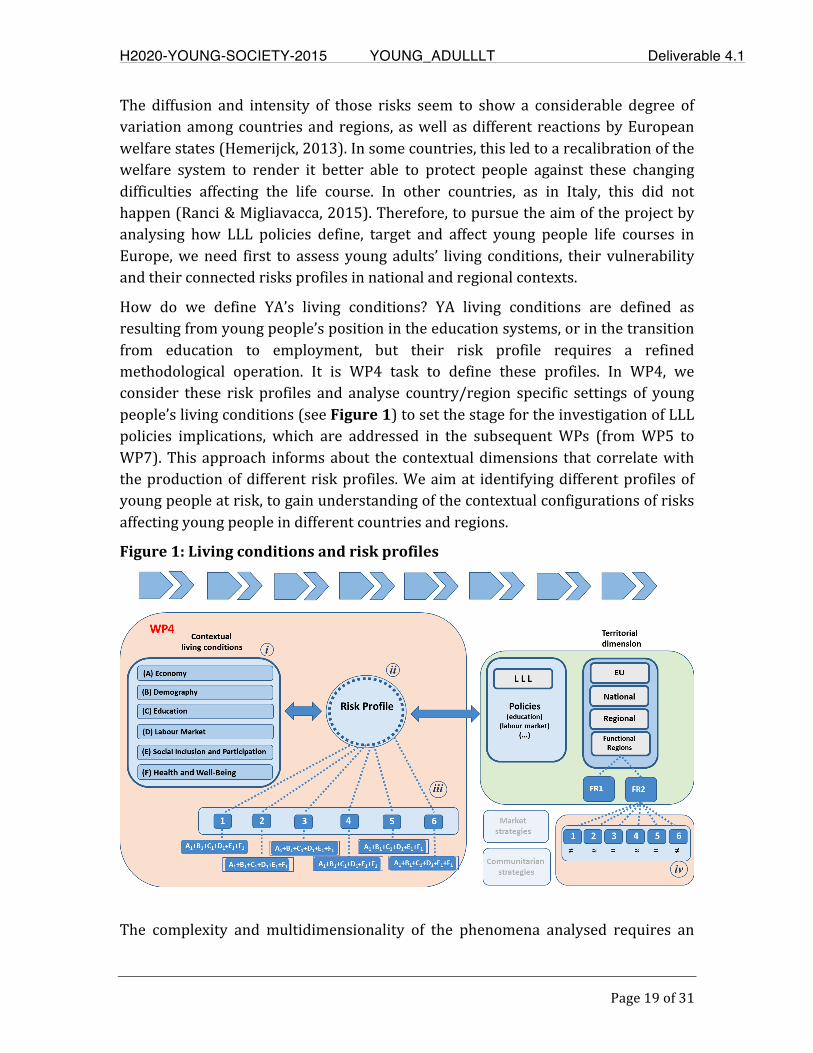
The diffusion and intensity of those risks seem to show a considerable degree ofvariationamongcountriesandregions,aswellasdifferent reactionsbyEuropeanwelfarestates(Hemerijck,2013).Insomecountries,thisledtoarecalibrationofthewelfare system to render it better able to protect people against these changingdifficulties affecting the life course. In other countries, as in Italy, this did nothappen(Ranci&Migliavacca,2015).Therefore,topursuetheaimoftheprojectbyanalysing how LLL policies define, target and affect young people life courses inEurope,weneed first to assess young adults’ living conditions, their vulnerabilityandtheirconnectedrisksprofilesinnationalandregionalcontexts.
How do we define YA’s living conditions? YA living conditions are defined asresultingfromyoungpeople’spositionintheeducationsystems,orinthetransitionfrom education to employment, but their risk profile requires a refinedmethodological operation. It is WP4 task to define these profiles. In WP4, weconsider these risk profiles and analyse country/region specific settings of youngpeople’slivingconditions(seeFigure1)tosetthestagefortheinvestigationofLLLpolicies implications, which are addressed in the subsequentWPs (fromWP5 toWP7).Thisapproach informsabout thecontextualdimensions that correlatewiththeproductionofdifferentriskprofiles.Weaimat identifyingdifferentprofilesofyoungpeopleatrisk,togainunderstandingofthecontextualconfigurationsofrisksaffectingyoungpeopleindifferentcountriesandregions.
Figure1:Livingconditionsandriskprofiles
The complexity and multidimensionality of the phenomena analysed requires an
Page 20
H2020-YOUNG-SOCIETY-2015 YOUNG_ADULLLT Deliverable 4.1
Page20of31
integrationofdifferentmethodsofresearch.ThequantitativeanalysiscarriedoutinWP4 integrates with the other WPs to triangulate and inform each step of theresearch. In developing a research design appropriate for answering the project’squestions, WP4 develop research hypotheses that are grounded in the scientificliterature andwill drawon the full breadthof available data. To set the stage forfurther investigationof howLLLpolicies affect young adults six basic dimensionsare selected. Definitions and descriptions of these dimensions, aswell as a list ofindicatorsanddataforeachofthemisgiveninsection1.Thedatacollectedbythecore team fromofficial andcomparable statistical sourcesareaggregatedat threedifferent levels: national (the more widely comparable); regional (NUTS2). Anessential part of the research is to develop a complementary set of indicators atregional level.Thissetof indicatorswascomplementedbyeach teamthrough thecollection of specific indicators available at local level that could be relevant forshedding light on context specificity. These indicators are in line with thedimensionsidentifiedintheframeworkoftheanalysis.Moreover,animportantstepis to assess the quality and comparability of the indicators across the Europeanregions. In this line, every national briefing provides a quality assessment on theavailabilityandqualityofthedatainrelationtotheobjectivesoftheWP4.
1. DefinitionofthedimensionsofcontextuallivingconditionsWe identified six dimensions of contextual living conditions which representdifferent aspects of young adults’ experience and are strongly correlated oneanother. To identify these dimensions, we extensively relied on literature oncompositeindicatorsonsocialjusticeandqualityoflife(Mazziotta&Pareto,2016;Schraad & Tischler, 2016; Noll, 2016; UrBes, 2015; European Commission, 2015;Eurostat,2015;Schepelmannetal.,2010;OECD,2008,2013),aswellasonwelfarepolicies (Kazepov&Ranci, 2016;Moreletal., 2012;Esping-Andersenetal., 2002;Esping-Andersen, 1999), life course (Walther, 2006; Verdier, 2012) and school towork transition (Raffe, 2014; Ryan, 2008). The dimensions we consider are thefollowing:
A=Demographicstructure
B=Generalstateoftheeconomy
C=Education
D=Labourmarket
E=Welfareandsocialinclusion
F=Healthandwell-being
Page 21
H2020-YOUNG-SOCIETY-2015 YOUNG_ADULLLT Deliverable 4.1
Page21of31
1.1Demographicstructure(A)ThedimensionDemographicstructure(A)referstodemographiccharacteristicsthatcanbeusedtodescribethepopulationanditssubgroups.Livingconditionsofyoungpeople are shaped by the demographic context, as the structure of a populationdeeply affects the characteristics and intensity of social needs of its varioussubgroups. Population ageing and the dynamics of migration are commonlyidentified as drivers of transformation within European societies and socialprotection systems (Castles et al., 2010; Brandolini et al., 2009; UNHCR, 2015).Moreover, the role of the households with respect to living conditions of youngpeople is widely recognised (Esping-Andersen et al., 2002; Saraceno, 2015): thefamily is considered as a source of welfare and redistribution of resources,according to the principle of reciprocity (Esping-Andersen, 1999); and it alsostronglycontributesinshapingeducationalpaths, labourmarketparticipationandpovertyrisks.However,theorganizationoffamilylifeandtherelationshipbetweenthefamily,thestateandthemarketvarywithinandacrossnationalsettings(Daly,2010; Bahle, 2009). Accordingly, this dimension analyses the structure of thepopulation by looking at its composition, as well at the fields of genderrelationships, households’ characteristics (type and size), fertility and degree ofurbanisation(OECD,2013;Rhodes,2005).
The demographic dimension includes four sub-dimensions. Sub-dimensions onpopulation structure and population density, urbanization and territory includeindicators related to the population structure (including migration and ethnicaldiversity of societies), its characteristics regarding density, urbanization andterritory. The sub-dimension household structure focuses on the households’structureandsize.Finally,thesub-dimensionbirthandlifeexpectancycoversissuesrelatedtofertilityandlifeexpectancy.
1.2Generalstateoftheeconomy(B)ThedimensionGeneralstateoftheeconomy(B)referstotheeconomiccontextandthe structure of the productive system, as elements framing living conditions ofyoungpeople indifferentnationaland local contexts. It canbebroadlydefinedasthenetworkofconnectionsandinteractionsamongeconomicactorsinvolvedintheproductionandexchangeofgoodsandserviceswithinthemarket.Thisdimensionisrelated to the impact of economic trends related to technological innovation,terziarization,economicandfinancialglobalization(Ferrera,1996),onthestructureof Europeannational and local economies.Here,wemainly look at themarket assource ofwelfare,where the allocation of resources followsmarket relationships(Esping-Andersen,1999). Inthe lightof theYAproject,acorrectunderstandingofthe characteristics of the economy, as embedded within various forms of social
Page 22
H2020-YOUNG-SOCIETY-2015 YOUNG_ADULLLT Deliverable 4.1
Page22of31
organization (Mingione, 1997), helps explain the preconditions for policiespromotingbotheconomicgrowthandsocialdevelopment(OECD,2001;Moreletal.,2012).Thecurrentphaseofcapitalismhasbeenvariouslydescribedas“knowledge-basedeconomy”or“globalisinglearningeconomy”(Brownetal.,2001;Lundvall&Lorenz, 2011; Jensen et al., 2007), thus stressing the relevance of innovation,research and skills for the competitiveness of firms. Accordingly, a competitiveproductive systems can result in an improvement of the quality of goods andservices, creating jobs and addressing societal challenges (European Commission,2015). As an example, labour productivity is regarded as ameasure of economicgrowthand livingstandardswithinaneconomy(OECD,2014b), stronglyaffectingyoungpeople’sopportunitiesindifferentcontexts.
The Economy dimension includes three sub-dimensions. First, the sub-dimensionstructureoftheeconomyconsidersindicatorsrelatedtothegeneralstructureoftheeconomicsystem.Second,thesub-dimensioninnovationcapturesthespecializationofenterprisesaswellastheinvestmentininnovativeandhigh-technologysectors.Finally, the sub-dimension labour productivity relates to the efficient use ofresourcesintermsoflabourproductivity.
1.3Education(C)The Education dimension (C), refers to access, process and outputs of education(Checchietal.,2014;Pawson&Tilley1997).Thecomparativeeducationliteratureshowshowtheinstitutionaldesignofeducationandtraininghasavarietyofeffectson the acquisition and distribution of educational attainments and achievements(Dupriez, Dumay, & Vause, 2008; Green, Green, & Pensiero, 2015; Hanushek,Woessmann, & Zhang, 2011; Heisig & Solga, 2015; Mons, 2007). This stream ofliteraturehasessentiallyfocusedonwhatisaneffectiveinstitutionalarchitectureineducation provision focusing on macro institutional differentiation. It has useddifferent dimensions such as the levels of stratification and standardisation, thedegrees of access and accessibility, the levels of state control and expenditure(Allmendinger & Leibfried 2003; Green 2007; West & Nikolai 2013; Biggart,Järvinen & Parreira do Amaral 2015). These studies identify a range of differenteducational and training systems that are closely associated with a country’sspecific history and culture, which have in turn shaped the development of therespective nation-state (Busemeyer & Trampusch, 2012; Green, 2013; Mayer &Solga,2008).
Moreover,theliteratureonschool-to-worktransitionsandskillsmismatchassesseshow the nexus between education outputs and labour market varies amongcountries, thus affecting youth living conditions and shaping life trajectories(Gambetta1987;Allmendinger,1989;Raffe,2014;Pastore,2011;Quintini&Martin,
Page 23
H2020-YOUNG-SOCIETY-2015 YOUNG_ADULLLT Deliverable 4.1
Page23of31
2006). In this field, VET systems and dual education experiences are gainingincreasingattention,asbridgespotentiallysmoothingthepassagefromeducationtoemployment (Eichhorst et al., 2015; Popiunik & Ryan, 2011). Accordingly, thisdimensioncoverstheavailableindicatorsoneducationandtraining,withaspecificattention directed to VET. We integrate them with diverse young adults’ skillsmeasures. In detail, we consider indicators related to input and outputs of theeducationsystems(OECD,2014a).
Theeducationandtrainingdimensionincludesfoursub-dimensions.Thefirstsub-dimension on education access considers indicators related to the access to theeducationsystemindifferentnationalandlocalcontexts.Thesecondsub-dimensioncovers indicatorsrelated toeducationalattainments (qualifications).The thirdsub-dimensionlooksateducationoutputs,concerningskills’achievement,dropoutsandlack of participation. Finally, in the sub-dimension education policy,we consideravailableindicatorsontheinstitutionalsetting,expenditureandpoliciesinthefieldofeducation.
1.4Labourmarket(D)TheLabourmarketdimension(D)focusesontheinteractionamonglabourmarket,welfare state and education structures, by looking specifically at the demand andsupplysideoflabourandyoungadultsskills(Busemeyer&Trampusch,2012;Hall& Soskice, 2001). The participation of young people in the labourmarket deeplyaffects their life opportunities and social identities. Moreover, it is seen as a keyobjectiveofpolicystrategiestryingtoconnecteconomicgrowthandsocialinclusion(Morel et al., 2012). However, young people in contemporary societiesmust faceincreasing disadvantages in the labour market: on the one hand, they often lackworking experience and related skills that are highly valued by employers (Ryan,2008);ontheotherhand,economicandlabourdevelopmentswithinpost-industrialsocieties deteriorate employment prospects for low-qualified people (Bonoli &Mouline,2012).Asaresult,youngpeopleareoftendepictedasagroupofoutsidersregarding labourmarketaccessandoutputs (Lindbeck&Snower,2001),butsuchoutcomes strongly vary across countries (Emmenegger et al., 2012). This reflectstheinteractionbetweendifferentcontextualandinstitutionalconditionsatstake.Inthe social science, scholars have written extensively on the association betweenoccupational attainment, education, skills, showingpositive relationshipsbetweenthose dimensions (Abrassart, 2013; Bol & van de Werfhorst, 2013; Heckman,Stixrud,&Urzua,2006;Psacharopoulos&Patrinos,2004;vandeWerfhorst,2011).Theincreasingcomplexityoflabourmarketsrequiresselectionandallocationbasedon education attainment associated with cognitive and non-cognitive skills(Heckmanet al., 2006).Against thisbackground, thehumancapital theoryarguesthat education provides individual with enhancing skills which make themmore
Page 24
H2020-YOUNG-SOCIETY-2015 YOUNG_ADULLLT Deliverable 4.1
Page24of31
productive.Ontheotherhand,goodpositionalapproachescontendthateducationacts as a screening device for employers and establish a proxy for the marginalproductivityof theemployees.Thus,weconsider theavailableempirical evidencerelatedtothelabourmarket,employmentdynamics.
The labour market dimension includes four sub-dimensions. The first sub-dimension on labour market access considers indicators related to access andparticipation. The second sub-dimensions on labour market demand looks atindicatorsmeasuring the characteristics of the demand for labour.With the thirdsub-dimensionon labourmarketoutput,weexamineindicatorsrelatedtothetypeofparticipation(contractualarrangements)andthematchingofskillsdemandandsupply. Finally, the sub-dimension on labour market policy considers availableindicatorsontheinstitutionalsetting,expenditureandpolicies.
1.5Redistributionandsocialinclusion(E)ThedimensionRedistributionandsocialinclusion(E)focusesonthemateriallivingconditions of young people, on social policy interventions and theparticipation ofcitizens to the political and civic life. Participation fosters cooperation and socialcohesion.Thusitstimulatessocialtrust,aswellasastrongerattentiontoefficiencyandefficacyofpublicpolicies,includingLLLpolicies(UrBes,2015).However,underconditionsofpovertyandsocialexclusion,socialparticipationbecomesharder,anda-selfdeterminedlifeispossibleonlywithgreatdifficulty(EuropeanUnion,2015).This iswhymeasuringmaterial conditionsand theirdegreesofparticipation isofutmost relevance in the investigation of contextual living conditions of youngpeople.Povertyanddeprivedmaterialconditionsharmindividuallivesbyaffectingtheir health andwellbeing and lowering educational outcomes. This limits youngpeople’s chances to achieve their full potential, that is, according to a capabilityapproach,theirrealopportunitiestodoandbewhattheyhavereasontovalue(Sen,1992;Deneulin,2009;Venkatapuram,2011).Thisdimensionexaminestheextenttowhich trends towards social exclusion and polarization have an impact on youngadults’ livingconditions,alsoconsideringtowhatdegreetheyarecounteractedbypolicy interventions. Thus, we look at the available empirical evidence related topovertyandsocialexclusion;attheroleofsocialpolicyintheredistributionandre-allocation of resources; at the general participation of young people within theirbelongingsociety.
The Social inclusion and participation dimension includes three sub-dimensions.Thefirstsub-dimensiononmaterialconditionsgathersindicatorsrelatedtomaterialconditionsofyoungpeople,incorporatingindicatorsonmonetarypoverty,materialdeprivationandlowworkintensity.Thesecondsub-dimensiononsocialpolicyandredistribution includesavailable indicatorsonincomeinequalitiesandexpenditure
Page 25
H2020-YOUNG-SOCIETY-2015 YOUNG_ADULLLT Deliverable 4.1
Page25of31
onredistributivepolicyinterventions.Thethirdsub-dimensioncoversmeasuresofpolitical and civic participation, measuring individual attitudes towardsengagement.
1.6Healthandwell-being(F)This dimension combines health and individual well-being. Health hasconsequencesonalldimensionsandalldifferentphasesofpeople’s life,modifyingtheir life conditions and influencing their behaviour, social relationships,opportunities andprospects. Further, health is amultidimensional feature (WorldHealthOrganization,1948)anditcomprisestoenjoya"completephysical,mentaland social well-being" and cannot be intended only as the absence of disease.Moreover, the concept of well-being is here used regarding perceptions andopinions expressed by the individuals in their own life. Here, elements of theindividuals’well-beingthroughthelifecourseareseenfromtheperspectiveoftheirwelfare(Sen,1992).Forthesereasons,weintegrateintothisbroaddimensionthewell-being as perceived by people. This subjective perspective gives additionalinformation to that provided by objective data, which are useful to measure thegeneralqualityof lifeof individualsand toenrich theanalysisof contextual livingconditionsofyoungpeople.
TheHealthandwell-beingdimensionincludesthreesub-dimensions.Thefirstsub-dimension on dealswithhealth accesswithin different national and local context.Thesecondsub-dimensiononhealthstatusandsubjectivewell-beingcovershealthconditions and more subjective-driven information about young adult conditionsoverarangeoftopics.Finally,thethirdsub-dimensiononsocialexpenditurelooksatexpenditureandpolicieswithinthisfield.
2. ProcessofdatacollationThedatacollation is constrainedby theavailabilityofpre-existingdatawhicharemainly produced by Eurostat. Within the EU, the official statistical approach ofgatheringdataonstructuralinformationisusingahierarchicalcategorisationofEUterritories and regions. As a geographical system, a division was developed byEurostat to structure and classify the regional statistics resulting into thenomenclature of territorial units for statistics (Nomenclature des Unitésterritorialesstatistiques–NUTS).Theaimistoprovideasingleaswellasacoherentsystemfor“comparableandharmoniseddatafortheEuropeanUniontouseinthedefinition,implementationandanalysisofCommunitypolicies.”(Eurostat,2007,p.3). Therefore, the EU vastly uses a national state driven concept for producing,describingandimplementingregionalstatistics.However,duetochangingrealities,suchasinternationalisation,Europeanisationandglobalisationprocesses,aswellastotrendstowardsrescalingandsubsidiarization(Kazepov,2010),theconceptofthe
Page 26
H2020-YOUNG-SOCIETY-2015 YOUNG_ADULLLT Deliverable 4.1
Page26of31
nationalentitiesusingadministrativeunitsisincreasinglyquestionedbeingausefultooltodescribesocialrealities(cf.D2.3,StateoftheArtReport,p.10).
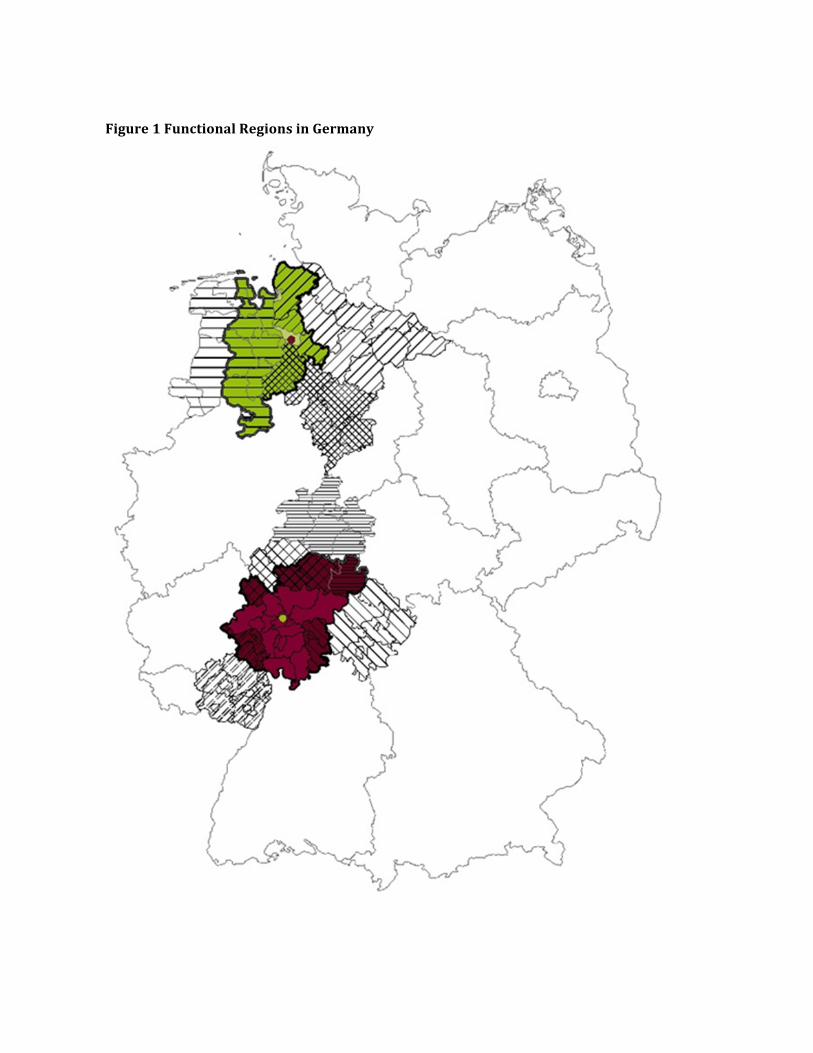
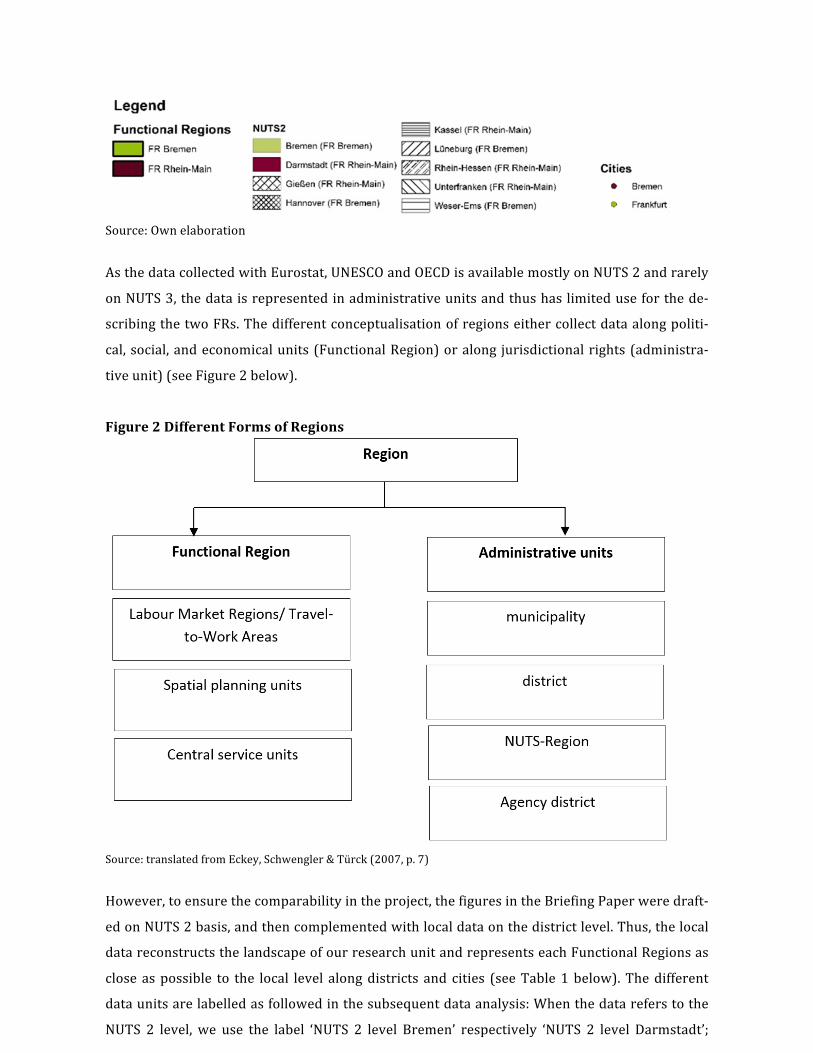
TheprojectYOUNG_ADULLLTderivesfromtheassumptionthattheimplementationofLLLpoliciesisbeststudiedattheregional/localleveltounderstandthecontext-specificity of young adult life courses beyond the national level. Therefore, theconceptofFunctionalRegionswhichwasadoptedwithin theprojectsharpens thefocusonregionaldifferencesandvariations.However, italsoraiseschallenges forthevalidityofquantitativeresearchbasedonavailableindicatorsonyoungpeopleliving conditions, as the different FRs can match/mismatch with the territorialand/oradministrativeregions thatarevastlyusedwithinestablishedstatistics,aswell as creating challenges in data availability of different sources. For instance,statistical data on socioeconomic and socio-demographic aspects, education andtraining, labour market and welfare is not limited to given administrative units(countries,states,districts,provinces,orcities).
Departingformthetensionbetweenofficialdescriptionsofcommunities,changingrealitiesanddataavailability,WP4dealswiththisintwoways:thedevelopmentofa practical approach to data collection as well as an assessment of the dataproductionprocessoftheEU.Inthecaseofthelatter,thedatagapsintheEuropeanStatistical Systems also imply how data is collected within the EU regarding ourFunctionalRegions.Thisprovidesinsighttothequestion,howdataisusedtosteerpoliticalprocessesonLLLpoliciesandthusintheprocessofdefinition,coordinationand implementationofpolicy. In the caseof thedatagatheringprocess, theWP4collectsdataascloseaspossibletotheregionallevelusingpre-existingdatasets.Inthisway, thepre-existingdata on theNUTSLevel is used, however, enriched andspecified by local/regional information. This is relevant, as subdivisions in somelevelsdonotnecessarilycorrespondtoadministrativedivisionswithinthecountry.
The data availability onNUTS-3 level is not exhaustive for all FRs. Therefore, theanalysiscombinestheselevelsofanalysisregardingtheavailabilityofthedataandwill reach NUTS2 whenever it is possible, which is derived from the system ofdivisionofEuropeanterritoryfromEUROSTAT1.ThelevelofanalysisofWP4inthissense is constrained from the existing territorial division which reflects the dataavailable.
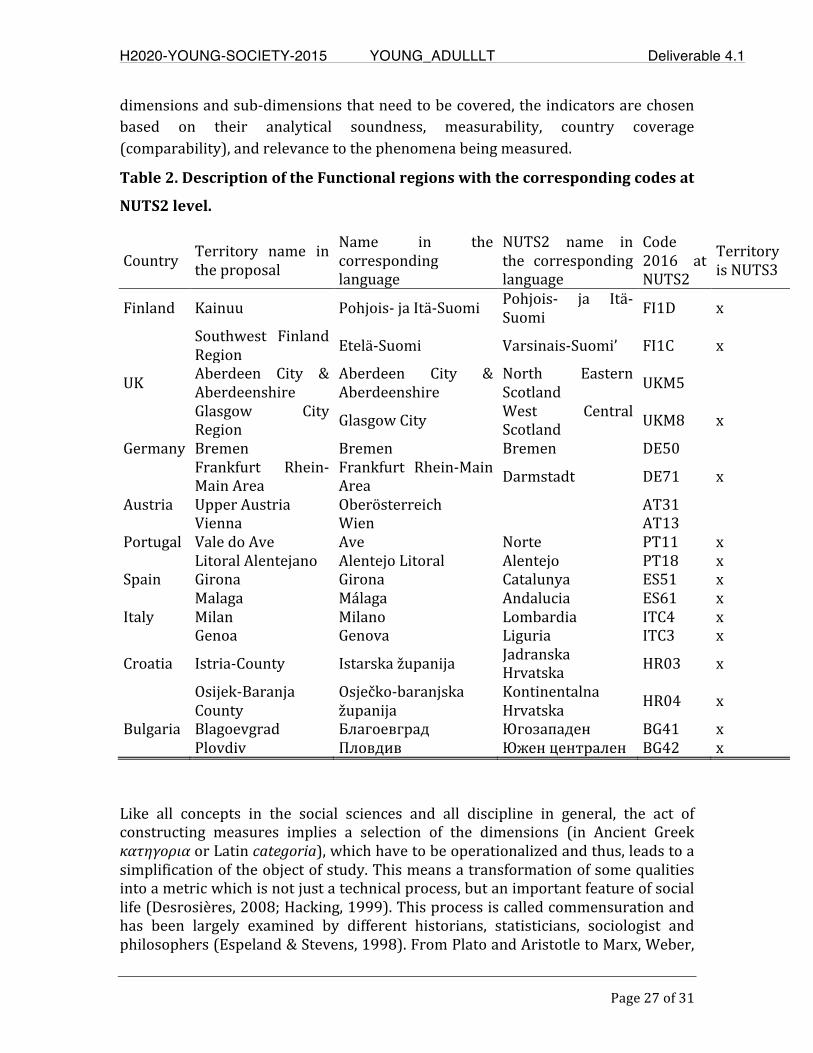
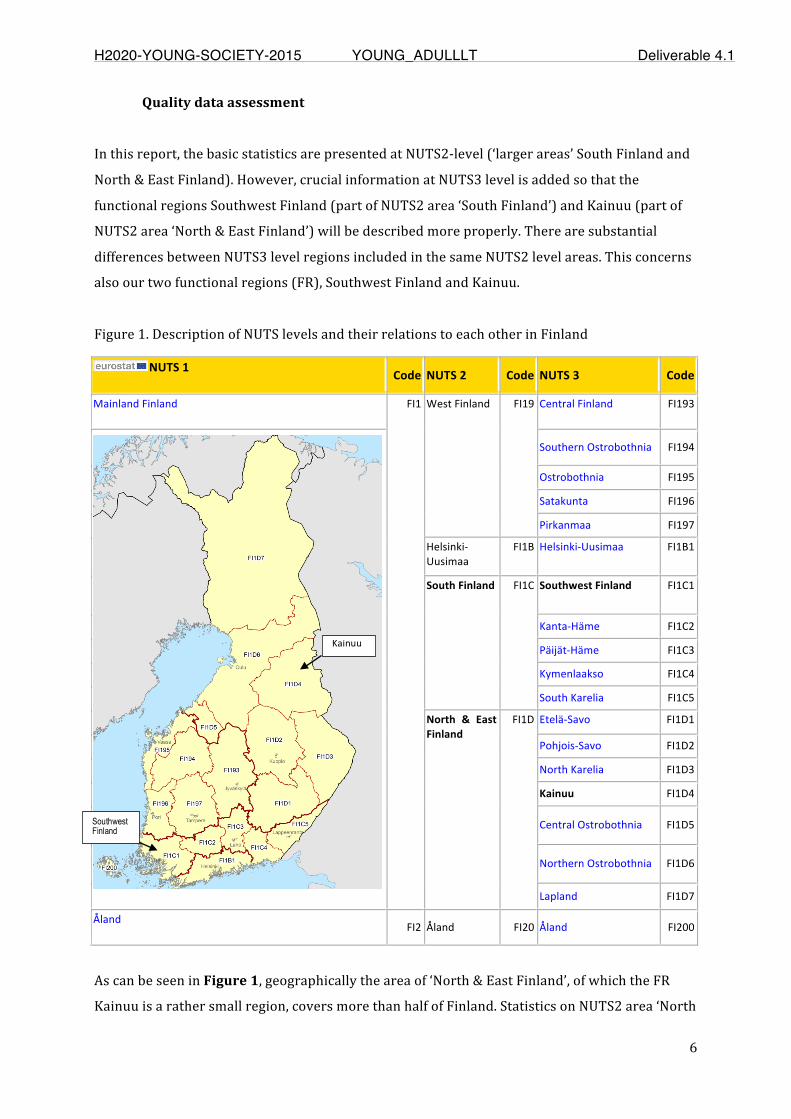
The functional regionsare shown inTable2,with thecorresponding informationaboutthefunctionalregionsandterritorialdivision.ItshouldbeborneinmindthatdatawillbeprovidedatNUTS2.Havingestablishedtheobjectivesandtheessential1 Detailed information about territorial division of the European territory could be found at http://ec.europa.eu/eurostat/web/nuts/overview. In the EUROSTAT division, NUTS 1 corresponds to major socio-economic regions; NUTS 2 are the basic regions for the application of regional policies and; NUTS 3 are the small regions for specific diagnoses, which are generally metropolitan area.
Page 27
H2020-YOUNG-SOCIETY-2015 YOUNG_ADULLLT Deliverable 4.1
Page27of31
dimensionsandsub-dimensionsthatneedtobecovered,theindicatorsarechosenbased on their analytical soundness, measurability, country coverage(comparability),andrelevancetothephenomenabeingmeasured.
Table2.DescriptionoftheFunctionalregionswiththecorrespondingcodesat
NUTS2level.
Country Territory name intheproposal
Name in thecorrespondinglanguage
NUTS2 name inthe correspondinglanguage
Code2016 atNUTS2
TerritoryisNUTS3
Finland Kainuu Pohjois-jaItä-Suomi Pohjois- ja Itä-Suomi FI1D x
Southwest FinlandRegion Etelä-Suomi Varsinais-Suomi’ FI1C x
UK Aberdeen City &Aberdeenshire
Aberdeen City &Aberdeenshire
North EasternScotland UKM5
Glasgow CityRegion GlasgowCity West Central
Scotland UKM8 x
Germany Bremen Bremen Bremen DE50 Frankfurt Rhein-
MainAreaFrankfurt Rhein-MainArea Darmstadt DE71 x
Austria UpperAustria Oberösterreich AT31 Vienna Wien AT13 Portugal ValedoAve Ave Norte PT11 x LitoralAlentejano AlentejoLitoral Alentejo PT18 xSpain Girona Girona Catalunya ES51 x Malaga Málaga Andalucia ES61 xItaly Milan Milano Lombardia ITC4 x Genoa Genova Liguria ITC3 x
Croatia Istria-County Istarskažupanija JadranskaHrvatska HR03 x
Osijek-BaranjaCounty
Osječko-baranjskažupanija
KontinentalnaHrvatska HR04 x
Bulgaria Blagoevgrad Благоевград Югозападен BG41 x Plovdiv Пловдив Юженцентрален BG42 x
Like all concepts in the social sciences and all discipline in general, the act ofconstructing measures implies a selection of the dimensions (in Ancient GreekκατηγοριαorLatincategoria),whichhavetobeoperationalizedandthus,leadstoasimplificationoftheobjectofstudy.Thismeansatransformationofsomequalitiesintoametricwhichisnotjustatechnicalprocess,butanimportantfeatureofsociallife(Desrosières,2008;Hacking,1999).Thisprocessiscalledcommensurationandhas been largely examined by different historians, statisticians, sociologist andphilosophers(Espeland&Stevens,1998).FromPlatoandAristotletoMarx,Weber,
Page 28
H2020-YOUNG-SOCIETY-2015 YOUNG_ADULLLT Deliverable 4.1
Page28of31
SimmelandFoucault,theimplicationsofcommensurationhavebeenanalysedasaprocessthatinfluencesourvaluationandthewayweinvestingoodsandservices.The research ofWP4 could not escape the process of commensuration. First, theestablishment,recognition,anduseofastatisticalobjectareveryappealing.Second,theinterpretationandpoliticaluseofeachmeasureisaverypowerfulwaytopushforwardaspecificapproachorevenapoliticalagenda(Meyer&Benavot,2013).Inthis sense, the research objectives are constrained from existing and availablesources, their comparability and statistical issues such as representativeness.Therefore,weconsideredtheEuropeanLabourForceSurveyandtheEuropeanSocial and Income Living Conditions as themost relevant survey data sourceswhichhaveimportantinformationfortheresearchobjectivesofWP4.ThesearethefewsurveysavailableandcomparableattheNUTS2levelwhichcollectinformationonlivingconditionsofyoungadults.
3. OperationalizationThissectiondescribestheoperationalizationprocesscarriedoutinconductingthequantitative research on young adults’ contextual living conditions and lifelonglearningpolicies.Theprocessconsistedof5phases.First,thecoreteamdesignedaframeworkofanalysisandselectedthedimensionsand sub-dimensions of interest for the overall research, finally the indicatorsconnectedtothesub-dimensionswereselected.Second,theteamleaderidentifiedadministrativesourcesandcomparativesurveysandassessedthedataqualityatnationalandregionallevel.Toexploreyoungadults’conditions on the different dimensions in the participating countries, it wasnecessarytoestablishanddelimitatargetgroupbasedondifferentcharacteristics.Consideringtheheterogeneoustargetgroupsof theyoungadults in termsof theirsocio-economic stratification and living conditions, WP3 analysis and dataavailabilityconstraints,ad-hocindicatorscouldbeincludedinthedatacollectionforeachfunctionalregion.Third,thecoregroupproducedasetofindicatorsatnationalandregionallevel.TheWP4offeredacriticalreviewofthedatalimitationsandgapsattheEuropeanlevelandproposedpossiblewaystosolve it,by integrating internationaland localdatathroughthedatacollectionprocessofeachpartner.Fourth, as a first milestone in the data collection and analysis, the core teamproducedareducedsetofindicatorsthatwereusedforthecountryreport.As a final stage the core team produces an international report with acomprehensivelistofindicators.To have a clear overview, theWP4 process is outlined below and comprises thefollowingsteps:
1) DefinitionandselectionoftheresearchquestionsBased on a first proposal, the core team togetherwith the other teamsworking ondata collection established a list of research questions. The research questionswere
Page 29
H2020-YOUNG-SOCIETY-2015 YOUNG_ADULLLT Deliverable 4.1
Page29of31
discussedinsmallgroupsandifneededredefinedandclarified.Atthisstage,someofthe research questions were redirected to the other working packages if they werelikelytoaddressmorespecificallythroughouttheirresearch.
2) Selectionofdimensionsandsub-dimensionsThe UGR team together with the core team made a first proposal of dimensions,includingtheirdefinitionandtheirtheoreticalrelationship.ThisstepwascoordinatedthroughinanonlinemeetingheldinFebruary.
3) SelectioncriteriaandindicatorsproposalThecoreteamdiscussedtheindicatorscriteriawhichincludedvalidity,reliabilityfortheoverallresearchquestionsoftheWPandcomparabilityandsimplicityofthedata.Thecore teamproposedanddiscusseda first selectionof the indicators for the sub-dimensions of the data collection, which was discussed online. This work was thenintegrated in the working package proposal and circulated among the partners. Atemplatefordatacollectionwasprovided.
4) ProvisionofspecificindicatorsbyeachpartnerIn addition to the list of indicators provided by the core team, every partner wereaskedtoprovidespecific-contextindicatorsatthelocallevel.
5) DevelopmentofindicatordescriptionsheetsConstruction of a detailed description for each indicator selected in the initialscreeninground.
6) RefinementoffinalindicatorsbasedonfeedbackTheindicatorswererefinedbasedontheinternalfeedbacks.
7) DisseminationoffinalindicatorsetThesetof indicatorswasdisseminatedamongall thepartners.A firstreleasewithashort list of indicators was sent to the partners at the end of May. The full list ofindicatorswasreleasedthroughtheplatformoftheproject.Context-specificindicatorsnot collected through harmonized data setswere collated via a template circulatedamongthepartners.
8) IndicatorsdevelopmentDevelopmentofthesetofindicatorstogetherwiththeirdescription.
References
Abrassart,A.(2013).Cognitiveskillsmatter:Theemploymentdisadvantageoflow-educatedworkersincomparativeperspective.EuropeanSociologicalReview,29(4),707–719.http://doi.org/10.1093/esr/jcs049
Bol,T.,&vandeWerfhorst,H.G.(2013).EducationalSystemsandtheTrade-OffbetweenLaborMarketAllocationandEqualityofEducationalOpportunity.
Page 30
H2020-YOUNG-SOCIETY-2015 YOUNG_ADULLLT Deliverable 4.1
Page30of31
ComparativeEducationReview,57(2),285–308.http://doi.org/10.1086/669122
Busemeyer,M.R.,&Trampusch,C.(2012).Thepoliticaleconomyofcollectiveskillformation.Oxford:OxfordUniversityPress.
Desrosières,A.(2008).Lastatistique,outildegouvernementetoutildepreuve.L’argumentStatistiqueI :PourUneSociologieHistoriquedeLaQuantification,7–20.
Dupriez,V.,Dumay,X.,&Vause,A.(2008).Howdoschoolsystemsmanagepupils’heterogeneity.ComparativeEducationReview,52(2),245–266.
Espeland,W.N.,&Stevens,M.L.(1998).Commensuration.pdf.AnnualReviewofSociology,24,313–343.
Green,A.(2013).Educationandstateformation(third).London:PalgraveMacmillan.
Green,A.,Green,F.,&Pensiero,N.(2015).Cross-countryvariationinadultskillsinequality:Whyareskilllevelsandopportunitiessounequalinanglophonecountries?ComparativeEducationReview,59(4),595–618.http://doi.org/10.1086/683101
Hacking,I.(1999).Thesocialconstructionofwhat?History.Cambridge:HarvardUniversityPress.
Hall,P.a,&Soskice,D.(2001).VaritiesofCapitalism.TheInstitutionalFoundationsofComparativeAdvantage.OxfordUniversityPress(OxfordUni).NewYork:OxfordUniversityPress.http://doi.org/10.1093/0199247757.001.0001
Hanushek,E.A.,Woessmann,L.,&Zhang,L.(2011).GeneralEducation,VocationalEducation,andLabor-MarketOutcomesOvertheLife-Cycle.NationalBureauofEconomicResearch,1–51.
Heckman,J.J.,Stixrud,J.,&Urzua,S.(2006).TheEffectsofCognitiveandNoncognitiveAbilitiesonLaborMarketOutcomesandSocialBehavior.JournalofLaborEconomics,24(3),411–482.http://doi.org/10.1086/504455
Heisig,J.P.,&Solga,H.(2015).SecondaryEducationSystemsandtheGeneralSkillsofLess-andIntermediate-educatedAdults:AComparisonof18Countries.SociologyofEducation,88(3),202–225.http://doi.org/10.1177/0038040715588603
Mayer,K.U.,&Solga,H.(2008).SkillFormationInterdisciplinaryandCross-NationalPerspectives.Cambridge:CambridgeUniversityPress.
Meyer,H.-D.,&Benavot,A.(2013).PISA,Power,andPolicy:theemergenceofglobaleducationalgovernance.Oxford:SymposiumBooks.
Mons,N.(2007).Lesnouvellespolitiqueséducatives:LaFrancefait-ellelesbonschoix?Paris:PressesUniversitairesdeFrance.
ParreiradoAmaral,M.,Schaufler,S.&Weiler,A.(2017b).DocumentationofDatabase.YOUNG_ADULLLTWorkingPaper.Münster:WestfälischeWilhelms-UniversitätMünster.Psacharopoulos,G.,&Patrinos,H.A.(2004).Returntoinvestmentineducation:a
furtherupdate.EducationEconomics,12(2),111–134.http://doi.org/10.1080/0964529042000239140
Sen,A.(1992).Inequalityreexamined.Boston:HarvardUniversityPress.vandeWerfhorst,H.G.(2011).Skills,positionalgoodorsocialclosure?Theroleof
Page 31
H2020-YOUNG-SOCIETY-2015 YOUNG_ADULLLT Deliverable 4.1
Page31of31
educationacrossstructural–institutionallabourmarketsettings.JournalofEducationandWork,24(5),521–548.http://doi.org/10.1080/13639080.2011.586994
Weiler,A.,Wutzkowsky,F.&ParreiradoAmaral,M.(2016).YoungAdult.YOUNG_ADULLLTGlossaryEntry.Münster:WestfälischeWilhelms-UniversitätMünster.Availableunder:http://www.young-adulllt.eu/glossary/listview.php?we_objectID=219[latestaccess:22Sept.2017].
Weiler,A.,Schaufler,S.,ParreiradoAmaral,M.,GanterdeOtero,J.P.&Wutzkowsky,F.(201a).LaunchingandResearchDesign.StateoftheArtReport.YOUNG_ADULLLTWorkingPaper.Münster:WestfälischeWil-helms-UniversitätMünster.
WorldHealthOrganization.ConstitutionofTheWorldHealthOrganization(1948).NewYork:WorldHealthOrganization.http://doi.org/12571729
Page 32
H2020-YOUNG-SOCIETY-2015 YOUNG_ADULLLT Deliverable 4.1
1
Work Package 4
Quantitative Analysis Young Adults’ Data
Austria – National Briefing Paper with national and regional
data sets Ruggero Cefalo, Yuri Kazepov University of Vienna Date: 31-08-2017 Work Package 4 – Quantitative Analysis of Young Adults’ Data Deliverable D 4.1
Page 33
H2020-YOUNG-SOCIETY-2015 YOUNG_ADULLLT Deliverable 4.1
2
TableofContentsExecutiveSummary............................................................................................................................................................................2
Introduction............................................................................................................................................................................................3
Descriptionofthedatacollatedandqualitydataassessment..................................................................................3
1. Findings...........................................................................................................................................................................................4
1.1 Demographicstructure...................................................................................................................................................4
1.2 GeneralstateoftheEconomy.......................................................................................................................................6
1.3 Education..............................................................................................................................................................................9
1.4 Labourmarket..................................................................................................................................................................14
1.5 Redistributionandsocialinclusion.........................................................................................................................18
1.6 Healthandwell-being....................................................................................................................................................21
2. Emergingissues........................................................................................................................................................................23
3. References...................................................................................................................................................................................24
Figures
Figure1:Migrationrates(leftaxe,‰),olddependencyandfertilityrates(rightaxe),naturalpopulation
change(rightaxe,‰changeoverpreviousyear),Austria,UpperAustriaandVienna,2005-2015................6
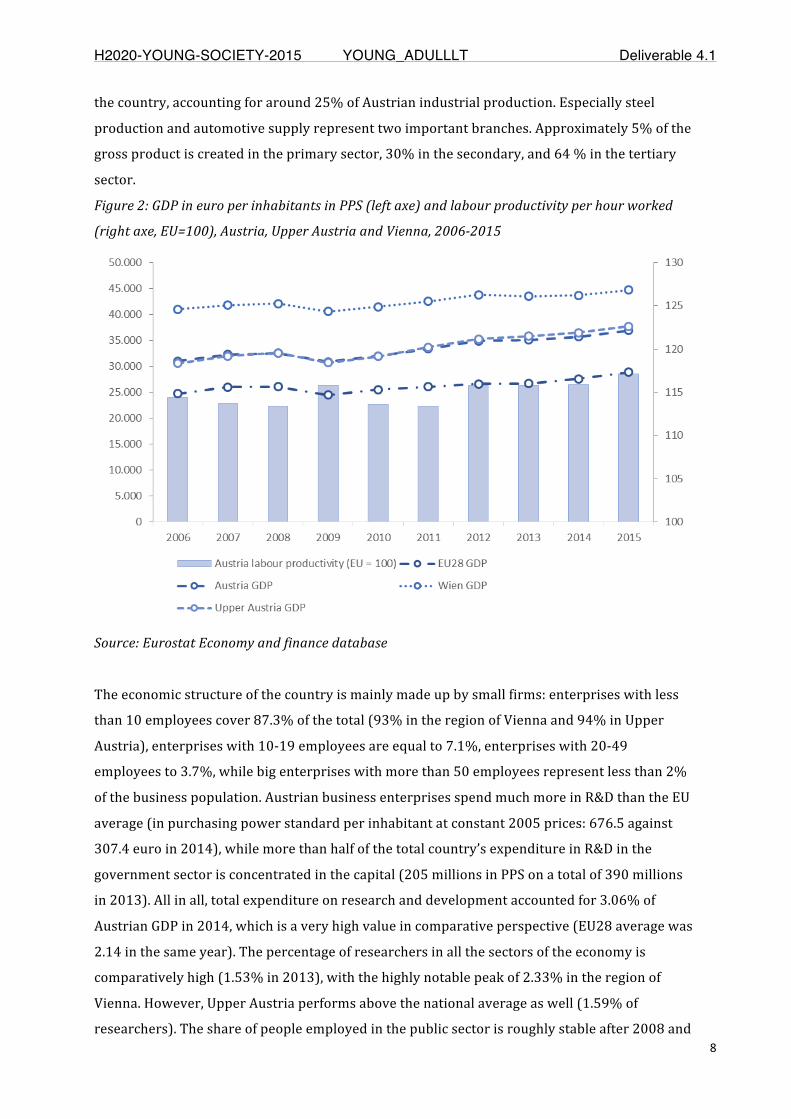
Figure2:GDPineuroperinhabitantsinPPS(leftaxe)andlabourproductivityperhourworked(rightaxe,
EU=100),Austria,UpperAustriaandVienna,2006-2015....................................................................................................8
Figure3:Educationalattainment(30-34,%)andparticipationineducationandtraining(25-34,%),
Austria,2005-2015..............................................................................................................................................................................12
Figure4:NEETrate(15-24,%)andearlyschoolleavingrate(18-24,%),Austria,UpperAustriaand
Vienna,2005-2015...............................................................................................................................................................................14
Figure5:youthemploymentandunemploymentrates(leftaxe,15-24,%),youthunemploymentratioof
youngpeople15-24(rightaxe),EU27,Austria,UpperAustriaandVienna,2005-2015......................................18
Figure6:GINIindexbeforeandaftertransfers(leftaxe,0:100),netdisposableincomeinhouseholdinPPS
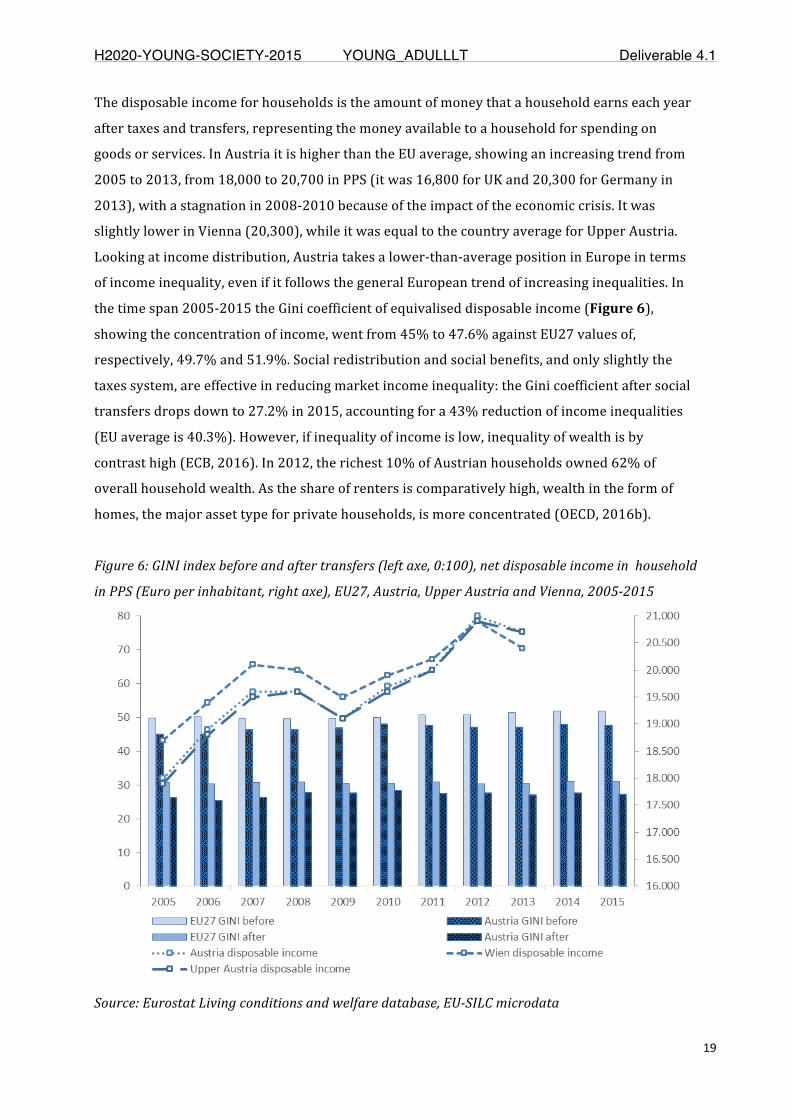
(Europerinhabitant,rightaxe),EU27,Austria,UpperAustriaandVienna,2005-2015......................................19
Figure7:Highsatisfactioninvariouslifedomains(25-34,%),EU28andAustria,2013.....................................22
ExecutiveSummary
Thisnationalbriefingpaperprovidesashortoverviewofthelivingconditionsofyoungadultsin
AustriabyanalyzingthefunctionalregionsofViennaandUpperAustria,selectedascasestudies
fortheYOUNG_ADULLLTproject.
Thecontextuallivingconditionsofyoungpeopleareanalyzedbylookingatavailableindicators
atNUTS0andNUTS2level,collectedbytheworkingpackageleadersandintegratedwithlocal
data(whenavailable),alongthefollowingdimensions:demographicstructureofthepopulation
Page 34
H2020-YOUNG-SOCIETY-2015 YOUNG_ADULLLT Deliverable 4.1
3
anditssubgroups;generalstateoftheeconomy;education;labourmarket;redistributionand
socialinclusion;healthandindividualwell-being.
Introduction
Thisnationalbriefingpaperwillprovideashortoverviewofthelivingconditionsofyoung
peopleinAustriaand,morespecifically,inthetwofunctionalregionsselectedforthe
YOUNG_ADULLLTproject,namelytheregionofViennaandUpperAustria.Thetworegions
sharesomecharacteristicswithinthesamefederalregulatoryframework,buttheypresent
differencesinthesocio-economicstructure,politicaltraditionanddegreeofurbanization,as
wellasinthewaytheyreacttocommonchallengeslikeyouthunemployment.Datawas
collectedatnational(NUTS0)andregional(NUTS2)levelaccordingtosixdimensionof
contextuallivingconditionsagreeduponintheWP4guidelines1.Eurostatonlinedatabasesat
aggregatednationalandregionallevelandmicrodatafromdifferentsurveys(LFS,EU-SILC,
PISA,PIAAC)wereusedassources.Themaincorpusofinternational,harmonizedand
consequentlycomparabledatawassuccessivelycomplementedbydatacollatedatthelocal
level.ContextuallivingconditionsofyoungpeopleinAustriaareanalyzedbylookingatthe
demographiccharacteristicsofthepopulationanditssubgroups;atthestructureofthe
economy;attheinputsandoutputsoftheeducationsystem;atthelabourmarketsituation;at
themateriallivingconditionsofyoungpeopleandattheirparticipationascitizenstothe
politicalandciviclife;athealthconditionsandindividualwell-being.
Descriptionofthedatacollatedandqualitydataassessment
EurostatandOECDprovideavastamountofdatathatcanbeusedtocomparativelyassessliving
conditionsofyoungpeopleindifferentdomainsandinvariouscountries/regions.However,
mostofthedataareprovidedatnationallevel,whiledataavailabilityattheregional/locallevel
islimitedatNUTS2levelandstronglylimitedatNUTS3level.Thisrestrainstheopportunityof
comparabilityamongregionstolimitedrangeofindicators.Moreover,harmonizeddataarehard
tocomplementwithlocaldata,oftensufferingfromafragmentedlandscapeofsources,asthey
arecollectedformoreorlessspecificpurposesandusuallynotwiththeobjectiveofinteraction
withotherdatasources.Inaddition,localdataareusuallyalreadyaggregatedanditisn’t
possibletofurtherelaboratethem.Thismakesdifficultthecomparabilityamongregionsandat
theEUlevel.AsfortheavailabledatapublishedbyEurostat,datacoverseveralfieldsandare
complementedwithmetadataandinformationabouttimeseries.However,accessibilityofdata
maybeaproblematicissue,asdatabasesonEurostatarenotcompletelycombinedandflexible
1Thedatacollectionwascarriedoninaworkinggroupofwhichalsothefollowingstudentswerepart:GeorgBayerl,Paul Marius Benjes, Philipp Gschnitzer, Alesja Kicaj, Hannes Kofler, Philipp Molitor, Tatjana Neuhuber, Niklas
Pernhaupt.
Page 35
H2020-YOUNG-SOCIETY-2015 YOUNG_ADULLLT Deliverable 4.1
4
sothatthecollectionisattimesdifficult:asanexample,thesameinformationontwodifferent
agegroupsmaybeavailableonlylookingattwodifferentdatabasesindifferentsectionsofthe
website(theNEETratefor15-24isavailableamonglabourmarketstatisticswhiletheNEET
rate15-29isavailableamongyouthstatistics).Ofcourse,thecomplexityandvarietyofthedata
publishedmakeacomprehensiveintegrationdifficulttoachieve.InthecaseofAustria,the
selectedfunctionalregionsmatchwithadministrativeboundariesofthefederalstatesandofthe
NUTS2regions,sothatagoodcompromisebetweentheexistingdataandtheresearchobjective
canbeestablished.Notwithstanding,itisimportanttobeawarethatthedatacanonly
approximatelygraspthecomplexityofthecontextualconditionsandinterdependenciesyoung
adultareembeddedin.
Forthereasonswereported,thenationalbriefingpapermakeslimiteduseoflocaldatafrom
Austriansources,asinternationalsourcesprovideawideamountofvaluableinformationfor
ourpurpose.Localdataontopiclikedemography,economicsystem,educationandlabour
market,redistribution,healthandwell-beingaremainlymadeavailablebyStatistikAustria,the
nationalstatisticalagency.Someadditionalinformationwasretrievedbyofficialwebsitesand
reportsofAustrianInstitutions(Ministers,CriminalPoliceOffice,ChambersofLabourand
EconomicChambers).TheroleofStatistikAustriaistoprovidereliablycollectedandexpertly
analyzedpolitical,socialandeconomicinformationonAustriaanditsregions.Theagencyis
committedtocreatestatisticsforadministrativepurposesandpoliticaldecision-making,butit
alsooffersreportsandinformationtogeneral-publicandresearchusers.
1. Findings
1.1 Demographicstructure
Austriaisarelativelysmallcountry,coveringatotalareaof83,879squarekilometers,thearea
oftheregionofViennais415squarekilometers,whileUpperAustriais11,980square
kilometers.Thepopulationincreasedgraduallyinthelasttenyears,goingfrom8.2millionin
2005to8.7millioninhabitantsin2016(equalto1.7%ofthetotalEU28population),butitis
unevenlydistributedoverthecountry:thepopulationdensityisequalto104individualsper
squarekilometer(122inUpperAustria),butintherelativelysmallareaoftheregionofVienna
live4,507inhabitantspersquarekilometer.Migrationisincreasinglyaffectingthedemographic
structureofthecountry,asthecruderateofnetmigrationroseupfrom2.9per1,000in2008to
7.7in2013,andjumpedto13per1,000in2015(inthesameyear,theratewas14.3%for
Germanyand5.1%fortheUK):thepeakwasinVienna(21.6%,seeFigure1).Thelargestshare
ofmigrantscomesfromGermany,Bosnia-Herzegovina,Turkey,SerbiaandRomania.
Page 36
H2020-YOUNG-SOCIETY-2015 YOUNG_ADULLLT Deliverable 4.1
5
ViennaisthecapitalofAustriaandatthesametimeoneoftheninefederalstates
(Bundesländer)ofAustria.Itisthe7thlargestcitywithintheEuropeanUnionandbyfarthe
largestcityinAustria.Viennaisatthesametimethemostpopulatedandthesmallestfederal
state.Morethan20%ofAustrianslivesinVienna,andthepopulationintheregionisalso
increasingatafasterpacethanthecountry’saverage(1.8%against0.4%inAustriaand0.7%in
UpperAustriain2015),reaching1.8millioninhabitantsin2014(with107.7womenevery100
men),around20%oftotalAustrianpopulation.Thecityissupposedtogrowupto2million
inhabitantsuntil2025,duetomigrationflows.Currently,42%ofthepopulationhasamigration
background,whilemorethan20%oftheVienneseinhabitantsarenon-Austrians,havingmainly
SerbiaandTurkeyascountryoforigin(StadtWien,2015).Moreover,inJune2016
approximately21,000refugeeswerelivinginViennaandseekingforasylum.
UpperAustriaislocatedintheNorthofAustria,itisthethirdlargestAustrianfederalstatein
termsofitspopulation:thenumberofinhabitantsin2014was1.4million(102.9womenevery
100men).TheregionalcapitalofLinzisthethirdlargestcityofAustria,withlittlelessthan
200,000inhabitants.InUpperAustria17.1%ofthepopulationhasamigrationbackgroundand
9.3%hasacitizenshipotherthanAustrian.ThelargestshareofmigrantscomefromBosnia-
HerzegovinaandGermany.
Lookingatavailabledemographicdata,generallivingconditionsinAustriaarecomparatively
goodwithrespecttootherEuropeancountries.Infantmortalityinthefirstyearafterbirthis
medium-low,andittouchedaminimumof3.1deathsperthousandin2015.Inthesameyear,
themedianagewas43yearsandthelifeexpectancy81.6years,attheleveloftheEuropean
average.Thelatteroverallvalueistheresultofrelevantgenderdifferences:anAustrianfemale
in2015couldexpecttolive83.7years,whileamalehadalifeexpectancyof78.8years.Austria
shareswithotheradvancedEUcountriesaconditionoflowfertilityandgradualageing.Asfor
thefirstpoint,thefertilityratewas1.47in2015.Again,thenationalvalueresultsfromregional
variations:theregionofViennaismoreaffectedthanUpperAustriabylowfertility,asthe
respectiveratewere1.42and1.61in2014.Duringthepasttwodecades,fertilityfellmostly
amongwomenintheirtwentiesandincreasedforwomenintheirthirties.Asforthesecond
point,thedemographicstructureoftheAustrianpopulationhasbeenageinginthelastten
years.Thisisshownbytheincreaseoftheold-dependencyrate(ratiobetweenpopulationaged
65andovertopopulation15-64),thatwentfrom23.5%to27.5%inthetime-span2005-2016.
Inparallel,theyoung-agedependencyisgoingdown(from23.8%in2005to21.3%in2016).
Youthpopulationaged20-24and25-29accountedrespectivelyfor6.4%and6.7%oftotal
inhabitantsin2015.WhilethevaluesforUpperAustriaareclosetothecountryaverage
(respectively6.3%and6.5%),intheregionofViennatheweightofyoungpeopleontheoverall
populationisstrongerandincreasinginthelastyears(respectively7.3%and8.5%),mostly
becauseoftheincreaseofmigrationflows(Figure1).
Page 37
H2020-YOUNG-SOCIETY-2015 YOUNG_ADULLLT Deliverable 4.1
6
Figure1:Migrationrates(leftaxe,‰),olddependencyandfertilityrates(rightaxe),natural
populationchange(rightaxe,‰changeoverpreviousyear),Austria,UpperAustriaandVienna,
2005-2015
Source:EurostatDemographyandmigrationdatabase
Amongyoungpeople,in201352.7%ofthoseaged20-29livedwiththeparents.Thispercentage
hasshownacertainstability,fluctuatingbetween50and54%inthelasttenyears.Comparing
AustriawithotherEUcountries,theshareofyouthstilllivingwiththefamilyisslightlylower
thantheEUaverage,butitishigherthanotherCentralEuropeancountrieslikeFranceandthe
Netherlands,aswellasthanNortherncountrieslikeUKandFinland.However,theaverage
valuescoversstronggenderdifferences.Thepercentageofyoungmaleslivingwithparentsis
62.1%against41.8%forfemales,anditisworthtonotethatthis20-percentage-points
differenceiswiderthantheEU27averagedifferenceof15points,recallingthepersistenceof
genderdifferencesrelatedtotraditionalfamilystructures.
1.2 GeneralstateoftheEconomy
Austria’seconomyisleavingbehindsomeyearsofslowgrowthintheaftermathofthefinancial
crisis.GDPmeasuresshowthat,generallyspeaking,theAustriancontextismarkedbypositive
Page 38
H2020-YOUNG-SOCIETY-2015 YOUNG_ADULLLT Deliverable 4.1
7
economicconditions.Theimpactofthecrisiswasevidentbetween2008and2009,asshownby
thedropinGDPforinhabitant(from32,500to30,900,seeFigure2).Alsotherealgrowthrate
ofregionalgrossvalueadded(GVA)showedanegativesignin2009(-4.2%).However,after
2010theeconomyofthecountrybegantorecover:theGDP,theGVAandthelabour
productivitymeasuredinGDPperhourworkedstartedincreasing,evenifataslowerpacewith
respecttothepre-crisisyears.Afterastagnationin2012-2013,thegrossdomesticproducthas
beengrowingagainsincethen(OECD,2017a).In2015theGDPinEuroperinhabitant(PPS)was
36,900,whichisupto128%oftheEUaverage.
Allinalllabourproductivitygrowthhasslowedoverthepastdecade,especiallyinservices
(OECD,2017b),butit’shigheranddevelopingatafasterpacethantheEuropeanaverage:in
2015,theGDPperhourworkedwasequalto117.1%oftheEU28.Productivityperhourworked
hasgrownconstantlysince2000and,unliketheEUaverage,didnotdropevenduringthecrisis
years,butproductivityperemployeeremainedflatafter2008-2009.Theexplanationisthatthe
increaseinemploymentsincethecrisishascreatedmorepart-timejobsandfewerfull-time
ones,sothatproductivityissharedamongarisingnumberofemployees(European
Commission,2017).
TheleadingroleofViennaintheAustrianeconomyisconfirmedbythehighGDPpercapita
(44,700europerinhabitant,asopposedto36,900inAustria),closertosomeoftherichest
Europeanregionsandequalto155%oftheEUaverage.Howeverthisdistanceisshrinking,as
thesamevaluewasupto165%in2012.TheregionofViennaaccountsformorethan25%of
valuecreationinthecountry.RealGVAattheNUTS2leveliscontinuouslygrowinginthelast
years,atafasterpacethantheAustrianaverage.Approximately86%oftheViennesegross
productiscreatedinthetertiarysector,whileapproximately14%inthesecondarysector.The
Vienneseeconomyhasgonethroughstructuralchangesduringthelastdecades.Thisis
especiallyreflectedinthegrowingamountofpeopleemployedintheservicesector(currently
around85%).Inthesub-sectorsoftheservicesector,likeaccommodationandgastronomy,
financeandinsuranceservices,knowledge-intensecorporateservices,educationandteachingas
wellashealthandsocialservices,anincreaseinemploymentof25%couldbewitnessedinthe
lastdecade.Apartfromthat,thecityfunctionsasahubforbusinesswithEasternEuropean
countriesandisstillamajortouristdestination.Relevantroleintheeconomicstructureofthe
regionisalsoplayedbythegrowingcreationofgreenandbythefurtherdevelopmentofVienna
asacenterforhighereducationandservicesinthefieldsofICT,LifeSciences,andR&D
(Eichmann&Nocker,2015).
TheeconomicperformanceofUpperAustriaappearsalsoremarkable,astheGDPper
inhabitantsisoverthenationalaverage(37,700).UnlikethecaseofVienna,thedistancefrom
theEUaveragehasshrunkenonlyslightly(from134%in2013to131%in2015),followingthe
generaltrendofthecountry.UpperAustriaisoneofthemaincentersofindustrialproductionin
Page 39
H2020-YOUNG-SOCIETY-2015 YOUNG_ADULLLT Deliverable 4.1
8
thecountry,accountingforaround25%ofAustrianindustrialproduction.Especiallysteel
productionandautomotivesupplyrepresenttwoimportantbranches.Approximately5%ofthe
grossproductiscreatedintheprimarysector,30%inthesecondary,and64%inthetertiary
sector.
Figure2:GDPineuroperinhabitantsinPPS(leftaxe)andlabourproductivityperhourworked
(rightaxe,EU=100),Austria,UpperAustriaandVienna,2006-2015
Source:EurostatEconomyandfinancedatabase
Theeconomicstructureofthecountryismainlymadeupbysmallfirms:enterpriseswithless
than10employeescover87.3%ofthetotal(93%intheregionofViennaand94%inUpper
Austria),enterpriseswith10-19employeesareequalto7.1%,enterpriseswith20-49
employeesto3.7%,whilebigenterpriseswithmorethan50employeesrepresentlessthan2%
ofthebusinesspopulation.AustrianbusinessenterprisesspendmuchmoreinR&DthantheEU
average(inpurchasingpowerstandardperinhabitantatconstant2005prices:676.5against
307.4euroin2014),whilemorethanhalfofthetotalcountry’sexpenditureinR&Dinthe
governmentsectorisconcentratedinthecapital(205millionsinPPSonatotalof390millions
in2013).Allinall,totalexpenditureonresearchanddevelopmentaccountedfor3.06%of
AustrianGDPin2014,whichisaveryhighvalueincomparativeperspective(EU28averagewas
2.14inthesameyear).Thepercentageofresearchersinallthesectorsoftheeconomyis
comparativelyhigh(1.53%in2013),withthehighlynotablepeakof2.33%intheregionof
Vienna.However,UpperAustriaperformsabovethenationalaverageaswell(1.59%of
researchers).Theshareofpeopleemployedinthepublicsectorisroughlystableafter2008and
Page 40
H2020-YOUNG-SOCIETY-2015 YOUNG_ADULLLT Deliverable 4.1
9
equalto6.8%oftotalemploymentin2014,withastrongconcentrationinVienna(7.5%in
Vienna,only5.4%inUpperAustria),whileemploymentineducationiscontinuouslygrowing
andwasequalto6.9%in2014with,again,apeakintheregionofVienna(8.7%).Beingthe
capitalofAustriaandastronglyattractivehighereducationcenter,thesehighvaluesfor
employmentinpublicandeducationsectorsareeasilyexplainable.Finally,peopleemployedin
thehealthsectorandinsocialworkmakeupalmost10%oftotalemployment(8.9%Upper
Austria,10.8%inVienna).
1.3 Education
Educationplaysakeyroleinprovidingindividualswiththeknowledge,skillsandcompetences
neededtoparticipateeffectivelyinsocietyandintheeconomy.LikewiseGermany,theAustrian
educationsystemischaracterizedbytheearlytrackingofpupils.Thefirstdivisionintotracks
takesplacewhentheyare10yearsold,atthebeginningoflowersecondaryeducation.Atthe
beginningofuppersecondaryeducation,thesystemismadeupof4tracks.
Roughly80%ofyoungcohortsafterlowersecondaryeducationentersavocationaleducation
andtraining(VET)course,37%indualapprenticeshipand43%inavocationalschool(BMS)or
college(BHS)(Bliemetal.,2016).Theexpenditureperstudentinvocationalprogrammesis
muchhigherthanforgeneralprogrammes(16,554against13,260USdollars).TheVETsystem
ischaracterizedbythecompetitionbetweenapprenticeshipandschool-basedvocational
courses(Lassnig,2011).However,itishighlydiversewithmanydifferentprogrammesand
institutionsofferingaccesstodifferentsocialgroups,andwithrangeofoptionsforstudentsto
accesshighereducation.SocialpartnersarealsoincludedinthemanagementoftheVETsystem,
throughtheEconomicChamberandtheChamberofLabour.
Thehighereducationsystem(HE)combinespost-secondaryandshort-cyclevocationalcourses
withbachelorandmastercoursesofferedbyuniversitiesanduniversitiesofappliedsciences.In
particular,Viennahosts9publicuniversities,4privateuniversitiesandateachertraining
college,6universitiesofappliedsciences.UpperAustriahasoneuniversity(Linz)andtwo
universitiesofappliedsciences.
In2013thepublicexpenditureontheeducationsysteminAustriawasequivalentto5.6%ofthe
nationalGDP.ExpenditureinHE(mainlyuniversityofappliedscienceanduniversity)makesup
toalmost24%oftotalexpenditureineducation,whiletheresourcesdirectedtoVETareequal
to14%ofthetotalamount.Asfortheexpenditurewhichisbrokendownbyfederalstates,the
largestshareisspentinVienna(20%),whileUpperAustriaranksthird,with12%.
Internationalvariationinthestructureofeducationsystemsbringsthenecessitytocomparenot
onlyparticipationandgraduationrates(inthefollowingparagraphs),butalsothequalityof
contentsandskillsachievedbystudentsandpupilsduringtheireducationalcareers.Education
Page 41
H2020-YOUNG-SOCIETY-2015 YOUNG_ADULLLT Deliverable 4.1
10
resultsinAustriaarestillinthemiddleoftherangecomparedtoothercountries,but
weaknessesinsomebasicskills(likereading)wereconfirmedbytheirdeteriorationinthelast
2015OECDProgrammeforInternationalStudentAssessment(PISA)test,collectedon15years
oldpupilsatthebeginningofuppersecondaryeducation.In2015Austrianpupilsgainedamean
scoreof497pointsinnumeracyand484inliteracy(EUaveragewererespectively491and
492).Onaveragegirlsoutperformedboysby2points.However,thecoefficientsofvariation
were0.19and0.21,inlinewiththeEuropeanaverageandstablebetween2003and2015,
pointingoutpersistingdifferencesaccordingtogenderandsocialbackgroundineducational
achievement.Parents’socioeconomicstatusandtheireventualmigrantbackgroundcontinueto
haveamajorinfluenceontheirchildren’seducationresults.In2015,firstgenerationimmigrant
studentsare3timesmorelikelythannativebornstudentstoleaveschoolearlybefore
completinguppersecondaryeducation(EuropeanCommission,2017).
Lookingatskillsofyoungpeopleaged20-30(PIAACdata),theadvantageofyoungAustrian
adultswithrespecttotheirEuropeanpeersincreases:in2012themeanscoreofAustriansin
numeracywas286againsttheEUaverageof262;inliteracythemeanscorewas284againstthe
EUaverageof272.However,inboththedomainsthevariationamongrespondentwaslower
thanEUaverage(respectively0.16and0.15against0.20and0.18),pointingoutthecoexistence
ofagoodlevelofskillattainmenttogetherwitharelativelyevenskilldistributionamongyoung
people.
Participationinchildcareandearlyeducationisrelevantindevelopingcognitiveabilitiesand
bufferingtheinfluenceofthefamiliarbackground.Thishasimpactonopportunitiesin
educationandonthelabourmarketlaterinlife.InAustria,theparticipationofchildrenin
childcareandpre-schooleducationisincreasing:in2012,90.9%of4-years-oldswerein
education(82.5%in2005),buttheratewasstillslightlylowerthantheEuropeanaverage
(91.9%in2012forEU27).Withrespecttothenationalaverage,intheregionofViennatherate
islower(86.5%in2015),whileparticipationismuchhigherinUpperAustria(89.5%),butboth
theregionsshowaslightlydecreasingtrendinthelast2-3years.
Lookingatthefollowingstagesoftheeducationsystem,participationinupper-secondaryand
post-secondarynon-tertiaryeducation(ISCED3-4)iscomparativelyquitehighespeciallyin
UpperAustria,asitisconnectedtotheregionalstructureofthelabourmarketandtothejob
demandexpressedbyastrongindustrialproduction.In2012theparticipationrateof
individuals15-24wasequalto42.9%,4pointsabovetheEU27average.InVienna,the
percentageofstudentsinupper-secondaryeducationandpost-secondarynon-tertiary
educationonthepopulationdroppedfrom44.7%in2005to39.8%in2012.InUpperAustria
thesameindicatorremainedquitestable(45.9%in2012).Moreover,youngpeopleinUpper
Austriatendtoenrollmoreinvocationalprogrammes(76.2%ofallthepupilsinupper
secondaryeducation),whileinViennaonly58.4%ofpupilsenrollinvocationalprogrammes.
Page 42
H2020-YOUNG-SOCIETY-2015 YOUNG_ADULLLT Deliverable 4.1
11
Asfortertiaryeducation,participationinAustriaisstronglyincreasinginthelasttenyears.At
thenationallevel,therateofstudentsintertiaryeducationaspercentageofthepopulationof
20-24yearsold,jumpedfrom46.6%in2005to70.8%in2012(theEU27averageis64.2%).In
theViennaregionthesamerateincreasedto151.4%in2012,duetothefactthattheUniversity
ofViennaattractsmanyAustrianandinternationalstudents.InUpperAustria,theparticipation
ismuchlowerbutitisalsoincreasing:in2012,studentsintertiaryeducationcovered40.4%of
thepopulationaged20-24years,18.5percentagepointsmorethanin2005.
Finally,bylookingatlifelonglearningeducationatalaterage,afterhavingusuallycompleted
initialeducation,youngAustriansstillshowrelevantcommitmentintraining:allinall,24.6%of
youngpeopleaged25-34statedthattheyparticipatedinsomeformsofeducationandtraining
activitiesin2016(theEU28averageis17.4%),25.7%forwomenand23.6%formen.
Goodeducationandskillsareimportantrequisitesforfindingajob.InAustria,84.5%ofadults
aged25-64hadcompletedatleastuppersecondaryeducation(ISCED3-8)in2015,wellabove
theEU27averageof76.5%.Thisistrueespeciallyformales,as88%ofmenhavesuccessfully
completedhigh-schoolcomparedwith80%ofwomen.Lookingateducationattainmentof
youngpeople,i.e.atthelevelandtypeofthequalificationsobtained,themaintrendinAustriais
theupgradingofthequalificationofyouthpotentialworkforce:thedata(Figure3)showadrop
intheshareoflow-educated(from16.5%in2005to13.2%in2016)andupper-secondary
educated(from63.1to44.8%),andasteadyincreaseoftertiaryeducated(from20.4%to42%).
Thedropinparticipationinuppersecondaryeducationandthejumpinparticipationintertiary
educationafter2013ismainlyrelatedtoachangeintheclassificationofAustrianqualifications,
accordingtotheISCED2011standards:indetail,qualificationsattainedafter4and5yearsin
BHSorvocationalcolleges,havebeenclassifiedasshort-cycletertiaryeducation2,thus
accountingforthestrongshiftsinparticipationrates.
2 For information on the application of ISCED 2011 standards at the Austrian education system, see:
http://www.bildungssystem.at/en/footer-boxen/isced/international-standard-classification-of-education/
Page 43
H2020-YOUNG-SOCIETY-2015 YOUNG_ADULLLT Deliverable 4.1
12
Figure3:Educationalattainment(30-34,%)andparticipationineducationandtraining(25-34,
%),Austria,2005-2015
Source:EurostatEducationandtrainingdatabase,LFSmicrodata
Thedatashowrelevantdifferencesattheregionallevelandsomesignsofarecentdeclinein
educationalattainments.Overall,thepercentageoflow-educatedyoungadultsof30-34years
old(ISCED0-2)isdecreasinginthelasttenyears,butthiscomestogetherwithanincreaseafter
2014(from11.6%to13.2%in2016,theEU28averageis15.3%),reachingaworseningpeakof
17.3%in2016inVienna,6.4percentagepointshigherthaninUpperAustria.Coherently,the
rateofearlyschoolleavers(thepercentageofthepopulationaged18to24havingattainedat
mostlowersecondaryeducationandnotbeinginvolvedinfurthereducationortraining)slightly
increased7.8%in2015(Figure4).Thetrendtowardsashrinkingshareofloweducatedis
commonbothformalesandfemales,butseemstointerruptafter2014.Moreover,a
characteristicoftheAustriancontextthatdidnotemergedbydataonparticipation,isthe
educationaldisadvantageofwomen,whichisshrinkingbutstillexisting:in2005theshareof
low-educatedwomenwas16.5%against11.2%ofmen,whiletheEUaveragewasrespectively
21.6%against23.9%;in2016theshareoflow-educatedwomenwas13.2%against10.8%of
men,whiletheEUaveragewasrespectively15.3%against19%.
Page 44
H2020-YOUNG-SOCIETY-2015 YOUNG_ADULLLT Deliverable 4.1
13
Secondaryeducationattainment(ISCED3-4)forthoseaged30-34ishigherinAustriathanEU27
average(50.2%and44%respectively),andhigherformen,52.7%,thanforwomen,47.6%.
However,lookingatuppersecondaryvocationaleducationattainmentthedifferenceisstriking:
47.2%against39.5%3.Hereitisworthtonoticethatvocationalprogrammesatuppersecondary
levelaremoreeffectiveinbridgingthetransitionstothelabourmarketthangeneral
programmes.ThisisstronglyconfirmedbythedataregardingAustria,asthedifferencein
unemploymentratesbetweenVETandgeneralsecondaryeducatediswiderthantheaverages
ofotherEUcountries(OECD,2016a).Tertiaryeducationattainment(ISCED5-8)provide
considerableearningadvantagesforbothgenderslaterinthelabourmarket,butmengraduates
especiallyinthefieldofengineering,manufacturingandconstructionformen,whilewomen
mainlyinteachertrainingandeducationsciences.
Allinall,thepercentageofhighereducatedaged30-34was38.7%in2015,veryclosetothe
EU27average(38.8%).FollowingtheEuropeantrend,womenaremoretertiaryeducatedthan
men(40%against37.5%),butthedivideiscloserthantheEUaverage(43.4%against34%).A
relevantshareofgraduatesinhighereducationattainashort-cycletertiarydegreeasa
maximumqualification,whiletheshareofBachelorgraduatesiscomparativelylow.Thisisdue
tothediffusionofvocationalcolleges,ontheonehand,andtothefactthatBachelor
programmeswereintroducedonlyrecentlyintheAustrianeducationsystem,ontheother
(OECD,2016a).
Dataoneducationalattainmentcoverrelevantregionalvariations.Aswesaw,inUpperAustria
youngpeopleheavilyparticipateespeciallyinuppersecondaryeducation(ISCED3-4),whilethe
rateofhighereducationstudentsisquitelow.WithrespecttoVienna,inUpperAustria
vocationaleducationandthedualapprenticeshipsystemplayamoreprominentrolein
structuringthetransitionfromschooltowork.Coherently,havinganupper-secondarynon-
tertiarydegreeasmaximumqualificationisthemostcommonsituationamongyoungpeople
aged30-34inUpperAustria(57.6%in2015),especiallyamongmen(59.9%against57,6%of
women).Secondaryeducationisquitecomprehensiveamongyoungadults,asonly7.8%ofthe
population30-34in2014wasmadeupbylow-educatedyouth.Ontheotherhand,only33.1%of
thoseaged30-34hadaHEdegreein2015,andwomentendtobemoreeducatedthanmen
(34.6%against30.4%).
IntheViennaregion,duetotertiarizationanddevelopmentintheservicesectorsofthe
economy,upper-secondarynon-tertiarydegreeasmaximumqualificationgoesdownto37.2%,
beingmorecommonforwomen(37.9%).HighereducationiswaymorewidespreadinVienna,
withnogenderdifference(48.8%formalesandfemales).Thisiscoherentwiththedataon
participation,confirmingthestrengthofHEintheViennaregion.
3 Onthecontrary,lookingatgeneraluppersecondaryeducationasmaximumattainment,Austrianwomenhavearate8.1%against5.5%ofmen.
Page 45
H2020-YOUNG-SOCIETY-2015 YOUNG_ADULLLT Deliverable 4.1
14
ThelinkbetweeneducationandthelabourmarketstillappearstobestrongerinAustriaif
comparedtoEurope,evenifslightlydeterioratingafter2012(Figure4):onlyalimitedshareof
youngpeopleisexcludedbothfromworkingandtrainingactivities,goingtogetherwiththe
aforementionedonaverageorabove-averageattainmentrates.TheAustrianNEETrate,
measuringthepercentageofyoungpeopleaged15-24outofeducationandnotemployed,was
7.5%in2015,increasingafter2012.IntheEU28theratewas12%butitisconstantly
decreasing,sothatthegapwithAustriaisreducinginthelast3years.However,therateof
youngpeopleoutofeducationandworkishigherintheViennaregion(11.1%in2015),while
extremelylowinUpperAustria(5.9%in2015).
Figure4:NEETrate(15-24,%)andearlyschoolleavingrate(18-24,%),Austria,UpperAustria
andVienna,2005-2015
Source:EurostatEducationandtrainingdatabase,LFSmicrodata
1.4 Labourmarket
Austriaremainsanattractivedestinationforforeignworkersandisexperiencingacontinuous
inflowfromEUandnon-EUcountriesalike.This,togetherwiththelongerworkinglivesofelder
workers(duetorestrictionsonearlyretirement)andincreasingfemalelabourmarket
participation,ishelpingtoincreasethelaboursupplyandpotentialgrowth.Employmenthas
beenincreasing,buttheeconomycannotfullyabsorbthegrowthinthelabourforce.Thishasled
torecentincreasesinunemployment,especiallyforthelowskilled,evenifitremainslowin
Page 46
H2020-YOUNG-SOCIETY-2015 YOUNG_ADULLLT Deliverable 4.1
15
comparativeperspective.Thegaininemploymentsincethecrisishasmainlybeendrivenby
part-timejobsratherthanfull-timework.Workisthusdistributedamongmoreemployees.As
wesaw,thisislimitingunemploymenttosomeextentbutalsoresultinginstagnatinglabour
productivityperemployee(EuropeanCommission,2017).TheAustrianlabourmarketdisplays,
accordingtoOECDdata,anintermediatedegreeofemploymentprotection.Therelativeindexes
measuringthestrictnessofregulationonindividualandcollectivedismissalsforregular
contractsremainedstableinthelastyears,beingupto2,37,lessthancountrieslikeGermany,
ItalyorPortugal,butmorethanFinland,SpainandUnitedKingdom.
In2015Austriainvestedinlabourmarketpoliciesanamountofresourceswhichwasequalto
2.26%ofitsGDP.Expenditureincreasedduetothefirstimpactofthecrisisin2008-2009,then
decreasedandstartedrisingagaininthelast3years.ThemainfocusofAustrianLMPsis
training(measuresthataimtoimprovetheemployabilityofLMPtarget,covering0.46%of
GDP),whicharerelativelyhighcomparedtotheEUaverage.Expenditureonlabourmarket
servicesslightlyincreasedaswellinthelasttenyear(0.18%in2015,stilllowerthanthelastEU
averageavailable:0.21%in2011).Othermeasureslabelledasactive,namelyemployment
incentives,supportedemployment,directjobcreationaswellasstart-upincentives,arenotthe
focusofAustrianlabourmarketpolicies.
Lookingatcompensatoryinterventions,theexpenditureforunemploymentbenefitsandout-of-
workincomemaintenanceandsupportdeclineduntil2008,beingbelowEUaverage,but
increasedafterwardsto1.38%ofGDPin2015,afterafirstpeakin2009duetotheeconomic
crisis.ExpenditureforearlyretirementaresignificantlyhigherthantheEUaverage,although
theydecreasedfrom0.24%(2006)to0.15%in2011(theEUaverageexpenditurewas0.05%in
thesameyear),andto0.12%in2015.
Regardingparticipationinthelabourmarket,duringthetimespan2005-2015theoverall
economicactivityratefor15-65yearsoldwasslightlybutconstantlyabovetheEU-28average,
increasingfrom72.4%to75.5%.Thismeansthatin20153individualsoutof4wereworkingor
activelysearchingforajob.In2015,57.4%oftheAustrianyouth(aged15to24)wereanactive
partofthelabourmarket,60.7%formalesand54.1%forfemales.Thisratedidnotchange
substantiallyinthelasttenyears,anditishighabovetheEU27-averageof41.7,whichshowed
insteadadecreaseof2.7percentagepointsafter2008.AttheNUTS2level,theAustrianlabour
marketischaracterizedbyacleardisparitybetweenViennaandUpperAustria.InUpperAustria
theactivityrateofthoseaged15-24isveryhigh(62.9%in2015),asyoungpeopletendtospend
lesstimeineducation(mainlyvocational),thusenteringearlierthelabourmarket.Intheregion
ofViennatheactivityrateislowerthanthecountryaverage(51.2%in2015),duetothe
increasingrelevanceanddiffusionofhighereducation.
TheoccupationalstructureoftheAustrianlabourmarketappearstobemorequalifiedthanthe
EUaverage,inlinewithdataoninnovation,productivityandR&D.Almost30%oftheworking
Page 47
H2020-YOUNG-SOCIETY-2015 YOUNG_ADULLLT Deliverable 4.1
16
populationin2015wasemployedinhighskilledwhitecollaroccupations(ISCO1,2,3),while
22%waspartofthehighskilledbluecollargroup(ISCO6,7).TheEU28averagesforthesame
occupationswere,respectively,27%and19%.Ontheothersideofskillsdistribution,33%ofthe
Austrianworkingpopulationwasworkinginlowskilledwhitecollaroccupations(ISCO4&5)
andtheremaining16%wasemployedinelementaryoccupations,makingupthelowskilled
bluecollargroup(ISCO8,9).TheEU28averagesforthesameoccupationswere,respectively,
33%and21%.WhatisespeciallyvisibleintheregionofVienna,isthesignificantriseofjobs
withahighqualificationprofile.Therehasbeenatrendtowardsahigherrequestforhigh-
qualifiedactivities,whiletheshareofjobsfocusingonmanualactivitiesisshrinking.Moreover,
Vienna’sjobmarketbenefitsfromthefactthatthecity,asthecapitalofAustria,offersarelative
highamountofservicejobsinthepublicoreducationalsector.Ontheotherhand,opportunities
foryoungpeopleinthedualapprenticeshipsystemformedium-lowqualifiedjobsarequite
limited.ThemainchallengefortheVienneselabourmarketinthefuturewillbetoprovide
sufficientjobsforitsgrowingpopulation.AlsothejobdemandinUpperAustriashowsan
upgradingtrend,evenifitismorefocusedonindustrialproductionthatcanrelyonadeveloped
apprenticeshipsystem.Despitedifferencesinthestructureofeconomyandeducation,itis
forecastedagrowinggapbetweendemandandsupplyofhighskilledlabourinthenextyearsfor
bothregions(Eichmann&Nocker,2015).
OverthelastdecadetheoverallAustrianemploymentrateofthepopulationaged20-64
increased(from71.6%in2005to74.3%in2015).Moreindetail,thispositivetrendwasstrong
beforethecrisis,itstoppedin2008-2009andthenstabilizedafterwards.Asacontrast,theEU-
28employmentratedecreasedbetween2009and2013,whenitstartedrisingagain.However,
intheregionofViennathedatashowadecreaseafter2013,astheemploymentratefellfrom
69.3%to67.7%.InUpper-Austria77.7%ofthepopulationwereemployedin2015,whichis
3.4%abovetheAustrianaverage.Generallyspeaking,onehastonotethatthemaleemployment
ratefollowsaverysimilarpatterntotheAustrianaverage,whilethefemaleemploymentrate
graduallybutcontinuouslyincreased(from64%in2005to70.2%in2015)anddidnotstagnate
ordeclineduringthistimeperiod.Nevertheless,therewasstillagapof8.4%in2015(70.2%
against78.4%formales).Thisismainlyexplainedwiththeincreaseoffemaleemploymentin
non-standardjobs:iftheratioofmalepart-timeworkhasnearlydoubledfrom6.6%(2006)to
11.8%(2016),thefemaleratioofpart-timeworkjumpedupto47.7%in2016.Therefore,we
canconcludethattheAustrianlabourmarketisstillaffectedbyrelevantgendergapsinearnings
aswellasintypeofemployment,aswomenatalllevelsofeducationalattainmentearnlessthan
manandaremoreemployedinnon-standardemployment(fixedtermandparttime)(OECD,
2015).
Theoverallunemploymentrate(aged20to64)stronglydecreasedintheearly2000s,touching
3.8%in2008,wellbelowtheEU-27averageof6.7%.Duetothefirstimpactoftheeconomic
Page 48
H2020-YOUNG-SOCIETY-2015 YOUNG_ADULLLT Deliverable 4.1
17
crisesitroseby1.2%in2009,thendecreasedtill2011(4.3%).Sincethenithasbeenconstantly
movingup(5.6%in2015).InVienna,wheretheunemploymentistraditionallyhigher,itroseto
10.4%in2015(involvingmoremen,12%,thanwomen,8.6%),abovetheEUaverageof9.2%.
Ontheotherhand,inUpperAustriaunemploymentislowerandroughlystable(3.9%in2015).
InAustria,thepercentageoftheunemployedthathavebeensearchingforajobforayearor
longeriscurrently29.2%.ItishigherandstronglyincreasinginVienna(from29.3%in2009to
36.2%in2015,butstillsignificantlylowerthantheEUaverageof48.1%),andlowerand
decreasinginUpperAustria(20.3%in2015).Amongyoungpeopleaged15-29long-term
unemploymentisquiterare:1.6%inAustriaand3.5%intheregionofVienna(4.8%among
men),comparedto5.8%intheEU27.Long-termunemploymentisparticularlyrelevantasitcan
haveanegativeeffectonfeelingsofwell-beingandresultinalossofskills,furtherreducing
employability.
Lookingattheyouthpopulation(Figure5),theemploymentrate15-24decreasedinthelast
fiveyearsbutit‘sstillmuchhigherthantheEUaverage(51.3%against33.1%in2015),
especiallyinUpperAustria(57.3%),whileinViennaisequalto42%.Moreover,ifatthenational
levelandinUpperAustriayoungmenaremoreemployedthanyoungwomen(54%against
48.7%inAustria,61.6%against52.8%inUpperAustria),inViennayoungwomenareslightly
advantaged(42.5%against41.4%in2015).Accordingly,theunemploymentrateforthoseaged
15-24ismuchlowerthantheEUaverage(10.6%against20.4%in2015),beingslightlyhigher
formales(11.1%)thanfemales(10%).However,after2011itiscontinuouslyincreasing,
comingclosertothelevelsof2009.Onceagain,thesituationisworstinVienna,whereitpeaked
upto19.4%in2012andisequalto18%in2015:youngmalesinViennaappeartobe
particularlyatrisk,astheirunemploymentrateis21.9%,abovetheEU27averageof21%after
2012.Conversely,afterapeakof18%in2012,theshareofyoungwomenunemployedhasfallen
downinthelast3years.
Ontheotherhand,UpperAustriaconfirmstobeamorefavorablecontextalsointermsofyouth
unemploymentwithrespecttotheoverallAustriansituation,astheshareof15-24yearsold
activelysearchingforajobwasequalto9%in2015,9.5%formenand8.5%forwomen.The
youthunemploymentratio,measuringtheshareofunemployedyoungpeopleamongthewhole
youthpopulation,alsosupportsourviewrelatedtothecomparativelygoodconditionsofthe
youngpopulationintheAustrianlabourmarket.TheAustrianshareofyouthunemployedonthe
overallunemployedpopulationislowerthantheEU27average:6.1%for15-24and7.4%for20-
29in2015against8.4%for15-24and11.8%for20-29.Nevertheless,whiletheaverage
Europeantrendisimprovingafter2012-2013(itwasequalto9.9%in2013),theAustrianratio
wasequalto5.3%in2011.ThisconfirmshowinAustriatheyouthlabourmarketconditions,
evenifstillcomparativelybetterthanmanyEuropeancountries,havebeenslightlydeteriorating
inthelast3-5years.
Page 49
H2020-YOUNG-SOCIETY-2015 YOUNG_ADULLLT Deliverable 4.1
18
Figure5:youthemploymentandunemploymentrates(leftaxe,15-24,%),youthunemployment
ratioofyoungpeople15-24(rightaxe),EU27,Austria,UpperAustriaandVienna,2005-2015
Source:EurostatLabourmarketdatabase,LFSmicrodata
1.5 Redistributionandsocialinclusion
TheAustrianoverallnetexpenditureinsocialprotectionrosefrom24.5%to26.9%ofGDPin
thetimespan2007-2014,thestrongestincreasetookplacebetween2008and2009(from25%
to27%),asanimmediateresponsetotheimpactoftheeconomiccrisis.Expenditureonsocial
protectionisprovidedtohouseholdsandindividualsaffectedbyaspecificsetofsocialrisksand
needs.InthecaseofAustria,resourcesspentforsocialprotectionbenefitsinordertoprotect
peopleinneedareequalto11,312europerinhabitant:thisvalueiswellaboveEUaverageof
7,655europerinhabitant,showingtheextensiveamountofresourcesdeployedbytheAustrian
welfarestate.Themainshareisspentforpensionsandretirement(oldagerisk),whichisalso
theindicatorshowingthemostcontinuousandstrongestgrowthbetween2005and2014,from
9.07%to10.66%ofnationalGDP.Relevantincreaseswerealsoregisteredinthefieldofhealth
care(from6.58%to7.13%),socialprotectionbenefitstocounteractunemployment(from
1.32%to1.59%)andsocialexclusion(from0.36%to0.46%).Expenditurefordisability
increasedonlyslightly(from1.83%to1.86%),whiletherewasaslightdeclineintheamountof
resourcesdestinedforhousing(from0.13%to0.12%),familyandchildren(from2.80%to
2.77%),survivors(from1.63%to1.54%).
Page 50
H2020-YOUNG-SOCIETY-2015 YOUNG_ADULLLT Deliverable 4.1
19
Thedisposableincomeforhouseholdsistheamountofmoneythatahouseholdearnseachyear
aftertaxesandtransfers,representingthemoneyavailabletoahouseholdforspendingon
goodsorservices.InAustriaitishigherthantheEUaverage,showinganincreasingtrendfrom
2005to2013,from18,000to20,700inPPS(itwas16,800forUKand20,300forGermanyin
2013),withastagnationin2008-2010becauseoftheimpactoftheeconomiccrisis.Itwas
slightlylowerinVienna(20,300),whileitwasequaltothecountryaverageforUpperAustria.
Lookingatincomedistribution,Austriatakesalower-than-averagepositioninEuropeinterms
ofincomeinequality,evenifitfollowsthegeneralEuropeantrendofincreasinginequalities.In
thetimespan2005-2015theGinicoefficientofequivaliseddisposableincome(Figure6),
showingtheconcentrationofincome,wentfrom45%to47.6%againstEU27valuesof,
respectively,49.7%and51.9%.Socialredistributionandsocialbenefits,andonlyslightlythe
taxessystem,areeffectiveinreducingmarketincomeinequality:theGinicoefficientaftersocial
transfersdropsdownto27.2%in2015,accountingfora43%reductionofincomeinequalities
(EUaverageis40.3%).However,ifinequalityofincomeislow,inequalityofwealthisby
contrasthigh(ECB,2016).In2012,therichest10%ofAustrianhouseholdsowned62%of
overallhouseholdwealth.Astheshareofrentersiscomparativelyhigh,wealthintheformof
homes,themajorassettypeforprivatehouseholds,ismoreconcentrated(OECD,2016b).
Figure6:GINIindexbeforeandaftertransfers(leftaxe,0:100),netdisposableincomeinhousehold
inPPS(Europerinhabitant,rightaxe),EU27,Austria,UpperAustriaandVienna,2005-2015
Source:EurostatLivingconditionsandwelfaredatabase,EU-SILCmicrodata
Page 51
H2020-YOUNG-SOCIETY-2015 YOUNG_ADULLLT Deliverable 4.1
20
Socialwelfarestandardsarestillhighoverall,astheproportionofthepopulationatriskof
povertyorsocialexclusionisoneofthelowestamongEUMemberStates,butsomegroupsmust
facegreaterrisk,inparticularolderwomenandchildrenofforeign-bornparents.Theriskof
povertyandsocialexclusionwasequalto17.4%in2005andjumpedto20.6%in2008,showing
afterwardsaslowdecreasetoarateof18.9%in2015,lowerthantheEU27averageof23.7%.
Manyotherindicatorsrepresentingthelivingandmaterialconditionofthepopulation,focusing
onrisksrelatedtopovertyandsocialexclusion,havebeenclearlyaffectedbythecrisis,showing
asimilarpattern:aslowimprovementbefore2007,anegativepeakin2008-2009andthena
dropandstabilizationafterwards,evenifonahigherlevelwithrespecttothepre-crisis.Values
tendtoremain,however,comparativelylowinEUperspective.Thisistruefortheriskof
poverty(from12.6%in2005to15.2%in2008,thendownto13.9%in2015,againstaEU27
averageof17.3%);fortheriskofpovertyorsocialexclusion(from17.4%in2005to20.6%in
2008,decliningto18.3%in2015,itwas20%forGermanyand23.5%forUK);forthesevere
materialdeprivationrate(from3.5%in2005to5.9%in2008,thendownto4.6%in2015,
againstaEU27averageof8%);aswellasfortheriskofpovertysufferedbyemployedpeople
(from6.7%in2005to8.6%in2008,thendownto7.9%in2015,againstaEU27averageof
9.5%).Adifferenttrendisinsteadrelatedtothepercentageofpeoplelivinginhouseholdswitha
verylowworkintensity:thisindicatorfluctuatedbetween7.3%in2005andamaximumof9.1
%in2014(consideringthetotalpopulationagedlessthan60),goingdownto8.1%the
followingyear,wellbelowtheEUaverageof10.6%.Allinall,thedatapointoutthatmaterial
conditionsoflivinginAustriaaregenerallybetterthaninmanyotherEUcountries,but
deterioratedaftertheeconomiccrisis,bothattheindividualandatthehouseholds’level,and
startedtorecoverwithfluctuationsafter2008-2009.
ConcerningthepublicsphereandcivicparticipationinAustria,resultsfromrecentsurveys
showapersistingsenseofcommunity:93%ofpeoplebelievethattheyknowsomeonethey
couldrelyonintimeofneed,higherthantheOECDaverageof88%(OECD,2016a).However,
dataonvoterturnoutinnationalelections,ameasureofcitizens'participationinthepolitical
process,expressacleartrendofdecline,commontomanyotherEUcountries.Thepercentage
wasequalto78.5%in2006,butparticipationdecreasedto74.9%in2013,evenifitisstill
higherthantheEuropeanaverage.AsimilardeclineisalsoshownbyturnoutdatainEU
parliamentaryelection.Alsotrustinpublicinstitutions,essentialforpublicsupport,isquitelow
inAustria:only43%ofthepopulationreporthavingconfidenceinthenationalgovernment,in
linewiththeOECDaverage.However,trustinthenationalgovernmentishigheramongyoung
peopleunder30(50%,seeOECD,2016b).
Page 52
H2020-YOUNG-SOCIETY-2015 YOUNG_ADULLLT Deliverable 4.1
21
1.6 Healthandwell-being
MostEUcountrieshaveenjoyedlargegainsinlifeexpectancyoverthepastdecades,thanksto
improvementsinlivingconditions,publichealthinterventionsandprogressinmedicalcare.
Austria’shealthcaresystemischaracterizedbyalargeandcostlyhospitalsectorand
underutilizedoutpatientcare(EuropeanCommission,2017).Ingeneraltheaccessibilityand
qualityofhealthcareprovidedaregoodincomparativeperspective.Beinganageingsociety,
however,accesschallengesashealthcarecostsareexpectedtoincreasemarkedlyinfuture.
From2011to2014totalhealthexpenditureinAustriaincreasedbymorethan10%,touching
33,794millioneuroin2014,equalto2,587europerinhabitant(EUaverageis2,235europer
inhabitant).Theavailablebedsinhospitalsin2014were768.71perhundredthousand
inhabitants,withtheregionofViennabeingslightlyabovetheaverage(800bedsperhundred
thousandinhabitants)andUpperAustriabeingslightlybelow(700beds).Itisstrikingthe
increaseinlong-termcarebeds,thatrosefrom35.8perhundredthousandinhabitantsto55.9in
thetimespan2005-2015,mostlyresultingfromtheregionofVienna(from67to163.35in
2014).Accordingly,lookingatthehealthpersonneldata,thevaluesofmedicaldoctorsand
nursesandmidwivesperhundredthousandinhabitantsarehigherandincreasinginVienna
(respectively689and975),withrespecttoboththenationalaverage(504and816)andto
UpperAustria(407and825).
In2015,70%ofpeopleinAustriareportedtobeingoodhealth,slightlyaboveEUaverageof
67%.Theratiobetweenpeoplewhohaveagoodandverygoodperceptionoftheirhealthand
thosewhohaveabadperceptionisalsoquitefavorableandhighincomparativeperspective,
being9.9ascomparedtotheEUaverageof8.7.Notsurprisingly,youngpeopleinAustriaaged
15-29tendtohaveabetterself-perceptionoftheirhealththantheoverallpopulation,as92.5%
ofthemperceivetheirownhealthasgoodorverygood,againabovetheEUaverageof90.8%.
Youngfemalereportedtobeingoodorverygoodhealthmoreoftenthanyoungmen
(respectively93.6%and91.4%ofrespondents).Theratiobetweenthosewhohaveagoodand
badperceptionoftheirownhealthisaccordinglyhigh,beingequalto77.1(EUaverageis69.8).
Despitethesubjectivenatureoftheindicator,answershavebeenfoundtobeagoodpredictorof
people'sfuturehealthcareuse(OECD,2016a).Moreover,lookingattheEurostatindicatorof
healthylifeyears(HLY),thatmeasuresthenumberofremainingyearsthatapersonofspecific
ageisexpectedtolivewithouthealthproblems,wecangainmoreinsightsonAustrians’health
status.InAustria,amaleisexpectedtolive57.6yearswithouthealthproblems(72.9%oftotal
lifeexpectancy)andafemale57.8(68.8%oftotallifeexpectancy).Itisimportanttostressthat
thebothvaluesarebelowEUaverage(respectively61.4and61.8years).Healthconditions
appearnottobedistributedevenly:thegapinreportedgoodhealthbetweenthetopandbottom
20%oftheincomedistributionisespeciallylargeinAustria.
Page 53
H2020-YOUNG-SOCIETY-2015 YOUNG_ADULLLT Deliverable 4.1
22
Subjectivewell-beingcanbemeasuredintermsoflifesatisfaction,lookingatthepresenceof
positiveornegativeexperiencesandfeelings.Suchmeasures,whilesubjective,areauseful
complementtoobjectivedatatocomparethequalityoflifeacrosscountries.Ingeneral,
Austriansarecomparativelyquitesatisfiedwiththeirlives.Whenaskedtoratetheirgeneral
satisfactionwithlifeonascalefrom0to10,Austriansgaveita7.8grade,higherthantheEU28
averageof7.1,andthepercentageofhighlysatisfiedwiththeirlifewas37.9%,stronglyabove
theEUaverageof21.7%.InVienna,lifesatisfactionwasratedat7.7in2016,butlabour
satisfactionwassignificantlybelowthenationalaverage(7.1against7.7),somehowreflecting
theproblematiclabour-relatedissuesthatwereportedinsection1.4.YoungAustriansaged16-
24and25-34expresshighlevelofsatisfactioninmanylifedomains(Figure7).Thedifference
withothercountriesisparticularlywideregardingthelivingenvironment(60%and52%of
highsatisfactionforthoseaged16-24and25-34,withrespectto30and27%inEU28),andthe
presenceofrecreationalandgreenareas(59%and51%ofhighsatisfactionwithrespectto28%
and25%inEU28).Theseresultsarerelatedtoeducationattainment:satisfactionismuchlower
forlow-educated,roughlyequaltothenational-averageforuppersecondaryeducated,much
higherfortertiaryeducated.
Figure7:Highsatisfactioninvariouslifedomains(25-34,%),EU28andAustria,2013
Source:EurostatLivingconditionsandwelfaredatabase,EU-SILCmicrodata
Goingbeyondsubjectiveperception,welookatsomeotherindicatorsrelatedtothepersonal
well-being,rangingfromsecuritytoalcoholconsumptionandsmoking,inordertogainamore
Page 54
H2020-YOUNG-SOCIETY-2015 YOUNG_ADULLLT Deliverable 4.1
23
nuancedpictureofwell-beinginAustria.Thenumberofreportedcrimesisshrinkinginthelast
tenyears,eveniftheoverallnumberofcrimesincreasedfrom2015to2016from518thousands
to537thousands,whiletheviolentcrimesslightlydecreasedfrom2,387to2,363.Thehomicide
rate(thenumberofmurdersper100000inhabitants)isaquitereliablemeasureofacountry's
safetylevelbecause,unlikeothercrimes,murdersareusuallyalwaysreportedtothepolice.
Accordingtothelatestdata,Austria'shomiciderateis0.4,muchlowerthantheOECDaverageof
4.1(OECD,2016b).However,Austriahasthehighestpercapitaconsumptionofalcoholinthe
OECD.At12.2litersperperson,consumptionissignificantlyhigherthantheOECDaverageof8.9
litters,andabovecountriessuchasFrance(11.5)andIreland(11).Austriaisalsotheonly
countrywheretheshareofthepopulationwhosmokedailyremainedstableat24%since2000,
whileontheOECDaverageitfellinthelastyears.
2. EmergingissuesAustriaischaracterizedbyastrongfederalism.Thisimpliesthatinmanypolicyareas,federal
statesshowdifferencesthatarenotexpressedbyaggregateddataatnationallevelandgo
beyondthecommonfederalinstitutionalarchitecture.Inthepaperweshowedthatthetwo
functionalregionsofViennaandUpperAustriaarecharacterizedbycommonalitiesand
differences,asfarascontextuallivingconditionsofyoungadultsareconcerned.Usuallythe
indicatorsconsideredshowthatthesituationofyoungAustrianandtheirperceptionsarequite
positiveinEuropeancomparativeperspective.However,thisgoestogetherwithsomesignsof
deteriorationintermsofgrowingyouthunemployment,persistinggenderdifferences,
worseningskillsachievementandstronginfluenceofparentalbackgroundineducation,high
wealthinequalities.Inaddition,thecreationofpredominantlylow-paidandpart-timejobsover
recentyearshasaggravatedthesegmentationofthelabourmarket.
DataconfirmtheleadingroleofViennainthecountry.Thecapitalattractsstrongflowsof
migrationandhasexperiencedastronggrowthintheservicesectors,especiallyinhighskilled
jobs.Thisisconnectedwiththerelevanceoftertiaryeducationinitsregionalskillformation
system.However,Viennacombinessomecontradictions:thegrowingjobmarketgoestogether
withincreasingunemploymentandNEETrates,especiallyforlowskilled,andscarce
apprenticeshipopportunitiesforyoungpeople.UpperAustriaischaracterizedbyastronger
industrialsectorand,accordingly,vocationaleducationandapprenticeshipplayamajorrolein
theeducationsystem.Themoderateincreaseofthepopulationdidnotincreasedsofarthe
pressureontheyouthlabourmarketasithappenedintheregionofVienna.
Page 55
H2020-YOUNG-SOCIETY-2015 YOUNG_ADULLLT Deliverable 4.1
24
3. ReferencesBliemW.,PetanovitschA.,SchmidK.(2016).DualvocationaleducationandtraininginAustria,
Germany,LiechtensteinandSwitzerland,IBW.
ECB(2016).TheHouseholdFinanceandConsumptionSurvey:resultsfromthesecondwave,
HouseholdFinanceandConsumptionNetwork,StatisticsPaperSeries,No.18,EuropeanCentral
Bank,FrankfurtamMain.
EichmannH.,NockerM.(2015).DieZukunftderBeschäftigunginWien–Trendanalysenauf
Branchenebene.Forschungs-undBeratungsstelleArbeitswelt(FORBA),Wien:
https://www.wien.gv.at/wirtschaft/standort/pdf/beschaeftigung-trendanalysen-
EuropeanCommission(2017).CountryReportAustria2017,Brussels.
LassniggL.(2011).The‘duality’ofVETinAustria:institutionalcompetitionbetweenschooland
apprenticeship.JournalofVocationalEducation&Training,63(3),417-438.
OECD(2017a).Countrystatisticalprofile:Austria2017,Paris.
OECD(2017b).OECDEconomicOutlook2017.Economicforecast,summary:Austria,Paris.
OECD(2016a).EducationataGlance:OECDIndicators.Countrynote:Austria,Paris.
OECD(2016b).SocietyataGlance2016.ASpotlightonYouth.HowdoesAustriacompare?Paris.
OECD(2015).EmploymentOutlook2015.HowdoesAustriacompare?Paris.
StadtWien(2015).StatistischesJahrbuchderStadtWien–2015:
https://www.wien.gv.at/statistik/publikationen/jahrbuch.html
Page 56
H2020-YOUNG-SOCIETY-2015 YOUNG_ADULLLT Deliverable 4.1
Work Package 4
Quantitative Analysis Young Adults’ Data
Bulgaria –
National Briefing Paper with national and regional
data sets
Valentina Milenkova, Stanimir Kabaivanov, Kaloyan Haralampiev,
Georgi Apostolov and Siyka Kovacheva
SOUTH-WEST UNIVERSITY NEOFIT RILSKI (SWU); UNIVERSITY OF PLOVDIV (PU)
Date: 30/09/2017
Work Package 4 – Quantitative Analysis of Young Adults’ Data
Deliverable 4.1
Page 57
H2020-YOUNG-SOCIETY-2015 YOUNG_ADULLLT Deliverable 4.1
2
TableofContents
ExecutiveSummary........................................................................................................................................................................3
Introduction.......................................................................................................................................................................................4
Qualitydataassessment...............................................................................................................................................................4
DescriptionofthetwoFunctionalRegions..........................................................................................................................5
FunctionalRegionPlovdiv.................................................................................................................................................5
FunctionalRegionofBlagoevgrad..................................................................................................................................6
Demographicstructure.................................................................................................................................................................7
Thestructureoftheeconomy..................................................................................................................................................11
Educationandtrainingsystem................................................................................................................................................15
Labourmarket................................................................................................................................................................................21
Redistributionandsocialinclusion.......................................................................................................................................24
Healthandwell-beingconditions...........................................................................................................................................26
Finalremarks..................................................................................................................................................................................28
References........................................................................................................................................................................................29
Figures
Figure1.Naturalchangeofpopulation(‰).................................................................................................................8Figure2.PercentageofBulgarianpopulationlivinginanalyzedregions....................................................................9Figure3.Proportionofpopulationaged20-24...........................................................................................................10Figure4.Fertilityrate(right)andinfantmortalityrate(left)....................................................................................10Figure5.GDPatcurrentmarketprices,Europerinhabitantin%ofEuropeanaverage.........................................12Figure6.RealGDPpercapitagrowthrate...................................................................................................................13Figure7.Economicsectors,valueadded(%ofGDP)..................................................................................................14Figure8.PopulationattainmentbyISCEDlevels,25-64yearsoverthecorrespondentagegroup........................16Figure9.Youngadults’educationattainmentbyISCEDlevels,30-34yearsoverthecorrespondentagegroup..16Figure10.Youngadults’educationattainmentbyISCEDlevel3-4,30-34yearsoverthecorrespondentagegroup.........................................................................................................................................................................................17
Figure11.Tertiaryeducationaccessofthepopulationaged20-24yearsoverthecorrespondentagegroup......18Figure12.EarlySchoolLeavers18-24years,ESL(leftaxis)andpopulationneitherinEmploymentnorinEducation15-24years,NEET(rightaxis)....................................................................................................................19Figure13.PISAandPIAACcompetences,Europeanaverage=1.................................................................................20Figure14.Participationrateineducationandtraining–24-34agegroup(last4weeks)......................................21Figure15.Youthemploymentrate(age15-24)...........................................................................................................22Figure16.Longtermyouthemploymentrate(age15-29)........................................................................................23Figure17.ExpenditureinsocialprotectioninPPSperinhabitantas%ofEU19.....................................................24Figure18.GINIindexbeforeandaftertaxes(leftaxis)anddisposableincome(rightaxis)....................................25Figure19.Populationatriskofpovertyorsocialexclusion,%(POV)andseverematerialdeprivationpopulation,%(SMD)..........................................................................................................................................................................26Figure20.Highsatisfactioninvariouslifedomains,populationaged25-34,EU28andBulgaria,2013................27
Page 58
H2020-YOUNG-SOCIETY-2015 YOUNG_ADULLLT Deliverable 4.1
3
ExecutiveSummary
Thequantitativecharacteristicsdescribinglivingconditions,education,structureoftheeconomyand
labormarket inBulgarian conditionsarevery important forunderstanding the transitionsof young
adultsfromeducationtoemploymentandtheopportunitiesforlifelonglearning.
Ontheonehand,inthenationalcontext,therearehighsharesofpeoplewithhighereducation,both
for thewhole population and for the 30-34 age group. It is also indicative that in 2014 two thirds
(66.5%) of the 20-24 age group are students. This percentage is an indication that education is
perceivedasavalue,andthisisalsoaresultoftheactivepolicyofuniversitiestowardsyoungadultsin
the country. The proportion of people aged between 30 and 34 with upper secondary education
(ISCED3-4)ishigherthanintheUK,andiscomparabletoGermany.
On theotherhand,when itcomes toadulteducation, thevaluesarevery low.Theshareof learners
(24-34)ismuchlowerthantheEU27average.Thismeansthataftercompletingcertaindegree,people
stoptheireffortsandambitionstocontinuetheireducation,whichrequiresmoreactiveinvolvement
ofthetrainingorganizationsinformalandnon-formaleducationandlifelonglearning.
It can also be said that there is a difference in education characteristics between the two regions
regarding different age groups. Apart from education, almost all other proportions describing the
BulgarianwayoflifearelowerthantheEUaverage:
- Socialprotectionexpenditurepercapitaincreasedfrom2005to2014,butremainsmuchlower
thanthatofotherEUcountries.
- TheHouseholds’incomein2013ismuchlowerthaninotherEUcountries.
- The share of people at risk of poverty and social exclusion in Bulgaria is decreasing in the
period2006-2015,andfrom2008to2015itisrelativelystablebetween40%and50%.These
values describeBulgaria as the poorest European countrywith low standard andpoor living
conditions.
- Theoverallsatisfactionforthoseaged18-30yearsinBulgaria(-1.161)ismuchlowerthanthe
averageforES28(-0.014)asmen(-1.211)aremoresatisfiedthanwomen(-1.109).
The situation in the country is characterized by a process of slow economic stabilization, income
growth,povertyreduction,increasingyouthemployment,growthindisposablehouseholdincomeand
higheducationalattainment,butthereisstilla lottobedonetoreachtheaveragevaluesdescribing
thequantitativecharacteristicsofthequalityoflifeintheEUcountries.
Page 59
H2020-YOUNG-SOCIETY-2015 YOUNG_ADULLLT Deliverable 4.1
4
Introduction
This national briefing paper provides a short overview of the living conditions of young adults in
Bulgaria and in the two functional regions selected for theYOUNG_ADULLLTproject, the regionsof
Blagoevgrad(South-West)andPlovdiv(South-Central). Thedatawerecollatedatnationalandlocal
level (NUTs2) according to six dimensions of contextual living conditions: the demographic
characteristicsofthepopulation,thestructureoftheeconomy,theinputsandoutputsoftheeducation
andtrainingsystem,thelabourmarket,themateriallivingconditionsandtheparticipationofcitizens
in the political and civic life and, finally, the health conditions and individualwell-being.Datawere
extractedfromEurostatandfromdifferentsurveyssuchastheEU-LFS,EU-SILC,PISAandPIAAC.The
main corpus of data proceeding from international and harmonized data was successively
complementedbydatacollatedat the local level,madeavailableby theNationalStatistical Institute
and by the official websites of various Bulgarian Institutions (Ministry of Education and Science,
Ministry of labour and Social policy, Chambers of commerce). The data ranges between 2005 and
2015, but for some indicators the datawere not available for 2015 and for this reasonwe refer to
2014asthelatestyearwithdataavailable.
Qualitydataassessment
StatisticalinformationusedinthisstudyistakenfrompubliclyavailabledatabasessuchasEUROSTAT,
ESSPROS, PISA, OECD and National Statistical Institute (NSI) in Bulgaria. Although these sources
provide a large number of time series and a lot of information on methods used to gather the
information,thereareseveralobservationstobemaderegardingcomparabilityandcompatibilityof
thedata.
DuetotheunificationofvariablesandstatisticalproceduresitiscurrentlypossibletouseEUROSTAT
asaprimarysourcewhenassessingandcomparinglivingconditionsacrossthecountries-membersin
the European Union. However, when a comparative analysis has to be made on a lower than the
nationallevel,itisnecessarytokeepinmindthatNUTS2(andtoalesserextentNUTS3)aretheonly
reliableforcomparisonlocallevelsthatcanbeusedwhensearchingfordata.Eventhenitispossible
tocomeupwithproblemssuchasdatagapsortimeseriesofdifferent lengths.Inaddition, it isalso
possible to have some local databases (in our caseNSI) updatedwithmore recent information and
variablevalues,whicharestillmissinginEUROSTAT.Inthispaper,wehavekeptouranalysislimited
tothevariablesthatwerecommonlyagreedandareavailableinEUROSTAT.
Whenever it was necessary to provide information on sub-regions or comparison of regions with
regard to the most recent information, we have used the same variables as those available in
EUROSTAT butwith latest values obtained fromNSI. This has been duly noted in the footnotes or
sourcesoftherespectivefiguresortables.TheNUTS2dataallowsoundstatisticalcomparisonsbutwe
Page 60
H2020-YOUNG-SOCIETY-2015 YOUNG_ADULLLT Deliverable 4.1
5
should keep in mind that they do not fully coincide with the chosen functional regions for the
fieldworkintheproject,themaindiversionbeingthattheSouth-WestincludesthecapitalSofiawhere
thesituationalongmostoftheusedindicatorsismuchbetterthaninBlagoevgradFunctionalRegion,
whilePlovdivFunctionalRegionhasabettersituationthantherestareasintheSouth-Centralregion.
NSIdatahasalsobeenusedwhennecessarytocheckfordifferencesinsideaspecifiedNUTS2region
(e.g.forNUTS3andLAUdata)asitoffersmorerecentinformation.Withregardtoeconomicdata,local
sourceshavebeenabletoprovideusefuldetailsonthepurchasingpowerinformationthatreflectthe
differences in the standard of living in big cities and the rest of the rest (more rural area) of the
respectiveregions.
DescriptionofthetwoFunctionalRegions
The traditional administrative-territorial division in the country is two-level – it consists of 28
administrativedistrictsand265municipalities.In2000Bulgariawasdividedinto6planningregions–
North-West, North Central, North-East, South-West, South-Central and South-East which were
grouped into two territorial units according to the agreements with Eurostat (NUTS) in 2005. The
municipalities in the country are very different in their economic development, the demographic
characteristics and the social status of the population. Overcoming these economic and social
differencesisthemaingoaloftheregionalpolicy.
The two functional regions (FR) are Plovdiv and Blagoevgrad. The Plovdiv FR corresponds to the
municipalityofPlovdiv.TheBlagoevgradFRcorresponds to theBlagoevgraddistrict in thenational
administrative-territorial division. The two FRs have a comparable population size: 341625
inhabitants for Plovdiv and 312831 for Blagoevgrad. The two regions have several specific
characteristics: Plovdiv FR has a central location in the country while Blagoevgrad FR is a border
region (withMacedonia andGreece); Plovdiv FR is an urban territorywith higher concentration of
servicesandindustryinitseconomy;BlagoevgradFRismixedwithruralandurbanareasandhasa
highershareofservicesector intheeconomy.Bothregionsare interestingtobestudied intermsof
theimplementationofLLLpoliciesduetotheirdifferenteconomiesandlabormarketdevelopments,
populationandeducationalstructures.
FunctionalRegionPlovdiv
- Plovdiv FR is unique in terms of administrative-territorial characteristics, e.g. Plovdiv
MunicipalityisoneofthethreemunicipalitiesinBulgariawhichcomprisesonlythemaincity.
- TheFRhasamulti-sectoreconomyprovidingaround7%ofthenationalsalesrevenueofgoods
andservices(www.pd.government.bg).Theindustrialproductiongives62%oftherevenue.Thereisa
trend in revenue growth in services. The main economic sectors which shape the industry are
production of food, beverage and tobacco products (around 28% of the gross sales revenue),
Page 61
H2020-YOUNG-SOCIETY-2015 YOUNG_ADULLLT Deliverable 4.1
6
productionof ferrousmetals(14%);metalcasting,metalworking,andmachineryproduction(11%);
productionof chemicals and chemical products (9%);productionof cellulose, paper, polygraphand
publishing goods (8%), (www.pd.government.bg). The local economy generates output of over 6
billion EUR annually, of which about 3.1 billion EUR in manufacturing, 690 million EUR in
construction, 400 million EUR in transport and logistics, and 310 million EUR in IT and business
services.
- The region has a well-developed logistics network that has a big potential to attract local
entrepreneursandforeigninvestors,anditappearsasanimportantcharacteristiconthesupplyside
ofthelabormarket:ahighwayconnectionwithCentralandWesternEurope;well-developedrailway
network with a connection to the nearest sea port; an intersection of Pan-European transport
corridors(IV,VIIIandX);acargoandpassengerairport(upcomingconcession);afreetradezoneand
acustomsterminal.ThePlovdivInternationalFair,spreadonaterritoryof352000m2,makesthecity
is an international, intellectual, trade and investment center, organizingmany trade fair events and
thematicexhibitionsonnationalandinternationalscale.
- Plovdivhasawell-developededucationalsystem,whichcouldserveasasourcepool to feed
the necessities of unemployed young people, and to insure them with modern and qualitative
knowledge.Thereare9universities,with39260students,and78primary,secondaryandvocational
schools with 8351 pupils. In 2014, there were 8657 university graduates, 5592 high school
graduates, of which 2825 graduated from vocational high schools, and 2767 general high school
graduates(www.nsi.bg).
FunctionalRegionofBlagoevgrad
- BlagoevgradFRisthesixthlargestdistrict inthecountrycovering14municipalitiesand280
settlements (http://www.bl.government.bg/en/population). It has a relatively good demographic
structure. The urban population in the district is 39% and there is a high percentage of people
employedinservices.
- TheFRischaracterizedbydiversifiedeconomicbranchstructure:foodandtobaccoprocessing
industries, tourism, transportandcommunications, textile industry, timberand furniture industries,
ironprocessingandmachineryindustry,constructionmaterialsindustry,aswellaspharmaceuticals,
plastics,paperandshoesproduction.Withitsrailwaylineandroadconnection,thedistrictformsthe
heart of the land-based trading route between northern Greece, Bulgaria and Romania
(http://www.bl.government.bg/en/economy). The developed labor market is an important
prerequisitefortheprofessionaldevelopmentofyoungadultsintheirlifecourse.Industryoccupiesa
significantplaceintheeconomicactivitiesoftheregion.Itsbranchesform25.7%intotalproductsin
Blagoevgrad FR.More than 39% of all employed people in the region are engaged in the industry.
Thereareseveralleadingindustrialbranchesinthearea.Foodindustryconstitutes31%ofthewhole
Page 62
H2020-YOUNG-SOCIETY-2015 YOUNG_ADULLLT Deliverable 4.1
7
FRindustryanditscompanies formthepredominantemploymentarea.Textile industry,whichisof
particularimportancefortheeconomyoftheregioninrecentyears.Activeplayers,attheendof2014,
dealingwiththeproductionofclothingindustryare739or27.8%ofthetotalregionalindustry.Most
ofthemaresmallandmicrobusinesses.Typicalofthissectoristheparticipationofforeigninvestors
(Greek, German, and French) that created new owned or joint ventures in the field. Wood and
furnitureproduction formanother important segmentof the regional industry.Thedevelopmentof
theindustryisbasedontheuseoflocalrawmaterialsandhasaperspective.Tourismintheregionisa
major sector of the economy. Agriculture is also developed. The specialization of region crop
productioninthecountryisdeterminedbytheproductionoftobacco.
- BlagoevgradFR is a significant, economic, educational and cultural center of theRepublic of
Bulgaria. The large number of young adults in the district is a good basis for the development and
implementation of LLL practices in formal and non-formal education. There are a total of 133
educationalinstitutionsthatinclude106generalschools,3specialschools,1artsschool,18vocational
highschools,2postgraduatecollegesand2universities.
Allofthesecharacteristicsofthepopulationandthesystemsofeducation,economyandcultureinthe
twoFRs suggest awide rangeof diversity in the approaches towards young adults and thepolicies
required for their inclusion in LLL. Both regions demonstrate efforts to establish effective cohesion
betweeneducation,scienceandbusiness.
Demographicstructure
InordertounderstandproperlythedemographicstructureandprocessesinBulgaria,itisnecessary
firsttounderlineafewimportantpoints:
• Bulgaria is a medium sized European country (a bit over 7million inhabitants as of 2016)
whichisexperiencinganegativepopulationgrowthsince1989.
• Figure1demonstratesnotonlythenegativepopulationgrowthinthecountryandinthetwo
regions but also the trend in its development over time. For thiswe are using the 2-period
movingaverageindicator(2perMov.Avg.)anditsvaluesarepresentedonseparatelinesfor
thecountryandtheregions.
Page 63
H2020-YOUNG-SOCIETY-2015 YOUNG_ADULLLT Deliverable 4.1
8
Figure1.Naturalchangeofpopulation(‰)
Source:EUROSTAT,NSI
Although both South-West and South-Central regions have experienced negative natural changes in
population,theeffectissmallercomparedtotheoverallcountrychange.Thisispartlyduetothefact
thattheeconomicdevelopmentoftheseregionsovertimehasattractedmorepeopleandinparticular
youngpeople,whichmakesthembetteroffcomparedtootherregionsofBulgariawherepopulationis
older (thus in the rest of the country themortality rate is higher and the birth rate is lower). The
South-Westregionhadacruderateofnaturalpopulationchangeof-4in2015,comparedto-5.7for
South-Centralregionand-6.2forBulgaria.Thatmeansthatthedecileinnaturalpopulationgrowthin
theSouth-WestregionissmallerthanthedeclineintheSouth-CentralregionwhichIturnissmaller
thanfortherestofthecountry.Thedecreaseinpopulationduetonaturalcausesinthetworegionsis
partiallycompensatedby internalmigrationandby theabilityof theregionalauthorities toprovide
bettermedicalservices(whichinturnarerelatedtotheeconomicdevelopmentoftheregions).Asa
result, it is evident that the percentage of Bulgarian population living in South-West region has
increasedsteadily from27.6%in2005to29.79%in2015.Thesameindicator for theSouth-Central
regionhasshownaverysmall(butstable)decreasefrom20.15%in2005to20.08%in2015.
Page 64
H2020-YOUNG-SOCIETY-2015 YOUNG_ADULLLT Deliverable 4.1
9
Figure2.PercentageofBulgarianpopulationlivinginanalyzedregions
Source:EUROSTAT,NSI
• LikemanyotherEuropeancountries,Bulgariahasanagingpopulation.Whatmakestheeffects
of this trend so serious is that combined with outmigration processes and the necessity to
catch up with the more developed European countries aging and high mortality rates are
turningintoamajorhurdleforthefutureeconomicdevelopmentofthecountry.
Aginghasresultedinanincreaseofthemedianpopulationagefrom41.2in2005to43.6in2015.This
changeismoresignificantfortheSouth-Centralregionwherethemeanagehasincreasedfrom41in
2005to44.3tenyearslater,whileintheSouth-Westthechangeissobig–from39.8to41.6.
It shouldbenotedagain that these effects aredistortedby including the capital city in the regional
division which also results in a higher population density in South-West (106 people per sq. km)
compared to South-Central (66 people per sq. km) and a larger share of young population (5.8 in
South-Westcomparedto5inSouth-Centraland5.2onaverage).
Page 65
H2020-YOUNG-SOCIETY-2015 YOUNG_ADULLLT Deliverable 4.1
10
Figure3.Proportionofpopulationaged20-24
Source:EUROSTAT
Thedemographiccomparisonbetweenthetworegionswillnotbefullenoughifwedidnotunderline
thatSouth-Centralregionhasahigherfertilityrate(1.59comparedwith1.36)butthisisalsofollowed
byahigherinfantmortalityrate(7.9comparedtoonly3.6forSouth-Westregion).
Figure4.Fertilityrate(right)andinfantmortalityrate(left)
Source:EUROSTAT,NSI
Page 66
H2020-YOUNG-SOCIETY-2015 YOUNG_ADULLLT Deliverable 4.1
11
• Emigrationabroadaffectsnotonlythenationaleconomy,butalsoplaysanimportantrolefor
theregionaldevelopment,becausetheeconomicdisproportionsamongtheregions(reflecting
relative development of different regions as well as relative development within the same
region–asstressedinsection1)resultinasignificantinternalmigrationaswell
WhilecruderatesofnetmigrationremainnegativeforBulgaria(-0.6in2015),theSouth-Westregion
has been able to attractmore people for the last yearwith rates from+5.4 in 2005down to 2.2 in
2015. The South-Central region on the other hand suffers from negative crude rates of migration,
which despite from falling from -4 in 2005 down to -1 in 2015 still represent a challenge for the
economicdevelopmentof the region.Regardingmortality rates it shouldbenoted thateven though
South-Western region is close to the nation-average this indicator differs across cities inside the
region,beinglowerinthecapitalSofia.
With69.3%oftheyoungpeoplelivingwiththeirparentsby2013,Bulgariaissimilartocountrieslike
Spain (69.6%), Croatia (79.1%) and Portugal (71.6%) and this share is higher than the average
percentageintheEU(55.4%measuredforEU27asof2013).Thispercentagehasbeenstableforthe
last fewyears and isdue toboth economic and social factors.Oneof the factors commonlyused to
explain this has been the economic crisis of 2008 and the long recovery period. Howeve,r the
percentageofyoungpeoplelivingwiththeirparentsinBulgariahasnotchangedsignificantlywiththe
economic cycle which indicates that besides the low pay and relatively high rents there are also
significant social factors such as cultural traditions, strong family links and a shared view between
parents and children to keep the former as long as possible inside a well-known “comfort zone”
(KovachevaandKabaivanov,2014;MitevandKovacheva,2014).TheEUROSTATdataalsoshowsthat
menaremore likelytostay longerwiththeirparentscomparedtowomen,which isoftenrelatedto
internalmigrationasinsmallercitiesandvillagesitiseasierformentofindajobandtheyhaveless
incentivestorelocate.
Thestructureoftheeconomy
WhendiscussingthestructureofBulgarianeconomy,weneedtopointoutseveralimportantfactsthat
accountformanyofthedifferencesdiscussedinthistext:
• Firstofall,Bulgariastillneedstocatchupwith itseconomicdevelopment, thustheabsolute
valuesoftheGDPpercapitaaresignificantlylowerthantheEU28averagevalues.
Intermsofabsolutevalues,theGDPpercapitainBulgaria(currentprices)isgrowingatratesofwell
above4%forthelastyear,howeveritisstillabout47%oftheEUaveragevalue.Theeconomiccrisis
Page 67
H2020-YOUNG-SOCIETY-2015 YOUNG_ADULLLT Deliverable 4.1
12
of2008hasalsohadanegativeimpactonBulgaria,andalthoughthisimpacthasnotbeenasstrongas
inothercountriesinEurope,thefinaloutcomecanbeseenintheslowrecoveryandlowgrowthrates
in2010-2014.
• Despite the fact that GDP in Bulgaria has grown faster than in most of the well-developed
countriesforthelastfewyears,thisgrowthisfarfrombeingsufficienttomovequicklytothe
EUaveragevaluesforgrossoutputandincome.
Figure6showsthattheeconomiccrisisof2008hitBulgarianeconomyabitlatercomparedtotherest
oftheEU(withthedeclineinrealGDPdetectedin2009)andresultedinalongerperiodofrecovery.
Thismeansthatregardlessofthepositivegrowthin2010,thecountryisstillfarfromgettingbackthe
samemomentumithadpriortothecrisis.
• Thereis(andhasbeenforalongtime)asignificantdifferenceintheeconomicdevelopmentof
different regions that has to be accounted for when explaining not only economic but also
demographicandsocialprocessesdevelopinginBulgaria.
ThisdifferenceisclearlyvisibleonFigure5,withBlagoevgrad(South-West)regionhaving76%ofthe
averageGDPpercapita inEU,whilePlovdiv(South-Central)regionhasonly33%oftheEUaverage.
Considering the last ten years, Blagoevgrad (South-West) region has always had about twice the
relativeGDPpercapitalevel,comparedtoPlovdiv(South-Central)regionanditisstillso,regardlessof
thefactthatthegrowthratesofthelatterhavebeenslightlyhigherforthepastthreeyears.
Figure5.GDPatcurrentmarketprices,Europerinhabitantin%ofEuropeanaverage
Source:EUROSTAT,Generalandregionalstatistics
Page 68
H2020-YOUNG-SOCIETY-2015 YOUNG_ADULLLT Deliverable 4.1
13
There are several reasons for the economic differences across the examined regions, the most
importantperhapsbeingthattheSouth-WestregionincludesalsothecapitalcityofSofia.Itishardnot
tooverestimatetheimportanceofSofiaforthedevelopmentoftheregionasforexampleitaccounts
formorethan50%oftheforeigninvestmentspercapitaforthewholeregion(2015data)andifwe
includealsoSofiaareawewillendupwithwellover80%.
Figure6.RealGDPpercapitagrowthrate
Source:EUROSTAT,Generalandregionalstatistics
The spatial concentration of economic and administrative activity that is so strikingly evident for
South-WestregionandSofiaisalsotakingplace(althoughthescalesmaydiffer)inotherpartsofthe
country.Therefore, it is essentialwhencomparing the regions to take intoaccount thateach region
has typically one large city attractingmostof theForeignDirect Investments (FDI), highlyqualified
employeesandineffectmostofthegovernmentandpublicattention.
Ifwehavetosumup,thedifferencesbetweentheexaminedregionsarequiteimportantandtheyalso
haveahighimpactontheirprospectsofeconomicdevelopment.AnotablefactisthatPlovdiv(South-
Central) region has 12 times less spending in R&D compared to Blagoevgrad (South-West) region,
whichon its turnhasalmost3 times thecountry-averageR&Dspending).Thespatial concentration
explains the short-term prospects of widening the gap in the economic development inside the
regions.
Page 69
H2020-YOUNG-SOCIETY-2015 YOUNG_ADULLLT Deliverable 4.1
14
Figure7.Economicsectors,valueadded(%ofGDP)
Source:EUROSTAT,NationalStatisticalInstitute
Thevalue-addedcontributionofthemaineconomicsectors,showninFigure7,revealsthatthereare
alsodifferencesacrossregions,withSouth-WestregionbeingclosesttotheEU28sectordistribution.
Itshouldbenotedthatthedifferencesinsectorcontributiontotheaddedvaluearenotnecessarilyan
indicator of problems as theymay rather point out a specialization of the region. In particular for
South-Westregion,Sofiaagainplaysavery importantroleas itseconomy ismainlyconcentrated in
theservicesector,thusincreasingtheshareoftheservicesectorforthewholeregion.
The percentage of researchers is low for both regions being analyzed, and has stayed virtually the
sameoverthe last fiveyears,withasmall increase intheSouth-Westregion.TheR&Dexpenditures
havealreadybeendiscussed,andtheyalsohighlightthefactthatthereisasignificantconcentrationof
R&Dspending inSouth-West region(andSofia inparticular).Thisconclusionholds forbothprivate
sectorandgovernmentexpendituresforR&D(wheretheratioofspendingforSouth-WestandSouth-
Central region is about 18:1, and despite that R&D expenses for South-Central have increased at a
fasterpaceforthelastyearthegapistoolargetobeclosedinshortterm).
Labor productivity in Bulgaria is constantly increasing, though it is still only 43.7% of the EU 28
average (asof2015). InSouth-Central regionover50%of theemployeeswork formicroandsmall
Page 70
H2020-YOUNG-SOCIETY-2015 YOUNG_ADULLLT Deliverable 4.1
15
companies,while inSouth-Westregionoverhalfof theemployeeswork inmediumand largersized
companies.
Table1.Employmentdatabycompanysize
Companies <9employees 10-49
employees
50-249
employees
>250
employees
Bulgaria 30.56% 20.87% 20.27% 28.3%
South-West 27.37% 20.94% 20% 31.69%
South-Central 32.78% 24.4% 23.45% 19.37%
Source:NationalStatisticalInstitute(NSI)
Educationandtrainingsystem
The Bulgarian education and training system is comprehensive and partially decentralized at the
regionallevel.Theshareofgovernmentspendingoneducationin2014is4.1%ofnationalGDPandis
relativelystablefortheperiod2001-2014,fluctuatingaroundtheaverageof3.7%.Thisfigureplaces
BulgariabelowtheEUaverageof4.9%andamongthebottom10EUMemberStates.Schooleducation
is compulsory for children from 7 to 16 years of age. Secondary education (ISCED Level 3) can be
divided into comprehensive education (comprehensive and specialized schools) and vocational
training.Generalsecondaryeducationcanbeobtainedatcomprehensiveschools(courseduration3-4
years)andatspecializedschools(courseduration4-5years).Theadmissioninthespecializedschools
is upon completion of grades 7 or 8 and after exams depending on the profile of the school (with
emphasiseitheronforeignlanguage,oronscienceand/ormathematics,oronhumanities,orsports,
orartsetc.).
Secondaryeducationcanbeobtainedalsoatvocational-technicalschoolsaftercompletionofgrade8
and4yearsoftrainingoraftercompletionofgrade7and5yearsoftraining.Vocationalschoolswitha
three-year curriculum also provide secondary education. All students successfully completing
secondary education can access university after passing a general entry examination organized by
eachpublicuniversity.TheeducationalstructureoftheBulgarianpopulationisrelativelyclosetothe
educationalstructureofGermanyandtheUK. In2005,27.5%of thoseagedbetween25and65had
lowersecondaryeducation(uptoISCED2),whereasin2014thisratedecreasedto18.9%,equivalent
toadecreaseof8,6percentagepointsfor10years.ThisdecreaseisgreaterthaninGermanyandthe
UK.
Page 71
H2020-YOUNG-SOCIETY-2015 YOUNG_ADULLLT Deliverable 4.1
16
Figure8.PopulationattainmentbyISCEDlevels,25-64yearsoverthecorrespondentagegroup
Source:LFS,EUROSTAT
Thepercentageofpeopleaged25-64withtertiaryeducation(atleastISCED5)increasedfrom21.6%
in2005to27.0%in2014.TheseratesarecomparabletoGermanyvaluesbutarelowerthanUKand
theEUaverage(37.9%)values.However,therearesignificantdifferencesbetweenstatisticalregions-
the proportion of people aged 25-65 in the South-West region is higher than in the South-Central
Region.IntheSouth-Westregion,thegrowthisfrom31.5%in2005to37.5%in2014.
In the South-Central region, the increase is from15.6% in 2005 to 21.4% in 2014. The difference
betweenthetwostatisticalregionsremainsrelativelyconstant -15.9percentagepoints in2005and
16.1percentagepointsin2014.
Figure9.Youngadults’educationattainmentbyISCEDlevels,30-34yearsoverthe
correspondentagegroup
Source:LFS,EUROSTAT
0%
10%
20%
30%
40%
50%
60%
70%
80%
90%
100%
Blagoevgrad(SouthWest)
Plovdiv(SouthCentral)
Bulgaria Germany UnitedKingdom
2005
ISCED0-2 ISCED3-4 ISCED5-8
0%
10%
20%
30%
40%
50%
60%
70%
80%
90%
100%
Blagoevgrad(SouthWest)
Plovdiv(SouthCentral)
Bulgaria Germany UnitedKingdom
2014
ISCED0-2 ISCED3-4 ISCED5-8
0
5
10
15
20
25
30
35
40
45
50
2005 2006 2007 2008 2009 2010 2011 2012 2013 2014
ISCED0-2
Blagoevgrad(SouthWest) Plovdiv(SouthCentral) Bulgaria Germany UnitedKingdom
0
5
10
15
20
25
30
35
40
45
50
2005 2006 2007 2008 2009 2010 2011 2012 2013 2014
ISCED5-8
Blagoevgrad(SouthWest) Plovdiv(SouthCentral) Bulgaria Germany UnitedKingdom
Page 72
H2020-YOUNG-SOCIETY-2015 YOUNG_ADULLLT Deliverable 4.1
17
Whenwe look at young adults, Bulgaria has a very high tertiary education attainment. The rate of
people aged 30-34 that have higher education in Bulgaria is comparable to that in Germany, but is
lowerthanintheUKandtheEUaverage(38.7%).Thisrateincreasedfrom24.9%in2005to30.9%in
2014. However, between 2005 and 2010, the proportion of people aged 30 to 34 with tertiary
educationintheSouth-WestregioniscomparabletothatoftheUK.Between2010and2012,thisrate
isdecreasing,andthen,in2014,itisagainapproachingthevalueintheUK.Thechangeisfrom35.0%
in2005 to43.0%in2014.Therateofpeopleagedbetween30and34withhighereducation in the
South-Central Region is the lowest and between 2005 and 2011 fluctuates at levels below 20%.
Growthhasbeenobservedover the last fouryears,with therate in2011being16.7%andrising to
23.2%in2014.However,thishighestshareintheSouth-CentralRegionislowerthanthelowestvalue
forBulgariaasawholeandfortheSouth-Westregion.
Figure10.Youngadults’educationattainmentbyISCEDlevel3-4,30-34yearsoverthe
correspondentagegroup
Source:EUROSTAT
The proportion of people aged between 30 and 34with upper secondary education (ISCED 3-4) is
higherthanintheUK,butcomparabletoGermany.Thevaluesinthetwostatisticalregionsarevery
close to each other and are close to the average for the country. Dynamics show cyclical ups and
downs.
Thepercentageofpeopleagedbetween30and34withlowerthansecondaryeducationinBulgariais
higher than in the UK and Germany. It was 22.4% in 2005 and is relatively stable over the whole
0
10
20
30
40
50
60
70
2005 2006 2007 2008 2009 2010 2011 2012 2013 2014
ISCED3-4
Blagoevgrad(SouthWest) Plovdiv(SouthCentral) Bulgaria Germany UnitedKingdom
Page 73
H2020-YOUNG-SOCIETY-2015 YOUNG_ADULLLT Deliverable 4.1
18
period,with20.5%in2014.However,thetwostatisticalregionsarecompletelyopposite-theratesin
the South-West region are the lowest, even lower than the rates of theUK andGermany,while the
ratesintheSouth-Centralregionarethehighest.
Insummaryitcanbesaidthatthereisadifferencebetweenthetworegionsontheonepole,withthe
largestrateofpeopleagedbetween30and34withtertiaryeducation,andthesmallestrateofpeople
ofthesameagewitheducationbelowsecondaryistheSouth-Westregion.Ontheotherpole,withthe
smallestshareof30-34year-oldswithhighereducation,andthelargestshareofpeopleofthesame
agewithlowersecondaryeducation,istheSouth-CentralRegion.In2012theshareoffour-year-olds
attendingpre-schoolchildcarefacilitiesis79.5%,whichismuchlowerthaninGermany(95.8%)and
GreatBritain(98.0%).
Figure11.Tertiaryeducationaccessofthepopulationaged20-24yearsoverthe
correspondentagegroup
Source:EUROSTAT
ThehighereducationsysteminBulgariacomprisesvariousformsofprogramsandcurriculauponthe
completionofthesecondarylevel.Bulgariantertiaryeducationalstructureisstep-by-stepadaptingto
the challenges of the European Higher Education area and there is positive evidence for that, e.g.
endorsingofNationalqualificationnetwork,developingRegistersforthehighereducationinstitutions
andtheirranking,etc.InBulgaria,therateofstudentsinthe20-24agegroupsisslightlyhigherthanin
Germanyand theUK. In2005, fewer thanhalf (48.3%)of thosebetween theagesof20and24are
students,whereasin2014twothirds(66.5%)ofthe20-24agegrouparestudents.
0
10
20
30
40
50
60
70
80
90
100
2005 2006 2007 2008 2009 2010 2011 2012
Blagoevgrad(SouthWest) Plovdiv(SouthCentral) Bulgaria Germany UnitedKingdom
Page 74
H2020-YOUNG-SOCIETY-2015 YOUNG_ADULLLT Deliverable 4.1
19
The dynamics in the South-West and South- Central regions is parallel to the overall dynamics for
Bulgaria. In the South-West region, the rate of students increased from69.8% in 2005 to 90.1% in
2013andin2014to80.8%.IntheSouth-CentralRegion,therateofstudentsincreasedfrom26.7%in
2005to52.2%in2014.Thedifferencebetweenthetwostatisticalregionsisrelativelyconstantforthe
period 2005-2013, fluctuating around 40 percentage points, while in 2014 it is reduced to 28.6
percentagepoints.IntheSouth-CentralRegionweseeanincreaseinthenumberofstudentsgrowing
everyyear,andthisgrowthprocessistheresultoftheactivepolicyofuniversitiesintheregionaimed
atattractingyoungadultsandtheirretention in localuniversities.Reducingtheshareofstudents in
theSouth-Westregion isduetoseveralreasons thatoperate inacomplexway:1)Targetinga large
percentage of young people in universities outside the country - mainly in Germany, Austria,
Netherlands,UnitedKingdom;Theseuniversitiesareperceivedasmoreprestigiousandpreferred,and
thisreducesthepercentageofuniversitystudents intheregion.2)Migrationofyoungpeopleoutof
thecountry.3)Theunderstandingthataftercompletingsecondaryeducation,itisgoodtogainlabor
experienceandresources;So,theeducationcareerinahighereducationinstitutionispostponedfor
severalyearsintime.
In Bulgaria the rate of early school leavers in 2016 is 13.8%. The share of early school leavers is
changinginparallelwiththeEU28andisalwayshigherthanit.InBulgaria,thechangeisfrom22.1%
in2005to13.8%in2016.TherateofearlyschoolleaversintheSouth-Westregionismuchlowerthan
thatintheSouth-Centralregion,whichiscomparabletothatofBulgariaasawhole.
Figure12.EarlySchoolLeavers18-24years,ESL(leftaxis)andpopulationneitherin
EmploymentnorinEducation15-24years,NEET(rightaxis)
0
5
10
15
20
25
0
5
10
15
20
25
30
35
40
2005 2006 2007 2008 2009 2010 2011 2012 2013 2014 2015 2016
Blagoevgrad(SouthWest)ESL Plovdiv(SouthCentral)ESL BulgariaESLEU28ESL SouthWestNEET SouthCentralNEETBulgariaNEET EU27NEET
Page 75
H2020-YOUNG-SOCIETY-2015 YOUNG_ADULLLT Deliverable 4.1
20
Source:EUROSTAT
The rateof thepeoplebetween15and24whoneither studynorwork isdecreased from21.5% in
2012 to 18.2% in 2016. This change is parallel to the change in the EU27, but the percentage for
BulgariaishigherthanintheEU27.However,theratesintheSouth-WestregionareclosetotheEU27
rates,whiletheratesintheSouth-CentralregionareclosetotheratesofBulgariaasawhole.
Figure13.PISAandPIAACcompetences,Europeanaverage=1
Source:PISA
According toPISA'sresults, theaverageof15-year-oldBulgarianstudents is lower than theaverage
forEurope,andovertheyears theyareapproachingbutataveryslowpace. In2006theresultsof
Bulgarianstudentsare84%oftheaverageforEurope,whilein2015theyare90%oftheaveragefor
Europe.Atthesametime,theresultsofBulgarian15-year-oldstudentsaremoreinhomogeneousthan
theaverageforEurope.In2006thecoefficientofvariationforBulgariawas1.24timeshigherthanthe
averageforEurope.By2012,BulgariaismovingclosertotheaverageforEurope,butin2014Bulgaria
is againmoving away from the European average – The coefficient of variation for Bulgaria is 1.16
timeshigherthantheaverageforEurope.
0,00
0,20
0,40
0,60
0,80
1,00
1,20
1,40
pisa2006,age15
pisa2009,age15
pisa2012,age15
pisa2015,age15
pisa2006,age15
pisa2009,age15
pisa2012,age15
pisa2015,age15
Meannumeracy Coeffitientofvariationnumeracy
Page 76
H2020-YOUNG-SOCIETY-2015 YOUNG_ADULLLT Deliverable 4.1
21
Figure14.Participationrateineducationandtraining–24-34agegroup(last4weeks)
Source:EUROSTAT
Regardingadultparticipation ineducationandtraining, inBulgariapeoplewhohaveparticipated in
adulteducationinthelastfourweeksbeforebeinginterviewedare7,4%.Thisrateofyoungadultsin
age group between 24 - 34 years ismuch lower than the EU27 average. This share increases from
4.2% in 2005 to 7.4% in 2016 for Bulgaria. The low participation is due to several reasons: 1) the
enterprises andorganizationsdonot invest funds for training their employeesandworkers.2)The
people's incomes are lowand they cannot afford to target training. 3) Insufficiently activepolicy of
organizationsintheformalandnon-formaleducationsystemtowardsadults.
Labourmarket
Youth employment rates in Bulgaria are well below the EU-27 value, as shown on Figure 15 with
South-West region being above country-average of 20.3% in 2015. However, these values are just
slightly higher than youth employment in Spain and Croatia, while being close to the youth
employment rate in Portugal. The employment of male youths in 2015 is higher for both regions
(25.3%comparedto19.3%forfemalesinSouth-Westand23.6comparedto16.1%inSouth-Central)
aswellasforBulgariaingeneral(24%comparedto16.5%forfemales).
0,0
2,0
4,0
6,0
8,0
10,0
12,0
14,0
16,0
18,0
20,0
2005 2006 2007 2008 2009 2010 2011 2012 2013 2014 2015 2016
EU27 Bulgaria Germany
Page 77
H2020-YOUNG-SOCIETY-2015 YOUNG_ADULLLT Deliverable 4.1
22
Longtermunemploymentrates,shownonFigure16, indicatetheeffectsoftheeconomiccrisisfrom
2008on theyouthemployment.Theyalsodemonstrateone interestingcharacteristicof thestudied
regions – South-West (in particular Sofia) respondedmuch faster to the crisis, while South-Central
regionwasthefirstonetoreachthepeakinunemploymentandmovetorecovery.
Figure15.Youthemploymentrate(age15-24)
Source:EUROSTAT
Thegenderstructureoftheunemploymenthasalsobeensubjecttoachangewithbothratesformales
and females going down after the initial surge due to the crisis in 2008. By the end of 2015 the
percentageofunemployedmalesaged15-24is21.2%andisalmostidenticaltheshareofunemployed
femalesinthesameagegroup-22.3%.Bothregionsthatwehaveonfocusfollowthesamepattern,
butwith importantdifferences in theabsolutenumberofunemploymentrates– forexampleby the
end of 2015, the share of unemployed youngmales in South-West is 14.9% compared to 23.2% in
South-Centralregion.
Page 78
H2020-YOUNG-SOCIETY-2015 YOUNG_ADULLLT Deliverable 4.1
23
Figure16.Longtermyouthemploymentrate(age15-29)
Source:EUROSTAT
Thesefactsonceagainconfirmthatthereisasignificantdifferenceacrossthestudiedregionsandit
affects not only their prospects for economic development but is also an important force driving
internalmigration.Itisstillnecessarytostressthatwithanoverallyouthunemploymentratioof5.6%
(closertoAustriawith6%andUKwith8.6%,ratherthantoSpanwith16.8%orCroatiawith14%)
Bulgariaisofferingquitegoodemploymentopportunitiesforyoungpeople.
Looking at the qualification structure of Bulgarianworkforce in the labormarket it is important to
notethatbytheendof2015theshareofhighlyskilledwhite-collaremployeesismuchlowerthanthe
EU-27average(19%comparedto27%),whiletheshareoflowskilledblue-collaremployeesishigher
(28% compared to 21%). Taking into account that we have almost identical percentages of low
qualifiedwhite collar and high qualified blue-collar employees as the EU-27 average, this indicates
thatBulgarianlabormarketisingenerallessqualified.
Page 79
H2020-YOUNG-SOCIETY-2015 YOUNG_ADULLLT Deliverable 4.1
24
Redistributionandsocialinclusion
InBulgaria,netsocialprotectionexpenditureincreasesfrom13.4%ofGDPin2007to18.5%ofGDPin
2014.InBulgaria,thecostofsocialprotectionpercapitainPPPin2014isEUR2544,whichis29.0%
of theEUaverage19and is32.2%of theEUaverage28.This rate increases from2005 to2014,but
remainsmuchlowerthantheotherEUcountries.
Figure17.ExpenditureinsocialprotectioninPPSperinhabitantas%ofEU19
Source:ESSPROS,EUROSTAT
The disposable household income in Bulgaria in 2013 is much lower than in other EU countries -
34.0%ofGermanyand41.1%ofUK.Thedisposablehouseholdincomerisesfrom4200Euroin2005
to 6900Euro in 2013. The disposable household income in the South-West region in 2013 is 1200
Euro higher than the average for Bulgaria, while the disposable household income in the South -
CentralRegionis300Euroslowerthantheaverageforthecountry.
In2015,theGinicoefficientfortheequivalentdisposableincomebeforesocialtransfersforBulgariais
very similar to that for the EU27 - 51.9% for the EU27 and 51.6% respectively for Bulgaria,which
shows a relative equal degree of inequality. However, after social transfers, Gini coefficient for
BulgariaishigherthanfortheEU27-31.0%fortheEU27and37.0%respectivelyforBulgariain2015.
0
0,2
0,4
0,6
0,8
1
1,2
1,4
2003 2004 2005 2006 2007 2008 2009 2010 2011 2012 2013 2014
Bulgaria Germany Italy Finland UnitedKingdom
Page 80
H2020-YOUNG-SOCIETY-2015 YOUNG_ADULLLT Deliverable 4.1
25
Thismeans that social transfers reduce inequality, but this decrease is less pronounced inBulgaria
thanintheEU27.GinicoefficientsforbothBulgariaandtheEU27arerelativelystableovertheperiod
2006-2016.
Figure18.GINIindexbeforeandaftertaxes(leftaxis)anddisposableincome(rightaxis)
Source:EUROSTAT
TherateofpeopleatriskofpovertyandsocialexclusioninBulgariaisdecreasingintheperiod2006-
2015andisrelativelystablebetween2008and2015between40%and50%.
ThepercentageofpeopleatriskofpovertyandsocialexclusionintheSouth-Westregionislowerthan
in the South-Central Region and Bulgaria as a whole. The change in the two statistical regions is
parallel and parallel to the change in Bulgaria as a whole. In the period 2009-2015, the difference
betweenthetwostatisticalregionsisrelativelystableandfluctuatesaround17percentagepoints.
Similarconclusionscanbedrawnfor therateofpeople livingwithseverematerialdeprivation.The
rate of these people in Bulgaria is decreasing and three periods can be highlighted – in the period
2006-2007theratesfluctuatedaround58%,intheperiod2008-2013theratesfluctuatedaround43%
and in the period 2014-2015 the rates fluctuated around 34%. Again, the rate of people living in
severematerialdeprivationintheSouth-WestregionislowerthanintheSouth-CentralRegionand
Bulgariaasawhole.
€0
€1 000
€2 000
€3 000
€4 000
€5 000
€6 000
€7 000
€8 000
€9 000
0,0
10,0
20,0
30,0
40,0
50,0
60,0
2005 2006 2007 2008 2009 2010 2011 2012 2013 2014 2015
EU27GINIbefore BulgariaGINIbeforeEU27GINIafter BulgariaGINIafterBulgariadisposableincome SouthWestdisposableincomeSouthCentraldisposableincome
Page 81
H2020-YOUNG-SOCIETY-2015 YOUNG_ADULLLT Deliverable 4.1
26
Figure19.Populationatriskofpovertyorsocialexclusion,%(POV)andseverematerial
deprivationpopulation,%(SMD)
Source:EU-SILC,EUROSTAT
Healthandwell-beingconditions
Healthandwell-beingconditionsaredifficulttoassess.Therehavebeenmanydatagapsandthereis
notenoughinformationattheregionallevelandwerefertothegeneralstateofhealthandwell-being
inthissection.
In2014theaveragelifeexpectancyingoodhealthinBulgariais66yearsforwomenand62yearsfor
men. These rates are higher than in Germany and are comparable to those in the UK. The rate of
peoplewhoappreciatetheirhealthasgoodorverygoodinBulgariain2015is65.6%,whichisslightly
lowerthantheEU27average(67.0%).However, thisraterisesrapidly from2006to2010,andthen
beginstoslowdown.
Overall,bothmenandwomen inBulgariaagedbetween25and35aremoredissatisfiedby the ten
indicatorsformenandwomenintheEU28.Thegreatestdiscrepancyisintraveltimeindicators
0
10
20
30
40
50
60
70
2006 2007 2008 2009 2010 2011 2012 2013 2014 2015
BulgariaPOV SouthWestPOV SouthCentralPOVBulgariaSMD SouthWestSMD SouthCentralSMD
Page 82
H2020-YOUNG-SOCIETY-2015 YOUNG_ADULLLT Deliverable 4.1
27
(-21.2% formenand -18.6% forwomen), "personal ties" (-20.5% formenand -23.0% forwomen),
"Livingenvironment"(-17.7%formenand-17.4%forwomen)and"leisureandgreenareas"(-14.8%
formenand-16.8%forwomen).
Totalsatisfactionforthe18-30agegroupinBulgaria(-1,161)ismuchlowerthantheEU28average(-
0,014),whilemen(-1,211)are lesssatisfiedthanwomen(-1,109). At thesametime, theresults for
BulgariaaremoreinhomogeneousthantheresultsfortheEU28.
Figure20.Highsatisfactioninvariouslifedomains,populationaged25-34,EU28andBulgaria,
2013
Source:EU-SILC,EUROSTAT
In2015thenumberofbedsinhospitalsinBulgariais713per1000people,whileintheSouth-West
regionitis688andintheSouth-Centralregionis763.Overall,thetrendinBulgariaistoincreasethe
numberofbedsinhospitalsper1000people.AnupwardtrendisalsoobservedintheSouth-Central
region,whileintheSouth-Westregiontherearecyclicalperiodsofincreaseanddownwardperiods.
In2015 thenumberofnurses andmidwivesper1000people inBulgaria is485, in theSouth-West
regionis500andintheSouth-Centralregionis453.Overall,thetrendinBulgariaisontheincrease,
againsuchanincreaseisobservedintheSouth-Centralregion,whileintheSouth-Westregionthereis
acyclicalalternationofperiodsofincreaseandperiodsofdecrease.
051015202530354045
Financialsituation
Accommodation
Jobsatisfaction
Commutingtime
Timeuse
Overalllifesatisfaction
Recreationalandgreenareas
Livingenvironment
Personalrelationships
Meaningoflife
EU28men Bulgariamen EU28women Bulgariawomen
Page 83
H2020-YOUNG-SOCIETY-2015 YOUNG_ADULLLT Deliverable 4.1
28
Thenumberofdoctorsper1000people inBulgariahas increasedfrom364in2005to399in2014.
GrowthisalsoseenintheSouth-Centralregion-from317in2005to374in2014.IntheSouth-West
region,however,from2005to2010therewasadecreasefrom419to391,andthenanincreaseand
in2014thefigurereached418,i.e.,reachesthe2005value.
Finalremarks
Tosumupthisoverviewofthe livingconditionsforyouthinthetworegionsinBulgaria,weshould
stressthefollowingpoints:
At the national level andwithin the functional regions there is a process of economic stabilization,
income growth, poverty reduction, increasing youth employment, growth in disposable household
income,andanincreaseintheshareofpeoplewithhighereducation.Whilethistrendhasapositive
impact on the living situation of young adults in the country, still the country lags far behind the
conditions for youth development in the other EU member states. The Bulgarian economy,
productivity, employment and incomes remain low when compared to the average values on the
Europeanlevel.BulgariastillneedstocatchupinitseconomicdevelopmentwiththerestofEurope,as
the absolute value of the GDP per capita is significantly lower than the EU 28 average values. It
remainsatabout47%oftheEUaverage.The laborproductivity inBulgaria isconstantly increasing,
thoughitisstillonly43.7%oftheEU28average(asof2015).Theshareofgovernmentspendingon
education in 2013 is 4.1% of the national GDP and is relatively stable for the period 2001-2013.In
addition,theratesofparticipationoftheBulgarianpopulationintheformsoflifelonglearningarealso
low.
There are important differences between the two regions in Bulgaria. For example, in the South-
Centralregionover50%oftheemployeesworkformicroandsmallcompanies,whileinSouth-West
region over 50% of the employees work in medium and larger sized companies. Concerning the
unemployment rates, the South-West region has somewhat more favorable conditions for youth
transitionsfromeducationtoemployment.ThustherateofunemployedyoungmalesinSouth-Westis
14.9% compared to 23.2% in South-Central region. Regarding education, the South-West region is
withthelargestshareofpeopleagedbetween30and34withcompletedtertiaryeducation,andthe
smallestshareofpeopleinthesameagerangewithlessthaneducation.TheSouth-CentralRegionis
withthesmallestshareof30-34year-oldswithhighereducation,andthelargestshareofpeoplewith
lower secondary education. In addition, the percentage of people at risk of poverty and social
exclusionintheSouth-WestregionislowerthanintheSouth-CentralRegionandBulgariaasawhole.
TheanalysisofthelivingconditionsofyoungadultsinBulgariarevealsseveralriskfactorsthatplace
young people in vulnerable situations. In education it is the young Roma who are particularly
Page 84
H2020-YOUNG-SOCIETY-2015 YOUNG_ADULLLT Deliverable 4.1
29
disadvantagedwhoareatariskofearlyschoolleavingbecauseofpoverty,culturalpracticesofearly
marriages and the existence of segregated schools (Milenkova and Hristova, 2017). While young
peoplefromotherminoritiesandthemajoritypopulationalsofacetheriskofdroppingoutbeforethe
obligatoryschoolleavingage,fortheRomathisoftenmeansnotonlyalackofanyqualifications,but
alsoremainingilliterate–aboutonefifthoftheRomayouth.(NSI,Census2011).Onthelabormarket
underprivilegedarethelong-termunemployedandthoseworkingintheinformaleconomybutmost
atriskaretheNEETs-withthosenotineducation,trainingandemploymentwhoareover20%inthe
South-Centralregion.YoungpeoplewithdisabilitiesandfromRomaethnicityareoverrepresentedin
thisgroup.Thoseareriskofseverematerialdeprivationinthetotalpopulationvarybetween25%in
theSouth-Westto40%intheSouth-Centralregion.Again,inthisgroupmostaffectedarefamilieswith
manychildren,singlemothersandtheRomayouth.
Inconclusion,thedatashowthatthelivingconditionsforyoungadultsincludingthestateofeducation
arebetter intheSouth-Westregionthan intheSouth-Centralregion.However,weconsiderthatthe
differencesbetweenBulgaria and themoredeveloped countries in theEUaremore significant, and
theyneedtobeaccountedforwhentryingtoexplainyoungpeople’sdecisionsasthesediscrepancies
areoftenthemajorreasonforthestillongoingmassyouthemigrationoutofthecountry.
References
EUROSTAT(2017).EuropeanUnionstatisticaloffice,http://ec.europa.eu/eurostat/TheEuropeanUnionLabourForceSurvey(EU-LFS),EUROSTATKovacheva,S.andS.Kabaivanov(2014)‘Youngpeopleinsearchofawork-familybalance',in
Deliyanni,V.(Ed.)ChanginglandscapesforchildhoodandyouthinEurope,Cambridge:CambridgeUniversityPress,61-85.
Milenkova,V.,S.Hristova,(2017)“Isthereanylightinthetunnel?OntheDrawbacksofRomaEducationalIntegrationinBulgaria”.EuropeanQuarterlyofPoliticalAttitudesandMentalities,6(1):1-16.https://docs.google.com/viewer?a=v&pid=sites&srcid=
ZnNwdWIudW5pYnVjLnJvfGV1cm9wZWFuLXF1YXJ0ZXJseS1vZi1wb2xpdGljYWwtYXR0aXR1ZGVzLWFuZ
C1tZW50YWxpdGllc3xneDo3MWExZjllNzVjMDdhM2YMitev,P.-E.andS.Kovacheva(2014)YoungPeopleinEuropeanBulgaria.ASociologicalPortrait
2014.Sofia:FreidrichEbertFoundation.NationalStatisticalInstitute(2017),http://www.nsi.bg/enOECD(2017),https://data.oecd.org/TheEuropeanUnionStatisticsonIncomeandLivingConditions(EU-SILC),EUROSTATOECD,PIAAC,http://www.oecd.org/skills/piaac/OECD,PISA,http://www.oecd.org/pisa/UNESCO,http://data.uis.unesco.org/
Page 85
H2020-YOUNG-SOCIETY-2015 YOUNG_ADULLLT Deliverable 4.1
Work Package 4
Quantitative Analysis Young Adults’ Data
Croatia -
National Briefing Paper with national and regional data sets
University of Zagreb, Faculty of Teacher Education (UNIZG) Vlatka Domović, Dejana Bouillet & Monika Pažur
15/06/2017
Project Coordinator: Prof. Dr. Marcelo Parreira do Amaral (University of Münster) Project no.: 693167 Project acronym: YOUNG_ADULLLT Project duration: 01/03/2016 to 28/02/2019 (36 months) Type of document: Deliverable 4.1. Delivery date: Month 19 Dissemination level: Public
Page 86
H2020-YOUNG-SOCIETY-2015 YOUNG_ADULLLT Deliverable 4.1
2
Tableofcontents
ExecutiveSummary........................................................................................................................................................41. Qualitydataassessment.......................................................................................................................................52. Demographicstructure........................................................................................................................................63. Generalstateoftheeconomy.........................................................................................................................114. EducationinCroatia...........................................................................................................................................135. YouthandtheLabourMarket.........................................................................................................................206. Redistributionandsocialinclusion..............................................................................................................247. Healthandwell-beingconditions.................................................................................................................29References.......................................................................................................................................................................33
Listoffigures
Section3DemographicstructureFigure1StatisticalregionsLevel2(NUTSII),2013,p.7Figure2:Comparisonofpopulationregardingageaccordingtothecensusin2001andin2011,p.8Figure3:Migration,olddependencyandfertilityrates,populationchangeinCroatia,ContinentalCroatia,AdriaticCroatia,2005-2015,p.9Section4GeneralstateoftheeconomyFigure4:GDPineuroperinhabitantsPPSandlabourproductivity(rightax,EU=100),Croatia,ContinentalCroatia,AdriaticCroatia,2006-2015,p.11Section5EducationinCroatiaFigure5:Trendsinenrolmentsinacademicvs.professionalhighereducation,p.17Figure6:NEETratesforgroupage15-29inCroatiaandEU28,p.18Figure7:Positioninrelationtostrongest(outerring)andweakestperformers(centre),p.19Section6YouthandtheLabourMarketFigure8:Youthemploymentandunemploymentrates,youthunemploymentratioofyoungpeople15-24(rightex),EU27,Croatia,AdriaticCroatiaandContinentalCroatia,p.21
Page 87
H2020-YOUNG-SOCIETY-2015 YOUNG_ADULLLT Deliverable 4.1
3
Figure9:TermofunemploymentofunemployedyoungadultsinOsijek-BaranjaandIstriaRegion,p.23Section7RedistributionandsocialinclusionFigure10:Socialprotectionbenefits(%oftheGDP),p.24Figure11:At-risk-of-povertyratebyNUTS2andNUTS3(%),p.25Figure12:Youngpeopleatrisk-of-povertyorexclusionrateandseverematerialdeprivationrate(age16-29,%),p.26Figure13:Giniindexofequaliseddisposableincome,p.27Figure14:MaterialDeprivationRate,p.28Section8Healthandwell-beingconditionsFigure15:Medicaldoctors:Healthpersonnel(perhundredthousandinhabitants,p.30Figure16:Prevalenceoftheratioofpersonswithadisabilityinthetotalpopulationofregions,p.31Figure17:Averageratingofsatisfactionbydifferentlifedomain(age:16yearsandover,2013),p.32
Page 88
H2020-YOUNG-SOCIETY-2015 YOUNG_ADULLLT Deliverable 4.1
4
ExecutiveSummary
ThisNationalBriefingPaperprovidesashortoverviewofthelivingconditionsofyoungpeopleinCroatia.SpecialattentionisgiventothelivingconditionsofyoungpeopleintwoCroatianfunctionalregions(IstriaCountyandOsijek-BaranjaCounty).
Basedontheobtaineddata,itispossibletoconcludethatyoungpeopleinCroatialiveinconditionsthatarelessfavourableincomparisonwiththeEU28average.Thisconclusionconcernsyouthinbothfunctionalregions,eventhoughtheIstriaCountyismoredevelopedthantheOsijek-BaranjaCounty.
Themaindemographiccharacteristicisadeclineoftherateofnaturalpopulation(includingincreasingtheaverageageofthepopulationandlowfertilityrate).CroatianeconomicconditionsaresignificantlyundertheEU28average(theCroatianGDPissignificantlylowerthantheEU28average,andtheCroatianlabourproductivityissignificantlyundertheEU28andEuroareacountriesaverage).ComparingCroatiawithotherEUcountries,theshareofyouthlivingwiththeirparentsisveryhigh.ThemainstrengthsoftheCroatianeducationsystemareaverylowearlyschoolleavingrateandthehighproportionofsecondaryvocationalschoolgraduatesenteringhighereducation.Themainweaknessesarelowresultsininternationalstudiesofnumeracy,literacyandreadingskillsofyouth,aswellasextremelylowparticipationinearlychildhoodeducationandcareandinadulteducation.Theeconomicactivityrateofyouth(age15-24)hasdecreasedinthelasttenyears.CroatiaisoneofthethreeEU28countrieswiththehighestyouthunemployment.ThekeyissuesfacedbyyoungpeoplewhenenteringthelabourmarketinCroatiaarethelackofpreviousworkexperienceandmismatchbetweentheirqualificationsandtheskilldemand.Moreover,economicactiveyouthinthelabourmarketshowsagreatgendergap.CharacteristicsoftheCroatiansocialwelfaresystemshowthatthesocialprotectionexpendituresinthenationalGDPisbehindtheexpendituresintheGDPofEU28average,whilethematerialdeprivationrateismultipletimeshigher.However,thelivingconditionsforyoungpeopleinCroatiaandtheGiniindexhaveatendencytobesimilartotheEuropeanaverage.ThebestaspectofhealthcareinCroatiaisthebroadnessthatencompassesthepopulationwithfreehealthcareincludingpersonsintheregularsystemofeducationandpersonswithlowincome.However,CroatianpeoplearelesssatisfiedthantheaverageEuropeancitizensinthefieldofsatisfactionwithfinancialsituation,overalllife,recreationalandgreenareasandlivingenvironment.Moreover,theavailabilityofhealthservicesisnotuniforminallregionsofCroatiaanditissignificantlyweakerinrelationtootherEUcountries.
Page 89
H2020-YOUNG-SOCIETY-2015 YOUNG_ADULLLT Deliverable 4.1
5
AllanalyseddatashowthatthelivingconditionsofyoungpeoplearebetterinIstriathaninthefunctionalregionOsijek-Baranja.
Introduction
This national briefing paper provides a short overview of the living conditions of young people inCroatiaand,morespecifically, intheNUTS2regions-ContinentalCroatiaandAdriaticCroatia. Datahas been collected at national (NUTS 0) and regional (NUTS 2) level according to six dimensions ofcontextuallivingconditionsagreeduponintheWP4guidelines.
Eurostatonlinedatabasesataggregatednationalandregionallevelareusedasmainsources.Thismaincorpusofdataiscomplementedbydatacollectedatthelocallevel,comingfromdifferentsourcesandmadeavailablebyCroatianBureauofStatistics,byofficialwebsitesofvariousCroatianInstitutions(forexample:Ministryofscienceandeducation,CroatianInstituteofPublicHealth,MinistryofHealthoftheRepublicofCroatia),regionaldevelopmentalstrategiesaswellasscientificpapers.ContextuallivingconditionsofyoungpeopleinCroatiaareanalysedbylookingatthe:
• demographiccharacteristicsofthepopulationanditssubgroups;• structureoftheeconomy;• inputsandoutputsoftheeducationsystem;• labourmarketsituation;• materiallivingconditionsofyoungpeople;• participationofyoungpeopleinthepoliticalandciviclife;• healthconditionsandindividualwell-being.
1. Qualitydataassessment
Asitismentionedabove,datahavebeencollectedatnational(NUTS0)andregional(NUTS2)level.Wheneverpossible,theresultsrepresentingthelivingconditionsofyoungpeopleintheselectedfunctionalregions(IstriaCountyandOsijek-BaranjaCounty)aregiven.
Eurostatprovidesavastamountofdatathatcanbeusedtocomparativelyassesslivingconditionsofyoungpeopleindifferentdomainsandinvariouscountries/regions.However,dataavailabilityattheregional/locallevelislimitedatNUTS2levelandextremelylimitedatNUTS3level.
Thisrestrainsthecomparabilityamongregionstoalimitedrangeofindicators.Moreover,harmonizeddataarehardtocomplementwithlocaldata,oftensufferingfromafragmentedlandscape
Page 90
H2020-YOUNG-SOCIETY-2015 YOUNG_ADULLLT Deliverable 4.1
6
ofsources,astheyarecollectedformoreorlessspecificpurposesandusuallynotwiththeobjectiveofinteractionwithotherdatasources.
AsfortheavailabledatapublishedbyEurostat,datacoverseveralfieldsandarecomplementedwithmetadataandinformationabouttimeseries.However,accessibilityofdatamaybeaproblematicissue,asdatabasesonEurostatarenotcompletelycombinedandflexiblesothatthecollectionisattimesdifficult:asanexample,thesameinformationontwodifferentagegroupsmaybeavailableonlylookingattwodifferentdatabasesindifferentsectionsofthewebsite(theNEETratefor15-24isavailableamonglabourmarketstatisticswhiletheNEETrate15-29isavailableamongyouthstatistics).Ofcourse,thecomplexityandvarietyofthedatapublishedmakesuchcomprehensiveintegrationdifficulttoachieve.
DuetothefactthatCroatiabecamememberoftheEuropeanUnionintheyear2013,theCroatiannationaldataatEurostatareavailablefromtheyear2007orlater.ThatiswhythecomparativenationalandEuropeandata,ingeneral,covertheperiodfrom2007to2015.
2. Demographicstructure
TheRepublicofCroatiacovers56,539sqkmofcontinentalsurface(includingAdriaticIslands)and31,421sqkmoftheAdriaticSeaalongthecoast.AccordingtothePopulationCensustakenin2011,thepopulationsizeis4,284,889inhabitants(Population,HouseholdandApartmentCensus,2011).ItcanbesaidthatCroatiaisaCentralEuropean,aPannonian,aDanube-basin,aPeralpineandaMediterraneancountry.ThebordercountriesareSlovenia,Hungary,BosniaandHercegovina,SerbiaandMontenegro,andItaly(seaborder).Duetoitsgeographicandtrafficposition,culturalandeconomicinfluencesarisingfromwidersurroundings,naturalandgeographicfeatures,Croatiaappearsexceptionallyheterogeneous.TheContinentalPannonianandPeri-Pannonianareacovers53.7%ofthewholestateterritory,whilethecoastalareacovers31.4%.Theremaining14.9%ofthestateterritorycomprisesanarrowmountainareaofLikaandGorskiKotar.
AccordingtotheNationalclassificationofterritorialunits,asof1January2013theRepublicofCroatiahasbeendividedintotwostatisticalregions–ContinentalCroatiaandAdriaticCroatia1(Figure1).ThisclassificationhasbeensetupaccordingtoEUROSTATcriteria.
Eventhoughitisonlyastatisticaldivision,thatiswithoutelementsofmanagementcharacteroradivisionofnon-administrativetype,therecentdivisionoftheRepublicofCroatiaintotwo
1 Official Gazette No 96 2012 year
Page 91
H2020-YOUNG-SOCIETY-2015 YOUNG_ADULLLT Deliverable 4.1
7
statisticalregions–ContinentalandAdriaticCroatia,hasopenedupaseriesofquestionsinasenseoffinancialandadministrativeefficiencyoflocalandregionalself-government(Bošnjak&Tolušić,2012).
Figure1:StatisticalregionsLevel2(NUTSII),2013(green=ContinentalCroatia,blue=AdriaticCroatia)
Source:CroatianBureauofStatistics
Namely,ContinentalCroatiaincludes13countiesandtheCityofZagrebasthelargesteconomic
centrewhichcomprisesalmostafourthofthepopulationofCroatia.Theregionhasalmost3millioninhabitants.Ontheotherhand,AdriaticCroatiaincludes7countieswith1,469,000inhabitants.TheareaofContinentalCroatiais31,846squarekilometres,whereasthatofAdriaticCroatiais24,696squarekilometres(CroatianBureauofStatistics,2016).ThefunctionalregionofIstriaCountyispartofAdriaticCroatia.TheareaofIstriaCountyis2,813squarekilometres,andthenumberofinhabitantsin2015was208,055(StatisticalYearbookoftheRepublicofCroatia,2016).Theotherobservedfunctionalregion–theOsijek-BaranjaCountyispartofContinentalCroatia,withanareaof4,155squarekilometresand305,032inhabitants(StatisticalYearbookoftheRepublicofCroatia,2016).
Page 92
H2020-YOUNG-SOCIETY-2015 YOUNG_ADULLLT Deliverable 4.1
8
ThenumberofinhabitantsinCroatiashowsasteadydecline.Duetotheprocessofdepopulationandpopulationageing,Croatiahasbeenfacingnumerousdemographicchallengesforanumberofyears.Accordingtothe2011censustheRepublicofCroatiahad4,284,889inhabitants,whichrepresentsadeclineof3.4%comparedtothepreviouscensusin2001.InAdriaticCroatiathisdeclinewassomewhatlowerthaninContinentalCroatia,Namely,thepopulationofAdriaticCroatiadecreasedby1.06%,whereasinContinentalCroatiathedecreasewasashighas4.57%.Intheyearsafterthelastcensus,thepopulationhascontinuedtodecline.Accordingtodatafrommid-2014,thetotalpopulationwasby0.4%lowerthanin2013.Ifcomparingthetwoselectedfunctionalregions,ithastobenotedthatanincreaseinthepopulationwasobservedinIstriaCounty,whereasOsijek-BaranjaCountywastheonewiththehighestpopulationdeclinein2014(RegionalDevelopmentStrategyoftheRepublicofCroatiafortheperioduntil2020,2016).Intheperiodfrom2001to2011inIstriaCountytherewasamildincreaseinthetotalpopulation(by1,711inhabitants,orby0.83%).Thispopulationincreaseisnottheconsequenceofnaturalgrowth,whichhasshownanegativetrend,butisprimarilytheresultofapositiveexternalmigrationbalance,whichhasshownarisingtrendinthelastfewyears.Figure2:Comparisonofpopulationregardingageaccordingtothecensusin2001andin2011
Source:CroatianBureauofStatistics
Page 93
H2020-YOUNG-SOCIETY-2015 YOUNG_ADULLLT Deliverable 4.1
9
Thebalanceofexternalmigration,i.e.betweenthenumberofpersonswhoemigratedfromandthosewhoimmigratedtoIstriaCounty,showsapositivegrowthtrend,withasignificantincreasein2014.Parallelwithanincreaseinthebalanceofexternalmigrations,anegativenaturalgrowthcouldbeobserved,withatendencyofmildincreaseofgrowth.In2011,naturalgrowthwasaccordingtoavailabledata-392,andin2013itwas-362,whichwastosomeextentcompensatedbythepositiveexternalmigrationtrends.ThedemographicstructureofthepopulationinIstriaregardingageshowssignsofdemographicerosion,whichhasanegativeinfluenceontheworkpotentialofthepopulation.Personsofmatureage(50-59yearsofage)makethemostnumerouspopulationgroupofIstria,whereastheaverageageis43.TheageingindexofIstriaCountyis136.8andishigherthanthenationalaverage(whichis115.0).ThismeansthatthepopulationofIstriabelongstothetypeofpopulationinthestageofdeepdemographicoldage(StrategyofDevelopmentofHumanPotentialsofIstriaCounty2016–2020).
Figure3:Migration,olddependencyandfertilityrates(rightax),populationchange(rightax),Croatia,
ContinentalCroatia,AdriaticCroatia,2005-2015Source:EUROSTAT
-0.5
0
0.5
1
1.5
2
2.5
3
-10
-5
0
5
10
15
20
25
30
2005 2006 2007 2008 2009 2010 2011 2012 2013 2014 2015
Croa2apopula2on Croa2afer2lity
Croa2amigra2on JadranskaHrvatskamigra2on
Kon2netalnaHrvatskamigra2on Croa2aOlddependency
Page 94
H2020-YOUNG-SOCIETY-2015 YOUNG_ADULLLT Deliverable 4.1
10
TherateofnaturalpopulationdeclineandtheproblemofdemographicageingintheRepublicofCroatiaisworrying(e.g.in2014itwas-2.7‰,andin2015-4.0‰).Croatianpopulationisamongthefifteenoldestworldpopulations,withtheshareofolderpersonsinthepopulationconstantlyrising.In2005,16,700morepeoplediedthantherewereborn(37,500born,54,200died,accordingtoEurostat).Theaverageageofthepopulationisconstantlyincreasing.In1961itwas32.5years;in1971itwas34.1;intheyear1981itwas35.4andin1991itwas37.5,in2001itwas39.3andin2011itreached41.7years.Theageingindex(calculatedasthenumberofpersonsolderthan60perhundredpersonsaged0-19)was115.0in2011andisaquarterhigherthaninthepreviouscensus(2001–90.7),theageingindexcalculatedfromthenumberofpersonsaged65yearsandolderinrelationtothegroup0-14yearsis116.3,whereasin2001itwas91.9.Thus,inCroatiathenumberofolderpersonsissignificantlyhigherthanthenumberofyoungerpersons.Populationageingisalsovisibleintheold-agedependencyrate(ratiobetweenpopulationaged65andovertopopulation15–64),thatrosefrom26%in2005to28.3in20015.Acomparisonofchildbase(0–4)andpersons75andolderisverysignificantforunderstandingthestatesandprocessesinthecompositionaccordingtoage.In2001thoseagegroupswerealmostequalintheirnumber,andin2011therewere62%moreolderpeoplethanchildren.BasedontrendsandprojectionsasignificantdeclineinthepopulationofCroatiacanbeexpectedinthedecadestofollow.Accordingtoaprojectionconductedbymeansofthecohort-componentmethodforclosedpopulation(notincludingmigration),in2031Croatiawillhave3,680,750inhabitants.Thus,inthirtyyears’time(2001istheinitialyearoftheprojection)thenumberofinhabitantswillhavediminishedby756,710or17.1%.Inotherwords,duetobiological(natural)depopulation,i.e,ahighermortalitythanbirth(themigrationhasnotbeenincluded),onaveragetheRepublicofCroatiawillhavelost25,220inhabitantsperyear(accordingto:NejašmićandToskić,2013).
ThefertilityrateinCroatiaislowanddoesnotshowsignificantchanges(from2005to2015itis1.5).Infantmortalityinthefirstyearafterbirthis4.1deathsperthousandin2015.InCroatialifeexpectancyin2014was77.9years,withtheexpectedlifedurationinAdriaticCroatiabeing79.3years,whichishigherthanthenationalaverage,andinContinentalCroatiaitis77.2years.Moreover,lifeexpectancyissignificantlylowerformen(74.7years)thanforwomen(81years),(datafor2014).
In2013,amongyoungpeople,79.1%ofthoseaged20–29livedwiththeirparents.Thispercentagehasshownacertainstability,fluctuatingbetween74.4to79.9%intheperiodfrom2010to2013.ComparingCroatiawithotherEUcountries,theshareofyouthlivingwiththeirparentsisveryhigh.However,theaveragevaluesdonotrevealexistingstronggenderdifferences.Thepercentageof
Page 95
H2020-YOUNG-SOCIETY-2015 YOUNG_ADULLLT Deliverable 4.1
11
youngmaleslivingwithparentsis86.1against72.1forfemales.Thereasonsforyoungpeoplelivingwiththeirparentsarevarious:theimpossibilityofsecuringaccommodation,unemploymentorjobinsecurity,culturalfamilypatterns,etc.
ThereisnodoubtthatCroatiafacedwithunfavourabledemographictrends:namely,between1953and2011theshareofyouth(agedbetween15and29)inthetotalpopulationdecreasedfrom27.7%to20.6%.Thisisoneofthereasonforwhichyoutharebecominganincreasinglyimportantsocialresource(Ilišinetal.,2013).
3. Generalstateoftheeconomy
GDPmeasures(Figure4)forCroatiaingeneral,aswellasfortwoNUTS2regions,showthateconomicconditionsaresignificantlyundertheEU28average.Figure4:GDPineuroperinhabitantsPPSandlabourproductivity(rightax,EU=100),Croatia,ContinentalCroatia,AdriaticCroatia,2006-2015
Source:EUROSTAT
-10
10
30
50
70
90
110
130
0
5,000
10,000
15,000
20,000
25,000
30,000
35,000
2006 2007 2008 2009 2010 2011 2012 2013 2014 2015
Croa2alabourproduc2vity(EU=100) EU28GDP
Croa2aGDP JadranskaHrvatskaGDP
Kon2nentalnaHrvatskaGDP
Page 96
H2020-YOUNG-SOCIETY-2015 YOUNG_ADULLLT Deliverable 4.1
12
AfterapositivegrowthofGDPintheyears2006–2008(from14,400to16,500),theeconomiccrisisthatstartedin2008,hascausedadropandstagnationoflowGDPinthenext6years(from2009-2014).In2015,theGDPincreasedtothestatefrom2008(GDP2015=16,700).However,evenwithavisibleeconomicgrowthin2015,theCroatianGDPisstill42%lowerthantheEU28average.
DataforAdriaticandContinentalCroatiaindicatethesametrendchangeoftheGDPduringtheobservedperiod,wheretheGDPforContinentalCroatiaiscontinuouslygreaterthantheCroatianaverageandoftheaverageforAdriaticCroatia.Still,thisdatashouldbeinterpretedwithcaution.Thenationalclassificationofareaunitsfrom2012,dividedCroatiaintotwostatisticalregions(ContinentalandAdriaticCroatia)2.ContinentalCroatiaincludes13countiesandtheCityofZagrebastheeconomicallystrongestcenterwith3millioninhabitants.Inthatway,theBDPforContinentalCroatiaisalmostartificiallydoubled(BošnjakandTolušić,2012).Datapresentedinthiswayarecontradictorytothefindingsinfunctionalregions,andthereforetheOsijek-BaranjaCountyalthoughpartofContinentalCroatia,had,in2014,aGDPperresident8,045EUR.Ontheotherhand,IstriaCountyaspartofAdriaticCroatiaisoneofthemostdevelopedCroatiancountiesandwithitsGDPsignificantlydeviatesfromthedata(GDPperresidentin2014was12,724EUR).
DataaboutlabourproductivityshowsthatCroatiaissignificantlyunder(around40-50%)theEU28andEuroareacountriesaverage.
Croatiahashad146,766activebusinesseconomiesin2014accordingtoEurostat,andinthesameyearEU28averagewas26,307,386.But,itissignificantthatestimatedpercentageofactivebusinesseswithnoemployeesinCroatiais15,whileEUaverageis57%.In2014,around99,500(69%)ofactivebusinesseconomiesinCroatiahadfrom1-4employees,andasmallpercentageofthemhad5-9employees(9%)or10andmoreemployees(8%).TheEurostatdataaboutactivebusinesseconomiesforCroatiaisavailablesinceyear2012,andinthoseyears’numberoftotalactivebusinesseconomieshasincreasedfrom147,798in2012to146,766in2015.
NinemembersoftheEU28,amongwhichisCroatia,allocatelessthan1%oftheirBDPforresearchanddevelopment.In2014,Croatiaspent0.79%oftheBDPforR&D.AnamountofinvestmentinR&Dhasdecreasedin2014thanin2004for1.5%of2004amount.In2015,theamountinvestedinR&Dincreasedfor8,7%ofanamountin2014.However,thatisstilllessthan1%oftheBDPinCroatia(0.85%BDP).TocomparethosenumberswithEU28average,thesituationisfollowing:inyear2015totalinvestmentinR&DinCroatiaexpressedinEuroperinhabitantwas88.7,andEU28averagewas
2 Official Gazette NN 96/2012
Page 97
H2020-YOUNG-SOCIETY-2015 YOUNG_ADULLLT Deliverable 4.1
13
587.7.Thereareonly3countriesinEU28whoseinvestmentinEuroperinhabitantislowerthaninCroatia:Bulgaria(60.1),Romania(39.4)andLatvia(76.7).FromtheamountofinvestmentinR&D,thebusinesssectorinvested51.2%,thegovernmentalsectorinvested24.5%,andtheremainingamountiscoveredbythehighereducationsector(23%)andprivatenon-profitsector(around1%).Thepercentageofresearchersemployedinallsectorsoftheeconomyisverylow(0.6%ofallemployment).Moreprecisely,in2014thenumberofresearchersemployedinallsectorswas10,726.Mostresearchersareemployedinthehighereducationsector(around7,000)andinthebusinessenterprisesector(1,100).InAdriaticCroatiain2015,therewere0.27%researchers(ofallemployees)employedinallsectors.InContinentalCroatia,thatpercentagewasonlyalittlebithigher(0.45%).
TheshareofpeopleemployedinthepublicsectorisslowlygrowinginCroatia,forexamplefrom2008(5.8%)to2014(7.1%).Thesamemovementispresentinemploymentineducation,thatintheyear2008was5.4%,andin2014,thatpercentagehasgrownto7.6.Finally,peopleemployedinthehealthsectorandinsocialworkmakearound6.8%oftotalemploymentofCroatia.
Inbrief,itispossibletoconcludethatCroatia’simmediateeconomicchallengesincluderestoringmacroeconomicstabilityandmodernizingpublicservices,thejudiciary,andthegovernanceofstate-ownedenterprises,tobettersupporttheneedsofpeopleandfirms.
4. EducationinCroatia
TheproportionofgeneralgovernmentexpenditurespentoneducationinCroatiawasgenerallystablebetween2007(10.5%)and2013(10.7%)butitfellsignificantlyto9.8%in2014.AlthoughgeneralgovernmentexpenditureoneducationasaproportionofGDProsefrom4.7%ofGDPin2007to5.1%in2013,italsofellin2014backto4.7%.ThisfigureplacesCroatiabelowtheEUaverageof4.9%andamongthebottom10EUMemberStates.Inrealterms,between2007and2013therehasbeenonlyasmallincreaseof1.4%inabsoluteexpenditureoneducation,howevertherehasbeenadropof7.8%between2013and2014–thesecondhighestdropintheEU.Alargeproportionofgovernmentexpenditureonschoolsgoesonstaffsalaries.(EducationandTrainingMonitor2016–Croatia).
DespitetheInternationalStandardClassificationofEducation(2011),(dividingthebasicsystemofeducationintopre-primary,primary,lowersecondary,anduppersecondary),theCroatianpre-tertiaryeducationstickstotheoldschemewhichremainedunchangedformorethanfiftyyears.Themaindifferenceincomparisonwithothercountriesisashorterprimaryeducation(ISCEDlevel1).Theoveralleducationalsystemisdividedintothefollowingsegments:pre-schooleducation,elementaryschooleducation,secondaryschooleducation,highereducationandadulteducation.In
Page 98
H2020-YOUNG-SOCIETY-2015 YOUNG_ADULLLT Deliverable 4.1
14
Table1thekeyindicatorsabouttheCroatianeducationsystem(year2012and2015)arepresentedandcomparedwiththeEUaverage.
Table1:KeyindicatorsofCroatianeducationsystemcompared,source:EducationandTrainingMonitor2016–Countryanalysis Croatia EUaverage
2012 2015 2012 2015ET2020benchmarks
Earlyleaversfromeducationandtraining(age18-24)
Total 5.1% 2.8% 12.7% 11.0%
Tertiaryeducationalattainment
Total 23.1% 30.9% 36.0% 38.7%
Earlychildhoodeducationandcare(ECEC)(fromage4tostartingageofcompulsoryeducation)
71.0% 72.4% 93.2% 94.3%
Proportionof15year-oldswithunderachievementin:
Reading 18.7% : 17.8% :
Maths 29.9% : 22.1% : Science 17.3% : 16.6% :Employmentrateofrecentgraduatesbyeducationalattainment(age20-34havinglefteducation1-3yearsbeforereferenceyear)
ISCED3-8(total) 60.2% 62.6% 75.9% 76.9%
Adultparticipationinlifelonglearning(age25-64)
ISCED0-8(total) 3.3% 3.1% 9.2% 10.7%
Othercontextualindicators
Educationinvestment PublicexpenditureoneducationasapercentageofGDP
4.9% 4.7% 5.0% 4.9%
Tertiaryeducationalattainment(age30-34)
Native-born 23.2% 31.7% 36.7% 39.4%
Foreign-born 21.7% 23.6% 33.8% 36.4%Employmentrateofrecentgraduatesbyeducationalattainment(age20-34havinglefteducation1-3yearsbeforereferenceyear)
ISCED3-4 54.2% 45.0% 69.7% 70.8%
ISCED5-8 65.9% 76.2% 81.5% 81.9%Learningmobility Inboundgraduates
mobility(bachelor)0.2% 0.2% 5.5% 5.9%
Inboundgraduatesmobility(master)
0.5% 0.5% 13.6% 13.9%
Eventhoughpre-schooleducationinCroatiaisnotcompulsory,itrepresentsthebeginningpart
oftheeducationalsystem.Pre-schooleducationcanstartwhenthechildbecomessixmonthsold,but,intheexistingpractice,childrenenterpre-schoolinstitutionswhentheyareoneyearold.The
Page 99
H2020-YOUNG-SOCIETY-2015 YOUNG_ADULLLT Deliverable 4.1
15
participationrateinearlychildhoodeducationandcare(fromage4tothestartingageofcompulsoryeducation)hassteadilyincreasedoverthelastdecadebutisstilloneofthelowestintheEU,at72.4%comparedtotheEUaverageof94.3%in2014.
ElementaryschooleducationinCroatiaisprovidedthroughthenetworkofpublicandprivateelementaryschools.Elementaryschooling,lastingeightyears,isthecompulsorypartofeducationintheRepublicofCroatiaforchildrenbetweentheagesofsevenandfifteen,andcorrespondstotheISCEDlevels1and2.In2014/15therewereapproximately850elementaryschoolswith321,000pupils,and31,800teachers(CroatianBureauofStatistics).Inthe2014/15schoolyear,therewere707secondaryschoolsinCroatia.
Oneindicatorofthequalityofdevelopmentofpupilcompetencesattheendofcompulsoryeducationaretheresultsininternationalcomparativeresearch.CroatiahasbeenparticipatingintheOECDProgrammeforInternationalStudentAssessment–PISAsince2006.TheCroatianPISAresults,incomparisonwithotherEUcountries,areunsatisfactory.Forexample,in2012,29.9%ofstudentsinCroatiafailedtoachievebasicskillsinmathematicscomparedtotheEU-25averageof22.1%(OECD2013).Inreadingandscience,CroatiawasaroundtheEUaverage(OECD2013).
Afterthecompletionofcompulsoryelementaryschoolmorethan95%ofstudentscontinuetheireducationinsecondaryschools(correspondingtotheISCED3level)althoughsecondaryeducationisnotcompulsory.Intheschoolyear2014/15therewere707secondaryschoolsinCroatia,with175,512studentsand26,138teachers(CroatianBureauofStatistics).
Themaincharacteristicofsecondaryeducationisstreaminginthreedirections:academic(gymnasium),vocationalschoolsandartschools.Whileacademic(gymnasium)andartschoolsarefour-yearsecondaryschools,therearetwotypesofvocationalschools,thefour-yearandthethree-yearvocationalschools.Roughly,70%ofthesecondaryschoolpopulationattendvocationalschools,ofwhomabout44%areinthefour-yearprogrammesandtheremaining26%areinthethree-yearprogrammes(Domović&VizekVidović,2015).Thelevelofparticipationinvocationaleducationandtraining(VET)atuppersecondarylevelinCroatiaisoneofthehighestintheEU—71.3%,comparedtotheEUaverageof48.3%in2015.However,theemploymentrateforrecentuppersecondarygraduates(peopleaged20–34wholeftuppersecondaryeducationbetweenoneandthreeyearsbeforethereferenceyear)46.1%in2014,issignificantlybelowtheEUaverageof73%andisthethirdlowestpercentageinEuropeafterItalyandGreece.TheemploymentgapbetweenyouthwithuppersecondaryandtertiaryeducationismoresignificantthaninotherEUcountries,especially1-3yearsaftergainingaqualification.ArelativelysmallproportionofVETgraduatesfindtheirfirstemployment
Page 100
H2020-YOUNG-SOCIETY-2015 YOUNG_ADULLLT Deliverable 4.1
16
intheoccupationthattheytrainedfor.Onaverage,between37%and47%managetodoso,whereassomesectorsstandoutaslesschallengingforfindingmatchingemployment,suchastheretailsector,hospitalityandtourismandwoodprocessing(EducationandTrainingMonitor2016–Croatia,p.7).
OneofthestrengthsoftheCroatianeducationalsystemisthelowestearlyschoolleavingrateinEU(2.8%)in2015,comparedtotheEUaverageof11%.
ItshouldbenotedthatthedepopulationtrendinCroatiahasasignificantimpactonthecontinuousdecreaseofthenumberofpupilsandstudentsinCroatia.Inprimaryschools,attheendofthe2014/2015schoolyeartheoverallnumberofstudentswas1.3%lowerandinsecondaryschools2%lowerthantheyearbefore.Thetrendtowardsshrinkingstudentpopulationscontinuedintheschoolyear2015/2016when1%fewerprimaryand4.5%fewersecondarystudentsenrolled.Thenumberofstudentsenteringhighereducationalsoexperiencedasignificantdropin2014/2015when,afteraperiodoffairlyconstantexpansion,3,000fewerpeopleenrolledinhighereducationthaninthepreviousyear(NationalStatisticsOffice,2015).
TertiaryeducationinCroatiaisbasedonthebinarysystemanditcanbeacquiredattheuniversityandprofessionalhighereducationinstitutions.Mostofthetotalnumberofstudentsstudyatpublichighereducationinstitutions(Figure5).Higherprofessionalschoolsandpolytechnicsofferinghighereducationarenotapartoftheuniversitysystem.TheyofferspecialistprofessionalprogrammesandrelevantdiplomasbutdonotprovideprogrammesleadingdirectlytoPh.D.
Page 101
H2020-YOUNG-SOCIETY-2015 YOUNG_ADULLLT Deliverable 4.1
17
Figure5:Trendsinenrolmentsinacademicvs.professionalhighereducation
Source:EducationandTrainingMonitor,2016–CountryAnalysis
TertiaryeducationalattainmentinCroatiahasformanyyearsbeenonagenerallyupward
trend.Theproportionof30-34-year-oldswithtertiaryeducationinCroatiain2015returnedto30.9%afterasurgeto32.2%in2014.ComparedtotheEUaverageof38.7%,thisisarelativelylowpercentage,butitisapproachingCroatia'sEurope2020targetof35%.MorethantheirpeersinotherEUcountries,studentsinCroatiamainlychoosetostudysocialsciencesandhumanities.Thisisespeciallythecaseforeconomics,businessandlawdegrees,whicharestudiedby41%inCroatiacomparedto34%intheEU.Inthepast5years,therehasbeenaslowbutsteadyincreaseintheproportionofstudentsstudyinginuniversities(Figure5)asopposedtopolytechnicsorschoolsofprofessionalhighereducation.Therehasalsobeenasteadyincreaseintheproportionofstudentspursuingacademicdegreesandaslowdropintheproportionofthosepursuingprofessionaldegrees(EducationandTrainingMonitor2016–Countryanalysis).
TheemploymentratesoftertiarygraduatesinCroatiahavenotrecoveredtothepre-crisislevels.In2008,86.3%oftertiaryeducatedgraduatesfoundemploymentwithin1-3yearsofgraduation
0%
10%
20%
30%
40%
50%
60%
70%
80%
0 1 2 3 4 5 6
Trendsinhighereduca2on
Professionaldegrees Academicdegrees
Page 102
H2020-YOUNG-SOCIETY-2015 YOUNG_ADULLLT Deliverable 4.1
18
whilein2015thisnumberwasstillaslowas76.2%.ThisfigureputsCroatiaamongthesixworstperformersintheEU,afterGreece,Italy,Spain,CyprusandPortugal.
ParticipationinadulteducationinCroatiaislowcomparedtootherEUcountries.Forexample,in2015,only3.1%ofCroatianadultsparticipatedineducationandtraining,comparedtotheEUaverageof10.7%(EducationandTrainingMonitor2015–Countryanalysis).TheCroatianNEETrate,measuringthepercentageofyoungpeopleaged15-29outofeducationandnotemployed,wasincreasingsince2008to2014(from13%in2008to21.8%in2014).In2016,theNEETratehasslightlydecreased(19,5%)comparedtopreviousyears.However,theNEETrateinCroatiaisconstantlymuchhighercomparedtotheEU28average(14,20%in2016).Figure6:NEETratesforgroupage15-29inCroatiaandEU28
Source:EUROSTAT
TheFigure7sumsupthestrongpointsandweakpointsoftheCroatiansystemofeducationincomparisonwiththeEuropeanaverageandEuropeangoalsfor2020.
0.0
5.0
10.0
15.0
20.0
25.0
2008 2010 2012 2014 2016
NEETRATES(groupage15-29)
Croa2a EU28
Page 103
H2020-YOUNG-SOCIETY-2015 YOUNG_ADULLLT Deliverable 4.1
19
Figure7:Positioninrelationtostrongest(outerring)andweakestperformers(centre)Source:EducationandTrainingMonitor2016
Table2showsdataontheavailableeducationalinstitutionsinCroatiaandthetwocounties,includingthestructureofpopulationaged20-29accordingtothelevelofeducation.Table2:Schoolsin2015/2016schoolyearandpopulationaged20-29accordingtohighestlevelofcompletededucation,source:CroatianBureauofStatistics,2016Schoolsin2015/2016schoolyear
CroatiaIstriaCounty
Osijek-Baranja
County
Primaryschools 2,125 105 187Uppersecondaryschools 751 44 52Facultiesandhighschools 104 2 13Populationaged20-29accordingtohighestlevelofcompletededucation
Totalpopulation(20-29,2011)550,724
(100%)26.569(100%) 40.762(100%)
Noschooling 2,352(0.43%) 61(0.23%) 168(0.41%)1-3gradesofbasiceducation 586(0.11%) 22(0.08%) 58(0.14%)4-7gradesofbasiceducation 2,502(0.45%) 103(0.39%) 273(0.67%)
Page 104
H2020-YOUNG-SOCIETY-2015 YOUNG_ADULLLT Deliverable 4.1
20
Elementaryeducation 27,831(5.05%) 1,499(5.64%) 2,486(6.10%)
Secondaryeducation 415,729(75.49%)
20,356(76.61%) 31,776(77.95%)
Highereducation 1010,385(18.41%) 4,521(17.2%) 5,991(14.70%)
DatapresentedinTable2leadtotheconclusionthatIstriaCounty,despitethesignificantly
lowernumberofeducationalinstitutions,standsoutintermsofafavorableeducationalstructureofyouthwhichisreflectedinthebelow-averagerepresentationofpersonswithalowlevelofeducation.Ontheotherhand,inOsijek-BaranjaCountyweencounteranabove-averageproportionofyouthwhohavenotcompletedsecondaryeducationandasmallproportionofhighlyeducatedpersons,despitetherelativelyfavorablenumberofavailableinstitutionsofhighereducation.
5. YouthandtheLabourMarket
In2015,Croatiainvestedinlabourmarketpoliciesanamountofresourceswhichwasequaltoonly0.6%ofitsGDP.Asmuchas49%ofthatamountwasdirectedintoLMPmeasures.ThemainfocusofCroatianLMPmeasuresistraining(60%),andapproximatelythesameamountgoestotheemploymentincentives(15%)anddirectjobcreation(16%).Around7%ofCroatiansinvestmentinLMPmeasuresgoestostart-upinitiatives.
RegardingparticipationintheCroatianlabourmarket,theoveralleconomicactivityratefrompeopleage15-65hasshownaslowgrowthinthelasttenyears,from63.3%in2005to66.9%inyear2015.ThatisbelowtheEU27average(72.6%).Ontheotherhand,theeconomicactivityrateofyouth(age15-24)hasdecreasedinthelasttenyears,from38.1%in2005to33.2%in2015,thatis8.3percentagepointslowerthantheEU27average.Economicactiveyouthinthelabourmarketshowsagreatgendergap,with28%activefemales,and38%activemales.Theemploymentrateshowstheproportionoftheworkingagepopulationthatisinemployment.InCroatia,theoverallemploymentrate–forpersonsaged20-64was60.5%in2015,thelowestamongallEU-28MemberStatesand9.6%belowtheEU-27average(Figure8).Overallemploymentofpersonsaged20-64inAdriaticCroatiais59.5%andinContinentalCroatia61%.AccordingtoastatisticalportraitofCroatiaintheEuropeanUnion(CroatianBureauforStatistics,2013),theCroatianemploymentrateforthepopulationaged20-64hadincreasedto62.9%by2008,butduringthefinancial,economicandpublicdebtcrisis,itdecreasedeachyearfrom2009to2012.OneoftheEurope2020targetsisthat,by2020,75%ofpersonsaged20-64intheEUshouldbeinemployment;forCroatiathetargetis59%.Thegendergap
Page 105
H2020-YOUNG-SOCIETY-2015 YOUNG_ADULLLT Deliverable 4.1
21
intheCroatianemploymentratewas9.4percentagepoints,withtherateofmalesat65.2%in2015andthatforfemalesat55.8%.In2012,thegendergapwas8.9%,whichshowsthatthegapincreasedthroughthelastthreeyears.ThegapissignificantlysmallerinAdriaticCroatia(6.9%)thaninContinentalCroatia(11%).Theemploymentofyouthinthe15-24agegroupin2015was19%,thatis,14.1percentagepointsbelowtheEU27average.Again,theemploymentisalittlebithigherinContinentalCroatia(19.3%)thaninAdriaticCroatia(18.3%).Thegapbetweenmalesandfemales(6.6%)existeveninthisagegroup,anditisagainlowerinAdriaticCroatia(5.3%),thaninContinentalCroatia(7.2%).Figure8:Youthemploymentandunemploymentrates,youthunemploymentratioofyoungpeople15-24(rightex),EU27,Croatia,AdriaticCroatiaandContinentalCroatia
Source:EUROSTAT
Thegeneralbusinesscyclehasasignificantimpactonunemploymentlevels,andtheimpactof
thefinancial,economicandpublicdebtcrisiscanbeseenintherecentdevelopmentsofunemploymentstatisticsinmostEUMemberStates.TheunemploymentrateinCroatiarosefromapre-crisislowof8.4%in2008to15.9%by2012,whileintheEU27itrosefrom7.1%to10.5%overthesameperiod.In
0
20
40
60
2005 2006 2007 2008 2009 2010 2011 2012 2013 2014 2015EU27unemploymentCroa2aunemploymentJadranskaHrvatskaunemploymentKon2nentalnaHrvatskaunemployment
Page 106
H2020-YOUNG-SOCIETY-2015 YOUNG_ADULLLT Deliverable 4.1
22
2015theunemploymentrateinCroatiawas15.6%,whichis6.2%higherthantheEU28average(9.4%).UnemploymentisalittlebithigherinAdriaticCroatia(16.3%)thaninContinentalCroatia(15.3%).Thisinformationis,onceagain,contradictorywithinformationabouttheunemploymentrateinthetwofunctionalregions–Osijek-BaranjaCountyandIstriaCounty.Intheyear2015,theunemploymentrateintheOsijek-Baranjafunctionalregionwas28.3%,thatis,13%higherthantheunemploymentrateinitsNUTS2region,ContinentalCroatia(15.3%).Inthesameyear,inIstriafunctionalregiontheunemploymentratewasonly6.1%,whichisremarkablyundertheaverageofCroatia(for9.5%),aswellasIstriaNUTS2region,AdriaticCroatia(for10.2%).Thegendergapinunemploymentofpeopleage20-64issignificantlylowerthaninemployment(just1.3%).Evenhere,thegendergapishigherinContinentalCroatia(1.7%)thaninAdriaticCroatia(0.4%).
CroatiaisoneofthethreeEU28membercountrieswiththehighestyouthunemployment(groupage15-24).Withahigh43%,Croatiais22.6percentagepointsawayfromtheEU28average.YouthunemploymentishighinbothContinental(42.2%)andAdriaticCroatia(44.7%).Again,femaleyouth,age15-24aremoreunemployedthantheirmalepeers(for2.9%).AccordingtothestatisticsoftheCroatianEmploymentService,from24,549unemployedpeopleinOsijek-BaranjaCounty,23.3%areyoungadults,age20-29,and3%areyouthage15-19.IntheIstriafunctionalregion,atthemomentthereare2,949unemployedpersons,outofwhich20%areyoungadults(age20-29),and2%belongtotheagegroup15-19.Theyouth(agegroup15-24)unemploymentratioinCroatiawas14%,whichisveryhighaccordingtotheEU27average(8.4%)in2015.Oftheoverallunemployedpopulation,theratioofyoungadults(age20-29)was17.9%in2015.
IncomparingallthosepercentageswiththeEU27orEU28average,itisobviousthatCroatiaisacountrywithhighunemploymentratesofallpopulation,butalsoofyoungadults.Thereis15.3%ofthoseunemployedyoungpeople(age15-29)thathavebeenunemployedforoneyearormore.ThatpercentageissameinCroatia,aswellasinbothNUTS2functionalregions.Thepercentageoflong-termunemployedofCroatia’sentireunemployedpopulationisashighas63.1%,thatisthehighestpercentageofallEU28membercountries.InContinentalCroatiathispercentageis63.7%,andinAdriaticCroatia61.9%.BylookingmoredeeplyintotheOsijek-Baranjafunctionalregion,14.9%unemployedpersonsareunemployedfrom6-12months,14%areunemployedfrom1-2years,andahighpercentageof17.3%ofpeopleareunemployedfor5andmoreyears.IntheIstriafunctionalregion,50%ofthoseunemployedareunemployedforonly6months,18%areunemployedfrom6-12months,from1-2yearsunemployedis10%ofallunemployed,and13%areunemployedformorethan5years.Thedistributionofthetermofunemploymentofunemployedyoungadults(age20-29)inthe
Page 107
H2020-YOUNG-SOCIETY-2015 YOUNG_ADULLLT Deliverable 4.1
23
Osijek-BaranjaandIstriaRegion(Figure9)indicatesthatyoungadultsintheOsijek-Baranjafunctionalregionaremoreatriskoflong-termunemployment.Inthatcounty,20%ofyoungonly6.2%.Thepercentageofunemployedpersonsfromtheagegroup20-29,thatareunemployedformorethan3yearsis8.7%inOsijek-BaranjaCounty,and4.8%inIstriaCounty.
Figure9:Distributionoftermofunemploymentofunemployedyoungadults(age20-29)inOsijek-BaranjaandIstriaRegion
Source:CroatianBureauofStatistics,2016
ThekeyissuesfacedbyyoungpeoplewhenenteringthelabourmarketinCroatiaarelackof
previousworkexperienceandmismatchbetweentheirqualificationsandtheskilldemand.Theseproblemsareinparticularevidentincasesofindividualswithlowereducationalattainment,youngmothersandRomapopulation.Long-termunemploymentandlargedifferencesinregionalyouthunemploymentratesarealsorecognized.About17%ofallregisteredyouthunemployedarewithoutpriorworkingexperience,about34%oflong-termunemployedyoungpeoplehavenohighschooleducation,and28%haveathree-yearcourseofvocationaleducation,andonly13%arehighlyeducated(NationalYouthProgramme2014-2017).
0
10
20
30
40
50
60
70
0-6months 6-12months 1-3years 3-5years morethen5years
Termofunemployment,age20-29
Osijek-BaranjaCounty IstriaCounty
Page 108
H2020-YOUNG-SOCIETY-2015 YOUNG_ADULLLT Deliverable 4.1
24
6. Redistributionandsocialinclusion
Socialprotectionincludesallinterventionsofpublicorprivatebodiesaimedatalleviatingthefinancialburdenofhouseholdsandindividualsfromadefinedseriesofrisksandneeds,providedthatthereisnosimultaneousreciprocalorindividualcounterperformance(aninterventionthatseekssomethingofidenticalvalueinreturnfromthebeneficiaryofsocialprotection).Croatiamaintainsacomprehensiveandcomplexsystemofsocialprotection.Thesystemservesmultipleobjectivesandincludessupporttowarveteransandtheirfamilies,populationpolicymeasures,socialassistancetolow-incomegroups,andalargenumberofothersocialassistanceprograms.Theadministrationofsocialbenefitsishighlyfragmented,withinsufficientcoordinationamongthedifferentlevelsofgovernmentprovidingtheseservices(Jafarov&Gunnarsson,2008).
AkeysocialpolicyissueinCroatiaishowtoreducethegovernment-spending-to-GDPratio,withoutunduesacrificesinquality,eventhoughCroatiaspendsmuchlessonsocialprotectionthantheEuropeanUnionaverage(Figure10).ComparingdataontheshareofsocialprotectionexpendituresinthenationalGDPwiththeshareofsuchexpendituresintheGDPofEUmembercountries,theRepublicofCroatiaranks18th,laggingby8.6percentagepointsbehindtheaverageoftheEU-28.Figure10:Socialprotectionbenefits(%oftheGDP)
24.8
27.5 27.4 27.2 27.6 27.8 27.6
18
20.2 20.3 20.2 20.7 21.5 21.2
0
5
10
15
20
25
30
2007 2008 2009 2010 2011 2012 2013 2014 2015
EU(28) Croa2a
Page 109
H2020-YOUNG-SOCIETY-2015 YOUNG_ADULLLT Deliverable 4.1
25
Source:EUROSTAT:Tablesbyfunctions,aggregatedbenefitsandgroupedschemes
AccordingtotheSocialwelfareAct3,TheGovernmentofCroatiaisthemainsourceofthesocialbenefitsofpersonsthatareatriskofpoverty,liveinseverematerialdeprivationorliveinhouseholdswithalowworkintensity.Thesocialinsuranceandsocialassistancecomponentofsocialwelfarepolicyitselfconsistsofthreecomponents.Therearecashtransfers,benefitsinkindandfoster-careorresidentialcareforvulnerablegroups(Bejaković&McAluey,1999).Inhabitantsinbothfunctionalregionshavetherighttothesamesocialbenefits,butdifferencesarisefromthenumberofpeoplewhoareinneedofsocialprotection(Figure11).
Figure11:At-risk-of-povertyratebyNUTS2andNUTS3(%)
Source:CroatianBureauofStatistics,Census2011
ThedatapresentedinFigure11showthatOsijek-BaranjaCountyischaracterisedwitha
significantlyhigherrateofpeopleatriskofsocialexclusionthanitisthecasewithIstriaCounty.
3OfficialGazette,157/13;152/14;99/15;52/16
20
17.4
28
11.9
0 5 10 15 20 25 30
Con2nentalCroa2a
Adria2cCroa2a
Osijek-BaranjaCounty
IstriaCounty
Page 110
H2020-YOUNG-SOCIETY-2015 YOUNG_ADULLLT Deliverable 4.1
26
Althoughthepercentageofpersonswhoshouldreceivesocialassistanceis28%,only5%ofthepopulationexercisethisright.InIstriaCounty,0.7%ofthepopulationreceivefinancialhelp,andeverytwelfthpersonisatriskofpoverty(Annualstatisticalreportonappliedrightsofsocialwelfare,legalprotectionofchildren,youth,marriage,familiesandpersonsdeprivedoflegalcapacity,andprotectionof
physicallyandmentallyhandicappedpersonsintheRepublicofCroatia).Thus,inbothfunctionalregionsthereisanimbalancebetweentheneedtoimprovelivingconditionsforpartofthepopulationandthepossibilitiesforthewelfaresystemtocontributetoitadequately.
Unfortunately,thedataonsocialprovisionsinCroatiaarenotkeptaccordingtobeneficiary’sage.However,dataaboutyoungpeopleatriskofpovertyorexclusionrateintheEuropeanUnionandinCroatiashowthatlivingconditionsforyoungpeopleinCroatiahaveatendencytobesimilartotheEuropeanaverage(Figure12).HavinginmindthatthisaverageistheresultofmanydifferentEuropeancountries(thelowestrateofsocialexclusionisaround10%),itispossibletoconcludethatCroatiabelongstothecountrieswithahigherlevelofyouthatriskofsocialexclusion.
Figure12:Youngpeopleatrisk-of-povertyorexclusionrateandseverematerialdeprivationrate(age16-29,%)
Source:EUROSTAT
25.8 26.628.1 28.1
29.631.6
29.427.4
9.5 9.711.1 10.8
14.9 15.8 15.112.5
0
5
10
15
20
25
30
35
2010 2011 2012 2013
EU(28)-Risk-of-povertyrate
Croa2a-Risk-of-povertyrate
EU(28)-Severematerialdepriva2onrate
Croa2a-Severematerialdepriva2onrate
Page 111
H2020-YOUNG-SOCIETY-2015 YOUNG_ADULLLT Deliverable 4.1
27
Itiswellknownthatyoungpeoplearegenerallyinanunfavourablesocioeconomicpositionin
comparisontootheragegroups.Thatmeansthatyouthdonotownproperty(realestate,savingsandstocks),theyhavedifficultiesinfindingemploymentandobtaininghousing,andaredependentontheirparents’support.Transitionalprocessesincreasethedegreeofuncertaintyforyoungpersonswho,havingcompletedtheireducation,havenoclearperspectivesontheopportunitiesforemployment,professionaldevelopmentandleadingindependentandproductivelives.TheGiniindexmeasurestheextenttowhichthedistributionofincome(or,insomecases,consumptionexpenditure)amongindividualsorhouseholdswithinaneconomydeviatesfromaperfectlyequaldistribution.ThusaGiniindexof0representsperfectequality,whileanindexof100impliesperfectinequality.TheGiniindexinCroatiahasnotsignificantlychangedinthelastsixyearsandisequaltotheGiniindexoftheEU28average(Figure13).Nevertheless,itcanbeobservedthattheGiniindexinCroatiahasatendencyofmilddecline,whereastheaverageGiniindexinthe28EUstatesshowsamildincrease.
Figure13:Giniindexofequaliseddisposableincome
Source:EUSILCsurvey,EUROSTAT
30.5
30.8
30.5 30.5
30.931
31.6
31.2
30.9 30.9
30.2
30.4
30
30.2
30.4
30.6
30.8
31
31.2
31.4
31.6
31.8
2009 2010 2011 2012 2013 2014 2015 2016
EU(28) Croa2a
Page 112
H2020-YOUNG-SOCIETY-2015 YOUNG_ADULLLT Deliverable 4.1
28
DespitethefactthatdataaboutexposuretopovertyandmaterialdeprivationofyouthinCroatiaarecomparabletotheaveragedatafortheEuropeanUnion,thematerialdeprivationrateforthetotalpopulationisnotinfavourofCroatia.DatashowthatthisratioinrelationtotheEU(28)ismultipletimeshigher,whichpointstoasignificantlyunfavourablelivingconditionsforyoungpeopleinCroatia(Figure14).
Figure14:MaterialDeprivationRate
Source:EUSILCsurvey,EUROSTAT
Finally,thequantitativeanalysisinthefieldofredistributionandsocialinclusionofyoung
adultsinCroatiashowsthatsomeeffortshouldbeinvestedinimprovingthequality,rangeandfrequencyofsocialstatistics.Suchinformationisrequiredforsocialplanning,fortheformulationofappropriatepoliciesconcerningyoungpeople.Thiscanbededucedfromtheunavailabilityofdataaboutsocialpolicies,whichareinCroatia,andsointhetwofunctionalregions,directedtoyoungpeople,andfromthedifficultiesincomparingdataformdifferentsources.
Nevertheless,itisevidentthatyouthinCroatiadonotgetsufficientsocialsupportintheprocessoftransitionfromchildhoodtoadulthood,whichcanbeseenfromthenumberofpersons
17.8 18.519.7 19.5 18.5
17
32.234.7 35.6
33.6 33.8 32.8
0
5
10
15
20
25
30
35
40
2009 2010 2011 2012 2013 2014 2015 2016
EU(28) Croa2a
Page 113
H2020-YOUNG-SOCIETY-2015 YOUNG_ADULLLT Deliverable 4.1
29
receivingsocialsupportinthetwofunctionalregions.Ithasbeenestablishedthattherateofmaterialdeprivationforthetotalpopulationishigherinrelationtothegroupofyouthaged16-29,afactwhichisparticularlydisturbing.
7. Healthandwell-beingconditions
TheConstitutionoftheRepublicofCroatiaguaranteeseveryonetherighttohealthcareinaccordancewithlaw,andthatrightisexercisedthroughthehealthcaresystem,whichfallswithintheresponsibilityoftheMinistryofHealth.ThehealthcaresystemincludeshealthcareserviceofinteresttotheRepublicofCroatia,whichisbeingperformedasapublicservicebasedonprofessionalmedicaldoctrineandwiththeuseofmedicaltechnologyintheprovisionofhealthcare(NationalHealthCareStrategy,2012).ThehealthcareofthepopulationoftheRepublicofCroatiaisimplementedaccordingtotheprinciplesofuniversality,continuity,availability,acomprehensiveapproachintheprimaryhealthcare,andspecialisedapproachinspecialist-consiliaryandhospitalhealthcare.ThebasiclegalframeworkofthehealthcaresysteminCroatiaconsistsofthreekeyacts:TheHealthCareAct,theMandatoryHealthInsuranceActandthePatient’sRightsProtectionAct.Eventhoughthehealthcareisinprinciplefreeofcharge,thepatientsmustpayfromtheirownpocketstotheprivatelyownedhealthcareserviceproviders.ItincludespatientswhodonothaveacontractualrelationshipwiththeCroatianInstituteforHealthInsuranceandpatientswhodonothaveadditionalhealthinsurance.However,themainsourceofthehealthprotectionofallthepopulationisthenationalbudget.
CroatiaisamongthecountriesinEuropewiththehighestmortalityratesofcerebrovasculardiseases,trachea,bronchusandlungcancerinmen,anddiabetes.Thetrendofincreasingmortalityofwomenbysometypesofneoplasmsisespeciallydisturbing,aswellasthemortalityratecausedbydiabetes,whichisamongthehighestinEurope(NationalHealthCareStrategy,2012).
InCroatia,onaveragethereare1.4hospitalsper100,000inhabitants.Manysignificantdifferencesareobservedinthequalityofhealthserviceandprotectionwithrespecttocounties.Therearesignificantdifferencesinthecoveragebyprimaryhealthofficers,doctors,andthenumberofteamsofgeneralpractitionersandinthenumberofhospitalbedsper1,000inhabitants.(RegionalDevelopmentStrategyoftheRepublicofCroatia–2020,2016),butinthetwofunctionalCroatianregionstheyarenotparticularlyapparent.Although,overtime,thereisanobservedincreaseinthenumberofmedicalstaffinCroatia,theirrepresentationincomparisontoEUcountriesiscontinuouslylower(Figure15).Moreover,significantnumbersofCroatianhealthprofessionalsconsidermovingto
Page 114
H2020-YOUNG-SOCIETY-2015 YOUNG_ADULLLT Deliverable 4.1
30
otherEUcountries,becauseofthesignificantlylowerearningsandcareeropportunitiesforhealthcareworkersinCroatia.
Figure15:Medicaldoctors:Healthpersonnel(perhundredthousandinhabitants)
Source:EUROSTAT
Itiswellknownthatinthepathologyofyoungpersons,anincreasinglysignificantplaceis
beingoccupiedbydisordersanddiseasesconnectedwithcertainkindsofbehaviour,habitsandlifestyles.Croatianresearchersofyouth(Ilišinetal.,2013;Bouillet,2017)indicateaworryingleveloftolerancetowardsalcoholuseinCroatiansociety,andofshortcomingsinpreparednessofyoungpeopleforresponsiblesexualbehaviour.
Oneoftheindicatorsofthenation’sstateofhealthistheportionofpersonswithadisabilityintheentirepopulation.AccordingtotheCroatianRegistryofPersonswithDisability(2017),thereare511,850personswithdisabilityinCroatia,whichisabout12%ofthetotalpopulation.Themostcommonconditionscausingdisabilityareimpairmentsofthelocomotorsystem,mentaldisorders,impairmentsofotherorgansandbodysystemsandimpairmentsofthecentralnervoussystem.Inthe
346.44350.49
354.58 355.52
299.18303.35
314.02319.15
270
280
290
300
310
320
330
340
350
360
2012 2013 2014 2015
EU(28) Croa2a
Page 115
H2020-YOUNG-SOCIETY-2015 YOUNG_ADULLLT Deliverable 4.1
31
majorityoftheanalysedagegroups,morepersonswithaphysicaldisabilityarerecordedinOsijek-BaranjaCountyincomparisontoIstriaCounty,andwiththeincreaseinagethereisanincreaseinthenumberofpersonswithphysicaldisability(Figure16).Figure16:Prevalenceoftheratioofpersonswithadisabilityinthetotalpopulationoffunctionalregions
Source:CroatianInstituteofPublicHealth,2017
Thedeterminationofhealthasastateofcompletephysical,mentalandsocialwell-beingis
relatedtotheresearchofsubjectiveevaluationsofhealth.Suchresearchconfirmsthattheevaluationsofsubjectivewell-beingare,forthemajoritypart,linkedwiththepersonalevaluationofhealth(Miljković,2013),wherewell-beingcontributestothesubjectiveexperienceofminorrepresentationofphysicalsymptomsandbetterevaluationofhealth,whilepositivefeelingslessentheriskofillness(Marčinko,2013).Atthesametime,researchsuggeststhateverypersontriestofindawaytoevaluatetheirhealthconditioninapositivelightandthatsubjectiveevaluationofhealthcanbeinterpretedasapredictorofthephysician’sevaluation,althoughthetwoevaluationscanbeindiscrepancy(Tucak&Nekić,2006).
6.4
3.54.8
14.9
10.5
3.5
9.6
23.3
11.9
4.4
9.3
30.3
0
5
10
15
20
25
30
35
Total 0-19 20-64 65+
IstriaCounty Osijek-BaranjaCounty Croa2a
Page 116
H2020-YOUNG-SOCIETY-2015 YOUNG_ADULLLT Deliverable 4.1
32
TheaverageratingofsatisfactionbydifferentlifedomainsinCroatiaisnotsignificantlydifferentincomparisonwiththeEuropeanUnionaverageinthefieldofjobsatisfaction,commutingtime,timeuse,personalrelationshipsandmeaningoflife.Thedifferencesarehigherinthefieldofsatisfactionwithfinancialsituation,overalllife,recreationalandgreenareasandlivingenvironment(Figure17).Inthesefields,CroatianpeoplearelesssatisfiedthantheaverageEuropeancitizen.ItispossibletoconcludethatcitizensinCroatiaarerelativelycontentwiththeprivateaspectsoflifewhiletheirdissatisfactionisexpressedinrelationtothesocialconditionsinwhichtheyareliving.Figure17:Averageratingofsatisfactionbydifferentlifedomain(rating:0-10,age:16yearsandover,2013)
Source:EUROSTAT,EU-SILCmicrodata
Overall,thebestaspectofhealthcareinCroatiaisthebroadnesswhichencompassesthe
populationwithfreehealthcareincludingpersonsintheregularsystemofeducationandpersonswithlowincome.However,theavailabilityofhealthservicesisnotuniforminallregionsofCroatiaanditissignificantlyweakerinrelationtootherEUcountries.SmalleravailabilityofhealthcareisaccompaniedwiththerelativelypoorhealthimageofCroatiancitizens.
6
7.57.1 7.4
6.77.1 7.1 7.3
7.87.4
4.6
6.9 7 7.26.6 6.3
5.86.3
7.3 7
0
1
2
3
4
5
6
7
8
9
EU(28) Croa2a
Page 117
H2020-YOUNG-SOCIETY-2015 YOUNG_ADULLLT Deliverable 4.1
33
References
Bejaković,P.&McAuley,A.(1999).WelfarepolicyandsocialtransfersinCroatia.OccasionalPaperSeries
No.8.,http://www.ijf.hr/OPS/8.pdf
Bošnjak,S.&Tolušić,E.(2012).NUTSIIregijekaodiokohezijskepolitkeEuropskeunije.Praktični
menadžment,5,79–84.
Bouillet(2017).Zdravljeirizičnaponašanjasuvremenegeneracijemladih.In:Ilišin,V.&Spajić-Vrkaš,V.
(Eds.):Potrebe,problemiipotencijalimladihuHrvatskoj(Needs,ProblemsandPotentialsofYouthin
Croatia).Zagreb:InstitutzadruštvenaistraživanjauZagrebu(inpress)
CroatianBureauforStatistics(2013).AstatisticalportraitofCroatiaintheEuropeanUnion.
http://www.dzs.hr/Hrv/important/PressCorner/StatPortraitOfCroatiaInTheEU2013.pdf.CroatianBureauofStatistics,Schoolsin2015/2016schoolyearandpopulationaged20-29accordingto
highestlevelofcompletededucation,2016.
CroatianBureauofStatistics:Population,HouseholdandApartment,Census,2011.
CroatianBureauofStatistics:StatisticalYearbookoftheRepublicofCroatia,2016.
CroatianInstituteofPublicHealth(2017).CroatianRegistryofPearsonswithDisabilityinyear2016.
https://www.hzjz.hr/wp-content/uploads/2016/04/Invalidi_2017.pdfCroatianInstituteofPublicHealth(2017).Izvješćeoosobamaliječenimzbogzlouporabepsihoaktivnih
drogauHrvatskoju2015.godini,https://www.hzjz.hr/wp-content/uploads/2013/11/DROGE_2015_Izvjesce_KONACNO_M.pdf
Domović,V.&VizekVidović,V.(2015).Croatia:AnOverviewofEducationalreforms,1950–2014.In:
Corner,T.(Ed.).:EducationintheEuropeanUnion:Post–2003memberstates.London:Bloomsbury
Publishing.27-49.
EuropeanCommission:EducationandTrainingMonitor2015–Croatia.
http://ec.europa.eu/dgs/education_culture/repository/education/tools/docs/2015/monitor2015-
croatia_en.pdfEuropeanCommission:EducationandTrainingMonitor2016–Croatia.
https://ec.europa.eu/education/sites/education/files/monitor2016-hr_en.pdfEurostat:http://ec.europa.eu/eurostat/data/databaseIlišin,V.,Bouillet,D.,Gvozdanović,A.&Potočnik,D.(2013).YouthinaTimeofCrisis:FirstIDIZ–Friedrich-
EbertStifungYouthSurvey.Zagreb:InstitutzadruštvenaistraživanjauZagrebu&FriedrichEbert
Stiftung.
Page 118
H2020-YOUNG-SOCIETY-2015 YOUNG_ADULLLT Deliverable 4.1
34
Ilišin,V.,SpajićVrkaš,V.(2015).Potrebe,problemiipotencijalimladihuHrvatskoj.Zagreb:Ministarstvo
socijalnepolitikeimladih.
Jafarov,E.&Gunnarsson,V.(2008).EfficiencyofGovernmentSocialSpendinginCroatia.FinancialTheory
andPractice32,3,289-320.
Marčinko,I.(2013).Odnossubjektivnedobrobitiitjelesnogzdravlja.Kliničkapsihologija,6,1-2,95-109.
Miljković,D.(2013).Zdravljeisubjektivnadobrobit.RadoviZavodazaznanstvenoistraživačkiiumjetnički
raduBjelovaru,7,223-237.
Ministarstvosocijalnepolitikeimladih,NationalYouthProgramme2014-2017,
http://www.mspm.hr/dokumenti/10?page=1&tag=-1&tip2=1&Datumod=&Datumdo=&pojam=MinistryofHealthoftheRepublicofCroatia(2012).NationalHealthCareStrategy2012–2020.
Nejašmić,I.&Toskić,A.(2013).StarenjestanovništvauHrvatskoj–sadašnjestanjeiperspective.Hrvatski
gografskiglasnik.75,1,89-110.
OECD(2013),EducationataGlance2013:OECDIndicators,OECDPublishing.
http://dx.doi.org/10.1787/eag-2013-enRegionalDevelopmentStrategyoftheRepublicofCroatiafortheperioduntil2020,IstriaCounty,2016.
SocialWelfareAct,OfficialGazette,157/13;152/14;99/15;52/16
Tucak,I.&Nekić,M.(2006).Nekeodrednicezadovoljstvazdravljemodraslihosoba.MedicaJadertina,36,
3-4,73-82.
Page 119
H2020-YOUNG-SOCIETY-2015 YOUNG_ADULLLT Deliverable 4.1
1
Work Package 4
Quantitative Analysis Young Adults’ Data
Finland – National Briefing Paper with national and regional
data sets
Heikki Silvennoinen Anna L. Eskola Tero Järvinen Risto Rinne
Jenni Tikkanen
Centre for Research on Lifelong Learning and Education CELE University of Turku
12.09.2017 Work Package 4 – Quantitative Analysis of Young Adults’ Data Deliverable 4.1
Page 120
H2020-YOUNG-SOCIETY-2015 YOUNG_ADULLLT Deliverable 4.1
2
TableofContentsExecutiveSummary.........................................................................................................................................................4Introduction........................................................................................................................................................................5Qualitydataassessment...............................................................................................................................................61. Findings........................................................................................................................................................................71.1 Demographicstructure.................................................................................................................................71.2 Generalstateoftheeconomy..................................................................................................................121.3 Educationandtrainingsystem...............................................................................................................141.4 Labourmarket................................................................................................................................................211.5 Redistributionandsocialinclusion......................................................................................................251.6 Healthandwell-being.................................................................................................................................27
2. Concludingremarks...........................................................................................................................................293. References...............................................................................................................................................................31
TableofFiguresFigure1.DescriptionofNUTSlevelsandtheirrelationstoeachotherinFinland................................6
Figure2.Theshareof20-24yearoldand25-29yearoldpopulationinFinland,Southwest
FinlandandNorth&EastFinland(%)..............................................................................................................8
Figure3.Populationincreasebymonth2014-2017...........................................................................................8
Figure4.Cruderateofnetmigrationplusstatisticaladjustmentyears2005-2015,Finland...........9
Figure5.LEFT:Olddependencyratio1stvariant(population65andovertopopulation15-64
years)(%)RIGHT:Young-agedependencyratio1stvariant(populationaged0-14to
population15-64years)(%)..............................................................................................................................10
Figure6.Numberofchildrenandyouthwithforeignoriginbyagegroup(0-4years,5-14years,
15-24years)(leftaxis),andpercentageofchildrenandyouth(0-24years)withforeign
originofthewholeagegroup(rightaxis)inFinlandin1990-2014.................................................11
Figure7.Theshareofpersonsagedunder15inthepopulationinFinland,in1940to2065(%)
.........................................................................................................................................................................................12
Figure8.GDPatcurrentmarketprices,Europerinhabitant.......................................................................13
Figure9.GDPatcurrentmarketprices,Europerinhabitantinpercentage(%)ofEU28(=100),
2006-2015..................................................................................................................................................................14
Figure10.TheshareofISCED5-8leveleducationofpopulationaged15yearsormorebygender
inFinland,FRSouthwestFinland,andFRKainuu,2007-2015(%)..................................................15
Figure11.Youngadults’(30-34yearolds)educationalattainmentbyISCEDlevelsinFinland,FR
SouthwestFinland,andFRKainuu,2005-2015.........................................................................................15
Page 121
H2020-YOUNG-SOCIETY-2015 YOUNG_ADULLLT Deliverable 4.1
3
Figure12.Theshareoflowperformers(belowtestlevel2)andhighperformers(testlevels5
and6)inmathematicsofthe15yearolds:OECDaverageandFinland,inyears2003,2012
and2015(%)............................................................................................................................................................17
Figure13.PupilshavingleftcomprehensiveschoolwithoutaleavingcertificateinFinland,
2000-2016(%).........................................................................................................................................................18
Figure14.Discontinuationofeducationinuppersecondarygeneral,vocational,universityof
appliedsciences,anduniversityeducationinacademicyearsinFinland,from2005/2006to
2014/2015(%)........................................................................................................................................................19
Figure15.YoungpeopleneitherinemploymentnorineducationandtraininginEU27,Finland,
SouthFinland,andNorth&EastFinland,2012-2016(%)...................................................................20
Figure16.Youngpeoplenotineducationoremployment(NEET)byagegroupandgenderin
Finland,2008-2015................................................................................................................................................21
Figure17.Sharesofemployedstudentsagedatleast18ofallstudentsinFinland,2008–2015
(%).................................................................................................................................................................................22
Figure18.ThedevelopmentofnumberofpeopleinlabourforceinFinland,FRSouthwest
Finland,andFRKainuu,1991-2016(year1991=100)...........................................................................23
Figure19.EmploymentratesinFinland,FRSouthwestFinland,andFRKainuu,2005-2016(%)
.........................................................................................................................................................................................24
Figure20.UnemploymentrateinFinland,inFRSouthwestFinland,andFRKainuu1991-2016
(%).................................................................................................................................................................................25
Figure21.Thenumberoflong-termunemployed20-29yearoldsinFinland,2006-2016............26
Figure22.GINIIndexbeforeandaftertransfers,disposableincomeinthehouseholdsinPPS
(rightaxis),inEU27,Finland,SouthFinland,andNorth&EastFinland,in2005-2015..........27
Figure23.Peopleatriskofpovertyandsocialexclusion,inEU27,Finland,SouthFinland,and
North&EastFinland(plusSpainandtheU.K.),in2005-2015(%)..................................................28
Figure24.Rateofyouth(20-29years)livingwiththeirparentsbygender,EU27andFinland(%)
.........................................................................................................................................................................................29
Figure25.Highsatisfactioninvariouslifedomainsofpopulationaged25-34bygender,EU28
andFinland.................................................................................................................................................................30
Page 122
H2020-YOUNG-SOCIETY-2015 YOUNG_ADULLLT Deliverable 4.1
4
ExecutiveSummary
TheFinnisheducationsystem,especiallythecomprehensiveschool,ischaracteristically
intertwinedwiththeScandinaviannotionofwelfarestate,whichentailsstrongemphasison
equaleducationalopportunities.AsoneofthekeyelementsoftheScandinavianwelfaremodel,
thecomprehensiveschoolsystemisidentifiedbyuniversal,non-selective,andfreebasic
educationprovidedbythepublicsector.PISAresultsfromtheearly2000’sonhaveshownthat
notonlyistheaveragelevelinreading,mathematics,andscienceshighinFinland,butalsothe
shareoflowachieversiscomparativelysmall.TheotherimportantsignisthattheFinnish
schoolsystemhasbeensuccessfulincompensatingforthepoorsocioeconomicbackgroundof
pupils.Also,thebetweenschoolvariationinlearningoutcomesisoneofthesmallestinthe
OECDworld.Theschoolsystemhasprovedtobehomogeneousinquality.Youngpeoplehave
relativelygoodeducationalopportunitiesattheuppersecondaryandtertiarylevel.However,
thereareabout10percentineachagecohortyoungpeoplewhodonotcontinueineducationor
trainingafterbasiceducation.Theirsituationisgettingworsewhilethecompetitioninthe
labourmarketgetstighter.Theotherphenomenonisthedecreasinglevelofaveragelearning
outcomestestedinPISA,TIMSS,andPIRLS.Theshareoflowperformershasbeengrowing.
Finnisheconomyhassufferedtwoseverecrisessincethe1980’s,firstintheearly1990’s
andthenasaneffectoftheglobalfinancialcrisisfrom2008onwards,whichhavehaddrastic
effectsonyouthemployment.Afterthefinancialcrisis,unemploymentforyoungpeoplehas
increased,moreheavilyformalesthanforfemales.Long-termunemploymentof20-29yearold
maleswasseventimeshigherandfemaleseighttimeshigherin2016thanin2008.Uncertain
employmentprospectshavealsodiscouragingeffectsoneducationalmotivationespeciallyof
youngpeopleinthelowendoftheachievementcurve.Incertainregionsofthecountrygettinga
jobwithoutworkexperienceandvocationaltrainingispracticallynon-existent.Thenumberof
NEETyounghasbeenslightlyincreasingduringthepastdecadeorso.Actually,youngadults
livinginthetwofunctionalregions,FRSouthwestFinlandandFRKainuu,liveinquitedifferent
realitieswhatcomestotheirfutureprospects.Peopleborninnorthernandeasternpartsofthe
countrytendtomovetosoutherncitiesaftercompletingcompulsoryoruppersecondary
education.TheoverallemploymentinFRKainuuhasdecreasedquitedramaticallywithinthe
pastdecades:thenumberofemployedinFRKainuuisonlyabout70percentofthelevelitwas
inthebeginningofthe1990’s.However,Finnishyoungpeopleareclearlymoresatisfiedwith
severalareasoftheirlifethantheirpeersinEuropeonaverage.Especiallylargedifferences
betweenFinnishyouthandEuropeanaverageareinaccommodation,jobsatisfaction,and
overalllifesatisfaction.
BeingatriskofpovertyandsocialexclusionislowerinFinlandthanitisinEU27
countriesonaverage.About17%ofthepopulationhasbeenatriskofpovertyorexclusion
Page 123
H2020-YOUNG-SOCIETY-2015 YOUNG_ADULLLT Deliverable 4.1
5
between2005and2015.Thegapbetweendifferentpartsofthecountryhasbeengrowing
duringthepastdecade.Theriskofpovertyandsocialexclusionhasgrownbiggerespeciallyin
northernandeasternregionsofFinland.
ThenumberofchildrenborninFinlandwillbelowerthaneversincethelastfamine
years1866-68,althoughthesizeofthepopulationhasmorethandoubled.Accordingtothe
projection,theshareofpersonsagedunder15inthepopulationwoulddecreaseto14percent
by2060.Theshareofpeoplewithforeignbackgroundhasbeenverylowcomparedtoother
Europeancountries.Hostilitytowardspeoplewithforeignbackgroundhasincreasedduring
recentyearsamongnativepopulation.Thesedevelopmentswillhavesevereconsequencesfor
thedependenceratiointhefuture.
Introduction
TheFinnisheducationsystem,especiallythecomprehensiveschool,ischaracteristically
intertwinedwiththeScandinaviannotionofwelfarestate,whichentailsstrongemphasison
equaleducationalopportunities.AsoneofthekeyelementsoftheScandinavianwelfaremodel,
thecomprehensiveschoolsystemisidentifiedbyuniversal,non-selective,andfreebasic
educationprovidedbythepublicsectorandofadequatelygoodqualityinordertopreventthe
demandsforprivateschools.Togetherwiththehealthandsocialsecuritysystems,the
comprehensiveeducationformsavirtuouscirclethathascumulativepositiveeffects.Universal
educationsystemprovidesequaleducationalopportunitiesthatleadtogreatersolidarityand
universalsocialcapital,socialtrustwhichconfirmsthelegitimacyofuniversalmodels.
(Kalalahti,Silvennoinen,Varjo&Rinne2015).Thesystemhasprovedtobeproductiveinseveral
respects:Finnishyoungpeoplehaveoutstandingresultsininternationalassessmenton
learning,andqualitydifferencesbetweenschoolsarethesmallestinEurope(OECD2013;OECD
2016a).
However,thelivingconditionsandopportunitystructuresforyoungpeoplearequite
differentindifferentpartsofFinland.ThecapitalcityHelsinkiwithitsmetropolitanareoffer
muchbetteropportunitiesforeducationandemploymentthanmoreremoteareasineastern
andnorthernpartsofthecountry.OurfunctionalregionsSouthwestFinlandandKainuuare
locatedintheoppositepartsofFinlandandtheyaredefinedbyquitedifferentprospectsfor
youngpeople.Thegeneraltrendsincethe1960s’hasbeentheconcentrationofpopulationin
thesouthernpartsofthecountry(includingFRSouthwestFinland),whereasthenorthernand
easternparts(includingFRKainuu)arebecomingmoreandmoresparselypopulated.
Page 124
H2020-YOUNG-SOCIETY-2015 YOUNG_ADULLLT Deliverable 4.1
6
Qualitydataassessment
Inthisreport,thebasicstatisticsarepresentedatNUTS2-level(‘largerareas’SouthFinlandand
North&EastFinland).However,crucialinformationatNUTS3levelisaddedsothatthe
functionalregionsSouthwestFinland(partofNUTS2area‘SouthFinland’)andKainuu(partof
NUTS2area‘North&EastFinland’)willbedescribedmoreproperly.Therearesubstantial
differencesbetweenNUTS3levelregionsincludedinthesameNUTS2levelareas.Thisconcerns
alsoourtwofunctionalregions(FR),SouthwestFinlandandKainuu.
Figure1.DescriptionofNUTSlevelsandtheirrelationstoeachotherinFinland
NUTS1 Code NUTS2 Code NUTS3 Code
MainlandFinland FI1 WestFinland FI19 CentralFinland FI193
SouthernOstrobothnia FI194
Ostrobothnia FI195
Satakunta FI196
Pirkanmaa FI197
Helsinki-Uusimaa
FI1B Helsinki-Uusimaa FI1B1
SouthFinland FI1C SouthwestFinland FI1C1
Kanta-Häme FI1C2
Päijät-Häme FI1C3
Kymenlaakso FI1C4
SouthKarelia FI1C5
North & EastFinland
FI1D Etelä-Savo FI1D1
Pohjois-Savo FI1D2
NorthKarelia FI1D3
Kainuu FI1D4
CentralOstrobothnia FI1D5
NorthernOstrobothnia FI1D6
Lapland FI1D7
Åland
FI2 Åland FI20 Åland FI200
AscanbeseeninFigure1,geographicallytheareaof‘North&EastFinland’,ofwhichtheFR
Kainuuisarathersmallregion,coversmorethanhalfofFinland.StatisticsonNUTS2area‘North
Southwest Finland
Kainuu
Page 125
H2020-YOUNG-SOCIETY-2015 YOUNG_ADULLLT Deliverable 4.1
7
&EastFinland’donotrepresentproperlythesituationinFRKainuu.ThesameistruewithFR
SouthwestFinlandandNUTS2areaSouthFinland,withinwhichthereareinmanyrespects
quitedifferentregionsfromEasternFinland(e.g.,NUTS3regionsKymenlaaksoandSouth
Karelia).SuitabilityofNUTS2levelstatisticsindicatingtherealitiesatNUTS3level-atthelevel
ofourfunctionalregions,thatis–isdisputable.ThatiswhywetrytopresentstatisticsatNUTS3
level,fromFRSouthwestFinlandandFRKainuu,wheneveritispossible.Roughly,the
differencesbetweenFRSouthwestFinlandandFRKainuuareingeneralwiderthanNUTS2
areasSouthFinlandandNorth&EastFinland.
StatisticsFinlandcontinuouslycollectsahugeamountandvarietyofdataonpopulation,
economy,education,labourmarket,housing,etc.butstatisticsonlyonquitegenerallevelare
availablefreeofcharge.MostoftherelevantdataonNUTS3levelareaccessibleonlyforextra
costs.
Themostseriousweaknessconcerningthisbriefingpaperistheunsystematicnatureof
availabledataonlivingconditionsofagegroupsinNUTS3regions–i.e.thetwofunctional
regionsofourstudy.Somerelevantdataaregatheredbyadministrativebodiesinthetwo
functionalregions(mostlypopulation,economyandemployment),buttheylackasystematic
approachondatacollecting.
1. Findings
1.1 Demographicstructure
AccordingtoStatisticsFinland'smostrecentdata,Finland'spopulationwas5,506,312attheend
ofMay2017.Theshareof20-29yearoldsisabout12.5percentofthewholepopulation.The
percentageofyoungpeopleaged20-24inSouthFinlandislowerthanthecountryaverage,and
thepercentageofyoungaged25-29islowerthanthecountryaverageinbothexaminedareas,
SouthFinlandandNorth&EastFinland(Figure2).Inmanyregionsinnorthernandeastern
Finland,anumberofpeopleaged25-29havealreadymovedawayfromtheirchildhoodhometo
otherpartsofthecountry.
ThesedaysthebirthrateisverylowinFinland.Populationincreasedby3,015persons
duringJanuary-May2017.Thereasonfortheincreasewasmigrationgainfromabroad,since
immigrationexceededemigrationby5,684.Thenumberofbirthswas2,669lowerthanthatof
deaths(Figure3).
Page 126
H2020-YOUNG-SOCIETY-2015 YOUNG_ADULLLT Deliverable 4.1
8
Figure2.Theshareof20-24yearoldand25-29yearoldpopulationinFinland,SouthwestFinlandandNorth&EastFinland(%)
Figure3.Populationincreasebymonth2014-2017
Source: Population Statistics, Statistics Finland DuringJanuary-May2017,20,510childrenwereborn,whichis1,613fewerthaninthe
correspondingperiodin2016.Thenumberofdeathswas23,179,whichis130lowerthanayear
earlier.AccordingtothepreliminarystatisticsforMay2017,10,908personsimmigratedto
Finlandfromabroadand5,224personsemigratedfromFinland.Thenumberofimmigrantswas
612lowerandthenumberofemigrants1,393lowerthaninthecorrespondingperiodofthe
previousyear.Intotal,2,604oftheimmigrantsand3,471oftheemigrantswereFinnishcitizens.
(PopulationStatistics,StatisticsFinland.)
Therateofnetmigrationhasbeenaboutthreepercentyearlyinthepastdecadein
Finland(Figure4).North&EastFinlandhasbeenlosingpopulationalmosteveryyearfrom
2005to2015.FrommanyregionsinNorth&EastFinlandpeopleareconstantlymovingoutto
5.2
5.4
5.6
5.8
6.0
6.2
6.4
6.6
FinlandSouthFinlandNorth&EastFinland
5.2
5.4
5.6
5.8
6.0
6.2
6.4
6.6
2005
2006
2007
2008
2009
2010
2011
2012
2013
2014
2015
2016
FinlandSouthFinlandNorth&EastFinland
ExcessofBirths
PopulationIncrease
NetMigration
Page 127
H2020-YOUNG-SOCIETY-2015 YOUNG_ADULLLT Deliverable 4.1
9
thesouthernpartsofFinland,anddespitesomeimmigration,northernandeasternFinlandis
losingpopulation,especiallyyoungadultsandtheworkingagepopulation.
Figure4.Cruderateofnetmigrationplusstatisticaladjustmentyears2005-2015,Finland
Theworseningofthedependencyratioisduetotheageingofthepopulation.Theshare
ofchildren(aged0-14years)hasbeenquitesteadyandrelativetothesizeoftheworkingage
population.However,thesizeoftheelderlypopulationisgrowingfastandoldagedependency
ratiohasrisenfrom24%to32%betweenyears2005and2016.(Figure5.)InSouthFinlandas
wellasinNorth&EastFinlandtheoldagedependencyratioishigherthatthecountryaverage.
InSouthFinlandareatheratiowasnearly38%in2016,havingthusgrownmorethan10
percentagepointsintenyears’time.
AscanbeseeninFigure5,youngagedependencyratioishigherinNorth&EastFinland
thanonaverageinFinland.AtNUTS2level,theyoungagedependencyratioshavebeenquite
steadyduringtheyears2005-2016.
ThemeanageofwomenatbirthofthefirstchildisinFinlandaboutthesameasin
EuropeanUnion(28countries),28.8yearsin2015.InFinland,themeanagehasrisenalmostby
oneyearintheperiodoftenyears.InfantmortalityrateinFinlandisthelowestamongtheYA
countries:1.7in2015.Fertilityratewas1.64in2015whichisabithigherthanEU28average
(1.58in2014).FertilityrateishigherinNorth&EastFinland(1.92in2014)thaninSouth
Finland(1.66in2014)orinFinlandonaverage.LikeinEuropegenerally,inthelongrunfertility
rateshavegonedownwards.
-3.00
-2.00
-1.00
-
1.00
2.00
3.00
4.00
1 2 3 4 5 6 7 8 9 10 11
Finland SouthFinland North&EastFinland
Page 128
H2020-YOUNG-SOCIETY-2015 YOUNG_ADULLLT Deliverable 4.1
10
Figure5.LEFT:Olddependencyratio1stvariant(population65andovertopopulation15-64years)(%)RIGHT:Young-agedependencyratio1stvariant(populationaged0-14topopulation15-64years)(%)
Actually,inyear2017,thenumberofchildrenborninFinlandwillbelowerthanever
sincethelastfamineyears1866-68,althoughthesizeofthepopulationhasmorethandoubled.
Thisdevelopmentwillhavesevereconsequencesforthedependenceratiointhefuture.The
shareofpeoplewithforeignbackgroundasbeenverylowcomparedtootherEuropean
countries.Inthissense,Finlandhasbeenanisolatedcountry.
In2014,therewereabout97000childrenandyoungpeople(agedunder25years)with
mothertongueotherthanFinnishorSwedish(Figure6).Theshareofforeignoriginintheage
group0-24yearoldswas6.3%.(StatisticsFinland.)Thebiggestpopulationswithforeign
originsareEstoniansandRussians,whichisquitenaturalasEstoniaandRussiaarethe
neighboringcountriesofFinland.
AccordingtoStatisticsFinland'slatestpopulationprojection,therewouldbe882,000
personsagedunder15inFinlandin2030.Thenumberofpersonsagedunder15haslastbeen
thislowin1894.Atthebeginningofthe1980s,oneinfiveFinnswereagedunder15.According
totheprojection,theshareofpersonsagedunder15inthepopulationwoulddecreaseto14per
centby2060.Themainreasonforthedecliningshareofyoungpeopleisalowbirthrate.
20.0
22.0
24.0
26.0
28.0
30.0
32.0
34.0
36.0
38.0
40.0FinlandSouthFinlandNorth&EastFinland
20.0
25.0
30.0
35.0
40.0
2005
2006
2007
2008
2009
2010
2011
2012
2013
2014
2015
2016
FinlandSouthFinlandNorth&EastFinland
Page 129
H2020-YOUNG-SOCIETY-2015 YOUNG_ADULLLT Deliverable 4.1
11
Figure6.Numberofchildrenandyouthwithforeignoriginbyagegroup(0-4years,5-14years,15-24years)(leftaxis),andpercentageofchildrenandyouth(0-24years)withforeignoriginofthewholeagegroup(rightaxis)inFinlandin1990-2014
Source:Väestöliitto.
Thenumberofthepopulationofworkingage(aged15to64)washighestin2009,when
therewere3.55millionsuchpersonsinFinland.During2010to2014,thenumberofworking-
agepeoplehasfallenby69,000persons.Accordingtothepopulationprojectionof2015,the
numberofworking-agepeoplewoulddecreasefromthecurrent3.48millionto3.41million,or
by75,000persons,by2030.Afterthis,thenumberofworking-agepeoplewouldrecover
slightly,andby2045theywouldnumber3.46million.Then,thenumberofworking-agepeople
wouldagainstartdecliningand,accordingtotheprojection,theywouldnumber3.40millionin
2060.Theproportionofpeopleofworkingageinthepopulationwilldiminishfromthepresent
64%to59%by2030andto57%by2060.
Theso-calledself-sufficiencyforecastdescribesasituationwheretherewouldbeno
immigrationandemigrationatallandonlythebirthrateandmortalitywouldinfluencetheage
structure.Accordingtotheself-sufficiencyforecast,thenumberofworkingagepeoplewouldgo
downbytheyear2030by300,000personsandbytheyear2050by550,000persons(Figure
7).
0-4y
5-14y
15-24y
Numberofchildrenandyouthwithforeignorigin
year
Page 130
H2020-YOUNG-SOCIETY-2015 YOUNG_ADULLLT Deliverable 4.1
12
Figure7.Theshareofpersonsagedunder15inthepopulationinFinland,in1940to2065(%)
Source:PopulationStatistics,StatisticsFinland
Theproportionofpersonsaged65oroverinthepopulationisestimatedtorisefromthe
present19.9to26percentby2030andto29percentby2060.Thedemographicdependency
ratio,thatis,thenumberofchildrenandpensionersperonehundredpersonsofworkingage,
willgoupinthenearfuture.Attheendof2014,thedemographicdependencyratiowas57.1.
Accordingtotheprojection,thelimitof60dependentswouldbereachedin2017andthatof70
dependentsby2032.In2060,thedemographicdependencyratiowouldbe76.(Statistics
Finland.)
TosummarizethefindingsondemographicchangesinFinland,andasithasbeenshown
above,younggenerationshavebeenshrinkinginsizeforsometimenowandthenumberof
elderlypeopleisgrowingfast.Youngpeopleborninperipheralregionsofthecountry(likeFR
Kainuu)tendtomovetometropolitanareaandotherregionsinsouthernFinland.Finnishfamily
policyhasfailedbadlyinraisingthefertilityrateandthenumberofchildren.Dependencyratio
isgettinghigher.Atthesametimehostilitytowardspeoplewithforeignbackgroundhas
increasedamongnativepopulation.
1.2 Generalstateoftheeconomy
Finnisheconomyhassufferedtwoseverecrisessincethe1980’s,firstintheearly1990’sand
thenasaneffectoftheglobalfinancialcrisisfrom2008onwards.Figure8reflectsthedamage
the2008globalfinancialcrisismadeonFinnisheconomy.Notonlydidgrossdomesticproduct
Page 131
H2020-YOUNG-SOCIETY-2015 YOUNG_ADULLLT Deliverable 4.1
13
(GDP)fallduetothecrisis,butalsolabourproductivityrelativetoEUaveragedecreased
substantially.TheFinnisheconomysufferedfromthecrisisformuchlongerthandidmanyother
Westerncountries.In2016therefinallyweresomesignsofrecoverytobeseen,e.g.,GDPgrew
1.9percentrelativetoyear2015.
Figure8.GDPatcurrentmarketprices,Europerinhabitant
AsispresentedinFigure8,thefallofGDPpercapitafrom2008to2009wasmuch
steeperinFinlandthanitwasinEU28.AfterthecrisistheGDPpercapitagapbetweenEU28and
North&EastFinlandgotwider.BeforethecrisisGDPpercapitawashigherinSouthFinland
thaninEU28,butafter2010SouthFinlandhasbeenlaggingbehindEU28andthegaphaseven
grownin2015(seeFigure9).Althoughwedonothaveappropriatedataathand,itishighly
likelythatthefigureforFRSouthwestFinlandwouldlookmorepositivethanthesefiguresfor
NUTS2areSouthFinland.ProbablytheGDPpercapitainFRSouthwestFinlandwouldbehigher
thanFinlandonaverage.
100102104106108110112114116118120
20,00022,00024,00026,00028,00030,00032,00034,00036,00038,00040,000
2006 2007 2008 2009 2010 2011 2012 2013 2014 2015
FinlandlabourproducZvity(EU=100) EU28GDP
Finland SouthFinland
North&EastFinland
Page 132
H2020-YOUNG-SOCIETY-2015 YOUNG_ADULLLT Deliverable 4.1
14
Figure9.GDPatcurrentmarketprices,Europerinhabitantinpercentage(%)ofEU28(=100),2006-2015
Tosummarizethefindingsonthestateofeconomy,itneedstobeemphasizedthat
duringthepast25yearstheeconomyofFinlandhassufferedtwodeepeconomicdepressions,
firstintheearly1990sandthenaftertheglobalfinancialcrisisafter2008.Thecriseshithardon
Finnisheconomyandhadsevereconsequencesonthegrossdomesticproduct(GDP)andlabour
productivityofthecountry,whichbothdecreasedsubstantially.Theconsequencesofthese
crisesmaterialized,e.g.,inshrinkingemploymentandincreasingunemployment.Buttheyalso
havehadahugeimpactonthementalityandsubjectivefutureprospectsofFinnishpeople.
1.3 Educationandtrainingsystem
InFinland,educationisverymuchagenderrelatedphenomenon.Thefieldsofeducationaswell
asoccupationsinworkinglifearestronglysegregatedbygender.Inschool,girlsclearly
outperfomboysinreadingandlanguages.ThemostrecentPISAassessmentshowsthatgirlsdo
betterinmathematicsandsciencesaswell(OECD2016a).Girls’bettersuccessinschoolisalso
reflectedlateroninlifebythefactthatwomenhavehighereducationalattainmentlevelthan
men:34%ofthefemalepopulationhascompletedISCED5-8levelofeducation,whereasonly
26%ofmenhaveattainedtherespectivelevelofeducation(Figure10).Theshareisaboutthe
sameinFRSouthwestFinlandasitisinFinlandonaverage.However,populationinFRKainuu
hasaremarkablylowerrateofISCED5-8educationalattainment.InKainuu27%ofwomenand
20%ofmenhaveISCED5-8leveleducation.
80
85
90
95
100
105
110
115
120
125
130
2006 2007 2008 2009 2010 2011 2012 2013 2014 2015
EuropeanUnion(28countries) Finland SouthFinland North&EastFinland
Page 133
H2020-YOUNG-SOCIETY-2015 YOUNG_ADULLLT Deliverable 4.1
15
Figure10.TheshareofISCED5-8leveleducationofpopulationaged15yearsormorebygenderinFinland,FRSouthwestFinland,andFRKainuu,2007-2015(%)
Youngpeoplenaturallyhaveahighereducationallevelthanthepopulationingeneral.
About85percentofthepopulationaged30-34yearshavecompletedsomepostcompulsory
education(Figure11).
Figure11.Youngadults’(30-34yearolds)educationalattainmentbyISCEDlevelsinFinland,FRSouthwestFinland,andFRKainuu,2005-2015
About40percenthavecompletedISCED5leveleducationorhigher.Thechangepatternwithin
tenyearstime,from2005to2015,lookmuchthesameinSouthwestandinFinlandonaverage.
ThereisasmalldifferenceintherelativeproportionsbetweenISCED3-4andISCED5-8levels
sothatonFRSouthwestFinlandyoungadultswithISCED3-4levelhaveincreasedtheirshareat
16
18
20
22
24
26
28
30
32
34
36
2007 2008 2009 2010 2011 2012 2013 2014 2015
Female
Finland
SouthwestFinland
Kainuu16
18
20
22
24
26
28
30
32
34
36
200720082009201020112012201320142015
Male Finland
SouthwestFinland
Kainuu
0
10
20
30
40
50
60
2005
2006
2007
2008
2009
2010
2011
2012
2013
2014
2015
Finland
ISCED0-2ISCED3-4ISCED5-8
0
10
20
30
40
50
60
2005
2006
2007
2008
2009
2010
2011
2012
2013
2014
2015
SouthwestFinland
ISCED0-2ISCED3-4ISCED5-8 0
10
20
30
40
50
60
2005
2006
2007
2008
2009
2010
2011
2012
2013
2014
2015
Kainuu
ISCED0-2ISCED3-4ISCED5-8
Page 134
H2020-YOUNG-SOCIETY-2015 YOUNG_ADULLLT Deliverable 4.1
16
theexpenceofyoungadultswithISCED5orhigher.Theshareof30-34yearoldswithonlybasic
leveleducation(ISCED0-2)hasincreasedinFRSouthwestFinlandandinFinlandonaverage.
TherearecleardifferencesbetweenFRSouthwestFinlandandFRKainuu:inKainuutheshare
youngadultshavingonlyISCED0-2leveleducationhasdecreasedintenyearstimeandwas
about10percentin2015.InFRSouthestFinlandtheshareofrespectivegrouphasincreased
sinceyear2008.MostyoungadultsinFRKainuuattainISCED3-4leveleducation,andthat
percentagehasincresedquiterapidly.ThegrowingpercentageofISCED3-4levelpeoplehas
comeattheexpenseofhigherlevelattainment(ISCED5orhigher).
PISAresultsfromtheearly2000’sonhaveshownthatnotonlyistheaveragelevelin
reading,mathematics,andscienceshighinFinland,butalsotheshareoflowachieversis
comparativelysmall.Thisisaveryimportantsignofanequalitarianandeffectiveschoolsystem.
TheotherimportantsignisthattheFinnishschoolsystemhasbeensuccessfulincompensating
forthepoorsocioeconomicbackgroundofpupils.Theeffectofsocialclassonlearningoutcomes
hasbeenproventobeweakerinFinlandthaninmostcountriesparticipatinginPISA.Also,the
betweenschoolvariationinlearningoutcomesisoneofthesmallestintheOECDworld.The
schoolsystemhasprovedtobehomogeneousinquality.
However,accordingtorecentdevelopmentsinPISAassessments,allthesepositive
resultsoftheFinnishschoolsystemhavebeendeteriorating.Theeffectofsocioeconomicand
culturalbackgroundonlearningoutcomeshasgottenstronger.
Theaverageproficiencylevelsinliteracy,mathematics,andscienceshasweakened
substantially,andtheproportionofpupilswithlowlevelofskillshasgrownsignificantly.Ascan
beseeninFigure12,theshareoflowperformersinmathematicshasgrownonaveragein
OECDcountries(from21.6%to22.9%fromyear2003toyear2015),butinFinlandthe
proportionhasdoubledintwelveyears,from6.8%to13.6%.Thepercentageoflowperformers
inFinlandisstillwellbelowOECDaveragebutthechangeisremarkableandhascausedalotof
discussiononthecausesbehindthesedevelopments.
Page 135
H2020-YOUNG-SOCIETY-2015 YOUNG_ADULLLT Deliverable 4.1
17
Figure12.Theshareoflowperformers(belowtestlevel2)andhighperformers(testlevels5and6)inmathematicsofthe15yearolds:OECDaverageandFinland,inyears2003,2012and2015(%)
Besidesthegrowingproportionoflowperformerstherehasalsobeenasignificant
declineintheproportionofhighperformersinreading,mathematics,andsciencesinFinland.
ThesametrendcanbeseenintheOECDaverageaswell,but,again,inFinlandthechangehas
beenbiggerthaninanyothercountry.Forexampleinmathematics,theproportionofhigh
performershashalvedintwelveyears’time,from23.4%to11.7%.
Page 136
H2020-YOUNG-SOCIETY-2015 YOUNG_ADULLLT Deliverable 4.1
18
PISAresultsreflecttheundesireddevelopmentthatmoreandmorepupilsarehaving
difficultiesinobtainingdecentlevelofmathematicalandreadingskillsinschools.Lateronthey
willhavedifficultiesinattachingtolabourmarketandgettingadecentjob.
Despitegrowingdifficultiesincopingwiththecompetitioninschoolandeducation
system,droppingoutofcomprehensiveschoolhasbeenveryrareinFinland.Almostallstudents
completetheircompulsoryeducationandgetacertificate.However,theshareofpupilsleaving
schoolwithoutaleavingcertificatefromcomprehensiveschoolhasbeenincreasingsince2008
(Figure13).Atotalof409studentshaddiscontinuedstudiesinonewayoranotherin
comprehensiveschoolduringthe2015/2016academicyear.Thenumberofthosewhohad
completelydroppedoutfromcompulsoryeducationinthespringtermwas94andthoseover
theageofcompulsoryeducationhavingleftschoolwithoutaleavingcertificatefrom
comprehensiveschoolwas315.Morethanone-halfofschooldrop-outswereboys.Thenumber
ofboysamongthosewhohadcompletelydroppedoutfromcompulsoryeducationwas53,and
185amongthosehavingleftcomprehensiveschoolwithoutaleavingcertificate.(Statistics
Finland.) Figure13.PupilshavingleftcomprehensiveschoolwithoutaleavingcertificateinFinland,2000-2016(%)
Source:StatisticsFinland Droppingoutofeducationhasbeenconsideredabigproblemespeciallyinsecondary
levelvocationaleducation.Inall,5.1percentofstudentsattendingeducationleadingtoa
qualificationordegreediscontinuedtheirstudiesanddidnotresumetheminanyeducation
leadingtoaqualificationordegreeduringthe2014/2015academicyear(Figure14).Compared
tothepast10yearperiod,discontinuationhasdecreasedinuppersecondarygeneraland
Page 137
H2020-YOUNG-SOCIETY-2015 YOUNG_ADULLLT Deliverable 4.1
19
vocationaleducation,anduniversitiesofappliedsciencesandremainedrelativelyunchangedin
universityeducation.(ThesedataderivefromStatisticsFinland’sEducationStatistics.Students
whohavechangedtheirsectorsofeducation,e.g.,studentswhohaveswitchedfromupper
secondarygeneralschooltovocationaleducation,arenotcalculatedasdiscontinuedstudents.)
Mendiscontinuedcompletelytheireducationleadingtoaqualificationordegreeinthe
academicyear2014/2015moreoftenthanwomeninallsectorsofeducation.Mendiscontinued
theiruniversityofappliedscienceseducationmostcommonlyandwomentheirvocational
education.Womendiscontinuedtheirstudiesintheirownsectorsofeducationmoreoftenthan
menonlyinvocationaleducation.(StatisticsFinland.)
Figure14.Discontinuationofeducationinuppersecondarygeneral,vocational,universityofappliedsciences,anduniversityeducationinacademicyearsinFinland,from2005/2006to2014/2015(%)
Source:StatisticsFinland ThetrendinthepercentageofNEETyounghasbeendownwardsinEuropesince2012.
AtthesametimethepercentageofNEETyounghasbeenincreasinginFinland.However,year
2016thereseemstobeaturningpointforthegrowingNEETfiguresinFinland(Figure15).The
shareofNEETyouthofallyoungpeoplediminishedabitinbothNUTS2areasinFinlandaswell
asinFinlandonaverage.TheshareofNEETyouthisbiggerinNorth&EastFinlandthanin
SouthFinlandorinFinlandonaverage.HoweveratNUTS2levelthedifferencesbetweenareas
arerathersmall,lessthanonepercentagepoint.
vocationaleducation
unversityofappliedsc.
unversityeducation
uppersecondarygeneral
Page 138
H2020-YOUNG-SOCIETY-2015 YOUNG_ADULLLT Deliverable 4.1
20
Figure15.YoungpeopleneitherinemploymentnorineducationandtraininginEU27,Finland,SouthFinland,andNorth&EastFinland,2012-2016(%)
ThereisalsorecentresearchonthesocalledNEETgroupmadeinFinlandwith
interestingstatisticsbyagegroupandgender.Youngpeoplenotinemployment,educationor
trainingorconscriptshasincreasedafter2010fortheyoungcohortsexceptthoseagedfrom15
to19(Figure16).TheNEETratefor20to24year-oldmaleshasincreasedespecially
significantly.Theeducationalattainmentofyoungmalesisnotasgoodasforfemales,which
explainsthedifferenceforitspart.ThepercentageofNEETwomenaged20-24hasalmost
doubledbetween2008and2015,fromninepercenttoabout16.5percent.Atthesametime
percentageofNEETmenaged25-29hasincreasedfrom15percentto20percent.
8.0
9.0
10.0
11.0
12.0
13.0
14.0
2012 2013 2014 2015 2016
EU27 Finland SouthFinland North&EastFinland
Page 139
H2020-YOUNG-SOCIETY-2015 YOUNG_ADULLLT Deliverable 4.1
21
Figure16.Youngpeoplenotineducationoremployment(NEET)byagegroupandgenderinFinland,2008-2015
Source:Alatalo,Mähönen&Räisänen2017. TheageofgraduationfromuniversitiesiscomparativelyhighinFinland.Onecrucial
reasonbehindlongstudytimesandlategraduationisthatitisverycommonforstudentsto
workwhilestudying.In2015,slightlylessthanone-halfofstudentswereemployedduringtheir
studies(Figure17).Since2004,thesharehasbeenhighestin2008whennearlysixoutoften
studentswereemployedduringtheirstudies.Workingwasmostcommoninconnectionwith
universityanduniversityofappliedsciencesstudies.Fifty-fivepercentofuniversitystudents
and54percentofuniversityofappliedsciencesstudentshadanemploymentcontractwhile
studying.Closetoone-halfofthestudentsattendinguppersecondaryvocationaleducationwere
15-19
15-29
25-29
20-24
15-19
15-19
20-24
20-24
25-29
25-29
15-29
15-29
Bothgenders
Male Female
Page 140
H2020-YOUNG-SOCIETY-2015 YOUNG_ADULLLT Deliverable 4.1
22
employedduringtheirstudies.In2015,theshareofemployedstudentsinuniversityeducation
decreasedthemost,byaroundonepercentagepointfromtheyearbefore.(StatisticsFinland.)
Figure17.Sharesofemployedstudentsagedatleast18ofallstudentsinFinland,2008–2015(%)
Source:StatisticsFinland Womenworkedwhilestudyingmorefrequentlythanmen:53percentofwomenand46
percentofmenhadanemploymentcontractwhilestudying.Theproportionofemployed
womeninuppersecondarygeneraleducationandinuniversityofappliedscienceseducation
wastenpercentagepointshigherthanthatofmen.Thirtypercentofwomeninuppersecondary
generaleducationwereworkingalongsidestudiesand56percentofwomeninuniversityof
appliedscienceseducation.Fifty-onepercentofwomeninuppersecondaryvocational
educationworked,whichwassevenpercentagepointsmorethanformen.Employmentduring
studiesgrewclearlytheolderthestudentswere.While22percentofstudentsaged18were
working,theshareofemployedstudentsagedatleast25wasnearlytriple.Of21-year-old
students,39percentandof24-year-oldstudents,49percenthadanemploymentcontract.
Amongstudentsaged25orover,61percentwereemployedduringtheirstudies.(Statistics
Finland.)
Tosummarizethefindingsonlearningandeducation,wecansaythatdespitetherecent
downturninlearningoutcomesinPISAassessments,onaverageFinnish15-year-oldsarevery
goodinmathematics,literacy,andsciences.However,theincreasingpercentageoflowachievers
isanationalconcerninFinnisheducationpolicy.Shareofpupilshavingleftcomprehensive
schoolwithoutaleavingcertificateisverylowinFinland,butithasbeenincreasingsince2008.
Itismostlikelythatmoreyoungpeoplewithpooreducationalqualificationsandpoorskillswill
Page 141
H2020-YOUNG-SOCIETY-2015 YOUNG_ADULLLT Deliverable 4.1
23
enterlabourmarketinthefuture.Loweducationalattainment(belowISCED5)ismoretypical
tomalethanfemale,andmorecommoninFRKainuuthanFRSouthwestFinland.From2012to
2015,thestatisticaltrendinthepercentageofNEETyoungwasdownwardsinEuropebut
upwardsinFinland.Probably,thenumberofvulnerableyouth(especiallyboys)willincreasein
Finland.
1.4 Labourmarket
The1990’sstartedinFinlandwitharapidlydeepeningeconomicdepression.Theaverage
unemploymentrateincreasedupto20percent,andemploymentratewiththenumberofpeople
inlabourforcedecreased(seeFigure18).Duringthewholeofthe1990’sthenumberofpeople
inlabourforcecontinuedtostayatalowerlevelthanattheturnofthedecade.FRSouthwest
FinlandrecoveredearlierthanFinlandonaverage,nottotalkaboutFRKainuuwherethesizeof
thelabourforcehasbeendecreasingforthewholeperiodexaminedintheFigure18.Year2016
seemstohavewitnessedanewdramaticdownturninlabourforceinFRKainuu.Theglobal
financialcrisisin2008hitespeciallyhardFRSouthwestFinlandwherethenumberofpeoplein
labourforcedovedramatically.
Figure18.ThedevelopmentofnumberofpeopleinlabourforceinFinland,FRSouthwestFinland,andFRKainuu,1991-2016(year1991=100)
Duetorelativelyhighstructuralunemploymentandincreasingshareofelderlypeople
(inretirement)intheFinnishpopulationtheemploymentratehasbeenestimatedtobe
unbearablylow.Beforethe2008crisisemploymentratewasrisingforseveralyears.Butafter
70.0
75.0
80.0
85.0
90.0
95.0
100.0
105.0
110.0
115.0
1991
1992
1993
1994
1995
1996
1997
1998
1999
2000
2001
2002
2003
2004
2005
2006
2007
2008
2009
2010
2011
2012
2013
2014
2015
2016
Finland SouthwestFinland Kainuu
Page 142
H2020-YOUNG-SOCIETY-2015 YOUNG_ADULLLT Deliverable 4.1
24
2008withincreasingunemploymentanddiscouragedworkersleavinglabourmarketaltogether
theemploymentraterapidlygottoalowerlevelandhasnotrecovered.EmploymentinFR
SouthwestFinlandhasbeenatahigherlevelthaninFinlandonaverage(Figure19).
RespectivelyemploymentrateinFRKainuuhasbeenmuchlowerthantheFinnishaverage.
Figure19.EmploymentratesinFinland,FRSouthwestFinland,andFRKainuu,2005-2016(%)
ThepresentFinnishgovernmenthassetthetargetathavingtheemploymentrateat72
percentin2019.Therehavebeenvariousmeasurestaken,but72%employmentratewillbe
beyondreachintwoyears’time.Year2017hasbeenthefirstpositiveyearinFinnisheconomy
sincethedownturnin2008.Thus,recoveringfromtheworldwidefinancialcrisisof2008took
abouttenyearsinFinland.Andstilltheeconomicfutureisfullofuncertainties.
In1991unemploymentbeguntorisedrastically.Theworstyearswere1993-1995when
theunemploymentratewasatthehighestlevelithadeverbeeninthehistoryofFinland.After
thattheunemploymentbegunasteadyfalltilltheyear2008afterwhichtheunemploymentrate
beguntoriseagain.ForFRKainuutheyear2014wasthepeakinunemploymentratewithabout
17percentoflabourforcebeingoutofwork(Figure20).InFRSouthwestFinland,
unemploymentratehasusuallybeenatalowerlevelthaninFinlandonaverage.However,in
2013unemploymentrateinFRSouthwestFinlandroseabovethecountryaverage.
50.0
55.0
60.0
65.0
70.0
75.0
Finland SouthwestFinland Kainuu
Page 143
H2020-YOUNG-SOCIETY-2015 YOUNG_ADULLLT Deliverable 4.1
25
Figure20.UnemploymentrateinFinland,inFRSouthwestFinland,andFRKainuu1991-2016(%)
Justrecentlytherewasadescriptiveanalysisofstatisticalnaturepublishedwhich
discussesworkinglifeandbeingoutsideofitforyoungpeopleandyoungadults.Thetarget
groupsoftheanalysisareyoungpeopleaged15-24andforsomeparts,youngadultsuptothe
ageof34.Theissuesdiscussedareemploymentandjobtenure,theoccupationalandbranch
leveldevelopmentsinthelabourmarket,workingconditions,occupationsofjob-seekers,
unemploymentandthoseoutsideofemploymentandeducationortraining,allfocusedonyoung
people.Accordingtotheanalyses,participationintheworkinglifehaschangedinmanyrespects
inthe2000sforyoungpeopleandyoungadults.Afterthefinancialcrisis2008,employment
rateshavedecreased,withtheexceptionoftheyoungestcohorts.Malesagedfrom20to24have
adecreasingtrendintheemploymentrate,unlikefemales.Employedyoungwomenparticipate
moreoftenineducationcomparedtoemployedyoungmen.Theaveragejobtenureforyoung
peopleisusuallylow;theemphasisofFinnishyoungpeople´sjobsisintheshortduration,also
ininternationalcomparison.
Whatiscrucial,isthatitismoredifficultthanbeforeforyoungpeopleandyoungadults
togetintoasalariedprofessionalposition.Thelabourmarketpositionofyoungadultshas
worsenedasawholeduringtheprolongedrecessionperiodincomparisontooldercohorts.The
shareof25-34-year-oldmeninthepositionsofworkersanddependentclericalworkersis
increasing.Theshareofthesecohortshasdecreasedinthefieldofinformationand
communication,andincreasedinmining,construction,financeandinsuranceaswellasin
electrical,gasandheatingservices.Accordingtoacademicstudies,thedeterioratinglabour
marketpositionsarealsovisibleintermsofincome.Job-seekersagedbetween20and24are
0
5
10
15
20
25
%
Year
Finland SouthwestFinland Kainuu
Page 144
H2020-YOUNG-SOCIETY-2015 YOUNG_ADULLLT Deliverable 4.1
26
oftenunclassifiedintermsofoccupation.Thehighestshareofoccupationsarefoundin
construction,repairandmanufacturingwork,whilealsoserviceandsalesoccupationsarefound
forover20percentofthejobseekersinthecohort.Forthefiveyearsoldercohort,theshareof
expertoccupationsishigher.
Afterthefinancialcrisis,unemploymentforyoungpeoplehasincreased,moreheavily
formalesthanforfemales.Youthunemploymenthasalreadyturneddownwardsthisyear,but
long-termunemploymentisstillrising(Figure21).
Figure21.Thenumberoflong-termunemployed20-29yearoldsinFinlandbygender,2006-2016
Source:Alatalo,Mähönen&Räisänen2017.
TosummarizethefindingsonlabourmarketsituationinFinland,weconcludethatdifferences
inemploymentratesbetweenregionsandagegroupsarelarge.Averageemploymentrateis
muchhigherinFRSouthewestFinandthanFRKainuu,andrespectively,unemploymentrateis
higherinFRKainuuthaninFRSouthwestFinland.Thelabourmarketpositionofyoungadults
hasworsenedasawholeduringtheprolongedrecessionperiodincomparisontooldercohorts.
TheaveragejobtenureforyoungpeopleinFinlandisusuallyshortinduration,alsowhen
comparedinternationally.Itismoredifficultthanbeforeforyoungadultstogetintoasalaried
professionalposition.Youngpeoplehaveahardtimeinplanningtheirfutureespeciallyin
economicallyregressiveregions.
Male
Female
Page 145
H2020-YOUNG-SOCIETY-2015 YOUNG_ADULLLT Deliverable 4.1
27
1.5 Redistributionandsocialinclusion
Ininternationalcomparisons,Finlandhashadrelativelynarrowincomedifferences.
SocioeconomicandculturalinequalitieshavebeensmallerthaninmostEuropeancountries.The
culturalgapbetweensocialclassesisnotnearlyaswideas,e.g.,inGreatBritainorFrance.One
ofthereasonistheculturalhomogeneityofthepopulation,butalsoimplementedpolicieshave
certainlyhadanimpactonthesizeoftheclassdifferences.However,OECDstatistics(OECD
2015;2016b)showthatincomedifferencesinFinlandhavegrownsincethebeginningofthe
1990’s(Silvennoinen,Kalalahti&Varjo2016),and,ascanbeseeninFigure22,theregional
differencesindisposableincomearesignificantinFinland–whenrememberingthatcomparing
NUTS2levelareashidealotofregionalandlocaldifferencesandinequalities.Disposableincome
hasincreasedinbothNUTS2areasbuttherelativedifferencebetweentheareashasremained
almostunchanged.
Figure22.GINIIndexbeforeandaftertransfers(leftaxis),disposableincomeinthehouseholdsinPPS(rightaxis),inEU27,Finland,SouthFinland,andNorth&EastFinland,in2005-2015
TheGINIindexbeforeandaftertransfersarelowerinFinlandthaninEU27countrieson
average.Itseemsfromfigure21thatmechanismoftransfershasbeeneffectiveinFinland:GINI
indexbeforetransfersincreasedfrom44.9%in2009to47.4%in2015.Atthesametime,GINI
indexaftertransfersdecreasedslightlyfrom25.9%to25.2%.
0
2,000
4,000
6,000
8,000
10,000
12,000
14,000
16,000
18,000
0
10
20
30
40
50
60
2005 2006 2007 2008 2009 2010 2011 2012 2013 2014 2015
EU27GINIbefore FinlandGINIbefore EU27GINIaaerFinlandGINIaaer Finland SouthFinlandNorth&EastFinland
Page 146
H2020-YOUNG-SOCIETY-2015 YOUNG_ADULLLT Deliverable 4.1
28
BeingatriskofpovertyandsocialexclusionislowerinFinlandthanitisinEU27countrieson
averagebutitiscertainlynotnon-existent,althoughtheriskismuchlowerthan,e.g.,intheU.K.,
nottotalkaboutSpain.About17%ofthepopulationhasbeenatriskofpovertyorexclusion
between2005and2015.Thereissomevariationbetweentheyearsduringthatperiod,butwith
alongtermexaminationtherateisquitesteady(Figure23).Thegapbetweendifferentpartsof
thecountryhasbeengrowingduringthepastdecade.Theriskofpovertyandsocialexclusion
hasgrownbiggerespeciallyinnorthernandeasternregionsofFinland.
Figure23.Peopleatriskofpovertyandsocialexclusion,inEU27,Finland,SouthFinland,andNorth&EastFinland(plusSpainandtheU.K.),in2005-2015(%)
Itisagreedthattheproportionofpeopleatriskofpovertyandsocialexclusionis
substantialinFinland,andespeciallyinnorthernandeasternregionsofthecountry.However,
severematerialdeprivationrateisatasubstantiallylowerlevelthaninothercountries
participatinginYoungAdullltresearch.Theratehasbeen2-3percentinbothNUTS2levelareas
andinFinlandonaverage.
Insummary,incomedifferences,aswellasriskofpoverty,aresmallerinFinlandthanin
mostEuropeancountries.GINIIndexhasincreasedsincetheyearoffinancialcrisis2008.
However,mechanismoftransfersseemstohavebeeneffectiveinFinland,sincealthoughGINI
indexbeforetransfershasincreasedandGINIindexaftertransfershasdecreasedslightly.
15
17
19
21
23
25
27
29
31
2005 2006 2007 2008 2009 2010 2011 2012 2013 2014 2015
EU27 Spain Finland
SouthFinland North&EastFinland UnitedKingdom
Page 147
H2020-YOUNG-SOCIETY-2015 YOUNG_ADULLLT Deliverable 4.1
29
1.6 Healthandwell-being
AccordingtoPISA2015studyFinnish15yearoldsareamongthemostsatisfiedyouthinthe
OECDworld(OECD2016a).NearlyhalfofFinnishpupils(45%)saytheyareverysatisfiedwith
theirlifewhereastheOECDaverageis34%.Among49participatingcountriesonlytheyouthin
DominicanRepublic,Mexico,CostaRica,andCroatiafeltweremoresatisfiedwiththeirlifethan
Finnishyoungpeople.
Figure24.Rateofyouth(20-29years)livingwiththeirparentsbygender,EU27andFinland(%)
OnefeatureincomingtoageinFinlandisthatyoungpeoplemoveawayfromtheir
childhoodhomeatarelativelyearlyage.InsomeEuropeancountriesyoungleavetheir
childhoodhomeaslateasattheageof30.Thiswouldbeconsideredassomesortofpersonal
failureinFinland.Finnishyouththinkthathavinganownapartment(rentedorowned)isa
crucialstepingainingindependenceasapersonandacitizen.Intheagegroup20-29,only10
percentofFinnishwomenlivewiththeirparents(Figure24).Thathasnotchangedinthepast
tenyearsorso.OftherespectivegroupofFinnishmenabout25percentlivewiththeirparents.
Thepercentagehasbeenslightlydecreasingsince2006.Thedevelopmentisquitetheopposite
comparedtotheirEU27peersofwhich63%livedwiththeirparentsin2013.Thedifferencein
percentagepointsbetweengendersisaboutsameinFinlandandinEU27.Theshareofyoung
menlivingwiththeirparentsisabout15percentagepointshigherthanamongyoungwomen.
Finnishyoungpeopleareclearlymoresatisfiedwithseveralareasoftheirlifethantheir
peersinEuropeonaverage,ascanbeseeninFigure25.
0.0
10.0
20.0
30.0
40.0
50.0
60.0
70.0
2006 2007 2008 2009 2010 2011 2012 2013
EU27female EU27male Finlandfemale Finlandmale
Page 148
H2020-YOUNG-SOCIETY-2015 YOUNG_ADULLLT Deliverable 4.1
30
Figure25.Highsatisfactioninvariouslifedomainsofpopulationaged25-34bygender,EU28andFinland
EspeciallylargedifferencesbetweenFinnishyouthandEuropeanaveragearein
accommodation,jobsatisfaction,andoveralllifesatisfaction(Figure25).Areaswiththelowest
levelofsatisfactionarethesameinFinlandastheEuropeanaverage:timeuseandfinancial
situation.ItseemsthatinFinlandyoungwomenaremoresatisfiedthanyoungmen.Especially
thesenseonmeaningoflifemakesadifferencebetweengendersinFinland.
Tosummarizethefindingsinhealthandwell-beingitsufficestosaythatFinnishyoung
peoplearerelativelysatisfiedwiththeirlifeinmostareasoflife.However,inmanyrespects
youngwomentendtobemoresatisfiedthantheirmalecounterparts.Onfeaturetypicalto
Finlandisthatyoungcohortsleavetheirchildhoodhometoliveontheirownatarelativelyearly
age.Thisprobablyincreasestheirfeltautonomyandindependenceandaffecttheirwell-beingas
well.
2. Concludingremarks
TheschoolsysteminFinlandhasprovedtobehomogeneousinquality.Differencesbetween
schoolsaregrowingbutstillrelativelysmall.Youngpeoplehaverelativelygoodeducational
0
10
20
30
40
50
60FinancialsituaZon
AccommodaZon
JobsaZsfacZon
CommuZngZme
Timeuse
OveralllifesaZsfacZon
RecreaZonalandgreenareas
Livingenvironment
PersonalrelaZonships
Meaningoflife
EU28males Finmales EU28females Finfemales
Page 149
H2020-YOUNG-SOCIETY-2015 YOUNG_ADULLLT Deliverable 4.1
31
opportunitiesattheuppersecondaryandtertiarylevel.However,thereareabout10percentin
eachagecohortyoungpeoplewhodonotcontinueineducationortrainingafterbasic
education.Theirsituationisgettingworsewhilethecompetitioninthelabourmarketgets
tighter.AnewdevelopmentinFinnishschoolsystemisthesteadilydecreasinglevelofaverage
learningoutcomestestedinPISA,TIMSS,andPIRLS.Duringthepastdecade,theshareofhigh
performershasbeendecreasingandlowperformershasbeengrowing.Lowperformancein
compulsoryschoolhasfarreachingconsequencesonyoungperson’sabilitytoclimbinthe
hierarchiesofeducationsystemandlabourmarket.
Finnisheconomyhassufferedtwoseverecrisessincethe1980’s,firstintheearly1990’s
andthenasaneffectoftheglobalfinancialcrisisfrom2008onwards,whichhavehaddrastic
effectsonyouthemployment.Long-termunemploymentof20-29yearoldmaleswasseven
timeshigherandfemaleseighttimeshigherin2016thanin2008.Uncertainemployment
prospectshavealsodiscouragingeffectsoneducationalmotivationespeciallyforlowachieving
young.Incertainregionsofthecountry,includingFRKainuu,gettingajobwithoutwork
experienceandvocationaltrainingispracticallynon-existent.ThenumberofNEETyounghas
beenslightlyincreasingduringthepastdecadeorso.Actually,youngadultslivinginthetwo
functionalregions(FR),FRSouthwestFinlandandFRKainuu,liveinquitedifferentrealities
whatcomestotheirfutureprospects.Peopleborninnorthernandeasternpartsofthecountry
tendtomovetosoutherncitiesaftercompletingcompulsoryoruppersecondaryeducation.The
overallemploymentinFRKainuuhasdecreasedquitedramaticallywithinthepastdecades:the
numberofemployedinFRKainuuisonlyabout70percentofthelevelitwasinthebeginningof
the1990’s.However,Finnishyoungpeopleareclearlymoresatisfiedwithseveralareasoftheir
lifethantheirpeersinEuropeonaverage.EspeciallylargedifferencesbetweenFinnishyouth
andEuropeanaverageareinaccommodation,jobsatisfaction,andoveralllifesatisfaction.
BeingatriskofpovertyandsocialexclusionislowerinFinlandthanitisinEU27countrieson
average.About17%ofthepopulationhasbeenatriskofpovertyorexclusionbetween2005
and2015.Thegapbetweendifferentpartsofthecountryhasbeengrowingduringthepast
decade.Theriskofpovertyandsocialexclusionhasgrownbiggerespeciallyinnorthernand
easternregionsofFinland.
ThenumberofchildrenborninFinlandwillbelowerthaneversincethelastfamine
years1866-68,althoughthesizeofthepopulationhasmorethandoubled.Accordingtothe
projection,theshareofpersonsagedunder15inthepopulationwoulddecreaseto14percent
by2060.Theshareofpeoplewithforeignbackgroundhasbeenverylowcomparedtoother
Europeancountries.Hostilitytowardspeoplewithforeignbackgroundhasincreasedduring
recentyearsamongnativepopulation.Thesedevelopmentswillhavesevereconsequencesfor
thedependenceratiointhefuture.
Page 150
H2020-YOUNG-SOCIETY-2015 YOUNG_ADULLLT Deliverable 4.1
32
Inthisreport,thebasicstatisticshavebeenpresentedatNUTS2-level(‘largerareas’
SouthFinlandandNorth&EastFinland).Relatedtothebasicproblematicsandtheapproachof
YoungAdulllt-projectthisisaproblem.TherearesubstantialdifferencesbetweenNUTS3level
regionsincludedinthesameNUTS2levelareas.Thisconcernsalsoourtwofunctionalregions,
especiallyFRKainuu.SuitabilityofNUTS2levelstatisticsindicatingtherealitiesatNUTS3
level-atthelevelofourfunctionalregions–isdisputable.StatisticsonNUTS2area‘North&
EastFinland’donotrepresentproperlythesituationinFRKainuu.However,crucialinformation
atNUTS3level,wheneveravailable,hasbeenaddedsothatthefunctionalregionsSouthwest
Finland(partofNUTS2area‘SouthFinland’)andKainuu(partofNUTS2area‘North&East
Finland’)wouldbedescribedmoreproperly.
3. References
Alatalo,J.,Mähönen,E.&Räisänen,H.2017.Nuortenjanuortenaikuistentyöelämäjasen
ulkopuolisuus.TEM-analyyseja76/2017.Helsinki:MinistryofEconomicAffairsand
Employment.
Kalalahti,M.,Silvennoinen,H.,Varjo,J.&Rinne,R.2015.Educationforall?UrbanParental
AttitudesTowardsUniversalismandSelectivismintheFinnishComprehensiveSchoolSystem.
InP.Seppänen,A.Carrasco,M.Kalalahti,R.Rinne&H.Simola(eds)ContrastingDynamicsin
EducationPoliticsofExtremes:SchoolChoiceinChileandFinland.London:SensePublisher,
205–224.
OECD2013.PISA2012Results:ExcellenceThroughEquity:GivingEveryStudenttheChanceto
Succeed(VolumeII).Paris:OECDPublishing.
OECD.2015.InItTogether:WhyLessInequalityBenefitsAll.Paris:OECDPublishing.
OECD.2016a.PISA2015Results(VolumeI):ExcellenceandEquityinEducation.Paris:OECD
Publishing.
OECD.2026b.IncomeDistributionDatabase(IDD).http://www.oecd.org/social/income-
distribution-database.htm.
Silvennoinen,H.Kalalahti,M.&Varjo,J.2016.Globalisaatio,markkinaliberalismija
koulutuspolitiikanmuutos.[Globalisation,MarketLiberalismandEducationPolicyChange.In
Page 151
H2020-YOUNG-SOCIETY-2015 YOUNG_ADULLLT Deliverable 4.1
33
Finnish].InH.Silvennoinen,M.Kalalahti&J.Varjo(eds)Koulutuksentasa-arvonmuuttuvat
merkitykset.Kasvatussosiologianvuosikirja1.Kasvatusalantutkimuksia73,11-34.
StatisticsFinland.PopulationStatistics.http://www.stat.fi/til/vrm_en.html.
Väestöliitto.
http://www.vaestoliitto.fi/tieto_ja_tutkimus/vaestontutkimuslaitos/tilastoja/syntyvyys/syntyn
eiden-maara/
Page 152
Work Package 4
Quantitative Analysis Young Adults’ Data
Germany National Report
University of Münster (WWU) & University of Education Freiburg (PHFR)
Sarah Schaufler & Marcelo Parreira do Amaral in cooperation with Thomas Verlage and Uwe H. Bittlingmayer
Project Coordinator: Prof. Dr. Marcelo Parreira do Amaral (University of Münster)
Project no.: 693167
Project acronym: YOUNG_ADULLLT
Project duration: 01/03/2016 to 28/02/2019 (36 months)
Type of document: National Report
Delivery date: Month 19
Dissemination level: Public
Page 153
ExecutiveSummary
LifeLongLearning(LLL)policiesacrossEuropehavebeenrepeatedlydescribedashighlyfrag-
mentedandoftenconflictingintheirobjectivesinrelationtotheirtargetgroupsandmeansof
implementation. Although aiming to improve economic growth and social inclusion for young
adults, theymightproduceunintended effectswhen they arenotwell suited to thehighlydi-
versetargetgroups.InparticularregardingthehighfragmentationofLLLpoliciesdifferentef-
fectsindifferentcontextscanbeobserved,whichraisesthequestionastotheirfitnessofthese
policiestothetargetedgroups.
TheprojectYOUNG_ADULLLTaimsat identifyingnecessaryparametersforfuturedeci-
sion-makingsupportsystemsbyunderstandingLLLpoliciesforyoungadultsintheirinterplay
between economy, society, labourmarket and education and training systems at regional and
local levels, including discussing issues of fragmentation and discrepancies affecting young
adults’lifecourse.Thus,theobjectivesoftheprojectare:
1. TounderstandtherelationshipandcomplementarityofLLLpoliciesintermsoforienta-tionsandobjectives to theirspecific targetgroups including(intendedandunintendedeffects);
2. Toenquires intopolicies’ fitandpotentials fromtheperspectiveoftheyoungadultstoexplorehiddenresourcesofyoungadultsbuildingtheirlifeprojects;
3. ToresearchLLLpoliciesintheirembeddingandinteractionintheregionaleconomy,thelabourmarketandindividuallifeprojectsofyoungadultstoidentifybestpractices.
InthecontextoftheoverallobjectiveofYOUNG_ADULLLT,thissub-study(WP4)focusesonthe
analysisonhowtheregionalcontextshapestheyoungadults’livingconditions.AsLLLpolicies
becomeeffectiveattheregional/locallevel,thesub-studyaimstoprovideinsightsintothedif-
ferentlocalcontextsLLLpoliciesareembeddedinandhowtheseregionalsettingsunderstudy
providedifferentlivingconditionsforyoungadults.Thus,eachregionalcontextcanprovide(or
preclude)specificopportunitiesforyoungadults’lives,leavinguntappedtheplentifulresources
forindividualgrowthandsocialinclusion.Theaimistopayparticularattentiontothestructural
characteristicsof theregions, suchas the infrastructure,educationandworkopportunities, to
describethedifferentsocialrealitiesofyoungpeopleandhowthoserealitiesareconstructedin
statisticaldatacollection.Thisallowsustounderstandhowthecontextcanmediateandinflu-
enceLLLpoliciesineachregion.
The livingconditionsaremostadequatelyanalysedbymeansofquantitativedata.Thus,WP4
contributestothemulti-methodapproachinYOUNG_ADULLLTandfirst, informsabouttheliv-
ingconditionsofyoungadultsandsecond,providescontextualdataforembeddingthequalita-
Page 154
2
tivedatacollectionapproachesinthequalitativeanalysisofyoungadults(WP5)andtheanalysis
oftheskillsupplyanddemandonthelabourmarket(WP6).
ThisnationalBriefingPaper,first,providesanoverviewofthelivingconditionsofyoungadults,
second, explains how relevant statistical sources describe their realities, and, third, identifies
gapsforfurtherdatacollectionforthetwoFunctionalRegionsofGermanyinthisstudy,Rhein-
MainandBremen,bydisentanglingvariousriskprofilesfromthecontexttheyareembeddedin.
In order todescribe andunderstand the local living conditions of young adults aswell as the
limitationsandconstraintsofthegivennational/localstatisticaldatainbothFR,fourmaintasks
wereperformed:
1. Identifyingandcollectingof localdata forcomplementingandenrichingthenationaldatasetsprovidedbyinternationaldatasources.
2. Analysing the living conditionsof young adults and their implicationsby identifyinglocalriskprofilesalongthefollowingdimensions:theeconomic,demographic,educa-tion and training, labour market, social inclusion and participation, and health andwell-being.
3. Assessingthequalityoftheavailablestatisticaldata(availability,classificationofthetargetgroup,etc.)byaddressingcontextspecificdatagaps.
4. Reportandassesstheparticularitiesandconditionsoftheregions,whichcanexacer-bateriskforyoungadultsforbuildingtheirlifeprojects.
In this study, the research object has been conceptualised along the living conditions of
youngadultsintheirregionalsettings(chapter2).Youngadultsareaheterogeneousgroupre-
garding theirsocialrealities, lifeprojectsandperspectivesandthusaredifferentlyaffectedby
structuraldevelopmentsasdifferentregionsprovidedifferingsocio-economicopportunitiesand
limitations.Thisrequiresustodistinguishbetweenheterogeneouscontextstheyareembedded
in,suchasthedemographiccharacteristicsofthepopulation,thestructureoftheeconomy,the
inputsandoutputsoftheeducationandtrainingsystem,thelabourmarket,thematerialliving
conditions and civic participation as citizens in political and social life and, finally, the health
conditionsandindividualwell-being.
Basedonthisconceptualisationthelivingconditionsaredescribedasfollowed:
• First,thelivingconditionsdescriberegionalvariationsofstructuralandsocio-economic
conditions, as the resources on sitemay vary and can enhance risks for young adults
buildingtheir lifeprojects. Indoingso,wedescribe localriskprofilesaccordingtothe
particularitiesandconditionsoftheregions,whichcanproduceand/orenhancevulner-
able situations for young adults. In particular since being a young adult itself implies
vulnerablelifephaseaspivotaldecisionsarebeingmade.
Page 155
3
• Second,datagapsinlocalstatisticalsourcesareassessed,asthedatacollectionforthe
regionalcontextvaries.Comparativesurveysarewidelyusedintheprocessofdescrib-
ing,coordinatingand implementingLLLpolicies foryoungadults,however,oftencon-
structtheirtargetgroupalongtheirindividualdeficitsnotalongstructuraldeficits.
TheresultsofthisBriefingPaperarebasedonsecondaryanalysisusingstatisticaldatacollated
fromnationaladministrativesourcesandcomparativesurveyscompiledbyinternationalorgan-
isationssuchastheEUandtheOECDsuchasEU-SILC,Eurostat.Thedataprovidedbyinterna-
tionalsurveyischallenging,astheregionaldataclassificationdoesnotalwayscovertheselected
twoFunctionalRegionsRhein-MainandBremen.Asthedataisaggregatedalongterritorialad-
ministrative responsibilities, the so-called Nomenclature des Unités Territoriales Statistiques
(NUTS),itdiffersfromtheprojects’adoptedconceptoffunctionalregion.Inordertoavoidover-
lapsofthedataunitswithotherregionsnotincludedinourconceptualization,onlythesmallest
NUTS2levelperFunctionalRegionwasused.Asthoseunitsarealotsmallerthanthetwore-
gions,wetakelossofdataintoaccount,however,theyrepresenttheirmetropolitancore.
The living conditionsof youngpeople (chapter 3)are described along the following six di-
mensions:(1)demographiccharacteristicsofthepopulationanditssubgroups;(2)structureof
theeconomy, (3) inputsandoutputsof theeducationsystem; (4) labourmarketsituation; (5)
redistributionandsocialinclusion,and(6)healthconditionsandindividualwell-being.
Themainresultsareasfollowed:
• Demographic structures: Overall, the German society is undergoing demographic
changesduetoanagingsocietyandan inflowofmigrants.However, thegrowthof the
tworegionsdiffersimmensely,astheFRRhein-Mainisconstantlygrowingduetowork-
erinflow,whereasthepopulationinFRBremenisshrinking.Therealsoseemstobean
interlinkagebetween labourmarketpossibilitiesandfamilyplanning:While inFRBre-
menyoungadults aremore likely tobe responsible at a youngage for children, inter-
rupting training andwork in early career stages, in theFRFrankfurt, especially in the
metropolitancore,youngpeoplearemorepronetopostponinglifeprojectsoffamilyand
ownchildren.Thedatashowsthattoday’syoungadultsgrowupunderdifferentcircum-
stancesanddealwithdifferentlimitations(highlivingcosts,uncertaincareerpath,pro-
longededucationaltrajectories,etc.),whichhindersthemfrommovingoutoftheirpar-
ents’homeandachievingfinanciallyindependentlives.Specifically,youngadultsunder
25–whoarerecipientsofwelfarebenefits(HarzIV)–arefurtherpreventedfromgain-
ingautonomybythelegalregulationsofsocialprogramsandlabourmarketpolicies.
• Structureoftheeconomy:Wealthandeconomicproductivityisunevenlydistributedin
the researched locales:While the core of both regions is ratherwealthy, its periphery
Page 156
4
hardlyprofitsfromtheeconomicturnover.Atthesametime,thehighlivingcostsinthe
coreareashinderyoungadults fromlivingandworkinthemoreprofitablecoreareas.
Asaresult,amismatchofeconomicopportunitiesandfinanciallimitationsarises,espe-
ciallyconcerningyoungadultslivinginFRRhein-Main.Simultaneously,theregionsface
structuralchangescreatingrisksforcareerpaths,particularlyaffectingyoungadults in
FRBremen.While traditionallydominantsectorsareon thedecline (suchas logistics),
other low-wage sectorsaregrowing,which could lead toa rethinkingof youngadults’
careerchoices:insteadofinvestingtimeinalow-paidapprenticeshipwithprospectsofa
low-paidjobintheservicesectoritcouldleadthemdirectlyintothelabourmarket.
• Educationsystem:TheGermaneducationsystemischaracterisedbyatightcouplingof
certificatesandoccupationalbiographies.Withtheincreasingtrendtowardsacademisa-
tion,youngadultsfaceaprolongationofformaleducation.However,thisfollowsapecu-
liarinstitutionalfragmentationduetothemulti-tieredschoolsystemwhichcaterstola-
bourmarketswithsubstantiallydifferentneeds(forinstanceasindicatedbyaprevalent
discourseaboutanallegedskilledworkshortage(Fachkräftemangel):Although40%in
theFRRhein-Mainand30%intheFRBremenhaveanAbitur,whichqualifiesthemfor
the university, they are trained as Fachkräfte leading to a competitionwith graduates
from other school tracks. The opportunities for education, and thus occupation, are
largelydeterminedbytheregioninwhichtheyoungadultsgrowup:Growingupinthe
neighbouringpartsofFrankfurtamMainasforinstancethecityofOffenbachorAschaf-
fenburg(theBavarianpartof theFR)or intheruralareasofFRBremenexponentially
increases the odds of achieving at most the lower secondary education certificate
(Hauptschule).Youngadultslivingthereareespeciallyatriskofexclusion,asthisschool
track is continuously reduced in Germany thus also diminishing their chances in the
transitionintothelabourmarket.
• Labour market: Although youth unemployment rates are under the EU average, for
youngadultslivingintheFRBrementheriskishigherthanintheFRRhein-Main.Par-
ticular regionaldifferences in contrasting labourmarketspromoteand foster theneed
for specific jobs as consequence of the regional structural changes. Especially the FR
Bremenhasahighlydynamicandcontrastinglabourmarket,howeverstilloffersalarge
numberofjobsinproductionplants.Asaresult,thelabourmarketsarehighlypolarised,
with focus on high and low skilled workers constantly reducing the medium skilled
workers. In contrast, theFRRhein-Mainoffers abroadervarietyof jobs in finance, air
transportation, service and media, however, attract workers all over Germany and
worldwidewhocompetewith thepotentialworkersonsite.ParticularlyasbothFunc-
Page 157
5
tional Regions attract high skilledworker in the core spreading the remaining skilled
jobsinitsperipherycausingprecarioussituationsforNEETsandearlyschoolleavers.
• Redistributionandsocialinclusion:Beingatriskofsocialexclusionandpovertyvaries
remarkablywithinandacrossbothFunctionalRegions.Livinginthecoreofbothregions
enhancestheriskofreceivingbenefits for longterm-unemployment.However, therisk
varieswiththeregions.Forexample,thechancesforachildreceivingsocialtransfers–
anoften-usedpoverty indicator–in thecitiesBremerhaven,Delmenhorst (FRBremen)
orOffenbach(FRRhein-Main)arethreetimeshigherthaninthecitiesCloppenburg,Os-
terholz(FRBremen),thecityofFulda(FRRhein-Main).Thus,theregionitselfseemsto
beastrongpredictorofpoverty,forcingyoungadultstobemobile.
• Healthandwell-beingconditions:Theabove-mentionedpovertyriskprofilesaresimi-
larintermsofhealth,asgrowingupinpoorfamiliesleadstoadecreasedhealthstatus.
Thisriskrisesforyoungadultslivinginmoreruralareas,astheaccesstohealthcareis
limited.Asdetailedlocaldataismissing,weconcludedbasedondataonpovertyandun-
employment,thatthehealthriskisalsohighinthecitiesofBremerhavenandWilhelms-
haven(bothFRBremen)andWormsandOffenbach(bothFRRhein-Main).
Theassessmentofthedataquality(chapter4)providesanoverviewofthepossibilitiesand
limitationsof theavailabledata fordescribing the livingconditionsofyoungadults.Statistical
dataisoftenabaseforpoliciesprocessesconcerningyoungadults.Therefore,theimplementa-
tionandmatchingofLLLpolicesisalsoaquestionoftheinformationonwhichpolicy-makingis
based.Inordertoachievethisobjectivetwomaintaskswereperformed:
1. Descriptionofdatagapsatnationalandlocallevelwhicharecontextspecific,and
2. Assessingthelimitationsandconstraintsoftheanalysisinrelationtothecontextspecific
ofthefunctionalregionandourtargetgroup.
Inshort,mostdatabanks(e.g.,EUROSTAT,INKAR,DESTATIS)donotcollectandanalysedataon
theindicatorsusedinourresearchatNUTS2level,whichwouldprovideforamoretailoredand
customizedinformationsource.Forthisreason,ithasbeendifficulttoaccessdatadescribingthe
targetgroupathand;also,dataonyoungpeoples’attitudestowardslabourandpolitical life is
largelymissing on a local level. Finally, available indicators reduce young adults’ information
sourcestoeducationandemployment.
Asaresult,youngadultsaremainlyinvisibleinwithinthestatisticaldatasetsasanindependent
agegroup.Therefore,thequestionarises,howcurrentLLLpoliciesarefittingintoyoungadults’
socialrealitiesasthestatisticalbasisofinformationisnottailoredalongtheneededinformation.
ThechapteronEmergingissues(chapter5)dealswithspecificissuesthatcameupduringthe
analysisandarerelevantforthecontextoftheprojectandprovidesconcludingremarks:
Page 158
6
1. Wecanobserveadivergencebetweenthedataqualityandavailabilityonnationaland in-
ternationallevel,especiallyregardinglocaldata,theageofthetargetgroupaswellashealth
indicators.
2. Althoughtheroleofthefamilyisrelevantfortheyoungadultslivingconditionsandsteered
bytheGermanwelfaresystem(principleofsubsidiarity),theircontributionisratherinvisi-
bleinthedatasets.
Inconclusion,statisticaldataavailableonthelivingconditionsofGermanyoungadultsismainly
collectedatnationallevelandusuallyrestrictedtoeducationandemploymentindicators,gloss-
ingoverothercrucialaspectsof their life courses.Against thisbackground,basedon thedata
reviewed the German context can be described as an employment-centred transition regime
whereyoungadults’autonomyischaracterisedbya low levelofstatesupportbuthigh family
support.Therefore,youngadults’citizenshipcanbedescribedasa‘monitoredcitizenship’,with
the overall aim to expedite their transition intowork along highly institutionalised education
andtrainingsystems.
Page 159
Contents1. Introduction....................................................................................................................................................................................8
2. Methodologyanddescriptionofthedatacollectedatlocallevel.........................................................................10
3. Findings..........................................................................................................................................................................................15
3.1 Demographicstructure.................................................................................................................................................15
3.2 StateoftheEconomy.....................................................................................................................................................20
3.3 Educationsystem............................................................................................................................................................24
3.4 Labourmarket..................................................................................................................................................................30
3.5 Redistributionandsocialinclusion.........................................................................................................................34
3.6 Healthandwell-beingconditions.............................................................................................................................38
4. Qualitydataassessment..........................................................................................................................................................41
5. Emergingissues..........................................................................................................................................................................44
6. References.....................................................................................................................................................................................46
ListofFigures
Figure1FunctionalRegionsinGermany...................................................................................................................................12Figure2DifferentFormsofRegions.............................................................................................................................................13Figure3Cruderateofnetmigration(1per1000),fertilityrateandolddependencyratefrom2005to2015,NUTS2Level..............................................................................................................................................................................17Figure4Rateofyoungadults(20-29)livingwiththeirparentsbygenderfrom2006to2013;nationalLevel............................................................................................................................................................................................................18Figure5GDPineuroperinhabitantsPPSandlabourproductivity(rightax,EU=100),Germany,BremenandDarmstadt,NUTS2-Level,2006-2015................................................................................................................................21Figure6Shareofstudentsintertiaryeducation(20-24)from2005to2012,NUTS2,%...................................26Figure7ComparisonoftheISCED(0-8)educationlevels(25-64)of2005and2014,NUTS2level,%......27Figure8Tertiaryeducationattainment(ISCED5-8)(30-34)from2005to2014NUTS2Level,%...............28Figure9NEETrate(15-24)andearlyschoolleavingrate(18-24),from2005-2015NUTS2-Level,%........29Figure10:youthemploymentandunemploymentratesforyoungpeople(15-24),EU-27,Germany,BremenandDarmstadtonNUTS2-Level,2005-2015.........................................................................................................31Figure11:GINIindexbeforeandaftertransfers,disposableincomeinthehouseholdsinPPS(rightax),EU-27,Germany,NUTS2LevelBremenandDarmstadt,2005-2015............................................................................36Figure12Highsatisfactioninvariouslifedomains,age25-34,EU-28andGermany,2013...............................40
ListofTables
Table1OverviewonthedatacollationforthetwoFunctionalRegionsRhein-MainandBremen..................14Table2SizeofenterprisesinGermanyandEU-27from2010to2014,%.................................................................22
Page 160
8
1. Introduction
LifeLongLearning(LLL)policieshavedifferentandoften-competingobjectivesaffectingyoung
adults’lifecourses.AsLLLpoliciesunfoldonthenationallevel,however,playoutdifferentlyin
localcontexts,theyprovidedistinctopportunitiesorconstraintsinyoungadults’livesaffecting
their social realities. Local contexts are important as they shape their living conditions, hence
varyandaresociallyconstructed(cf.Bartlett&Vavrus,2017,p.14):First,regionalsettingsvary,
asstructuralcharacteristics(e.g.infrastructure,educationalandworkingopportunitiesetc.)are
notevenlydistributedwithinonecountry. Second, regional settingsare constructedalong the
“social interactions,politicalprocesses, andeconomicdevelopments” (ibid.) shaping the living
conditions ina specificway.Thus,describing thestructural settingshighlights towhatextend
andhowtheselivingconditionsofyoungadultsareintercededandinfluencedbyLLLpolicies.
InthecontextoftheoverallobjectiveofYOUNG_ADULLLT,thissub-study(WP4)focuses
onthequantitativeanalysisofregionalcontextshapingtheyoungadults’livingconditionsinthe
interplaywithLLLpoliciesatmacro,mesoandlocallevel,whichsupportorhindergrowthand
social inclusion.AsLLLpoliciesbecomeeffectiveattheregional/local level,thesub-studypro-
videsinsightintothedifferentlocalcontextsLLLpoliciesareembeddedin.First,bydescribing
thedifferentlivingconditionsforyoungadultsintheFunctionalRegions(FR)understudyand,
second,byassessinghowthespecificitiesofnationaldatacollectionitselfcreatesadescription
of young adults living conditions (Functional Regions, cf. Kotthoff et al. 2017; Weiler et al.
2017a).Thisallowstoassessthepolicies’fitandpotentialsintheregionalcontextsbydescrib-
ingthetensionbetweenthesocialrealitiesandtheofficialdescriptionofyoungadults.
Inordertodoso,thisBriefingPaperidentifieslocalriskprofilesdescribingthestructur-
al implications on young adults living conditions as different regions have different risks for
theiryoungadultsliving,learningandworkingthere,andthus,cancreatevulnerablesituations
forthem.Growingupinaspecificregioncanbemake-or-breakforyoungadultsincreatingtheir
lifecourseassomeregionsmakeiteasiertocreate‘successful’lifeprojectsthanothersdo.The
analysisofregionalriskprofileshastwoaims:First, toanalysethesocio-economicparticulari-
tiesofthelivingconditionsintheregions,whichcanexacerbateriskforyoungadultsbuilding
their lifeprojects.Second, thespecificitiesofdatacollection,ascomparativesurveysonstruc-
turaldataiswidelyusedasaninformationsystemforLLLpoliciesthemselves.Asstatisticsare
usedtosteerprocessesofdefinition,coordinationandimplementationofLLLpoliciesforyoung
adults,thedataitselfprovidesa ‘data-lens’onyoungadultsshapingthepolicyprocesses,yet–
notnecessarilymatchingtheirsocialrealities.Anassessmentofdatabasesisprovidedtoidentify
datagapsthatshouldandcouldbefilledinordertoinformLLLpolicies,astheirimplementation
isnotonlyaquestionofpolicycoordinationandmatchingofthedifferentcontextsandinterests,
butratheraquestionoftheassessmentoftheinformationonwhichpolicy-makingisbasedon.
Page 161
9
Againstthisbackground,thesub-studyprovidesaquantitativeanalysisofyoungadults’
socialandlivingconditions(WP4)whichfocusesontheregional/localsocio-economicparticu-
laritiesoftheregionsunderstudy.Thesewerereviewedandmappedintheprevioussub-study
(WP3)(cf.Kotthoffetal.,2017)andthisnationalBriefingPaperprovidesashortoverviewofthe
livingconditionsofyoungadultsinGermanyanditstwoselectedregions,Rhein-MainandBre-
men(cf.Bittlingmayeretal.,2016a).Thequantitativeanalysis identifiesriskprofilesofyoung
adultsintheirspecificcontextandgathersinformationforembeddingthedataconductedinthe
qualitativeanalysiswithyoungadults(WP5)andtheanalysisoftheskillsupplyanddemandon
thelabourmarket(WP6).Theanalysisfollowsthreeapproaches:First,thissub-studyconducts
deskresearchonregionalriskprofilesasasecondaryanalysisofquantitativedataatnational
and local level. Second, analysing the regional living conditions of young adults by identifying
localriskprofiles.Third,assessingthequalityoftheavailablestatisticaldata(availability,classi-
ficationofthetargetgroup,etc.)byaddressingcontextspecificdatagaps.Theanalysisuseddif-
ferentdatasourcesonnational(e.g.Eurostat)andlocallevel(e.g.GermanMicrocensus).
This national Briefing Paper is divided into three parts: First, a short overviewon the
methodsoflocaldatacollectionincludingadescriptionofmismatchesofthedataclassification
used in common international databases with the German regional conceptualisation of the
FunctionalRegions.Second,ananalysisofthelivingconditionsalongthefollowingdimensions:
theeconomic,demographic,educationandtraining,labourmarket,socialinclusionandpartici-
pationaswellashealthandwell-being.Inouranalysis,weareabletoidentifyseveralanddif-
ferentriskfactorsforyoungadults,whicharecloselylinkedto:
• first,theavailablepersonalresourcesintermsofthesocialbackground,thesocialposi-
tion,thepersonallabourmarketandeducationalstatus,and
• second, regional dimensions like the housing situation and the status of the regional
apartmentmarket, theaccesstohealthcare, theregionalshareofpovertyorthesitua-
tionoftheregionallabourmarket.
TheGermancaseingeneralandthetwoFunctionalRegionsBremenandRhein-Maininparticu-
larclearlyshowthatthesedimensionsareinfluencedbysocialpolicy.Furthermore,theavaila-
bledatarevealsthat,dependingontheindicator,astableshareof10-30%ofthepopulationis
notwellsociallyintegratedanddependentonsocialtransfers.
Subsequently to the findings, thedataassessmentalongtheavailability,representation
andqualityofthedataisdescribed.Finally,thereportconcludeswithemergingissues.
Thefollowingsub-chapterprovidesanoverviewonthedatagatheringprocess.
Page 162
10
2. Methodologyanddescriptionofthedatacollectedatlocallevel
Basedontheoveralltheoreticalperspectivesoftheproject(cf.Weileretal.,2017a)theresearch
objecthasbeenconceptualisedalongthelivingconditionsofyoungadultsintheirregionalset-
tings.Asyoungadultsareheterogeneousgroupsregardingtheirlivingconditions,suchassocio-
economicstratification,theirlifeprojectsandperspectives(cf.Weileretal.,2016)theyaredif-
ferently affected by structural developments. Each setting can provide (or preclude) specific
opportunities foryoungadults’ lives, asLLLpolicies fitdifferently in the local contexts,which
canrevealhiddenresourcesorhindranceforindividualgrowthandsocialinclusion.Therefore,
growingupinaspecificregioncanbemake-or-breakforyoungadults,especiallyastheyhave
differentneeds, in creating their life courseas someregionsmake it easier to create their life
projectsthanothersdo.Againstthisbackground,theanalysisofthesocio-economiclivingcondi-
tionsallowstoassesstheparticularitiesandconditionsoftheregions,whichcanexacerbaterisk
foryoungadultsbuildingtheirlifeprojects.
Thephaseofbeingayoungadultisakeyperiodoftransitionaspivotaldecisionsarebe-
ingmade.Somemightpursuefurthereducationandtrainingorstarttheirworkingcareers,en-
gagewithsociety,develophealthhabitsandcreatetheirlivecourse(cf.Wutzkowsky&Weiler,
2016).However,beinginbetweenyouthandadulthoodcanalsoincreasevulnerabilityandrisk:
Poverty,migration,lackofjobopportunities,accesstohealthcareetc.,canproduceand/oren-
hancevulnerablesituationsforyoungadults,especiallybytheregionalcontext(cf.Weileretal.,
2016).Astheresourcesonsitemayvarysodoestheriskforyoungadultslivinginthoseregions.
Forinstance,alackofworkingopportunitiesinspiteofanextensiveformaleducationcanlead
tolong-termunemployment,thusenhancingvulnerablesituationsandcanevencauseexclusion
ofparticipating in thesociety.ThisaffectsyoungadultsalreadyconstructedbyLLLpoliciesas
being in vulnerable positions even more, as they differ from a notion of a standardized life
course.ThetargetgroupsofLLLpoliciesaremainlydescribedalongtheirdeficits,forinstancein
needforfinancialsupport,havinglefteducationtooearlyorfacinginequalities(cf.Bittlingmayer
etal.,2016b;Wutzkowsky&Weiler,2016).Asaresult,beingatriskcanputyoungadults ina
disadvantageincreatingtheir lifecourseandbeingconstructedaspotentiallybeingatrisk,can
exacerbate inequalities and hinder social inclusion. LLL polices canmake a difference for the
young adults by levelling out structural riskswhen they take the construction of their target
groupsintoaccountandpayattentiontothepoliciesfitwiththeregionalpossibilitiesandlimi-
tations.Thus,thisBriefingPaperofregionalriskprofilesinformsfuturepolicydecision-making.
Departingfromthisconceptualisation,thereportprovidesregionalriskprofilesofyoung
adultsalongsocial,regional,genderandethnicbasedinequalitiescreatinglifeopportunitiesor
obstaclesandmanifesting ineducationalandschool-to-work transitions.Thismeans todistin-
guishbetweendifferentcontextstheyareembeddedinsuchasthedemography,thestructureof
theeconomy, the inputsandoutputsof theeducationand training system, the labourmarket,
Page 163
11
thematerial livingconditionsandcivicparticipation inpoliticalandsocial lifeand, finally, the
health conditions and individual well-being. As this transition is steered by LLL policies, the
skillsandformal/non-formalqualificationsofyoungadultsintheselectedregionalcontextsare
central,especiallytheeffectsofeducationalattainmentqualificationinrelationtotheentrance
tothelabourmarket.
TherisksprofilesareinformedbystatisticaldatawhicharealsowidelyusedinLLLpoli-
cies processes as part of thedescription, coordination and implementationof LLLpolicies for
youngadults.Thisleadstothequestionwhichkindofdataisavailableandhowdoesitconstruct
thetargetgroupaspotentiallybeingatrisk,suchasearlyschool leavers(ESL)andyoungper-
sons‘NotinEducation,EmploymentorTraining’(NEET).TheimplementationofLLLpoliciesis
notonlyaquestionofpolicycoordinationandmatchingofthedifferentcontextsandinterests,
butratheraquestionofassessingtheinformationonwhichthepolicy-makingisbasedon.1Chal-
lengesarise,asthestatisticaldataisnotalwaysavailabletoprovidetherequiredinformationor,
theavailabledataiscomparableacrosstheEU,yethasregionalgaps.Thiscancausedifficulties
forpolicy-makingprocesses,asitisnotalwaysclearwhatdatacouldtellaboutthelivingcondi-
tions.Therefore,wealsocriticallyanalyse theperspectiveon thedatagatheringprocess(data
availability,protection,etc.),dataoperationalisation(agegroups,targetgroups,etc.)aswellas
overlappinglevelofgovernance(researchunit,administrativeunit,etc.)asa(re)constructionof
youngadultslivingconditions.Foradetailedassessmentofthequalityofdatapleaseseechap-
ter4.
Forthesecondaryanalysisofregionalriskprofiles,acoresetofdata(Eurostat,UNESCO,
OECDetc.)wasprovided.However, thesedatabasesaggregate thedata in regionalunitsalong
territorial administrative responsibilities, the so-called Nomenclature des unités territoriales
statistiques(NUTS),aimingtoprovidecomparabledatabasedonhierarchicalstructures,which
differsfromtheprojectsconceptregionalunits(cf.Parreiraetal.,2017b,p.10ff.).Thisischal-
lenginginthecaseofthetwoGermanFRsastheprovidedregionaldataclassificationdoesnot
fitourcase(seeFig.1below):EitherwehavetoassembleeachFRalongseveralNUTSunitsor,
we only use the smallestNUTS 2,which is a lot smaller than our FRs.The former implies an
overlap with other regions not included in our conceptualization, which sustainably distorts
datavaluesandwouldgeneratedifferentriskprofiles.Choosingasmallerunittakeslossofdata
intoaccount,however,itrepresentstheFRs’core:fortheFRBrementheNUTS2levelunit‘Bre-
men’ (including thecityofBremenandBremerhaven)andrespectively for theFRRhein-Main
theunit‘Darmstadt’wasused(includingthecitiesDarmstadt,Frankfurta.M.,Offenbacha.M.and
Wiesbadenandtheirsurroundings).
1InYOUNG_ADULLLT,twosub-studiesfocusonthecoordinationandmatchingofthecontextandtheinterests.First,aqualitativesub-study(WP5)withperspectiveontheyoungadults’perceptionandexpectationsandsecond,acom-parativeanalysis(WP6)withperspectiveonthepolicycoordinationoflocalactors(cf.Weileretal.,2017b).
Page 164
12
Figure1FunctionalRegionsinGermany
Page 165
13
Source:Ownelaboration
AsthedatacollectedwithEurostat,UNESCOandOECDisavailablemostlyonNUTS2andrarely
onNUTS3,thedataisrepresentedinadministrativeunitsandthushaslimiteduseforthede-
scribingthetwoFRs.Thedifferentconceptualisationofregionseithercollectdataalongpoliti-
cal,social,andeconomicalunits(FunctionalRegion)oralong jurisdictionalrights(administra-
tiveunit)(seeFigure2below).
Figure2DifferentFormsofRegions
Source:translatedfromEckey,Schwengler&Türck(2007,p.7)
However,toensurethecomparabilityintheproject,thefiguresintheBriefingPaperweredraft-
edonNUTS2basis,andthencomplementedwithlocaldataonthedistrictlevel.Thus,thelocal
datareconstructsthelandscapeofourresearchunitandrepresentseachFunctionalRegionsas
closeaspossible to the local level alongdistricts and cities (seeTable1below).Thedifferent
dataunitsarelabelledasfollowedinthesubsequentdataanalysis:Whenthedatareferstothe
NUTS 2 level, we use the label ‘NUTS 2 level Bremen’ respectively ‘NUTS 2 level Darmstadt’;
Page 166
14
when the data is collected along the local district level and represents the spatial unit of our
FunctionalRegions,weusethelabel‘FRBremen’respectively‘FRRhein-Main.
Onthenationallevel,themainsourceforthelocaldatacollectionareregisters.Especial-
lytheinteractiveonline-atlasoftheFederalInstituteforResearchonBuilding,UrbanAffairsand
Spatial Development (INKAR, Online-Atlas des Bundesinstituts für Bau-, Stadt- und
Raumforschung)2wasused,asitnotonlycollectsdatafromothernationalregistersinGermany,
butalsoprovidesdatathatencompassesmetropolitancitiesaswellasmunicipalitydistricts.
Table 1Overviewon the data collation for the two FunctionalRegionsRhein-Main andBremen
Administrativecitiesanddistricts
FRRhein-Main FRBremen
Cities Frankfurta.M. BremenOffenbacha.M. BremerhavenWiesbaden DelmenhorstDarmstadt OldenburgMainz WilhelmshavenWorms Aschaffenburg
Districts Bergstraße AmmerlandDarmstadt-Dieburg CloppenburgGroß-Gerau CuxhavenHochtaunuskreis DiepholzMain-Kinzig-Kreis FrieslandMain-Taunus-Kreis OldenburgOdenwaldkreis OsnabrückOffenbach OsterholzRheingau-Taunus-Kreis VechtaWetteraukreis VerdenGießen WesermarschLimburg-Weilburg VogelsbergkreisFuldaAlzey-WormsMainz-BingenAschaffenburgMiltenberg
Besidesthespatialrestrictionoftheresearchunits,dataforadditionalindicatorshadtobegath-
ered inorder todescribe theGermancontext, as risk ismainlyunderstoodasa financial risk,
suchaspoverty,itsinterrelationtoalackofskills,suchasliteracy(cf.AutorengruppeBildungs-
berichterstattung,2016,p.6,p.17)orasahealthrisk(cf.RobertKoch-Institut,2016).However,
additionalsourcesofriskareimportantaswell:Forexample,duetothesovereigntyoftheLän-
2Availableunder:http://www.inkar.de/Default[lastaccess:10July2017]
Page 167
15
der in Germany3, the educational system is characterised by different school tracks providing
differentopportunitiesforthetransitionintowork.Inturn,findingworkishighlylinkedtothe
qualificationgained in theeducational systemas the labourmarket couplesqualificationwith
occupation,stressingtherelevanceofcertificationsoverskills.Therefore,thedescriptionofre-
gionalriskprofileshastofocusontheregionalembodimentofinstitutionsasdifferentregions
providedifferenteducationalsystemsandlabourmarketopportunities(cf.Weileretal.,2017b).
Both,thedatacollectiononnationalandregionallevelconformstoethicalstandardsand
dataprotectionregulations.Thetargetgroupforthedatacollectionareyoungadultsintheage
of 18 to29, howeverdifferent age rangeswere consideredwhen suitable as thedata sources
complybothwithnationalandEuropeanlegislation.Therefore,datacollectionbelowandover
theagerangeof18and29complieswithStandardsofEthicalConduct(cf.ParreiradoAmaralet
al.,2017a).
Thefollowingsub-chapterprovidesthefindingsthelivingconditionsofyoungadultsinthetwo
FunctionalRegions.
3. Findings
Thefollowingsub-chaptersdescribethecontextuallivingconditionsofyoungpeopleinthetwo
FunctionalRegionsRhein-Main andBremenalong the followingdimensions: (1) demographic
characteristicsofthepopulationanditssubgroups;(2)structureoftheeconomy,(3)inputsand
outputsoftheeducationsystem;(4)labourmarketsituation;(5)redistributionandsocialinclu-
sion,and(6)healthconditionsandindividualwell-being.
3.1 Demographicstructure
GermanyisthefourthlargestcountryintheEUwith357,000km2.BothFRsvarygeographically
and structurally, with the FR Rhein-Main being the larger region, both geographically and in
termsofpopulationdensity,spreadingacrossseveralmainlocationsandcities.Whilethesmall-
er FR Bremen covers an area of 3.8% of Germany (13.750,97 km2)with 3.3% of the German
population (approx. 2.7million inhabitants), the FR Rhein-Main covers a larger area of 4.1%
(14.755,3km2)with6.5%of theGermanpopulation(approx.5.3million inhabitants)(Statisti-
scheÄmterdesBundesundderLänder,Deutschland,2017;Zensus,2011).Thecontrastingpop-
ulationstructureisreflectedbythepopulationdensity:whileintheFRBremen1.413,16livein
eachkm2,theamountalmostdoublesfortheFRRhein-Mainwith2.440,96inhabitantsperkm2.
However,thepopulationinRhein-Mainisspreadinitscoreoverfivecitieswithatotalof716,96
3InGermany,thepolicyisorganizeddifferentlyinthe16federalstatesresultingindifferentjurisdictions,struc-tures,andlegislationsaffectingeducationandtraining,welfareandsetsdifferentframeworksforpolicymaking(cf.Parreiraetal.,2017b,p.36f.).
Page 168
16
km2–Offenbacha.M.,Frankfurta.M.,Mainz,DarmstadtandWiesbaden–whileinFRBrementhe
populationismainlylocatedinthethreecitiesBremen,BremerhavenandDelmenhorst,cover-
ingtogetheranareaof482,2km2(INKAR,2017).4ThedifferenceswithinBremencorresponds
totheexpecteddifferencebetweenurbanandruralareasinGermany–asmallcorewithsparse-
lypopulatedagricultural surroundings–while in theFRRhein-Main the core is formedby its
tightlykniturbanmetropolitanareawithanintensivesocialmobility.
Currentpopulationdevelopmentshowsanoverallpopulationdecreaseofanoldergrow-
ingsociety,whichdemographicallybenefitsfromthemigrantinflow(seeFig.3below).InGer-
many,thepopulationdecreasedfrom2005to2014from82.5millionto80.8millioninhabitants,
adevelopmentmirroredintheFRBremen,howevernotintheFRRhein-Main.WhileDarmstadt5
iscontinuouslyexpandingastheirinhabitantsaregrowingfrom3.77to3.82million,Bremen6is
shrinkingfrom663thousandto657thousandinhabitants(NUTS2Level).Itseemsthattheur-
banmetropolitan area is growing faster by attractingmore inhabitants than themore urban-
ruralareaofFRBremen.
Inthelastyears,migrationhasbecomeanimportantaspectofthedevelopmentofthepopula-
tion,affectingbothFunctionalRegionsevenly,asthecruderateofnetmigrationincreasedfrom
1per1,000 inhabitants in2005 to4.9% in2009, and in2015 to14.3% (seeFig. below).One
reasonforthisdevelopmentistheinflowfromcrisisregions,inGermanythesocalled,“refugee
crisis”. Migrants live mostly in the metropolitan cities, notably Frankfurt a.M. with 20.1%,133,530 of all its inhabitants, opposed to an overall smaller share in FRBremenwith 82,910
migrants;however, theystillconstitute15.4%of itsoverallpopulation(StatistischeÄmterdes
Bundes und der Länder, Deutschland, 2017; Zensus, 2011). The naturalization ratesmirror a
similar,yetratherunevendistributedinflowasFRRhein-Mainfacesahigherinflow(in2015:FR
Rhein-Main11,545personsandFRBremen3,529persons).However,thisaffectsthemetropoli-
tancoreFrankfurta.M.with22%toalesserextentthanthecityofBremenwith43.5%(ibid.).7
Thiscouldbedue to thehigh livingcosts inFrankfurta.M.,as theaveragerentingprice is14
EUR/m2, one of the highest inGermany, especially compared to the city of Bremenwith 9,06
EUR/m2andtheGermanaverage(7,97EUR/m2).8
4 The population in the 5 largest cities in the FR Rhein-Main area distributed as followed: Offenbach am Main:5.499,50;FrankfurtamMain:4.961,90;Mainz:4.206,20;Darmstadt:3.556,30;Wiesbaden:3.437,70.Thepopulationinthe3largestcitiesintheFRBremendistributesasfollowed:Bremen:2.878,30;Bremerhaven:2.499,60;Delmen-horst:2.486,20)(INKAR2017).
5Theadministrativeunit ‘Darmstadt’ includesthecitiesDarmstadt,Frankfurta.M.,OffenbachamMain,Wiesbadenanditssurroundingareas.
6IncludingthecityofBremenandBremerhaven.
7 For both regions, themain immigration region is Europe, followed by Asia: In 2015, in the FR Bremen 54.29%(1,916)fromEuropeand30.32%(1,070)becamenaturalized,whileintheFRRhein-Main56.65%(6,540)fromEu-ropeand24.99%(2,885)fromAsiabecamenaturalized(ibid.).
8ForBremen:https://www.wohnungsboerse.net/mietspiegel-Bremen/3193ForFrankfurta.M.:https://www.wohnungsboerse.net/mietspiegel-Frankfurt/3242[lastaccess:20Aug.2017].
Page 169
17
Figure3Cruderateofnetmigration(1per1000),fertilityrateandolddependencyratefrom2005to2015,NUTS2Level
Source:EurostatDemographyandmigrationdatabase
The high living costs also restrict young people from creating a financially and socially a-self
determinedlifeasthehighcostspreventthemfromcompetingonthehousingmarket.Instead,
therateofyoungadultslivingwiththeirparentsrapidlyincreasedoverthelastdecade.In2013,
this rate was 50.1% (20-29 years), which is under the European average (55.4%), however,
highly stable over time (2005: 45.9%; see Fig. 4 below). The data shows that today’s young
adults grow up under different circumstances and deal with different limitations (high living
costs,uncertaincareerpath,prolongededucational trajectories,etc.),whichhinder them from
moving out of their parents’ home and achieving financially independent lives. Specifically,
youngadultsunder25–whoarerecipientsofwelfarebenefits(HarzIV)–arefurtherprevented
fromgainingautonomybythe legalregulationsofsocialprogramsandlabourmarketpolicies.
Since 2005, young people are hindered frommoving out of their parents’ home without the
agreementoftheJobcenteriftheyortheirparentsreceivewelfarebenefits(cf.SGBII-§22Abs.
5).Thechangedhouseholdstructuresreflectgenderdifferences,asmoreyoungmalesareliving
withtheirparentsasopposedtoyoungfemales.Overahalfofthemalegenerationbetween20
and29is livingathome(2006:57.2%;2013:60.1%)opposedtowomen(2006:32.8%;2013:
39.4%) (EUSILC). Therefore, demographic changes and the risk of social exclusion are closely
interlinkedtosocialandlabourmarketpolicies.
-0.5
0
0.5
1
1.5
2
2.5
3
-5
0
5
10
15
20
25
30
35
2005 2006 2007 2008 2009 2010 2011 2012 2013 2014 2015
Bremenfer4lity Darmstadtfer4lity Germanyfer4lity
Germanymigra4on Bremenmigra4on Darmstadtmigra4on
GermanyOlddependency
Page 170
18
Figure4Rateofyoungadults(20-29)livingwiththeirparentsbygenderfrom2006to2013;nationalLevel
Source:EU-SILCmicrodata
While thenumbersofmigrantsareontherise, the fertilityrate isonlymoderately increasing,
both inGermanyandthe tworegions:While inGermany, from2005to2014, the fertilityrate
increasedfrom1.34to1.47.ItroseintheFRBremenfrom1.47to1.57andintheFRRhein-Main
from1.38to1.47(INKAR,2017),however,stillundertheEU-28averagefrom1.51to1.57(Eu-
rostat). As career choices and founding a family are main biographical decisions for women
(Keddi&Pfeil,1999,p.13)thedifferentopportunitiesfortheircompatibilitybetweenruraland
urban areas becomes obvious. It seems, that the cities rather attract workforce than people
planning families, as the fertility rate is stable on a low value in large cities, such asBremen,
BremerhavenFrankfurta.M.andDarmstadt,however,risesinmoreruralareas,suchasthedis-
trictVerdenintheFRBremen(from1.52to1.73,INKAR,2017).However,thereseemstobean
interlinkagebetweenthestructures,opportunitiesforeducationandworkandthefamilyplan-
ningprocess,aslivinginbigcitiesseemstohaveaneffectonwomentopostponethislifedeci-
sionasthisprovidesdifferentopportunities.Theaverageageofwomenhavingtheirfirstchildis
increasinglypostponingfromtheageof28.7in2005totheageof29.5in2015–adevelopment
slightlyabovetheEU-28averageof28.9in2015(UNIDEMO).9WhileinFRFrankfurtpostponing
motherhood is prominent,most likely due to a prolonging of formal education, in FRBremen
earlymotherhoodunder the age of 20 is observable – the agewheremostly transitions from
9 The data sets for the EU 28 countries are only available from 2013 to 2015. Available under:https://data.europa.eu/euodp/en/data/dataset/aahacCLN1mWh03eaNJSMjA[latestaccess:26Sept.2017].
30
35
40
45
50
55
60
65
2006 2007 2008 2009 2010 2011 2012 2013
EuropeanUnion(27countries) Germany Germanfemale Germanmale
Page 171
19
education intowork takeplace (cf.Goebel,1996,p.144ff.).For instance, inFrankfurta.M. the
motherhoodfromage40to45rosebetween1995-2014from7.4%to17.6%–surpassingthe
Germanaver-ageof4.4%respectively10.9%.Incontrast,duringthe lastdecadeBremerhaven
hadanaverage21.8%ofyoungmothers,doublingtheGermanaverageof10.5%(INKAR,2017).
In the case of Bremen, this could reveal a risk profile that is shaped by socioeconomic disad-
vantagesandloweducationalexpectationsintheirfutureandalowprospectiveonjobopportu-
nitiesasearlymotherhoodcanbeusedasasubstituteforlackofotheropportunities(cf.Wittel-
Fischer,2000,p.111).
Despitethismoderateriseofthefertilityrates,aswellastheriseoflatemotherhood,the
German population is ageing: from 2005 to 2016, the old-dependency rate10 increased from
27.8%to32%andthe lifeexpectancyrosebetween2005to2014from79,4to81,2years–a
developmentmirrored in the twoFunctionalRegions.11However,at thesametimetheyoung-
agedependencyisgoingdowninGermany,from21.6%to20.2%,adevelopmentalsomirrored
bybothFRs.Thus,Germanyfacesdemographicchangesasthepopulationisgettingincreasingly
older,howeverisoverallgrowingthroughanincreasingmigrantinflow.
Regarding a comprehensive perspective on risk factors caused by the demographic
structure,thesituationisambivalentforyoungadults.Ontheonehand,thereareundoubtedly
recentdevelopmentsthatcausestressfulsituationsforyoungadultslikethehighrentsinurban
areasthatcomealongwithaforcedprolongationtolivewiththeparentsortheuncertaintiesof
careerplanningleadingtoapostponementinfamilybuilding.Ontheotherhand,recentpublic
discoursesrenewtheclaim forbetteradulteducationbecauseof the forecasted lackofskilled
workers in thenear futureasaconsequenceofashrinkingpopulation.However, thisambiva-
lence materializes differently in our two regions. While the population of Frankfurt a.M. in-
creased,duetoworkerinflow,thepopulationinBremendecreasedanditsinhabitantspostpone
theirlifeprojectsofhavingownchildren–whichcontainsinitselfmedicalrisks(e.g.stillbirth,
miscarriage,andectopicpregnancy;cf.Stein&Susser,2000).Thelifecourseopportunitiesde-
scribed along the demographic structure shows interlinkages to the economy, which is de-
scribedinthefollowingchapter.
10Theoldold-dependencyrateistheratiobetweenpopulationaged65andovertopopulation15-64(DefinitionbyEurostat).
11FortheadministrativeunitonNUTS2Level ‘Darmstadt’,representingthecoreoftheFRRhein-Main,anincreasefrom26.0%to29.6%canbeobserved,whilethetwounits‘Bremen’and‘Weser-Ems’,representingFRBremen,Raisefrom29.9%to32.2%respectivelyfrom26.7%to30.4%(Eurostat).
Page 172
20
3.2 StateoftheEconomy
InGermanyandbothFRsthestateoftheeconomyisovertheEU-28average;however,thedis-
tributionoftheproductivityandwealthishighlyfragmented(see.Fig.5below).Particularlythe
FRBremenisfacingstructuralchangesduetothere-anddeindustrialisationelevatingthedif-
ferencebetweenitsruralandurbanareas.Itsmaineconomicdriveristhelogisticssectordueto
itsseveralharbours.However,theshipbuildingsectorfacesseverechangesasaconsequenceof
the automation in the harbour industry using progressive systems for operating processes
whichminimize the need ofworkforce. As a result, the number ofwarpings are reduced, alt-
houghsimultaneouslytheexportandimport-orientedtradeandindustries, for instanceitscar
manufacturers, are expanding. Additionally, its more rural areas gain their economic profit
mainly in theagricultural sector.Thus,FRBremen is facedwithachangingprofileof itsmain
industrieswithachangeddemandofworkers(cf.Weileretal.,2017b,p.49f.).Thesefragmenta-
tionsaremirroredbythedistributionsofthehighgrossdomesticproductpercapita(GDP)as
thelabourforceisconcentratedinthecoreoftheregionprofitingfromtheeconomicproductivi-
ty.However,theamountvariesdependingiflocaldataisusedordataonNUTS2level.Bremen’s
GDPonNUTS2levelisapprox.2,500EURabovethenationalaverage(seeFig.5below),while
usingregionaldatarevealstheFRisbelownationalaverage–althoughitslightlyraised inre-
centyears(2006:24,320EURto2014:29,690EUR).Thus, thewealth isunevenlydistributed,
providingfinancialriskforthoselivingandworkinginmoreruralareas.
In contrast, FRRhein-Main, andespecially its corearoundFrankfurt a.M., isoneof the
wealthiestregions inGermany–andmost likely inEurope(cf.Bittlingmayeretal.,2016a). Its
uniqueeconomicdensityonservicesandindustry,duetoitsfinancialdistrict,airport,tradefair
andmedia sector, attracts the settling from large national and international companies. This
resultsinaneconomicallygrowingurbanterritory,howevermainlyinitscorenotinitsperiph-
ery.TheeconomicperformanceoftheFRRhein-Mainisremarkablewith38,830EUR,as itex-
ceedsthenationalaverage(GDP35,900EUR/capita)andletalonethecityofFrankfurta.M.is
with91,300 EUR up to 330%of the EU-28 average (27,600EUR/ capita). The region around
Darmstadt (NUTS 2 level), including the cities Frankfurt a.M., Darmstadt andWiesbaden, are
withcontinuouslyapprox.10,000EURupto130%abovenationalaverage–wideningtheeco-
nomicdisparitiestoitsperipheralregions.Incontrast,thecityofBremenhaswith47,300EUR
thehighestamountintheFRBremen,exceedingtheGermanaverageof130%–however,thisis
notevenhalfoftheamountofthecityofFrankfurta.M.(Euostat,INKAR,2017).12
12AsthedataprovidedbyEurostatusesdifferentresearchunits,whicharesmallerthanourFRs,thedatawascom-pletedbylocaldata,whichshowsoverallthesametrend,howevertheabsolutenumbersvarypositivelyforGermanywith1000EURperinhabitant.ForthiscompletioncalculationfromINKAR(2017)wereusedwhichanalyseGDPinEuroperinhabitantatcurrentmarketpricesusingEurostatRegioDatenbankaswellastheworkinggroup»RegionalAccounts«.
Page 173
21
As a result, these data reveal both, fragmentations between the Functional Regions as
wellaswithinthem:TheeconomicdifferencebetweenbothFRsrevealseconomicdisadvantages
basedontheregionalsettings,mostlikelyresultingfromlabourproductivityinspecificsectors.
Onlyaspecificproportionof labourforcegainsfromthematerialwealthbylivinginaspecific
areaandworkinginaspecificfield.ThematerialwealthofbothFRsisconcentratedinitscore
citiesandwidens thegap to itsperipheral regions, leaving thosebehindwhocannotafford to
liveortoworktheinthesecities(cf.sub-chapters3.1&3.4).
Figure5GDPineuroperinhabitantsPPSandlabourproductivity(rightax,EU=100),Germany,BremenandDarmstadt,NUTS2-Level,2006-2015
Source:EurostatEconomyandfinancedatabase
Although the economic prosperity of both regions is above the EU-28 level, theywere evenly
negativlyaffectedbythefinancialcrisis in2008/2009asboth, theGDPper inhabitantandthe
gross value added rate (GVA), decreased and recovered after 2010: The GDP dropped from
30.600EURto28.700EUR(see.Fig.5)andtheGVAdecreased56.4%to54%(FRBremenfrom
50.3%to48.2%;FRRhein-Mainfrom61.6%to58.6%;cf.INKAR,2017).Thelabourproductivity
measurestheamountofGDPproducedbyanhouroflabourandahighamountmeans,thatthe
economyisabletoproducemoregoodsandservicesforthesameamountofwork;thiswasthe
caseinGermanybeforethefinancialcrisiswithitspeakin2007(127.3%,i.e.,27.3%higherthan
the EU-28 average, counted 100%) and levelling off between 2010 (124.9%) and 2015
(126.1%). The recovery of the labour productivity can also indicate a shift of the labour for-
mationperse,forexampleasautomatedprocessesofworkorspecializationoftheworkforce–
122
123
124
125
126
127
128
129
130
0
5,000
10,000
15,000
20,000
25,000
30,000
35,000
40,000
45,000
50,000
2006 2007 2008 2009 2010 2011 2012 2013 2014 2015
Germanlabourproduc4vity(EU=100) EU28GDP
GermanyGDP BremenGDP
DarmstadtGDP
Page 174
22
especiallyastheGDPisstillgrowinginthesametimespan.Asaresult,theworkforce–especial-
lyyoungadults–eitherarereplacedbynewtechnologiesorareforcedtocompetewithhigher
specializedworkersonthelabourmarket.
Theeconomicstrengthaffectsthetworegionsdifferently,astheshareoftheGDPisnot
closely linked to a specific structure of economic sectors. Especially the rural and agriculture
areas in the FR Bremen, have little economic strength, as this sector contributes remarkably
little to the overall GDP (0.76% compare to 1.8%EU-28 average). Its strength rather derives
from the contributions to the second (industry) and third (services) sectors,which hardly di-
verges from the EU-average (share of industry on GDP for Germany: 29.4%, EU-28 average:
26.46%,WorldBank).However,thesesectorsare,asmentionedabove,locatedinspecificareas
ofeachregionpromotingdisparitiesduetolimitedaccess.
Table2SizeofenterprisesinGermanyandEU-27from2010to2014,%
Sizeofenterprises Total From0to9
personsem-
ployed
From10to
49persons
employed
From50to
249persons
employed
250persons
employedor
more
EU-27in2010 21,801,180 92.45% 6.22% 1.02% 0.19%
Germany2010 n.a.13 89.68% 8.12% 1.88% 0.31%
FRBremen2010 n.a. 88.05% 9.68% 1.98% 0.28%
FRRhein-Main2010 n.a. 90.78% 7.26% 1.66% 0.28%
Germany2012 2,189,737 82.31% 14.68% 2.53% 0.49%
FRBremen2012 n.a. 87.55% 10.02% 2.12% 0.30%
FRRhein-Main2012 n.a. 90.31% 7.65% 1.72% 0.30%
Germany2014 2,497,694 83.57% 13,74% 2.24% 0.44%
Source:EurostatEconomyandfinancedatabase&INKAR2017,owncalculations
ComparedtotheotherEUcountries,theeconomiccrisishadashort-termimpactontheGerman
economyasboththerealestatepricesandthedisposableincomeforhouseholdswasrelatively
stable(cf.sub-chapter3.5).However,astheGermaneconomicstrengthmainlyfromitsexport,
theoverallglobalcrisishadsevereeffectsonitseconomicstrengthderivingfromtheexportof
consumergoods(e.gcars,investments)(cf.Roos,2009,p.392f.).Itseconomicstrengthismainly
producedbyenterpriseswithmorethan250employees(2010EU-27:0.19%,Germany:0.31%)
–allinallaboveEUaverage(seetable2above).Theyproduce68.2%oftheturnoverand52.9%
oftheGVAopposedtoaturnoverof6%bymicro-enterprises,12%oftheGVA(cf.Söllner,2016,
p.3).Asbothregionshavethesameshareoflargeenterprises,theireconomicdifferencesmost
likelyderivefromtheregionaldifferencesalongthesectors.However,duetoalackofregional
data, we can only assume those difference, for instance in the sector of manufacturing
13Nodataavailable.
Page 175
23
(4,112,399 empl./ 1,614,474 EUR) opposed to transportation and storage (1,084,732 empl./
181,210EUR)(StatistischesBundesamtDestatis,2017).14
Correspondingly,thenumberofmicro-enterprisesissignificantlylowerthantheEU-27
average,evendecreasingsince2010–adevelopmentnotnecessarilymirroredbythetwoFRs:
theyaremoresuccessfullyimplementedintheouterrimoftheFRRhein-Main,whileintheFR
Bremensmalltomedium-sizedcompaniesaremoreprominent(INKAR,2017).15Itseems,that
the“SmallBusinessAct”passed in2008 fosters thegrowthofsmallbusiness in thoseregions.
Nonetheless,Germany’seconomicstrengthderives from itsexportsectorby largercompanies
participatinginforeigntradesize(cf.Söllner,2016,p.4).However,thesmallerenterprisespro-
ducealowereconomicstrengthandprovidelesserjobopportunities.In2014inGermany,only
20%ofallemployeesworkedformicro-enterprisescomparedto39%hiredbylargeenterprises
(cf.StatistischesBundesamt,2016).16
Astheproportionspersectorvary,theregionsprovidedifferentpossibilitiestobehired.
Whilethepublic-sectorisdeclining(2008:7.3%,2014:7.1%),thenumberofemployeesinthe
tertiary sectoraswell as educational andhealth sectorare increasing. Since theunificationof
Germany,thenumberofpublicservantswasreducedbyonethird(bpb,2013),adevelopment
mirroredbybothFRsmarkingastructuralchangeconcerningthegovernmentasemployer.In
bothregionstheemploymentratedeclinedbetween0.7%and1.1%between2008-2014(NUTS
2level,Eurostat).Thus,headingintoacareerinthepublicsectorcandevelopintoacareerrisk.
Thisrevealsgenderproblems,asthepublicsectorhasoneofthesmallestgenderpaygapof8%
withratherhighwages(19.24EUR/hour).On thecontrary, theeducationalandhealthsector
provide vacancies, however with different wage opportunities (Education: 20.08 EUR/ hour;
Human health and socialwork: 16.87 EUR/ hour).17 Both sectors are fostered by a change in
social policies focusing on early childhood education. Since 2005 the staffing conditions have
changedby implementing theTagesbetreuungsausbaugesetz (TAG,day care expansion act) re-
spectivelyKinderförderungsgesetz(KiföG,lawforthesupportofchildren),guaranteeingthelegal
14Availableunder:https://www.destatis.de/EN/FactsFigures/EconomicSectors/Service/Tables/SiD_01_EnterprisesPersonsTurnoverCapitalformation.html[lastaccess:20July2017].
15ThedataprovidedbyEurostatislimited,bothinitsavailabilityasinitsrepresentation.Eurostatonlyprovidesdatafor theEU-27 for2010, and forGermany for2012and2014.Therefore, thedata is complementedwithdata fromINKAR.However,thedatarepresentationvaries,asEurostatdistinguishesbetweencompanysizesfrom10to19and20to49;classificationthatissummedupintheGermandatagatheringprocess,mostlikelytotheGermandefinitionof theMittelstandweresmallandmedium-sizedcompanies,most-oftenfamilyowned,gain importancefortheGer-maneconomy.Therefore,theprovidedEurostatdatawassummedupinordertobecomparabletotheGermandatarepresentation.
16Availableunder:https://www.destatis.de/EN/FactsFigures/NationalEconomyEnvironment/EnterprisesCrafts/SmallMediumSizedEnterprises/Current.html[latestaccess:26Sept.2017].
17Availableunder:https://www.destatis.de/EN/FactsFigures/NationalEconomyEnvironment/EarningsLabourCosts/EarningsEarningsDifferences/Tables/GPG_ByEnterprise.html[lastaccess:20July2017].
Page 176
24
claimonadaycareplaceaftertheageofoneyear.EspeciallyinBrementhissegmenthasgrown
morethanonethirdinsevenyears,from6.7%to8.8%markingadramaticshiftintheregional
labourmarket(2008-2014,).Onthecontrary,thehealthandsocialworksectorisincreasingin
Darmstadt(2008:9.2%;2014:10.7%;NUTS2level,Eurostat).
Theeconomicconditionsofthetworegionsprovidedifferentrisksforyoungpeople,as
thewealthandeconomicproductivityisunevenlydistributed:Whilethecoreofbothregionsis
rather wealthy, its periphery hardly profits from economic prosperity as especially the large
enterprisesareinthecoreoftheseareas.Atthesametime,thehighlivingcostsinthecoreareas
precludeitsinhabitantslivingandworkinginthehighlyprofitablecoreareas,producingamis-
matchofeconomicopportunitiesandfinanciallimitations.Gainingaprofitablejobopportunity
meansspendingmostofthewageforthelivingcostsorcommuting(seesub-chapter3.1).Thus,
autonomyandfinancial independenceseemstobeatstakeforyoungadultsstarting intotheir
careers. Simultaneously, the regions face structural changes providing risks for career paths:
ThreeoftheprominentsectorsintheFRBremen,agriculture,watertransportandlogistics,are
onadecline,however,ratherlowwagessectors(e.g.health,socialwork)provideastable,orin
thecaseofFRRhein-Main,increasingjobmarket.Thedecouplingbetweentheoveralldevelop-
mentofwealthinGermanyandthestagnationofwagesinindustriesispartoftheexplanation
whysignificantlymoreyoungadultsstaylongerwiththeirfamilies(cf.sub-chapter3.4).These
conditionscanleadtoarethinkingofyoungadultsinmakingtheirfinanciallivingdecision:in-
steadofinvestingtimeinalow-paidapprenticeshipwithprospectsofalow-paidprofessionin
theservicesector, itcouldleadthemdirectlyintothelabourmarket.Thiscancauselong-term
consequencesforthemontheoccupationallabourmarket(seesub-chapter3.4below).
The following chapter describes the education system context for young adults promoting or
hinderingopportunitiesintheirlifecourse.
3.3 Educationsystem
Theeducationsystemasacontextofyoungadults’livingconditions,describesthepositionsand
settings inwhichtheyareembedded inviewof theaccess,attainment,outputsandpoliciesof
educationandthuspavesthewayintothelabourmarket(Checchietal.,2014;Allmendinger&
Leibfried,2003;Pawson&Tilley,1997).Onecharacteristicof theGermaneducationsystemis
thefocusonqualifications,ratherthanonskillsoron-the-job-traininginfirms,withatightcou-
plingofcertificatestothelabourmarket(cf.Weileretal.,2017b,p.12).Thishighlightsthefor-
mationintheschoolsystemanditsoutputintheformofqualificationsprovidingopportunities
orobstacles forthe labourmarkettransitionastheregionsrequiredifferentspecificqualifica-
tions:highandlowqualifiedworkersinthemoreindustrialBremenopposedtoahighvarietyof
workersinthemoreservice-orientatedareaaroundFrankfurt(cf.chapter3.4below).
Page 177
25
ThestrongGerman federalpoliticalsystem is importantas theeducationsystem isor-
ganisedunderthesovereigntyofthefederalstates,particularlyaffectingthetworegionsasthey
are spread over five different federal systemswith heterogeneous policies, access and output
rates.18Theverticalisationandstratificationoftheschoolsystemsleadstodifferenthighlyseg-
mentedtracksandahighstandardisationoftheeducationalandtrainingsystem(cf.Parreirado
Amaraletal.,2017b,p.11f.)Thisstructureisalsoinfluencedbytheamountofeducationalex-
penditure(Biggartetal.,2015).Withinthelast15years, theexpensesontheGermanysystemincreasedfrom4.3%to4.94%ofthenationalGDP(UNESCO),withapprox.60%inprimaryand
secondary(ISCED0–4)education(AutorengruppeBildungsberichterstattung,2016,p.38).This
riseisnotsurprising,asGermanycanbecharacterisedasasocial-conservativestatewithmod-
eratetohighpublicfunding.Additionally,themedia-stirred‘PISA-shock’discussionsinGermany
ledtoseveralreformschangingtheeducationalsystem(cf.ParreiradoAmaraletal.,2017b,p.
11; Bittlingmayer et al., 2016c; Grek, 2009, p. 29ff.), especially regarding the early education
system.Thepoliciesaimtoprovidechildcareundertheageofthree(cf.sub-chapter3.2);there-
fore,by200584.6%ofthe4-years-oldwereineducationnationwide(by2012:95.8%)andin
Bremen93.1%.19
Theearlytrackingleadstoearlydecisionsunderhighuncertaintyasthedifferenthighly
segmented tracks offer different opportunities of qualifications for young adults. LikeAustria,
theGermaneducationsystemhasafirstdivisionattheageof10atthebeginningoflowersec-
ondaryeducation.Afterthat,pupilscantransitionintothreegeneralschooltracks:Hauptschule,
Realschule, andGymnasium. For studentswith special needs there is a separated and in itself
highly fragmented school track (Sonder- or Förderschulen;~4%of each cohort) (cf. Powell&
Pfahl,2012).Besidesthecharacteristicofaverticaldifferentiation,thesystemhasatraditionof
separating between academic and vocational education (cf. Bittlingmayer et al., 2016a, p. 5f.),
both attainedbypupils in almost equal shares in upper secondary education: in 2015, 53.2%
wereenrolledinthegeneralprogramand46.8%inthevocationalprogram(Eurostat).
Theseuppersecondaryschoollevelsplayanimportantroleinthetransitionfromschool
to labourmarket as theyprovidedifferentqualificationoptions,paving theway intodifferent
careers. Especially the Gymnasium provides the general higher education entrance certificate
(Abitur),whichenablesstudentstoenteruniversity.Since1995,thenumberofgraduateswith
anAbiturhasincreasedabout9.15%to33.4%in2014,mirroredinbothFRs,howevertoadif-
ferentextent:WhiletheFRRhein-Main iscontinuouslyaboveGermanaverage(1995:25.63%,
2014:38.58%),theFRBremenincreasesitsnumberataslowerpace,remainingunderthena-
18Duetothefederalstatessystem,theschoolforsupplystructureisheterogeneousandvarieswithaminimumofthreeuptosixdifferentschoolforms.TheFRRhein-Mainoverlaps3federalstatesallhaveeach6differentschoolforms,whileFRBremenoverlapstwofederalstateswith3respectively5differentschoolforms(cf.AutorengruppeBildungsberichterstattung,2016,p.74).19ThedatareferstoBremenonNUTS2Level.NodataisavailableforDarmstadt.
Page 178
26
tional average (1995: 22.28%, 2014: 28.5%).However, theGymnasium is not the onlyway of
reachingtheAbiturasthestructureoftheuppersecondarysystemischangingnationwideoffer-
ingnewintegratedschooltrackseithersubstituteorintegrateHaupt-andRealschuleaswellas
toopennewpathstotheAbitur(AutorengruppeBildungsberichterstattung,2016,p.73).
TheHauptschule in particular has been the target of reforms, leading to its steady decline of
around 10% since 1995, both nationwide as well as in the two regions, due to demographic
changes and the increased importance of theAbitur as a prerequisite for entering the labour
market.IntheFRBremen,theschoolhasthehighestattainmentlevelsinitsverynorthernand
rural district Friesland (over 20%)while in the FR Rhein-Main the highest attainment levels
over20%are in its regional corewith the cityofOffenbach, the closeneighbour toFrankfurt
a.M., and the Bavarian part of the FR (INKAR, 2017). This change has led to a creaming out-
process20andattendingaHauptschuleismeanwhilelinkedwithstigmatisationandstereotypes
(Solga&Wagner,2001;Kraemer&Bittlingmayer,2001;Ditton,2013).Itmarksariskfactorof
itsownasthetransitionfromthelowersecondaryschoolsystemintothedualsystemsofVET
hasbecomemarginal,mostlyduetolabourmarketdemands(cf.Weileretal.,2017b).
Figure6Shareofstudentsintertiaryeducation(20-24)from2005to2012,NUTS2,%
Source:EurostatEducationandtrainingdatabase
20The‘creaming-out-process’describesthetransitionoftop-performingstudentsintohighereducationinstitutions,leavingthosebehindfromsocio-economicunstablefamilies.Asaresult,theeducationopportunitiesonlyimproveforacertaingroupofstudents,however,creatingeducational limitations for thealready financiallydisadvantagedstu-dents.
20
30
40
50
60
70
80
90
2005 2006 2007 2008 2009 2010 2011 2012
Germany Bremen Darmstadt
Page 179
27
The VET consists of three systems: the dual system (Duales System), the school-based
trainingsystemwithoutanin-firmtraininginvocationalschools(Schulberufssystem)andatran-
sitionssystem(Übergangssystem),whichdoesnotleadtoaqualificationtoenterintoaprofes-
sionbutratherimprovestheopportunitiestoentertheothertwoVETschoolsystems(cf.Kohl-
rausch, 2012). This leads to a postponement of their entrance into the labourmarket,with a
stable share of approx. 28% NEETs since 2000 (Autorengruppe Bildungsberichterstattung,
2016,p.103ff.).Incontrast,asteadilyincreasingnumberof20%ofstudentswithanAbituren-
ters thedualSystem(ibid.,p.105)competing in theVETsystemwithstudents fromtheother
schooltracks.
Thedevelopmentoftertiaryeducation(20-24years)isdynamic,astheshareofstudents
rosebetween2005and2012(seeFig.7),alsomirroredbyDarmstadt.Onthecontrary,inBre-menthenumbersdecline,however,theattainmentlevelwashighertobeginwith(NUTS2level,
Eurostat). Comparedwith local data,we can observe that the number of students enrolled in
universitiesinbothregionshasfairlyremainedonthesamestableleveloverthelast20years
(cf.INKAR,2017).
Figure7ComparisonoftheISCED(0-8)educationlevels(25-64)of2005and2014,NUTS2level,%
Source:EurostatEducationandtrainingdatabase
Contrary to tertiaryeducation, theparticipationrate inadulteducation israther low. In2005,
16.7%oftheGermans(age25to34)participatedinadulteducationortraining,slightlyincreas-
ing until 2016 (18.8%), still being above EU average (EU-27 in 2005: 15.8%; 2016: 17.7%).
16.958.5 24.6
13.159.8 27.1
25.852.7
21.5 19.554
26.5
18.2 53.827.9
15.2 52.832
ISCED0-2 ISCED3-4 ISCED5-8 ISCED0-2 ISCED3-4 ISCED5-8
2005 2014
Germany Bremen Darmstadt
Page 180
28
However,slightdifferencesbetweenthegenderscanbeobserved:While20.2%of themale in
thispeergroupparticipateineducationortraining,just17.3%ofthefemaleparticipated.How-
ever, these differences seem to be limited to adult education and training, as the educational
level generally rose in Germany, equally attended by both genders. While the share of low-
educatedstudents(ISCED0-2)decreasedfrom16.9%to13.1%,wenoticeastaticsituationwith
regardtotheamountofpeoplewithupper-secondaryeducation(ISCED3-4:in2005:58.5%;in
2014:59.8%).However, theshareof thehighly-educatedpeoplerose in this timeperiod from
24.6to27.1%.
Incontrast,thesecondaryeducationattainmentbetweentheagesof30-34(ISCED3-4),slightly
decreased between2005 and2014 from58.5% to 56%, equally for both genders (men: from
58%to55.9%;women:from59%to56.2%),howeverincreasedforthesameagegroupinthe
tertiaryeducationattainment(ISCED5-8)from26.1%to31.4%(seeFigures7&8below).Both
regionsareincreasinglyadjustingintheirtertiaryeducationattainment,prolongingtheformal
educationopportunitiesfortheiryoungadults.Especiallywomenprofitfromthisdevelopment
astheysteadilyincreasetheirattainmentlevelsfrom24.1%to30.8%comparedto28%to32%
ofmen(Eurostat).
Figure8Tertiaryeducationattainment(ISCED5-8)(30-34)from2005to2014NUTS2Level,%
Source:EurostatEducationandtrainingdatabase
Besides the structure and the expenses, the quality assessment of the education system also
plays an important role, forwhich especiallyPISA is a commonlyuseddenominator. In2015,
10
15
20
25
30
35
40
45
2005 2006 2007 2008 2009 2010 2011 2012 2013 2014
Germany Bremen Darmstadt
Page 181
29
Germanpupilsgainedameanscoreof505 innumeracyand491 in literacy(EUaveragewere
respectively491and492).However,thegroupofyoungadults(20-29)isnotablyaboveEUav-
erage:In2012,youngpeoplehadameanscoreinliteracyof290(EU:272)andinnumeracyof
288(EU:262)(Eurostat),wellaboveEUaverageinthemeasuredcompetencelevels.
Those that are neither in employment nor in education and training (NEETs) are per-
ceivedasbelongingtoaparticularlyvulnerabletargetgroup(cf.chapter2).InGermany,therate
ofyoungNEETS(15to24years) iscomparably lowtotheEU-27(seeFig.9below).However,
theratesvary locally: InBremen, theshareofNEETswasslightlyaboveGermanaveragewith
9.4%in2016opposed toaslightly increase inDarmstadt from6.4%to7.3%(cf.LSF,NUTS2
level).Comparedtotheeducationalattainmentlevels,itseemsthatBremenimprovedtherates
of tertiary education, however, has fluctuating rates ofNEETs. In contrast, theFRRhein-Main
alreadyhashightertiaryattainmentlevelsandseeminglystableratesofNEETs.
Figure9NEETrate(15-24)andearlyschoolleavingrate(18-24),from2005-2015NUTS
2-Level,%
Source:LSFmicrodata
In sum andwith a view to the risk profiles of young adults, the German education system is
characterised by a tight coupling of certificates and building occupational biographies. This is
discussedunder the label ‘academisation’asan increasingnumberof studentscontinues their
formaleducationafteruppersecondaryschool,bothinGermanyasawholeaswellasinthetwo
regions.Firstly,theratesofstudentsgainingtheschoolleavingcertificate(Abitur)forentering
highereducationissteadilyontherise.Secondly,therestructuringoftheGermanschoolsystem
0
2
4
6
8
10
12
14
16
18
20
BremenESL DarmstadtESL GermanyESL
EU28ESL Bremen,NEET Darmstadt,NEET
EU27NEET Germany,NEET
Page 182
30
has led to a reduction of lower secondary school tracks (Hauptschule), however hardly to an
integration of Schools for Special Needs Education (Sonderschulen or Förderschulen or
Förderzentren)intothegeneralschooltracks.Thirdly,ahighnumberofstudentsisenrolledin
thetransitionsystem(Übergangssystem),waitingtoentertheVETsystem,competing,however,
withthestudentsfromhigherschooltracks.Theprolongingofformaleducationiscloselylinked
totheoccupationallabourmarket,ascertificatesareapreconditionforanoccupation(seesub-
chapter 3.4 below). In this sense, being at risk is paved and reinforced by the school system
youngadultsattend,bothforthesubsequentchancesbeingincludedinthe labourmarketand
forfacingstigmatisation.
The obstacles they face are hardly levelled out by LLLpolicies or theVET systemand
thus, enhance the risk of facing fragmented occupational biographies.Firstly, the overarching
significance of educational certificates for the employers and the comparatively little signifi-
canceofadulteducationandfurthertrainingexacerbatesthecreationofastableandpredictable
life course for studentsbelowhigher formaleducation.Thesegroupsbuild thecoreof the so-
called “functional illiterates” inGermany,which isoneof themost important target groupsof
LLL-policies (Grotlüschen, 2012; Bilger, 2012; Riekmann & Buddeberg, 2016). Secondly, even
successfully finishing dual vocational education and training can lead into occupational risk-
careersasjobswhicharehighindemandcanleadtoasurplusofworkers.Themainavailable
andcontinuouslyexpandingqualificationsleadtojobsthatareinthelowwagessector,suchas
hairdresser,motorcarmechanic (besides thebig enterprisesof the famousGerman car indus-
try), butcher, or nurse, with nearly no chances of advancement (cf. MAIS, 2017; Lohnspiegel,
2017).Thus,thediscoursesonthelackofskilledworkersseemsneithertobefilledbystudents
ofhighereducationnorbyapprenticeships,asthematchingofthecertificatesandtheneedsof
thelabourmarketaretightlyknit.Asaresult,thelowpermeabilityoftheinstitutionalarrange-
mentsoftheGermaneducationsystemhardlyenhancestheequalityofopportunitiesforyoung
adultsatrisk.
Thefollowingchapterdescribesthestructureoftheyouthandlabourmarketforyoungadults
promotingorhinderingopportunitiesintheirlifecourse.
3.4 Labourmarket
The differentways inwhich young people can participate in labourmarkets affects their life
opportunitiesandsocial identities (cf.Höfer&Straus,2001,p.91f.). In theGermandiscourse,
‘beinginwork’isnotnecessarilyequatedwithhavingajob,ratheranoccupationshapingthelife
course:Whileajobdescribesatemporarylimitedactivityallowingahighflexibility,anoccupa-
tionaimstoprovidelong-term,systematicallytrainedandqualifiedactivity,shapingone’siden-
tity(“Berufsträger”Straus&Höfer,1998,p.280).Thus,inGermany,thequalificationsgainedin
Page 183
31
theeducationsystemsareapreconditionforanoccupation.Inthissense,thestratificationofthe
educationalsystemismirroredbytheoccupationalsystemcausingalowpermeability(cf.Shavit
&Müller,1998).
Againstthisbackdrop,thefragmentedyetdistinctlabourmarketstructuresandoppor-
tunities(cf.sub-chapter3.2)ofthetworegionsaffectyoungpeople.Theopportunitiesarehighly
coupledtotheeducationsystem:the‘wrong’certificatecanleadintounemployment,nocertifi-
catesurelywill.Thesystemdoesnotintenda‘switch’betweenoccupations,whichisaccompa-
niedbypresumedlossofproductivity(cf.Kambourov&Manovskii,2009).Asaresult,theDual
System,beingthemostimportantstrainoftheVETsystem,providesemployerswithanotionof
whattoexpectfromacertaintypeoftraining(Hall&Soskice,2001)andisapreconditionforits
occupational labourmarket (cf. ParreiradoAmaral et al., 2017b, p. 15). Therefore, the rather
low unemployment rate, especially compared to other EU-27 countries (see Fig. 10 below),
couldleadintolong-termunemploymentorprecariousworkingsituations.Withinthepastten
years, the ratesdecreased remarkably (2005:11.2%;2015:4.6%,age20 to64).Although the
rates foryoungpeople (15-24)wereslightlyhigher tobeginwith (2005:15.5%) thenumbers
havebeenreducedbyhalf(2015:7.2%).Thereductionoftheratesisalsomirroredbythetwo
FRs: inBremen, from16.8% to5.6%and inDarmstadt from8% to4.1% (NUTS2 level, LSF).
Complimentarily, theemploymentrates (age20-64)arehigh,both inGermanyand in the two
regionsandremainedunaffectedbythefinancialcrisisin2008and2009(LSF).
Figure10:youthemploymentandunemploymentratesforyoungpeople(15-24),EU-27,Germany,BremenandDarmstadtonNUTS2-Level,2005-2015
Source:EurostatLabourmarketdatabase,LFSmicrodata
0
10
20
30
40
50
60
2005 2006 2007 2008 2009 2010 2011 2012 2013 2014 2015
EU27unemployment GermanyunemploymentBremenunemployment DarmstadtunemploymentEU27employment GermanyemploymentBremenemployment Darmstadtemployment
Page 184
32
Althoughtheunemploymentratesaredecreasingforbothgenders,theunemploymentratesof
womenarelowerasopposedtomen(e.g.inGermany2015,males:5.0%,females:4.2%).How-
ever, thedatacoversahighnumberofundetectedcases, forexamplehousewivesandpersons
willingtoworkbutunregisteredassearchingforwork(cf.Hahnetal.,1995;Beck,2008).Inthe
national statistical data gathering process, these groups are considered inactive and thus not
includedinthestatistics.Theunemploymentratecancoverriskofprecariouslivingconditions,
aspausingfromemploymentcausesareducedpaymentinpensionschemes.Especiallywomen
areaffectedbyold-agepoverty,astheirfragmentationofthelifecoursethroughpausesishighly
encouragedbytheGermangovernment,forinstanceforchildcare,beingahousewifeorhavinga
part-timejob(cf.StatistischesBundesamt,2016,p.38f;cf.ParreiradoAmaraletal.,2017b,p.17,
sub-chapter3.5).Opposed towomen in theretirementage, thecurrentgenerationofworking
women(18-64) is facing theseprecarious livingconditions later in lifeas theyalready face fi-
nancialstrainsduetounemployment,part-timeemploymentandlowincomeresultinginmate-
rialdeprivation (ibid.).This especially effects theFRBremen, as thegenderdifferences in the
employmentrateshaveonlybegundiminishingsince2014,whileDarmstadtalreadyhasasta-
bleemploymentrateforbothgendersofover40%(NUTS2level,LFS).Thiscouldleadtolimited
possibilitiesforpartakinginthelabourmarket,forinstanceifacarisnecessaryforcommuting
oramovetoanothercityistooexpensiveyetapreconditionforajob.
Againstthisbackground,theyouthunemploymentratesvisualizetheinternalheteroge-
neitywithintheregionsasthemoretightlykniturbanareasofFRRhein-Mainhavelowerrates
thantheFRBremen.WhileinDarmstadt(onNUTS2Level)theunemploymentratesareshrink-
ing(2005:12.1%2015:to7.0%)inBrementheratesareratherhigh(2005:19.3%).Especially
thecitiesofBremerhaven(2014:13.6%)andWilhelmshaven(9.7%)havehighrates,evenmore
obviousincontrasttothehighestrateswithinthecitiesofFRRhein-Main(Worms:8.6%,Offen-
bach:8.2%)(INKAR,2017).Itseems,theunemploymentratesinFRBremenfluctuate,whileFR
Rhein-Mainslowlybutsteadilyreduceditsrates.Althoughthelong-term-unemploymentandthe
youthunemploymentratio21showsaverypositivetrendinthelasttenyearsitrevealsastable
shareofvulnerableyoungadultsmostlikelyheadingintoadultunemploymentbetween3,1%in
theageof15to29(long-term,unemployment;2008)and4,8%intheageof20to29(Eurostat).
Theexclusionofyoungpeoplefromthelabourmarketcausesvariousdebilitatingeffects.
Thefinancialstrainsresultinanoveralldecreaseoflifetimeearningsenhancingtheriskofpov-
erty(cf.StatistischesBundesamt,2016,p.40f).Earlyunemploymentcanhave long-termnega-
tive“scarringeffects”(Øivind&HolmReiso,2011,p.3)bymissingearlycareerexperienceand
beingperceived,or ‘scarred’,witha lackof individualskillsorproductivityasopposedtoper-
ceivestructuralobstacleshinderingthemtoparticipateinthelabourmarket.Asaresult,access21Theyouthunemploymentratiomeasurestheshareofunemployedyoungpeopleamongthewholeyouthpopulation(either15to24-year-oldpersonsor20to29-year-oldpersons).
Page 185
33
tounemploymentcanbedecisiveforsubsequentlong-termsuccessastheymostlikelyfaceun-
employmentagain(ibid.).Especially theFRBremen isconfrontedwith theeffectsofearlyun-
employment,bothon the individual level (e.g. stigmatisation,health issues, lackofmotivation,
etc.)andstructurallevel(e.g.highercostssocialwelfaresystem,lossoflabourmarketproduc-
tivity).
Itisassumedthattherearefourcontributingfactorstothedifferencesintheyouthunemploy-
ment/employmentrates:
1. Theinterlinkageofsocialandlabourmarketpolicieslinkingunemploymentbenefits
andsocialwelfare.
2. Weakerlegalemploymentprotectionforyoungworkers.
3. Longerformaleducationpostponingtheentranceintothelabourmarket.
4. Regionaldifferencesincontrastinglabourmarketsleavingthosebehindwithamis-
matchoftrainingandjobopportunities.
First,since2005theso-called“Hartz-laws”22wereimplemented,reformingtheunemployment
benefitsbylinkingthemtowelfarebenefitsasanoverallstrategyoflabourmarketpolicies.Due
to thisreformofactivation(workfarepolicy), receivingbenefitspayment for long-termunem-
ploymentisboundtoacontractwithpubliclaw:thebeneficiariesofthepaymentareobligedto
agreetoimprovetheirjobsituationinacceptinganykindofjob–arefusalcanotherwiseleadto
reduction/ complete suspensionof thebenefits. This interlinkage also explains theoverall re-
ductionof expenditures in labourmarket policies as they arepartially substitutedwith social
policies (cf. Lessenich, 2009; Gerdes & Bittlingmayer, 2012). In 2005, Germany spent slightly
morethan3%oftheGDPforlabourmarketpolicies–thehighestvalueacrossallthecountries
analysedinYOUNG_ADULLLTand50%abovetheEUaverage(EU-28:2.0%ofGDP).However,
thisexpendituredecreasedaround50%withinthefollowing10years(2015:1.5%ofGDP).
Second,thelegalemploymentprotectionisweaker,particularlyforyoungworkers.With
theEmploymentPromotionActfrom1985companieshavethepossibilitytoextendfixed-term
contractingfornewentrantstothelabourmarket(cf.Buchholz&Kurz,2008,p.54;cf.Parreira
doAmaraletal.,2017b,p.13).Thisleadstoa‘yo-yo-effect’withphasesofemploymentandun-
employment,promotingafragmentedlifecoursewiththeconstantsearchforthenextemploy-
mentbypassinguncertainty.Thus, labourmarketpolicies contribute toa fragmentationof life
courses–regardlessofskillsets,certificationorlabourmarketsector.
22TheHartz-lawstrytoredefinetherolebetweenstateandsubjectandlimitcivilrightsofunemployedpersonsandestablishalabourpolicyofactivation,i.e.thatunemployedpersonsneedtoprovepermanentlythattheyarewillingtowork,acceptingforinstanceworseworkingconditions,timecontractsandsoon(cf.Lessenich,2009;Dörre,inpress).AsoneconsequenceoftheHartz-IV-law,theamountanddurationofunemploymentbenefitswereshortenedtooneyearand60to67%ofthepreviousnetsalary,regardlesstheageandworkhistory.TherearemanysimilaritiestotheBritishWorkforcepolicyunderToniBlair(cf.Dixon,1999,2000).
Page 186
34
Third,theparticipationinhighereducationisconstantlyincreasingwhichleadstoapostpone-
mentof theentrance intothe labourmarket(seesub-chapter3.3).Andfourth,regionaldiffer-
ences in contrasting labourmarketspromote and foster theneed for specific jobs as a conse-
quenceoftheregionalstructuralchanges(cf.sub-chapter3.2)leavingthosebehindwithamis-
matchoftrainingandjobopportunities(ParreiradoAmaraletal.,2017b,p.24f.).Especiallythe
FR Bremen has a highly dynamic and contrasting labourmarket, however still offers a large
amountofjobsinproductionplants.Asaresult,thelabourmarketishighlypolarized,withfocus
onhighandlowskilledworkerconstantlyreducingthemediumskilledworkers(cf.Autoretal.,
2003).Incontrast,theFRRhein-Mainoffersabroadervarietyofjobs(e.g.finance,media),how-
everwithaworldwidejobcompetitionwhocompetewiththepotentialworkersonsite.Inthis
sense, theGerman labourmarket creates an interlinkageof life course and careerpathwhich
leadsintoahighprecarityforthosechoosingorforcedtochooseanon-matchingvocation.Par-
ticularlyasbothregionsattracthighskilledworkersinthecorespreadingtheremainingskilled
jobsinitsperipherycausingprecarioussituationsforNEETsandearlyschoolleavers.
Despite theoverallpositiveeconomic situation inGermanyandemployment rates, the
problemsfor–acomparativelysmalleramount–ofyoungadultsaremoreorlessthesamelike
in the other EU-countries. In terms of the interplay between youth and labourmarket, to be
youngisariskfactorofitsowngiventhesignificantagedifferencesinalltherelevantindicators
mentionedabove(e.g.unemploymentrateetc.).However,thereisarelativelynewriskfactorfor
young adults, particularly forGermany: a successfully acquired vocational certificate doesnot
prevent unsecure occupational biographies. Since the 1980’s, the wages in twelve traditional
industriesareinthelow-paysector(MAIS,2016).Thus,receivingtrainingandworkinginthose
industries is a risk in itself.Weassume thatnot vocational trainingper se lowers the risk for
youngadults,butrathervocationaltraininginspecificareas,bothavailableandwithareasona-
blecompensation.Thisisparticularlyachallengeforyoungadultslivinginurbanareaslikethe
citiesFrankfurta.M.orBremenwithhighrentsonahighlycompetedapartmentmarket.
Thefollowingchapterdescribesthemateriallivingconditionsforyoungadultsalongtheredis-
tributionandsocialinclusioninthetwoFunctionalRegions.
3.5 Redistributionandsocialinclusion
Ineverycountry,certaingroupsfacebarrierspreventingthemfromparticipatinginthesocial,
economic and political sphere of society. However, social participation is even more difficult
under conditions of poverty as it can lead to social exclusion and, as a consequence prevents
citizensfromcreatinganautonomouslife(Eurofund,2015,p.5).Thus, fromasocial-economic
perspective,socialinclusionandredistributionofwealtharecloselylinked,asthematerialliving
conditionsareacrucialminimumrequirementtoavoidpoverty.Thewelfarestateisagovern-
Page 187
35
mentalconceptofprotectingitscitizensbypromotingsocial,economicsecurityandsocialrights
byensuringtheredistributionofwealth(cf.Esping-Andersen,2014,p.140).
InGermany,thewelfarestateisratherconservativeasitoperatesalongtheprincipleof
subsidiarity,however,onlyafterthefamilies’possibilitiesforsupportareexhausted.Thebene-
fits system is constructed along former contributions to the system that have been made
throughemployment.Thisperpetuatesgenderdifferences,aswomenareencouragedtosupport
thefamilyopposedtojointhelabourmarket(cf.ParreiradoAmaraletal.,2017,p.17;cf.sub-
chapter 3.4).Here, regional differences canbe observed as the legislations unfolds differently
amongst and within the regions. First, the possible wealth is dispersed differently. Although
thoselivinginthecorearemorelikelytoparticipateinthewealthoftheregionastheperiphery,
thoselivingintheFRRhein-Mainaremorelikelytofaceadivergenceofrichandpoor(cf.sub-
chapter3.1).Second,thebenefitssystemshavedifferentshort-andlong-termtargetgroups,as
in theFRBremen theyouthunemployment rate ishigher than inFRRhein-Main. In the long-
term,thiscontainstheriskoffuturephasesofunemploymentleadingtorecurrentlypaymentof
benefitsandsubsequently reducedpayment into the social system(taxes, insurances,pension
etc.).Thisperpetuateswomenevenmore,asthedoublepressureofmakingalivingandstarting
a family cancauseseveralpauses fromemploymentandhasnegativeeffectson theirpension
plan,however,ishighlyencouragedbythestate(cf.sub-chapter3.4).
Against thisbackgroundof theprincipleof subsidiarity thehighexpendituresof social
protectionhavetobeenread.TheGermanoverallnetexpenditureinsocialprotectionrosefrom
24.8%to26.6%oftheoverallGDPbetween2007-2014.Thisrathermoderaterisewashowever
influencedbythe financialcrisis,as thestrongest increasetookplacebetween2008and2009
(from25%to28%ofGDP).23InGermany,thespendingisratherhigh:in2014,thegovernment
spent10.324,72EUR/ inhabitant,being130%wellaboveEU-28averageof7.904,73EUR/ in-
habitant(Eurostat;ESSPROS).InlinewiththeGermanwelfarestate,anditsstate-basedhealth
care insurance providing accessible health care (cf. sub-chapter 3.6), themain share of social
protectionisspenthere(2005:7.9%;2014:9.7%).Duetothestrongnotionofthefamilysup-
portsystembeforegovernmentalbenefits,thereisonlyaslightriseintheexpendituresonfami-
lyandchildren(from3.0%to3.1%)andsocialexclusion(from0.1%to0.2%)–however,con-
tinuouslyunder theEU-27averageof0.5%andthe lowestofallparticipatingcountries in the
project.Onthecontrary,thespendingforpensionandretirement(9.6%to9.0%)aswellasso-
cialprotectionbenefitstocounteractunemployment(from2.0%to1.1%)decreased.Thus,fami-
ly,socialinclusionandpensionsarenotontheforefrontoftheexpenditureofsocialprotection,
althoughGermanyfacesdemographicchangesofanageingsociety(cf.sub-chapter3.1).
23According toESPROSS, expenditureon social protection is provided tohouseholds and individuals affectedby aspecific setof social risksandneeds.Availableunder:http://measuring-progress.eu/social-protection-expenditure-current-function-gross-and-net-espross[latestaccess:14Aug.2017].
Page 188
36
Thedisposable incomeforhouseholdsdescribesthematerialconditionsoftheregions,
astheamountofmoneyearnedeachyearaftertaxesandtransfers,andthus,representingthe
money available for spending on goods or services. In Germany, it is relatively stable and
amongst thehighest intheEU.However,duetotheeconomiccrisis, theamountstagnatedbe-
tween2008-2009(seeFig.below).LivingandworkinginthecoreoftheFunctionalRegionshas
apositiveimpactonthewealthofitsinhabitants,although,notallinhabitant’sprofitfromit,due
toGermanysincreasingincomeinequality(Darmstadt:21,600PPS,Bremen:19,700PSS,NUTS
2-Level). Since 2006, it surpasses the EU-27 average consistently (Germany: 56.4%; EU-27:
51.9% in 2015), following the general trend of widening the gap between rich and poor (cf.
OECD,2011;Piketty,2014).Inthetimespan2005-2015theGinicoefficient24ofequivaliseddis-
posable income (Fig. 11 below),which shows the concentration of incomewent from45% to
56.4%,surpassingtheEUaverage(EU-27:2005:49.7%;2015:51.9%).Also,householdwealthis
muchmoreunequallydistributedthanincome.In2012,therichest10%ofGermanhouseholds
owned59.2%ofoverallhouseholdwealth, the fourthhighestshareof17countriesstudiedby
OECD.(cf.OECD,2016,p.102f.).
Figure11:GINIindexbeforeandaftertransfers,disposableincomeinthehouseholdsinPPS(rightax),EU-27,Germany,NUTS2LevelBremenandDarmstadt,2005-2015
Source:EurostatLivingconditionsandwelfaredatabase,EU-SILCmicrodata
24TheGinicoefficientmeasurestheextenttowhichadistributiondeviatesfromaperfectlyequaldistribution.Inthiscase,GINIisappliedtoequaliseddisposableincomewithinacountry.Ingeneral,itrangesfrom0to100,howeveritcouldalsobeexpressedon1-pointscale.Acoefficientof0expressesperfectequalitywhereeveryonehasthesameincome,whileacoefficientof100expressesfullinequalitywhereonlyonepersonhasalltheincome.
0
5,000
10,000
15,000
20,000
25,000
0
10
20
30
40
50
60
70
2005 2006 2007 2008 2009 2010 2011 2012 2013 2014 2015
EU27GINIbefore GermanyGINIbefore
EU27GINIaSer GermanyGINIaSer
Germanydisposableincome Bremendisposableincome
Darmstadtdisposableincome
Page 189
37
The risk of poverty and social exclusion is under the EU-27 average and one of the lowest
amongst the projects countries (only Finland and Austria are lower). However, its increase
seemsnotaneffectof the financial crisis,butoccurredbefore it.The riskmainly increased in
2005from18.4%to20.2%in2006andremainedonthatstablelevelthroughoutthecrisis,even
recoveringshortlyafterthecrisisin2010(19.7%)(Eurostat;EU-SILC).25Thus,theseveremate-
rial deprivation rate, the inability to pay for basic living supplies26,was affected by the crisis
(2005:4.6%,2009:5.4%).
These developments can particularly be a risk for receiving long-term unemployment
welfarebenefits,duetothecouplingsocialandlabourmarketpolicies(cf.sub-chapter3.4).The
socalled‘Hartz-IV-law’referstotheUnemploymentBenefitII,whichallpeople“capableofwork
andeligibleforbenefitscanreceive”(BundesagenturfürArbeit,2017).Thesecanbeforpersons
whoareunemployed longer thanoneyear (or in special casesoneandahalf year)orpeople
who enter the labourmarket after school/VETwithout successfully getting a job.On average,
personsbeingonunemploymentbenefitsreceive399EUR/month,plus440EUR forhousing,
withslightlydifferentdistributionsperregion(StatistikderBundesagenturfürArbeit,2017).
To sumup this subchapter in terms of risk profiles: Germany has undoubtedly a very
strongeconomyandastabledemocracybutontheotherhand,aconstantshareofpeoplede-
pendsonsocialwelfare.Germanyfailedinthelasttenyearstoreducethisratesubstantially;on
thecontrary,theincomeinequalityincreasedsignificantlyaswellasthenumberofpeoplewho
areworking on a low-income base. Being at risk varies remarkably along the regional differ-
ences,especiallywithintheFunctionalRegions.Forinstance,in2014,forachildthechancesof
receivingsocialtransfers–anoften-usedpovertyindicator–arethreetimeshigherinthecities
Bremerhaven(37.2%,FRBremen)orOffenbach(34.8%,FRRhein-Main) than in thecitiesOs-
terholz(9.3%,FRBremen)orthecityofFulda(9%,FRRhein-Main). TheriskforthoseinBrem-erhavenorOffenbachisevenfive-tosixtimeshigherthanintheBavarianpartofFRRhein-Main
Aschaffenburgwith6.1%(INKAR,2017).Thus,theregionitselfseemstobeastrongpredictorofpoverty,forcingyoungadultstobemobile.However,iftheyareforcedtostayindisadvantaged
districtslikeBremerhavenorOffenbachforseveralreasons–forinstance,asthequalifications
areonlyacceptedlocallyortheyareresponsibleforthehealthcareoftheirparents–thenthe
neighbourhoodturnsdirectlyintoariskfactorfortheirbiographiesaswellasfortheirpartici-
pationinLLL-policies.
25ThereisnodataavailableonNUTS2LevelforGermanregions.
26Severematerialdeprivationrateisdefinedastheenforcedinabilitytopayforatleastfourbasicitemssuchas:1.topaytheirrent,mortgageorutilitybills;2.tokeeptheirhomeadequatelywarm;3.tofaceunexpectedexpenses;4.toeatmeatorproteinsregularly;5.togoonholiday;6.atelevisionset;7.awashingmachine;8.acar;9.atelephone.
Page 190
38
Thefollowingchapterdescribesthehealthandwell-beingconditionsofyoungadultsalongthe
redistributionandsocialinclusioninthetwoFunctionalRegions.
3.6 Healthandwell-beingconditions
InGermany,localdataonhealthishardlyavailable.Mostofthedataishighlyaggregatedonthe
national level,however,rarelyonthe levelof federalstatesoronregional level,ascentralized
healthdatacollectionhardlyexists.Thus,datafrominternationalsurveys,asinEurostat,aggre-
gatestheGermanhealthdataonacomparativelyhighlevel.Asaresult,thissub-chapterdiffers
fromtheothersregardingtheillustrationoftheindicatorsaswerefermoretodataonthena-
tionallevelcomparedtothefivesubchaptersabove.
Againstthebackgroundofasteadilygrowinglifeexpectancy(cf.sub-chapter3.1),public
health interventions and medical care improved. During the last decade, the total health ex-
penditure in Germany increased steadily touching 321 billion EUR in 2014 – the highest ex-
penditureamongstEUmemberstates–whichequals3.973EURperinhabitant(EU-28average:
2.235EUR/perinhabitant).Yetinrelativeterms,othercountrieshavesimilarratiosofcurrent
healthcareexpendituretoGDPof11%asGermany(Eurostat).However,duringthelast20years
governmentalhealthcarereformshavebeenimplementedinGermanyaimingtoreducethegov-
ernmentalexpensesinhealthcarefavouringacompulsorycontributoryhealthinsurancesystem.
Thisleadtotheintroductionofahealthcareinsuranceaswellastheintroductionofeconomic
principles(e.g.regulationsbyoutcomesinthehealthsector).In2014,thehealthexpendituresin
Germanywere 6.6%of government schemes – one of the lowest of the EU-28 –while 78.0%
werecoveredbycompulsorycontributoryhealthinsuranceschemesandsavingaccounts–the
highestwithin theEU (260compared to3.059PPSper inhabitant) (Eurostat).Asa result, the
accesstoahealthcareisgranted,however,thestandardandqualityofhealthcarecanvaryon
thewealthoftheinhabitants.
Thesechangedhealthpolicieshadstrongeffectsonthefieldofhealthandmedicalcare
aswellashealthcareaccessinGermany.Theintroductionofastate-basedhealthcareinsurance
ledtoanincreasingnumberofpeopleprofitingfromthisinsurance,simplybecauseoftheageing
society. In theFRBremen, thenumberofofficiallyregisteredcarerecipients increasedsignifi-
cantlyfrom6,089in2009to6,476in2013,whichhasenormousconsequencesforthefederal
expendituresinhealthcare(FHB,2015).Furthermore,ofthenineparticipatingcountriesinthe
project,Germanyhasthehighestnumberofavailablebeds inhospital inthe lastdecade.They
facedonly amoderate reduction in the last tenyears (2005:846,7beds/100,000 inhabitants;
2015:822,8beds/100,000inhabitants,Eurostat).27Theavailablehealthcarestaffmirrorsthese
developments.However,theimprovementoftheratioofmedicaldoctors(2005:339,5/100,000
27Dataforthelong-termcurativebedsper100.000inhabitantsisnotavailableviaEurostat.
Page 191
39
inhabitants, 2015: 410,8/100,000 inhabitants) aswell as nurses andmidwifes during the last
decade (2005:1.137,3/100.000 inhabitants,2015:1.342,2/100.000 inhabitants) ismost likely
not a consequence of an improvement of the health care system, but rather through a stablequota of medical students (Eurostat). These quotas are highly regulated in Germany by the
states(Bremenhasa largeMedicalFacultyat theUniversityofBremen)andanegativedemo-
graphictrendinGermany.
Thesechanges in thestructureandaccess to thehealthcaresystemmaybe thereason
whyGermanshavea lowerperceptionof theirhealth than theEU-27average.Whenasked in
2015, "How is your health in general?" 64.6% of people in Germany reported to be in good
health, slightly under EU-27 average of 67%.However, the ratio between peoplewho have a
goodandverygoodperceptionof theirhealthand thosewhohaveabadperception is rather
highwith9.3%and in comparativeperspectiveover theEU-27averageof8.7% (cf. Eurostat;
EU-SILC).Notsurprisingly,youngpeopleinGermany,aged16-29,haveabetterself-perception
oftheirhealththantheoverallpopulation,asin201589.1%ofthemperceivedtheirownhealth
asgoodorverygoodyetslightlyundertheEU-27averageof90.8%(ibid.).Thisperceptioncould
alsomirrortheactualhealthstatusinGermany,astherateofhealthylifeyears(HLY)isunder
theEUaverage,measuring thenumberof remaining years that a personof specific age is ex-
pectedtolivewithoutanysevereormoderatehealthproblems.GermanmalesarebelowtheEU-
27averageandhavetheshortestamountofhealthyyearsofallprojectcountries.Onaverage,
theyareexpectedtolive56.4healthyyears,whichamountsfor71.7%oftheirlifespan(in2012:
EU-27: 80.3%, Germany: 74.2%). In addition, females are below EU level (in 2012: EU-27:
75.5%,Germany:70.8%)andamongstthe lowest intheprojectwith56.5healthyyearswhich
estimatesfora67.6%healthylifespan(cf.Eurostat).28
Thesubjectivewell-beingcanbemeasuredintermsoflifesatisfaction(seeFig.below).
Thisallowstodescribeaself-positioningperspectiveonhealthandwell-beingofyoungadults
asanuncoveringoftheirperception.Ingeneral,Germansarequitesatisfiedwiththeirlives.Ona
scale from 0 to 10. Germany rated general satisfactionwith lifewith a 7.3 grade (EU-28: 7.1
grade) and 25%were highly satisfied (EU-28 average: 21.7%). Accordingly, young Germans
(16-24)arehighlysatisfiedaswell,forinstance33%withtheirjob,especiallytheirpeersonthe
EU-28averagewith29.3%(cf.Eurostat;EU-SILC).Notsurprisingly,theseresultsarerelatedto
educationalattainmentandlabourstatus:satisfactionismuchlowerforlow-educated,roughly
equaltothenational-averageforuppersecondaryeducated,muchhigherfortertiaryeducated
aswellasthoseineducationandtrainingcomparedtothosebeingunemployed(ibid.).
Thiscloselinkbetweenthesubjectivehealthstatusandtheindividualpositionintheso-
cialstructureontheonehandandeducationalcertificatesontheotherhandleadstothetopicof
28NodataontheEUlevelfor2014wasavailableviaEurostat.
Page 192
40
health inequalities which has beenwidely discussed in Germany for fifteen years (cf. Mielck,
2005; Richter & Hurrelmann, 2006; Hackauf & Jungbauer-Gans, 2008; Bauer et al., 2008).
MeanwhilethereisnodoubtthathealthinequalitiesexistinGermanyandthattheypartlyincrease
forallagegroups(Kroll,2010;Lampert,2016).
Figure12Highsatisfactioninvariouslifedomains,age25-34,EU-28andGermany,2013
Source:EurostatLivingconditionsandwelfaredatabase,EU-SILCmicrodata
Healthrelevantriskprofilesforyoungadultsareverysimilartotherisksofbeingpoor,unem-
ployedanddependentonsocialtransfers.Recentstudieshaveshownthatchildrengrowingup
inpoorfamiliesaremore likelytohavepoordental,aremoreoftenaffectedbymental illness,
particularlydepressivesymptoms,andhaveapooreropinionoftheiroverallhealthstatus.Simi-
larpatternscanbeobservedforthecontinuinglifecourseandaccumulateindifferentlifeexpec-
tanciesbetweenthetop20%incomegroupsascomparedtothe20%bottomincomegroupof
nearlytenyearsforbothgender(Kroll&Lampert,2014).Furthermore,healthinequalitieshave
anotherindependentregionaldimension.Inruralareastheaccesstohealthcareandspecialized
healthandmedicalservices,forinstanceintermsofpsychiatricorophthalmologiccare,isprob-
lematic(cf.Bittlingmayeretal.,2009;Bauer,2009).Ontheonehand,healthcareaccessinurban
areasismuchbetter.Ontheotherhand,thegapbetweenrichandpoorpeopleinurbanareasis
muchhigherandleadstonotabledifferencesinlifeexpectancieswithinonetown–nearlysix-
teenyearsofwealthyandpoorquarterswithinU.S.-cities(Wilkinson,2005,pp.14ff.).Butrisks
0
10
20
30
40
50
60Financialsitua4on
Accommoda4on
Jobsa4sfac4on
Commu4ng4me
Timeuse
Overalllifesa4sfac4on
Recrea4onalandgreenareas
Livingenvironment
Personalrela4onships
Meaningoflife
EU28males Germanymales EU28females Germanyfemales
Page 193
41
forbadhealth,ashortenedlifeexpectancyortheriskofmentalillnessofyoungadultsaremost
ofallthedirectconsequenceofbadlivingconditions,however,notjustariskfactorthatstands
alone(cf.Hoffmannetal.,2014;Borrelletal.,2014).
Foramorelocalorregionalhealthrelatedriskprofile,wecanassumethatthesamevariables
andrelationshipsareverylikelytrue.IntheFunctionalRegionsBremenandRhein-Main,there
is very likely a concentrationofbadhealth statusof youngadults, ofmental illnesses, obesity
a.d.o.inthepoorneighbourhoods,followingthelogicofahighconcentrationofunemployment
andbadhousingconditions.Asdetailedlocaldataismissing,weassume,startingfromthedata
onpovertyandunemployment,thatthehealthriskisalsohighinthecitiesofBremerhavenand
Wilhelmshaven (both FR Bremen) andWorms and Offenbach (both FR Rhein-Main) (cf. sub-
chapter3.4).
Thefollowingchapterprovidesthedataassessmentoftheavailablestatisticaldata.
4. Qualitydataassessment
The data quality assessment provides an overview on the possibilities and limitations of the
availabledatafordescribingthelivingconditionsofyoungadults’inthetwoFunctionalRegions
Rhein-MainandBremen.Statisticaldataiswidelyusedinpoliciesprocessestoinformandsteer
thedefinition,coordinationandimplementationofpolicyforyoungadults.Thus,assessingthe
data allows us to understand the perspective, or the ‘data-lens’, shaping LLL policies. As LLL
policiesunfolddifferentlywithinthedifferentcontexts,theimplementationofLLLpoliciesisnot
onlyaquestionof theprocessofpolicy coordinationandmatching,but alsoaquestionof the
informationonwhichpolicy-makingisbasedon.Itsobjectiveistodescribetheavailability,rep-
resentationandqualityofthedataanddatasourcesonthelocal/regionallevel.Inordertodo
so, firstly,contextspecificdatagapsatnationaland local levelweredescribed inordertosec-
ondly,assesseslimitationsandconstraintsoftheanalysis.
Theprocessofgatheringlocal/regionaldatainGermanyischallenging.Thevastmajori-
tyofavailabledatadoesnotfocuseitherontheproject’sagegroup(18-29-year-old)ordoesnot
correspond to the project’s research unit of the Functional Regions. Governmental funded re-
search,suchasthe‘Bildungsbericht’(federalreportoneducation)orthe‘Berufsbildungsbericht
2017’(federalreportonvocationaleducation)of theBundesministeriumfürBildungundFor-
schung,ispublicavailable,however,thestudiesrarelyfocusontheregionallevel.Theymainly
collectandanalysedatainlargerunits,especiallythecomparisonofEastversusWestGermany
andthefederallevel(‘Länder’),focusingmainlyonthereunificationanditsaftermathwiththe
developmentofEastcomparedtoWestGermany.Thisapproachofdatacollectionmirrors the
traditionalpath-dependenciesofGermanysadministrationunits:regionalvariationsbelowthe
federal level are the responsibilityof the federalunits (‘Ländersache’), and therefore it seems
Page 194
42
thatlargerstudiesfocusonratherbroaderadministrativelevels.Undoubtedly,wecanalsofind
studiesusing smallerunits, however, the representativeness is limited.This challengeunfolds
differentlyontheFunctionalRegionsBremenandRhein-Mainasdescribedinthemethodologi-
calapproach(cf.chapter2).Asaresult,thesystematicintroductionoftheregionallevelingov-
ernmentalfundedresearchhasstilltobemade.
Although the governmental reportsmainly focus on larger research units, the govern-
mental statistical registers provide a broad variety of data on smaller research units, such as
districtsandcities(cf.chapter2).Forthelocaldatacollection,thegovernmentalstatisticalregis-
terswereusedforseveralreasons:
1. regardingthechosenindicatorstheregisterscomecloseenoughtotheregional/local
level,
2. theyofferlongitudinaldatasets,and,
3. theinformationisspecificenoughinordertopermitinterpretation.
Thedatainformationsystemsoftheregistersallowaquickandto-the-pointdatagathering,thus
providingabroadvarietyofspatialcustomizingoftheindicatorsonanoperationallevelasop-
posedtoediteddatareportsbyvariousfederaland/orregional/localagenciesmainlyfocusing
onthenationallevel.Theregistersmergedatafromofficialstatisticsandensureboth,dataac-
cessibilityandrepresentativeness.Asmainsources,thefollowingregisterswereused:
• RegionalDatabaseGermany(RegionaldatenbankDeutschland)29,
• thestatisticalstateofficeBremen(StatistischesLandesamtBremen)30,and.
• theinteractiveonline-atlasoftheFederalInstituteforResearchonBuilding,Ur-
ban Affairs and Spatial Development (INKAR, der interaktive Online-Atlas des
BundesinstitutsfürBau-,Stadt-undRaumforschung)31.
Inordertodoso,mainlytheinteractiveonline-atlasINKARwasusedasitprovidedmostofthe
requireddatadrawingfromdifferentofficialregisters.AlthoughtheRegionalDatabaseGermany
–andthestatisticalstateofficeBremenprovidedetailedstatisticaldatafromvariousofficialsta-
tisticsintheformofstandardtables,theamountofdataislimited.Both,ontheindicatorlevelas
wellasonthedepthof theregionalcategory, the informationsystemshardlyallowa tailoring
and customizing for theneeded research scope. For this reason, it hasbeendifficult to access
datadescribingthetargetgroupathand:
1. Difficultaccessofdatadescribingthetargetgroup:Althoughallthreestatisticalregisters
offeravastamountofdemographicdataandinformationontheeducationalsystemas29Availableunder:https://www.regionalstatistik.de/genesis/online/data;jsessionid=E45863A21A7DB10816FA15E40C669472.reg1?operation=statistikenVerzeichnisNextStep&levelindex=0&levelid=1498395022977&index=1&structurelevel=3[lastaccess:23June2017]
30Availableunder:http://www.statistik.bremen.de/datenangebote-8409[lastaccess:23June2017]
31Availableunder:http://www.inkar.de/Default[lastaccess:10July2017]
Page 195
43
wellasthelabourmarketsystem,thedatacanhardlybecustomizedaccordingtotheage
ofourtargetgroup.Therefore,datacollectionforcommonindicatorsinGermanyseems
notsomuchaproblemofdataavailability,howevermoreatechnicalissueonthepossi-
bilityfortailoredandcustomizeddataaccessandrepresentation.
2. Indicatorsonyoungpeoples’attitudesarelargelymissingonlocallevel:Datatowardsla-
bourandpoliticallifearelargelymissingonlocallevel.Thisdataisavailableonthena-
tionalaswellasonthelevelofthefederalstates.Here,additionaldataalongtheageof
ourtargetgroupclosertothelocallevelisneededinordertoprovideacollatedpicture
ofthelivingconditionsofyoungadults.
3. Availableindicatorsreduceyoungadultsininformationsourcestoeducationandemploy-
ment:Theavailable indicatorsonyoungadult focusmainlyon theunemployment rate
andeducationalattainmentlevel, thecitizens’economiccontributiontosocietyaccord-
ing to their labourproductivity(GDP;GAV),unemploymentrates,accessandoutputof
theeducationalsystem.Thus,thecontextualinformationisreducedtotheparticipation
tothelabourmarket.
Asaresult,youngadultsaremainlyinvisiblethestatisticaldatasets.Thedatagatheringprocess
oflocaldataisconfrontedwithaclassificationproblemoftheofficialregistersthattailoryoung
adultsnotasan independent targetgroup.Thus, fromaCulturalPoliticalEconomy(CPE)per-
spective, theyoungadultsthemselvesareagapinthedatasets(cf.Weileretal.,2017a).They
are age-wise either groupedwithminors or adolescence, diminishing their position as in be-
tween.Althoughthisagegroupfacecrucialdevelopmentaltaskspertainingcareerbuilding,fam-
ilygainingindependenceandtakingonresponsibility(Weileretal.,2016).Mostofthedatasets
clustertheyoungadultsintotwoagegroups:intheagerangeeitherof15-25or18-25-year-old.
Forexample,INKAR(2017)includestheagegroup‘youngunemployedpeople’,comprisingthe
agegroupbetween15and25.Onlyforthedemographicindicator‘inhabitants’thedataisalso
systematized along the age group of 25-30. However, above the age of 25, young adults are
groupedwith adults. Theseprocesses of classificationmerge the young adultswith older citi-
zens,most likelymore established in terms of career, family planning and personal develop-
ment. Therefore, the classification of young adults produces different degrees of visibility, or
ratherinvisibility.
The invisibility/visibilityof youngadultspertainswhetherornot theyare considered
importantinpolicymakingprocesses.Thishasahighinfluenceonfuturedecision-makingpro-
cesses (cf.Bowker&Star,2000)andcan, ifdeveloped intostandards, representcertainsocial
choiceswhich impose ethical and political implications, especially affecting thosewho are se-
lected–orinthiscasenotselected(cf.Lampland&Star,2009).Thisbecomesevenmorepromi-
nentasmost indicatorsarenot separatelyavailablealong thedifferentagegroups,but rather
alongthe institutions, theyareembedded in.Forexample,regardingthedimensioneducation,
Page 196
44
wefindabroadvarietyofdifferentdatasets,suchasparticipationrate intheeducationaland
vocationaltraininginstitutions,however,notexplicitlysystematizedalongtheagegroup.Here,
the different age groups are covered by a notion of standardized age-trajectories in passing
throughinstitutionalpathways.
Againstthisbackgroundofdatamismatchesontheageandregionallevel,thestatistical
dataonyoungadultsaremissingcrucialinformationinordertoinformLLLpolicies.First,local
structuraldataonyoungadultsispotentiallyavailable,howevernotrepresentedalongourage
group.Forfurtherdataanalysis,itwouldbehelpfulifthestatisticalregisterswouldallowatai-
lored and customized data collection. Second, more subjective indicators on a local level are
needed inorder todescribe theyoungadults livingconditionsbeyondeducation, trainingand
development.Indoingso,otherimportantfactorsforsocialinclusionandparticipationcouldbe
considered.Therefore,thequestionarises,howcurrentLLLpoliciesarefittingintoyoungadults’
socialrealitiesasthestatisticalbasisofinformationisnottailoredalongtheneededinformation.
Thegatheringofmoreinformationisonlypartiallytheanswer,suchassubjectiveindicatorson
jobsatisfaction,butmoreaquestionofdatarepresentation.
Thefollowingchapterprovidesconcludingremarksandemergingissues.
5. Emergingissues
InthissectionoftheBriefingPaperwewanttopointoutspecificissuesthatcameupduringthe
analysisandare relevant for thecontextof theproject.The first issue reflects thedataquality
andquantityandtherelationshipbetweennationalandEuropeandata(cf.chapter4).Thereare
bigdatagapsindifferentdimensionsonNUTS2andNUTS3-levelthatshouldbeaddressedin
thecomingyears.Thebiggestgapsareinthesubjectofhealtheventhoughtherehavebeenre-
searchersinthefieldofPublicHealthcomplainaboutthepoordataqualityandquantityforthe
past20years(cf.Prüss-Üstünetal.,2006).TheRobertKoch-Institute,whichisresponsiblefor
nationalhealthmonitoring,doesnotpublishhealthdataonaregionallevelduetotheirstand-
ardsinnecessarycasenumbers.Inrecentyears,theGermangovernmentestablishedandwid-
enedanationalhealthmonitoring(Gesundheitsberichterstattung)butaccordingtoamemberof
theRobertKoch-Institute,thesedataarenotcollectedanddesignedwithrespecttotheNUTS-
Level.OnlyinBavaria,thesituationisslightlybetter(cf.BLGL,2017).Butalsointherealmsof
socialpolicyand labourmarketpolicyrelevantdataatNUTS2-levelaremissing.Additionally,
thedatarepresentationontheregionalaswellasagelevelofourtargetgroupischallenging,as
thedata is potentially available, however, thedata output of the registers is not customisable
alongtheresearchinterest.Asaresult,theregistersaggregationofyoungadultsdiffersfromthe
projectsscope,whichcancausedatadistortion.
Page 197
45
Asecondbigissueistheroleofthefamilyasaveryimportantresourceforyoungadults.
Ontheonehand,familiesareinsomedimensionsimplicitlypictured,forinstanceregardingthe
ratioofyoungadultsliving–voluntarilyorinvoluntarily–togetherwiththeirparentsorregard-
ingearlypregnancies.Ontheotherhand,thefamilysupportismoreorlessinvisibleinthedata.
Weassumethatmostoftheriskfactorsforyoungadultsarebufferedbythefamilysupport,for
instance regarding childcare foryoungmothersormaterial support forunemployedsonsand
daughters. The importance of the family support system highlights the notion of the German
conservative welfare state along the principle of subsidiarity (cf. Parreira do Amaral et al.,
2017b,p.17;cf.sub-chapter3.5).However,itseems,thatthecontributionofthefamilyforthe
youngadults’lifecourseisnotmirroredbythedata,butrathertheyoungadults’contributionto
thesocietythrougheducationandemployment.
Inconclusion,statisticaldataavailableonthelivingconditionsofGermanyoungadultsis
mainlycollectedatnationallevelandusuallyrestrictedtoeducationandemploymentindicators,
glossingoverothercrucialaspectsoftheirlifecourses.Thedatalargelyinformsonthedifferent
school tracks, thetrainingopportunities, theunemployment/employmentratesandthesocial
securitysystem.Againstthisbackground,basedonthedatareviewedtheGermancontextcanbe
describedasanemployment-centredtransitionregimewhereyoungadults’autonomyischarac-
terisedbyalowlevelofstatesupportbuthighfamilysupport(ParreiradoAmaralet.al.,2017b,
p. 22;Walther & Pohl, 2005;Walther, 2006). Therefore, young adults’ citizenship can be de-
scribedasa ‘monitoredcitizenship’,withtheoverallaimtoexpeditetheirtransitionintowork
alonghighly institutionalisededucationand training systems (Chevalier2016,p.14ff.; cf. Par-
reiradoAmaraletal.,2017b,p.21).
Page 198
6. References
Allmendinger,J.,&Leibfried,S.(2003).Educationandthewelfarestate:thefourworldsofcompetenceproduction.JournalofEuropeansocialpolicy,13(1),pp.63-81.
Autor,D.H.,Levy,F.&Murnane,R.J.(2003).Theskillcontentofrecenttechnologicalchange:Anempiricalexplora-tion.TheQuarterlyJournalofEconomics,118(4),pp.1279–1333.
AutorengruppeBildungsberichterstattung(2016).BildunginDeutschland2016.EinindikatorengestützterBerichtmiteinerAnalysezuBildungundMigration.Bielefeld2016.availableunder:https://www.bildungsbericht.de/de/bildungsberichte-seit-2006/bildungsbericht-2016/pdf-bildungsbericht-2016/bildungsbericht-2016[latestaccess:16July2017].
Bauer,U.(2009).SozialeUngleichheitenindergesundheitlichenVersorgung.InternationaleForschungsbefundeundtheoretischeZugänge.ZeitschriftfürSozialreform,55(4),pp.389-407.
Bauer,U.,Bittlingmayer,U.H.&Richter,M.(eds)(2008).HealthInequalities.Wiesbaden:Springer.
Beck,V.(2008).Unemployedwomenandtheirroles–RevisitingolddebatesandGermanexamples.Exaequo[online],n.18,pp.39-55.Availableunder:http://www.scielo.mec.pt/scielo.php?script=sci_arttext&pid=S0874-55602008000200003&lng=en&nrm=iso[latestaccess26Sept.2017].
Biggart,A.,Järvinen,T.,&ParreiradoAmaral,M.(2015).InstitutionalframeworksandstructuralfactorsrelatingtoeducationalaccessacrossEurope.EuropeanEducation,47(1),pp.26-45.
Bilger,F.(2012).(Weiter-)BildungsbeteiligungfunktionalerAnalphabet/inn/en.GemeinsameAnalysedesAdultEdu-cationSurvey(AES)undderleo.–LevelOneStudie.InGrotlüschen,A.&Riekmann,W.(eds.).FunktionalerAnalphabe-tismusinDeutschland.Ergebnissedererstenleo.–LevelOneStudie.Münster:Waxmann,pp.254-275.
Bittlingmayer,U.H.,Bauer,U.,Richter,M.&Sahrai,D.(2009).DieÜber-undUnterschätzungvonRauminPublicHealth.DeutscheZeitschriftfürKommunalwissenschaft.BrennpunktheftPrekarität,SegregationundArmutimSozial-raum,48(2),pp.21-34.
Bittlingmayer,U.H.;Boutiuc-Kaiser,A.;Heinemann,L.;Kotthoff,H.-G.,Verlage,T.&Walther,A.(2016a).WorkPackage3.LifelongLearningPolicies:Mapping,ReviewandAnalysis.NationalReport:Germany.
Bittlingmayer,U.H.;Kotthoff;Heinemann,L.&Rambla,X.(2016b).TargetGroups.YOUNG_ADULLLTGlossaryEntry.Münster:WestfälischeWilhelms-UniversitätMünster.Availableunder:http://www.young-adulllt.eu/glossary/listview.php?we_objectID=215[latestaccess:22Sept.2017].
Bittlingmayer,U.H.;Boutiuc,A.F.,Heinemann,L.&Kotthoff,H.-G.(2016c).JumpingtoConclusions—ThePISAKnee-Jerk:SomeRemarksontheCurrentEconomic-EducationalDiscourse.EuropeanEducation,48(4),pp.294-305.
BLGL[BayerischesLandesamtfürGesundheitundLebensmittelsicherheit](2017):Gesundheitregional.DerBayeri-scheGesundheitsatlas.Band6derSchriftenreiheGesundheitsberichterstattungfürBayern.Erlangen:o.V.
Bowker,G.C.&Star,S.L.(2000).SortingThingsOut:ClassificationandItsConsequences.Cambridgeetal.:MITPress.
Buchholz,S.&Kurz,K.(2008).ANewMobilityRegimeinGermany?YoungPeople’sLaborMarketEntryandPhaseofEstablishmentSincetheMid-1980s.InH.-P.Blossfeld,S.Buchholz,E.Bukodi&K.Kurz(eds.).YoungWorkers,Globali-zationandtheLaborMarket.ComparingEarlyWorkingLifeinElevenCountries.Cheltenham&Northamption:EdwardElgar,pp.51-76.
BundesagenturfürArbeit(2017).UnemploymentBenefitII(ArbeitslosengeldII)/SocialBenefit(Sozialgeld)asof13.02.2017.Availableunder:https://www3.arbeitsagentur.de/web/content/EN/Benefits/UnemploymentBenefitII/Detail/index.htm?dfContentId=L6019022DSTBAI485759[latestaccess:22Sept.2017].
Page 199
47
BundesministeriumfürBildungundForschung(Eds.):Berufsbildungsbericht2017.Bonn,März2017,availableunder:https://www.bmbf.de/pub/Berufsbildungsbericht_2017.pdf[latestaccess:16.July2017].
BundeszentralefürpolitischeBildung(bpb)(2013).BeschäftigtedesöffentlichenDienstes.Availableunder:http://www.bpb.de/nachschlagen/zahlen-und-fakten/soziale-situation-in-deutschland/61714/oeffentlicher-dienst[latestaccess:22Sept.2017].
Checchi,D.,vandeWerfhorst,H.,Braga,M.,&Meschi,E.(2014).ThePolicyResponse:Education.ChangingInequali-tiesandSocietalImpacts.InB.Nolan,W.Salverda,D.Checchi,I.Marx,A.McKnight,I.G.Tóth,H.G.vandeWerfhorst(eds.)ChangingInequalitiesinRichCountries:AnalyticalandComparativePerspectives.Oxford,OxfordUniversityPress,pp.294-326.
Chevalier,T.(2016).Varietiesofyouthwelfarecitizenship:Towardsatwo-dimensiontypology.JournalofEuropeanSocialPolicy,26(1),pp.3-19.
Ditton,H.(2013).WergehtaufdieHauptschule?PrimäreundsekundäreEffektedersozialenHerkunftbeimÜber-gangnachderGrundschule.ZeitschriftfürErziehungswissenschaft,16(4),pp.731–749.
Dixon,K.(1999).DieEvangelistendesMarktes.Konstanz:UVK.
Dixon,K.(2000).EinwürdigerErbe.Konstanz.UVK.
Dörre,K.(2018).DieneuenVagabunden.PrekaritätinreichenGesellschaften.InBittlingmayer,U.H.,Demirovič,A.&Freytag,T.(eds.).HandbuchKritischeTheorie.Bd.1.Wiesbaden:SpringerVS(inpress).
Esping-Andersen,G.(2014).ThreeWorldsofWelfareCapitalism.InC.Pierson;F.G.Castles&I.K.Naumann(eds.)TheWelfareStateReader.Cambridge&Malden:PolityPress,pp.136-149.
Eurofound(2015).Socialinclusionofyoungpeople.PublicationsOfficeoftheEuropeanUnion,Luxembourg.
FHB[FreieHansestadtBremen](2015).StatistischesJahrbuch.Bremen:StatistischesLandesamt.
Fischer,AnnaC.;Larsen,Christa(2017).BetrieblicheAusbildunginHessen2016*IAB-Betriebspanel-ReportHessen.(IAB-BetriebspanelHessen,2017,01),FrankfurtamMain,25S.
Gerdes,J.&Bittlingmayer,U.H.(2012).AssimilationundWissensgesellschaft.BildungsgesteuerteIntegrationsimpe-rativeimdeutschenparteipolitischenDiskursseitdenDebattenumdasZuwanderungsgesetz.SociologiaInternationa-lis,49(1),pp.103-138.
Goebel,P.(1996).KontrazeptionundKonzeptionalsKonfliktlösung.InBundeszentralefürgesundheitlicheAufklä-rung(eds.).Kontrazeption,Konzeption,Kinderoderkeine.DokumentationeinerExpertenbefragung,Köln,pp.142-147(=ForschungundPraxisderSexualaufklärungundFamilienplanung.Bd.6).
Grek,S.(2009).Governingbynumbers:thePISA‘effect’inEurope.JournalofEducationPolicy,24(1),pp.23-37.
Grotlüschen,A.(2012).LiteralitätundErwerbstätigkeit.InGrotlüschen,A.&Riekmann,W.(eds.).FunktionalerAnal-phabetismusinDeutschland.Ergebnissedererstenleo.–LevelOneStudie.Münster:Waxmann,pp.135-165.
Hackauf,H.&Jungbauer-Gans,M.(eds.)(2008).GesundheitspräventionbeiKindernundJugendlichen.GesundheitlicheUngleichheit,GesundheitsverhaltenundEvaluationvonPräventionsmaßnahmen.Springer:Wiesbaden.
Hahn,T.,Sydow,H.,Schlegel,U.&Helmke,A.(1995).FrauenundArbeitslosigkeit.InSydow,H.,Schlegel,U.&Helmke,A.(eds.).ChancenundRisikenimLebenslauf.BeiträgezumgesellschaftlichenWandelinOstdeutschland.AkademieVerlag:Berlin,pp.171-186.
Hall,P.A.&Soskice,D.(2001).TheVarietiesofCapitalism:TheInstitutionalFoundationsofComparativeAdvantage.Oxford:OxfordUniversityPress.
Höfer,R.&Straus,F.(2001).ArbeitsorientierungundIdentität:DieveränderteBedeutungvonErwerbsarbeitfürdieIdentitätsarbeitamBeispielbenachteiligterJugendlicher/jungerErwachsener.InB.Lutz(eds.).Entwicklungsperspek-
Page 200
48
tivenvonArbeit:ErgebnisseausdemSonderforschungsbereich333derUniversitätMünchen,AkademieVerlag:Berlin.pp.83-105.
IndikatorenundKartenzurRaum-undStadtentwicklung.INKAR.Ausgabe2017.(eds.):BundesinstitutfürBau-,Stadt-undRaumforschung(BBSR)imBundesamtfürBauwesenundRaumordnung(BBR)-Bonn2016.©2017BundesamtfürBauwesenundRaumordnung,Bonn.
Kambourov,G.&Manovskii,I.(2009).OccupationalSpecificityofHumanCapital.InternationalEconomicReview,50(1),pp.63-115.
Keddi,B.&Pfeil,P.(1999).LebensthemenjungerFrauen.DieandereVielfaltweiblicherLebensentwürfe.EineLängs-schnittuntersuchunginBayernundSachsen.Opladen:LeskeundBudrich.
Kohlrausch,B.(2012).DasÜbergangssystem–ÜbergängemitSystem?InBauer,U.,Bittlingmayer,U.H.&Scherr,A.(eds.).HandbuchBildungs-undErziehungssoziologie.Springer:Wiesbaden,pp.595-609.
Kotthoff,H.-G.,CarrilloGáfaro,J.F.,Bittlingmayer,U.H.,Boutiuc,A.F.,ParreiradoAmaral,M.,Rinne,R.(2017).WorkPackage3.LLLpoliciesandInclusioninEducationandWork.InternationalReport.WorkingPapers.Freiburg,Münster,Turku:UniversityofEducationFreiburg,UniversityofMünster&UniversityofTurku.
Kraemer,K.&Bittlingmayer,U.H.(2001).SozialePolarisierungdurchWissen.ZumWandelderArbeitsmarktchan-ceninderWissensgesellschaft.InBerger,P.A.&Konietzka,D.(eds.)DieErwerbsgesellschaft.NeueUngleichheitenundUnsicherheiten.Springer:Opladen,pp.313-329.
Kroll,L.(2010).SozialerWandel,sozialeUngleichheitundGesundheit.DieEntwicklungsozialerundgesundheitlicherUngleichheiteninDeutschlandzwischen1984und2006.Springer:Wiesbaden.
LampertTh.&KrollL.E.(2014).SozialeUnterschiedeinderMortalitätundLebenserwartung.RobertKoch-Institut(eds.)Berlin.GBEkompakt5(2),Availableunder:www.rki.de/gbe-kompakt[latestaccess:07April2014].
Lampert,Th.(2016).SozialeUngleichheitundGesundheit.InRichter,M.&Hurrelmann,K.(eds.)SoziologiederGe-sundheitundKrankheit.Springer:Wiesbaden,pp.121-137.
Lampert,Th.,Kuntz,B.Hoebel,J.Müters.S.&Kroll,L.E.(2016).GesundheitlicheUngleichheit.InStatistischesBun-desamt(Destatis),WissenschaftszentrumBerlinfürSozialforschung(WZB),Sozio-oekonomischesPanel(SOEP)(eds.).Datenreport2016.EinSozialberichtfürdieBundesrepublikDeutschland.Bonn:BundeszentralefürpolitischeBildung/bpb,pp.302-314.
Lampland,M.&Star,S.L.(2009).StandardsandTheirStories:HowQuantifying,Classifying,andFormalizingPracticesShapeEverydayLife.Ithaca&London:CornellUniversityPress.
Lessenich,St.(2009).DieNeuerfindungdesSozialen.TranscriptVerlag:Bielefeld.
Lohnspiegel(2017).Availableunder:https://www.lohnspiegel.de/html/[latestaccess:16Sept.2017].
MAIS[MinisteriumfürArbeit,IntegrationundSozialesdesLandesNRW(2017).Tarifregister.Availableunder:http://www.tarifregister.nrw.de/pdf/tarifspiegel.pdf[latestaccess:16Sept.2017].
MielckA(2005).SozialeUngleichheitundGesundheit.EinführungindieaktuelleDiskussion.Bern:HansHuber.
OECD(2016b).SocietyataGlance2016:OECDSocialindicators.ASpotlightonYouth.OECDPublishing,Paris.Availa-bleunder:http://dx.doi.org/10.1787/9789264261488-en[latestaccess:10July2017].
OECD(2011).GrowingIncomeInequalityinOECDCountries:WhatDrivesitandHowCanPolicyTackleit?Availableunder:https://www.oecd.org/els/soc/47723414.pdf[latestaccess:16Sept.2017].
Øivind,A.N.&HolmReiso,K.(2011).ScarringEffectsofUnemployment.DiscussionPaperNo.6198.December2011.Bonn:ForschungsinstitutzurZukunftderArbeitInstitutefortheStudyofLabor,Availableunder:http://ftp.iza.org/dp6198.pdf[latestaccess:24Sept.2017].
Page 201
49
ParreiradoAmaral,M.,Schaufler,S.&Weiler,A.incollaborationwithApostolov,G.,Panzer,O.&Bresch,N.(2017a).WorkingPaperonEthicalIssuesYOUNG_ADULLLTWorkingPaper.Münster:WestfälischeWilhelms-UniversitätMün-ster.
ParreiradoAmaral,M.,Schaufler,S.&Weiler,A.(2017b).DocumentationofDatabase.YOUNG_ADULLLTWorkingPaper.Münster:WestfälischeWilhelms-UniversitätMünster.
Pawson,R.&Tilley,N.(1997).RealisticEvaluation.London:Sage.
Piketty,Th.(2014).Capitalinthe21stCentury.London:BelknapPr.
Powell,J.J.&Pfahl,L.(2012).SonderpädagogischeFördersysteme.InBauer,U.,Bittlingmayer,U.H.&Scherr,A.(eds.)HandbuchBildungs-undErziehungssoziologie.Springer:Wiesbaden,pp.721-739.
Prüss-Üstün,A.,Stein,C.&Zeeb,H.(2006).GlobaleKrankheitslast.Daten,TrendsundMethoden.InRazum,O.,Zeeb,H.&Laaser,U.(eds.)Globalisierung–Gerechtigkeit–Gesundheit.Bern:Huber,pp.27-42.
Richter,M.&Hurrelmann,K.(eds.)(2006).GesundheitlicheUngleichheit.Springer:Wiesbaden.
Riekmann,W.&Buddeberg,K.(2016).Handlungsempfehlungen.In:Riekmann,W.,Buddeberg,K.&Gortlüschen,A.(eds.)DasmitwissendeUmfeldvonErwachsenenmitgeringenLese-undSchreibkompetenzen.Münster:Waxmann,pp.199-205.
RobertKoch-Institut(eds.)(2015).GesundheitinDeutschland.GesundheitsberichterstattungdesBundes.GemeinsamgetragenvonRKIundDestatis.RKI,Berlin.
Roos,M.W.M.(2009).DiedeutscheFiskalpolitikwährendderWirtschaftskrise2008/2009.PerspektivenderWirt-schaftspolitik,10(4),pp.389–412
Shavit,Y.&Müller,W.(eds.)(1998).FromSchooltoWork.AComparativeStudyofEducationalQualificationsandOc-cupationalDestinations.Oxford:ClarendonPress.
Solga,H.&Wagner,S.(2001).ParadoxiederBildungsexpansion.DiedoppelteBenachteiligungvonHauptschülern.ZeitschriftfürErziehungswissenschaft,4(1),pp.107–127.
Söllner,René(2016).TheGermanMittelstandintheageofglobalisation.StatistischesBundesamt(FederalStatisticalOffice).GermanversionpublishedinWISTA2/2016,p.107etseq.Availableunder:https://www.destatis.de/EN/Publications/WirtschaftStatistik/TheGermanMittelstand_Soellner_022016.pdf?__blob=publicationFile[latestaccess:10July2017].
Sozialgesetzbuch(SGBII)ZweitesBuch–GrundsicherungfürArbeitsuchende–§22SGBIIBedarfefürUnterkunftundHeizunginderFassungderBekanntmachungvom13.5.2011I850,2094;ZuletztgeändertdurchArt.158Gv.29.3.2017I626.
StatistikderBundesagenturfürArbeit(2017).GrundsicherungfürArbeitsuchendenachdemSGBII,Bedarfe,Leistun-gen,Einkommen-DatennacheinerWartezeitvon3Monaten,Nürnberg,März2017.
StatistikderBundesagenturfürArbeit(eds.).ArbeitsmarktinZahlen,AusgabenfüraktiveundpassiveLeistungenimSGBII,Nürnberg,November2016.
StatistischesBundesamt(2016).ÄltereMenscheninDeutschlandundderEU.Wiesbaden,Juli2016.Availableunder:https://www.destatis.de/DE/Publikationen/Thematisch/Bevoelkerung/Bevoelkerungsstand/BroschuereAeltereMenschen0010020169004.pdf?__blob=publicationFile[latestaccess:22Sept.2017].
StatistischesBundesamt(2017).Pressemitteilungvom22.Juni2017–208/17.Availableunder:https://www.destatis.de/DE/PresseService/Presse/Pressemitteilungen/2017/06/PD17_208_741pdf.pdf?__blob=publicationFile[latestaccess:22Sept.2017].
Stein,Z:&andSusser,M.(2000).Therisksofhavingchildreninlaterlife.WestJMed.,173(5),pp.295–296.
Page 202
50
Walther,A.&Pohl,A.(2005).ThematicStudyonPolicyMeasuresconcerningDisadvantagedYouth.FinalReportfortheEuropeanCommission.IRISe.V.,Tübingen.Availableonlinehttp://d-nb.info/1029653178/34[latestaccess:26Sept.2017].
Walther,A.(2006).Regimesofyouthtransitions:Choice,flexibilityandsecurityinyoungpeople'sexperiencesacrossdifferentEuropeancontexts.YOUNG,14(2),pp.119-139.
Weiler,A.,Wutzkowsky,F.&ParreiradoAmaral,M.(2016).YoungAdult.YOUNG_ADULLLTGlossaryEntry.Münster:WestfälischeWilhelms-UniversitätMünster.Availableunder:http://www.young-adulllt.eu/glossary/listview.php?we_objectID=219[latestaccess:22Sept.2017].
Weiler,A.,Schaufler,S.,ParreiradoAmaral,M.,GanterdeOtero,J.P.&Wutzkowsky,F.(2017a).LaunchingandRe-searchDesign.StateoftheArtReport.YOUNG_ADULLLTWorkingPaper.Münster:WestfälischeWil-helms-UniversitätMünster.
Weiler,A.,GanterdeOtero,J.P.,ParreiradoAmaral,M.incollaborationwithBoutiuc-Kaiser,A.,Schaufler,S.,Verlage,T.(2017b).ComparativeAnalysisSkillsSupplyandDemand.NationalReport:Germany.YOUNG_ADULLLTWorkingPapers.Münster:WestfälischeWilhelms-UniversitätMünster.
Wilkinson,R.(2005).Theimpactofinequality.Howtomakesicksocietieshealthier.NewYork,London.
Wittel-Fischer,B.(2000).DieungestillteSehnsuchtnachSchwangerschaftundMutterschaft?EinvergessenesThemainderSexualpädagogik.In.BundeszentralefürgesundheitlicheAufklärung(eds.).DokumentationderFachtagungzurSexualpädagogischenMädchenarbeit.19.-21.Juni2000,pp.110-113.
Wutzkowsky,F.&Weiler,A.(2016).Vulnerability.YOUNG_ADULLLTGlossaryEntry.Münster:WestfälischeWilhelms-UniversitätMünster.Availableunder:http://www.young-adulllt.eu/glossary/listview.php?we_objectID=218&pid=187[latestaccess:22Sept.2017].
Page 203
H2020-YOUNG-SOCIETY-2015 YOUNG_ADULLLT Deliverable 4.1
1
Work Package 4
Quantitative Analysis Young Adults’ Data
National Report Italy
University of Genoa (UNIGE)
Mauro Palumbo, Anna Siri, Mauro Migliavacca
Project Coordinator: Prof. Dr. Marcelo Parreira do Amaral (University of Münster)
Project no.: 693167
Project acronym: YOUNG_ADULLLT
Project duration: 01/03/2016 to 28/02/2019 (36 months)
Type of document: National Report
Delivery date: Month 19
Dissemination level: Public
Page 204
H2020-YOUNG-SOCIETY-2015 YOUNG_ADULLLT Deliverable 4.1
2
TableofcontentsExecutivesummary................................................................................................................................................................................3Introduction..............................................................................................................................................................................................5Descriptionofthedatacollatedandqualitydataassessment............................................................................................51. Demographicstructure..............................................................................................................................................................62. Structureoftheeconomy..........................................................................................................................................................83. Education........................................................................................................................................................................................114. Labourmarket..............................................................................................................................................................................185. Redistributionandsocialinclusion.....................................................................................................................................246. Healthandwell-being...............................................................................................................................................................267. Conclusions....................................................................................................................................................................................28References................................................................................................................................................................................................30
Figures
Figure1-Cruderateofnetmigration(1per1000)................................................................................................................7Figure2-Earlyschoolleversatnationalandregionallevels(percent)......................................................................12Figure3-ThereareclearimprovementsinschoolresultsbuttheyarestillbelowtheOECDaverage.........14Figure4-Highereducationparticipationandincentivestoinvestarelow...............................................................15Figure5-Thelevelofskillsmismatchishigh..........................................................................................................................16Figure6-NEETsatnationalandfunctionalregion’slevels(percent)..........................................................................18Figure7-PeopleatriskofpovertyorsocialexclusionbyNUTS2regions,2012-2015......................................26Figure8-Italy’swell-being.............................................................................................................................................................27
TablesTable1-Economicsectors,shareofeconomicsectorsinGDPvalueadded(percentofGDP)............................9Table2-Labourproductivityperhourworked(ESA2010).Percentagechangeonpreviousperiod...........10Table3-GDPatcurrentmarketprices,EuroperinhabitantinpercentofEuropeanaverage..........................10Table4-Netsocialprotectionbenefits.......................................................................................................................................24
Page 205
H2020-YOUNG-SOCIETY-2015 YOUNG_ADULLLT Deliverable 4.1
3
Executivesummary
Themainfindingsofthein-depthreviewcontainedinthiscountryreportareasfollows:
- Demographicstructures
From a demographic point of view, Italy is one of the oldest countries with the lowest
replacement rate. This makes the demographic stability and the same system of social
security more and more dependent on migrations, which, however, are today one of the
most serious problems for the Country. The old dependecy ratio confirms a worst
demographic dynamic in Liguria in comparison with Lombardy. Regarding the life
expectancyindicator,inLombardy(83.9onaverage),theindicatorshowsabettersituation
thaninLiguria(82,8onaverage),anywayhigherthanthegreatpartofItalianregions.
- Structureoftheeconomy
Productivity growth remains weak, slowing the correction of Italy’s macroeconomic
imbalances. It has been a problem for years. Making the labor market more flexible and
reducingtheindirectcostshavebeenconsideredapivotalpartofawiderstrategyaimedat
reducing high structural Italian unemployment. The focus on these two aspects, however,
hasovershadowedanother importantbutscantily investigated issue: themissingeffectsof
the innovation on productivity growth, as Italian industries preferred financiarization to
innovation.HighpublicdebtremainsamajorsourceofvulnerabilityforItaly,alsobecause
thespreadwithGermanBund(around1,6percent)makedebtheavier, itsreductionmore
difficult and investments for industries more expensive. Despite recent gains, the
competitiveness gap remains. The depreciation of the euro supported the stabilisation of
Italy’s export performance in recent years, togetherwith contained increases in producer
pricesandunitlabourcosts.
LombardyandLiguriaremainintheEUaveragewithregardstotheGDP,butwhilethefirst
oneisfirmlyaboveItalianandEUaverage,thesecondismuchclosertotheaverage.
- Educationsystem
Education reform is ongoing but tertiary education remains largely underfunded and
participationinadultlearningandapprenticeshipsislow.The2015reform,ifproperlyand
swiftly implemented, is expected to improve school outcomes. In particular, strengthened
apprenticeships and work-based learning aim to raise the labour-market relevance of
education. However, participation in adult learning remains a persistent concern, in
particularforthoseneedingitmost.Inspiteofrecentpartialmeasures,thehighereducation
systemsuffersfromsignificantunderinvestment.�
Page 206
H2020-YOUNG-SOCIETY-2015 YOUNG_ADULLLT Deliverable 4.1
4
Italylacksofshortdegrees(EQF5)makestheaveragerateofyoungwithtertiaryeducation
levellowerthanEUaverage(andfarfromtheLisboa2020target),butinthesametimethe
absence of technical short degrees causes the overqualification ofworkforce, because the
rateofdegrees thatdon’tuseenough theirqualification in the joc ishigh(more inLiguria
thaninLombardy),andtherateofhighlyeducatedyoungsthatmigratesisgrowing.
Ligurianstudentsperform less thanpeers inLombardy,but the resultsare lower thanEU
average.
- Youthandlabourmarket
Despitethegradualimprovementofthelabourmarket,long-termandyouthunemployment
remainhigh.Theimplementationoftheactivelabourmarketpoliciesreform,includingthe
reinforcement of public employment services, is still at an early stage. Also in the public
debate, mismatch prevails over the lack capacity of productive context to absorb skilled
workers.Inthelast15years,profitshaverisenandwageshavefallen,butcompaniesdidnot
devotetheirhighestprofitstogreaterinvestments.Inaddition,duetothehighpublicdebt,
despitearecentmodestreduction,thetaxburdenonproductionfactorsremainsamongthe
highestintheEU.InvestmentinItalysufferedasharperfallthaninmostMemberStates.The
declinewasbroad-based,butparticularlystronginnon-residentialinvestmentandservices.
Thepotentialoffemalelabourmarketparticipationremainslargelyunderutilised.Accessto
affordablechildcareremainslimitedwithwideregionaldisparities,paternityleaveisamong
the lowest in EU and the effectiveness of cash allowances for childcare has not been
assessed. Young people and women are confirmed theless protectedand needystrataof
society,evenifthefemaleemploymenthasdevelopedovertime(if lessthanthestrongEU
countries).�
The structureof the economyexplains a largepart of thedifferent internal outcomes. For
examples,aboutourfunctionalregions,thedatashowsthatinLiguriatheriskofpovertyand
socialexclusionishigherthaninLombardy.
- Redistributionandsocialinclusion
Significant barriers to competition remain in important sectors, including professional
services, local public services, concessions and the transport sector. The public sector is
beingreformedtotacklelongstandinginefficiencies.
Newsocialpolicieshavebeenputforwardtorespondtotherisingpovertyrate.Itisunclear
whether the financial resources will be sufficient to address Italy’s poverty challenge.
Activationpoliciesarenotyetwidespreadenough.Therateofpeopleatriskofpovertyor
socialexclusioniswellabovetheEUaverage,andisparticularlyhighforchildren,temporary
workersandindividualswithamigrantbackground.
Page 207
H2020-YOUNG-SOCIETY-2015 YOUNG_ADULLLT Deliverable 4.1
5
- Healthandwell-beingconditions
TheshareofprivatehealthexpenditureinItalywas24.5percentofthetotalin2015,equal
to Estonia and Finland. Health public expenditure in Italy was below other important
Europeancountries.IngenerallivingconditionsinLombardyarebetter,andthisevaluation
emergesbothfromobjectivedata,bothfromperceptionsofcitizens.Wemustconsiderthat
Liguria is the regionwith the oldest population, as said heavily affected by economic and
demographiccrisis,causedseriousdisturbanceineducationalandsocialsectors.Lessyoung
peopleinanageingcontextwithfeweropportunitiesandagreaterpartofpopulationatrisk
of social exclusion contribute also to lower levels of subjective well-being and lower
expectationsforthefuture.
To summarise, the current problems of the Italian economic and social context (low
productivity,highpublicdebt,inefficienciesinsomesectors,poorinnovation,populationageing,
overcrowdedsocialpolicycosts,oftenpassive)donotfavortheconditionofYoungAdults,who
toa largeextent continue to live in the family (78%ofpeopleaged20-29,vsaEUaverageof
55,4%).Inatimeofcrisissuchasthis,familiesarethemainsafetyvalve,reducingtheautonomy
ofyoungpeople.
IntroductionThenationalbriefingpaperoffersanoverviewof the livingconditionsofyoungadults in Italy
and,morespecifically, in the two functionalregionsselected for theYOUNG_ADULLLTproject,
theFunctionalRegionsofGenoaandofMilan.
Thelivingconditionsareexploredbyobservingthekeysetofindicatorsthatwasprovidedfor
the 6 dimensions: the demographic characteristics of the population, the structure of the
economy, the inputsandoutputsof theeducationand trainingsystem, the labourmarket, the
reditributionandsocialinclusionand,finally,thehealthconditionsandindividualwell-being.
Thedatawerenotallavailablefor2016andforthisreasonweoftenreferto2014or2015as
thelastdataaccessible.
DescriptionofthedatacollatedandqualitydataassessmentAhugeamountofharmonizedandcomparativedatahasbeencollectedbyOECDandEUROSTAT
sincetheyprovidemetadataandcompletedtimeseries.Mostoftheinformationareprovidedat
nationallevelandnotalldimensionshaveafairnumberofindicatorsatNUTS2andNUTS3level.
Moreover, the analysis of our two Functional Regionswith these data sets is a hard task for
Page 208
H2020-YOUNG-SOCIETY-2015 YOUNG_ADULLLT Deliverable 4.1
6
mainlytworeasons:a) theavailabledatadonotcoverall the indicatorsof thesixdimensions,
andb)theunitsofNUTS2and3donotmatchourFunctionalRegions.
Theeducationalandlabourmarketdatacollatedatnationalandlocallevelwereextractedalso
fromdifferentsurveyssuchas theEU-LFS,EU-SILC,PISAandPIAAC.Themaincorpusofdata
proceeding from international and harmonized data was successively complemented by data
collatedatthelocallevel,madeavailablebytheALMALAUREAdatasetandbyINVALSIsurveys,
aswellasbyofficialwebsitesofseveralItalianInstitutions(Ministers,regionalgovernmentand
Chambersoftrade).
Thedatarangesbetween2005and2015,butforsomeindicatorsespeciallyatnationallevelit
wascollectedmorerecentdata.Duetolimitedavailabilityofdataattheregional/locallevel,and
thehigh levelof the fragmentationofsources, thepossibilityofcomparison is limited insome
cases.
1. DemographicstructureItaly, with its 302,073 square kilometres, has 60,589,445 inhabitants according to the
calculations current as of December 31, 2016. The distribution of the population is widely
uneven.Inthelastyears,theItalianpopulationrecordedanegativevariationmainlyattributable
tothenaturaldynamicsandthemigrationslowdown.Thenaturalpopulationdifference(births
minus deaths) in the most recent year was negative by almost -142 thousand units. As the
balancewaspositiveforforeignnationals(almost+63thousandunits),fortheItalianonesthe
declinewasevenmoresignificant(-204,675units).
ThedeclineinthenumberofbirthsthatstartedintheSixtiesisstillgoingon.
Thedeathswereover615,000,almost32,000lessthanin2015.Thedecreasein2016wasdue
toahighlevelofmortalityregisteredinthepreviousyear.ThetwoFRsshowdifferentlevelsof
demographic decrease: in Genoa Functional Region the crude rate of natural change of
population in 2015 was -8.0 for thousand inhabitants, in Milan FR of -1.2; crude rate of net
migrationwas-1.3inGFRand+4.8inMFR.
In2016,theinternationalmigratorymovementdeterminedapositivebalanceofapproximately
144,000units,astablevaluecomparedtopreviousyears.Theattractivenessofthenorthernand
centralregionstowhichwereaddressedmostmigrationflows(bothinternalandfromforeign
countries)wasconfirmed.
Inthelastyears,migrationbecomesanimportantaspectofthedevelopmentofthepopulation,
affectingbothFunctionalRegionsevenly.
ThecruderateofnetmigrationdecreasedinLombardyuntil2008(-0.7),jumpedin2013to32.4
Page 209
H2020-YOUNG-SOCIETY-2015 YOUNG_ADULLLT Deliverable 4.1
7
percent(butonlyduetostatisticflow,andin2015decreasedto4.8.InLiguria,thecruderateof
netmigrationfluctuateduntil2012andthenroseupto26.3 in2013,andcollapsedinthe last
years(in2015-2.4percent).
Figure1-Cruderateofnetmigration(1per1000)
Source:Eurostat
From2005to2010thetotalfertilityrateinItalyincreasesfrom1.34to1.46andthentherate
began todecrease.Thenumbers in thehere focused in functional regionsareverynear these
average,butGFRshowsawortssituationthanMFR. In2015, thenumbersare1,33 inLiguria,
and1,46inLombardy.ThisseemstobeaEuropeanphenomenonaswell,astheEU-28average
increasesfrom1.51to1.62until2010,andinthelastyearstheratestartedaslowdecline(1,58
in2014).Themeanageatchildbearing-31.7yearsin2016-wasstabletothepreviousyear.
The old-dependency rate (ratio between population aged 65 and over to population 15-64)
increasedinItalyfrom29.4percentto34.3percentinthetimespan2005-2016.InLombardy,in
thesameperiodtherateroseupfrom28.5percentto34.2percent,whileinLiguriafrom42.2
percent to 46.8 percent. This indicator confirms a worst demographic dynamic in Liguria in
comparisonwithLombardy.
Life expectancy estimates for2016evidencedanewgrowthof the indicator forboth genders
(80.6 males, 85.1 females), after the exceptional decrease recorded between 2014 (reported
excessdeaths)and2015(males:+0.3comparedto2014,+0.5comparedto2015;females:+0.1
comparedto2014,+0.5comparedto2015).InLombardy(83.9onaverage),theindicatorshows
abettersituationthaninLiguria(82,8onaverage),anywayhigherthanthegreatpartofItalian
regions.
(10)
-
10
20
30
40
2005 2006 2007 2008 2009 2010 2011 2012 2013 2014 2015Italy Genova Milano
Page 210
H2020-YOUNG-SOCIETY-2015 YOUNG_ADULLLT Deliverable 4.1
8
Therateofyoungadultlivingwiththeirparentsrapidlyincreasedoverthelastdecade.In2013,
therateofyoungadults(20–29years)wholivewiththeirparentswas78percent,whichexceed
23 points the European average (55.4 percent), however in 2006 the rate was still at 72,8
percent(EU-2753.1percent).Weassumethatthisincreaseislinkedwiththereformsofsocial
programsandlabormarketsince2015.Livingathomewiththeirparentsisratherayoungmale
(83.4percentin2013)thanayoungfemaleissue(72.5percent).
2. StructureoftheeconomyTheItalianeconomyishistoricallycharacterizedbyadifferentterritorialdevelopment,usually
represented in three specific geographical areas: the developed industrial North, a less-
developedandwelfare-dependentagriculturalSouth,withhighunemployment,andtheCenter
area,moredominatedbysmallandmedium-sizefirms.Italyhasmovedslowlyonimplementing
needed structural reforms, such as the reduction of the public-sector costs, and increasing
employment opportunities for young workers, particularly women. The data of the different
economicsectors,putinevidencetheroleplayedbytheservicesector(accordingtoEuropean
trends)and,atthesametime,theroleplayedbytheagriculturesector,that,despitethereduced
impact,inItalyrepresentaninterestingareaofdevelopfornewentrepreneurshipactivities.
Page 211
H2020-YOUNG-SOCIETY-2015 YOUNG_ADULLLT Deliverable 4.1
9
Table1-Economicsectors,shareofeconomicsectorsinGDPvalueadded(percentofGDP)
Agriculture 2005 2006 2007 2008 2009 2010 2011 2012 2013 2014 2015 EU 28 1.8 1.7 1.7 1.64 1.49 1.62 1.68 1.68 1.74 1.65 1.6 Italy 2.25 2.17 2.1 2.07 1.98 1.97 2.1 2.19 2.33 2.16 2.25
Industry 2005 2006 2007 2008 2009 2010 2011 2012 2013 2014 2015 EU 28 26.46 26.73 26.62 26.14 24.61 24.96 25.03 24.75 24.49 24.37 24.50 Italy 25.83 26.15 26.49 26.13 24.27 24.37 24.21 23.87 23.7 23.38 23.53
Services 2005 2006 2007 2008 2009 2010 2011 2012 2013 2014 2015 EU 28 71.74 71.57 71.69 72.22 73.9 73.42 73.28 73.57 73.77 73.98 73.9 Italy 71.92 71.68 71.41 71.8 73.75 73.66 73.69 73.94 73.97 74.46 74.22 Source:Eurostat
The last international financial crisis worsened the economic conditions in Italy, with
unemployment rising from 6.2 percent in 2007 to 12.4 percent in 2015. In the longer-term
Italy’s low fertility rate and quota-driven immigration policies will increasingly strain its
economy.Ariseinexportsandinvestmentdrivenbytheglobaleconomicrecoverynevertheless
helpedtheeconomygrow.
The general framework of the productive structure of the Italian economy is marked by the
persisting financial crisiswhich causedadramatic fall in thenumberof enterprises.Although
thenumberofenterprisesper1,000inhabitantsdecreased,theiraveragesizeremainedstablein
2014atabout4employeesbyenterprise;micro-enterprisesthereforestillplayanon-negligible
roleintheentireproductivesystem.
TheItalianproductivesystemischaracterizedbyalargedegreeoffragmentation,togetherwith
a relative specialisation seen in themicro-enterprise service segment, accounting for over 30
percentofemployment.RegionsintheNorth-westareahadthehighestlevelsofwageadjusted
labourproductivity,while values lower than thenational averagewere recorded in the South
andIslandsarea.Thelowestvalueswererecordedintheconstructionsector.
TheItaliansocioeconomicbackgroundexpertisesomerelevantchangesinthelasttwentyyears.
Although the main indicators of inequality exhibit a stable trend until the explosion of the
currentcrisis,inthesameperiodmajorchangestakingplaceinternallyinItaliansocialstructure
anddynamicshavelargelyredrawnthemapofsocialrisks.InItaly,theeffectsofthecrisis(the
recent economic crisis and early ’90 crisis) was aggravated by a particularly slow economic
growththatconcernedproductivityandwageincreases,aswellaspeople’sstandardsof living
(Crouch1999,RanciandMigliavacca2015).Thelabourproductivitygrewinthemanufacturing
sector by less than 1 percent per year between1996 and2007 anddecreased after 2001. As
Page 212
H2020-YOUNG-SOCIETY-2015 YOUNG_ADULLLT Deliverable 4.1
10
regardswages,whilstinthe1970sand1980stheaveragegrowthhadbeen2.5percentperyear,
betweentheearliest’90andthefirstdecadeofthe2000thegrosspayofdependentlabourgrew
atarateof0.6percent–aslowdownwhichmeantthatwagescoulddonomorethankeepup
withtheinflationrate.
Table2-Labourproductivityperhourworked(ESA2010).Percentagechangeonpreviousperiod 2005 2006 2007 2008 2009 2010 2011 2012 2013 2014 2015 2016EU28 1.1 1.7 1 -0.4 -1.4 3.1 1.4 0.9 1 0.6 1.2 0.6Italy 0.6 0 -0.1 -0.7 -2.2 2.2 0.5 -0.3 0.9 0.2 -0.2 -0.8Source:Eurostat There was also an evident downturn in the standard of living: in the period 1995-2012, per
capitaGDPgrowthatmarketpriceswas lower in Italy than in themainEuropeancountries –
especiallyafter2001–which increased thedistancebetween Italyand itsprincipalEuropean
partners.Atthesametimebetween2006and2015thepercapitaGDPgrowthatmarketprices
decreased, while a positive variation was registered inmany European countries. Italy’s real
GDP growth recovered only modestly in 2014 and 2015 (0.1 percent and 0.7 percent
respectively), while growth in the rest of the euro area was significantly more dynamic (1.4
percentand2.3percentrespectively).This trendshowsthedifficultiesof the Italianeconomy,
difficultiessimilartotheotherssouthernEuropeancountries(especiallySpain).
AshighlightedbyEuropeanCommission in the last country report Italy2017, theunit labour
costdynamicsslowedsignificantlyinrecentyearsdespitenegativelabourproductivitygrowth.
Since 2010, nominal unit labour costs have slowed down in Italy and in 2014-2016 they
increased by less than 0.4 percent per year on average (as compared to 2.3 percent in 1999-
2013).Thesedevelopmentshelped to reduce slightly the cost competitivenessproblemof the
Italianeconomy in recentyears.Labourproductivitywasnegativealsodue tohistorically low
investmentlevels,whichturnedcapitaldeepeningnegative.
Table3-GDPatcurrentmarketprices,EuroperinhabitantinpercentofEU-28average
2006 2007 2008 2009 2010 2011 2012 2013 2014 2015
Δ2015-2005
EuropeanUnion(28countries) 100 100 100 100 100 100 100 100 100 100
Italy 108 107 107 106 104 104 102 99 97 96 -12Liguria 118 119 120 119 114 114 112 108 108 107 -11
Lombardy 138 137 140 138 138 137 134 129 128 127 -11Source:Eurostat
Theeconomicstructureof the territorial systemof theMetropolitanAreaofMilanselectedas
oneoftheFunctionalRegionsforYAprojectisquitecomplexduetothehighnumberofsectors
Page 213
H2020-YOUNG-SOCIETY-2015 YOUNG_ADULLLT Deliverable 4.1
11
and of supply chains for each sector. In the recent years, this area has been characterized by
differentvulnerabilityaspects(morespecifically,territorialdisparity,inequalitiesingenderand
education, social and spatial marginality) which nowadays are stressed due to the economic
crisiseffects.Ithasalsobeenaffectedbyade-industrializationprocess.TheMetropolitanCityof
Milanhasover296,000activeenterprises,themajorityofwhichoperateinthetertiarysector,
particularly in services, where there are over 146,000 units (49.6 percent of the total) and
1,032,000employees(55percent).Themanufacturingsectorcovers18.8percentofemployees,
with10.5percentoftheenterprises.Itisasystemingoodhealth,which,despitetheeconomic
recession,hasseenan increase in thenumberofenterprisesof3.4percent in the last5years,
withanoverallpositiveannualchangeandparticularlyinMilan(4.6percent).
TheMetropolitanAreaofGenoaselectedasthesecondFunctionalRegionischaracterizedbya
dynamicandspecializedport especiallywith regard to container traffic and itsnodalposition
with logistic trans-European and Mediterranean corridors. The Port of Genoa features an
uninterrupted22-kilometre coastline, and covers a total surface areaof6million sqmof land
and14.5millionsqmofseawater.
Accordingtothedata,LombardyandLiguriaremainintheEUaveragewithregardstotheGDP,
butwhilethefirstoneisfirmlyaboveItalianandEUaverage,thesecondismuchclosertothe
average.
3. EducationExpenditureoneducationandtrainingallowstoassesspoliciesimplementedforthegrowthand
optimizationofhumancapital.BothasaproportionofGDP(4.1percent)andasaproportionof
totalgeneralgovernmentexpenditure(7.9percent), theexpenditureoneducation in Italywas
among the lowest in the EU in 2014. Europe Strategy 2020 set some objectives for the
populationeducationlevels,whichourcountryhaspartiallyreachedin2016.
Students inTertiaryeducationrate ishigher inLombardy than inLiguria (61,7percentvs.56
percent) and this phenomenon is relevant because, in thepast, in Liguria families invested in
tertiary educationmore than other regions (Bini & Palumbo, 1990); Lombardy shows also a
higher percentage of pupils enrolled in vocational secondary education than Liguria (61,7
percentvs.54,3),asanadditionalproofoflabourmarketorientedchoicesoffamilies.Anyway,
thepercentageofpeopleaged30-34yearswithhighleveleducation(ISCED5-8)isstillhigherin
LiguriathaninLombardy(in201431.3percentvs25.9).
Theearlyschoolleavingratehasbeenonadownwardtrendsince2008.Thepercentageofearly
school leavers in 2016decreased to 13.8 percent (14.7 percent in 2015), thus surpassing the
Page 214
H2020-YOUNG-SOCIETY-2015 YOUNG_ADULLLT Deliverable 4.1
12
nationaltargetof16percentsetfor2020.However,therateremainsabovetheEUaverage(11
percent in 2015). It is interesting to note in this context that in Lombardy the ESL rate goes
downveryfast,whileinLiguriaincreasesforatimeforfallinginthelastyears,maybeduetothe
impact of foreigners. In fact, the gap is particularly high among foreign-born students,with a
rate of 31.3 percent compared to the EU average of 19 percent in 2015. Integrating students
withanimmigrantbackgroundisarelativelyrecentissueinItaly,butit isgainingimportance.
The proportion of foreign pupils in state schools reached 9.5 percent in 2015/2016, ranging
from 6.3 percent in upper secondary education to 11.4 percent in early childhood education.
There isalso in thesameyearasignificantgendergap,with therate forboysat17.5percent,
comparedto11.8percent forgirls,andawideningof thenorth-southdivideover the last five
years.
Figure2-Earlyschoolleversatnationalandregionallevels(percent)
Source:Eurostat
According to the 2015 school reform, one of the possible actions to tackling inequalities and
promotinginclusionisimprovingmigrantstudents’proficiencyinItalian.
Therehavebeenconsistentsignsofimprovementinthequalityofeducation.Scoresinreading,
mathand sciencesamong15-yearoldshave increased substantially and faster than theOECD
average, as measured by the OECD Programme for International Student Assessment (PISA).
However,averagelevelsofcompetencesproficiencyarestilllow.
0
5
10
15
20
25
2005 2006 2007 2008 2009 2010 2011 2012 2013 2014 2015 2016
EU28ESL ItalyESL LiguriaESL LombardiaESL
Page 215
H2020-YOUNG-SOCIETY-2015 YOUNG_ADULLLT Deliverable 4.1
13
Page 216
H2020-YOUNG-SOCIETY-2015 YOUNG_ADULLLT Deliverable 4.1
14
Figure 3 - There are clear improvements in school results but they are still below the
OECDaverage
Source:OECDPISA2006,2009,2012,2015
Inscienceliteracy,themaintopicofPISA2015,15-year-oldsinItalyscore481pointscompared
toanaverageof493pointsinOECDcountries.Boysperformbetterthangirlswithastatistically
significantdifferenceof17points (OECDaverage:3.5pointshigher forboys).Onaverage,15-
year-olds score 490 points in mathematics compared to an average of 490 points in OECD
countries.Boysperformbetter thangirlswithastatistically significantdifferenceof20points
(OECD average: 8 points higher for boys). In Italy, the average performance in reading of 15-
year-oldsis485points,comparedtoanaverageof493pointsinOECDcountries.Girlsperform
betterthanboyswithastatisticallysignificantdifferenceof16points(OECDaverage:27points
higherforgirls).
In thePisa2015 survey, there is no longerdata fromall regions,which canbe seen from the
INVALSIreport2016.From2012totodaytheresultsareworseandnotleast:Lombardylost16
reading points (521-505), nine points inmathematics (517-508),more than twenty points in
three years in science (529-503), but today it is still at the level of Switzerland and Ireland,
halfway between Singapore (556 points). Ligurian students perform less than peers in
Lombardy, but the results are lower than EU average. It is alsointeresting to note that since
thePISAtestsbeganin2000,LombardyperformsbetterthanLiguria.
Therearealsosignificantdifferencesinbasicskillsproficiency,asmeasuredbyProgrammefor
Page 217
H2020-YOUNG-SOCIETY-2015 YOUNG_ADULLLT Deliverable 4.1
15
InternationalAssessmentofAdultCompetencies(PIAAC).
Figure4-Highereducationparticipationandincentivestoinvestarelow
Source:Eurostat
InItaly,workers’skillsoftendonotmatchemployers’needs.TheSurveyofAdultSkills(PIAAC),
thatmeasures the key cognitive skills for adults to fully participate in society, shows that 12
percentofItalianworkersareover-skilledinliteracyastheyarenotabletofullyusetheirskills
andabilitiesinthejob;while8percentareunder-skilledastheylacktheskillsnormallyneeded
for their job. Both measures are above OECD averages which are 10 percent and 4 percent,
respectively.Under-skillingisespeciallyhighinItaly,reflectingthelowlevelsofskills.Reducing
skill mismatches is crucial to raising productivity, job satisfaction andwell-being. Illustrative
evidencesuggeststhatItalycouldboostitsleveloflabourproductivityby10percentifitwereto
Page 218
H2020-YOUNG-SOCIETY-2015 YOUNG_ADULLLT Deliverable 4.1
16
reduceitslevelofmismatchwithineachindustrytothatcorrespondingtoOECDbestpractices
(AdaletMcGowanandAndrews,2015).
Figure5-Thelevelofskillsmismatchishigh
Source:Eurostat
Overcomingskillmismatches,underorover-skilling,requirespoliciestofosterlabourmobility
andmaketheeducationandtrainingsystemmoreresponsivetolabourmarketneeds.
In 2015, 26.2 percent of people aged 30-34 achieved a tertiary qualification, in linewith the
objectivesetforItaly,butratherfarfromthe40percentsetforEurope.
InboundgraduatemobilityremainsratherlowatMaster'slevel,butisontheriseatBachelor’s
level (4percentofbachelorgraduates came fromabroad in2014, compared to2.9percent in
2013).
The number of Italian citizenswith a tertiary education degree leaving the country has been
rapidly increasing since 2010. This has not been compensated by inflows of equally well
qualifiedItalians(orforeigners)returningtothecountry(ISTAT,variousyears).Theincreasing
emigration reflects better job opportunities and conditions abroad. Survey data show that
comparedwiththeirpeersworkinginItaly,youngItaliangraduatesworkingabroadearnhigher
andmore rapidly increasing salaries, workmore frequently under open-ended contracts and
considertheirformalqualificationmoreappropriatefortheirjob(ConsorzioInteruniversitario
AlmaLaurea2016).Italianswithadoctoraldegreeworkingabroadreporthavingbothbetterjob
opportunities and significantly higher earnings. Thismay explainwhy highly qualified Italian
workershave very little inclination to return to their home country (Biondo et al. 2012). The
Page 219
H2020-YOUNG-SOCIETY-2015 YOUNG_ADULLLT Deliverable 4.1
17
emigration of highly qualified Italianworkers therefore does not qualify as ‘brain circulation’
(i.e. when people temporarily go abroad to study or work, but then go back to their home
country), neither a ‘brain exchange’. Many Italian workers leave the country, but few highly
qualifiedindividualsfromothercountrieschooseItalyasadestination.
TheproportionofforeigncitizenslivinginItalyaged25to64withatertiaryeducationdegreeis
muchlowerthanthatofItaliancitizens(11.5percentcomparedto17.5percentin2014).Inthe
EU,asawhole theproportionsofhighlyqualifiedEUcitizensandnon-EUcitizensaresimilar
(29.4 percent and 28.1 percent respectively). The resulting ‘brain drain’ can thus cause a
permanentnetlossofhighlyqualifiedhumancapital,whichwouldharmItaly’scompetitiveness
(EuropeanCommission2016).
Evenlifelonglearning,whichisconsideredtobeanimportantrequirementtobeintegratedinto
thelabourmarket,in2016involved8.3percentofpeopleaged25-64.
The shareof30-34-year-oldswith tertiaryeducation, too, isdifferent across regions: in2016,
the indicator for almost all regions of the Centre and North was above the national average,
whilefortheSouthandIslandsareaitwas5.5percentagepointslower.
Finally,youngpeopleaged15-29whoarenotineducation,employmentortrainingwereover
2,2million(24.3percentoftherelativepopulation),withahigherincidenceamongwomenthan
men.In2016,however,theaggregateshowsaslightdecreaseforthesecondconsecutiveyear.
Thephenomenonseemstohavebegunatrendreversal,aftertheexponentialgrowthdynamic
that has been in place since the beginning of the economic crisis. Compared to themaximum
values reached in 2013 in Liguria and in 2014 in Lombardy, the NEETs are down slightly in
2016.
In2016,15 to24-year-oldNEETsresidents inLiguriawere19,019and their incidenceon the
populationofthesameagewas14.7percent,downfrom15.9percentin2015and17.1percent
in 2013. Among the Italian regions, Liguria is ranked 13th with regard at NEET rate, with a
percentageweightof5.2pointslowerthantheItalianaverage(19.9percent)and0.9pointsthan
theNorthwestItaly(15.6percent).Regardingtheneighboringregions,onlyEmiliaRomagnais
in a better situationwith thepercent rate ofNEETat 12.1percent, followedbyTuscany14.9
percent,Lombardy15percentandPiedmont17.5percent.
Page 220
H2020-YOUNG-SOCIETY-2015 YOUNG_ADULLLT Deliverable 4.1
18
Figure6-NEETsatnationalandfunctionalregion’slevels(percent)
Source:EUROSTAT
ThepresenceofNEETincreasesbyobservingthe15-29-year-old.TheLigurianNEETsof15-29
yearsin2016were34,859,withanincidenceonthepopulationofthesameageof17.6percent
(16thamongtheItalianregions),6.7percentagepointsbelowtheItalianaverage(24.3percent),
and0.2percentagepointshigherthantheNorth-Westaverage(17.8percent).Ligurialastyear
hadarateofNEETbetween15and29yearshigherthantheneighboringregions.Thisyearisin
an intermediateposition:LiguriaexceedsEmiliaRomagna(15.6percent)andLombardy(16.9
percent),butisexceededbyTuscanyat18percent,andbyPiedmontto20percent.TheNEETs
residentinLiguriaaged18-29are33,425,withanincidenceof20.8percentofthepopulationof
thesameage(16thamongtheItalianregions),8percentagepointsbelowthenationalaverage
(which affects 28,8 percent), and 0.3 points below the North-West average (21.1 percent).
Liguria is also in amiddlepositionwith regard to this age group: it is aboveEmiliaRomagna
(18.7percent)andLombardy(20.1percent),butitisbelowTuscanyat21.5percent,andfrom
Piedmontto23.6percent.
Inconclusion,consideringthetrendofNEETsinthetwoareasinvolvedintheYAproject,Liguria
andLombardyhasmanysimilaritiesand in2016 thepercentage in the tworegionswasquite
thesame.
4. LabourmarketThe Italian labour market recorded slight positive growth between 1999 and 2008, with
0
5
10
15
20
25
2012 2013 2014 2015 2016EU27NEET LombardiaNEET LiguriaNEET ItalyNEET
Page 221
H2020-YOUNG-SOCIETY-2015 YOUNG_ADULLLT Deliverable 4.1
19
absoluteemploymentandtheemploymentraterisingslowlybutconstantly.In2009,however,
thisupwardtrendreversed.Whilein2008some22.7millionpeoplewereemployed,thisfigure
haddropped to21.8millionby2014.Theemployment rate alsodropped in thisperiod, from
58.6percentin2008downto55.7percentin2014.
Employmentgrowthstartedtorecoverin2014whentheeconomywasstillstagnating,andthis
trendcontinuedin2015and2016.MostrecentdatashowthatItalyreachedthepre-crisislevel.
A look at the rates of employment according to gender and age reveals structural
underemployment among young adults, older persons and women. The poverty risk has
increasedaccordingly.
Afterthepositiveeconomicsignsatthebeginningofthe2015,theItalianeconomylookssetto
return to growth last year. In the second quarter of 2016, against the backdrop of a general
stoppage in economic growth internationally, the Italian economy came to a standstill. GDP
remainedunchangedcompared to thepreviousquarter, and increased0.8percent inyear-on-
year terms. In this context, the absorption of work by the production system continued to
increase:thetotalhoursworkedroseby0.5percentonthepreviousquarterandby2.1percent
year-on-year. The quarter-on-quarter rise affected both industrial production (+0.4percent)
andservices(+0.6percent).
Thenumberofinactivepeoplecontinuedtodeclineatafasterpace,bothquarter-on-quarterand
year-on-year (in absolute and percentage terms), especially with regard to the number of
discouraged people1. After the economic stability, the unemployment rate fell slightly (-0.1
points)incomparisontothepreviousquarter,andwasdown0.6pointsonthesamequarterof
2015,withthenumberofunemployedpersonsfallingyear-on-yearby109,000.
Thechangesintheemployedpopulationimplysignificantchangesinthesituationofpeoplein
thelabourmarket;transitionstopermanentemploymentincreased,particularlyfortemporary
employees and staff. Moreover, the flow from unemployment into employment increased,
particularly for employees. The increased move from unemployment to employment mainly
affectedmen, youngpeople aged25-34, residents in theNorth and secondary school diploma
holders.
Inthesecondquarterof2016therewasanupwardtrendinemployment:anincreasingtrendin
the‘newentrants’expectedbyenterprisescombinedwithadescendingtrendinthenumberof
1Discouragedworkersare persons not in the labour force who believe that there is no work available due to various reasons and who desire to work (OECD, http://www.oecd.org/els/emp/LFSNOTES_SOURCES.pdf).Discouragedworkersdonot includethosewhohavedroppedoutofthelaborforceforotherreasons.Thesearepeoplewhohavegone back to school to better their chances of gettingwork.Manywomen leave theworkforce because they'vegotten pregnant.Otherpeoplecan'tworkbecausethey'vebecomedisabled.Althoughtheymayindeedalsofeeldiscouraged, theyaren'tcountedasdiscouragedworkers.
Page 222
H2020-YOUNG-SOCIETY-2015 YOUNG_ADULLLT Deliverable 4.1
20
jobseekers.Growinglabourdemandmustthereforemeetreducedlaboursupply;inotherwords,
a virtuous circle has begun which, if it continues, could speed up and intensify the fall in
unemployment. In Lombardy Region, in the second quarter of 2016 there was year-on-year
growth in employment (the number of employed persons was 4,367,000), male employment
rose and female employment decreased. The employment rate of theworking age population
(15-64years)inthefirstquarterof2016stoodat65.8percent.
ThenumberofjobseekersinLombardyin2015fellby3.8percentcomparedto2014.According
to ISTAT, theunemployment rate in the secondquarterof2016was6.9percent compared to
7.8percentinthepreviousquarter.Overall,therewere322,000unemployedpeople.
The first quarter of 2016 showed a decrease of 11percent of hirings comparedwith the first
quarterof2015andrelatedequallytomenandwomen.Alleconomicsectorsrecordedafallin
the number of hirings; agriculture showed the least pronounced fall (1percent), compared to
the construction sector (-19.5percent), industry (-11percent), and tradeand services (-10.8
percent).
As regards employment contract types, overall there was a 6percent increase in agency
contracts between the first quarter of 2016 and the first quarter of 2015 and a decrease in
permanent contracts (-23.5percent), apprenticeships (-9.5 percent), fixed-term contracts (-
4.7percent)andproject-basedcontracts(-32.6percent).
In Lombardy, the difficulties in filling vacancies are attributable equally to the poor skills of
candidates and the lack of availability of the professional profiles sought. On the other hand,
vacanciesarefilledmoreeasilyinpublicutilitiesandinleisureservices.
At a sectoral level, recruitment difficulties are more frequent in IT services and telecoms
(28percentofthetotal),advancedservicestoenterprises(23percent),electricalandelectronic
industries (22percent), metalworking industries (21percent), and textile and clothing
industries(20percent).
Themainsectorsrequiringthegreatestspecificworkexperienceare:construction(74percent),
media and communication (68percent), healthcare and social work (68percent), IT and
telecoms(67percent),andtextileandclothingindustries(66percent).
In 2015, in Lombardy, the recruitment of highly-skilled workers (specialists: 8percent,
technicians:16percent,andasmallnumberofmanagers)cameto32,750,or25percentoftotal
hirings. The hiring of medium-skilled workers, of which 12percent were office workers and
31percent service and trade occupations, was 57,890, or 44percent of total hirings. The
remaining 42,390 planned recruitments were in low-skilled occupations, accounting for
32percentofthetotal.Theyincludedlabourers(21percent)andgenericunskilledoccupations
(11percent).
Page 223
H2020-YOUNG-SOCIETY-2015 YOUNG_ADULLLT Deliverable 4.1
21
Theoccupationsingreatestdemandwere:skilledworkersintrade,hotelsandrestaurants/bars
(cooks,waiters,bartendersandsimilar),unskilledoccupations in tradeandservices, technical
professionsinorganisational,administrative,financialandtradeactivities,secretariesandoffice
workers,andtechnicalprofessionsinscience,engineeringandproduction.
In2015 inLiguria, theoverallemploymentratewas62.4percent,up1.7percentcompared to
2014,whichwas lower than the average for the NorthWest, but 6.1percent higher than the
national average. Among the employed, men have the largest share (55.1percent), despite
decreasing by 24000 workers compared to 2008 (before the crisis) (-6.6percent); female
employment between 2008 and 2015 remained stable, although the percentage of women
amongtotalpeopleinworkrosefrom43.2percentin2008to44.9percentin2015.
InLiguriain2015,71.6percentofpeopleinworkwereemployees,while28.4percentwereself-
employed.
ThebreakdownofpeopleinworkbyagegroupsshowsthatinLiguriathesituationisespecially
critical for young people: only 3.3percent of people inwork are aged 15-24 years, compared
with 4.1percent of the national figure; 25-34 years-old account for 15.7percent of the
workforceinLiguriaagainst18.2percentatnationallevel.
As to gender differences, in Liguria the greatest gap between men and women in terms of
percentagepointsisfoundintheagegroup25-34years,whereemployedmenare15.1percent
and women 2.6percent of the total by gender, and in the over-65s, withmen outnumbering
womenby2.1percentagepoints.
Breakdown of employment by activity sector shows no significant changes vis-à-vis
2008: services account for almost 80percent of total employment, followed by industry at
20percent. Within industry, the manufacturing sector accounted for 12.7percent of total
employmentin2015.
In2015, according todataobtained fromcompulsory reporting, themostwidelyused typeof
contractcontinuedtobe fixed-termcontracts(44.6percent), followedbypermanentcontracts
(30percent).Comparedto2014,flexibleworkdroppedtothirdplace(16.1percent),withagap
of about14percentagepoints from fixed-term contracts.Between2014 and2015permanent
contracts increased by 65.5percent,while non-standard employment fell by 11.5percent and
apprenticeshipsby19.6percent.
Breakdown by type of occupation shows that 33.2percent of employment was in skilled
occupations in trade and services, followed by unskilled occupations (20.6percent). Office
workers,intellectualprofessions,craftworkers,skilledmanualworkersandfarmersaccounted
foraround11percentofemployment.
Page 224
H2020-YOUNG-SOCIETY-2015 YOUNG_ADULLLT Deliverable 4.1
22
Compared to 2008, the largest increaseswere in intellectual, scientific and highly specialised
professions(+34.7percent),followedbyskilledworkersintradeandservices(+16.9percent),
which show that in years of crisis people with very specific professional skills and highly
intellectualskillscouldbemoreattractive for the labourmarket.Conversely, therehasbeena
significant drop in legislators, managers and businesspeople (-46.6percent) and technical
occupations(-41percent).
TheunemploymentrateinLiguriaincreasedfrom5.4percentto9.2percentbetween2008and
2015,althoughit fell from10.8percentto9.2percentbetween2014and2015.Withregardto
thegendercomponent,femaleunemploymentinparticulardecreasedinLiguria(-17.1percent,
correspondingto6000people),whilemencontinuetobethelargestcomponent(53.2percent)
ofthoseseekingemployment.
Inspiteoftheimprovementinthefemaleunemploymentrate,therelativerate,whichwasdown
on the previous year, was nonetheless higher than themale unemployment rate (9.5percent
comparedto8.9percent).
The rise in unemployment mainly concerns workers who lost a previous job and first time
jobseekers(whomadeup21percentofunemployedpeopleinLiguriain2015and27.2percent
ofthenationalaverage).
Between2014and2015thegrowthinemploymentwassolelyduetothegoodperformanceof
services (+14000 jobs, corresponding to +3percent), while industry lost a thousand jobs (-
0.8percent), mainly due to the decline of employment in manufacturing (-5000 jobs,
correspondingto-6.6percent).
InLiguriaon1January2015therewere114984non-EUnationalslegallyresident,representing
7.2percentofthetotalregionalpopulation.
AccordingtotheISTATdata(RCFL-ContinuousLabourForceSurveyannualaverage2015),the
employment rate (15-64 years) of non-EU foreign nationals was 58percent; around 4
percentage points lower than the overall regional rate (62.4percent). Among EU nationals,
however,theemploymentratewas69.4percent.Therewere50645employednon-EUnationals
(aged15andover),ofwhom51.5percentweremen.
Theunemploymentrate(aged15andover)ofnon-EUforeignnationalswas20.1percent,more
thandoubletheoverallregionalfigure(9.2percent).
Employedforeignnationals(aged15andover)tendedtobeyoungerthanItalians:64percentof
non-EUworkerswereunder theageof44year(among Italians the figure falls to44percent);
themajorityofemployedforeignnationalswereintheagegroup30-44.
Page 225
H2020-YOUNG-SOCIETY-2015 YOUNG_ADULLLT Deliverable 4.1
23
Companies in Liguria showed a largely stable trend compared to 2015,with a growth rate of
0.10percent.Therewere163,418businessesregisteredasattheendof2015,andthebalance
betweenregistrationsandclosureswaspositive,standingat163.
In terms of changes in registration, taking into account joint changes in registrations and
closures, the sectors struggling most appeared to be construction, trade, transport and
warehousing,andaccommodationandfoodservices,whilerental,travelagenciesandbusiness
supportservices,realestateactivitiesandmanufacturingshowedapositivetrend.
Morecriticalisthesituationofcraftbusinessesatalllevels:national,regional(NorthWest)and
Liguria.Growthratesincreased,withtheexceptionofLiguria,comparedto2014,butwerestill
innegativeterritory.TheNorthWestfell from-1.15percentto-1.08percent,while inLiguria
the figure fell from0.66percent in2014to -0.93percent in2015andwasnegative inall four
provinces.
AlthoughtheoveralltrendforcompaniesinLiguriaappearedtoshowresilienceratherthanfull
recovery,itisimportanttorecallthattorevivetheeconomy,thedifficultsituationinwhichcraft
businesseshavebeenstruggling foryearscannotbe ignored,giventhatcraftbusinessesmake
upasignificantproportionofthelocaleconomy(27.5percent).
The employment situation for the best qualified deserves attention: the employment rate of
graduatesofdifferenttypesattheUniversityofGenoa(LiguriaRegion)in2015,oneyearafter
graduation,was58.9percentandmorethanhalf(55percent)saidtheymadelittleornouseat
alloftheskillstheygainedduringtheiruniversityeducation,andprobablyalsocarriedouttasks
forwhichauniversitydegreewasnotrequired.Also,oneyearaftergraduation,theemployment
rateofgraduateswithmaster’sdegreesandsinglecycledegrees(76.6percentand62.7percent
respectively) was significantly higher than that of graduates having only a bachelor’s degree
(48.9percent). The academic disciplines with higher unemployment rates include
geology/biology,architectureandsocialandpoliticalsciences; thedisciplineswith thehighest
employmentratesaremedicineandhealth,engineering,teachingandscience.
Inparticular,oneyearafterobtainingabachelor’sdegree,theunemploymentratedeclaredby
respondentswashigherforthosehavingadegreeinsocialandpoliticalsciences(30.7percent),
geology/biology (30percent), law (29.3percent) and architecture (26.3percent). Conversely,
the unemployment rate was lower for psychology-related subjects (4.3percent), the sciences
(7percent)andphysicaleducation(10.5percent).
One year after obtaining a master’s degree, there was a higher unemployment rate in
geology/biology-related subjects (43.1percent), physical education (25.1percent) and
architecture(21.3percent);meanwhile,theemploymentratewashigherinthefieldofmedicine
andhealthcare(92.9percent),engineering(89.6percent)andteaching(86.2percent).
Page 226
H2020-YOUNG-SOCIETY-2015 YOUNG_ADULLLT Deliverable 4.1
24
Based on the average 2015 data, this trend was more pronounced in Liguria than in Italy,
although it was noteworthy that female graduates conversely had a higher rate of
unemployment thanmenwith similar qualifications. In Liguria, the situationwas the reverse
withregardtohighschooldiplomas,withthefemaleunemploymentrateat7.9percentandthe
malerateat8.9percent.
5. RedistributionandsocialinclusionThe Italian welfare state is considered by the literature on comparative welfare state as
‘familistic’ welfare systems, in the consideration of the key role that the family plays in the
overarchingarchitectureofthewelfaresystem,actingasthemainproviderofcareandwelfare
forchildrenanddependent individuals.At thesametime,wecandefine the Italianwelfarean
unbalancedsystemifweconsiderthesubdivisionofexpenditurebyfunctions.Currenttrendsof
thesocialexpenditurehighlightingtheinertiaoftheItalianwelfarestate.Startingfromearly’90
the Italian public spending on social protection increased, according to the main European
countries,butthisdatait’snotenoughtodescribetheItaliancase.
Table4-Netsocialprotectionbenefits
2005 2006 2007 2008 2009 2010 2011 2012 2013 2014
EU (27 countries) 25.1 24.8 24.2 24.9 27.5 27.5 27.3 27.6 27.8 27.6Italy 24.4 24.6 24.5 25.5 27.5 27.6 27.4 28.0 28.7 28.8
Source:Eurostat Asmatterof fact, ifweput the focuson thespecificityof thepublicspendingwecandiscover
someinterestingevidences.Ifthegrowthinthevolumeofsocialexpenditurehasbeenmatched
bymarked fixity in the subdivision of expenditure by functions, the data shows that the only
dynamicelementisexpenditureonold-ageandsurvivorpensions.Consideringthetotalamount
ofsocialsecurityspending(includedthepensions)inoverallsocialprotectionexpenditure,Italy
spendsmorethantheotherEuropeancountries.
ThesocialandeconomicchangeshappenedinItalyinthelastdecades,havenotbeenmatched
byanalogouschangesinthewelfaresystem.Thewelfaresystemstructurehasremainedlargely
unchanged,withfewsignificantexceptions:thereformofthepensionssystem(startedbetween
1992and1995fromthe“Amato”and“Dini”reformsuntil2011withthe“Fornero”reform);the
reformsandthechangesinthelabourmarketregulation(in1997(“Treu”Reform),2001(“Biagi”
Reform)and2014(thejob’sact)andin2017thefirststepoftheminimumincomepolicy,(REI
reddito minimo di inclusione). The amount of expenditure on social protection in Italy has
Page 227
H2020-YOUNG-SOCIETY-2015 YOUNG_ADULLLT Deliverable 4.1
25
grownatarategreaterthanthatofGDP.In2014isnear7percent,lowerthanEUaverage,for
health care, but higher for old age (11.50 percent) and lower for other social problems, like
disability,housingandsoon.Duringthelasttwentyyears,therehasbeennoreconfigurationof
theItalianwelfarestateabletoincludethenewsocialriskswithintheexistingsocialprotection
system.
If anything, observation of the redistributive effects exerted by thewelfare system shows the
reverse:theevolutionofItalianwelfarehascontributedtoanincreaseinsocialimbalancesand
inequalities.Withoutsignificantchanges in thewelfarestatesystem, thewelfarebenefitshave
beendistributedmainlytotheadvantageoftheinsidersinsteadoftheoutsiders.Theoutcomeof
these dynamics has been that the dualism, between insiders and outsiders, historically
characteristicofItaly’swelfaresystem,likethoseoftheothersouthernEuropeancountries,has
been increased by the joint effect of the absence of the structural welfare system’s reform
(Ferrera1996,RanciandMigliavacca2015).
ItalyisamongonethemainEuropeancountrieswiththehighestlevelsofincomeinequalityas
thedata shows this.Gini coefficient after social transfer is, in2015,32.4,higher thanEU (18)
average,31.0.Thelevelofthepeopleatriskofpovertyorsocialexclusionislargerandislineas
theworstsituationoftheothersouthernEuropeancountries.
Theshareofthepopulationat-risk-of-poverty-or-social-exclusion(AROPE)stabilisedcloseto29
percent in2015,oneof thehighest rates in theEU. In addition, thereare substantial regional
disparities,withverylargedifferencesinAROPEratesbetweennorthernandsouthernregions.
The structure of the economy explains a large part of the different internal outcomes. For
examples, aboutour functional regions, thedata shows that inLiguria the riskofpovertyand
social exclusion is higher than in Lombardy. In fact, the ratio in Liguria grewby18.9 percent
from 2005 to 2015 rising 25.8 percent (EU27 23.7 percent; Italy 28.7 percent), while in
Lombardy by 29.4 percent at the same period considered rising 17.6 percent. People in
conditionofseveredeprivationwasin201511.6percentinLiguria(similartothenationaldata)
adonly6.4percentinLombardy.Also,peoplelivinginhouseholdswithverylowworkdensityis
higherinLiguriathaninLombardy(8.7percentvs.5.3).
Nevertheless,inboththeRegionshouseholds’incomeishigherthanaverage(in2013Lombardy
19.770euros,inLiguria18.500,vsanationalaverageof16.100euros;in2014,averageincome
perinhabitantwas20.200inLombardy,19.200inLiguriaand16.600atthenationallevel).
Page 228
H2020-YOUNG-SOCIETY-2015 YOUNG_ADULLLT Deliverable 4.1
26
Figure7-PeopleatriskofpovertyorsocialexclusionbyNUTS2regions,2012-2015
Source: EU-SILC
6. Healthandwell-beingFor more than a decade the European health system has undertaken reforms aimed at
rationalizingresourcesandlimitingspending,howeverpublicfundingisstillthemainoptionfor
healthservices.
TheshareofprivatehealthexpenditureinItalywas24.5percentofthetotal in2015,equalto
Estonia and Finland. Health public expenditure in Italywas below other important European
countries;against2,431USDperinhabitantatpurchasingpowerparity,spentinItalyin2014,
theUnitedKingdomandFrancespentover3,000andGermany4,000perinhabitant.
Asforhospitalbedsupply,ItalywasstillbelowEU28averagein2014(3.4against5.2bedsper
thousand inhabitants). Liguria and Lombardy have similar indicators referring to
beds/thousandinhabitants(3.4vs.3.7),butinLiguriathereisagreateravailabilityoflong-term
curativebeds(12.5per100,000inhabitants,vs.8.7)andagreaterpresenceofmedicaldoctors
Page 229
H2020-YOUNG-SOCIETY-2015 YOUNG_ADULLLT Deliverable 4.1
27
(442.1 per 100,000 inhabitants, vs. 358.6) or nursey and midwives (981.2 per 100,000
inhabitants,vs.684.9),wesupposeforthegreaterweightofolderpeople.
In2015,currentpublichealthexpenditurewasabout112billionEuros(1,838Eurosperyear
perinhabitant),equalto6.8percentofGDP.
Per capita public expenditure at a regional level is highly changeable because of differences
existing in the socio-economic conditions and in the management models of regional health
systems.
AwidegappersistedbetweentheNorthandtheSouthandIslandsareaasforhospitalbeds.
Thehospital systemsofLombardy,Emilia-RomagnaandToscanawere confirmedaspointsof
attractionforadmissionsofnon-residentpatients.
Where people live has an important impact on their opportunities to livewell. There can be
large differences in average levels ofwell-being in different regionswithin the same country.
How’sLifeinyourRegion?andtheOECDregionalwell-beingweb-toolassessperformanceacross
9dimensionsofwell-beinginthe362OECDlargeregions–21ofwhichareinItaly.
Italy’sperformanceacrossthedifferentwell-beingdimensionsismixed.
The chart below by OECD Better Life Initiative shows areas of well-being strengths and
weaknesses in Italy, based on a ranking of all OECD countries. Longer lines show areas of
relativestrength,whileshorterlinesshowareasofrelativeweakness2.
Figure8-Italy’swell-being
Source:OECDcalculationbasedontheOECDBetterLifeIndex2016database,http://stats.oecd.org/Index.aspx?DataSetCode=BLI.
2Formoredetails,seewww.oecd.org/statistics/Better-Life-Initiative-2016-country-notes-data.xlsx.�
Page 230
H2020-YOUNG-SOCIETY-2015 YOUNG_ADULLLT Deliverable 4.1
28
In general living conditions in Lombardy are better, and this evaluation emerges both from
objective data, both fromperceptions of citizens.Wemust consider that Liguria is the region
withtheoldestpopulation,assaidheavilyaffectedbyeconomicanddemographiccrisis,caused
serious disturbance in educational and social sectors. Less young people in an ageing context
withfeweropportunitiesandagreaterpartofpopulationatriskofsocialexclusioncontribute
alsotolowerlevelsofsubjectivewell-beingandlowerexpectationsforthefuture.
7. ConclusionsItaly is “convalescing” after a deep and long recession. Structural reforms, accommodative
monetaryandfiscalconditions,andlowcommoditypriceshaveaidedtheeconomytoturnthe
corner. The ambitious structural reform programme, named Jobs Act, and social security
contribution exemptions for new entries have developed the labour market and improved
employment.Yet, therecoveryremainsweakandproductivitycontinues todecline.Returning
the banking system to health will be crucial to revive growth and private investment. More
investmentininfrastructurewillbeessentialtoincreaseproductivity.
Raisingchronicallylowproductivitygrowthwillrequireamoreeffectivepublicadministration,
an improved business environment, increased innovation, stronger competition, and a better
match between the demand and supply of skills. The Good School reform also aims at
strengthening links between school and the labour market by mandating school-to-work
experiencesforallstudentsinthelastthreeyearsofsecondaryschool.Intensiveinvolvementof
thebusinesssectorandotherstakeholderswillbekeytoensuringthecreationofqualityschool-
to-work schemes that will help the development of relevant skills for the labour market. An
assessmentsystemaimedatverifyingthequalityoftrainingcarriedoutintheworkplacement
willneedtobeimplemented.
Literacy scores are low and job-skill mismatch is one of the highest among OECD countries,
depressing earnings and well-being. Many workers are under-skilled in the jobs they hold,
emphasizingmismatchesbetweenworkers’skillsandthoserequiredbyemployers.Linkingthe
education systemand labourmarketpoliciesare crucial to raising realwages, job satisfaction
andlivingstandards.TheJobsActandtheGoodSchoolreformgointherightdirectionandneed
tobefullyimplemented.
Italyhasasmallshareofstudentsinhighereducation.Atthesametime,thedifferencebetween
the earnings of tertiary-educated graduates relative to those of adults with only upper
secondary education is low in Italy compared to the OECD average. Furthermore, the
unemployment rate among tertiary educated adults is among the highest in OECD countries.
Page 231
H2020-YOUNG-SOCIETY-2015 YOUNG_ADULLLT Deliverable 4.1
29
Hence,labourmarketoutcomesoftertiaryeducatedmaketheinvestmentintertiaryeducation
unattractive,atleaststillatechnical-professionaltrackisnotimplemented.
Educationexpenditure is low,particularly in tertiaryeducation,bothrelative toGDP(Italy1.0
percentofGDP2016;1.6percentOECDaverage)and to thenumberof students (expenditure
per student was 71 percent of the oECD average). More funding will be crucial point to
improving the quality of education. Given limited fiscal room, one alternative could be to
increasetuitionfees,whicharelowcomparedtootherOECDcountries(OECD,2017).
Apprenticeshipsareakeyinstrumenttohelpyoungpeopletogainusefulwork-relevantskills.
However,theyareunderutilised.ThemainchallengeforapprenticeshipsinItalyistheweaklink
betweenwork and education. Themost common apprenticeship, is onlyweakly connected to
formal education and under this type of contract less than one third of apprentices were
enrolledinformaleducationin2013.Inothertypeofcontracts,accesstotraining–asrequired
by law–dependson the initiativeof enterprises. Furthermore, there isnonational system to
controlandmonitorthetrainingprovidedbyfirms.Specificqualitycriterianeedtobesetand
enforcedforcompaniesofferingapprenticeships.
Participation in vocationally-oriented tertiary programmes is low in Italy compared to other
OECD countries. In recent years, Italy has taken several steps to create tertiary education
programmespreparing students for a rapid entry into the labourmarketwith the creationof
hightechnicalinstitutes(IstitutiTecniciSuperiori–ITS).TheexperienceofITShasbeenpositive
as graduating students have high level of employability (INDIRE, 2016). The success of ITS is
attributable to its responsiveness to labour market needs, as they benefit from strong
involvement of the business sector, universities and higher secondary education. The full
potentialofITSremainsuntappedastheyareconcentratedinthemostindustrialisedregionsof
Italyandfemaleparticipationislow.EnrollmentinITSisnegligiblecomparedtoothertertiary
educationalpaths,basicallybecauseitrequiresadditionalfunding.
Italymust construct on the positive experience of ITS and establish a VET system at tertiary
level based on apprenticeships. Professional degrees are going to be introduced in national
tertiary education systemand couldhelp to reduce thedistance between educational outputs
andlabourmarketrequirements.
Thiswouldhelpmatchthetrendofrisingdemandformedium-andhigher-levelqualifications,
which are projected to reach 82.5 percent of the labour force in 2025, against less than 80
percenttoday(CEDEFOP,2015).Establishinganationalbodyinvolvingthebusinesssectorand
other key stakeholders would improve strategic planning and coordination, and ensure the
education-working experiencemix reflects not only student preferences but also local labour
marketneeds.
Page 232
H2020-YOUNG-SOCIETY-2015 YOUNG_ADULLLT Deliverable 4.1
30
Alltheabove-mentionedissuesshallbevalidforbothourFunctionalRegions,butitisimportant
to note that Lombardy need less interventions in all area descripted by the indicators than
Liguria,asrevealedbythestatisticaldata.
ReferencesAdaletMcGowan,M.andD.Andrews(2015),"SkillMismatchandPublicPolicyinOECDCountries",OECDEconomicsDepartment Working Papers, No. 1210, OECD Publishing, Paris.http://dx.doi.org/10.1787/5js1pzw9lnwk-en.
ASSOLOMBARDA(2016),http://www.assolombarda.it/investing-in-the-territory/data-sheets-by-area/.
BiondoA.E.,MonteleoneS.,SkoniecznyG.,TorrisiB. (2012),Thepropensity toreturn:Theoryandevidence for theItalianbraindrain,EconomicsLetters,115,pp.359-62.
Consorzio Interuniversitario AlmaLaurea (2016), XVIII Indagine Condizione occupazionale dei Laureati,http://www.almalaurea.it
CrouchColin(1999),SocialChangeinWesternEuropeOxford:OxfordUniversityPress.
CRUI (2016), Università e ricerca. Pilastri su cui fondare lo sviluppo economico e sociale del Paese,https://www.crui.it
EuropeanCommission(2017),CountryReportItaly2017,https://ec.europa.eu/info/sites/info/files/2017-european-semester-country-report-italy-en_0.pdf
EUROSTAT(2017).TheEuropeanUnionLabourForceSurvey(EU-LFS),http://ec.europa.eu/eurostat.�
Ferrera,M.(1996):‘The“SouthernModel”ofWelfareinSocialEurope’,JournalofEuropeanSocialPolicy6/1,pp.17–37.GenoaportauthorityAuthority(2016),http://servizi.porto.genova.it.
INDIRE (2016), “Istituti Tecnici Superiori (High Technical Institutes)”, National Institute of Documentation,InnovationandEducationalResearch,www.indire.it/approfondimento/its-istituti-tecnici-superiori.
ISTAT(variousyears),http://www.istat.it/it.
Mandrone,E.(2014),“YouthGuaranteeandtheItalianPES: insights fromISFOLPLUSSurveydata”,CIMRResearchWorkingPaperSeries,WorkingPaper,No.21.
MigliavaccaM., Ranci C. (2015), Everything needs to change, so everything can stay the same’: The Italianwelfarestatefacingnewsocialrisks,inAscoliU.andPavoliniE.,TheItalianwelfarestateinaEuropeanperspective,Bristol,PolicyPress.Pp.21-48.ISBN9781447316886.
Monti,P.andM.Pellizzari(2016),“SkillMismatchandLabourShortages intheItalianLabourMarket”,PolicyBrief,No.02,BocconiUniversity.EmploymentSkillsandProductivity in Italy–AResearchProjectcoordinatedby IGIER-Bocconi,inpartnershipwithJPMorganChaseFoundation.
OECD(2014),TALIS2013Results:AnInternationalPerspectiveonTeachingandLearning,Paris:OECDPublishing
OECD(2016),EducationataGlance2016:OECDIndicators,http://www.oecd-ilibrary.org/education/education-at-a-glance-2016_eag-2016-en
OECD(2017),TheEuropeanUnionStatisticsonIncomeandLivingConditions(EU-SILC),https://data.oecd.org
OECD calculation based on the OECD Better Life Index 2016 database,http://stats.oecd.org/Index.aspx?DataSetCode=BLI
OECDProgrammeforInternationalStudentAssessment(PISA),http://www.oecd.org/pisa
ProgrammeforInternationalAssessmentofAdultCompetencies(PIACC),http://www.oecd.org/skills/piaac
Page 233
H2020-YOUNG-SOCIETY-2015 YOUNG_ADULLLT Deliverable 4.1
Work Package 4
Quantitative Analysis Young Adults’ Data
Portugal –
National Briefing Paper with national and regional data sets
Mariana Rodrigues, Ana Bela Ribeiro and Tiago Neves (University of Porto)
António José Almeida, Natália Alves and Rita Queiroga (University of Lisbon)
Date 2017/09/10 Work Package 4 – Quantitative Analysis of Young Adults’ Data Deliverable 4.1
Page 234
H2020-YOUNG-SOCIETY-2015 YOUNG_ADULLLT Deliverable 4.1
2
Tableofcontents
ExecutiveSummary............................................................................................................................................................3Introduction...........................................................................................................................................................................5Descriptionofthedatacollatedandqualitydataassessment........................................................................5Findings...................................................................................................................................................................................61. Demographicstructure............................................................................................................................................62. GeneralstateoftheEconomy...............................................................................................................................83. Education....................................................................................................................................................................114. Labourmarket..........................................................................................................................................................155. Redistributionandsocialinclusion.................................................................................................................206. Healthandwell-being...........................................................................................................................................22FinalRemarks....................................................................................................................................................................25References...........................................................................................................................................................................26Listoffigures
FIGURE 1: GDP in euro inhabitants (left axis) and labour productivity (right axis, EU=100),
Portugal,NorteandAlentejo,2006-2015...........................................................................................9
FIGURE2:Populationchangeandmigration(rightaxis),olddependencyandfertilityrates(left
axis),Portugal,NorteandAlentejo,2005-2015..............................................................................7
FIGURE3:Percentageofpopulation(25-64)withISCED0-2,ISCED3-4andISCED5-8,in2005
and2014.........................................................................................................................................................12
FIGURE4:Participation(%)intertiaryeducationofpopulationaged20-24,2005-2012..............14
FIGURE5:Percentageofyoungpeopleaged15-24neitherineducation,employmentortraining
(NEET;leftaxis)andearlyleaversaged18-24(rightaxis),Portugal,AlentejoeNorte,
2012-2016......................................................................................................................................................15
FIGURE6:Employmentrate(20-64)inEU27,Portugal,NorteandAlentejo........................................16
FIGURE 7: Youth employment and unemployment rates, youth unemployment ratio of young
people15-24(rightaxis),EU27,Portugal,NorteandAlentejo,2005-2015.....................17
FIGURE8:Unemploymentrate(20-64)inEU28,Portugal,NorteandAlentejo...................................18
FIGURE9:Long-termunemploymentrate(20-64)inEU27,Portugal,NorteandAlentejo............19
FIGURE10:GINI indexbeforeandafter transfers,disposable income in thehouseholds inPPS
(rightaxis),EU27,Portugal,NorteandAlentejo,2005-2015..................................................21
FIGURE11:Highsatisfactioninvariouslifedomains,age25-34,EU28andPortugal,2013..........24
Page 235
H2020-YOUNG-SOCIETY-2015 YOUNG_ADULLLT Deliverable 4.1
3
ExecutiveSummary
Thisnationalbriefingpaperprovidesashortoverviewofthelivingconditionsandriskprofiles
of young adults in Portugal and in the functional regions of Vale doAve andAlentejo Litoral,
selected as case studies for the YOUNG_ADULLLT project. The contextual living conditions of
young people are analysed by looking at available indicators at NUTS 0 and NUTS 2 level,
collected by the working package leaders and integratedwith NUT 3 data when available or
provided by the Portuguese National Statistics Institute (INE) and the Database of
Contemporary Portugal (PORDATA), as well as by other institutional sources, along the
followingdimensions:demographicstructureofthepopulationanditssubgroups;generalstate
of the economy; education; labour market; redistribution and social inclusion; health and
individualwell-being.
Two of the main demographic characteristic are the growing ageing of the Portuguese
populationbothatnationalandregionallevels,andthehighpercentageofyoungadultsaged20-
29livingwiththeirparents.Duringthetimespan,andinspiteofthefinancialcrisisandTroika’s
intervention the GDP and the GVA increased at national and regional levels. However, the
performance of the Portuguese economy measured by GDP per inhabitant and labour
productivityisstillconsiderablylowerthantheEU28average.
Between 2005 and 2016, the structure of academic qualifications of the Portuguese
population has improved significantly both nationally and regionally. The rates of school
attainment increased in all age groups, the ratio of early school leavers and the rate ofNEET
declinedsignificantly.However,whencomparedtootherEuropeanpartnercountries,Portugal
stillrevealsthelowestratesofschoolattainmentevenamongtheyoungergenerations.
Inspiteofanimportantskillsupgradingduringthedecade,theoccupationalstructureofthe
Portuguese labour market is less qualified than the EU27 average. The Portuguese youth
employment rate (15-24 years old) is one of the lowest in EU27 and decreased consistently
during the time span 2005-2015, showing important differences at regional level.
Unemployment is mainly a youth problem, particularly after 2011. In 2015, the Portuguese
youthunemploymentratewasmorethanthedoubletherateofpeopleagedbetween20and64
years and higher than the EU28 average. Once again, significant regional differences can be
found. Generally, theNorte labourmarket seems to bemore youth friendly than theAlentejo
one.
In Portugal, resources spent for social protection benefits, provided to households and
individuals affectedbya specific setof social risksandneeds isoneof the lowest inEU27. In
spiteofthefinancialcrisisandthegrowthofunemploymentrate,theexpenditureperinhabitant
didn’t rise significantly and the expenditurewith family and children and social exclusion are
thoseweretheunderfundingismoreseverewhencomparedwithEU27.Theincomeinequality
Page 236
H2020-YOUNG-SOCIETY-2015 YOUNG_ADULLLT Deliverable 4.1
4
started to increase strongly after 2011, transforming Portugal in one of the most unequal
countriesinEU.
During the time span 2005-2015, self perceived health in Portugal has always been lower
thantheEU27average.PortugalwasalsothecountryparticipatinginYOUNGADULLLTproject
withthelowestself-perceivedhealth.Ingeneral,Portuguesepeopleagedbetween25-34years
arecomparativelylesssatisfiedwiththeirlives.
ThedatashowthatthelivingconditionsofyoungpeopleinPortugalareworsethantheEU28
average. They also reveal some regional differences which point to the fact that the living
conditions are slightly better in Norte, where Vale do Ave is located than in Alentejo where
LitoralAlentejano’syoungpeoplelive.
Page 237
H2020-YOUNG-SOCIETY-2015 YOUNG_ADULLLT Deliverable 4.1
5
Introduction
Thisbriefingpaperoffersaconciseoverviewof the livingconditionsofyoungpeopleandrisk
profiles in Portugal and, particularly, in Vale do Ave and Litoral Alentejano, the two national
functionalregionsselectedforanalysisbythePortugueseteamoftheYOUNG_ADULLLTproject.
Dataweregatheredatnational(NUTS0)andregional(NUTS2and3)levelwithregardtothe
sixdimensionsagreeduponintheWP4proposal.Thesedimensionsrepresentdifferentaspects
ofthecontextuallivingconditionsofyoungadults’experiences,concretely,theeconomiccontext
and structure of the productive system; demographic characteristics; the access, process and
outputsofeducationandtrainingsystem;theinteractionbetweenlabourmarket,welfarestate
andeducationstructures;themateriallivingconditionsofyoungpeopleandtheirparticipation
ascitizensinthepoliticalandciviclife;andthehealthstatusandindividualwell-being.Thejoint
datasetwaselaboratedmainlybasedontheEUROSTATdatabase;however,othersourceswere
alsoused,suchastheOECD,UNESCO,Eurydice,WorldBank,UNIDEMO,PISA,LFS,ESA,EU-SILC,
ESSPRO,DGEMPL,andSES2014.Themaincorpusofdatawas thencomplementedwithdata
collected at the functional regional level (NUTS 3), which were available or provided by the
Portuguese National Statistics Institute (INE) and the Database of Contemporary Portugal
(PORDATA), as well as by other institutional sources (such as Directorate-General of the
Ministries).Thisreportisbasedonadatacollectionovera10-yearspan,rangingfrom2006to
thelastyearofdataavailable(e.g.,2015).
Descriptionofthedatacollatedandqualitydataassessment
TheEurostat,OECDandUNESCOdatabasesaggregateahugeamountofdata.Thiscanbeuseful
when comparing different dimensions of the contextual living conditions of young people in
variouscountriesorregions.However,datainallsixdimensionsofanalysisaremainlyavailable
at the national level (NUTS 0). This means that access to data at regional level (NUTS 1) is
somewhat limited, and at local level (NUTS 2) it is actually very limited. These limitations
constituteconstraintsonthecomparabilityofsomeindicatorsbetweenlocalfunctionalregions.
Besides,itisimportanttoacknowledgethatcomplementingtheavailableandharmoniseddata
withlocaldatacanbeadifficultandtime-consumingprocess,mainlyduetoissuesrelatedtothe
heterogeneity and fragmentation of data sources. This can be seen, for instance, in the
inconsistency of the concepts and analytical categories used, aswell as in the available time-
series. Since local data are collected within a particular framework and there is no prior
intentiontobringthemintointeractionwithotherdatasources,thisaffectsthepossibilitiesof
Page 238
H2020-YOUNG-SOCIETY-2015 YOUNG_ADULLLT Deliverable 4.1
6
contextualised comparison between the different national cases. Just to illustrate, in Portugal,
theexistingdatasourcesgrouptogetherretentionandschoolleavingrates,whiletheEuropean
datasourcesprovide therepetitionrate.For thesereasons, themostsignificantdatasource is
EUROSTAT, since this database provides metadata and completed time-series, even if not
completelyconsistentor flexible.So,acomprehensive integrationandanalysisofmulti-source
data at the different levels of analysis is a hard goal to accomplish; therefore, this research
intends to raise awareness for the need and relevance of contextualised data at regional and
local level inordertobeabletoproducea fullpictureof theriskprofilesderivedof the living
conditionsofyoungpeopleindifferentEuropeanregions.
Findings
1. DemographicstructurePortugalislocatedinSouthernEuropeandisarelativelysmallcountry,coveringatotalareaof
92,200 square kilometres. The area of the Norte region is 21,286 square kilometres, while
Alentejo is 31,605 square kilometres. Thepopulationdecreasedby2.2%over the last decade
(2006-2016), from 10.5 million to 10.3 million inhabitants (with 111 women per every 100
men) in 2016; this corresponds to 2% of the total EU28 population. Norte is much more
populated than Alentejo (3.6 million against 0.72 million people), even if it covers a smaller
territory. The national population density accounts for 113 persons per square kilometre in
2014(less0.88%since2006).ThePortuguesepopulationhasanunequaldistributionacrossthe
country:atregionallevel,theNorteisclearlydenserthanAlentejo(-64%);andatlocallevel,Ave
has an incredibly high population density when compared to Litoral Alentejano (-151.1%)1.
Furthermore,theaveragePortuguesepopulationisageingconsiderably:from2005to2016,the
medianageincreasedfrom39.2to44years.Thesamesituationhappenedattheregionallevel:
from37.6 to43.8 years inNorte and from43.2 to46.7 years inAlentejo. Youngerpopulation
aged 15-24 and 25-29 has decreased in the last years, and now accounts for 5.3% and 5.4%,
respectively,of the total inhabitants in2015.Alsoat theregional level, therewasasignificant
reduction in the proportion of these age groups in the population since 2005, reaching
respectively5.6%oftheyouthaged20-24andaged25-29inNorte,and4.8%and5.6%ofthe
youthaged25-29inAlentejoin2015.
Thenational cruderateofnetmigrationdecreasedsignificantlyafter2010, reaching -3.60
per1,000inhabitants in2012.Onlyafter2014didthesituationbegintochange,withtherate
risingfrom-2.90to-1.00per1,000personsbetween2014and2015.After2008,theeconomic1 Source:https://www.ine.pt/xportal/xmain?xpid=INE&xpgid=ine_indicadores&indOcorrCod=0008337&contexto=bd&selTab=tab2
Page 239
H2020-YOUNG-SOCIETY-2015 YOUNG_ADULLLT Deliverable 4.1
7
crisis obviously affected thedemographic structure of the country,withmore intensity in the
Norte, since a lot ofpeople left thePortugal andmoved toother countries,more attractive in
terms of employment and remuneration, between 2010 and 2014 (FIGURE 2). In 2015, the
crude rate of net migration started to show signs of change at national and regional level,
probablyduetotheslowdownoftheemigrationprocess.
FIGURE 1: Population change and migration (right axis), old dependency and
fertilityrates(leftaxis),Portugal,NorteandAlentejo,2005-2015
Source:Eurostat
Birthandlifeexpectations inPortugalaregood, like inmostotherEuropeancountries.The
infantmortality,inthefirstyearafterbirth,hasbeendecreasingconstantlysince2005,totalling
2.9deathsper1,000in2016,whileintheEU28itwas3.6.LifeexpectancywasPortugalis81.3
years in2015. In termsofgenderdifferences, the female lifeexpectancy is longer than thatof
males(a6.4yearsdifference).Attheregionallevel,inAlentejo,theaveragelifeexpectancy(80.8
years) is lower than the national average,whilst inNorte it is higher (81.7 years) (data from
2015). When compared to other European partners, Portugal had the lowest fertility rate in
2014 (1.23).From2006 to2014, thenational fertility ratedecreased14.6%.Not surprisingly,
duringthistimespan,thefertilityalsodiminishedatregionallevel:21.1%inNorteand12.2%in
Alentejo. At the same time, the age at which awoman gives birth to her first child has been
increasingcontinuouslysince2005,reachingtheageof29.5yearsin2015(2.2yearsmorethan
10yearsago).Thecombinedeffectofincreasedlifeexpectancyandlowerfertilityisproducing
Page 240
H2020-YOUNG-SOCIETY-2015 YOUNG_ADULLLT Deliverable 4.1
8
some changes in the living conditions of European countries; this is not only visible in the
populationaging,butalsointheolddependencyrate(theratiobetweenpopulationaged65and
overtopopulationagedamong15and65).Thisindicatorhasbeenrisinguninterruptedlysince
2005,from25.7%to31.8%in2014.Thisriseovertime(2005-2014)oftheolddependencyrate
isalsonotedinbothregions,moreprecisely,28.3%inNorteand7.9%inAlentejo.Contraryto
olddependency, thenational young-agedependency rate has beendeclining in the last years,
from23.9%in2005to21.7%in2016.Between2005and2016,therewasthesametrendatthe
regionallevel,reaching20.1%inNorteand20.7%inAlentejoin2016.
ThepercentageofPortugueseyoungpeopleaged20-29livingwiththeirparentshasgrown
since 2006, amounting to 71.6% in 2013. When comparing Portugal with other European
countries,thepercentageofyoungpeoplewhostill livewiththeirparentsismuchhigherthan
theEU28average(55.4%)andtheNorthernEuropeancountries(e.g.,Finland,UnitedKingdom
orAustria),butquitesimilartootherSouthernEuropeancountries(e.g.,Italy,SpainorCroatia).
Intermsofgenderdifferences,thepercentageofyoungmaleslivingwiththeirparents(76.6%)
ishigherthanthatofyoungfemales(66.6%).However,thepercentageofbothPortugueseyoung
malesandfemales(aged20-29)wholivewiththeirparentsishighertotheaverageoftheEU28
(63%and47.7%,respectively).
2. GeneralstateoftheEconomy
FIGURE 1 presents some aspects of the Portuguese economic landscape, from 2006 to 2015.
Basically, the gross domestic product per inhabitant (GDP) increased from 20,400 to 22,200
euro, however, it remained23.2% lower thanEuropean average (EU28) in2015. In the same
period,attheregionallevel,nevertheless,theGDPinbothNorteandAlentejoregionsincreased
overtime(18,700and20,100euro,respectively),evenin2015itremainedsignificantlybelow
otherEuropeancountries,showingadiscrepancyof54.4%and43.8%fromtheEU28average.
DatadrawnfromthePortugueseNationalStatisticsInstitute(INE)2showthat,atthelocallevel,
therewasanincreaseoftheGDPperinhabitantfrom2006to2013.However,itisimportantto
point out the extraordinarydifference inGDPbetweenboth functional regions, since theGDP
perinhabitantinLitoralAlentejanoisnotonly70%higherthantheoneinAve,butalso32.9%
greaterthanthenationalaveragein2013.Itisrelevanttomentionthatthereareconsiderable
discrepanciesregardingtheGDPperinhabitant,from2006till2013,whencomparingdatafrom
EUROSTATandINE.Justtogiveanexample,in2006,thenationalGDPaverageis15,800euroin
INEand20,400euroinEUROSTAT.
2 Source:https://www.ine.pt/ngt_server/attachfileu.jsp?look_parentBoui=224212953&att_display=n&att_download=y
Page 241
H2020-YOUNG-SOCIETY-2015 YOUNG_ADULLLT Deliverable 4.1
9
However,overthelastdecade,therateofgrowthofthePortugueseeconomywasnotlinear,
oscillatingacrosstime.Theeconomicandfinancialcrisis,whichemergedin2008,broughtabout
yearsofprofoundchallengesforEurope,particularlySouthernEurope.From2008to2009,the
Portuguese GDP per inhabitant decreased from 21,000 to 20,100 euro. Despite some
improvementsbetween2009and2010,Portugalhasbeenineconomicrecessionfortwoyears,
which can be perceived by the drop in differentmeasures between 2010 and 2012: the GDP
(from20,900to20,000euro);therealgrowthrateofregionalgrossvalue(GVA)(from0%to-
1.9%);andthelabourproductivitymeasuredinGDPperhourworked(from69.7%to67.9%).
Various factors may have contributed to this economic framework: the Troika’s intervention
(2011-2014)isoneofthem,sinceitimposedsevereausteritymeasurestothecountry.
FIGURE 2: GDP in euro inhabitants (left axis) and labour productivity (right axis,
EU=100),Portugal,NorteandAlentejo,2006-2015
Sources:EurostatandPortugalStatistics(microdata)
Since 2013, the Portuguese economy started to show some positive signs of recovery,
expressed,forinstance,intheincreaseofGDPandGVArates.Bothregions,NorteandAlentejo,
havealsopresentedevidenceof improvement in these twoeconomic indicators.Despite these
achievements, thenational labourproductivity ratedecreaseduntil 2015 (-1.7%). In fact, this
indicatorwasconsiderablybelowEU28foralldecade(rangingfrom-32%to-30.2%).
Aswith other countries, the service sector is dominant in thenational economic structure,
representing75.4%oftheGDPin2015,whichisahighervaluecomparedtoalmostanyother
Page 242
H2020-YOUNG-SOCIETY-2015 YOUNG_ADULLLT Deliverable 4.1
10
partner countries (excluding the United Kingdom). The service sector is followed by the
agriculture sector (2.33%),which is remarkably larger than the average for theEU28.On the
contrary, the shareof the industry sector in thePortugueseGDP is lower than in theEU28 (-
2.25%).Tobemoreprecise,thenationalindustrysectorwasonadownwardtrendfrom2005
until 2014, but in 2015 therewas a very slightly increase in this economic sector.Micro and
small firmsarethebackboneof thenationaleconomicstructure. In2014,companieswith less
than49employeesaccountedfor99,3%ofthetotal,whilemedium-sizedandlargeenterprises
withmore than 49 employees represent only 0,7% of the total. Portugal is a relatively small
countryingeographicalterms.However,therailwaylinesandmotorwayscoverrespectively28
and33kilometresofevery1.000squarekilometres. In2013, therailway linesnetwork in the
Norteregionis4.5%higherthaninAlentejoregion,whichisinaccordancewiththedifferences
indensitypopulationbetweenbothregions.
ThePortuguesebusiness enterprises spendmuch less in research anddevelopment (R&D)
thantheaverageinEU28in2014,measuredinPurchasingPowerStandard(PPS)perinhabitant
atconstant2005prices(moreconcretely,107.7against307.4).However,theinvestmentofthe
businesssectorinR&Dwassignificantlydifferentbetweenbothregionsin2014,amountingto
106.1 PPS per inhabitant in the Norte region and 35.4 in the Alentejo. The averages in both
regions were below the national and European averages in 2015 (107.7 and 307.4 PPS per
inhabitant).AlsotheinvestmentofthePortuguesegovernmentinR&Disremarkablybelowthe
EU28(14.5against60.6PPSper inhabitant).What isparticularly important tohighlight is the
low share of Norte (17.2%) and Alentejo (0.8%) regions in the total of national government
expenditure inR&D in2013.Thepublic investment inR&Dhasbeendecreasing considerably
overthepastfewyearsatthenationallevel(-29.3%),aswellasattheregionallevel:inAlentejo
(since 2008, from 10.8 to 1 PPS per inhabitant), and in Norte (since 2010, from 15 to 7.1).
Additionally,totalexpenditureinR&Daccountedfor1.36%ofPortugueseGDPin2014,whichis
avalue lowerthanEU28(-0.68%).Thepercentageofresearchers inalleconomicsectorsover
theactivepopulation ishighcomparedtoSouthernEuropeanpartners(inPortugal, the figure
was 1.5% in 2013, whereas in Spain it stood at 0.9%, and in Italy at 0.7%). Also in this
innovationindicator,thereareterritorialdifferencessince,contrarytotheNorteregion(1.4%),
Alentejoperformedbelowthenationalaverage(0.5%).
The share of people employed in the Portuguese public sector presents small fluctuations
since2008andamountedto7.2%ofthetotalemploymentin2014,withconsiderableregional
differences (10.5% in Algarve and 4.6% in Norte). Regarding employment in the education
sector,thisindicatorhadbeenincreasingfrom2008until2012(from6.8%to8.3%);however,
inthetwolastyearsitbegandecreasing(8.1%in2014).Inanycase,onlytheUnitedKingdom
hadmoreemploymentineducationin2014,whencomparedtoEuropeanpartners.Intermsof
regionaldiscrepancies,Alentejopresentsahigherpercentage(8.5%)thanNorte(7.7%).Finally,
Page 243
H2020-YOUNG-SOCIETY-2015 YOUNG_ADULLLT Deliverable 4.1
11
thepercentageofpeopleemployedinthehealthsectorandinsocialworkisconsiderablylower
than in other European partners (16.4% in Finland or 12.5% in Germany in 2014). In this
indicator, Alentejo performed 1.1% above the national average in 2014, and Norte below (-
7.1%).
In2015,70%ofthehouseholdshadaccesstoInternet.Thisvalueisthesecondlowestamong
theEuropeanpartners.Onceagain, therearedifferencesbetweenboth regions:63% inNorte
and54%inAlentejoin2014.
3. Education
ThePortugueseeducationandtrainingsystemiscomprehensiveandcentralisedatthenational
level.Since2009,afterthebeginningofthefinancialcrisis,anduntil2012,thepublicinvestment
ineducationdeclinedfrom5.7%to4.9%oftheGDP.Thegovernment’sexpenditureineducation
began to increase again in 2013, being estimated at 5.3% of the national GDP. Full-time
educationiscompulsoryforallchildrenandyouthsagedbetween6and18(inclusive).
InPortugal, pre-school education for childrenbetween theagesof3 and5 is still optional.
Since 2006, the participation of children in childcare and pre-school has been increasing
continuously:in2012,93.4%thechildrenaged4wereenrolledineducation(9.4%morethanin
2006).Bothregionalaveragesarehigherthanthenationalaveragein2012,moreprecisely,96%
inNorteand99.4%inAlentejo.
Basic education consists of nine years of schooling divided into three sequential cycles of
educationoffour(1stcycle),two(2ndcycle)andthreeyears(3rdcycle).
The division into tracks takes placewhen pupils are 15 years old, at the beginning of the
secondaryeducationsystem,which ismadeupof threepossible tracks,eachthreeyears-long:
the scientific-humanistic track prepares pupils to enter higher education in the sciences,
technologyandhumanities;specializedartstrackspreparepupilstoeitherenteractivelifeorto
follow higher education studies in music and performance arts, audio-visual arts and dance;
vocational education and training, together with professional tracks, prepare pupils to enter
activelife,butalsoallowthepursuitofhighereducationstudies.In2015,afterlowersecondary
education, around 55% of young people entered a scientific-humanistic course, against 45%
whoaccessedavocationalprogramme.
All students who successfully conclude the secondary education can apply to the tertiary
education system (university or polytechnics). This application (for public sector higher
education institutions) is made through a national online platform and based on students’
prioritiesandgrades.Briefly,thepolytechnictertiaryeducationsystemisaimedatprovidinga
more practical training and to be profession-oriented,while the university tertiary education
systemischaracterisedbyastrongertheoreticalbasisandresearch-orientation.
Page 244
H2020-YOUNG-SOCIETY-2015 YOUNG_ADULLLT Deliverable 4.1
12
From2005to2014,thepercentageofpopulationaged25-65whoattainedlowereducation
(ISCED2)declinedfrom73.7%to56.7%.WhencomparedtootherEuropeanpartnercountries,
Portugalrevealsthe lowestratesofschoolattainment,whichcanbepartiallyexplainedbythe
significantdifferencesinschoolattainmentacrossagegroups.Justtoillustrate,thePortuguese
population aged 56-65 has the lowest average number of schooling years of all European
partners in 2014, more concretely, just 23% of this age group attained upper secondary
education(21%lessthantheaverageforEU21).
In both regional contexts, theparticipationpercentage of students in upper-secondary and
post-secondarynon-tertiary education (ISCED3-4) hasbeen fluctuating; however, it has been
declining from 2009 to 2012, from 40.2% to 37.1% in Norte and from 45.7% to 37.1% in
Alentejo.
Examining tertiary education in Portugal (FIGURE 3), there was an improvement in the
percentageofpeopleaged25-65whoattainedISCED5-8,increasingfrom12.8%to21.7%from
2006until2014.Evenso,Portugalhadoneofthe lowestaverages(21.7%)comparedtoother
Europeancountries(e.g.,34.7%inSpainor27.1%inGermany) in2014,withtheexceptionof
Italy.Intermsofgenderdifferences,womenaremorelikelytoconcludethetertiaryeducation
thanmen,whoreached17.2%in2014(8.7%lessthanwomen).
FIGURE3:Percentageofpopulation(25-64)withISCED0-2,ISCED3-4andISCED5-8,
in2005and2014
Page 245
H2020-YOUNG-SOCIETY-2015 YOUNG_ADULLLT Deliverable 4.1
13
Source:Eurostat
Duringthesameperiod,atthePortugueseregionallevel,NorteandAlentejohadanincrease
in this indicator in 2015, gaining respectively 6.3% and 4% since 2005. Considering the
Portuguesepopulation aged30-34with ISCED5-8, thepanorama is basically the same as the
one described previously; thus, the percentage has also grown considerably since 2006,
amountingto31.3%in2014,butevensoitislessthaninmostEuropeancountries,exceptItaly
andBulgaria.Alsoherethepercentageofwomenwas15.7%higherthanthatofmen,amounting
to 38.9% in 2014. The percentage of the population aged 30-34 that concluded tertiary
education inbothPortugueseregionshasalso increasedover time,with16.7%more inNorte
and10.1%inAlentejothan in2005,reaching30.3%and24.9%in2014.Although ithadbeen
continuouslygrowingsince2006(FIGURE4),thePortuguesepercentageofpopulationaged20-
24 who attained the tertiary education (ISCED 5-8) is one of the lowest among European
countries (51.2% compared to 95.9% in Austria and 88.3% in Finland in 2012). The same
growth trajectory is seen in both regions, as this indicator increased from40.2% to44.4% in
Alentejoandfrom42.7%to58%inNorte.
Regarding adult participation in education and training, in the Portuguese EUROSTAT
sample, 16.8% of the participants aged 25 to 34 stated that they had received education or
traininginthefourweeksprecedingthesurvey.Thisvalueis0.6%lowerthantheEU21average
in2015.DuringThelastdecade,theindicatorpresentedsomefluctuations;however,from2011
to2016ithasbeendecreasing.Thereisnoevidenceofsignificantdifferencesregardinggender.
Page 246
H2020-YOUNG-SOCIETY-2015 YOUNG_ADULLLT Deliverable 4.1
14
FIGURE 4: Participation (%) in tertiary education of population aged 20-24, 2005-
2012
Source:Eurostat
Portugal only completed the field test of Programme for the International Assessment of
AdultCompetencies(PIAAC),andassuchdidnotparticipate inthemainstudythattookplace
between2008-2013.So,ourmainsourceofdataistheProgrammeforInternationalAssessment
(PISA). Portugal did not participate in 2003; therefore, we included data between 2006 and
2015. Since 2000, every three years, the Programme for International Student Assessment
(PISA) aims to assess and compare education systems worldwide by testing the skills and
knowledgeof15-year-oldstudentsatthebeginningofuppersecondaryeducation.From2006to
2015,thePortuguese15-years-oldstudentsshowedanincreaseinthemeanscoresinnumeracy
and literacy. In 2006, the national numeracy mean was 466 (with 90.67 points of standard
deviation and 0.19 of coefficient of variation). In 2015, the national average had risen to 492
points (with 95.74 points of standard deviation and 0.19 of coefficient of variation).
Simultaneously, the national literacy average grew from 472 points (with 98.79 points of
standarddeviationand0.21ofcoefficientofvariation)in2006to498points(with91.95points
of standard deviation and 0.18 of coefficient of variation) in 2015. The national average in
numeracyandliteracywasgreater,respectively,1pp.and6pp.thantheEUaveragein2015.
In Portugal, the ratio of early school leavers, more specifically, the percentage of the
population aged 18-24 having attained at most lower secondary education and not being in
further education or training, has been declining in the last decade (FIGURE 5). The national
Page 247
H2020-YOUNG-SOCIETY-2015 YOUNG_ADULLLT Deliverable 4.1
15
average decreased from 40.9% in 2005 to 14% in 2016, which is a value that nonetheless
remainshigherthantheEU28average(10.7%).Attheregionallevel,bothregionsalsohadan
improvementinthisindicator,droppingfrom38.3%to18.4%inAlentejoandfrom45%to19%
inNorte between2005 and2014. In any case, theywere greater than the national andEU28
average(11.2%)in2014.
FIGURE5:Percentageofyoungpeopleaged15-24neitherineducation,employment
or training (NEET; left axis) and early leavers aged 18-24 (right axis), Portugal,
AlentejoeNorte,2012-2016
Sources:EurostatandLFS(microdata)
Similarly to thisprevious indicator, thepercentageofPortugueseyoungpeopleaged15-24
whoneitherinemploymentnorineducationandtraining(NEET)reducedfrom13.9%in2012
to10.6%in2016(FIGURE5).Thisindicatorhasalsodecreasedinbothregions,from12.4%to
11.1% in Norte and from 15.3% to 10.3% in Alentejo between 2012 and 2016. While the
nationalaverageishigherthantheEU27average(11.5%)in2016,theregionalaverageswere
slightlylower.
4. Labourmarket
The occupational structure of the Portuguese labour market is less qualified than the EU27
average.However,somechangeshavehappenedduringthelastdecade,withanimportantskills
Page 248
H2020-YOUNG-SOCIETY-2015 YOUNG_ADULLLT Deliverable 4.1
16
upgrading, mainly among the high skilled white-collar occupations. In 2015, 22% of the
Portuguese labour forcewas employed in high skilledwhite collar occupations (ISCO1, 2, 3),
and24%waspartofthehighskilledbluecollargroup(ISCO6,7),whilein2008,theaverages
forthesameoccupationswere,respectively,17%and23%.Onthebottomoftheoccupational
structure,30%ofthePortugueselabourforceisworkinginlowskilledwhite-collaroccupations
(ISCO4,5)andtheremaining24%isworkinginlowskilledblue-collaroccupations(ISCO8,9).
Duringthe lastdecadetheoverallPortugueseemploymentrate foradultsagedbetween20
and64 rose from72.2% in 2005 to 73.1% in 2008 (FIGURE6). Between2008 and2013, the
employment rate decreased 7.1pp. due to both the global financial crisis in 2008 and the
nationalonein2010.Itstartedrisingtheyearafter,reachingthevalueof69.1%in2015.Inspite
of this positive trend in last years, the Portuguese employment rate is still below the value
reachedin2005andtheEU27average in2015(70.1%).Duringthetimespan2005-2015, the
overall employment rates for adults aged between 20 and 64 in Norte and Alentejo regions
followed the same national trends, and were below the Portuguese average. In 2015, the
employmentrateforadultsagedbetween20and64was66.5%inNorteand68.5%inAlentejo.
FIGURE6:Employmentrate(20-64)inEU27,Portugal,Norte,andAlentejo
Source:EUROSTAT
ThePortugueseyouthemploymentrate(15-24yearsold) isoneof the lowest inEU27and
decreasedconsistentlyduringthetimespan2005-2015(FIGURE7).Itwas35.3%in2005and
22.8% in 2015, showing a reduction of 12,5pp.. During the last decade, the gap between the
Page 249
H2020-YOUNG-SOCIETY-2015 YOUNG_ADULLLT Deliverable 4.1
17
Portuguese youth employment rate and the EU 27 average rose from 0.6pp. to 10.3pp., since
2005to2015.Generallyspeaking,onecansupporttheideathattheeffectsofthefinancialcrisis,
inparticular the riseof theunemployment,havebeenparticularly severe to theyoung labour
force.
Theimpactofthefinancialcrisisattheregionallevelwasevenstrongerthanatthenational
level(FIGURE7).Theyouthemploymentratedecreased16pp.inNorteand14.9pp.inAlentejo
between 2005 and 2015. In spite of this general trend, the two regions have different youth
employment rates. In 2015, the youth employment rate in Nortewas 23.7%, higher than the
nationalaverage,whileinAlentejowas19.4%lower.
FIGURE7:Youthemploymentandunemploymentrates,youthunemploymentratio
ofyoungpeople15-24(rightaxis),EU27,Portugal,NorteandAlentejo,2005-2015
Sources:EurostatandLFS(microdata)
Focusing on unemployment, the overall unemployment rate (aged 20 to 64) began to
increaseevenbeforethefinancialcrisisandstronglyrosetill2013.In2006,itwas7.8%,0.9pp.
lowerthanEU28average(8.7%).In2013,thePortugueseunemploymentratewas16.5%,5.9pp.
higherthanEU28average.Sincethanithasbeenconsistentlymovingdown(12.5%in2015)and
thegapbetweenthePortugueseandtheEU27overallunemploymentrateisgettingsmaller,but
thePortugueserateisstill3.3pp.higherthanEU27average.NorteandAlentejoregionsfollowed
thenationaltrend.Inbothregionstheunemploymentratestartedmovingupin2008till2013
when it reached, respectively, 17.4% and 17.2%. As at the national level, the downward
Page 250
H2020-YOUNG-SOCIETY-2015 YOUNG_ADULLLT Deliverable 4.1
18
movement began in 2014. In 2015, the Norte average was 2.2pp. higher than the national
average,whiletheAlentejoaveragewas2pp.lower.
FIGURE8:Unemploymentrate(20-64)inEU28,Portugal,Norte,andAlentejo
Source:EUROSTAT
InPortugal,thepercentageoftheunemployedthathavebeensearchingforajobforoneyear
ormore is one of the highest in EU27. In 2015, the overall long-term unemployment rate in
Portugalwas57.4%whileinEU27was48.1%(FIGURE9).Whenlong-termunemploymentrate
is concerned, important territorial differences emerge. During the time span 2005-2015, this
ratehasalwaysbeenhigherinNorteregionthaninAlentejo,whereitwasalwayslowerthanthe
nationalaverage.In2015,thelong-termunemploymentratewas61.6%inNorteand49.6%in
Alentejo.
In Portugal, unemployment is mainly a youth problem, particularly after 2011. The
unemploymentrateamongyoungpeopleaged15-24startedtorisewiththeinternationalcrisis
of 2008 (FIGURE 7). However, it was with the severe austerity measures imposed in the
aftermath of the Portuguese bailout of 2010 that it started coming up very rapidly and
intensively. In 2005 and 2006, the Portuguese youth unemployment was lower than EU 28
average.In2011,ittouched30.3%,whileinEU28was21.8%.Thehighestvaluewasreachedin
2013,when38.1%oftheyoungactivepopulationwasunemployed.
Page 251
H2020-YOUNG-SOCIETY-2015 YOUNG_ADULLLT Deliverable 4.1
19
FIGURE 9: Long-term unemployment rate (20-64) in EU27, Portugal, Norte and
Alentejo
Source:EUROSTAT
In2015,thePortugueseyouthunemploymentratewas32%,morethanthedoubletherateof
people aged between 20 and 64 years (12.5%), and 12.4pp higher than the EU28 average.
Opposite to what happens with the adult unemployment rate, among young people gender
makesthedifference.Youngwomenaremoreaffectedbytheunemploymentthanyoungman.
Duringthetimespan2005-2015,theyouthfemaleunemploymentratewasalwayshigherthan
the young male’s one. The major difference can be found in 2005: the youth female
unemployment rate was 19.2% and the male unemployment rate was 13.9%. Long-term
unemployment seems to be less severe among unemployed youth (15-29) than among the
unemployedadults.Itstartedmovingupduringthefinancialcrises,reachingthehighestvaluein
2013(12.2%). In2015, thePortuguese long-termunemploymentratewas8.1%,4.3pp.higher
thantheEU27average(FIGURE9).
Lookingatyouthunemployment(15-24)someterritorialdifferencescanbefound(FIGURE
7).During the timespan2005-2015,youthunemployment ratewasalwayshigher inAlentejo
than in Norte. While in Norte this rate followed the national trend and was lower than the
nationalaverage, inAlentejoyouthunemploymenthasalwaysbeenmoresevereandgoteven
worseduringthefinancialcrisis.In2012,thePortugueseyouthunemploymentratewas37.9%,
while inNortewas33%andinAlentejo45%.ThisdatasuggeststhattheNorte labourmarket
seems to be more youth friendly than the Alentejo one or even the national one, probably
Page 252
H2020-YOUNG-SOCIETY-2015 YOUNG_ADULLLT Deliverable 4.1
20
becauseofregion’seconomicstructurewithahighweightof industry.TheadvantageofNorte
disappearedwhenyouthlongtermunemploymentrate(15-29)isconcerned.Inthiscase,youth
long-termunemploymentratesaresimilar inbothregions,andhigherthannationalandEU27
average. In 2015, when long-term unemployment became less severe, youth long-term
unemploymentratewas9.2%inNorteand9%inAlentejoagainst8.1inPortugaland5.8%in
EU27.
Due to the financial crises, thePortuguese investment in labourmarketpolicies, started to
comingupin2009,whenthetotalamountofresourceswasequalto1.98%ofGDPandreached
itspeakin2013(2.14%ofGDP).Sincethatyear,theexpenditureisconsistentlydecreasing.In
2015,Portugalinvestedinlabourmarketpolicies(LMP)atotalamountof1.54%ofGDP.During
thetimespan,almost2/3ofthetotalamountwasinvestedinout-of-workincomeandsupport.
Active labourmarketmeasures represent a very small share of the overall LMP expenditure.
However,theinvestmentintrainingisrelativelyhighcomparedtotheEU28average.Inspiteof
thedecreasefrom2009till2015,trainingexpenditurevariedbetween0.41%and0.27%ofGDP,
onlyAustriaandFinlandinvestedmoreinthisactivelabourmarket.Thesefiguressupportthe
idea that themost important Portuguese active labourmarket policy to copewith the rise of
unemploymenthasbeentheinvestmentintraining.
5. Redistributionandsocialinclusion
InPortugal,thenetexpenditureinsocialprotectionrosefrom22.4%ofGDPin2007to24.9%in
2014.The strongest increase tookplacebetween2009and2013due to the impactsof global
andnationalfinancialcrisis.However,theriseoftheexpenditureinsocialprotectioninPortugal
is lower than in otherEU countries due to the reduction of the entitlement to social benefits.
This can be seen as a political strategy to control public expenditure within the austerity
framework. InPortugal, resourcesspent forsocialprotectionbenefits,provided tohouseholds
andindividualsaffectedbyaspecificsetofsocialrisksandneedsisoneofthelowestinEU27.In
spiteofthefinancialcrisisandthegrowthofunemploymentrate,theexpenditureperinhabitant
didn’t rise significantly. In 2008, the expenditure per inhabitant in Portugal was 4,779 euro
against6,784euroinEU27,whilein2013itwas,respectively,5,544euroand7,763euro.This
trendshowstheweaknessofthePortugueseWelfareStatethattraditionallyallocatestofamilies
andcivilsocietythegreatestresponsibilityinrespondingtosocialproblems.
The main share of the overall expenditure in social protection is spent for pensions and
retirement.Thesocialprotectionbenefitswitholdagerosecontinuously from9.2%ofGDP in
2005to12.8%ofGDPin2014.Portugalwasoneofthecountrieswherethisexpendituregrew
themost.From2005till2014,theexpenditurewitholdageincreased3.6pp.inPortugalagainst
Page 253
H2020-YOUNG-SOCIETY-2015 YOUNG_ADULLLT Deliverable 4.1
21
1.4pp.inEU27.Thisgrowthcanbeexplainedbothbyagingandhighriskofpovertyduetothe
low incomeof Portuguese old people. The social protectionbenefitswith survivors also grew
duringthetimespanfrom1.5%to1.9%ofGPD.Ontheoppositeside,duringthetimespan,the
expenditurewithsocialprotectionbenefitsdecreasedinthefieldsofhealthcare(from6.7%to
6.1%) and disability (from 2.2% to 1.9%). Expenditure with family and children and social
exclusion remained stable between 2005 and 2014.However, these social protection benefits
are those were the underfunding is more severe when compared with EU27. In 2014, the
amountofresourcesspentwithbothsocialprotectionbenefitswashalfofEU27average.
Thedisposable incomeforhouseholds istheamountofmoneythatahouseholdearnseach
yearaftertaxesandtransfers,representingthemoneyavailabletoahouseholdforspendingon
goodsorservices. InPortugal, thedisposable incomeforhouseholdsrose from11,300euro in
2005 to12,600euro in2013, remainingoneof the lowest inEU (FIGURE10). In spiteof this
growth,duetothefinancialcrisis,thedisposableincomeforhouseholdsin2013wasidenticalto
the one registered in 2010. Norte and Alentejo region followed the same national trend.
However, in both regions the disposable income for households is lower than the national
average.Comparingbothregions,theincomeishighestinAlentejothaninNorte.
Focusing in income inequality, Portugal followed the general European trend of increasing
inequalities. TheGini coefficient of equivalised disposable incomebefore social transfers rose
from51.2%in2005to64.1%in2015(FIGURE10).
FIGURE 10: GINI index before and after transfers, disposable income in the
householdsinPPS(rightaxis),EU27,Portugal,NorteandAlentejo,2005-2015
Page 254
H2020-YOUNG-SOCIETY-2015 YOUNG_ADULLLT Deliverable 4.1
22
Sources:EurostatandEU-SILCmicrodata
Thiswasnotalineargrowth.Theinequalitystartedtoincreasestronglyafter2011duetothe
structuraladjustmentpoliciesimposedtoPortugalbytheEuropeanCommission,theEuropean
Central Bank and the International Monetary Fund. The concentration of income rose from
50.3%in2011to64.1%in2015,transformingPortugalinoneofthemostunequalcountriesin
EU. The huge growth of inequality shows that the structural adjustment policies were more
severetowardsthelow-incomefamiliesthantothehighincomeones.Thisinequalityisstrongly
reducedwhenthesocialtransferistakeninaccount.AsshowninFIGURE10,theGinicoefficient
aftersocialtransfersdroppeddownfrom38.1%in2005to33.7%in2010,duetotheincreasein
publicexpenditureinsocialprotection.However,itstartedcomingupto34.5%in2014,maybe
asaconsequenceofthecutandreductiontotheentitlementinmanysocialprotectionbenefits.
The risk of poverty and social exclusion decreased from26.1% in 2005 to 24.4% in 2011.
After 2011, it started to grow, reaching 27.5% in 2014. In 2015, 26.6% of the Portuguese
population was at risk of poverty and social exclusion against 23.7% in the EU27. Severe
material deprivation shows a much more erratic behaviour during the time span. It started
comingupin2006,decreasedbetween2008and2011,andreturnedtogrowreachingthepeak
in2013,when10.9%ofthePortuguesepopulationwasinseverematerialdeprivation.Looking
atbothindicators,itcanbeconcludedthatthegrowthofinequalityinPortugal,asintheother
countriesparticipatinginYOUNGADULLLTproject,hasmainlyincreasedthepercentageofthe
populationatriskofpovertyandsocialexclusion.
Focusing in public sphere and civic participation, recent surveys show that in Portugal
confidence in national government is one of the lowest among OECD countries (23% against
42%)anditisevenlowerwhenyoungpeopleaged15-29yearsisconcerned(OECD,2016).Only
20%declaretotrustthegovernment,against43.6%inOECDarea.Notsurprisingly,theinterest
inpolitics isalso lowandhasbeendeclining. In2005, theparticipation in theelection for the
nationalparliamentwas64.3%, in200959.7%, in201158.1%and in201555.9%.Thevoter
turnoutisevenlowerwhentheelectionforEuropeanparliamentisconcerned,neversurpassing
40%inlastdecade.
6. Healthandwell-being
In2015,lifeexpectancyinPortugalwas80.5years,slightlyhigherthantheOECDaverage(79.6
years) (OECD,2015).Portuguesemaleand femalepopulationexperiencedan improvement in
healthylifeyearsbetween2005and2012.After2013,thehealthylifeyearsdeclinedduetothe
effects of the structural adjustment policies. In 2014, males had 58.3 healthy life years and
Page 255
H2020-YOUNG-SOCIETY-2015 YOUNG_ADULLLT Deliverable 4.1
23
female55.4years.Duringthetimespan2005-2015,selfperceivedhealthinPortugalhasalways
beenlowerthantheEU27average.In2015,peoplereportinggoodorverygoodselfperceived
healthwas67%inEU27and46.5%inPortugal.Portugalwasalsothecountryparticipatingin
YOUNGADULLLTprojectwiththelowestself-perceivedhealth.Mostprobablybecauseoftheir
youth,thehealthperceptionsamongyoungpeopleaged16-29yearsaremuchhigher,81.3%in
2015,butstilllowerthantheEU27average,90.8%in2015.
Thehealth expenditureper inhabitant rose from1,014 euro in 2005 to 1,165 in 2009 and
decreased since than to 1,012 euro in 2014, when it was less than half of the EU27 average
(2,236euro).Thisamountisslightlylowerthanitwasatthebeginningofthedecadeshowing
thePortuguesegovernment’sdivestmentinhealthandmedicalcareduringthefinancialcrisis.
This divestment also affected thenumber of available beds in hospital,whichdecreased from
353,3 per 100,000 inhabitants in 2005 to 339,5 in 2013. Once again the number of available
bedsislessthanhalftheEU27average(681,4).Oppositetothesetrendsthehealthpersonnel
roseduring the timespan2005-2015. In2005,medicaldoctorsandnursesandmidwivesper
100,000 inhabitantswere780while in2015were1079.Howeverhuge territorialdifferences
emerge when we look at both regions. In Norte, the number of health personnel data per
hundredthousandinhabitantsissimilartonationalaverage(719in2005and1074in2015).In
Alentejo,itwasconsiderablylower(668in2005and815in2015).
Subjectivewell-beingcanbemeasured in termsof lifesatisfaction(FIGURE11). Ingeneral,
Portuguesepeopleagedbetween25-34yearsarecomparativelylesssatisfiedwiththeirlives.
Page 256
H2020-YOUNG-SOCIETY-2015 YOUNG_ADULLLT Deliverable 4.1
24
FIGURE 11: High satisfaction in various life domains, age 25-34, EU28 and Portugal,
2013
Source:EU-SILCmicrodata
Only16.5%arehighsatisfiedagainst25.3%inEU28.Accordingly,Portuguesearelesssatisfied
withfinancialsituation,recreationandgreenareas,andlivingenvironmentthantheirEuropean
peers.However,theyaremoresatisfiedthanthemwithaccommodation,commutingtime,time
use, and personal relations. There are some differences according to gender, in Portugal.
Portuguese young women are more satisfied with accommodation, job, commuting time and
meaningoflife.
Sameotherindicatorscanbeusedtomeasurewell-being.In2015,Portuguesehomiciderate
was0.9,significantly lowerthantheOECDaverageof4.1. In2014,consumptionofalcoholper
capitawas 9.9 litters in Portugal against 8.9 litters inOECD area and the daily smokerswere
16.8%.
Page 257
H2020-YOUNG-SOCIETY-2015 YOUNG_ADULLLT Deliverable 4.1
25
FinalRemarks
ConsideringthelimitationsofdataavailabilityatNUTS3andNUTS2,aswellasregardingthe
youthagegroup,itischallengingtofindthekeyaspectstounravelriskprofilesatlocallevel.
Still,thefollowingmainfindingsbringrelevantinformationonthesocialconditionsofyoung
adultsinbothFR.
LikeageneraltendencyinEurope,Portugalisalsowitnessinganageingprocessofits
population,mainlyinAlentejo.Inviewoftheriskprofile,thisfactassociatedwithlow
populationdensityanddispersesettlementinfluencesnegativelythelivingconditionsofthe
youngadultsintheregion,especiallyregardingtheaccesstoeducation.Thesmallnumberof
youngpeoplelivinginAlentejoLitoralhasaneffectonthediversityofeducationalprovisionat
bothuppersecondaryandtertiarylevels.Thefactthatthereisnohighereducationinstitutionin
theregionmakestheaccesstohighereducationmoredifficultandexpensiveandpartially
explainthelowerpercentageofpopulationaged20-24whoattainedthetertiaryeducationin
theregion.
Otherdemographiccharacteristicsarethehighpercentageofyoungadults(20-29)stillliving
withtheirparentsandtheincreasingageatwhichawomangivesbirth.Unemployment,
precariousjobsandlowwageshaveagreatimpactinyoungadults’lifecourseinbothregions
andcancontributetopostponetheirownfamilyproject.
ConsideringotherpartnerEuropeancountries,Portugalhasthelowestrateofschool
attainmentalsoamongtheyoungergenerations.AlongtheconsideredtimespanPortugalhas
shownaconsiderabledecreaseintermsofearlyschoolleavingrate,makingagreateffortto
keepyoungstersatschool,byincreasingthecompulsoryschoolupto12years.Nonetheless,
earlyschoolleavingrateisstillhigherthantheEU28average.ThepercentageofNEETalso
reducedandbothregionsshowaverageslowerthantheEU27.However,thesituationitself
poseschallengesforstatisticaleffects,asitsnumberismostlikelygreaterthantherepresented.
Consideringtheidentificationofriskprofiles,unemploymentinPortugalismainlyayouth
problem,(15-24yearsold)withoneofthehighestratesinEU27,withregionaldifferenceswith
AlentejoshowingahigherratethanNorte.Inaddition,gendermakesadifferenceandyoung
womenaremorerepresented,onthecontrarytoadultunemployment.Youthlong-term
unemploymentinbothregionsishigherthanthenationalandtheEU27average.Figuresshow
qualificationasthemostimportantactivelabourmarketpolicytodealwiththeincreasing
unemploymentrates.
Theexpenditureinsocialprotectionbenefitsperinhabitantdidnotaccompanythegrowthof
theunemploymentratewithintheconsideredtimespan.Tobenotedhowfamiliesandcivil
societytraditionallytakeresponsibilitytoactasthePortuguesewelfarestatedoesnotcome
forthwitharesponse.
Page 258
H2020-YOUNG-SOCIETY-2015 YOUNG_ADULLLT Deliverable 4.1
26
References
OECD(2017)Countrystatisticalprofile:Portugal2017,Paris.
OECD (2016). Education at a Glance 2016: OECD Indicators. OECD Publishing, Paris.
http://dx.doi.org/10.187/eag-2016-en.
OECD (2016). Society at a Glance 2016. A Spotlight on Youth. How does Portugal
compare?.OECDPublishing,Paris.
OECD(2015).EmploymentOutlook2015.HowdoesPortugalcompare?Paris.
Page 259
H2020-YOUNG-SOCIETY-2015 YOUNG_ADULLLT Deliverable 4.1
Work Package 4
Quantitative Analysis Young Adults’ Data
Scotland –
National Briefing Paper with national and regional data sets in Scotland, Glasgow City-Region and
Aberdeenshire
Kristinn Hermannsson, University of Glasgow
Rosario Scandurra, Universidad de Granada
Date 07/09/2017
Work Package 4 – Quantitative Analysis of Young Adults’ Data
Deliverable 4.1
Page 260
H2020-YOUNG-SOCIETY-2015 YOUNG_ADULLLT Deliverable 4.1
2
Tableofcontents
1 Introduction............................................................................................................................................................4
2 Qualitydataassessment..................................................................................................................................4
3 Demographicstructure....................................................................................................................................6
4 Thestructureoftheeconomy...................................................................................................................11
5 Education...............................................................................................................................................................14
5.1 Post-compulsoryeducation....................................................................................................................16
5.2 Workbasedlearning..................................................................................................................................17
6 Labourmarket....................................................................................................................................................18
6.1 Qualificationsoftheworkingagepopulation.................................................................................19
7 Redistributionandsocialinclusion.......................................................................................................24
8 Healthandwell-beingconditions...........................................................................................................27
9 Finalremarks......................................................................................................................................................28
10 References..........................................................................................................................................................30
Page 261
H2020-YOUNG-SOCIETY-2015 YOUNG_ADULLLT Deliverable 4.1
3
Figures
Figure1Populationoffunctionalregions(ONSpopulationestimates,2015)...........................................7
Figure2.Shareofthepopulationaged20-29years.....................................................................................8
Figure3.Cruderateofnetmigrationplusstatisticaladjustment................................................................9
Figure4.Agedependencyratio.On1stvariant(populationaged0-14and65andmoretopop.aged
15-64).............................................................................................................................................................11
Figure5.GDPatcurrentmarketprices,Europerinhabitantin%ofEuropeanaverage(EU28=100)..13
Figure6Employmentbybroadsectorandstudyregion...........................................................................14
Figure7OverviewoftheScottishschoolsystem........................................................................................15
Figure8.Youthemploymentrates,population15-24years.....................................................................19
Figure9Shareofpopulationaged25-64withtertiaryqualificationsbyEurostatcountryin2014(%).
.........................................................................................................................................................................20
Figure10Shareofpopulationaged25-64withtertiaryqualificationsinEurostataffiliatedcountriesin
2014.40highestrankedNUTS-2regions.(%)............................................................................................21
Figure11Highestqualificationsachievedforpopulationaged25-64.Eurostataffiliatedstatesand
Scotlandin2014(%).....................................................................................................................................23
Figure12.ExpenditureinsocialprotectioninPPSperinhabitantas%ofEU19.....................................24
Figure13Disposablehouseholdincome(€,PPPadjusted).......................................................................26
Figure14Disposableincomeofprivatehouseholdsperinhabitant,highestandlowestNUTS2region
withineachcountry.......................................................................................................................................27
Figure15.Highsatisfactioninvariouslifedomains,populationaged18-30,EU28andUK,2013.........28
Page 262
H2020-YOUNG-SOCIETY-2015 YOUNG_ADULLLT Deliverable 4.1
4
1 Introduction
Thisnationalbriefingpaperprovidesashortoverviewofthelivingconditionsofyoungadults
inScotlandandinthetwofunctionalregionsselectedfortheYOUNG_ADULLLTproject,
GlasgowCityRegionandAberdeenshire.Thedatawerecollatedatnationalandlocallevel
(NUTS2)accordingtosixdimensionsofcontextuallivingconditions:thedemographic
characteristicsofthepopulation,thestructureoftheeconomy,theinputsandoutputsofthe
educationandtrainingsystem,thelabourmarket,themateriallivingconditionsandthe
participationascitizenstothepoliticalandciviclifeand,finally,thehealthconditionsand
individualwell-being.DatawereextractedfromEurostatandfromdifferentsurveyssuchas
theEU-LFS,EU-SILC,PISAandPIAAC.Themaincorpusofdataproceedingfrominternational
andharmonizeddatawassuccessivelycomplementedbydatacollatedatthelocallevel.
ForthecaseofAberdeenCityandAberdeenshire,thechosenfunctionalregioncorresponds
withtheNUTS2regionofNorthEasternScotland.ForthecaseofGlasgowCityRegion,thereis
aclosebutapproximatefitwiththeNUTS2regionSouthWesternScotland.Additionally,
SouthWesternScotlandincludesthemoreruralareaofDumfriesandGalloway,whichspans
theareafromAyrshire,whichistakentorepresentthesouthernlimitofGlasgowCityRegion
andtheEnglishcountyofCumbria.Overall,thiswillacttodilutetheurbanandservice
orientedcharacterofGlasgowCityRegion.However,thisbiasislikelytobemodestasthe
populationofDumfriesandGallowayisonlyaround150,000people,orlessthanatenthof
theoverallpopulationofGlasgowCityRegion.Foramoredetailexpositionofthefunctional
regionsseeLowdenetal(2016)andforamoredetaileddiscussionabouttheuseofavailable
statisticsinthemodellingofGlasgowCityRegionseeHermannsson(2016).
2 Qualitydataassessment
EurostatUNESCOandOECDprovideavastamountofharmonizedandcomparativedatathat
canbeausefulresourceforassessingthelifeconditionsofyoungpeopleindifferentdomains
andinvariouscountries/regions.However,theavailabilityofdataattheregional/locallevel
islimited.Mostofthedataareprovidedatnationallevelandonlytwoofthesixdimensions
(economyanddemography)haveafairamountofindicatorsatNUTs2andNUTs3level.This
restrainsthepossibilityofcomparison.Withinthesurveysavailablethemostrelevantsource
ofinformationistheEU-LFSwhichhaslargesamplesizeatlocallevel.Moreover,
complementingtheinternationaldatawithlocaldataisahardtaskformainlytworeasons:a)
fragmentationandavailabilityofsourcesandb)comparabilitybetweenregionsofthesame
stateandatEuropeanlevelandacross2005and2015.Sincetheobjectiveisverybroad,the
Page 263
H2020-YOUNG-SOCIETY-2015 YOUNG_ADULLLT Deliverable 4.1
5
dataneededarelikelytobecollectedforspecificpurposesandindifferentway.Forthis
reason,themostaccessibledataareEUROSTATsincetheyprovidemetadataandcompleted
timeseries.
DuetoitsautonomousstatuswithintheUK,availabilityofdataforScotlandistypicallybetter
thanforotherUKregions.Forinstance,theScottishGovernmenthaspublisheddetailed
regionaleconomicaccountssincethe1970's.However,thereremainsignificantgapswhenit
comestoassessingthelivingconditionsofyoungadultsattheleveloffunctionalregion.In
somecasesrelevantinformationisavailable,butataggregatespatialscales.Alternatively
theremaybenodataatall.SocialresearchintheUKoftendrawsonseverallargescalesocial
surveysmaintainedbytheOfficeforNationalStatistics,suchastheLabourForceSurveyand
theAnnualPopulationSurvey.Whilstthesesurveysprovideinformationaboutawiderange
ofvariables,samplessizesareoftentoosmalltodealaccuratelywithsub-populationsand
sub-regions.Furthermore,theUKhasinvestedincohortstudies(e.g.forthosebornin1958,
1970and2000)andhouseholdpanelstudies(BritishHouseholdPanelStudy,Understanding
Society),wheregreatercarehasbeentakentooversamplesub-populationtoallowforamore
detailedbreak-down.Thesedatasetsareusefulforthesocialsciencesingeneral,butwaves
areinfrequentandoftenfocussingonspecificcohortssotheseareunlikelytomeettheneeds
ofpolicymakersforongoingmonitoringofthelivingconditionsofyoungadults.Scotlandhas
investedinadedicatedlongitudinalstudy,GrowingUpinScotland,whichtracksfamily
circumstances,healthandeducationof3cohortsbornin2002/3,2004/5and2010/11.
However,asofyet,thesecohortsaretooyoungtoshedlightonthelivingconditionsofyoung
adultsanditisnotclearforhowlongtheywillbefollowedup.
TheUKhighereducationsectorcollectsdetailedadministrativedataanddepositswiththe
HigherEducationStatisticsAgency(HESA).Thesedatasetcontainthefullpopulationof
studentsandsamplesurveysarecarriedouttofollowupgraduates.Theadministrativeand
surveydatasetsareoftenlinkedtocarryoutanalysisofstudentsandgraduates.However,a
shortcomingofthisdatasetforassessingthelivingconditionsofyoungpeopleingeneralis
thatitomitsthesizableshareofthepopulationthatdoesnotenterhighereducationand
similardataarenotgatheredforthoseinothereducationalroutesoremployment.Skills
DevelopmentScotlandcarriesoutanannualsurveyofschoolleavers,trackingtheiractivities.
However,thesecohortsarenotfollowedupsoitisimpossibletotellhowtheyoungpeople
geton,beyondtheirfirstdestinationafterschool.Onbalance,thereisagapinavailabilityof
dataforyoungpeopleaftertheyleavetheschoolsystem.
Page 264
H2020-YOUNG-SOCIETY-2015 YOUNG_ADULLLT Deliverable 4.1
6
3 Demographicstructure
Scotlandisacountrythatsince1707hasbeenpartoftheUnitedKingdom.WithintheUnited
KingdomScotlandenjoysconsiderableautonomy.Throughoutithasmaintainedalegal
systemandaneducationalsystemseparatefromtherestoftheUnitedKingdom(henceforth
RUK).TheScottishParliamentwasreinstatedin1999andtheScottishGovernment
(originallyreferredtoastheScottishExecutive)established.TheScottishGovernmenthas
devolvedauthorityfromtheWestminsterParliamentovermostdomesticaffairs,including
health,transport,culture,agriculture,fisheries,ruralpolicyandregionaldevelopment.
However,ithasnocontroloverdefenceorforeignpolicyandonlylimitedfiscalpowers.
Taxationisnotadevolvedmatter.HerMajesty'sRevenue'sandCustoms(HMRC)collectstax
revenuesforthewholeoftheUKandHerMajesty'sTreasury(theministryoffinanceinthe
UKgovernment)distributesanannualblockgranttoScotland(aswellasWalesandN-
Ireland,theothertwodevolvedgovernments)basedontheso-calledBarnettformula,which
takesaccountofpopulationandhistoricalexpenditurelevels.Initiallythefiscalautonomyof
Scotlandwasnotional,butfollowingthe2014independencereferendumadditionalsteps
havebeentakentodevolvefurtherfiscalpowers,suchasstampdutyonpropertytransactions
andairportduties.Similarly,elementsofsocialsecurityarenowbeingdevolved,whereas
historicallythesewerereservedmattersforWestminster1.
Scotlandcoversatotalareaof77,933km2,justunderonefifthofthelandmassofFinlandor
Germany,aquarterofthelandmassofItalyandathirdofthelandmassoftheUK–smaller
thanBulgaria,PortugalorAustriaandlargerthanCroatia.ThepopulationofScotlandis
estimatedtobearound5.5millionpeople.
1ForamoredetaileddiscussionofthefiscalarrangementsinScotlandandrecentandemergingchangestothefiscalframeworkseeEiser(2017).
Page 265
H2020-YOUNG-SOCIETY-2015 YOUNG_ADULLLT Deliverable 4.1
7
Figure1Populationoffunctionalregions(ONSpopulationestimates,2015)
Figure2showstheshareoftheyouthpopulationaged20-29overthestudyperiod.In2015,
youthpopulationaged20-29accountedfor13.5%oftotalinhabitants,inSouthWest
Scotland.ThisisinlinewithScotlandandtheUKasawhole.TheNUTS2regionofNorth
EasternScotland,however,divergesfromthebroaderaverage,with20-29populationmaking
upjustover15%ofthetotalpopulation.Overall,acrosstheUKandScotlandtheshareofthe
20-29populationisstable.
Page 266
H2020-YOUNG-SOCIETY-2015 YOUNG_ADULLLT Deliverable 4.1
8
Figure2.Shareofthepopulationaged20-29years
Source:EUROSTAT
Infantmortalityinthefirstyearafterbirthis3.9intheUKwhileintheEU28itwas3.6in
2016withaconstantdecreaseoverthelastdecade(in2005itwas3.7).InScotland,however,
thisstoodat3.2intheSouthWestand2.7intheNorthEast,InbothcasesbelowboththeUK
andEUaverages.Conversely,lifeexpectancyinScotlandisbelowtheUKaverageof81.3
years,at78.6intheSouthWestand80intheNorthEast.Inbothcaseslifeexpectancyhas
beenincreasing,broadlyinlinewithdevelopmentsseenelsewhere.
InthepostwarerapartsofScotlandhaveattimesbethreatenedbyde-population.Thisis
particularlythecaseformoreremotesettlements,buthasalsobeenanissueforurban
centresthathavesufferedfromde-industrialisationsuchastheGlasgowCityRegion.In
conjunctionwithpopulationageingthishasbeenseenasasignificantchallengeandwasseen
asapolicypriorityinthelate1990's.However,followingtheenlargementoftheEUnet
migrationtoScotlandincreased(andastheimmigrantpopulationwasmorefertilethisalso
boostedfertilityrates).Notsurprisingly,netmigrationhasbeenstrongerfortheaffluent
NorthEast,aboveboththeUKandScottishaverages,whilstfortheSouthWestmigrationhas
beenbelowbothUKandScottishaverages,albeitpositive.Foradetaileddiscussionofthe
economicimpactofdemographicchangeinScotlandseeLisenkovaetal(2010).
Page 267
H2020-YOUNG-SOCIETY-2015 YOUNG_ADULLLT Deliverable 4.1
9
Figure3.Cruderateofnetmigrationplusstatisticaladjustment
Source:EUROSTAT
Whilstmigrationandfertilityhasbeenmovinginapositivedirection,thishasnotbeensufficienttooff-setthepopulationmomentum.DependencyratiosareincreasinginScotlandinlinewithdevelopmentselsewhereinEurope,asdepictedin
Page 268
H2020-YOUNG-SOCIETY-2015 YOUNG_ADULLLT Deliverable 4.1
10
Figure4.However,Scotland'sdependencyratioissomewhatbelowthatoftheUK.
Furthermore,thereisregionalvariationinthedependencyratios.WhilsttheSouthWestis
closetotheaverageforScotlandataround51%in2015,thedependencyratiofortheNorth
Eastis3percentagepointslowerat48%in2015.
Page 269
H2020-YOUNG-SOCIETY-2015 YOUNG_ADULLLT Deliverable 4.1
11
Figure4.Agedependencyratio.On1stvariant(populationaged0-14and65andmore
topop.aged15-64)
Source:EUROSTAT
4 ThestructureoftheeconomyWhencomparedtotheEU28(asin
Page 270
H2020-YOUNG-SOCIETY-2015 YOUNG_ADULLLT Deliverable 4.1
12
Figure5)theGDPpercapitainScotlandhasbeenfallingbehind.Thisisinlinewiththetrend
oftheUKasawhole.ThisrunssomewhatcountertothepopularnarrativeintheUKmedia,
wherepoliticianshavebeenatpainstoemphasisetheeconomicachievementsoftheUK.
However,whilstnominalGDPhasbeenincreasing,thishascoincidedwithpopulationgrowth
sothatGDPpercapitagrowthhasbeenlessimpressive.Furthermore,nominalgrowthhas
coincidedwithasignificantdepreciationofthepoundsterling,therebyreducingitseuro
value.TheSouthWestofScotlandfollowstheUKandScottishtrendsalbeitatalowerlevel.
However,intheNorthEast,GDPpercapitaisatafarhigherlevelandhasgrownoverthe
period(althoughfrom2015theregionaleconomyhasbeenhitbyastrongcontractioninthe
activitiesoftheoilandgassector).
Page 271
H2020-YOUNG-SOCIETY-2015 YOUNG_ADULLLT Deliverable 4.1
13
Figure5.GDPatcurrentmarketprices,Europerinhabitantin%ofEuropeanaverage
(EU28=100)
Source:EUROSTAT
Page 272
H2020-YOUNG-SOCIETY-2015 YOUNG_ADULLLT Deliverable 4.1
14
Figure6Employmentbybroadsectorandstudyregion
Source:AnnualPopulationSurvey,ONS.
AscanbeseenfromFigure6approximately80%oftheworkforceinScotlandisemployedin
services.Aboutathirdoftheworkforceareemployedinthepublicsector.Thereisstructural
variationwithinthecountry,withGlasgowCityandGreaterGlasgowleaningmoreheavily
towardsservices(approximately84%)andmorepublicsectoremployment(34-35%).
Aberdeenshireisdistinctinthattheenergysector(mainlyoilandgas)andagricultureand
fishingaredisproportionatelylargeemployerscomparedtoScotlandasawhole.Conversely,
theshareofservicesis65%andthepublicsectoronlyemploys24%oftheworkforce.
5 Education
Scotland's32localauthoritiesareresponsiblefortheprovisionofeducation,inEarly
LearningandChildcare(ELC),primaryandsecondaryeducation.Localauthoritiesmaketheir
owndecisionsabouttheshareoftheirincomespentoneducation(ScottishGovernment,
2015).Approximately85%oflocalauthorityfundingisobtainedviaaScottishGovernment
blockgrantandtheremainderfromlocaltaxation2.Figure7presentsanoverviewofthe
differentstagesoftheScottisheducationsystemandthekeyfeaturesofeachstage.
2 For a further discussion of local authority finances see the chapter by Gibb and Christie in this volume. Asummary of local government funding is provided on the Scottish Government's website:
Page 273
H2020-YOUNG-SOCIETY-2015 YOUNG_ADULLLT Deliverable 4.1
15
Figure7OverviewoftheScottishschoolsystem
Source:ScottishGovernment(2015),citedinOECD(2015,p.38).
FollowingtheChildrenandYoungPeople(Scotland)Act(2014),all3and4yearoldsare
eligibleforEarlyLearningandChildcare(ELC)of600hoursperannum.Thisamountsto
approximately3hoursadayduringtermtime.Additionally,some2yearoldsareeligible3.
Localauthoritieshaveadutytosecuretheseplaces,whichcanbeprovidedbythelocal
authority,inaprimaryschoolnurseryclassorbyindependentproviders4.
Mostprimaryandsecondaryschoolsarerunbylocalauthoritieswithafewspecialistschools
fundeddirectlybytheScottishGovernment.Overalljustover95%ofstudentsattendpublicly
fundedschools.Mostofthesearesecular.However,forhistoricalreasons15%ofpublicly
fundedschoolsaredenominational(mostlyRomanCatholic).Theindependentschoolsector
inScotlandisrelativelysmall,with100institutionsprovidingeducationforapproximately
30,000studentsorjustover4%oftheoverallstudentpopulation.However,theseinstitutions
areunevenlydistributedspatially,withathirdofstudentsattendinginstitutionsin
http://www.gov.scot/Topics/Government/local-government/17999/CoreRevenueFunding/Revenue-Funding-Streams3Thisincludeschildrenincareandchildrenwhoseparentsareinreceiptofparticularbenefits.Fordetailssee:http://www.gov.scot/Topics/People/Young-People/early-years/parenting-early-learning/childcare4Fordetailssee:https://www.scottishfamilies.gov.uk/NationalCategoryDetail.aspx?ncid=7
Page 274
H2020-YOUNG-SOCIETY-2015 YOUNG_ADULLLT Deliverable 4.1
16
Edinburgh,afifthattendingschoolsinGlasgowand10%attendingschoolsinAberdeen.In
Edinburgh,1in4secondaryschoolstudentsattendindependentschools.Thisisthehighest
concentrationofindependentschoolsinScotland.IndependentschoolsinScotlandreceiveno
publicsubsidy.However,schoolsthatmeettherequirementsforacharitablestatusreceivea
taxbreak(ScottishGovernment,2015).
SkillsDevelopmentScotlandcarriesoutafollowupsurveyofschool-leaverstodetermine
theirfirstdestination.ThesestatisticsplayacentralroleintheScottishGovernment’spolicy
onyoungpeople.TheScottishGovernmentmonitorstheshareofschoolleaversthatgoto
whatitreferstoaspositivedestinations.Thisbroadlyreferstobeinginwork,educationor
training5.Thisindicatorhasbeenimprovinginrecentyears.Thesedataarepublishedbythe
ScottishGovernment:http://www.gov.scot/Topics/Statistics/Browse/School-
Education/TrendDestinations
5.1 Post-compulsoryeducationTheScottishQualificationsAuthority(SQA)awardsqualificationsinScotland,typicallyto
studentsinsecondaryschoolsandFurtherEducationColleges(FECs),butalsoforworkbased
trainingandotherroutes6.After4yearsofsecondaryschooling(S4),studentscanleave
compulsoryeducationat16orcontinuesecondaryschoolingfora5thand6thyear(S5and
S6).Althoughstudentscanleavewithqualificationsafteryear4most(78.3%)stayonforS5
andthemajority(59.25%)ofS4pupilsstayonforS6(ScottishGovernment,2015,p.8).
TheScottishGovernmentfundsteachingandresearchatFECsandHEIsviatheScottish
FundingCouncil(SFC),whichisanarms-lengthorganisation(formallyaNon-Departmental
PublicBody).TheSFCpublishesanoutcomeagreementforeachHEandFEinstitution,which
setsouthowthefundingwillbeusedtoachievepolicyaimsrelatingtoresearch,lifeoutcomes
andtheeconomy.ForinstancetheSFCusesoutcomeagreementstopromotetheparticipation
ofunder-representedsocioeconomicgroupsbyringfencingapartofstudentplacesforthese
groups7.ScottishUniversitiesreceiveateachinggrantfromtheSFC,butadditionallyreceive
tuitionfees.ScottishdomiciledstudentsstudyinginScotlanddonotpaytuitionfeesasthese
arecoveredbytheStudentAwardsAgencyScotland(SAAS).Thisentitlementisalsoavailable
5 For details of the Scottish Government definition see here: http://www.gov.scot/topics/archive/About-Archive/scotlandperforms/NotesSP/TechnicalNotesSPNI106ForuptodatedetailsofqualificationsseetheSQA'swebsite:http://www.sqa.org.uk/sqa/70972.html7 For a detailed overview of current outcome agreements, see the website of the Scottish Funding Council:http://www.sfc.ac.uk/funding/OutcomeAgreements/OutcomeAgreementsOverview.aspx
Page 275
H2020-YOUNG-SOCIETY-2015 YOUNG_ADULLLT Deliverable 4.1
17
tostudentsfromtheEuropeanunionoutsidetheUK,whilestudentsfromotherpartsofthe
UKpayfees(fordetailsseeSAAS,n.d.).
TheFEsectorismostlyfundedbytheSFCandreceivesfundinglargelyforteaching.A
significantshareofthosestudyingforHEqualificationsinScotland,dosowithintheFE
sector.TheHEsectorreceivesfundingfromtheSFCbothforteaching,researchandother
activities.FurthermoretheHEsectorreceivessignificantincomefromoutwiththeScottish
Government.SuchastuitionfeesfromexternalstudentsandScottishpost-graduatesand
researchfundingfromUKGovernment,EUandindustrysources.Hermannssonetal(2014)
estimatethatonaverageScottishGovernmentfundingamountsto55%ofthesector's
income.
5.2 WorkbasedlearningApprenticeshipschemesinScotlandaremanagedbySkillsDevelopmentScotland(SDS),a
subsidiaryoftheScottishGovernment.ThemainschemeforworkbasedlearningisModern
Apprenticeship(MA),whichemergedinthe1990s.Thisisavailabletoeveryone16yearsor
older.AnMAcombinesemploymentwithtraining,eitherdirectlyprovidedbytheemployer,
affiliatedfurthereducationcollegesorprivatetrainingproviders.AccordingtoSDS8thereare
37,500individualsworkingasmodernapprenticesinScotland,asofAugust1st,2017.The
numberofthesehasbeengrowinginrecentyears,buttoputthisintoperspective,thereare
approximately140,000ScottishdomiciledstudentsregisteredatuniversitiesinScotland
(basedonHESA2014).
Morerecently,twoadditionalapprenticeshipschemeswereintroducedFoundation
Apprenticeships(FA)andGraduateLevelApprenticeships(GLA).FAsareatwoyearlong
work-basedlearningopportunityforsenior-phasesecondaryschoolpupils.Youngpeople
spendtimeoutofschoolatcollegeorwithalocalemployer,andcompletetheFoundation
Apprenticeshipalongsidetheirschoolqualifications.AnexplicitaimoftheFApolicywasto
addressyouthunemploymentbygivingyoungpeopleanopportunitytogainwork
experience.GLAarearoutetowardscompletingadvancedprofessionalqualificationswhilst
inwork.Theseareopentoemployeesofparticipatingemployersincollaborationwith
universitiesandfurthereducationcolleges.
8 SDS publishes statistics on apprenticeships in Scotland on its website:http://www.skillsdevelopmentscotland.co.uk/publications-statistics/statistics/modern-apprenticeships/?page=1&statisticCategoryId=4&order=date-desc
Page 276
H2020-YOUNG-SOCIETY-2015 YOUNG_ADULLLT Deliverable 4.1
18
Apprenticeshipsareclassifiedthematicallyalongsectorallines9andareassignedaparticular
leveltocorrespondwiththeScottishQualificationsFramework(SQF)10.Apprenticeshipsin
Scotlandrangefromlevel5tolevel11ontheSQF.ThiscorrespondstoISCEDlevels3to7,i.e.
fromuppersecondarytomasterslevel11.
ApprenticeshipsarefundedbyaUK-wideemployerlevy.Employerspaytheirapprentices
salariesandhavetoabidebyminimumwagerulesbutreceiveinturnacontributiontowards
trainingcosts.Insomecases,employersreceivedadditionaltaxincentivesfortakingon
apprentices.SDSsurveysemployerstodeterminetheneedsforparticularskills,whichin
turndeterminesprioritiesforapprenticeships.Oncethesehavebeendeterminedsubsidy
towardstheapprenticeshipsisallocatedonbasisofcompetitivetendering,inlinewithpublic
procurementprinciples.ForfurtherdetailsofthisprocessseeAuditScotland(2014)All
apprenticeshiptrainingproviders,whethereducationinstitutionsorprivatefirmsaresubject
toinspectionbyEducationScotland,whichcarriesoutinspectionsofschoolsandcollegesin
Scotland.
Theneedforthissubsidyarisestooff-setamarketfailure.Asacomponentoftheapprentices
skillsaretransferable,ratherthanfirmspecific,thereisadisincentiveforindividual
employerstoinvestintrainingduetoafreeriderproblem,whicharisesascompetingfirms
couldpoachtrainedemployeeswithoutbearingtheburdenofthetrainingcost,thereby
potentiallygainingacompetitiveadvantageattheexpenseoffirmsmorededicatedto
training.Ifnotcounteredbyinterventionthiswouldleadtoasub-optimaloutcomewith
underinvestmentinskills(foramoredetaileddiscussionofthispointseeOECD(2016).
6 Labourmarket
Throughaseriesofreformssincethe1980´sthelabourmarketintheUnitedKingdomhas
becomeoneoftheleastregulatedintheEuropeanUnion.Whilst,inlinewithpredictionsof
neoclassicaleconomicsthisflexibilityhasmeanthatrecenteconomicshockshaveledtoonly
moderateriseinunemployment,butafallinrealwages(Blundelletal,2016).Furthermore,
9Foranoverviewsee:http://www.skillsdevelopmentscotland.co.uk/media/41680/sds-framework-grouping-1.pdf10Detailsofthisassignmentcanbeaccessedhere:http://www.skillsdevelopmentscotland.co.uk/media/38809/MA%20Level%20Description.pdf11 For details of how the SQP maps against UNESCO’s ISCED framework see:https://beta.gov.scot/publications/scottish-qualifications-unesco-isced-levels/
Page 277
H2020-YOUNG-SOCIETY-2015 YOUNG_ADULLLT Deliverable 4.1
19
theconsequencesoftheeconomicdownturnhavetakenmoresubtleforms,forinstancearise
inunderemploymentandprecariousemployment(Furlongetal,2017).
Figure8.Youthemploymentrates,population15-24years
Source:EUROSTAT
AscanbeseeninFigure8youthemploymentratesintheUKarefarhigherthanfortheEU27.
Whilstthisfellduringtheeconomicdownturnithasbeenrecoveringsince2013.Scotlandasa
wholeandSouthWesternScotlandcloselytracktheUKaverageintermsofyouth
employmentrates.However,youthemploymentratesintheNorthEastofScotlandarefar
higherandremainedhighduringtheeconomicdownturn.
6.1 QualificationsoftheworkingagepopulationEurostatcompilesdataonthelevelsofformalqualificationsachievedbythepopulationsof
EuropeanUnion(EU)memberstates,affiliatedcountriesintheEuropeanEconomicArea
(EEA),SwitzerlandandcandidatestatesforaccessiontotheEuropeanUnion.InError!Nota
validbookmarkself-reference.,theshareoftheapproximateworkingagepopulationinScotland
iscomparedtothestatesreturningdatatoEurostat.OnthatbasisScotlandhasthehighest
shareofgraduateworkerswithinEurope.However,ofcourse,comparingScotlandtostate-
wideaveragescanbemisleadingasmanyofthesearelargeandinternallyheterogeneous.
Page 278
H2020-YOUNG-SOCIETY-2015 YOUNG_ADULLLT Deliverable 4.1
20
Figure9Shareofpopulationaged25-64withtertiaryqualificationsbyEurostatcountryin2014(%).
Source:Eurostat.
Page 279
H2020-YOUNG-SOCIETY-2015 YOUNG_ADULLLT Deliverable 4.1
21
Figure10Shareofpopulationaged25-64withtertiaryqualificationsinEurostataffiliatedcountriesin2014.40highestrankedNUTS-2regions.(%).
Source:Eurostat.
Aslightlydifferentperspectiveispresentedin
Page 280
H2020-YOUNG-SOCIETY-2015 YOUNG_ADULLLT Deliverable 4.1
22
Figure10,whichshowstheshareofgraduatesoftheworkingagepopulationforNUTS-2
regions.Tosavespaceonlythe40regionswiththehighestshareoftertiaryeducatedworking
agepopulationareshown(dataisavailablefor314regions).Scotland'sfourNUTS-2regions
areallonthis"Top40"listandindeedtheUKiswidelyrepresentedalongwithmanyof
Europe'scapitalregions.
Page 281
H2020-YOUNG-SOCIETY-2015 YOUNG_ADULLLT Deliverable 4.1
23
Figure11Highestqualificationsachievedforpopulationaged25-64.EurostataffiliatedstatesandScotlandin2014(%).
Source:Eurostat
ThesedataillustratethatScotlandiswellendowedintermsofhighly-qualifiedworkers.
However,analternativeviewistoexaminetheshareofworkerswithlowqualifications.
Page 282
H2020-YOUNG-SOCIETY-2015 YOUNG_ADULLLT Deliverable 4.1
24
Figure11showsthehighestqualificationsachievedbytheworkingagepopulationof
EurostataffiliatedstatesincomparisontoScotland.Scotlandisclosetothemedianwithjust
under20%ofthepopulationreportingthehighestqualificationobtainedtobelower
secondaryorless.WithinScotlandthereissubstantialregionalvariationinthisregard.The
populationofNorthEasternScotlandhasthelowestshareofworkerswithlowersecondary
qualificationsorlessat13.7%.Whilethesesharesstandat16.8%,20.5%and22.3%in
EasternScotland,theHighlands&IslandsandSouthWesternScotland,respectively.
7 Redistributionandsocialinclusion
Throughouttheperiodexaminedinthisprojectsocialprotectionspendingwasareserved
matterintheUK,conductedbythecentralgovernmentinLondon.Regionspecificdataisnot
availableforScotlandasawholeorScottishregions,butUK-widedatacanprovideanoverall
comparisonwithotherEUcountries.UKnetexpenditureinsocialprotectionfellfromapeak
of99%oftheEU19averagein2006to89%in2015.
Figure12.ExpenditureinsocialprotectioninPPSperinhabitantas%ofEU19
Source:ESSPROS,EUROSTAT
ThisshowsthatwhilstsocialprotectionexpendituresintheUK,whereinlinewithotherEU
countries,ithasbeengraduallyshrinking.Whilsttheliberal-conservativecoalition
60%
70%
80%
90%
100%
110%
120%
130%
2003 2004 2005 2006 2007 2008 2009 2010 2011 2012 2013 2014Germany Spain Italy Finland UnitedKingdom
Page 283
H2020-YOUNG-SOCIETY-2015 YOUNG_ADULLLT Deliverable 4.1
25
governmentthatcametopowerin2010madeapointofwelfarereformsandimplementeda
fiscalausterityprogramme,thetrendseemstohavesetinearlier.
Page 284
H2020-YOUNG-SOCIETY-2015 YOUNG_ADULLLT Deliverable 4.1
26
Figure13Disposablehouseholdincome(€,PPPadjusted)
Thedisposableincomeforhouseholdsistheamountofmoneythatahouseholdearnseach
yearaftertaxesandtransfers,representingthemoneyavailabletoahouseholdforspending
ongoodsorservices.TheUKonaverageisonparwithItalyandFinlandintermsof
disposableincomeandcomesinatabout80%ofdisposableincomeinGermanyandAustria
andabout120%ofdisposableincomeinSpain.Disposableincomehasfallenfromapeakof
€18,000in2007toatroughof€16,700in2011.Thesetrendsarereplicatedcloselyata
regionallevelforScotlandasawholeandtheSouthWestofScotland,albeitataloweroflevel
of,€16,100and€15,100,respectively,in2011.TheNorthEastofScotlandisoutofsyncwith
therestofScotlandandtheUK,beingdominatedbytheoilandgaseconomy.There,
disposableincomereachedapeakof€20,100in2008andbottomedoutat€18,900in2010.
ComparingScotlandtoUKaveragemaskssignificantregionalvariationinlivingstandards
withintheUK.TheUKaverageisskewedupwardsbythevastlyhigherdisposableincomeof
greaterLondonandwithScotlandbeingthemostaffluentregionoutsidegreaterLondonthis
truncatesthelowerrangeofobservation.Indeed,theOfficeforNationalStatistics(ONS)
recentlyminedEurostatdatatoproducearegionalcomparisonofGDHIacrosstheEU.This
revealsthattherangeofaverageGDHIacrossregionsintheUKisthewidestfoundwithinthe
EU.ThisanalysisissummarisedinFigure14.
Page 285
H2020-YOUNG-SOCIETY-2015 YOUNG_ADULLLT Deliverable 4.1
27
Figure14Disposableincomeofprivatehouseholdsperinhabitant,highestandlowestNUTS2regionwithineachcountry.
8 Healthandwell-beingconditions
Healthandwell-beingconditionsareverydifficultdimensionstoassess.Manydatagaps
emergedandthereisneitherenoughinformationatregionallevelnorfortargetedagegroup.
Wewillrefertogeneralconditionofhealthandwell-beinginthissection.TheUKpopulation
hasexperiencedanimprovementinlifeexpectancytogetherwithanincreaseinhealthylife
years.Generallythough,ScotlandhaslaggedtheUKintermsofhealthoutcomesandtherefore
UKaveragesmaynotberepresentative.Inparticular,GreaterGlasgowhassufferedbadhealth
outcomes,whichresearchershavebeenunabletoexplainbasedonavailablecontrolssuchas
incomeorsocialclass.ThisresiduallaginhealthoutcomeshasbeentermedtheGlasgow
effect.
Lookingclosertotheyoungadultpopulation,someinformationaboutlifesatisfactionis
availableforEuropeanmembersstatesintheEU-SILC2013.In2013aspecialad-hocmodule
ofEU-SILCassessedsatisfactionindifferentdomainsoflife.WereportintheFigure15the
percentageofyoungadultsagedbetween18and30whoreportbeinghighlysatisfiedinthe
10domainsassessed.GenerallyUKyoungadultsexperiencedsimilarandsometimeshigher
satisfactioninall10differentdomainscomparedtoEU28.Britonstendtobemoresatisfied
withaccommodation,livingenvironmentandrelationships,butlesssatisfiedwiththe
Page 286
H2020-YOUNG-SOCIETY-2015 YOUNG_ADULLLT Deliverable 4.1
28
financialsituation,jobsandgreenspaces.However,onbalance,overalllifesatisfactionwas
slightlylowerthanintheEU28.
Figure15.Highsatisfactioninvariouslifedomains,populationaged18-30,EU28and
UK,2013
Source:EU-SILC,EUROSTAT
Thereareveryfewproxiesavailableatregionallevelregardingaccesstohealthservices.
Someofthemarecloselyrelatedtohealthsystemsuchashospitalstaffanddoctorsavailable
inthearea.Ofcoursetheseproxiesrepresentameasureofthecoverageofhealthaccess.
9 Finalremarks
ThisreporthasusedharmoniseddatafromEUROSTATandotherpubliclyavailablesourcesto
analyselivingconditionsinabroadsensefortwofunctionalregionsofScotland:
AberdeenshireandAberdeenCityandGlasgowCityRegion.Theharmonisedindicatorsare
usefulastheyallowastraightforwardcomparisonwithotherEuropeanregions.Naturally,
suchindicatorsshouldnotbeinterpretedinisolation.Whereverpossible,thesehavebeen
relatedtothestructureofScottishinstitutionsandpolicies–inparticularfortherealmof
education.Insomecasesthesehavebeensupplementedwithadditionaldatathatarenot
0.010.020.030.040.050.060.0
SaLsfacLonwithfinancialsituaLon
SaLsfacLonwithaccommodaLon
JobsaLsfacLon
SaLsfacLonwithcommuLngLme
SaLsfacLonwithLmeuse
OveralllifesaLsfacLon
SaLsfacLonwithrecreaLonalandgreen
areas
SaLsfacLonwithlivingenvironment
SaLsfacLonwithpersonalrelaLonships
Meaningoflife
EuropeanUnion(28countries) UnitedKingdom
Page 287
H2020-YOUNG-SOCIETY-2015 YOUNG_ADULLLT Deliverable 4.1
29
availableacrosstheEU.Thissupplementationwithlocaldatahasbeenuseful.However,itis
perhapsnotthedataassuchthatrepresentsthebottleneckformeaningfuldiscussionor
comparison,butratherlocalcapacitytoengagewithdatasourcetointerpretandcritique.
Thisreporthasbenefittedgreatlyfromtheavailabilityofpriorworkmwhichhassoughtto
engagewithandapplythedatatounderstandtheScottishcontext.Coverageofthisis
undoubtedlylimitedbytheauthors'oversightandfocussesmostlyoneducationandthe
economy.Infutureworkitwouldbeusefultosupplementtheanalysisofharmonisedregional
indicatorswithsystematicreviewsofavailableacademicandpolicyliteratures,relatingtothe
topicbeingexamined.
Page 288
H2020-YOUNG-SOCIETY-2015 YOUNG_ADULLLT Deliverable 4.1
30
10 ReferencesAuditScotland(2014).Modernapprenticeships.RetrievedfromtheWorldWideWeb:http://www.audit-scotland.gov.uk/report/modern-apprenticeships
Blundell,R.,Green,D.,&Jin,W.(2016).TheUKwagepremiumpuzzle:howdidalargeincreaseinuniversitygraduatesleavetheeducationpremiumunchanged?InstituteforFiscalStudies.WorkingPaperW16/01.
Eiser,D.(2017).AprimerontheScottishParliament’snewfiscalpowers:whatarethey,howwilltheywork,andwhatarethechallenges?FraserofAllanderEconomicCommentary,Vol.41,No.2,pp.1-17.RetrievedfromtheWorldWideWeb:https://www.strath.ac.uk/media/1newwebsite/departmentsubject/strathclydebusinessschool/fraserofallander/A_primer_on_the_Scottish_Parliament%E2%80%99s_new_fiscal_powers.pdf
EUROSTAT(2017).EuropeanUnionstatisticaloffice,http://ec.europa.eu/eurostat/
EUROSTAT(n.d.a)TheEuropeanUnionLabourForceSurvey(EU-LFS),
EUROSTAT(n.d.b)TheEuropeanUnionStatisticsonIncomeandLivingConditions(EU-SILC),EUROSTAT
Furlong,A.,Goodwin,J.,O'Connor,H.,Hadfield,S.,Hall,S.,Lowden,K.andPlugor,R.(2017)YoungPeopleintheLabourMarket:Past,Present,Future.Routledge:London.ISBN9781138798069(InPress)
Hermannsson,K.(2016).Beyondintermediates:Theroleofconsumptionandcommutingintheconstructionoflocalinput–outputtables.SpatialEconomicAnalysis,11(3),315-339.
Hermannsson,K.,Lisenkova,K.,McGregor,P.G.,&Swales,J.K.(2014).‘Policyscepticism’andtheimpactofScottishhighereducationinstitutions(HEIs)ontheirhostregion:accountingforregionalbudgetconstraintsunderdevolution.RegionalStudies,48(2),400-417.
Lisenkova,K.,McGregor,P.G.,Pappas,N.,Swales,J.K.,Turner,K.,&Wright,R.E.(2010).Scotlandthegrey:alinkeddemographic–computablegeneralequilibrium(CGE)analysisoftheimpactofpopulationageinganddecline.RegionalStudies,44(10),1351-1368.
OrganisationforEconomicCo-operationandDevelopment–OECD(2015).ImprovingSchoolsinScotland:AnOECDPerspective.Paris:OECD.RetrievedfromtheWorldWideWeb:http://www.oecd.org/edu/school/improving-schools-in-scotland.htm
OrganisationforEconomicCo-operationandDevelopment–OECD(2016).OECDEvaluationFrameworkforModernApprenticeshipsinScotland.OECDscience,technologyandinnovationpolicypapers,no.35.RetrievedfromtheWorldWideWeb:http://www.oecd-ilibrary.org/science-and-technology/oecd-evaluation-framework-for-modern-apprenticeships-in-scotland_59084781-en
OrganisationforEconomicCo-operationandDevelopment–OECD(2017),https://data.oecd.org/
OrganisationforEconomicCo-operationandDevelopment–OECD(n.d.a),PIAAC,http://www.oecd.org/skills/piaac/
Page 289
H2020-YOUNG-SOCIETY-2015 YOUNG_ADULLLT Deliverable 4.1
31
OrganisationforEconomicCo-operationandDevelopment–OECD(n.d.b),PISA,http://www.oecd.org/pisa/
OfficeforNationalStatistics–ONS(2016).GrossDisposableHouseholdIncomebyEuropeanRegions.RetrievedfromtheWorldWideWeb:https://www.ons.gov.uk/economy/regionalaccounts/grossdisposablehouseholdincome/bulletins/regionalgrossdisposablehouseholdincomegdhi/2015
SAAS–StudentAwardsAgencyScotland(n.d.).Exceptionsfromthegeneralresidenceconditions.RetrievedfromtheWorldWideWeb:http://www.saas.gov.uk/_forms/residence.pdf
ScottishGovernment(2015).OECD-ScotlandEducationPolicyReview:ABackgroundReportbytheScottishGovernment.RetrievedfromtheWorldWideWeb:http://www.oecd.org/education/school/OECD-Scotland-Education-Policy-Review-Background-report.pdf
UnitedNationsEducational,Scientific,andCulturalOrganization–UNESCO,http://data.uis.unesco.org/
Page 290
H2020-YOUNG-SOCIETY-2015 YOUNG_ADULLLT Deliverable 4.1
Work Package 4
Quantitative Analysis Young Adults’ Data
Spain – National Briefing Paper with national and regional
data sets Name: Rosario Scandurra, Universidad de Granada Xavier Rambla, Universitat Autònoma de Barcelona Date 05/09/2017 Work Package 4 – Quantitative Analysis of Young Adults’ Data Deliverable 4.1
Page 291
H2020-YOUNG-SOCIETY-2015 YOUNG_ADULLLT Deliverable 4.1
2
TableofContents
ExecutiveSummary............................................................................................................................................................3
Descriptionofthedatacollatedandqualitydataassessment........................................................................3
1.Findings..............................................................................................................................................................................5
1.1. Demographicstructure....................................................................................................................................5
1.2. Thestructureoftheeconomy.......................................................................................................................8
1.3. Education.............................................................................................................................................................11
1.4. Labourmarket...................................................................................................................................................19
1.5. Redistributionandsocialinclusion.........................................................................................................21
1.6. Healthandwell-beingconditions.............................................................................................................26
2.Finalremarks................................................................................................................................................................28
References...........................................................................................................................................................................30
Listoffigures
Figure1.GDPatcurrentmarketprices,Europerinhabitantin%ofEuropeanaverage(EU28=100)............9
Figure2.LabourproductivityEU28=1andrealgrowthvalueadded...........................................................................10
Figure3.Shareofthepopulationaged20-29years................................................................................................................6
Figure4.Cruderateofnetmigrationplusstatisticaladjustment.....................................................................................7
Figure5.Agedependencyratio.On1stvariant(populationaged0-14and65andmoretopop.aged15-
64).................................................................................................................................................................................................................8
Figure6.PopulationattainmentbyISCEDlevels,25-64yearsoverthecorrespondentagegroup.................12
Figure7.Youngadult’seducationattainmentbyISCEDlevels,30-34yearsoverthecorrespondentage
group..........................................................................................................................................................................................................13
Figure8.Tertiaryeducationaccessofthepopulationaged20-24yearsoverthecorrespondentagegroup
.......................................................................................................................................................................................................................14
Figure9.EarlySchoolLeavers18-24years,ESL(leftaxis)andpopulationNeitherinEmploymentNorin
Education15-24years,NEET(rightaxis)..................................................................................................................................15
Figure10.PISAandPIAACcompetences,Europeanaverage=1......................................................................................17
Figure11.Participationrateineducationandtraining(last4weeks)........................................................................18
Figure12.Employment(leftaxis)andunemploymentrate(rightaxis),population20-64years...................20
Figure13.ExpenditureinsocialprotectioninPPSperinhabitantas%ofEU19....................................................21
Figure14.GINIindexbeforeandaftertaxes(leftaxis)anddisposableincome(rightaxis)...............................22
Figure15Riskofpoverty,rentimputedonthebaseofincomeoftheyearbefore.................................................24
Figure16.Populationatriskofpovertyorsocialexclusion,%(POV)andseverematerialdeprivation
population,%(SMD)...........................................................................................................................................................................25
Figure17.Highsatisfactioninvariouslifedomains,populationaged25-34,EU28andSpain,2013............27
Page 292
H2020-YOUNG-SOCIETY-2015 YOUNG_ADULLLT Deliverable 4.1
3
ExecutiveSummary
Thisnationalbriefingpaperprovidesashortoverviewofthelivingconditionsofyoung
adults in Spain and in the two functional regions selected for the YOUNG_ADULLLT
project, theautonomousregionsofAndalusiaandCatalonia.Thedatawerecollatedat
national and local level (NUTs2) according to six dimensions of contextual living
conditions: the structure of the economy, the demographic characteristics of the
population, the inputs and outputs of the education and training system, the labour
market, thematerial living conditions and theparticipation as citizens to thepolitical
and civic life and, finally, the health conditions and individual well-being. Data were
extracted fromEurostatand fromdifferent surveyssuchas theEU-LFS,EU-SILC,PISA
andPIAAC.Themaincorpusofdataproceedingfrominternationalandharmonizeddata
wassuccessivelycomplementedbydatacollatedatthelocallevel,madeavailablebythe
Instituto de Estadística y Cartografía de Andalucía and by the IDESCAT, as well as by
official websites of various Spanish Institutions (Ministers, regional government and
Chambersof trade).Thedatarangesbetween2005and2015,but forsome indicators
thedatawerenotavailablefor2015andforthisreasonwereferto2014asthelastdata
available.
Descriptionofthedatacollatedandqualitydataassessment
EurostatUNESCOandOECDprovideavastamountofharmonizedandcomparabledata
thatcanbeausefulresourceforassessingthelifeconditionsofyoungpeopleindifferent
domains and in various countries/regions. However, the availability of data at the
regional/locallevelislimited.Mostofthedataareprovidedatanationallevelandonly
twoofthesixdimensions(economyanddemography)haveafairamountofindicators
at NUTS21 and NUTS3 level. This restrains the possibility of comparison. Within the
surveysavailablethemostrelevantsourceofinformationistheEU-LFSwhichhaslarge
sample size at local level. Moreover, complementing the international datawith local
dataisahardtaskmainlyforfourreasons.
1NUTSstandsforNomenclatureUniteTerritorialStatistique.
Page 293
H2020-YOUNG-SOCIETY-2015 YOUNG_ADULLLT Deliverable 4.1
4
First, thefragmentationofsources isrelevantbothatSpanish,AndalusianandCatalan
levels. Neither the regional bureau of statistics nor the National Statistics Institute of
Spain (INE2) bring together all the information available at public andofficial sites or
provideacompletelistofsourcesandstudies.Thus,collectingdataimpliesinvestinga
lot of time, even if these data are quite simple and publicly available. Second, the
multiplicityofavailablesourcesmightentailmethodologicaldifficultiesthathamperthe
comparability of the provided data between regions and at European level between
2005and2015.Third,thereisalackofdataatprovincial3andlocallevelintheavailable
sources. Finally, some private institutions in agreement with some public ones (the
ChamberofCommerceofCataloniaand theDepartmentofEducationofCataloniaand
the Catalan Employment Service) are collecting very rich information on skills and
competences of the vocational and training education4. However, these data are not
providedpubliclyand thechannels toaccessing themarenotclearlyestablished.This
hampers the transparency of the administration that is collecting a huge amount of
information,butit isnotusingitneithertobetterinformthecitizenshipnor,asstated
bytheChamberofCommerce,toimprovetheirownpoliticalaction.Moreover,thefact
that this isaprivate institution,whichdevelopsandadministers thesedatasets,poses
ethicalproblemsaswellasbureaucraticdifficultiestoaccessit.
Fromamoregeneralperspective,consideringthehighratesofearlyschoolleaversand
NEETinSpain,itisremarkablethatwedidnotfindalmostanyspecificsourcesneither
atregionalnor local level5aboutthisgroupofpopulationwhich issociallyvulnerable.
ReducingearlyschoolleaversisapriorityforbothAndalusianandCatalangovernment,
nevertheless there is no specific instrument to understand the specificities of these
youngadultsandinformpolicies.
2IstitutoNacionaldeEstadística(INE)www.ine.es3 In Spain there are 50 provinces excluding Ceuta and Melilla. They correspond to NUTS3 in the
EUROSTATclassification.4ForthecaseofCatalonia,twodatasourcesarerelevant:theComprehensiveDataBank(BancIntegraldeDades-BID).ThefirstwascreatedbyanagreementbetweentheChamberofCommerceofCataloniaandtheDepartmentofEducationofCatalonia.Nowadaysitsaimistoprovideinformationnotonlyaboutthe
available companies but also, and more importantly, to track the apprenticeship period gathering the
assessmentsdevelopedbyboththehighschools,thecompaniesandthestudentsthemselvesinrelationto
each training process. In the last years, information about those courses provided by the Employment
Service of Catalonia has also been included. The Graduate Insertion Survey (Estudi sobre Inserció deGraduats) collects information about the degree, quality and the suitability of the placement of thestudentsfromtheVETprovidedbytheHighSchoolsoncetheyhavefinishedtheirstudies.5 Here with regional and local level, we refer respectively to Andalusia and Catalonia andMalaga and
GironaasfunctionalregionoftheYOUNG_ADULLLTproject.
Page 294
H2020-YOUNG-SOCIETY-2015 YOUNG_ADULLLT Deliverable 4.1
5
Understanding young adult social risk represents a very broad objective. For this
endeavour, the data needed were collected in various studies, in different way and
sometimes for very specific purposes. For this reason, the most accessible data are
EUROSTATsincetheyalreadyprovideharmonizeddata,metadataandcompletedtime
series.However,accessibilityofdataisnotastraightforwardissue,asdatabasesarenot
completely combined and flexible and the collection is at times difficult and time
consuming.Thecomplexityandvarietyofthedatapublishedmakesuchcomprehensive
integrationdifficulttoachieve.
1. Findings
1.1. DemographicstructureSpaincoversatotalareaof505.970squarekilometres.Itisthesecondlargestcountryin
theEU28anditrepresents11%of its totalarea.Spain isdivided into17Autonomous
regions; the biggest one isAndalusiawith an area of 87.597 square kilometres,while
Cataloniacovers32.091km².SpainisthefifthmostpopulatedcountryintheEuropean
Union.Thepopulation increasedgradually reaching46.8million in2012, thenstarted
decreasing(in2015,thepopulationwas0.7%lessthan2012).AndalusiaandCatalonia
are the most populated autonomous regions with respectively 8.3 and 7.4 million
inhabitants. The population density is below 93 individuals per square kilometre in
Spainandithasslightlyincreasedoverthepastdecade.Itisveryunevenlydistributed
both between andwithin regions: Andalusia has 97 individuals per square kilometre,
whileCataloniahas232,morethandoubleoftheSpainaverage.
Youth population aged 20-29 in 2015 accounted for approximately 10.4% of total
inhabitants,makingup11.5%ofthepopulationintheregionofAndalusiaand10.1%in
Catalonia.Thedecreaseoftheshareofyouthpopulationoverthelastdecadeisconstant
andremarkable.
Page 295
H2020-YOUNG-SOCIETY-2015 YOUNG_ADULLLT Deliverable 4.1
6
Figure1.Shareofthepopulationaged20-29years
Source:EUROSTAT
GenerallivingconditionsinSpainarecomparativelygoodinrelationtootherEuropean
countries.Infantmortalityinthefirstyearafterbirthis2.7whileintheEU28itwas3.6
in 2016 with a constant decrease over the last decade (in 2005 it was 3.7). Life
expectancyinSpainis83.3yearshighercomparedtoEuropeanaverage,buttheoverall
valueistheresultofrelevantgenderdifferences:aSpanishfemalein2014couldexpect
tolive86.2years,whileamalehadalifeexpectancyof80.4years.Territorialdifferences
areremarkable;inAndalusiaitis1.2yearslowerthanSpainaverage,whileinCatalonia
itisabout0.3yearshigher.Infantmortalityinthefirstyearafterbirthislow;ittouched
aminimumof2.7deathsper thousand in2015,being theEU28average3.6.Thishas
decreased from2005of1year.Someterritorialdifferencesemerge.Cataloniahas2.4,
whileAndalusia2.9,andthisdifferencewaslargeroverthelastdecade.
SpainsharesaconditionoflowfertilitywithotheradvancedEUcountries,asthefertility
ratewas 1.32 in 2015. Catalonia and Andalusia had higher fertility rate compared to
Spain (1.39).During thepast decades, fertility has remained constantly lowwhile the
ageatwhichawomanhasherfirstchildincreasedfrom29.4to30.7between2005and
2015(EU28averagein2015was28.9).
Spain is a country of recent immigration, above all from Spanish-speaking countries.
During the middle nineties migration started to grow and reached one of its peaks
10
11
12
13
14
15
16
17
2005 2006 2007 2008 2009 2010 2011 2012 2013 2014 2015 2016
Spain Catalonia Andalusia
Page 296
H2020-YOUNG-SOCIETY-2015 YOUNG_ADULLLT Deliverable 4.1
7
before theeconomiccrisis.From2007migrationhasbeen increasinglydiminishingas
the economic crisis reduced the attractiveness of the country. The crude rate of net
migrationwentfromitspeakof17.2in2007to0in2016,meaningparityofmigration
flows,afteralreadyhavingreachednegativesignsyearsbefore.
Currently,policiestargetingyoungadultsarecrucialfortheeffectivesocialinclusionof
theforeign-bornpopulationinthecountry.Significantly,whileforeign-bornindividuals
amountedto10%ofthewholepopulation,in2017thisproportionscored13%among
20-to-24year-oldsand16%among25-to-29year-olds(INE,2017)6.Failingtocaterto
theneedsofthesegenerationsthreatenstoaggravateethniccleavagesinthelongterm.
Figure2.Cruderateofnetmigrationplusstatisticaladjustment
Source:EUROSTAT
The combined effect of living longer and fewer children is transforming the
demographicstructureacross theEuropeancountries.Thedemographicpyramidsare
changinganddependencyratiosareoftenusedtocomparethesizeofsuchgroupsand
6Source:InstitutoNacionaldeEstadística-INE(2017)CifrasdePoblación(CP):Poblaciónresidenteporfecha,sexo,grupodeedadynacionalidad.Retrievedfromhttp://datos.gob.es/es/catalogo/e00121204-cifras-de-poblacion-cp-poblacion-residente-por-fecha-
sexo-grupo-de-edad-y-nacionalidadon28July2017
-15.0
-10.0
-5.0
0.0
5.0
10.0
15.0
20.0
25.0
2005 2006 2007 2008 2009 2010 2011 2012 2013 2014 2015
Spain Catalonia Andalucia
Page 297
H2020-YOUNG-SOCIETY-2015 YOUNG_ADULLLT Deliverable 4.1
8
theygenerallyrelatecentralagegroupswithdependent(youngandold).Infigure5,age
dependency ratios are plotted together with other European countries. The level is
lowerforSpainalthoughafastincreaseintheshareofdependentamongthepopulation
is registeredsince2009onwards (the firstvariantof theagedependency ratio raised
from 45 until 51.2 in 2016). The increase in the dependent population is similar,
although inAndalusia is lower compared theboth the Spanish average andCatalonia.
Whencomparingtheoldestshareofthepopulationtocentralages,ageneralincreasein
theshareofthepopulation65andoverisrevealed;thetrendissimilarinAndalusiaand
Catalonia.
Figure3.Agedependencyratio.On1stvariant(populationaged0-14and65and
moretopop.aged15-64)
Source:EUROSTAT
Thepercentageof youngadults livingwithparents is69.6%against the55.4%of the
EU27average(formen74.3and64.8forwomen).Overthelastdecadethisindicatorhas
remainedstable,althoughitreacheditslowestpeakin2010,being65.2%.
1.2. ThestructureoftheeconomyDuringthelastdecade,theSpanisheconomyhasexperienceddifficultiesadaptingtothe
impactoftheeconomiccrisis.From2006to2015,GDPincreasedfrom25.500to25.900
europerinhabitant,butithasdiminishedinrelativetermslosing13%comparedtothe
15
20
25
30
2005
2006
2007
2008
2009
2010
2011
2012
2013
2014
2015
2016
Pop.0-14and65+to15-64
Germany SpainCatalonia AndaluciaUnitedKingdom
15
20
25
30
2005
2006
2007
2008
2009
2010
2011
2012
2013
2014
2015
2016
Pop.65+to15-64years
GermanySpainCataloniaAndalucia
Page 298
H2020-YOUNG-SOCIETY-2015 YOUNG_ADULLLT Deliverable 4.1
9
Europeanaverage.Inthesameperiod,theGDPofAndalusiadecreasedbothinabsolute
(2.5%)andrelativeterms(14%comparedtotheEU28),whileitincreasedinCatalonia
(2.6%)butdroppedinrelationtoEU28(-15%).Theimpactoftheeconomiccrisisseems
tohavehittheeconomicoutlook,althoughsomesignsofrecoveryseemtobeemerging
togetherwithgrowingeconomicdisparitieswithinthecountry.
Figure 4. GDP at current market prices, Euro per inhabitant in% of European
average(EU28=100)
Source:EUROSTAT
In Spain, the real growth rateof regional grossvalueadded (GVA) showedanegative
sign in2009 (-3.4%)and it stayednegativeuntil 2013, although it started to recover.
Additionally,labourproductivitymeasuredinGDPperhourworkedstayedbelowEU28
average for almost adecadealthough it reached theparity in2009. It started todrop
againaftertheeconomiccrisis,being97.1%ofEU28in2015.
0
20
40
60
80
100
120
140
2006 2007 2008 2009 2010 2011 2012 2013 2014 2015
Spain Catalonia Andalucía
Page 299
H2020-YOUNG-SOCIETY-2015 YOUNG_ADULLLT Deliverable 4.1
10
Figure5.LabourproductivityEU28=1andrealgrowthvalueadded
Source:EUROSTAT
Servicesareprevalent in thestructureof theSpanisheconomy,representing73.8%of
theshareofGDP,This issimilartotheEU28(73.9%),althoughithasaslightlyhigher
share of the agriculture sector overall. The reduction in the industry sector was
remarkable in the last decade since it used to be higher compared to the European
partners. The economic structure of the country ismainlymade up of small firms: in
2014, enterprises with less than 10 employees are equal to 94.8% of the total,
enterpriseswith10-19employeesareequal to2.9%,whilebigenterpriseswithmore
than 50 employees represent less than 0.7% over the total. The infrastructural and
transportationnetwork,whichplaysarelevantrolefortheeconomy,appearstobequite
developed;railwaylinesandmotorwayscoverrespectively32and30kilometresevery
1.000 square kilometreswith important territorial differences partially coherentwith
thepopulationdensitywithintheautonomousregions.
Thepercentageofresearchersinalloftheeconomicsectorsovertheactivepopulation
is low compared to European partners (0.9% in 2013, 1.3% in Germany and 1.4% in
0
0.2
0.4
0.6
0.8
1
1.2
1.4
2005 2006 2007 2008 2009 2010 2011 2012 2013 2014 2015
SpainLP(EU28=1) AndaluciaGVA CatalunyaGVA SpainGVA
Page 300
H2020-YOUNG-SOCIETY-2015 YOUNG_ADULLLT Deliverable 4.1
11
UK),withsometerritorialdifferences; forexample inCatalonia it is1%andAndalusia
0.7%.
The percentage of the GDP in PPS7 in research and development in the government
sector is1.24%inSpain(in theEU28 itwas2.04%).Over the lastdecade it increased
slightlymore than0.1%of theGDP. Territorial differences emerged: in Catalonia this
shareis1.49%,whileinAndalusiaitis1.05%,withaquitesimilarevolutionacrosstime.
Expenditure inresearchanddevelopment inthegovernmentsector isconcentrated in
Catalonia(653millioninPPS,thenationalaverageis392millionin2013andAndalusia
173).ThepatternoftheindicatorhasaUshapewithapeakin2008andaconstantand
slowdecreaseuntil2013.
Theshareofpeopleemployedinthepublicsectorisroughlystableafter2010andequal
to 7.6% of total employment in 2014, with some territorial differences (5.3% in
Cataloniaand9.5%inAndalusia),whileemploymentineducationstartedtodecreasein
2013, and was equal to 6.6% in 2014. Andalusia again shows higher employment in
education(7.2%,comparedtoCatalonia’s6.4%).Finally,peopleemployedinthehealth
sectorandinsocialworkmakeup8.2%oftotalemployment,whichislowercompared
toEuropeanpartners (UK13.3,Germany12.5%).Some territorialdifferencesemerge;
employmentinhealthsectorswas7.8%inAndalusia,whileitwas8.2%inCataloniain
2014.
1.3. EducationTheSpanisheducationandtrainingsystemiscomprehensiveandpartiallydecentralized
attheregionallevel.Thegovernmentexpenditureineducationwas4.3%ofthenational
GDPin2013andthishasremainedalmoststableoverthepasttwodecades.Full-time
education iscompulsoryuntil theageof16,althoughrecent legislationseeksto lower
this to15.Spanishsecondaryeducation is fouryears long,withstudentsat theendof
the third year being able to choose between either Bachillerato (Baccalaureate
equivalent) or Ciclo de Grado Formativo Medio, the latter being geared towards
vocationaltraining.Indeed,therearetwoprogramsofvocationaltraining,ashorterand
a longer program, lasting three and five years, respectively. All students successfully
7PurchasingPowerStandard(PPS)isaspecialcaseofPurchasingPowerParityPPPadjustmentascarried
outbyEurostat.
Page 301
H2020-YOUNG-SOCIETY-2015 YOUNG_ADULLLT Deliverable 4.1
12
completing secondary education can access university after passing a general entry
examinationorganizedbyeachpublicuniversity.
SpainstilllagsbehinditsEuropeanpartnersintermsofeducationalattainment.Thisis
in part due to a highly unequal distribution of education across the age cohorts. The
population aged 56-65 has one of the lowest average years of schooling of all the
EuropeancountriesaccordingtoPIAAC.In2005morethanhalfofthepopulation(51%)
agedbetween25and65yearsattainedlowersecondaryeducation(ISCED2),whilein
2014 this diminished to 43% representing 18% reduction over the past 10 years.
Nevertheless,therateofreductionislowercomparedtootherEuropeancountries.
Figure6.PopulationattainmentbyISCEDlevels,25-64yearsoverthe
correspondentagegroup
Source:LFS,EUROSTAT
Examining tertiaryeducation,34.7%of thepopulationagedbetween25and64years
haveatleastattainedISCED5withanincreaseof22%from2005.Thestockoftertiary
educated people is lower compared to other European partners and it has strongly
increased. However, there is important variation between regions; 23% in Andalusia
and 30% in Catalonia in 2005. Over the last decade, this has increased to 27.6% in
AndalusiaandinCatalonia37%,increasingthegapbetweenthetworegions.
020406080100
2005
ISCED0-2 ISCED3-4 ISCED5-8
020406080
100
2014
ISCED0-2 ISCED3-4 ISCED5-8
Page 302
H2020-YOUNG-SOCIETY-2015 YOUNG_ADULLLT Deliverable 4.1
13
Figure7.Youngadult’seducationattainmentbyISCEDlevels,30-34yearsoverthe
correspondentagegroup
Source:LFS,EUROSTAT
When we look at young adults, Spain has a very high tertiary education attainment,
higher than European partners; in 2005 almost 2 out of 5 people aged 30-34 have
attained tertiaryeducation,while in2014 theproportion increasedby roughly6%. In
2005, in Andalusia 31% of the population aged between 30 and 34 had tertiary
education and this remained almost stable over the past decade (the increasewas of
0.9%),while forCataloniatheattainmentwas41.2%andit increasedto47%in2014.
Moreover,womenaremorelikelytoachievetertiaryeducationattainment;102women
over100maleattaineditin2005andthisratioincreasedto111in2014.
Examininglowereducationattainmentofthepopulationaged30-34,Spainhasahigher
proportion of population with less than secondary education compared to European
partners. Itwas38.3%in2005andthisdecreasedreaching33.7%in2014.Thereare
highterritorialvariationsinsecondaryeducationattainment.InAndalusiaalmosthalfof
thepopulationagedbetween30and34attainedsecondaryeducationwhileinCatalonia
itwas a third, in linewith the Spanish average.When comparing thiswith European
partners, Spanish secondary educationattainment is almost thedoubleofUKaverage
and three times of that of Germany. Gender differences are very relevant; secondary
educationattainmentamongwomenwas27.9%whileformenitwas10pointshigher;
thisgaphasbeenmaintainedover thepastdecade.Thisdifferencebetweengender is
notpresentedincountrieslikeGermanyorUK.
101520253035404550
ISCED0-2
Andalucia Catalonia Spain
Germany UK
101520253035404550
ISCED5-8
Andalucia Catalonia Spain
Germany UK
Page 303
H2020-YOUNG-SOCIETY-2015 YOUNG_ADULLLT Deliverable 4.1
14
Overall, there ishighpolarizationofeducationattainmentandhighvariationbetween
regions. Andalusia and Catalonia represent two extreme cases in Spain and this is
indirectlyrelatedtothesocio-economicattractivenessofthetwoterritories.Finally,itis
worth noticing that traditionally vocational programmes at upper secondary level are
not effective in bridging the transitions to the labour market and this represents an
importantfactorintheeducationattainmentpolarization.
InSpain,thereisnocompulsorypre-primaryschoolsystem,butmanyparentsdecideto
prepare their children for primary school by enrolling them to the so called “escuela
infantil”, which is relevant in developing cognitive and non-cognitive abilities and
buffering the influence of the familiar background.Althoughpre-primary education is
not compulsory in Spain, the participation rate of 4 years-old in education was
traditionally very high and remained high during the past decade with almost a full
coverage,reachingalmosttheentirepopulationof4yearsoldsforwhomenrolmentis
soughtandthere'snotsignificantvariationbetweenregions.In2012theEU-28average
was93.9%whereastheaverageinSpainwasalmost4%higher(97.4%).
Figure8.Tertiaryeducationaccessofthepopulationaged20-24yearsoverthe
correspondentagegroup
Source:EUROSTAT
40
50
60
70
80
90
100
2005 2006 2007 2008 2009 2010 2011 2012
Andalucia Catalonia Germany Spain UnitedKingdom
Page 304
H2020-YOUNG-SOCIETY-2015 YOUNG_ADULLLT Deliverable 4.1
15
InSpain,theleveloftertiaryeducationaccessishighcomparedtoGermanyortheUK.In
2005, Spain had higher tertiary access compared to Germany; overall 1 over 2
individualsbetween20and24yearswasenrolledinatertiaryeducationprogram.Over
the last decades access to university has increased, following a historical trend that
started4decadesbefore.In20124outof5peopleaccessedtertiaryeducationandthe
territorial differences are very relevant. In Catalonia, 9 out of 10 people attended
university, while, in Andalusia, thiswas approximately the case for 7 out of 10, with
more than 20% difference between the two autonomous regions. This difference is
partially due to the attractiveness of Barcelona both for national and international
students and the substantial presence of academic institutions. Tertiary education
access in Spain is high compared to European partners, possibly as a consequence of
economiccrisisandthereductionofopportunitycostofattendinguniversity.
InSpain,theratioofearlyschoolleavers(ESL)(thepercentageofthepopulationaged
18to24havingattainedatmost lowersecondaryeducationandnotbeinginvolvedin
furthereducationortraining)wasequalto19%in2016,comparedtotheEU28rateof
10.7%. Marked gender differences emerged; the prevalence of early school leavers
amongwomenwas15.1% in2016,while formen itwas22.7%.The trend towards a
decreaseofloweducatedindividualsisalmostidenticalforbothgenders(around60%)
andtherateofreduction increasedafter2009. In the lastdecade,earlyschool leavers
diminished frombeing3outof10 to less than2outof10peoplebetween18and24
years.Importantterritorialdifferencesemergedbothinthelevelofearlyschoolleavers
(inAndalusia 27.7% in 2014,while in Catalonia theywere 22.2%), and in the rate of
reduction over the past decade where Catalonia is similar to Spain average while
Andalusiaisslightlybelow.
SimilarlytoESL,theproportionofyoungpeopleneitherinemploymentnorineducation
andtrainingagedbetween15and24years(NEET)diminishedfrom18.6%(13.1%in
theEU27)in2005,to14.6%in2016(11.5%intheEU27),althoughimportantterritorial
differences emerge, similar to those observed for ESL. Overall, the link between
educationandthelabourmarketisstillnotsmoothandmanyyoungadultsareexcluded
orhavedifficultiesinfindingajob.
Page 305
H2020-YOUNG-SOCIETY-2015 YOUNG_ADULLLT Deliverable 4.1
16
Figure9.EarlySchoolLeavers18-24years,ESL(leftaxis)andpopulationNeither
inEmploymentNorinEducation15-24years,NEET(rightaxis)
Source:EUROSTAT
The former data depict a particular portrait of polarised educational inequalities.
Between2005and2014 theproportionof30- to-34year-oldswhoachievedatmost
both ISCED 0-2 and ISCED 5-8 exceeded the scores of Germany and the UK. In 2012
about 75% 20- to- 24 year-olds entered tertiary education. In 2016 the rate of early
schoolleaverswas19%,thatis,9percentagepointsabovetheEUaverage.Inaddition,
PISA and PIAAC tests have recently noticed that young adults have not acquired the
samelevelofcompetencesthanthemajorityofcountriesincludedintheseassessments.
Therefore, many young adults appear to follow non-standard educational pathways
insofaras they leaveschoolearlybutafterwardsenrol inotherprogrammes that lead
themtotertiaryeducation.However,theseexperiencesareinsufficientformanyofthem
tolearnthebasicacademiccompetences.
0
5
10
15
20
25
0
5
10
15
20
25
30
35
40
2005 2006 2007 2008 2009 2010 2011 2012 2013 2014 2015 2016
AndalusiaESL CataloniaESL SpainESL EU28ESL
Spain,NEET Catalunia,NEET Andalusia,NEET EU27NEET
Page 306
H2020-YOUNG-SOCIETY-2015 YOUNG_ADULLLT Deliverable 4.1
17
Figure10.PISAandPIAACcompetences,Europeanaverage=1
Source:PISAandPIAAC
In terms of the few data available on the competences of the young population, two
assessmentsofferapartialviewofthelevelanddistributionacrossSpanishpopulation:
PISAandPIAAC.Thisdata isnotrepresentative forthecaseofPIAACatregional level
whichisthemostvalidproxybecauseitassessesspecificallyyoungadults.However,we
includePISAinouranalysisbecauseitprovidesaproxyofcompetencesatthemoment
ofcompletingsecondaryeducation.AccordingtothePISAassessment,Spanish15year
oldstudentsperformslightlybelowtheEuropeanaverage.InPISA2003,theyperform7
points lower innumeracy and13 in literacy compared toEuropean average. In2015,
thisgapdiminishedbyhalfapoint,althoughthestandarddeviationandthecoefficient
of variation for Spain are lower than average (10 points and 0.02 respectively). This
showslowerdispersionoftheoveralldistributionandthispatternissimilaracrossPISA
wavesandliteracydomains.LookingatPIAACadultcompetences,youngadultsaged20-
30score5pointslowertheEuropeanaverageandthisappearstobecoherentwiththe
assessment of PISAon15 years oldpupils. Thedisadvantageof Spanish young adults
0.75
0.8
0.85
0.9
0.95
1
Meannumeracy CoeffofvariaUonnumeracy
pisa2003,age15 pisa2015,age15
piaac2012,age20-30 piaac2012,age20-50
Page 307
H2020-YOUNG-SOCIETY-2015 YOUNG_ADULLLT Deliverable 4.1
18
compared toEuropeanpeers is similar across the twodomainsassessed inPIAAC (in
numeracy is 7 points lower). If we look at 20-50 years population this gap persist.
However, thedistribution ismoreconcentratedand inboth thedomains thevariation
among respondentswas lower thanEU average (the standard deviationwas 8 points
lower in numeracy and 5 in literacy), pointing out the coexistence of a lower level of
adult competenceswitha relativelyevendistributionamongyoungadults (Valiente&
Scandurra2015).
Figure11.Participationrateineducationandtraining(last4weeks)
Source:EUROSTAT
Regarding adult participation in education and training, In Spain people who have
participatedinadulteducationinthelastfourweeksbeforebeinginterviewedare18%
in2016whichisslightlyaboveEU27average(17.4%).Thepatternoverthelastdecade
has a U shape: it starts above EU27 average, it increases strongly between 2009 and
2013andstartstodecreaseduringthelast4years.
12
13
14
15
16
17
18
19
20
21
22
2005 2006 2007 2008 2009 2010 2011 2012 2013 2014 2015 2016
EU27 Germany Spain
Page 308
H2020-YOUNG-SOCIETY-2015 YOUNG_ADULLLT Deliverable 4.1
19
1.4. LabourmarketSpainoperates amalebreadwinnermodel, although, until the effects of the economic
crisiswerefelt,thereweresignsoffastchange,increasingtheaccessofwomentopaid
employment. The labour market has traditionally suffered from very high
unemployment,butthiswasgraduallyreducedinthe20-yearperiodupto2009.Youth
unemploymenthasbeenespeciallyhighduringtherecentyearsaseconomiccrisishas
loweredtheaccesstothelabourmarketandthetransitionbetweeneducationandthe
first jobbecameespeciallyprecarious.Additionally,employment ismoreconcentrated
in low skilled occupations, while high skilledwhite-collar occupation represents only
19%vs.27%comparedtoEU27ofthepopulationemployedin2015.Thisfeatureofthe
Spanish labourmarket and skills level of the overall population play a central role in
explainingdivergenceinlabourmarketaccessacrossEuropeancountries(Calero&Choi
2017).
Duringthetimespan2006-2015theoveralleconomicemploymentrateforadultsaged
between20and64wasbelowtheEU-28average.Thisgapstartedtoincreasein2008,
andin2015itreached8%difference(Spain62vs.EU2770.1%).Lowemploymentrate
isparticularlyhighinyouthpopulation(peopleagedbetween15and24),beingalmost
halfof theEU27,with important territorialdifferences.Before2007,Spainhadhigher
youth employment rate compared to EU27, but after it decreased dramatically being
17.9%in2015,whichisalmosthalftheproportionofEU27.
Focusing on unemployment rate, Spain registers high unemployment rate (in 2015,
21.7% compared to 9.2 of EU28). There are huge territorial variations with 13%
differencebetweenCataloniaandAndalusia.After2008,unemploymentonaggregatein
SpainincreaseddramaticallycomparedtotheEuropeanpartnersandfrom2013ithas
started to decline very slowly. Unemployment is particularly concentrated on youth,
wherealmosthalfoftheactivepopulationaged15to24yearsisunemployed,whichis
more than double the rate of European partners. Again, huge territorial differences
emerge, in Andalusia youth unemployment being 56.8% and 42.3% in Catalonia. In
addition, the percentage of active population unemployed for more than one year
reached10.4% in 2015 (EU274.5%), increasing dramatically from2008when itwas
2%almostinlinewithEU27.Thisrepresentsanimportanthumantollasthesepeople
arelikelytohavelowerchancetogetemployedandlosetheirwillandabilitytowork.
Again, importantterritorialdifferencesemerge; inAndalusia longtermunemployment
Page 309
H2020-YOUNG-SOCIETY-2015 YOUNG_ADULLLT Deliverable 4.1
20
in2015was14.8%,whileinCataloniaitwas10.4%.Someauthorshaveshownthatthe
chancestoloseajobwereconcentratedinlowskilledoccupation,whichwerethefirst
toshowjoblosses.Particularlyyouthpopulationemployedinlowvalue-addedactivities
associatedwithrealestateor tourismssectorssuffered themostduring theeconomic
crisis.
Figure12.Employment(leftaxis)andunemploymentrate(rightaxis),population
20-64years
Source:EUROSTAT
In 2014 Spain invested in the overall labourmarket policies an amount of resources
equal to3%of theGDP, similar toFinlandwhich is oneof the countrieswithhighest
investment.Expenditureincreasedduetothefirstimpactofthecrisisin2008-2009and
reached its peak in 2010, then started to decrease. Almost 2.4% out of 3% (80%) is
directed toward out-of-work incomemaintenance, although cut and reduction to the
entitlement have lowered the share of GDP. Active labour market represents a very
smallshareoftheoverallLMP,wheretrainingis0.12%ofGDP,ahalfofGermananda
fourthofAustrianGDPshare.
0
5
10
15
20
25
30
52
54
56
58
60
62
64
66
68
70
72
2005 2006 2007 2008 2009 2010 2011 2012 2013 2014 2015
EmploymentRateSpain EmploymentRateEU28UnemploymentRateEU28(rightax) UnemploymentRateSpain(rightax)
Page 310
H2020-YOUNG-SOCIETY-2015 YOUNG_ADULLLT Deliverable 4.1
21
1.5. RedistributionandsocialinclusionSpanishnetexpenditureinsocialprotectionrosefrom19.4%to23.9%inthetimespan
2007-2014,withastrongincreasetakingplacebetween2007and2011inordertocope
to theconsequencesof theeconomiccrisis. InSpain,governmentexpenditure ismore
fundedbycentralgovernmentcomparedtoEU28(47,3%in2015),autonomousregions
accountsfor26,3%,localgovernmentof11,1%andsocialsecurityfunds14,9%.
According toESPROSS, expenditureon socialprotection isprovided tohouseholdand
individuals affected by a specific set of social risks and needs. In the case of Spain,
resourcesspentforsocialprotectionbenefitswereequalto6.079europerinhabitants
in 2014, which means almost 70% of the EU19 average and 76% of the EU28. The
expenditureincreasedinthelastdecade,butthisshareremainedconstantlybelowthat
ofEuropeanpartners.
Figure13.ExpenditureinsocialprotectioninPPSperinhabitantas%ofEU19
Source:ESSPROS,EUROSTAT
0
0.2
0.4
0.6
0.8
1
1.2
1.4
2003 2004 2005 2006 2007 2008 2009 2010 2011 2012 2013 2014
Germany Spain Italy Finland UnitedKingdom
Page 311
H2020-YOUNG-SOCIETY-2015 YOUNG_ADULLLT Deliverable 4.1
22
ThisshowsthetraditionallowgenerosityoftheSpanishwelfarestate.Themainshareis
spent for pensions and retirement (old age), that is also the indicator showing the
strongest increase (45%) between 2007 and 2014, rising from 6 to 8.8% of national
GDP,belowEuropeanpartners. Spain registeredan increaseof spending in thehealth
care system in the years preceding the economic crisis, but following the crisis its
growth fell rapidly and became negative in real terms in 2010 and 2011. Some
schemeofthewelfarestateremainunder-financedcomparedtoEuropeanpartnerssuch
as health (being 79% of EU-28 expenditure in 2012), family (being 39% of EU-28 in
2012),socialexclusion(51%ofEU28in2012),family(59%ofEU28in2012).
Thedisposable incomeforhouseholds is theamountofmoneythatahouseholdearns
eachyearaftertaxesandtransfers,representingthemoneyavailabletoahouseholdfor
spendingongoodsorservices.InSpainthisislowerthantheEuropeanpartners,being
68% of the average for Germany and 83% of the UK average in 2013, and it has
remainedstableduringtheformer4years.ThedisposableincomeinCataloniawas14%
higherthantheSpanishaverage,whileinAndalusiaitwas21%lower.Forthisindicator
longer series are not available and for this reason it is not possible to compare the
recenttrendwiththepre-economiccrisislevel.
Figure 14. GINI index before and after taxes (left axis) and disposable income
(rightaxis)
Source:EUROSTAT
€10,000
€11,000
€12,000
€13,000
€14,000
€15,000
€16,000
€17,000
0
10
20
30
40
50
60
2005 2006 2007 2008 2009 2010 2011 2012 2013 2014 2015
EU27GINIbefore SpainGINIbefore EU27GINIa\er
SpainGINIa\er Spaindisposableincome Cataloniadisposableincome
Andalusiadisposableincome
Page 312
H2020-YOUNG-SOCIETY-2015 YOUNG_ADULLLT Deliverable 4.1
23
IntermsofincomeinequalitySpainissimilartoEuropeanpartners(50.8comparedto
51.9EU27),andit followsthegeneraltrendofwideningthegapbetweentherichand
thepoor.Between2005and2015theGiniindex8,whichisoneofthekeymeasuresfor
inequality, shows that the concentration of incomewent from 46% to 50.8% against
EU27valuesof respectively49.7%and51.9%.However, theredistributivecapacityof
thewelfarestateappearsreduced,astheGiniindexaftersocialtransfersdropsdownto
34.6% in 2015, accounting for a 31.8% reduction of income inequalities (EU average
was 40.3%). In addition, householdwealth appearsmuchmore unequally distributed
than income. In 2012, the richest 10% of Spanish households owned 43% of overall
household wealth, being the median 300.000 US dollars, 50% than the 17 OECD
countries included. In addition, half of the population results in a high level of
indebtednesswhichismainlyconcentratedinrealestateassets(OECD,2016).
Therateofpeopleatriskofpovertyorsocialexclusionstartedtogrowin2008andin
thelastfouryearsithasbeenbetween10%and20%higherthantheEU27.Territorial
differencesbetweenCataloniaandAndalusiaareveryrelevantandinthelasttenyears
theyhavegrown;In2005theshareofpeopleatriskofpovertyinAndalusiawas31%,
whichis78%morecomparedtoCatalonia(30%comparedwithSpainaverage),whilein
2015itreached42.6%,representing118%comparedtoCataloniaand50%morethan
Spanishaverage.From2010territorialdifferencesstartedtoenlargereachingapeakin
2015.
Whenwelookattheseverematerialdeprivationrate9,apartfrom2005,Andalusiahas
experiencedhigherlevelofextremepovertyoverthelastdecade.Spanishaveragewas
4.1%in2006equaltoCatalonia,whileinAndalusiaitwas6.5%.In2015itwas6.4%in
Spain,6.7%inCataloniaand8%inAndalusia,showingageneralincreaseinthecountry,
butlessinequalitywithinregions.EU-SILCdatapointthatoverthelastdecadegrowing
inequality seem to be concentrated not on the extreme poor but on people at risk of
povertyandtheshareofpoorisgrowinglargelyamongregionsinSpain.
8 The Gini coefficient measures the extent to which a distribution deviates from a perfectly equal
distribution. In this case, GINI is applied to equalised disposable incomewithin a country. Generally it
ranges from0 to100,however it could alsobeexpressedon1-point scale.A coefficientof0 expresses
perfectequalitywhereeveryonehasthesameincome,whileacoefficientof100expressesfullinequality
whereonlyonepersonhasalltheincome.9Severematerialdeprivationrateisdefinedastheenforcedinabilitytopayforat leastfourbasicitems
suchas:1. topaytheirrent,mortgageorutilitybills;2. tokeeptheirhomeadequatelywarm;3. to face
unexpected expenses; 4. to eatmeat or proteins regularly; 5. to go on holiday; 6. a television set; 7. a
washingmachine;8.acar;9.atelephone.
Page 313
H2020-YOUNG-SOCIETY-2015 YOUNG_ADULLLT Deliverable 4.1
24
One of the main drivers is the massive loss of job experienced during the economic
crisis. In fact, the share of people living in households with low work intensity
(population aged 0 to 59 years) experienced a dramatic rise until 2014 for Spain,
representing 17.1%while in 2005 it was 6.9%. The same trend was experienced by
Catalonia andAndalusia. From2005 until 2015 the increase ranged between 4.1% in
Cataloniatoamaximumof14.1%inAndalusia.
Finally,althoughtheregionaldataarelimited,itisinterestingtolookattheratesof
povertyacrossagegroupssincethefinancialcrisis(SeeFigure1510).Infact,the
proportionof16-to-29years-oldwhowereexposedtotheriskofpovertyincreased
from18,1%in2008to29,6%in2016.Theleapexceedsthe150%ofthevaluescoredin
theinitialyear.
Figure15Riskofpoverty,rentimputedonthebaseofincomeoftheyearbefore
Source:INE,2017
10INE,Riesgodepobreza(rentaañoanterioralaentrevista).Retrievedfrom,http://www.ine.es/jaxiT3/Tabla.htm?t=9958on18,July2017.
0
5
10
15
20
25
30
35
2008 2009 2010 2011 2012 2013 2014 2015 2016
Total Lessthan16yrs. 16-29yrs.
30-44yrs. 45-64yrs. 65yrs.andover
Page 314
H2020-YOUNG-SOCIETY-2015 YOUNG_ADULLLT Deliverable 4.1
25
Figure16.Populationatriskofpovertyorsocialexclusion,%(POV)andsevere
materialdeprivationpopulation,%(SMD)
Source:EU-SILC,EUROSTAT
Concerningthepublicsphereandcivicparticipation inSpain,dataonvoterturnout in
national elections, which is one of the proxy of citizens' participation in the political
process, expresses a clear trend of decline, common tomany other EU countries. The
percentagewasequalto75.3%in2006,butparticipationdecreasedto68.9%in2011,
lower than the European average. A similar decline is also shown by turnout data in
regionalandEUparliamentaryelection.In2010accordingtothequalityofgovernment
index11 the Spanishmeanwas 0.09 in 2010 and 0.13 in 2013, being themean of the
Europeanaverage120.23in2010and0.21in2013.Territorialdifferencesarepresent;
Cataloniascoredonthisscale-0.43and-0.05,whileAndalusiascored-0.15and0.02for
2010 and 2013 respectively. The perceptions about the quality and the trust of
11 The European Quality of Government Index (EQI) is the result novel survey data on corruption and
governanceattheregionallevelwithintheEU,conductedintwowavesin2010and2013.Thedatafocus
onbothperceptionsandexperienceswithpublicsectorcorruption,alongwiththeextenttowhichcitizens
believe various public sector services are impartially allocated and of good quality. The data is
standardizedwithameanofzero,andhigherscoresimplyinghigherqualityofgovernment.12Itreferstoall28Europeanmemberstatesandtwoaccessioncountries(SerbiaandTurkey).
0
5
10
15
20
25
30
35
40
45
50
2005 2006 2007 2008 2009 2010 2011 2012 2013 2014 2015
SpainPOV CataluñaPOV AndalucíaPOV
SpainSMD CataluñaSMD AndalucíaSMD
Page 315
H2020-YOUNG-SOCIETY-2015 YOUNG_ADULLLT Deliverable 4.1
26
Spaniards appear to be very low compared to EU average and this is particularly the
caseofCatalonia.
1.6. Healthandwell-beingconditionsHealthandwell-beingconditionsareverydifficultdimensionstoassess.Manydatagaps
emergedandthereisneitherenoughinformationatregionallevelnorfortargetedage
group.Wewillrefertogeneralconditionofhealthandwell-beinginthissection.Spanish
population has experienced an improvement in life expectancy together with an
increase in healthy life years. In 2015 Spanish bothwomen andmenhad65 years of
healthy life years above theEuropeanpartners likeUK (64.2 forwomenand63.2 for
menorGermanyrespectively56.5and56.4).Totalself-perceivedhealthwasveryhigh:
people reporting very good or good self-perceived health were 72.6%, being 5.6%
higher thanEU27 average.However, the trend of this indicator showedhigh increase
before 2011 and it dropped almost 3% in the last three years. This is caused by an
increasing share of peoplewho report bad self-perceived health as the ratio between
highandlowself-perceivedhealthwentbetween2011and2015from14to12.5while
intheEU27itwas8.96reaching8.7inthelastperiodreported.
Lookingclosertotheyoungadultpopulation,someinformationaboutlifesatisfactionis
available for Europeanmember states in the EU-SILC 2013. In 2013 a special ad-hoc
module of EU-SILC assessed satisfaction in different domains of life.We report in the
Figure17 thepercentageof young adults agedbetween25 and34who report being
highly satisfied in the 10 domains assessed. Generally bothwomen andmen Spanish
young adults experienced lower satisfaction in all 10 different domains compared to
EU28,expectintimeuse(+1.7%)andmeaningoflifedomain(+3.2%).Biggestgapsare
revealed incommuting time (-10.7%), recreationalactivities (-7.5%), satisfactionwith
livingenvironment(-4.3%),accommodation(-3.9%)andjobsatisfaction(-5.1%).
Wealsoreportanoverallfactor13oflifesatisfactionforpeopleagedbetween18and30
years for all the items included except labour market and commuting items. This
populationhas similar overall satisfaction compared to theEU28, being respectively -
0.018 and -0.013. However, women seem to experience less overall satisfaction
compared tomenandtheEU28average; thedispersionof the index isalsohigher for
themcomparedtomen,butlowerthantheEU28.
13 The factor is derived from a principal component analysis. The population aged between 18 and 30
yearsareincluded.ItemsincludedarePW030,PW040,PW120,PW160,PW200,PW210.
Page 316
H2020-YOUNG-SOCIETY-2015 YOUNG_ADULLLT Deliverable 4.1
27
Figure17.Highsatisfactioninvariouslifedomains,populationaged25-34,EU28
andSpain,2013
Source:EU-SILC,EUROSTAT
Thereareveryfewproxiesavailableatregionallevelregardingaccesstohealthservices.
Some of them are closely related to health system such as hospital staff and doctors
available in the area.Of course theseproxies are ameasureof the coverageof health
access.Theavailabilityofhospitalstaffandresourcesrevealedagapbetweenthetwo
regions Catalonia and Andalusia. In 2015, the availability of total beds14 in hospitals
infrastructure in Spain was 297 beds per 100.000 people while in Catalonia and
Andalusiawasrespectively435and259. Inthe lastdecade, theavailabilityofhospital
bedsdeclined as in otherEuropean countries such asGermany, but thedecreasewas
more important for Spain since it accounted for -11.7% compared to 2005 (Catalonia
registereda-12.5%andAndalusia-16%).Thisrevealsalowerhealthaccessparticularly
if we consider that there was a pre-existing gap between Spain and other European
14Totalhospitalbedsareallhospitalbedswhichareregularlymaintainedandstaffedand immediately
available for the care of admitted patients. The overall account for hospital beds which are regularly
maintainedandstaffedandimmediatelyavailableforthecareofadmittedpatients.Thesearethenbroken
downbetween: Curative care (acute care) beds; Psychiatric care beds; Long-term care beds (excluding
psychiatriccarebeds);Otherhospitalbeds.
0
10
20
30
40
FinancialsituaUon
AccommodaUon
JobsaUsfacUon
CommuUngUme
Timeuse
OveralllifesaUsfacUon
RecreaUonalandgreenareas
Livingenvironment
PersonalrelaUonships
Meaningoflife
EU28men Spainmen EU28women Spainwomen
Page 317
H2020-YOUNG-SOCIETY-2015 YOUNG_ADULLLT Deliverable 4.1
28
partners and that the overall levelwas increasingly lower (being in2015, almost 2/3
lower than Germany and 1/3 of Finland). Considering the availability of nurses and
midwifes in hospital, Spain registered 514 per 100,000 inhabitants in 2015,which is
lower compared to other European partners. Catalonia has 602 nurses andmidwifes,
while Andalusia 370; this represents respectively 116% and 72% of the national
average.Catalonia faced importantdecrease in2010,while inAndalusia thisdrophas
beenregisteredfrom2012.
Regarding the availability of medical doctors, Spain has a similar share of doctors,
similartoFinlandandlower(-8%)thanGermany.Thesharehasincreasedslightlyover
the past decade, but a slight decrease has been registered from 2011 onwards.
Substantialterritorialdifferencesarepresent,comparedtoSpanishaverage.Andalusia
has29%lesswhileCataloniahas5%moremedicaldoctors.Thisgaphasincreasedover
thelastdecade,whilein2005Andalusiahad5%lessdoctorsandin2015ithad28.3%
lessthantheSpanishaverage.Meanwhile,Cataloniaremainedslightlyabovethemean
(+2%and+5%).
Goingbeyondsubjectiveperception,weshouldlookatsomeotherindicatorsrelatedto
thepersonalwell-being,rangingfromsecuritytoalcoholconsumptionandsmoking,in
ordertohaveabetterpictureofwell-beinginSpain.Wecanrelyonthebetterlifeindex
elaboratedby theOECDwhich collectnational composite index fordifferentdomains.
Oneofthemisthehomiciderate(thenumberofmurdersper100000inhabitants)asa
quite reliablemeasureofa country's safetybecause,unlikeothercrimes,murdersare
usuallyalwaysreportedtothepolice.Accordingtothelatestdata,Spainhasaverylow
share of murders, the seven lowest among EU28 and it decreased compared to the
period2000-08.Cataloniahomicide ratewas0.54 in2016and thisdatahasdropped,
much lower than the OECD average of 4.1. Alcohol consumption has been decreasing
overthelastdecadefrom12.3in2002until9.3litrespercapitaforthepopulationaged
15andover.ThisissimilartoUK(9.4)andFinland(9.1).
2. Finalremarks
Limitationsintheavailabilityofdataproduceascatteredoverviewoftheyoungadults
living conditions. In this sense, the present report raises awareness of two huge
challengesforfurtherresearchandpolicyevaluation.
Page 318
H2020-YOUNG-SOCIETY-2015 YOUNG_ADULLLT Deliverable 4.1
29
First, limited information constrains the scope of academic debates. The general
accountsofeducationaltrajectoriesuseterritorialaverageratesofenrolmentandearly
school leaving in order to discuss the effects of the legal reformspassed in 1970 and
1990 (Merino, 2013; Felgueroso et al, 2014). This strand of research is problematic
becausethedataconflate individualandcollective trends. Inaddition, itasksresearch
questionsintheveinofmethodologicalnationalism,thatis,invitesspecialiststotakethe
nation-stateasthebasicunitofanalysis.
Second,notonlydatacollationrequiresenormousendeavours,butalsothepartnership
betweentheChamberofCommerceofCataloniaandtheDepartmentofEducationhas
neither been effective. Strikingly, this state of the art contrasts with themost recent
recommendationoftheEuropeanUnionregardingearlyschoolleaving:
“[The Council of the European Union], alongside the EU early school leaving
indicator,[invitesthememberstatesto]exploreopportunitiesfordevelopingor
enhancingnationaldatacollectionsystemswhichregularlygatherawiderange
ofinformationonlearners,especiallythoseatriskandearlyschoolleavers.Such
systems, covering all levels and types of education and training and in full
compliancewithnationallegislationondataprotection,could:
(…)
(d)facilitatetheavailabilityofdataandinformationatdifferentpolicylevelsand
theiruseinsteeringandmonitoringpolicydevelopment;
(e) provide the basis for developing effective guidance and support in schools
withaviewtopreventingearlyschoolleaving,aswellasfollow-upmeasuresfor
youngpeoplewhohavelefteducationandtrainingprematurely”(Councilofthe
EuropeanUnion,2015:7).
Although this briefing paper unfortunately cannot provide details at the levels of
autonomous communities and NUTS3, a brief glance of data for the whole of Spain
inspiresa fewgeneral conclusionson thesocial conditionsofyoungadults. Strikingly,
the point is that many young adults are foreign-born, these cohorts are divided by
polarised educational inequalities, and a growing share of young adults have been
exposed to income poverty since the financial crisis. These trends highlight both the
crucialrelevanceofthepoliciesaddressedtothisage-basedtargetgroupandthehuge
challengesthatthesepolicieshavetoovercome.
Page 319
H2020-YOUNG-SOCIETY-2015 YOUNG_ADULLLT Deliverable 4.1
30
References Calero,J.,&Choi,Á.(2017).ThedistributionofskillsamongtheEuropeanadult
populationandunemployment:Acomparativeapproach.EuropeanJournalofEducation,52(3),348–364.
CounciloftheEuropeanUnion(2015)Councilconclusionsonreducingearlyschool
leavingandpromotingsuccessinschool-Councilconclusions(23November2015),14441/15EDUC310,SOC690,EMPL449,JEUN112,pp.1-14.Retrievedfrom
http://data.consilium.europa.eu/doc/document/ST-14441-2015-INIT/en/pdf(28July2017)
EUROSTAT(2017).EuropeanUnionstatisticaloffice,http://ec.europa.eu/eurostat/
Felgueroso,F.,Gutiérrez-Domènech,M.,&Jiménez-Martín,S.(2014).DropoutTrendsandEducationalReforms:TheRoleoftheLOGSEinSpain.IZAJournalofLaborPolicy,
3(1),1–24.http://doi.org/10.1186/2193-9004-3-9
INE,Estadistícassobreriesgodepobreza.(EU-SILC),Retrievedfrom,
http://www.ine.es/jaxiT3/Tabla.htm?t=9958on18,July2017.Merino,R.(2013).LassucesivasreformasdelaformaciónprofesionalenEspañaola
paradojaentreintegraciónysegregaciónescolar.ArchivosAnalíticosdePolíticaEducativa,21(66).
OECD(2017),https://data.oecd.org/
OECD,PIAAC,http://www.oecd.org/skills/piaac/OECD,PISA,http://www.oecd.org/pisa/
OscarValiente,&RosarioScandurra.(2015).Educaciópostobligatòriaidesigualtatdecompetènciesentreelsjoves.InÓ.Valiente&Q.Capsada-Munsech(Eds.),Elsreptesen
matèriadecompetènciesdelapoblacióadulta(pp.25–73).Barcelona:FundacióJaume
Bofill.TheEuropeanUnionLabourForceSurvey(EU-LFS),EUROSTAT
TheEuropeanUnionStatisticsonIncomeandLivingConditions(EU-SILC),EUROSTAT
UNESCO,http://data.uis.unesco.org/