DOI: 10.1126/science.1186986 , 463 (2010); 330 Science et al. Anthony Colaprete, Detection of Water in the LCROSS Ejecta Plume This copy is for your personal, non-commercial use only. . clicking here colleagues, clients, or customers by , you can order high-quality copies for your If you wish to distribute this article to others . here following the guidelines can be obtained by Permission to republish or repurpose articles or portions of articles (this information is current as of November 5, 2010 ): The following resources related to this article are available online at www.sciencemag.org http://www.sciencemag.org/cgi/content/full/330/6003/463 version of this article at: including high-resolution figures, can be found in the online Updated information and services, http://www.sciencemag.org/cgi/content/full/330/6003/463/DC1 can be found at: Supporting Online Material found at: can be related to this article A list of selected additional articles on the Science Web sites http://www.sciencemag.org/cgi/content/full/330/6003/463#related-content http://www.sciencemag.org/cgi/content/full/330/6003/463#otherarticles , 8 of which can be accessed for free: cites 19 articles This article http://www.sciencemag.org/cgi/content/full/330/6003/463#otherarticles 5 articles hosted by HighWire Press; see: cited by This article has been http://www.sciencemag.org/cgi/collection/planet_sci Planetary Science : subject collections This article appears in the following registered trademark of AAAS. is a Science 2010 by the American Association for the Advancement of Science; all rights reserved. The title Copyright American Association for the Advancement of Science, 1200 New York Avenue NW, Washington, DC 20005. (print ISSN 0036-8075; online ISSN 1095-9203) is published weekly, except the last week in December, by the Science on November 5, 2010 www.sciencemag.org Downloaded from
: subject collectionsThis article appears in the following
registered trademark of AAAS. is aScience2010 by the American Association for the Advancement of Science; all rights reserved. The title
CopyrightAmerican Association for the Advancement of Science, 1200 New York Avenue NW, Washington, DC 20005. (print ISSN 0036-8075; online ISSN 1095-9203) is published weekly, except the last week in December, by theScience
Detection of Water in theLCROSS Ejecta PlumeAnthony Colaprete,1* Peter Schultz,2 Jennifer Heldmann,1 Diane Wooden,1 Mark Shirley,1Kimberly Ennico,1 Brendan Hermalyn,2 William Marshall,1,8 Antonio Ricco,1 Richard C. Elphic,1David Goldstein,3 Dustin Summy,3 Gwendolyn D. Bart,4 Erik Asphaug,5 Don Korycansky,5David Landis,6 Luke Sollitt7
Several remote observations have indicated that water ice may be presented in permanentlyshadowed craters of the Moon. The Lunar Crater Observation and Sensing Satellite (LCROSS)mission was designed to provide direct evidence (1). On 9 October 2009, a spent Centaur rocketstruck the persistently shadowed region within the lunar south pole crater Cabeus, ejecting debris,dust, and vapor. This material was observed by a second “shepherding” spacecraft, which carriednine instruments, including cameras, spectrometers, and a radiometer. Near-infrared absorbanceattributed to water vapor and ice and ultraviolet emissions attributable to hydroxyl radicalssupport the presence of water in the debris. The maximum total water vapor and water ice withinthe instrument field of view was 155 T 12 kilograms. Given the estimated total excavated mass ofregolith that reached sunlight, and hence was observable, the concentration of water ice in theregolith at the LCROSS impact site is estimated to be 5.6 T 2.9% by mass. In addition to water,spectral bands of a number of other volatile compounds were observed, including lighthydrocarbons, sulfur-bearing species, and carbon dioxide.
Neutron scattering measurements by LunarProspector (2) indicated increased con-centrations of hydrogen at latitudes with-
in 20° of the poles; subsequent observations fromEarth and spacecraft have provided further evi-dence for the presence of trace amounts of ice orbound OH on theMoon (3–5). Neither the chem-ical form of the hydrogen-bearing compoundsnor their origins has been determined; a variety ofstudies have postulated sources, including solarwind, asteroids, and comets (6–10). Clementineradar observations showed a bright radar returnfrom the interior of Shackleton Crater consistentwith volumetric scattering by water ice (11), aprocess requiring this ice to be relatively pure(~90%) and 1 to 2 m thick. The goal of the LunarCraterObservation andSensingSatellite (LCROSS)was to provide ground truth at one location—thecrater Cabeus—for these observations by crash-ing a spent rocket stage into the Moon and ob-serving the ejected debris, including any hydrogenspecies, from instruments on a trailing spacecraft.
The impactor was the spent upper stage ofthe Atlas V rocket, the Centaur, which propelledboth the Lunar Reconnaissance Orbiter (LRO)and LCROSS to the Moon. Shortly after launch,LRO separated from the LCROSS-Centaur stack,
the Centaur vented its remaining fuel, and con-trol was assumed by the LCROSS ShepherdingSpacecraft (SSc). The LCROSS SSc then con-trolled the Centaur for the next 4 months, per-forming maneuvers to allow the sun to bake outresidual water (12), perform instrument calibra-tions, and ultimately target the Centaur at theplanned impact site. Approximately 9 hours be-fore impact, the SSc separated from the Centaur,performed a braking burn to build a 4-min sep-aration between itself and the Centaur at impact,and oriented its instruments in the direction of thetargeted impact site. About 1 hour before impact,the nine LCROSS instruments were powered onand began taking data (13). Observations fromthe near-infrared (NIR) and ultraviolet/visible(UV/Vis) spectrometers are described here [(14)and supporting online material (SOM)].
The LCROSS target site was selected using avariety of criteria; the two most important werethe altitude at which ejecta would be illuminatedby sunlight and evidence of elevated levels ofhydrogen from previous measurements. Topo-graphic data and its orientation to the Sun indi-cated that Cabeus was the most compelling target(15–18). Substantial levels of hydrogen were in-dicated in Cabeus by both the Lunar ProspectorNeutron Spectrometer (LPNS) and the Lunar Ex-ploration Neutron Detector (LEND) (2, 18). Theheight required for the debris to reach sunlightwas 833 m at the Centaur impact site and time,based on the comparatively low latitude of Cabeus(~–81.5°S) and a cleft in the crater rim topographyon the sunward side at the time of impact. Thisobservation geometry also provided a dark back-ground for the nadir spectrometer measurements.The area selected for impact showed temperatures
less than 50 K (19), making it a likely cold trapfor volatiles.
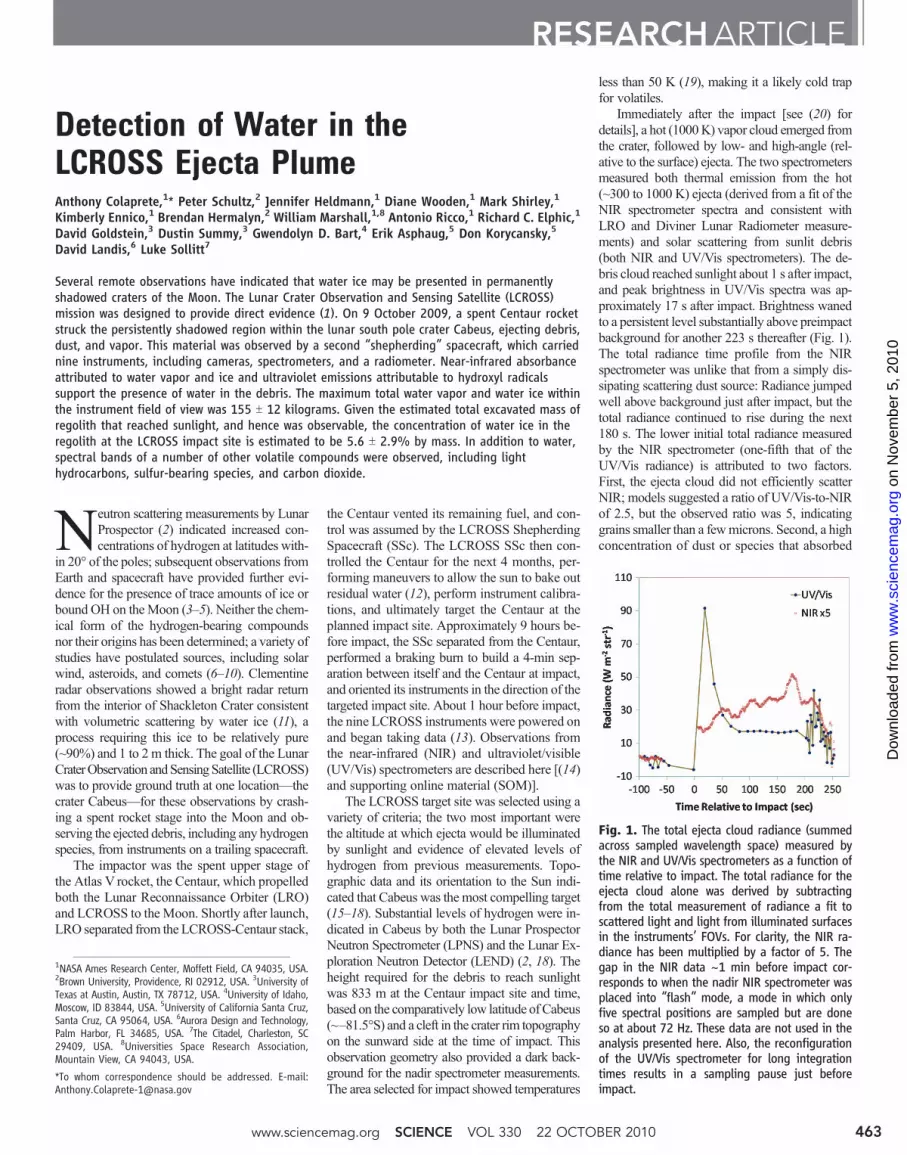
Immediately after the impact [see (20) fordetails], a hot (1000K) vapor cloud emerged fromthe crater, followed by low- and high-angle (rel-ative to the surface) ejecta. The two spectrometersmeasured both thermal emission from the hot(~300 to 1000 K) ejecta (derived from a fit of theNIR spectrometer spectra and consistent withLRO and Diviner Lunar Radiometer measure-ments) and solar scattering from sunlit debris(both NIR and UV/Vis spectrometers). The de-bris cloud reached sunlight about 1 s after impact,and peak brightness in UV/Vis spectra was ap-proximately 17 s after impact. Brightness wanedto a persistent level substantially above preimpactbackground for another 223 s thereafter (Fig. 1).The total radiance time profile from the NIRspectrometer was unlike that from a simply dis-sipating scattering dust source: Radiance jumpedwell above background just after impact, but thetotal radiance continued to rise during the next180 s. The lower initial total radiance measuredby the NIR spectrometer (one-fifth that of theUV/Vis radiance) is attributed to two factors.First, the ejecta cloud did not efficiently scatterNIR; models suggested a ratio of UV/Vis-to-NIRof 2.5, but the observed ratio was 5, indicatinggrains smaller than a fewmicrons. Second, a highconcentration of dust or species that absorbed
RESEARCHARTICLE
1NASA Ames Research Center, Moffett Field, CA 94035, USA.2Brown University, Providence, RI 02912, USA. 3University ofTexas at Austin, Austin, TX 78712, USA. 4University of Idaho,Moscow, ID 83844, USA. 5University of California Santa Cruz,Santa Cruz, CA 95064, USA. 6Aurora Design and Technology,Palm Harbor, FL 34685, USA. 7The Citadel, Charleston, SC29409, USA. 8Universities Space Research Association,Mountain View, CA 94043, USA.
*To whom correspondence should be addressed. E-mail:[email protected]
Fig. 1. The total ejecta cloud radiance (summedacross sampled wavelength space) measured bythe NIR and UV/Vis spectrometers as a function oftime relative to impact. The total radiance for theejecta cloud alone was derived by subtractingfrom the total measurement of radiance a fit toscattered light and light from illuminated surfacesin the instruments’ FOVs. For clarity, the NIR ra-diance has been multiplied by a factor of 5. Thegap in the NIR data ~1 min before impact cor-responds to when the nadir NIR spectrometer wasplaced into “flash” mode, a mode in which onlyfive spectral positions are sampled but are doneso at about 72 Hz. These data are not used in theanalysis presented here. Also, the reconfigurationof the UV/Vis spectrometer for long integrationtimes results in a sampling pause just beforeimpact.
www.sciencemag.org SCIENCE VOL 330 22 OCTOBER 2010 463
in the NIR (described below) lowered integratedradiance across most of the NIR spectrum, aneffect also seen both experimentally and in theDeep Impact mission (21). After the impact, the
abundance of NIR absorbers diminished as theplume expanded kinetically and departed the fieldof view (FOV) of the instrument. However, ingeneral, at wavelengths longer than about 1.9 mm,
the radiance increased as range decreased be-tween the instrument and the warm, emittingcrater (Fig. 2).
The nadir NIR spectrometer measurementsafter impact were dynamic, with significant var-iations across the measured spectrum as a func-tion of time (Fig. 2). We used 180 measurementstaken in the ~90 s before impact to generate areference spectrum against which postimpactspectra could be compared. After impact, varioustime series of scans were averaged to improvesignal-to-noise ratios. Each NIR spectrometerscan took ~0.6 s; thus, averaging across 30 scanseffectively averages over ~20 s. The averagingtime period was guided by discernible periods ofdistinct NIR phenomenology, as indicated by thepeaks and valleys in the total NIR radiance (Fig.1). These differentiable periods are likely to bethe result of changes in the FOV of the instru-ment (during descent toward the impact site)(22), and changes in the morphology of the ejectaand vapor clouds, as debris moved into sunlightand volatiles continued to sublimate from ejectagrains and the warmed surfaces in and around theimpact crater. During the earliest periods afterimpact, there was a clear indication of a NIRcontribution from scattered solar light (see Fig. 2,spectra for periods 0 to 24 and 24 to 30 s). Thiscontribution is seen as an upturn at wavelengthsshorter than ~1.5 mm. At longer wavelengths, thecontinuum is composed of a combination of weakscattering from ejecta debris and the surface, andemission from the hot crater (23). Over all spectralperiods, the continuum generally appeared to beheavily eroded by a variety of absorbers. Afterabout 30 s, gas absorption bands, which were
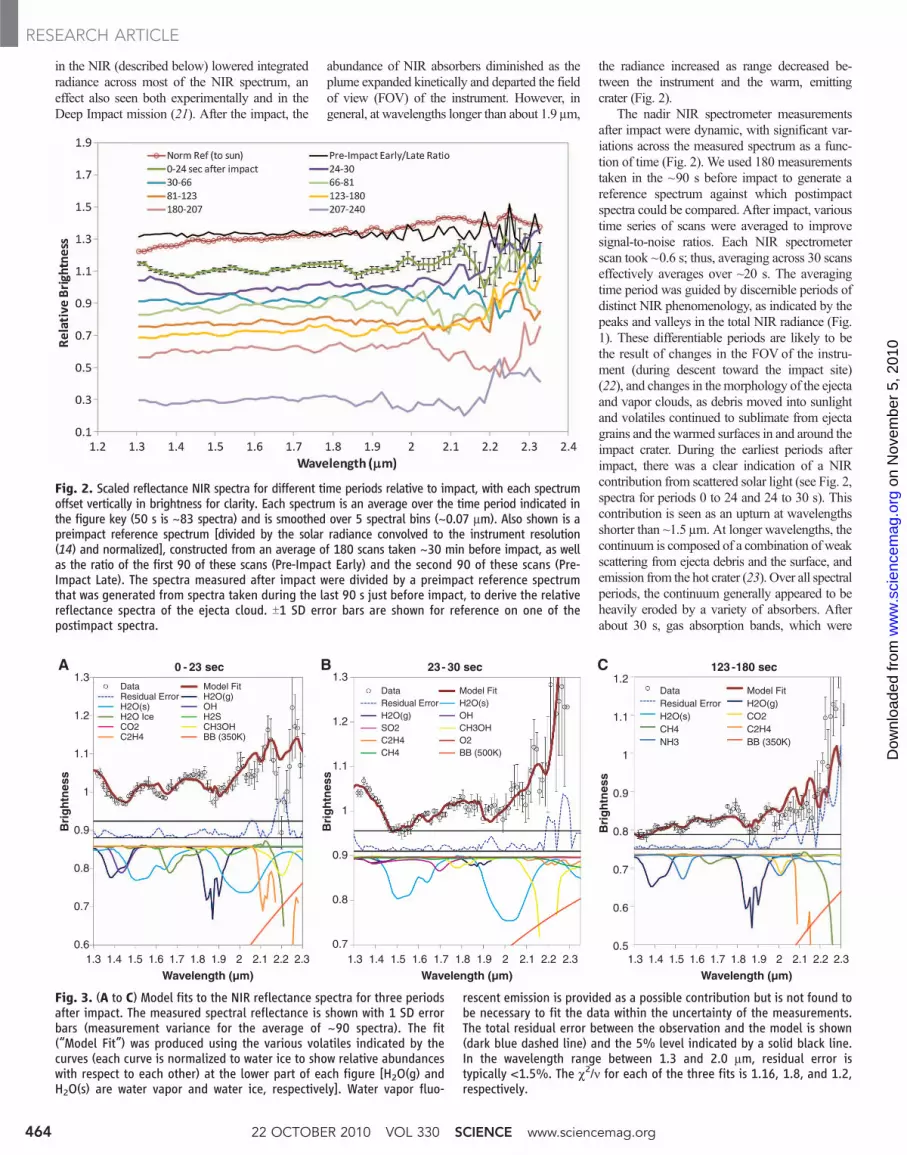
Fig. 2. Scaled reflectance NIR spectra for different time periods relative to impact, with each spectrumoffset vertically in brightness for clarity. Each spectrum is an average over the time period indicated inthe figure key (50 s is ~83 spectra) and is smoothed over 5 spectral bins (~0.07 mm). Also shown is apreimpact reference spectrum [divided by the solar radiance convolved to the instrument resolution(14) and normalized], constructed from an average of 180 scans taken ~30 min before impact, as wellas the ratio of the first 90 of these scans (Pre-Impact Early) and the second 90 of these scans (Pre-Impact Late). The spectra measured after impact were divided by a preimpact reference spectrumthat was generated from spectra taken during the last 90 s just before impact, to derive the relativereflectance spectra of the ejecta cloud. T1 SD error bars are shown for reference on one of thepostimpact spectra.
A B C
0.5
0.6
0.7
0.8
0.9
1
1.1
1.2
1.3 1.4 1.5 1.6 1.7 1.8 1.9 2 2.1 2.2 2.3
Bri
gh
tnes
s
Bri
gh
tnes
s
Bri
gh
tnes
s
123 -180 sec
Data Model FitResidual Error H2O(g)H2O(s) CO2CH4 C2H4NH3 BB (350K)
0.7
0.8
0.9
1
1.1
1.2
1.3
1.3 1.4 1.5 1.6 1.7 1.8 1.9 2 2.1 2.2 2.3
23- 30 sec
Data Model FitResidual Error H2O(s)H2O(g) OHSO2 CH3OHC2H4 O2CH4 BB (500K)
0.6
0.7
0.8
0.9
1
1.1
1.2
1.3
1.3 1.4 1.5 1.6 1.7 1.8 1.9 2 2.1 2.2 2.3
Wavelength (µm) Wavelength (µm) Wavelength (µm)
0 - 23 sec
Data Model FitResidual Error H2O(g)H2O(s) OHH2O Ice H2SCO2 CH3OHC2H4 BB (350K)
Fig. 3. (A to C) Model fits to the NIR reflectance spectra for three periodsafter impact. The measured spectral reflectance is shown with 1 SD errorbars (measurement variance for the average of ~90 spectra). The fit(“Model Fit”) was produced using the various volatiles indicated by thecurves (each curve is normalized to water ice to show relative abundanceswith respect to each other) at the lower part of each figure [H2O(g) andH2O(s) are water vapor and water ice, respectively]. Water vapor fluo-
rescent emission is provided as a possible contribution but is not found tobe necessary to fit the data within the uncertainty of the measurements.The total residual error between the observation and the model is shown(dark blue dashed line) and the 5% level indicated by a solid black line.In the wavelength range between 1.3 and 2.0 mm, residual error istypically <1.5%. The c2/n for each of the three fits is 1.16, 1.8, and 1.2,respectively.
22 OCTOBER 2010 VOL 330 SCIENCE www.sciencemag.org464
narrower than mineral absorption bands, domi-nated the spectra. We used a linear mixing modelto fit the spectra, and the quality of fit was deter-mined by the total residual between the measure-ments and the fit from 1.3 to 2.0 mm—the regionwhere water vapor and ice are primarily involved.A c2 minimization was performed for threeepochs to elucidate the uncertainties with respectto their related confidence intervals (24). Linearfits for three of the periods shown in Fig. 2 areshown in Fig. 3. Τhe model fit is good at wave-lengths <2.0 mm, where residual errors are typ-ically less than 1.5%. At longer wavelengths,where the instrument performance is poorest andthe variance from one spectrum to the next isgreatest due in part to variations in the blackbodysource function, the fit is not as good. Moreover,because the NIR source function was not dom-inated by scattering from ejecta debris, especiallyover 30 to 40 s after impact, narrow gas lineswere evident in the spectra and could be used toderive abundances of gaseous species. Thus, thefitting of the water features at wavelengths <2 mmdid not depend strongly on the fitting of speciesthat absorb at wavelengths >2 mm.
In Fig. 3A, there is a strong indication of ab-sorption by hydroxyl (OH) and water (vapor andpossibly mineral bound). It is likely that OH andwater gasseswere part of an initial warm (~1000K)vapor plume that was released just after impactand that is generally unassociated with ejectadebris–sunlight interaction. The combination offeatures seen at 1.4, 1.9, and 2.2 mm suggest thatmineral-bound OH (at 1.4 mm), bound H2O (at1.9 mm), and metal-bound OH (e.g., Al-OH at2.2 mm feature) were also present (26) but in sub-stantially smaller quantities than gas-phase water.Figure 3B shows spectra from the period whenthe ejecta cloud was brightest and provides thegreatest shortwave contrast for the water ice fea-ture at 1.5 mm. This ice feature and its 2.0-mmcounterpart (which is skewed to higher reflec-tance because of the thermal emission beginningat 1.9 mm) confirm that at least some of the waterejected from Cabeus was in the form of ice andnot just water adsorbed on grains. At later times,the water vapor feature at 1.87 mm again becameapparent (Fig. 3C) and persisted for the remain-ing duration of the 4-min observation period (com-pare spectra at 1.87 mm in Fig. 2).
Using the depth of the 1.87-mmabsorption bandin the spectrum in Fig. 3C and absorption crosssections computed using high-resolution trans-mission molecular absorption database (HITRAN),
the total water vapor in the instrument FOV atthe time of the observation was ~5.1 (T1.4) ×1019 molecules m−2 (1 SD uncertainty) (24). Overthe period of the observation (123 to 180 s), theFOVof the spectrometer ranged from ~3.8 × 10⁷
to 2 × 10⁷ m2, giving a total water vapor massin the instrument FOV ranging from 74 to 31 kg.Given the average FOVover this period, the watervapor mass is 53 T 3 kg (1 SD uncertainty).Similarly, the total water ice abundance over thissame period ranged from 22 to 9 kg, with anaverage in that time period of 16 T 2 kg (1 SDuncertainty) (27). These are lower limits, becausethe ejecta cloud filled the spectrometer FOV~20 s after impact, and thus some water wouldbe outside the instrument’s FOV. In a similarmanner, total water vapor columns were calcu-lated at earlier times (Fig. 3, A and B). Using the1.5-mm ice feature shown in Fig. 3B,we estimateusing a 2-mm ice particle radius (28) that the waterice grain column number is 6.3 × 10⁷ particlesm−2 or ~131 T 8 kg of water ice (Table 1).
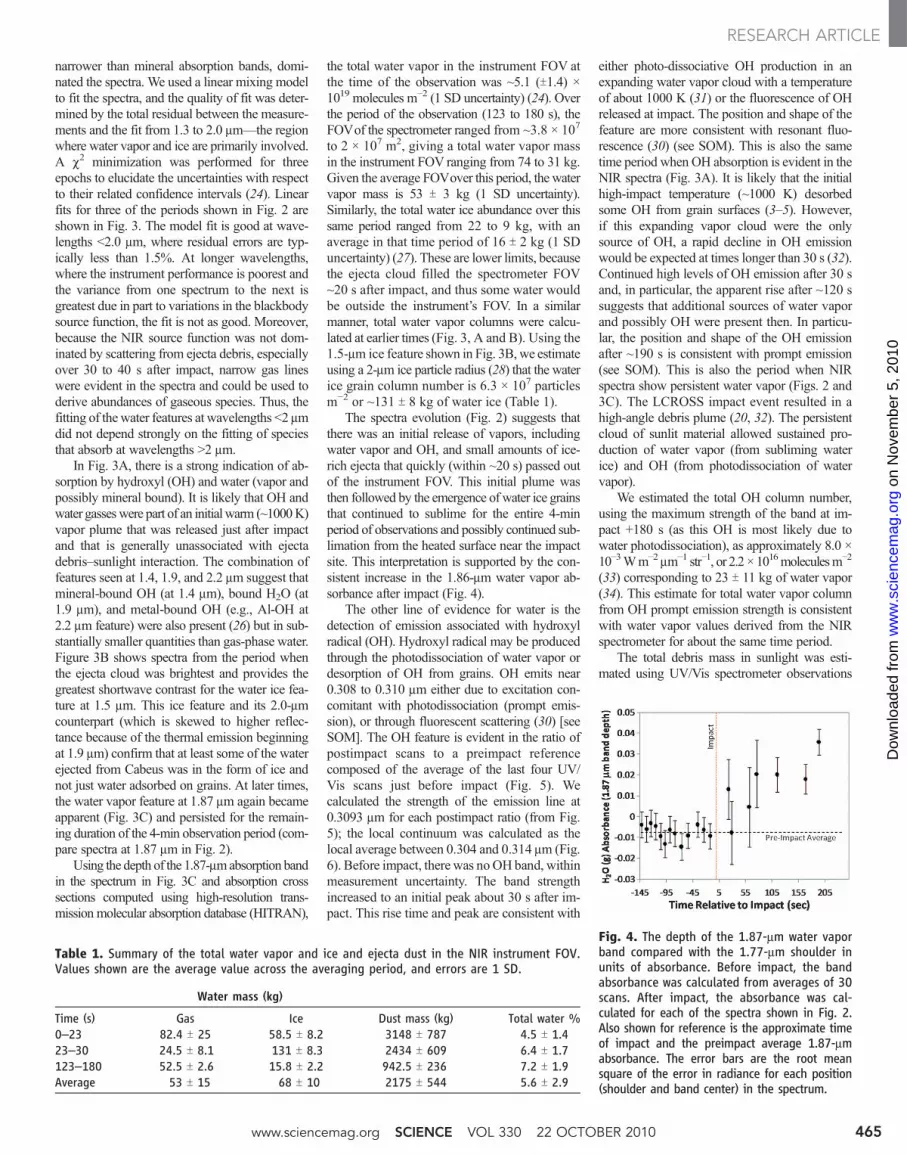
The spectra evolution (Fig. 2) suggests thatthere was an initial release of vapors, includingwater vapor and OH, and small amounts of ice-rich ejecta that quickly (within ~20 s) passed outof the instrument FOV. This initial plume wasthen followed by the emergence of water ice grainsthat continued to sublime for the entire 4-minperiod of observations and possibly continued sub-limation from the heated surface near the impactsite. This interpretation is supported by the con-sistent increase in the 1.86-mm water vapor ab-sorbance after impact (Fig. 4).
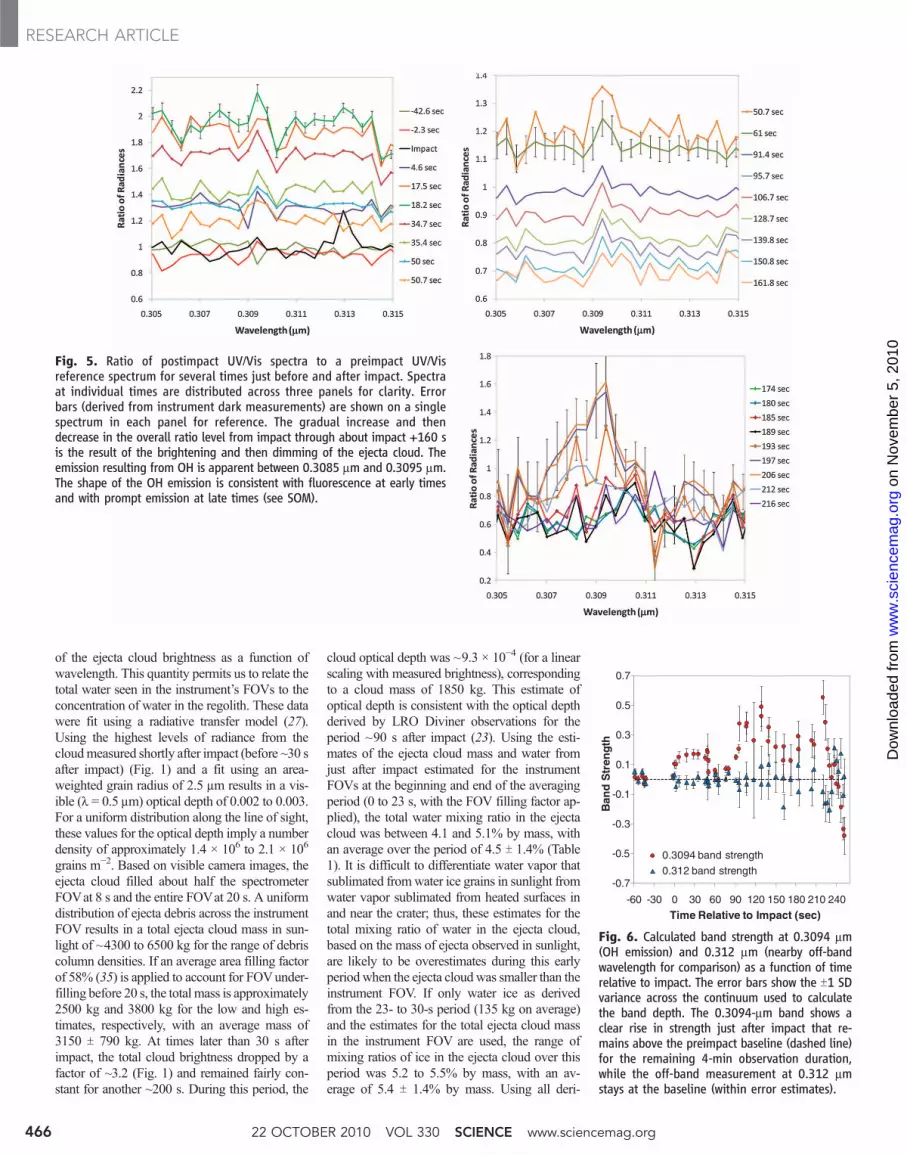
The other line of evidence for water is thedetection of emission associated with hydroxylradical (OH). Hydroxyl radical may be producedthrough the photodissociation of water vapor ordesorption of OH from grains. OH emits near0.308 to 0.310 mm either due to excitation con-comitant with photodissociation (prompt emis-sion), or through fluorescent scattering (30) [seeSOM]. The OH feature is evident in the ratio ofpostimpact scans to a preimpact referencecomposed of the average of the last four UV/Vis scans just before impact (Fig. 5). Wecalculated the strength of the emission line at0.3093 mm for each postimpact ratio (from Fig.5); the local continuum was calculated as thelocal average between 0.304 and 0.314 mm (Fig.6). Before impact, there was noOHband, withinmeasurement uncertainty. The band strengthincreased to an initial peak about 30 s after im-pact. This rise time and peak are consistent with
either photo-dissociative OH production in anexpanding water vapor cloud with a temperatureof about 1000 K (31) or the fluorescence of OHreleased at impact. The position and shape of thefeature are more consistent with resonant fluo-rescence (30) (see SOM). This is also the sametime period when OH absorption is evident in theNIR spectra (Fig. 3A). It is likely that the initialhigh-impact temperature (~1000 K) desorbedsome OH from grain surfaces (3–5). However,if this expanding vapor cloud were the onlysource of OH, a rapid decline in OH emissionwould be expected at times longer than 30 s (32).Continued high levels of OH emission after 30 sand, in particular, the apparent rise after ~120 ssuggests that additional sources of water vaporand possibly OH were present then. In particu-lar, the position and shape of the OH emissionafter ~190 s is consistent with prompt emission(see SOM). This is also the period when NIRspectra show persistent water vapor (Figs. 2 and3C). The LCROSS impact event resulted in ahigh-angle debris plume (20, 32). The persistentcloud of sunlit material allowed sustained pro-duction of water vapor (from subliming waterice) and OH (from photodissociation of watervapor).
We estimated the total OH column number,using the maximum strength of the band at im-pact +180 s (as this OH is most likely due towater photodissociation), as approximately 8.0 ×10⁻³Wm−2 mm−1 str−1, or 2.2 × 10¹⁶moleculesm−2
(33) corresponding to 23 T 11 kg of water vapor(34). This estimate for total water vapor columnfrom OH prompt emission strength is consistentwith water vapor values derived from the NIRspectrometer for about the same time period.
The total debris mass in sunlight was esti-mated using UV/Vis spectrometer observations
Table 1. Summary of the total water vapor and ice and ejecta dust in the NIR instrument FOV.Values shown are the average value across the averaging period, and errors are 1 SD.
Water mass (kg)Time (s) Gas Ice Dust mass (kg) Total water %0–23 82.4 T 25 58.5 T 8.2 3148 T 787 4.5 T 1.423–30 24.5 T 8.1 131 T 8.3 2434 T 609 6.4 T 1.7123–180 52.5 T 2.6 15.8 T 2.2 942.5 T 236 7.2 T 1.9Average 53 T 15 68 T 10 2175 T 544 5.6 T 2.9
Fig. 4. The depth of the 1.87-mm water vaporband compared with the 1.77-mm shoulder inunits of absorbance. Before impact, the bandabsorbance was calculated from averages of 30scans. After impact, the absorbance was cal-culated for each of the spectra shown in Fig. 2.Also shown for reference is the approximate timeof impact and the preimpact average 1.87-mmabsorbance. The error bars are the root meansquare of the error in radiance for each position(shoulder and band center) in the spectrum.
www.sciencemag.org SCIENCE VOL 330 22 OCTOBER 2010 465
of the ejecta cloud brightness as a function ofwavelength. This quantity permits us to relate thetotal water seen in the instrument’s FOVs to theconcentration of water in the regolith. These datawere fit using a radiative transfer model (27).Using the highest levels of radiance from thecloudmeasured shortly after impact (before ~30 safter impact) (Fig. 1) and a fit using an area-weighted grain radius of 2.5 mm results in a vis-ible (l = 0.5 mm) optical depth of 0.002 to 0.003.For a uniform distribution along the line of sight,these values for the optical depth imply a numberdensity of approximately 1.4 × 10⁶ to 2.1 × 10⁶
grains m−2. Based on visible camera images, theejecta cloud filled about half the spectrometerFOVat 8 s and the entire FOVat 20 s. A uniformdistribution of ejecta debris across the instrumentFOV results in a total ejecta cloud mass in sun-light of ~4300 to 6500 kg for the range of debriscolumn densities. If an average area filling factorof 58% (35) is applied to account for FOVunder-filling before 20 s, the total mass is approximately2500 kg and 3800 kg for the low and high es-timates, respectively, with an average mass of3150 T 790 kg. At times later than 30 s afterimpact, the total cloud brightness dropped by afactor of ~3.2 (Fig. 1) and remained fairly con-stant for another ~200 s. During this period, the
cloud optical depth was ~9.3 × 10⁻⁴ (for a linearscaling with measured brightness), correspondingto a cloud mass of 1850 kg. This estimate ofoptical depth is consistent with the optical depthderived by LRO Diviner observations for theperiod ~90 s after impact (23). Using the esti-mates of the ejecta cloud mass and water fromjust after impact estimated for the instrumentFOVs at the beginning and end of the averagingperiod (0 to 23 s, with the FOV filling factor ap-plied), the total water mixing ratio in the ejectacloud was between 4.1 and 5.1% by mass, withan average over the period of 4.5 T 1.4% (Table1). It is difficult to differentiate water vapor thatsublimated fromwater ice grains in sunlight fromwater vapor sublimated from heated surfaces inand near the crater; thus, these estimates for thetotal mixing ratio of water in the ejecta cloud,based on the mass of ejecta observed in sunlight,are likely to be overestimates during this earlyperiod when the ejecta cloudwas smaller than theinstrument FOV. If only water ice as derivedfrom the 23- to 30-s period (135 kg on average)and the estimates for the total ejecta cloud massin the instrument FOV are used, the range ofmixing ratios of ice in the ejecta cloud over thisperiod was 5.2 to 5.5% by mass, with an av-erage of 5.4 T 1.4% by mass. Using all deri-
Fig. 5. Ratio of postimpact UV/Vis spectra to a preimpact UV/Visreference spectrum for several times just before and after impact. Spectraat individual times are distributed across three panels for clarity. Errorbars (derived from instrument dark measurements) are shown on a singlespectrum in each panel for reference. The gradual increase and thendecrease in the overall ratio level from impact through about impact +160 sis the result of the brightening and then dimming of the ejecta cloud. Theemission resulting from OH is apparent between 0.3085 mm and 0.3095 mm.The shape of the OH emission is consistent with fluorescence at early timesand with prompt emission at late times (see SOM).
-0.7
-0.5
-0.3
-0.1
0.1
0.3
0.5
0.7
-60 -30 0 30 60 90 120 150 180 210 240
Ban
d S
tren
gth
Time Relative to Impact (sec)
0.3094 band strength
0.312 band strength
Fig. 6. Calculated band strength at 0.3094 mm(OH emission) and 0.312 mm (nearby off-bandwavelength for comparison) as a function of timerelative to impact. The error bars show the T1 SDvariance across the continuum used to calculatethe band depth. The 0.3094-mm band shows aclear rise in strength just after impact that re-mains above the preimpact baseline (dashed line)for the remaining 4-min observation duration,while the off-band measurement at 0.312 mmstays at the baseline (within error estimates).
22 OCTOBER 2010 VOL 330 SCIENCE www.sciencemag.org466
vations of total water concentration and the errorsfrom individual measurements for each of thethree periods shown in Fig. 3, the mean waterconcentration is 5.6 T 2.9% by mass (36). Thesehigh values suggest that a substantial amount ofthe hydrogen observed by LPNS and LEND wasin the form of water ice in the crater. LENDneutron data suggests that the floor of Cabeuscontains >2 weight percent water (18), or abouta third the value derived from LCROSS. Sev-eral important caveats need to be considered: (i)the LEND result is strongly model dependent(e.g., assumptions about the desiccated top layerthickness); (ii) the LCROSS sample depth waspossibly deeper than neutron spectroscopy caneffectively sample (deeper than ~0.7 m); (iii) thepersistent conduction of impact heat into the reg-olith resulted in a continued release of volatiles(23); and (iv) the neutron LEND and LPNS in-strument footprints were never smaller than 10 kmacross; thus, spatial gradients smaller than 10 kmare smoothed. The LCROSS result when com-bined with LEND and LPNS suggests that thereis some spatial heterogeneity at scales <10 km.
As implied in Fig. 3, other hydrogen-bearingcompounds are also likely to be present. Obser-vations from the Lyman Alpha Mapping Project(LAMP) on LRO suggest that ~140 kg of H2
was released at impact, corresponding to an ini-tial regolith concentration of 1.4% (31). The to-tal hydrogen sensed by LPNS and LRO LENDwould logically include not only the watermeasured by LCROSS’s spectrometers but alsoH2 measured by LRO-LAMP and any otherhydrogen-containing volatiles (e.g., CH4) mea-sured by LCROSS.
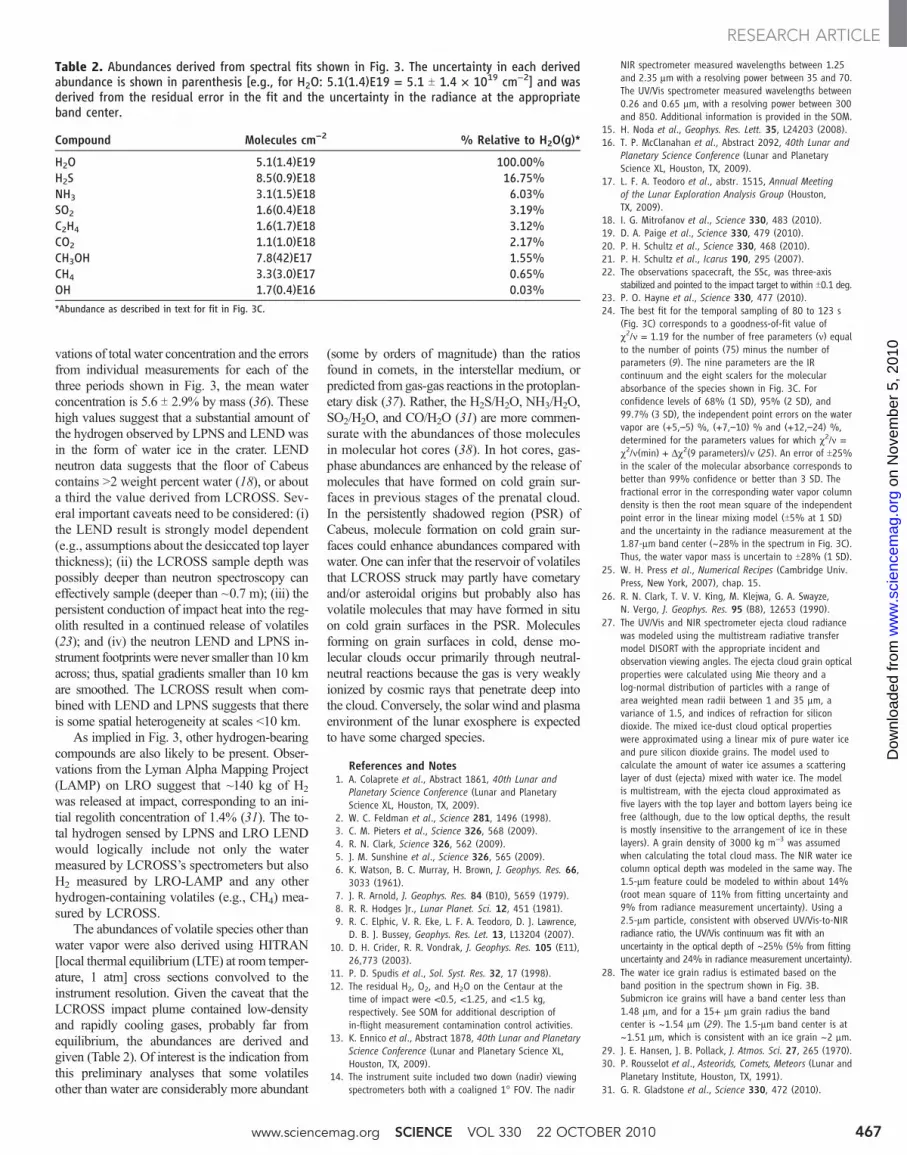
The abundances of volatile species other thanwater vapor were also derived using HITRAN[local thermal equilibrium (LTE) at room temper-ature, 1 atm] cross sections convolved to theinstrument resolution. Given the caveat that theLCROSS impact plume contained low-densityand rapidly cooling gases, probably far fromequilibrium, the abundances are derived andgiven (Table 2). Of interest is the indication fromthis preliminary analyses that some volatilesother than water are considerably more abundant
(some by orders of magnitude) than the ratiosfound in comets, in the interstellar medium, orpredicted from gas-gas reactions in the protoplan-etary disk (37). Rather, the H2S/H2O, NH3/H2O,SO2/H2O, and CO/H2O (31) are more commen-surate with the abundances of those moleculesin molecular hot cores (38). In hot cores, gas-phase abundances are enhanced by the release ofmolecules that have formed on cold grain sur-faces in previous stages of the prenatal cloud.In the persistently shadowed region (PSR) ofCabeus, molecule formation on cold grain sur-faces could enhance abundances compared withwater. One can infer that the reservoir of volatilesthat LCROSS struck may partly have cometaryand/or asteroidal origins but probably also hasvolatile molecules that may have formed in situon cold grain surfaces in the PSR. Moleculesforming on grain surfaces in cold, dense mo-lecular clouds occur primarily through neutral-neutral reactions because the gas is very weaklyionized by cosmic rays that penetrate deep intothe cloud. Conversely, the solar wind and plasmaenvironment of the lunar exosphere is expectedto have some charged species.
References and Notes1. A. Colaprete et al., Abstract 1861, 40th Lunar and
Planetary Science Conference (Lunar and PlanetaryScience XL, Houston, TX, 2009).
2. W. C. Feldman et al., Science 281, 1496 (1998).3. C. M. Pieters et al., Science 326, 568 (2009).4. R. N. Clark, Science 326, 562 (2009).5. J. M. Sunshine et al., Science 326, 565 (2009).6. K. Watson, B. C. Murray, H. Brown, J. Geophys. Res. 66,
3033 (1961).7. J. R. Arnold, J. Geophys. Res. 84 (B10), 5659 (1979).8. R. R. Hodges Jr., Lunar Planet. Sci. 12, 451 (1981).9. R. C. Elphic, V. R. Eke, L. F. A. Teodoro, D. J. Lawrence,
D. B. J. Bussey, Geophys. Res. Let. 13, L13204 (2007).10. D. H. Crider, R. R. Vondrak, J. Geophys. Res. 105 (E11),
26,773 (2003).11. P. D. Spudis et al., Sol. Syst. Res. 32, 17 (1998).12. The residual H2, O2, and H2O on the Centaur at the
time of impact were <0.5, <1.25, and <1.5 kg,respectively. See SOM for additional description ofin-flight measurement contamination control activities.
13. K. Ennico et al., Abstract 1878, 40th Lunar and PlanetaryScience Conference (Lunar and Planetary Science XL,Houston, TX, 2009).
14. The instrument suite included two down (nadir) viewingspectrometers both with a coaligned 1° FOV. The nadir
NIR spectrometer measured wavelengths between 1.25and 2.35 mm with a resolving power between 35 and 70.The UV/Vis spectrometer measured wavelengths between0.26 and 0.65 mm, with a resolving power between 300and 850. Additional information is provided in the SOM.
15. H. Noda et al., Geophys. Res. Lett. 35, L24203 (2008).16. T. P. McClanahan et al., Abstract 2092, 40th Lunar and
Planetary Science Conference (Lunar and PlanetaryScience XL, Houston, TX, 2009).
17. L. F. A. Teodoro et al., abstr. 1515, Annual Meetingof the Lunar Exploration Analysis Group (Houston,TX, 2009).
18. I. G. Mitrofanov et al., Science 330, 483 (2010).19. D. A. Paige et al., Science 330, 479 (2010).20. P. H. Schultz et al., Science 330, 468 (2010).21. P. H. Schultz et al., Icarus 190, 295 (2007).22. The observations spacecraft, the SSc, was three-axis
stabilized and pointed to the impact target to within T0.1 deg.23. P. O. Hayne et al., Science 330, 477 (2010).24. The best fit for the temporal sampling of 80 to 123 s
(Fig. 3C) corresponds to a goodness-of-fit value ofc2/n = 1.19 for the number of free parameters (n) equalto the number of points (75) minus the number ofparameters (9). The nine parameters are the IRcontinuum and the eight scalers for the molecularabsorbance of the species shown in Fig. 3C. Forconfidence levels of 68% (1 SD), 95% (2 SD), and99.7% (3 SD), the independent point errors on the watervapor are (+5,–5) %, (+7,–10) % and (+12,–24) %,determined for the parameters values for which c2/n =c2/n(min) + Dc2(9 parameters)/n (25). An error of T25%in the scaler of the molecular absorbance corresponds tobetter than 99% confidence or better than 3 SD. Thefractional error in the corresponding water vapor columndensity is then the root mean square of the independentpoint error in the linear mixing model (T5% at 1 SD)and the uncertainty in the radiance measurement at the1.87-mm band center (~28% in the spectrum in Fig. 3C).Thus, the water vapor mass is uncertain to T28% (1 SD).
25. W. H. Press et al., Numerical Recipes (Cambridge Univ.Press, New York, 2007), chap. 15.
26. R. N. Clark, T. V. V. King, M. Klejwa, G. A. Swayze,N. Vergo, J. Geophys. Res. 95 (B8), 12653 (1990).
27. The UV/Vis and NIR spectrometer ejecta cloud radiancewas modeled using the multistream radiative transfermodel DISORT with the appropriate incident andobservation viewing angles. The ejecta cloud grain opticalproperties were calculated using Mie theory and alog-normal distribution of particles with a range ofarea weighted mean radii between 1 and 35 mm, avariance of 1.5, and indices of refraction for silicondioxide. The mixed ice-dust cloud optical propertieswere approximated using a linear mix of pure water iceand pure silicon dioxide grains. The model used tocalculate the amount of water ice assumes a scatteringlayer of dust (ejecta) mixed with water ice. The modelis multistream, with the ejecta cloud approximated asfive layers with the top layer and bottom layers being icefree (although, due to the low optical depths, the resultis mostly insensitive to the arrangement of ice in theselayers). A grain density of 3000 kg m−3 was assumedwhen calculating the total cloud mass. The NIR water icecolumn optical depth was modeled in the same way. The1.5-mm feature could be modeled to within about 14%(root mean square of 11% from fitting uncertainty and9% from radiance measurement uncertainty). Using a2.5-mm particle, consistent with observed UV/Vis-to-NIRradiance ratio, the UV/Vis continuum was fit with anuncertainty in the optical depth of ~25% (5% from fittinguncertainty and 24% in radiance measurement uncertainty).
28. The water ice grain radius is estimated based on theband position in the spectrum shown in Fig. 3B.Submicron ice grains will have a band center less than1.48 mm, and for a 15+ mm grain radius the bandcenter is ~1.54 mm (29). The 1.5-mm band center is at~1.51 mm, which is consistent with an ice grain ~2 mm.
29. J. E. Hansen, J. B. Pollack, J. Atmos. Sci. 27, 265 (1970).30. P. Rousselot et al., Asteorids, Comets, Meteors (Lunar and
Planetary Institute, Houston, TX, 1991).31. G. R. Gladstone et al., Science 330, 472 (2010).
Table 2. Abundances derived from spectral fits shown in Fig. 3. The uncertainty in each derivedabundance is shown in parenthesis [e.g., for H2O: 5.1(1.4)E19 = 5.1 T 1.4 × 1019 cm−2] and wasderived from the residual error in the fit and the uncertainty in the radiance at the appropriateband center.
Compound Molecules cm−2 % Relative to H2O(g)*H2O 5.1(1.4)E19 100.00%H2S 8.5(0.9)E18 16.75%NH3 3.1(1.5)E18 6.03%SO2 1.6(0.4)E18 3.19%C2H4 1.6(1.7)E18 3.12%CO2 1.1(1.0)E18 2.17%CH3OH 7.8(42)E17 1.55%CH4 3.3(3.0)E17 0.65%OH 1.7(0.4)E16 0.03%*Abundance as described in text for fit in Fig. 3C.
www.sciencemag.org SCIENCE VOL 330 22 OCTOBER 2010 467
32. D. Summy et al., abstr. 2267, 40th Lunar andPlanetary Science Conference, (Lunar and PlanetaryScience XL, Houston, TX, 2009).
33. A g factor of 5 × 10⁻⁴ photons/s was used in theOH number estimate.
34. The uncertainty in the water vapor mass derived from theOH prompt emission at ~180 s after impact is based onthe total uncertainty in the measured OH radiance at thattime. The total uncertainty in OH radiance is based onthe calibration error (<10%), instrument noise (fromdark measurements at specific integration time), anduncertainty in the g factor (about 20%).
35. At 8 s after impact, the diameter of the ejecta cloud inthe visible camera was ~4.5 km, and the FOVs of the NIR
and UV/Vis spectrometers were ~10 km in diameter. At20 s, the ejecta cloud diameter was ~8.5 km and theFOVs of the spectrometers were approximately 9.6 km indiameter.
36. The total error is the propagated error for the masses ofwater vapor plus water ice divided by the dust mass,using the errors (1 SD uncertainties, quoted in Table 1)in the derived masses of each component.
37. D. Bockele'e-Morvan et al., in Comets II (University ofArizona Press, Tucson, AZ, 2004), pp. 391–423.
38. D. H. Wooden et al., in Comets II (University of ArizonaPress, Tucson, AZ, 2004), pp. 33–66.
39. We thank the LCROSS Project and NASA’s ExplorationSystems Mission Directorate (ESMD) and NASA Science
Mission Directorate (SMD) for support, and are verygrateful to the LRO project and the LRO instrumentleads for supporting the LCROSS targeting and impactobservations, and for the three referees who providedreviews that greatly improved this paper. R.C.E. wassupported by an LRO Participating Scientist grant.
Supporting Online Materialwww.sciencemag.org/cgi/content/full/330/6003/463/DC1SOM TextFigs. S1 to S11References
12 January 2010; accepted 22 September 201010.1126/science.1186986
REPORTS
The LCROSS Cratering ExperimentPeter H. Schultz,1* Brendan Hermalyn,1 Anthony Colaprete,2 Kimberly Ennico,2Mark Shirley,2 William S. Marshall2,3
As its detached upper-stage launch vehicle collided with the surface, instruments on the trailingLunar Crater Observation and Sensing Satellite (LCROSS) Shepherding Spacecraft monitored theimpact and ejecta. The faint impact flash in visible wavelengths and thermal signature imaged inthe mid-infrared together indicate a low-density surface layer. The evolving spectra reveal not onlyOH within sunlit ejecta but also other volatile species. As the Shepherding Spacecraft approached thesurface, it imaged a 25- to-30-meter–diameter crater and evidence of a high-angle ballistic ejecta plumestill in the process of returning to the surface—an evolution attributed to the nature of the impactor.
Prior studies from instruments on the Apollo(1) and Lunar Prospector (2) missions in-dicated the presence of mobile volatiles
on or around the Moon. Multiple spacecraft re-cently confirmed these observations through di-rect spectroscopic measurements of OH and H2O(3–5). In contrast, the Lunar Crater Observationand Sensing Satellite (LCROSS) mission used akinetic probe (the emptied stage of the Centaurrocket) to excavate H-bearing compounds fromapermanently shadowed region (PSR)near the southpole of theMoon.As theCentaur collidedwith thelunar surface, the trailing Shepherding Spacecraft(SSc) measured the evolution and compositionof the resulting ejecta with a series of instruments.A separate contribution specifically examinesH-bearing molecular species observed withLCROSS instruments (6). Here, we describe theCentaur collision with implications for the ejectedmass, excavation depth, and regolith composition.
The mid-infrared cameras (MIR1 and MIR2)recorded the “first light” in the frame coincidingwith the moment of impact that remained visiblefor the next 10 s (Fig. 1A). At that time, theresolution of the MIR instrument was approxi-mately 1 km/pixel. Consequently, the thermal ra-diance generated just by the heated crater floorshould have covered less than a single pixel at
that range; instead, it spanned multiple pixelscorresponding to 3 to 4 km in diameter beforefading with time.
The Total Luminance Photometer (TLP) wasdesigned to detect a sudden change in bright-ness over visible wavelengths from a distanceof more than 600 km (7), but this signal hasnot yet been unequivocally identified. Never-theless, the Near-Infrared Spectrometer (NSP1),covering longer wavelengths, operated in aflash mode at 72 Hz (five wavelength chan-nels plus a dark measurement measured every13.8 ms); hence, it functioned as a thermal flashdetector (Fig. 1B). This instrument recorded a0.4-s rise in background intensity, followed bya 0.7-s decay. The onset for the rise in radiancein the NSP1, however, was delayed about 0.3 sfrom the moment of impact, on the basis ofour analysis of flight data for the trajectory andtopography.
The UV/VIS Spectrometer (VSP) capturedboth emissions from the impact flash and ejectarising into sunlight. A large number of weak [butsignificant (2s)] emission lines emerged withinthe first 0.8 s after impact, during the flashmode of the NSP1 instrument. The spectralresolution of the VSP is better than 1 nm, asdemonstrated through clear identification of finestructure in the solar spectrum due to scatteredlight. Although many emission lines have notyet been identified with confidence, possibleidentifications include CN, NH, NH2, CO2
+,and CS (8). The overall radiance levels increaseddramatically during the next exposure (1.1 to
3.1 s after impact), indicating the arrival of ejectainto sunlight. Prominent emissions at 598 nm(Na) and a line pair at 328 and 338 nm (possiblyAg) also emerged, along with other species,such as H2S and H2O
+.The Visible Camera (VIS) started its se-
quence ~8 s after impact, well after ejecta hadreached sunlight (Fig. 2A). The ejecta cloudincreased from ~4 km (8 s) to ~8 km (20 s) indiameter and remained visible for about 42 sbefore dropping below the sensitivity thresholdof the instrument (Fig. 2B). Both near-infraredcameras (NIR1 and NIR2) also captured the ex-panding ejecta cloud well after (~8 s) the mo-ment of impact but with less dynamic range thanthe visible camera, thereby limiting their use forcomparing dimensions.
In the final 10 s before impact, changes inexposure time and pixel gain for the NIR2 cam-era allowed the lunar surface to be imaged fromscattered light off nearby relief. As a result, “shad-owed” and “illuminated” areas are opposite tothe direction of direct solar illumination (Fig. 3A).These images (higher in spatial resolution thanthe MIR images) reveal a region around the pointof impact that is typical of the lunar surface: anundulating but relatively flat surface with fewlarge craters. The last three frames from NIR2,starting at a range of 11 km above the surface,included a feature that correlates with a small ther-mally warm region in the MIR. This region isidentified as the crater through correlation producedby the Centaur impact and its surrounding ejectathrough correlation of telemetry and registrationwith the hot spot located in the MIR data. Justbefore the SSc collision, the NIR2 camera alsorecorded a diffuse disk-like feature that movedthrough the field of view in four successive im-ages during approach (Fig. 3B). This featureappeared suddenly as a result of the camera ex-posure and gain settings.
The evolving ejecta cloud and final craterproduced by the Centaur impact place constraintson the nature of the surface, the depth of anyreleased volatiles, and context for observationsby other instruments. The prolonged spectral ra-diance in the NSP1 data as well as NIR1 and theMIR images establish that the Centaur impact
1Department of Geological Sciences, Brown University,Providence, RI 02912, USA. 2NASA Ames Research Center,Moffett Field, CA 94035, USA. 3Universities Space ResearchAssociation, Mountain View, CA 94043, USA.
*To whom correspondence should be addressed. E-mail:[email protected]
22 OCTOBER 2010 VOL 330 SCIENCE www.sciencemag.org468