Paper presentado en la IEEE Global Humanitarian Technology Conference (GHTC), Seattle, WA. Oct 2015. Best Conference Paper. DevCAFE: A customizable participatory assessment platform for sustainable development interventions Brandie Nonnecke a*w , Sanjay Krishnan b* , Alison Cliff c , Angela Lin b , Shir Nehama c , Jay Patel b , Mo Zhou c , Laura Byaruhanga d , Dorothy Masinde e , Maria Elena Meneses f , Alejandro Martin del Campo f , Camille Crittenden a , Ken Goldberg a,b,c a CITRIS Connected Communities Initiative, UC Berkeley b Electrical Engineering and Computer Science, UC Berkeley c Industrial Engineering and Operations Research, UC Berkeley d Uganda Program, Iowa State University e Global Resource Systems, Iowa State University f Tecnológico de Monterrey *These authors contributed equally to this work w Corresponding Author: [email protected]Abstract— Participatory methods for assessment are considered important for sustainable development practices. Existing digital data collection tools are limited in the way they can process qualitative data and engage participants. In this paper, we describe the Development Collaborative Assessment and Feedback Engine (DevCAFE), a customizable participatory assessment platform that integrates quantitative assessment, qualitative feedback and peer-to-peer collaborative filtering. DevCAFE also provides a library of statistical analyses for researchers to quickly identify quantitative and qualitative trends while collecting field data. DevCAFE can run on any mobile device with a web-browser and can work with or without Internet connectivity. We present results from two pilot projects: (1) 137 participants evaluating family planning education in rural Uganda, and (2) 2,262 participants evaluating governance in Mexico. DevCAFE collected over 14,000 peer-to-peer ratings on 473 submitted ideas. DevCAFE’s collaborative filtering and statistical analyses discovered insightful qualitative feedback as well as significant correlations between quantitative assessment and demographics. Feedback gathered through DevCAFE enabled targeted reforms to the family planning efforts in Uganda and the need for increased government attention to public safety and corruption in Mexico. Keywords—collaborative assessment; collaborative filtering; participatory research; collective intelligence I. INTRODUCTION Participatory methods for assessment are important for sustainable development practices [1]. However, analyzing and collecting data in the field can be very challenging, especially in remote areas. A researcher often has to travel to the field, conduct a series of surveys or interviews, and then enter and analyze data after returning. Digital survey tools such as Open Data Kit (ODK) and SMS-based mobile frameworks [2,3] are revolutionizing field data collection. These tools use a digital survey design to reduce the time- consuming and error-prone process of converting handwritten notes, paper forms, and audio recordings into structured digital data. Digital survey tools are useful for experimental designs and confirmatory analysis as they mitigate sources of bias. However, in many participatory applications, development participants, practitioners and researchers are interested in exploratory analysis to discover patterns, problems and issues of interest while in the field. Our goal is to enable inclusive and interactive feedback by designing an application that allows researchers and participants in the field to discover key insights by combining statistical models and collaborative filtering to enable rapid exploratory analysis. We consider two key analysis challenges: (1) qualitative data analysis and (2) quantitative data dimensionality. Qualitative data is useful for discovering unanticipated issues and problems directly from the participants. However, analyzing large amounts of qualitative data is challenging. Researchers also often need to analyze the responses to multiple potentially correlated quantitative questions. Analyzing each question (dimension) individually can overlook multivariate trends.
Transcript
Paper presentado en la IEEE Global Humanitarian Technology Conference (GHTC), Seattle, WA. Oct 2015. Best Conference Paper. DevCAFE:
A customizable participatory assessment platform for sustainable development interventions
Brandie Nonneckea*w, Sanjay Krishnanb*, Alison Cliffc, Angela Linb, Shir Nehamac, Jay Patelb, Mo Zhouc, Laura Byaruhangad, Dorothy Masindee, Maria Elena Menesesf, Alejandro Martin del Campof, Camille Crittendena,
bElectrical Engineering and Computer Science, UC Berkeley cIndustrial Engineering and Operations Research, UC Berkeley
dUganda Program, Iowa State University eGlobal Resource Systems, Iowa State University
fTecnológico de Monterrey *These authors contributed equally to this work w Corresponding Author: [email protected]
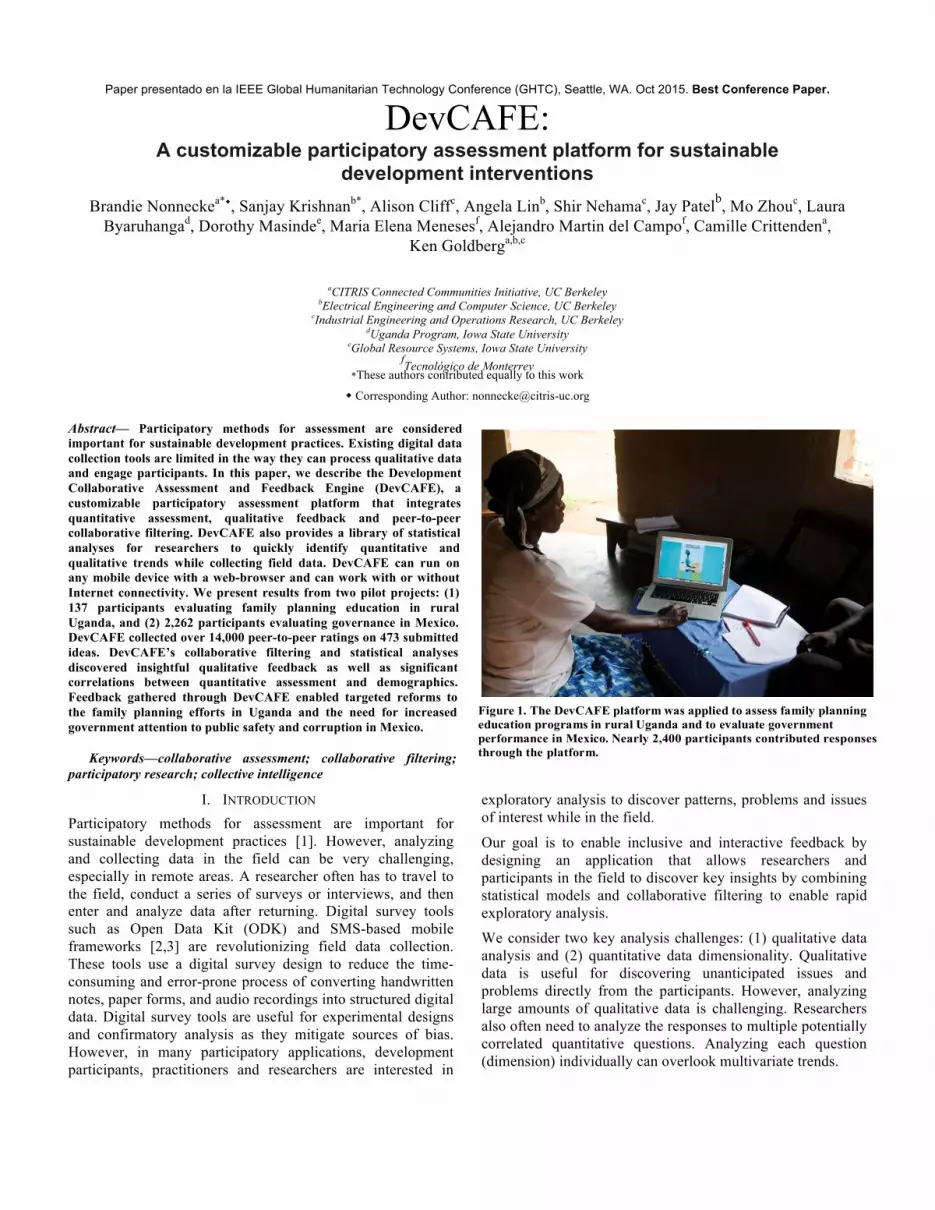
Abstract— Participatory methods for assessment are considered important for sustainable development practices. Existing digital data collection tools are limited in the way they can process qualitative data and engage participants. In this paper, we describe the Development Collaborative Assessment and Feedback Engine (DevCAFE), a customizable participatory assessment platform that integrates quantitative assessment, qualitative feedback and peer-to-peer collaborative filtering. DevCAFE also provides a library of statistical analyses for researchers to quickly identify quantitative and qualitative trends while collecting field data. DevCAFE can run on any mobile device with a web-browser and can work with or without Internet connectivity. We present results from two pilot projects: (1) 137 participants evaluating family planning education in rural Uganda, and (2) 2,262 participants evaluating governance in Mexico. DevCAFE collected over 14,000 peer-to-peer ratings on 473 submitted ideas. DevCAFE’s collaborative filtering and statistical analyses discovered insightful qualitative feedback as well as significant correlations between quantitative assessment and demographics. Feedback gathered through DevCAFE enabled targeted reforms to the family planning efforts in Uganda and the need for increased government attention to public safety and corruption in Mexico.
I. INTRODUCTION Participatory methods for assessment are important for sustainable development practices [1]. However, analyzing and collecting data in the field can be very challenging, especially in remote areas. A researcher often has to travel to the field, conduct a series of surveys or interviews, and then enter and analyze data after returning. Digital survey tools such as Open Data Kit (ODK) and SMS-based mobile frameworks [2,3] are revolutionizing field data collection. These tools use a digital survey design to reduce the time-consuming and error-prone process of converting handwritten notes, paper forms, and audio recordings into structured digital data. Digital survey tools are useful for experimental designs and confirmatory analysis as they mitigate sources of bias. However, in many participatory applications, development participants, practitioners and researchers are interested in
exploratory analysis to discover patterns, problems and issues of interest while in the field.
Our goal is to enable inclusive and interactive feedback by designing an application that allows researchers and participants in the field to discover key insights by combining statistical models and collaborative filtering to enable rapid exploratory analysis.
We consider two key analysis challenges: (1) qualitative data analysis and (2) quantitative data dimensionality. Qualitative data is useful for discovering unanticipated issues and problems directly from the participants. However, analyzing large amounts of qualitative data is challenging. Researchers also often need to analyze the responses to multiple potentially correlated quantitative questions. Analyzing each question (dimension) individually can overlook multivariate trends.
We present the Development Collaborative Assessment and Feedback Engine (DevCAFE), a mobile-optimized assessment platform to address these challenges. This platform has a visual interactive interface, where participants immediately see where they stand with respect to others and can evaluate others’ responses. The collaborative design allows us to address qualitative data and rapidly identify insightful responses [4,6]. To address the second challenge, DevCAFE incorporates dimensionality reduction tools to efficiently identify differentiating factors in quantitative responses. These statistics are computed in real-time and enable researchers to discover and share timely insights in the field.
In addition, many development studies are in locations with intermittent or non-existent Internet connectivity. DevCAFE supports the mobility features of existing digital assessment platforms: (1) DevCAFE can be loaded on any device with an HTML5-compatible browser, (2) it does not require Internet connectivity once loaded, (3) and if connectivity is available, the system will synchronize with its server. DevCAFE is a flexible platform that can be modified to fit the needs of a participatory assessment application. Researchers can select demographic, quantitative and qualitative questions. We implement many of the salient features of tools like ODK while adding additional support for peer-to-peer interactions, visualization, and statistical analysis.
In this paper, we present the DevCAFE software and describe two preliminary case studies of applying DevCAFE to assess development practices in Uganda and Mexico.
Uganda Case Study: We applied DevCAFE for use in Kamuli, Uganda in June 2014 to assess the effectiveness of family planning (FP) trainings at three Nutrition Education Centers (Centers). Responses were collected from 137 women who attended these trainings.
Mexico Case Study: We applied a Spanish-language DevCAFE to evaluate the Mexican Government’s performance on timely policy issues. We collected data from April 2015 to May 2015 from 2,262 participants from throughout the country.
II. RELATED WORK Digital data collection tools for humanitarian programs have been well studied [13]. The most comprehensive toolkit is the Open Data Kit project [7,8,21]. ODK provides an Android-based data collection tool, which uploads collected data to a central server. It is resilient to network connectivity problems and can export data in many standard research formats. It further integrates with sensor, image, and voice data and has meta-tools, which allow researchers to easily design surveys and survey protocols. While the functionalities of ODK and DevCAFE overlap, we optimize our software for a different application. We target collaborative participant-centric problem exploration and issue discovery, and manage this data longitudinally. Participants not only contribute data, but also
receive instant feedback and can evaluate responses provided by others. To implement interactive applications in an intermittent network, we apply results from the database literature such as transactions and logging. These two features allow us to operate in unreliable networks with less fear of losing data. One alternative to ODK and related tools has been SMS-based data collection such as FrontlineSMS and RapidSMS [1,21,28]. FrontlineSMS is an open-source platform for surveying communities with limited Internet access but with SMS coverage. As with ODK, the system allows for collecting responses to simple forms via SMS, but does not enable interaction between participants. While FrontlineSMS is primarily used to gather data for short surveys, RapidSMS can be used to gather more structured data on a larger scale. RapidSMS is an open-source platform built with Python and Django. The use of SMS for data collection has been proven successful in a variety of development research contexts; however, research has shown that data collected through SMS may not be as accurate as data collected through the use of interactive voice recognition systems [30]. Within developing country contexts, SMS data collection capabilities may be diminished due to literacy and language barriers among target populations. One solution to this problem has been the use of interactive voice recognition systems (IVRs). ODK Voice is one tool that enables surveys to be recorded in the local language or dialect [21]. To complete the survey, participants respond to an automated phone call or call a central phone number. Participants then provide answers to survey questions by entering numbers in response to audio-recorded questions or by recording qualitative answers (ibid.). While extremely useful, such approaches are still limited in the types of data they can collect. A related point of ensuring the quality of collected data has also been studied [5, 9, 29]. Participatory action research (PAR) engages and empowers participants as active contributors in the research process [39]. Participants are encouraged to assist in identifying problems faced within the community, interpreting research results, and identifying potential applications of these results to address local problems. The bottom-up approach of PAR is particularly useful in development-based research where interventions must draw on local knowledge to better understand the complex and multifaceted issues affecting successful implementation. This theoretical model argues that when subjects actively participate rather than passively provide data it can yield more informative results in democratic processes, strategic planning and ideation.
III. DEVCAFE PLATFORM A. Overview DevCAFE is a new assessment platform that can directly engage citizens and communities from developing regions to collectively assess conditions, needs and outcomes related to development engineering in fields such as democracy, governance and public health. One key focus of the software platform is to collect longitudinal data, and track changes over time. In contrast to polls and surveys traditionally used by aid agencies and analysts, DevCAFE is user-facing and provides direct, immediate visual feedback to participants, allowing them to instantly understand where they stand on key issues in relation to other participants and encourage open-ended / qualitative responses that can enhance interaction between participants. We envision DevCAFE as a grassroots, user-friendly, self-organizing environment that allows the wisdom of crowds to identify, highlight and display patterns, trends and insights as they emerge.
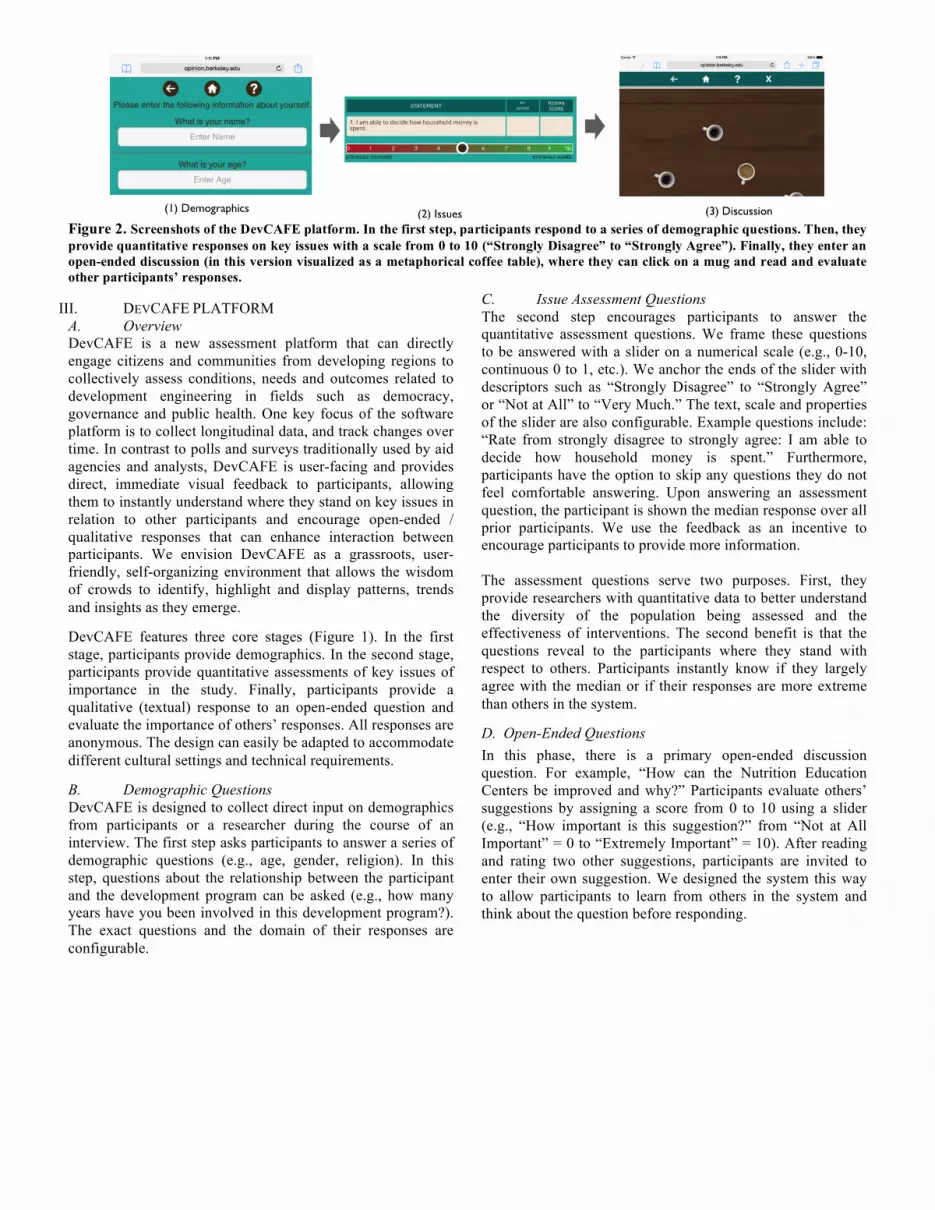
DevCAFE features three core stages (Figure 1). In the first stage, participants provide demographics. In the second stage, participants provide quantitative assessments of key issues of importance in the study. Finally, participants provide a qualitative (textual) response to an open-ended question and evaluate the importance of others’ responses. All responses are anonymous. The design can easily be adapted to accommodate different cultural settings and technical requirements.
B. Demographic Questions DevCAFE is designed to collect direct input on demographics from participants or a researcher during the course of an interview. The first step asks participants to answer a series of demographic questions (e.g., age, gender, religion). In this step, questions about the relationship between the participant and the development program can be asked (e.g., how many years have you been involved in this development program?). The exact questions and the domain of their responses are configurable.
C. Issue Assessment Questions The second step encourages participants to answer the quantitative assessment questions. We frame these questions to be answered with a slider on a numerical scale (e.g., 0-10, continuous 0 to 1, etc.). We anchor the ends of the slider with descriptors such as “Strongly Disagree” to “Strongly Agree” or “Not at All” to “Very Much.” The text, scale and properties of the slider are also configurable. Example questions include: “Rate from strongly disagree to strongly agree: I am able to decide how household money is spent.” Furthermore, participants have the option to skip any questions they do not feel comfortable answering. Upon answering an assessment question, the participant is shown the median response over all prior participants. We use the feedback as an incentive to encourage participants to provide more information.
The assessment questions serve two purposes. First, they provide researchers with quantitative data to better understand the diversity of the population being assessed and the effectiveness of interventions. The second benefit is that the questions reveal to the participants where they stand with respect to others. Participants instantly know if they largely agree with the median or if their responses are more extreme than others in the system.
D. Open-Ended Questions In this phase, there is a primary open-ended discussion question. For example, “How can the Nutrition Education Centers be improved and why?” Participants evaluate others’ suggestions by assigning a score from 0 to 10 using a slider (e.g., “How important is this suggestion?” from “Not at All Important” = 0 to “Extremely Important” = 10). After reading and rating two other suggestions, participants are invited to enter their own suggestion. We designed the system this way to allow participants to learn from others in the system and think about the question before responding.
Figure 2. Screenshots of the DevCAFE platform. In the first step, participants respond to a series of demographic questions. Then, they provide quantitative responses on key issues with a scale from 0 to 10 (“Strongly Disagree” to “Strongly Agree”). Finally, they enter an open-ended discussion (in this version visualized as a metaphorical coffee table), where they can click on a mug and read and evaluate other participants’ responses.
Figure 4. Participants rate each other's ideas on importance. Peer-to-peer ratings are an important part of DevCAFE’s solution to the potential bottleneck of analyzing qualitative data.
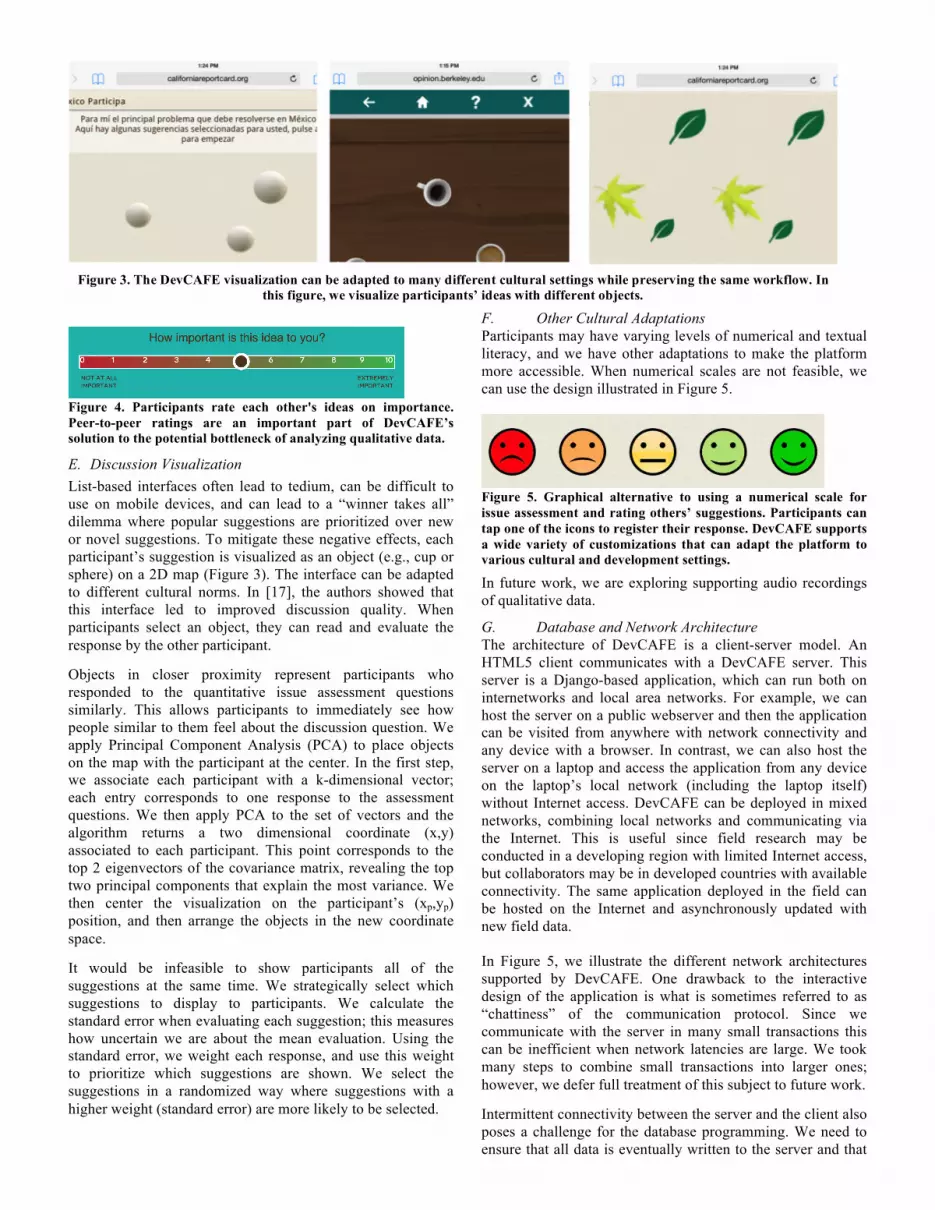
E. Discussion Visualization List-based interfaces often lead to tedium, can be difficult to use on mobile devices, and can lead to a “winner takes all” dilemma where popular suggestions are prioritized over new or novel suggestions. To mitigate these negative effects, each participant’s suggestion is visualized as an object (e.g., cup or sphere) on a 2D map (Figure 3). The interface can be adapted to different cultural norms. In [17], the authors showed that this interface led to improved discussion quality. When participants select an object, they can read and evaluate the response by the other participant.
Objects in closer proximity represent participants who responded to the quantitative issue assessment questions similarly. This allows participants to immediately see how people similar to them feel about the discussion question. We apply Principal Component Analysis (PCA) to place objects on the map with the participant at the center. In the first step, we associate each participant with a k-dimensional vector; each entry corresponds to one response to the assessment questions. We then apply PCA to the set of vectors and the algorithm returns a two dimensional coordinate (x,y) associated to each participant. This point corresponds to the top 2 eigenvectors of the covariance matrix, revealing the top two principal components that explain the most variance. We then center the visualization on the participant’s (xp,yp) position, and then arrange the objects in the new coordinate space.
It would be infeasible to show participants all of the suggestions at the same time. We strategically select which suggestions to display to participants. We calculate the standard error when evaluating each suggestion; this measures how uncertain we are about the mean evaluation. Using the standard error, we weight each response, and use this weight to prioritize which suggestions are shown. We select the suggestions in a randomized way where suggestions with a higher weight (standard error) are more likely to be selected.
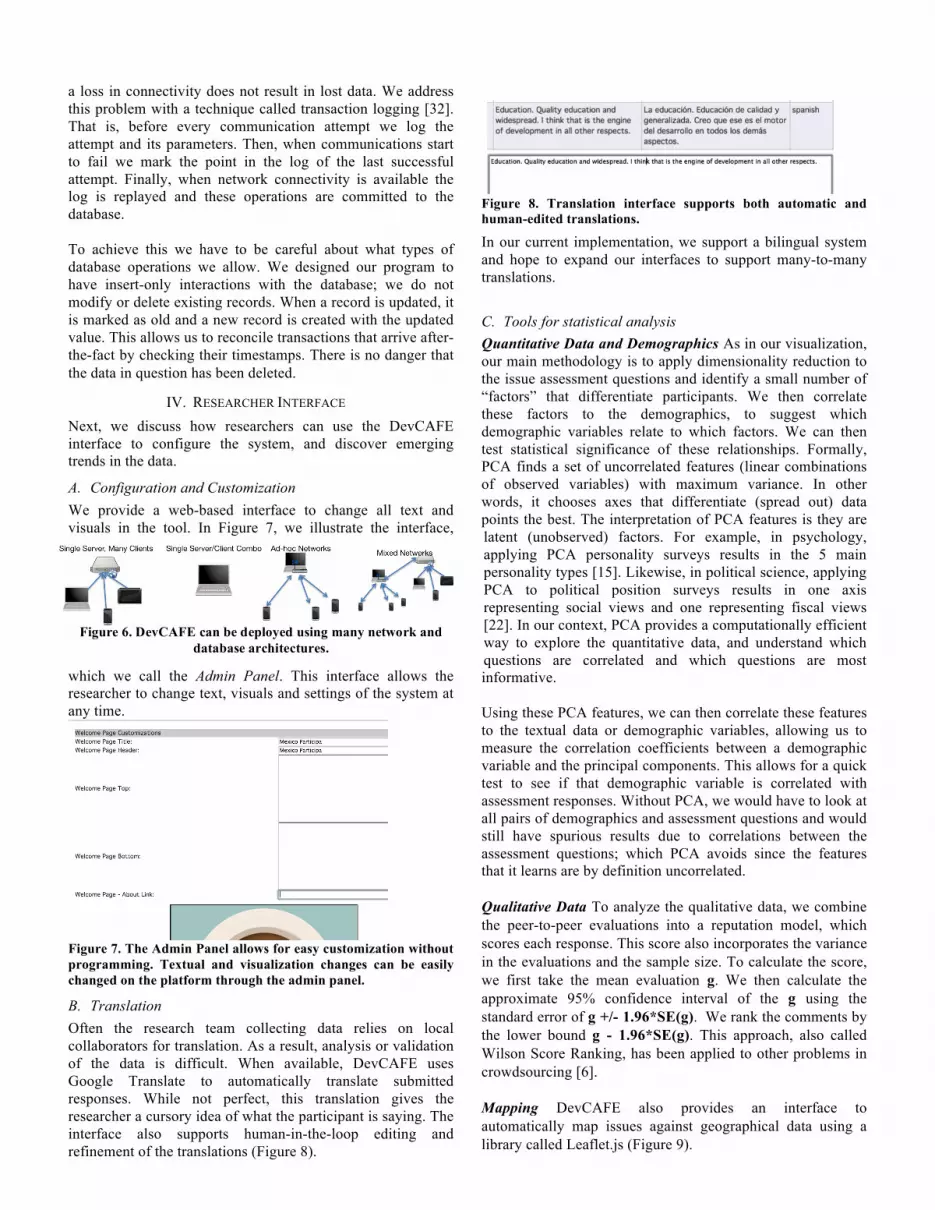
F. Other Cultural Adaptations Participants may have varying levels of numerical and textual literacy, and we have other adaptations to make the platform more accessible. When numerical scales are not feasible, we can use the design illustrated in Figure 5.
Figure 5. Graphical alternative to using a numerical scale for issue assessment and rating others’ suggestions. Participants can tap one of the icons to register their response. DevCAFE supports a wide variety of customizations that can adapt the platform to various cultural and development settings.
In future work, we are exploring supporting audio recordings of qualitative data.
G. Database and Network Architecture The architecture of DevCAFE is a client-server model. An HTML5 client communicates with a DevCAFE server. This server is a Django-based application, which can run both on internetworks and local area networks. For example, we can host the server on a public webserver and then the application can be visited from anywhere with network connectivity and any device with a browser. In contrast, we can also host the server on a laptop and access the application from any device on the laptop’s local network (including the laptop itself) without Internet access. DevCAFE can be deployed in mixed networks, combining local networks and communicating via the Internet. This is useful since field research may be conducted in a developing region with limited Internet access, but collaborators may be in developed countries with available connectivity. The same application deployed in the field can be hosted on the Internet and asynchronously updated with new field data.
In Figure 5, we illustrate the different network architectures supported by DevCAFE. One drawback to the interactive design of the application is what is sometimes referred to as “chattiness” of the communication protocol. Since we communicate with the server in many small transactions this can be inefficient when network latencies are large. We took many steps to combine small transactions into larger ones; however, we defer full treatment of this subject to future work.
Intermittent connectivity between the server and the client also poses a challenge for the database programming. We need to ensure that all data is eventually written to the server and that
Figure 3. The DevCAFE visualization can be adapted to many different cultural settings while preserving the same workflow. In this figure, we visualize participants’ ideas with different objects.
a loss in connectivity does not result in lost data. We address this problem with a technique called transaction logging [32]. That is, before every communication attempt we log the attempt and its parameters. Then, when communications start to fail we mark the point in the log of the last successful attempt. Finally, when network connectivity is available the log is replayed and these operations are committed to the database. To achieve this we have to be careful about what types of database operations we allow. We designed our program to have insert-only interactions with the database; we do not modify or delete existing records. When a record is updated, it is marked as old and a new record is created with the updated value. This allows us to reconcile transactions that arrive after-the-fact by checking their timestamps. There is no danger that the data in question has been deleted.
IV. RESEARCHER INTERFACE Next, we discuss how researchers can use the DevCAFE interface to configure the system, and discover emerging trends in the data.
A. Configuration and Customization We provide a web-based interface to change all text and visuals in the tool. In Figure 7, we illustrate the interface,
which we call the Admin Panel. This interface allows the researcher to change text, visuals and settings of the system at any time.
Figure 7. The Admin Panel allows for easy customization without programming. Textual and visualization changes can be easily changed on the platform through the admin panel.
B. Translation Often the research team collecting data relies on local collaborators for translation. As a result, analysis or validation of the data is difficult. When available, DevCAFE uses Google Translate to automatically translate submitted responses. While not perfect, this translation gives the researcher a cursory idea of what the participant is saying. The interface also supports human-in-the-loop editing and refinement of the translations (Figure 8).
Figure 8. Translation interface supports both automatic and human-edited translations.
In our current implementation, we support a bilingual system and hope to expand our interfaces to support many-to-many translations.
C. Tools for statistical analysis Quantitative Data and Demographics As in our visualization, our main methodology is to apply dimensionality reduction to the issue assessment questions and identify a small number of “factors” that differentiate participants. We then correlate these factors to the demographics, to suggest which demographic variables relate to which factors. We can then test statistical significance of these relationships. Formally, PCA finds a set of uncorrelated features (linear combinations of observed variables) with maximum variance. In other words, it chooses axes that differentiate (spread out) data points the best. The interpretation of PCA features is they are latent (unobserved) factors. For example, in psychology, applying PCA personality surveys results in the 5 main personality types [15]. Likewise, in political science, applying PCA to political position surveys results in one axis representing social views and one representing fiscal views [22]. In our context, PCA provides a computationally efficient way to explore the quantitative data, and understand which questions are correlated and which questions are most informative. Using these PCA features, we can then correlate these features to the textual data or demographic variables, allowing us to measure the correlation coefficients between a demographic variable and the principal components. This allows for a quick test to see if that demographic variable is correlated with assessment responses. Without PCA, we would have to look at all pairs of demographics and assessment questions and would still have spurious results due to correlations between the assessment questions; which PCA avoids since the features that it learns are by definition uncorrelated. Qualitative Data To analyze the qualitative data, we combine the peer-to-peer evaluations into a reputation model, which scores each response. This score also incorporates the variance in the evaluations and the sample size. To calculate the score, we first take the mean evaluation g. We then calculate the approximate 95% confidence interval of the g using the standard error of g +/- 1.96*SE(g). We rank the comments by the lower bound g - 1.96*SE(g). This approach, also called Wilson Score Ranking, has been applied to other problems in crowdsourcing [6]. Mapping DevCAFE also provides an interface to automatically map issues against geographical data using a library called Leaflet.js (Figure 9).
Figure 6. DevCAFE can be deployed using many network and database architectures.
V. CASE STUDY AND RESULTS In the case studies, we describe the results from our statistical analysis methodology applied to data collected through DevCAFE. Our goal is to illustrate that the data collected from the platform gives qualitative and quantitative insight into how participants perceive development interventions. For both the case studies, we list the PCA factors, how these correlate with demographics, and insightful qualitative responses based on our reputation model.
A. Uganda Case Study From June 16th through June 19th, 2014, a member of our team conducted a series of interviews with 137 women at Nutrition Education Centers (Centers) in the Kamuli District, Uganda using the DevCAFE software. The Centers provide daily nutrient-dense meals to mothers and children and trainings in health and sanitation, family planning, agricultural productivity, and income-generating activities [42]. The effectiveness of humanitarian interventions has been studied in the Kamuli District [27]. This work has largely focused on improved agricultural practices and how skills training can improve economic outcomes in the region. Recently, the Centers highlighted maternal health as a key priority thus introducing family planning training for women in the region [42]. In this project, we used DevCAFE to collect collaborative feedback on the quality of the family planning trainings offered at the Centers and to understand the relationships between demographic variables and the opinions of the participants toward family planning methods. The participants came from four parishes in the Kamuli District. A researcher on our team installed the software on an Apple MacBook Air and collected data through DevCAFE on the laptop with the assistance of a translator conversant in English and the local language, Lusoga.
1) Factor Analysis With PCA DevCAFE extracted the top two latent factors with PCA. In Table 1, we show the first two principal components. The first principal component represents questions relating to the participants’ level of autonomy: monetary autonomy, support of family planning methods and degree she can openly discuss family planning with her husband. The questions most aligned with the second component, fear of 3 types of birth control: injection, intrauterine coil and oral contraceptive. For each participant, there are two scores: one for the autonomy factor and one for the fear factor. This is a linear combination of the quantitative responses based on the weights below. These
scores can tell us a lot about the participants. For example, a high household factor score indicates autonomy and support for family planning at home, but a high fears score indicates reservations about different contraceptive methods. We can use these scores to test correlations between demographic variables and user responses. By finding these scores automatically, we significantly help researchers find trends in new data sources where they may not have intuition on differentiating factors. Table 1. Weights on PCA Factors. Factor 1 is most aligned with
Autonomy and Factor 2 is most aligned with Fears. Issue Factor 1 (Autonomy) Factor 2 (Fears)
Decision Autonomy 0.354 0.001
Husband Support 0.287 -0.092
Open Discussion 0.451 -0.006
Fear Contraceptive Pill -0.012 0.564
Fear Intrauterine Device 0.078 0.641
Fear Injection -0.102 0.402
2) Correlating Demographics With Factors Statistical analysis enabled through DevCAFE revealed the following insights: (1) Openness and autonomy in the household were strongly correlated with age; implying that older women tended to make more of the household monetary decisions and were more open in discussing family planning with their husbands (r=0.198, p<0.001). (2) The center that the participant visited was very predictive of fears of contraceptive methods. For example, those who visited the Naluwoli Center were less likely to indicate fears of any specific contraceptive method (r=0.254, p<0.001). The Naluwoli Center is the longest-running Nutrition Education Center in the district. Due to its longer presence in the community, the Center has likely established credibility within the community.
3) Insightful Responses Due to literacy and language barriers, participants were unable to evaluate the importance of others’ responses on the platform. The following textual responses were chosen based on their prevalence and novelty compared to all other suggestions. “It is important to mobilize husbands to also attend family planning trainings.” “We need a water borehole at the Center. We travel too far to get water for the Center.” “We walk too far to get to the Center. More Centers should be opened.”
4) Results As a result of the feedback enabled through DevCAFE, the Nutrition Education Centers have implemented priority changes to increase the effectiveness of its programs in the Kamuli District. First, the number of Centers has increased from 3 to 8 to decrease the amount of time participants must travel to attend trainings. Second, the Centers have invested in the construction of water boreholes at the Centers to reduce time spent collecting water. Third, one of the Centers will serve as a test location for the inclusion of men in family planning trainings.
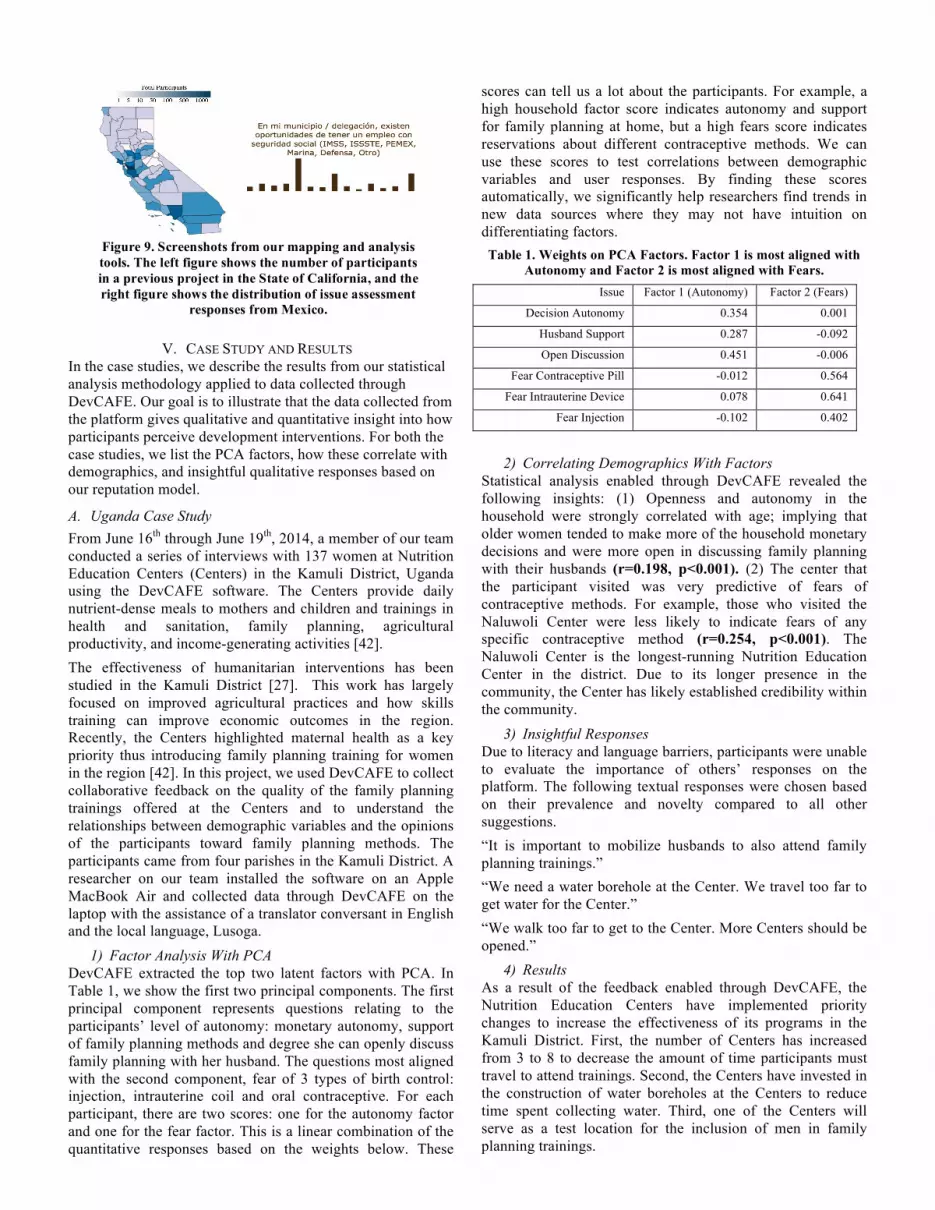
Figure 9. Screenshots from our mapping and analysis tools. The left figure shows the number of participants in a previous project in the State of California, and the right figure shows the distribution of issue assessment
responses from Mexico.
B. Mexico Case Study In preparation for the June 2015 mid-term elections in Mexico, México Participa (http://mxparticipa.org) was launched in mid-April 2015 in collaboration with the Mexico National Electoral Institute to allow participants to share their opinions and priorities with fellow citizens and the leaders who represent them. Participants were asked to rate the country’s performance on timely issues, including: corruption, public safety, educational opportunities, formal employment, public health services, and presence of violence. Participants also suggested an issue that deserves increased national priority and rated the suggestions of others, offering candidates and incumbents timely feedback on the changing priorities of their constituents. México Participa had 2,267 participants who assigned over 18,000 grades and provided over 14,000 peer-to-peer ratings. Participants accessed México Participa through their personal computer or smartphone.
1) Factor Analysis With PCA In Table 2, we show the top two factors that differentiate participants. These results illustrate the correlation structure of the data can result in very different latent factors that are not necessarily aligned to single questions. For the first factor all of the weights are positive. We phrased the questions such that a high score rating implies a positive assessment of the Mexican government. Thus, this factor corresponds to general “satisfaction” with the government’s performance. Participants whose PCA scores are higher on the first axis are, in general, more satisfied with the government. The second factor assigns a positive weight to Social Security, Public Education, and Health while negative weights to the questions about Security, Violence and Corruption. This factor illustrates a separation between social services and public safety. Upon further investigation, there are many participants who are satisfied with the government’s progress on social services but dissatisfied with government progress on public safety and corruption. Table 2. PCA Factors for México Participa. Factor 1 corresponds to general satisfaction with the government's progress and factor 2 shows a separation between social service performance and public safety.
Issue Factor 1 (Satisfaction)
Factor 2 (Social Services vs. Safety)
Social Security 0.307 -0.525
Public Education 0.368 -0.436
Public Health 0.390 -0.341
Security 0.472 0.156
Violence 0.453 0.333
Corruption 0.434 0.530
2) Correlating Demographics With Factors
We found a significant negative correlation between participant Age and Satisfaction (r = -0.112, p<0.001). Older participants provided more negative assessments about the Mexican government in general.
3) Insightful Responses We collected 14,033 peer-to-peer ratings on 336 submitted ideas on what participants feel are the most important problems facing Mexico. We highlight the two highest-rated participant responses (translated): “There are three problems that the government of Mexico needs to urgently fully resolve: corruption, insecurity and education” “The National Anti-Corruption System bureaucracy will only grow, need many resources and attack the causes of corruption among public officials.”
4) Results Feedback gathered through México Participa was shared with newly elected leaders and incumbents through the Mexico National Electoral Institute. Across Mexico, participants expressed the need for increased government efforts to mitigate causes of corruption, strengthen public safety and security, and improve education for youth. These insights will be used by elected leaders to inform policy decisions.
VI. CONCLUSION DevCAFE is a new assessment platform that can directly engage citizens and communities from developing regions to collectively assess conditions, needs and outcomes related to development engineering in fields such as democracy, governance, and global public health. We evaluated our new experimental platform, DevCAFE, in pilot projects in Uganda and Mexico. Our data suggests that the tool extracts meaningful qualitative and quantitative insights about development interventions.
In future work, we are developing visual- and voice-based interfaces for DevCAFE. Rather than suggesting a textual comment, participants will audio record their response. In a related project in the United States, we used Google Voice and integrated a phone-in system for participants to respond to open-ended suggestions. While we have developed our software on HTML5, we are interested in more tightly integrating with mobile-specific features such as GPS and the camera. Location information and images provide data that can greatly enhance assessment of humanitarian interventions.
This work was supported by the Blum Center for Developing Economies and the Development Impact Lab (USAID Cooperative Agreement AID-OAA-A-12-00011), part of the USAID Higher Education Solutions Network; UC Berkeley’s Algorithms, Machines, and People Lab; and the UC CITRIS Data and Democracy Initiative. We wish to thank Temina Madon and Heather Lofthouse for their feedback and guidance on the development of DevCAFE.
REFERENCES [1] Ken Banks and Erik Hersman. Frontlinesms and ushahidi-a demo. In Information and Communication Technologies and Development (ICTD), 2009 International Conference on, pages 484–484. IEEE, 2009. [2] Inka Barnett and Jose V Gallegos. Using mobile phones for nutrition surveillance: A review of evidence. 2013. [3] Olivier Barnich and Marc Van Droogenbroeck. Vibe: A universal background subtraction algorithm for video sequences. Image Processing, IEEE Transactions on, 20(6):1709–1724, 2011. [4] Michael W Berry and Malu Castellanos. Survey of text mining. Computing Reviews, 45(9):548, 2004.
[5] Benjamin Birnbaum, Brian DeRenzi, Abraham D Flaxman, and Neal Lesh. Automated quality control for mobile data collection. In Proceedings of the 2nd ACM Symposium on Computing for Development, page 1. ACM, 2012. [6] Lawrence D Brown, T Tony Cai, and Anirban DasGupta. Interval estimation for a binomial proportion. Statistical Science, pages 101–117, 2001. [7] Waylon Brunette, Rita Sodt, Rohit Chaudhri, Mayank Goel, Michael Falcone, Jaylen Van Orden, and Gaetano Borriello. Open data kit sensors: a sensor integration framework for android at the applicationlevel. In Proceedings of the 10th international conference on Mobile systems, applications, and services, pages 351–364. ACM, 2012. [8] Waylon Brunette, Mitchell Sundt, Nicola Dell, Rohit Chaudhri, Nathan Breit, and Gaetano Borriello. Open data kit 2.0: expanding and refining information services for developing regions. In Proceedings of the 14th Workshop on Mobile Computing Systems and Applications, page 10. ACM, 2013. [9] Kuang Chen, Akshay Kannan, Yoriyasu Yano, Joseph M Hellerstein, and Tapan S Parikh. Shreddr: pipelined paper digitization for low-resource organizations. In Proceedings of the 2nd ACM Symposium on Computing for Development, page 3. ACM, 2012. [10] Xi Chen, Paul N Bennett, Kevyn Collins-Thompson, and Eric Horvitz. Pairwise ranking aggregation in a crowdsourced setting. In Proceedings of the sixth ACM international conference on Web search and data mining, pages 193–202. ACM, 2013. [11] Nilesh Dalvi, Anirban Dasgupta, Ravi Kumar, and Vibhor Rastogi. Aggregating crowdsourced binary ratings. In Proceedings of the 22nd international conference on World Wide Web, pages 285–294. International World Wide Web Conferences Steering Committee, 2013. [12] Scott C. Deerwester, Susan T Dumais, Thomas K. Landauer, George W. Furnas, and Richard A. Harshman. Indexing by latent semantic analysis. JASIS, 41(6):391–407, 1990. [13] Nicola Dell, Nathan Breit, Timóteo Chaluco, Jessica Crawford, and Gaetano Borriello. Digitizing paper forms with mobile imaging technologies. In Proceedings of the 2nd ACM Symposium on Computing for Development, page 2. ACM, 2012. [14] Sebastian Deterding, Miguel Sicart, Lennart Nacke, Kenton O’Hara, and Dan Dixon. Gamification. using game-design elements in non-gaming contexts. In CHI’11 Extended Abstracts on Human Factors in Computing Systems, pages 2425–2428. ACM, 2011. [15] John M Digman. Personality structure: Emergence of the five-factor model. Annual review of psychology, 41(1):417–440, 1990. [16] Marisol Estrella and John Gaventa. Who counts reality?: Participatory monitoring and evaluation: a literature review. Institute of Development Studies Brighton, 1998. [17] Siamak Faridani, Ephrat Bitton, Kimiko Ryokai, and Ken Goldberg. Opinion space: a scalable tool for browsing online comments. In Proceedings of the SIGCHI Conference on Human Factors in Computing Systems, pages 1175–1184. ACM, 2010. [18] Anne Marie Goetz and Rob Jenkins. Hybrid forms of accountability: citizen engagement in institutions of public-sector oversight in india. Public Management Review, 3(3):363–383, 2001. [19] Phillip Good. Permutation tests. Springer, 2000. [20] Irene Guijt, Mae Arevalo, and Kiko Saladores. Participatory monitoring and evaluation. PLA Notes 31: Participatory Monitoring and Evaluation, page 28, 1998. [21] Carl Hartung, Adam Lerer, Yaw Anokwa, Clint Tseng, Waylon Brunette, and Gaetano Borriello. Open data kit: Tools to build information services for developing regions. In Proceedings of the 4th ACM/IEEE International Conference on Information and Communication Technologies and Development, page 18. ACM, 2010. [22] Marc Helbling and Anke Tresch. Measuring party positions and issue salience from media coverage: Discussing and cross-validating new indicators. Electoral Studies, 30(1):174–183, 2011. [23] GOLD Judy, Harriet ANDREWS, Gabrielle APPLEFORD, Boni RAMANANTSOA, Odile HANITRINIAINA, Rostom DEIPARINE, and Nick CORBY. Using mobile phone text messages (sms) to collect health service data: Lessons from social franchises in kenya, madagascar and the
philippines. Journal of Health Informatics in Developing Countries, 6(2), 2012. [24] JH Jung, Christoph Schneider, and Joseph Valacich. Enhancing the motivational affordance of information systems: The effects of real-time performance feedback and goal setting in group collaboration environments. Management Science, 56(4):724–742, 2010. [25] Peter Kisaakye. Determinants of unmet need for contraception to space and limit births among various groups of currently married women in uganda. European Scientific Journal, 9(19), 2013. [26] Jody Zall Kusek and Ray C Rist. Ten steps to a results-based monitoring and evaluation system: a handbook for development practitioners. World Bank Publications, 2004. [27] Brandie L. Martin and Eric Abbott. Mobile phones and rural livelihoods: Diffusion, uses, and perceived impacts among farmers in rural uganda. Information Technologies & International Development, 7(4):pp–17, 2011. [28] Fidele Ngabo, Judith Nguimfack, Friday Nwaigwe, Catherine Mugeni, Denis Muhoza, David R Wilson, John Kalach, Richard Gakuba, Corrine Karema, and Agnes Binagwaho. Designing and implementing an innovative sms-based alert system (rapidsms-mch) to monitor pregnancy and reduce maternal and child deaths in rwanda. The Pan African Medical Journal, 13, 2012. [29] Sukhada Palkar and Emma Brunskill. Analysis of the impact of errors made during health data collection using mobile phones: exploring error modeling and automatic diagnosis. In Proceedings of the 3rd ACM Symposium on Computing for Development, page 24. ACM, 2013. [30] Somani Patnaik, Emma Brunskill, and William Thies. Evaluating the accuracy of data collection on mobile phones: A study of forms, sms, and voice. In Information and Communication Technologies and Development (ICTD), 2009 International Conference on, pages 74–84. IEEE, 2009. [31] Samuel Paul. Making voice work: the report card on Bangalore’s public services, volume 1921. World Bank Publications, 1998. [32] Raghu Ramakrishnan, Johannes Gehrke, and Johannes Gehrke. Database management systems, volume 3. McGraw-Hill New York, 2003. [33] Al M Rashid, Kimberly Ling, Regina D Tassone, Paul Resnick, Robert Kraut, and John Riedl. Motivating participation by displaying the value of contribution. In Proceedings of the SIGCHI conference on Human Factors in computing systems, pages 955–958. ACM, 2006. [34] Adikeshavalu Ravindra. An assessment of the impact of bangalore citizen report cards on the performance of public agencies. Evaluation Capacity Development Working Paper, 12, 2004. [35] Howard Rheingold. Using participatory media and public voice to encourage civic engagement. Civic life online: Learning how digital media can engage youth, pages 97–118, 2008. [36] John Rice. Mathematical statistics and data analysis. Cengage Learning, 2006. [37] Ognjen Scekic, Hong-Linh Truong, and Schahram Dustdar. Incentives and rewarding in social computing. Communications of the ACM, 56(6):72–82, 2013. [38] KateWellard, Jenny Rafanomezana, Mahara Nyirenda, Misaki Okotel, and Vincent Subbey. A review of community extension approaches to innovation for improved livelihoods in ghana, uganda and malawi. The Journal of Agricultural Education and Extension, 19(1):21–35, 2013. [39] William Foote Ed Whyte. Participatory action research. 1991. [40] Gebremariam Woldemicael and Roderic Beaujot. Currently married women with an unmet need for contraception in eritrea: Profile and determinants. Canadian Studies in Population, 38(1 2):61–81, 1944. [41] Jun Zhang, Yong Yan, and Martin Lades. Face recognition: eigenface, elastic matching, and neural nets. Proceedings of the IEEE, 85(9):1423–1435, 1997 [42] Center for Sustainable Rural Livelihoods, Iowa State University. Improved nutrition, stable incomes, and hope for the future: Donor impact report. 2014