This article was downloaded by: [Faculty of natural sciences & mathematic], [Margareta Pecovska-Gjorgjevich] On: 11 March 2013, At: 03:06 Publisher: Taylor & Francis Informa Ltd Registered in England and Wales Registered Number: 1072954 Registered office: Mortimer House, 37-41 Mortimer Street, London W1T 3JH, UK Physics and Chemistry of Liquids: An International Journal Publication details, including instructions for authors and subscription information: http://www.tandfonline.com/loi/gpch20 Dielectric relaxation and ac conductivity study of calcite and dolomite aqueous solutions Margareta Pecovska-Gjorgjevich a , Julijana Velevska a & Aleksandar Andonovski a a Faculty of Sciences and Mathematics, Sts Cyril and Methodius University, Skopje, Republic of Macedonia Version of record first published: 30 Aug 2012. To cite this article: Margareta Pecovska-Gjorgjevich , Julijana Velevska & Aleksandar Andonovski (2013): Dielectric relaxation and ac conductivity study of calcite and dolomite aqueous solutions, Physics and Chemistry of Liquids: An International Journal, 51:2, 162-181 To link to this article: http://dx.doi.org/10.1080/00319104.2012.708874 PLEASE SCROLL DOWN FOR ARTICLE Full terms and conditions of use: http://www.tandfonline.com/page/terms-and- conditions This article may be used for research, teaching, and private study purposes. Any substantial or systematic reproduction, redistribution, reselling, loan, sub-licensing, systematic supply, or distribution in any form to anyone is expressly forbidden. The publisher does not give any warranty express or implied or make any representation that the contents will be complete or accurate or up to date. The accuracy of any instructions, formulae, and drug doses should be independently verified with primary sources. The publisher shall not be liable for any loss, actions, claims, proceedings, demand, or costs or damages whatsoever or howsoever caused arising directly or indirectly in connection with or arising out of the use of this material.
Transcript
This article was downloaded by: [Faculty of natural sciences & mathematic], [MargaretaPecovska-Gjorgjevich]On: 11 March 2013, At: 03:06Publisher: Taylor & FrancisInforma Ltd Registered in England and Wales Registered Number: 1072954 Registeredoffice: Mortimer House, 37-41 Mortimer Street, London W1T 3JH, UK
Physics and Chemistry of Liquids: AnInternational JournalPublication details, including instructions for authors andsubscription information:http://www.tandfonline.com/loi/gpch20
Dielectric relaxation and acconductivity study of calcite anddolomite aqueous solutionsMargareta Pecovska-Gjorgjevich a , Julijana Velevska a &Aleksandar Andonovski aa Faculty of Sciences and Mathematics, Sts Cyril and MethodiusUniversity, Skopje, Republic of MacedoniaVersion of record first published: 30 Aug 2012.
To cite this article: Margareta Pecovska-Gjorgjevich , Julijana Velevska & Aleksandar Andonovski(2013): Dielectric relaxation and ac conductivity study of calcite and dolomite aqueous solutions,Physics and Chemistry of Liquids: An International Journal, 51:2, 162-181
To link to this article: http://dx.doi.org/10.1080/00319104.2012.708874
PLEASE SCROLL DOWN FOR ARTICLE
Full terms and conditions of use: http://www.tandfonline.com/page/terms-and-conditions
This article may be used for research, teaching, and private study purposes. Anysubstantial or systematic reproduction, redistribution, reselling, loan, sub-licensing,systematic supply, or distribution in any form to anyone is expressly forbidden.
The publisher does not give any warranty express or implied or make any representationthat the contents will be complete or accurate or up to date. The accuracy of anyinstructions, formulae, and drug doses should be independently verified with primarysources. The publisher shall not be liable for any loss, actions, claims, proceedings,demand, or costs or damages whatsoever or howsoever caused arising directly orindirectly in connection with or arising out of the use of this material.
Faculty of Sciences and Mathematics, Sts Cyril and Methodius University,Skopje, Republic of Macedonia
(Received 10 January 2012; final version received 16 June 2012)
Dielectric and electric behaviour of calcite and dolomite aqueous solutionswere investigated using dielectric spectroscopy and electric modulusformalism. The electrode polarisation influence was observed in the low-frequency region. The influence of including grain-size (5 mm, 10mm and20mm) concentration (5� 10�5–10�2 g L�1) and temperature (295–313K)to dielectric constant, electric modulus and conductivity was established.The Cole–Cole plot showed only one suppressed semicircle with centrebelow the x-axis, whose diameter changes with the grain diameter size ortemperature, confirming one relaxation non-Debye process. The activationenergies of conduction processes were calculated. Using the Jonscher powerlaw, we obtained pre-factor A and exponent n.
Keywords: calcite; dolomite; dielectric spectra; electric modulus;conductivity
1. Introduction
Calcite (CaCO3) has wide use in the paper, rubber, dyes and polish industry, and alsofor the protection of flora in the cosmetic and pharmaceutical industries, as foranimal food. Its solubility, crystal morphology, structural, electric and opticalproperties are very well investigated [1–7]. Because of the presence of magnesium,dolomite (CaMg(CO3)2) is not used in food industry but only for buildingconstruction, dyes and polish industries. Both materials can also be used aspotential electrorheological materials which can fulfil the requirements as lowconductivity, fast response time, large field-induced yield stress needed for industrialapplication in different devices. Calcite electrorheological (ER) behaviour is alreadyinvestigated [8] in order to obtain its colloidal stability and ER activity. Due todielectric difference between the dispersed and continuous phases, the particles arepolarised in an electric field, increasing the force between neighbouring particles andforming an ER active structure [9].
The most common enhancer of the ER activity is water. It has a polar solventmolecule and its dipole moment is free to rotate in the presence of an electric field.In a layer of water close to the electrode interface, there will be a net dipolar
orientation and the water will not exhibit its normal dielectric constant, which isconfirmed in our measurements with a lower value than the one from the literature.Calcite is a non-polar material. An aqueous solution of calcite can therefore betreated as a binary mixture, because the two molecular species (calcite or dolomiteand water) do not interact strongly. This solution forms hydrated ions that are notable to approach indefinitely close to the interface, and a monolayer of charge withdistance dependent on the size of the hydrated ion will exist. The interface willbehave as two capacitors in series: inner (Stern) and outer diffuse layers [10].
In order to understand the electrical behaviour of the materials, ac technique isapplied to measure dielectric characteristics and conductivity over a range offrequencies. The ac voltage minimises the polarisation of the electrodes in the cellfilled with the dielectric characteristics. Using the dielectric spectroscopy method,which is also inexpensive and easily applicable, unlike other expensive and complexmeasuring techniques, we can study the dielectric relaxation processes. Also, fromdielectric studies we can obtain bulk conductivity, ionic transport properties, ionicand molecular interaction in the solution, double-layer formation at the electrode/electrolyte interface, etc. The behaviour of ion transport depends on the dissociationof the solvent, its concentration, dielectric constant of the soluble substance anddegree of ion aggregation [11,12]. Because of this characteristic, dielectric spectros-copy has become a powerful technique for characterising the dielectric and electricalproperties of the materials, their interfaces with electrodes and defining the dynamicproperties of the materials. By recording the dielectric relaxation, we can supply theinformation for orientation polarisability, connected to the magnitude of the dipolemoment and a relaxation time of the structural particles (connected with thedimensions of the structural particles). Orientation polarisability is a slow processwith long relaxation time and takes place in a low-frequency range, but cannot beobserved in a high-frequency interval where atomic and electron polarisation exist,(!� 1/�). Dipole polarisation leads to energy absorption from electric field anddielectric losses.
In heterogeneous systems, like the solution of water and calcite/dolomiteinvestigated here, the ion association is directly related to the presence of dipolesdue to solvent dipole/ion pairs. The dielectric relaxation and frequency-dependentconductivity are both sensitive to themotion of charged species and dipoles of solution[13]. Regarding the above-mentioned system, this article reports dielectric behaviourand electrical conductivity analysis of CaCO3/H2O and CaMg(CO3)2/H2O systemsusing dielectric spectroscopy. The effect of calcite/dolomite concentration and grainsize on frequency-dependent dielectric properties and conductivity has been investi-gated in order to understand the ion transport behaviour of the solution.
The sample that exhibits the most pronounced characteristics is used for furtherinvestigation of the temperature dependence of dielectric and electric characteristics.
2. Theory
2.1. Complex dielectric spectra
The complex dielectric permittivity "* is given by [14,15]
where "0 and "00 are the real and imaginary parts of complex permittivity. The realpart of the complex permittivity or the dielectric constant, "0, is calculated from ameasured capacitance value from the relation:
"0 ¼C
C0¼
C � d
"0Sð2Þ
where C0 is the capacitance of the empty cell with an area of the electrodes S andthickness of the cell d, and C is the capacitance of the capacitor filled with thesolution. The imaginary part of the complex permittivity "00 is the dielectric lossdefined by "00 ¼ "0 � tan �, where tan � is a dielectric loss factor. Common dependenceof the dielectrics shows "0 with high values at low frequencies and if dispersion withincreasing frequency is observed, it passes an inflection at !¼ 1/� (!¼ 2�f�angularfrequency of the applied electric field, ��relaxation time), while at higher frequenciesit becomes asymptotic to "1. Frequency dependence of imaginary part of "* showsthe changes which exhibit a maximum at !�¼ 1, where oscillating charges arecoupled with the oscillating field and absorb a maximum electrical energy. If weobserve dielectric dispersion with single relaxation time, the complex permittivityexhibits a symmetric Debye behaviour and can be described with the Debyeequation:
"� !ð Þ ¼ "0 !ð Þ � i"00 !ð Þ ¼ "1 þ"s � "11þ i!�
ð3Þ
where "s and "1 are the low- and high-frequency values of the dielectric constant.If a non-Debye behaviour is observed, we can describe this response using the
Cole-Cole equation [16]:
"� ¼ "� !ð Þ þ"s � "1
1þ i!�ð Þ1��
ð4Þ
the Davidson-Cole equation [17]:
"� ¼ "� !ð Þ þ"s � "1
1þ i!�ð Þ�
ð5Þ
or the empirical expression proposed by Havriliak-Negami [18], which assumes thefollowing relaxation time distribution:
"� !ð Þ ¼ "0 !ð Þ � i"00 !ð Þ ¼ "1 þ"s � "1
1þ i!�ð Þ1��ð Þ
� �� ð6Þ
with "1, "s and � same as for (3); � and � are empirical parameters used to measurethe difference from an ideal Debye response for which �¼ 0, �¼ 1.
Here we used the Cole–Cole plot to observe the changes in dielectric properties ofthe solutions involved.
2.2. Electric modulus
We superimposed the electric modulus M* representation to complex dielectricpermittivity "* representation, in order to distinguish local dielectric relaxation (e.g.dielectric reorientation) from long-range electrical conductivity. For that purpose,
M. Pecovska-Gjorgjevich et al.164
Dow
nloa
ded
by [
Facu
lty o
f na
tura
l sci
ence
s &
mat
hem
atic
], [
Mar
gare
ta P
ecov
ska-
Gjo
rgje
vich
] at
03:
06 1
1 M
arch
201
3
we used complex electric modulus formalism introduced by Macedo [19]. Electricmodulus is a reciprocal of the complex permittivity M*¼ 1/"* and enables us tosuppress the polarisation effects at the electrode/electrolyte interface and representsthe real electrical relaxation process in the materials in the bulk, which can beexpressed as
M� !ð Þ ¼1
"�¼M0 þ iM00 ¼M1 1�
Z 10
�d� tð Þ
dt
� �e�i!tdt
� �ð7Þ
where M1 ¼ "1ð Þ�1 is the asymptotic value of M0(!) and �(t) is the time evolution
of the electric field within the material [20,21]. Real and imaginary parts of thecomplex electric modulus can be calculated from Equations (8) and (9) [22,23]:
M0 ¼"0 !ð Þ
"02 !ð Þ þ "002 !ð Þð8Þ
M00 ¼"00 !ð Þ
"02 !ð Þ þ "002 !ð Þð9Þ
The imaginary part M00 does not include a contribution from the electrode effect.For pure conduction process a relaxation peak would be observed in the frequencyspectra of the imaginary part of the complex electric modulus M00, and no peakwould be observed at the "00 plot. If we have a dielectric relaxation process, therelaxation peak appears at both M* and "* representations [24,25]. Showing thedependence of the imaginary part M00 from the real part M0 of the complex modulus(the Cole–Cole mode), we obtain the semicircle intersecting the real axis at 0 and 1="s("s – static dielectric constant), representing the Debye curve with a single relaxationtime. The maximum in the frequency dependence of M00 defines a single relaxationtime with !�¼ 1.
2.3. Conductivity
If all the dielectric loss is due to conductivity of the dielectric material, the bulkconductivity can be calculated from [26]
�0 ¼ !C tan � �d
S¼ !"0"
00 ð10Þ
If the conductivity comes from the Ohmic resistance without any relaxationprocesses, it is calculated from the conductance G by the following equation:
�00 ¼ G �d
Sð11Þ
where d is the thickness of the dielectric (gap between the electrodes) and S is theelectrode area.
Here we calculated total conductivity from admittance measurements:(Y¼Gþ iB¼ 1/Rþ i!C), where B is a susceptance:
�tot ¼ Y �d
S¼ �0 þ i�00 ð12Þ
165Physics and Chemistry of Liquids
Dow
nloa
ded
by [
Facu
lty o
f na
tura
l sci
ence
s &
mat
hem
atic
], [
Mar
gare
ta P
ecov
ska-
Gjo
rgje
vich
] at
03:
06 1
1 M
arch
201
3
In the frequency dependence of conductivity, three regions are observed. The firstone (increasing � with frequency) is connected to the electrode polarisation effect, thesecond part with almost horizontal dependence (plateau) presents the dc conductivityand the third (linear dependence of � with frequency) shows the bulk ac conductivity.The dependence of the conductivity, without the part coming from electrodepolarisation in the low-frequency region, is fitted to the so-called universal dynamicresponse or the Jonscher power law [27,28]:
�! ¼ �0 þ A!n ð13Þ
where �! is the total ac conductivity at certain angular frequency of the applied field!, �0 is the dc conductivity, A is the pre-exponential constant and n is the power lawexponent where 0.65 n5 1.
The activation energies of conduction and dielectric relaxation processes can bedetermined from the temperature-dependent measurements [29,30]. The conductivitydata is fitted to the Arrenius equation:
� ¼ �0 exp �Eac
kBT
� �ð14Þ
where �0 is the pre-exponential factor and Eac, kB and T are the activation energy,Boltzman’s constant and absolute temperature, respectively. The activation energy iscalculated from the slope of the obtained linear fit when the data is plotted against1000/T of the investigated sample. Similar calculations are done for the extractingactivation energy of relaxation processes.
3. Experimental procedure
In this study, the dielectric behaviour of solutions from calcite (CaCO3) and dolomite(CaMg(CO3)2) grains, dispersed in a deionised aqueous medium (0.5M� cm) wasinvestigated. We considered a two-phase mixture, where one phase (water) iscontinuous and the second phase is randomly dispersed in the form of sphericalinclusions. Calcite and dolomite powders were kindly supplied by IGM VratnicaInd., and theirs compositions are given in Table 1.
The size of the grains was determined by Fraunhofer scattering using the laser(He–Ne) granulometer CILAS HR 850 B Alkatel (laser particle analyser). Theparticles were dispersed in izopropanol as a suspension fluid. Average effectiveparticle diameters were determined as 5 mm (97% – 4.89mm), 10 mm (97% – 9.71mm)and 20 mm (97% – 18.99 mm). The shape of the grains was confirmed by opticalmicroscopy to be spherical.
The solutions used for dielectric measurements were prepared with the dispersionof CaCO3 or CaMg(CO3)2 particles in deionised water and stirred at constanttemperature of 295K with concentration series from 5� 10�5 to 10�2 g L�1. Becauseof partial solubility of the material in water, we observed sedimentation stability ofthe solutions. The difference between the density of the continuous and dispersephase is the reason for sedimentation of the calcite (dolomite) particles in water. Wemeasured the time of sedimentation for different sizes of particles and for differentconcentrations. Lower concentration solutions did not show any sedimentationeffect, while ones with higher concentration exhibited the formation of sediment at
the bottom of the tubes in approximately 1 day. The sedimentation of solutions withsmaller grain size was lower than the one with bigger ones. That conclusion wasexpected, in accordance with the literature [14], i.e. the colloidal stability increaseswith the decrease in the particle size and particle concentration.
The solutions were mechanically stirred against sedimentation before eachmeasurement. Frequency-dependent dielectric characteristics were measured withHP 4192A Impedance Analyser, which operates in a range of 5Hz to 13MHz. Formeasuring capacitance, dielectric loss factor and conductance, we used HP 16 452 ALiquid Test Fixture with a pair of platinum electrodes with a diameter of 38mm anda fluid gap of 0.3mm, which contains 3.4mL of the suspension. The capacitor wasconnected to Impedance Analyser in parallel mode with four-contact system to avoidthe effect of parasitic currents. In order to eliminate the effect of stray capacitance ofall leads, before measurements, we performed the open circuit calibration of the cell.The applied oscillation voltage amplitude of the electric field was 1V. Themeasurements were performed in a temperature range of 295–313K with a step of3K. After every temperature was reached, we waited for 10min to obtain thermalequilibrium in the whole capacitor. We did not go at higher temperatures because ofthe possibility of water evaporation and change of concentration of solutions.Dielectric activity of all suspensions changing with the frequency of the appliedelectric field, temperature, concentration or size of the particles used wasinvestigated.
4. Results and discussion
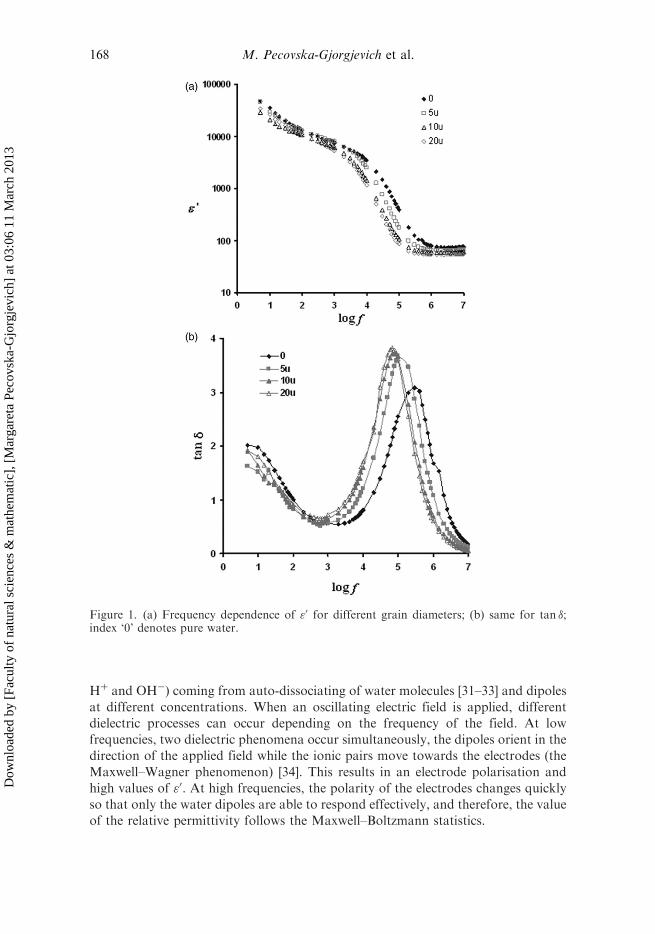
In the first part we investigated calcite/water solutions (CW). Figure 1(a) comparesthe variation of the real part of dielectric permittivity with the frequency of purewater and CW solutions with a concentration of 10�4 g L�1 for three values ofparticle diameters at room temperature. In all the cases, at low frequencies "0 has anenormous value (over 10,000) and it reduces with increasing frequency. At highfrequencies, near 1MHz, "0 becomes almost constant. This behaviour ischaracteristic for water and appears to be dominant in all solutions, indicatingthat the main behaviour of solutions comes from water with some contributions fromthe inclusions. Water can be seen as a system of two species: ions (ion pairs
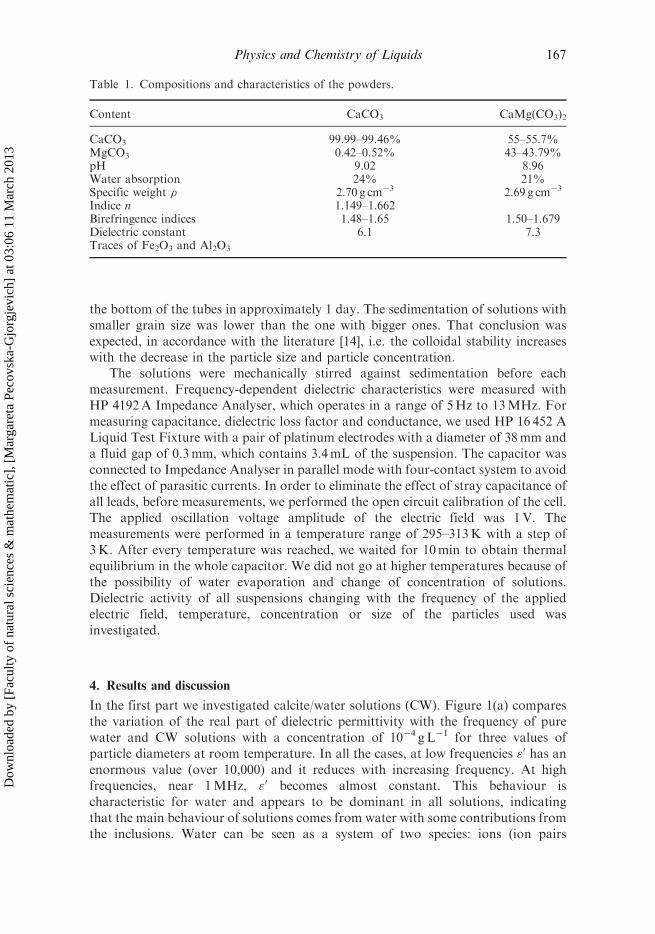
Table 1. Compositions and characteristics of the powders.
Content CaCO3 CaMg(CO3)2
CaCO3 99.99–99.46% 55–55.7%MgCO3 0.42–0.52% 43–43.79%pH 9.02 8.96Water absorption 24% 21%Specific weight � 2.70 g cm�3 2.69 g cm�3
Indice n 1.149–1.662Birefringence indices 1.48–1.65 1.50–1.679Dielectric constant 6.1 7.3Traces of Fe2O3 and Al2O3
167Physics and Chemistry of Liquids
Dow
nloa
ded
by [
Facu
lty o
f na
tura
l sci
ence
s &
mat
hem
atic
], [
Mar
gare
ta P
ecov
ska-
Gjo
rgje
vich
] at
03:
06 1
1 M
arch
201
3
Hþ and OH�) coming from auto-dissociating of water molecules [31–33] and dipoles
at different concentrations. When an oscillating electric field is applied, different
dielectric processes can occur depending on the frequency of the field. At low
frequencies, two dielectric phenomena occur simultaneously, the dipoles orient in the
direction of the applied field while the ionic pairs move towards the electrodes (the
Maxwell–Wagner phenomenon) [34]. This results in an electrode polarisation and
high values of "0. At high frequencies, the polarity of the electrodes changes quickly
so that only the water dipoles are able to respond effectively, and therefore, the value
of the relative permittivity follows the Maxwell–Boltzmann statistics.
Figure 1. (a) Frequency dependence of "0 for different grain diameters; (b) same for tan �;index ‘0’ denotes pure water.
M. Pecovska-Gjorgjevich et al.168
Dow
nloa
ded
by [
Facu
lty o
f na
tura
l sci
ence
s &
mat
hem
atic
], [
Mar
gare
ta P
ecov
ska-
Gjo
rgje
vich
] at
03:
06 1
1 M
arch
201
3
The decrease of "0 with the increase in the frequency is commonly attributed tothe electrical relaxation processes, but we also know that in the same time theelectrode polarisation takes place, because water is known as a polar substance. Thematerial electrode interface polarisation superimposed with other relaxationprocesses at low frequencies. The grain diameter of the inclusions influences the "0
behaviour, which results in its decreasing value, suggesting that higher interactionbetween the water ions and the calcite particles takes place and the concentration ofions in the solution decreases. Since the inclusions are non-polar, they do notinfluence the value of "0 in the high-frequency region, which results in almost anunchanged dependence.
Figure 1(b) shows the dependence of tangent loss with the frequency for the samesamples. We observe peak appearing at a characteristic frequency suggesting thepresence of relaxing dipoles in the samples and another peak at low frequency�10Hz which confirms the presence of electrode polarisation. This peak decreaseswith increasing concentration, confirming the lowering of the electrode polarisationprocess because of the presence of calcite in the solution. The strength and frequencyof relaxation depend on the characteristic property of dipolar relaxation. The peakshifts towards the lower frequencies and increases its magnitude with increase in thesize of the calcite particle, which leads to increase in the relaxation time.
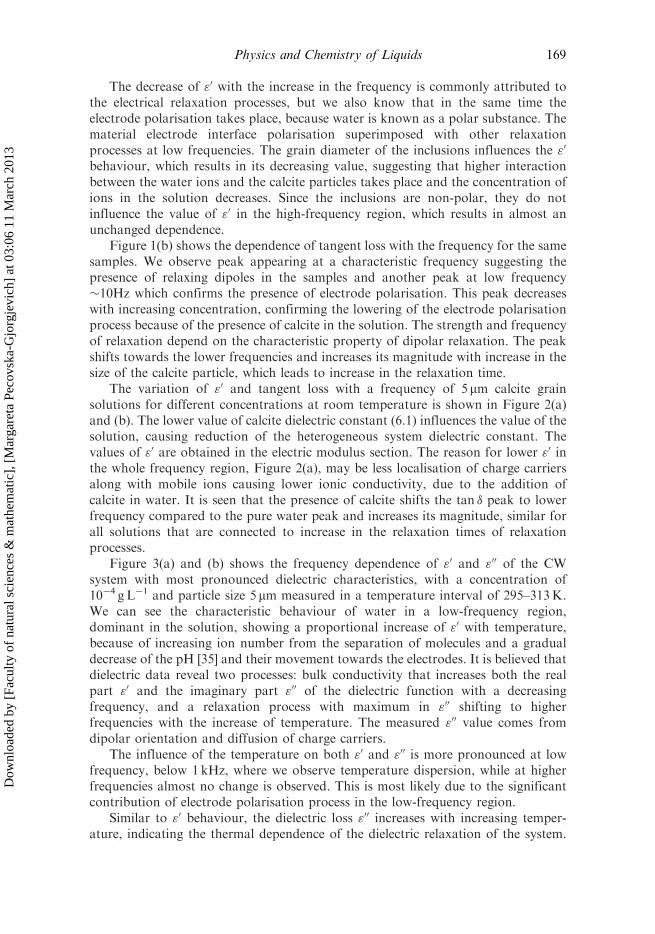
The variation of "0 and tangent loss with a frequency of 5 mm calcite grainsolutions for different concentrations at room temperature is shown in Figure 2(a)and (b). The lower value of calcite dielectric constant (6.1) influences the value of thesolution, causing reduction of the heterogeneous system dielectric constant. Thevalues of "0 are obtained in the electric modulus section. The reason for lower "0 inthe whole frequency region, Figure 2(a), may be less localisation of charge carriersalong with mobile ions causing lower ionic conductivity, due to the addition ofcalcite in water. It is seen that the presence of calcite shifts the tan � peak to lowerfrequency compared to the pure water peak and increases its magnitude, similar forall solutions that are connected to increase in the relaxation times of relaxationprocesses.
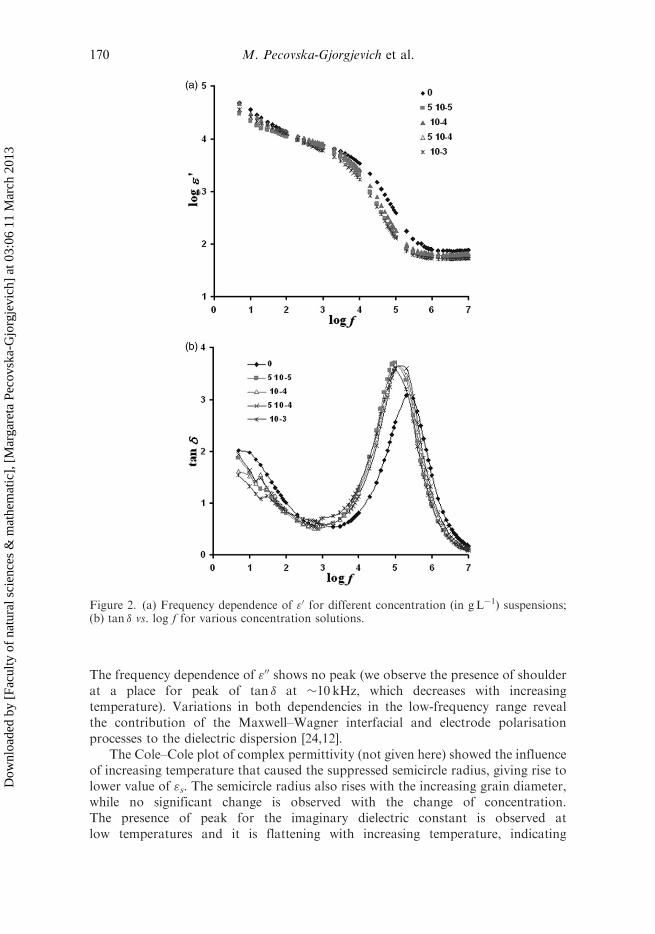
Figure 3(a) and (b) shows the frequency dependence of "0 and "00 of the CWsystem with most pronounced dielectric characteristics, with a concentration of10�4 g L�1 and particle size 5 mm measured in a temperature interval of 295–313K.We can see the characteristic behaviour of water in a low-frequency region,dominant in the solution, showing a proportional increase of "0 with temperature,because of increasing ion number from the separation of molecules and a gradualdecrease of the pH [35] and their movement towards the electrodes. It is believed thatdielectric data reveal two processes: bulk conductivity that increases both the realpart "0 and the imaginary part "00 of the dielectric function with a decreasingfrequency, and a relaxation process with maximum in "00 shifting to higherfrequencies with the increase of temperature. The measured "00 value comes fromdipolar orientation and diffusion of charge carriers.
The influence of the temperature on both "0 and "00 is more pronounced at lowfrequency, below 1 kHz, where we observe temperature dispersion, while at higherfrequencies almost no change is observed. This is most likely due to the significantcontribution of electrode polarisation process in the low-frequency region.
Similar to "0 behaviour, the dielectric loss "00 increases with increasing temper-ature, indicating the thermal dependence of the dielectric relaxation of the system.
169Physics and Chemistry of Liquids
Dow
nloa
ded
by [
Facu
lty o
f na
tura
l sci
ence
s &
mat
hem
atic
], [
Mar
gare
ta P
ecov
ska-
Gjo
rgje
vich
] at
03:
06 1
1 M
arch
201
3
The frequency dependence of "00 shows no peak (we observe the presence of shoulderat a place for peak of tan � at �10 kHz, which decreases with increasingtemperature). Variations in both dependencies in the low-frequency range revealthe contribution of the Maxwell–Wagner interfacial and electrode polarisationprocesses to the dielectric dispersion [24,12].
The Cole–Cole plot of complex permittivity (not given here) showed the influenceof increasing temperature that caused the suppressed semicircle radius, giving rise tolower value of "s. The semicircle radius also rises with the increasing grain diameter,while no significant change is observed with the change of concentration.The presence of peak for the imaginary dielectric constant is observed atlow temperatures and it is flattening with increasing temperature, indicating
Figure 2. (a) Frequency dependence of "0 for different concentration (in gL�1) suspensions;(b) tan � vs. log f for various concentration solutions.
M. Pecovska-Gjorgjevich et al.170
Dow
nloa
ded
by [
Facu
lty o
f na
tura
l sci
ence
s &
mat
hem
atic
], [
Mar
gare
ta P
ecov
ska-
Gjo
rgje
vich
] at
03:
06 1
1 M
arch
201
3
low-temperature dielectric relaxation process. Also "0 increases with temperature inthe low-frequency region, which is attributed to a conduction process that takesplace in the solution. In order to investigate this behaviour, we used electric modulusrepresentation to exclude the electrode polarisation effect and observe only bulkconductivity. Comparing both "* and M* representations, we can distinguishlocalised dielectric relaxation processes from long-range conductivity [17].
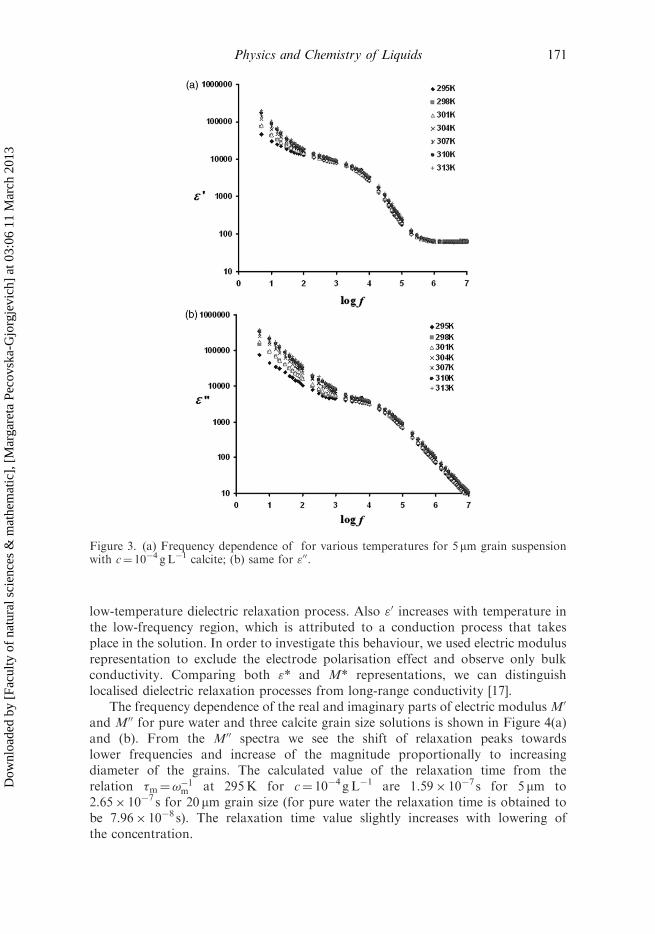
The frequency dependence of the real and imaginary parts of electric modulus M0
and M00 for pure water and three calcite grain size solutions is shown in Figure 4(a)and (b). From the M00 spectra we see the shift of relaxation peaks towardslower frequencies and increase of the magnitude proportionally to increasingdiameter of the grains. The calculated value of the relaxation time from therelation �m¼!
�1m at 295K for c¼ 10�4g L�1 are 1.59� 10�7 s for 5 mm to
2.65� 10�7 s for 20 mm grain size (for pure water the relaxation time is obtained tobe 7.96� 10�8 s). The relaxation time value slightly increases with lowering ofthe concentration.
Figure 3. (a) Frequency dependence of for various temperatures for 5mm grain suspensionwith c¼ 10�4 g L�1 calcite; (b) same for "00.
171Physics and Chemistry of Liquids
Dow
nloa
ded
by [
Facu
lty o
f na
tura
l sci
ence
s &
mat
hem
atic
], [
Mar
gare
ta P
ecov
ska-
Gjo
rgje
vich
] at
03:
06 1
1 M
arch
201
3
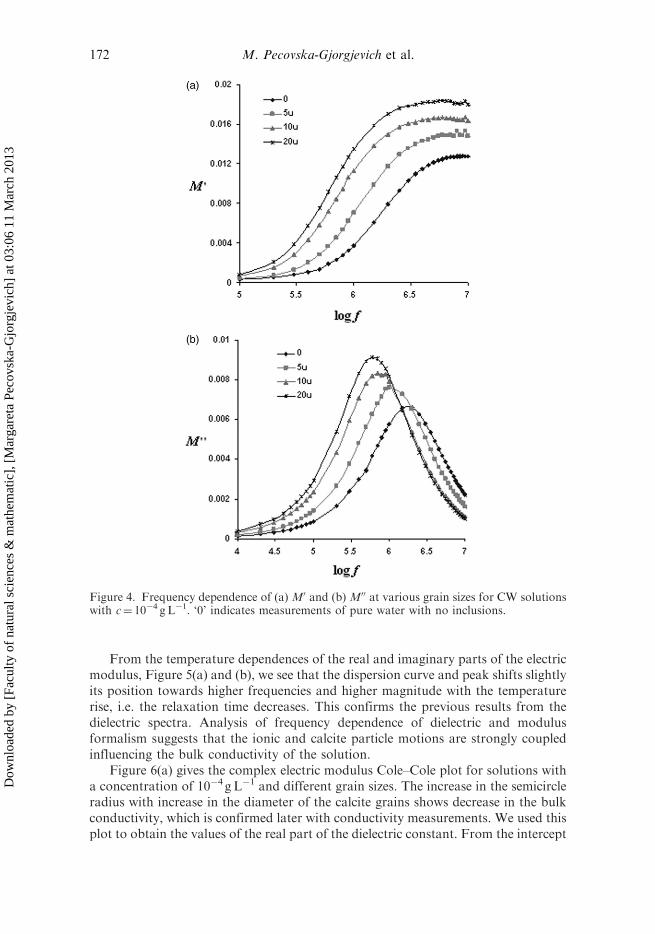
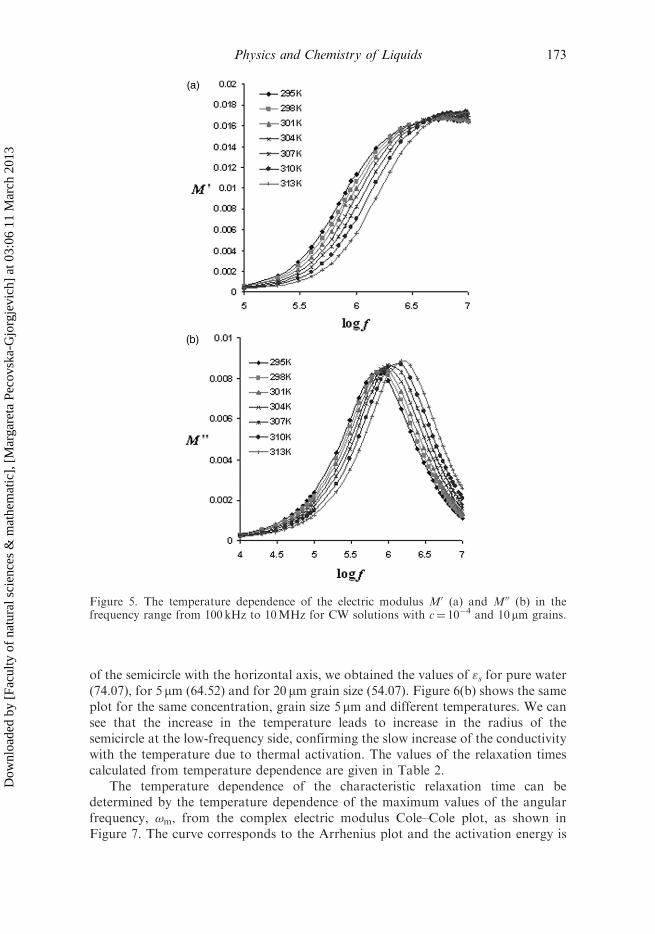
From the temperature dependences of the real and imaginary parts of the electricmodulus, Figure 5(a) and (b), we see that the dispersion curve and peak shifts slightlyits position towards higher frequencies and higher magnitude with the temperaturerise, i.e. the relaxation time decreases. This confirms the previous results from thedielectric spectra. Analysis of frequency dependence of dielectric and modulusformalism suggests that the ionic and calcite particle motions are strongly coupledinfluencing the bulk conductivity of the solution.
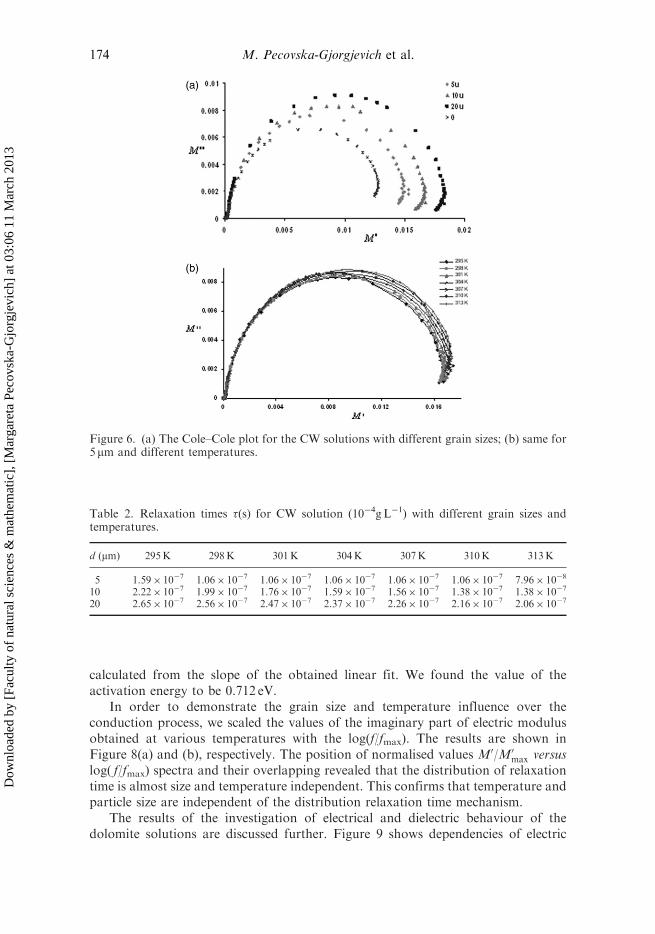
Figure 6(a) gives the complex electric modulus Cole–Cole plot for solutions witha concentration of 10�4g L�1 and different grain sizes. The increase in the semicircleradius with increase in the diameter of the calcite grains shows decrease in the bulkconductivity, which is confirmed later with conductivity measurements. We used thisplot to obtain the values of the real part of the dielectric constant. From the intercept
Figure 4. Frequency dependence of (a) M0 and (b) M00 at various grain sizes for CW solutionswith c¼ 10�4 g L�1. ‘0’ indicates measurements of pure water with no inclusions.
M. Pecovska-Gjorgjevich et al.172
Dow
nloa
ded
by [
Facu
lty o
f na
tura
l sci
ence
s &
mat
hem
atic
], [
Mar
gare
ta P
ecov
ska-
Gjo
rgje
vich
] at
03:
06 1
1 M
arch
201
3
of the semicircle with the horizontal axis, we obtained the values of "s for pure water(74.07), for 5 mm (64.52) and for 20 mm grain size (54.07). Figure 6(b) shows the sameplot for the same concentration, grain size 5 mm and different temperatures. We cansee that the increase in the temperature leads to increase in the radius of thesemicircle at the low-frequency side, confirming the slow increase of the conductivitywith the temperature due to thermal activation. The values of the relaxation timescalculated from temperature dependence are given in Table 2.
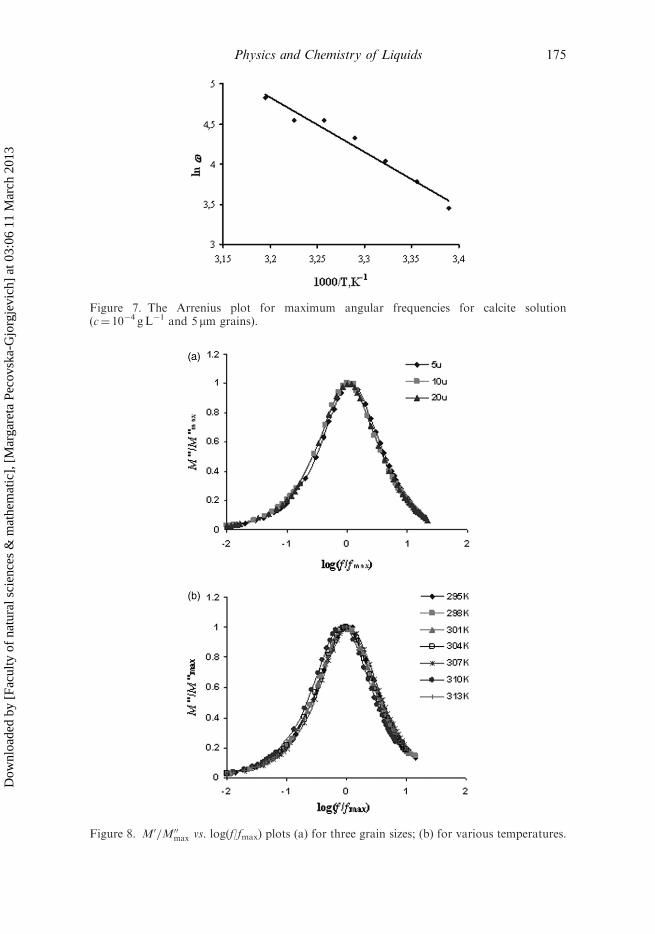
The temperature dependence of the characteristic relaxation time can bedetermined by the temperature dependence of the maximum values of the angularfrequency, !m, from the complex electric modulus Cole–Cole plot, as shown inFigure 7. The curve corresponds to the Arrhenius plot and the activation energy is
Figure 5. The temperature dependence of the electric modulus M0 (a) and M00 (b) in thefrequency range from 100 kHz to 10MHz for CW solutions with c¼ 10�4 and 10mm grains.
173Physics and Chemistry of Liquids
Dow
nloa
ded
by [
Facu
lty o
f na
tura
l sci
ence
s &
mat
hem
atic
], [
Mar
gare
ta P
ecov
ska-
Gjo
rgje
vich
] at
03:
06 1
1 M
arch
201
3
calculated from the slope of the obtained linear fit. We found the value of theactivation energy to be 0.712 eV.
In order to demonstrate the grain size and temperature influence over theconduction process, we scaled the values of the imaginary part of electric modulusobtained at various temperatures with the log(f/fmax). The results are shown inFigure 8(a) and (b), respectively. The position of normalised values M0/M0max versuslog( f/fmax) spectra and their overlapping revealed that the distribution of relaxationtime is almost size and temperature independent. This confirms that temperature andparticle size are independent of the distribution relaxation time mechanism.
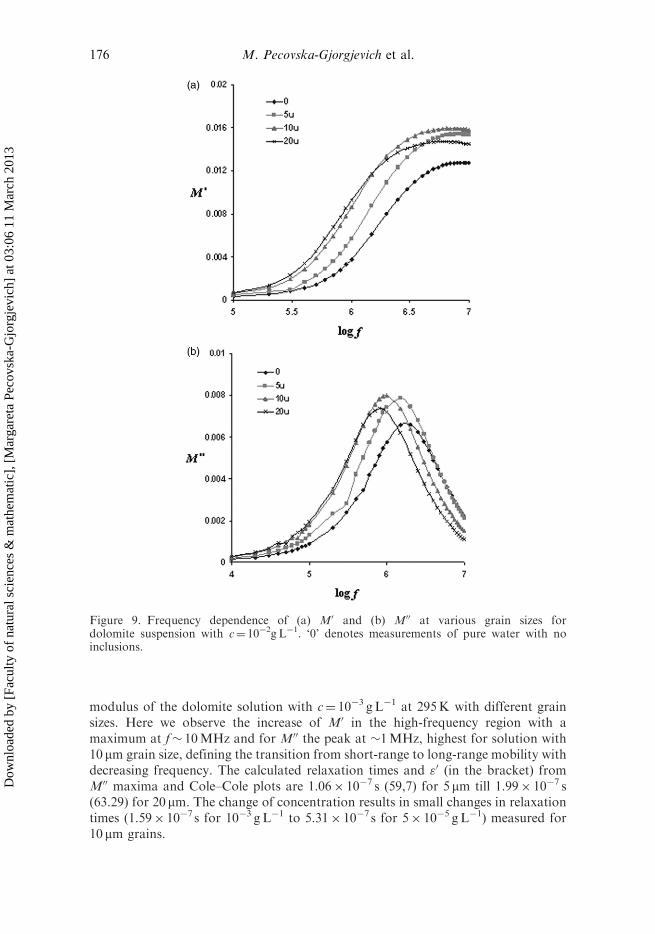
The results of the investigation of electrical and dielectric behaviour of thedolomite solutions are discussed further. Figure 9 shows dependencies of electric
Figure 6. (a) The Cole–Cole plot for the CW solutions with different grain sizes; (b) same for5mm and different temperatures.
Table 2. Relaxation times �(s) for CW solution (10�4gL�1) with different grain sizes andtemperatures.
Figure 8. M0=M00max vs. log(f/fmax) plots (a) for three grain sizes; (b) for various temperatures.
Figure 7. The Arrenius plot for maximum angular frequencies for calcite solution(c¼ 10�4 gL�1 and 5 mm grains).
175Physics and Chemistry of Liquids
Dow
nloa
ded
by [
Facu
lty o
f na
tura
l sci
ence
s &
mat
hem
atic
], [
Mar
gare
ta P
ecov
ska-
Gjo
rgje
vich
] at
03:
06 1
1 M
arch
201
3
modulus of the dolomite solution with c¼ 10�3 g L�1 at 295K with different grainsizes. Here we observe the increase of M0 in the high-frequency region with amaximum at f� 10MHz and for M00 the peak at �1MHz, highest for solution with10 mm grain size, defining the transition from short-range to long-range mobility withdecreasing frequency. The calculated relaxation times and "0 (in the bracket) fromM00 maxima and Cole–Cole plots are 1.06� 10�7 s (59,7) for 5 mm till 1.99� 10�7 s(63.29) for 20 mm. The change of concentration results in small changes in relaxationtimes (1.59� 10�7 s for 10�3 g L�1 to 5.31� 10�7 s for 5� 10�5 g L�1) measured for10 mm grains.
Figure 9. Frequency dependence of (a) M0 and (b) M00 at various grain sizes fordolomite suspension with c¼ 10�2g L�1. ‘0’ denotes measurements of pure water with noinclusions.
M. Pecovska-Gjorgjevich et al.176
Dow
nloa
ded
by [
Facu
lty o
f na
tura
l sci
ence
s &
mat
hem
atic
], [
Mar
gare
ta P
ecov
ska-
Gjo
rgje
vich
] at
03:
06 1
1 M
arch
201
3
Frequency dependence of electric modulus for both types of solutions with calciteor dolomite inclusions shows the presence of only one relaxation process. The peakshifts toward lower frequencies related to the pure water peak. The results from theheating of dolomite solutions were similar to the ones of CW, which are not givenhere for clearance. Results from different concentration measurements gave noconcrete dependence.
The conductivity was calculated from the measured real and imaginary parts ofthe admittances. Figure 10(a) shows the frequency dependence of solutions’conductivities obtained at 295K with a concentration of 10�4 g L�1 of calcite fordifferent grain sizes. This dependence was similar for all concentrations and for
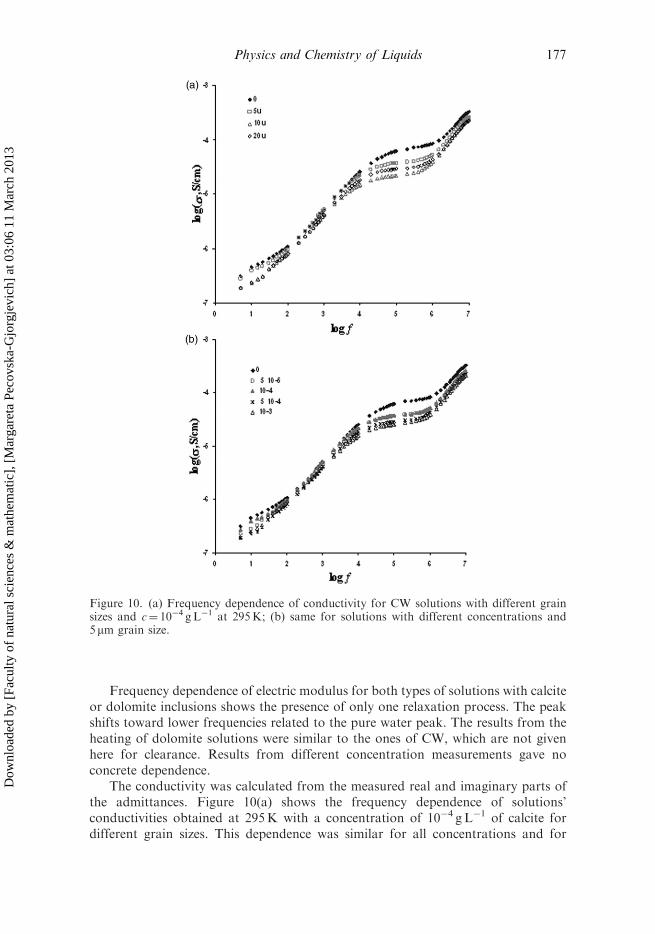
Figure 10. (a) Frequency dependence of conductivity for CW solutions with different grainsizes and c¼ 10�4 gL�1 at 295K; (b) same for solutions with different concentrations and5mm grain size.
177Physics and Chemistry of Liquids
Dow
nloa
ded
by [
Facu
lty o
f na
tura
l sci
ence
s &
mat
hem
atic
], [
Mar
gare
ta P
ecov
ska-
Gjo
rgje
vich
] at
03:
06 1
1 M
arch
201
3
dolomite solutions also, where ‘0’ denotes the conductivity of pure water. Total
conductivity amount is coming from free, polarised and ionic charges. The
characteristic curve for dielectrics was obtained for higher frequencies, defining
plateau for �dc and increasing conductivity with increasing frequency. The electrode
polarisation effect is very pronounced till �10 kHz, showing decrease in the
conductivity in the low-frequency region. The effect of the grain size is evident, the
plateau value is lowering with the increase of the grain diameter. This is expected
because the grain mobility depends on its diameter, and conductivity depends on the
mobility of the charge carriers. Similar behaviour is observed in Figure 10(b). The dc
conductivity decreases with increase in the calcite concentration which decreases the
polarity of the solution, indicating lowering of the ionic particle concentration
responsible for the solution conductivity. In the high-frequency region, the slow
changes of the conductivity refer to the presence of atomic and electron polarisation,
while orientation polarisation, connected to the magnitude of the dipole moment,
cannot be observed. The reduction of the ionic charge accumulation at high
frequencies also takes place. These results confirm the results from dielectric and
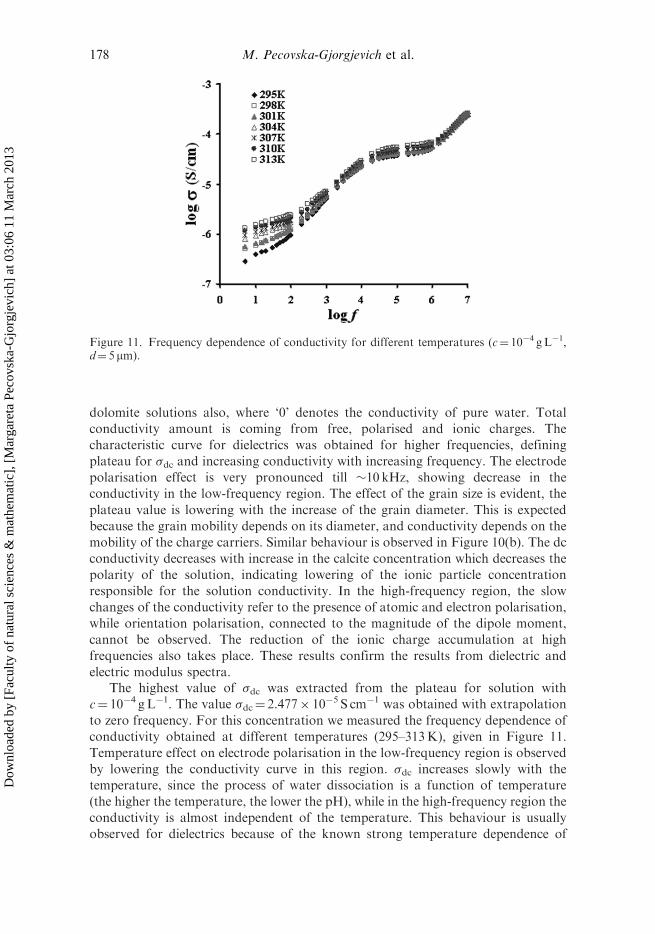
electric modulus spectra.The highest value of �dc was extracted from the plateau for solution with
c¼ 10�4 g L�1. The value �dc¼ 2.477� 10�5 S cm�1 was obtained with extrapolation
to zero frequency. For this concentration we measured the frequency dependence of
conductivity obtained at different temperatures (295–313K), given in Figure 11.
Temperature effect on electrode polarisation in the low-frequency region is observed
by lowering the conductivity curve in this region. �dc increases slowly with the
temperature, since the process of water dissociation is a function of temperature
(the higher the temperature, the lower the pH), while in the high-frequency region the
conductivity is almost independent of the temperature. This behaviour is usually
observed for dielectrics because of the known strong temperature dependence of
Figure 11. Frequency dependence of conductivity for different temperatures (c¼ 10�4 gL�1,d¼ 5mm).
M. Pecovska-Gjorgjevich et al.178
Dow
nloa
ded
by [
Facu
lty o
f na
tura
l sci
ence
s &
mat
hem
atic
], [
Mar
gare
ta P
ecov
ska-
Gjo
rgje
vich
] at
03:
06 1
1 M
arch
201
3
electrode polarisation and low temperature-dependent conductivity processesin the bulk.
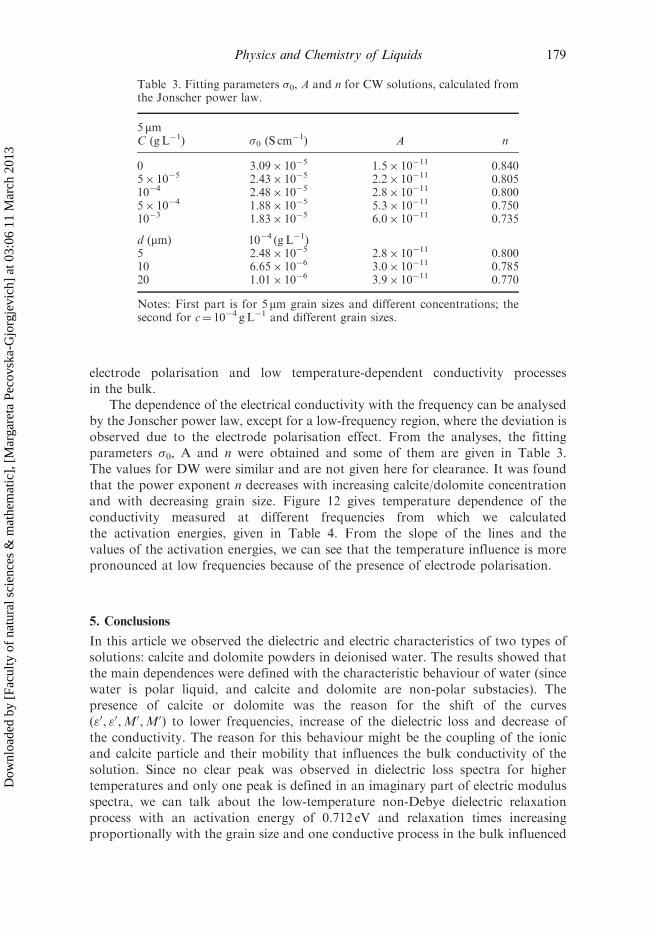
The dependence of the electrical conductivity with the frequency can be analysedby the Jonscher power law, except for a low-frequency region, where the deviation isobserved due to the electrode polarisation effect. From the analyses, the fittingparameters �0, A and n were obtained and some of them are given in Table 3.The values for DW were similar and are not given here for clearance. It was foundthat the power exponent n decreases with increasing calcite/dolomite concentrationand with decreasing grain size. Figure 12 gives temperature dependence of theconductivity measured at different frequencies from which we calculatedthe activation energies, given in Table 4. From the slope of the lines and thevalues of the activation energies, we can see that the temperature influence is morepronounced at low frequencies because of the presence of electrode polarisation.
5. Conclusions
In this article we observed the dielectric and electric characteristics of two types ofsolutions: calcite and dolomite powders in deionised water. The results showed thatthe main dependences were defined with the characteristic behaviour of water (sincewater is polar liquid, and calcite and dolomite are non-polar substacies). Thepresence of calcite or dolomite was the reason for the shift of the curves("0, "0,M0,M0) to lower frequencies, increase of the dielectric loss and decrease ofthe conductivity. The reason for this behaviour might be the coupling of the ionicand calcite particle and their mobility that influences the bulk conductivity of thesolution. Since no clear peak was observed in dielectric loss spectra for highertemperatures and only one peak is defined in an imaginary part of electric modulusspectra, we can talk about the low-temperature non-Debye dielectric relaxationprocess with an activation energy of 0.712 eV and relaxation times increasingproportionally with the grain size and one conductive process in the bulk influenced
Table 3. Fitting parameters �0, A and n for CW solutions, calculated fromthe Jonscher power law.
Notes: First part is for 5mm grain sizes and different concentrations; thesecond for c¼ 10�4 g L�1 and different grain sizes.
179Physics and Chemistry of Liquids
Dow
nloa
ded
by [
Facu
lty o
f na
tura
l sci
ence
s &
mat
hem
atic
], [
Mar
gare
ta P
ecov
ska-
Gjo
rgje
vich
] at
03:
06 1
1 M
arch
201
3
by the water behaviour. Temperature increase leads to decrease of therelaxation time.
Bigger grains of the inclusions and their higher concentration lead to lowering ofthe conductivity. Fitting the conductivity to power law allowed us to calculate thefitting parameters �0, A and n and define their dependence from the concentration ofthe solution. We also calculated the activation energy for the conductivity process atdifferent frequencies that takes place in the bulk.
References
[1] Y.F. Ma, Y.H. Gao, and Q.L. Feng, J. Cryst. Growth 312, 3165 (2010).[2] J. Gal, J. Bollinger, H. Tolosa, and N. Gache, Talanta 43, 1497 (1996).
[3] L.Z. Lakshtanov and S.L.S. Stipp, Geoch. Cosmoch. Acta 74, 2655 (2010).[4] O. Sohnel and J.W. Mullin, J. Crys. Growth 60, 239 (1982).[5] W.N. Al Nasser, A. Shaikh, C. Morriss, M.J. Hounslow, and A.D. Salman, Chem. Eng.
Sci. 63, 1381 (2008).[6] M. Faruque, G. Hossain, E. Murch I, B.D. Belova V, and Turner, Solid State Commun.
149, 1201 (2009).
Figure 12. The Arrenius plot for temperature dependent conductivity.
Table 4. Activation energies calculated from the Arrenius plot of theconductivity for various frequencies for CW (10�4g L�1, 5 mm).
[8] H. Yilmaz, H.I. Unal, and M. Yavuz, Colloid. J. 67, 236 (2005).[9] T. Uemura, K. Minagawa, and J. Takimoto, J. Chem. Soc., Faraday Trans. 91, 1051
(1995).[10] E. Barsoukov, Impedance Spectroscopy Theory, Experiment and Applications, 2nd ed.
(John Wiley & Sons Inc., Hoboken, NJ, 2005).
[11] J.R. MacCallum and C.A. Vincent, editors, Polymer Electrolyte Review I & II (Elsevier,London, 1987).
[12] F. Kremer and A. Schonhals, editors, Broad Band Dielectric Spectroscopy (Springer-
Verlag, Berlin, Heidelberg, New York, 2003).[13] D.K. Pradhan, R.N.P. Choudhary, and B.K. Samantaray, Int. J. Electrochem. Sci. 3, 597
(2008).
[14] X.P. Zhao and X. Duan, Mater. Lett. 54, 348 (2002).[15] C.P. Smyth, Dielectric Behaviour and Structure (McGraw-Hill, New York, 1955).[16] K.S. Cole and R.H. Cole, J. Chem. Phys. 9, 341 (1941).[17] D.W. Davidson and R.H. Cole, J. Chem. Phys. 19, 1484 (1951).
[18] S. Havriliak and S. Negami, Polymer 8, 161 (1967).[19] P.B. Macedo, C.T. Moynihan, and R. Bose, Phys. Chem. Glass 13, 171 (1972).[20] J. Liu, C.G. Duan, W.G. Yin, W.N. Mei, R.W. Smith, and J.R. Hardy, J. Chem. Phys.
119, 5 (2003).[21] A. Dutta, C. Bharti, and T.P. Sinha, Ind. J. Eng. Mat. Sci. 15, 181, (2008).[22] B. Jun, H. Kim, Y. Hwang, B. Choi, and J. Bae, J. Korean Phys. Soc. 49, 2408 (2006).
[23] S.R. Elliott, J. Non-Cryst. Solids 170, 97 (1994).[24] S. Chounhary and R.J. Sengwa, Ind. J. Eng. Mater. Sci. 18, 147 (2011).[25] T.J. Pinnavaia and G.W. Bell, Polymer–Clay Nanocomposite (John Wiley & Sons Ltd,
England, 2000).
[26] A. Chelkowsky, Dielectric Physics (Elsevier, Amsterdam, 1980).[27] A.K. Jonscher, Dielectric Relaxation in Solids (Chelsea Dielectric Press, London, 1983).[28] A.K. Jonscher, J. Mater. Sci. 16, 2037 (1981).
[29] L.F. Maia and A.C.M. Rodrigues, Solid State Ionics 168, 87 (2004).[30] P. Kluvanek and R. Klement, J. Non-Cryst. Solids 353, 2004 (2007).[31] B.L. Trout and M. Parinello, Phys. Rev. Lett. 288, 343 (1998).
[32] T. Yagasaki, I. Iwahashi, S. Saito, and I. Ohmine, J. Chem. Phys. 122, 14504 (2005).[33] R. Phillips, J. Kondev, and J. Theriot, Physical Biology of Cell (Garland Science, New
York, 2009).
[34] H. Jansson, R. Bergman, and J. Swenson, Phys. Rev. Lett. 104, 017802 (2010).[35] Y.S. Shiue and M.J. Mathewson, J. Eur. Chem. Ceram. Soc. 22, 2325 (2002).