Different Post-Pleistocene Histories of Eurasian Parids ALEXANDRA PAVLOVA,SIEVERT ROHWER,SERGEI V. DROVETSKI, AND ROBERT M. ZINK From the Bell Museum of Natural History, University of Minnesota, St Paul, MN 55108 (Pavlova and Zink); Burke Museum and Department of Zoology, University of Washington, Seattle, WA 98195-3010 (Rohwer); and Department of Biological Sciences, University of Alaska, Anchorage, AL 99508 (Drovetski). Alexandra Pavlova is now at the School of Biological Sciences, Monash University, Clayton, Victoria 3800, Australia. Address correspondence to R. M. Zink, 100 Ecology Building, 1987 Upper Buford Circle, St Paul, MN 55108, or e-mail: [email protected]. Abstract Previous phylogeographic studies of the great tit (Parus major) and the willow tit (Parus montanus) found a general absence of phylogeographic structure for both species and suggested that each species underwent range contraction during the last Ice Age and survived in relatively low numbers, P. major in southern Europe and P. montanus in southeastern Asia. However, prior studies did not sample the entire range of either species. We analyzed sequence data for the complete mitochondrial ND2 gene from 87 P. major and 139 P. montanus from 15 new Eurasian localities, both to test prior conclusions and to provide better coverage of each species’ range. Our analyses confirmed the absence of phylogeographic structure in P. major and P. montanus and supported the prior refuge hypothesis for P. major. For P. montanus, we concluded that besides surviving the Ice Age in southeastern Asia, as previously hypothesized, it apparently sustained a relatively large population in northern Eurasian riv- erine thickets and then expanded eastward. Genetic diversity was low in P. major (p 5 0.0012, h 5 0.64) and moderate in P. montanus (p 5 0.0021, h 5 0.88), suggesting higher long-term effective population sizes and the older ages of populations in P. montanus. If molecular substitution rates are similar, P. montanus colonized its current Eurasian range earlier than P. major. Differences between prior studies and ours likely result from sampling gaps in earlier studies. Phylogeographic studies have revealed that many North American and European species were strongly affected by Pleistocene glaciations (Hewitt 1996, 1999, 2004; Taberlet and others 1998). Relatively few studies, however, examine species with wide Eurasian distributions (Irwin and others 2001; Kvist and others 2001, 2003; Liebers and others 2001; Zink, Drovetski, and Rohwer 2002; Zink, Rohwer, and others 2002; Pavlova and others 2003; Zink and others 2003; Drovetski, Zink, Rohwer, and others 2004; Godoy and others 2004; Pavlova 2004; Pavlova, Zink, and Rohwer 2005; Pavlova, Zink, Rohwer, and others 2005) be- cause of the difficulties in obtaining samples. As a result, many studies of Palearctic species sample the European part of the species’ ranges but only include a few Asian samples. Such sampling gaps can affect the conclusions of phylogeo- graphic studies (Zink and others 2003). In this paper, we analyze new and published mitochondrial DNA (mtDNA) sequences representing most of the range of 2 widespread Eurasian passerine birds, the great tit (Parus major) and the willow tit (Parus montanus). Our goals are to test prior conclu- sions about the recent histories of these species and their taxonomic status. Parus major In a review of morphological variation, Harrap and Quinn (1995) distinguished 3 major groups in the P. major species complex: major (yellow-bellied with green upperparts; 11 sub- species inhabiting Europe, northwest Africa, and northern Asia; Figure 1A), minor (whitish belly and green upperparts; 9 subspecies inhabiting southeast Russia, Japan, and northern Southeast Asia), and cinereus (whitish belly and blue-gray upperparts; 13 subspecies inhabiting northeast Iran, south Afghanistan, India, and Indonesia). A fourth group, the Tur- kestan tit (Parus bokharensis), is often included in the major group, but it is considered a species by Harrap and Quinn (1995). Parus bokharensis resembles cinereus but is slightly smaller and longer tailed and occurs in the lowlands of central Asia from Turkmenia to Mongolia (Cramp and Perrins 1993). Songs of the major group differ substantially from songs of the other groups (Ivankina and others 1997). Formozov and others (1993) suggested that major and bokharensis are the most distant from each other among the 4 groups based on mor- phological characters; however, their view was not supported by the mtDNA study of Kvist and others (2003), which Journal of Heredity 2006:97(4):389–402 doi:10.1093/jhered/esl011 Advance Access publication July 14, 2006 ª The American Genetic Association. 2006. All rights reserved. For permissions, please email: [email protected]. 389
Transcript
Different Post-Pleistocene Histories ofEurasian ParidsALEXANDRA PAVLOVA, SIEVERT ROHWER, SERGEI V. DROVETSKI, AND ROBERT M. ZINK
From the Bell Museum of Natural History, University of Minnesota, St Paul, MN 55108 (Pavlova and Zink); Burke Museumand Department of Zoology, University of Washington, Seattle, WA 98195-3010 (Rohwer); and Department ofBiological Sciences, University of Alaska, Anchorage, AL 99508 (Drovetski). Alexandra Pavlova is now at the Schoolof Biological Sciences, Monash University, Clayton, Victoria 3800, Australia.
Address correspondence to R. M. Zink, 100 Ecology Building, 1987 Upper Buford Circle, St Paul, MN 55108, ore-mail: [email protected].
Abstract
Previous phylogeographic studies of the great tit (Parus major) and the willow tit (Parus montanus) found a general absence ofphylogeographic structure for both species and suggested that each species underwent range contraction during the last IceAge and survived in relatively low numbers, P. major in southern Europe and P. montanus in southeastern Asia. However, priorstudies did not sample the entire range of either species. We analyzed sequence data for the complete mitochondrialND2 genefrom 87 P. major and 139 P. montanus from 15 new Eurasian localities, both to test prior conclusions and to provide bettercoverage of each species’ range. Our analyses confirmed the absence of phylogeographic structure in P. major and P. montanusand supported the prior refuge hypothesis for P. major. For P. montanus, we concluded that besides surviving the Ice Age insoutheastern Asia, as previously hypothesized, it apparently sustained a relatively large population in northern Eurasian riv-erine thickets and then expanded eastward. Genetic diversity was low in P. major (p 5 0.0012, h 5 0.64) and moderate inP. montanus (p5 0.0021, h5 0.88), suggesting higher long-term effective population sizes and the older ages of populations inP. montanus. If molecular substitution rates are similar, P. montanus colonized its current Eurasian range earlier than P. major.Differences between prior studies and ours likely result from sampling gaps in earlier studies.
Phylogeographic studies have revealed that many NorthAmerican and European species were strongly affected byPleistocene glaciations (Hewitt 1996, 1999, 2004; Taberletand others 1998). Relatively few studies, however, examinespecies with wide Eurasian distributions (Irwin and others2001; Kvist and others 2001, 2003; Liebers and others2001; Zink, Drovetski, and Rohwer 2002; Zink, Rohwer,and others 2002; Pavlova and others 2003; Zink andothers 2003; Drovetski, Zink, Rohwer, and others 2004;Godoy and others 2004; Pavlova 2004; Pavlova, Zink, andRohwer 2005; Pavlova, Zink, Rohwer, and others 2005) be-cause of the difficulties in obtaining samples. As a result,many studies of Palearctic species sample the European partof the species’ ranges but only include a few Asian samples.Such sampling gaps can affect the conclusions of phylogeo-graphic studies (Zink and others 2003). In this paper, weanalyze new and published mitochondrial DNA (mtDNA)sequences representing most of the range of 2 widespreadEurasian passerine birds, the great tit (Parus major) and thewillow tit (Parus montanus). Our goals are to test prior conclu-sions about the recent histories of these species and theirtaxonomic status.
Parus major
In a review of morphological variation, Harrap and Quinn
(1995) distinguished 3 major groups in the P. major species
complex: major (yellow-bellied with green upperparts; 11 sub-
species inhabiting Europe, northwest Africa, and northern
Asia; Figure 1A), minor (whitish belly and green upperparts;
9 subspecies inhabiting southeast Russia, Japan, and northern
Southeast Asia), and cinereus (whitish belly and blue-gray
upperparts; 13 subspecies inhabiting northeast Iran, south
Afghanistan, India, and Indonesia). A fourth group, the Tur-
kestan tit (Parus bokharensis), is often included in the major
group, but it is considered a species by Harrap and Quinn
(1995). Parus bokharensis resembles cinereus but is slightly
smaller and longer tailed and occurs in the lowlands of central
Asia from Turkmenia to Mongolia (Cramp and Perrins 1993).
Songs of the major group differ substantially from songs of
the other groups (Ivankina and others 1997). Formozov and
others (1993) suggested that major and bokharensis are the most
distant from each other among the 4 groups based on mor-
phological characters; however, their view was not supported
by the mtDNA study of Kvist and others (2003), which
Journal of Heredity 2006:97(4):389–402doi:10.1093/jhered/esl011Advance Access publication July 14, 2006
ª The American Genetic Association. 2006. All rights reserved.For permissions, please email: [email protected].
389
found a clade consisting of 2 pairs of sister taxa, major andbokharensis and cinereus and minor. Thus, although some hy-bridization does occur where group ranges meet (Kerimovand Formozov 1986; Formozov and others 1993; Nazarenkoand others 1999; Fedorov and others forthcoming), the4 groups have had independent evolutionary histories and,therefore, should be considered phylogenetic species (Kvistand others 2003). In this paper, we consider the great tit(P. major), the Turkestan tit (P. bokharensis), and the Japanesetit (Parus minor) separate species (we lack Parus cinereus), as dosome other authors (Stepanyan 2003).
Kvist and others (1999) studied genetic variation in 6 Eu-ropean populations of P. major using sequence data from thecomplete mitochondrial (mtDNA) control region (CR) for 68
birds (Figure 1A, Table 1). They found an absence of phy-logeographic structure and extensive gene flow among pop-ulations, for which they inferred recent demographicexpansions. Kvist and others (1999) hypothesized that theBalkans was a refugium during the last glacial maximum(20 000 years ago) and that P. major subsequently expandedrapidly to northern Europe. More recently, Kvist and others(2003) examined partial CR sequences of 125 P. major
expanding the initial sampling to Portugal and the UnitedKingdom in Europe and to 3 Asian and 1 African localities(open circles in Figure 1A, Table 1); they also includedsequences of 3 individuals of P. bokharensis from Kirghiziaand 44 individuals of P. minor from 4 southeastern Asian pop-ulations (Figure 1A, Table 1). Kvist and others (2003) found
Figure 1. (A) Distribution of collecting localities for the great tit Parus major, Turkestan tit Parus bokharensis (Kirghizia and
Almaty), and Japanese tit Parus minor (Amur, Primor’e, Japan, North Korea, and China): filled circles indicate new samples and open
circles samples of Kvist and others (2003) (some localities are pooled to simplify analysis). (B) Collecting localities for the willow tit
Parus montanus samples: filled circles indicate new samples and open circles samples of Kvist and others (2001). Shaded areas
represent the distributions of (A) P. major and (B) P. montanus (following Harrap and Quinn 1996).
Journal of Heredity 2006:97(4)
390
low genetic diversity within P. major and concluded that thegenetic variation within populations of P. major was reduceddrastically because of population bottlenecks during Ice Agerange contractions. Although the starlike haplotype network
of Kvist and others (2003; their Figure 2) suggested no over-all phylogeographic structure, their analysis of molecular var-iance (AMOVA) showed some overall population structure(UST 5 0.12) and pairwise population UST values for the
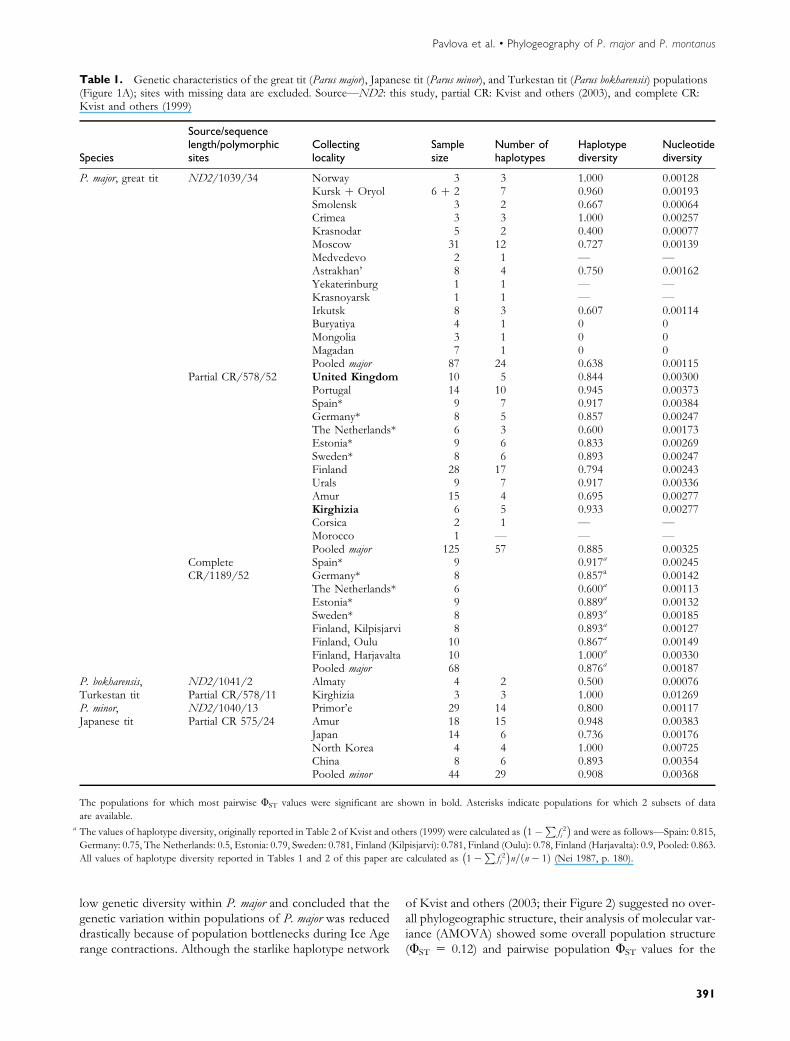
Table 1. Genetic characteristics of the great tit (Parus major), Japanese tit (Parus minor), and Turkestan tit (Parus bokharensis) populations(Figure 1A); sites with missing data are excluded. Source—ND2: this study, partial CR: Kvist and others (2003), and complete CR:Kvist and others (1999)
Japan 14 6 0.736 0.00176North Korea 4 4 1.000 0.00725China 8 6 0.893 0.00354Pooled minor 44 29 0.908 0.00368
The populations for which most pairwise UST values were significant are shown in bold. Asterisks indicate populations for which 2 subsets of data
are available.a The values of haplotype diversity, originally reported in Table 2 of Kvist and others (1999) were calculated as 1�
Pf 2i
� �and were as follows—Spain: 0.815,
Germany: 0.75, The Netherlands: 0.5, Estonia: 0.79, Sweden: 0.781, Finland (Kilpisjarvi): 0.781, Finland (Oulu): 0.78, Finland (Harjavalta): 0.9, Pooled: 0.863.
All values of haplotype diversity reported in Tables 1 and 2 of this paper are calculated as 1�P
f 2i� �
n=ðn� 1Þ (Nei 1987, p. 180).
Pavlova et al. � Phylogeography of P. major and P. montanus
geographically isolated populations from Kirghizia and theUnited Kingdom were large and significant. Based on highergenetic diversity in the 3 individuals of P. bokharensis, itwas concluded that P. bokharensis was historically stable,whereas both P. major and P. minor experienced Late Pleisto-cene or Holocene population reductions and subsequentexpansions. Kvist and others (2003) also suggested thatP. major had a larger and more recent population expansionthan P. minor.
Parus montanus
This species ranges from northeastern France through cen-tral and northern Europe and Russia to the Pacific coast(Cramp and Perrins 1993, Figure 1B). Geographic variationin morphology is clinal and connects most of the continentalsubspecies, which also differ in song types and coloration(Harrap and Quinn 1995). Harrap and Quinn (1995) dividedP. montanus into 3 subspecies groups: salicarius (northern Eur-asia, 6 subspecies), kamtschatkensis (Pacific rim in eastern Asia,4 subspecies), and montanus (mountains of central Europe,1 subspecies); they considered the songar tit (Parus songarus)of central Asia a separate species, as we do in this paper.
Kvist and others (2001) and Salzburger and others (2002),using sequences of the mitochondrial CR and cytochrome b,respectively, found no mtDNA structuring associated withsubspecies groups within P. montanus, whereas the songartit, considered by them as subspecies of P. montanus, wasfound to be polyphyletic and consisting of 3 distinct lineages:weigoldicus, affinis, and songarus. On the basis of close relation-
ships among 6 Eurasian subspecies of P. montanus, Salzburgerand others (2002) suggested that this species spread over ma-jor parts of Eurasia during the Pleistocene and underwentrapid morphological and vocal divergence. Kvist and others(1998) compared complete mitochondrial CR sequencesfrom Finland and Swedish populations and concluded thatindividuals from both localities belong to one panmictic pop-ulation with high long-term effective population size. Later,Kvist and others (2001) studied partial CR sequences of birdsfrom 6 western European localities, 6 samples from easternAsia, and 1 sample from the Urals (open circles in Figure 1B,Table 2) and found no phylogeographic structure; however,their AMOVA showed that populations were subdividedoverall (UST 5 0.15), and all pairwise population UST valuesfor Japan and most UST values for Latvia were large and sig-nificant. Kvist and others (2001) attributed the general lack ofphylogeographic structure to homogeneous habitat through-out the distribution, absence of geographic barriers, highgene flow, and a high long-term effective population sizeand, based on trend of westward decrease in genetic diversity,suggested that P. montanus expanded through the Palearcticfrom southeastern Asia after the last Ice Ages.
Summary of Previous Work on Parid Phylogeography
Several studies have shown a general lack of phylogeographicstructure and evidence of overall population subdivision inP. major and P. montanus (sensu strictu). However, exceptfor the Urals, samples from eastern Europe and western Asiawere lacking (open circles in Figure 1 indicate prior samples).
Figure 2. Median-joining ND2 haplotype networks for Parus major (white circles on large network) and Parus bokharensis (gray
circles on large network) and Parus minor from Primor’e (small network). Each circle represents a unique haplotype, and the size of
the circle is proportional to the frequency of the haplotype in the sample. Small black dots represent unsampled haplotypes,
and lines connecting circles represent single mutations. Numbers within circles indicate the total number of individuals sharing the
same haplotype; numbers in parentheses indicate the number of individuals from a particular locality sharing the same haplotype
(if different from 1). Locality abbreviations are as follows: NOR, Norway; KUR, Kursk; ORY, Oryol; SMO, Smolensk; CRI,
Species-level evolutionary conclusions should not be madewith confidence until the complete geographic range is sam-pled. This concern motivated us to add new localities (blackcircles in Figure 1) from previously unstudied areas. If theconclusions of Kvist and others (2001, 2003) are correct, thenour expanded analyses should reveal 1) a general absence ofgeographic structure on the haplotypes trees of both species,2) a decrease in genetic diversity consistent with the directionof expansion: eastward and northward in P. major and west-ward and northward in P. montanus, 3) signatures of expansionfor populations of both species, and 4) earlier expansions insoutheastern populations of P. montanus relative to the north-ern and western populations. Because our new samples over-lap to some degree with those used in the studies reviewedabove, we chose to sequence the mitochondrial coding geneND2. Thus, in addition to testing prior phylogeographic con-
clusions, we were able to compare genetic estimates derivedfrom the noncoding CR with those from ND2.
Materials and MethodsNew Sampling
We analyzed 87 individuals of P. major from 15 Eurasianlocalities, 4 individuals of P. bokharensis from Almaty, and29 individuals of P. minor from Primor’e (black circles inFigure 1A, Table 1). For P. montanus, we analyzed 139 indi-viduals from 17 localities (Figure 1B, Table 2). We used themarsh tit Parus palustris (GenBank number AY734248) as anout-group for the haplotype tree of P. montanus and P. minor
for P. major. All birds were collected during the breeding sea-son. From nearly all specimens, a study skin and spread wing
Table 2. Genetic characteristics of willow tit (Parus montanus) populations (Figure 1B); sites with missing data are excluded.Source—ND2: this paper, partial CR: Kvist and others (2001), and complete CR: Kvist and others (1998)
62 0.976 0.00671Complete CR/1207/52 Finland 13 13 1.000 0.00550
Sweden 12 12 1.000 0.00500Pooled 25 25 0.00530
The populations for which most pairwise UST values were significant are shown in bold. Asterisks indicate populations for which 2 subsets of data
are available.a Top row values reported in Table 1 (p. 932) of Kvist and others 2001, bottom row values reported on page 934 of the text (nucleotide diversity of 0.00671 was
calculated by us in DNASP and was not reported in original paper).
393
Pavlova et al. � Phylogeography of P. major and P. montanus
were preserved and deposited at the Burke Museum, Univer-sity of Washington, Seattle; the Moscow State UniversityZoological Museum, Moscow, Russia; the Bell Museum, Uni-versity of Minnesota, St Paul; or the State Darwin Museum,Moscow, Russia. Tissue samples were preserved in the fieldeither in 96% ethanol or in lysis buffer (Longmire and others1997) or frozen in liquid nitrogen.
Molecular Laboratory Methods
Isolation and purification of DNA was performed usingQIAamp Tissue Kit (Qiagen, Valencia, CA). Polymerasechain reaction (PCR) (Saiki and others 1988) with Perkin-Elmer PCR reagents and primers L5215 (Hackett 1996)and H1064 (Drovetski, Zink, Fadeev, and others 2004)was used to amplify the completeND2 gene; PCR conditionsare explained in Drovetski, Zink, Fadeev, and others (2004).PCR products were cleaned with Qiaquick PCR PurificationKit (Qiagen) and directly sequenced on ABI 3700 automatedsequencer using BIGDYE versions 3.0 and 3.1 chemistry(Applied Biosystems, Foster City, CA) and primers L5215,H1064, L347 (Drovetski, Zink, Fadeev, and others 2004),and H5578 (Hackett 1996).
Data Analysis
Sequences were aligned and edited in SEQUENCHER 3.1.1(Gene Codes Corporation, Ann Arbor, MI). Sequencedata have been deposited in GenBank (Accession num-bers AY732613–AY732729, AY734249–AY734251, andAY732869–AY733007). Mitochondrial origin of sequencedDNA fragments was supported by the absence of stopcodons and the existence of a large number of haplotypes,which are inconsistent with nuclear copies (Zhang andHewitt 1996). A matrix of variable sites was used as inputfor constructing a median-joining network (Bandelt andothers 1999) using software NETWORK version 4.110(http://www.fluxus-engineering.com) assigning equal weightsto all sites and with default value of epsilon 5 0.
Maximum likelihood (ML) model and parameters weredetermined by the hierarchical likelihood ratio test inMODELTEST 3.06 (Posada and Crandall 1998). PAUP*(Swofford 2000) and PHYML (Guindon and Gascuel2003) were used to perform ML tree searches. SEQBOOTandCONSENSEwere used from the PHYLIPprogram pack-age (Felsenstein 1993). SEQBOOT version 3.5c was used togenerate 100 bootstrapped sets of data from which ML treeswere constructed in PHYML. Then, CONSENSE version3.5c was used to compute a majority rule consensus tree.
DNASP version 4.00 (Rozas and others 2003) was usedto calculate the number of haplotypes in populations, nucle-otide diversity (p, Nei 1987; Equation 10.5), haplotype diver-sity (h; Nei 1987; Equation 8.4), and theta (H5 2Nel, whereNe is the effective population size and l is the mutationrate) from the number of polymorphic sites per nucleotide(Tajima 1996) and to perform the R2 test for detecting pop-ulation growth (Ramos-Onsins and Rozas 2002). We usedARLEQUIN version 2.000 (Schneider and others 2000) toperform an AMOVA (Excoffier and others 1992) taking into
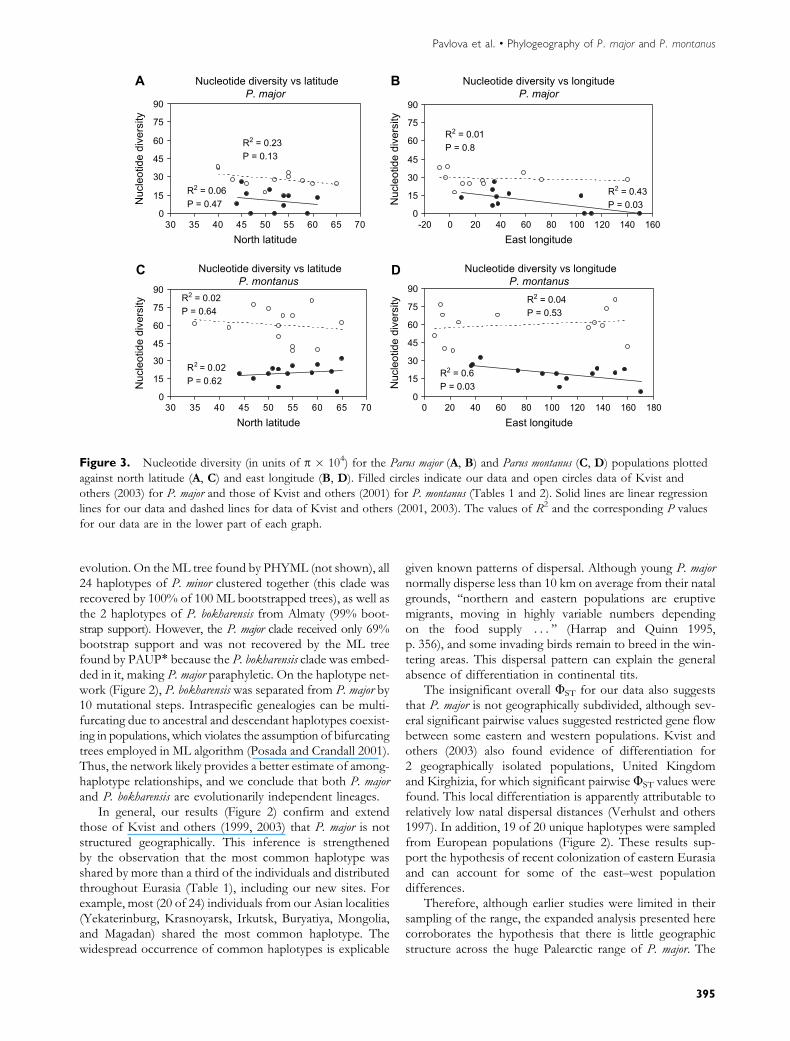
account haplotype frequencies and the distances betweenhaplotypes, to compute pairwise population UST, mismatchdistributions, time since population expansion (s), effectivepopulation sizes before (H0) and after (H1) expansion, andTajima’s D (Tajima 1996) and Fu’s Fs (Fu 1997) tests of se-lective neutrality for localities with sample sizes greater than10 individuals (in some cases, samples were pooled if theywere not significantly differentiated). The latter 2 tests wereused as indicators of population expansion. Sites with ambig-uous characters were removed. To test the empirical mis-match distribution against a model of sudden expansion,we used the generalized nonlinear least squares approach(Schneider and Excoffier 1999) implemented in ARLEQUIN.We compared our estimates of p with those of Kvist andothers (2001, 2003) and regressed values of p against latitudeand longitude for samples of 3 or more individuals expectingsmaller values to be observed on the leading edge of popu-lation expansion (Hewitt 1999, 2000).
Results and DiscussionThe Great Tit P. major
Genetic Variability and Gene Flow
We analyzed 1039 aligned nucleotides of ND2 after remov-ing sites with missing characters. The 34 polymorphic sites(9 of them parsimony informative) resolved 24 haplotypesamong the 87 individuals (Table 1). The most common hap-lotype (haplotype A in Figure 2) was shared by 52 individuals(60% of all sampled individuals) from 13 populations:Norway (1 individual), Kursk (2), Smolensk (2), Crimea (1),Krasnodar (4), Moscow (16), Medvedevo (2), Astrakhan’ (4),Krasnoyarsk (1), Irkutsk (5), Buryatiya (4), Mongolia (3), andMagadan (7). Three more haplotypes were shared amonglocalities (Figure 2). Overall haplotype diversity was 0.638and ranged from 0 in Buryatiya, Mongolia, and Magadan,where all individuals shared the most common haplotype,to 1 in Norway and Crimea (Table 1). Overall nucleotide di-versity (p) averaged 0.0012 and ranged from 0.0 in Buryatiya,Mongolia, and Magadan to 0.0026 in Crimea (Table 1).Northern populations had lower p, both for our data andfor those of Kvist and others (2003) (Figure 3A), but thistrend was not significant (P. 0.05). Our data, but not thoseof Kvist and others (2003), showed a significant trend to-ward eastern birds having lower p (R2 5 0.43, P 5 0.03)(Figure 3B), suggesting eastward dispersal. A general lackof population subdivision was suggested by the overallnonsignificant UST value (P . 0.05, Table 1). However,several pairwise population comparisons yielded significant(P , 0.05) UST values: Krasnodar–Magadan (UST 5 0.07),Crimea–Buryatiya (0.11), and Astrakhan’–Irkutsk (0.05),indicating that gene flow between eastern and westernpopulations might be restricted.
Molecular Phylogenetic Analysis and Phylogeography
MODELTEST 3.06 indicated TrN þ G (Tamura and Nei1993) with alpha 5 0.0069 as the best-fit model of sequence
evolution. On the ML tree found by PHYML (not shown), all24 haplotypes of P. minor clustered together (this clade wasrecovered by 100% of 100 ML bootstrapped trees), as well asthe 2 haplotypes of P. bokharensis from Almaty (99% boot-strap support). However, the P. major clade received only 69%bootstrap support and was not recovered by the ML treefound by PAUP* because the P. bokharensis clade was embed-ded in it, making P. major paraphyletic. On the haplotype net-work (Figure 2), P. bokharensis was separated from P. major by10 mutational steps. Intraspecific genealogies can be multi-furcating due to ancestral and descendant haplotypes coexist-ing in populations, which violates the assumption of bifurcatingtrees employed in ML algorithm (Posada and Crandall 2001).Thus, the network likely provides a better estimate of among-haplotype relationships, and we conclude that both P. major
and P. bokharensis are evolutionarily independent lineages.In general, our results (Figure 2) confirm and extend
those of Kvist and others (1999, 2003) that P. major is notstructured geographically. This inference is strengthenedby the observation that the most common haplotype wasshared by more than a third of the individuals and distributedthroughout Eurasia (Table 1), including our new sites. Forexample, most (20 of 24) individuals from our Asian localities(Yekaterinburg, Krasnoyarsk, Irkutsk, Buryatiya, Mongolia,and Magadan) shared the most common haplotype. Thewidespread occurrence of common haplotypes is explicable
given known patterns of dispersal. Although young P. majornormally disperse less than 10 km on average from their natalgrounds, ‘‘northern and eastern populations are eruptivemigrants, moving in highly variable numbers dependingon the food supply . . . ’’ (Harrap and Quinn 1995,p. 356), and some invading birds remain to breed in the win-tering areas. This dispersal pattern can explain the generalabsence of differentiation in continental tits.
The insignificant overall UST for our data also suggeststhat P. major is not geographically subdivided, although sev-eral significant pairwise values suggested restricted gene flowbetween some eastern and western populations. Kvist andothers (2003) also found evidence of differentiation for2 geographically isolated populations, United Kingdomand Kirghizia, for which significant pairwise UST values werefound. This local differentiation is apparently attributable torelatively low natal dispersal distances (Verhulst and others1997). In addition, 19 of 20 unique haplotypes were sampledfrom European populations (Figure 2). These results sup-port the hypothesis of recent colonization of eastern Eurasiaand can account for some of the east–west populationdifferences.
Therefore, although earlier studies were limited in theirsampling of the range, the expanded analysis presented herecorroborates the hypothesis that there is little geographicstructure across the huge Palearctic range of P. major. The
A Nucleotide diversity vs latitudeP. major
Nucleotide diversity vs latitudeP. montanus
Nucleotide diversity vs longitudeP. montanus
0
15
30
45
60
75
90
30 35 40 45 50 55 60 65 70North latitude
Nuc
leot
ide
dive
rsity
Nuc
leot
ide
dive
rsity
Nuc
leot
ide
dive
rsity
Nuc
leot
ide
dive
rsity
C
0
15
30
45
60
75
90
30 35 40 45 50 55 60 65 70North latitude East longitude
B Nucleotide diversity vs longitudeP. major
0
15
30
45
60
75
90
East longitude
D
0
15
30
45
60
75
90
-20 0 20 40 60 80 100 120 140 160
0 20 40 60 80 100 120 140 160 180
R2 = 0.23P = 0.13
R2 = 0.06P = 0.47
R2 = 0.01P = 0.8
R2 = 0.43P = 0.03
R2 = 0.04P = 0.53
R2 = 0.6P = 0.03
R2 = 0.02P = 0.64
R2 = 0.02P = 0.62
Figure 3. Nucleotide diversity (in units of p � 104) for the Parus major (A, B) and Parus montanus (C, D) populations plotted
against north latitude (A, C) and east longitude (B, D). Filled circles indicate our data and open circles data of Kvist and
others (2003) for P. major and those of Kvist and others (2001) for P. montanus (Tables 1 and 2). Solid lines are linear regression
lines for our data and dashed lines for data of Kvist and others (2001, 2003). The values of R2 and the corresponding P values
for our data are in the lower part of each graph.
395
Pavlova et al. � Phylogeography of P. major and P. montanus
general absence of phylogeographic structure as the result ofpostglacial range expansion and low genetic diversity wasreported for 2 northern species of North American chicka-dees, Poecile atricapillus and Poecile hudsonicus (Gill and others1993). Other forest-dwelling birds also appear to lack phylo-geographic structure across much of northern Eurasia (e.g.,Zink, Drovetski, and Rohwer 2002; Zink, Rohwer, andothers 2002).
The mtDNA data appear to conflict with 2 recent studiesfrom the United Kingdom that revealed the existence of nat-ural selection acting on local differences in life-history traits.Postma and van Noordwijk (2005) discovered differences inclutch size between subpopulations separated by only a fewkilometers. Garant and others (2005) discovered that themean mass of P. major decreased in one part of Wythamwoods, whereas clutch size remained constant to the north.A significant genetic component to variation in these fitnessor fitness-linked traits was documented in both studies. Ifthese represented genome-wide patterns of differentiation,the mtDNA tree should have revealed more structure. Thus,the mtDNA data suggest that these local adaptations are veryrecently evolved.
Population Expansion
Kvist and others (2003) suggested that P. major populationsunderwent a drastic reduction in size as a result of range con-traction during the last glacial maximum. Survival in lownumbers in a small southwestern refugium (possibly Balkans,Kvist and others 1999) was thought to have been followed bynortheastward range expansion and subsequent demographicexpansion. Although many of our individual samples aresmall, our mismatch distributions and values of Tajima’sD, Fu’s Fs, and R2 are consistent with these hypotheses ofpopulation and range expansion (Table 3, Figure 4), asexpected for north temperate populations (Hewitt 2004).
To test for the effects of natural selection, Zink (2005)analyzed our data set using 2 partitions of the ND2 gene(surface and transmembrane portions and synonymous–
nonsynonymous sites). Both partitions yielded similar esti-mates of UST, which suggested demographic expansion asthe cause of the shallow tree for P. major and not directionalor stabilizing natural selection (Zink 2005).
Notes on Evolutionary History of P. bokharensis
Kvist and others (2003) suggested that there was less or nohistoric habitat reduction for P. bokharensis because it prefersdeserts and semideserts, which is ‘‘the same kind of environ-ment that existed during the Ice Ages within its presentrange’’ based on the reconstruction by Adams (1997). Theestimate of Kvist and others (2003) of p (from 3 individuals)for P. bokharensis led them to conclude that ‘‘populations havebeen stable for a long time because . . . [they] . . . possessmore diversity than the minor and major groups.’’ We did notfind a higher p in P. bokharensis with our sample of 4 birds.We suggest more samples are needed to clarify the history ofP. bokharensis.
The Willow Tit P. montanus
Genetic Variability and Gene Flow
We analyzed 1039 aligned bp of ND2 after removing siteswith ambiguous characters. The 63 polymorphic sites (26parsimony informative) resolved 58 haplotypes among the139 individuals (Table 2). The most common haplotype(haplotype A in Figure 5) was shared by 44 individuals (32%of all individuals) from 12 populations: Moscow (N 5 2),Medvedevo (1), Mezen’ (2), Noyabr’sk (1), Gorno-Altay (2),Tyva (1), Irkutsk (11), Buryatiya (8), Mongolia (3), Primor’e (5),Khabarovsk (2), and Magadan (6) (Figure 5). Two othercommon haplotypes were found: haplotype B (Figure 5)had a restricted Far Eastern distribution and occurred in13 individuals from Kamchatka, Magadan, and Anadyr’and haplotype C was shared by 12 individuals from Mezen’,Noyabr’sk, Irkutsk, Buryatiya, Mongolia, Primor’e, andKhabarovsk. Several more haplotypes were shared amongpopulations (Figure 5). The occurrence of widespread hap-lotypes indicates considerable recent gene flow.
Table 3. Estimates of effective population size and demographic changes from ND2 data for samples of 10 or more individuals
‘‘Pooled reduced’’ refers to calculations omitting differentiated sampling sites of Parus montanus (Medvedevo, Anadyr’, and Kamchatka). HS is estimated
(in DNASP) from the number of segregating sites per nucleotide; s, H0, and H1 (calculated in ARLEQUIN) are parameters of the demographic expansion
model of Schneider and Excoffier (1999). All mismatch distributions except Irkutsk were unimodal, and none differed from the model of sudden expansion.
Given values of Tajima’s D, Fu’s Fs (ARLEQUIN), and R2 (DNASP) are significant at the P , 0.05 level unless denoted as ns, not significant, or ne, no
Overall haplotype diversity (0.88) was moderate andranged from 0.38 in Kamchatka to 1 in Medvedevo (Table 2).Overall nucleotide diversity was 0.0021 and ranged from0.0004 in Anadyr’ to 0.0032 in Mezen’ (Table 2). Relativelyhigh genetic diversity within P. montanus and the relativelylarge number of haplotypes found in our data and thoseof Kvist and others (2001) (Table 2) suggest a high long-term effective population size and an absence of recentbottlenecks.
Regressions of p on latitude were not significant (P .
0.05) for our data or for those of Kvist and others (2001)(Figure 3C). Longitude explained 60% of the variance ofp in our data with eastern birds having lower p (R2 5 0.6,P, 0.05), but no such trend was found for the data of Kvistand others (2001) (Figure 3D). Kvist and others (2001)reported a westward decrease in nucleotide diversity forsalicarius group (which includes most of the species’ distribu-tion excluding Kamchatka, Sakhalin, and Japan), from whichthey concluded that during the last Ice Ages P. montanus
occupied large regions of the southeastern Palearctic andcolonized the European (western) part of the range fromthe east. However, our regression analysis of their nucleotidediversity data did not find this trend to be a statistically sig-nificant (with or without Kamchatka, Sakhalin, and Japan).
Furthermore, our data show a significant trend in which
the eastern birds have lower nucleotide diversity (Figure 3D),
which might be a trace of past eastward range expansion.
This does not mean, however, that our results contradict
those of Kvist and others (2001). Low genetic diversity in
European samples is expected because during last glacial
maximum a large part of western Europe was under glacial
ice and was recolonized recently. As Figure 1 demonstrates,
the western samples of P. montanus of Kvist and others (2001)
are from western Europe, and the eastward increase of
nucleotide diversity might have resulted from their sampling
design. The discrepancy in interpretation reinforces the need
to have adequate geographic coverage.
Molecular Phylogenetic Analysis and Phylogeography
MODELTEST 3.06 suggested TrN þ G (Tamura and Nei
1993) with alpha 5 0.0153 as a most probable model of se-
quence evolution. This was the same model selected for the
P. major group, suggesting similar sequence evolution ofND2
gene in different parids. The monophyly of P. montanus was
supported by 100% of 100 ML bootstrap support replicates.
The ML haplotype tree (not shown) was geographically
unstructured, which can be seen in the network (Figure 5).Kvist and others (2001) also found a geographically unstruc-tured haplotype network and attributed it to high gene flow.However, they also suggested that gene flow might not becurrently high because of geographic differences in morphol-ogy and voice. Our haplotype network (Figure 5) shows thatsome haplotypes are restricted to Asia, suggesting limitedgene exchange for some eastern localities. Furthermore,our AMOVA showed that geographic localities explain10.8% of the total variation (P , 0.05). Most pairwiseUST values involving Anadyr’ (range 0–0.62) and Kamchatka(range 0–0.37) were large and significant (Table 4), indicatingrestricted or no gene flow between these and more westernpopulations. Zink (2005) explored the nature of highUST val-ues for these populations and found that they occurred be-cause of a replacement substitution at base position 452 thatwas shared by all Anadyr’ individuals and 4 of 5 birds fromKamchatka (haplotype B and 2 adjacent haplotypes fromAnadyr’ in Figure 5). Zink (2005) pointed out that althoughsignificant UST values might be a signature of incipient diver-gence caused by geographic isolation, they also might indicate
a selection for a new favorable haplotype. Because only a sin-gle substitution is involved, a definitive conclusion is unwar-ranted. Several pairwise UST values involving Medvedevo(range 0–0.18) were also significant (Table 4), further sup-porting restricted gene flow between western and easternpopulations. Significant pairwise UST values that are foundfor 2 northeastern populations (Anadyr’ and Kamchatka,subspecies anadyrensis and kamtchatkensis) and the populationfrom Japan (subspecies restrictus), Medvedevo, and Latvia(both belong to subspecies borealis), suggest that some pop-ulations of P. montanus are differentiated.
Populations diverging from a common ancestor gothrough a series of stages represented by gene trees thatare polyphyletic, then paraphyletic, and finally reciprocallymonophyletic with respect to geography (Avise 2000). Theexistence of significant UST values and a haplotype tree thatis not reciprocally monophyletic, but has some limited differ-entiation, suggests that P. montanus is at an intermediate stageof differentiation. The pattern of incomplete genetic dif-ferentiation coincides in part with phenotypic (subspecific)divergence.
Figure 5. Median-joining haplotype network for Parus montanus ND2 haplotypes. Each circle represents a unique haplotype, and
the size of the circle is proportional to the frequency of the haplotype in the sample. Small black dots represent unsampled
haplotypes, and lines connecting circles represent single mutations. Numbers within the circles indicate the total number of
individuals sharing the same haplotype; numbers in parenthesis indicate number of individuals from particular locality sharing the
same haplotype (if different from 1). Gray areas in the circles indicate the proportion of individuals from the Far Eastern
populations (Anadyr’, Primor’e, Khabarovsk, Magadan, and Kamchatka) sharing the same haplotype. Locality abbreviations are as
Kvist and others (2001) suggested that during Pleistocenecooling P. montanus was restricted to southeastern Asia andcolonized Eurasia (westward) when the climate warmed.However, if P. montanus’s range expanded from a refugium,then a large number of haplotypes from the refugial popu-lation is expected to be unique and most haplotypes fromrecently colonized areas are expected to be closely relatedto the common haplotype. Such a pattern was observedfor P. major (Figure 2), consistent with the findings of Kvistand others (2003). However, on haplotype networks forP. montanus (Figure 5 in this paper and Figure 2 in Kvistand others [2001]), haplotypes from the western and mosteastern, potentially refugial, populations were randomlydistributed (although in Kvist and others 2001 no easternindividuals shared the most common haplotype). Recon-structions of biomes during the last glacial maximum basedon pollen and plant macrofossils (Tarasov and others 1999)suggest that much of northeastern Europe and northwesternAsia were covered by tundra. Although P. montanus typicallybreeds in coniferous and mixed forests, it also inhabits woodyshrubs and riverine thickets extending to the tree line innorthern Eurasia and in mountainous regions (Harrap andQuinn 1995). Thus, Pleistocene tundra in northern Eurasiacould have provided suitable habitats for P. montanus. Theexistence of substantial genetic diversity in western popula-tions (see Figure 4 for comparison with P. major) suggests that
P. montanus, unlike P. major, was not subjected to drastic rangecontractions and during climate warming could have ex-panded eastward, as suggested by our data, as well as west-ward to Europe, as Kvist and others (2001) suggested. It isalso possible that historic range of P. montanus was split dur-ing the last Pleistocene cooling and some birds survived inrefugial forests of eastern Asia.
The mtDNA data are consistent with the hypothesis ofrange and population expansion. Mismatch distributions(Figure 4) for P. montanus populations did not differ from themodel of sudden population expansion and were unimodalfor all localities except Irkutsk. Population growth was alsosuggested by most values of Tajima’s D, Fu’s Fs, and R2 forall populations except Buryatiya. Thus, both P. major andP. montanus appear to have responded to post–Ice Age habitatamelioration by range and population expansion, although asdiscussed below, the details differ.
Different Evolutionary Histories of P. major, P. minor, andP. montanus
During the last glacial maximum, some broadleaved forestsof southeastern Asia were replaced by grassland vegetation.However, this part of the continent also contained severallarge refugial forests (Adams 1997) and, therefore, was apotential refuge for forest-dwelling birds. AlthoughP. montanus,like P. major and P. minor, is a cavity nester and its range largelyoverlaps with that of P. major, the evolutionary history ofP. montanus likely differed from that of its congeners, as evi-denced by higher values of p, H, and h and the low percent-age of individuals sharing a common haplotype (Table 5).A significant range restriction associated with Pleistocenecooling would be expected for P. major because they requireforested habitats and do not live in the brushy habitats of landunderlain with permafrost. Eastward decrease of geneticdiversity (Figure 3B) and low genetic diversity suggest thatP. major might have survived Pleistocene glaciations in smallnumbers in refugial forests of southern Europe and subse-quently expanded into eastern Eurasia. In contrast to P. major,P. montanus, whose range extends farther north, did not un-dergo as severe a population bottleneck but instead survivedin relatively large numbers in narrow riparian thickets in thewidespread north Eurasian ice-free areas where large river
Table 5. Summary of genetic characteristics for 3 species of Parus based on different sets of individuals, populations, and gene regions.Source—partial CR: data of Kvist and others (2001) (P. montanus) and Kvist and others (2003) (P. major and P. minor), ND2: this paper
Species Data set % Most com. hapl. h p HS Total UST s Tajima’s D Sample size
‘‘ND2 reduced’’ refers to calculations omitting sampling sites that are differentiated (Medvedevo, Anadyr’, and Kamchatka); %most com. hapl., proportion of
individuals sharing most common haplotype. Values of h, p, HS, s, and Tajima’s D were calculated in DNASP and UST in ARLEQUIN. Asterisk indicates
significance at P , 0.05 level; ns, not significant.
399
Pavlova et al. � Phylogeography of P. major and P. montanus
valleys were free of permafrost, as well as in refugial forestsof southeastern Asia.
The present range of P. minor is restricted to southeasternAsia, and it is thought that the species only recently has beenexpanding northward (Smirenskiy 1986; Harrap and Quinn1995). In fact, all but 5 haplotypes of P. minor in Kvistand others (2003) were unique and clustered according totheir geographic localities on the haplotype network (theirFigure 1), whereas only 2 of the 5 common haplotypes wereshared between populations. A nonrandom distribution ofhaplotypes and the large significant overall UST for P. minor(0.28, Table 5) indicate significant population subdivision, in-consistent with high gene flow expected from range expan-sion. For our only sample of P. minor (from Primor’e),significantly negative Tajima’s D and Fu’s Fs, significantR2 value (Table 3), and a starlike network where 46% indi-viduals shared the most common haplotype (Figure 2) indi-cated population growth, consistent with recent colonizationof Primor’e.
On the basis of similar nucleotide diversity for P. majorand P. minor, but higher theta within P. major (the results con-sistent with our findings, Table 5), Kvist and others (2003)suggested a greater degree of population expansion in P. majorthan in P. minor because theta is more influenced by currentpopulation size, whereas p reflects the historic size (Tajima1989). Given that the range of P. major is roughly 4 timesgreater than that of P. minor, this conclusion is not surprising.Time since expansion (s, Table 5) was small in P. major, in-termediate in P. minor, and large in P. montanus for all data sets,indicating that expansion in P. major was relatively recent. Infact, range expansion of P. major is known to have mirroredthe expansion of human settlements (Harrap and Quinn1995), and in some regions of the Russian Far East, the spe-cies’ presence is restricted to human habitations. In addition,introgression of major haplotypes into minor populations inthe Amur region hybrid zone and absence of foreign haplo-types in allopatric P. minor populations provide indirect evi-dence toward high philopatry in P. minor (Fedorov and othersforthcoming).
Thus, the genetic analyses of 3 codistributed sedentaryparids suggest that each species responded differently tothe environmental changes of the Ice Ages. These differentgenetic signatures are likely a result of differences in habitatuse and dispersal abilities.
Comparison of Genetic Parameters Derived fromCR and ND2
Regions of the mtDNA genome are known to evolve at dif-ferent rates, owing in part to selective constraints. The CR isoften considered the most variable, although this is not al-ways the case (Ruokonen and Kvist 2002). Despite the po-tential for different regions of mtDNA to evolve at differentrates, the entire gene has a single history owing to linkage.Nonetheless, it is of interest to make direct comparisonsof different gene regions as studies often compare levelsof variability across gene regions (Ruokonen and Kvist2002). For the 5 European populations of P. major, estimates
of nucleotide diversity were on average 1.64 times higherwhen computed from the partial 5#-end of the CR (Kvistand others 2003) than those calculated from the completeCR sequences (Kvist and others 1999) (Table 1), indicatingthat within species the 5#-end of the mitochondrial CR ismore variable than the 3#-end. This result was reported ear-lier for intraspecific comparisons in P. major, Parus caeruleus,and P. montanus (Ruokonen and Kvist 2002). However, forthe 2 Scandinavian populations of P. montanus studied byKvist and others (1998, 2001), the results were not consistent:pFinland was higher when estimated from partial (5#-end) CR,whereas pSweden was higher when estimated from completeCR sequences. Such inconsistency in the relative distributionof variation in CR sequences makes it hard to compare esti-mates of p obtained from different mitochondrial generegions. Although Ruokonen and Kvist (2002) suggested thatthe distribution of variation in CR is similar within genera,nucleotide diversity estimated from the 3#-end of the CRsequences for P. major, P. minor, and P. montanus (A Pavlova,RM Zink, S Rohwer, and S Drovetski, unpublished data;GenBank sequence numbers AY732496–AY732612 andAY732730–732868) yielded comparative results very differ-ent than those obtained from ND2 for the same sets of indi-viduals. For example, p from the 3#-end of CR was 0.0007,0.0034, and 0.0026 andH was 0.0046, 0.0114, and 0.0125 forP. major, P. minor, and P. montanus, respectively, whereas esti-mates of p fromND2 or 5#-end of CR were similarly low forP. major and P. minor andH was smallest in P. minor (Table 5).This example demonstrates that different parts of mitochon-drial genome, and even parts of the same gene region, evolvewith different rates in different taxa (even within genera), andcare must be used when interpreting results. Thus, molecularclock rates calibrated for coding genes should not be appliedfor CR data to avoid substantial overestimation of the ages ofpopulation/species splits. Furthermore, calibrations for differ-ent parts of the CR are not general.
Values of nucleotide diversity estimated from our ND2
data were consistently lower than those calculated from thepartial CR data of Kvist and others (2001, 2003). For the4 eastern populations of P. montanus (Magadan, Kamchatka,Khabarovsk [Amur], and Primor’e [Ussuri]), our samples andthose of Kvist and others (2001) overlapped (Figure 1B,Table 2). Comparisons of estimates of genetic diversity cal-culated from ND2 and partial CR for these populationsshowed that estimates of p from partial CR are on average2.9 times higher than from ND2 and estimates of h are 1.4times higher from partial CR than from ND2 (Table 5).Therefore, for Parus species, the 5#-end of CR yields moreintraspecific variation than either complete CR or ND2,and estimates of genetic diversity obtained from differentgenes cannot be compared directly.
Because it is always possible that CR sequences are nu-clear in origin, it is important to confirm general findings witha coding gene such as ND2, which can be more easilychecked for mitochondrial authenticity. Genetic parametersestimated from ND2 showed a pattern similar to the onefrom partial CR studies of Kvist and colleagues (Table 5).In all studies, haplotype diversity was low in P. major and
higher in P. minor and P. montanus, whereas nucleotide diver-sity was similar in P. major and P. minor and higher inP. montanus (Table 5). For P. montanus, we also computed ge-netic parameters for ourND2 data removing 3 sites (Anadyr’,Kamchatka, and Medvedevo) that had the majority of signif-icant pairwise UST values (Table 5) because population sub-structure, found both in Kvist and others (2003) and in ourstudy (Table 4), could confound the estimation of theseparameters. The relative values of the genetic parametersdid not change. Thus, although absolute values for parame-ters cannot be directly compared across gene regions, theoverall phylogeographic pattern is consistent.
AcknowledgmentsWe are grateful to B. Eddy, H. Furguson, and to the late G. Eddy for funding
fieldwork. Additional support came from the National Science Foundation
(DEB 9707496 and DEB 0212832) and the Dayton-Wilkie Natural History
fund. Tissue samples were provided by Burke Museum of Natural History
and Culture, University of Washington; Moscow State University Zoological
Museum, Moscow, Russia; and the Bell Museum of Natural History, Uni-
versity of Minnesota. We thank the Burke Museum for curatorial assistance
and M. Westberg for laboratory assistance. We also thank A. Andreev, V.
Andreev, Yu. Lohman, D. Banin, I. Karagodin, Ya. Red’kin, B. Schmidt,
V. Rohwer, C. S. Wood, X. Pu, V. Masterov, R. Faucett, G. Voelker,
V. Sotnikov, S. Birks, B. Barber, I. Fadeev, E. Nesterov, E. Koblik, and
A. Jones for logistical help with expeditions and collecting.
ReferencesAdams JM. 1997. Global land environments since the last interglacial. Oak
Ridge, TN: Oak Ridge National Laboratory. Available from: http://www.esd.
ornl.gov/projects/qen/nerc.html.
Avise JC. 2000. Phylogeography: The history and formation of species.
Cambridge, MA: Harvard University Press.
Bandelt H-J, Forster P, Rohl A. 1999. Median-joining networks for inferring