Artifi cial subsurface drainage is commonly used in midwestern agriculture and drainage losses of dissolved organic carbon (DOC) from such systems are an under-quantifi ed portion of the terrestrial carbon (C) cycle. Th e objectives of this study were to determine the eff ect of common agricultural management practices on DOC losses from subsurface tile drains and to assess patterns of loss as a function of year, time of year, and drainfl ow. Daily drainfl ow was collected across six water years (1999–2004) from a restored prairie grass system and cropping systems which include continuous corn (Zea mays L.) and corn-soybean [Glycine max (L.) Merr.] rotations fertilized with urea-ammonium-nitrate (UAN) or swine (Sus scrofa) manure lagoon effl uent. Th e DOC concentrations in tile drainfl ow were low, typically <2 mg L–1. Yearly DOC losses, which ranged from 1.78 to 8.61 kg ha–1, were not aff ected by management practices and were small compared to organic C inputs. Spring application of lagoon effl uent increased yearly fl ow-weighted (FW)-DOC concentrations relative to other cropping systems in three of the years and increased monthly FW-DOC concentrations when drainfl ow occurred within 1 mo of application. Drainfl ow was signifi cantly and positively correlated with DOC loss. Drainfl ow also aff ected DOC concentrations as greater 6-yr cumulative drainfl ow was associated with lower 6-yr FW-DOC concentrations and greater daily drainfl ow was associated with higher daily DOC concentrations. Our results indicate that lagoon effl uent application and fertilizer N rates do not aff ect long-term losses of DOC from tile drains and that drainfl ow is the main driver of DOC losses.
Dissolved Organic Carbon Losses from Tile Drained Agroecosystems
Matthew D. Ruark* University of Wisconsin–Madison
Sylvie M. Brouder and Ronald F. Turco Purdue University
Artificial subsurface tile drainage is a management practice for
improving crop production in poorly drained soils. Roughly 37%
of agricultural lands in the upper Midwest are tile drained, altering
the hydrologic pathways in these landscapes (Fausey et al., 1995).
Subsurface drainage decreases runoff losses of sediment, nutrients,
and chemicals, but increases infi ltration rates and leaching losses of
nutrients and chemicals (Skaggs et al., 1994). Tile drainage has been
shown to aff ect the cycling of organic C in managed agroecosystems
by altering the dominant water loss pathways (McTiernan et al.,
2001; Jacinthe et al., 2001). While many recent studies have focused
on tile drainage losses of nitrate (e.g., Huggins et al., 2001; Bakhsh
et al., 2002, 2005; Jaynes et al., 2001; Randall et al., 2003; Randall
and Vetsch, 2005; Kladivko et al., 1999, 2004) and pesticides (e.g.,
Kladivko et al., 1999, 2001), there is considerably less information
regarding losses of DOC. At the watershed-level, surface water fl ux
of DOC ranges from 10 to 100 kg ha–1 yr–1 (as reviewed by Hope
et al., 1994), with DOC fl uxes from small agricultural watersheds
in Indiana typically being <20 kg ha–1 yr–1 (Dalzell et al., 2007).
Th us, in watersheds dominated by tile-drained agriculture, it is
possible that tile drainage is an important contributor to the overall
DOC fl ux from the watershed, although the relative contribution
of tile drains to watershed scale DOC fl ux has not been quantifi ed
(Chantigny, 2003; McDowell, 2003).
Leaching losses of DOC from surface soils are usually small
compared to soil organic carbon (SOC) content or other C loss
pathways such as grain removal or gas fl ux (Brye et al., 2002). Mc-
Carty and Bremner (1992) reported that DOC concentrations
ranged between <0.3 to 2.9 mg L–1 from tile drains in central Iowa
and Beauchemin et al. (2003) reported average DOC concentra-
tions between 1.58 to 6.03 mg L–1 in tile drains in Quebec, Canada,
but DOC mass losses were not quantifi ed. Kovacic et al. (2000)
reported that average DOC concentrations in tile drainage ranged
between 2.6 and 3.6 mg L–1 in eastern Illinois, Owens et al. (2002)
determined that DOC concentrations in subsurface soil leachate
water (2.4 m depth) ranged from 0.5 to 3.2 mg L–1 in eastern Ohio,
and Brye et al. (2001) reported typical DOC concentrations be-
tween 5 and 20 mg L–1 in subsurface soil leachate (1.4 m depth)
in central Wisconsin. Th e DOC concentrations in Kovacic et al.
(2000), Owens et al. (2002), and Brye et al. (2001) translate to an-
Corn SLE Corn Spring injection Effl uent¶ 190 to 210 8230d 20.9ab
Corn FLE Corn Fall injection Effl uent 230 to 260 8140d 23.2ab
† 6-yr average corn and soybean yields (1998–2003). Corn yields followed by diff erent lowercase letters are signifi cantly diff erent (P ≤ 0.05).
‡ SOC, average soil organic carbon content (collected in the fall of 1999, 2000, 2003, and 2004). The SOC contents followed by diff erent lowercase letters
6-yr average daily DOC concentration, average SOC content, and
estimated 6-yr cumulative crop residue. If drainage plots did not
have any yearly, seasonal, or monthly drainfl ow, the corresponding
FW-DOC concentrations was treated as missing data.
Regression analysis was used to characterize relationships
between drainfl ow and DOC fl ux. Th e drainfl ow-DOC fl ux
relationship was determined across two time scales: 6-yr and
daily. Th e relationship between 6-yr cumulative drainfl ow and
6-yr DOC fl ux was determined across all 48 tile drains, while
the relationship between daily drainfl ow and daily DOC fl ux
was determined among all tiles and all days with concentra-
tions greater than the minimum detection limit (0.5 mg L–1)
and fl ow rates >0.1 mm d–1. For each time scale, both variables
were log-transformed and fi t with a linear regression model
(SAS Proc. REG). Th e resulting expression was converted to
the simplifi ed expression based on non log-transformed data:
L = aQb [1]
where L = solute fl ux and Q = drainage fl ow rate. Th e exponent b
in Eq. [1] represents the slope in the linear relationship between
the log-transformed values of drainfl ow and DOC fl ux. Ninety-
fi ve percent confi dence intervals of the slope (b) were determined
with Proc. REG to test whether b was signifi cantly diff erent from
1. Slope values less than, greater than, and equal to one indicate
solute concentrations are decreasing with, increasing with, and
unaff ected by increasing drainfl ow, respectively.
ResultsYearly corn yields, averaged across all treatments, ranged from
7660 kg ha–1 (in 1998) to 9790 kg ha–1 (in 1999). Among crop
management treatments, CBH, CCH, and CBM had the highest
6-yr average corn yields (9630, 9390, and 9170 kg ha–1, respec-
tively) and were signifi cantly greater than the two lowest yielding
corn plots, SLE and FLE (8230 and 8140 kg ha–1, respectively)
(Table 1). Yearly soybean yields, averaged across all treatments,
ranged from 1310 kg ha–1 (in 1999) to 4090 kg ha–1 (in 2002).
Analysis of variance determined no eff ect of crop management
on 6-yr average soybean yield. Th e SOC content exhibited rela-
tively large variation within each management treatment, with
coeffi cients of variation (CV) ranging between 9.2 to 19.0%.
Th ere was a signifi cant eff ect of cropping system on SOC con-
tent, but the only signifi cant diff erence was between the treat-
ment with the greatest SOC content (CCL) and the treatment
with the lowest SOC content (CBL) (Table 1).
Drainfl ow and RainfallTh e 6-yr cumulative and yearly drainfl ows were not signifi cantly
diff erent among the experimental blocks or among agricultural
management treatments. Univariate statistics of 6-yr cumulative
Ruark et al.: Dissolved Organic C Losses from Tile Drained Agroecosystems 1209
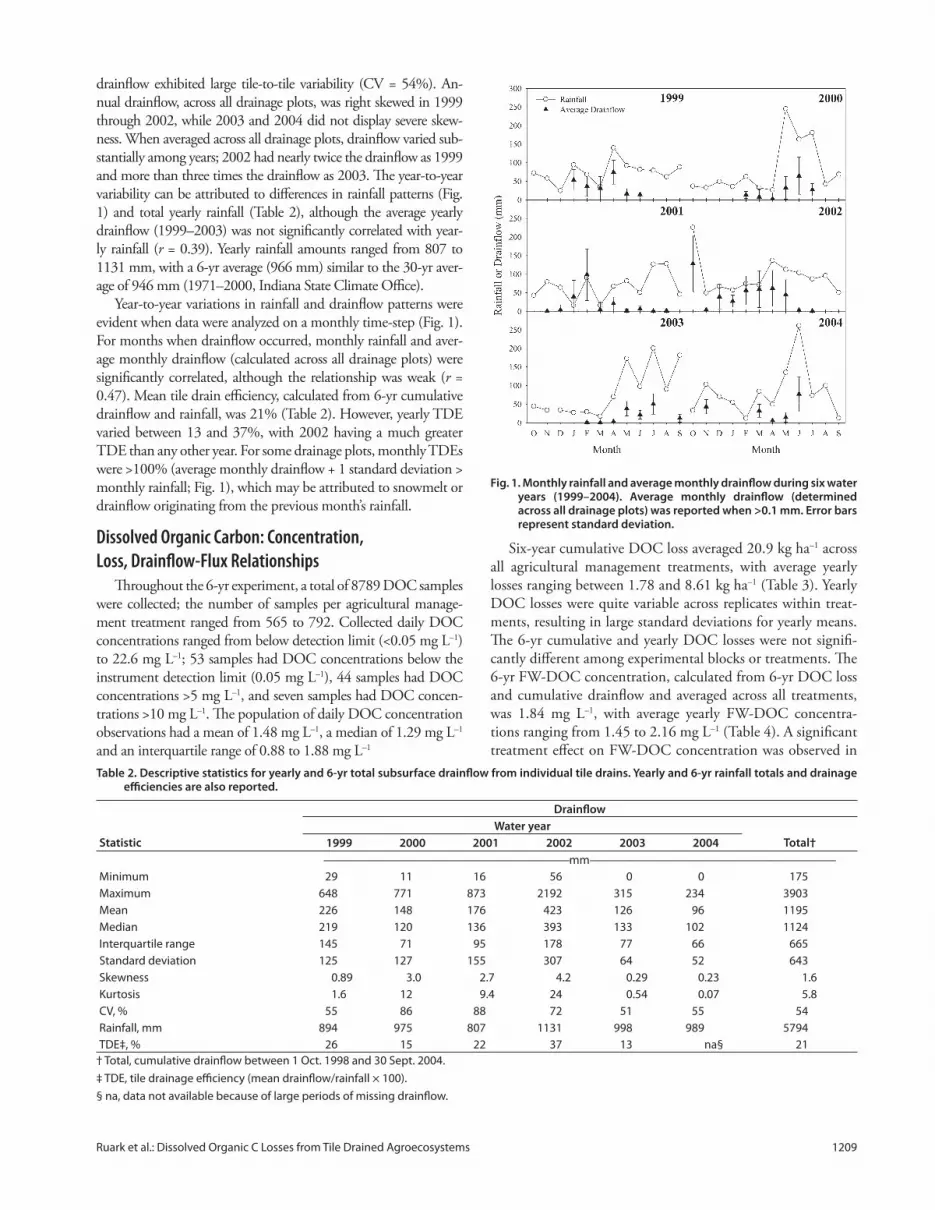
drainfl ow exhibited large tile-to-tile variability (CV = 54%). An-
nual drainfl ow, across all drainage plots, was right skewed in 1999
through 2002, while 2003 and 2004 did not display severe skew-
ness. When averaged across all drainage plots, drainfl ow varied sub-
stantially among years; 2002 had nearly twice the drainfl ow as 1999
and more than three times the drainfl ow as 2003. Th e year-to-year
variability can be attributed to diff erences in rainfall patterns (Fig.
1) and total yearly rainfall (Table 2), although the average yearly
drainfl ow (1999–2003) was not signifi cantly correlated with year-
ly rainfall (r = 0.39). Yearly rainfall amounts ranged from 807 to
1131 mm, with a 6-yr average (966 mm) similar to the 30-yr aver-
age of 946 mm (1971–2000, Indiana State Climate Offi ce).
Year-to-year variations in rainfall and drainfl ow patterns were
evident when data were analyzed on a monthly time-step (Fig. 1).
For months when drainfl ow occurred, monthly rainfall and aver-
age monthly drainfl ow (calculated across all drainage plots) were
signifi cantly correlated, although the relationship was weak (r =
0.47). Mean tile drain effi ciency, calculated from 6-yr cumulative
drainfl ow and rainfall, was 21% (Table 2). However, yearly TDE
varied between 13 and 37%, with 2002 having a much greater
TDE than any other year. For some drainage plots, monthly TDEs
were >100% (average monthly drainfl ow + 1 standard deviation >
monthly rainfall; Fig. 1), which may be attributed to snowmelt or
drainfl ow originating from the previous month’s rainfall.
Dissolved Organic Carbon: Concentration,
Loss, Drainfl ow-Flux RelationshipsTh roughout the 6-yr experiment, a total of 8789 DOC samples
were collected; the number of samples per agricultural manage-
ment treatment ranged from 565 to 792. Collected daily DOC
concentrations ranged from below detection limit (<0.05 mg L–1)
to 22.6 mg L–1; 53 samples had DOC concentrations below the
instrument detection limit (0.05 mg L–1), 44 samples had DOC
concentrations >5 mg L–1, and seven samples had DOC concen-
trations >10 mg L–1. Th e population of daily DOC concentration
observations had a mean of 1.48 mg L–1, a median of 1.29 mg L–1
and an interquartile range of 0.88 to 1.88 mg L–1
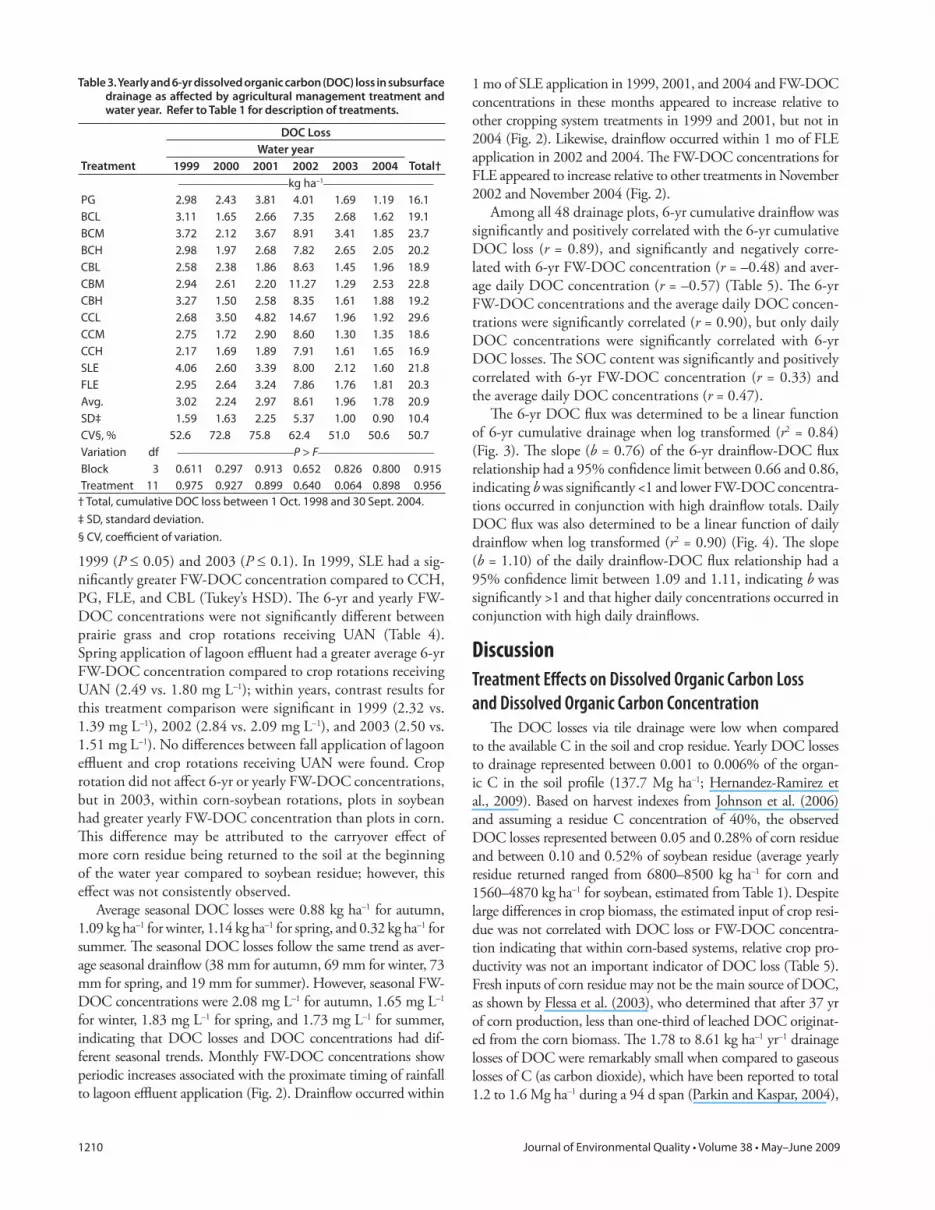
Six-year cumulative DOC loss averaged 20.9 kg ha–1 across
all agricultural management treatments, with average yearly
losses ranging between 1.78 and 8.61 kg ha–1 (Table 3). Yearly
DOC losses were quite variable across replicates within treat-
ments, resulting in large standard deviations for yearly means.
Th e 6-yr cumulative and yearly DOC losses were not signifi -
cantly diff erent among experimental blocks or treatments. Th e
6-yr FW-DOC concentration, calculated from 6-yr DOC loss
and cumulative drainfl ow and averaged across all treatments,
was 1.84 mg L–1, with average yearly FW-DOC concentra-
tions ranging from 1.45 to 2.16 mg L–1 (Table 4). A signifi cant
treatment eff ect on FW-DOC concentration was observed in
Fig. 1. Monthly rainfall and average monthly drainfl ow during six water years (1999–2004). Average monthly drainfl ow (determined across all drainage plots) was reported when >0.1 mm. Error bars represent standard deviation.
Table 2. Descriptive statistics for yearly and 6-yr total subsurface drainfl ow from individual tile drains. Yearly and 6-yr rainfall totals and drainage effi ciencies are also reported.
Drainfl ow
Water year
Statistic 1999 2000 2001 2002 2003 2004 Total†
———————–––—————————————mm—————–––———————————————
Minimum 29 11 16 56 0 0 175
Maximum 648 771 873 2192 315 234 3903
Mean 226 148 176 423 126 96 1195
Median 219 120 136 393 133 102 1124
Interquartile range 145 71 95 178 77 66 665
Standard deviation 125 127 155 307 64 52 643
Skewness 0.89 3.0 2.7 4.2 0.29 0.23 1.6
Kurtosis 1.6 12 9.4 24 0.54 0.07 5.8
CV, % 55 86 88 72 51 55 54
Rainfall, mm 894 975 807 1131 998 989 5794
TDE‡, % 26 15 22 37 13 na§ 21
† Total, cumulative drainfl ow between 1 Oct. 1998 and 30 Sept. 2004.
1999 (P ≤ 0.05) and 2003 (P ≤ 0.1). In 1999, SLE had a sig-
nifi cantly greater FW-DOC concentration compared to CCH,
PG, FLE, and CBL (Tukey’s HSD). Th e 6-yr and yearly FW-
DOC concentrations were not signifi cantly diff erent between
prairie grass and crop rotations receiving UAN (Table 4).
Spring application of lagoon effl uent had a greater average 6-yr
FW-DOC concentration compared to crop rotations receiving
UAN (2.49 vs. 1.80 mg L–1); within years, contrast results for
this treatment comparison were signifi cant in 1999 (2.32 vs.
1.39 mg L–1), 2002 (2.84 vs. 2.09 mg L–1), and 2003 (2.50 vs.
1.51 mg L–1). No diff erences between fall application of lagoon
effl uent and crop rotations receiving UAN were found. Crop
rotation did not aff ect 6-yr or yearly FW-DOC concentrations,
but in 2003, within corn-soybean rotations, plots in soybean
had greater yearly FW-DOC concentration than plots in corn.
Th is diff erence may be attributed to the carryover eff ect of
more corn residue being returned to the soil at the beginning
of the water year compared to soybean residue; however, this
eff ect was not consistently observed.
Average seasonal DOC losses were 0.88 kg ha–1 for autumn,
1.09 kg ha–1 for winter, 1.14 kg ha–1 for spring, and 0.32 kg ha–1 for
summer. Th e seasonal DOC losses follow the same trend as aver-
age seasonal drainfl ow (38 mm for autumn, 69 mm for winter, 73
mm for spring, and 19 mm for summer). However, seasonal FW-
DOC concentrations were 2.08 mg L–1 for autumn, 1.65 mg L–1
for winter, 1.83 mg L–1 for spring, and 1.73 mg L–1 for summer,
indicating that DOC losses and DOC concentrations had dif-
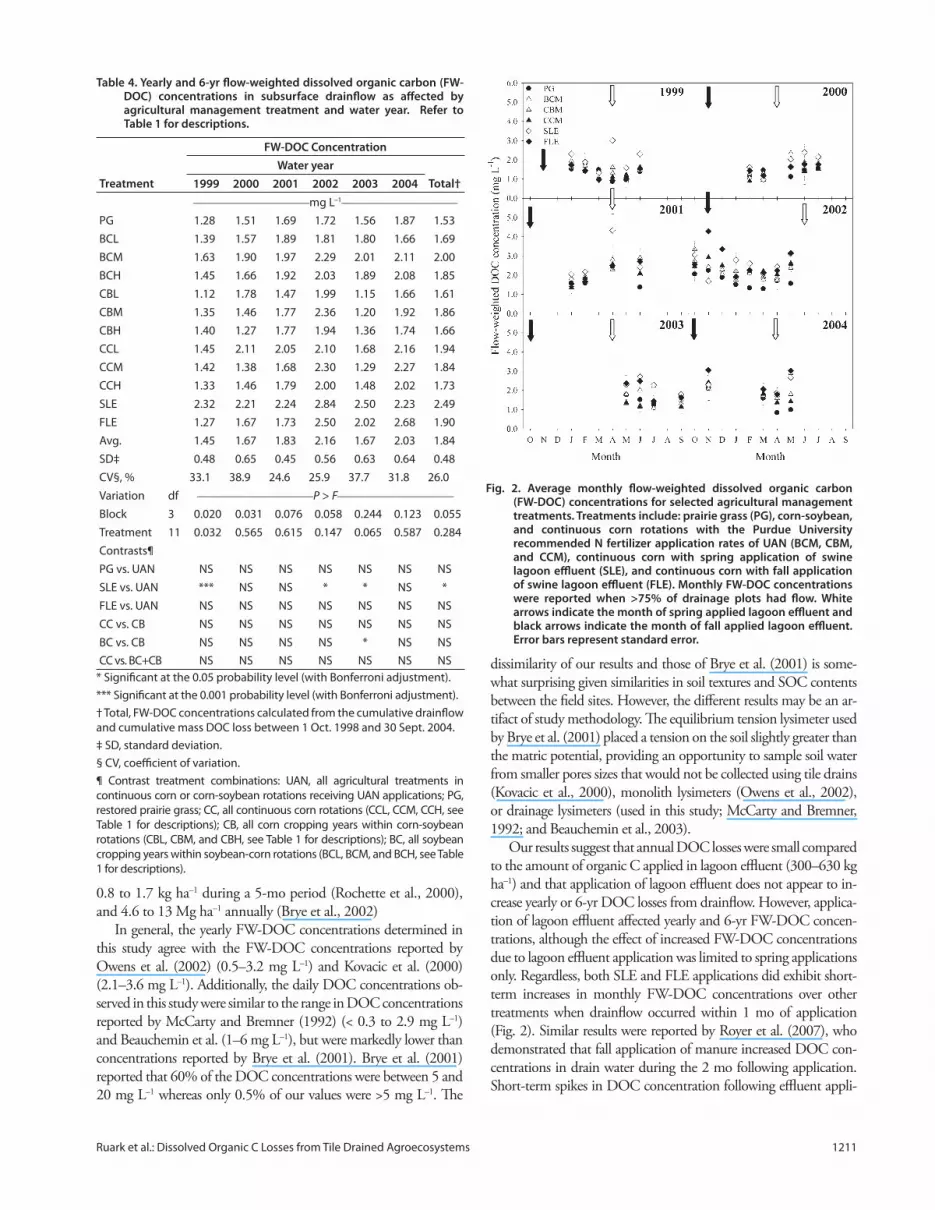
ferent seasonal trends. Monthly FW-DOC concentrations show
periodic increases associated with the proximate timing of rainfall
to lagoon effl uent application (Fig. 2). Drainfl ow occurred within
1 mo of SLE application in 1999, 2001, and 2004 and FW-DOC
concentrations in these months appeared to increase relative to
other cropping system treatments in 1999 and 2001, but not in
2004 (Fig. 2). Likewise, drainfl ow occurred within 1 mo of FLE
application in 2002 and 2004. Th e FW-DOC concentrations for
FLE appeared to increase relative to other treatments in November
2002 and November 2004 (Fig. 2).
Among all 48 drainage plots, 6-yr cumulative drainfl ow was
signifi cantly and positively correlated with the 6-yr cumulative
DOC loss (r = 0.89), and signifi cantly and negatively corre-
lated with 6-yr FW-DOC concentration (r = –0.48) and aver-
age daily DOC concentration (r = –0.57) (Table 5). Th e 6-yr
FW-DOC concentrations and the average daily DOC concen-
trations were signifi cantly correlated (r = 0.90), but only daily
DOC concentrations were signifi cantly correlated with 6-yr
DOC losses. Th e SOC content was signifi cantly and positively
correlated with 6-yr FW-DOC concentration (r = 0.33) and
the average daily DOC concentrations (r = 0.47).
Th e 6-yr DOC fl ux was determined to be a linear function
of 6-yr cumulative drainage when log transformed (r2 = 0.84)
(Fig. 3). Th e slope (b = 0.76) of the 6-yr drainfl ow-DOC fl ux
relationship had a 95% confi dence limit between 0.66 and 0.86,
indicating b was signifi cantly <1 and lower FW-DOC concentra-
tions occurred in conjunction with high drainfl ow totals. Daily
DOC fl ux was also determined to be a linear function of daily
drainfl ow when log transformed (r2 = 0.90) (Fig. 4). Th e slope
(b = 1.10) of the daily drainfl ow-DOC fl ux relationship had a
95% confi dence limit between 1.09 and 1.11, indicating b was
signifi cantly >1 and that higher daily concentrations occurred in
conjunction with high daily drainfl ows.
Discussion
Treatment Eff ects on Dissolved Organic Carbon Loss
and Dissolved Organic Carbon ConcentrationTh e DOC losses via tile drainage were low when compared
to the available C in the soil and crop residue. Yearly DOC losses
to drainage represented between 0.001 to 0.006% of the organ-
ic C in the soil profi le (137.7 Mg ha–1; Hernandez-Ramirez et
al., 2009). Based on harvest indexes from Johnson et al. (2006)
and assuming a residue C concentration of 40%, the observed
DOC losses represented between 0.05 and 0.28% of corn residue
and between 0.10 and 0.52% of soybean residue (average yearly
residue returned ranged from 6800–8500 kg ha–1 for corn and
1560–4870 kg ha–1 for soybean, estimated from Table 1). Despite
large diff erences in crop biomass, the estimated input of crop resi-
due was not correlated with DOC loss or FW-DOC concentra-
tion indicating that within corn-based systems, relative crop pro-
ductivity was not an important indicator of DOC loss (Table 5).
Fresh inputs of corn residue may not be the main source of DOC,
as shown by Flessa et al. (2003), who determined that after 37 yr
of corn production, less than one-third of leached DOC originat-
ed from the corn biomass. Th e 1.78 to 8.61 kg ha–1 yr–1 drainage
losses of DOC were remarkably small when compared to gaseous
losses of C (as carbon dioxide), which have been reported to total
1.2 to 1.6 Mg ha–1 during a 94 d span (Parkin and Kaspar, 2004),
Table 3. Yearly and 6-yr dissolved organic carbon (DOC) loss in subsurface drainage as aff ected by agricultural management treatment and water year. Refer to Table 1 for description of treatments.
Ruark et al.: Dissolved Organic C Losses from Tile Drained Agroecosystems 1211
0.8 to 1.7 kg ha–1 during a 5-mo period (Rochette et al., 2000),
and 4.6 to 13 Mg ha–1 annually (Brye et al., 2002)
In general, the yearly FW-DOC concentrations determined in
this study agree with the FW-DOC concentrations reported by
Owens et al. (2002) (0.5–3.2 mg L–1) and Kovacic et al. (2000)
(2.1–3.6 mg L–1). Additionally, the daily DOC concentrations ob-
served in this study were similar to the range in DOC concentrations
reported by McCarty and Bremner (1992) (< 0.3 to 2.9 mg L–1)
and Beauchemin et al. (1–6 mg L–1), but were markedly lower than
concentrations reported by Brye et al. (2001). Brye et al. (2001)
reported that 60% of the DOC concentrations were between 5 and
20 mg L–1 whereas only 0.5% of our values were >5 mg L–1. Th e
dissimilarity of our results and those of Brye et al. (2001) is some-
what surprising given similarities in soil textures and SOC contents
between the fi eld sites. However, the diff erent results may be an ar-
tifact of study methodology. Th e equilibrium tension lysimeter used
by Brye et al. (2001) placed a tension on the soil slightly greater than
the matric potential, providing an opportunity to sample soil water
from smaller pores sizes that would not be collected using tile drains
(Kovacic et al., 2000), monolith lysimeters (Owens et al., 2002),
or drainage lysimeters (used in this study; McCarty and Bremner,
1992; and Beauchemin et al., 2003).
Our results suggest that annual DOC losses were small compared
to the amount of organic C applied in lagoon effl uent (300–630 kg
ha–1) and that application of lagoon effl uent does not appear to in-
crease yearly or 6-yr DOC losses from drainfl ow. However, applica-
tion of lagoon effl uent aff ected yearly and 6-yr FW-DOC concen-
trations, although the eff ect of increased FW-DOC concentrations
due to lagoon effl uent application was limited to spring applications
only. Regardless, both SLE and FLE applications did exhibit short-
term increases in monthly FW-DOC concentrations over other
treatments when drainfl ow occurred within 1 mo of application
(Fig. 2). Similar results were reported by Royer et al. (2007), who
demonstrated that fall application of manure increased DOC con-
centrations in drain water during the 2 mo following application.
Short-term spikes in DOC concentration following effl uent appli-
Table 4. Yearly and 6-yr fl ow-weighted dissolved organic carbon (FW-DOC) concentrations in subsurface drainfl ow as aff ected by agricultural management treatment and water year. Refer to Table 1 for descriptions.
* Signifi cant at the 0.05 probability level (with Bonferroni adjustment).
*** Signifi cant at the 0.001 probability level (with Bonferroni adjustment).
† Total, FW-DOC concentrations calculated from the cumulative drainfl ow
and cumulative mass DOC loss between 1 Oct. 1998 and 30 Sept. 2004.
‡ SD, standard deviation.
§ CV, coeffi cient of variation.
¶ Contrast treatment combinations: UAN, all agricultural treatments in
continuous corn or corn-soybean rotations receiving UAN applications; PG,
restored prairie grass; CC, all continuous corn rotations (CCL, CCM, CCH, see
Table 1 for descriptions); CB, all corn cropping years within corn-soybean
rotations (CBL, CBM, and CBH, see Table 1 for descriptions); BC, all soybean
cropping years within soybean-corn rotations (BCL, BCM, and BCH, see Table
1 for descriptions).
Fig. 2. Average monthly fl ow-weighted dissolved organic carbon (FW-DOC) concentrations for selected agricultural management treatments. Treatments include: prairie grass (PG), corn-soybean, and continuous corn rotations with the Purdue University recommended N fertilizer application rates of UAN (BCM, CBM, and CCM), continuous corn with spring application of swine lagoon effl uent (SLE), and continuous corn with fall application of swine lagoon effl uent (FLE). Monthly FW-DOC concentrations were reported when >75% of drainage plots had fl ow. White arrows indicate the month of spring applied lagoon effl uent and black arrows indicate the month of fall applied lagoon effl uent. Error bars represent standard error.
cation may, in part, refl ect the effl uent’s DOC moving through the
preferential fl ow pathways of macroporus soil. Both the nature and
drivers of DOC concentration dynamics in relation to lagoon effl u-
ent applications require further investigation.
In this study, restoration of prairie grass on tile drained soils did
not appear to aff ect drainfl ow, DOC losses, or FW-DOC concen-
trations. Th ese results were in contrast to Brye et al. (2001), who
observed large diff erences in 4-yr cumulative drainfl ow between a
chisel-plowed agroecosystem and a restored prairie (1575 and 461
mm, respectively); these drainage diff erences were associated with
a twofold diff erence in DOC loss (annual cropping system > prai-
rie). Additionally, the DOC concentrations in the agricultural soils
were typically higher than in the prairie soils (Brye et al., 2001).
Our results, however, are similar to those by Owens et al. (2002),
who reported similar DOC losses and concentrations in subsur-
face fl ow between pasturelands and corn-soybean rotations.
Univariate statistics of within-year and 6-yr variation in
drainfl ow and effi ciency (Table 2) indicate a large variability
in hydrologic properties among the relatively small drainage
plots. Yet previous studies have suggested this degree of varia-
tion in tile performance is typical. In a 36 plot (4446 m2 plots,
1.2 m depth, 28.5 m spacing), 6-yr study, Bakhsh and Kan-
war (2004) reported annual CV values for drainfl ow between
39 and 85%, which are similar to our CV values (51–88%).
Likewise, within years, the Bakhsh and Kanwar (2004) obser-
vations were also right-skewed around the mean although the
degree of skewness (0.89 and 2.3) was less than observed in this
study (0.23–4.2). Although plot-to-plot variability was high,
our average yearly TDEs were similar to TDEs in southern
Minnesota (36%; Jin and Sands, 2003) and southern Indiana
(13–16%; Kladivko et al., 2004).
Drainfl ow-Dissolved Organic Carbon Flux RelationshipsAmong tiles, the single greatest determinant of DOC loss
was drainfl ow. Th is relationship was observable and signifi cant
on a daily and 6-yr cumulative loss basis, the extremes of the
timescale examined in this study. Studies of nitrate fl ux from
individual tiles (Hofmann et al., 2004; Tomer et al., 2003)
Table 5. Correlation matrix of selected measured variables from individual drainage plots determined from 1 Oct. 1998 through 30 Sept. 2004. Variables are 6-yr cumulative totals or 6-yr averages per drainage plot.
Cumulative drainfl ow L 48 –0.57*** 0.89*** –0.48***
Average SOC† mg kg–1 48 0.47*** 0.05 0.33*
Estimated cumulative residue‡ kg 44 0.22 0.12 0.22
* Signifi cant at the 0.05 probability level.
*** Signifi cant at the 0.001 probability level.
† SOC, soil organic carbon (0–20 cm, averaged across 1999, 2000, 2003, and 2004 soil samples).
‡ Estimated cumulative residue returned after harvest, using a harvest index of 0.53 and 0.46 for corn and soybean, respectively (Johnson et al., 2006).
Plots with prairie grass were not included because there were no estimates of residue return.
Fig. 4. Relationship between daily drainfl ow and daily dissolved organic carbon (DOC) fl ux presented on a log-log scale. Each data point represents daily drainfl ow and daily DOC fl ux from individual drainage plots from days when samples were collected and when daily drainfl ow was >0.1 mm d–1. Exponent (b) and coeffi cient (a) values are defi ned by Eq. [1] and r2 values were determined by linear regression on log-transformed drainfl ow and DOC fl ux values. Iso-lines for 0.5 and 3 mg L–1 are provided for orientation.
Fig. 3. Relationship between 6-yr cumulative drainfl ow and 6-yr dissolved organic carbon (DOC) fl ux presented on a log-log scale. Each data point represents total values from an individual drainage plot. Exponent (b) and coeffi cient (a) values are defi ned by Eq. [1] and r2 values were determined by linear regression on log-transformed drainfl ow and DOC fl ux values. Iso-lines for 1 and 3 mg L–1 are provided for orientation.
2003. Prediction of phosphorus concentration in tile-drainage water from the Montreal Lowlands soils. Can. J. Soil Sci. 83:73–87.
Bol, R., N.J. Ostle, C. Friedrich, W. Amelung, and I. Sanders. 1999. Th e infl uence of dung amendments on dissolved organic matter in grassland soil leachates—Preliminary results from a lysimeter study. Isot. Environ. Health Stud. 35:97–109.
Bremner, J.M. 1996. Nitrogen–Total. p. 1085–1121. In D.L. Sparks (ed.) Methods of soil analysis. Part 3. SSSA Book Ser. no 5. SSSA and ASA, Madison, WI.
Brye, K.R., S.T. Gower, J.M. Norman, and L.G. Bundy. 2002. Carbon budgets for a prairie and agroecosystems: Eff ects of land use and interannual variability. Ecol. Appl. 12:962–979.
Brye, K.R., J.M. Norman, L.G. Bundy, and S.T. Gower. 2001. Nitrogen and carbon leaching in agroecosystems and their role in denitrifi cation potential. J. Environ. Qual. 30:58–70.
Campbell, C.A., G.P. Lafond, V.O. Biederbeck, G. Wen, J. Schoenau, and D. Hahn. 1999. Seasonal trends in soil biochemical attributes: Eff ects of crop management on a Black Chernozem. Can. J. Soil Sci. 79:85–97.
Chantigny, M.H. 2003. Dissolved and water-extractable organic matter in soils: A review on the infl uence of land use and management practices. Geoderma 113:357–380.
Clay, D.E., S.A. Clay, Z. Liu, and S.S. Harper. 1995. Leaching of dissolved organic carbon in soil following anhydrous ammonia application. Biol. Fertil. Soils 19:10–14.
Dalzell, B.J., T.R. Filley, and J.M. Harbor. 2007. Th e role of hydrology in annual organic carbon loads and terrestrial organic matter export from a midwestern agricultural watershed. Geochim. Cosmochim. Acta 71:1448–1462.
Eigel, J.D., R.F. Turco, and E.J. Kladivko. 1992. Slurry trenching to isolate water quality research plots. Paper 922066. American Soc. of Agric. Engineers, St. Joseph, MI.
Fausey, N.R., L.C. Brown, H.W. Belcher, and R.S. Kanwar. 1995. Drainage and water quality in Great Lakes and Cornbelt States. J. Irrig. Drain. Div. Am. Soc. Civ. Eng. 121:283–288.
Flessa, H., B. Ludwig, B. Heil, and W. Merbach. 2003. Th e origin of soil organic C, dissolved organic C and respiration in a long-term maize experiment in Halle, Germany, determined by 13C natural abundance. J. Plant Nutr. Soil Sci. 163:157–163.
Franchini, J.C., F.J. Gonzalez-Vila, F. Cabrera, M. Miyazawa, and M.A. Paven. 2001. Rapid transformation of plant water-soluble organic compounds in relation to cation mobilization in an acid Oxisol. Plant Soil 231:55–63.
Gentry, L.E., M.B. David, K.M. Smith-Starks, and D.A. Kovacic. 2000. Nitrogen fertilizer and herbicide transport from tile drained fi elds. J. Environ. Qual. 29:232–240.
Hernandez-Ramirez, G., S.M. Brouder, D.R. Smith, and G.E. Van Scoyoc. 2009. Carbon and nitrogen dynamics in an eastern corn belt soil: Nitrogen source and rotation. Soil Sci. Soc. Am. J. 73:128–137.
Hofmann, B.S., S.M. Brouder, and R.F. Turco. 2004. Tile spacing impacts on Zea mays L. yield and drainage water nitrate load. Ecol. Eng. 23:251:267.
Hope, D., M.F. Billett, and M.S. Cresser. 1994. A review of the export of carbon in river water: Fluxes and processes. Environ. Pollut. 84:301–324.
Huggins, D.R., G.W. Randall, and M.P. Russelle. 2001. Subsurface drain losses of water and nitrate following conversion of perennials to row crops. Agron. J. 93:477–486.
Jacinthe, P.A., R. Lal, and J.M. Kimble. 2001. Organic carbon storage and dynamics in croplands and terrestrial deposits as infl uenced by subsurface tile drainage. Soil Sci. 166:322–335.
Jamieson, R.C., R.J. Gordon, K.E. Sharples, G.W. Stratton, and A. Madani. 2002. Movement and persistence of fecal bacteria in agricultural soils and subsurface drainage water: A review. Can. Biosys. Eng. 44: 1.1–1.9.
Jaynes, D.B., T.S. Colvin, D.L. Karlen, C.A. Cambardella, and D.W. Meek. 2001. Nitrate loss in subsurface drainage as aff ected by nitrogen fertilizer rate. J. Environ. Qual. 30:1305–1314.
Jin, C.X., and G.R. Sands. 2003. Th e long-term fi eld-scale hydrology of subsurface drainage systems in a cold climate. Trans. ASAE 46:1011–1021.
Johnson, J.M.F., R.R. Allmaras, and D.C. Reicosky. 2006. Estimating source carbon from crop residues, roots and rhizodeposits using the national grain-yield database. Agron. J. 98:622–636.
Jury, W. 1982. Simulation of solute transport using a transfer function model. Water Resour. Res. 18:363–368.
Kaiser, K., G. Guggenberger, and W. Zech. 2000. Organically bound nutrients in dissolved organic matter fractions in seepage and pore water of weakly developed forest soils. Acta Hydrochim. Hydrobiol. 28:411–419.
Kalbitz, K., S. Solinger, J.H. Park, B. Michalzik, and E. Matzner. 2000. Controls on the dynamics of dissolved organic carbon: A review. Soil Sci. 165:277–304.
Kladivko, E.J., L.C. Brown, and J.L. Baker. 2001. Pesticide transport to subsurface tile drains in humid regions of North America. Crit. Rev. Environ. Sci. Technol. 31:1–62.
Kladivko, E.J., J.R. Frankenberger, D.B. Jaynes, D.W. Meek, B.J. Jenkinson, and N.R. Fausey. 2004. Nitrate leaching to subsurface drains as aff ected by drain spacing and changes in crop production system. J. Environ. Qual. 33:1803–1813.
Kladivko, E.J., J. Grochulska, R.F. Turco, G.E. Van Scoyoc, and J.D. Eigel. 1999. Pesticide and nitrate transport into subsurface tile drains of diff erent spacings. J. Environ. Qual. 28:997–1004.
Kovacic, D.A., M.B. David, L.E. Gentry, K.M. Starks, and R.A. Cooke. 2000. Eff ectiveness of constructed wetlands in reducing nitrogen and phosphorus export from agricultural tile drainage. J. Environ. Qual. 29:1262–1274.
Kung, K.J.S., T.S. Steenhuis, E.J. Kladivko, T.J. Gish, G. Bubenzer, and C.S. Helling. 2000. Impact of preferential fl ow on the transport of adsorbing and non-adsorbing tracers. Soil Sci. Soc. Am. J. 64:1290–1296.
Lennartz, B., J. Michaelsen, W. Wichtmann, and P. Widmoser. 1999. Time variance analysis of preferential solute movement at a tile-drained fi eld site. Soil Sci. Soc. Am. J. 63:39–47.
Lorenz, K., and R. Lal. 2005. Th e depth distribution of soil organic carbon in relation to land use and management and the potential of carbon sequestration in subsoil horizons. Adv. Agron. 88:35–66.
Mazzarino, M.J., L. Szott, and M. Jimenez. 1993. Dynamics of soil total C and N, microbial biomass, and water-soluble C in tropical agroecosystems. Soil Biol. Biochem. 25:205–214.
McCarty, G.W., and J.M. Bremner. 1992. Availability of organic carbon for denitrifi cation of nitrate in subsoils. Biol. Fertil. Soils 14:219–222.
McDowell, W.H. 2003. Dissolved organic matter in soils–Future directions and unanswered questions. Geoderma 113:179–186.
McTiernan, K.B., S.C. Jarvis, D. Scholefi eld, and M.H.B. Hayes. 2001. Dissolved organic carbon from grazed grasslands under diff erent management regimes. Water Res. 35:2565–2569.
Neff , J.C., and G.P. Asner. 2001. Dissolved organic carbon in terrestrial ecosystems: Synthesis and a model. Ecosystems 4:29–48.
Nelson, D.W., and L.E. Sommers. 1996. Total carbon, organic carbon, and organic matter. p. 961–1010. In D.L. Sparks (ed.) Methods of soil analysis. Part 3. SSSA Book Ser. no 5. SSSA and ASA, Madison, WI.
Owens, L.B., G.C. Starr, and D.L. Lightell. 2002. Total organic carbon losses in subsurface fl ow under two management practices. J. Soil Water Conserv. 57:74–81.
Parkin, T.B., and T.C. Kaspar. 2004. Temporal variability of soil carbon dioxide fl ux: Eff ect of sampling frequency on cumulative carbon loss estimation. Soil Sci. Soc. Am. J. 68:1234–1241.
Randall, G.W., and J.A. Vetsch. 2005. Nitrate losses in subsurface drainage from a corn-soybean rotation as aff ected by fall and spring application of nitrogen and nitrapyrin. J. Environ. Qual. 34:590–597.
Randall, G.W., J.A. Vetsch, and J.R. Huff man. 2003. Nitrate losses in subsurface drainage from a corn-soybean rotation as aff ected by time of nitrogen application and use of nitrapyrin. J. Environ. Qual. 32:1764–1772.
Raulund-Rasmussen, K., O.K. Borggaard, H.C.B. Hansen, and M. Olsson. 1998. Eff ect of natural organic soil solutes on weathering rates of soil minerals. Eur. J. Soil Sci. 49:397–406.
Rochette, P., D.A. Angers, and D. Côté. 2000. Soil carbon and nitrogen dynamics following application of pig slurry for the 19th consecutive year: I. Carbon dioxide fl uxes and microbial biomass carbon. Soil Sci. Soc. Am. J. 64:1389–1395.
Royer, I., D.A. Angers, M.H. Chantigny, R.R. Simard, and D. Cluis. 2007. Dissolved organic carbon in runoff and tile-drain water under corn and forage fertilized with hog manure. J. Environ. Qual. 36:855–863.
Royer, T.V., and M.B. David. 2005. Export of dissolved organic carbon from agricultural streams in Illinois, USA. Aquat. Sci. 67:465–471.
SAS Institute.1999. SAS/STAT user’s guide. Vol. 2. Version 8. SAS Inst., Cary, NC.
Siemens, J., M. Haas, and M. Kaupenjohann. 2003. Dissolved organic matter induced denitrifi cation in subsoils and aquifers? Geoderma 113:253–271.
Skaggs, R.W., M.A. Breve, and J.W. Gilliam. 1994. Hydrologic and water quality impacts of agricultural drainage. Crit. Rev. Environ. Sci. Technol. 24:1–32.
Sotomayor, D., and C.W. Rice. 1996. Denitrifi cation in soil profi les beneath grassland and cultivated soils. Soil Sci. Soc. Am. J. 60:1822–1828.
Ruark et al.: Dissolved Organic C Losses from Tile Drained Agroecosystems 1215
Temminghoff , E.J.M., S.E.A.T.M. van der Zee, and F.A.M. de Haan. 1997. Copper mobility in a copper-contaminated sandy soil as aff ected by pH and solid and dissolved organic matter. Environ. Sci. Technol. 31:1109–1115.
Tomer, M.D., D.W. Meek, D.B. Jaynes, and J.L. Hatfi eld. 2003. Evaluation of nitrate nitrogen fl uxes from a tile-drained watershed in central Iowa. J. Environ. Qual. 32:642–653.
Totsche, K.U., J. Danzer, and I. Kögel-Knabner. 1997. Dissolved organic matter-enhanced retention of polycyclic aromatic hydrocarbons in soil miscible displacement experiments. J. Environ. Qual. 26:1090–1100.
Vitosh, M.L., J.W. Johnson, and D.B. Mengel. 1995. Tri-state fertilizer recommendations for corn, soybeans, wheat and alfalfa. Ext. Bull. E-2567. Michigan State Univ., East Lansing.
Waranoski, V.M. 2007. Environmental controls on the survival of E. coli in surface water. M.S. thesis. Purdue Univ., West Lafayette, IN.
Yeomans, J.C., J.M. Bremner, and G.W. McCarty. 1992. Denitrifi cation capacity and denitrifi cation potential of subsurface soils. Commun. Soil Sci. Plant Anal. 23:919–927.