Do Family Caps on Welfare Affect BirthsAmong Welfare Recipients?Reconciling Efficacy and EffectivenessEstimates of Impact through a BlendedDesign Strategy
RADHA JAGANNATHAN, MICHAEL J. CAMASSO, ANDMARK R. KILLINGSWORTH
ABSTRACT
This paper proposes a blended experimental and quasi-experimental research strategy whichwe believe will help improve the external validity of evaluations of welfare reform and othersocial policies. We draw upon data from New Jersey’s imposition of a family cap, where welfarebenefits instead of increasing remained the same for women who conceive and bear a childwhile on public assistance. We directly compare estimates of the policy’s effectiveness on thestate’s welfare population using (a) a point-in-time sample randomly assigned to experimentaland control group conditions; (b) an initial cohort sample similarly assigned; and (c) a beforeand after policy implementation of the entire welfare caseload. We find that these estimatescan differ dramatically, reflecting sensitivity to a time-induced heterogeneity we have labeledthe Heraclitus effect. We discuss how multiple estimates of effectiveness can be used to boundexpectations of a welfare reform policy impact when population dynamics data are available.
INTRODUCTION
In her account of her life with Gertrude Stein, Alice B.Toklas (1963, p. 173)describes Stein’slast hours:
Radha Jagannathan • Bloustein School of Planning and Public Policy, Rutgers University, 33 Livingston Avenue, Suite100, New Brunswick, NJ 08901-1958, USA; E-mail: [email protected].
By this time Gertrude Stein was in a sad state of indecision and worry. I sat next to her andshe said to me early in the afternoon, What is the answer? I was silent. In that case, shesaid, what is the question?
The answer to the perennial evaluation question “Does it [the policy or social program]work?” has, more often than not, proven to be a bit more complicated than the question wouldseem to imply. In the professional literature this question quickly devolves into inquiriesabout program efficacy, that is, does it work when delivered properly (Nathan & Gorman,2002; Rosenbaum, 2002) and/or program effectiveness, that is, does it work when put intoday-to-day practice (Shadish, Cook, & Campbell, 2002; Sommer & Zeger, 1991). Answeringthe efficacy question may or may not help us answer questions about program effectiveness,and the reverse is true as well. Yet both questions are typically of interest in evaluations ofmost social policies and programs.
It would appear that an obvious way to answer both the efficacy and effectiveness questionsis to design an evaluation that examines the policy or program as it is implemented accordingto specifications and also as it is applied under typical environmental conditions. This practice,however, has not been used in the vast majority of evaluations for a variety of practical,political, financial, ethical and strategic reasons (Greenberg & Shroder, 1997; Moffitt & VerPloeg, 2001). Much more common is the practice of using efficacy estimates, usually extractedfrom social experiments, to infer program effectiveness, or to use the effectiveness estimatesfrom quasi-experiments, natural experiments, or observational studies (seeMeyer, 1995), todraw conclusions about efficacy. In the absence of actual data, researchers, policy makers, andpractitioners are forced to extrapolate or interpolate, as the case may be.
In this paper, we employ a blended experimental/quasi-experimental research design thatallows us to answer the program efficacy and effectiveness questions without imposing the typesof assumptions that have often been used to link these two impact estimates (Heckman & Hotz,1989; Heckman, Smith, & Clements, 1997; Pepper, 2003). We investigate the consequencesof the introduction of the nation’s first family cap by the State of New Jersey in October of1992. The family cap denies additional cash benefits to those children born 10 or more monthsafter the mother began receiving AFDC/TANF benefits. The cash benefit loss was $102 permonth if the child was the second born and $64 per month for any higher order births. At thetime of family cap implementation, New Jersey’s caseload hovered around 110,000 recipientfamilies. By the end of the study period in December of 1996, the caseload had declined toless than 100,000. During the study period, on average, 37% of the cases closed in a quarter,with about 25% re-entering or entering the caseload for the first time.
Our estimates of policy efficacy come from a sample of randomly assigned experimentalswho were subject to the family cap and controls who were not subject to the cap. Our esti-mates of the policy’s effectiveness from this experiment are augmented with an analysis of theentire welfare caseload (excepting the experimental sample) before and after the introductionof the family cap. This relatively simultaneous examination of a treatment under experimentaland non-experimental conditions was made possible by the State’s decision to conduct anexperiment within the confines of a full-coverage reform program that included a family capprovision. Hence, the only individuals not subject to the family cap were the experiment’scontrol group members. This unique circumstance allowed us to compare four different ef-fectiveness estimates of program impact directly, a very desirable feature of a blended designstrategy. Our analysis also points up some of the perils of attempting to answer the effectiveness(efficacy) question through assumptions, no matter how weak these assumptions might be.
Do Family Caps on Welfare Affect Births Among Welfare Recipients? 297
Answering Questions About the Family Cap
There are several different questions that might be of interest to individuals concernedabout the impact of the family cap. An economist or policy designer might ask whether arandomly chosen experimental subject would be more or less likely to give birth than a ran-domly chosen control subject. Welfare administrators in New Jersey might ask how much thecap affected births among the state’s public assistance population. Demographers might askwhether a national family cap would affect birth rates among the general population. Wash-ington policymakers might ask whether introduction of a cap in other states would have effectssimilar to or different from those in New Jersey.
The economist’s question, in this example, when answered, could go a long way in help-ing the welfare administrator, demographer, or policy maker. And then again it may not. Thisis because, notwithstanding its many advantages for isolating program efficacy (Grissmer,Flanagan, Kawata & Williamson, 2000; Orr, 1999; Rossi, Freeman & Lipsey, 1999), a con-trolled experiment with randomization might not capture the more global treatment effectsbeing sought by the other questioners.
To fix ideas, consider a small-scale social experiment, with an outcomeYE for randomlyselected experimentals who are subjected to the program’s treatment, and an outcomeYC forrandomly selected controls who are not subjected to the treatment, with the difference in theseoutcomes∆ defined as∆ ≡ YE − YC. There is of course the issue of the experiment’s inter-nal validity, that is,YE − YC, as derived from the experiment, may not actually measure theactual average effect of the treatment (Campbell & Stanley, 1966; Cook & Campbell, 1979;Nathan, 2004). Fortunately, in the New Jersey experiment issues of control group contamination(Camasso, Jagannathan, Killingsworth, & Harvey, 2003), differential attrition (Jagannathan,Camasso, & Killingsworth, 2004), compliance with experimental conditions (Camasso,Jagannathan, Harvey, & Killingsworth, 2003) and interfering treatments (Camasso, in press)have been examined and do not pose serious threats to our estimates ofYE − YC.1
Whether or not the experimental effects of New Jersey’s family cap possess externalvalidity, in the sense the estimates can be generalized across persons, settings, treatment vari-ations and times (Shadish et al., 2002; Stock & Watson, 2003), is quite another matter. Wenow discuss the principal reasons why a social experiment might lack external validity and notallow us to say much about overall program effectiveness.
Randomization bias. AsHeckman and Smith (1995)andHeckman (1992)note, randomassignment may mean that the type of persons who participate in a small-scale experiment willdiffer from the type of persons who would participate if the social program were global. Ina welfare reform experiment (WRE), the recipients who would participate in a small-scaleexperiment might differ from the recipients who would obtain treatment in a global program;and results for the former therefore might not be generalizable to the latter. In contrast, abefore-after welfare reform study (BAWRS) of the entire welfare caseload obviously capturesthe difference between outcomes in the presence of a global program and outcomes in theabsence of such a program – although, of course, there is always the risk of confounding theeffects of other factors with the effects of the program itself.2
Bias due to omission of entry effects. A number of researchers have noted that, byvirtue of their design, social experiments may ignore “entry effects,” even though these effectsmay be very important responses to policy changes (Heckman & Smith, 1995; Moffitt & Ver
298 AMERICAN JOURNAL OF EVALUATION, 25(3), 2004
Ploeg, 1999, 2001). For example, consider changes in welfare policy. Most social experimentsinvolving welfare policy of which we are aware include, as experimental and control subjects,only welfare recipients. (In theory, such experiments could sample randomly from the entirepopulation, but in practice that might entail prohibitively high costs for collection of data onpersons many of whom would not be affected in any way by changes in welfare policy.) How-ever, as a response to changes in welfare policy, members of the non-welfare population maychange their behavior either (a) in order to join the welfare rolls or (b) to change their expectedcircumstances in the event that they join the welfare rolls in the future. Focusing exclusivelyon persons who are already on the welfare rolls will, of course, ignore such responses to thepolicy change. Formally, expected (average) behavior while on welfare is the product of theprobability of being on welfare, Pr(D = 1), and the expected value of behaviorY while onwelfare,E(Y|D = 1), that is,
Pr(D = 1)E(Y |D = 1)
Policy changes can alter either or both of these, that is,
Focusing only on actual welfare recipients – as is done in most experimental evaluations ofwelfare programs – will measure the effect of welfare programs as (only) [�(E(Y|D = 1)], andwill ignore “entry effects,” that is, the first term on the right-hand side of the above expression.To be sure, social experiments can attempt to gauge entry effects by collecting data on broadpopulation groups; for example, WREs can collect data on persons not already participating inwelfare as well as persons currently enrolled in welfare. However, broadening the scope of datacollection is likely to increase substantially the cost of the experiment, thereby reducing animportant practical advantage of small-scale experiments over global programs.3 In contrast,a BAWRS methodology would focus on aggregate outcomes for the population as a whole (orfor a random sample of the entire population), and could therefore consider both the impacton persons who do use the program and the rate of participation in the program.
Entry effects are often associated in the literature with the experiment’s alleged inade-quacy in considering macro level effects such as norm-formation, that is, group-influencedbehavioral expectations (Garfinkel, Manski, & Michalopoulos, 1992) and low-wage, labormarket equilibrium (Cain, 1997; Heckman & Smith, 1995). Moffitt (1992)views the entry andmacro-effect issues as closely related:
Because the spread of knowledge within community wide information networks is likelyto be an important intervening variable in the program entry mechanism, individualizedoffers of treatment are unlikely to replicate adequately the program environment that wouldobtain in a permanent community-wide program. (p. 241)
If welfare client application, enrollment, participation, and continuation decisions are ne-glected, as these critics of social experimentation maintain they typically are, then reportedimpact estimates reported are bound to differ from the estimates generated by research designsmore sensitive to the entry effect problem (Moffitt & Ver Ploeg, 2001; Heckman & Smith,1995). Just how or how much the experimental and non-experimental impact estimates mightdiffer is not often made clear.Garfinkel et al. (1992), for example, surmise that norm-formationwould lead to an experimental effect that “might be close to or smaller than the change induced
Do Family Caps on Welfare Affect Births Among Welfare Recipients? 299
by a real shift in policy” (p. 264). On the other hand, information diffusion would suggest “thatthe real world stimulus would grow stronger while the experimental effect would diminish”(Garfinkel et al., 1992, p. 263). These are, of course, guesses because to our knowledge nowelfare reform research has actually compared estimates of impact from an experimentalsample and the caseload from which the sample was drawn. Biases from randomization andentry effects alert us to the difficulties of generalizing in the face of population heterogeneity,especially when that heterogeneity is stimulated by the experiment itself (Heckman et al.,1997).
Bias due to omission of community or scale effects. As a number of authors, includingGarfinkel et al. (1992)andMoffitt (1998) have noted, “community” or “scale” effects mightbe absent in a small-scale social experiment but might be very powerful in a global program.As a simple model with scale effects, consider
Yi = aXi + bTi + cP + dTiP + ei
wherei indexes an individual,Y = outcome of interest (e.g., earnings),X = characteristics,T= indicator denoting whether an individual was treated,P = proportion of population subjectto the treatment, ande = error term. For example, “welfare reform” on a global basis (p > 0)that instills a greater “work ethic” may increase work effort (c > 0, whereY refers to hours ofwork) even for individuals who receive no treatment (T = 0); but a small-scale experiment (p≈ 0) may have no such effect.4 The effect of treatment (T = 1) in a small-scale experiment,with p ≈ 0, is simplyb. In contrast, in a global program, the effect of treatment for individuali is b + cp + dp, and can readily be measured using a BAWRS methodology.
The mixing problem. The mixing problem addresses the issue of what observationsof homogenous treatment outcomes in the sample of study reveal about the outcomes thatwould occur if a treatment’s provisions and parameters were varied across the populationof interest (Manski, 1997; Pepper, 2003). To address this problem, the researcher must bewilling to either gather data on the population or impose assumptions on the joint outcomedistributionP(Y1,Y0|X) or the nature of the treatment policy (m).5 Mixing, like the issue ofscale effects calls our attention to the limits placed on experimental generalizability due totreatment heterogeneity.
Setting heterogeneity. Hotz, Imbens, and Mortimer (1999)carefully discuss the prob-lems that arise when attempting to generalize the results of an experiment in one physicallocation to a new jurisdiction. These researchers note that attempts to adjust for setting hetero-geneity require that sites overlap to some degree on population units (of study) and treatments.Even then, Hotz et al. are limited to predicting the outcomes of control group members. Re-search byFriedlander and Robins (1995), moreover, indicates that the greater the geographicdistance between the jurisdictions the weaker the inferences about the program effectivenessbecome. Setting heterogeneity is also a concern in historical generalizations (Shadish et al.,2002; Stock & Watson, 2003).
Time-induced heterogeneity. In principle, it is possible to address population unit,treatment and/or setting heterogeneity by insuring that some degree of overlap exists betweenthe experimental units, treatments, and settings, on the one hand, and the more global subjects,treatments and settings of interest (Hotz et al., 1999; Heckman et al., 1997). This same strategy
300 AMERICAN JOURNAL OF EVALUATION, 25(3), 2004
could also be employed to address time-induced heterogeneity, which, to be sure is a neglectedtopic in discussions of external validity.
Time-induced heterogeneity is a form of conditioning bias that can arise as a result of themanner in which experimental and/or control subjects are sampled (see, for example,Cook &Campbell, 1979). Although there is no inherent reason why an experiment could not samplerandomly from the entire population, for some time period, sayt to t + 1, cost and efficiencyconsiderations will usually dictate that sampling for an experiment should proceed conditionalon membership in some temporally defined population subgroup. Such conditional samplingmay produce a form of selection bias where experimental results based on such sampling mayyield erroneous answers to the questions the experiment was intended to address.
An obvious example is the “random” selection of subjects for an experimental welfareprogram from persons currently enrolled in an existing welfare program. Of course, suchsampling necessarily proceeds conditional on – that is, takes as given – actual enrollment inwelfare. Even when such sampling selects randomly from all persons currently enrolled inwelfare, experiments based on a sample of this kind may yield biased answers. This is becausethe behavior of persons enrolled in welfare as of timet is not necessarily representative of theexperience of persons who will enroll in welfare between timet and timet + �t (even in theabsence of any macroeconomic, environmental, or other “time effects”). For example, personsenrolled at timet may on average be “chronics” – persons who are severely and/or permanentlydisadvantaged and, as such, are unlikely to respond to any kind of treatment. In contrast, personswho enroll between timet and timet + �t may on average be “acutes” – persons who suffertemporary or intermittent disadvantage and, as such, are likely to respond appreciably to somekinds of treatment. An experiment that randomly samples “chronics” (persons enrolled at timet) may give very misleading estimates of treatment effects for “acutes” (persons who enrollbetween timet and timet + �t) — and vice-versa. One or both samples, moreover, mightgive misleading estimates of a policy’s population effectiveness, that is, become out of phase(Moffitt & Ver Ploeg, 2001) or out of date (Stock & Watson, 2003), if the population’s durationmix changes after the experimental sample was drawn.
There is some limited evidence for studies of welfare caseload dynamics to suggest thattime-induced heterogeneity may be one of the most pervasive obstacles to the generalizabilityof WREs.Rank (1985), O’Neill, Bassi, and Wolf (1987), andEllwood and Bane (1994)observethat point-in-time random samples will select a very different composition of acute/chronicrecipients than will random ‘opening-cohort’ samples. For example,Rank (1985)reports thatthe former sampling strategy nets only about 35% acutes (≤12 months spent on welfare over a3-year period), while the latter yields over 60%. Of course, the welfare population itself mighthave a variety of acute/chronic compositions.
A sampling strategy that dips into a population pool att cannot be expected to capturethe dynamic flow of cases that comprise a welfare population. Here it is useful to invoke anobservation first attributed to Heraclitus:
“It is not possible to step twice into the same river, nor is it possible to touch a mortalsubstance twice in so far as its state is concerned.” (Robinson, 1987)
The ‘Heraclitus effect’ alerts us to the possibility that we might find little or no response toa family cap in a random sample of chronics (or acutes) but that this estimate of efficacy mightseriously understate the possible response in a random sample of acutes (chronics). Moreover,if the welfare population is comprised largely of acutes or short stay recipients (Moffitt &Ver Ploeg, 2001; Stevens, 2000), our estimate possesses little external validity. In contrast, a
Do Family Caps on Welfare Affect Births Among Welfare Recipients? 301
BAWRS of the welfare caseload methodology allows one to track the behavior of both chronicsand acutes, and to determine if the response of these groups to the family cap is similar ordifferent.
As with other forms of heterogeneity, the Heraclitus effect might be addressed in a numberof ways. One approach would be to suggest a range of joint outcome and treatment distributionsthat are consistent with the marginal distributions produced by the experimental data (Heckmanet al., 1997; Manski, 1997; Pepper, 2003). Because the experiment can tell us only about theoutcome proportions for those under randomly assigned treatment conditions, there is a needfor identifying assumptions about the untreated and/or their outcomes. In our family capexperiment, assumptions about the fraction of acute and chronic cases would appear to beappropriate if population data is lacking. These fractions, however, have proven to be highlyvariable in studies of caseload dynamics.Moffitt and Ver Ploeg (2001), for example, reportthat about a third of the public assistance observations from the National Longitudinal Studyof Youth (NLSY) could be considered chronic, long-term welfare users.Ver Ploeg (2002)inher investigation of the Wisconsin caseload, found the proportion of chronic users to be about50%. And in a study of Maryland’s caseload,Stevens (2000)finds only about 17% of the casesto be chronics. Varying fractions have also been reported byEllwood and Bane (1994), O’Neillet al. (1987), andRank (1985).
A second approach might be to adjustYE − YC for duration dependence by includingsuch a measure as a right-hand side variable in a regression. The difficulty here is that thevariable is likely to be endogenous, that is, it too could be affected by the treatment (Blank,1989; Plotnick, 1983).
It is also feasible to increase the external validity of experimental estimates using a modelof deliberate sampling for heterogeneity (Cook & Campbell, 1979; Heckman, 1992). Here,timing is everything, if the experimental samples are to reflect the population of interest. Sam-pling for heterogeneity is the method we used in the family cap experiment to insure that bothchronic and acute welfare cases were included in sufficient numbers. However, such samplingdoes not guarantee that Heraclitus effect will be addressed; it only insures that multiple esti-mates ofYE − YC will be available to the researcher. To answer the questions posed by theState’s welfare administrator and perhaps the federal policy maker, a program of samplingfor heterogeneity needs to be supplemented, we believe, by treatment and outcome data fromthe entire welfare caseload. We now describe this blended experimental/quasi-experimentalstrategy and the insights it has provided about the practicality of extending experimental resultsbeyond descriptions of average treatment effects.
IMPLEMENTING A BLENDED DESIGN STRATEGY
The data for our empirical application of the blended design strategy comes from New Jersey’sstate-wide implementation of a family cap in October of 1992.6 The efficacy estimates of thefamily cap impact on births (and other fertility outcomes, such as abortion, contraception, etc.)were to be assessed through a controlled experiment that took place from October 1992 throughDecember 1996. As the experiment progressed, there were concerns expressed by federal andstate policy makers regarding generalizability of the efficacy estimates that would be generatedby the experiment. These concerns were addressed by the evaluation research team through anaugmentation of the original evaluation design to include a before-after analysis (BAWRS) offamily cap effects, using data from New Jersey’s overall caseload. It was anticipated that the
302 AMERICAN JOURNAL OF EVALUATION, 25(3), 2004
BAWRS would provide additional effectiveness estimates that could help gauge the extent towhich experimental results could be generalized to the New Jersey welfare population. The dataused in both the WRE and BAWRS analyses of family cap effects were provided by the NewJersey Department of Human Services from the Family Assistance Management InformationSystem (FAMIS). This statewide database is designed to deliver cash assistance payments andFood Stamp benefits to welfare recipients and provides demographic data including birth ofeach child and income information on all welfare recipients.
Efficacy Assessment Through Experimental Design
Sample assignment for the experiment began in October 1992 with cases drawn fromthe ten largest welfare counties in New Jersey that accounted for approximately 85% of thestate’s welfare caseload.7 The original sampling design called for the random assignment of9,000 cases – 6,000 in an experimental group and 3,000 controls. Assignment was based on thelast four digits of the payee’s social security number. The assignment process was controlledcentrally through a set of computerized edits linked to eligibility determination. Each recipientassigned to the experiment was required to meet with a case manager or income maintenanceworker who (a) informed the client of the eligibility rules that applied to her experimental orcontrol group status and (b) required the recipient to indicate her understanding in a signedconsent form.
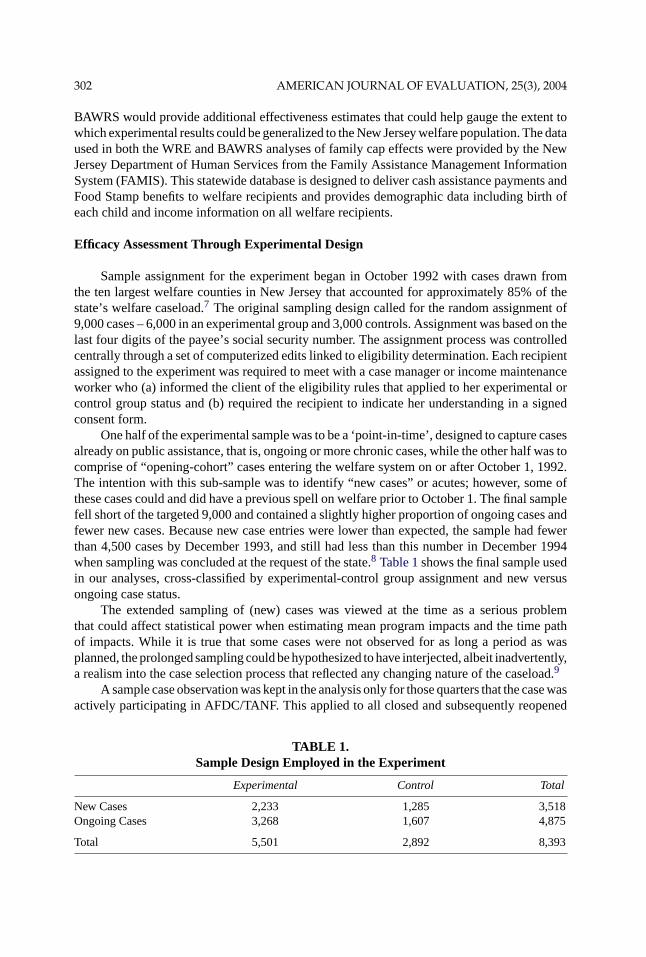
One half of the experimental sample was to be a ‘point-in-time’, designed to capture casesalready on public assistance, that is, ongoing or more chronic cases, while the other half was tocomprise of “opening-cohort” cases entering the welfare system on or after October 1, 1992.The intention with this sub-sample was to identify “new cases” or acutes; however, some ofthese cases could and did have a previous spell on welfare prior to October 1. The final samplefell short of the targeted 9,000 and contained a slightly higher proportion of ongoing cases andfewer new cases. Because new case entries were lower than expected, the sample had fewerthan 4,500 cases by December 1993, and still had less than this number in December 1994when sampling was concluded at the request of the state.8 Table 1shows the final sample usedin our analyses, cross-classified by experimental-control group assignment and new versusongoing case status.
The extended sampling of (new) cases was viewed at the time as a serious problemthat could affect statistical power when estimating mean program impacts and the time pathof impacts. While it is true that some cases were not observed for as long a period as wasplanned, the prolonged sampling could be hypothesized to have interjected, albeit inadvertently,a realism into the case selection process that reflected any changing nature of the caseload.9
A sample case observation was kept in the analysis only for those quarters that the case wasactively participating in AFDC/TANF. This applied to all closed and subsequently reopened
TABLE 1.Sample Design Employed in the Experiment
Experimental Control Total
New Cases 2,233 1,285 3,518Ongoing Cases 3,268 1,607 4,875
Total 5,501 2,892 8,393
Do Family Caps on Welfare Affect Births Among Welfare Recipients? 303
cases as well as continuous stayers. The approach is equivalent to measuring the averageeffect of the family cap on the treated (Manski, 1996)10 and is consistent with the federalpolicy guidance that sought to determine if the family cap had an impact on births while arecipient was receiving welfare payments. Observations in the experiment were pooled over 17quarters, i.e., from the fourth quarter of 1992 through the fourth quarter of 1996, yielding 66,992person-quarter observations. This method of pooling, however, needs to take into considerationthe possibility that the exit rates between experimental and control group cases differ. Therewere no significant experimental-control differences in reasons for exit due to marriages,change in residence, or earned income; and a Cox regression analysis of experimental attritionfound no significant differences between experimental and control group cases in the hazard ofleaving AFDC/TANF (Jagannathan et al., 2004). Further, no differences were found betweenthe two groups in overall length of stay on welfare, recidivism, or continuous stay lengths(spells).
It is possible, in principle, that women in the experimental group who wish to have a birthare more likely to leave welfare because the child will be excluded from the grant, and thattherefore the experimental group will tend to have relatively lower birth rates. It is also possible,in principle, that there might be reporting biases involved if women subject to the family cap hadno incentive to report the birth to the welfare system. Assessing these possibilities, however,requires consideration of several features of the family cap legislation and the circumstancesof women on welfare. In New Jersey, capped (experimental) cases received substantially morefood stamp benefits and also were subject to a lower tax rate on earned income than controls.While the family cap could only affect the second or subsequent births on welfare, leavingwelfare would result not only in the loss of AFDC, food stamp, and Medicaid benefits forthe mother and enhanced food stamp and Medicaid for the excluded child, but also woulddisqualify all the other eligible children in the household from receiving benefits. Should themother decide to stay on welfare but not report the birth, this would entail foregoing food stampand Medicaid benefits for the child, where such benefits far outweigh the actual increase in theAFDC grant.11 Thus, failing to report a new birth or temporary exits from welfare would entailvery high financial costs, and we have no evidence to indicate that either form of behavioroccurred.
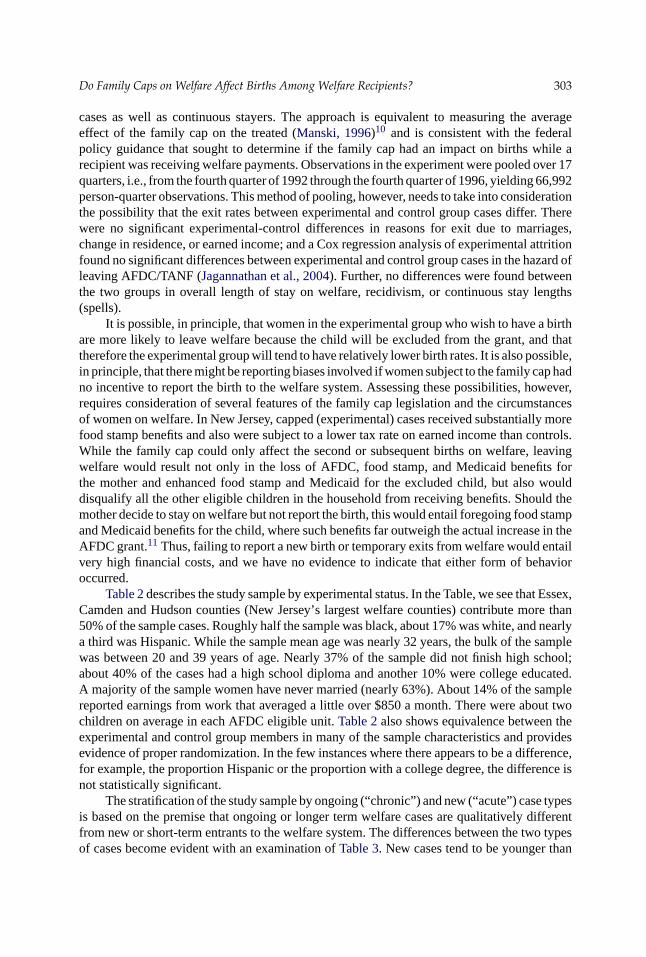
Table 2describes the study sample by experimental status. In the Table, we see that Essex,Camden and Hudson counties (New Jersey’s largest welfare counties) contribute more than50% of the sample cases. Roughly half the sample was black, about 17% was white, and nearlya third was Hispanic. While the sample mean age was nearly 32 years, the bulk of the samplewas between 20 and 39 years of age. Nearly 37% of the sample did not finish high school;about 40% of the cases had a high school diploma and another 10% were college educated.A majority of the sample women have never married (nearly 63%). About 14% of the samplereported earnings from work that averaged a little over $850 a month. There were about twochildren on average in each AFDC eligible unit.Table 2also shows equivalence between theexperimental and control group members in many of the sample characteristics and providesevidence of proper randomization. In the few instances where there appears to be a difference,for example, the proportion Hispanic or the proportion with a college degree, the difference isnot statistically significant.
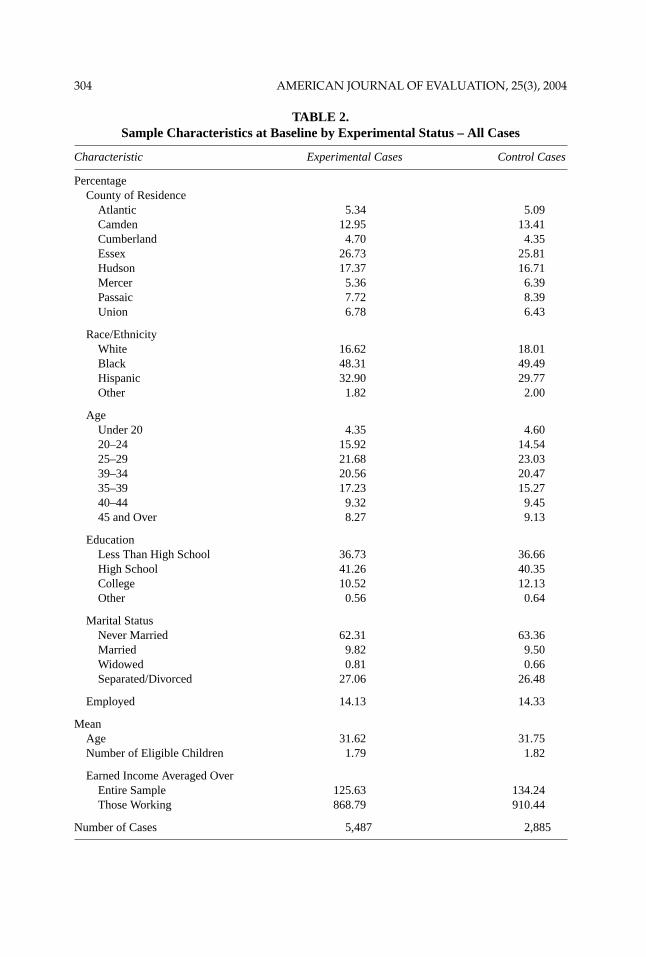
The stratification of the study sample by ongoing (“chronic”) and new (“acute”) case typesis based on the premise that ongoing or longer term welfare cases are qualitatively differentfrom new or short-term entrants to the welfare system. The differences between the two typesof cases become evident with an examination ofTable 3. New cases tend to be younger than
304 AMERICAN JOURNAL OF EVALUATION, 25(3), 2004
TABLE 2.Sample Characteristics at Baseline by Experimental Status – All Cases
MeanAge 32.47 31.75 30.30 30.36Number of Eligible Children 1.88 1.82 1.66 1.68
Earned Income Averaged OverEntire Sample 124.47 134.24 127.42 135.64Those Working 852.98 910.44 893.67 904.78
Number of Cases 3,243 1,591 2,185 1,257
∗∗ p values< .05.
306 AMERICAN JOURNAL OF EVALUATION, 25(3), 2004
ongoing cases, to have fewer children on AFDC and are more likely to have completed highschool and to have attended college. New cases are also less likely to have never married. Theracial composition of ongoing and new cases is also different. Among persons in the new casesample, about 44% are black and 20% are white; in the ongoing case sample the figures are51% and 15%, respectively. Within case type, there is only one significant difference, that is,the difference between experimental and control ongoing Hispanic cases.
Effectiveness Assessment Through BAWRS
The BAWRS augmentation of the experiment examines births that occurred to recipientson the New Jersey welfare caseload two years before and four years after the implementationof the family cap, encompassing the six-year period beginning January 1991 and ending De-cember 1996. Data are available on a quarterly basis for all recipients who were on the activewelfare rolls. Observations over 24 quarters for continuous stayers and new/reopened caseswere pooled, yielding 1,278,058 person-quarters from approximately 250,000 distinct cases.12
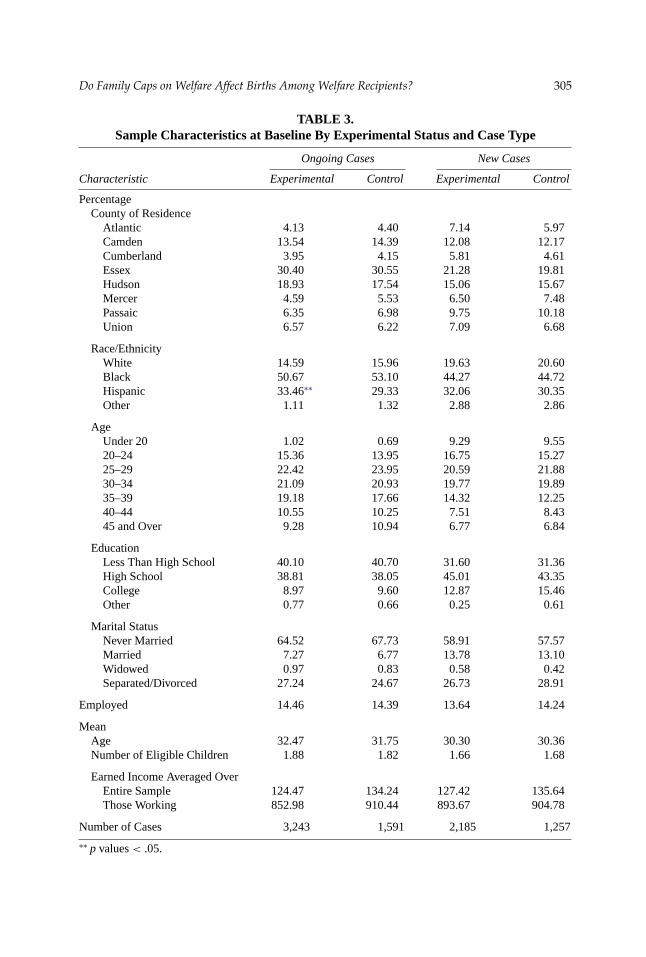
All cases used in the experiment were excluded from the BAWRS analysis.Table 4describes the caseload at each year end. The average age of recipients was around
29 years. The average household size hovered around four people, while the number of AFDCeligible children slightly declined over the study period. Black recipients comprised overhalf the caseload, while roughly a third was Hispanic. The caseload contained about equalproportions of high school dropouts and graduates (40%), and over 70% of the caseload wasnever married.Table 4also shows clearly that the caseload declined steadily during the studyperiod. Of course, these cross-sectional views of the caseload can be expected to be biasedtoward chronic cases (Ellwood & Bane, 1994; Rank, 1985).
TABLE 4.Descriptions of Point-in-Time Caseload 1992–1996
Variables Dec-92 Dec-93 Dec-94 Dec-95 Dec-96
MeanFemale Head Age 28.8 29.1 29.2 29.3 29.4Eligible Children 1.95 1.93 1.84 1.77 1.71Household Size 4.01 4.01 4.01 4 4.02
EducationHigh School Dropout 40.7 40 39.2 39.6 40.2High School Graduate 39.4 39.9 40.1 40.2 39.6College 9.2 9.8 10.5 10.6 10.7
Marital StatusNever Married 69.6 70.1 71 72.3 74.4
Number of Cases 79,301 78,689 77,241 72,640 64,567
Do Family Caps on Welfare Affect Births Among Welfare Recipients? 307
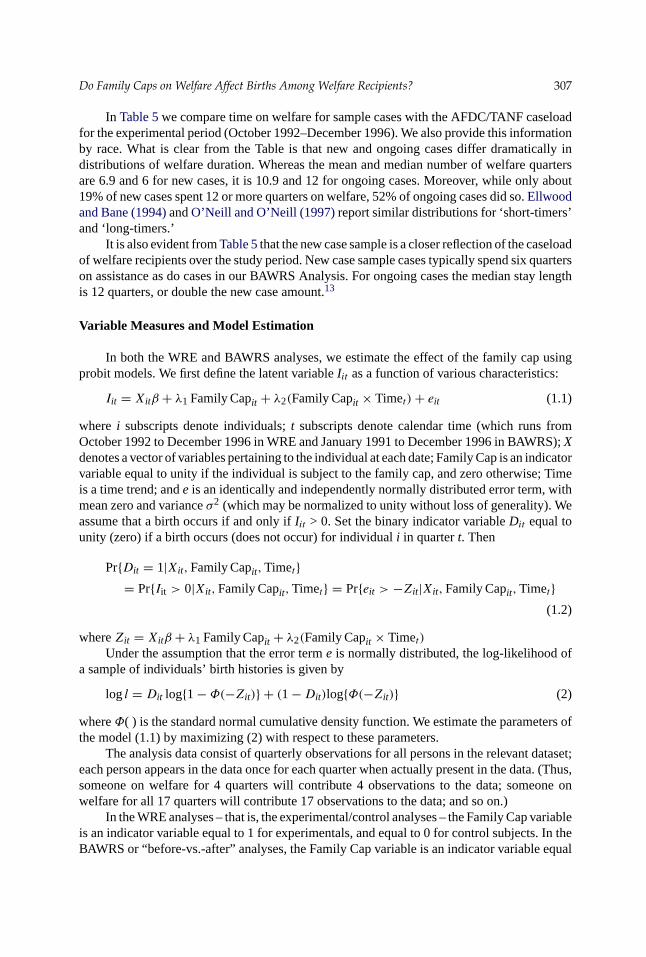
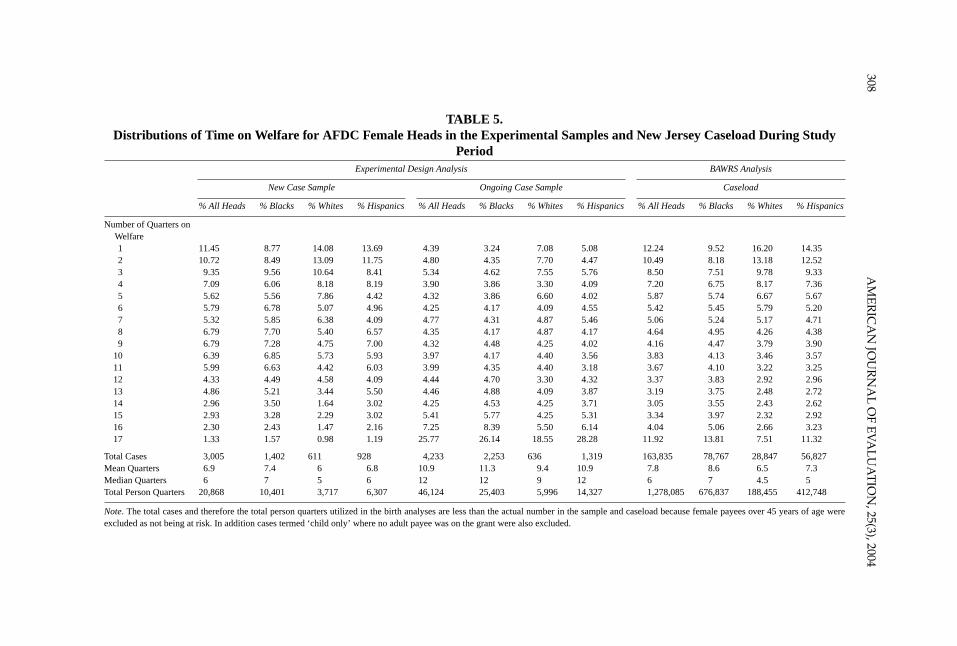
In Table 5we compare time on welfare for sample cases with the AFDC/TANF caseloadfor the experimental period (October 1992–December 1996). We also provide this informationby race. What is clear from the Table is that new and ongoing cases differ dramatically indistributions of welfare duration. Whereas the mean and median number of welfare quartersare 6.9 and 6 for new cases, it is 10.9 and 12 for ongoing cases. Moreover, while only about19% of new cases spent 12 or more quarters on welfare, 52% of ongoing cases did so.Ellwoodand Bane (1994)andO’Neill and O’Neill (1997)report similar distributions for ‘short-timers’and ‘long-timers.’
It is also evident fromTable 5that the new case sample is a closer reflection of the caseloadof welfare recipients over the study period. New case sample cases typically spend six quarterson assistance as do cases in our BAWRS Analysis. For ongoing cases the median stay lengthis 12 quarters, or double the new case amount.13
Variable Measures and Model Estimation
In both the WRE and BAWRS analyses, we estimate the effect of the family cap usingprobit models. We first define the latent variableIit as a function of various characteristics:
Iit = Xitβ + λ1 Family Capit + λ2(Family Capit × Timet) + eit (1.1)
where i subscripts denote individuals;t subscripts denote calendar time (which runs fromOctober 1992 to December 1996 in WRE and January 1991 to December 1996 in BAWRS);Xdenotes a vector of variables pertaining to the individual at each date; Family Cap is an indicatorvariable equal to unity if the individual is subject to the family cap, and zero otherwise; Timeis a time trend; ande is an identically and independently normally distributed error term, withmean zero and varianceσ2 (which may be normalized to unity without loss of generality). Weassume that a birth occurs if and only ifIit > 0. Set the binary indicator variableDit equal tounity (zero) if a birth occurs (does not occur) for individuali in quartert. Then
Pr{Dit = 1|Xit, Family Capit, Timet}= Pr{Iit > 0|Xit, Family Capit, Timet} = Pr{eit > −Zit|Xit, Family Capit, Timet}
Under the assumption that the error terme is normally distributed, the log-likelihood ofa sample of individuals’ birth histories is given by
log l = Dit log{1 − Φ(−Zit)} + (1 − Dit)log{Φ(−Zit)} (2)
whereΦ( ) is the standard normal cumulative density function. We estimate the parameters ofthe model (1.1) by maximizing (2) with respect to these parameters.
The analysis data consist of quarterly observations for all persons in the relevant dataset;each person appears in the data once for each quarter when actually present in the data. (Thus,someone on welfare for 4 quarters will contribute 4 observations to the data; someone onwelfare for all 17 quarters will contribute 17 observations to the data; and so on.)
In the WRE analyses – that is, the experimental/control analyses – the Family Cap variableis an indicator variable equal to 1 for experimentals, and equal to 0 for control subjects. In theBAWRS or “before-vs.-after” analyses, the Family Cap variable is an indicator variable equal
308AMERIC
AN
JOURNALOFEVALUATIO
N,25(3),2004
TABLE 5.Distributions of Time on Welfare for AFDC Female Heads in the Experimental Samples and New Jersey Caseload During Study
PeriodExperimental Design Analysis BAWRS Analysis
New Case Sample Ongoing Case Sample Caseload
% All Heads % Blacks % Whites % Hispanics % All Heads % Blacks % Whites % Hispanics % All Heads % Blacks % Whites % Hispanics
Note. The total cases and therefore the total person quarters utilized in the birth analyses are less than the actual number in the sample and caseload because female payees over 45 years of age wereexcluded as not being at risk. In addition cases termed ‘child only’ where no adult payee was on the grant were also excluded.
Do Family Caps on Welfare Affect Births Among Welfare Recipients? 309
to 1 for all periods when the family cap was in effect (i.e., all periods on or after October 1992),and equal to zero otherwise. In both cases, we include an interaction term with Time, FamilyCap× Time, to allow for the possibility of changes in treatment impact over time.
The variables included inX in Eq. (1.1)represent individual characteristics (age, race,education, marital status, and number of AFDC-eligible children) and time-varying factorscommon to all individuals (a simple time trend term and indicator variables for calendarquarter, whose use allows for the possibility of long-term or seasonal variation in births).Characteristics such as race and age are, of course, completely exogenous to the treatment;but other characteristics such as education, marital status and the number of AFDC-eligiblechildren are potentially endogenous, since the family cap could affect these variables. To avoidthis endogeneity, we measure each of these variables for each case using the value observed asof the last pre-cap quarter. In order to control for changes in county job opportunities duringthe study period, we also include county unemployment rates and JOBS program participationrates in the vectorX, along with indicators for county of residence (which is intended to capturetime-invariant factors shared by recipients in the same county, and to serve as a contextual levelcontrol for heterogeneity).
We estimate probit models separately for the overall experimental sample, new and on-going cases, the entire caseload, and racial subgroups.
RESULTS
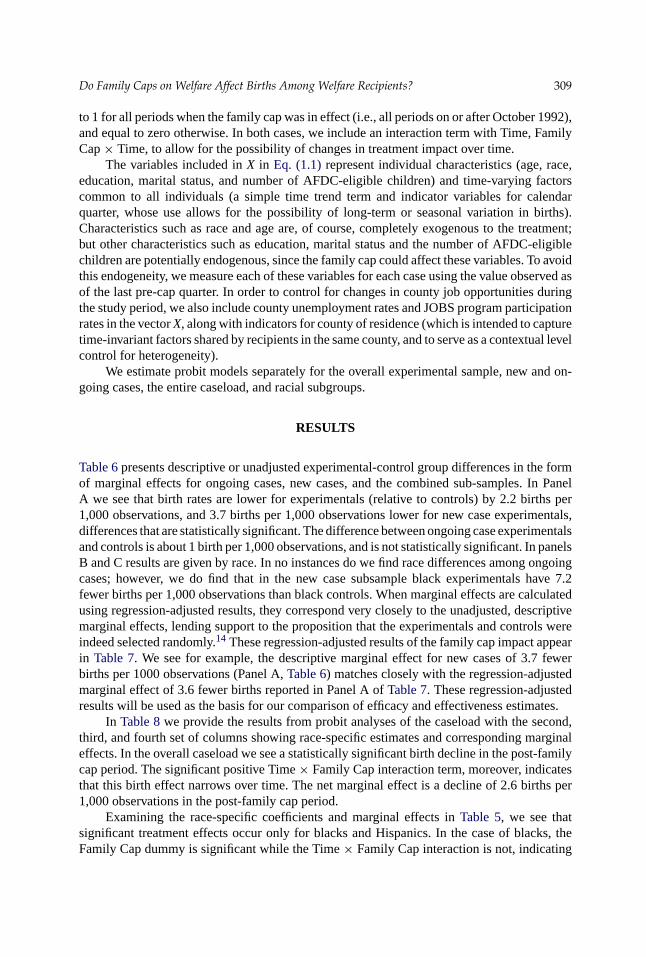
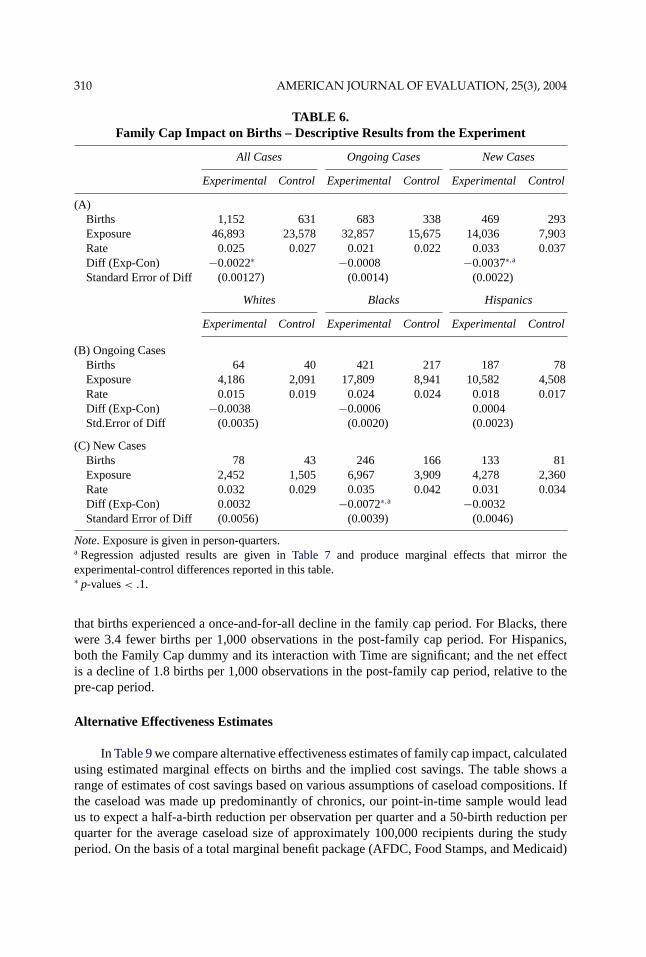
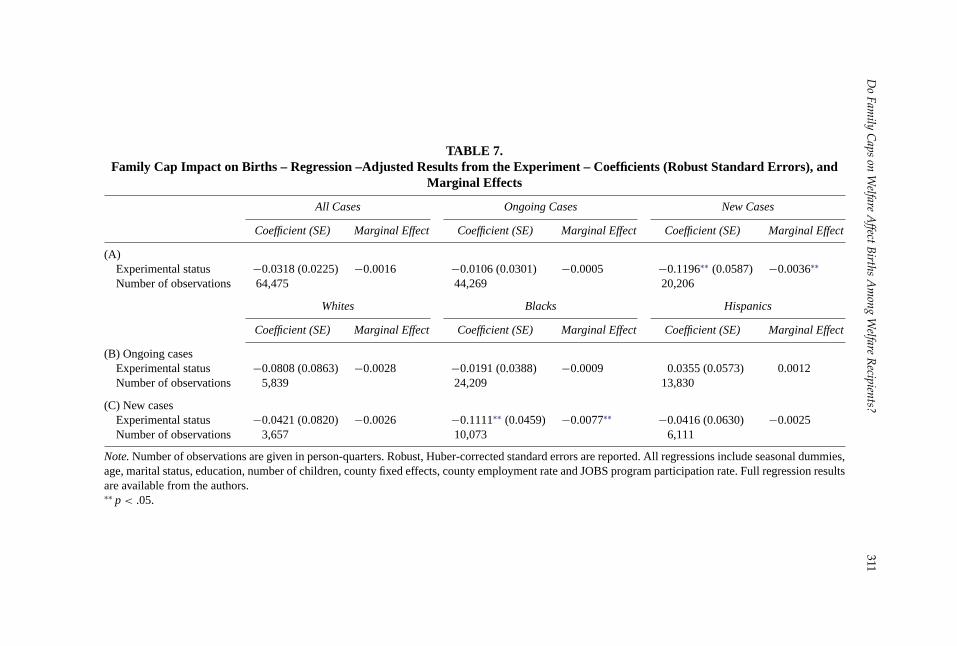
Table 6presents descriptive or unadjusted experimental-control group differences in the formof marginal effects for ongoing cases, new cases, and the combined sub-samples. In PanelA we see that birth rates are lower for experimentals (relative to controls) by 2.2 births per1,000 observations, and 3.7 births per 1,000 observations lower for new case experimentals,differences that are statistically significant. The difference between ongoing case experimentalsand controls is about 1 birth per 1,000 observations, and is not statistically significant. In panelsB and C results are given by race. In no instances do we find race differences among ongoingcases; however, we do find that in the new case subsample black experimentals have 7.2fewer births per 1,000 observations than black controls. When marginal effects are calculatedusing regression-adjusted results, they correspond very closely to the unadjusted, descriptivemarginal effects, lending support to the proposition that the experimentals and controls wereindeed selected randomly.14 These regression-adjusted results of the family cap impact appearin Table 7. We see for example, the descriptive marginal effect for new cases of 3.7 fewerbirths per 1000 observations (Panel A,Table 6) matches closely with the regression-adjustedmarginal effect of 3.6 fewer births reported in Panel A ofTable 7. These regression-adjustedresults will be used as the basis for our comparison of efficacy and effectiveness estimates.
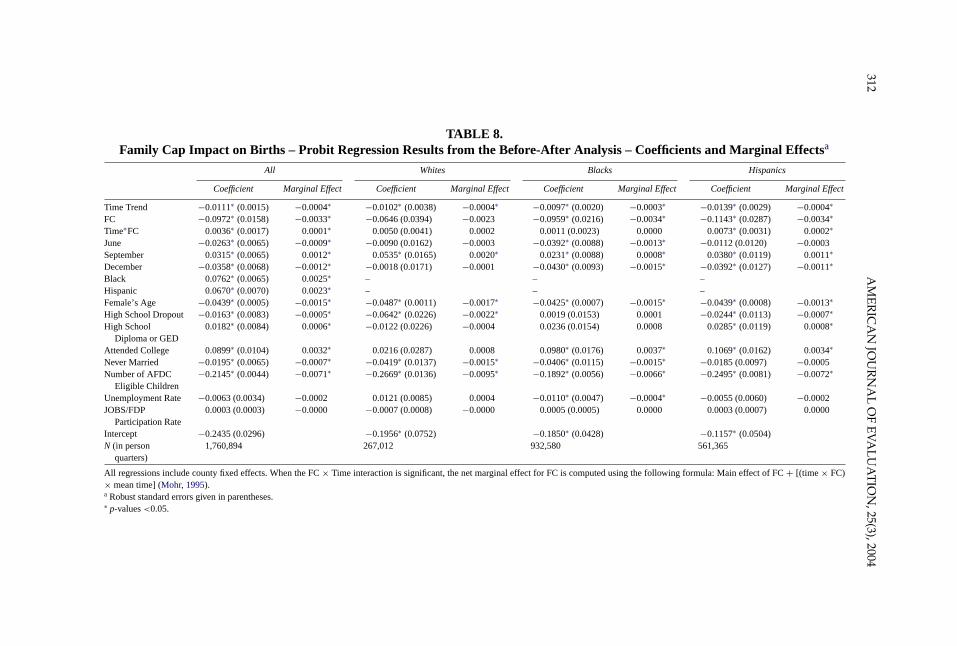
In Table 8we provide the results from probit analyses of the caseload with the second,third, and fourth set of columns showing race-specific estimates and corresponding marginaleffects. In the overall caseload we see a statistically significant birth decline in the post-familycap period. The significant positive Time× Family Cap interaction term, moreover, indicatesthat this birth effect narrows over time. The net marginal effect is a decline of 2.6 births per1,000 observations in the post-family cap period.
Examining the race-specific coefficients and marginal effects inTable 5, we see thatsignificant treatment effects occur only for blacks and Hispanics. In the case of blacks, theFamily Cap dummy is significant while the Time× Family Cap interaction is not, indicating
310 AMERICAN JOURNAL OF EVALUATION, 25(3), 2004
TABLE 6.Family Cap Impact on Births – Descriptive Results from the Experiment
All Cases Ongoing Cases New Cases
Experimental Control Experimental Control Experimental Control
Note. Exposure is given in person-quarters.a Regression adjusted results are given inTable 7 and produce marginal effects that mirror theexperimental-control differences reported in this table.∗ p-values< .1.
that births experienced a once-and-for-all decline in the family cap period. For Blacks, therewere 3.4 fewer births per 1,000 observations in the post-family cap period. For Hispanics,both the Family Cap dummy and its interaction with Time are significant; and the net effectis a decline of 1.8 births per 1,000 observations in the post-family cap period, relative to thepre-cap period.
Alternative Effectiveness Estimates
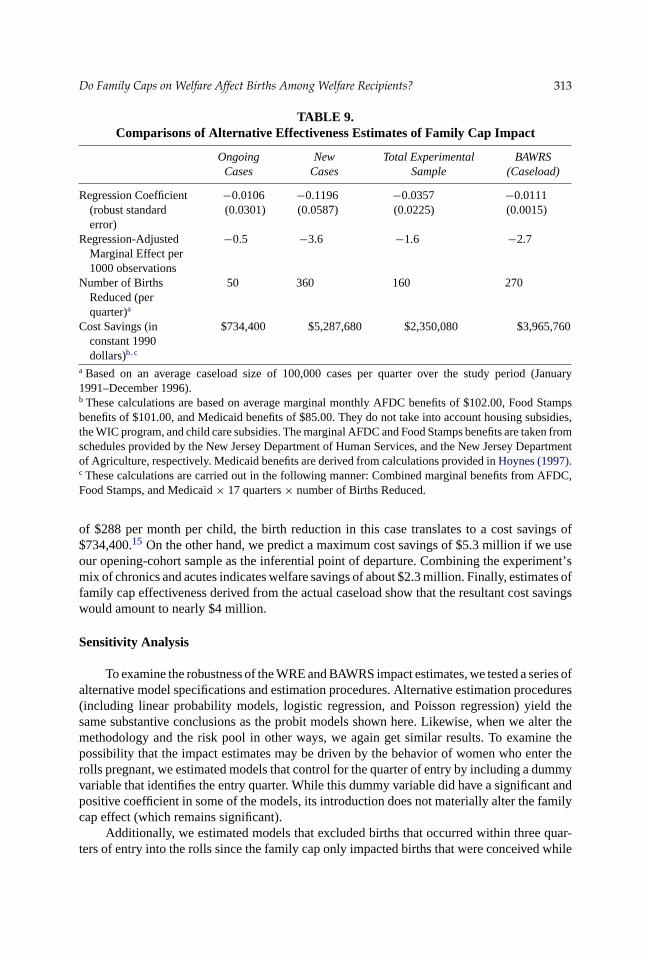
In Table 9we compare alternative effectiveness estimates of family cap impact, calculatedusing estimated marginal effects on births and the implied cost savings. The table shows arange of estimates of cost savings based on various assumptions of caseload compositions. Ifthe caseload was made up predominantly of chronics, our point-in-time sample would leadus to expect a half-a-birth reduction per observation per quarter and a 50-birth reduction perquarter for the average caseload size of approximately 100,000 recipients during the studyperiod. On the basis of a total marginal benefit package (AFDC, Food Stamps, and Medicaid)
Do
Family
Caps
onW
elfareA
ffectBirths
Am
ongW
elfareR
ecipients?311
TABLE 7.Family Cap Impact on Births – Regression –Adjusted Results from the Experiment – Coefficients (Robust Standard Errors), and
(B) Ongoing casesExperimental status −0.0808 (0.0863) −0.0028 −0.0191 (0.0388) −0.0009 0.0355 (0.0573) 0.0012Number of observations 5,839 24,209 13,830
(C) New casesExperimental status −0.0421 (0.0820) −0.0026 −0.1111∗∗ (0.0459) −0.0077∗∗ −0.0416 (0.0630) −0.0025Number of observations 3,657 10,073 6,111
Note. Number of observations are given in person-quarters. Robust, Huber-corrected standard errors are reported. All regressions include seasonal dummies,age, marital status, education, number of children, county fixed effects, county employment rate and JOBS program participation rate. Full regression resultsare available from the authors.∗∗ p < .05.
312AMERIC
AN
JOURNALOFEVALUATIO
N,25(3),2004
TABLE 8.Family Cap Impact on Births – Probit Regression Results from the Before-After Analysis – Coefficients and Marginal Effectsa
Intercept −0.2435 (0.0296) −0.1956∗ (0.0752) −0.1850∗ (0.0428) −0.1157∗ (0.0504)N (in person
quarters)1,760,894 267,012 932,580 561,365
All regressions include county fixed effects. When the FC× Time interaction is significant, the net marginal effect for FC is computed using the following formula: Main effect of FC+ [(time × FC)× mean time] (Mohr, 1995).a Robust standard errors given in parentheses.∗ p-values<0.05.
Do Family Caps on Welfare Affect Births Among Welfare Recipients? 313
TABLE 9.Comparisons of Alternative Effectiveness Estimates of Family Cap Impact
Ongoing New Total Experimental BAWRSCases Cases Sample (Caseload)
a Based on an average caseload size of 100,000 cases per quarter over the study period (January1991–December 1996).b These calculations are based on average marginal monthly AFDC benefits of $102.00, Food Stampsbenefits of $101.00, and Medicaid benefits of $85.00. They do not take into account housing subsidies,the WIC program, and child care subsidies. The marginal AFDC and Food Stamps benefits are taken fromschedules provided by the New Jersey Department of Human Services, and the New Jersey Departmentof Agriculture, respectively. Medicaid benefits are derived from calculations provided inHoynes (1997).c These calculations are carried out in the following manner: Combined marginal benefits from AFDC,Food Stamps, and Medicaid× 17 quarters× number of Births Reduced.
of $288 per month per child, the birth reduction in this case translates to a cost savings of$734,400.15 On the other hand, we predict a maximum cost savings of $5.3 million if we useour opening-cohort sample as the inferential point of departure. Combining the experiment’smix of chronics and acutes indicates welfare savings of about $2.3 million. Finally, estimates offamily cap effectiveness derived from the actual caseload show that the resultant cost savingswould amount to nearly $4 million.
Sensitivity Analysis
To examine the robustness of the WRE and BAWRS impact estimates, we tested a series ofalternative model specifications and estimation procedures. Alternative estimation procedures(including linear probability models, logistic regression, and Poisson regression) yield thesame substantive conclusions as the probit models shown here. Likewise, when we alter themethodology and the risk pool in other ways, we again get similar results. To examine thepossibility that the impact estimates may be driven by the behavior of women who enter therolls pregnant, we estimated models that control for the quarter of entry by including a dummyvariable that identifies the entry quarter. While this dummy variable did have a significant andpositive coefficient in some of the models, its introduction does not materially alter the familycap effect (which remains significant).
Additionally, we estimated models that excluded births that occurred within three quar-ters of entry into the rolls since the family cap only impacted births that were conceived while
314 AMERICAN JOURNAL OF EVALUATION, 25(3), 2004
receiving welfare. Again, our results are invariant to this adjustment and if anything, the treat-ment effect gets stronger. We also estimated models that adjust the risk pool (the denominatorof the birth rate) to accommodate the biological impossibility of women to give birth withinthree quarters of a previous birth. None of our risk-pool adjustments yielded impact estimatesthat differed substantially from the estimates presented here. While results of these sensitivityanalyses on the WRE are reported inJagannathan et al. (2004), those results for the BAWRSare available from the authors.
DISCUSSION
Notwithstanding the many strengths that social experiments display, the chorus who maintainthat results may not be generalizable to populations of interest has been growing larger andlouder.Heckman (1992), for example, warns that human participants in social experiments donot act the way “plots of ground” react to randomized trials in agriculture. “Plots of ground donot respond to anticipated treatment of fertilizer, nor can they excuse themselves from beingtreated” (p. 215).
While a good many researchers have traced the social experiments’ lack of externalvalidity to problems such as randomization bias, entry and macro effects, mixing problemsand setting heterogeneity, in this paper we show that a form of time-induced heterogeneity,the Heraclitus effect, can limit an experiment’s generalizability. The Heraclitus effect alerts usthat although it may be unwise to treat experimental subjects as plots of ground, it may also beunwise to assume they are drawn from stagnant pools. If population dynamics indicate an ebband flow, our sampling strategy would appear to warrant more than one step into the streamand perhaps from a few places along the banks as well.
Our research is consistent with other work on welfare population suggesting that recipi-ents comprise two general types, that is, chronic, long-term users and acute, emergency cases(Ellwood & Bane, 1994; Moffitt & Ver Ploeg, 2001; Rank, 1985). Our model of samplingfor heterogeneity, which includes point-in-time and opening-cohort components, allows us toestimate family cap efficacy for these chronic and acute cases as well as for the entire ex-perimental sample. The feasibility of using these estimates as measures of the family cap’spopulation-wide effectiveness is greatly facilitated, moreover, by a research design that allowstheir direct comparison with effectiveness estimates generated through a BAWRS comparisonof the entire caseload. In our application, for example, the preponderance of evidence wouldpoint to an estimate of effectiveness that lies somewhere between the total experimental esti-mate of $2.3 million and the new case estimate of $5.2 million. Our BAWRS analysis clearlysteers us away from using the ongoing case estimate as a lower bound.
As we have shown, efficacy estimates from a social experiment do not necessarily placean upper bound on estimates of effectiveness in a real-world population of interest (Nathan,2004; Rosenbaum, 2002). Here estimates for a sample of chronics are much lower than whatwas found in the population; on the other hand, the family cap effect for new cases was higher.Hence, WREs that employed point-in-time samples will tend to understate birth effects tothe extent that the effect is confined to new cases and new cases are underrepresented insuch samples. The study is not meant to imply that point-in-time samples will always lead toestimates biased by time-induced heterogeneity. Today’s populations of welfare recipients arelikely to be less dynamic than those 10 years ago as shrinking caseloads are dominated by higherfractions of long-term, chronic cases. It is not difficult to imagine under these circumstances,
Do Family Caps on Welfare Affect Births Among Welfare Recipients? 315
that experimental treatments which affect chronics more than others will be more reflectiveof population effectiveness estimates. However, until such time as sufficient data has beenaccumulated from additional blended design studies, extrapolations of experimental effectsto dynamic populations, should proceed with great caution. The use of prior information ontreatment selection and population response appear to be a helpful interim response (Manski,1997; Pepper, 2003).
In this application, we show that sampling from a welfare population at t nets a set ofrespondents heavily weighted toward “chronics” while an opening-cohort strategy of samplingcases betweent and severalt + �t yielded predominately “acutes” with welfare stay lengthssimilar to those of the entire caseload. These mixes are anticipated from the work ofEllwood andBane (1994), Rank (1985), and others. This need not be the case, however, in other applicationsof welfare reform experiments. Work byMoffitt and Ver Ploeg (2001), Stevens (2000), andVerPloeg (2002)indicate that in addition to acutes and chronics, a number of recipients are cyclerswho have intermittent spells of welfare dependency. There is little consensus at this time, how-ever, on the size of this cycler group which appears to behave more like chronics than acutes(Moffitt & Ver Ploeg, 2001). Sampling strategies need to be sensitive to these issues if exper-iments are to yield unbiased estimates of treatment effectiveness in the population of interest.
We believe that our discussion of time-induced heterogeneity bias is not limited to wel-fare reform experiments and applies to any experiment or observational study where durationcontingent subgroups comprise the population under study. We recognize, however, that de-tecting a Heraclitus effect requires a blended design strategy that may be difficult or evenimpossible to implement under conditions of partial-coverage programs. Where conditions areconducive, this potential source of bias in treatment estimates needs to be identified and, ifpossible, corrected through case weighting or other related techniques. Such a line of researchwould go a long way in addressing issues of external validity that continues to challenge socialexperimentation and its advocates.
NOTES
1. The view that experiments are superior to other evaluation designs in establishing internalvalidity is often expressed in the welfare reform evaluation literature. The advantages of experiments areattributed to (a) providing a treatment variable that is assured to be at least conditionally independent ofunobservables (Moffitt, 1992); (b) minimizing errors due to factors external to the program, maturationprocesses, and regression to the mean (Orr, 1999); (c) obviating the need to collect background andretrospective information (Moffitt & Ver Ploeg, 2001); and (d) simplicity and straightforwardness ofimpact interpretation (Burtless, 1995). Moreover, asBurtless and Orr (1986)note, many of the supposeddisadvantages of experiments such as limited duration, attrition, non-compliance and non-response, areshared by quasi-experimental designs as well.
2. There are several obvious difficulties with such before-after methodology; in particular, thereis the risk of confounding effects of other factors betweent andt + 1 with the effects of the program (orthe change in program) per se (seeCook & Campbell, 1979; Rossi, Freeman & Lipsey, 1999).
3. Like social experiments, a medical experiment also may fail to measure entry effects (forexample, a national vaccination program might be so successful that some persons at risk might not botherto become vaccinated. Focusing only on outcomes for a medical experiment’s experimental subjects mightmean that such entry effects would be ignored).
4. Likewise, a global medical program may substantially reduce the likelihood of disease even forpersons who are not vaccinated, whereas a small-scale medical experiment may have no such effect.
316 AMERICAN JOURNAL OF EVALUATION, 25(3), 2004
5. Manski (1997), for example, notes that an experiment only provides information on the twomarginal distributionsP(Y1|X) andP(Y0|X), that is, the outcomes for experimentals (Y1) and controls (Y0)given a set of covariates (X). The outcome a person realizes under an actual administration of policy in apopulation of interest isZm = 1 if the person receives treatment andZm = 0 if not. Hence the estimate oftreatment impact in the population for the experiment is the conditional probabilityP(Ym|X) = P(Y1|X,Zm = 1) × P(Zm = 1|X) + P(Y0|X, Zm = 0) × P(Zm = 0|X).
6. The cap was implemented in New Jersey as a component in a welfare reform initiative calledthe Family Development Program (FDP). Other provisions of this welfare reform package included: (a)enhanced earnings disregards for households with capped grants; (b) provision of a two-year extensionof Medicaid benefits for welfare recipients that exited AFDC for employment; (c) toughened sanctionsfor failure to participate in the JOBS program; (d) elimination of the loss of cash benefits for childrenif a mother married; and (e) a requirement that women with children age two and older participate intraining/education programs. Unlike the family cap, these policies do not target fertility behavior and,when tested, have not been found to influence birth outcomes (Camasso, in press; Horvath-Rose & Peters,2001).
7. We restricted the before-after analysis of the caseload to these 10 counties to help make WREand BAWRS analyses compatible.
8. [8.]We find no difference in family cap impacts assessed using the opening cohort sampleaccrued through the planned sampling period (December 1993) and the actual opening cohort sample(that accrued through December 1994). Analyses presented in this paper report on the actual sample.
9. Heckman (1992)has pointed up the issue faced by all experiments about when to randomize. Tooearly a stage or too narrow a timeframe could yield a potential conflict between obtaining better estimatesof a behavioral model and producing simple estimates of mean impacts that cannot be generalized.
10. AsManski (1996, p. 716)points out a great many WRE, including the now-classic experimentsconducted by MDRC focus on the population fraction receiving treatment under a program (see forexample,Gueron & Pauly, 1991). This often amounts to a comparison of welfare reform treatment andAFDC treatment (controls) without consideration of individuals who are not currently on the rolls. Hence,under the assumption of no entry effects, the experiment produces estimates of efficacy that are moredescriptive of the ‘average effect of treatment on the treated’ than ‘an average treatment effect’.
11. For experimental cases that are capped, marginal benefits comprise food stamp benefits only,adjusted for the loss in AFDC increment, calculated as: Food Stampt = FSMAXt,n+ 1 − FSMAXt,n whereFSMAXt,n is the maximum food stamp allotment in timet for food stamp eligible sizen. For control casesthat have a birth, marginal benefits include the usual incremental AFDC amount plus foods stamp benefitsthat are reduced by 30 cents for each dollar increase in AFDC grant amount, and are calculated as: NetIncremental Benefit= AFDC Increment+ FSMAXt,n+ 1 − FSMAXt,n − (0.30× AFDC Increment).
12. In both the WRE and the BAWRS analyses, we explicitly recognize the non-independence ofobservations and calculate Huber-corrected standard errors.
13. Because all cases in the post-reform period (except for the control cases in the experimentalsample) were subject to the family cap, we also computed mean and median spell lengths for experimentalsample excluding the control cases. These mean and median spell lengths were virtually identical to thosereported inTable 5for the experimental sample as a whole.
14. Regression-adjusted marginal effects presented in Table 7 were generated using Stata’s –dprobit– command, which reportsΦ1 − Φ0, whereΦ1 andΦ0 are the normal cumulative density functions eval-uated with the FDP dummy variable turned on and off, holding all other variables at their sample means.All regressions presented in Table 7 include seasonal dummies, age, marital status, education, numberof children, county fixed effects, county employment rate and JOBS participation rate. Full regressionresults are available from the authors.
15. These calculations are based on average marginal monthly AFDC benefits of $102.00, FoodStamps benefits of $101.00, and Medicaid benefits of $85.00. They do not take into account hous-ing subsidies, the WIC program, and child care subsidies. The marginal AFDC and Food Stampsbenefits are taken from schedules provided by the New Jersey Department of Human Services, and
Do Family Caps on Welfare Affect Births Among Welfare Recipients? 317
the New Jersey Department of Agriculture, respectively. Medicaid benefits are derived from calcu-lations provided inHoynes (1997). The calculations are carried out in the following manner: Com-bined marginal benefits from AFDC, Food Stamps, and Medicaid× 17 quarters× number of BirthsReduced.
REFERENCES
Blank, R. M. (1989). Analyzing the length of welfare spells.Journal of Public Economics, 39, 45–273.Burtless, G. (1995). The case for randomized field trials in economic and policy research.Journal of
Economic Perspectives, 9, 63–84.Burtless, G., & Orr, L. L. (1986). Are classical experiments needed for manpower policy?Journal of
Human Resources, 21, 606–639.Cain, G. G. (1997). Controlled experiments in evaluating the new welfare programs.Focus, 18, 25–28.Camasso, M. J. (in press). Isolating the family cap effect on fertility behavior: Evidence from New
Jersey’s Family Development Program Experiment.Journal of Contemporary Economic Policy.Camasso, M. J., Jagannathan, R., Harvey, C., & Killingsworth, M. (2003). The use of client surveys to
gauge the threat of contamination in welfare reform experiments.Journal of Policy Analysis andManagement, 22, 207–223.
Camasso, M. J., Jagannathan, R., Killingsworth, M., & Harvey, C. (2003). New Jersey’s family capand family size decisions: Findings from a five-year evaluation.Research in Labor Economics, 22,71–112.
Campbell, D. T., & Stanley, J. C. (1966).Experimental and quasi-experimental designs for research.Chicago, IL: Rand McNally.
Cook, T. D., & Campbell, D. T. (1979).Quasi-experimentation: Design and analysis issues for fieldsettings. Chicago, IL: Rand McNally.
Ellwood, D. T., & Bane, M. J. (1994). Understanding welfare dynamics. In M. J. Bane & D. T. Ellwood(Eds.),Welfare realities: From rhetoric to reform (pp. 28–66). Cambridge, MA: Harvard UniversityPress.
Friedlander, D., & Robins, P. K. (1995). Evaluating program evaluations: New evidence on commonlyused nonexperimental methods.American Economic Review, 85, 923–937.
Garfinkel, I., Manski, C. F., & Michalopoulos, C. (1992). Micro experiments and macro effects. In C. F.Manski & I. Garfinkel (Eds.),Evaluating welfare and training programs (pp. 253–273) Cambridge,MA: Harvard University Press.
Greenberg, D., & Shroder, M. (1997).The digest of social experiments (2nd ed.). Washington, DC: TheUrban Institute Press.
Grissmer, D., Flanagan, A., Kawata, J., & Williamson, S. (2000).Improving students achievement. SantaMonica, CA: Rand.
Gueron, J. M., & Pauly, E. (1991).From welfare to work. New York: Russell Sage.Heckman, J. J. (1992). Randomization and social policy evaluation. In C. F. Manski & I. Garfinkel (Eds.),
Evaluating welfare and training programs (pp. 201–230). Cambridge, MA: Harvard UniversityPress.
Heckman, J. J., & Hotz, V. J. (1989). Choosing among alternative nonexperimental methods for estimatingthe impact of social programs: The case of manpower training.Journal of the American StatisticalAssociation, 84, 862–874.
Heckman, J. J., & Smith, J. A. (1995). Assessing the case for social experiments.Journal of EconomicPerspectives, 9, 85–110.
Heckman, J. J., Smith, J. A., & Clements, N. (1997). Making the most out of programme evaluationsand social experiments: Accounting for heterogeneity in programme impacts.Review of EconomicStudies, 64, 487–535.
318 AMERICAN JOURNAL OF EVALUATION, 25(3), 2004
Horvath-Rose, A., & Peters, H. E. (2001). Welfare waivers and nonmarital childbearing. In G. Duncan &P. L. Chase-Lansdale (Eds.),For better and for worse: Welfare reform and the wellbeing of childrenand families. New York, NY: Russell Sage.
Hotz, V. J., Imbens, G. W., & Mortimer, J. H. (1999).Predicting the efficacy of future training programsusing past experiences (NBER-238). Cambridge, MA: National Bureau of Economic Research.
Hoynes, H. W. (1997). Work, welfare, and family structure: What have we learned? In A. J. Auerbach(Ed.),Fiscal policy: Lessons from economic research (pp. 101–146). London: MIT Press.
Jagannathan, R., Camasso, M. J., & Killingsworth, M. (2004). New Jersey’s Family Cap experiment: Dofertility impacts differ by racial density?Journal of Labor Economics, 22, 431–460.
Manski, C. F. (1996). Learning about treatment effects from experiments with random assignment oftreatments.Journal of Human Resources, 31, 709–733.
Manski, C. F. (1997). The mixing problem in programme evaluation.Review of Economic Studies, 64,537–553.
Meyer, B. (1995). Natural and quasi-experiments in economics.Journal of Business and EconomicStatistics, 13, 151–161.
Moffitt, R. A. (1992). Evaluating methods for program entry effects. In C. F. Manski & I. Garfinkel (Eds.),Evaluating welfare and training programs (pp. 231–252). Cambridge, MA: Harvard UniversityPress.
Moffitt, R. A. (1998). The effect of welfare on marriage and fertility. In R. A. Moffitt (Ed.),Welfare, thefamily, and reproductive behavior (pp. 50–97). Washington, DC: National Academy Press.
Moffitt, R. A., & Ver Ploeg, M. (Eds.). (1999).Evaluating welfare reform: A framework and review ofcurrent work. Washington, DC: National Academy Press.
Moffitt, R. A., Ver Ploeg, M. (Eds.). (2001).Evaluating welfare reform in an era of transition. Washington,DC: National Academy Press.
Mohr, L. B. (1995).Impact analysis for program evaluation. Thousand Oaks, CA: Sage.Nathan, P. E. (2004). The clinical utility of therapy research: Bridging the gap between the present and
the future. In A. R. Roberts & K. R. Yeager (Eds.),Evidence-based practice manual (pp. 949–960).New York, NY: Oxford University Press.
Nathan. P. E., & Gorman, J. M. (2002). Efficacy, effectiveness and clinical utility of psychotherapyresearch. In P. E. Nathan & J. M. Gorman (Eds.),A guide to treatments that work (pp. 643–654).New York, NY: Oxford University Press.
O’Neill, D. M., & O’Neill, J. F. (1997).Lessons for welfare reform: An analysis of the AFDC caseloadand past welfare-to-work programs. Kalamazoo, MI: WE Upjohn Institute.
O’Neill, J. A., Bassi, L. J., & Wolf, D. A. (1987). The duration of welfare spells.Review of Economicsand Statistics, 69, 241–249.
Orr, L. L. (1999).Social experiments: Evaluating public programs with experimental methods. ThousandOaks, CA: Sage.
Pepper, J. V. (2003). Using experiments to evaluate performance standards: What do welfare-to-workdemonstrations reveal to welfare reformers?Journal of Human Resources, 38, 860–880.
Plotnick, R. (1983). Turnover in the AFDC population: An event history analysis.Journal of HumanResources, 18, 65–81.
Rank, M. R. (1985). Exiting from welfare: A life-table analysis.Social Service Review, 59, 358–376.Robinson, T. M. (1987).Fragments: A text and translation/Heraclitus. Toronto: University of Toronto
Press.Rosenbaum, P. R. (2002).Observational studies (2nd ed.). New York, NY: Springer.Rossi, P. H., Freeman, H. E., & Lipsey, M. W. (1999).Evaluation: A systematic approach. Thousand
Oaks, CA: Sage.Shadish, W. R., Cook, T. D., & Campbell. D. T. (2002).Experimental and quasi-experimental designs
for generalized causal inference. Boston, MA: Houghton Mifflin.Sommer, A., & Zeger, S. L. (1991). On estimating efficacy from clinical trials.Statistics in Medicine, 10,
45–52.
Do Family Caps on Welfare Affect Births Among Welfare Recipients? 319
Stevens, D. (2000).Welfare, employment, and earnings. Memorandum proposal for the panel on data andmethods for measuring the effects of changes in social welfare programs. Committee on NationalStatistics. Baltimore, MD: University of Baltimore.
Stock, J. H., & Watson, M. W. (2003).Introduction to econometrics. Boston, MA: Addison Wesley.Toklas, A. B. (1963).What is remembered. New York: Holt, Rinehart, and Winston.Ver Ploeg, M. (2002). Preexit benefit receipt and employment histories and postexit outcomes of welfare
leavers. In M. Ver Ploeg, R. A. Moffitt, & C. F. Citro (Eds.),Studies of welfare populations: Datacollection and research issues (pp. 415–472). Washington, DC: National Academy Press.