LINCOLN UNIVERSITY Do tourists use too much water, pay too little in taxes? Ross Cullen, Commerce Division, Lincoln University Andrew Dakers & David Lees, ecoEng Ltd, Christchurch Gerit Meyer-Hubbert, Commerce Division, Lincoln University
Transcript
LIN
CO
LN U
NIV
ER
SIT
Y
Do tourists use too much water, pay too little in taxes?
Ross Cullen, Commerce Division, Lincoln UniversityAndrew Dakers & David Lees, ecoEng Ltd, Christchurch
Gerit Meyer-Hubbert, Commerce Division, Lincoln University
LIN
CO
LN U
NIV
ER
SIT
Y
Research into tourism, water, wastewater and solid wastes
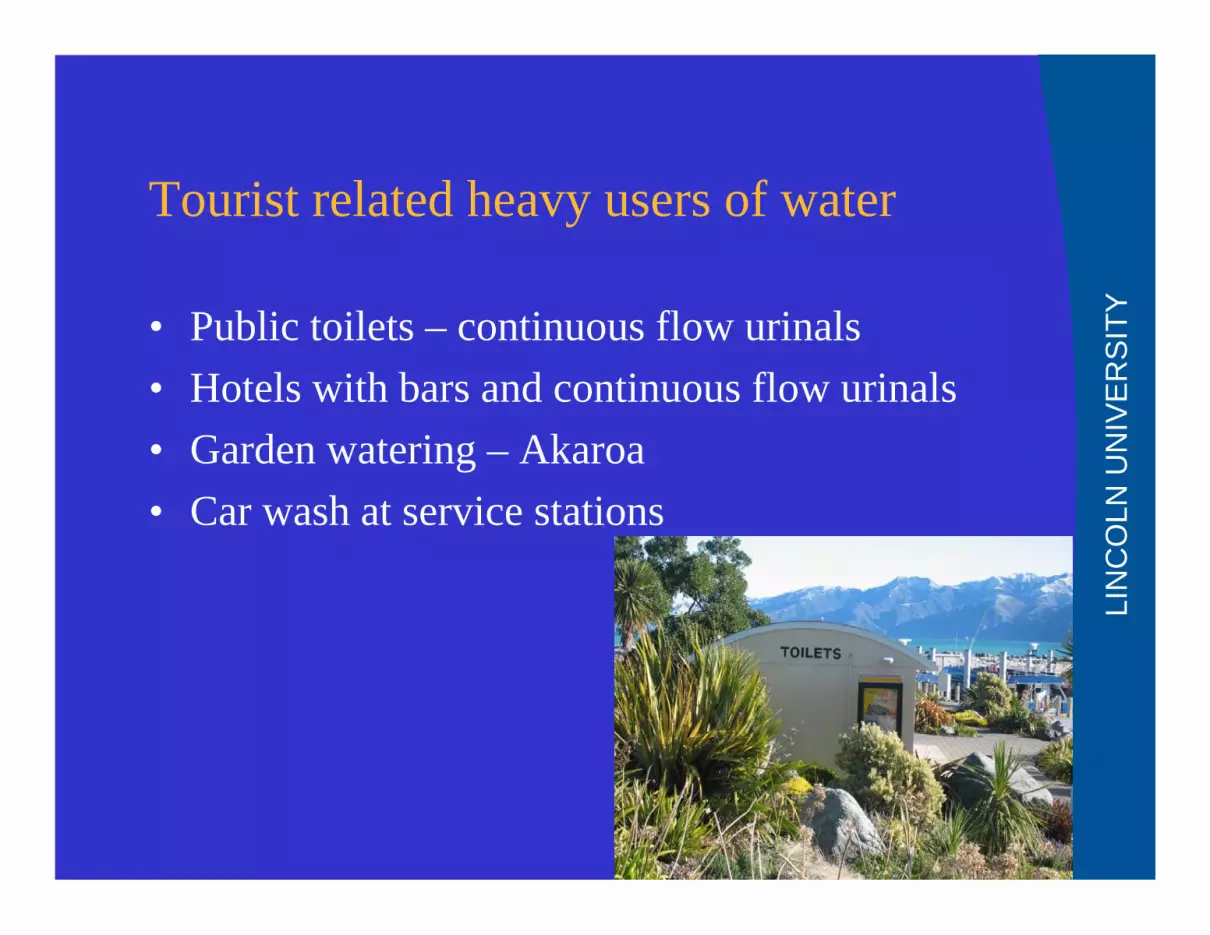
• Growth in visitor numbers• Increased demands for water, wastewater, solid waste
services• Need to fund operational costs and new services• Studies of water, sewerage, and solids disposal and
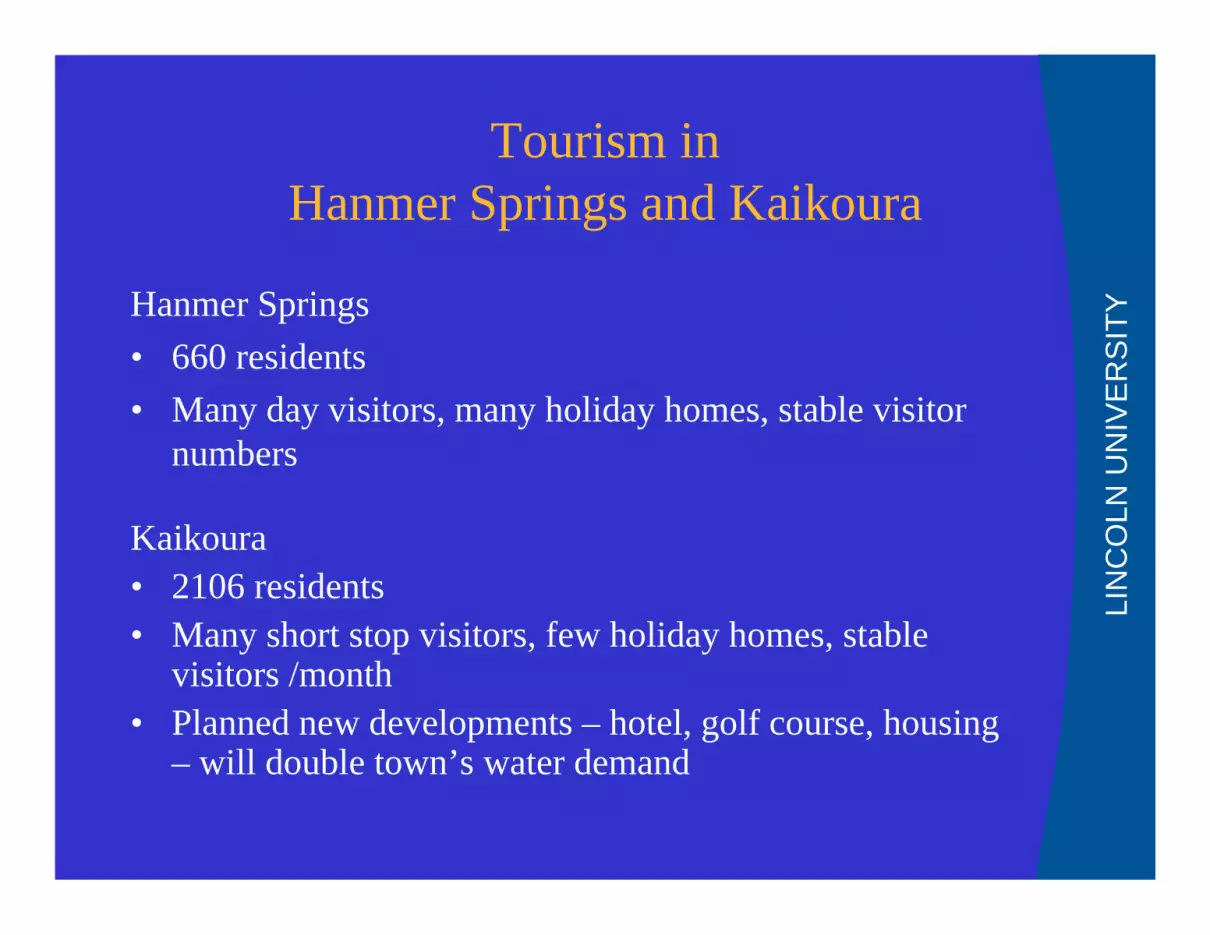
funding: – Westland 2000/01, Akaroa 2002/03, Kaikoura and
Hanmer Springs 2003/04• Micro data collection. FRST and MED/ CDC funding
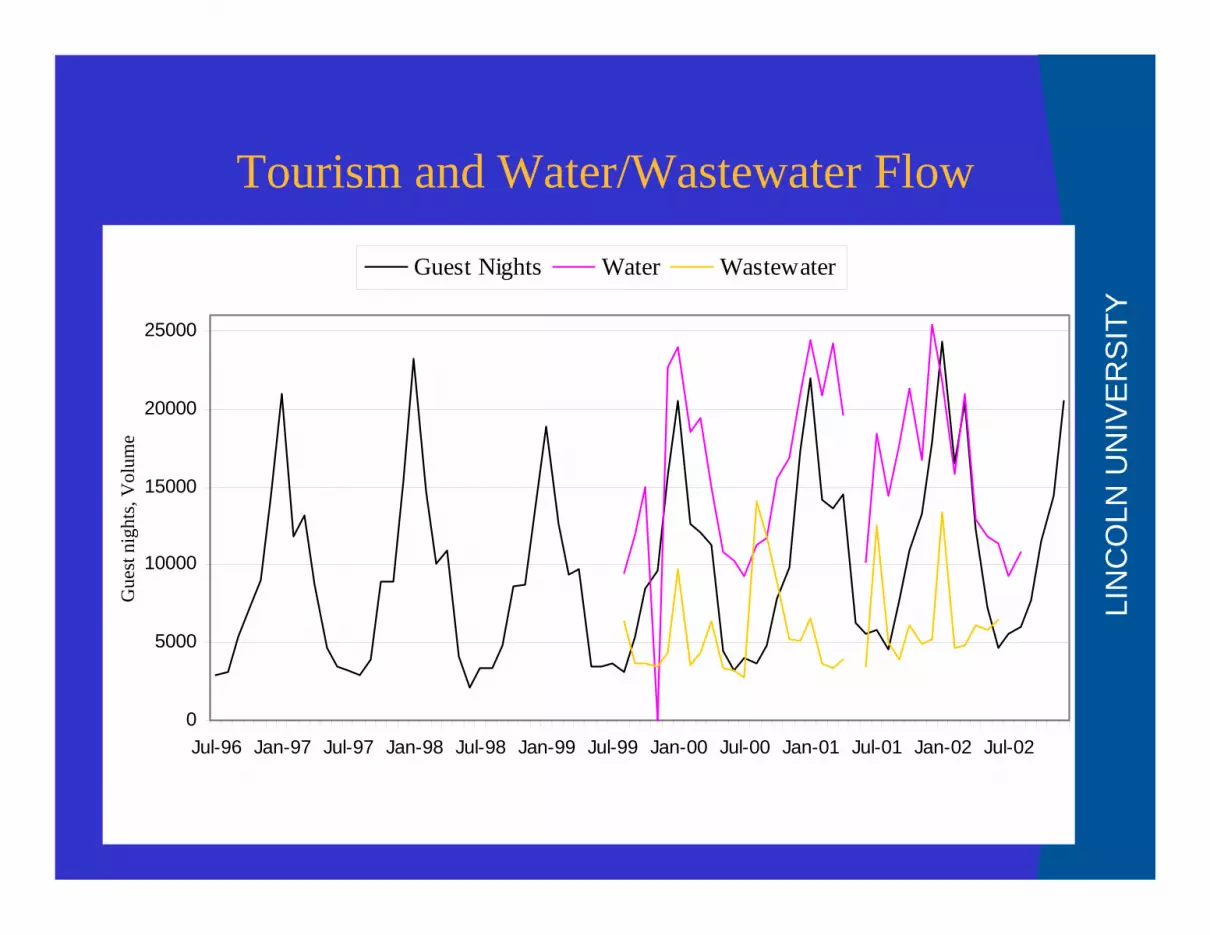
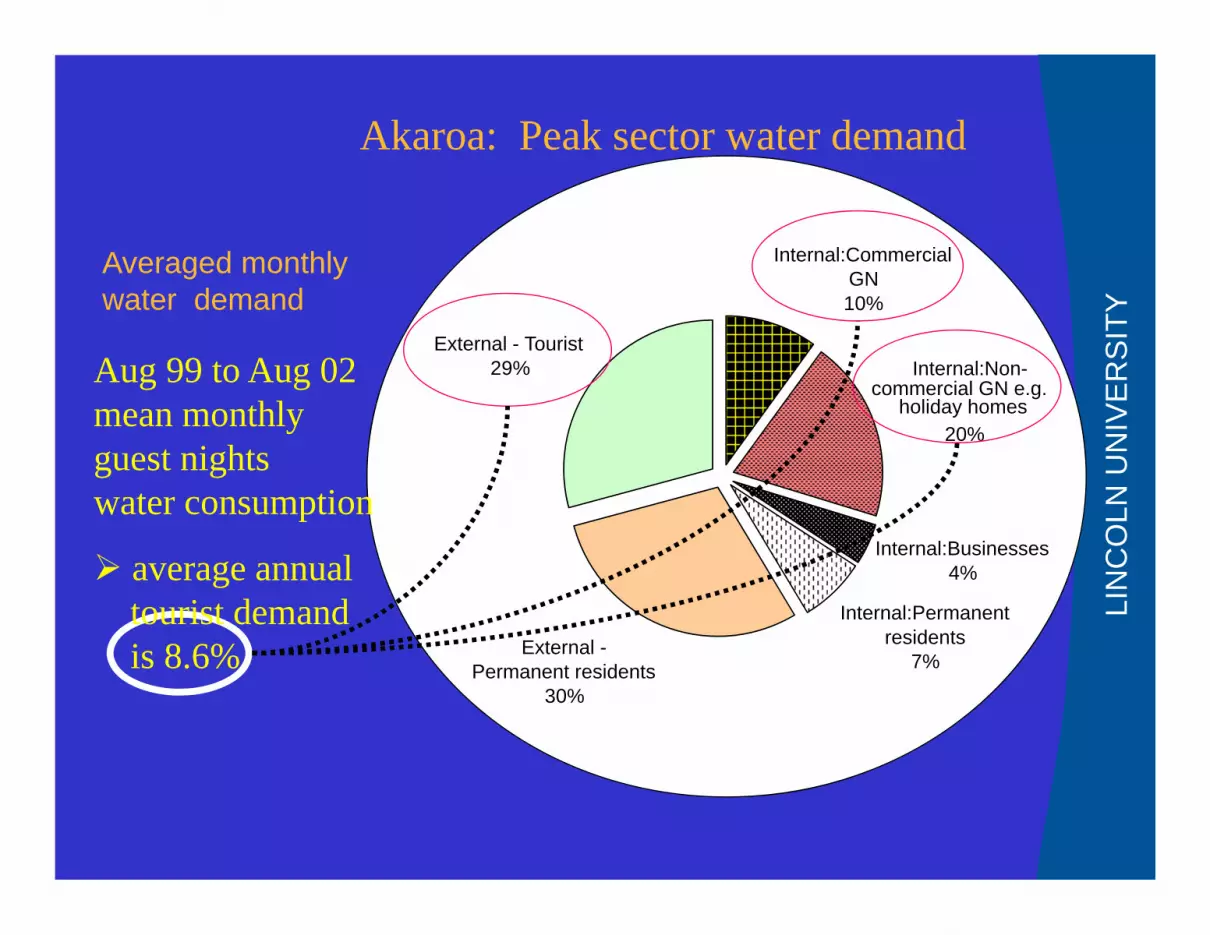
Aug 99 to Aug 02mean monthly guest nightswater consumption
average annualtourist demandis 8.6%
Averaged monthly water demand
LIN
CO
LN U
NIV
ER
SIT
Y
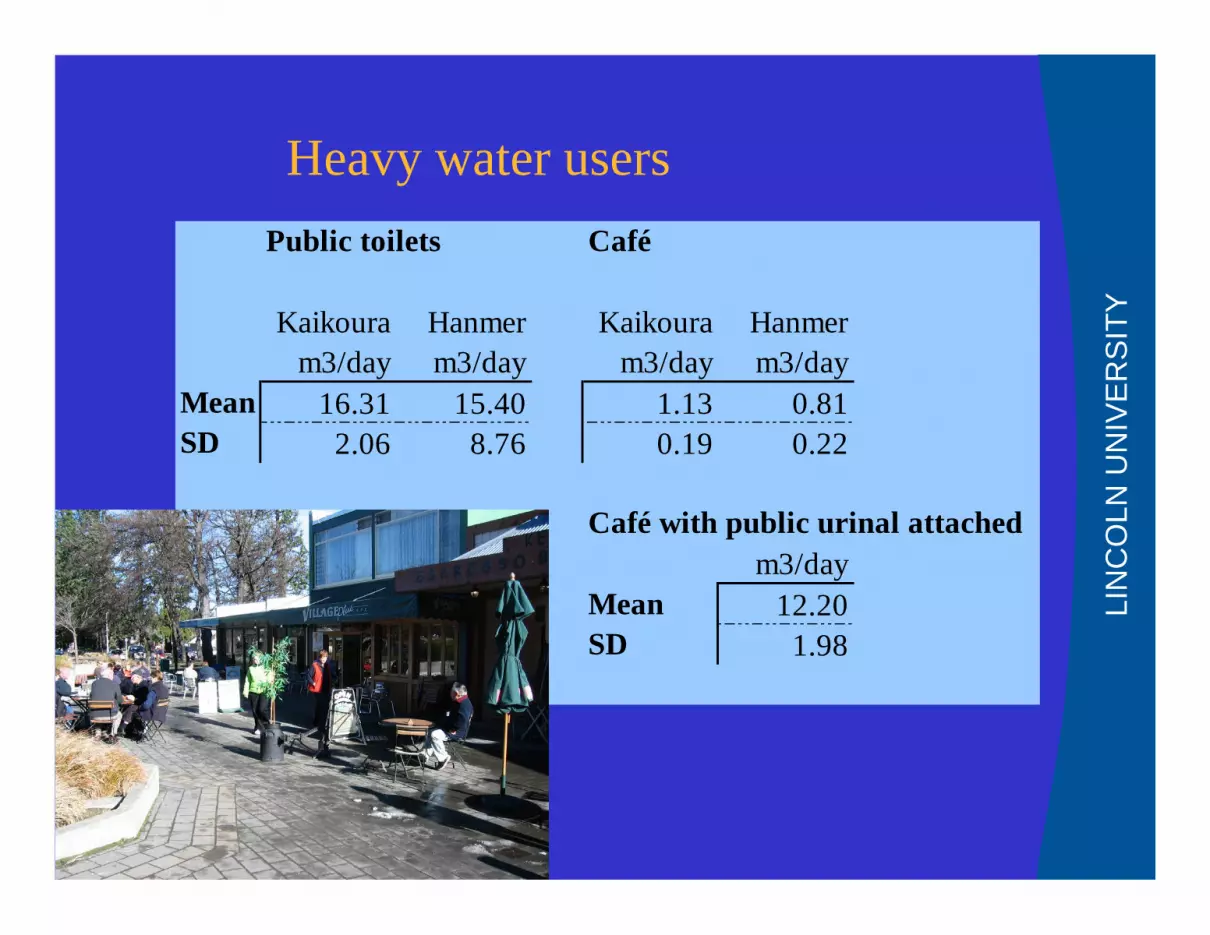
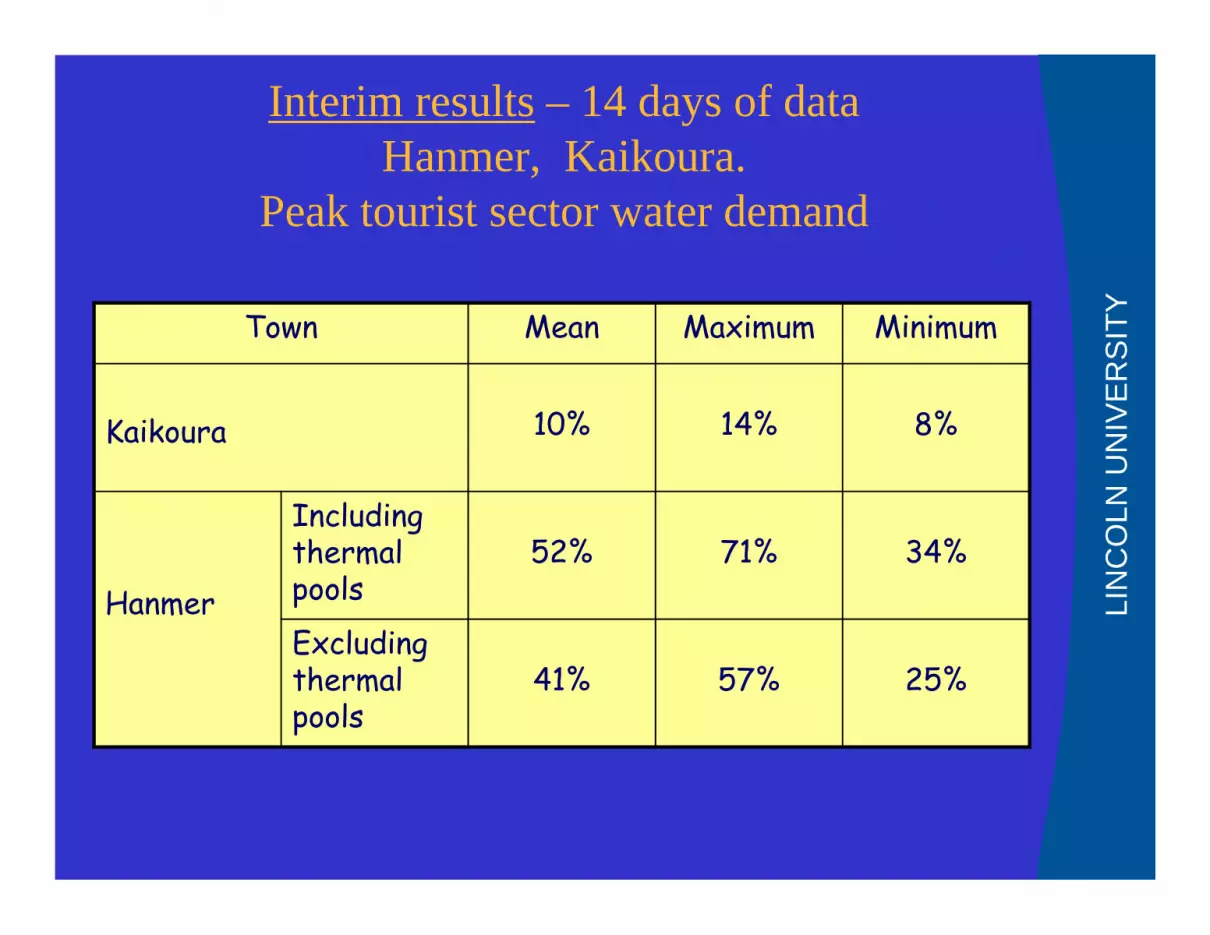
Interim results – 14 days of data Hanmer, Kaikoura.
Peak tourist sector water demand
Town Mean Maximum Minimum
Kaikoura 10% 14% 8%
Hanmer
Including thermal pools
52% 71% 34%
Excluding thermal pools
41% 57% 25%
LIN
CO
LN U
NIV
ER
SIT
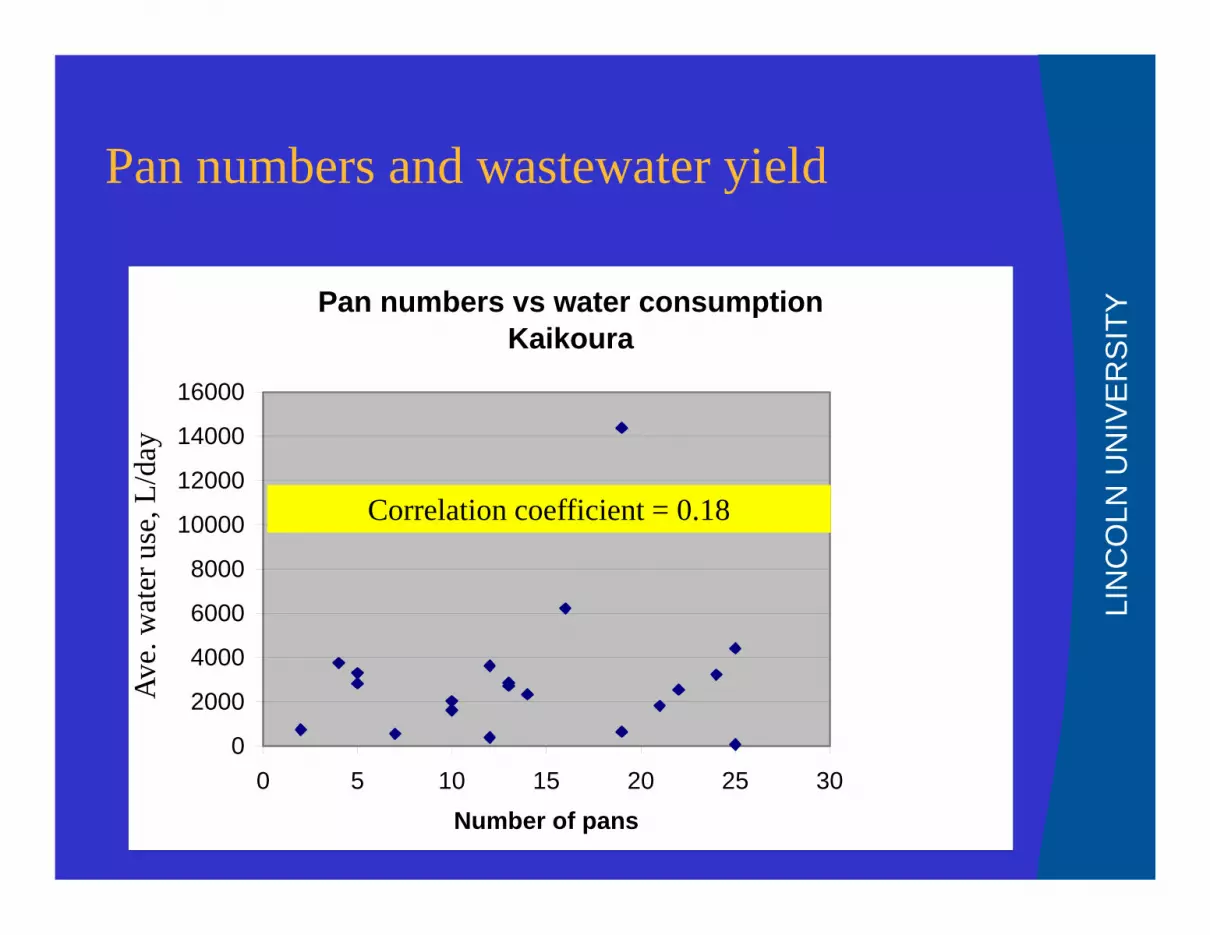
YPan numbers vs water consumptionKaikoura
0
2000
4000
6000
8000
10000
12000
14000
16000
0 5 10 15 20 25 30Number of pans
Pan numbers and wastewater yieldAv
e. w
ater
use
, L/d
ay
Correlation coefficient = 0.18
LIN
CO
LN U
NIV
ER
SIT
Y
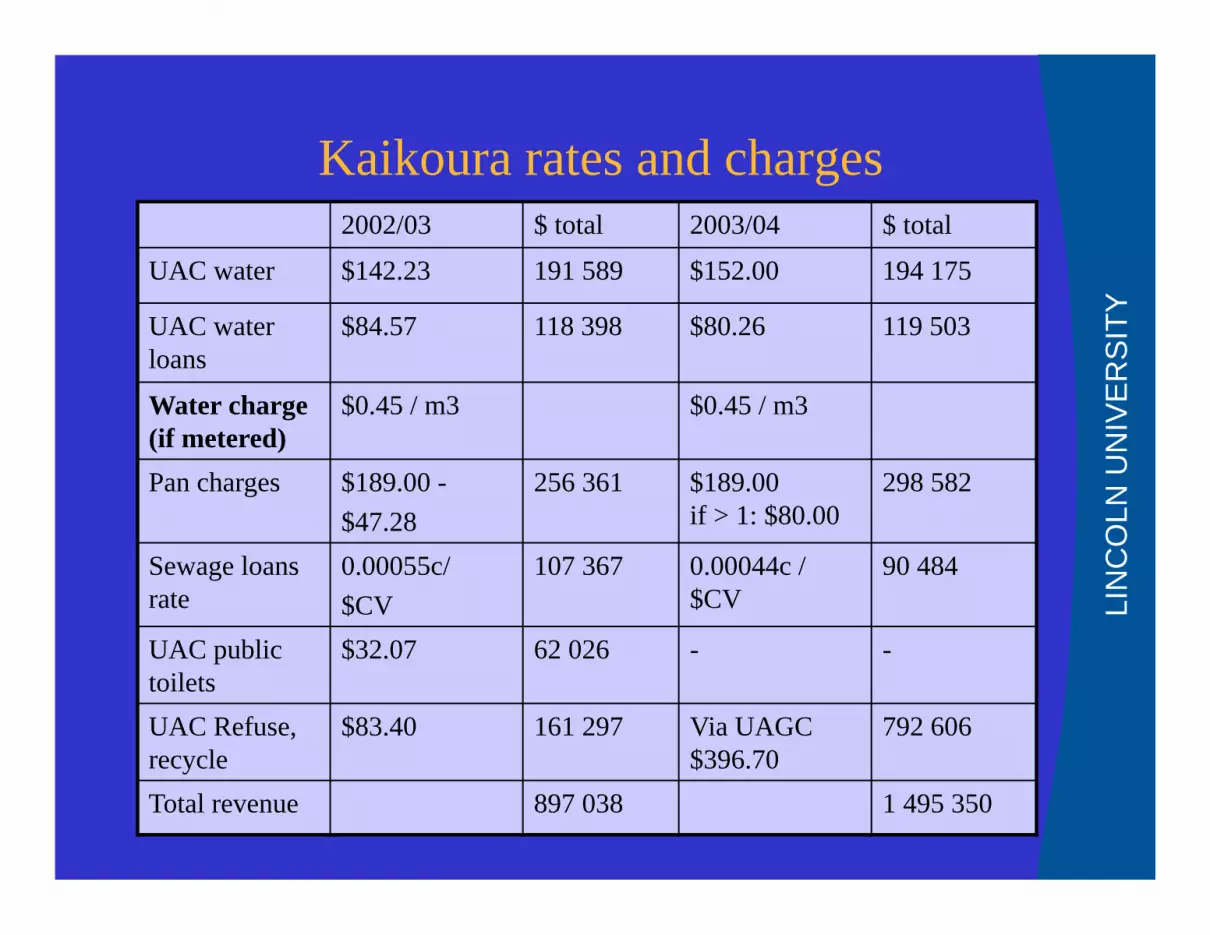
Kaikoura rates and charges2002/03 $ total 2003/04 $ total
UAC water $142.23 191 589 $152.00 194 175
UAC water loans
$84.57 118 398 $80.26 119 503
Water charge (if metered)
$0.45 / m3 $0.45 / m3
Pan charges $189.00 -$47.28
256 361 $189.00if > 1: $80.00
298 582
Sewage loans rate
0.00055c/$CV
107 367 0.00044c / $CV
90 484
UAC public toilets
$32.07 62 026 - -
UAC Refuse, recycle
$83.40 161 297 Via UAGC $396.70
792 606
Total revenue 897 038 1 495 350
LIN
CO
LN U
NIV
ER
SIT
Y
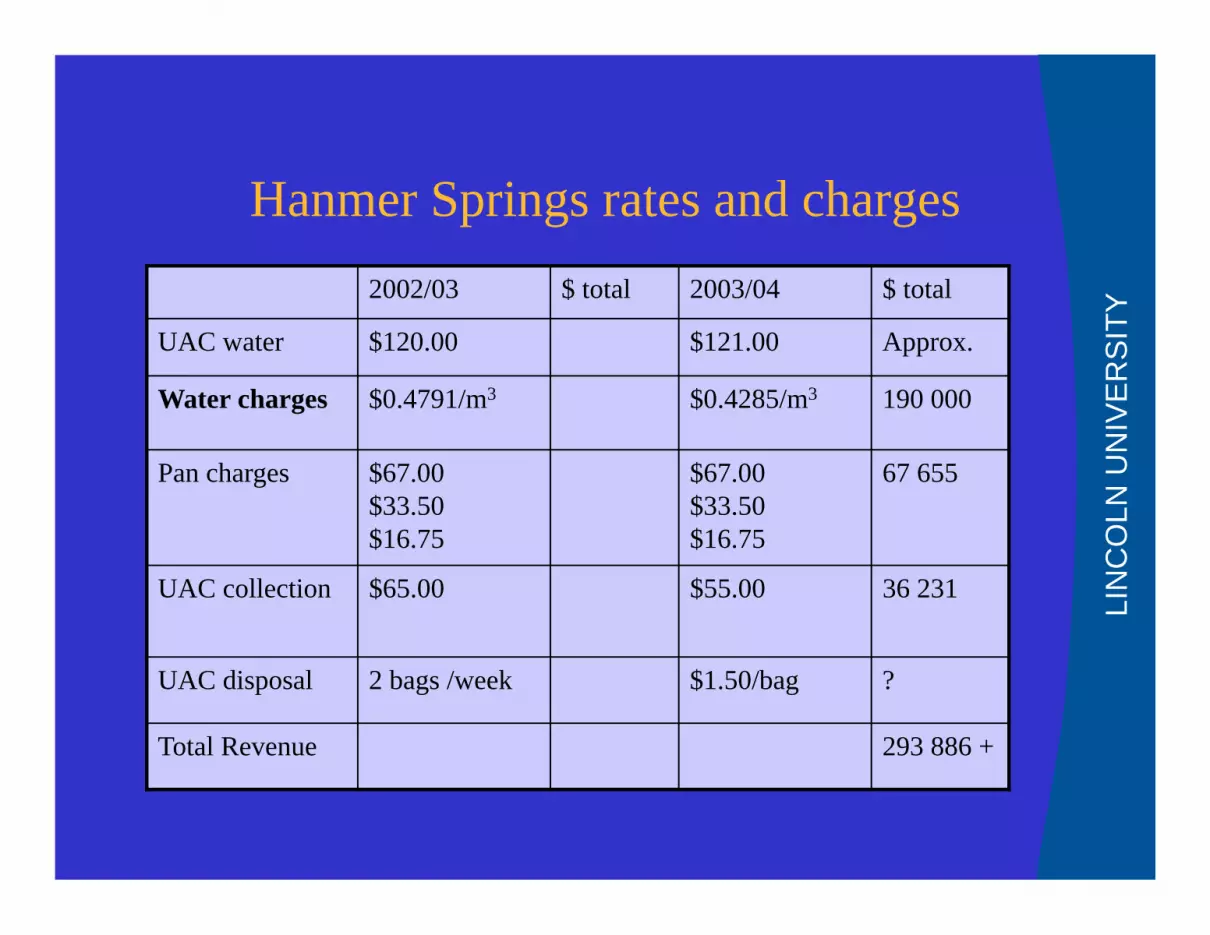
Hanmer Springs rates and charges2002/03 $ total 2003/04 $ total
UAC water $120.00 $121.00 Approx.
Water charges $0.4791/m3 $0.4285/m3 190 000
Pan charges $67.00$33.50$16.75
$67.00$33.50$16.75
67 655
UAC collection $65.00 $55.00 36 231
UAC disposal 2 bags /week $1.50/bag ?
Total Revenue 293 886 +
LIN
CO
LN U
NIV
ER
SIT
Y
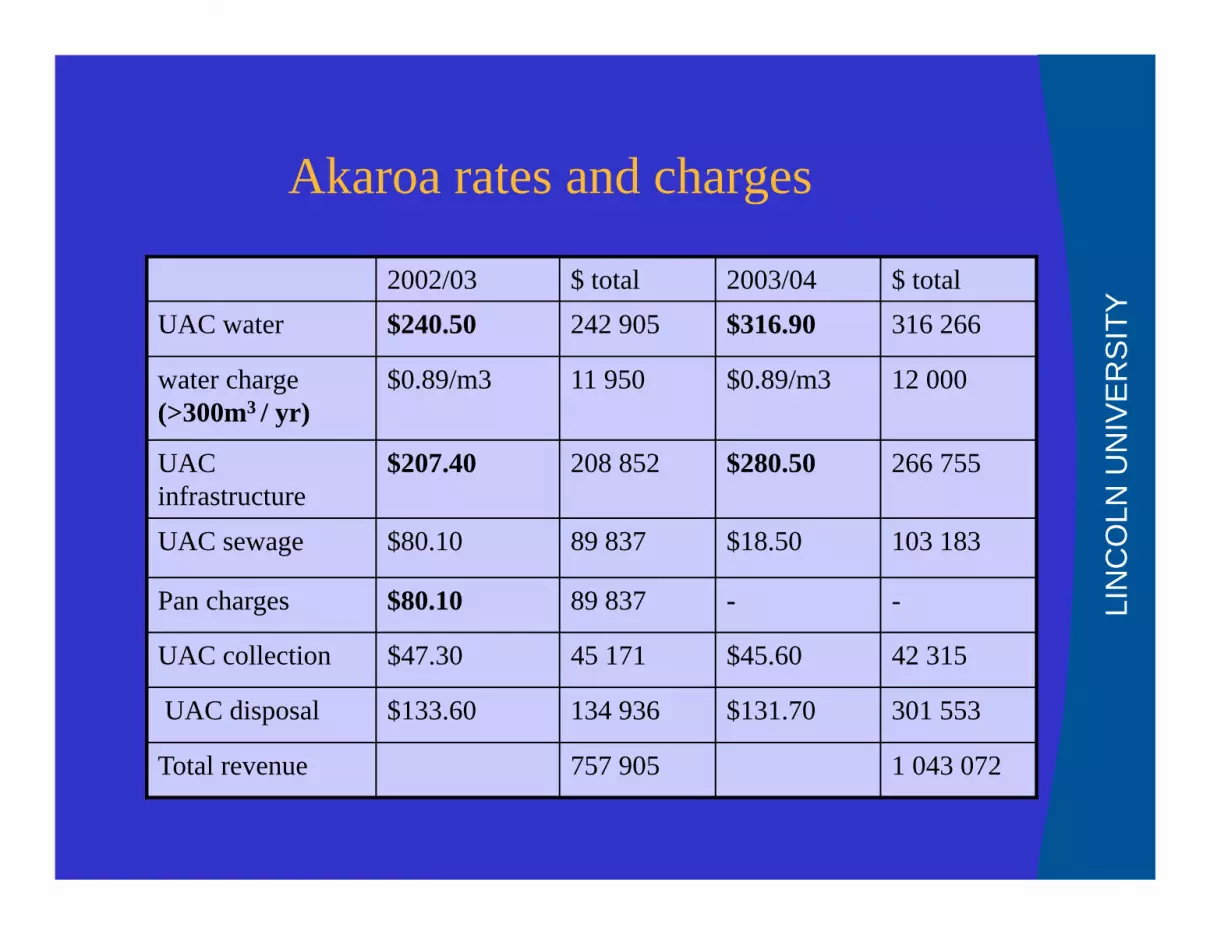
Akaroa rates and charges
2002/03 $ total 2003/04 $ totalUAC water $240.50 242 905 $316.90 316 266
water charge (>300m3 / yr)
$0.89/m3 11 950 $0.89/m3 12 000
UAC infrastructure
$207.40 208 852 $280.50 266 755
UAC sewage $80.10 89 837 $18.50 103 183
Pan charges $80.10 89 837 - -
UAC collection $47.30 45 171 $45.60 42 315
UAC disposal $133.60 134 936 $131.70 301 553
Total revenue 757 905 1 043 072
LIN
CO
LN U
NIV
ER
SIT
Y
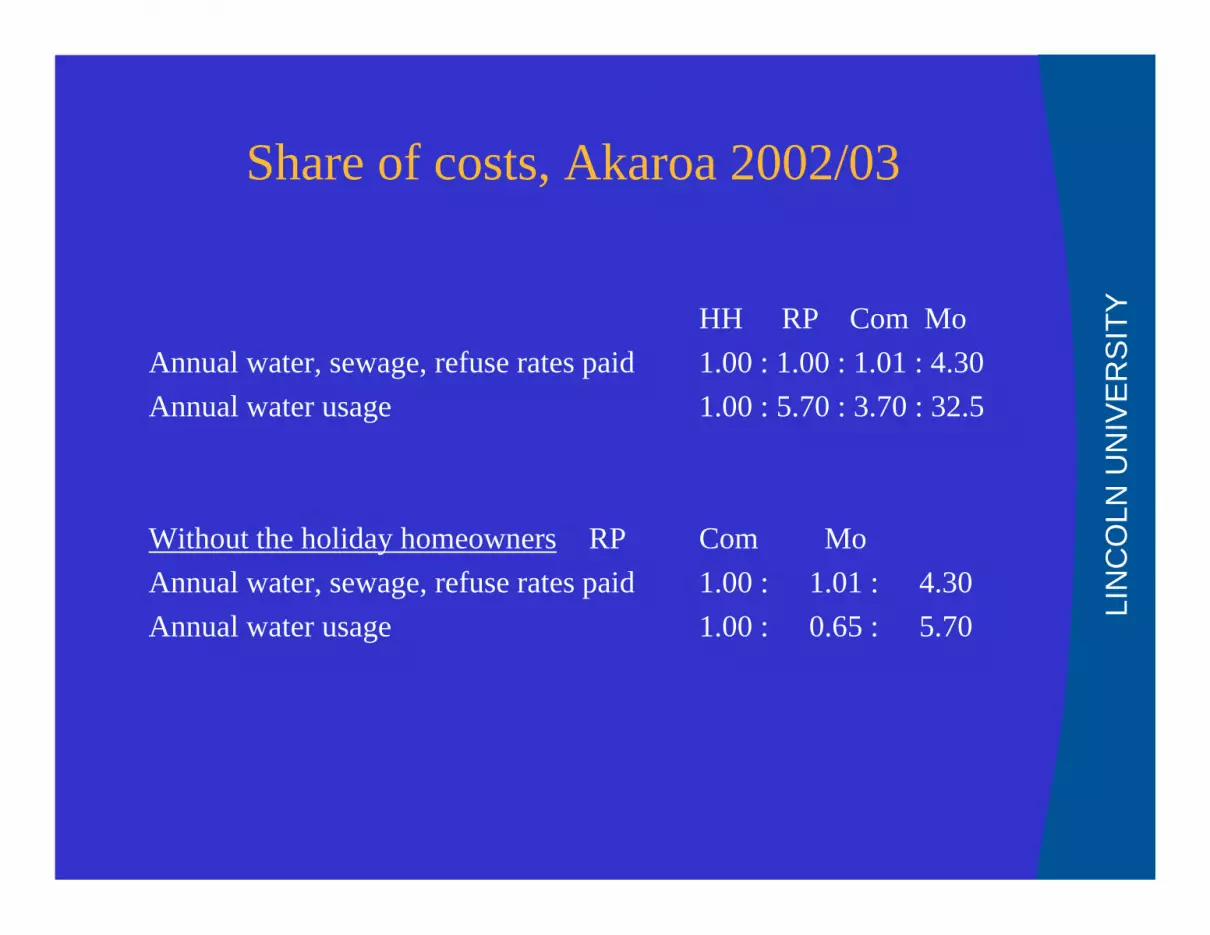
Share of costs, Akaroa 2002/03
HH RP Com MoAnnual water, sewage, refuse rates paid 1.00 : 1.00 : 1.01 : 4.30Annual water usage 1.00 : 5.70 : 3.70 : 32.5
Without the holiday homeowners RP Com MoAnnual water, sewage, refuse rates paid 1.00 : 1.01 : 4.30Annual water usage 1.00 : 0.65 : 5.70
LIN
CO
LN U
NIV
ER
SIT
Y
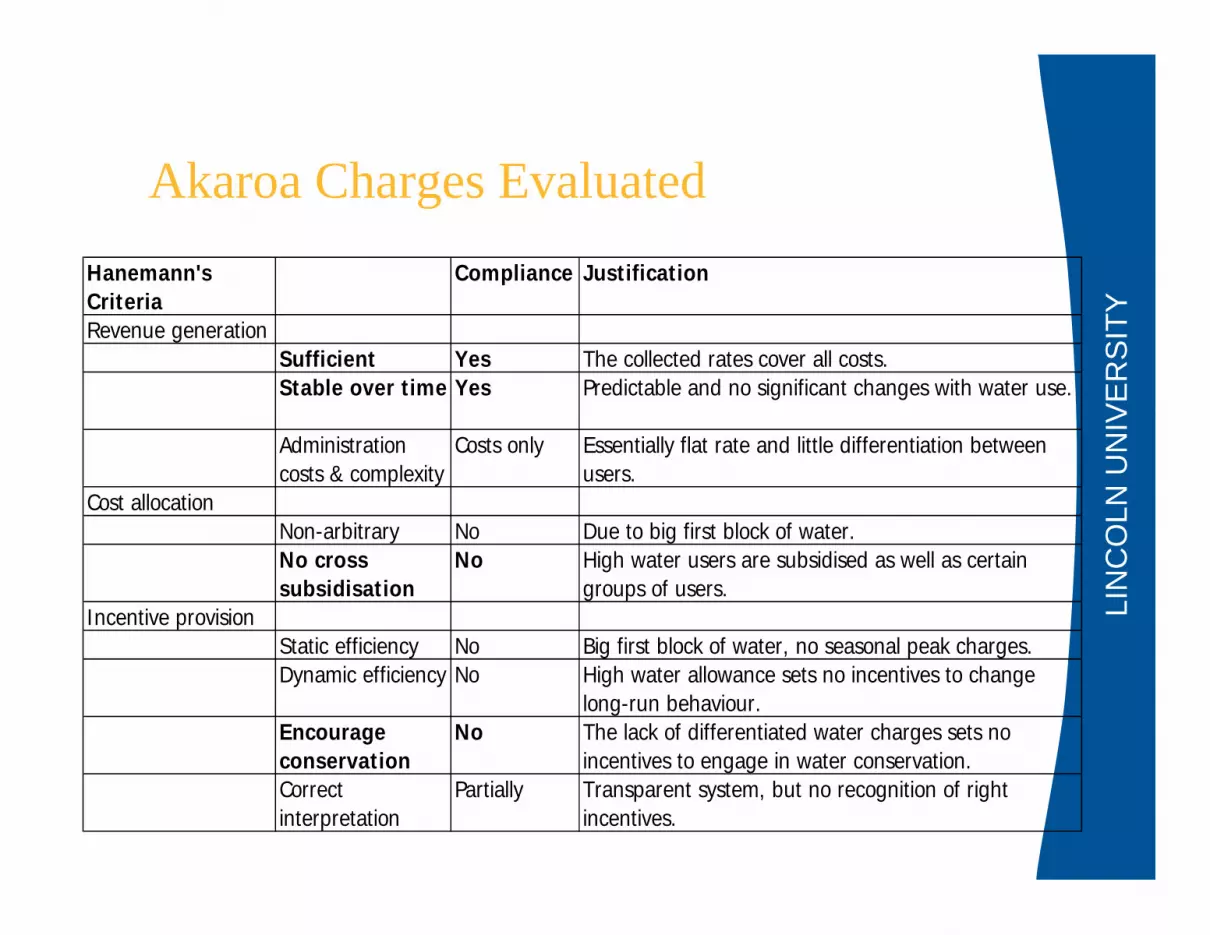
Akaroa Charges EvaluatedHanemann'sCriteria
Compliance Justification
Revenue generationSufficient Yes The collected rates cover all costs.Stable over time Yes Predictable and no significant changes with water use.
Administration costs & complexity
Costs only Essentially flat rate and little differentiation between users.
Cost allocationNon-arbitrary No Due to big first block of water.No cross subsidisation
No High water users are subsidised as well as certain groups of users.
Incentive provisionStatic efficiency No Big first block of water, no seasonal peak charges.Dynamic efficiency No High water allowance sets no incentives to change
long-run behaviour.Encourage conservation
No The lack of differentiated water charges sets no incentives to engage in water conservation.
Correct interpretation
Partially Transparent system, but no recognition of right incentives.
LIN
CO
LN U
NIV
ER
SIT
Y
Rates and charging systems
Sewage:• impractical to meter• Evidence for correlation between water and
sewerage m3 in other communities• Combined water and sewage charges reduces
complexity, eases administration
General flaws:•complex, weak incentives, cross subsidisation
LIN
CO
LN U
NIV
ER
SIT
Y
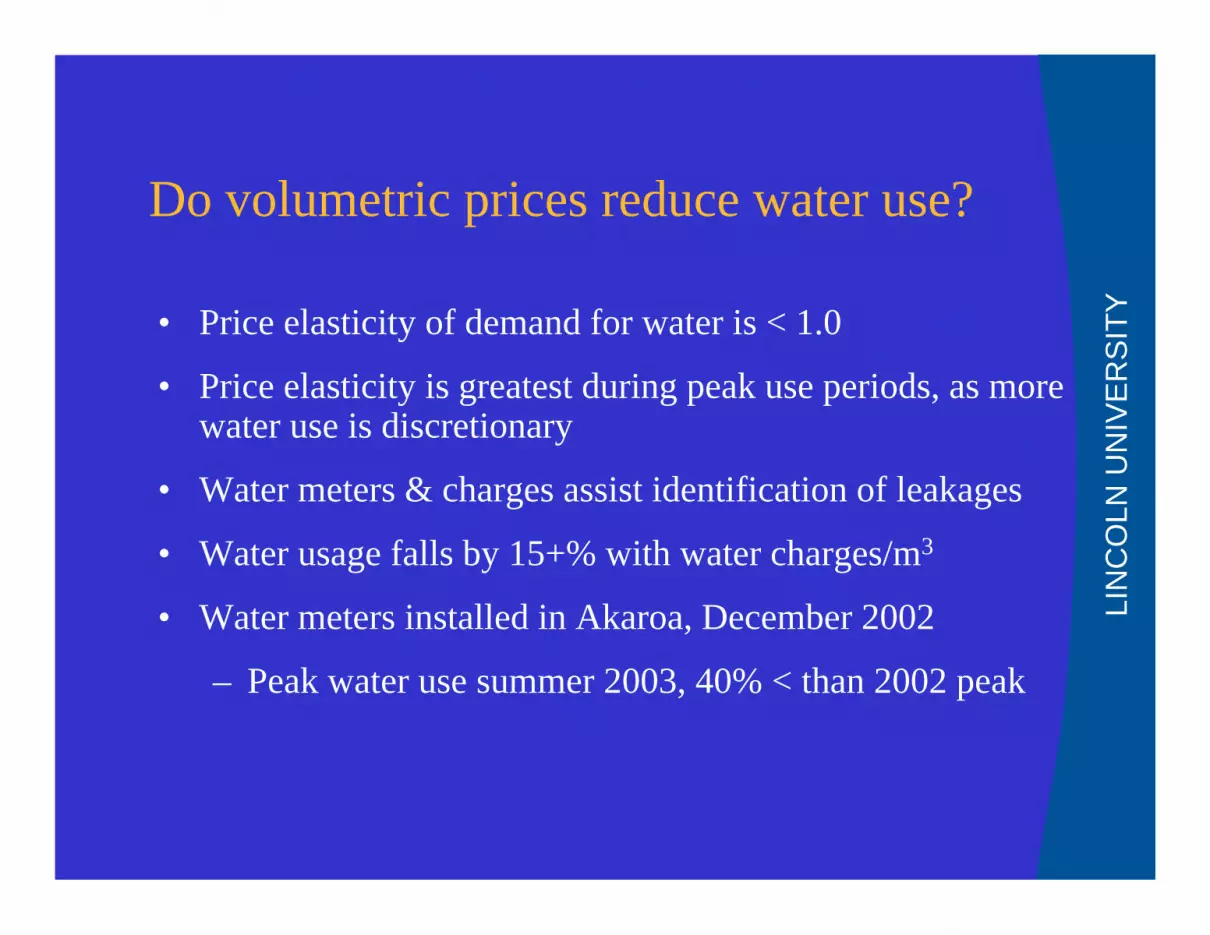
Do volumetric prices reduce water use?
• Price elasticity of demand for water is < 1.0
• Price elasticity is greatest during peak use periods, as more water use is discretionary
• Water meters & charges assist identification of leakages
• Water usage falls by 15+% with water charges/m3
• Water meters installed in Akaroa, December 2002
– Peak water use summer 2003, 40% < than 2002 peak
LIN
CO
LN U
NIV
ER
SIT
Y
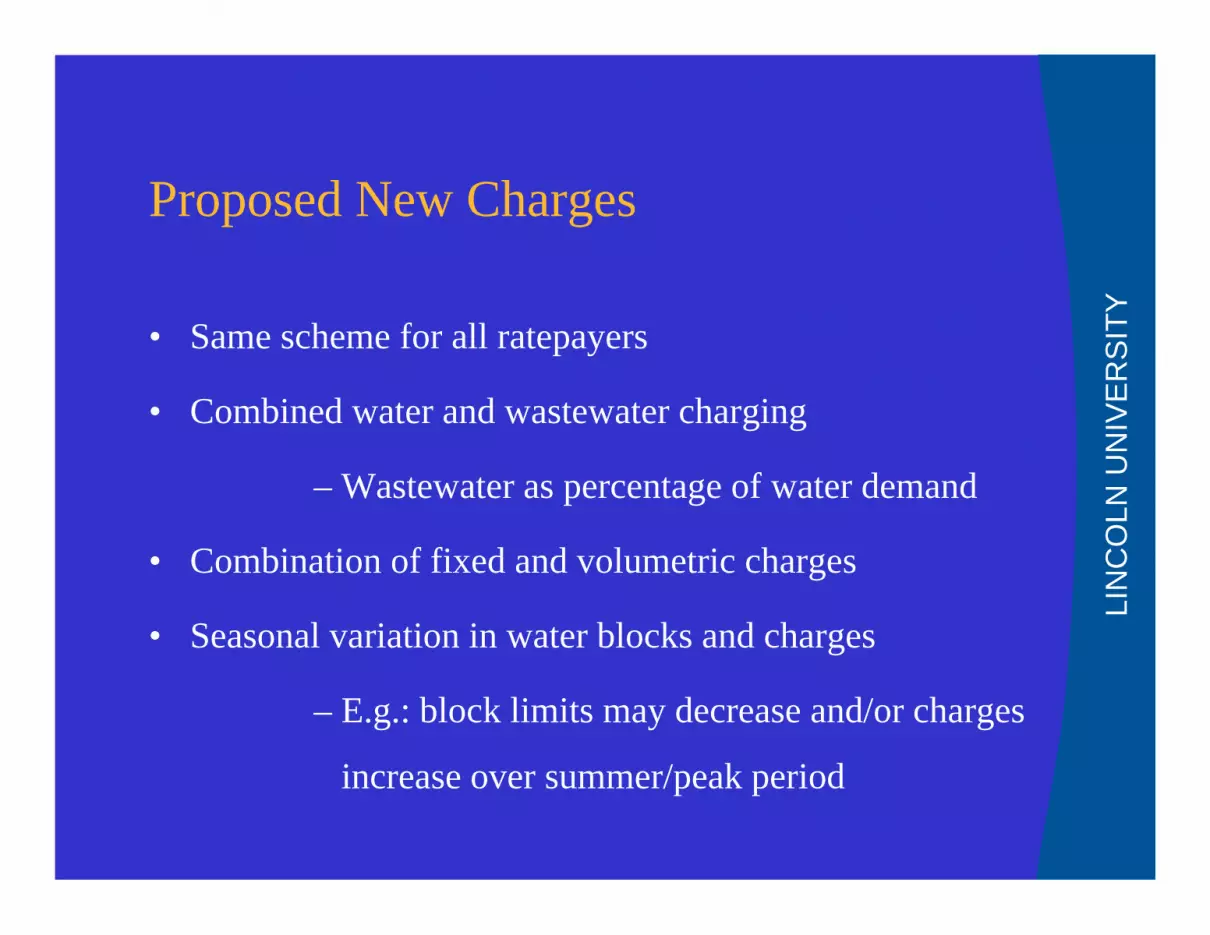
Proposed New Charges
• Same scheme for all ratepayers
• Combined water and wastewater charging
– Wastewater as percentage of water demand
• Combination of fixed and volumetric charges
• Seasonal variation in water blocks and charges
– E.g.: block limits may decrease and/or charges
increase over summer/peak period
LIN
CO
LN U
NIV
ER
SIT
Y
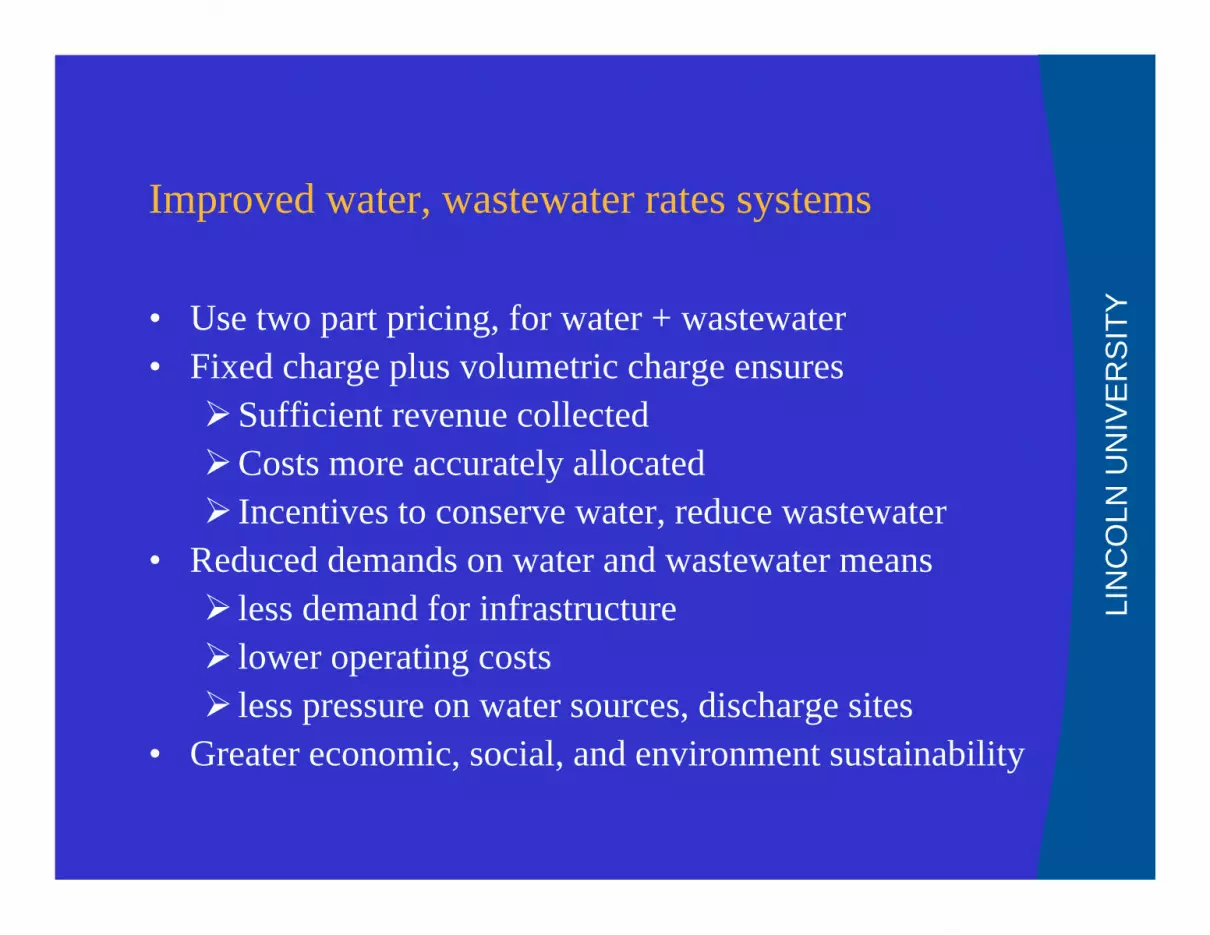
Improved water, wastewater rates systems
• Use two part pricing, for water + wastewater• Fixed charge plus volumetric charge ensuresSufficient revenue collectedCosts more accurately allocated Incentives to conserve water, reduce wastewater
• Reduced demands on water and wastewater means less demand for infrastructure lower operating costs less pressure on water sources, discharge sites
• Greater economic, social, and environment sustainability