SOFTWARE TOOL ARTICLE Electronic data capture for large scale typhoid surveillance, household contact tracing, and health utilisation survey: Strategic Typhoid Alliance across Africa and Asia [version 1; peer review: 1 approved, 3 approved with reservations] Deus Thindwa 1,2 , Yama G. Farooq 3 , Mila Shakya 4 , Nirod Saha 5 , Susan Tonks 3 , Yaw Anokwa 6 , Melita A. Gordon 2,7 , Carl Hartung 6 , James E. Meiring 3 , Andrew J. Pollard 3 , Robert S. Heyderman 2,8 , The Strategic Typhoid alliance across Africa and Asia consortium 1 Department of Infectious Disease Epidemiology, London School of Hygiene and Tropical Medicine, London, London, UK 2 Malawi Liverpool Wellcome Trust Clinical Research Programme, Blantyre, Malawi 3 Centre for Clinical Vaccinology and Tropical Medicine, Department of Paediatrics, University of Oxford and the National Institute for Health, Oxford, UK 4 Oxford University Clinical Research Unit-Patan Academy of Health Sciences, Patan, Nepal 5 International Centre for Diarrhoeal Diseases Research., Dhaka, Bangladesh 6 Nafundi, Seattle, Washington, USA 7 Institute of Infection and Global Health, University of Liverpool, Liverpool, UK 8 Division of Infection and Immunity, University College London, London, UK First published: 09 Apr 2020, 5:66 https://doi.org/10.12688/wellcomeopenres.15811.1 Latest published: 01 Dec 2020, 5:66 https://doi.org/10.12688/wellcomeopenres.15811.2 v1 Abstract Electronic data capture systems (EDCs) have the potential to achieve efficiency and quality in collection of multisite data. We quantify the volume, time, accuracy and costs of an EDC using large-scale census data from the STRATAA consortium, a comprehensive programme assessing population dynamics and epidemiology of typhoid fever in Malawi, Nepal and Bangladesh to inform vaccine and public health interventions. A census form was developed through a structured iterative process and implemented using Open Data Kit Collect running on Android- based tablets. Data were uploaded to Open Data Kit Aggregate, then auto-synced to MySQL-defined database nightly. Data were backed-up daily from three sites centrally, and auto-reported weekly. Pre-census materials’ costs were estimated. Demographics of 308,348 individuals from 80,851 households were recorded within an average of 14.7 weeks range (13-16) using 65 fieldworkers. Overall, 21.7 errors (95% confidence interval: 21.4, 22.0) per 10,000 data points were found: Open Peer Review Approval Status 1 2 3 4 version 2 (revision) 01 Dec 2020 view version 1 09 Apr 2020 view view view view Sylvester Maleghemi , World Health Organization, Port Harcourt, Nigeria 1. Jillian S Gauld, Institute for Disease Modeling, Seattle, USA 2. Michael Sikorski, University of Maryland School of Medicine, Baltimore, USA 3. Page 1 of 26 Wellcome Open Research 2020, 5:66 Last updated: 29 APR 2022
Transcript
SOFTWARE TOOL ARTICLE
Electronic data capture for large scale typhoid surveillance,
household contact tracing, and health utilisation survey:
Strategic Typhoid Alliance across Africa and Asia [version 1;
peer review: 1 approved, 3 approved with reservations]
Deus Thindwa 1,2, Yama G. Farooq 3, Mila Shakya4, Nirod Saha5, Susan Tonks3, Yaw Anokwa6, Melita A. Gordon 2,7, Carl Hartung6, James E. Meiring3, Andrew J. Pollard 3, Robert S. Heyderman 2,8, The Strategic Typhoid alliance across Africa and Asia consortium1Department of Infectious Disease Epidemiology, London School of Hygiene and Tropical Medicine, London, London, UK 2Malawi Liverpool Wellcome Trust Clinical Research Programme, Blantyre, Malawi 3Centre for Clinical Vaccinology and Tropical Medicine, Department of Paediatrics, University of Oxford and the National Institute for Health, Oxford, UK 4Oxford University Clinical Research Unit-Patan Academy of Health Sciences, Patan, Nepal 5International Centre for Diarrhoeal Diseases Research., Dhaka, Bangladesh 6Nafundi, Seattle, Washington, USA 7Institute of Infection and Global Health, University of Liverpool, Liverpool, UK 8Division of Infection and Immunity, University College London, London, UK
First published: 09 Apr 2020, 5:66 https://doi.org/10.12688/wellcomeopenres.15811.1Latest published: 01 Dec 2020, 5:66 https://doi.org/10.12688/wellcomeopenres.15811.2
v1
Abstract Electronic data capture systems (EDCs) have the potential to achieve efficiency and quality in collection of multisite data. We quantify the volume, time, accuracy and costs of an EDC using large-scale census data from the STRATAA consortium, a comprehensive programme assessing population dynamics and epidemiology of typhoid fever in Malawi, Nepal and Bangladesh to inform vaccine and public health interventions. A census form was developed through a structured iterative process and implemented using Open Data Kit Collect running on Android-based tablets. Data were uploaded to Open Data Kit Aggregate, then auto-synced to MySQL-defined database nightly. Data were backed-up daily from three sites centrally, and auto-reported weekly. Pre-census materials’ costs were estimated. Demographics of 308,348 individuals from 80,851 households were recorded within an average of 14.7 weeks range (13-16) using 65 fieldworkers. Overall, 21.7 errors (95% confidence interval: 21.4, 22.0) per 10,000 data points were found:
Open Peer Review
Approval Status
1 2 3 4
version 2
(revision)01 Dec 2020
view
version 109 Apr 2020 view view view view
Sylvester Maleghemi , World Health
Organization, Port Harcourt, Nigeria
1.
Jillian S Gauld, Institute for Disease
Modeling, Seattle, USA
2.
Michael Sikorski, University of Maryland
School of Medicine, Baltimore, USA
3.
Page 1 of 26
Wellcome Open Research 2020, 5:66 Last updated: 29 APR 2022
13.0 (95% confidence interval: 12.6, 13.5) and 24.5 (95% confidence interval: 24.1, 24.9) errors on numeric and text fields respectively. These values meet standard quality threshold of 50 errors per 10,000 data points. The EDC’s total variable cost was estimated at US$13,791.82 per site. In conclusion, the EDC is robust, allowing for timely and high-volume accurate data collection, and could be adopted in similar epidemiological settings.
Keywords Africa, Asia, Electronic data capture, Open Data Kit, Typhoid fever.
Myron Levine, University of Maryland,
Baltimore, USA
Gagandeep Kang , Christian Medical
College, Vellore, India
4.
Any reports and responses or comments on the
article can be found at the end of the article.
Page 2 of 26
Wellcome Open Research 2020, 5:66 Last updated: 29 APR 2022
AbbreviationsEDCs: Electronic data capture systems; STRATAA: Strategic Typhoid alliance across Africa and Asia consortium; ODK: Open Data Kit; GPS: global positioning system; eCRF: electronic census report form; SQL: Structured Query Language; CI: Confidence Intervals; US$: United States dollar; SCDM: Society of Clinical Data Management.
IntroductionUse of electronic data capture systems (EDCs) for health research has increased since Apple’s launch of the first handheld device in 19931, and for observational studies and clinical trials is beginning to replace paper-based data collection methods. Paper-based systems have the advantage that they provide a hard copy source document but are characterised by high inaccuracies, substantial omissions, longer data turnaround time, longer data entry time, and high incremental costs both dur-ing the data collection and subsequent entry into an electronic database2–6. The advantages of EDC include built-in global positioning system (GPS) locator that automatically capture geographical coordinates thus minimizing transcription errors from external GPS locators; password-locked tablets and data encryption that maintain participant data confidentiality; required checks that prevent data omissions; range checks and data type checks that prevent typographical errors; skip patterns that pro-vide logical responses; barcode technology that automates entry of unique identification; timestamps that provide a means to monitor work rate; and internet connectivity that ensures availability of real-time data3,4,7,8. Despite these benefits9, there is limited description of the performance of EDCs for large-scale or multisite surveys in low and middle-income countries.
Each year, an estimated 9.9–24.2 million typhoid fever cases occur from low- and middle-income countries resulting in approximately 75,000–208,000 deaths10,11. However, although essential to build a public health case for disease control efforts such as vaccination and provision of clean water, sanitation and hygiene, obtaining reliable estimates for the burden of disease at national and sub-national level is difficult12. This requires collection of high quality field demographic, mapping, epide-miological, and clinical and laboratory data at scale from both hospital and community-based survey studies13. Interestingly, the collection of such quality data is hindered by complexities of dilapidated health facilities, overcrowding, unstructured housing or slums, and illiteracy14.
We present an open source-based EDC, designed to overcome data quality complexities, and evaluate the efficiency, quality, and costs of the EDC by measuring volume, time, accuracy, and material costs using multisite census data collected from sub-Saharan Africa and Asia15. The EDC was developed and implemented within the Strategic Typhoid alliance across Africa and Asia (STRATAA), a comprehensive programme which is assessing population dynamics and epidemiology of typhoid fever in Malawi, Bangladesh and Nepal to inform design of vaccine and public health interventions.
MethodsImplementationThe census component of the STRATAA study aimed to collect demographics from approximately 100,000 individuals, of all ages, in each of the three sites, to form the sampling frame for subse-quent sub-studies. More details of the STRATAA study design and participants have previously been described13. In brief, the three sites, one in each country, were selected based on high known burden of enteric fever, differing epidemiological patterns and previous ability to deliver paper-based studies of high participant volume and logistical complexity.
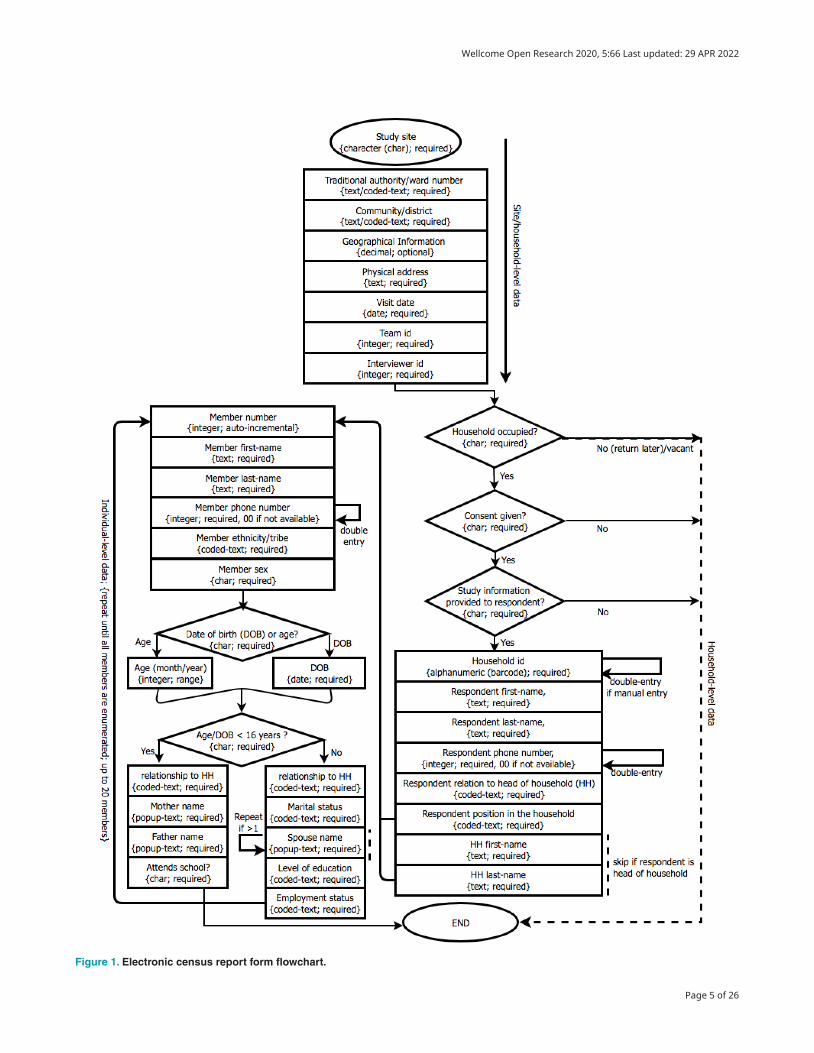
An electronic census report form (eCRF), uniform to all sites, was developed through a structured iterative process. An eCRF comprised household- and individual-level questions. The eCRF data fields reflected a range of data types including integers to capture census team identifier, interviewer identifier, phone numbers of key respondent and older household members, household member number, and age; decimal to capture GPS points; alphanumeric to capture household unique identifier (barcode); texts to capture ward/traditional authority name, community/district name, physical address, respondent name, respondent relationship to head of household, respondent position in the household, head of household name, household member name, household member tribe/ethnicity, household member relationship to head, marital status, spouse name, education levels, employment status, mother’s name, and father’s name; characters to capture study site, household occupancy status, consent status, study information access status, sex, and school attendance status; and dates to capture household visit date and date of birth of each household member15.
To ensure ultimate generation of error-free data, the eCRF data fields were designed with quality control tools, such as dropdown menus, range checks, choice fields, skip patterns, required checks, double-data entry checks, systematic auto-numbering, preloading, and looping. However, due to other internal and external limitations of the EDC, we further built external database queries based on the Structured Query Language (SQL) to track potential data entry errors that might have arisen beyond EDC’s control. External SQL queries were aimed to expose persistent error sources which included duplication of study household identifiers (barcode); duplication of entire individual demograph-ics; barcode decoding errors during scan; illogical ages or date of births of children relative to parents; incorrect household visit dates relative to tablet system date; misspellings of traditional authority names/ward numbers, physical addresses, respond-ent names, and household members names; missing GPS points; inaccurate GPS points relative to the household; and mismatches between community names and GPS points. After running the external SQL queries on the census database table and identifying the errors, each correction of an error by the data officer triggered an automatic log to an audit-trail table with entries (table’s column names) that included table name with error, action on an error (update, insertion, or deletion), individual/household barcode identifier with an error, field name
Page 3 of 26
Wellcome Open Research 2020, 5:66 Last updated: 29 APR 2022
with an error, old value, new value, timestamp, and a user’s name modifying an error. This generated a single row in an audit-trail table for each single error that was modified in the original census table. Errors corresponding to GPS points were specifically identified through sub-setting and importing GPS points (longitude, latitude, and altitude) from the census table into Google Earth Pro software v7.3.2 (Google LLC, Mountain View, California, USA) as a keyhole markup language file, and then mapping the GPS points on the overlay of community boundaries’ and households’ satellite images. Once a GPS point was not mapped within 5 meters at 10% accuracy of the household or within the community boundary, it was consid-ered a mapping error, and corrected through remapping in the field and updating it in the census table thereby triggering an audit-trail table error record. All the other errors exposed by the external SQL queries were investigated thoroughly in the field before corrections could be applied to the census table and subsequently auto-logged into the audit-trail table. The maximum number of visits to the household prior declaring the household vacant or errors permanently unresolved was twice. We show the flow diagram of the eCRF in (Figure 1), whereas the technical details of the extensible markup language code used to create an eCRF, and the SQL code used to create the audit-trail table and triggers to the audit-trail table have been publicly shared through GitHub (GitHub Inc, San Francisco, California, USA)15.
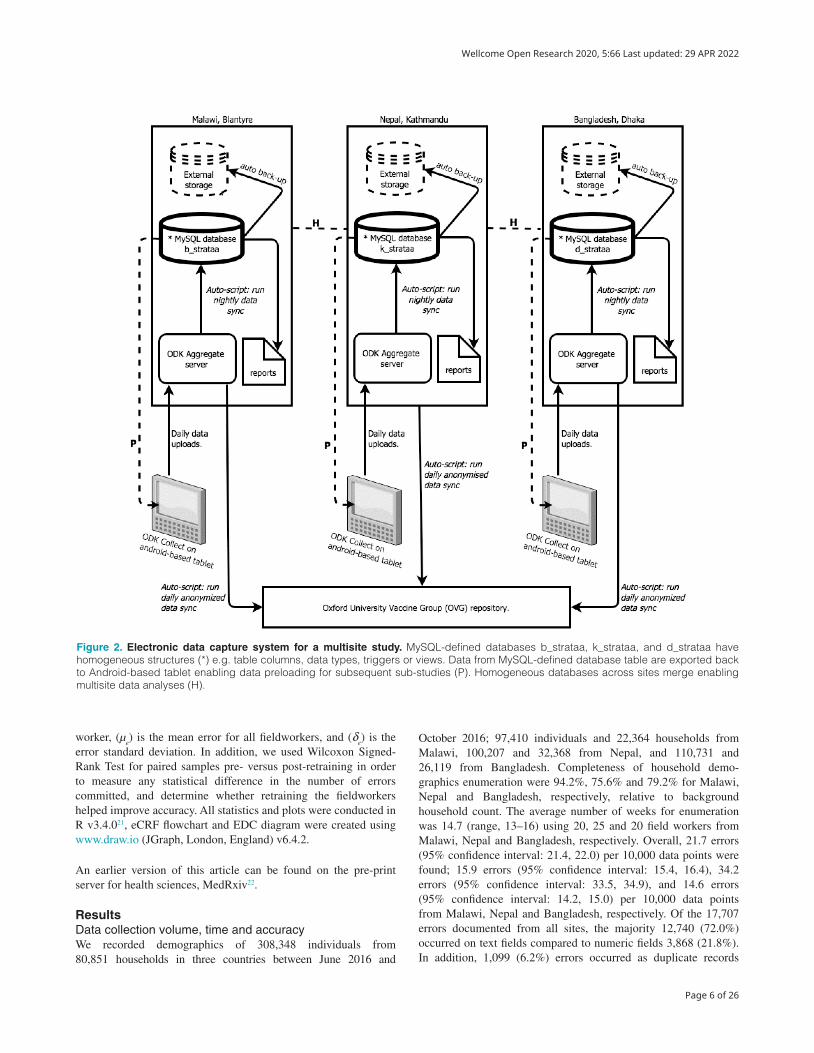
OperationWe designed a uniform EDC using combined open-source tools; Open Data Kit (ODK) software v1.4.16 (Nafundi, Seattle, Washington, USA)16–18, and MySQL relational database management system v8.0.1 (Oracle Corporation, Redwood city, California, USA)19. The eCRF was customized in ODK Collect and uploaded onto Android-based Asus ZenPad (AsusTek Computer Inc., Taipei, Taiwan), and Samsung (Samsung group, Seoul, South Korea) tablets. Then data were collected in the field during the day and temporarily saved in the tablet’s memory. At the end of each day, tablets were returned to the base STRATAA data office and data were uploaded from the tablet’s memory to ODK Aggregate server via a secure wireless network technology. Tablets were then charged overnight at the base data office in preparation for use on the next day. For every scheduled time of the night, data automatically synchronized from ODK Aggregate server to MySQL-defined database, set up for four main reasons; first, to facilitate corrections of inconsistencies beyond ODK validations (e.g. all persistent error sources mentioned above) and auto-audit the corrections; second, to ensure homogeneous database structure across sites in order to facilitate multisite dataset merging, and to preserve meaningful variables (excluding metadata generated by ODK software) in order to provide intui-tive datasets to epidemiologists and statisticians; third, to generate automated reports using SQL; and last, to allow automated back-up of cleansed data from MySQL-defined database to external storage devices. The EDC also allows daily comma-separated value and anonymized data format to securely and automatically synchronize from each site’s ODK Aggregate server to a central repository. Conversely, the comma-separated value data format, from MySQL-defined database, were sporadically exported back to
tablet’s ODK media folder to enable data preloading for sub-sequent sub-studies (Figure 2). Technical details of the scripts for synchronizations, and creation of table structures and triggers have been publicly shared through GitHub15.
Pre-census time, costs, and trainingWe estimated time and costs required to attain the following census-related materials or complete census activities; tablets (including screen protectors, and protective covers), desktop server computers, network devices, barcodes, development of eCRF, training of field workers, replacement of broken tablets, and backpacks. We did not assess other operational costs because of uncertainty e.g. electric power to servers, charging tablets, and electronic data synchronization. We trained fieldworkers and assessed their suitability to conduct census by administering a practical mock test and then selecting best performers. Moreover, five weeks post-census implementation, we retrained fieldworkers based on calculated individual performances on data quality and data collection speed.
Ethics approval and consent to participate. Ethical approval was obtained from the Malawi National Health Sciences Research Committee, 15/5/1599; Bangladesh ICDDR,B Institutional Review Board, PR-15119; Nepal Health Research Council, 306/2015; and Oxford Tropical Research Ethics Committee, 39-15. Following extensive sensitisation and engagement with community and traditional leaders, and community health-workers, the key inform-ant from each household provided a verbal informed consent, to enumerate the household, which was documented in the eCRF.
Statistical analysis and visualizationWe estimated the error rates, after running external SQL queries but prior to data cleaning, by dividing the total number of errors observed by the total number of data points (≈ all expected errors). A data point was defined as a discrete unit of information that could possibly be obtained from each member of the population after administering an eCRF e.g. If an eCRF had (n) number of unique questions, with each question corresponding to a variable (X
i), for (N) number of respondents, then the total data points for
eCRF would be ( )1
.n
iiX N
=∑ In our calculations, data points for household- and individual-level variables were calculated separately and summed up. The reason was that household-level questions were answered by a key informant (head of household or respondent ≥ 18 years old), while individual-level questions were hypothetically answered by all household members (repre-sented by a key informant). Exact binomial confidence intervals were used to estimate error rates. Data entry speed and accuracy by fieldworkers were combined into a single merit in order to measure their performance20. For each fieldworker, we standard-ized the data entry speeds (z
s) and errors (z
e), and assigned more
weight to data entry speed (60%) than errors (40%) given the background that the EDC was robustly developed to prevent most data entry errors, thus, speed was more important. The final data entry speed-accuracy trade-off was calculated using the formula (SAT = −z
s * 0.6 − z
e * 0.4) where z
s = (s − μ
s)/δ
s and
ze = (e − μ
e)/δ
e, (s) is the total speed for all data entries per field
worker, (μs) is the mean speed for all fieldworkers, (δ
s) is the
speed standard deviation, (e) is the total number of errors per field
Page 4 of 26
Wellcome Open Research 2020, 5:66 Last updated: 29 APR 2022
Figure 1. Electronic census report form flowchart.
Page 5 of 26
Wellcome Open Research 2020, 5:66 Last updated: 29 APR 2022
Figure 2. Electronic data capture system for a multisite study. MySQL-defined databases b_strataa, k_strataa, and d_strataa have homogeneous structures (*) e.g. table columns, data types, triggers or views. Data from MySQL-defined database table are exported back to Android-based tablet enabling data preloading for subsequent sub-studies (P). Homogeneous databases across sites merge enabling multisite data analyses (H).
worker, (μe) is the mean error for all fieldworkers, and (δ
e) is the
error standard deviation. In addition, we used Wilcoxon Signed-Rank Test for paired samples pre- versus post-retraining in order to measure any statistical difference in the number of errors committed, and determine whether retraining the fieldworkers helped improve accuracy. All statistics and plots were conducted in R v3.4.021, eCRF flowchart and EDC diagram were created using www.draw.io (JGraph, London, England) v6.4.2.
An earlier version of this article can be found on the pre-print server for health sciences, MedRxiv22.
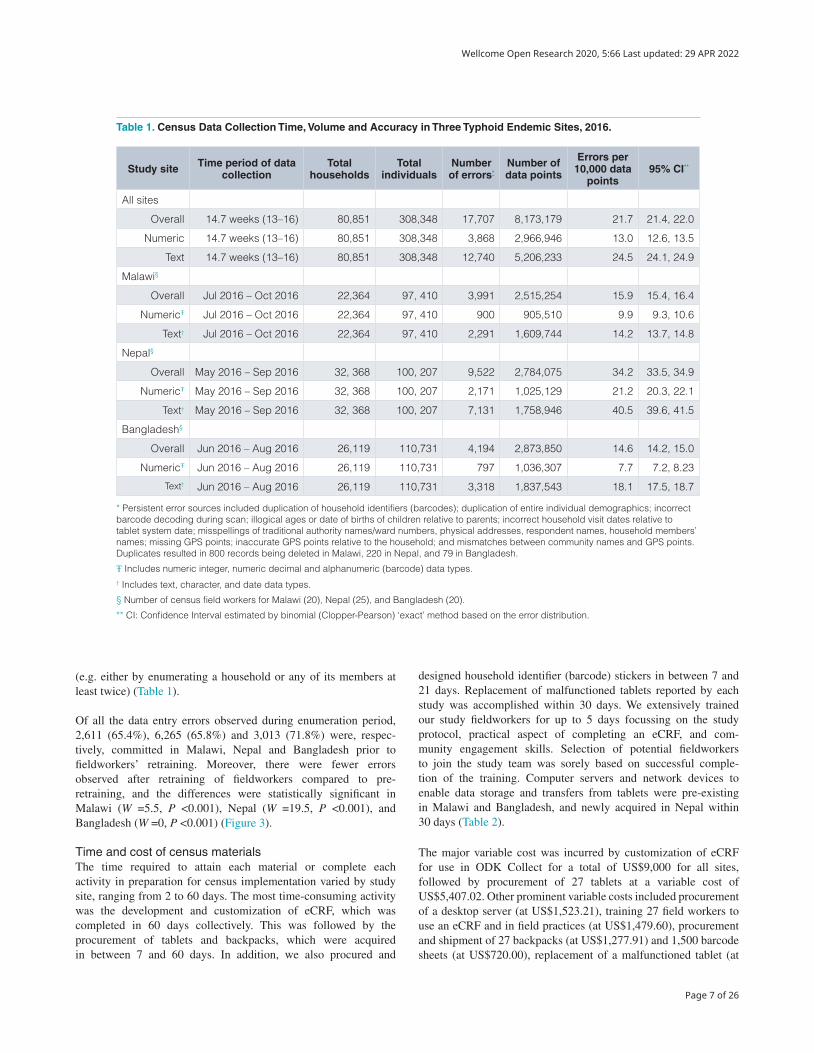
ResultsData collection volume, time and accuracyWe recorded demographics of 308,348 individuals from 80,851 households in three countries between June 2016 and
October 2016; 97,410 individuals and 22,364 households from Malawi, 100,207 and 32,368 from Nepal, and 110,731 and 26,119 from Bangladesh. Completeness of household demo-graphics enumeration were 94.2%, 75.6% and 79.2% for Malawi, Nepal and Bangladesh, respectively, relative to background household count. The average number of weeks for enumeration was 14.7 (range, 13–16) using 20, 25 and 20 field workers from Malawi, Nepal and Bangladesh, respectively. Overall, 21.7 errors (95% confidence interval: 21.4, 22.0) per 10,000 data points were found; 15.9 errors (95% confidence interval: 15.4, 16.4), 34.2 errors (95% confidence interval: 33.5, 34.9), and 14.6 errors (95% confidence interval: 14.2, 15.0) per 10,000 data points from Malawi, Nepal and Bangladesh, respectively. Of the 17,707 errors documented from all sites, the majority 12,740 (72.0%) occurred on text fields compared to numeric fields 3,868 (21.8%). In addition, 1,099 (6.2%) errors occurred as duplicate records
Page 6 of 26
Wellcome Open Research 2020, 5:66 Last updated: 29 APR 2022
Overall Jun 2016 – Aug 2016 26,119 110,731 4,194 2,873,850 14.6 14.2, 15.0
NumericŦ Jun 2016 – Aug 2016 26,119 110,731 797 1,036,307 7.7 7.2, 8.23
Text† Jun 2016 – Aug 2016 26,119 110,731 3,318 1,837,543 18.1 17.5, 18.7
* Persistent error sources included duplication of household identifiers (barcodes); duplication of entire individual demographics; incorrect barcode decoding during scan; illogical ages or date of births of children relative to parents; incorrect household visit dates relative to tablet system date; misspellings of traditional authority names/ward numbers, physical addresses, respondent names, household members’ names; missing GPS points; inaccurate GPS points relative to the household; and mismatches between community names and GPS points. Duplicates resulted in 800 records being deleted in Malawi, 220 in Nepal, and 79 in Bangladesh.
Ŧ Includes numeric integer, numeric decimal and alphanumeric (barcode) data types.† Includes text, character, and date data types.
§ Number of census field workers for Malawi (20), Nepal (25), and Bangladesh (20).
** CI: Confidence Interval estimated by binomial (Clopper-Pearson) ‘exact’ method based on the error distribution.
(e.g. either by enumerating a household or any of its members at least twice) (Table 1).
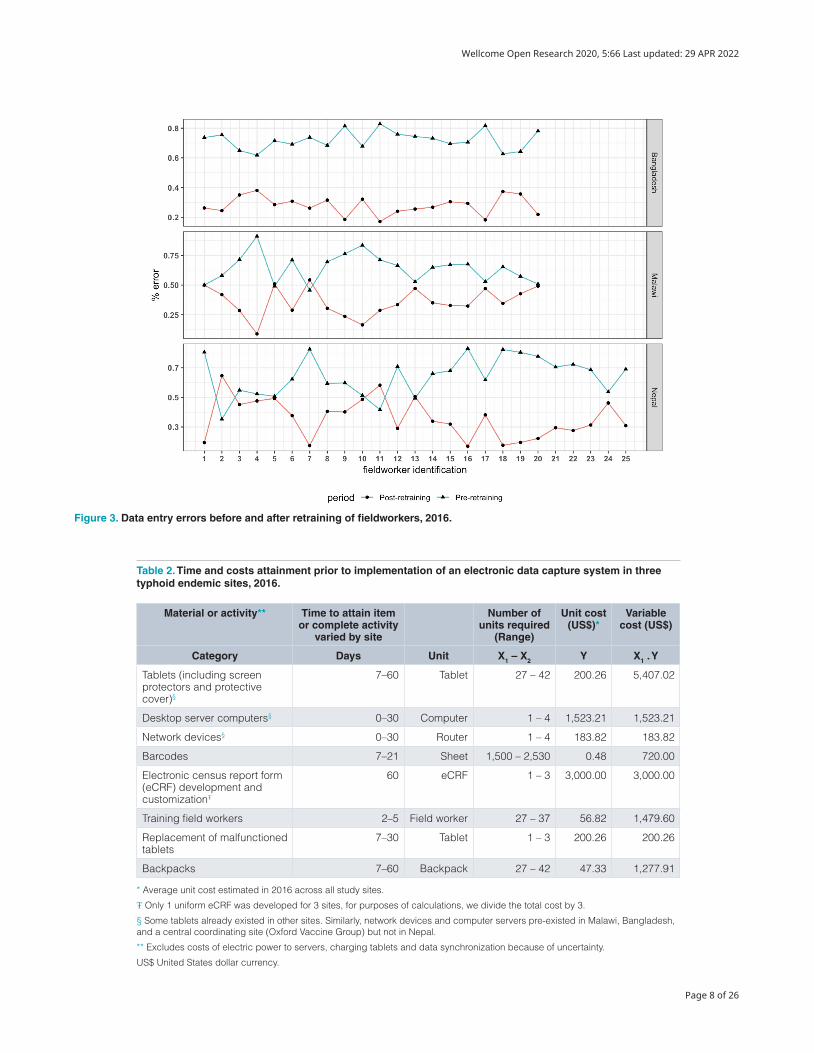
Of all the data entry errors observed during enumeration period, 2,611 (65.4%), 6,265 (65.8%) and 3,013 (71.8%) were, respec-tively, committed in Malawi, Nepal and Bangladesh prior to fieldworkers’ retraining. Moreover, there were fewer errors observed after retraining of fieldworkers compared to pre- retraining, and the differences were statistically significant in Malawi (W =5.5, P <0.001), Nepal (W =19.5, P <0.001), and Bangladesh (W =0, P <0.001) (Figure 3).
Time and cost of census materialsThe time required to attain each material or complete each activity in preparation for census implementation varied by study site, ranging from 2 to 60 days. The most time-consuming activity was the development and customization of eCRF, which was completed in 60 days collectively. This was followed by the procurement of tablets and backpacks, which were acquired in between 7 and 60 days. In addition, we also procured and
designed household identifier (barcode) stickers in between 7 and 21 days. Replacement of malfunctioned tablets reported by each study was accomplished within 30 days. We extensively trained our study fieldworkers for up to 5 days focussing on the study protocol, practical aspect of completing an eCRF, and com-munity engagement skills. Selection of potential fieldworkers to join the study team was sorely based on successful comple-tion of the training. Computer servers and network devices to enable data storage and transfers from tablets were pre-existing in Malawi and Bangladesh, and newly acquired in Nepal within 30 days (Table 2).
The major variable cost was incurred by customization of eCRF for use in ODK Collect for a total of US$9,000 for all sites, followed by procurement of 27 tablets at a variable cost of US$5,407.02. Other prominent variable costs included procurement of a desktop server (at US$1,523.21), training 27 field workers to use an eCRF and in field practices (at US$1,479.60), procurement and shipment of 27 backpacks (at US$1,277.91) and 1,500 barcode sheets (at US$720.00), replacement of a malfunctioned tablet (at
Page 7 of 26
Wellcome Open Research 2020, 5:66 Last updated: 29 APR 2022
Table 2. Time and costs attainment prior to implementation of an electronic data capture system in three typhoid endemic sites, 2016.
Material or activity** Time to attain item or complete activity
varied by site
Number of units required
(Range)
Unit cost (US$)*
Variable cost (US$)
Category Days Unit X1 – X2 Y X1 . Y
Tablets (including screen protectors and protective cover)§
7–60 Tablet 27 – 42 200.26 5,407.02
Desktop server computers§ 0–30 Computer 1 – 4 1,523.21 1,523.21
Network devices§ 0–30 Router 1 – 4 183.82 183.82
Barcodes 7–21 Sheet 1,500 – 2,530 0.48 720.00
Electronic census report form (eCRF) development and customizationŦ
60 eCRF 1 – 3 3,000.00 3,000.00
Training field workers 2–5 Field worker 27 – 37 56.82 1,479.60
Replacement of malfunctioned tablets
7–30 Tablet 1 – 3 200.26 200.26
Backpacks 7–60 Backpack 27 – 42 47.33 1,277.91
* Average unit cost estimated in 2016 across all study sites.
Ŧ Only 1 uniform eCRF was developed for 3 sites, for purposes of calculations, we divide the total cost by 3.
§ Some tablets already existed in other sites. Similarly, network devices and computer servers pre-existed in Malawi, Bangladesh, and a central coordinating site (Oxford Vaccine Group) but not in Nepal.
** Excludes costs of electric power to servers, charging tablets and data synchronization because of uncertainty.
US$ United States dollar currency.
Figure 3. Data entry errors before and after retraining of fieldworkers, 2016.
Page 8 of 26
Wellcome Open Research 2020, 5:66 Last updated: 29 APR 2022
US$200.26) and procurement of a network router (at $183.82). The total variable cost for the EDC was US$13,791.82 per site (Table 2).
DiscussionIn this study, we have developed and implemented an EDC which allows high volume of data collection over short time periods, high data accuracy, 12-hourly updated data access, and quality checking for decision making15. Additionally, the EDC is robust, allowing for automated reports generation, scalability and could be adaptable to other epidemiological settings. Finally, the total variable cost of the EDC’s pre-census materials and activities, was minimal relative to paper-based data collection methods from similar settings.
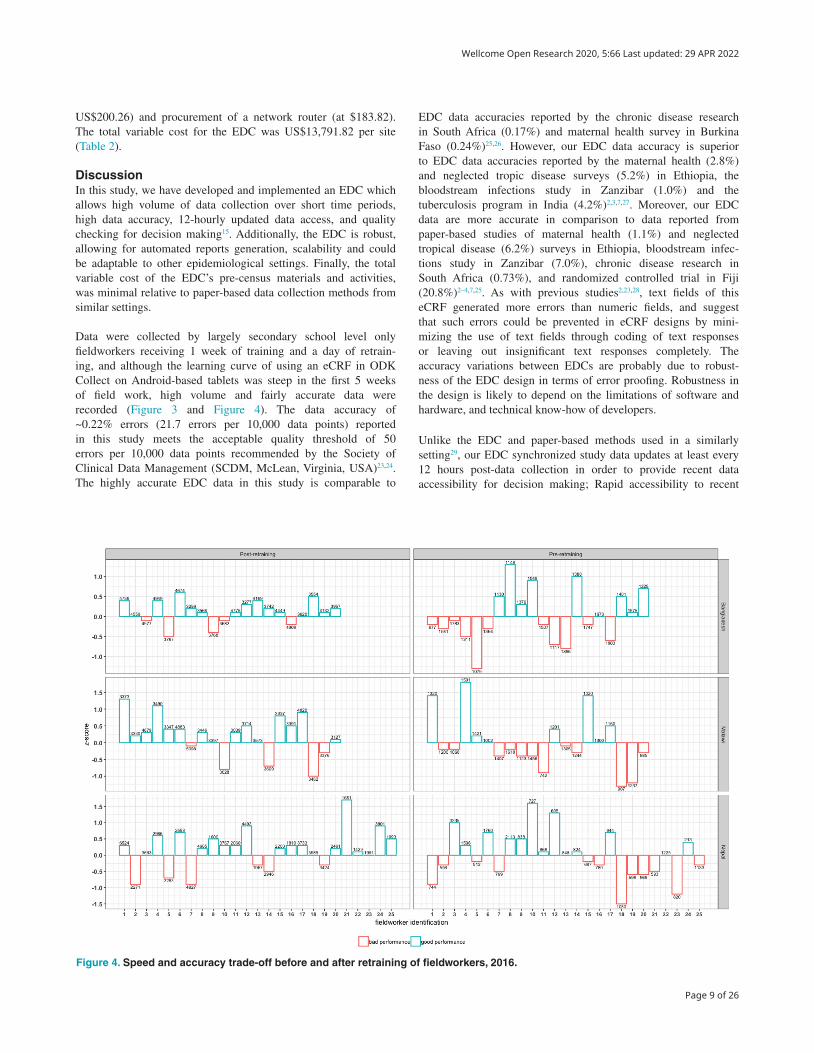
Data were collected by largely secondary school level only fieldworkers receiving 1 week of training and a day of retrain-ing, and although the learning curve of using an eCRF in ODK Collect on Android-based tablets was steep in the first 5 weeks of field work, high volume and fairly accurate data were recorded (Figure 3 and Figure 4). The data accuracy of ~0.22% errors (21.7 errors per 10,000 data points) reported in this study meets the acceptable quality threshold of 50 errors per 10,000 data points recommended by the Society of Clinical Data Management (SCDM, McLean, Virginia, USA)23,24. The highly accurate EDC data in this study is comparable to
EDC data accuracies reported by the chronic disease research in South Africa (0.17%) and maternal health survey in Burkina Faso (0.24%)25,26. However, our EDC data accuracy is superior to EDC data accuracies reported by the maternal health (2.8%) and neglected tropic disease surveys (5.2%) in Ethiopia, the bloodstream infections study in Zanzibar (1.0%) and the tuberculosis program in India (4.2%)2,3,7,27. Moreover, our EDC data are more accurate in comparison to data reported from paper-based studies of maternal health (1.1%) and neglected tropical disease (6.2%) surveys in Ethiopia, bloodstream infec-tions study in Zanzibar (7.0%), chronic disease research in South Africa (0.73%), and randomized controlled trial in Fiji (20.8%)2–4,7,25. As with previous studies2,23,28, text fields of this eCRF generated more errors than numeric fields, and suggest that such errors could be prevented in eCRF designs by mini-mizing the use of text fields through coding of text responses or leaving out insignificant text responses completely. The accuracy variations between EDCs are probably due to robust-ness of the EDC design in terms of error proofing. Robustness in the design is likely to depend on the limitations of software and hardware, and technical know-how of developers.
Unlike the EDC and paper-based methods used in a similarly setting29, our EDC synchronized study data updates at least every 12 hours post-data collection in order to provide recent data accessibility for decision making; Rapid accessibility to recent
Figure 4. Speed and accuracy trade-off before and after retraining of fieldworkers, 2016.
Page 9 of 26
Wellcome Open Research 2020, 5:66 Last updated: 29 APR 2022
data has enabled immediate quality checks and data cleaning on critical variables which, at the time of the study, are beyond ODK’s built-in validations. It also enabled us to quickly understand and decide on ways to improve participant uptake rates, adding to a growing body of literature reporting how rapid data updates by an EDC enable swift decisions9,30,31.
The EDC was also designed to counteract some complexities associated with data collection in low- and middle-income countries; Internet connectivity was through a client-server system where data capture client (ODK Collect) was an offline stand-alone instance separated from the database server (ODK Aggregate). Data were synchronized from client to server at a later point in time at the base STRATAA data office where connectivity was possible. This approach has also been recom-mended by others32,33, and we did not experience any damage or theft of the tablets which led to data loss before data was synchronized to the database server. We adhered to a practice of disabling eCRF ‘edit’ options, post-interview, in order to maintain data integrity in the field. Validations within the ODK Collect prevented most errors. However, 0.4% duplicate household identities and 0.3% missing GPS points were uncovered in addition to other text and numeric errors. Following good data management practices34, our EDC also provided three backup strategies; scheduled data synchronization to (i) centralized repository, (ii) MySQL-defined databases, and (iii) scheduled incremental backup of MySQL-defined databases to external storage devices.
The EDC delivered considerable capacity for automated report generation, scalability and adaptability. We were able to use SQL to pull seasonal data from MySQL-defined database, and automate summaries of demographics in order to monitor progress of field work, and collective and individual performance of field workers. SQL was preferred because of its simple but powerful syntax, and its wider use in handling complex queries to epi-demiological datasets23,25,30,33. Since the STRATAA consortium continuously generates laboratory data, post-census, the EDC also allows scalability, pushing laboratory data from laboratory database systems to MySQL-defined databases while keeping the database structure homogeneous across sites. The EDC could therefore not only be adopted by others collecting large data volumes requiring centralized data storage and automation of process, but also be tested by settings with little experience in conducting field-based research. The EDC is installed in three typhoid endemic settings and will be maintained by STRATAA consortium for adaptability of potential future studies.
Costs estimates on the data capture systems across low- and middle-income settings account for different item inclusions7,29,35,36. However, generally, our total variable cost of the EDC was minimal relative to most EDCs or paper-based data collection methods conducted in similar settings. For instance, our EDC’s total variable cost is analogous to US$13,883.00 incurred on a paper-based survey of neglected tropic diseases in Ethiopia7. However, in northern Malawi, estimated total variable costs of an EDC (US$14,477.46 [£11,427]) and paper-based system (US$23,939.06 [£18,895]) are slightly and much higher than our
EDC, respectively29. Similarly, our total variable cost is relatively low compared to paper-based studies conducted in Bangladesh and Philippines (US$45,000.00) on verbal autopsy35, and in Kenya (US$15,999.00) on influenza36.
ConclusionIn conclusion, we have designed an EDC which has been imple-mented in three typhoid endemic sites to collect large volume of accurate data in short time periods with rapid access through automated reports. The EDC’s development required careful attention to detail but the materials’ variable costs prior to census implementation, were minimal relative to some EDCs and paper-based data collection methods. This EDC could be adopted in similar epidemiological settings, enabling the collection and management of large data volumes, centralize data storage, and automated data processes.
Data availabilityZenodo: Electronic-Data-Capture-for-Large-Scale-Typhoid-Surveil-lance---STRATAA: edc. https://doi.org/10.5281/zenodo.373832815.
File ‘8.strataa_s1_s2_figures.csv’ contains raw data on error rates, errors before and after retraining field workers, and data entry performance.
Data are available under the terms of the Creative Commons Zero “No rights reserved” data waiver (CC0 1.0 Public domain dedication).
Software availabilityCoding scripts used to develop the EDC (ODK Collect eCRF and MySQL database objects) available at: https://github.com/deusthindwa/Electronic-Data-Capture-for-Large-Scale-Typhoid-Surveillance---STRATAA/tree/v1.1.
Archived code at time of publication: https://doi.org/10.5281/zenodo.373832815.
License: GNU General Public License version 2.
Consent for publicationNot applicable.
AcknowledgementsMembers of The Strategic Typhoid alliance across Africa and Asia consortium (STRATAA) have played a role of funding- acquisition and administration. The following members of STRATAA study consent to be acknowledged: Oxford University Clinical Research Unit, Patan Academy of Health Sciences, Kathmandu, Nepal (Mila Shakya, Abhilasha Karkey, Sabina Dongol, Amit Aryjal, Buddha Basnyat); International Center for Diarrhoeal Diseases Research, Dhaka, Bangladesh (Nirod Saha, Farhana Khanam, Md Arifuzzaman Khan, John D. Clemens, Firdausi Qadri, K. Zaman); Malawi Liverpool Wellcome Trust Clinical Research Programme, Malawi (Deus Thindwa, Robert S Heyderman, Melita A Gordon, Tikhala Makhaza Jere, Chisomo
Page 10 of 26
Wellcome Open Research 2020, 5:66 Last updated: 29 APR 2022
Msefula, Tonney Nyirenda); The Hospital for Tropical Diseases, Wellcome Trust Major Overseas Programme, Oxford Univer-sity Clinical Research Unit, Ho Chi Minh City, Vietnam (Tan Trinh Van); Wellcome Trust Sanger Institute, Cambridge, United Kingdom (Stephen Reece, Gordon Dougan); Oxford Vaccine Group, Department of Paediatrics, University of Oxford, and the NIHR Oxford Biomedical Research Centre, Oxford, United Kingdom (Merryn Voysey, Christoph J. Blohmke, Jennifer Hill, Thomas C. Darton, Susan Tonks, Yama G Farooq, James E. Meiring, Andrew J Pollard); Yale School of Public Health, Yale University, New Haven, Connecticut, United States of America (Neil J. Saad, Virginia E. Pitzer); Center for Tropical Medicine and Global Health, Nuffield Department of Medicine, University
of Oxford, United Kingdom (Stephen Baker, Christiane Dolecek); The Peter Doherty Institute for Infection and Immunity, The University of Melbourne, Australia (Sarah J. Dunstan); Centre for Systems Genomics, University of Melbourne, Parkville, Victoria, Australia (Kathryn E. Holt). Division of Infection and Immunity, University College London (Robert S Heyderman), Department of Infectious Disease Epidemiology, Imperial College London (Deus Thindwa), Institute of Infection and Global Health, University of Liverpool, Liverpool, United Kingdom (Melita A Gordon). We are grateful to all individuals who participated in the census of the STRATAA study. We also thank all community leaders from the STRATAA areas for allowing us to conduct STRATAA study in their areas.
References
1. Garritty C, El Emam K: Who’s using PDAs? Estimates of PDA use by health care providers: a systematic review of surveys. J Med Internet Res. 2006; 8(2): e7. PubMed Abstract | Publisher Full Text | Free Full Text
2. Medhanyie AA, Spigt M, Yebyo H, et al.: Quality of routine health data collected by health workers using smartphone at primary health care in Ethiopia. Int J Med Inform. 2017; 101: 9–14. PubMed Abstract | Publisher Full Text
3. Thriemer K, Ley B, Ame SM, et al.: Replacing paper data collection forms with electronic data entry in the field: findings from a study of community-acquired bloodstream infections in Pemba, Zanzibar. BMC Res Notes. 2012; 5: 113. PubMed Abstract | Publisher Full Text | Free Full Text
4. Yu P, de Courten M, Pan E, et al.: The development and evaluation of a PDA-based method for public health surveillance data collection in developing countries. Int J Med Inform. 2009; 78(8): 532–42. PubMed Abstract | Publisher Full Text
5. Rorie DA, Flynn RWV, Grieve K, et al.: Electronic case report forms and electronic data capture within clinical trials and pharmacoepidemiology. Br J Clin Pharmacol. 2017; 83(9): 1880–95. PubMed Abstract | Publisher Full Text | Free Full Text
6. Ali M, Deen JL, Khatib A, et al.: Paperless registration during survey enumerations and large oral cholera mass vaccination in Zanzibar, the United Republic of Tanzania. Bull World Health Organ. 2010; 88(7): 556–9. PubMed Abstract | Publisher Full Text | Free Full Text
7. King JD, Buolamwini J, Cromwell EA, et al.: A novel electronic data collection system for large-scale surveys of neglected tropical diseases. PLoS One. 2013; 8(9): e74570. PubMed Abstract | Publisher Full Text | Free Full Text
8. King C, Hall J, Banda M, et al.: Electronic data capture in a rural African setting: evaluating experiences with different systems in Malawi. Glob Health Action. 2014; 7: 25878. PubMed Abstract | Publisher Full Text | Free Full Text
9. White A, Thomas DSK, Ezeanochie N, et al.: Health Worker mHealth Utilization: A Systematic Review. Comput Inform Nurs. 2016; 34(5): 206–13. PubMed Abstract | Publisher Full Text | Free Full Text
10. Antillón M, Warren JL, Crawford FW, et al.: The burden of typhoid fever in low- and middle-income countries: A meta-regression approach. PLoS Negl Trop Dis. 2017; 11(2): e0005376. PubMed Abstract | Publisher Full Text | Free Full Text
11. Mogasale V, Maskery B, Ochiai RL, et al.: Burden of typhoid fever in low-income and middle-income countries: a systematic, literature-based update with risk-factor adjustment. Lancet Glob Health. 2014; 2(10): e570–80. PubMed Abstract | Publisher Full Text
12. Crump JA: Building the case for wider use of typhoid vaccines. Vaccine. 2015; 33(Suppl 3): C1–2. PubMed Abstract | Publisher Full Text | Free Full Text
13. Darton TC, Meiring JE, Tonks S, et al.: The STRATAA study protocol: a programme to assess the burden of enteric fever in Bangladesh, Malawi and Nepal using prospective population census, passive surveillance, serological studies and healthcare utilisation surveys. BMJ Open. 2017; 7(6): e016283. PubMed Abstract | Publisher Full Text | Free Full Text
14. MacPherson P, Choko AT, Webb EL, et al.: Development and validation of a global positioning system-based “map book” system for categorizing cluster residency status of community members living in high-density urban slums in Blantyre, Malawi. Am J Epidemiol. 2013; 177(10): 1143–7. PubMed Abstract | Publisher Full Text | Free Full Text
16. University of Washington: Open Data Kit. Accessed 9 Jul 2017. Reference Source
17. Anokwa Y, Hartung C, Brunette W, et al.: Open Source Data Collection in the Developing World. Computer. 2009; 42(10): 97–9. Publisher Full Text
18. Hartung C, Lerer A, Anokwa Y, et al.: Open Data Kit: Tools to Build Information Services for Developing Regions. In: Proceedings of the 4th ACM/IEEE International Conference on Information and Communication Technologies and Development. New York, NY, USA: ACM; 2010; 18:1–18:12. Publisher Full Text
20. Chignell M, Tong T, Mizobuchi S, et al.: Combining Multiple Measures into a Single Figure of Merit. Procedia Comput Sci. 2015; 69: 36–43. Publisher Full Text
21. R Core Team: R: A language and environment for statistical computing. R Foundation for Statistical Computing, Vienna, Austria. 2018. Accessed 28 May 2019. Reference Source
22. Thindwa D, Farooq YG, Shakya M, et al.: Electronic data capture for large scale typhoid surveillance, household contact tracing, and health utilisation survey: Strategic Typhoid Alliance across Africa and Asia. medRxiv. 2020; 2020.03.02.20030056. Publisher Full Text
23. Jenkins TM, Boyce TW, Akers R, et al.: Evaluation of a Teleform-based data collection system: A multi-center obesity research case study. Comput Biol Med. 2014; 49: 15–8. PubMed Abstract | Publisher Full Text | Free Full Text
24. Pomerantseva V, Ilicheva O: Clinical Data Collection, Cleaning and Verification in Anticipation of Database Lock. Pharm Med. 2011; 25(4): 223–33. Publisher Full Text
25. Dillon DG, Pirie F, Rice S, et al.: Open-source electronic data capture system offered increased accuracy and cost-effectiveness compared with paper methods in Africa. J Clin Epidemiol. 2014; 67(12): 1358–63. PubMed Abstract | Publisher Full Text | Free Full Text
26. Byass P, Hounton S, Ouédraogo M, et al.: Direct data capture using hand-held computers in rural Burkina Faso: experiences, benefits and lessons learnt. Trop Med Int Health. 2008; 13 Suppl 1: 25–30. PubMed Abstract | Publisher Full Text
27. Patnaik S, Brunskill E, Thies W: Evaluating the Accuracy of Data Collection on Mobile Phones: A Study of Forms, SMS, and Voice. 2009; Accessed 22 May
Page 11 of 26
Wellcome Open Research 2020, 5:66 Last updated: 29 APR 2022
28. Walther B, Hossin S, Townend J, et al.: Comparison of Electronic Data Capture (EDC) with the Standard Data Capture Method for Clinical Trial Data. PLoS One. 2011; 6(9): e25348. PubMed Abstract | Publisher Full Text | Free Full Text
29. McLean E, Dube A, Saul J, et al.: Implementing electronic data capture at a well-established health and demographic surveillance site in rural northern Malawi. Glob Health Action. 2017; 10(1): 1367162. PubMed Abstract | Publisher Full Text | Free Full Text
30. Rajput ZA, Mbugua S, Amadi D, et al.: Evaluation of an Android-based mHealth system for population surveillance in developing countries. J Am Med Inform Assoc. 2012; 19(4): 655–9. PubMed Abstract | Publisher Full Text | Free Full Text
31. Maduka O, Akpan G, Maleghemi S: Using Android and Open Data Kit Technology in Data Management for Research in Resource-Limited Settings in the Niger Delta Region of Nigeria: Cross-Sectional Household Survey. JMIR MHealth UHealth. 2017; 5(11): e171. P ubMed Abstract | Publisher Full Text | Free Full Text
32. Meyer J, Fredrich D, Piegsa J, et al.: A mobile and asynchronous electronic data capture system for epidemiologic studies. Comput Methods Programs Biomed. 2013; 110(3): 369–79. PubMed Abstract | Publisher Full Text
33. Baguiya A: An offline mobile data capture module for health and demographic surveillance system (HDSS) studies. Thesis. 2016; Accessed 18 Jul 2017. Reference Source
34. Shirima K, Mukasa O, Schellenberg JA, et al.: The use of personal digital assistants for data entry at the point of collection in a large household survey in southern Tanzania. Emerg Themes Epidemiol. 2007; 4: 5. PubMed Abstract | Publisher Full Text | Free Full Text
35. Flaxman AD, Stewart A, Joseph JC, et al.: Collecting verbal autopsies: improving and streamlining data collection processes using electronic tablets. Popul Health Metr. 2018; 16: 3. PubMed Abstract | Publisher Full Text | Free Full Text
36. Njuguna HN, Caselton DL, Arunga GO, et al.: A comparison of smartphones to paper-based questionnaires for routine influenza sentinel surveillance, Kenya, 2011–2012. BMC Med Inform Decis Mak. 2014; 14: 107. PubMed Abstract | Publisher Full Text | Free Full Text
Page 12 of 26
Wellcome Open Research 2020, 5:66 Last updated: 29 APR 2022
Gagandeep Kang Division of Gastrointestinal Sciences, Christian Medical College, Vellore, India
Electronic data capture is essential for clinical research. Data quality has been an issue, particularly where field staff with limited education are responsible for data capture. The authors have described how they built an eCRF using Open Data Kit and MySQL and deployed it for capturing data from over 300,000 individuals from 80,000 households.
○
The group collected baseline data from households for a census with an error rate of less than 50 per 10,000 in all three sites. Expectedly, text fields had more errors. While low, the error rate in Nepal was almost double other sites. It would be useful to know whether there were specific fields that were problematic in one location and not others? Or whether the errors were distributed evenly across field staff?
○
A key issue with electronic data capture is the availability of internet access and the group has addressed the combination with offline collection and twice daily uploading. It would help to have clarity on whether there are country-level regulatory/legal issues with the data being hosted with the Oxford Vaccine Group?
○
While this was not included in the scope of the paper, the authors’ comments on whether baseline census information data collection accuracy was comparable to data collected during follow-up or plans for future analysis would be helpful.
○
Is the rationale for developing the new software tool clearly explained?Yes
Is the description of the software tool technically sound?Yes
Are sufficient details of the code, methods and analysis (if applicable) provided to allow replication of the software development and its use by others?
Page 13 of 26
Wellcome Open Research 2020, 5:66 Last updated: 29 APR 2022
Is sufficient information provided to allow interpretation of the expected output datasets and any results generated using the tool?Yes
Are the conclusions about the tool and its performance adequately supported by the findings presented in the article?Yes
Competing Interests: No competing interests were disclosed.
Reviewer Expertise: Public health
I confirm that I have read this submission and believe that I have an appropriate level of expertise to confirm that it is of an acceptable scientific standard.
Author Response 23 Nov 2020Deus Thindwa, London School of Hygiene and Tropical Medicine, London, London, UK
Electronic data capture is essential for clinical research. Data quality has been an issue, particularly where field staff with limited education are responsible for data capture. The authors have described how they built an eCRF using Open Data Kit and MySQL and deployed it for capturing data from over 300,000 individuals from 80,000 households. Response: Thank you. The group collected baseline data from households for a census with an error rate of less than 50 per 10,000 in all three sites. Expectedly, text fields had more errors. While low, the error rate in Nepal was almost double other sites. It would be useful to know whether there were specific fields that were problematic in one location and not others? Or whether the errors were distributed evenly across field staff? Response: We only categorised fields as receiving text or numeric inputs. The problematic text fields were evenly distributed across sites but with more problems in Nepal than Bangladesh than Malawi (see Table 1). Such differences across sites could be due to fieldworker abilities and experience (Figure 3). There was substantial reductions in errors post-retraining in Nepal and Bangladesh. A key issue with electronic data capture is the availability of internet access and the group has addressed the combination with offline collection and twice daily uploading. It would help to have clarity on whether there are country-level regulatory/legal issues with the data being hosted with the Oxford Vaccine Group? Response: Thank you, the study design was reviewed and approved by each country’s national research ethics committee as well as Oxford University. We provide approval numbers under “Ethics approval and consent to participate”. While this was not included in the scope of the paper, the authors’ comments on whether baseline
Page 14 of 26
Wellcome Open Research 2020, 5:66 Last updated: 29 APR 2022
census information data collection accuracy was comparable to data collected during follow-up or plans for future analysis would be helpful. Response: Thank you, we have added a sentence to capture your suggestion. Indeed we plan to re-evaluate accuracy following additional studies under STRATAA (Lines 348-249) Is the rationale for developing the new software tool clearly explained? Yes Response: Thank you. Is the description of the software tool technically sound? Yes Response: Thank you. Are sufficient details of the code, methods and analysis (if applicable) provided to allow replication of the software development and its use by others? Yes Response: Thank you. Is sufficient information provided to allow interpretation of the expected output datasets and any results generated using the tool? Yes Response: Thank you. Are the conclusions about the tool and its performance adequately supported by the findings presented in the article? Yes Response: Thank you.
Competing Interests: We declare no competing interests
Michael Sikorski Center for Vaccine Development and Global Health, University of Maryland School of Medicine, Baltimore, MD, USA Myron Levine Center for Vaccine Development and Global Health, University of Maryland, Baltimore, MD, USA
The authors present a comprehensive custom electronic data capture system designed using open source tools and applied to a series of field censuses across three sites (one in Africa and two in Asia), targeting ~100,000 persons per site.
The EDC system employs best-practices in data management, including quality control tools, automated data validation, and secure backups.
○
Page 15 of 26
Wellcome Open Research 2020, 5:66 Last updated: 29 APR 2022
The authors clearly describe the software data system and illustrate the flow of data using two effective figures.
○
All components of the software system are available in the public domain and clearly annotated.
○
The results are both credible and clear-cut with regards to data management. However, with respect to the ability to extrapolate this method to other sites, there is a basic assumption that high quality and trainable workers can be mobilized and dedicated to allocate 13-16 weeks on such an activity and that funding will be available for the personnel and transportation costs to utilize this EDC system in the field. We note that STRATAA represents a consortium of highly experienced sites with core funding and that each participating site was selected, in part, for their "paper-based studies of high participant volume and logistical complexity."
Expanded discussion of the limitations and external validity of this study would help; including a discussion of how comparator studies cited in the discussion were selected, when they were conducted, and whether they are comparable given the potential differences in technology.
○
Major limitations to a successful demographic survey include the costs of the staff and the time/cost for transportation, stable WiFi, electricity, and GPS signals.
○
In summary: where adequate core funding, staffing, and transportation are readily available, the EDC system presented by the authors is likely to be readily adaptable as an upgrade to paper-based or out-moded electronic systems at a reasonable cost. Is the rationale for developing the new software tool clearly explained?Yes
Is the description of the software tool technically sound?Yes
Are sufficient details of the code, methods and analysis (if applicable) provided to allow replication of the software development and its use by others?Yes
Is sufficient information provided to allow interpretation of the expected output datasets and any results generated using the tool?Yes
Are the conclusions about the tool and its performance adequately supported by the findings presented in the article?Partly
Competing Interests: No competing interests were disclosed.
Reviewer Expertise: Field epidemiology and disease surveillance in LMICs; demographic surveillance; multi-site electronic data capture systems.
We confirm that we have read this submission and believe that we have an appropriate level
Page 16 of 26
Wellcome Open Research 2020, 5:66 Last updated: 29 APR 2022
of expertise to confirm that it is of an acceptable scientific standard, however we have significant reservations, as outlined above.
Author Response 23 Nov 2020Deus Thindwa, London School of Hygiene and Tropical Medicine, London, London, UK
The authors present a comprehensive custom electronic data capture system designed using open source tools and applied to a series of field censuses across three sites (one in Africa and two in Asia), targeting ~100,000 persons per site.
The EDC system employs best-practices in data management, including quality control tools, automated data validation, and secure backups.
○
The authors clearly describe the software data system and illustrate the flow of data using two effective figures.
○
All components of the software system are available in the public domain and clearly annotated.
○
Response: Thank you. The results are both credible and clear-cut with regards to data management. However, with respect to the ability to extrapolate this method to other sites, there is a basic assumption that high quality and trainable workers can be mobilized and dedicated to allocate 13-16 weeks on such an activity and that funding will be available for the personnel and transportation costs to utilize this EDC system in the field. We note that STRATAA represents a consortium of highly experienced sites with core funding and that each participating site was selected, in part, for their "paper-based studies of high participant volume and logistical complexity." Response: We have added a sentence to acknowledge that our approach may not be a practicable scenario in some low-income settings. (Lines 328-331). Expanded discussion of the limitations and external validity of this study would help; including a discussion of how comparator studies cited in the discussion were selected, when they were conducted, and whether they are comparable given the potential differences in technology. Response: We have added a sentence to acknowledge limitations as per your suggestions. (Lines 304-307). Major limitations to a successful demographic survey include the costs of the staff and the time/cost for transportation, stable WiFi, electricity, and GPS signals. Response: We have added a sentence to capture the limitation of not being able to estimate other related costs. (Lines 364-366). In summary: where adequate core funding, staffing, and transportation are readily available, the EDC system presented by the authors is likely to be readily adaptable as an upgrade to paper-based or outmoded electronic systems at a reasonable cost. Response: Agree, we have added this to conclusions (Lines 375-376). Is the rationale for developing the new software tool clearly explained? Yes Response: Thank you. Is the description of the software tool technically sound? Yes
Page 17 of 26
Wellcome Open Research 2020, 5:66 Last updated: 29 APR 2022
Response: Thank you. Are sufficient details of the code, methods and analysis (if applicable) provided to allow replication of the software development and its use by others? Yes Response: Thank you. Is sufficient information provided to allow interpretation of the expected output datasets and any results generated using the tool? Yes Response: Thank you. Are the conclusions about the tool and its performance adequately supported by the findings presented in the article? Partly Response: We have expanded conclusions acknowledging what would be limitations of implementing the EDC (Lines 373-376).
Competing Interests: We declare no competing interests
Jillian S Gauld Institute for Disease Modeling, Seattle, WA, USA
This paper provides an excellent overview of a substantial electronic data capture system, implemented in three different locations. I appreciate the detailed tables and schematic figures, as well as the cost and timeline data being published. This study would be very helpful for other settings deciding on whether to implement such a system, and identify potential issues to be aware of. However, there is a narrative challenge throughout the paper. It is unclear after reading through the introduction, what the purpose of this particular paper was. Is it a summary of a novel tool? If so, what is novel about it as compared to other EDC’s? Or, if this is a descriptive study of a large scale implementation of an electronic system, what other large scale surveillance studies have failed to report this type of accuracy data, and how does this impact the quality of research? I think it would be helpful to the reader to more thoroughly ground the paper in a very clear introduction and purpose. Similarly in the discussion, I appreciated the comparison of the EDC’s costs and accuracy to other systems. However, there is only a limited discussion of what might be driving these differences.
Page 18 of 26
Wellcome Open Research 2020, 5:66 Last updated: 29 APR 2022
For example, are the different error rates driven by the rate of text-based data entry, or the type of disease being surveiled? For costs, are all of these studies geo-locating individuals? Investigating these differences further would very much strengthen the discussion and conclusions made. For Figure 3, I am not sure this is displayed correctly, or I may be misunderstanding what is being displayed. It appears that the post-retraining error is 1 minus the pre-retraining error for each field worker. Presumably some field workers may benefit less than others from the re-training? Some more minor comments: Methods
Paragraph 2 of the methods seems to be summarized at least partly in Figure 1, so would remove.
○
Some of the terms (preloading, looping) not obvious to a general audience, can you define?
○
"All the other errors exposed by the external SQL queries were investigated thoroughly in the field before corrections could..." This section was a bit unclear - what are the other errors? Any non-GPS errors, or those that couldn't be auto-corrected through the SQL script?
○
"The maximum number of visits to the household prior declaring the household vacant or errors permanently unresolved was twice." Would move this to results.
○
The operation and implementation sections could be switched in order in the paper. ○
DiscussionThe first time I see the 12 hour upload frequency is in the discussion unless I missed it, this should be in the methods somewhere.
○
Is the rationale for developing the new software tool clearly explained?No
Is the description of the software tool technically sound?Yes
Are sufficient details of the code, methods and analysis (if applicable) provided to allow replication of the software development and its use by others?Yes
Is sufficient information provided to allow interpretation of the expected output datasets and any results generated using the tool?Yes
Are the conclusions about the tool and its performance adequately supported by the findings presented in the article?
Page 19 of 26
Wellcome Open Research 2020, 5:66 Last updated: 29 APR 2022
Partly
Competing Interests: No competing interests were disclosed.
Reviewer Expertise: Mathematical and statistical modeling of typhoid fever and other enteric diseases.
I confirm that I have read this submission and believe that I have an appropriate level of expertise to confirm that it is of an acceptable scientific standard, however I have significant reservations, as outlined above.
Author Response 23 Nov 2020Deus Thindwa, London School of Hygiene and Tropical Medicine, London, London, UK
This paper provides an excellent overview of a substantial electronic data capture system, implemented in three different locations. I appreciate the detailed tables and schematic figures, as well as the cost and timeline data being published. This study would be very helpful for other settings deciding on whether to implement such a system, and identify potential issues to be aware of. Response: Thank you. However, there is a narrative challenge throughout the paper. It is unclear after reading through the introduction, what the purpose of this particular paper was. Is it a summary of a novel tool? If so, what is novel about it as compared to other EDC’s? Or, if this is a descriptive study of a large scale implementation of an electronic system, what other large scale surveillance studies have failed to report this type of accuracy data, and how does this impact the quality of research? I think it would be helpful to the reader to more thoroughly ground the paper in a very clear introduction and purpose. Response: The last paragraph of the introduction has been revised to make clear the purpose/rationale of developing the EDC (Lines 80-89). Similarly in the discussion, I appreciated the comparison of the EDC’s costs and accuracy to other systems. However, there is only a limited discussion of what might be driving these differences. For example, are the different error rates driven by the rate of text-based data entry, or the type of disease being surveyed? For costs, are all of these studies geo-locating individuals? Investigating these differences further would very much strengthen the discussion and conclusions made. Response: See our response to this to “Reviewer 1 point 13". For Figure 3, I am not sure this is displayed correctly, or I may be misunderstanding what is being displayed. It appears that the post-retraining error is 1 minus the pre-retraining error for each field worker. Presumably some field workers may benefit less than others from the re-training? Response: It interprets as the proportion of all errors committed per fieldworker e.g. if fieldworker 1 committed 10 errors pre-retraining and 5 errors post-retraining then 10/15 (67%) for pre-retraining and 5/15 (33%) for post-retraining are the % errors. Paragraph 2 of the methods seems to be summarized at least partly in Figure 1, so would
Page 20 of 26
Wellcome Open Research 2020, 5:66 Last updated: 29 APR 2022
remove. Response: In the spirit of keeping manuscript text independent from figures, we were previously advised by a reviewer to include the text in case some readers don’t have to check Figure 1. Some of the terms (preloading, looping) not obvious to a general audience, can you define? Response: Thank you, these terms have been defined on their first appearances. (Lines 120-122) "All the other errors exposed by the external SQL queries were investigated thoroughly in the field before corrections could..." This section was a bit unclear - what are the other errors? Any non-GPS errors, or those that couldn't be auto-corrected through the SQL script? Response: This sentence has been slightly revised by deleting prefix “All the other”. The sentence refers to errors listed under Lines 123-131 "The maximum number of visits to the household prior declaring the household vacant or errors permanently unresolved was twice." Would move this to results. Response: Thank you, this has now been moved to results (Lines 250-251). The operation and implementation sections could be switched in order in the paper. Response: It is the Journal’s editorial advice to put them in the current order. The first time I see the 12 hour upload frequency is in the discussion unless I missed it, this should be in the methods somewhere Response: This has already been indicated in the Methods section. “Then data were collected in the field during the day and temporarily saved in the tablet’s memory. At the end of each day, tablets were returned to the base STRATAA data office and data were uploaded from the tablet’s memory to ODK Aggregate server via a secure wireless network technology.” (Lines 159-162) Is the rationale for developing the new software tool clearly explained? No Response: The last paragraph of the introduction has been revised to make clear the purpose/rationale of developing the EDC (Lines 80-89). Is the description of the software tool technically sound? Yes Response: Thank you. Are sufficient details of the code, methods and analysis (if applicable) provided to allow replication of the software development and its use by others? Yes Response: Thank you. Is sufficient information provided to allow interpretation of the expected output datasets and any results generated using the tool? Yes Response: Thank you. Are the conclusions about the tool and its performance adequately supported by the findings presented in the article? Partly
Page 21 of 26
Wellcome Open Research 2020, 5:66 Last updated: 29 APR 2022
Response: We have expanded conclusions acknowledging what would be limitations of implementing the EDC (Lines 373-376).
Competing Interests: We declare no competing interests
Sylvester Maleghemi World Health Organization, Port Harcourt, Nigeria
The article clearly demonstrates what was done, and can be replicated but does not clearly demonstrate what new information it adds to the scientific community, what was done different from previous ECDs, and leaves room for bias with facilities chosen for previous good performances. It also needs to speak more on the challenges and limitations especially in real time data updates to servers in low income settings where network remains an issue, collecting data and the assumption that dilapidated facilities etc. are justification for poor data is not proven and does not hold true. A 12 hour regular synchronization is really not feasible in our setting esp. Africa. Once these issues are addressed the paper should be considered for indexing. I have some specific comments that can be found in the PDF file here which need to be addressed. Is the rationale for developing the new software tool clearly explained?Partly
Is the description of the software tool technically sound?Yes
Are sufficient details of the code, methods and analysis (if applicable) provided to allow replication of the software development and its use by others?Yes
Is sufficient information provided to allow interpretation of the expected output datasets and any results generated using the tool?Yes
Page 22 of 26
Wellcome Open Research 2020, 5:66 Last updated: 29 APR 2022
Are the conclusions about the tool and its performance adequately supported by the findings presented in the article?Partly
Competing Interests: No competing interests were disclosed.
Reviewer Expertise: My ares of research include Immunology, use of emobile technology for health, data management, clinical trials, research and International Health regulation.
I confirm that I have read this submission and believe that I have an appropriate level of expertise to confirm that it is of an acceptable scientific standard, however I have significant reservations, as outlined above.
Author Response 23 Nov 2020Deus Thindwa, London School of Hygiene and Tropical Medicine, London, London, UK
The article clearly demonstrates what was done, and can be replicated but does not clearly demonstrate what new information it adds to the scientific community, what was done different from previous ECDs, and leaves room for bias with facilities chosen for previous good performances. It also needs to speak more on the challenges and limitations especially in real time data updates to servers in low income settings where network remains an issue, collecting data and the assumption that dilapidated facilities etc. are justification for poor data is not proven and does not hold true. Response: (a) We report a new application of an existing open source software platform. We show how this electronic system can be built and how it can be deployed to improve quality of huge volumes of data collection from across poor-resource settings, globally. We have amended the text accordingly. This manuscript is targeted at researchers who are considering adopting EDC. We have not formally compared our EDC with other systems, because this would require another large-scale census which was not feasible. (b) The selected study sites have considerable experience of paper-based data collection systems but no prior experience of using ODK at scale, particularly in high-density urban slums. The field workers using the EDC frequently had little prior experience of data collection. We have amended the text accordingly. (c) We agree with the reviewer that network interruptions could render EDC impractical, although network coverage and stability is improving in many resource-limited settings. To avoid this potential barrier to implementation, synchronisation between tablet and server was done at the data office, not in the field, and typically at night when connectivity was stable. d) Contrary to the Reviewer’s comments, we have presented the limitations of our system in the manuscript. These include errors from (i) using text fields, (ii) not retraining field workers for better performance or due to field worker steep learning curve, (iii) lack of knowledge and skills required to develop and manage the ODK-SQL apps, (iv) limited built-in functionality of ODK e.g. lack of detection of duplicate barcodes for individual IDs when scanned, (v) lack of ODK built-in GPS validations relative to map boundaries. A 12 hour regular synchronization is really not feasible in our setting esp. Africa. Response: On the contrary, one of the benefits of this system is that 12 hourly
Page 23 of 26
Wellcome Open Research 2020, 5:66 Last updated: 29 APR 2022
synchronisation was feasible. We describe a protocol whereby Android tablets were given out in the morning and returned in the late afternoon by field workers on a daily basis for collection and submission of data. We also provide datasets that have timestamps of data collection and submission for your review. (Lines 159-164) Is the rationale for developing the new software tool clearly explained?, Partly Response: The last paragraph of the introduction has been revised to make clear the purpose/rationale of developing the EDC (Lines 80-89). Is the description of the software tool technically sound?, Yes Response: Thank you. Are sufficient details of the code, methods and analysis (if applicable) provided to allow replication of the software development and its use by others?, Yes Response: Thank you. Is sufficient information provided to allow interpretation of the expected output datasets and any results generated using the tool?, Yes Response: Thank you. Are the conclusions about the tool and its performance adequately supported by the findings presented in the article?, Partly Response: We have expanded conclusions acknowledging what would be limitations of implementing the EDC (Lines 373-376). Competing Interests? No competing interests were disclosed. Response: The “Competing interests” statement was provided during submission in the online system. We have included it again in the revised manuscript: “Paper-based systems have the advantage that they provide a hard copy source document”. I agree but all advantages of paper can also be reflected in the ODK, rather focus on the benefits of the ODK, and its disadvantage here. The paper itself is not a comparism of paper based over emobile reporting (Lines 59-70). Response: The inclusion of paper-based data collection drawbacks is to justify our choice for EDC (ODK). The major advantage of paper is in providing original copy of completed questionnaire. EDC may emulate that by providing an audit trail, but even an audit trail can be deleted leaving no evidence of changes. We list the advantages of EDC in the introduction, and discuss the disadvantages of EDC e.g. steep learning curve, poor form design which may result into errors during data collection. “In brief, the three sites, one in each country, were selected based on high known burden of enteric fever, differing epidemiological patterns and previous ability to deliver paper-based studies of high participant volume and logistical complexity.” The mannerism in which these sites were selected create a lot of room for bias, as the team purposively selected high performing facilities only that will deliver irrespective of challenges encountered especially in real life situation. Where in the article is STRATAA study designed discussed ??? (Lines 94-100) Response: The description of STRATAA study is given by reference number 13 - a peer-
Page 24 of 26
Wellcome Open Research 2020, 5:66 Last updated: 29 APR 2022
reviewed published paper by Darton TC et al. As discussed above, the selected sites had no prior experience of using EDC at very large scale. “Interestingly, the collection of such quality data is hindered by complexities of dilapidated health facilities, overcrowding, unstructured housing or slums, and illiteracy”.Cause and effect are not valid. The issue of data collection , quality etc and dilapidated health facilities "even good facilities can churn out poor data" same with the other reasons listed that affects the quality of data, you have not touched on major reasons for poor data in low and middle income countries such as simple things like even availability of the data tools, issues around data submission, from HFs to National database, quality of data due to poor supervision, DQAs etc. Please reword. (Lines 80-83) Response: We have amended the manuscript in line with the Reviewer’s suggestions (Lines 80-84). “Completeness of household demographics enumeration were 94.2%, 75.6% and 79.2% for Malawi, Nepal and Bangladesh, respectively, relative to background household count.” This is interesting, I would have thought this was an advantage of an interactive method of data collection, the rates between Malawi and the other 20 countries is greater than 20% and hopefully will be discussed in the discussions. Response: We have included a separate paragraph to explain variations in household data collection completeness across sites (Lines 309-312). “... and neglected tropic disease surveys (5.2%) in Ethiopia, the bloodstream infections study in Zanzibar (1.0%) and the tuberculosis program in India (4.2%)2,3,7,27. Moreover, our EDC data are more accurate in comparison to data reported from paper-based studies of maternal health (1.1%) and neglected tropical disease (6.2%) surveys in Ethiopia, bloodstream infections study in Zanzibar (7.0%), chronic disease research in South Africa (0.73%), and randomized controlled trial in Fiji (20.8%)”. Important that you have listed and compared your work with similar work and paper based, but you need to clearly state why this is more accurate, complete, as I am aware in most of the studies compared, training and retraining were done so what was done differently? (Lines 292-297) Response: We have already provided potential reasons for observed variations e.g. “The accuracy variations between EDCs are probably due to robustness of the EDC design in terms of error proofing. Robustness in the design is likely to depend on the limitations of software and hardware, and technical know-how of developers”. Also, we have added limitations in making such comparisons (Lines 303-307). “text fields of this eCRF generated more errors than numeric fields, and suggest that such errors could be prevented in eCRF designs by minimizing the use of text fields through coding of text responses or leaving out insignificant text responses completely.” Using a Drop box with selected comments is usually the standard whereby ticks become application, the idea of collecting data is for result, however it will be good to explain what can of information was been sourced from the field text in the beginning and its relevance. (Lines 297-300) Response: Figure 1 provides a flowchart with different data types for different fields and indicates what kind of information was sourced as text. In the Methods section, we state all fields of the eCRF and their relevance. (Lines 104-116).
Page 25 of 26
Wellcome Open Research 2020, 5:66 Last updated: 29 APR 2022
“Data were synchronized from client to server at a later point in time at the base STRATAA data office where connectivity was possible. This approach has also been recommended by others.” This introduces a limitation, that should be discussed, in some countries the data office may not assessed in days, as it seems the households targeted ensured that the surveyors could reach the offices daily and this is not a practicable scenario in most low income countries. I am aware also that most countries have learnt to rely on GSM networks to upload this data to mitigate this and ensure that the data collected included pictures are compressed on the ODK to ensure success of its transmission to the server. (Lines 316-318) Response: Thank you, additional statement to support this as a limitation in some low-income study sites far from the data office has been added. (Lines 328-331). “In conclusion, we have designed an EDC which has been implemented in three typhoid endemic sites to collect large volume of accurate.” I agree with the conclusion but I am of the opinion that the study itself is oversimplified to just 3 things
How data was collected using emobile technology along with its costs, training etc1. How it compares with other similar data collection mechanism ie paper and other studies2. The most interesting is how the data itself was managed along with the SQL3.
Response: Thank you. What it has failed to bring out is Understanding the potential impact of apps as part of a comprehensive integrated approach required for data collection. Response: We have presented the impact of the EDC as being capable to manage collection and processing of huge volumes of high quality data over very short time periods across different settings at a moderate cost. Therefore we maintain that the tool is an essential part of the integrated approach required for data collection (text amended). The limitations have not been properly addressed as it seems that all is easy in real life data collection Response: The Reviewer may have missed the limitations section of the manuscript. We have presented limitations in terms of (i) more errors from using text fields,(ii) a need to retrain field workers for better performance or due to steep learning curve, (iii) the knowledge and skills required to develop and manage the ODK-SQL apps, (iv) limited built-in functionality of ODK like lack of detection of duplicate barcodes for individual IDs when scanned, (v) accuracy of GPS can only be controlled with external Google Earth software and SQL queries, and not ODK alone. What is new as EDC has been and is continuously been used across different health programmes. Response: We report a new application of an existing open source software platform. We show how the system can be built and deployed to improve quality of huge volumes of data collection from across poor-resource settings. This paper is targeted at researchers who are considering adopting EDC.
Competing Interests: We declare no competing interests
Page 26 of 26
Wellcome Open Research 2020, 5:66 Last updated: 29 APR 2022