Thermohydraulic explosions in phreatomagmatic eruptions as evidenced by the comparison between pyroclasts and products from Molten Fuel Coolant Interaction experiments R. Bu ¨ttner, 1 P. Dellino, 2 L. La Volpe, 2 V. Lorenz, 1 and B. Zimanowski 1 Received 9 March 2001; revised 12 April 2002; accepted 30 May 2002; published 6 November 2002. [1] Thermohydraulic explosions were produced by Molten Fuel Coolant Interaction (MFCI) experiments using remelted shoshonitic rocks from Vulcano (Italy). The fragmentation history and energy release were recorded. The resulting products were recovered and analyzed with the scanning electron microscope. Fine particles from experiments show shape and surface features that result from melt fragmentation in brittle mode. These clasts relate to the thermohydraulic phase of the MFCI, where most of the mechanical energy is released; they are here called ‘‘active’’ particles. The total surface area of such particles is proportional to the energy of the respective explosions. Other particles from experiments show shape and surface features that result from melt fragmentation in a ductile regime. These fragments, called ‘‘passive’’ particles, form after the thermohydraulic phase, during the expansion phase of the MFCI. In order to verify thermohydraulic explosions in volcanic eruptions, we compared experimental products with samples from phreatomagmatic base-surge deposits of Vulcano. Ash particles from the experiments show features similar to those from the deposits, suggesting that the experiments reproduced the same fragmentation dynamics. To achieve discrimination between active and passive particles, we calculated shape parameters from image analysis. The mass of active particles in base-surge deposits was calculated. As the material properties for the natural samples are identical to the experimental ones, the energy measurements and calculations of the experiments can be applied. For a single phreatomagmatic eruption at Vulcano, a maximum mechanical energy release of 2.75 10 13 J was calculated, representing a TNT analogue of 6.5 kt. INDEX TERMS: 8414 Volcanology: Eruption mechanisms; 8404 Volcanology: Ash deposits; 8494 Volcanology: Instruments and techniques; 8439 Volcanology: Physics and chemistry of magma bodies; 8499 Volcanology: General or miscellaneous; KEYWORDS: explosive volcanism, phreatomagmatic explosions, image processing analysis, experimental volcanology, thermohydraulic explosions Citation: Bu ¨ttner, R., P. Dellino, L. La Volpe, V. Lorenz, and B. Zimanowski, Thermohydraulic explosions in phreatomagmatic eruptions as evidenced by the comparison between pyroclasts and products from Molten Fuel Coolant Interaction experiments, J. Geophys. Res., 107(B11), 2277, doi:10.1029/2001JB000511, 2002. 1. Introduction [2] Explosive magma/water interaction frequently occurs during volcanic eruptions and lead to the formation of phreatomagmatic deposits [Wohletz and Sheridan, 1983]. Such processes, which relate to a fast transformation of magmatic thermal energy into a mechanical form, represent the main eruptive mechanisms of maar volcanoes, tuff rings and tuff cones. They are reported also in some large-scale eruptions of composite volcanoes [Cioni et al., 1992]. Even if phreatomagmatic activity was recorded during recent eruptions, e.g. at Surtsey, Taal and Capelinhos [Moore et al., 1966; Thorarinsson, 1967; Waters and Fisher, 1971], not much of the explosion dynamics is understood from direct observation. The knowledge of such phenomena mostly derives from laboratory experiments and studies of eruptive products. Magma/water interaction processes gen- erally form deposits with a finer grain-size than products of purely magmatic origin. Ash particles show diagnostic shape features, and systematic descriptions of their morpho- logical characters are frequently reported in the literature [Wohletz, 1983; Heiken and Wohletz, 1985; Wohletz, 1987; Zimanowski et al., 1997a; Bu ¨ttner et al., 1999]. [3] Two different experimental approaches were used, in the past, to address the main physical processes of explosive magma/water interaction. Wohletz [1983] and Wohletz et al. [1995] used thermite to simulate magma; Zimanowski et al. [1986, 1991] instead used remelted volcanic rocks. Results from both types of experiments allowed the attribution of such explosions to Molten Fuel Coolant Interaction pro- cesses. These phenomena occur when two liquids, the first (magma) with a temperature above a critical temperature of JOURNAL OF GEOPHYSICAL RESEARCH, VOL. 107, NO. B11, 2277, doi:10.1029/2001JB000511, 2002 ECV 5 - 1 1 Physikalisch Vulkanologisches Labor, Institut fu ¨r Geologie, Universi- ta ¨t Wu ¨rzburg, Wu ¨rzburg, Germany. 2 Dipartimento Geomineralogico, Universita ` di Bari, Bari, Italy. Copyright 2002 by the American Geophysical Union. 0148-0227/02/2001JB000511$09.00
Transcript
Thermohydraulic explosions in phreatomagmatic eruptions as
evidenced by the comparison between pyroclasts and products from
Molten Fuel Coolant Interaction experiments
R. Buttner,1 P. Dellino,2 L. La Volpe,2 V. Lorenz,1 and B. Zimanowski1
Received 9 March 2001; revised 12 April 2002; accepted 30 May 2002; published 6 November 2002.
[1] Thermohydraulic explosions were produced by Molten Fuel Coolant Interaction(MFCI) experiments using remelted shoshonitic rocks from Vulcano (Italy). Thefragmentation history and energy release were recorded. The resulting products wererecovered and analyzed with the scanning electron microscope. Fine particles fromexperiments show shape and surface features that result from melt fragmentation in brittlemode. These clasts relate to the thermohydraulic phase of the MFCI, where most of themechanical energy is released; they are here called ‘‘active’’ particles. The total surfacearea of such particles is proportional to the energy of the respective explosions. Otherparticles from experiments show shape and surface features that result from meltfragmentation in a ductile regime. These fragments, called ‘‘passive’’ particles, form afterthe thermohydraulic phase, during the expansion phase of the MFCI. In order to verifythermohydraulic explosions in volcanic eruptions, we compared experimental productswith samples from phreatomagmatic base-surge deposits of Vulcano. Ash particles fromthe experiments show features similar to those from the deposits, suggesting that theexperiments reproduced the same fragmentation dynamics. To achieve discriminationbetween active and passive particles, we calculated shape parameters from image analysis.The mass of active particles in base-surge deposits was calculated. As the materialproperties for the natural samples are identical to the experimental ones, the energymeasurements and calculations of the experiments can be applied. For a singlephreatomagmatic eruption at Vulcano, a maximum mechanical energy release of 2.75 �1013 J was calculated, representing a TNT analogue of 6.5 kt. INDEX TERMS: 8414
Citation: Buttner, R., P. Dellino, L. La Volpe, V. Lorenz, and B. Zimanowski, Thermohydraulic explosions in phreatomagmatic
eruptions as evidenced by the comparison between pyroclasts and products from Molten Fuel Coolant Interaction experiments,
J. Geophys. Res., 107(B11), 2277, doi:10.1029/2001JB000511, 2002.
1. Introduction
[2] Explosive magma/water interaction frequently occursduring volcanic eruptions and lead to the formation ofphreatomagmatic deposits [Wohletz and Sheridan, 1983].Such processes, which relate to a fast transformation ofmagmatic thermal energy into a mechanical form, representthe main eruptive mechanisms of maar volcanoes, tuff ringsand tuff cones. They are reported also in some large-scaleeruptions of composite volcanoes [Cioni et al., 1992]. Evenif phreatomagmatic activity was recorded during recenteruptions, e.g. at Surtsey, Taal and Capelinhos [Moore etal., 1966; Thorarinsson, 1967; Waters and Fisher, 1971],
not much of the explosion dynamics is understood fromdirect observation. The knowledge of such phenomenamostly derives from laboratory experiments and studies oferuptive products. Magma/water interaction processes gen-erally form deposits with a finer grain-size than products ofpurely magmatic origin. Ash particles show diagnosticshape features, and systematic descriptions of their morpho-logical characters are frequently reported in the literature[Wohletz, 1983; Heiken and Wohletz, 1985; Wohletz, 1987;Zimanowski et al., 1997a; Buttner et al., 1999].[3] Two different experimental approaches were used, in
the past, to address the main physical processes of explosivemagma/water interaction. Wohletz [1983] and Wohletz et al.[1995] used thermite to simulate magma; Zimanowski et al.[1986, 1991] instead used remelted volcanic rocks. Resultsfrom both types of experiments allowed the attribution ofsuch explosions to Molten Fuel Coolant Interaction pro-cesses. These phenomena occur when two liquids, the first(magma) with a temperature above a critical temperature of
the second (water), interact via a interfacial area in directcontact [Buttner and Zimanowski, 1998]. A high heattransfer rate is achieved and an explosion results as theconsequence of a brittle reaction of the melt driven by thethermally induced water expansion.[4] Recent experiments specifically designed to record
the short-term dynamics of MFCI, allowed identificationand description of the various phases of the thermohydraulicprocess leading to an explosion [Buttner and Zimanowski,1998]. The effective mingling of melt and water takes placeduring the presence of a vapor film that temporarilyinsulates water from melt. A weak shock wave triggers arapid and complete condensation of the vapor film, andquasi coherent direct contact of the two media is established[Kobayashi et al., 1996; Zimanowski et al., 1997c]. Themechanical and thermal coupling of melt and water resultsin an enhanced heat transfer rate; melt suddenly cools andcontracts, and water suddenly heats and expands. This waterexpansion causes a rapid deformation of the melt that reactsby fracturing. Water intrudes into fractures and produces afurther micro fracturing of melt, which again increases theinterfacial area and thus the heat flux. This cascadingprocess enhances the surface area of contact between waterand melt and augments the cooling rate (>106 K/s). Such amechanism causes brittle melt fragmentation into very fineparticles (fine ash) and a high amount of kinetic energy isreleased as seismic waves. The fine fragments produced bythis process (<130 mm [Zimanowski et al., 1997a]) are thefingerprints of a thermohydraulic explosion. Such particleshave rough surfaces and uneven, angular shapes, they arecalled active particles because they represent the source ofexplosive energy. Buttner and Zimanowski [1998] demon-strated that the cumulative surface area of active particles isdirect proportional to the total mechanical energy releasedduring an explosion. After fine fragmentation water vapor-izes and its consequent fast expansion produces rapidacceleration of the melt surrounding the explosion locusand formation of liquid instabilities that lead to ductile meltfragmentation in two modes: ‘‘confined’’ and ‘‘free air’’.[5] In the initial phase of system expansion, when the
melt is confined in the crucible, the maximum pressure isreached and the melt reacts by formation of small particlesof rounded shapes with smooth surfaces that can bedescribed to result from stimulated Taylor instability. Whenthe melt, still liquid, is expelled at high velocities out of thecrucible, free air ductile fragmentation occurs that formselongated particles with smooth surfaces that can be mod-eled by Helmholtz instability strip-off [Zimanowski et al.,1997a]. Fragments produced during the expansion stage arecalled passive, because they do not directly contribute to themechanical energy release of the explosion. Active par-ticles, which are the fingerprint of thermohydraulic explo-sions, have been found in natural deposi ts ofphreatomagmatic eruptions [Buttner et al., 1999]. Knowl-edge of the amount of such active particles in naturaldeposits and calculation of their cumulative surface areashould provide information on the mechanical energyrelease during this type of explosive volcanic activity.[6] Various and diverse processes, other than thermohy-
draulic explosions, result in fact from the contact betweenmagma and water during volcanism. For example, passivethermal granulation [Wohletz et al., 1995], which is fre-
quently recorded when lava flows enter the sea and likelyhappens also in crater lakes upon ascent of magma through-out the conduit, plays a relevant role during phreatomag-matic eruptions. This kind of process allows heat transferfrom the melt to water and a significant steam expansionoccurs, thus leading to a certain release of kinetic energy.Such dynamics however, because of the small surface areaof contact between magma and water, reflect a low rate ofproduction of mechanical energy. In this article we intro-duce a method for the quantification of the active particlesand apply it to calculate the mechanical energy release ofphreatomagmatic eruptions. As case history we choosebase-surge deposits of the Palizzi eruptions of la Fossa diVulcano (Aeolian Islands, Italy), because they represent awell-constrained example of phreatomagmatic activity[Frazzetta et al., 1983; De Rosa et al., 1992; Dellino andLa Volpe, 2000]. They are well exposed in the field and it ispossible to correlate individual layers over the whole dis-persal area and to obtain a volume estimation of products ofa single eruption. In addition the Palizzi eruptions representthe maximum expected event in a future eruption at Vulcano[Dellino and La Volpe, 1997], and the knowledge of theireruptive dynamics is important for hazard assessment. Weperformed MFCI experiments using remelted shoshoniticrocks from Vulcano that well represent the magma compo-sition during the Palizzi eruptions [De Astis et al., 1997].The products of each experiment were completely recoveredto form one sample each. We compared the morphologicalfeatures of products obtained from experiments and naturaldeposits using the SEM. A quantitative characterization ofparticle shape is presented. Active particles are identified inexperimental and natural products, and are distinguishedfrom the passive ones. Finally the mechanical energyreleased during a representative phreatomagmatic explosionat Vulcano is calculated.
2. Geological Background and FieldCharacteristics of the Deposits
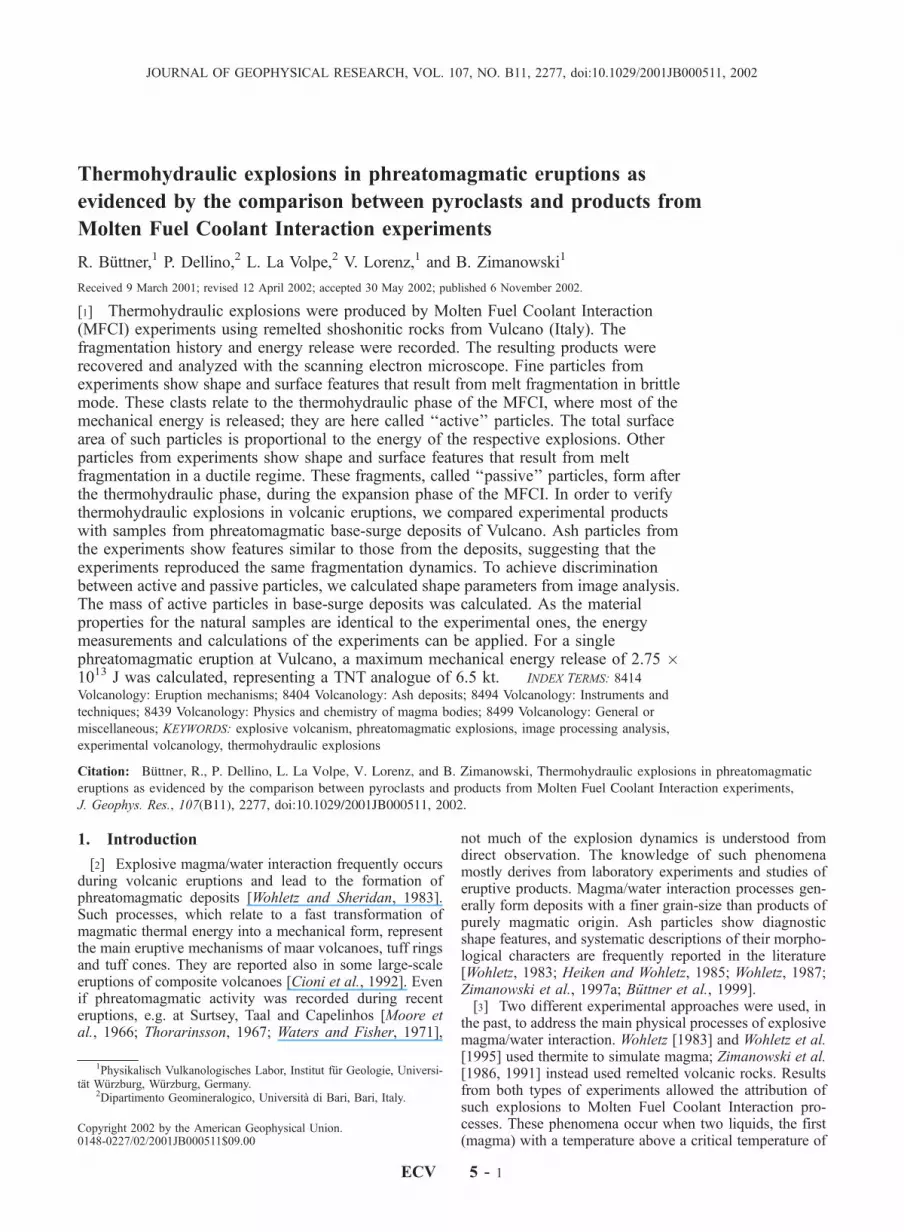
[7] La Fossa (Figure 1a) is the active cone of Vulcanoisland in the Tyrrhenian sea of Italy. Its maximum height isabout 390 m and the edifice, at its base, is about 2 km wide.At present, vigorous fumarolic activity occurs both insidethe crater and on the flanks of the cone. The volcanicactivity of La Fossa started about 6 ka BP [Frazzetta etal., 1983] and the last eruption occurred during the period1888–1890 AD. The eruptive history consisted of numer-ous eruptions, punctuating times of quiescence between afew years to hundred years [Dellino and La Volpe, 1997].The study of structural and textural features of products[Frazzetta et al., 1983; Dellino et al., 1990; De Rosa et al.,1992] suggests that phreatomagmatic base-surges are themain eruptive processes at la Fossa. Base-surges, theproducts of which constitute more than 80% of the strati-graphic sequence, are the expected events in future erup-tions and represent the most hazardous type of activity forthe island [Dellino and La Volpe, 2000].[8] Base-surge deposits investigated in this paper are
from the Palizzi eruptions (about 1.6 ka BP). They rangein composition between shoshonites and latites [De Astis etal., 1997], and are made up of decimeters thick ash layerswith a laminated structure (Figure 1b). Ripples and sand-
ECV 5 - 2 BUTTNER ET AL.: THERMOHYDRAULIC EXPLOSIONS
waves bed forms are present, suggesting transportation byturbulent suspension [Dellino and La Volpe, 2000]. Glass isthe most abundant component, representing about 60% ofdeposit volume, other components being crystals and lithics.From the analysis of layers correlated over the dispersal areait is possible to estimate that the maximum volume ofproducts related to a single base-surge event is in the orderof 1.0 106 m3. Among the coarsest particles of the deposits,shapes of the kind of Pele’s hairs and tears are present(Figure 1c). Pele’s hairs are generally observed during lavafountaining processes [Duffield et al., 1977] that join theHawaiian type of activity [Macdonald, 1972]. The occur-rence of such elongated fragments is therefore usually
associated with magmatic gas exsolution dynamics [Heiken,1974]. It could seem an oddity to find Pele’s hairs inphreatomagmatic deposits. The occurrence of such particles,however, is not rare at Vulcano, in fact they occur in thebase-surge deposits of all the eruptive sequences of LaFossa cone. In the recent literature on this subject [Shimo-zuru, 1994], the balance between melt viscosity and exitvelocity is considered to be the dominant factor in theformation of such particles. During the expansion stage ofMFCI experiments, elongated particles of the kind of Pele’shairs form [Wohletz, 1983; Zimanowski et al., 1991, 1997a].We suggest that their occurrence is indicative of the rheo-logical properties of the melt (low viscosity) and of the highexit velocity, no matter if the driving mechanism is mag-
Figure 1. a = Photograph of the cone of La Fossa diVulcano. b = Photograph of base-surge beds showinglaminated structures. c = Top-view photograph of a base-surge lamina showing some elongated particles of the typeof Pele’s hairs (arrows).
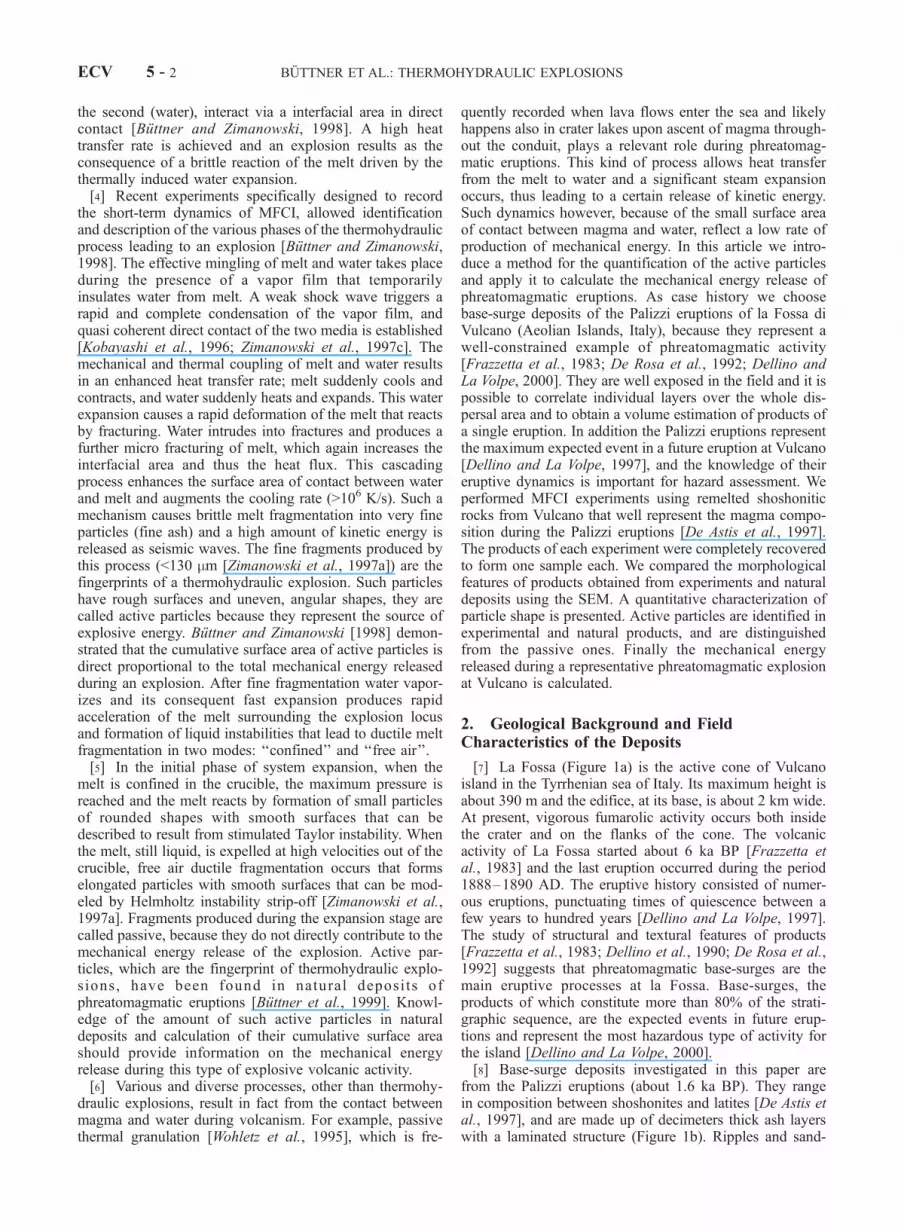
Figure 2. Grain-size distribution of a base-surge layer ofPalizzi eruptions sampled at various locations. a = grain-sizedistribution at the base of La Fossa cone; b = grain-sizedistribution at 800 m from the base of the cone; c = grain-size distribution at 850 m from the base of the cone. Phi =�log2d, where d is particle diameter in mm. Mdf and s arethe median size and sorting of the distribution as defined byInman [1952].
BUTTNER ET AL.: THERMOHYDRAULIC EXPLOSIONS ECV 5 - 3
matic or phreatomagmatic. Theoretical and experimentalconsideration made by Shimozuru [1994] on the formationof such elongated particles compared with artificial materialproduced in the glass industry, lead us to suggest that theviscosity of the melt should have been lower than 100 Pa sif an exit velocity between 75 and 100 m/s is assumed[Zimanowski et al., 1997a].[9] Grain-size distribution data of base-surge beds of
Palizzi are given in Figure 2. Sorting is good and themedian is in the range of fine and medium ash. Distributionsare skewed, and a granulometrical shift toward finer valuesoccurs in samples taken from an increasing distance fromthe vent (Figures 2a, 2b, and 2c). This behavior is inaccordance with the sequential fragmentation/transportationmodel of grain-size distribution [Wohletz et al., 1989]. Aselective transportation mechanism related to turbulentsuspensions is assumed for these deposits of La Fossa.One may conclude that the grain-size distribution of indi-vidual base-surge beds mainly reflects the transportationand deposition mechanisms. Therefore, even if it is largelyaccepted that magma/water interaction processes generallyproduce fine-grained deposits, we should not use the grain-size distribution of base-surges to directly infer the frag-mentation population of particles at the onset of explosion,at least not for the coarse-size fraction. It is also to note thatthe coarse material produced by volcanic explosions is morelikely to be recycled back into the crater, as is typical ofphreatomagmatic eruptions [Houghton and Smith, 1993],and is not significantly transported into the eruptive cloud.
3. Experiments
[10] Major oxide proportions of the shoshonitic rocksamples used for experiments are given in Table 1. DuringMFCI the quality of melt fragmentation is governed by themechanical energy release and by melt material properties.The most important parameter is melt viscosity, whichdetermines the rheological behavior. We used as a referencefor the magma forming the base-surge products the viscos-
ity value expected for the formation of Pele’s hair, thatshould be lower than 100 Pa s. A high-temperature visc-ometer [Buttner et al., 2000] was used to measure theviscosity/temperature dependence of the remelted shosho-nitic rocks. The temperature for obtaining a viscosity lowerthan 100 Pa s was found to be in the range between 1280and 1320 �C. This value is higher than the estimatedoriginal eruption temperature, given by the homogenizationtemperature (about 1150 �C) obtained by Gioncada et al.[1998] from melt inclusions of these products. This differ-ence may be explained by a) the loss of ‘‘silica-bond’’breaking elements and b) loss of water due to degassing.The thermal conductivity of the model melt was determinedusing a newly developed method [Buttner et al., 2000].Results indicate that in the range between 1150 and 1320 �Cthe value (0.4 ± 0.1) W/(m K) is practically constant. Themelt temperature of MFCI experiments was thus adjusted to1300 �C, which results in a rheological behavior similar tothe original magma, and does not significantly modify thethermal conductivity.[11] In each experimental run, about 400 g of volcanic
rocks were filled into a steel crucible of 5 cm internaldiameter and 10 cm depths and heated to 1300 �C to form150 mL of melt. Using a force-transducer mechanicallycoupled to the crucible, a geophone and a pressure trans-ducer, the force and pressure history were recorded duringexperiments. Furthermore, we used high-speed cinematog-raphy and video to measure the expansion velocities and todistinguish the various process phases from each other. Inthis way the total mechanical energy release was monitoredand correlated to the respective melt fragmentation pro-cesses. The set-up and methods used are described in detailby Zimanowski et al. [1997a, 1997b, 1997c] and Buttnerand Zimanowski [1998]. Here we report a brief descriptionof the experimental runs carried out with melts fromVulcano rock samples, for illustrating the dynamic pro-cesses that occurred during the experiments. 15 mL of waterat room temperature are injected into the melt at a velocityof 4.2 m/s, by means of a steel tube of 4.4-mm internaldiameter. Thus the entrapment of a water domain sur-rounded by a stable vapor film inside the melt is achieved.Consequently the vapor film is destroyed by a weak shockwave (<10 J) caused by the impact of an air gun bullet ontothe melt surface. About 0.5 to 0.7 ms after the trigger,intensive pressure pulses and shock waves are emitted (>5kJ) causing an ‘‘explosion bang’’. Most of the mechanicalenergy is released during this phase of the experiments(about 80%), but the optical recordings display no systemexpansion at this stage. Such a behavior is typical forthermohydraulic explosions, which are described as quasiisochoric processes. Most of the thermal energy that isconverted into a mechanical form is in fact released asshock waves during fine fragmentation of the melt in abrittle mode that produces active particles in this phase.
Table 1. Major Oxides Percentages of Rocks Used for MFCI
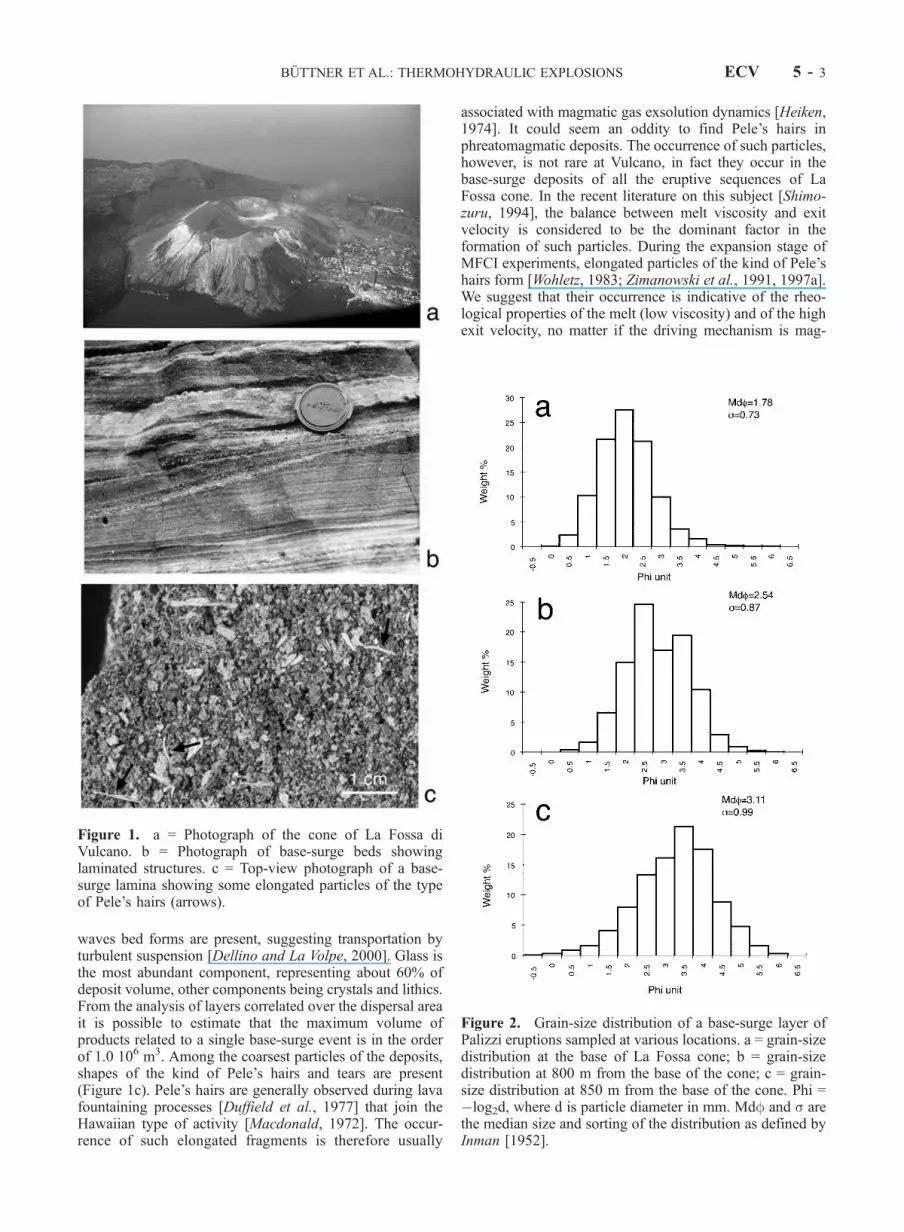
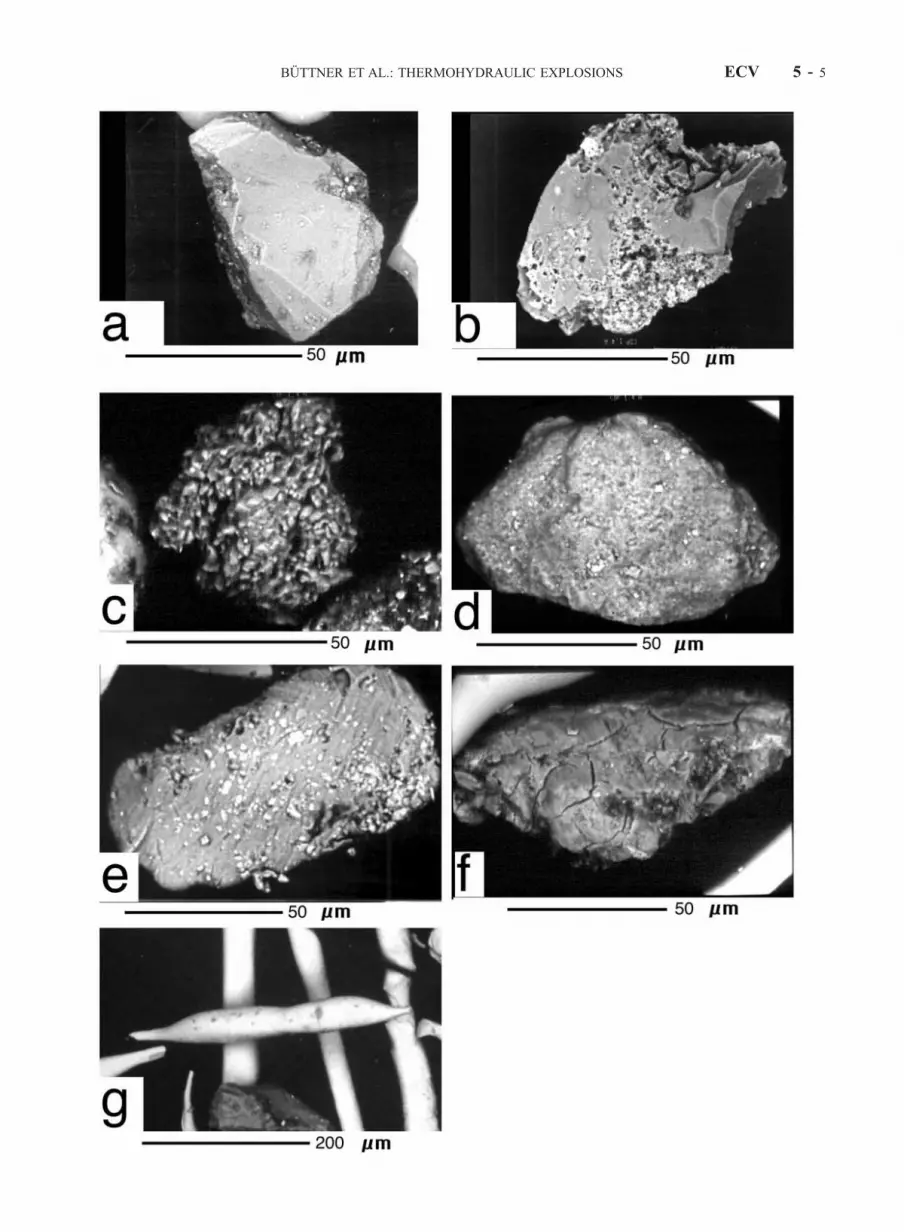
Figure 3. (opposite) Photographs showing SEM images of glass particles obtained from MFCI experiments. a = particlewith angular shape caused by brittle fragmentation; b = particle with angular shape and rough surfaces caused by brittlefragmentation; c = particle with angular and irregular shape caused by annealing after brittle fragmentation; d = particlewith rounded shape caused by ductile fragmentation; e = particle with subrounded shape caused by ductile fragmentation;f = subrounded particle with quenching crack structures caused by contact of the hot fragment with liquid water; g =particle showing an elongated shape of the type of Pele’s hairs caused by free air ductile fragmentation.
ECV 5 - 4 BUTTNER ET AL.: THERMOHYDRAULIC EXPLOSIONS
BUTTNER ET AL.: THERMOHYDRAULIC EXPLOSIONS ECV 5 - 5
Finally, about one ms after the trigger the reacting waterreaches a critical state and transforms into superheatedsteam. Once the steam forms, the thermohydraulic phaseis terminated and the system expands to ambient pressure.The expansion stage is reconstructed in detail by analysis ofthe high-speed cinematography. Melt is accelerated duringrapid expansion, and finally ejected from the cruciblereaching ejection velocities in excess of 100 m/s. In thisphase passive particles form by confined and free air ductilefragmentation. The mechanical energy release duringexpansion represents a small amount of the total mechanicalenergy release.[12] The total mechanical energy release of a typical
experiment was found to be in the range of 6 kJ, including300 to 500 J of kinetic energy released during the expansionphase. The pressure and force signals were found to betypical for thermohydraulic explosions. The materialobtained after each experimental run was completely recov-ered for particle characterization.
4. Investigation of Experimental Particles
[13] As the size of active particles typically is smallerthan 130 mm, SEM studies have to concentrate on that sizerange. Coarser particles were also investigated, to stress theoccurrence and the role of fragmentation mechanisms lead-ing to the formation of passive particles.[14] About 50% of the fine particles have rough surfaces
and angular shapes that result from brittle fragmentation(Figures 3a, 3b, and 3c). They represent active particles, i.e.those related to the most energetic phase of thermohydraulicexplosion and correspond to particle population P3 ofZimanowski et al. [1997a]. Other fine particles from experi-ments have rounded (Figure 3d) or subrounded (Figure 3e)shapes with smooth surfaces and result from fragmentationin a ductile regime under confined conditions that occurredduring the early expansion stage of MFCI, corresponding tothe particle population P1 of Zimanowski et al. [1997a].Some of these particles additionally show quenching crackfeatures (Figure 3f), which are indicative of contact betweenthe still hot fragments with liquid water [Buttner et al.,1999]. Coarser particles typically show elongated smoothshapes (Figure 3g), similar to the Pele’s hairs found in base-surge deposits of La Fossa [Dellino and La Volpe, 2000].They relate to the free air fragmentation in a ductile regimeduring the late expansion phase of MFCI, corresponding tothe particle population P2 of Zimanowski et al. [1997a].Whereas the fine particles did not display any vesicles, veryfew (<5%) of the coarser particles show a few vesicles,typically with a diameter of 10 to 50 mm.[15] The specific surface area of active particles was
determined using the method described by Zimanowski etal. [1997a] and found to be 0.314 m2/g. Using the linearproportionality between the total kinetic energy release of
thermohydraulic explosion experiments and the surface areaof the active particles [Buttner and Zimanowski, 1998] akinetic energy release of 4.4 105 J can be assigned to one kgof active particles.
5. Investigation of Particles From Base-SurgeDeposits of La Fossa
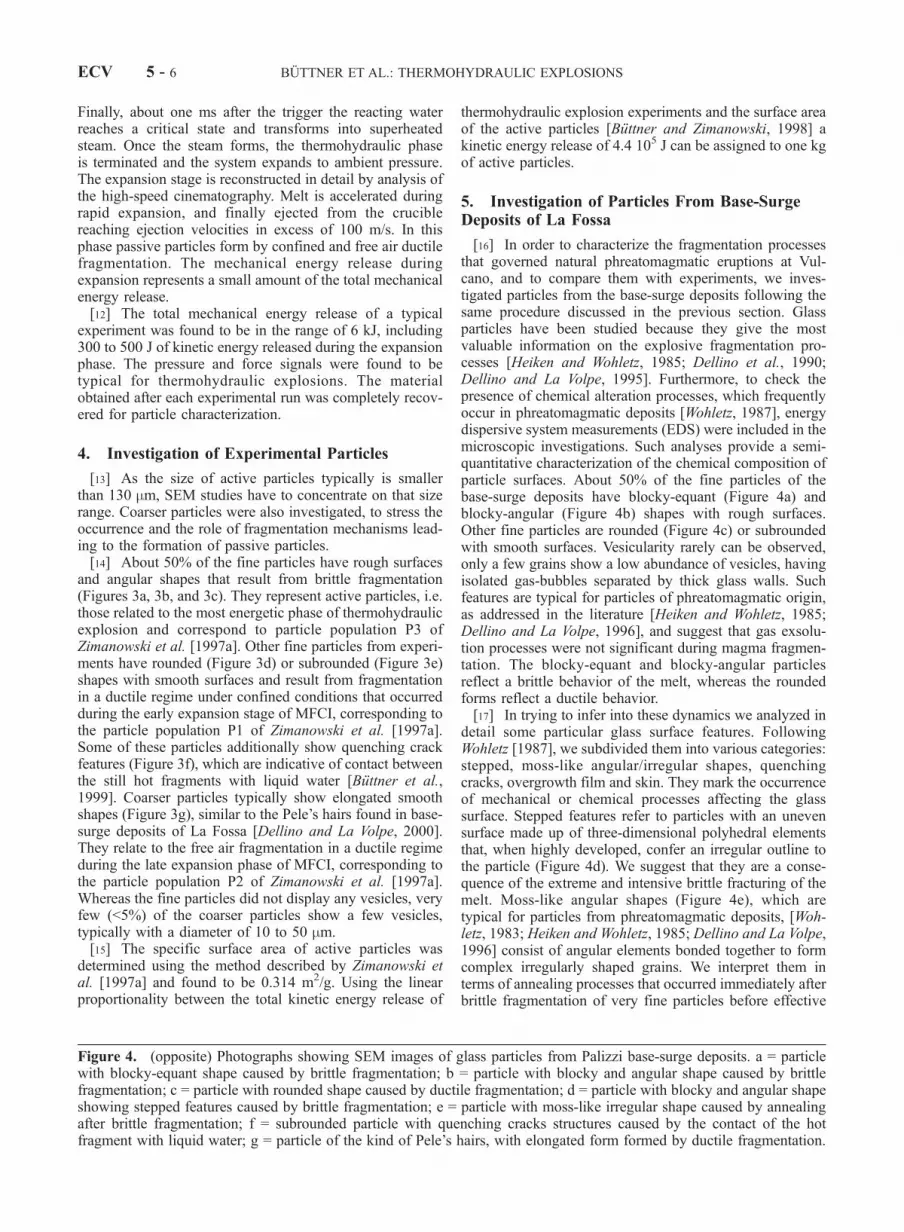
[16] In order to characterize the fragmentation processesthat governed natural phreatomagmatic eruptions at Vul-cano, and to compare them with experiments, we inves-tigated particles from the base-surge deposits following thesame procedure discussed in the previous section. Glassparticles have been studied because they give the mostvaluable information on the explosive fragmentation pro-cesses [Heiken and Wohletz, 1985; Dellino et al., 1990;Dellino and La Volpe, 1995]. Furthermore, to check thepresence of chemical alteration processes, which frequentlyoccur in phreatomagmatic deposits [Wohletz, 1987], energydispersive system measurements (EDS) were included in themicroscopic investigations. Such analyses provide a semi-quantitative characterization of the chemical composition ofparticle surfaces. About 50% of the fine particles of thebase-surge deposits have blocky-equant (Figure 4a) andblocky-angular (Figure 4b) shapes with rough surfaces.Other fine particles are rounded (Figure 4c) or subroundedwith smooth surfaces. Vesicularity rarely can be observed,only a few grains show a low abundance of vesicles, havingisolated gas-bubbles separated by thick glass walls. Suchfeatures are typical for particles of phreatomagmatic origin,as addressed in the literature [Heiken and Wohletz, 1985;Dellino and La Volpe, 1996], and suggest that gas exsolu-tion processes were not significant during magma fragmen-tation. The blocky-equant and blocky-angular particlesreflect a brittle behavior of the melt, whereas the roundedforms reflect a ductile behavior.[17] In trying to infer into these dynamics we analyzed in
detail some particular glass surface features. FollowingWohletz [1987], we subdivided them into various categories:stepped, moss-like angular/irregular shapes, quenchingcracks, overgrowth film and skin. They mark the occurrenceof mechanical or chemical processes affecting the glasssurface. Stepped features refer to particles with an unevensurface made up of three-dimensional polyhedral elementsthat, when highly developed, confer an irregular outline tothe particle (Figure 4d). We suggest that they are a conse-quence of the extreme and intensive brittle fracturing of themelt. Moss-like angular shapes (Figure 4e), which aretypical for particles from phreatomagmatic deposits, [Woh-letz, 1983; Heiken and Wohletz, 1985; Dellino and La Volpe,1996] consist of angular elements bonded together to formcomplex irregularly shaped grains. We interpret them interms of annealing processes that occurred immediately afterbrittle fragmentation of very fine particles before effective
Figure 4. (opposite) Photographs showing SEM images of glass particles from Palizzi base-surge deposits. a = particlewith blocky-equant shape caused by brittle fragmentation; b = particle with blocky and angular shape caused by brittlefragmentation; c = particle with rounded shape caused by ductile fragmentation; d = particle with blocky and angular shapeshowing stepped features caused by brittle fragmentation; e = particle with moss-like irregular shape caused by annealingafter brittle fragmentation; f = subrounded particle with quenching cracks structures caused by the contact of the hotfragment with liquid water; g = particle of the kind of Pele’s hairs, with elongated form formed by ductile fragmentation.
ECV 5 - 6 BUTTNER ET AL.: THERMOHYDRAULIC EXPLOSIONS
BUTTNER ET AL.: THERMOHYDRAULIC EXPLOSIONS ECV 5 - 7
cooling could act. Quenching cracks are features consistingof a few mm wide fractures, which generally intersect theparticle all over its surface (Figure 4f). They relate to thesudden quenching and consequent contraction of still hotparticles. Such structures also affect rounded or subroundedparticles. The occurrence of quenching cracks is not accom-panied by any differences in the chemical compositioncompared to fresh glass.[18] In the coarse size fraction some elongated grains of
the type of Pele’s hairs (Figure 4g) and Pele’s tears arepresent. They relate to ductile fragmentation likely causedby fast ejection of the melt out of the vent. Some particlesshow a smooth overgrowth film (Figure 5a). The extremedevelopment of such a glass surface structure can lead to theformation of a few mm thick skin (Figure 5b), that some-times gets detached from the underlying part of the glassfragment (Figure 5c). This overgrowth formation is succes-sive to the other glass surface features, as shown in Figure5d. Film and skin show respectively a weak or strongdepletion of alkaline elements compared to fresh glass.Such data point to a process of glass alteration by fluidsthat have leached the highly mobile alkaline elements fromthe surface. As some Pele’s hairs (Figure 5e) and Pele’s tears(Figure 5f) also show the overgrowth features, the formationof such features should be related to a process acting afterfragmentation and ejection of particles out of the volcanicvent.
6. Comparison Between Natural andExperimental Particles and Energy Calculation
[19] Shape and surface textures of experimental andnatural particles are strikingly similar. Active particlesproduced by melt fragmentation in the brittle mode in theexperiments are practically identical to the particles fromthe La Fossa deposits related to fragmentation in the brittlemode. Thus we conclude, that both particle populationsresult from thermohydraulic explosions. Also passive par-ticles formed by melt fragmentation in the ductile regimeare recorded both in natural and experimental products. Thegrain-size spectrum of the particles obtained from experi-ments covers the same range as those from the naturalbase-surge deposits, however, the median of the experi-mentally derived particles is generally coarser than that ofnatural products. This difference should be related to theproperties of base-surge clouds that sort particle sizesduring transport.[20] The most significant difference between natural and
experimental particles is the presence of glass surface alter-ation features, such as film and skin, which occur only onnatural glass particle surfaces. Such features, which record asignificant depletion of the highly mobile alkaline elements,were caused, after our opinion, by thermal fluids that etchedthe glass fragments during transportation and deposition ofthe base-surge cloud. Such processes did not occur duringexperiments because steam and particles were decoupledupon ejection from the crucible and did not stay in closecontact long enough for glass alteration to be effective.[21] To check if active and passive particles can be
distinguished from each other by numerical shape parame-ters, we applied high resolution (600 dpi) image processinganalysis (IPA), modified after Dellino and La Volpe [1996]
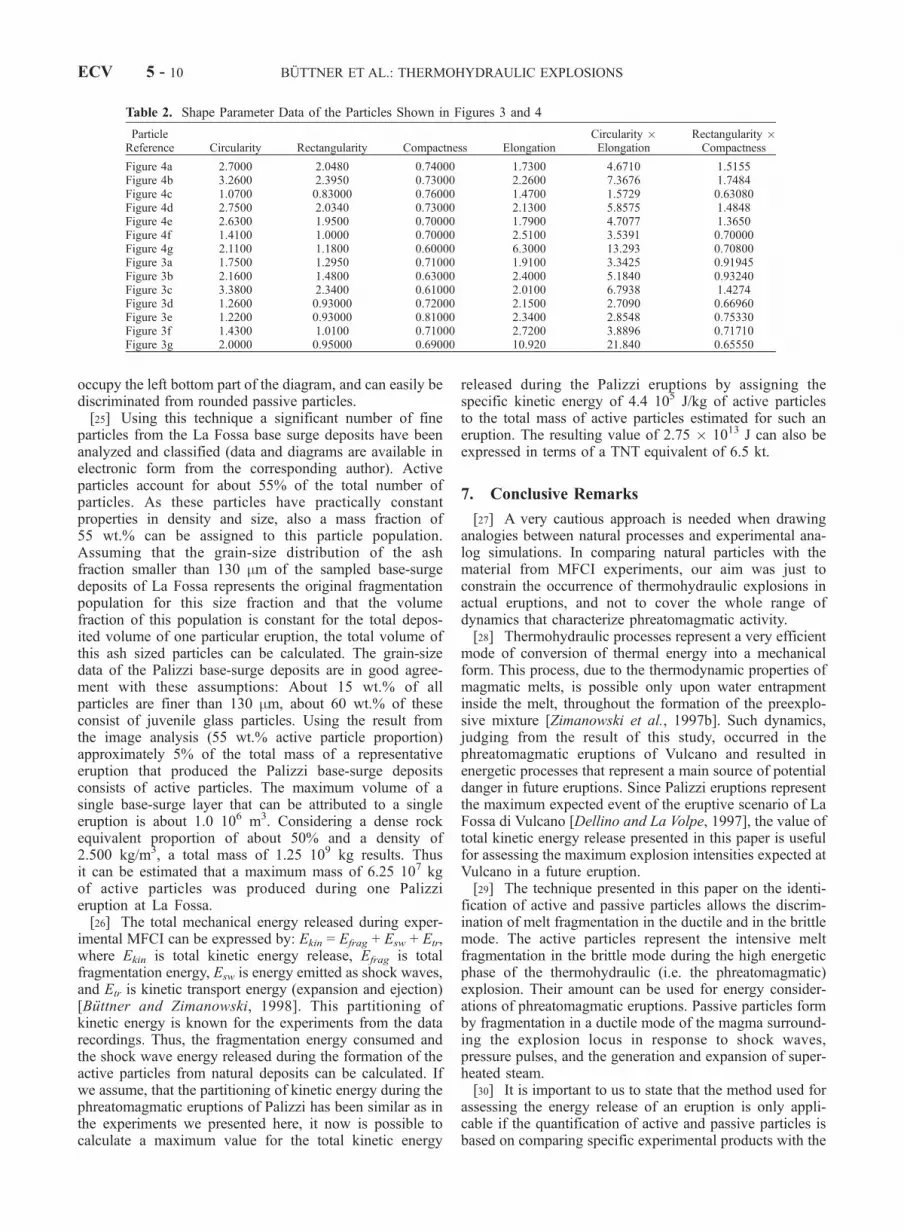
to digital SEM images (see Appendix A). The adimensionalparameters we have used to describe both natural andexperimental particles are: compactness, circularity, elonga-tion, and rectangularity. Such parameters represent ratios ofareas, perimeters and axes. In Table 2, values of the shapeparameters calculated for the experimental and naturalparticles described in Figures 3 and 4 are given. Passiveparticles with a rounded shape and a smooth contour, relatedto melt fragmentation in the ductile regime during confinedsystem expansion, have a circularity value close to 1.Stretched particles due to free air fragmentation in theductile regime have high elongation values. Particles witha regular outline and an isometric form with edges at rightangles, i.e., blocky-equant particles assigned to fragmenta-tion in the brittle mode, have both rectangularity andcompactness close to 1. Particles characterized by a veryangular shape and irregular contour, such as those withstepped features or moss-like shapes that also refer tofragmentation in the brittle mode, have high rectangularityvalues and low compactness values.[22] To check the relevance of shape parameters in repro-
ducing the overall similarity between experimental andnatural particles, we performed statistical t-tests (level ofsignificance a = 0.1) between the sample of particles ofFigure 3 and the sample of particles of Figure 4. Nosignificant differences resulted between the two samplesfor any of the four shape parameters. Furthermore, wechecked the relevance of shape parameters to reproducethe morphological differences between particles related tobrittle versus ductile fragmentation processes, i.e. to discrim-inate between active and passive particles. We performedstatistical t-tests between a sample of particles, both fromexperiments and natural deposits, related to brittle fragmen-tation (Figures 3a, 3b, 3c, 4a, 4b, 4d, and 4e) and a sample ofparticles related to ductile fragmentation (Figures 3d, 3e, 3f,3g, 4c 4f, and 4g). Three out of the four parameters(circularity, rectangularity and elongation) showed signifi-cant differences between samples, stressing a good discrim-ination power in term of fragmentation processes.Compactness showed no significant differences, probablybecause it ranges between low values for highly irregularactive particles and high values for less irregular activeparticles, thus covering the same range as that of passiveparticles.[23] In summary (see also Appendix A for further anal-
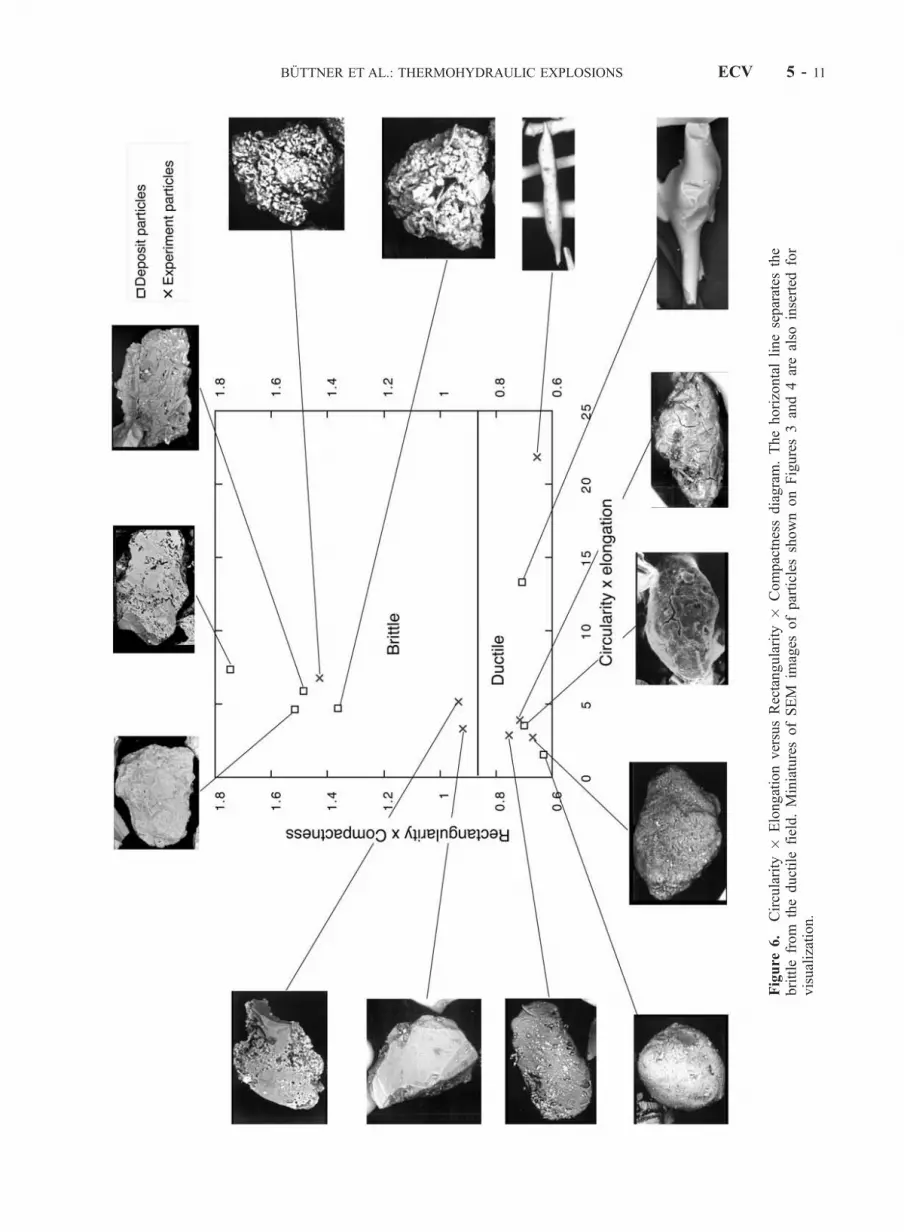
ysis), the product of circularity and elongation welldescribes particles formed by ductile melt fragmentation,and the product of rectangularity and compactness welldescribes particles formed by brittle melt fragmentation.[24] Data points are plotted on the circularity� elongation
versus rectangularity � compactness diagram of Figure 6,and miniatures of particle images are included, to allow alsovisualization. In particular elongated particles, like Pele’shairs, from deposits and experiments, which refer to free airductile fragmentation, occupy nearby positions on the bot-tom part of the diagram. Rounded and subrounded particles,both from deposits and experiments, which refer to confinedductile fragmentation, plot on the bottom left side of thediagram. Particles related to brittle fragmentation occupydistinct positions on the diagram. Blocky-angular particleswith stepped features and moss-like shapes occupy thetopmost part. Finally, blocky particles with a regular outline,
ECV 5 - 8 BUTTNER ET AL.: THERMOHYDRAULIC EXPLOSIONS
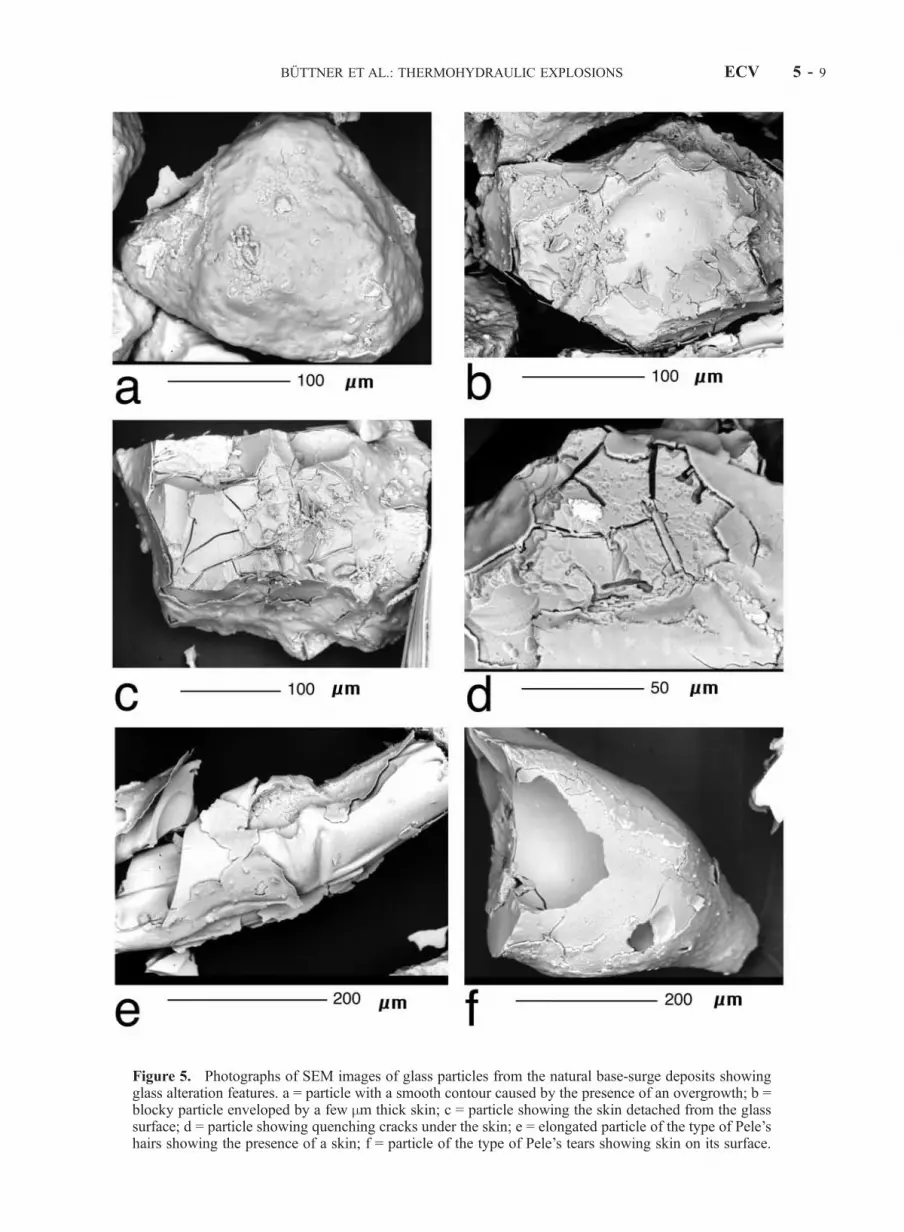
Figure 5. Photographs of SEM images of glass particles from the natural base-surge deposits showingglass alteration features. a = particle with a smooth contour caused by the presence of an overgrowth; b =blocky particle enveloped by a few mm thick skin; c = particle showing the skin detached from the glasssurface; d = particle showing quenching cracks under the skin; e = elongated particle of the type of Pele’shairs showing the presence of a skin; f = particle of the type of Pele’s tears showing skin on its surface.
BUTTNER ET AL.: THERMOHYDRAULIC EXPLOSIONS ECV 5 - 9
occupy the left bottom part of the diagram, and can easily bediscriminated from rounded passive particles.[25] Using this technique a significant number of fine
particles from the La Fossa base surge deposits have beenanalyzed and classified (data and diagrams are available inelectronic form from the corresponding author). Activeparticles account for about 55% of the total number ofparticles. As these particles have practically constantproperties in density and size, also a mass fraction of55 wt.% can be assigned to this particle population.Assuming that the grain-size distribution of the ashfraction smaller than 130 mm of the sampled base-surgedeposits of La Fossa represents the original fragmentationpopulation for this size fraction and that the volumefraction of this population is constant for the total depos-ited volume of one particular eruption, the total volume ofthis ash sized particles can be calculated. The grain-sizedata of the Palizzi base-surge deposits are in good agree-ment with these assumptions: About 15 wt.% of allparticles are finer than 130 mm, about 60 wt.% of theseconsist of juvenile glass particles. Using the result fromthe image analysis (55 wt.% active particle proportion)approximately 5% of the total mass of a representativeeruption that produced the Palizzi base-surge depositsconsists of active particles. The maximum volume of asingle base-surge layer that can be attributed to a singleeruption is about 1.0 106 m3. Considering a dense rockequivalent proportion of about 50% and a density of2.500 kg/m3, a total mass of 1.25 109 kg results. Thusit can be estimated that a maximum mass of 6.25 107 kgof active particles was produced during one Palizzieruption at La Fossa.[26] The total mechanical energy released during exper-
imental MFCI can be expressed by: Ekin = Efrag + Esw + Etr,where Ekin is total kinetic energy release, Efrag is totalfragmentation energy, Esw is energy emitted as shock waves,and Etr is kinetic transport energy (expansion and ejection)[Buttner and Zimanowski, 1998]. This partitioning ofkinetic energy is known for the experiments from the datarecordings. Thus, the fragmentation energy consumed andthe shock wave energy released during the formation of theactive particles from natural deposits can be calculated. Ifwe assume, that the partitioning of kinetic energy during thephreatomagmatic eruptions of Palizzi has been similar as inthe experiments we presented here, it now is possible tocalculate a maximum value for the total kinetic energy
released during the Palizzi eruptions by assigning thespecific kinetic energy of 4.4 105 J/kg of active particlesto the total mass of active particles estimated for such aneruption. The resulting value of 2.75 � 1013 J can also beexpressed in terms of a TNT equivalent of 6.5 kt.
7. Conclusive Remarks
[27] A very cautious approach is needed when drawinganalogies between natural processes and experimental ana-log simulations. In comparing natural particles with thematerial from MFCI experiments, our aim was just toconstrain the occurrence of thermohydraulic explosions inactual eruptions, and not to cover the whole range ofdynamics that characterize phreatomagmatic activity.[28] Thermohydraulic processes represent a very efficient
mode of conversion of thermal energy into a mechanicalform. This process, due to the thermodynamic properties ofmagmatic melts, is possible only upon water entrapmentinside the melt, throughout the formation of the preexplo-sive mixture [Zimanowski et al., 1997b]. Such dynamics,judging from the result of this study, occurred in thephreatomagmatic eruptions of Vulcano and resulted inenergetic processes that represent a main source of potentialdanger in future eruptions. Since Palizzi eruptions representthe maximum expected event of the eruptive scenario of LaFossa di Vulcano [Dellino and La Volpe, 1997], the value oftotal kinetic energy release presented in this paper is usefulfor assessing the maximum explosion intensities expected atVulcano in a future eruption.[29] The technique presented in this paper on the identi-
fication of active and passive particles allows the discrim-ination of melt fragmentation in the ductile and in the brittlemode. The active particles represent the intensive meltfragmentation in the brittle mode during the high energeticphase of the thermohydraulic (i.e. the phreatomagmatic)explosion. Their amount can be used for energy consider-ations of phreatomagmatic eruptions. Passive particles formby fragmentation in a ductile mode of the magma surround-ing the explosion locus in response to shock waves,pressure pulses, and the generation and expansion of super-heated steam.[30] It is important to us to state that the method used for
assessing the energy release of an eruption is only appli-cable if the quantification of active and passive particles isbased on comparing specific experimental products with the
Table 2. Shape Parameter Data of the Particles Shown in Figures 3 and 4
ECV 5 - 10 BUTTNER ET AL.: THERMOHYDRAULIC EXPLOSIONS
Figure
6.
Circularity
�ElongationversusRectangularity
�Compactnessdiagram.Thehorizontallineseparates
the
brittle
from
theductilefield.MiniaturesofSEM
images
ofparticles
shownonFigures3and4arealso
inserted
for
visualization.
BUTTNER ET AL.: THERMOHYDRAULIC EXPLOSIONS ECV 5 - 11
respective natural particles. The resulting discriminatingdiagram therefore is only applicable to that specific erup-tion. In future we will try to use this method also on highlyvesiculated particles, which typically occur in deposits ofsilicic compositions, to test its general applicability to alltypes of phreatomagmatic eruptions.
Appendix A
[31] In this section the shape parameters used in this paperto describe particles morphology are defined. Their ability todiscriminate between particles related to different fragmen-tation processes is also discussed with graphical examples.
Compactness is defined by the ratio :Particle area
Breadth�Width:
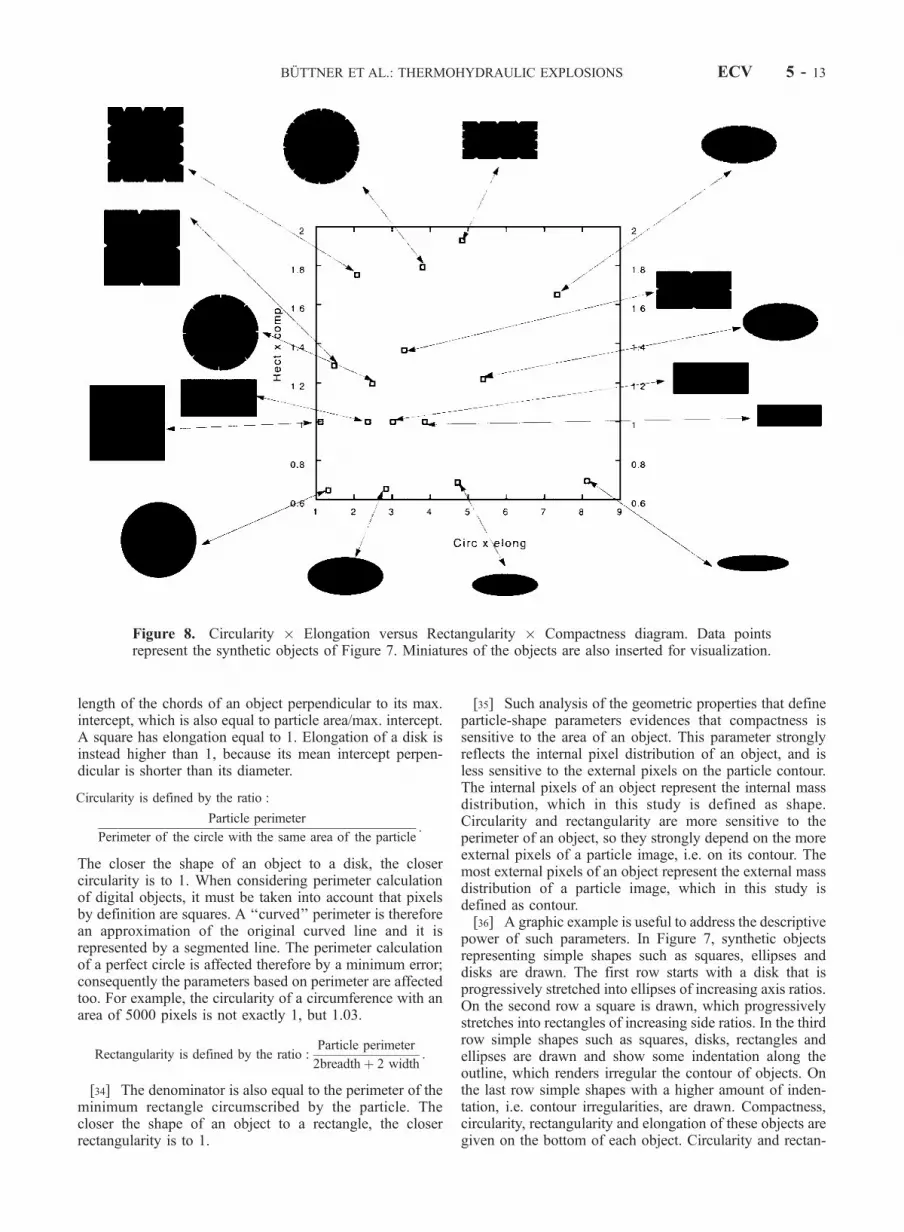
[32] Breadth is the distance between the leftmost andrightmost pixels of a digital object, which is also equal tothe horizontal side of the smallest rectangle circumscribedby that object. Width is the distance between the upper-most and lowermost pixels of an object, which is alsoequal to the vertical side of the smallest rectangle circum-scribed by that object. The denominator is also equal to thearea of the minimum rectangle circumscribed by the object.The compactness value belongs to the interval 0–1: thecloser the shape of an object to a rectangle, the closer to 1is compactness.
Elongation is defined by the ratio :Max: intercept
Mean intercept perpendicular:
[33] Max. intercept is the length of the longest segment inan object. The mean intercept perpendicular is the mean
Figure 7. Chart of synthetic objects with the respective shape parameters.
ECV 5 - 12 BUTTNER ET AL.: THERMOHYDRAULIC EXPLOSIONS
length of the chords of an object perpendicular to its max.intercept, which is also equal to particle area/max. intercept.A square has elongation equal to 1. Elongation of a disk isinstead higher than 1, because its mean intercept perpen-dicular is shorter than its diameter.
Circularity is defined by the ratio :
Particle perimeter
Perimeter of the circle with the same area of the particle:
The closer the shape of an object to a disk, the closercircularity is to 1. When considering perimeter calculationof digital objects, it must be taken into account that pixelsby definition are squares. A ‘‘curved’’ perimeter is thereforean approximation of the original curved line and it isrepresented by a segmented line. The perimeter calculationof a perfect circle is affected therefore by a minimum error;consequently the parameters based on perimeter are affectedtoo. For example, the circularity of a circumference with anarea of 5000 pixels is not exactly 1, but 1.03.
Rectangularity is defined by the ratio :Particle perimeter
2breadthþ 2 width:
[34] The denominator is also equal to the perimeter of theminimum rectangle circumscribed by the particle. Thecloser the shape of an object to a rectangle, the closerrectangularity is to 1.
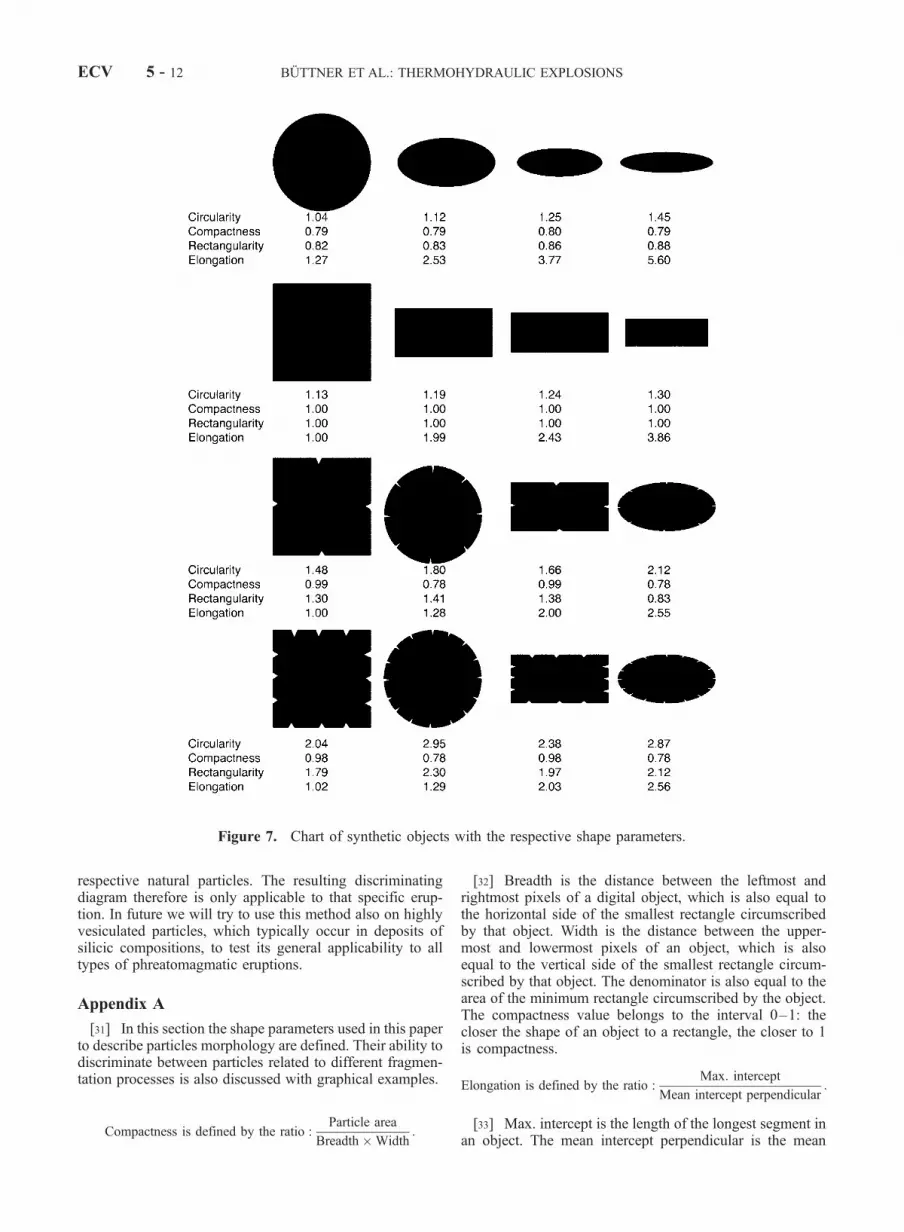
[35] Such analysis of the geometric properties that defineparticle-shape parameters evidences that compactness issensitive to the area of an object. This parameter stronglyreflects the internal pixel distribution of an object, and isless sensitive to the external pixels on the particle contour.The internal pixels of an object represent the internal massdistribution, which in this study is defined as shape.Circularity and rectangularity are more sensitive to theperimeter of an object, so they strongly depend on the moreexternal pixels of a particle image, i.e. on its contour. Themost external pixels of an object represent the external massdistribution of a particle image, which in this study isdefined as contour.[36] A graphic example is useful to address the descriptive
power of such parameters. In Figure 7, synthetic objectsrepresenting simple shapes such as squares, ellipses anddisks are drawn. The first row starts with a disk that isprogressively stretched into ellipses of increasing axis ratios.On the second row a square is drawn, which progressivelystretches into rectangles of increasing side ratios. In the thirdrow simple shapes such as squares, disks, rectangles andellipses are drawn and show some indentation along theoutline, which renders irregular the contour of objects. Onthe last row simple shapes with a higher amount of inden-tation, i.e. contour irregularities, are drawn. Compactness,circularity, rectangularity and elongation of these objects aregiven on the bottom of each object. Circularity and rectan-
Figure 8. Circularity � Elongation versus Rectangularity � Compactness diagram. Data pointsrepresent the synthetic objects of Figure 7. Miniatures of the objects are also inserted for visualization.
BUTTNER ET AL.: THERMOHYDRAULIC EXPLOSIONS ECV 5 - 13
gularity are very sensitive to the irregularity of an objectcontour, whereas compactness is not strongly influenced bycontour irregularity. Compactness is therefore more repre-sentative of the internal mass distribution of a particle, itmeans that if an object has a very high value, it can bereduced to a rectangular or square shape, independently ofhow irregular or crenulated its contour is. Elongationincreases at increasing stretching of forms. It is 1 for asquare, 1.27 for a disk. A diagram where the product ofcircularity and elongation is plotted against the product ofrectangularity and compactness is proposed to discriminateobjects in terms of both, differences in shape and contour. Totest the discriminating power of this diagram, the data andminiatures of the objects of Figure 7 are plotted in Figure 8.
[37] Acknowledgments. This research has been carried out in thecontext of the EC project ENV4-CT98-0703: ‘‘The physics of explosivevolcanism’’, funded by the European Community, which is acknowledged.Larry Mastin, being the associated editor, Ken Wohletz, and Oliver Spielerare gratefully acknowledged for the review of the paper.[38] Part of the research has been funded by a CNR-GNV grant, project
96.00855.PF62.
ReferencesButtner, R., and B. Zimanowski, Physics of thermo hydraulic explosions,Phys. Rev. E, 57, 5726–5729, 1998.
Buttner, R., P. Dellino, and B. Zimanowski, Identifying modes of magma/water interaction from the surface features of ash particles, Nature, 401,688–690, 1999.
Buttner, R., B. Zimanowski, C. Lenk, A. Koopmann, and V. Lorenz, De-termination of thermal conductivity of natural silicate melts, Appl. Phys.Lett., 77, 1810–1812, 2000.
Cioni, R., A. Sbrana, and R. Vecci, Morphologic features of juvenile pyr-oclasts from magmatic and phreatomagmatic deposits of Vesuvius,J. Volcanol. Geotherm. Res., 51, 61–78, 1992.
De Astis, G., L. La Volpe, A. Peccerillo, and L. Civetta, Volcanological andpetrological evolution of Vulcano island (Aeolian Arc, southern Tyrrhe-nian Sea), J. Geophys. Res., 102, 8021–8050, 1997.
Dellino, P., and L. La Volpe, Fragmentation versus transportation mechan-isms in the pyroclastic sequence of Monte Pilato—Rocche Rosse (Lipari,Italy), J. Volcanol. Geotherm. Res., 64, 211–232, 1995.
Dellino, P., and L. La Volpe, Image processing analysis in reconstructingfragmentation and transportation mechanisms of pyroclastic deposits. Thecase of Monte Pilato—Rocche Rosse eruptions, Lipari (Aeolian is-lands—Italy), J. Volcanol. Geotherm. Res., 71, 13–29, 1996.
Dellino, P., and L. La Volpe, Stratigrafia, dinamiche eruttive e deposizio-nali, scenario eruttivo e valutazioni di pericolosita a La Fossa di Vulcano,C.N.R. Gruppo Nazionale per la Vulcanologia, volume speciale Vulcano,pp. 207–213, Felici Editore, Pisa, 1997.
Dellino, P., and L. La Volpe, Structures and grain-size distribution in surgedeposits as a tool for modelling the dynamics of dilute pyroclastic densitycurrents at La Fossa di Vulcano (Aeolian Islands, Italy), J. Volcanol.Geotherm. Res., 94, 57–78, 2000.
Dellino, P., G. Frazzetta, and L. La Volpe, Wet surge deposits at La Fossa diVulcano: Depositional and eruptive mechanisms, J. Volcanol. Geotherm.Res., 43, 215–233, 1990.
De Rosa, R., G. Frazzetta, and L. La Volpe, An approach for investigatingthe depositional mechanism of fine-grained surge deposits. The exampleof the dry surge deposits at ‘‘La Fossa di Vulcano’’, J. Volcanol.Geotherm. Res., 51, 305–321, 1992.
Duffield, W. A., Jr., E. K. Gibson, and G. H. Heiken, Some characteristicsof Pele’s hair, J. Res. U. S. Geol. Surv., 5(1), 93–101, 1977.
Frazzetta, G., L. La Volpe, and M. F. Sheridan, Evolution of the Fossa cone,Vulcano, J. Volcanol. Geotherm. Res., 17, 329–360, 1983.
Gioncada, A., R. Clocchiatti, A. Sbrana, P. Bottazzi, D. Massare, andL. Ottolini, A study of melt inclusions at Vulcano (Aeolian Islands, Italy):Insights on the primitive magmas and on the volcanic feeding system,Bull. Volcanol., 60, 286–306, 1998.
Heiken, G., An atlas of volcanic ash, Smithson. Contrib. Earth Sci., 12, 1–101, 1974.
Heiken, G., and K. H. Wohletz, Volcanic Ash, 246 pp., Univ. of Calif. Press,Berkeley, 1985.
Houghton, B. F., and R. T. Smith, Recycling of magmatic clasts duringexplosive eruptions: Estimating the true juvenile content of phreatomag-matic volcanic deposits, Bull. Volcanol., 55, 414–420, 1993.
Inman, D. L., Measures of describing the size distribution of sediments,J. Sediment. Petrol., 22, 125–145, 1952.
Kobayashi, Y., T. Watanabe, and N. Nagai, Vapor condensation behind ashock wave propagating through a large molecular-mass medium, ShockWaves, 5, 287–292, 1996.
Macdonald, G. A., Volcanoes, 510 pp., Prentice-Hall, Old Tappan, N. J.,1972.
Moore, J. G., K. Nakamura, and A. Alcaraz, The 1965 eruption of Taalvolcano, Science, 151, 955–960, 1966.
Shimozuru, D., Physical parameters governing the formation of Pele’s hairand tears, Bull. Volcanol., 56, 217–219, 1994.
Thorarinsson, S., Surtsey—The New Island in the North Atlantic, pp. 1–47,Viking Press, New York, 1967.
Waters, A. C., and R. W. Fisher, Base surges and their deposits: Capelinhosand Taal volcanoes, J. Geophys. Res., 76, 5596–5614, 1971.
Wohletz, K. H., Mechanisms of hydrovolcanic pyroclast formation: Grain-size, scanning electron microscopy, and experimental studies, J. Volcanol.Geotherm. Res., 17, 31–64, 1983.
Wohletz, K. H., Chemical and textural surface features of pyroclasts fromhydrovolcanic eruption sequences, in Clastic Particles, edited byR. Marshall, pp. 79–97, Van Nostrand Reinhold, New York, 1987.
Wohletz, K. H., and M. F. Sheridan, Hydrovolcanic explosions, 2, Evolu-tion of basaltic tuff rings and tuff cones, Am. J. Sci., 283, 385–413,1983.
Wohletz, K. H., M. F. Sheridan, and W. K. Brown, Particle size distributionand the sequential fragmentation/transport theory applied to volcanic ash,J. Geophys. Res., 94, 15,703–15,721, 1989.
Wohletz, K. H., R. McQueen, and M. Morrisey, Experimental study ofhydrovolcanism by fuel–coolant interaction analogs, in Intense Multi-phase Interactions, Proceedings of US (NSF) Japan (JSPS) Joint Semi-nar, Santa Barbara, CA, June 8–13, edited by T. G. Teofanous andM. Akijama, pp. 287–317, 1995.
Zimanowski, B., V. Lorenz, and G. Frohlich, Experiments on phreatomag-matic explosions with silicate and carbonatitic melts, J. Volcanol.Geotherm. Res., 30, 149–153, 1986.
Zimanowski, B., G. Frohlich, and V. Lorenz, Quantitative experiments onphreatomagmatic explosions, J. Volcanol. Geotherm. Res., 48, 341–358,1991.
Zimanowski, B., R. Buttner, V. Lorenz, and H. G. Hafele, Fragmentation ofbasaltic melt in the course of explosive volcanism, J. Geophys. Res., 102,803–814, 1997a.
Zimanowski, B., R. Buttner, and V. Lorenz, Premixing of magma and waterin MFCI experiments, Bull. Volcanol., 58, 491–495, 1997b.
Zimanowski, B., R. Buttner, and J. Nestler, Brittle reaction of a high tem-perature ion melt, Europhys. Lett., 38, 285–289, 1997c.
�����������R. Buttner, V. Lorenz, and B. Zimanowski, Physikalisch Vulkanologisches
Labor, Institut fur Geologie, Universitat Wurzburg, Pleicherwall 1, 97070,Wurzburg, Germany.P. Dellino and L. La Volpe, Dipartimento Geomineralogico, Universita