FIRST-ORDER DRAFT IPCC WGII AR5 Chapter 19 Do Not Cite, Quote, or Distribute 1 11 June 2012 Chapter 19. Emergent Risks and Key Vulnerabilities 1 2 Coordinating Lead Authors 3 Michael Oppenheimer (USA), Maximiliano Campos (Costa Rica) 4 5 Lead Authors 6 Joern Birkmann (Germany), George Luber (USA), Brian O’Neill (USA), Kiyoshi Takahashi (Japan), Rachel Warren 7 (UK) 8 9 Contributing Authors 10 Franz Berkhout (Netherlands), Pauline Dube (Botswana), Wendy Foden (South Africa), Stefan Greiving (Germany), 11 Solomon Hsiang (USA), Klaus Keller (USA), Joan Kleypas (USA), Robert Kopp (USA), Carlos Peres (UK), Jeff 12 Price (UK), Alan Robock (USA), Wolfram Schlenker (USA), Richard Tol (UK) 13 14 Review Editors 15 Mike Brklacich (Canada), Sergey Semenov (Russian Federation) 16 17 Chapter Scientist 18 Solomon Hsiang (USA) 19 20 21 Contents 22 23 Executive Summary 24 25 19.1. Purpose, Scope, and Structure of the Chapter 26 19.1.1. Historical Development of this Chapter 27 19.1.2. The Special Report on Managing the Risks of Extreme Events and Disasters to Advance Climate 28 Change Adaptation (SREX) 29 19.1.3. New Developments in this Chapter 30 31 19.2. Framework for Identifying Key Vulnerabilities, Key Risks, and Emergent Risks 32 19.2.1. Risk and Vulnerability 33 19.2.2. Criteria for Identifying Key Vulnerabilities and Key Risks 34 19.2.2.1. Criteria for Identifying Key Vulnerabilities 35 19.2.2.2. Criteria for Identifying Key Risks 36 19.2.3. Criteria for Identifying Emergent Risks 37 19.2.4. Identifying Key and Emergent Risks under Alternative Development Pathways 38 19.2.5. Assessing Key Vulnerabilities and Emergent Risks 39 40 19.3. Emergent Risk: Multiple Interacting Systems and Stresses 41 19.3.1. Limitations of Previous Approaches Imply Key Risks Overlooked 42 19.3.2. Emergent Risks 43 19.3.2.1. Emergent Risks Arising from the Effects of Degradation of Ecosystem Services by 44 Climate Change 45 19.3.2.2. Emergent Risk Involving Non-Climate Stressors: the Management of Water, Land, and 46 Energy 47 19.3.2.3. Emergent Risks Involving Health Effects and Disease Emergence 48 19.3.2.4. Spatial Convergence of Multiple Impacts: Hotspots 49 19.3.2.5. Maladaptation 50 51 19.4. Emergent Risk: Indirect, Trans-Boundary, and Long-Distance Impacts 52 19.4.1. Indirect, Trans-Boundary, and Long-Distance Impacts of Climate Change Impacts on Agricultural 53 Yields: Food Trade Patterns, Prices, Malnutrition 54
Transcript
FIRST-ORDER DRAFT IPCC WGII AR5 Chapter 19
Do Not Cite, Quote, or Distribute 1 11 June 2012
Chapter 19. Emergent Risks and Key Vulnerabilities 1 2 Coordinating Lead Authors 3 Michael Oppenheimer (USA), Maximiliano Campos (Costa Rica) 4 5 Lead Authors 6 Joern Birkmann (Germany), George Luber (USA), Brian O’Neill (USA), Kiyoshi Takahashi (Japan), Rachel Warren 7 (UK) 8 9 Contributing Authors 10 Franz Berkhout (Netherlands), Pauline Dube (Botswana), Wendy Foden (South Africa), Stefan Greiving (Germany), 11 Solomon Hsiang (USA), Klaus Keller (USA), Joan Kleypas (USA), Robert Kopp (USA), Carlos Peres (UK), Jeff 12 Price (UK), Alan Robock (USA), Wolfram Schlenker (USA), Richard Tol (UK) 13 14 Review Editors 15 Mike Brklacich (Canada), Sergey Semenov (Russian Federation) 16 17 Chapter Scientist 18 Solomon Hsiang (USA) 19 20 21 Contents 22 23 Executive Summary 24 25 19.1. Purpose, Scope, and Structure of the Chapter 26
19.1.1. Historical Development of this Chapter 27 19.1.2. The Special Report on Managing the Risks of Extreme Events and Disasters to Advance Climate 28
Change Adaptation (SREX) 29 19.1.3. New Developments in this Chapter 30
31 19.2. Framework for Identifying Key Vulnerabilities, Key Risks, and Emergent Risks 32
19.2.1. Risk and Vulnerability 33 19.2.2. Criteria for Identifying Key Vulnerabilities and Key Risks 34
19.2.2.1. Criteria for Identifying Key Vulnerabilities 35 19.2.2.2. Criteria for Identifying Key Risks 36
19.2.3. Criteria for Identifying Emergent Risks 37 19.2.4. Identifying Key and Emergent Risks under Alternative Development Pathways 38 19.2.5. Assessing Key Vulnerabilities and Emergent Risks 39
40 19.3. Emergent Risk: Multiple Interacting Systems and Stresses 41
19.3.2.1. Emergent Risks Arising from the Effects of Degradation of Ecosystem Services by 44 Climate Change 45
19.3.2.2. Emergent Risk Involving Non-Climate Stressors: the Management of Water, Land, and 46 Energy 47
19.3.2.3. Emergent Risks Involving Health Effects and Disease Emergence 48 19.3.2.4. Spatial Convergence of Multiple Impacts: Hotspots 49 19.3.2.5. Maladaptation 50
51 19.4. Emergent Risk: Indirect, Trans-Boundary, and Long-Distance Impacts 52
19.4.1. Indirect, Trans-Boundary, and Long-Distance Impacts of Climate Change Impacts on Agricultural 53 Yields: Food Trade Patterns, Prices, Malnutrition 54
FIRST-ORDER DRAFT IPCC WGII AR5 Chapter 19
Do Not Cite, Quote, or Distribute 2 11 June 2012
19.4.2. Indirect, Trans-boundary, and Long-Distance Impacts of Adaptation 1 19.4.2.1. Human Migration and Displacement 2 19.4.2.2. Conflict and Insecurity 3 19.4.2.3. Species Range Shifts: Consequences 4
19.4.3. Indirect, Trans-Boundary, and Long-Distance Impacts of Mitigation Measures 5 19.4.3.1. Effects on Biodiversity 6 19.4.3.2. Effects on Human Systems 7 19.4.3.3. Indirect Effects of Biofuels Production via Markets 8
9 19.5. Other Emergent Risks 10
19.5.1. Risks from a Large Temperature Rise 11 19.5.2. Risks from Ocean Acidification 12 19.5.3. Risks from CO2 Health Effects 13 19.5.4. Risks from Geo-Engineering (Solar Radiation Management) 14
15 19.6. Key Vulnerabilities, Key Risks, and Reasons of Concern 16
19.6.2. Key Risks 22 19.6.2.1. The Role of Adaptation and Alternative Development Pathways 23 19.6.2.2. Relationship between Adaptation, Mitigation, and Residual Impacts at Regional and 24
Sectoral Levels 25 19.6.3. Updating Reasons for Concern 26
19.6.3.1. Unique and Threatened Systems 27 19.6.3.2. Extreme Events 28 19.6.3.3. Distribution of Impacts 29 19.6.3.4. Aggregate Impacts 30 19.6.3.5. Large-Scale Singular Events: Physical, Ecological, and Social System Thresholds and 31
Irreversible Change 32 19.6.3.6. Variations in RFCs across Socio-Economic Pathways 33
34 19.7. Assessment of Response Strategies to Manage these Risks 35
19.7.1. Relationship between Adaptation Efforts, Mitigation Efforts, and Residual Impacts 36 19.7.2. Limitations of Response Strategies 37
19.7.2.1. Limits to Mitigation 38 19.7.2.2. Limits to Adaptation 39
19.7.3. Avoiding Thresholds, Irreversible Change, and Large-Scale Singularities in the Earth System 40 19.7.4. Avoiding Tipping Points in Social/Ecological Systems 41 19.7.5. Governance and Adaptation Strategies 42
43 Frequently Asked Questions 44 45 References 46 47 48 Executive Summary 49 50 A focal point of this chapter is the interaction of the changing physical characteristics of the climate system with 51 evolving characteristics of socioeconomic and biological systems (exposure and vulnerability) to produce risk. 52 53
FIRST-ORDER DRAFT IPCC WGII AR5 Chapter 19
Do Not Cite, Quote, or Distribute 3 11 June 2012
Key risks arise from high probability of occurrence of a substantial physical impact of climate change or a high 1 degree of exposure and vulnerability to an impact, or both. 2 3 Emergent risks are risks which have only recently emerged in the scientific literature in sufficient detail to permit 4 assessment and which have the potential to become key risks as additional understanding accumulates, i.e. those 5 relevant to interpreting Article 2 of the UN Framework Convention on Climate Change (UNFCCC). 6 7 Key vulnerabilities arise in systems due to one or more of the following characteristics: exposure to physical climate 8 changes, probability of major harm due to exposure, importance of exposed system, limited ability to cope with 9 impacts, limited adaptation capacity, persistence of conditions of high susceptibility to climate stressors, cumulative 10 and interactive stresses. 11 12 Existing frameworks, such as Reasons for Concern and Key Vulnerabilities, for evaluating risks pertinent to Article 13 2 of the UNFCCC are updated here in light of the advances in SREX and the current report’s discussions of 14 vulnerability, human security, and adaptation. 15 16 Alternative development paths influence risk by changing both the likelihood of physical impacts (through their 17 effect on greenhouse gas emissions) and by altering vulnerability and exposure. 18 19 Interactions among climate change impacts in various sectors and regions, and between these impacts and human 20 adaptation in other sectors and regions, as well as interactions between adaptation and mitigation actions, are 21 generally not included, or not well integrated, into projections of climate change impacts. These interactions create 22 emergent risks and/or key vulnerabilities not previously recognized. 23 24 Among these are interactions of climate change with other non-climate factors such as land management, water 25 management, air pollution (which has drivers in common with climate change), energy production (including 26 cultivation of biofuel feed stocks) and diseases. 27 28 A key interaction is that between the impacts of climate change on biodiversity and the impacts of climate change on 29 human systems, where the effects on human systems are increased by the loss of ecosystem services that 30 biodiversity provides such as water and air purification, protection from extreme weather events, preservation of 31 soils, recycling of nutrients, and pollination of crops. 32 33 Spatial convergence of impacts in different sectors can create impact ‘hotspots’ involving new interactions. 34 35 Adaptation designed for one sector interacting with functioning of another sector can create risks (e.g. increasing 36 irrigation to crops in response to a drying climate can exacerbate water stress in downstream areas such as wetlands, 37 in cases where the latter provide important water cleaning services) 38 39 Risks emerge from indirect, trans-boundary, and long-distance impacts of climate change acting on agricultural and 40 energy sectors among others. Impacts of climate change may be transmitted by human responses such as migration 41 and via global markets. An emergent risk is the association of climate change, acting through uncertain channels, 42 with conflict. 43 44 Other emergent risks relate to ocean acidification, geo-engineering, temperature increases above 40C, and indirect 45 health impacts of high ambient concentrations of CO2. 46 47 A large number of key vulnerabilities, key risks, and emergent risks follow from the assessments of individual 48 chapters of this report. Many of these reflect differential vulnerability between groups due to age, wealth, or income 49 status, and deficiencies in governance. 50 51 In updating and revising the Reasons for Concern framework, we find that since AR4, there is new and stronger 52 evidence to support the previous judgment of high confidence that “a warming of up to 2°C above 1990-2000 levels 53 would result in significant impacts on many unique and vulnerable systems, and would likely increase the 54
FIRST-ORDER DRAFT IPCC WGII AR5 Chapter 19
Do Not Cite, Quote, or Distribute 4 11 June 2012
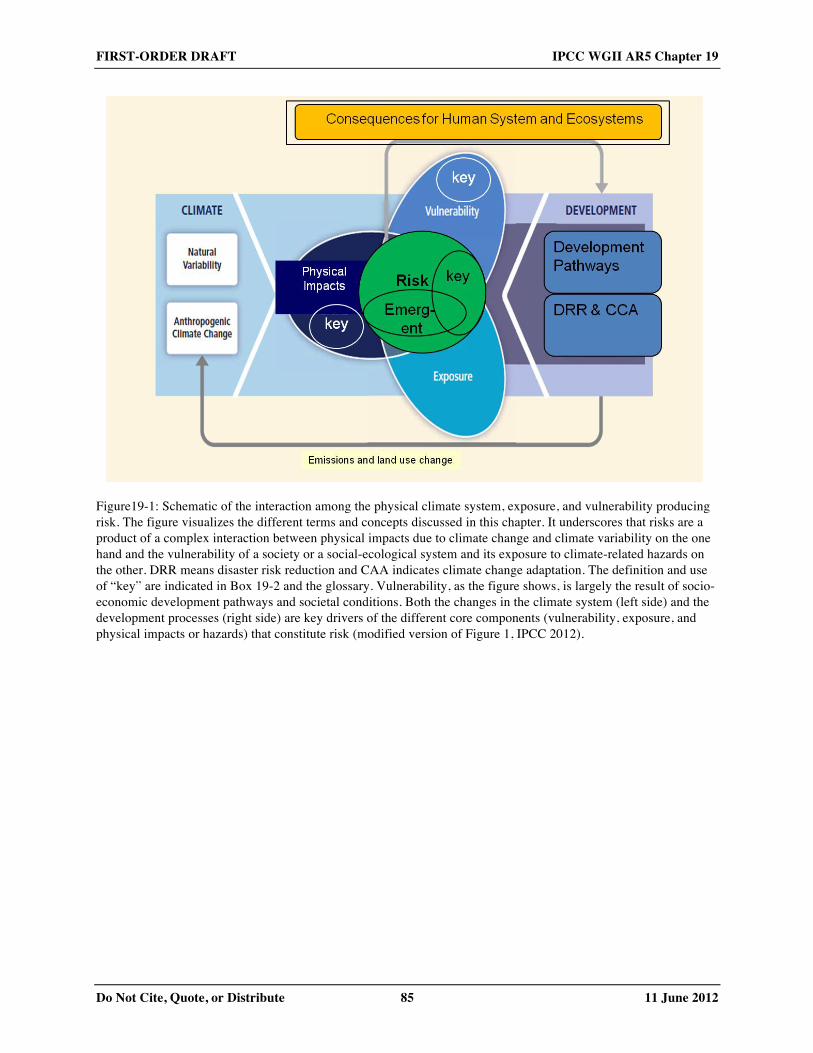
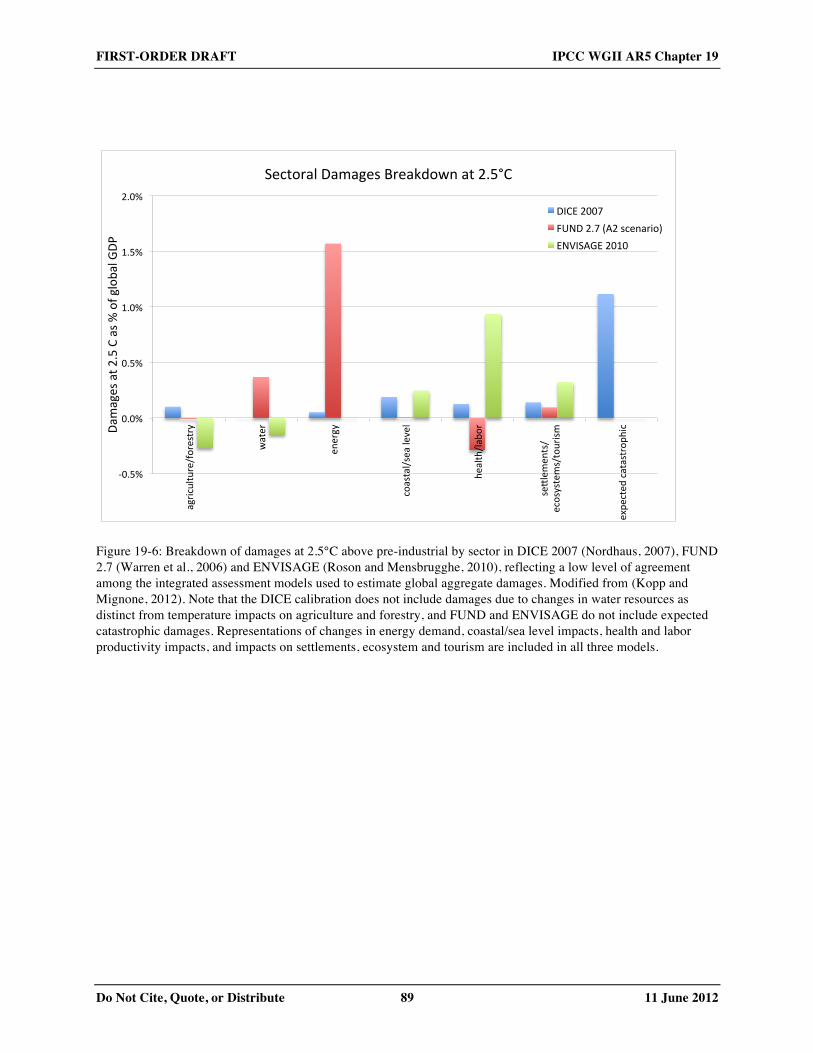
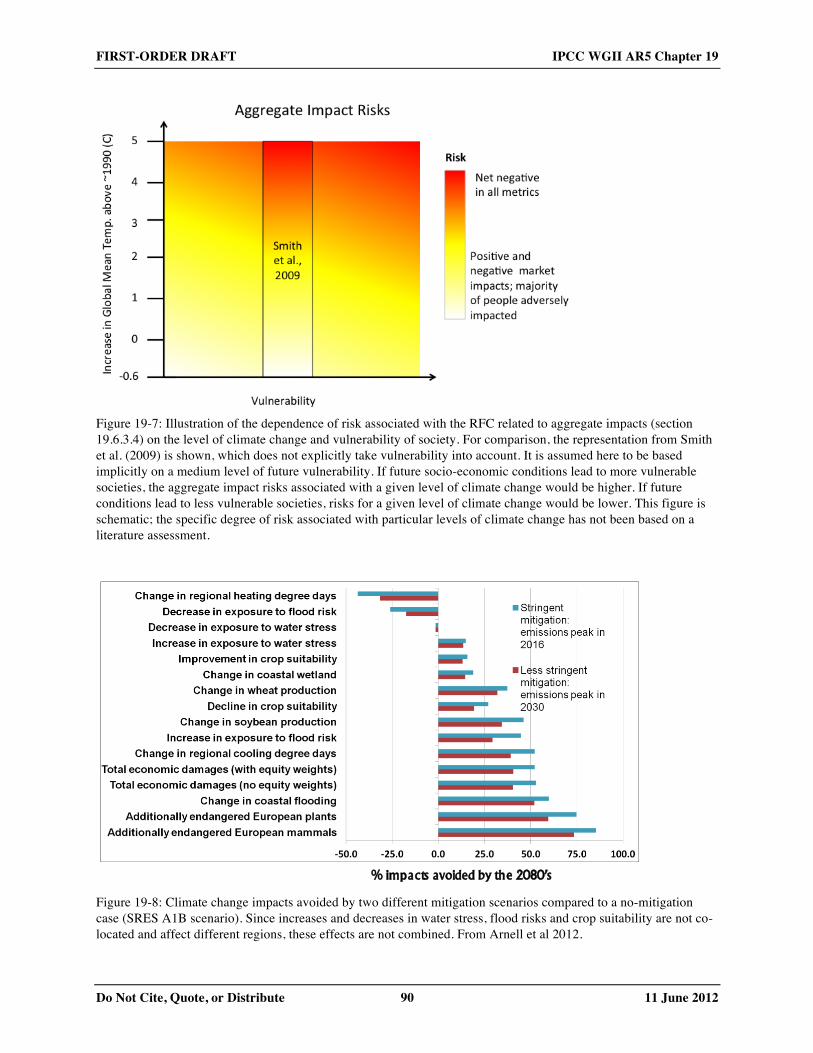
endangered status of many threatened species, with increasing adverse impacts (and increasing confidence in this 1 conclusion) at higher temperatures”. 2 3 Based largely on the findings from SREX, we assess that the overall risk from physical climate characteristics of 4 extreme events has not changed significantly since AR4. However, there is a new appreciation for the importance of 5 exposure and vulnerability, in both developed and developing countries. 6 7 New methods for estimating aggregate impacts have emerged. Consistent with AR4, we judge that there remains 8 high confidence that globally aggregated figures underestimate damages because they cannot include many non-9 quantifiable impacts and there is very high confidence that aggregate estimates of costs mask significant differences 10 in impacts across sectors, regions, countries and populations. 11 12 The determination of key risks as reflected, for example, in the Reasons for Concern has not previously been 13 distinguished across alternative development pathways. The development of risk profiles from Shared 14 Socioeconomic Pathways and Representative Concentration Pathways is an important area of research that can lead 15 to improvement in the framework developed in this chapter. 16 17 New methods of estimating the impacts of climate change that may be avoided by mitigation of greenhouse gas 18 emissions have been developed. These show that the avoided impacts are potentially large and increasing over the 19 21st century. Benefits from mitigation are most immediate for ocean acidification, and least immediate for impacts 20 related to sea level rise. 21 22 Mitigation and adaptation possibilities are not unlimited, implying that some degree of risk from residual damages 23 will be unavoidable. For example, no model-based scenarios in the literature demonstrate the feasibility of limiting 24 warming to a maximum of 1.5 C with at least 50% likelihood. 25 26 The design of risk-management strategies could be informed by observation and projection systems that would 27 provide an actionable early warning signal of an approaching threshold response. However, there is low confidence 28 in the feasibility and requirements for such systems since studies to date have been highly simplified and limited in 29 number. 30 31 32 19.1. Purpose, Scope, and Structure of the Chapter 33 34 The objective of this chapter is to assess new literature published since the Fourth Assessment Report on emergent 35 risks and key vulnerabilities to climate change from the perspective of the distribution of risk over geographic 36 location, economic sector, time period, and socioeconomic characteristics of individuals and societies. Frameworks 37 used in previous IPCC reports to assess risk in the context of Article 2 of the UN Framework Convention on Climate 38 Change (UNFCCC) are updated and extended in light of new literature; and additional frameworks arising in recent 39 literature are examined. A focal point of this chapter is the interaction of the changing physical characteristics of the 40 climate system with evolving characteristics of socioeconomic and biological systems (exposure and vulnerability) 41 to produce risk (see Figure 19-1). 42 43 [INSERT FIGURE 19-1 HERE 44 Figure19-1: Schematic of the interaction among the physical climate system, exposure, and vulnerability producing 45 risk. The figure visualizes the different terms and concepts discussed in this chapter. It underscores that risks are a 46 product of a complex interaction between physical impacts due to climate change and climate variability on the one 47 hand and the vulnerability of a society or a social-ecological system and its exposure to climate-related hazards on 48 the other. DRR means disaster risk reduction and CAA indicates climate change adaptation. The definition and use 49 of “key” are indicated in Box 19-2 and the glossary. Vulnerability, as the figure shows, is largely the result of socio-50 economic development pathways and societal conditions. Both the changes in the climate system (left side) and the 51 development processes (right side) are key drivers of the different core components (vulnerability, exposure, and 52 physical impacts or hazards) that constitute risk (modified version of Figure 1, IPCC 2012).] 53 54
FIRST-ORDER DRAFT IPCC WGII AR5 Chapter 19
Do Not Cite, Quote, or Distribute 5 11 June 2012
1 19.1.1. Historical Development of this Chapter 2 3 The Third and Fourth Assessment Reports (TAR and AR4, respectively) each devoted chapters to evaluating the 4 state of knowledge relevant to Article 2 of the UNFCCC (Smith et al 2001, Schneider et al 2007; see Box 19-1). The 5 TAR sorted and aggregated impacts discussed in the literature according to a framework called Reasons for Concern 6 (RFCs), and assessed the level of risk associated with individual impacts of climate change as well as each category 7 or “reason” as a whole, generally as a function of global mean warming. This assessment took account of the 8 distribution of vulnerability across particular regions, countries, and sectors. AR4 furthered the discussion relevant 9 to Article 2 by assessing new literature and developing criteria which might be used by policy makers for 10 determining which impacts and vulnerabilities were key, i.e., meriting particular attention in respect to Article 2 (see 11 Box 19-2 for definitions of Reasons for Concern and Key Vulnerabilities [KVs]). AR4 emphasized the differences 12 in vulnerability between developed and developing countries but also assessed emerging literature describing 13 vulnerability pertaining to various aggregations of people (such as by ethnic, cultural, age, gender, or income status) 14 and response strategies for avoiding key impacts. The Reasons for Concern were updated and the Synthesis Report 15 (IPCC 2007) noted that they “remain a viable framework to consider key vulnerabilities”. However, their utility was 16 limited by several factors: the lack of a time dimension (i.e., representation of impacts arising from timing and rates 17 of climate change and climate forcing), the focus on risk only as a function of global mean temperature, lack of a 18 clear distinction between impacts and vulnerability, and importantly, incomplete incorporation of the socioeconomic 19 context, particularly adaptation capacity, in representing impacts and vulnerability. 20 21 22 19.1.2. The Special Report on Managing the Risks of Extreme Events and Disasters to Advance Climate Change 23
Adaptation (SREX) 24 25 SREX (IPCC 2011) provides additional insights with respect to the fourth “reason” (the risk of extreme weather 26 events) and particularly the distribution of capacities to adapt to such events between countries, communities, and 27 other groups, and the limitations of implementation of these capacities. SREX emphasized the role of the 28 socioeconomic setting and development pathway (expressed through exposure and vulnerability) in determining, on 29 the one hand, the circumstances where extreme events do or do not result in extreme impacts and disasters, and on 30 the other hand, when non-extreme events may also result in extreme impacts and disasters. 31 32 33 19.1.3. New Developments in this Chapter 34 35 With these frameworks already established, and a long list of impacts and key vulnerabilities enumerated and 36 categorized in previous assessments, the current chapter has three main objectives: first, to recognize the dynamic 37 nature of our understanding by assessing emergent risks (see Box 19-2), i.e., those which have only recently 38 emerged in the scientific literature in sufficient detail to permit assessment and which have the potential to become 39 relevant to interpreting Article 2 as additional understanding accumulates. For example, since AR4, sufficient 40 literature has emerged to allow initial assessment of the relationship between climate change and conflict. The 41 second objective is to reassess and reorganize the existing frameworks (based on Reasons for Concern and Key 42 Vulnerabilities) for evaluating the literature pertinent to Article 2 of the UNFCCC in order to address the 43 deficiencies cited in section 19.1.1, particularly in light of the advances in SREX and the current report’s discussions 44 of vulnerability and human security (see chapters 12 and 13) and adaptation (see chapters 14-17 and 20). From this 45 perspective, the objective stated in Article 2 may be viewed as aiming in part to ensure human security in the face of 46 climate change. Thirdly, this chapter will assess recent literature pertinent to additional frameworks for categorizing 47 risk and vulnerability, particularly focusing on indirect impacts and interaction and concatenation of risk, including 48 geographic “hotspots” (see 19.3). 49 50 In order to clarify the relative roles of characteristics of the physical climate system, like increases in temperatures, 51 precipitation, or storm frequency, and characteristics of the socioeconomic and biological systems with which these 52 interact (vulnerability and exposure) to produce risks of consequences, we rely heavily on a concept used sparingly 53
FIRST-ORDER DRAFT IPCC WGII AR5 Chapter 19
Do Not Cite, Quote, or Distribute 6 11 June 2012
in the TAR and AR4, key risks (see Box 19-2). Furthermore, we emphasize recent literature pointing to the dynamic 1 character of vulnerability based on its intimate relationship to development. 2 3 We consider a variety of types of emergent risks, including for example, vulnerability to impacts arising from 4 multiple interacting systems and stresses, indirect impacts, trans-boundary impacts, and impacts over longer 5 distances. To cite one example which illustrates all of these properties, consider that climate impacts on agriculture, 6 water availability, and sea level may be a contributing cause for the migration of populations. These shifts entail 7 both risks and potential benefits for the migrants, for the regions where they originate, and for the destination 8 regions (see 19.5.2.1 and 12.4). Risks include indirect impacts occurring at the new locations of settlement, which 9 may be near the location of the original impact or quite distant. Such distant, indirect effects would compound the 10 direct consequences of climate change at the locations receiving the incoming populations, and involve multiple 11 physical and biological systems which interact, including impacts on ecosystems and species at the receiving 12 locations which are subject simultaneously to climate changes and consequences of an increased population. 13 14 _____ START BOX 19-1 HERE ____ 15
16 Box 19-1. Article 2 of the UNFCCC and the Copenhagen Accord 17
18 Article 2 19
20 OBJECTIVE 21 The ultimate objective of this Convention and any related legal instruments that the Conference of the Parties may 22 adopt is to achieve, in accordance with the relevant provisions of the Convention, stabilization of greenhouse gas 23 concentrations in the atmosphere at a level that would prevent dangerous anthropogenic interference with the 24 climate system. Such a level should be achieved within a time-frame sufficient to allow ecosystems to adapt 25 naturally to climate change, to ensure that food production is not threatened and to enable economic development to 26 proceed in a sustainable manner. 27
28 Copenhagen Accord (excerpt) 29
30 To achieve the ultimate objective of the Convention to stabilize greenhouse gas concentration in the atmosphere at a 31 level that would prevent dangerous anthropogenic interference with the climate system, we shall, recognizing the 32 scientific view that the increase in global temperature should be below 2 degrees Celsius, on the basis of equity and 33 in the context of sustainable development, enhance our long-term cooperative action to combat climate change. 34
35 _____ END BOX 19-1 HERE ____ 36 37 ____ START BOX 19-2 HERE ____ 38
39 Box 19-2. Definitions 40
41 Impacts - Effects on natural and human systems. In this report, the term ‘impacts’ is used to refer to the effects on 42 natural and human systems of physical events, of disasters, and of climate change. 43 44 Vulnerability - The propensity or predisposition to be adversely affected. 45 46 Risk - The potential for adverse effects on lives, livelihoods, health status, economic, social and cultural assets, 47 services (including environmental) and infrastructure due to particular hazardous events occurring within some 48 specified time period (IPCC 2012). More generally, risk refers to a situation or an event where something of human 49 value (including humans themselves) is at stake and where the outcome is uncertain (chapter 2). 50 51 Expressed formally, Risk = (Probability of an Impact) X (Consequences) 52 53
FIRST-ORDER DRAFT IPCC WGII AR5 Chapter 19
Do Not Cite, Quote, or Distribute 7 11 June 2012
Key impact - An impact relevant to the definition and elaboration of “dangerous anthropogenic interference (DAI) 1 with the climate system,” in the terminology of United Nations Framework Convention on Climate Change 2 (UNFCCC) Article 2, meriting particular attention by policy makers in that context. 3 4 Key risk - A risk that is relevant to the definition and elaboration of “dangerous anthropogenic interference (DAI) 5 with the climate system,” in the terminology of United Nations Framework Convention on Climate Change 6 (UNFCCC) Article 2, meriting particular attention by policy makers in that context. Key risks are potential adverse 7 effects on humans and social-ecological systems due to the interaction of climate-related physical impacts with 8 vulnerabilities of societies exposed. Risks are considered “key” due to high physical impact or high vulnerability of 9 societies exposed, or both. 10 11 Key vulnerability - A vulnerability that is relevant to the definition and elaboration of “dangerous anthropogenic 12 interference (DAI) with the climate system,” in the terminology of United Nations Framework Convention on 13 Climate Change (UNFCCC) Article 2, meriting particular attention by policy makers in that context. Vulnerabilities 14 are considered “key” if they have the potential to combine with physical impacts to result in severe consequences for 15 society or social-ecological systems. Vulnerabilities that have little influence on risk would not be considered key. 16 17 Extract from Chapter 19, WGII, AR4: 18 19 Many impacts, vulnerabilities and risks merit particular attention by policy-makers due to characteristics that might 20 make them ‘key’. The identification of potential key vulnerabilities is intended to provide guidance to decision-21 makers for identifying levels and rates of climate change that may be associated with ‘dangerous anthropogenic 22 interference’ (DAI) with the climate system, in the terminology of United Nations Framework Convention on 23 Climate Change (UNFCCC) Article 2 (see Box 19-1). Ultimately, the definition of DAI cannot be based on scientific 24 arguments alone, but involves other judgments informed by the state of scientific knowledge. 25 26 Emergent risk - A risk that has only recently emerged in the scientific literature in sufficient detail to permit 27 assessment, for example the hypothetical impacts of geoengineering (solar radiation management) on the monsoon 28 or the effect of climate change on conflict, and that has the potential to become a key risk once sufficient 29 understanding of it accumulates. Risks emerge in the scientific literature over time for a number of reasons, 30 including that their initial consequences have only recently been detected above the natural variability of the climate 31 system, for example certain effects of ocean acidification on calcareous organisms; or because the risks arise from 32 the interaction of phenomena in a complex system, for example the effect of human population shifts in response to 33 climate change on the capacity of receiving regions to adapt to local climate changes. 34 35 Reasons for Concern – Elements of a classification framework, first developed in the IPCC Third Assessment 36 Report, which aims to facilitate judgments about what level of climate change may be “dangerous” (in the language 37 of Article 2 of the UNFCCC) by aggregating impacts, risks, and vulnerabilities. 38 39 Summary of Reasons for Concern, Chapter 19, WGII, TAR: 40 41 “Reasons for Concern” may aid readers in making their own determination about what is a “dangerous” climate 42 change. Each reason for concern is consistent with a paradigm that can be used by itself or in combination with 43 other paradigms to help determine what level of climate change is dangerous. The reasons for concerns are the 44 relations between global mean temperature increase and: 45 46 1. Damage to or irreparable loss of unique and threatened systems 47 2. The distribution of impacts 48 3. Global aggregate damages 49 4. The probability of extreme weather events 50 5. The probability of large-scale singular events 51 52 _____ END BOX 19-2 HERE _____ 53 54
FIRST-ORDER DRAFT IPCC WGII AR5 Chapter 19
Do Not Cite, Quote, or Distribute 8 11 June 2012
1 19.2. Framework for Identifying Key Vulnerabilities, Key Risks, and Emergent Risks 2 3 19.2.1. Risk and Vulnerability 4 5 Definitions and frameworks that systematize physical impacts, exposure, vulnerability, risk and adaptation in the 6 context of climate change are multiple, overlapping, and often contested (see e.g. Füssel and Klein 2006; IPCC 7 2007; UN/ISDR 2004, Birkmann 2006a; ICSU-LAC 2010a,b, Cardona 2011; Burton et al., 1983; Blaikie et al., 8 1994; Twigg, 2001, Turner et al., 2003a, b; Schröter et al., 2005; Adger 2006; 2006; Villagran, 2006; Cutter et al., 9 2008; Cutter and Finch, 2008. Thomalla et al. 2006; Tol and Yohe 2006; IPCC 2012); however, most of the 10 concepts and the respective literature differentiates between vulnerability, risk, impacts and hazards (see e.g. IPCC 11 2012). The following section serves not solely as an update of existing knowledge about key vulnerabilities and key 12 risks since the AR4, but also provides a more coherent framework to systematize these concepts and to enhance the 13 understanding of these phenomena based on new literature, including SREX (IPCC 2012). 14 15 The large body of literature on climate change adaptation and risk reduction as well as loss and damage indicates 16 that risk in the context of climate change, such as risks related to human health and well-being arising from droughts 17 or heat waves or potential economic losses due to sea level rise, are not solely externally generated circumstances to 18 which societies respond, but rather, the results of complex interactions among societies or communities, ecosystems, 19 and physical impacts arising from climate change (IPCC 2012; Susman et al. 1983; Comfort et al. 1999, Birkmann 20 et al. 2011,UN/ISDR 2011). In this chapter, risk describes the potential outcome of the interaction of vulnerable 21 conditions of societies and social-ecological systems (arising from multiple stresses such as poverty and 22 marginalization which limit their ability to cope and adapt) with climate changes to which they are exposed and the 23 resulting physical impacts (e.g. changes in weather related extreme events triggering hazards such as heat waves, 24 droughts, and wildfires; see Figure 19-1). The concept of risk encompasses the probability of the occurrence of 25 specific physical impacts (hazard or stressor factor; see IPCC 2012), and the consequences of their occurrence in 26 terms of harm, loss and disruption to human lives and social-ecological systems (vulnerability factor). The diverse 27 approaches to vulnerability encompass the concepts of susceptibility or sensitivity, and societal response capacities 28 including adaptive capacity (e.g. Füssel and Klein 2006; UN/ISDR 2004, Birkmann 2006a; Cardona 2011; Blaikie et 29 al., 1994; Turner et al., 2003a, b; Adger 2006; Villagran, 2006; Cutter et al., 2008; Cutter and Finch, 2008; IPCC 30 2012). 31 32 We define the direct consequences of climate change as physical impacts, such as deglaciation, ocean circulation 33 changes, ice sheet disintegration, etc. Hence, vulnerability refers primarily to characteristics of human or social-34 ecological systems exposed to climate change and respective single or multiple hazards (UNDRO, 1980; Cardona, 35 1986, 1990; Liverman, 1990; Cannon 1994, 2006; Blaikie et al., 1996; UNISDR, 2004, 2009; Birkmann, 2006b, 36 Thywissen, 2006, Füssel and Klein 2006 and IPCC SREX 2011). Ecosystems or geographic areas can be classified 37 as vulnerable, especially if vulnerability of humans arises from impacts on the related ecosystem services (see 38 Renaud 2011) or if these systems embody important values (e.g. cultural values), in which case their disappearance 39 might increase the vulnerability of a society, a community or a social-ecological system. The Millennium Ecosystem 40 Assessment (MEA) for example identified ecosystem services that probably affect the vulnerability of societies and 41 communities, such as provision of fresh water resources and air quality (see in detail MEA 2005) 42 43 Compared to the AR4 which did not fully differentiate key vulnerabilities, impacts and risks, the new 44 conceptualization used here provides a more coherent and precise framework to systematize vulnerability, risk, 45 hazard, and physical impacts (see Figure 19-1). In addition, the framework underscores that the development 46 process of a society has significant implications for a) the anthropogenic induced climate change in terms of 47 greenhouse gas emissions, as well as b) for the vulnerability patterns and their severity as well as for the exposure of 48 societies to the physical impacts. In this regard it is important to emphasize that climate change is not a risk per se; 49 rather physical impacts arising from climate change in combination with the vulnerability of a system exposed 50 determine the level of risk. Identifying key vulnerabilities therefore also facilitates estimating key risks when 51 coupled with information about the climate and climate change. Consequently, it is often not possible to attribute a 52 particular outcome or set of consequences to a single physical impact of climate. The societal determination of risk 53 related to climate change has two aspects: anthropogenic climate change and respective physical impacts; and 54
FIRST-ORDER DRAFT IPCC WGII AR5 Chapter 19
Do Not Cite, Quote, or Distribute 9 11 June 2012
societal responses to these physical impacts (and the limits of responses, from which vulnerabilities arise) as well as 1 anticipatory actions. This differentiation provides the basis for criteria developed in this chapter for assessing 2 vulnerability and risk. 3 4 5 19.2.2. Criteria for Identifying Key Vulnerabilities and Key Risks 6 7 Vulnerability is dynamic and context specific, determined by human behavior and societal organization, which 8 influences the levels of exposure (e.g. urbanization of low laying areas) and susceptibility of people (e.g. 9 marginalization) and livelihoods exposed, taking into account their response capacity (coping and adaptive 10 capacities) (see IPCC 2012). Furthermore, human perceptions and cognitive constructs about risks and adaptation 11 options as well as cultural contexts influence adaptive capacities and decision making processes and consequently 12 influence vulnerability of societies to climate change (e.g. Kuruppu/Liverman 2011; Grothmann/Patt 2005; 13 Rohmberg 2009; see section 19.4.2.3). Additionally, IPCC SREX stressed that consideration of multiple dimensions 14 (e.g., social, economic, environmental, institutional, cultural) as well as different causal factors can improve 15 strategies to reduce vulnerability to climate change (see IPCC 2012, p. 17, 67-106). 16 17 Key vulnerability and key risk are defined in Box 19-2. Vulnerability cannot be considered “key” if the different 18 factors that determine vulnerability would have negligible influence on the consequences physical impacts would 19 have on societies, social groups, or social-ecological systems. Hence, vulnerabilities that have little influence on the 20 overall risk would not be considered key. 21 22 Similarly, the magnitude or other characteristics of the geophysical changes, such as glacier melting or sea level rise, 23 are not by themselves adequate to determine key risks, since the consequences of climate change will be determined 24 largely by the vulnerability of the exposed society or the exposed social-ecological system. Key vulnerabilities and 25 key risks embody a normative component because different societies might rank the various vulnerability and risk 26 factors and actual or potential types of loss and damage differently (see e.g. IPCC 2012, p. 45; IPCC 2007, p. 785). 27 28 Recent literature shows that vulnerability profiles as well as loss and damage types assume different dimensions and 29 themes for different regions, country groups and social groups (see e.g. Surminski et al. 2012). Generally, 30 vulnerability merits particular attention when the survival of communities or societies is threatened (see e.g. 31 UN/ISDR 2011; Birkmann et al. 2011). 32 33 Climate change will influence both the nature of the climatic stressors societies and ecosystems are exposed to and 34 also contribute to deterioration or improvement of coping and adaptive capacities of systems exposed to these 35 changes. Consequently, many studies (Cardona 2010, Birkmann et al. 2011, Wisner et al. 2004) focus with a priority 36 on the vulnerability of humans and societies as a key feature, rather than on the first order physical impact or the 37 geophysical changes. 38 39 40 19.2.2.1. Criteria for Identifying Key Vulnerabilities 41 42 AR4 WGII Ch. 19 highlighted seven criteria that may be used to identify key vulnerabilities: Here we reorganize 43 and further develop these criteria in order to improve the differentiation between key vulnerabilities, key risks and 44 physical impacts – taking into account recent literature (IPCC 2012; UN/ISDR 2011, Birkmann 2006a; ICSU-LAC 45 2010a,b, Cardona 2011; Blaikie et al., 1994; Turner et al., 2003a, b; Villagran, 2006; Cutter et al., 2008; Cutter and 46 Finch, 2008; Bohle 2001). The criteria for identifying vulnerabilities as “key” used in the AR4 are: magnitude of 47 impacts, timing of impacts, persistence and reversibility of impacts, likelihood (estimates of uncertainty) of impacts 48 and vulnerabilities and confidence in those estimates, potential for adaptation, distributional aspects of impacts and 49 vulnerabilities, and importance of the system(s) at risk. These criteria do not provide a systematic differentiation of 50 vulnerability and risk. 51 52
FIRST-ORDER DRAFT IPCC WGII AR5 Chapter 19
Do Not Cite, Quote, or Distribute 10 11 June 2012
Revised criteria for assessing key vulnerabilities used here should provide an improved basis to distinguish between 1 changes in the physical climate and associated physical impacts (like sea level rise), vulnerability and risk for 2 societies or social-ecological systems. The following seven criteria are used to judge whether vulnerabilities are key: 3
1) Exposure of a society, community, or social-ecological system to climatic stressors. While exposure is 4 defined here separately from vulnerability, exposure is an important precondition for considering a specific 5 vulnerability as key. If a system is not at present nor in future exposed to climatic stressors, it is less 6 important to consider its vulnerability to such stressors. The exposure to climatic stressors can be assessed 7 in its spatial and temporal dimensions. 8
2) Probability that societies or social-ecological systems exposed to a climatic stressor or physical impact 9 would experience major harm, loss and damages. Vulnerability is considered key when there is a high 10 probability that a climatic stressor, often in combination with non-climatic stressors, would cause major 11 harm to an exposed and particularly susceptible societal or social-ecological system. This criterion can be 12 made specific with relative vulnerability assessment of societies, regions, and groups (one region or society 13 or group within these may be more vulnerable than another). For example sea-level rise will impact coastal 14 communities and regions worldwide; however, groups, communities and regions most vulnerable are those 15 that have a high susceptibility and a low capacity to cope and adapt to these influences. In this regard recent 16 literature indicates that low-lying areas and communities in developing countries with limited resources to 17 adapt and a low awareness about climatic stressors are more vulnerable than regions and communities in 18 highly developed countries that can afford the further strengthening of coastal protection systems that 19 reduce the negative consequences of sea-level rise (Nicholls and Small 2002; Klein et al. 2003, p. 109). 20 Criteria that might be used to assess such susceptibilities or sensitivities encompass among other factors 21 poverty and wealth status, demographic characteristics, and aspects of governance (see IPCC 2012, p. 70-22 74 and chapter 12 of this report), such as failed states or violent conflicts. A focus on relative vulnerability 23 is highly important to improve the knowledge base for adaptation needs. 24
3) Importance of the system(s) which is vulnerable. Various societies and people in different regions and 25 cultural contexts view the importance of systems, impacts, and services differently. However, the 26 identification of key vulnerabilities is less subjective when it involves those systems that are crucial for the 27 survival of societies and the important ecosystem services on which societies depend. The importance of 28 certain ecosystem services for example varies with geography and landscape as well as the specific 29 livelihoods dependent upon them. For example, drought exposed farmer households in the Sahel are 30 heavily depending on ecosystem services such as water and fertile soils. 31
4) Limited ability of societies or communities to cope with the stressor within existing capacities. Coping 32 refers primarily to capacities that are available here and now to reduce the negative impacts of climatic 33 stress on communities or social-ecological systems exposed. Coping is part of the formula that determines 34 vulnerability at any one moment in time. Coping also connotes the protection of the current system and 35 institutional settings (see Birkmann, 2011) rather than improving these to increase capacities against 36 climate risks (IPCC 2012, p. 51). Limits of coping provide a criterion for key vulnerabilities. 37
5) Limited ability of societies to build adaptive capacities to reduce or limit vulnerability as environmental 38 and climate conditions change. The capacity of societies (including communities) to build adaptive 39 capacities is a central issue when assessing vulnerability (IPCC 2007, AR4). Adaptation is a continuous 40 process, with levels of adaptive capacity changing over time. Adaptation in contrast to coping denotes a 41 longer-term and constantly unfolding process of learning, experimentation and change that alters 42 vulnerability. Adaptation is more strategic and long-term compared to coping. It includes acting to shape all 43 aspects of vulnerability and is manifest through the systems and outcomes of learning – planned and 44 spontaneous, pre- and post-disaster (Pelling, 2010; Smit et al. 1999; Smit and Wandel 2006; Pielke 1998; 45 Frankhauser et al. 1999; Adger et al. 2005; Smithers and Smit 1997). This understanding of adaptation is 46 commensurate with the emerging consensus from climate change literature (see Kelly and Adger, 2000; 47 Yohe and Tol, 2002; Pelling, 2010) where coping describes actions taken within existing constraints 48 (including vision and knowledge), while adaptation signifies expanding the boundaries of those constraints, 49 for instance, through institutional changes (Pelling et al. 2008; Tschakert and Dietrich 2012; Garschagen 50 2011). 51
6) Persistence of vulnerable conditions and degree of irreversibility of consequences. Vulnerabilities are 52 considered key when they are persistent and difficult to alter as well as having a high potential to interact 53 with a hazardous event to produce irreversible negative changes. This is particularly the case when the 54
FIRST-ORDER DRAFT IPCC WGII AR5 Chapter 19
Do Not Cite, Quote, or Distribute 11 11 June 2012
vulnerability is high and the capacities to cope or adapt are low. In this way, social-ecological systems 1 (coastal communities dependent on fishing or mountain communities dependent on specific soil conditions) 2 may reach a tipping point that would cause a partial or full collapse of the system (see Renaud et al. 2010). 3
7) Presence of conditions that make societies highly susceptible or sensitive to cumulative stressors in 4 multiply-interacting systems. Communities or social groups as well as social-ecological systems existing 5 under conditions that make them highly susceptible to additional climate stressors or that limit their ability 6 to cope and adapt, such as chronic poverty or living in a failed state (e.g. drought disaster in Somalia) 7 should be taken into account. In addition, inability to replace a system or compensate for potential and 8 actual losses and damages are criteria for judging vulnerabilities as key. Defining key vulnerabilities 9 regarding various societal groups (as above in criterion #2), or ecosystem services takes into account the 10 contextual conditions that make these societies or exposed elements or groups highly vulnerable. 11 Consequently, the vulnerability to cumulative stressors and vulnerability of multiple-interacting systems is 12 not solely determined by the susceptibility of individual systems or groups to the direct physical impacts or 13 climatic stressor, but is a matter of joint susceptibility, taking into consideration feedbacks among coping 14 and adaptive capacity, climate change and development pathways – thus the wider enabling or non-15 enabling context of conditions (O’Brien et al. 2004; Leichenko and O’Brien 2008). 16
17 18 19.2.2.2. Criteria for Identifying Key Risks 19 20 Key risks are the product of the interaction of climate-related physical impacts (e.g. impacts on water resources due 21 to glacier melting, heatwaves, changes in flood regimes, etc.) with key vulnerabilities of exposed societies and 22 communities (high level of poverty, limited coping and adaptive capacities etc.). A risk would not be considered 23 “key” if the climatic stressor or physical impact had a low probability and magnitude and would impact a society, 24 community or a social-ecological system with low vulnerability. 25 26 In contrast to the criteria for identifying key vulnerabilities, the criteria for identifying key risks take into account the 27 magnitude, frequency and severity of the physical impacts (or hazards) linked to climatic changes. The following 28 four criteria are used to judge whether risks are key: 29
1) Magnitude: Risk are key if judged to have large magnitude, determined by a variety of metrics including 30 human mortality and morbidity, economic loss, cultural importance, and distributional consequences (see 31 Schneider et al 2007; IPCC 2012, Below 2009). 32
2) Likelihood that risks will materialize, and their timing. Risks are considered key when there is a high 33 probability that the physical impact or hazard due to climate change will occur under circumstances where 34 societies or social-ecological systems exposed to these physical impacts have very limited capacities to 35 cope or adapt to these stressors . Risks which materialize in the near term may be evaluated differently than 36 risks which materialize in the distant future, since the time available for building up adaptive capacities is 37 different (Oppenheimer 2005; Schneider et al 2007). 38
3) Irreversibility and persistence of conditions and drivers that determine risks. Risks are considered key 39 when there is a high probability that they would involve irreversible harm, losses and damages. In addition, 40 the persistence of risks refers to the fact that underlying drivers and conditions of these risks cannot be 41 rapidly reduced (i.e., due to lags in the physical system resulting from e.g., the long atmospheric residence 42 time of CO2), or the damage to societal and social-ecological systems cannot be quickly reversed (see point 43 6 above). Critical infrastructures, such as electric power, communications, and transport networks in 44 developed countries often embody systemic risks due to their interdependencies as well as due to the fact 45 that many basic processes in industrialized countries and countries in transition are dependent on the 46 availability and functioning of these critical infrastructures. Risk to such systmes may indicate key 47 vulnerabilities. 48
4) Limited ability to reduce the magnitude and frequency or nature of physical impacts and the vulnerability 49 of societies and social-ecological systems exposed. Risks are considered to be key when societies have very 50 limited means through development (either by reducing emissions of greenhouse gases or improving 51 coping and adaptation) to reduce the magnitude, frequency or intensity of physical impacts and their 52 consequences for society and social-ecological systems. 53
54
FIRST-ORDER DRAFT IPCC WGII AR5 Chapter 19
Do Not Cite, Quote, or Distribute 12 11 June 2012
1 19.2.3. Criteria for Identifying Emergent Risks 2 3 Emergent risks are those risks which have only recently emerged in the scientific literature in sufficient detail to 4 permit assessment and which has the potential to become a key risk as additional understanding accumulates (see 5 Box 19-2). Risks emerge in the scientific literature over time for a number of reasons, including that their initial 6 consequences have only recently been detected above the natural variability of the climate system or because the 7 risks arise from the interaction of phenomena in a complex system, for example those involving unforeseen 8 feedback and response processes between climatic change, human interventions and feedback processes in natural 9 systems; or new vector borne diseases or those diseases arising from partial break down of critical infrastructures, 10 such as sewage systems that do not function properly. Emergent risks could also be linked to the increasing 11 urbanization of low laying coastal areas that are prone to sea-level rise or the phenomena that new flooding risk 12 emerges due to urbanization of vulnerable areas not historically populated. 13 14 Overall, the above differentiation of physical impacts due to climate change, key vulnerabilities, and key risks 15 allows an improved systematization of the different issues and factors that would be considered in the context of 16 development of adaptation strategies as well as the implementation of Article 2 of the UNFCCC in terms of the 17 development of mitigation strategies. 18 19 Section 19.6.1 and the table therein presents examples of the application of the framework developed here, based on 20 judgments made by the authors of many of the chapters of this report. 21 22 23 19.2.4. Identifying Key and Emergent Risks under Alternative Development Pathways 24 25 Key risks are determined by the interaction of physical impacts of climate change with vulnerabilities of societies or 26 ecosystems. Future impacts and vulnerabilities will depend in part on underlying socio-economic conditions, which 27 can differ widely across alternative future development pathways (Hallegatte et al., 2011). Therefore some risks 28 could be judged to be key under some development pathways but not others. Similarly, emergent risks, as risks that 29 have only recently emerged sufficiently in the scientific literature to permit assessment, can depend on development 30 pathways as well, since their identification as potentially key risks may be contingent on future socio-economic 31 conditions. 32 33 Development pathways will influence the likelihood and nature of physical impacts through their effects on 34 emissions and other forcing such as land use change, and consequently on climate change (see Ch. 12, WG1). 35 Components of development pathways such as economic growth, technical change, and policy will influence the 36 rates and spatial distributions of emissions of greenhouse gases and aerosols, and of land use change (Ch. 5, WG3). 37 As a consequence, different development pathways will lead to different key risks because they affect the 38 magnitude, timing, and heterogeneity of physical impacts of climate change. 39 40 Development pathways will also influence the factors involved in identifying key vulnerabilities of human and 41 ecological systems, including both susceptibility to impacts and adaptive capacity (Hallegatte et al., 2011; Fuessel 42 and Klein, 2006; Yohe and Tol, 2002). The size or scale of populations, ecosystems, or economic sectors that are 43 vulnerable to particular impacts will depend on population growth and spatial distribution, economic development 44 patterns, and social systems. Which elements of the human-environment system are most exposed and sensitive to 45 climate hazards, and which are considered most important, will depend on spatial development patterns as well as on 46 cultural preferences, attitudes toward nature/biodiversity, and dependence on climate-sensitive resources or services, 47 among other factors (Adger, 2006; Fuessel, 2009). The geographic or socio-economic heterogeneity of populations, 48 and therefore the potential for distributional consequences, will be affected, as will the degree to which persistent or 49 difficult to reverse vulnerabilities are built into social systems (Adger et al., 2009). 50 51 52 53
FIRST-ORDER DRAFT IPCC WGII AR5 Chapter 19
Do Not Cite, Quote, or Distribute 13 11 June 2012
19.2.5. Assessing Key Vulnerabilities and Emergent Risks 1 2 The criteria above for assessing vulnerability and risk provide a sequence of potential assessment steps. While the 3 first assessment phase would explore whether and how a society or social-ecological system is exposed to climate 4 related physical impacts and hazards, the assessment thereafter would focus on the probability of loss and harm in 5 case an event or events would affect a society or social-ecological system exposed. In addition, the importance of 6 the system at risk and the ability of a society or system to cope and to adapt to these stressors would be assessed. 7 Finally, the application of the criteria would also require the assessment of the irreversibility of the consequences, 8 the persistence of vulnerable conditions as well as the presence of conditions that make societies susceptible. Hence, 9 the assessment criteria focus on the inner conditions of an individual social-ecological system or community 10 (intrinsic factors) exposed as well as on the contextual conditions that influence the vulnerability of the respective 11 community or social-ecological system. The application of the criteria to identify key risks requires additionally the 12 consideration of the physical impacts and respective hazards together with the key vulnerabilities. Examples of such 13 key vulnerabilities and key risks drawn from other chapters of this assessment are provided in section 19.6. Further 14 operationalizing would be facilitated by consideration of criteria relevant to specific conditions and climate change 15 impacts. 16 17 18 19.3. Emergent Risk: Multiple Interacting Systems and Stresses 19 20 19.3.1. Limitations of Previous Approaches Imply Key Risks Overlooked 21 22 Interactions between climate change impacts in various sectors and regions, and between these impacts and human 23 adaptation in other sectors and regions, as well as interactions between adaptation and mitigation actions, are 24 generally not included, or not well integrated, into projections of climate change impacts (Warren 2011). These 25 interactions create emergent risks and/or key vulnerabilities not previously recognized. There are a very large 26 number of potential interactions, and many important ones have not yet been quantified, meaning that some key 27 risks have been overlooked. In some cases, new knowledge about these risks is just now emerging. The six 28 interaction processes listed below, while not exclusive, are systemic and are likely to lead to further key 29 vulnerabilities as well as a larger number of less significant impacts. Several of these are discussed in more detail in 30 the following sections. 31
• Climate change induced biodiversity loss erodes ecosystem services, in turn affecting human systems 32 dependent on those services. (19.3.2.1) 33
• Climate change induced changes in extreme weather events affect human systems and ecosystems, which 34 preconditions these systems and increases vulnerability to the effects of mean climate change. Most 35 impacts projections are based only on changes in mean climate (Rosenzweig & Hillel 2008). 36
• Interactions with non-climate stressors: the interaction between climate change impacts and 37 population/economic growth is well studied, but a large literature now addresses interactions of climate 38 change with other factors such as land management, water management, air pollution (which has drivers in 39 common with climate change) and energy production (19.3.2.2) 40
• Interactions related to climate change and disease emergence (19.3.2.3) 41 • Co-location of impacts in different sectors can create impact ‘hotspots’ involving new interactions 42
(19.3.2.4) 43 • Adaptation designed for one sector interacts with functioning of another sector (e.g. increasing irrigation to 44
crops in response to a drying climate can exacerbate water stress in downstream areas such as wetlands, in 45 cases where the latter provide important water cleaning services). (19.3.2.5) 46
47 48 19.3.2. Emergent Risks 49 50 19.3.2.1. Emergent Risks Arising from the Effects of Degradation of Ecosystem Services by Climate Change 51 52 The large proportion of the world’s species that are projected to become at risk of extinction from mean climate 53 change [CITE Ch 3], which includes a large proportion of the world’s widespread species (Warren et al submitted), 54
FIRST-ORDER DRAFT IPCC WGII AR5 Chapter 19
Do Not Cite, Quote, or Distribute 14 11 June 2012
together with the projected effects of climate-change induced increases in extreme events such as drought and 1 increased forest losses due to fire; and the resulting potential for disruption of mutualistic or predator-prey 2 relationships between species, translates into an emergent risk from a large scale loss of ecosystem services in both 3 terrestrial and marine systems (Mooney et al 2009). Biodiversity loss is linked to disruption of ecosystem structure, 4 function and services (Gaston et al 2008, Maestre et al. 2012, Diaz et al 2006, Midgley 2012). 5 6 Examples of at-risk services include water purification provided by wetlands, air purification by forests, crop 7 pollination by insects, coastal protection from storm surge by mangroves and coral reefs, regulation of pests and 8 disease, recycling of waste nutrients, and removal of carbon from the atmosphere (Chivian & Bernstein, 2008). 9 Biodiversity loss has now been linked to increased transmission of infectious diseases such as Lyme, Schistosoma 10 and hantavirus in humans, and West Nile virus in birds (Keesing et al. 2010). 11 12 The following studies provide examples of projected ecosystem service loss in the agricultural sector due to climate 13 change: projected crop damage due to increased prevalence of pest species including Fusarium graminearum (a 14 fungal disease of wheat), the European corn borer, the Colorado beetle, bakanae disease and leaf blights of rice 15 (Petzoldt et al. 2006, Chakraborty & Newton, 2011, Magan et al 2011, Kocmankova et al. 2010, Huang et al 2010); 16 and projected declines in crop yields due to climate change effects on pollinating species (Hillel & Rosenzweig 17 2008, others). These effects are simultaneous with climate change’s direct effects on yields through changing 18 temperature, precipitation, and ambient carbon dioxide concentrations. Climate change has caused, or is projected to 19 cause range expansion in a number of weeds that have the potential to become invasive (Clements & Ditommaso, 20 2011; Bradley et al 2009a). Invasive species can damage agriculture and cause extinction of other species, with 21 attempts to control them being extremely costly (eg $120 billion annually in the USA, Crowl et al 2008). Whilst the 22 balance of gains and losses for invasive species will vary locally (Bradley et al 2009b) and no single aspect stands 23 out, any one of the mechanisms mentioned in this paragraph has the potential to cause outcomes that are very 24 damaging and act in synergy with existing climate change impacts on agriculture. Hence, these various 25 susceptibilities to loss of ecosystem services taken together comprise a key vulnerability, and in interaction with 26 climate change, an emergent risk. 27 28 Estimates of the current value of the ecosystem services of pollinators in the UK are UK430 million per year yet the 29 study also noted that this service is currently becoming less effective (UKNEA 2011). The same study found that the 30 recent increase in woodland from 6 to 12% of the UK’s land area (with the reverse being a measure of the cost of 31 degradation) was worth £680 million per year in carbon sequestration value alone. Ecological function analysis for 32 Chinese terrestrial ecosystems yielded estimated economic values of approximately 0.3-1.6 x 10¹³ yuan annually for 33 services such as CO2 fixation, O2 release, nutrient recycling, soil protection, water holding capacity and 34 environmental purification (Ouyang et al 2006). Similarly, the value of ecosystem services in US forests has been 35 estimated at values ranging from 1 to 6 billion annually for climate regulation, 4-54 billion for biodiversity, and 1 to 36 100 billion annually for recreation (Kriegler 2001). The potential loss of coral reefs (section 19.3.2.4) would result 37 in a loss of income of $Au4 billion to the Australian economy from international tourism, of US$1.6 billion to the 38 Caribbean economies for tourism and fishing on reefs, and the loss almost equal to the value of the entire economy 39 of the Maldives and the Seychelles (Hoegh Guldberg 2011). Such costs are represented only very crudely, if at all, 40 in aggregate global models of the economic impacts of climate change where ‘non-market impacts’ are estimated 41 very broadly if at all (section 19.6.3.4). 42 43 Some of the work on degraded ecosystems and their interaction with economic sectors examines the cost of 44 restoring ecosystem services. For example, interviewed households along the Platte River (US) showed a 45 willingness to pay, in terms of increased water bills, an additional US$20 per month in order to improve five 46 ecosystem services (Loomis et al, 2000), while the total amount “paid” is US$19 to US$70 million dollars which 47 greatly exceeds the estimated costs of improving degraded ecosystem services (US$1.13 to US$12.3 million). A 48 meta-analysis of 89 studies looking at the restoration of ecosystem services found that restoration increased the 49 amount of biodiversity and ecosystem services by 44 and 25%. However, even after restoration, the values in 50 restored ecosystems were lower than in intact ecosystems (Rey Benayas et al 2009). 51 52 Concomitant stress from land use change increases the likelihood that climate change impacts on biodiversity would 53 result in increased extinction rates, since larger areas of contiguous habitat support relatively greater numbers of 54
FIRST-ORDER DRAFT IPCC WGII AR5 Chapter 19
Do Not Cite, Quote, or Distribute 15 11 June 2012
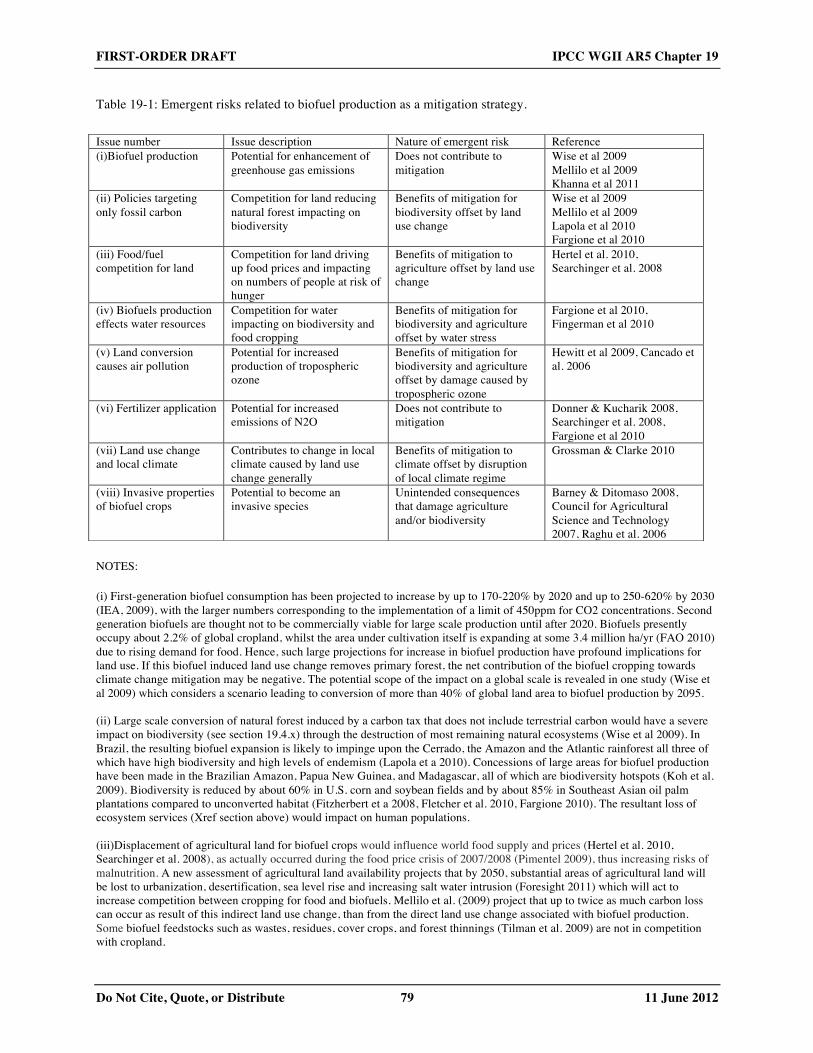
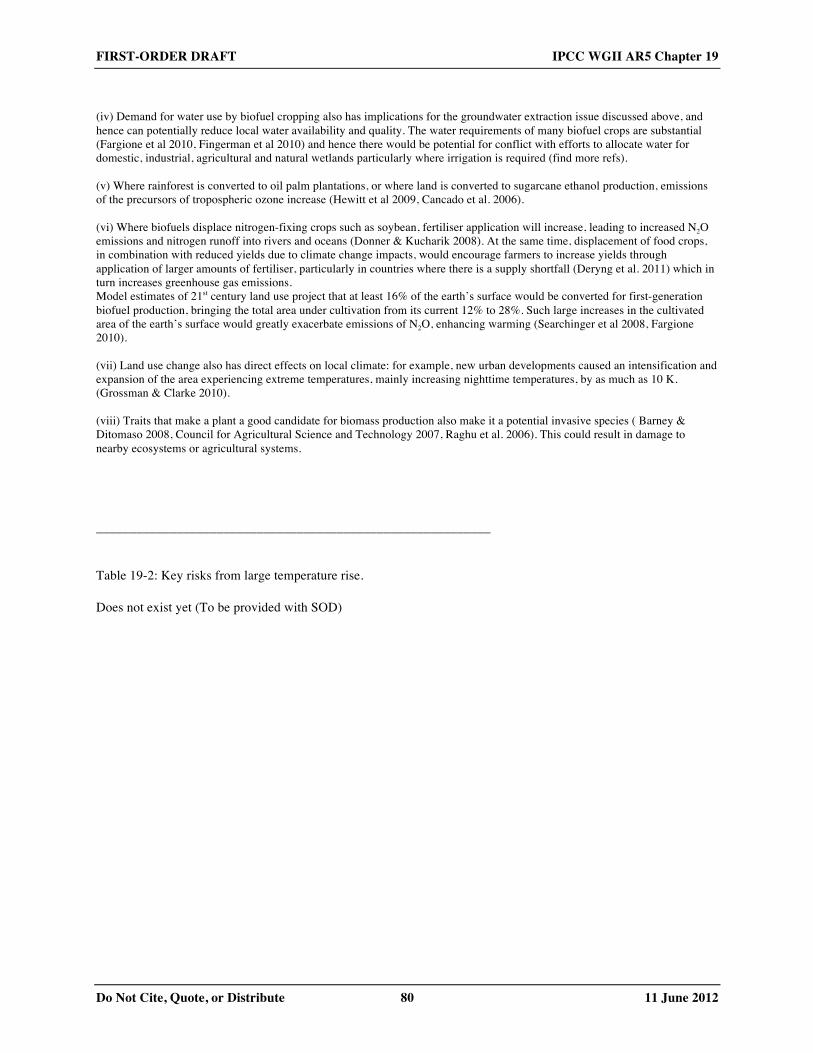
species by reducing edge effects. In addition, if species attempt to adapt to climate change by moving, fragmentation 1 can create impassable barriers between an area of suitable habitat that is no longer climatically favorable and one 2 that is newly favorable (in prep, Berry et al UK scale study). Land clearing not only releases carbon to the 3 atmosphere but removes carbon sinks (Warren et al in prep., X-ref WG1), in part because old growth forests 4 continue to accumulate carbon (Lussayert 200x). A new approach has quantified the ‘Greenhouse Gas Value’ of 5 ecosystems (Anderson-Teixera and Delucia 2011), taking into account both fluxes and storage of carbon, implying 6 that published values of ecosystem services from carbon sequestration have tended to underestimate their 7 importance due to a tendency to consider only the carbon currently stored in the systems. 8 9 10 19.3.2.2. Emergent Risk Involving Non-Climate Stressors: the Management of Water, Land, and Energy 11 12 19.3.2.2.1. Interactions among water use, energy, adaptation, and mitigation, and agriculture 13 14 One of the most important interactions affecting the well-being of humans and ecosystems and the level and rate of 15 climate change, are those involving human management of water, land, and energy. These profoundly affect the 16 amount of carbon which can be stored in terrestrial ecosystems, the amount of water available for use by humans 17 and ecosystems, and the viability of adaptation plans for cities or protected areas, for example. Failure to manage 18 land, water and energy in a manner which maximizes synergy among management strategies can itself greatly 19 increase the vulnerability of local populations and/or ecosystems, and can exacerbate climate change impacts 20 globally. 21 22 The projected increase in climate variability combined with water extraction leads to an emergent risk: that of water 23 stress exacerbated by the removal of groundwater which serves as ‘an historical buffer against climate variability’ 24 (Green et al 2011). The use of energy by the water sector, including domestic use for heating, accounts for between 25 5-6% of the greenhouse gas emissions of the US and India. Extraction and conveyance of water for irrigation is 26 energy intensive and this demand is projected to rise as adaptation to climate change and increasing food demand 27 drives the need for an expansion of irrigated cropland. This has implications for projected energy use and hence 28 mitigation strategies. 29 30 However, there are opportunities for adapting the agricultural sector to climate change in drying regions which 31 reduce greenhouse gas emissions, such as advanced irrigation systems (Rothausen & Conway, 2011). The second 32 issue is that of groundwater extraction, which is likely to increase as an adaptation to climate change, since current 33 demand for surface water will not be met under various scenarios of a changed climate (Barnett et al, 2008). For 34 example, following a ten-fold increase in groundwater extraction in China, 70% of the irrigated cropland in China is 35 now groundwater fed, and it is estimated that 0.5% of the country’s greenhouse gas emissions are attributable to 36 exploitation of this resource (Wang et al 2012). The effects of climate change on groundwater are varied with some 37 areas expecting decreases recharge, whilst others are projected to experience increased recharge (Green et al 2011). 38 However, in areas where extraction rates increase or recharge decreases, water tables will be depleted with 39 consequence for ecosystems and the human systems (such as agriculture, tourism and recreation) which depend 40 upon them, while water quality will also decrease. One projection shows insufficient water availability in Africa, 41 Latin America and the Caribbean to satisfy both agricultural demands and environmental regulations by 2050, 42 owing to increases in demand for water use for municipal and industrial use, combined with increases in demand for 43 food, a situation that is exacerbated by climate change (Strzepek & Boehlert 2010). 44 45 46 19.3.2.2.2. Interactions among biofuel development, land use management, and agriculture 47 48 Primary biofuel production, when not carefully managed, often displaces use of land for food cropping or natural, 49 unmanaged ecosystems. Reductions of greenhouse gas emissions from biofuel production and use (compared to 50 fossil fuels) may be offset partly or entirely for decades or centuries by emissions from the resulting indirect land-51 use changes (iLUC) (IPCC SRREN 2012) some of which are not only indirect but have transboundary and/or distant 52 impacts (see 19.4). Particular types of biofuel production, especially second generation biofuels, can reduce GHG 53 emissions and other air pollutants compared to fossil fuel use (Fargione 2010; Plevin 2009). 54
FIRST-ORDER DRAFT IPCC WGII AR5 Chapter 19
Do Not Cite, Quote, or Distribute 16 11 June 2012
1 There can be important interactions between global mitigation policies and land management which can either 2 confound, or contribute to, mitigation by affecting the above tradeoffs. In particular, the placement of a carbon tax 3 (as a surrogate for the effect of a variety of policies) to fossil carbon only, with a goal of limiting CO2 4 concentrations to 450ppm-550ppm, is projected to lead to large scale deforestation of all natural forests, with 5 conversion of most other natural ecosystems, in part due to enhanced biofuel production (Wise et al 2009, Mellilo et 6 al 2009a,b). If instead the tax is applied also to include terrestrial carbon, the area of forested land increases. Dietary 7 changes could reduce the land requirements of food cropping embodied in these tradeoffs. Specifically, a transition 8 to a vegetarian diet would free up 2700 Mha of pasture and 100 Mha of cropland, 75% of which could be used for 9 biofuel cropping (Stehfest et al 2009), whilst the remainder could revert to natural vegetation becoming a carbon 10 sink (see 19.3.2.1). 11 12 More generally, should mitigation be achieved with a substantial contribution from biofuel cropping, a number of 13 emergent risks apply, as shown in the Table 19-1. 14 15 [INSERT TABLE 19-1 HERE 16 Table 19-1: Emergent risks related to biofuel production as a mitigation strategy.] 17 18 Strategies exist that can reduce some of the above interaction problems, in particular iLUC. Whilst the iLUC itself 19 associated with a particular biofuel project can be difficult to measure (because accounting can be complex and 20 assumption dependent, as in the case of in Brazil’s ethanol industry (Lapola et al 2010; Barr 2011), iLUC reduction 21 strategies can be adopted. These include ensuring that increases in land use due to biofuel production is 22 accompanied by concomitant improvements in agricultural management, such as intensification (Stehfest et al 2011, 23 IPCC SRREN 2012); establishing bioenergy plantations on marginal and degraded soils where CO2 might 24 potentially thus be sequestered; and appropriate land use governance (zoning) (IPCC SRREN 2012, Fargione et al 25 2010). More generally the rate of improvement of agricultural and livestock management, including fertiliser 26 management, is key to the avoidance of iLUC issues; but the issue of enhanced emissions of N2O still remains. 27 28 29 19.3.2.3. Emergent Risks Involving Health Effects and Disease Emergence 30 31 Climate change will act through numerous direct and indirect pathways to alter the prevalence and distribution of 32 diseases that are climate and weather sensitive. These effects will differ substantially depending on current 33 epidemiologic profiles, reflecting the level of development and access to clean and plentiful water, food and access 34 to health care resources. Furthermore, the impact of climate change will differ by region, depending upon the 35 adaptive capacity of critical public health infrastructure that ensures access to clean food and water. 36 37 A principal emerging global risk is malnutrition secondary to ecological changes and disruptions in food production 38 as a result of changing rainfall patterns, increases in extreme temperatures and precipitation events (SREX), and 39 increased atmospheric CO2 (Burke and Lobell 2010, Taub 2008). Modeling of the magnitude of the effect of climate 40 change on future under-nutrition in five regions in South Asia and sub-Saharan Africa in 2050 suggests an increase 41 in moderate nutritional stunting of 1% to 29% compared to a future without climate change, and a much greater 42 impact on severe stunting of 23% for central sub-Saharan Africa and 62% for south Asia (Lloyd et al 2011). The 43 impact of climate induced drought and precipitation changes in Mali inlcude the southward movement of drought-44 prone areas which would result in a loss of critical agriculturally-productive land by 2025 and increase food 45 insecurity (Jankowska et al 2011). 46 47 In developed countries and large, highly populated megacities with developed public health infrastructure, principal 48 risks include increased injuries and fatalities as a result of severe storms and heat waves; changes in vector biology 49 and disease ecology that impact infectious diseases; water and food contamination; increased pollen production 50 leading to increases in allergic airway diseases (see 19.5.3); and respiratory and cardiovascular morbidity and 51 mortality secondary to degraded air quality and ozone formation. Indirect effects, for which data and evidence to 52 support projections are less available and uncertainties are greater, include mental health consequences resulting 53 from population dislocation, and nutritional shortages related to changes in food production (Portier et al 2010). 54
FIRST-ORDER DRAFT IPCC WGII AR5 Chapter 19
Do Not Cite, Quote, or Distribute 17 11 June 2012
1 Increase in heat-related morbidity and mortality subsequent to the increase in the severity, duration, and frequency 2 of heat waves (Luber and McGeehin 2008) in urban areas is an emergent risk. These impacts will be greatest in 3 urban areas with a pronounced urban heat island effect (Kovats and Hajat 2008). The coupling of the increasing 4 vulnerability of an aging population and a global shift to urbanization will increase the likelihood of relatively 5 higher mortality from exposure to excessive heat (Knowlton et al., 2007). In addition to heat waves, climate change 6 is projected to alter the frequency, timing, intensity, and/or duration of extreme weather events, such as tropical 7 cyclones, heavy precipitation events, and floods (see WGI AR5 Ch x, SREX). The health effects of these extreme 8 weather events range from the direct effects, such as loss of life and acute trauma, and mortality resulting from the 9 exacerbation of chronic disease, to indirect effects, including large-scale population displacement, damage to water 10 and sanitation infrastructure, damage to the health care infrastructure, and psychological problems such as post- 11 traumatic stress disorder (Frumkin et al 2008). 12 13 While the association between ambient air quality and health is well established, there is an increasingly robust body 14 of evidence linking spikes in respiratory diseases to weather events and to climate change, so that this interaction is 15 emerging as a key risk. In New York City, for example, each single degree (Celsius) increase in surface temperature 16 has been associated with a 3% increase in same-day hospitalizations due to respiratory diseases, and an increase of 17 up to 3.6% in hospitalizations due to cardiovascular diseases (Shao Lin 2009). The principal pathways through 18 which such respiratory health outcomes will be exacerbated by climate change are through increased production and 19 exposure to tropospheric (ground-level) ozone, smoke produced by wildfires, and increased production of pollen 20 (D’Amato 2010). Many of the same populations that are vulnerable to health effects from heat waves, show 21 increased risk for effects from poor air quality induced by heat, including: the very young and the very old and those 22 with preexisting medical conditions, including respiratory and cardiovascular disease. 23 24 Projected changes in precipitation, temperature, humidity, and water salinity, would affect the distribution and 25 prevalence of food- and water-borne diseases resulting from bacteria, overloaded drinking water systems, and 26 increases in the frequency and range of harmful algal blooms (Curriero et al., 2001, Moore et al 2008). Climate 27 change and increased climatic variability are particularly would affect vector-borne diseases such as plague, Lyme’s 28 disease, malaria, hanta virus, and dengue fever which exhibit distinct seasonal patterns and sensitivity to ecologic 29 changes (Githeko et al 2000, Gage 2008, Parham et al. 2011 submitted). 30 31 32 19.3.2.4. Spatial Convergence of Multiple Impacts: Hotspots 33 34 In this chapter, hotspot is defined as a region where climate-change induced impacts in one sector affects other 35 sectors in the same region or a region where climate change impacts in different sectors are compounded, resulting 36 in extreme or disastrous consequences. The coincidence of impacts in different sectors in the same region could 37 have consequences that are more serious than simple summation of the sectoral impacts would suggest. Such 38 synergistic processes are difficult to identify through sectoral assessment and apt to be overlooked in spite of their 39 potential importance in considering key vulnerabilities. For example, a large flood in a rural area may damage crop 40 fields severely, causing food shortages (Stover and Vinck, 2008). The flood may simultaneously cause a 41 deterioration of hygiene in the region and the spread of water borne diseases (Hashizume et al., 2008; Schnitzler et 42 al., 2007; Kovats and Akhtar, 2008). The coincidence of disease and malnutrition can thus create a hotspot for health 43 impacts, with the elderly and children most at risk. 44 45 Identification of hotspots could be achieved by overlaying spatial data on impacts in multiple sectors, but this cannot 46 indicate synergistic influences and dynamic changes in these influences quantitatively. For global analysis, certain 47 types of integrated assessment models which allow spatial analysis of climate change impacts have been used to 48 identify regions that are affected disproportionately by climate change (Fussel, 2010; Tol and Fankhauser, 2008, 49 Kainuma et al., 2003; Bowman et al., 2006; Warren et al., 2008). Recent efforts attempt to collect and archive 50 spatial data on impact projections and facilitate their public use. These have created overlays for identifying hotspots 51 with web-GIS technology (Adaptation Atlas (Vajjhala, 2009). There are also efforts to coordinate impacts 52 assessments based on shared future scenarios at various spatial scales (Parry 2004; ISI-MIP, 2012 ). 53 54
FIRST-ORDER DRAFT IPCC WGII AR5 Chapter 19
Do Not Cite, Quote, or Distribute 18 11 June 2012
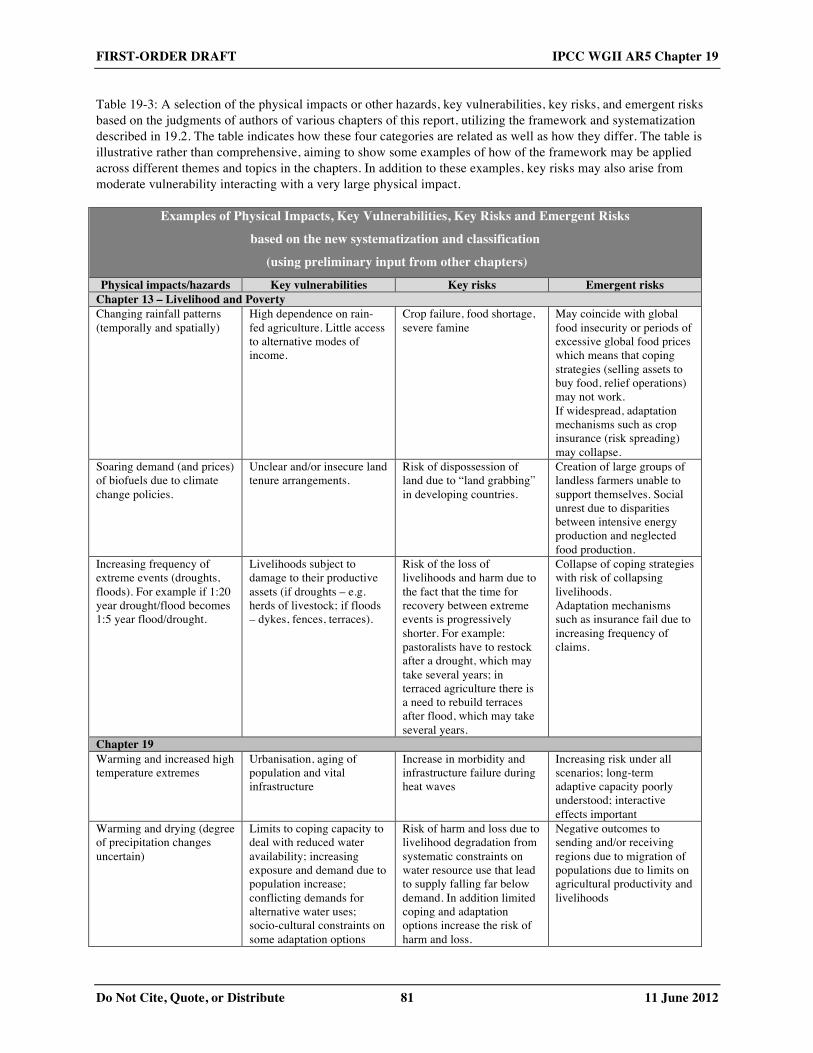
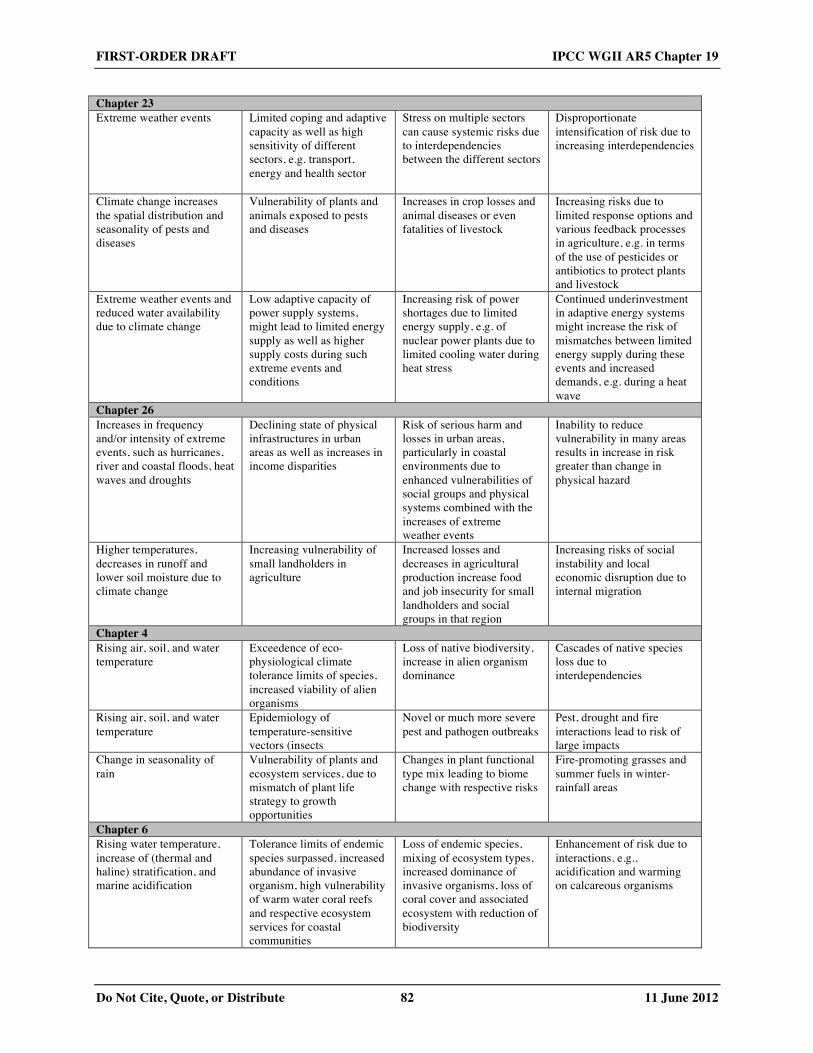
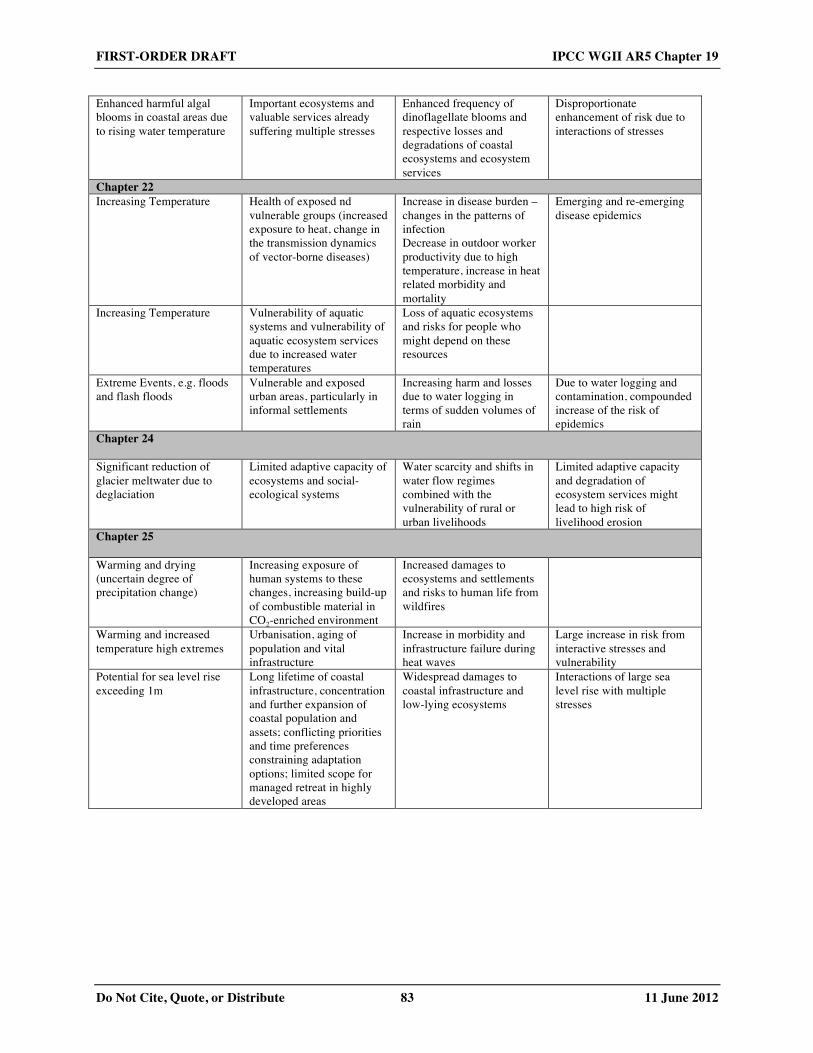
[TO BE INSERTED HERE: examples of coordinated regional/national/city assessment of climate change impacts 1 and suggested hot spots from regional chapters] 2 3 Below are some examples of hotspots where climate change impacts coincide and interact: 4
1) The Arctic, where the Inuit culture (Crowley et al 2011) is projected to be exposed to the disruption, and 5 possible destruction of, their hunting and food sharing culture. This hotspot is due to the combination of sea 6 ice loss and the concomitant potential extinction of the animals dependent upon the ice (Johannessen et al 7 2011). Thawing ground is also disrupting transportation, buildings and infrastructure whilst there is 8 increased exposure to storms. Alaskan ecosystems are considered particularly at risk (Kittel et al 2011) 9
2) Coral reefs, which are highly threatened due to exposure to concomitant sea surface temperature rise and 10 ocean acidification. (Hoegh Guldberg, 2011) considers that reefs could not persist should CO2 11 concentrations reach 450ppm by 2100, as this would reduce the carbonate concentration of the ocean to 12 below a critical level of 200umol/kg, and given the climate sensitivity used, increase sea surface 13 temperatures by at least 2C. A ‘safe’ level of 324 ppm has been suggested (Royal Society 2009). 14
3) Placeholder: a South Asian coastal city where citizens are projected to be at risk of a combination of coastal 15 flooding, heat-related deaths, etc. Cities in deltas are impact hotspots: An assessment of combined impacts 16 of sea level rise, increased storm surge and natural and anthropogenic subsidence in deltas under a moderate 17 scenario for sea level rise (Ericson et al 2006, AR4 WGII) revealed that over 6 million people would be at 18 risk of enhanced inundation and increased coastal erosion in three megadeltas and 8.7 million in 40 deltas, 19 absent measures to adapt. 20
4) Placeholder: a similar city in Africa, including food insecurity 21 22 General equilibrium economic models (see chapter 10) may facilitate quantitative evaluation of synergistic 23 influences. An analysis of the EU by the PESETA project evaluated sub-regional welfare loss by considering 24 impacts on agriculture, coastal system, river floods, and tourism together in the CGE (Computable General 25 Equilibrium) model, which is designed to represent interrelationships among economic activities of sectors, and 26 indicated the largest percentage loss in Southern Europe (Ciscar et al., 2011). It should be noted, at any scale, 27 choices of sectors are strongly constrained by availability of data or evaluation methods and they are not 28 comprehensive. 29 30 31 19.3.2.5. Maladaptation 32 33 Maladaptation refers to adaptation strategies that increase a population or sector’s vulnerability to climate change. 34 The IPCC Third Assessment Report defines maladaptation as “an adaptation that does not succeed in reducing 35 vulnerability but increases it instead” (IPCC 2001, 990). More recent treatments of this concept refine this definition 36 to an “action taken ostensibly to avoid or reduce vulnerability to climate change that impacts adversely on, or 37 increases the vulnerability of other systems, sectors or social groups” (Barnett and O’Neill 2010, 213). More 38 generally, maladaptation occurs “where the human response actively undermines the capacity of society to cope 39 with climate change or further contributes to the problem” (Niemeyer et al. 2005, 1443). Maladaptations can take 40 numerous forms, but quite commonly the maladaptation results from a narrowly focused approach that attempts to 41 reduce impacts in one sector or region without considering the consequences for others. Maladaptation can operate 42 on different temporal and spatial scales, including, for example, adaptation actions or policies that increase 43 greenhouse gas emissions, those that disproportionately burden the most vulnerable, have high opportunity costs, 44 reduce individual incentives to adapt, and set paths that limit the choices available to future generations. An 45 assessment of potential adaptation actions in the context of interactions across multiple sectors and regions would 46 identify potential negative impacts (Barnett and O’Neill 2010, 212). Lack of consideration of such interactions is 47 itself an emergent risk, in that it could cause new risks to emerge (see 19.6.x on governance). 48 49 Most clearly identified as in this category are those adaptation actions in one sector that impact another sector within 50 the same region (Warren 2011, 218). Increasing irrigation in agriculture uses water which may be required to 51 maintain a healthy wetland; and the building of dykes to protect towns can be to the detriment of associated natural 52 ecosystems (Knogge et al 2004, xxxx et al. 2008) or adjacent settlements (Ericson et al. 2006); in addition to its 53 benefits for crop productivity locally, agricultural intensification (World Bank, 2011) entrains negative impacts such 54
FIRST-ORDER DRAFT IPCC WGII AR5 Chapter 19
Do Not Cite, Quote, or Distribute 19 11 June 2012
as reduced biodiversity. Water stress in Burkina Faso, Sudan and Egypt has encouraged dam construction to ensure 1 water resource resiliency. Dam building has led to has damaged wetlands and stimulated the reproduction of 2 parasites in lakes nearby human settlements, leading to schistosomiasis and malaria (Molyneux et al. 2008). In 3 theory, process-based impact models represent one way to quantify these interactions, but only a few interactions 4 have presently been simulated within models (Warren 2011, 235). Another way to assess maladaptative responses is 5 to qualitatively examine social responses. For example, the incentive for individuals to cooperate may decrease if 6 they perceive that public institutions are unwilling, or unable to increase their adaptive response (see 19.6.x on 7 governance). One method to examine how human responses to climate change may influence subsequent behavior is 8 to analyze people’s perceptions of various climate change scenarios in order to understand what drives their 9 behavior (Niemeyer et al. 2005, 1444). 10 11 12 19.4. Emergent Risk: Indirect, Trans-Boundary, and Long-Distance Impacts 13 14 Climate change impacts can have consequences beyond the regions in which they occur. Such long distance 15 interactions may be mediated by global trade systems. The most prominent example of this is the global food trade 16 system. Similarly, both mitigation and other adaptation responses that are implemented on the ground can have 17 unintended consequences beyond the locations in which they are implemented. All of these mechanisms can create 18 emergent risks. 19 20 21 19.4.1. Indirect, Trans-Boundary, and Long-Distance Impacts of Climate Change Impacts on Agricultural 22
Yields: Food Trade Patterns, Prices, Malnutrition 23 24 Climate change impacts on agriculture can have consequences beyond the regions in which those impacts are 25 directly felt, through the global food trade system. Food access can be inhibited by rising food prices, as 26 demonstrated during recent price rise episodes that resulted from the combination of poor weather in certain world 27 regions combined with a demand for biofuel feedstocks , increased demand for grain-fed beef in China, and 28 historically low levels of food stocks (Abbot & deBattisti 2011, Adam & Ajakaiye 2012). This episode provides an 29 analog elucidating how reduced crop yields due to climate change impacts and biofuel cropping create a risk of 30 malnutrition: hence this interaction of climate change with the food system via markets comprises an emergent risk 31 of the impacts of climate change acting a distance. 32 33 One study finds that climate change has already significantly offset technology-related increases in crop yields in the 34 last 30 years in several countries including Russia, Turkey and Mexico (wheat) and China (maize) (Lobell et al 35 2011) while another identified areas where past climate variability has induced sudden or prolonged drops in food 36 production, e.g., Ukraine (a 13% decline in a single year due to high summer temperatures) and the Sahel (decadal 37 scale losses due to prolonged drought and high temperatures) (Battisti & Naylor, 2009). In the next few decades, 38 areas where crop yields are projected to decline such as sub-Saharan Africa and the Sahel may come to rely more 39 strongly on imported food (Scmidhuber & Tubiello, 2007). Whilst some studies (Jaggard et al. 2010, other refs) 40 conclude that in the next few decades, there may be increases in crop yields in temperate regions which may 41 compensate in global terms for the losses in tropical regions (FAO, 2008), a recent empirical study suggests that 42 these benefits may not be realized, based on indications that, to date, the positive effects of CO2 fertilisation on 43 yields and the effects of changes in precipitation and temperature have offset one another (Lobell & Field, 2007). 44 Median projected temperatures from AR4 are higher than any year on record in most tropical areas by 2050. Taken 45 together, the evidence points to an increased risk (compared to the assessment in AR4) that significant crop yield 46 declines will occur in tropical and sub-tropical regions. 47 48 Regional climate change impacts on crop yields would result in increased prices of food commodities on the global 49 market (Lobell et al. 2011, Battisti & Naylor 2009) even under an assumption of barrier-free ability to change the 50 areas under cultivation (Julia and Duchin 2007). Weather-induced yield losses, such as drought in Australia and 51 Europe which occurred in recent years have affected food prices in many countries (World Bank 2011, FAO 2008), 52 for example increasing the number of malnourished people by 75 million in 2007 [CITE]. While many of these price 53 rises may not be related to climate change, climate change is projected to increase the frequency of extreme weather 54
FIRST-ORDER DRAFT IPCC WGII AR5 Chapter 19
Do Not Cite, Quote, or Distribute 20 11 June 2012
that can reduce in crop yields and increase their year-to-year variability (Diffenbaugh et al 2012; Urban et al 2012), 1 and there is some specific evidence that climate change induced yield losses are already affecting food prices 2 (Lobell et al. 2011). Furthermore, developing countries which have limited financial capacity for trade, and/or food 3 distribution networks may be damaged by increases in extreme weather events (FAO 2008) leading to increased risk 4 of poverty and malnutrition. One study used historical vulnerability to extreme weather events to project that 5 Bangladesh, Mexico, Mozambique, Malawi, Tanzania and Zambia would be most at risk under 21st century climate 6 change in the SRES A2 scenario (Ahmed et al 2009), whilst another (Jones & Sanyang 2008) noted that experienced 7 food price rises have reduced food security in African countries, especially in Kenya and Ethiopia. Developed 8 countries which currently enjoy imported foods from tropical regions that become affected by climate change, 9 would see the prices of those commodities rise. More generally, pressure on land use for biofuels is likely to further 10 exacerbate food prices (see sections 19.3.2.2.2, 19.4.2.1). 11 12 On longer timescales, new techniques for assessing climate change impacts on yields of soybean, maize and cotton 13 (Schlenker & Roberts 2009) result in higher projections of yield declines compared to studies assessed in AR4: yield 14 losses reach 30-46% by the end of the century under a low emissions scenario, or 63-82% under a high emissions 15 scenario. However, these approaches are not necessarily accepted as better than earlier studies (Xref Ch 7). Global 16 rice prices may be particularly sensitive to climate change (Chen et al 2012), potentially rising by 7-13% in the wake 17 of projected 1.6-2.7% losses in yield resulting from a combination of climate change and sea level rise. Another 18 study (Warren et al 2011) highlights that 50% of the world’s cropland is projected to become less suitable for 19 cultivation over the same period. A recent report (Foresight, 2011) highlights the combined agricultural land losses 20 expected in the next 40 years, due to desertification, erosion and sea level rise (the latter leading to increased 21 salination). The report does not estimate the percentage of agricultural land involved, but if large, such changes 22 would further increase global food prices, increasing the risk of poverty and malnutrition (World Bank, 2011). 23 24 25 19.4.2. Indirect, Trans-boundary, and Long-Distance Impacts of Adaptation 26 27 Risk can also emerge from unintended consequences of adaptation (see 19.3.2.5), and this can act across distance, if 28 for example, there is migration of peoples or species from one region to another. Adaptation responses in human 29 systems can include land use change which can have both trans-boundary and long distance effects; and changes in 30 water management, which often has downstream consequences. In some cases such interactions may contribute to 31 conflict. 32 33 34 19.4.2.1. Human Migration and Displacement 35 36 Human migration is one of many possible adaptive strategies or responses to climate change (Reuveny 2007; Piguet 37 2008; Tacoli 2009: McLeman 2011). Regional climatic changes are among the many factors which have contributed 38 to migration to urban areas as individuals seek work for the purpose of sending remittances home. By pursuing 39 economic opportunities in other regions, people build resilience to climate impacts by distributing risks of economic 40 loss through income diversification and circular mobility patterns (Adger et al. 2002; Tacoli 2009). Displacement 41 refers to situations where choices are limited and movement more or less compelled by land loss due to sea level rise 42 or extreme drought, for example (see AR5 WGII chapter12.4). A number of studies have linked past climate 43 variability to both local and long distance migration (Lilleør and Van den Broeck 2011). In addition to positive and 44 negative outcomes for the migrants, migration from one region results in significant indirect, (and in some cases, 45 long distance) effects on people and states in other regions. Consequences for receiving regions, determined by a 46 variety of metrics, could be both positive and negative, as may also be the case for sending regions (McLeman 2011; 47 Foresight 2011; AR5 WGII Chapter 12). An emerging literature examines potential changes in migration due future 48 climate changes but projections of specific positive or negative outcomes are not yet available. Nevertheless, the 49 potential for negative outcomes is an emergent risk of climate change. Furthermore, recent literature underscores 50 risks previously ignored: risk arising from the lack of mobility in face of a changing climate, and risks entailed by 51 those migrating into areas of enhanced risk, like low-lying coastal deltas (Foresight 2011; see Chapter 12). 52 53
FIRST-ORDER DRAFT IPCC WGII AR5 Chapter 19
Do Not Cite, Quote, or Distribute 21 11 June 2012
Past experience suggests that population movement within vulnerable countries would be the predominant mode of 1 migration in response to climatic and other environmental stress (McLeman 2011; Massey et al 2010; de Haas 2011) 2 with, however important exceptions (Feng et al 2010, Marchioli et al 2012) where international migration could be 3 large. In areas with strong economies, rural-urban migration is currently predominant. It is, however, not the only 4 form of movement that can occur inside countries. Rural-rural migration is particularly widespread in agriculture-5 based economies (Tacoli 2009). In Burkina Faso, temporary moves to other rural areas have increased as a result of 6 a reduction in rainfall (Henry et al. 2004), indicative of a sensitivity also seen in agent based modeling of future 7 responses (Kniveton 2011). Furthermore, the local and regional nature of past climate variability limits its utility as 8 an analog for the effect of future global scale climate changes on migration. Climate change-induced drought has 9 prompted both short-distance (Tacoli 2009) and long distance international migration, with the Mexican drought of 10 the 1990s providing an example of the latter (Saldaña-Zorrilla S, Sandberg K 2009; Feng et al 2010). 11 12 Several studies have discussed potential future migration resulting from climate change on a global or regional basis 13 (Myers 2002; McLeman and Smit 2006; Stern 2007; Warner 2009), including some global estimates of very large 14 flows (Myers and Kent 1994). Three recent studies use statistical analysis to isolate and quantify migration 15 responses to past climate variability and then project migration later in this century assuming sensitivity to future 16 climate changes resembles that to past variability. These studies attempt to distinguish past climate-driven migration 17 from the influences of variations in non-climate factors that may simultaneously affect migration behavior, such as 18 policies affecting domestic and international migration as well as unrelated political, economic and household 19 factors. A study of Mexico-US immigration under the B2 warming scenario projects cumulative immigration by late 20 in this century of 1.4-6.4 million additional people due to the effects of climate change on the agricultural sector 21 alone (Feng et al 2010). A similar approach to US domestic migration projects that 3.7% of the adult population 22 (ages 15-59) will emigrate from rural counties of the Corn Belt in the medium term (2020-2049) under the B2 23 scenario (Feng et al 2011). A study examining the relationships among climate variability, wages, and urbanization 24 (Marchiori et al 2012) projects that under A1B and mid-range regional population growth, an additional 11.8 million 25 people will migrate annually from and within Sub-Sahara Africa. To different extents, all three studies are ceteris 26 paribus and thus unable to account for shifts in national demographic (Hugo 2011) and income structures, and pre-27 existing immigrant networks (Munshi 2003), which interact with the influence of climate and which pose a 28 significant challenge (Hunter 2005) to any analysis aimed at singling out the effects of climate change. In addition, 29 omitted variable bias may limited the value of the projections in the Marchiori et al (2012) study (Lilleør and Van 30 den Broeck 2011). Nevertheless, all three studies find a sensitivity of migration to past climate variations and 31 support the general conclusion that future climate change of similar or greater magnitude will affect migration flows 32 in a significant way. 33 34 A study using a different approach, modeling the effect of changes in land value on incomes in the agricultural 35 sector, projects substantial climate-driven migration of approximately 20,000 (SRES B2) to 250,000 (SRES A2) for 36 the period 2045-2050 in Northeast Brazil (Barbieri et al 2010). This method has the disadvantage of not drawing on 37 the past climate-migration relationship but has the advantage of avoiding some of the limitations of a ceteris paribus 38 approach. The potential international component of migration was not estimated. 39 40 Taken together, these studies indicate that substantial numbers of people may migrate under the influence of climate 41 change, creating risks as well as benefits for themselves and for sending and receiving regions and states. While a 42 literature projecting climate-driven migration has emerged, there is as yet insufficient literature which projects 43 region-specific consequences of such migration. 44 45 Climate change induced sea level rise, in conjunction with storm surges and flooding, creates a threat of temporary 46 and eventually permanent displacement from low-lying coastal areas, the later particularly the case for small island 47 states (Pelling and Uitto 2001). The extent to which these responses are employed will depend on whether 48 governments develop strategies such as relocating people from highly vulnerable to less vulnerable areas nearby and 49 conserving ecosystem services which provide storm surge protection (Perch-Nielsen 2004) in addition to so-called 50 “hardening” such as building sea walls and storm barriers (Nordenson and Seavitt 2011). Numbers of people at risk 51 from coastal land loss have been estimated (Nicholls and Tol 2006, Ericson 2006, Nicholls et al 2011) but 52 projections of resulting anticipatory migration or episodic and permanent displacement are not available. 53 54
FIRST-ORDER DRAFT IPCC WGII AR5 Chapter 19
Do Not Cite, Quote, or Distribute 22 11 June 2012
1 19.4.2.2. Conflict and Insecurity 2 3 Violent conflict between individuals or groups arises for a variety of reasons; for example, violence may be used to 4 intimidate political or economic competitors, to redistribute or protect property rights, or to permanently alter social 5 institutions. When individuals or groups employ violence to achieve these or other objectives, they do so because it 6 dominates alternative actions (Fearon and Laitin, 2003, Collier and Hoeffler, 2007, Chassang and Padro-i-Miquel, 7 2009, Blattman and Miguel, 2010, Besley and Perssen, 2011, Dal Bo and Dal Bo, 2011). It has been hypothesized 8 that climatic changes can alter the prevalence or nature of violent conflicts by altering the environment in which 9 agents decide whether or not to take violent actions (Homer-Dixon, 1991, Diamond, 2005, Barnett and Adger, 10 2007). Violent conflict may become more prevalent if climate change increases the value of capturing control rights 11 to current or future resources (Dube and Vargas, 2007, Angrist and Kugler, 2008, Lei and Michaels, 2011), reduces 12 the benefit of peaceful employment (Miguel et al., 2004, Dube and Vargas, 2007, Schlenker and Roberts, 2009, 13 Hidalgo et al. 2010, Hsiang, 2010, Barrios et al., 2010, Jones and Olken, 2010, Dell et al, forthcoming), weakens the 14 institutions or governments that enforce the status quo (Burke and Leigh, 2010, Zhang et al., 2011, Bruckner and 15 Ciccone, 2011, Chaney, 2011, Burke, 2011), increases socio-economic inequality (Davis, 2002, Grove 2007, 16 Hidalgo et al. 2010, Zhang et al., 2011, Anttila-Hughes and Hsiang, 2012), makes the execution of violent activities 17 logistically easier (Meier et al. 2007, Harari and Ferrara, 2011, Butler and Gates, 2012), or directly alters the 18 decision-making process of individuals at the cognitive-psychological level (Kenrick and Macfarlane, 1986, 19 Anderson et al., 2000, Jacob et al., 2007, Larrick et al., 2011). 20 21 A large number of empirical studies have implicated climatic events as a contributing causal factor to the onset or 22 intensification of violent conflicts and social instability around the world, across a variety of spatial and temporal 23 scales [See Section 18.4.5.1] with most studies released after AR4 (Kenrick and Macfarlane, 1986, Anderson et al., 24 2000, Cullen et al., 2000, DeMenocal, 2001, Haug et al., 2003, Miguel et al., 2004, Levy et al., 2005, Kuper and 25 Kropelin, 2006, Zhang et al., 2006, Hendrix and Glaser, 2007, Jacob et al., 2007, Zhang et al., 2007, Grove 2007, 26 Yancheva et al., 2007, Burke et al., 2009, Bai and Kung, 2010, Tol and Wagner, 2010, Hidalgo et al. 2010, Buckley 27 et al., 2010, Bohlken and Sergenti, 2010, Pasquale and Travaglianti, 2010, Bruckner and Ciccone, 2011, Couttenier 28 and Soubeyran, 2011, Hsiang et al., 2011, Harari and Ferrara, 2011, Chaney, 2011, Zhang et al., 2011, Burke, 2011, 29 Larrick et al., 2011, Hendrix and Salehyan, 2012, Theisen, 2012). It remains unclear whether climatic events 30 contribute to the likelihood of violence through one of the pathways above or some other mechanism (Sutton et al., 31 2010, Hsiang & Burke, 2012, Gleditsch, 2012, Bernauer et al. 2012), however the large number of new studies 32 finding such an association indicates that changing patterns of violence should be considered an emerging risk. 33 34 The strongest studies of modern data examine whether high-frequency variations of climatic variables are associated 35 with rapid changes in the risk of violence (Hsiang & Burke, 2012). In these studies, the range of annual variations of 36 temperature, precipitation or water availability observed since midcentury is generally associated with changes in 37 the risk of various types of conflict by a factor of two (Hsiang & Burke, 2012). Because annual variability is 38 expected to increase for many locations under warming scenarios, these findings are directly relevant to the 39 projection of future social impacts. Furthermore, since future changes in mean climate conditions may be large in 40 magnitude compared to historically observed annual variability, extrapolating these historical associations to future 41 warming scenarios suggest that conflict risks might increase dramatically (Burke et al., 2009). 42 43 It has been suggested that gradual changes in locations’ mean climates should not exacerbate violence as much as 44 historical variability because populations may successfully adjust to slowly changing conditions in non-violent ways 45 (Buhaug, 2010, Hsiang et al. 2011, Gleditsch, 2012); however, it is also argued that since gradual changes are more 46 persistent, they may be more challenging to cope with because the conflict-buffering capacities of exposed 47 populations are replenished less often (Haug et al., 2003, Hendrix and Glaser, 2007, Buckley et al., 2010, Couttenier 48 and Soubeyran, 2011, Bruckner and Ciccone, 2011). In order to observe populations exposed to gradual but 49 persistent climate changes that are decades, centuries or longer in duration, empirical researchers examine historical 50 records, archeological remains and paleo-climatic data that necessarily predate the twentieth century (Stahle et al., 51 1998, Cullen et al., 2000, DeMenocal, 2001, Haug et al., 2003, Kuper and Kropelin, 2006, Zhang et al., 2006, Zhang 52 et al., 2007, Yancheva et al., 2007, Buckley et al., 2010, Tol and Wagner, 2010, Bai and Kung, 2010, Stahle, 2010, 53 Chaney, 2011, Zhang et al., 2011). While these older data describe historical climate changes that are a better proxy 54
FIRST-ORDER DRAFT IPCC WGII AR5 Chapter 19
Do Not Cite, Quote, or Distribute 23 11 June 2012
for anthropogenic warming than annual climate variations, the societies exposed to these changes are substantially 1 weaker proxies for modern societies (Hsiang & Burke, 2012). 2 3 A weakness with all studies making inferences from past behavior is the extent of ceteris paribus assumptions made, 4 in the same way that such assumptions place limitations on migration projection studies (see 19.4.2.1). Bearing this 5 caveat in mind and recognizing the limited value of negative inferences, it is nevertheless notable that in the 6 historical conflict studies above, there are many examples where gradual and persistent changes were associated 7 with higher rates of violence and less stable social, political or economic conditions, and there is little evidence that 8 gradual and persistent climate changes did not affect the likelihood of violent conflict. 9 10 11 19.4.2.3. Species Range Shifts: Consequences 12 13 One of the main adaptations of species to climate extremes and climate change is to move to more climatically 14 suitable areas. The resulting losses, gains, and changes in species abundance are having, and will continue to have, 15 profound impacts on how ecosystem function, posing risks to the services they provide (Dossena et al., 2012; 16 Millennium Ecosystem Assessment, 2005), including those related to climate regulation (Wardle et al. 2011). For 17 example, warming-driven expansion and intensification of Mountain Pine Beetle outbreaks in North American pine 18 forests have caused both declines in timber harvest and the conversion of forests from net carbon sinks to large net 19 carbon sources (Kurz et al., 2008). Predicted negative impacts of range shifts include redistribution of important 20 resource species (e.g. marine fishes, where catch potential is predicted to increase by 30-70% in high latitude 21 regions and decline by 40% in the tropics by 2055 (Cheung et al. 2010)), as well as new introductions of diseases to 22 people, livestock, crops and native species (Chakraborty & Newton, 2011; Jepsen et al., 2008; Gale et al., 2009; 23 Lafferty, 2009). Newly arrived species may prey on, outcompete or hybridize with existing biota, becoming weeds 24 or pests in agricultural systems (Thuiller 2007; Walther et al. 2009; Chown et al. 2012). 25 26 Despite successful range shifts being problematic in some cases, failure to track shifting climates also poses new and 27 serious risks to species and ecosystems. Species for which dispersal is limited by natural barriers (e.g. island 28 endemics), anthropogenic barriers (e.g. transformed land), their inherent biological characteristics (e.g. 29 morphological, behavioural or physical traits), disappearance of suitable climate conditions, or their reliance on 30 other organisms or habitats that shift at different rates, are at heightened risk of extinction (Root & Schneider 2006; 31 J. W. Williams & Jackson 2007; S. E. Williams et al. 2008; Thomas et al. 2010). Range shift limitations can be 32 further exacerbated by human responses to climate change, for example construction of dams and changing land use 33 (Kostyack et al. 2011).While some evidence suggests that species are keeping up with their shifting climatic 34 conditions (Chen et al. 2011; Gregory et al. 2009; Tingley et al. 2009), it remains to be seen whether this pattern will 35 manifest globally and across all species groups. In large regions, particularly in the tropics, climate change is 36 predicted to generate conditions unlike any occurring today (J. W. Williams et al. 2007); the risks and ecological 37 implications of species reshuffling into novel, no-analogue communities are, as yet, unknown (Root & Schneider 38 2006; J. W. Williams & Jackson 2007). 39 40 Current legal frameworks and conservation strategies face the challenges of untangling desirable species range shifts 41 from undesirable invasions, and identifying circumstances when movement should be facilitated versus inhibited. 42 New agreements may be needed to regulate new or altered national trans-boundary migration, for example under the 43 Convention of Migratory Species. As target species and ecosystems move, protected area networks will become less 44 effective for conserving them, necessitating re-evaluation and adaptation, including possible addition of sites, 45 particularly those important as either ‘refugia’ or migration corridors (Willis & Bhagwat 2009; Hole et al. 2011; 46 Hannah 2011). Assisted colonisation – moving individuals or populations from currently occupied areas to locations 47 with higher probability of future persistence – is emerging as a conservation tool for species that are unable to track 48 changing climates themselves (Hoegh-Guldberg et al. 2008; Richardson et al. 2009; Thomas 2011). At this stage, 49 however, difficulties in predicting target species’ invasiveness, in combination with economic constraints to 50 implementation, continue to impede its acceptance (Loss et al. 2011). Ex situ collections (i.e. in zoos, botanical 51 gardens, and seed and gene banks) are often seem as a fall-back resource for conserving threatened species, yet their 52 relatively low representation of global species and genetic diversity (Wyse-Jackson 2002; FAO 2010; Conde et al. 53 2011) limits the tools available to prevent extinctions of dispersal-limited species. 54
FIRST-ORDER DRAFT IPCC WGII AR5 Chapter 19
Do Not Cite, Quote, or Distribute 24 11 June 2012
1 2 19.4.3. Indirect, Trans-Boundary, and Long-Distance Impacts of Mitigation Measures 3 4 Mitigation, too, can have unintended consequences beyond its boundaries. If mitigation involves a form of land use 5 change, then regional implications can ensue in the same way as they can for adaptation (see 19.3.2.5). 6 7 8 19.4.3.1. Effects on Biodiversity 9 10 Mitigation reduces climate change impacts on biodiversity (Warren et al., 2012, ten Brink et al., 2010). However, 11 the impacts on biodiversity as a result of habitat destruction concomitant to widespread implementation of land 12 intensive biofuel production would offset any gains from the resulting reduction in climate change (ten Brink et al. 13 2010, Sala et al 2009). Second generation bioenergy, or use of degraded land, has a smaller impact (Searchinger et al 14 2008, van Oorschot et al 2010). It is possible to further offset losses due to land use change by increasing 15 agricultural productivity, thus reducing some of the competition for land use. Tropical forest, in particular, can also 16 be preserved under biofuel cropping strategies if the climate mitigation policy applied incorporates an economic 17 price for emissions from land use change (Thomson et al 2010). PinKoh (2007) suggests that the oil-yield efficiency 18 of major biodiesel feedstocks could be increased in order to reduce the pressure on land. Further details on these 19 interactions from a sectoral perspective are found in 19.3.2.2. 20 21 Climate change mitigation through ‘clean energy’ substitution may also have a profound negative impact on 22 biodiversity where it involves the construction of capital-intensive large hydroelectric dams, which will impact both 23 terrestrial ecosystems within the hydroelectric reservoir and surrounding areas and aquatic ecosystems far 24 downstream and far upstream along a river system (World Commission on Dams 2000). These impacts on 25 biodiversity may include high deforestation rates in the surrounding landscape due to (i) new roads, power 26 transmission lines, and new settlements to accommodate the large immigrant workforce involved in building large 27 dams, (ii) mass tree mortality within low-elevation inundated areas, and (iii) discontinuity of upstream fish 28 migrations (World Commission on Dams 2000; Bertham and Goulding 1997; Finer and Jenkins 2012; Anderson et 29 al 2006). In all cases, low-lying forests and savannas are disproportionately affected by the direct and indirect 30 impacts of building and maintaining a large dam. The biodiversity losses from large dams are particularly large 31 relative to benefits of the dams in relatively flat lowland areas where the ecological effect size of dams — which is 32 often expressed as the total inundated area (km2) per unit of electricity produced (MW/yr) — tends to be very high. 33 In addition to a wide range of ecological impacts, local indigenous populations are often displaced from their 34 traditional territories within the reservoir area and immediate vicinities — in direct contradiction of the UN 35 Declaration of Indigenous Rights (UN General Assembly 2007). In sum, there is a wide range of detrimental 36 biodiversity, carbon storage and socioeconomic consequences of augmenting hydropower generation, especially in 37 tropical countries, all of which require large dams to be reconsidered as low-impact energy sources. 38 39 40 19.4.3.2. Effects on Human Systems 41 42 Mitigation strategies will have a range of effect on human systems, dependent on the type of mitigation strategy as 43 well as the type of human system. Even within a particular mitigation strategy, effects may vary considerably. 44 Reforestation that properly mimics existing forest ecosystems in structure and composition would potentially benefit 45 human systems by stabilizing micro-climatic variation. It would also provide numerous benefits from the sustainable 46 harvest of non-timber forest products (NTFP’s) for food, medicine and other marketable commodities. However, 47 there is a generally longer time frame and greater expense involved in recreating a diverse forest system. In the 48 future, the short-term benefits from planting monoculture stands of tree species most beneficial for climate 49 mitigation may win out over more complex reforestation efforts. In this scenario, human systems may still benefit 50 from improved local climate effects but not benefit from the utilization of species in a diverse forest system. A 51 current example of this is found in China where the world’s largest reforestation effort has led to dense monoculture 52 stands of fast growing tree species through the Three Norths Shelterbelt Development Program (Zhang and Song 53 2005). Afforestation (foresting an area that was historically not forested) creates a similar set of costs and benefits. 54
FIRST-ORDER DRAFT IPCC WGII AR5 Chapter 19
Do Not Cite, Quote, or Distribute 25 11 June 2012
In both reforestation and afforestation, land tenure and ownership becomes an issue for human systems. Relocation 1 of human populations from agricultural lands in order to reforest would have negative consequences for those 2 affected unless clear and thoughtful strategies are implemented. In this scenario, it would be necessary to “mitigate” 3 the effects on human systems caused by climate mitigation. Efforts to preserve existing forests would have an 4 overall benefit for human systems since over the long term, the costs to maintain an intact forest are much lower 5 than the cost to restore a forest. Human populations utilizing NTFP’s may continue to benefit as long as such 6 utilization is carefully monitored for sustainability [CITES]. 7 8 More generally, mitigation strategies designed to reduce dependence on carbon-intensive fuels present a very 9 different set of circumstances in relation to human systems. The development of alternative and renewable energy 10 sources will have significant economic and market effects which could influence food prices (see also 19.3.2.2.2). 11 Some scenarios suggest a rise in energy costs solely due to the lower flexibility of renewable energy resources 12 compared to fossil fuels, which would in turn affect prices in the energy-dependent agriculture sector. This would 13 especially affect marginal populations who already devote a considerable portion of their household income to food. 14 [CITE] 15 16 17 19.4.3.3. Indirect Effects of Biofuels Production via Markets 18 19 Biofuels increase the demand for the commodities (feed stocks) they are produced from. This increase in demand 20 can be met in one of two ways: either through reduction in other demands for the commodity or an increase in the 21 supply of the commodity, both of which will happen as the price starts to rise in response to biofuel production. For 22 example, as the price of maize starts to rise, both humans and animal feedlots will reduce their use of maize, while 23 farmers have an incentive to plant more acres and increase the supply. The size of the price increase depends on the 24 demand and supply elasticities. The more elastic the supply or demand, i.e., the larger the change in quantity for a 25 given change in price, the lower will be the resulting price increases. By the same token, the share that is met 26 through a reduction in demand versus an increase in supply depends on the relative size of the elasticities. If the 27 supply elasticity is twice as elastic as demand, two thirds of the biofuel mandate will be met through new production 28 and one third through a reduction in demand. 29 30 Biofuels divert a significant share of global food production. For example, the 2009 US renewable fuel standard 31 requires that 9 billion gallons of ethanol be blended into gasoline. Using an average conversion ratio of 32 2.7gallons/bushel (Rajapol et al., 2007), the mandate diverts roughly 25% of US maize production1, or 11% of 33 global maize production to biofuels.2 Estimates of the supply and demand elasticity of basic grain commodities 34 (Roberts and Schlenker 2009) lead to a prediction that the 2009 Renewable Fuel standard will increase commodity 35 prices of maize, wheat, rice, and soybeans by roughly 20%, assuming one third of the calories used in ethanol 36 production can be recycled as feedstock (Roberts and Schlenker 2010). On the other hand, second generation 37 biofuels that can be grown on areas that are not suitable for commodity crops might induce less of a price effect if 38 they do not directly compete for the same land. 39 40 [FOOTNOTE 1: US maize production averages around 12.5 billion bushels in 2007-2011 (www.nass.usda.gov).] 41 42 [FOOTNOTE 2: US maize production constitutes 42% of global maize production (www.faostat.fao.org).] 43 44 The increase in commodity prices will give farmers an incentive to increase supply around the globe, and thereby 45 have the indirect effect of increasing CO2 emissions by an amount which remains uncertain. The central question is 46 how much of the additional supply will come from the intensive margin (higher yields per acre), and how much will 47 come from the extensive margin (more acres). Keeney and Hertel (2009) argue that yields respond to prices, yet 48 Roberts and Schlenker (2010) find that historically the growing area adjusted in response to exogenous price shocks. 49 Additional supply mainly comes from planting additional acres, raising the question of where the additional acreage 50 would come from. On the one hand, Fargonie et al. (2008) and Searchinger et al. (2008) find large CO2 effects of 51 indirect land use change. Deforestation would result in large indirect CO2 emissions, as does the production of 52 biodiesel using palm oil on peatlands that are drained (Miettinen, 2012). On the other hand, a study of biofuel 53 production in Brazil (Barr et al. 2011) finds that once pasture land is incorporated in the analysis, expansion into 54
FIRST-ORDER DRAFT IPCC WGII AR5 Chapter 19
Do Not Cite, Quote, or Distribute 26 11 June 2012
unexploited land is minor, i.e., most of additional cropland is predicted to come from conversion of pastureland. To 1 the extent that biofuel feed stock is grown on areas that were previously fallow, the indirect land effects would 2 further reduce CO2 emissions. 3 4 5 19.5. Other Emergent Risks 6 7 Most emergent risks appearing recently in the literature are related to multiple interacting systems and stresses 8 (section 19.3) or to indirect and long-distance impacts (section 19.4). However, an additional set of risks have 9 emerged related to particular biophysical impacts of climate change, including large temperature rise, ocean 10 acidification, and CO2 increases, and to the potential consequences of geo-engineering as a climate change response 11 strategy. 12 13 14 19.5.1. Risks from a Large Temperature Rise 15 16 Most climate change impact studies have been based on climate change scenarios corresponding to global mean 17 temperature rises of up to 3.5°C relative to 1990 (or 4°C above pre-industrial levels) (Parry et al. 2004, Hare 2006, 18 Warren et al. 2006, Fischlin et al. 2007, Easterling et al. 2007; [CITES]). Recently the potential for larger amounts 19 of warming has received increasing attention in the literature, motivated by the possibilities that future radiative 20 forcing could be higher than typically considered and that positive feedbacks between climate and the carbon cycle 21 could be strong (Betts et al. 2011; Sanderson et al., 2011). 22 23 Emerging risks associated with warming greater than 4 C above pre-industrial include the potential exceedance of 24 human physiological limits in some areas for a global temperature rise of 7°C above pre-industrial (Sherwood & 25 Huber 2011); the triggering of non-linear earth system responses (Lenton et al 2007, see section 19.6.3.5); 26 widespread disruption of ecosystem function and services, alongside projected extinction of a large proportion of the 27 earth’s biodiversity (Thomas et al 2007, Warren et al submitted) with potentially very large impacts on human 28 systems and the economy [CITE]; large increases in the proportion of the population exposed to water stress, fluvial 29 and coastal flooding, and hunger, especially in Africa (Sissoko et al 2010, Mougou et al 2010); the large investments 30 that would be required for adaptation; and the aggregate impacts of climate change on the economy (see 19.6.3.4). 31 32 [INSERT TABLE 19-2 HERE 33 Table 19-2: Key risks from large temperature rise. (to be provided with SOD)] 34 35 36 19.5.2. Risks from Ocean Acidification 37 38 Ocean acidification is defined as “a reduction in pH of the ocean over an extended period, typically decades or 39 longer, caused primarily by the uptake of carbon dioxide from the atmosphere, but can also be caused by other 40 chemical additions or subtractions from the oceans” (Feely et al., AR5 WG1 Ch. 3). It is a physical impact resulting 41 from CO2 emissions that poses emerging risks to marine ecosystems and societies that depend on them. Ocean 42 acidification is a relatively new research area, and the potential for associated risks to become key is magnified by 43 the fact that it is a global phenomenon and, without a decrease in atmospheric CO2 concentration, it is irreversible 44 on century timescales. 45 46 It is virtually certain that ocean acidification is occurring now (Dore et al., 2009; Byrne et al., 2010; Table 3.7.1 of 47 AR5 WG1 Ch. 3). The upper mixed layer of the ocean, which is in direct contact with the atmosphere, has 48 experienced a decline in pH that is consistent with predictions of about 0.1 pH unit since the preindustrial (Feely et 49 al., 2004). Because acidification is thermochemically driven by the difference in partial pressures of CO2 in the 50 atmosphere and the ocean (Takahashi et al., 2009), it will continue to increase in magnitude as long as the 51 atmospheric CO2 concentration increases (National Academy of Sciences, 2010). For example, if atmospheric CO2 52 concentration were to reach 800 ppmv, average pH of the surface waters would be expected to decrease by an 53
FIRST-ORDER DRAFT IPCC WGII AR5 Chapter 19
Do Not Cite, Quote, or Distribute 27 11 June 2012
additional 0.3 units (Feely et al., 2009; Feely et al. AR5 WG1 Ch. 3). Ocean acidification of deeper layers is also 1 occurring, but at rates dependent on ocean mixing (Caldeira and Wickett 2005; Ilyina et al., 2009). 2 3 Characterizing the risks of ocean acidification to marine organisms, populations, communities, ecosystems, and 4 fisheries is limited by the complexity of interactions across these scales and the relatively small number of studies 5 available for quantitative risk assessment. The degree of confidence in assessing the implications of ocean 6 acidification decreases along the chain of consequences from biogeochemical processes to organisms to ecosystems 7 to ecosystem services. The risks to many marine processes that directly affect organisms can be assessed with a 8 medium degree of confidence. 9 10 A recent statistical meta-analysis of more than 70 laboratory studies across multiple taxa concluded that ocean 11 acidification will have overall negative effects on organism growth, calcification, reproduction, and survival, but 12 with a high degree of variation across taxa (Kroeker et al., 2010). Ocean acidification can also affect the availability 13 of iron for marine photosynthesis, the rate of nitrogen fixation in several important cyanobacteria (Barcelos e Ramos 14 et al., 2007, Hutchins et al., 2007, Kranz et al., 2010, Kranz et al., 2009, Levitan et al., 2007) as well as the rate of 15 denitrification (Beman et al., 2011), and the chemical state and toxicity of some metals (Millero et al., 2009). Most 16 of these processes can pose emerging risks because they affect marine organisms, ecosystems, food webs, fisheries, 17 and biogeochemical cycling (National Academy of Sciences, 2010) (Figure 19-2). 18 19 [INSERT FIGURE 19-2 HERE 20 Figure 19-2: Assessment of impacts of ocean acidification on marine organisms through effects on various 21 biogeochemical processes Assessment based on (1) estimated likelihood that the process will be affected by ocean 22 acidification and (2) the magnitude of impacts to marine organisms. The width of the boxes roughly indicates the 23 uncertainty in the likelihood of the process being affected by acidification, while the height of the boxes roughly 24 indicates the magnitude of impacts to marine organisms. Height, width, and location of boxes are based on expert 25 opinion, with greatest subjectivity in judging impacts. Judgments are based on impacts expected with atmospheric 26 CO2 levels of 2-3x preindustrial levels (560-840 ppmv). This figure is meant to be broadly illustrative: with 27 sufficient information Low, Medium, and High would be defined quantitatively. For example, while the sign of the 28 impact on marine calcifiers is negative, the magnitude varies considerably across taxa and currently overall 29 quantification is not feasible (based on a meta-analysis by Kroeker et al. 2010).] 30 31 As indicated in Figure 19-2, changes in marine calcification are likely and the overall magnitude of impact to 32 calcifiers will be medium to high. This judgment is based on studies such as those that examine responses of marine 33 ecosystems to ocean acidification caused by natural carbon dioxide seeps (Hall-Spencer et al., 2008; Fabricius et al., 34 2011). These studies document significant changes in community composition, biodiversity, calcification rates, and 35 recruitment of corals at pH levels of 7.8, the expected pH once atmospheric CO2 concentration reaches 750 ppmv. 36 The latter study (Fabricius et al., 2011) showed that coral reef growth ceased completely at pH levels < 7.7 (at 37 atmospheric CO2 concentration > 970 ppmv). 38 39 The risks to ecosystem services are less certain. A recent synthesis of the vulnerability of individual nations to 40 reductions in the global mollusk harvest (Cooley et al. 2012) identified how changes in overall availability and 41 nutritional value of desired mollusk species could impact their economies and food availability, while 42 acknowledging the difficulty of directly linking ocean acidification to harvest; hence the emerging nature of this 43 risk. 44 45 46 19.5.3. Risks from CO2 Health Effects 47 48 There is increasing evidence that the impacts of elevated atmospheric CO2 on plant species will affect health via 49 two distinct pathways: the increased production and allergenicity of pollen and allergenic compounds, and the 50 nutritional quality of key food crops. The evidence for these impacts on plant species is increasingly robust and 51 recent evidence in the public health literature points to the potential for these risks to be sufficiently widespread in 52 geographical scope and large in their impact on human health to be considered an emergent risk. 53 54
FIRST-ORDER DRAFT IPCC WGII AR5 Chapter 19
Do Not Cite, Quote, or Distribute 28 11 June 2012
Climate change is expected to alter the spatial and temporal distribution of several key allergen-producing plant 1 species (Shea 2008), and increased atmospheric CO2 concentration, independent of climate effects, has been shown 2 to stimulate pollen production (Rasmussen 2002; Clot 2003; Galán 2005; García-Mozo et al. 2006; LaDeau and 3 Clark 2006; Damialis et al. 2007; Frei and Gassner 2008). Ziska et al. (2000, 2003, 2012) found an association 4 between elevated CO2 concentrations and temperature with faster growing and earlier flowering ragweed species 5 (Ambrosia artemisiifolia) along with greater production of ragweed pollen (Wayne et al. 2002; Singer et al. 2005; 6 Rogers et al. 2006) leading, in some areas, to a measurable increase in hospital visits for allergic rhinitis (Breton et 7 al. 2006). Experimental studies have shown that poison ivy, another common allergenic species, responds to 8 atmospheric CO2 enrichment through increased photosynthesis, water use efficiency, growth, and biomass. This 9 stimulation, exceeding that of most other woody species, also produces a more potent form of the primary allergenic 10 compound, urushiol (Mohan et al. 2006). 11 12 While climate change and variability is expected to affect crop production (see Ch. 7), emerging evidence suggests 13 an additional stressor on the food system: the impact of elevated levels of CO2 on the nutritional quality of 14 important foods. A prominent example of the effect of elevated atmospheric CO2 is the decrease in the nitrogen (N) 15 concentration in vegetative plant parts as well as in seeds and grains and, related to this, the decrease in the protein 16 concentrations (Cotrufo et al., 1998; Taub et al., 2008;Wieser et al., 2008). Experimental studies of increasing CO2 17 to 550 ppm demonstrated effects on crude protein, starch, total and soluble Β-amylase, and single kernel hardiness, 18 leading to a reduction in crude protein by 4 to 13% in wheat and 11 to 13% in barley (Erbs at el, 2010). Other CO2 19 enrichment studies have shown changes in the composition of other macro- and micronutrients (Ca, K, Mg, Fe, Zn) 20 and in concentrations of other nutritionally important components such as vitamins and sugars (Idso and Idso, 2001). 21 The declining nutritional quality of important global crops is an emerging risk that has the potential to broadly affect 22 rates of protein-energy and micronutrient malnutrition in vulnerable populations. While this emergent risk has the 23 potential to become key, there is currently insufficient information to assess the likelihood that it will become key, 24 or under what ambient CO2 concentrations that this risk will manifest as key. 25 26 27 19.5.4. Risks from Geo-Engineering (Solar Radiation Management) 28 29 Geoengineering can be defined as deliberate large-scale efforts to manipulate physical, chemical, or biological 30 aspects of the climate system to counteract the consequences of increasing greenhouse gas emissions (IPCC, 2011). 31 Geoengineering is distinct from mitigation, in that mitigation aims to reduce or prevent actions that would change 32 the climate, such as emissions of gases and particles and changes to the land surface, while geoengineering involves 33 deliberate changes to the climate system itself. It is an emerging risk both because it poses risks to society and 34 ecosystems that could be large and widespread and because, although it is not a new idea (Rusin and Flit, 1960; 35 Environmental Pollution Panel, 1965; Budyko, 1974, 1977; Cicerone et al., 1992; Panel on Policy Implications of 36 Greenhouse Warming, 1992; Leemans et al., 1996; Dickinson, 1996; Schneider, 1996; Flannery et al., 1997; Teller 37 et al., 1997, 2000, 2002; Keith, 2000, 2001; and a long history of geoengineering proposals as detailed by Fleming, 38 2004, 2006, 2010), it has received increasing attention in the recent scientific literature, stimulated in part by 39 suggestions that nations consider geoengineering solutions to global warming in light of the absence of 40 comprehensive global abatement policy (Crutzen, 2006; Wigley, 2006). 41 42 Geoengineering has come to refer to both carbon dioxide concentration reduction and solar radiation management 43 (SRM; Shepherd et al., 2009; Lenton and Vaughan, 2009), and these two different approaches to climate control 44 raise very different scientific, ethical (Morrow et al 2009) and governance issues (Lloyd and Oppenheimer 2012). 45 Only SRM is discussed here, and unless otherwise noted, the term geoengineering will refer to SRM. Furthermore, 46 although various SRM schemes have been suggested, we focus on stratospheric aerosols and marine cloud 47 brightening as the only two schemes that seem to have the potential to produce effective and inexpensive large 48 cooling of the planet (Lenton and Vaughan, 2009; Salter et al., 2008; McClellan et al., 2010). 49 50 Cloud brightening requires the introduction of salt or other cloud condensation nuclei into marine stratus clouds to 51 induce the first indirect effect (Twomey effect – see AR5 WG I, Chapter 7) producing more, but smaller cloud 52 droplets, enhancing the cloud-top albedo, while not producing other effects that reduce the total cloud amount 53 (Wang et al., 2011). Stratospheric aerosols require injecting sulfate aerosol precursors into the lower stratosphere 54
FIRST-ORDER DRAFT IPCC WGII AR5 Chapter 19
Do Not Cite, Quote, or Distribute 29 11 June 2012
using airplanes or other means (Robock et al., 2009; McClellan et al., 2010) to increase planetary albedo and reduce 1 incident solar radiation. Much more work is needed on the physical mechanisms associated with both proposed 2 schemes before we can say if SRM is physically and economically feasible (IPCC, 2011) but for the purpose of this 3 section, we assume that both approaches are, and we assess the risks of employing them. 4 5 SRM would produce both benefits and risks (Robock, 2008b; Robock et al., 2009). Benefits include cooling the 6 planet, reducing or reversing melting of sea ice and ice sheets, increasing plant productivity and the terrestrial CO2 7 sink, beautiful red and yellow sunsets, and potentially, control of regional precipitation. Risks include undesirable 8 regional changes in climate; effects on ecosystems, stratospheric ozone, and tropospheric chemistry; implications for 9 mitigation strategies, including rapid warming if stopped; effects of weaker solar radiation on solar electricity 10 generation and passive solar heating; effects on airplanes, satellite remote sensing, and electrical properties of the 11 atmosphere; as well as a number of other effects. 12 13 Approaches to assessing these risks include climate modeling as well as studies of volcanic eruptions and ship 14 tracks. Observations of volcanic eruptions indicate that while stratospheric aerosols can reduce the global average 15 surface air temperature, they can also produce regional drought much like that depicted in Figure 19-3 (e.g., 16 Trenberth and Dai, 2007), cause ozone depletion through heterogeneous reactions on sulfate aerosols (Solomon, 17 1999), and change the ratio of diffuse-to-direct downward solar radiation, producing an increased carbon sink in the 18 land biosphere and reducing electricity generation from solar generators that use focused direct sunlight (Murphy, 19 2009). Ship track observations are indeterminate due tof the difficulty of separating clear bright stripes in satellite 20 images from the larger more diffuse cloud field that may also have an aerosol effect (e.g., Schreier et al., 2007; 21 Capaldo et al., 2009; Peters et al., 2011). 22 23 [INSERT FIGURE 19-3 HERE 24 Figure 19-3: Northern Hemisphere summer precipitation differences from the current climate averaged for the 25 second 10 years of a 20-year geoengineering period emitting 5 Mt SO2 per year into the tropical lower stratosphere 26 combined with A1B (Fig. 8, Robock et al., 2008). Hatch marks indicate changes significant at the 5% level. Note 27 large reductions over India and China.] 28 29 Climate modeling studies of stratospheric sulfate aerosol approaches indicate unintended and possibly harmful 30 impacts on the hydrologic cycle and ozone depletion (Robock et al., 2009). However, there is little agreement across 31 studies on the magnitude and regional pattern of these consequences, because studies have not assessed comparable 32 geoengineering scenarios. Some studies have injected similar amounts of SO2 into the stratosphere, but with 33 different regional distributions (Robock et al., 2008; Rasch et al., 2008; Jones et al., 2010). Others have 34 approximated net effects of stratospheric aerosols on the planetary energy balance by reducing the solar constant 35 (Govindasamy and Caldeira, 2000; Govindasamy et al., 2002, 2003; Matthews and Caldeira, 2007; Bala et al., 36 2008). Studies have also differed in assumptions about anthropogenic greenhouse forcing (Robock et al., 2008; 37 Jones et al., 2010; Ammann et al., 2010). 38 39 Cloud brightening would be expected to reduce global average temperature, but there would be large regional 40 differences in responses. Jones et al. (2009), for example, found a large reduction of precipitation over the Amazon 41 as a result of brightening clouds in the South Atlantic. However, modeling studies (Jones et al., 2009; Rasch et al., 42 2009; Partenan et al., 2012) are difficult to compare given model differences in the locations of marine stratus 43 clouds. 44 45 With either sulfate aerosol or cloud brightening approaches, globally averaged precipitation is expected to be 46 reduced as a consequence of reduced solar radiation, but the regional patterns of such a reduction are model-47 dependent (Bala et al., 2008). Some studies find that stratospheric geoengineering would reduce summer monsoon 48 rainfall relative to current climate in Asia and Africa (Figure 19-3), potentially threatening the food supply for 49 billions of people (Robock et al., 2008; Jones et al., 2010), but others find different regional patterns (Rasch et al., 50 2008). Past large volcanic eruptions have disrupted the summer monsoon (Oman et al., 2005; Trenberth and Dai, 51 2007) and even produced famine (Oman et al., 2006), but direct comparisons between geoengineering with 52 stratospheric sulfate aerosols and large volcanic eruptions are limited by the differences in forcing. Some 53 unanswered questions include whether a continuous stratospheric aerosol cloud would have the same effect as a 54
FIRST-ORDER DRAFT IPCC WGII AR5 Chapter 19
Do Not Cite, Quote, or Distribute 30 11 June 2012
transient one and to what extent regional changes in precipitation would be compensated by regional changes in 1 evapotranspiration. Ozone depletion via heterogeneous chemistry on stratospheric aerosol particles is also a concern 2 (Tilmes et al., 2008, Robock, 2008a; Rasch et al., 2008). 3 4 A model comparison project currently underway, the Geoengineering Model Intercomparison Project (GeoMIP; 5 Kravitz et al., 2011), aims to produce results regarding the consequences of SRM that are comparable across models 6 by carrying out a set of standardized experiments. Few results are available so far (Schmidt et al., 2012). 7 8 9 19.6. Key Vulnerabilities, Key Risks, and Reasons of Concern 10 11 In this section, we present key vulnerabilities, key risks, and emergent risks that have been identified by many of the 12 chapters of this report based on the material assessed by each. We then discuss dynamic characteristics of 13 vulnerability and risk, features which depend on future development pathways. After reviewing and updating the 14 Reasons For Concern in light of literature since AR4, we reinterpret them to be consistent with the framework of 15 evolving risk adopted in this chapter. 16 17 The examples in Table 19-3 are based on a selection from a larger number provided by the chapters of this report. In 18 order to present an overview of the implementation of the risk framework used in this chapter, examples were 19 selected to represent different thematic dimensions and key risks that are linked to different physical impacts and 20 various key vulnerabilities. 21 22 [INSERT TABLE 19-3 HERE 23 Table 19-3: A selection of the physical impacts or other hazards, key vulnerabilities, key risks, and emergent risks 24 based on the judgments of authors of various chapters of this report, utilizing the framework and systematization 25 described in 19.2. The table indicates how these four categories are related as well as how they differ. The table is 26 illustrative rather than comprehensive, aiming to show some examples of how of the framework may be applied 27 across different themes and topics in the chapters. In addition to these examples, key risks may also arise from 28 moderate vulnerability interacting with a very large physical impact.] 29 30 31 19.6.1. Key Vulnerabilities 32 33 Several of the risks noted in Table 19-3 arise because vulnerable people must cope and adapt not only to changing 34 climate conditions, but to multiple, interacting stressors simultaneously (see 19.4), which means that effective 35 adaptation strategies would address these complexities and relations. For example, the complex interactions of 36 stressors related to crop failure and famine include changing rainfall patterns, high dependence on rain-fed 37 agricultural in some regions with little access to alternative livelihoods, and limited coping and adaptive capacities. 38 These conditions periodically coincide with high global food prices that could in combination trigger crises. 39 40 41 19.6.1.1. Dynamics of Vulnerability 42 43 This sub-section deals with the meaning and the importance of dynamics of vulnerability, while section 19.6.1.3 44 assesses recent literature and data regarding observed trends of vulnerability mostly at a global or regional scale. 45 The literature provides increasing evidence that structures and processes that determine vulnerability are dynamic 46 and spatially variable (IPCC 2012; and section 19.6.1.3). The IPCC SREX report states with high confidence that 47 vulnerability and exposure of communities or social-ecological systems to climatic stressors and climate related 48 extreme events are dynamic, thus varying across temporal and spatial scales due to influences of and changes in 49 social, economic, demographic, cultural, environmental and governance factors (IPCC 2012, p. 7). 50 51 Examples of such dynamics in exposure and vulnerability encompass, e.g. population dynamics, such as population 52 growth and increasing exposure of people and settlements in low lying coastal areas in Asia (see Nicholls and Small 53 2002; Levy 2009; Fuchs/Conran/Louis 2011). Demographic changes, such as aging societies, have a significant 54
FIRST-ORDER DRAFT IPCC WGII AR5 Chapter 19
Do Not Cite, Quote, or Distribute 31 11 June 2012
influence on vulnerability to heat stress (see Staffogia et al., 2006; Gosling et al., 2009). Changes in poverty or 1 socio-economic status, race-ethnicity compositions as well as age structures had a significant influence in past crises 2 and disasters triggered by climate and weather related hazards. Cutter and Finch (2008) found that social 3 vulnerability increased over time in some areas of the United States due to changes in socio-economic status, race-4 ethnicity composition, age, and density of population. Such factors had a direct influence on the vulnerability of 5 people exposed to the Hurricane Katrina disaster (Cutter and Finch (2008). Changes in the strength of social-6 networks (e.g., resulting in social isolation of elderly) and physical abilities to cope with such extreme events 7 modify vulnerability (see e.g. Khunwishit 2007). 8 9 Important dynamics of human vulnerability have also been observed in the context of extreme impacts and disasters. 10 In some case human vulnerability might also change in different phases of crises and disasters. Hence, the factors 11 that might determine vulnerability before the disaster might differ from those that determine vulnerability thereafter 12 (post-disaster and recovery phases). The Indian Ocean Tsunami provides an example where disaster as well as the 13 disaster response and reconstruction processes and policies modified the vulnerability of coastal communities 14 (Birkmann and Fernando 2008). Overall, these examples underscore that a comprehensive assessment of 15 vulnerability would account for these dynamics. This also requires an improved assessment of long-distance impacts 16 (e.g., resulting from migration) and multiple-stressors (e.g. climatic stressors, recovery policies after disasters, etc.) 17 that often influence these dynamics. 18 19 The following subsection deals in greater depth with the phenomena of differential vulnerability based on recent 20 literature. 21 22 23 19.6.1.2. Differential Vulnerability 24 25 Wealth, education, race, ethnicity, religion, gender, age, class/caste, disability, and health status can illustrate and 26 contribute to the differential vulnerability of individuals or societies to climate and non-climate related hazards (see 27 IPCC 2012). Differential vulnerability is, for example, revealed by the fact that people and communities that are 28 similarly exposed face different levels of harm, damage and loss as well as success of recovery. The uneven effects 29 and the uneven suffering of different populations groups and particularly marginalized groups is well documented in 30 various studies and in the scientific literature (Kasperson and Kasperson 2001; Bohle et al., 1994; Thomalla et al., 31 2006, Birkmann 2006). Factors that determine and influence these differential vulnerabilities and exposure patterns 32 to climate change and climate related hazards encompass for example race and ethnicity (Elliot and Pais, 2006; 33 Fothergill et al., 1999; Cutter and Finch, 2008), socioeconomic class (O’Keefe et al., 1976; Peacock et al., 1997; 34 Ray-Bennet, 2009), gender (Sen, 1981), age (Bartlett, 2008; Jabry, 2003; Wisner, 2006b) as well as migration 35 experience (Cutter and Finch, 2008) and homelessness (see Wisner 1998) (see IPCC 2012). These differential 36 vulnerabilities are often attributed to specific populations at a particular scale. While local scale approaches can 37 assess a variety of quantitative and qualitative measures, global and national assessments are often based on existing 38 quantitative data (see Cardona 2006; 2008; Birkmann et al. 2011). In this context the usefulness of the specific 39 approach, method and indicators depends on the function and the application are of the approach (Cardona et al., 40 2003a; Carreño et al., 2007b). In general larger aggregations of population groups and resulting generalizations 41 require careful interpretation in terms of the actual vulnerability of specific populations (Adger and Kelly, 1999). 42 Furthermore, the scientific literature underscores that groups which are marginalized, particularly due to gender or 43 wealth status, are differentially affected by physical impacts of climate change in terms of both gradual changes in 44 mean properties as well as extreme events (e.g., Neal and Phillips, 1990; Enarson and Morrow, 1998; Neumayer and 45 Plümper, 2007). This body of literature is relatively recent, particularly in a developed world context, compared to 46 the longer recognition of gender concerns in the development field (Fordham 1998). Gendered vulnerability in 47 which women and girls are often (although not always) at greater risk of dying in disasters, is not solely linked to the 48 physical conditions, but rather determined by their being typically marginalized from decision making fora, and 49 discriminated and acted against in post-disaster recovery and reconstruction efforts (Houghton, 2009; Sultana, 50 2010). Hence, vulnerability in terms of gender is not determined through biology, but in most cases by social 51 structures, institutions and rule systems (IPCC 2012). 52 53
FIRST-ORDER DRAFT IPCC WGII AR5 Chapter 19
Do Not Cite, Quote, or Distribute 32 11 June 2012
Overall, the research findings and evidence regarding differential vulnerability emphasizes the social construction of 1 risk, meaning that climate change related physical impacts and stressors affect populations in ways that are 2 particular. 3 4 5 19.6.1.3. Trends in Vulnerability 6 7 Vulnerability as well as exposure of societies and social-ecological systems to physical impacts of climate change 8 are dynamic and depend on economic, social, demographic, cultural, institutional, and governance factors (see IPCC 9 2012, p.7). Population growth, rapid and unsustainable urban development, international financial pressures, 10 increases in socioeconomic inequalities, trends and failures in governance (e.g. corruption), and environmental 11 degradation are trends that modify vulnerability of societies and communities (Maskrey, 1993a,b, 1994, 1998; 12 Mansilla, 1996; Cannon, 2006) at different scales. Consequently, many of the factors that reveal and determine 13 differential vulnerability, such as socio-economic status, wealth, poverty, age, health conditions or migration 14 experience and governance processes (see 19.6.1.2) are dynamic, often changing over time in terms of their spatial 15 distribution. For example, wealth and its distribution, education, demography, health status and governance issues 16 are not solely characteristics that can be assessed at a particular time using widely agreed indicators, such as the 17 GINI index or the illiteracy rate; rather trends in these indicators can also be observed. The following section 18 assesses the knowledge base on observed trends in vulnerability, within the constraint that data for assessing such 19 trends in vulnerability is still fragmentary and much of it only recently emerging. 20 21 The trends outlined below serve as an illustration of the dynamic nature of vulnerability. They are not intended to 22 provide a comprehensive picture; rather they suggest for selected areas that the trends in the past in such indicators 23 heavily influenced vulnerability. The assessment and illustration of trends is differentiated into 3 broader categories: 24 I) trends in socio-economic, II) environmental and III) institutional vulnerability – which is closely linked with 25 questions of governance. These vulnerability trends are also examined in order to assess their potential and actual 26 overlap with climate related trends in order to determine risk. 27 28 29 19.6.1.3.1. Trends in socioeconomic vulnerability 30 31 Trends in poverty 32 Trends in poverty are arguably one of the key factors determining vulnerability of societies. Trends in poverty at the 33 local, national and global level have fundamental influences on the general levels of vulnerability, since, in 34 particular, poor and marginalized populations face severe difficulties coping or adapingt to additional stressors, such 35 as climate change and its physical impacts, due to the constraints in resources and adaptation options. For example, 36 past and recent trend analyses underscore that drought risk is intimately linked to poverty and rural vulnerability (see 37 GAR 2011, p. 62). That means the risk of loss of livelihoods and harm due to droughts is heavily influenced by the 38 poverty patterns of societies and communities exposed to drought, e.g. in Africa or Asia. Restocking by poor 39 pastoralists’ households in rural areas in Africa after a drought may take several years due to the limited financial 40 resources (see in detail Chapter 13). Interestingly, recent global studies for 119 countries (thus accounting for 41 approximately 95 percent of the global population) found that at the international level there is a clear decrease in 42 global poverty over the past six years (Chandy and Gertz 2011). The number of poor people globally fell by nearly 43 half a billion people, from over 1.3 billion in 2005 to under 900 million in 2010. This trend is expected to continue 44 at least until 2015 (according to Chandy and Gertz (2011). While the poverty rate at the global level is decreasing 45 and now accounts for approx. 16 percent of the total global population (in 2010), regional differences are significant. 46 Particularly, the highly drought exposed region sub-saharan Africa still has nearly 47% of its population living in 47 poverty, compared to an approximately 20% poverty rate in South Asia (poverty defined as people with less than 48 1.25 dollar per day). Accordinlgy, despite a global trend toward poverty reduction, there is a growing climate-related 49 risk in sub-saharan Africa due to the high poverty rate in combination with projected increases in dryness in the 50 region due to climate change (IPCC 2012, p. 15). 51 52 53
FIRST-ORDER DRAFT IPCC WGII AR5 Chapter 19
Do Not Cite, Quote, or Distribute 33 11 June 2012
Trends in income distribution 1 Income distribution patterns are an important factor linked to vulnerability. Variation of the GINI index, a measure 2 of income inequality, across selected countries in Africa, Asia, Latin America and Europe shows differential trends 3 and patterns. For example, Africa six countries show a significant increase in the inequality of income distribution, 4 while 13 countries show a reduced gap between rich and poor population groups. Increases in the GINI index can 5 also be observed in China, India, Indonesia and Bangladesh (Worldbank 2012). These countries not only represent a 6 large part of the world population, but are also highly exposed to climate change and respective hazards, such as sea-7 level rise in the case of Bangladesh and Indonesia (CIESIN et al. 2012; Birkmann et al. 2011) as well as droughts 8 and floods in the case of India and China (see PREVIEW/UNEP 2012; CRED EM-DAT 2011). The increasing 9 divide between poor and wealthy population groups in some countries could increase vulnerability, which in 10 combination with climate related hazards could increase risk. 11 12 Trends in health 13 Health conditions of individuals and population groups affect vulnerability to climate change by limiting of coping 14 and adaptive capacities to deal with additional stressors. Consequently, trends and conditions in the burden of 15 disease and associated risk factors (Mather and Loncar, 2006) at a variety of geographical scales may affect local to 16 global levels of vulnerability. The IPCC SREX report underscores, for example that obesity, a risk factor for 17 cardiovascular disease, is increasing in a number of countries (Skelton et al., 2009; Stamtakis et al., 2010), 18 increasing vulnerability of people to heat stress. Moreover, trends in HIV/AIDS, tuberculosis and malaria are also 19 observed in regions that are highly exposed to climatic hazards, such as Africa and South-East Asia. Some countries 20 exposed to these health risks also face significant limitations with regard to their health systems (Vitoria et al., 2009) 21 and therefore malaria and HIV/Aids occasionally reach epidemic proportions with severe consequences for the 22 ability of affected people to cope and adapt to additional climatic stressors. 23 24 Extreme heat events, characterized by consecutive days with abnormally high temperatures, are increasing in 25 frequency, intensity, and duration (IPCC SREX 2012) signaling an emergent public health risk, particularly for 26 urban populations. Advanced age represents one of the most significant risk factors for heat-related death 27 (Bouchama and Knochel 2002). In addition to having diminished thermoregulatory and physiologic heat-adaptation 28 ability, the elderly more often live alone, have reduced social contacts, and higher prevalence of chronic illness and 29 poor health (Khosla and Guntupalli 1999; Klinenberg 2002; O'Neill 2003). 30 31 The prevalence of these social and physiological vulnerabilities to extreme heat will increase as global populations 32 grow older. Aanalysis of global demographic trends for populations >60 years old indicate a substantial increase in 33 both the absolute size of the elderly population as well as a potential doubling or tripling of these groups as a 34 proportion of total population by 2100 (O’Neill, MacKellar, Lutz 2001). Another demographic trend affecting 35 vulnerability to extreme heat is population movement towards urban areas, which are currently gaining an estimated 36 67 million people globally per year—about 1.3 million every week. By 2030, approximately 60% of the projected 37 global population of 8.3 billion is expected to live in cities (United Nations 2006). 38 39 Urban areas are a largely transformed environment, from absence of native vegetation to an engineered 40 infrastructure that increases thermal-storage capacity, resulting in significant change in the urban climate compared 41 to adjacent rural regions, known as the Urban Heat Island effect (UHI). The combined effect of the high thermal 42 mass provided by concrete and blacktop roads, the low ventilation ability of the urban “canyons” created by tall 43 buildings, lower evapotranspiration due to replacement of soils by impermeable surfaces, and “point-source” heat 44 emitted from vehicles and air conditioners, adds to the temperature increases created by climate change (Brazel 45 2005). In real terms, relative to the surrounding rural and suburban areas, the UHI can add from 2 – 10 degrees 46 Fahrenheit to ambient air temperature (EPA 2005; Vose et al. 2004). More importantly, the UHI serves to absorb 47 heat during the daytime and radiate it out at night, raising the nighttime minimum temperatures, which have been 48 epidemiologically linked with excess mortality (EPA 2006). 49 50 Absent a sufficient increase in generating capacity, the projected increase (IPCC 2012) in the magnitude and 51 duration of extreme heat events (EHEs) would increase electrical demand for air conditioning during EHEs, severely 52 taxing the power grid infrastructure leading to rolling brown-outs or a large-scale power failure (Vine 2012). Model 53 projections of increases in extreme heat events and electrical demand for air conditioning indicate that under a 54
FIRST-ORDER DRAFT IPCC WGII AR5 Chapter 19
Do Not Cite, Quote, or Distribute 34 11 June 2012
variety of assumptions, cities experience electricity deficits during peak demand periods (Miller et al. 2008). 1 Electricity deficits during heat waves remove one of the most effective health interventions for heat-related illness 2 and death, access to an air-conditioned environment (Luber and McGeehin 2008). 3 4 Urbanization 5 In addition projected increase in the fraction of the population which is urbanized, the sheer numbers of urban 6 dwellers will represent a large pool of potentially vulnerable individuals, concentrated into relatively small areas. 7 The modification of environmental processes by urbanization in combination with increasing exposures to climatic 8 stressors, such as floods, flash floods or heat waves, may enhance the vulnerability of urban populations. Urban 9 megacities in developing countries and countries in transition are particularly complex systems characterized by 10 highly interwoven processes and rapid changes, while at the same time formal planning tools and measures often 11 cannot cope with the variety of changes accompanying urbanizaton, e.g. the rapid growth of informal settlements 12 and the resulting gap in provision of adequate infrastructure provision (Matthias and Coelho, 2007). These patterns 13 of urbanization increase vulnerability and exposure of people to climatic hazards, particularly due to the fact that 14 informal settlements are often located in hazard prone areas as well as due to the inadequate access to basic 15 infrastructure services (such as water and sanitation) (see e.g. UN Habitat, 2003; Utzinger and Keiser, 2006). 16 However, it is also important to note that urbanisation poses different implications for vulnerability (and adaptive 17 capacity) in different regions depending on the broader context of the socio-economic development status and 18 governance conditions (Garschagen and Kraas 2010; Birkmann et al. 2010). On the one hand, unplanned rapid 19 urbanisation in many parts of the developing world exceeds the capacities of public authorities to provide sufficient 20 infrastructures leading in general to increases in exposure and vulnerability; on the other hand, the contrary trend of 21 shrinking urban density in some parts of Western Europe or Northern America may also lead to increased levels of 22 vulnerability as social networks diminish and the efficiency of public infrastructures decreases. 23 24 25 19.6.1.3.2. Trends in environmental vulnerability 26 27 Ecosystem services 28 The environment provides a range of ecosystem services. These can be classed as provisioning (e.g. food and water), 29 regulating (flood and disease control), supporting (e.g. biogeochemical cycling), and cultural (e.g. aesthetic, spiritual 30 and recreational) (see e.g. MEA 2005). Environmental degradation and climate change will have a major impact on 31 the quality and availability of such services. Particularly, societies and communities that heavily rely on the quality 32 of ecosystem services, such as rural populations, are very likely to experience additional risks, for example due to the 33 increasing loss of supportive services of ecosystems. Such loss of services I part-and parcel to urbanization as 34 usually practiced; e.g., the loss of regulative services of soils and landscapes (e.g. buffer and filter function of soils 35 and vegetation) in rapidly urbanizing areas in flood plains and delta regions exacerbates vulnerability to flooding in 36 intense rainstorms. 37 38 Inevitably development pathways of societies and communities also influence the quality and degradation of 39 environmental services and functions which provide an important resource base for human development. 40 Approximately 90 percent of the world’s poor have been estimated to be directly or indirectly dependent on forests 41 for at least some of their income (World Bank 2002), while roughly 250 million people depend substantially on 42 fisheries for food and income (MEA 2005). Hence, large proportions of the world’s rural population – particularly in 43 developing countries – depend on ecosystem services and functions. Consequently, projected physical impacts of 44 climate change that modify and degraded these resource bases pose serious threats to human livelihoods and 45 economies at a range of scales (IPCC SREX 2012). There are a number of current environmental trends that threaten 46 human well-being and thus by extension human vulnerability (UNEP, 2007). Many communities have suffered 47 considerable losses due to extreme weather events in combination with the degradation of ecosystems and 48 ecosystem services, which have rendered them even more vulnerable to future climatic and non-climatic extreme 49 events. For example, agricultural productivity, food security, livelihoods and health are being affected by land 50 degradation which often starts with soil sealing, erosion, salinization, fire risk, over production, and land 51 fragmentation resulting from both natural and human-caused changes in climate, soil, vegetation conditions and 52 economic and population pressures (Salvati and Zitti, 2009). The extinctions of species and the loss of biodiversity 53
FIRST-ORDER DRAFT IPCC WGII AR5 Chapter 19
Do Not Cite, Quote, or Distribute 35 11 June 2012
pose a threat of diminution of genetic pools that otherwise buffer the adaptive capacities of social-ecological 1 systems in the medium and long-run (e.g. in terms of medicine and agricultural production). 2 3 4 19.6.1.3.3. Trends in institutional vulnerability 5 6 Governance 7 Institutional vulnerability refers to issues of governance. Governance is an important factor that influences 8 vulnerability and adaptive capacity of societies and communities as well as ecosystems exposed to climatic stressors 9 and physical impacts of climate change. At a general level Kahn (2005) concludes that states with strong institutions 10 and better governance face fewer deaths after extreme natural events than those with weak or absent institutions. 11 Weak or failed governance is a driver of vulnerability due to the fact that those countries classified as failed states 12 might not be able to guarantee their citizens basic standards of human security (see chapter 12). Secondly, weak 13 governance influences coping and adaptive capacities of societies and communities exposed to extreme events and 14 climate change related hazards (physical impacts) (WRI 2011). Although it is still difficult to measure aspects of 15 governance at the national and international level that bear severe implications for the vulnerability to climate 16 change, the Failed State Index (see Fund for Peace 2012 website; Foreign Policy 2012 website) as well as the 17 Corruption Perception Index (see Transparency International 2012) are two indicators and data sets that provide 18 initial insights into the issue. Trends in corruption - using the Corruption Perception Index - cannot be assessed for 19 all countries due to data constraints; however, existing data for, e.g., 47 countries in Africa suggest that about 16 20 countries succeeded in reducing their level of corruption, while 24 countries show an increasing trends in corruption 21 based on data from 1998 or 1999 to 2011 (see Transparency International 2012 website). In addition, the Failed 22 State Index, based on expert surveys and the conflict assessment system tool (CAST) method, captures widespread 23 violations of human rights, criminalization and de-legitimization of the state as well as massive movement of 24 refugees or internally displaced persons creating humanitarian emergencies. Trends in the Failed State Index from 25 2006 up to 2011 show that countries with severe problems in the functioning of the state cannot easily shift or 26 change their situation; However, as one example to the contrary, the Republic of Congo which ranked second in the 27 world list of failed states in 2006 improved its situation significantly and ranked 32 in 2011. Indonesia, the 28 Dominican Republic as well as Bosnia provide additional examples of significant improvement in terms of 29 governance based on the Failed State Index (see Fund for Peace 2012 website). Despite these examples of improved 30 governance and reduced institutional vulnerability, including some countries which are also highly exposed to 31 climatic hazards, there remains a negative trend at the global level: in 2006 the Failed State Index pointed to nine 32 countries that had severe problems in governance, and 13 such countries in 2011. Also the category below those 33 countries with severe problems in governance increased from 28 countries in 2006 to 35 countries in 2011. Hence, at 34 the global scale we observe an increase in countries with governance problems and conflicts that might also limit the 35 capacity of states to effectively prepare and respond to climate change and climate variability. This is an alarming 36 trend, since these countries are not in the position to support vulnerability reduction nor they can effectively support 37 coping and adaptation processes of people exposed to climatic stressors. Countries s characterized in some literature 38 as substantially failing in general governance or in some particular aspects of governance , such as Somalia and 39 Sudan, Haiti or Pakistan have shown in the past severe difficulties in dealing with extreme events, such as severe 40 droughts, storms or floods and complex emergencies (see e.g. Lautze et al. 2004; Ahrens and Rudolph 2006; in 41 terms of Pakistan see Khazai et al. 2011, p. 30-31, in terms of Somalia see Menkhaus 2010, p. 320-341). Unless 42 governance improves, an increase in risk is likely to occur as the climate changes. 43 44 45 19.6.1.4. Risk Perception 46 47 Risk perceptions influence the behavior of people in terms of risk preparedness and adaptation to climate change 48 (IPCC 2012; Burton et al. 1993, van Sluis and van Aalst 2006). Factors that shape risk perceptions and therewith 49 also influence actual and potential responses (and this vulnerability and risk) include a) interpretations of the threat, 50 including the understanding and knowledge of the root cause of the problem, b) exposure and personal experience 51 with the events and respective negative consequences, particularly recently (availability) c) priorities of individuals, 52 d) environmental values and value systems in general (see e.g. O’Conner 1999; Weber 2006; Grothmann and Patt, 53 2005; Kuruppu and Liverman 2011). Furthermore, Weber (2010) argues that the perceptions of risk and reactions to 54
FIRST-ORDER DRAFT IPCC WGII AR5 Chapter 19
Do Not Cite, Quote, or Distribute 36 11 June 2012
such risk and actual events are also shaped by motivational processes (Weber, 2010). In this context people will 1 often ignore predictions of climate change related stressors and extreme events if those predictions fail to elicit 2 emotional reactions. In contrast, if the event or forecast of such an event elicits strong emotional feelings of fear, 3 people may overreact and panic (see Slovic et al., 1982; Slovic 1993, 2010; Weber, 2006). Risk perceptions 4 particularly influence and increase vulnerability in terms of false perceptions of security. The disastrous tsunami in 5 Japan in March 2011 is one prominent example, where some coastal communities had a false sense of security due 6 to the existing protection structures (e.g., 10m wall) that had served as effective risk reduction measures in the past 7 during smaller tsunamis. Present risk management plans were developed using 400-year historical earthquake data 8 and did not foresee the great magnitude of the seaquake in March 2011 (Sagiya,2011). The tsunami hazard was 9 similarly underestimated (Hibbs 2012; Funabashi and Kitazawa 2012). Consequently, public perceptions of risks are 10 not solely determined by the “objective” information, but rather are the product of the interaction of such 11 information with social, institutional, and cultural processes and norms which are partly subjective (Kasperson et al., 12 1988). Studies about health, social psychology, and risk communication suggest that social and cultural risk 13 amplification processes modify perceptions of risk in either direction and in ways that may generally be socially 14 adaptive (APA, 2009; IPCC 2012). Finally, it is important to acknowledge that everyday concerns and satisfaction 15 of basic needs may prove more pressing than attention and effort toward actions to address longer-term risks and 16 changes in the light of climate change and risk (Maskrey, 1989, 2011; Wisner et al., 2004). Rather people’s 17 worldview and political ideology guide attention toward events that threaten their preferred social order (Douglas 18 and Wildavsky 1982). 19 20 21 19.6.2. Key Risks 22 23 19.6.2.1. The Role of Adaptation and Alternative Development Pathways 24 25 As discussed in section 19.2.4, the identification of key risks depends in part on the underlying socio-economic 26 conditions assumed to occur in the future, which can differ widely across alternative development pathways. 27 Literature since the AR4 has begun to compare impacts across development pathways and also to compare the 28 contributions of anthropogenic climate change and socio-economic development (through changes in vulnerability 29 and exposure) to climate-related impacts. The relative importance of development and climate change varies by 30 sector, region, and time period, but in general both are important to understanding possible outcomes. 31 32 For example, the impacts of climate change on food security and water stress have been found to be strongly 33 dependent on socio-economic conditions. The effect of climate change on the number of people at risk from hunger 34 generally spans a range of +/- 10-30 million across the four SRES scenarios, with the number rising to 120-170 35 million in some analyses based on the A2 scenario, which assumes high population growth (Schmidhuber & 36 Tubiello, 2007). Climate change impacts on food consumption or risk of hunger have been found to be small relative 37 to changes in these measures driven by socio-economic development alone (Nelson et al., 2010; Schmidhuber & 38 Tubiello, 2007). Similarly, a global study of water stress found that population growth was the primary determinant 39 of future water stress in a scenario in which global average temperature increased by 2 C (Fung et al., 2008). In a 40 scenario with a 4 C increase, both climate change and population growth were important to determining outcomes. 41 42 Sea level rise impacts will also depend on development pathways, due to the effect of development on the exposure 43 of both the population and economic assets to coastal impacts, as well as on the capacity to invest in protection 44 (Anthoff et al., 2010). A study of Europe found that socio-economic development dominated coastal impacts over 45 the first half of the 21st century, while over the second half both the amount of sea level rise and development were 46 important (Hinkel et al., 2010). Projected changes in heat-related mortality in Europe by the 2080s have also been 47 found to be driven nearly as much by changes in population and age structure as by climate change, and more so if 48 the potential for acclimatization is taken into account (Watkiss & Hunt, 2012). 49 50 Assessments of the impacts of extreme events have also evaluated the role of development pathways. Several studies 51 argue that potential future damages from tropical cyclones are largely driven by socio-economic changes such as 52 growth in population and wealth, and much less by the climate change signal itself (Bouwer et al., 2007; Pielke Jr., 53 2007). Flood risk in Europe has been shown in some cases to be as sensitive to assumptions regarding future land 54
FIRST-ORDER DRAFT IPCC WGII AR5 Chapter 19
Do Not Cite, Quote, or Distribute 37 11 June 2012
use and distributions of buildings and infrastructure as it is to the climate change scenario assumed (Bouwer et al., 1 2010; Feyen et al., 2009). Climate change was the dominant driver when particular aspects of socio-economic 2 development, such as buildings and infrastructure, were excluded from the analysis (Linde et al., 2011) or when 3 biophysical impacts such as stream discharge, rather than its consequences, were assessed (Ward et al., 2011). 4 5 With few exceptions, most ecosystem impact studies do not account for changes in future socio-economic 6 conditions (Warren et al., 2011). A study of land bird extinction risk found some sensitivity to four alternative land 7 use scenarios, but risk was dominated by the climate change scenario (Sekercioglu, 2008). Similarly, a study of 8 European land use found that while land use outcomes were more sensitive to the assumed socio-economic scenario, 9 consequences for species depended more on the climate scenario (Berry et al., 2006). 10 11 Some studies have not accounted for future socio-economic change, but have evaluated the vulnerability of sub-12 groups of the current population to climate-related stresses, showing that socio-economic conditions are a key 13 determinant of risks to low-income households due to climate change effects on agriculture (Ahmed et al., 2009; 14 Hertel et al., 2010), to sub-populations due to exposure to heterogeneous regional climate change (Diffenbaugh et 15 al., 2007), and to low-income coastal populations due to storm surges (Dasgupta et al., 2009). Assessments of 16 environmentally induced migration have concluded that migration responses are mediated by a number of social and 17 governance characteristics that can vary widely across societies (Warner, 2010; chapter 19.4.X). These studies find 18 that variation in socio-economic conditions explain some of the variation in risks of associated with climate and 19 climate change. They therefore support the idea that alternative development pathways, which describe different 20 patterns of change in these conditions over time, should be expected to influence the future risks of climate change. 21 22 Explicit assessments of the potential for adaptation to reduce risks have been less common, but when undertaken 23 have indicated substantial scope for reducing impacts of several types. Assessments of the impacts of sea level rise 24 have begun to incorporate the possibility of adaptation through investing in coastal protection, as opposed to 25 accommodation or abandonment strategies, and have indicated that protection, and therefore a substantial reduction 26 in impacts, can be an economically rational response for large areas of coastline globally (Nicholls and Cazenave, 27 2010; Anthoff et al., 2010; Nicholls et al., 2008a, 2008b) and in Europe (Bosello et al., 2012). For example, a study 28 of sea level rise impacts in Europe found that adaptation in the form of increasing dike heights and nourishing 29 beaches reduced the number of people affected by coastal flooding by a factor of 110 to 228, and total economic 30 damages by a factor of 7 to 9 (Hinkel et al., 2010). Nonetheless, in some areas with higher vulnerability such as low-31 lying island states and parts of Africa and Asia, impacts are expected to be greater and adaptation more difficult 32 (Nicholls et al., 2011). 33 34 Similarly, the risk to food security could be reduced through policy and institutional reform, although most impact 35 studies have focused on agricultural production and accounted for adaptation to a limited and varying degree 36 (Ziervogel and Ericksen, 2010; Nelson et al., 2009; Lobell et al., 2008). A study of response options in Sub-Saharan 37 Africa identified substantial scope for adapting to climate change associated with a global warming of 2 degrees C, 38 given substantial investment in institutions, infrastructure, and technology, but was pessimistic about the prospects 39 of adapting to a world with 4 degrees of warming (Thornton et al., 2011; see also section 19.6.1). A study focused 40 on Europe identified improved water use efficiency and extension services as the highest priority agricultural 41 adaptation options available in that regions (Iglesias et al., 2012). 42 43 _____ START BOX 19-3 HERE ____ 44 45 Box 19-3. Illustrating the Shared Socioeconomic Pathways 46 47 A new generation of socio-economic and climate change scenarios is under development intended to serve as a 48 shared point of reference across research communities. Climate change scenarios are being produced by the climate 49 modeling community based on a set of four Representative Concentration Pathways (RCPs; Moss et al., 2007; 2010) 50 that vary widely in level and rate of change of radiative forcing. In addition, a set of Shared Socio-economic 51 Pathways (SSPs) is being developed that would characterize a wide range of possible development pathways 52 (Kriegler et al., 2010; Van Vuuren et al., 2011; Arnell et al., 2011; O’Neill et al., 2012). The use of SSPs and RCPs 53 (and climate model simulations based on them) to carry out scenario analyses is envisioned as having a matrix 54
FIRST-ORDER DRAFT IPCC WGII AR5 Chapter 19
Do Not Cite, Quote, or Distribute 38 11 June 2012
architecture, where each RCP could be used together with a range of SSPs, and similarly each SSP could be used in 1 conjunction with multiple RCPs. 2 3 One of the key aims of the scenario matrix architecture is to facilitate research and assessment that can characterize 4 the range of uncertainty in mitigation efforts required to achieve particular radiative forcing (or concentration, or 5 emission) pathways, in adaptation efforts that could be undertaken in preparation for and response to the climate 6 change associated with those pathways, and in residual impacts. All of these outcomes will be dependent on 7 assumptions regarding future socio-economic conditions described in SSPs. To provide a basis for characterizing 8 this uncertainty, SSPs are conceived of as being defined along two axes: socio-economic challenges to mitigation, 9 and socio-economic challenges to adaptation (see Figure 19-4). Socio-economic challenges to mitigation are defined 10 as consisting of two components: factors that tend to lead to high reference emissions in the absence of climate 11 policy because, all else equal, higher reference emissions makes the accompanying mitigation task larger; and 12 factors that would tend to reduce the inherent mitigative capacity of a society. Socio-economic challenges to 13 adaptation are defined as societal conditions related to exposure, sensitivity, and adaptive capacity that, by making 14 adaptation more difficult, increase the risks associated with any given climate change scenario. 15 16 [INSERT FIGURE 19-4 HERE 17 Figure 19-4: Definition of five Shared Socio-economic Pathways (SSPs) describing alternative development 18 pathways that span a range of challenges to adaptation and mitigation (O’Neill et al., 2012).] 19 20 SSPs will include qualitative narratives and quantitative information that will help characterize the future in a way 21 that will facilitate a wide range of studies at a variety of scales based on the SSPs, including integrated assessment 22 modeling studies. Although specific SSPs are still under development (O’Neill et al., 2012), the definition of the 23 principal axes along which they will vary is intended to facilitate research relevant to improving understanding of 24 how alternative development pathways influence key risks, biophysical impacts, and vulnerabilities. 25 26 _____ END BOX 19-3 HERE ____ 27 28 29 19.6.2.2. Relationship between Adaptation, Mitigation, and Residual Impacts at Regional and Sectoral Levels 30 31 [forthcoming] 32 33 34 19.6.3. Updating Reasons for Concern 35 36 The Reasons for Concern (RFCs) are five categories of impacts, or characteristics of impacts, that were introduced 37 in the IPCC TAR (Smith et al., 2001) in order to facilitate interpretation of Article 2 by aggregating a wide range of 38 individual consequences of climate change into a smaller number of broad categories. In AR4, new literature related 39 to the five RFCs was assessed, leading in most cases to confirmation or strengthening of the judgments about their 40 relevance to defining dangerous anthropogenic interference (Schneider et al., 2007; Smith et al., 2009). RFCs are 41 related to the framework of key risks, physical impacts, and vulnerabilities used in this chapter because each RFC is 42 understood to represent a broad category of key risks to society or ecosystems related to a specific type of physical 43 impact (extreme events, large-scale singular events), system at risk (unique and threatened systems), or 44 characteristic of risk to social-ecological systems (aggregate impacts on those systems, distribution of impacts to 45 those systems). For example, the RFC for extreme events implies a concern for risks to society and ecosystems 46 posed by extreme events, rather than a concern for extreme events per se. Because risks depend not only on physical 47 impacts of climate change but also on vulnerabilities of societies and ecosystems to those impacts, RFCs as a 48 reflection of those risks depend on both factors as well (see also 19.1). 49 50 51 52
FIRST-ORDER DRAFT IPCC WGII AR5 Chapter 19
Do Not Cite, Quote, or Distribute 39 11 June 2012
19.6.3.1. Unique and Threatened Systems 1 2 Unique and threatened systems include a wide range of physical, biological, and human systems that are restricted to 3 relatively narrow geographical ranges (Smith et al., 2001). Loss of or damage to such systems are key risks when 4 these systems have great importance to other systems and to society, and because in some cases such loss or damage 5 would be irreversible. AR4 stated with high confidence that a warming of up to 2°C above 1990-2000 levels would 6 result in significant impacts on many unique and vulnerable systems, and would increase the endangered status of 7 many threatened species, with increasing adverse impacts (and increasing confidence in this conclusion) at higher 8 temperatures (Schneider et al., 2007). 9 10 Since AR4, there is new and stronger evidence to support this judgment, particularly regarding species and 11 ecosystems. AR4 stated with medium confidence that approximately 20-30% of the plant and animal species 12 assessed to date are at increasing risk of extinction as global mean temperatures exceed a warming of 2-3°C above 13 pre-industrial levels (Fishlin et al. 2007). There is increased evidence of observed climate change impacts (including 14 those arising from changes in climate variability) in ecosystems, including range loss in plants and animals and 15 changes in phenology (Gange et al., 2007; PUdas et al., 2008; Moreno-Rueda et al., 2009; Furgal et al., 2009, 16 Devictor et al., 2008; Kusano and Inoue, 2009; Beckage et al., 2008; Thibault and Brown, 2008; Kelly and Goulden, 17 2008; Foden et al., 2007 ), and upon ecosystem composition and function (Blaum et al., 2007; Le Roux and 18 McGeoch, 2008; Vittoz et al., 2009). It has been suggested that an additional 10% of species are exposed to 19 increased extinction risk for each 1°C increase in temperature (CBD, 2009). Recent work has highlighted that 20 species which are widespread geographically are also at risk (Warren et al., submitted), not only endemics which 21 have tended to be a focus of study until now, implying a greater risk to ecosystem service provision (Gaston 2008; 22 Allesina et al., 2007). New work has exposed the potential for large turnovers in marine species in response to 23 climate change, putting marine ecosystem functioning at risk (Cheung et al., 2009), and has identified tropical 24 ecosystems (Deutsch et al., 2009; Wright et al., 2009; Kearney et al., 2009) and tropical island endemics (Fordham 25 and Brook, 2010) as particularly vulnerable, alongside polar, coral reef, mountain (Colwell et al., 2008) and 26 Mediterranean systems. Much new work has focused on synergistic impacts of climate-change induced increases in 27 fire, drought, disease, and pests (Flannigan et al., 2009; Krawchuk et al., 2009; Hegland et al., 2009; Koeller et al., 28 2009; Garrett et al., 2011; Garamszegi, 2011), leading to the projection of more severe impacts than in AR4 29 30 Regarding physical systems, there is new evidence about the risks to glaciers and the human systems that their 31 meltwater supports. Later this century, reduced meltwater flow from glaciers could reduce water availability in Asia 32 (Chakraborty & Newton, 2011; Shrestha et al 2011) and in the foothills of the Andes with implications for tourism, 33 hydropower and agriculture (Chevallier et al 2011). Although during the melting period flows would increase, the 34 risk of dangerous floods would increase as well. Regarding social systems, studies continue to find that projected 35 climate change threatens the hunting and food sharing culture of the Inuit population (Crowley et al 2011). 36 37 38 19.6.3.2. Extreme Events 39
[to be updated based on WGI SOD] 40 41 Extreme weather events (e.g., heat waves, intense precipitation, tropical cyclones) are physical impacts that can pose 42 key risks to societies that are exposed and vulnerable. The IPCC Special Report on Managing the Risk of Extreme 43 Events and Disasters to Advance Climate Change Adaptation (SREX, IPCC 2012) provides a comprehensive 44 assessment indicating modest changes in frequency of occurrence, intensity, and extent of these risks since AR4 45 (IPCC 2012 Ch. 3), while at the same time clarifying the factors which contribute to vulnerability, and means to 46 address the latter. Furthermore, SREX based its conclusions on new literature since AR4. Based on this report, we 47 assess that the risk from extreme events has not changed significantly since AR4. 48 49 50 19.6.3.3. Distribution of Impacts 51 52 The potential distribution of impacts is a category of climate change consequences that includes key risks to 53 particular societies and social-ecological systems that may be disproportionately affected due to unequal distribution 54
FIRST-ORDER DRAFT IPCC WGII AR5 Chapter 19
Do Not Cite, Quote, or Distribute 40 11 June 2012
of vulnerability and of physical climate impacts. AR4 concluded that there is high confidence that low-latitude, less-1 developed areas are generally at greatest risk and found that, because vulnerability to climate change is also highly 2 variable within countries, some population groups in developed countries are also highly vulnerable even to a 3 warming of less than 2°C (Schneider et al., 2007). These conclusions remain valid and are now supported by more 4 impact studies that explicitly consider differences in socio-economic conditions across regions or populations that 5 affect vulnerability. 6 7 Economic (including insured) disaster losses associated with weather, climate, and geophysical events are higher in 8 developed countries, while fatality rates and economic losses expressed as a proportion of GDP are higher in 9 developing countries (SREX-SPM), a finding that emphasizes the importance of exposure to the vulnerability of 10 human systems. 11 12 There is new evidence for a risk of widespread deterioration of regional food security in the 21st century with 13 warming levels of 1.5-2°C, due to new assessments of the role of CO2 fertilization (Hare et al. 2011) and of pests 14 and tropospheric ozone (Reilly et al 2007; Avnery et al., 2011; Sutherst et al., 2011). If partial Himalayan glacier 15 melt eventually reduces runoff, water availability would be reduced in an area of Asia that produces 25% of the 16 world’s cereals (Chakraborty & Newton, 2011, Shrestha et al 2011). 17 18 Agricultural yields are projected to increase in some regions and decrease in others in ways that may be difficult to 19 compensate for through international trade (Battisti & Naylor, 2009; Penny et al, 2010). Areas that are particularly 20 vulnerable include those surrounding the Namib and the Mediterranean due to projected desertification (Brauch 21 2006); the southern half of Russia, due to projected drought increase (Dronin & Kirilemko 2011); Australia, where 22 ongoing water stress and agricultural losses are projected to increase under further climate change (Risbey 2011, 23 Steffen et al 2011); and North Africa where current climate variability already produces severe impacts due to long 24 droughts (Sissoko et al 2010); and some parts of sub-Saharan Africa where large losses in agricultural production 25 could occur (Muller et al 2011)., 26 27 Finally, since AR4 there has been increased understanding confirming areas where natural ecosystems are 28 particularly vulnerable to climate change, for example the Wet Tropics of Queensland, Australia (a World Heritage 29 Area) and in southwest Australia, one of 25 identified global hotspots of high endemism (Hughes 2011), where even 30 1C of warming is projected to have negative effects. 31 32 33 19.6.3.4. Aggregate Impacts 34 35 The RFC pertaining to aggregate impacts includes risks to society or ecosystems that are aggregated globally into a 36 single metric, such as monetary damages, lives affected, or lives lost, although most aggregations in the literature are 37 carried out in monetary terms. Estimates of the aggregate, economy-wide risks of climate change have increased 38 since AR4 and their uncertainty has been more frequently acknowledged. Studies at the sectoral level have been 39 refined with new data and models, and have assessed new sectors. 40 41 For example, impacts on the health sector have not previously included the direct effects of heat and humidity on 42 productivity. New studies indicate that there is high confidence that these effects will have a negative impact on 43 global economic output and human welfare (Dell et al., 2009; Hsiang, 2010). Heat- and humidity-related declines in 44 available workdays of up to 19% by the middle of the century have been projected in some regions (Kjellstrom et 45 al., 2009; SRES A2 scenario). When considering effects of disease as well, labor productivity losses are projected to 46 lead to a global output loss of ~1.8% with ~3°C of warming above pre-Industrial levels and ~4.6% with ~6°C of 47 warming (Roson and Mensbrugghe, 2010). For more extreme levels of warming, beginning at about 8°C above pre-48 Industrial temperatures, some areas will become physiologically uninhabitable for humans for portions of the year in 49 the absence of adaptive measures such as fail-safe air conditioning (Sherwood and Huber, 2010). 50 51 Assessments of risks to coastal populations due to sea level rise have advanced through the application of more 52 geographically detailed coastal databases in models that include adaptation options (Hinkel and Klein, 2009). One 53 global study found that without investment in coastal protection, 50 cm of globally uniform sea level rise would 54
FIRST-ORDER DRAFT IPCC WGII AR5 Chapter 19
Do Not Cite, Quote, or Distribute 41 11 June 2012
displace about 70 million people by 2100, while 2 m of globally uniform sea level rise would displace about 187 1 million people; the costs of protection are estimated at $25 billion/year and $270 billion/year [in 1995 USD], 2 respectively (Nicholls et al., 2011, SRES A1B scenario). Similarly, an assessment of risks from tropical cyclones 3 that depend on both climate and socio-economic conditions projected an increase in cyclone damages globally of 4 $14-US$80 billion/year [in presumptive 2011 USD] by 2100 (0.01% of global GDP), on top of baseline damages of 5 $56 billion/yr (Mendelsohn et al., 2012; SRES A1B scenario). 6 7 Assessments of economy-wide consequences of climate change report results either as total damages or as marginal 8 damages, the latter represented by the social cost of carbon. Estimates of global aggregate impacts from integrated 9 assessment models (Figure 19-5) have increased modestly since AR4 (Nordhaus, 2008, 2011; Interagency Working 10 Group on the Social Cost of Carbon, United States Government, 2010; Roson and Mensbrugghe, 2010; Ackerman et 11 al., 2011; Hope, 2011; Bosello et al., 2012). Consistent with AR4, there remains high confidence that globally 12 aggregated figures underestimate the damage costs because they cannot include many non-quantifiable impacts 13 (Yohe and Tirpak, 2008; Warren, 2011; Kopp and Mignone, 2012). There is very high confidence that aggregate 14 estimates of costs mask significant differences in impacts across sectors, regions, countries and populations. In some 15 locations and amongst some groups of people with high exposure and high vulnerability, net costs per capita will be 16 significantly larger than the global average (Anthoff et al., 2009; Nordhaus, 2011; Warren, 2011). In addition, there 17 remains a low level of agreement between IAMs in the sectoral calibrations used to estimate global aggregate 18 damages (Figure 19-6). 19 20 [INSERT FIGURE 19-5 HERE 21 Figure 19-5: Representative global damage estimates, shown as a % of global output as a function of temperature. 22 FUND: (Interagency Working Group on the Social Cost of Carbon, United States Government, 2010). DICE: 23 (Nordhaus, 2008, 2011). PAGE: (Hope, 2011). CRED: (Ackerman et al., 2011). ENVISAGE: (Roson and 24 Mensbrugghe, 2010). ICES: (Bosello et al., 2012). Note that, of models shown, only DICE and CRED (the damage 25 function of which is recalibrated from that of DICE based on (Hanemann, 2008)) and PAGE attempt to include 26 uncertain catastrophic damages, and only ENVISAGE includes labor productivity lost due to heat/humidity. For 27 comparison, DICE 2007 damages are also shown considering only non-catastrophic impacts.] 28 29 [INSERT FIGURE 19-6 HERE 30 Figure 19-6: Breakdown of damages at 2.5°C above pre-industrial by sector in DICE 2007 (Nordhaus, 2007), FUND 31 2.7 (Warren et al., 2006) and ENVISAGE (Roson and Mensbrugghe, 2010), reflecting a low level of agreement 32 among the integrated assessment models used to estimate global aggregate damages. Modified from (Kopp and 33 Mignone, 2012). Note that the DICE calibration does not include damages due to changes in water resources as 34 distinct from temperature impacts on agriculture and forestry, and FUND and ENVISAGE do not include expected 35 catastrophic damages. Representations of changes in energy demand, coastal/sea level impacts, health and labor 36 productivity impacts, and impacts on settlements, ecosystem and tourism are included in all three models.] 37 38 Alternative measures of global aggregate damages have been proposed based upon historical and geographic 39 relationships between temperature and economic growth. Limited evidence suggests that higher temperatures 40 decrease growth rates in low-income countries by ~1.3%-2.5%/year per 1°C (Dell et al., 2009, 2012; Hsiang, 2010). 41 Consistent with studies on the relationship between temperature and labor productivity, higher temperatures appear 42 to reduce both agricultural and industrial output in low-income countries; they also appear to increase political 43 instability, which will also contribute to decreased economic growth (Dell et al., 2012). Modest changes in 44 economic growth rate can accumulate to large changes in output over time, although the studies conducted to date 45 do not address the possibility of long-term adaptation. 46 47 The aggregate damage estimates in IAMs exclude a number of potentially significant factors, including the 48 consequences of earth system tipping points (Lenton, in rev; Kopp and Mignone, 2012), intersectoral and 49 interregional interactions (see section 19.3; Warren, 2011) (Bosello et al., 2012) , and imperfectly substitutable 50 environmental goods, which reflects the fact that impacts on (for example) ecosystems cannot be replaced 1-for-1 by 51 an increased consumption of material goods (Sterner and Persson, 2008; Weitzman, 2010; Kopp et al., 2012). 52 Additionally, studies lack evidence for extrapolating damages from temperature increases at which impact studies 53 have been carried out to higher temperatures (Ackerman et al., 2010; Weitzman, 2010; Ackerman and Stanton, 54
FIRST-ORDER DRAFT IPCC WGII AR5 Chapter 19
Do Not Cite, Quote, or Distribute 42 11 June 2012
2012; Kopp et al., 2012). There is very high confidence that the exclusion of these factors leads to an underestimate 1 of global aggregate impacts. In addition, adaptation is treated differently across modeling studies (Patt et al., 2010) 2 (Hope, 2006; de Bruin et al., 2009; Bosello et al., 2010) (Bosello et al., 2012) and affects aggregate damage 3 estimates in ambiguous ways. 4 5 The social cost of carbon (SCC) is an alternative index of aggregate damages that measures the consequences of a 6 marginal increase in carbon dioxide emissions in a given year, aggregated across space, time, and probability (e.g., 7 Newbold et al., 2010; Nordhaus, 2011; Tol, 2011; Kopp and Mignone, 2012). Central estimates of the SCC have 8 increased since AR4. For example, the mean value of the 217 post-TAR social cost of carbon estimates incorporated 9 into the meta-analysis of Tol (2011), which are produced predominantly by the FUND model, is $31/tCO2. By 10 comparison, the meta-analysis of (Tol, 2005), cited in AR4, found a mean of $25/tCO2. 11 12 The uncertainty in SCC estimates has also increased since AR4. The post-TAR estimates in Tol (2011) have a 95th 13 percentile value of $112/tCO2, compared to $95/tCO2 in Tol (2005). Moreover, additional studies not included in 14 this meta-analysis (Hope, 2011; Ackerman and Stanton, 2012; Kopp et al., 2012) further reduce the level of 15 agreement and expand the uncertainty range (Table 19-4); including these results suggests high confidence that the 16 SCC is between $0 and $1,000/tCO2. Uncertainty in SCC estimates is high due to under-representation of 17 uncertainty in socio-economic scenarios, under-representation in some models of uncertainty in climate/carbon 18 cycle, fidelity issues regarding the reduced-form climate/carbon cycle models used in the principal IAMs (Warren et 19 al., 2010; Hof et al., 2011; Marten, 2011; van Vuuren et al., 2011), and low level of agreement regarding the 20 appropriate framework for aggregating impacts over time (discounting), regions (equity weighing), and states of the 21 world (risk aversion). The uncertainty range has increased since AR4 due to new estimates employing different 22 damage functions and discounting and risk aversion assumptions (Table 19-4). Quantitative analyses have shown 23 that SCC estimates can vary by ~2x depending on assumptions about future demographic conditions (Interagency 24 Working Group on the Social Cost of Carbon, United States Government, 2010), ~3x due to the incorporation of 25 uncertainty (Kopp et al., 2012), and ~4x due to differences in discounting (Tol, 2011) or alternative damage 26 functions (Ackerman and Stanton, 2012). A further source of uncertainty is whether and how the possibility of 27 catastrophic damages is accounted for (Weitzman, 2009; Dietz, 2010; Nordhaus, 2011b), which requires bounding 28 potential losses with a parameter akin to the value of a statistical life (representing, essentially, willingness to pay to 29 avoid human extinction) (Dietz, 2010; Kopp et al., 2012). 30 31 [INSERT TABLE 19-4 HERE 32 Table 19-4: Estimates of the Social Cost of Carbon. From AR4 WG2 20.6.1, with new values from DICE: 33 Nordhaus, in rev.; FUND: Anthoff et al., 2009; PAGE: Hope, in rev.; CRED: Ackerman & Stanton, in rev.; 34 matDICE: Kopp et al., in rev.] 35 36 37 19.6.3.5. Large-Scale Singular Events: Physical, Ecological, and Social System Thresholds and Irreversible Change 38
[to be updated based on WGI SOD] 39 40 Large-scale singular events (sometimes called “tipping points”) are abrupt and drastic changes in physical, 41 ecological, or social systems in response to smooth variations in driving forces (Smith et al., 2001; Smith et al 42 2009). They pose key risks because of the potential magnitude of the consequences, the rate at which they would 43 occur, and the limited ability of society to cope with them. 44 45 Regarding singular events in physical systems, AR4 expressed medium confidence that at least partial deglaciation 46 of the Greenland ice sheet, and possibly the West Antarctic Ice Sheet (WAIS), would occur over a period of time 47 ranging from centuries to millennia for a global average temperature increase of 1-4°C (relative to 1990-2000), 48 causing a contribution to sea-level rise of 4-6 m or more (Schneider et al., 2007). Recent studies are consistent with 49 these judgments but provide a more nuanced view. At the current time, the two ice sheets are making approximately 50 equal contributions to sea level rise [CK and CITE WGI]. Recent studies (McKay et al 2011, Kopp et al 2009) 51 suggest a comparable contribution from the two ice sheets during the Last Interglacial, which provides a partial 52 analog for 21st century warming. A recent study (Robinson et al 2012) lowered the threshold for near-complete 53 melting of the Greenland ice sheet to 0.8-3.2C above preindustrial temperatures from 1.9-5.1C global warming in 54
FIRST-ORDER DRAFT IPCC WGII AR5 Chapter 19
Do Not Cite, Quote, or Distribute 43 11 June 2012
AR4. Expert elicitations (Kriegler 2009) and other approaches (Good et al 2011) have led to assessments that a 1 complete melting of Greenland is unlikely below 2C and likely above 4C compared to current temperatures. The 2 question of whether the melting of Greenland is irreversible remains contested (Ridley et al 2010, Lunt et al 2004; 3 Robinson et al 2012). A threshold for the disintegration of WAIS remains difficult to identify due to shortcomings in 4 modeling the dynamical component of ice loss. Extreme exposure and vulnerability to the magnitude of sea level 5 rise associated with loss of a significant fraction of either ice sheet is found worldwide (Nichols and Tol 2006). 6 7 There is also additional evidence regarding singular events in other physical systems. Feedback processes in the 8 earth system cause accelerated emissions from wetlands, terrestrial permafrost and ocean hydrates but temperature 9 sensitivity of these processes is not known and progress in determining this has been slow. However, the risk of a 10 substantial carbon release from these processes increases with warming. Early model results indicate a modest 11 additional warming, on the order of several percent (O’Connor et al 2010, Archer et al 2009, Zhang et al 2009). On 12 the other hand, release of methane from permafrost may be abrupt. AR4 stated that Arctic summer sea ice 13 disappears almost entirely in some projections by the end of the century (AR4 WGI 10.3), but new work 14 constraining models with observations show that this could occur well before the end of the century (Wang and 15 Overland 2009, Boe et al 2009). Whether or not the physical process is reversible, effects of ice loss on biodiversity 16 may not be. Large uncertainties remain in estimating the probability of a shutdown of the Atlantic meridional 17 circulation. One expert elicitation finds the chance of a shutdown to be between 0 and 60% for global average 18 warming between 2-4C, and between 5 and 95% for 4-8C of warming (Kriegler et al 2009). Recent observational 19 evidence confirms the susceptibility of the Amazon to drought and fire (Adams et al 2009), and recent 20 improvements to models provide increased confidence in the existence of a tipping point in the Amazon (Lapola et 21 al 2009, Jones et al 2009, Malhi et al 2009). One study proposed a 2°C limit to protect the Amazon from 22 commitment to such a transformation (Phillips et al 2009). 23 24 Risks to biological systems include species extinction (see 19.6.3.1), which are sometimes classified as large-scale 25 singular events. Such tipping points will occur in different ecosystems with different levels of warming (Warren et 26 al 2010), and there is still uncertainty over when such points might be crossed. 27 28 29 19.6.3.6. Variations in RFCs across Socio-Economic Pathways 30 31 The determination of key risks as reflected in the Reasons for Concern (RFCs) has not previously been distinguished 32 across alternative development pathways. In the TAR, RFCs took only autonomous adaptation into account (Smith 33 et al., 2009). An update based on literature assessed in AR4 concluded that the RFCs reflect more steeply increasing 34 risk with global average temperature change in each category (Smith et al., 2009; Schneider et al., 2007, AR4 WG2 35 Ch. 19), but this conclusion was not based on a change in the assessment of future development pathways but rather 36 on evidence of some impacts already becoming apparent, higher likelihoods of some biophysical impacts, and better 37 identification of currently vulnerable populations. 38 39 However, the RFCs represent risks that are determined by both the physical impacts of climate change and the 40 vulnerability of social and ecological systems to climate change stresses. For some RFCs, this representation is 41 explicit. For example, the aggregate impacts of climate change depend on both the physical climate change impacts 42 and future socio-economic conditions (see Figure 19-7). In other cases ability to adapt, or lack thereof, is implicit, as 43 in the category of large-scale singular events: these impacts are considered key based on an assumption that it would 44 be difficult to adapt to such impacts for a wide range of socio-economic conditions. 45 46 [INSERT FIGURE 19-7 HERE 47 Figure 19-7: Illustration of the dependence of risk associated with the RFC related to aggregate impacts (section 48 19.6.3.4) on the level of climate change and vulnerability of society. For comparison, the representation from Smith 49 et al. (2009) is shown, which does not explicitly take vulnerability into account. It is assumed here to be based 50 implicitly on a medium level of future vulnerability. If future socio-economic conditions lead to more vulnerable 51 societies, the aggregate impact risks associated with a given level of climate change would be higher. If future 52 conditions lead to less vulnerable societies, risks for a given level of climate change would be lower. This figure is 53
FIRST-ORDER DRAFT IPCC WGII AR5 Chapter 19
Do Not Cite, Quote, or Distribute 44 11 June 2012
schematic; the specific degree of risk associated with particular levels of climate change has not been based on a 1 literature assessment.] 2 3 4 19.7. Assessment of Response Strategies to Manage these Risks 5 6 The management of key and emerging risks of climate change can include mitigation that reduces the likelihood of 7 physical impacts and adaptation that reduces the vulnerability of society and ecosystems to those impacts. This 8 section therefore assesses relationships between mitigation, adaptation, and the residual impacts that generate key 9 and emerging risks. It also considers limits to both mitigation and adaptation responses, because understanding 10 where these limits lie is critical to anticipating risks that may be unavoidable. Potential threshold impacts on 11 physical, ecological, and social systems (19.6.3.5) are particularly important elements of key risks, and the section 12 therefore assesses response strategies aimed at avoiding or adapting to them. Finally, this section considers 13 governance responses, which are particularly important elements of adaptation and mitigation strategies aimed at 14 managing key and emerging risks. 15 16 17 19.7.1. Relationship between Adaptation Efforts, Mitigation Efforts, and Residual Impacts 18 19 Response strategies to climate change can be thought of in broad terms as mixes of mitigation and adaptation that 20 together will imply some degree of residual impacts. Evaluating the potential mixes of mitigation, adaptation, and 21 impacts is an important task, since key risks and vulnerabilities for social-ecological systems will vary along with 22 these mixes, as will the nature of Reasons for Concern (19.6). The task is made complicated by the fact that it 23 requires joint consideration of alternative outcomes for both climate change and socio-economic development. Such 24 an approach is complicated because socio-economic development pathways will influence future emissions, land use 25 change, and therefore climate change (WG3, Ch. 5), and in turn climate change will influence development 26 pathways through feedbacks on social and economic systems, including policy responses (AR5 WGII Ch. 2, Ch. 27 20). 28 29 One perspective on these relationships is provided by studies of the benefits of mitigation, i.e., the impacts avoided 30 by mitigation, which sometimes also account for adaptation. Avoided impacts vary significantly across regions due 31 to (a) differing levels of regional (as opposed to global) climate change, (b) differing numbers of people and levels 32 of resources at risk in different regions (e.g. presence of unique ecosystems or the size of the human population 33 exposed to impacts), and (c) differing sensitivities and adaptive capacities of humans, species or ecosystems in 34 different regions. Similarly, residual impacts will differ between sectors due to (a) different levels of sensitivity and 35 (b) differing levels of adaptive capacity. They will also differ over time depending on which aspect of the physical 36 climate system is driving them. Benefits accrue most rapidly for impacts associated with ocean acidification, less 37 rapidly for those associated with change in temperature and/or precipitation, and least rapidly for impacts associated 38 with sea level rise such as coastal flooding, loss of mangroves and coastal wetlands. Sea level rise responds very 39 slowly to mitigation efforts so that mitigation can reduce the rate of sea level rise but under most emissions 40 scenarios, cannot halt it altogether (Meehl et al 2012). Global temperature can be stabilized as a result of mitigation 41 efforts, but even if anthropogenic CO2 emissions were reduced to zero, global average temperature would not 42 decline significantly from its peak over a century timescale (Solomon et al., 2011; Matthews and Caldeira, 2008). 43 Ocean acidification responds more quickly to changes in emissions of CO2 than does global temperature, with the 44 rise in pH ceasing several decades after stringent emission reductions begin (Bernie et al. 2010). 45 46 Figure 19-8 gives an example of regional and sectoral variation within a harmonized analysis on a global scale of the 47 avoided impacts of climate change resulting from efforts to implement stringent mitigation (Arnell et al, 2012). The 48 figure shows the impacts avoided by reducing greenhouse gas emissions from a SRES A1B scenario to one in which 49 global greenhouse gas emissions peak in either 2016 or 2030 and are reduced thereafter at 5% annually. The impacts 50 avoided increase over time and by the 2080s range from 20-70% across sectors. This study reported large benefits in 51 terms of avoided biodiversity impacts, which are confirmed by a more comprehensive independent study estimating 52 that 40-60% of the projected loss in species range can be avoided (Warren et al, 2012). Results from both studies 53 show that fewer impacts can be avoided when global emissions do not peak until 2030. 54
FIRST-ORDER DRAFT IPCC WGII AR5 Chapter 19
Do Not Cite, Quote, or Distribute 45 11 June 2012
1 [INSERT FIGURE 19-8 HERE 2 Figure 19-8: Climate change impacts avoided by two different mitigation scenarios compared to a no-mitigation 3 case (SRES A1B scenario). Since increases and decreases in water stress, flood risks and crop suitability are not co-4 located and affect different regions, these effects are not combined. From Arnell et al 2012.] 5 6 A limitation of this study, and in the literature more broadly, is the uneven treatment of adaptation. In some sectors 7 adaptation was not included. In contrast, the assessment of sea level rise impacts considered a range of adaptation 8 policies, showing that adaptation can greatly reduce the residual impacts (Nicholls et al 2011). 9 10 Other studies have also quantified the benefits of mitigation. Mitigation reduces by 80-95% the people additionally 11 at risk of hunger in 2080 in the SRES A2 scenario (mostly in Africa), corresponding to a global saving of an 12 estimated 23-34 billion US$ in terms of agricultural output (Tubiello & Fischer, 2007). Benefits varied regionally 13 and were negative in some cases, for example in developed countries due to a positive, though uncertain, effect of 14 CO2 fertilisation. Mitigation can also reduce overall potential welfare losses in the EU from 0.4-1% to 0.2-0.3% 15 (Ciscar et al., 2011), with losses in the agricultural sector changing to gains, and the numbers of additional people 16 affected by fluvial flooding decreasing from 318-396,000 annually to 251-276,000 annually. 17 18 Mitigation also produces benefits by reducing the rate of temperature increase, allowing more time for adaptation. A 19 study of biodiversity impacts found that stringent mitigation could increase by 3 to 4 decades the time available for 20 adaptation (Warren, 2012). 21 22 23 19.7.2. Limitations of Response Strategies 24 25 Key risks, impacts, and vulnerabilities to which societies and ecosystems may be subject will depend in large part on 26 the mix of mitigation and adaptation measures undertaken. However, mitigation and adaptation possibilities are not 27 unlimited, implying that some degree of residual damages will be unavoidable. 28 29 30 19.7.2.1. Limits to Mitigation 31 32 Assessment of maximum feasible mitigation (or lowest feasible emissions pathways) must account for the fact that 33 feasibility is a subjective concept encompassing technological, economic, political, and social dimensions (Hare et 34 al., 2010, UNEP Ch 2). Most mitigation studies have focused on technical feasibility, for example demonstrating 35 that it is possible to reduce emissions enough to have at least a 50% chance of limiting warming to less than 2 C 36 relative to pre-industrial (Edenhofer et al., 2010; Hare et al., 2010; den Elzen and van Vuuren, 2007; O'Neill et al., 37 2010; Clarke et al., 2009). Such scenarios lead to pathways in which global emissions peak within the next 1-2 38 decades and decline to 50-80% below 1990 levels by 2050, and in some cases exhibit negative emissions before the 39 end of the century. In contrast, no model-based scenarios in the literature demonstrate the feasibility of limiting 40 warming to a maximum of 1.5 C with at least 50% likelihood (UNEP, 2010; Ranger et al., 2012). 41 42 However, most studies of technical feasibility include a number of idealized assumptions, including availability of a 43 wide range of mitigation technologies such as large scale renewable energy, carbon capture and storage, and large 44 scale biomass energy. Most also assume universal participation in mitigation efforts beginning immediately, 45 economically optimal reductions (i.e., reductions are made wherever they are cheapest), and no constraints on policy 46 implementation. Any deviation from these idealized assumptions can significantly limit feasible mitigation 47 reductions (Knopf et al., 2010). For example, delayed participation in reductions by non-OECD countries made 48 concentration limits such as 450 ppmm CO2eq (roughly consistent with a 50% chance of remaining below 2C 49 relative to pre-industrial), and in some cases even 550 ppm CO2eq, unachievable in some models unless temporary 50 overshoot of these targets were allowed (Clarke et al., 2009), but not in others (Waldhoff 2011). Technology limits, 51 such as unavailability of CCS or limited expansion of renewables or biomass makes stabilization at 450 ppm CO2eq 52 unachievable in some models (Krey and Riahi, 2009). Costs may also become unacceptably high; for example, if 53 low carbon power plants and other infrastructure were limited to new installations (as opposed to replacement of 54
FIRST-ORDER DRAFT IPCC WGII AR5 Chapter 19
Do Not Cite, Quote, or Distribute 46 11 June 2012
existing stock), the maximum emissions reduction rate would be limited to about 3%/yr (Davis et al., 2010). 1 Similarly, if the political will to implement coordinated mitigation policies within or across a large number of 2 countries is limited, peak emissions and subsequent reductions would be delayed (Webster, 2010). 3 4 These considerations have led some analysts to doubt the plausibility of limiting warming to 2 C (Tol, 2009; 5 Anderson and Bows, 2008, 2011). "Emergency mitigation" options have also been considered that would go beyond 6 the measures considered in most mitigation analyses (van Vuuren and Stehfest, 2009; Swart and Marinova, 2010). 7 These include drastic emissions reductions achieved through limits on energy consumption (Anderson and Bows, 8 2011) or geoengineering through management of the earth's radiation budget (19.5.4; WGI Ch. 6, 7). 9 10 11 19.7.2.2. Limits to Adaptation 12 13 Chapter 16.2 and 16.5 provide a thorough assessment of the literature on limits to adaptation. Discussions are 14 beginning on the nature of such limits, e.g. in terms of different dimensions of the limits of adaptation, including 15 financial or economic limits to adapt, but also social and political or cognitive limits of adaptation are emerging 16 issues. Furthermore, limits of adaptation are also recognized in terms of specific geographies, for example small 17 island developing states and their limited ability to adapt to increasing impacts of sea level rise, the limits of 18 adaptation of urban agglomerations in low-laying coastal zones (see e.g. Birkmann 2010b), or in relation to loss of 19 water supplies as a result of glacier retreat (Orlove 2009). 20 21 There is new literature on the limits to adaptation from the perspective of distinct dimensions such as physical limits, 22 or financial or social constraints (Adger 2009), which are pertinent to several key vulnerabilities and Reasons for 23 Concern. For example, with regard to the risk of extreme weather events (Birkmann 2010a), new findings on 24 physical limits may be of particular importance. Global warming of 7C would exceed a human adaptability limit to 25 climate change due to heat stress (Sherwood & Huber 2011) by creating small zones where human metabolic heat 26 dissipation would be impossible, and hence where lives would become dependent on air conditioning, and persons 27 could not go outside. A global warming of 11-12C was projected to expose most of the human population to this 28 level of risk. Since these estimates were based on extreme assumptions that the ‘people’ considered were doing all 29 that they could to stay cool, by being dowsed with water in high winds and not working, a much larger fraction of 30 the population could be at risk of life-threatening heat stress at lower, more realistic levels of global warming (see 31 19.3.10 and 19.6.1). 32 33 34 19.7.2.2.1. General considerations on key vulnerabilities and limits to adaptation 35 36 Intrinsic to any definition of “dangerous anthropogenic interference with the climate system” (UNFCCC, 1992, art 37 2) are assumptions about the capacity of natural systems, groups and societies to adapt to climatic change. The 38 UNFCCC refers specifically to adaptation of ecosystems, threats to food production and the sustainability of 39 economic development. There is evidence that while there are opportunities to adapt to climate change impacts in all 40 natural and human systems, those opportunities are not unlimited and that ‘residual damage’ following adaptation is 41 likely to occur in many cases (Smit and Wandel 2006; Stern, 2007; de Bruin et al., 2009; Patt et al., 2009). It is the 42 extent of these residual damages (following adaptation) that determine whether anthropogenic interference with the 43 climate is considered dangerous. If residual risks and damages are acceptable, or do not threaten ecosystems, food 44 production and economic development, then they would not be deemed dangerous, at least in the context of Article 45 2. Only when residual risks or damages are deemed unacceptable, or lead to undesired discontinuities in natural or 46 human systems, will they be perceived as dangerous interference [see 16.2.1]. 47 48 This argument can be extended to the analysis of ‘key vulnerabilities’ to climate change. A key vulnerability to a 49 social or biophysical system becomes evident once unacceptable risks or damages are experienced, following 50 adaptation. For this reason, the definition of key vulnerabilities would normally include an assessment of adaptation 51 opportunities and of the limits of adaptation to the social or biophysical risks identified. While the importance of 52 adaptation has been widely acknowledged in previous IPCC statements (Schneider et al., 2007, 19.2 and 19.4), 53 relatively little detailed attention has been paid to the complex question of limits to adaptation. Instead the focus has 54
FIRST-ORDER DRAFT IPCC WGII AR5 Chapter 19
Do Not Cite, Quote, or Distribute 47 11 June 2012
remained on assessments of globally-significant impacts of climate change. So, the AR4 assessment projects 1 ‘productivity decreases for some cereals in low latitudes’ and ‘productivity increases for some cereals in mid/high 2 latitudes’ with global mean temperature increases of 1-3°C by 2100 (medium/low confidence) (Schneider et al., 3 2007, Table 19-1). But there is also an acknowledgement of the large potentials for adaptation in food production. 4 Without some assessment of potential limits to adaptive capacity in agriculture – for instance, by pointing to 5 evidence of slowing potential yield growth in key cereal crops (Fischer and Edmeades, 2010) – it may remain hard 6 to judge the significance of these productivity changes for the vulnerability of global food supply. 7 8 Adaptation may fail to prevent residual damages due to climate change impacts for different reasons. First, there 9 may be a lack of opportunity to adapt. For instance, along some coasts there are few plausible options to respond to 10 sea-level rise of over a meter in a century (Tol at al., 2007; Nicholls et al., 2010), or as on some Torres Straits 11 Islands, adaptation to rising seas through retreat may not be an option due to limited high land (Green et al, 2009). 12 Second, there may be constraints on the deployment of available adaptation options or strategies. There is 13 substantial evidence that a range of perceptual, economic and institutional factors determine whether or not 14 organizations in the private or public sectors choose to adapt to reduce potential vulnerabilities to climate change 15 impacts (Ivey et al., 2004; Naess et al., 2005; Moser et al., 2008; Storbjork, 2010; Farley et al., 2011; Berrang-Ford 16 et al., 2011; Berkhout, 2012). Third, there may be biophysical, technical, economic or other limits to adaptation. For 17 instance, there may be physiological limits to heat-tolerance of certain key crops, such as wheat and maize (IPCC, 18 2007, TS Fig TS.7). Likewise, there are technical limits to artificial snow-making in response to less reliable snow 19 conditions for skiing (Scott and McBoyle, 2007; Hoffman et al., 2009), or there may be economic limits to the 20 insurability of disaster risks [see Box 16-4]. 21 22 The existing scientific literature on limits to adaptation does not present a mature set of definitions, nor a consistent 23 conceptual framework. Nor is there a consistent treatment of adaptation limits in the literature on adaptation. A 24 number of different meanings are described and this has worked to confuse an important scientific and policy 25 debate. The IPCC AR4, for example, used the terms constraints, barriers, and limits interchangeably to describe a 26 variety of impediments to adaptation (Adger et al., 2007), and a similar confounding of meanings is evident across 27 the literature. In AR5 [16.2] an adaptation limit is defined as ‘…a situation in which an actor's objectives and values 28 can no longer be secured from unacceptable risks through adaptive action, or where biophysical change threatens a 29 valued ecosystem service.’ A limit to adaptation means that either no adaptation options exist, or that an 30 unacceptable measure of adaptive effort is required to secure social objectives and values, or for a biological system 31 to survive intact in its current state. Social objectives include, for instance, standards of safety (e.g. 1 in 500 year 32 levees) or safe drinking water supplies. Values include attributes such as social equity, cultural cohesion, and 33 preservation of livelihood practices. Key attributes of biophysical systems might include reproductive success of 34 keystone species, or the pattern of precipitation in a region. 35 36 This definition of adaptation limits as the point at which there are unacceptable risks to social objectives and valued 37 ecosystem services, points to the moral core for the concept. Defining when and for whom risks to social or 38 ecosystem values become unacceptable, leads the analysis on to complex ethical issues. There will be large social 39 and cultural differences in the exposure and vulnerability to climate-related risks, and the extent to which they are 40 felt to be acceptable or not (IPCC SREX, 2012). Complicating this picture further is the observation that social 41 values are not universal and are not static (O’Brien and Wolf, 2010). And these may not be economic values, but 42 intangible cultural, aesthetic or spiritual values. Berkes (2008: 163) documents that in Inuit culture the loss of sea ice 43 in summer months leaves some people feeling ‘lonely for the ice.’ Whether the risk of such a loss would be seen as 44 unacceptable remains a complicated question and raises ethical issues which remain unresolved. This discussion 45 points to a finding that limits to adaptation will often be perceived and experienced by actors as normative and 46 ethical, rather than technical and economic. 47 48 Predicting limits to social or ecological adaptation remains analytically difficult. This is partly because climate risk 49 assessment is difficult, and partly because predictions about what is deemed an unacceptable risk may be difficult. 50 Ecological limits are related to regime shifts at local, regional or ecosystem scales. Assessments of regime shifts 51 need to take account of the complex interaction between climate and other non-climate factors and shocks which 52 threaten an ecosystem’s resilience. For instance, forest-savannah transitions are influenced by drought and the 53
FIRST-ORDER DRAFT IPCC WGII AR5 Chapter 19
Do Not Cite, Quote, or Distribute 48 11 June 2012
prevalence of fire, but are also linked to rates of agricultural conversion (Petersen, 2009). But the deeper question of 1 whether such a transition is unacceptable will often be hard to answer ex ante. 2 3 4 19.7.3. Avoiding Thresholds, Irreversible Change, and Large-Scale Singularities in the Earth System 5 6 Section 19.3.6 highlighted the reasons for concern related to non-linear changes in the Earth system, thereby 7 anthropogenic forcings might cause irreversible and potentially rapid transitions. In general, the risk of triggering 8 these transitions increases with increasing anthropogenic climate forcings or climate change (Kriegler et al., 2009; 9 Lenton et al., 2008; Levermann et al., 2012; Zickfeld et al, 2007). Mitigation of greenhouse gas emissions is 10 projected to reduce the risks of triggering such transitions. Adaptation, where possible (see 19.7.2.2), could reduce 11 their consequences, should they occur. 12 13 A number of studies have sought to identify levels of atmospheric greenhouse gas concentrations or global average 14 temperature change that would limit the risks of triggering these transitions (e.g., Keller et al., 2008; Kriegler et al., 15 2009; Lenton et al., 2008, Zickfeld et al, 2007). It is important to distinguish between triggering and experiencing a 16 threshold response because model simulations and expert assessments suggest that there can be substantial delays 17 between the two (e.g., Lenton et al., 2008; Urban and Keller, 2010). The analysis of Lenton et al. (2008), for 18 example, suggests that limiting global mean temperature increase to approximately 3 oC above present values would 19 considerably reduce the risks of triggering an Amazon rainforest dieback, a melting of the West Antarctic ice sheet 20 (WAIS), a collapse of the thermohaline circulation, and disruptions of the Sahara/Sahel and West African monsoon 21 and the El Niño-Southern Oscillation systems. However, staying below this temperature limit does not entirely 22 eliminate the risks of triggering these events (cf. Hansen et al., 2008; Kriegler et al., 2009; Levermann et al., 2012; 23 Robinson et al., 2012; Zickfeld et al, 2007; Zickfeld et al., 2010). In particular, evidence from the Last Interglacial 24 suggests that 2 oC may be a more appropriate indicator of high risk for disintegration of WAIS (McKay et al 2011, 25 Kopp et al 2009). In addition, this 3 oC temperature limit would, in the assessments of Lenton et al (2008) or 26 Levermann et al (2012), still result in considerable risks of triggering threshold responses such as a disintegration of 27 the Greenland Ice Sheet or a melting of the Arctic summer sea-ice. There is low confidence in the location of such 28 temperature limits due to disagreements among different experts (e.g., Zickfeld et al, 2007, Kriegler et al., 2009). 29 Estimates of such temperature limits can change over time (cf., Oppenheimer et al., 2008) and may be subject to 30 overconfidence that can introduce a downward bias in risk estimates of low-probability events (Henrion and 31 Fischhoff, 1986; Keller, 2012; McNeall et al., 2011; Morgan and Henrion, 1995). Other climate change metrics 32 (e.g., rates of climate change, spatial patterns of emissions and land use change, and atmospheric carbon dioxide 33 concentrations) can be important in the consideration of response strategies (Lenton, 2011a; McAlpine et al., 2010; 34 Steffen et al., 2011). 35 36 Several analyses have performed risk- and decision-analyses for specific thresholds, with most studies focusing on a 37 single potential threshold response: a persistent weakening or collapse of the thermohaline circulation / Atlantic 38 meridional overturning circulation (THC/AMOC) (e.g., Bahn et al., 2011; Bruckner and Zickfeld, 2009; Keller et 39 al., 2004; Keller et al., 2005; McInerney and Keller, 2008; McInerney et al., 2012; Urban and Keller, 2010; Zickfeld 40 and Bruckner, 2008). The probability of experiencing a THC collapse in this century has been assessed as very 41 unlikely (Alley et al, 2007). However, as expected from the considerable response time of the THC, the probability 42 of triggering an eventual THC collapse within a certain time period (e.g., this century) can be substantially higher 43 than the probability of experiencing it (Urban and Keller, 2010). A probabilistic analysis sampling a subset of the 44 relevant uncertainties concluded that reducing the probability of a THC collapse within the next few centuries to one 45 in ten requires emissions reductions of 60% relative to a business-as-usual strategy by 2050 (McInerney and Keller, 46 2008). Bruckner and Zickfeld (2009) show that, under their worst-case conditions, emissions mitigation would need 47 to begin within the next two decades to avoid an eventual THC collapse (defined as overturning rate reduced by 48 more than 50%). Threshold risk estimates and the risk-management strategies are sensitive to factors such as the 49 representation of the uncertainties and the decision-making frameworks (cf. McInerney et al., 2012; Polasky et al., 50 2011; Zickfeld and Bruckner, 2008). 51 52 Another set of analyses has examined broader aspects of how the consideration of threshold events affects response 53 strategies, particularly for mitigation. For example, the design of risk-management strategies could be informed by 54
FIRST-ORDER DRAFT IPCC WGII AR5 Chapter 19
Do Not Cite, Quote, or Distribute 49 11 June 2012
observation and projection systems that would provide an actionable early warning signal of an approaching 1 threshold response. Learning about key uncertain parameters (e.g., climate sensitivity or economic damages 2 associated with a threshold response) can have a considerable effect on risk-management strategies and can have a 3 substantial economic value of information (Keller et al., 2004; Lorenz et al., 2012). However, there is low 4 confidence in the feasibility and requirements for such systems due to the limited amount of studies that have, thus 5 far, mostly analyzed highly simplified situations (e.g., Keller and McInerney, 2008; Keller et al., 2008; Keller et al., 6 2007; Lenton, 2011b, Lorenz et al., 2012). In some decision-analytic frameworks, knowing that a threshold has been 7 crossed can lead to reductions in emissions mitigation efforts (Keller et al., 2004) and a shift of resources toward 8 adaptation (Guillerminet and Tol, 2008) and/or geoengineering of the Earth’s climate system (Irvine et al., 2009; 9 Lenton, 2011b; Swart and Marinova, 2010). 10 11 12 19.7.4. Avoiding Tipping Points in Social/Ecological Systems 13 14 Tipping points in socio-ecological systems are defined as thresholds beyond which impacts increase non-linearly to 15 the detriment of both human and natural systems. They pose a particularly important risk because they can be 16 initiated rapidly and, until recently, without warning, inducing a need for rapid response from human systems. 17 Because human and ecological systems are linked by the services that ecosystems provide to society (Lubchenko & 18 Petes, 2010, McLeod & Leslie 2009), tipping points may be crossed when either the ecosystem services are 19 disrupted and/or the social/economic networks are disrupted (Renaud et al. 2010). Climate change provides a stress 20 on these services and networks that increases the potential for tipping points to be crossed, although they may be 21 crossed due to other types of stresses even in the absence of climate change. For example, in dryland ecosystems, 22 overgrazing has caused grassland-to-desert transitions in a number of locations (Pimm 2009). 23 24 The crossing of tipping points due to climate change can be avoided by preserving ecosystem services through (i) 25 limiting the level of climate change and/or (ii) removing concomitant stresses such as overgrazing, fishing, and 26 pollution. Most of the literature currently focuses on strategy (ii), and there is limited information about the exact 27 levels of climate change that specific coupled socio-economic systems can withstand. Examples of strategy (ii) 28 include maintaining the resilience of coral reefs or pelagic cephalopod populations by the removal of stress from 29 fishing (Andre et al 2010, Anthony et al 2011). Similarly, risks to seabird populations due to climate change impacts 30 on fish (prey) populations could be lessened by reducing concomitant fishing stress (Cury et al., 2011). In some 31 cases, it is possible to use management to reverse the crossing of a tipping point, for example by adding an 32 appropriately chosen amount of sediment to a submerged salt marsh (Stagg & Mendelssohn 2010). However, 33 strategy (ii) generally becomes ineffective once climate changes beyond a certain threshold that is not well known 34 and varies across socio-ecological system. Furthermore, some systems may contain multiple thresholds (Renaud et 35 al., 2010) that may be crossed as stresses increase. 36 37 Other literature focuses more generally on the need for managing both marine and terrestrial ecosystems for 38 resilience (Allen et al 2012, Lubchenko & Petes 2010). A particular category of threshold, that of regime shifts in 39 ecosystems, has received much attention, and it has been noted that such shifts can be reversible in systems with 40 high biodiversity; that is, a high level of biodiversity increases ecosystems’ resilience and enables them to recover 41 after crossing a tipping point (Brierley et al. 2009, Lubchenko & Petes, 2010). Regime shifts have already occurred 42 in several marine food webs (Byrnes et al. 2007; Alheit et al. 2009, Green et al 2008) as a result of (observed) 43 changes in sea surface temperature, changes in salinity due to change in runoff, and (separately) natural climate 44 variability, showing how future climate change will analogously affect species composition and hence ecosystem 45 functioning and potentially biogeochemical cycles. Removal of concomitant stress such as nutrient loading can 46 reduce the chance of a regime shift (Jurgensone et al 2011). Appropriate ecosystem monitoring that looks for a 47 slowing down in the recovery of systems from small changes (Nes & Scheffer 2007) can give warning that a system 48 is a approaching a regime shift, allowing intervention of type (ii) above to be implemented (Brock & Carpenter, 49 2010; Cuttal & Jayaprakash, 2008). Indicators that could be used for such monitoring have been identified for the 50 desertification process in the Mediterranean (Alados et al, 2011) and for landscape fire dynamics (Zinck et al. 2011, 51 McKenzie & Kennedy 2012). 52 53 54
FIRST-ORDER DRAFT IPCC WGII AR5 Chapter 19
Do Not Cite, Quote, or Distribute 50 11 June 2012
19.7.5. Governance and Adaptation Strategies 1 2 Climate change adaptation strategies at the national level as well as local and household-based response strategies 3 are influenced and in part determined by different forms of governance. Governance, and in particular risk 4 governance, aims to enhance the resilience and human security of societies or regions. Risk governance includes all 5 actors, rules, conventions, processes, and mechanisms concerned with how relevant risk information, including 6 information about climate change, its physical impacts, and societal vulnerabilities, is gathered, analyzed and 7 communicated and management decisions are taken (IRGC, 2005). 8 9 Studies regarding the effectiveness of early warning systems in enhancing coping and adaptation capacities for 10 responding to climatic stressors and natural hazards underscore the importance of governance processes and 11 frameworks (see e.g. Chang-Seng 2010). Governance failure (e.g. in fragile and failed states) often leads to a lack of 12 human security networks and therefore reduces the capacity of a social system to cope, adapt, or recover, capacities 13 which are crucial to effective response strategies for managing risks (UN/ISDR, 2005). 14 15 Differences in governance structures, procedures and culture can lead to different response strategies to manage risk. 16 For example, legal frameworks and political-administrative systems significantly determine how governmental 17 response strategies are designed and by which institutions they are implemented (Greiving and Fleischhauer, 2012). 18 Different governance structure may also place more or less importance on the role of the state (Ernst, 2004), and the 19 relation between the state and the population can affect the orientation of a risk-related legal framework (Young, 20 2010). Trust in governance can also be a central to the success of response strategies at managing risks, particularly 21 communication strategies (Löfstedt, 2005), with distrust reducing the efficiency and effectiveness of management 22 actions (Greiving et al., 2012). 23 24 The SREX report (IPCC 2012) notes that “Governance is broader than governmental actions.… governance can be 25 understood as the structures of common governance arrangements and processes of steering and coordination – 26 including markets, hierarchies, networks, and communities” and added that “formal and informal governance 27 structures also determine vulnerability, since they influence power relations, risk perceptions, and constitute the 28 context in which vulnerability, risk reduction, and adaptation are managed” (Cardona et al., SREX Chapter 2, 2012). 29 Governance is critical in facilitating development and building adaptive capacity but the link between development, 30 adaptation and disaster risk reduction with governance is complex (Lal et al. SREX Chapter 6, 2012). For example 31 counties such as China and Vietnam that are considered to be under authoritarian political regimes with insecure 32 property rights, and underdeveloped rule of law have however, managed to address poverty and reduce vulnerability 33 among a million of their citizens (The Advisory Board for Irish Aid, 2008; Lal et al. SREX Chapter 6, 2012). This is 34 in contrast to Africa where institutional capacity to coordinate, regulate and facilitate development is weak, and in 35 addition the media, watch-dog organizations and systems of checks and balances are constrained, resulting in failed 36 development, widespread poverty and low capacity to response to climate change risks (The Advisory Board for 37 Irish Aid, 2008). In addition government’s response to climate risks in terms of willingness to avoid crisis, tailor 38 relief efforts to need, and appeal for aid in an area depends among others on the kind of political relationships that 39 existed before the crisis (Raleigh, 2010). 40 41 Literature on ‘environmental security’ argues that climate change would lead to political instability especially in 42 poor and underdeveloped states such as those in Africa reducing further governance capacity to respond to risks and 43 deepening vulnerability (Tor Benjaminsen, 2008). There is likely to be increased dependence on natural resources 44 among conflict-torn societies and resource scarcity may lead to conflict (Brunnschweiler and Bulte, 2009). Conflicts 45 in Darfur, Chad, Somalia, and Mali are usually cited as examples of cases of wars triggered by resource scarcity and 46 distribution (Tor Benjaminsen, 2008). There is an emerging literature but no consensus yet on the role of climate 47 change and weakened governance leading to conflict or outbreak of war (see 19.4.2.2). What is undisputable is that 48 prospects for effective governance required to address climate change risks and disasters are greatly reduced during 49 conflicts due to destruction of infrastructure and shelter, redirection of resources from social to military purposes, 50 loss of skilled labour, lawlessness, and disruption of social networks. These contribute to resources scarcity, 51 increased exposure and sensitive of communities to climate risks and other stresses (Hadmaer, SREX Chapter 4, 52 2012). 53 54
FIRST-ORDER DRAFT IPCC WGII AR5 Chapter 19
Do Not Cite, Quote, or Distribute 51 11 June 2012
As a result, there is a potential for climate change to fuel pre-exiting tensions and inequalities that are linked for 1 instance in Sub-Saharan Africa, to weak governing systems skewed towards patron–client political relationships 2 resulting in disproportional government representation and marginalization of some groups (Sabates-Wheeler, 2008; 3 Raleigh, 2010). Tor Benjaminsen (2008) noted that droughts of the 1970s and 1980s in northern Mali, had a role in 4 the Tuareg rebellion but the original tension was driven by marginalization by state policies of modernization and 5 sedentarization of nomadic pastoralists and poor governance resulting in embezzlement of drought relief funds. The 6 vulnerability of Masai pastoralists to drought in Kenya is also a combination of inadequate state capacity and years 7 of marginalization (Sabates-Wheeler et al. 2008; Raleigh, 2010). 8 9 Many developing countries are yet to build capable states that can deliver a comprehensive climate change risk 10 response governance structure. Where ethno-political groups underlie the governing system, governments rarely 11 exercise sovereignty across their full territories. This in addition to limited resources reduces equitable delivery of 12 basic social services and capacity to respond effectively to climate change risks to all citizens (Raleigh, 2010; 13 Osbahr et al., 2008). Uneven and disproportionate responses to risks within the same country have been witnessed 14 in, among others, Mali, Niger and Kenya (Raleigh, 2010). In such cases influential social groups have environmental 15 pressures mediated by government intervention in both pre- and post-disaster e.g. in terms of better roads, hospitals, 16 relief aid, coping assistance while the marginalized have limited access to these services leading to “(i) increased 17 risk of communal violence over access; (ii) heightened levels of distress migration to relief; and (iii) increased 18 poverty and decreased coping strategies during periods of compounded disasters “Raleigh, 2010 ). Because they are 19 a minor factor in the governing process, governments are not compelled to expend scarce public goods to these less 20 influential communities. Raleigh (2010) suggested mapping zones of marginalization and extreme poverty as nuclei 21 of potential conflict and increased vulnerability as climate change risks increases. 22 23 Weak governance, scarce resources resulting in widespread poverty drives rapid urbanization in developing 24 countries resulting in the concentration of informal settlements in disaster risk areas that are lacking basic services 25 e.g. housing, storm water drainage and sanitation. High flood-risk parts of certain districts of Saint Louis in Senegal 26 dominated by minority groups and or lower-income groups are good example of such nucleus of vulnerability 27 (Diagne, 2007; Murray et al., SREX, Chapter 9, 2012). 28 29 Climate change presents risks of a magnitude and kind outside of previous experience of many communities, but 30 natural hazards and disasters are not new and all communities had well developed risk management governing 31 systems that involve disaster prevention, prediction, early warning, mitigation and recovery built into indigenous 32 knowledge and the livelihood systems (Mwaura, 2008; Osbahr et al., 2008). Poor interfacing of the indigenous 33 livelihoods systems including its governing institutions with modern institutions undermined more locally adapted 34 systems leading to overall weakened risk management governing systems at all levels i.e. from household through 35 community to district and national level (Dube and Sekhwela, 2007 and 2008; Osbahr et al., 2008; Adger et al. 36 2009; Tor Benjaminsen, 2008). This is the case for much of African indigenous systems but is more pronounced for 37 the politically and economically marginalized groups such as nomadic pastoralists in the Sahel and hunter gathers in 38 the Kalahari in Southern Africa and other low income groups e.g. in urban areas(Tor Benjaminsen, 2008; Pansiri, 39 2008; Raleigh, 2010). 40 41 However, modern African states are not purely patrimonial but rather hybrid formations with strong bureaucratic 42 and democratic features underpinned by formal bodies of law, political constitutions a development process that is 43 guided by national development plans (NDP); for instance Botswana is currently on NDP10 (The Advisory Board 44 for Irish Aid, 2008). There is a potential to strengthen governance structures for climate change adaptation and 45 disaster management. The Mozambique government conducted a comprehensive vulnerability mapping exercise, 46 and put measures in place to mainstream disaster risk reduction and climate change adaptation across its 47 development policy through a cross-scale governance structure supported by a participatory decision-making 48 processes. This has allowed community adaptation to be linked with NGOs, Government effort and to effectively 49 utilize regional forecast outputs for early warning and monitoring to improve risk governance resulting in lower 50 impacts of disasters compared to for e.g. the devastating floods of 2000 (Osbahr et al., 2008; Murray et al., SREX 51 Chapter 9, 2012). Similarly in Asia, Bangladesh has through its history of large-scale disasters made significant 52 improvements in Disaster Risk Reduction from tropical cyclones through a governing systems that includes policy 53 makers, donors, NGOs, humanitarian organizations and local communities (Paul, 2009). 54
FIRST-ORDER DRAFT IPCC WGII AR5 Chapter 19
Do Not Cite, Quote, or Distribute 52 11 June 2012
1 2 Frequently Asked Questions 3 4 FAQ 19.1: How do risks differ from impacts and vulnerabilities? 5 Impact, as used in this report, is the effect or damage to natural and human systems of physical events associated 6 with climate change, for example the extent or cost of flooding due to an intense coastal storm. Risk is defined as the 7 probability of a damaging event or series of events occurring times the impact or amount of damage that such 8 event(s) would cause, measured in monetary value, number of human lives lost, number of species lost to extinction, 9 or the value of other human, cultural, or monetized losses. In other words, risk refers to a situation where something 10 of human value (including humans themselves) is at stake and where the outcome is uncertain. Vulnerability is the 11 susceptibility of people, societies or natural ecosystems and species to damages due to such event(s). High 12 vulnerability leads to high impact when a person, society, or ecosystem is exposed to damaging physical event(s). 13 (chapter 2-ES, chapter 19.1) 14 15 FAQ 19.2: How can climate change at one location cause impacts at another, distant location? 16 Impacts of climate change are felt locally and directly where the events related to a changing climate occur. 17 However, such impacts may cause responses on the part of humans, societies, and ecosystems and species which 18 reverberate elsewhere and cause important indirect impacts at great distance from the initial climate impact. For 19 example, a changing climate may lead to reduced crop productivity in some regions, reducing agricultural 20 commodities supplied from that region and increasing demand for and price of the same or substitute crops grown in 21 distant regions. In that case, the indirect impact is transmitted by price changes in the global commodities markets. 22 In a second example, people may migrate in response to climate change, leading to potential for both positive and 23 negative consequences at receiving regions that may be far removed from the point of origin of the migrants. 24 (Chapter 19.3, 19.4) 25 26 FAQ 19.3: Does science provide an answer to the question of how much warming is excessive? 27 The question of how much warming is excessive is raised in Article 2 of the UN Framework Convention on Climate 28 Change (UNFCCC). The criteria for determining what constitutes, in the words of Article 2, “dangerous interference 29 with the climate system” are based both on science and human values. Science can determine, within a range of 30 uncertainty, how much damage might done if tropical cyclones grow more intense or heat waves more frequent, for 31 example. But comparing damages across communities, countries, or larger regions depends on how each political, 32 social, or cultural entity values the losses. Comparing loss of property and loss of life is even more difficult and 33 controversial, particularly when damage to future generations is involved. The purpose of this chapter is to highlight 34 key risks and vulnerabilities that science has identified; however it is up to people and governments to determine 35 how these potential impacts should be valued. For example, agreements reached by governments since 2009, 36 meeting under the auspices of the UNFCCC, have recognized “the scientific view that the increase in global 37 temperature should be below 2 degrees Celsius”. (Chapter 19.1, UNFCCC, Copenhagen Accord) 38 39 40 References 41 42 Ackerman, F. S., Elizabeth A., 2012: Climate risks and carbon prices: Revising the social cost of carbon. 43
Economics: The Open-Access, Open Assessment E-Journal, 6 (2012-10), 44 Ackerman, F., E. A. Stanton and R. Bueno, 2010: Fat tails, exponents, extreme uncertainty: Simulating catastrophe 45
in dice. Ecological Economics, 69 (8), 1657-1665. 46 Ackerman, F., E. A. Stanton and R. Bueno, Cred: A new model of climate and development. Ecological Economics. 47 Adger, N. W., N. W. Arnell and E. L. Tompkins, 2005: Successful adaptation to climate change across scales. 48
Global Environmental Change, 15 (2), 77-86. 49 Adger, W. N. and P. M. Kelly, 1999: Social vulnerability to climate change and the architecture of entitlements. 50
Mitigation and Adaptation Strategies for Global Change, 4 (3/4), 253-266. 51 Adger, W. N., 2006: Vulnerability. Global Environmental Change, 16 (3), 268-281. 52 Adger, W., S. Dessai, M. Goulden, M. Hulme, I. Lorenzoni, D. Nelson, L. Naess, J. Wolf and A. Wreford, 2009: 53
Are there social limits to adaptation to climate change? Climatic Change, 93 (3), 335-354. 54
FIRST-ORDER DRAFT IPCC WGII AR5 Chapter 19
Do Not Cite, Quote, or Distribute 53 11 June 2012
Ahmed, S. A., N. S. Diffenbaugh and T. W. Hertel, 2009: Climate volatility deepens poverty vulnerability in 1 developing countries. Environmental Research Letters, 4 (3), 034004. 2
Ahrens, J. and P. M. Rudolph, 2006: The importance of governance in risk reduction and disaster management. 3 Journal of Contingencies and Crisis Management, 14 (4), 207-220. 4
Allesina, S., A. Bodini and M. Pascual, 2009: Functional links and robustness in food webs. Philosophical 5 Transactions of the Royal Society B: Biological Sciences, 364 (1524), 1701-1709. 6
Ammann, C. M., W. M. Washington, G. A. Meehl, L. Buja and H. Teng, 2010: Climate engineering through 7 artificial enhancement of natural forcings: Magnitudes and implied consequences. J. Geophys. Res., 115 (D22), 8 D22109. 9
Anderson-Teixeira, K. J. and E. H. Delucia, 2011: The greenhouse gas value of ecosystems. Global Change 10 Biology, 17 (1), 425-438. 11
Anderson, C., K. Anderson, N. Dorr, K. Deneve and M. Flanagan, 2000: Temperature and aggression. Advances in 12 experimental social psychology, 32 63–133. 13
Anderson, E. P., C. M. Pringle and M. Rojas, 2006: Transforming tropical rivers: An environmental perspective on 14 hydropower development in costa rica. Aquatic Conservation: Marine and Freshwater Ecosystems, 16 (7), 679-15 693. 16
Anderson, K. and A. Bows, 2008: Reframing the climate change challenge in light of post-2000 emission trends. 17 Philosophical Transactions of the Royal Society A: Mathematical, Physical and Engineering Sciences, 366 18 (1882), 3863-3882. 19
Anderson, K. and A. Bows, 2011: Beyond ‘dangerous’ climate change: Emission scenarios for a new world. 20 Philosophical Transactions of the Royal Society A: Mathematical, Physical and Engineering Sciences, 369 21 (1934), 20-44. 22
Angrist, J. D. and A. D. Kugler, 2008: Rural windfall or a new resource curse? Coca, income, and civil conflict in 23 colombia. Review of Economics and Statistics, 90 (2), 191-215. 24
Anthoff, D., C. Hepburn and R. S. J. Tol, 2009: Equity weighting and the marginal damage costs of climate change. 25 Ecological Economics, 68 (3), 836-849. 26
Anthoff, D., R. Nicholls and R. Tol, 2010: The economic impact of substantial sea-level rise. Mitigation and 27 Adaptation Strategies for Global Change, 15 (4), 321-335. 28
Anttila-Hughes, J. K. and S. M. Hsiang, 2012: Destruction, disinvestment, and death: Economic and human losses 29 following environmental disaster. Working paper presented at National Bureau of Economic Research HC/EEE 30 meeting, 31
Archer, D., B. Buffett and V. Brovkin, 2008: Ocean methane hydrates as a slow tipping point in the global carbon 32 cycle. Proceedings of the National Academy of Sciences, 33
Bahn, O., N. R. Edwards, R. Knutti and T. F. Stocker, 2011: Energy policies avoiding a tipping point in the climate 34 system. Energy Policy, 39 (1), 334-348. 35
Bai, Y. and J. K.-S. Kung, 2010: Climate shocks and sino-nomadic conflict. The Review of Economics and 36 Statistics, 93 (3), 970-981. 37
Bala, G., P. B. Duffy and K. E. Taylor, 2008: Impact of geoengineering schemes on the global hydrological cycle. 38 Proceedings of the National Academy of Sciences, 105 (22), 7664-7669. 39
Barcelos E Ramos, J., H. Biswas, K. G. Schulz, J. Laroche and U. Riebesell, 2007: Effect of rising atmospheric 40 carbon dioxide on the marine nitrogen fixer trichodesmium. Global Biogeochem. Cycles, 21 (2), GB2028. 41
Barnett, J. and S. O'neill, 2010: Maladaptation. Global Environmental Change, 20 211-213. 42 Barnett, J. and W. N. Adger, 2007: Climate change, human security and violent conflict. Political Geography, 26 43
(6), 639-655. 44 Barnett, T. P., D. W. Pierce, H. G. Hidalgo, C. Bonfils, B. D. Santer, T. Das, G. Bala, A. W. Wood, T. Nozawa, A. 45
A. Mirin, D. R. Cayan and M. D. Dettinger, 2008: Human-induced changes in the hydrology of the western 46 united states. Science, 319 (5866), 1080-1083. 47
Barr, K. J., B. A. Babcock, M. A. Carriquiry, A. M. Nassar and L. Harfuch, 2011: Agricultural land elasticities in 48 the united states and brazil. Applied Economic Perspectives and Policy, 33 (3), 449-462. 49
Barrios, S., L. Bertinelli and E. A. Strobl, 2010: Trends in rainfall and economic growth in africa: A neglected cause 50 of the african growth tragedy. The Review of Economics and Statistics, 92 (2), 51
Bartlett, S., 2008: Climate change and urban children: Impacts and implications for adaptation in low- and middle-52 income countries. Environment and Urbanization, 20 (2), 501-519. 53
FIRST-ORDER DRAFT IPCC WGII AR5 Chapter 19
Do Not Cite, Quote, or Distribute 54 11 June 2012
Battisti, D. S. and R. L. Naylor, 2009: Historical warnings of future food insecurity with unprecedented seasonal 1 heat. Science, 323 (5911), 240-244. 2
Beckage, B., B. Osborne, D. G. Gavin, C. Pucko, T. Siccama and T. Perkins, 2008: A rapid upward shift of a forest 3 ecotone during 40 years of warming in the green mountains of vermont. Proceedings of the National Academy 4 of Sciences, 105 (11), 4197-4202. 5
Beddington, J., 2010: Food security: Contributions from science to a new and greener revolution. Philosophical 6 Transactions of the Royal Society B: Biological Sciences, 365 (1537), 61-71. 7
Beman, J. M., C.-E. Chow, A. L. King, Y. Feng, J. A. Fuhrman, A. Andersson, N. R. Bates, B. N. Popp and D. A. 8 Hutchins, 2011: Global declines in oceanic nitrification rates as a consequence of ocean acidification. 9 Proceedings of the National Academy of Sciences, 108 (1), 208-213. 10
Ben, W., 2006: Let our children teach us! A review of the role of education and knowledge in disaster risk 11 reduction. Journal, (Issue), 12
Berkhout, F., 2012: Adaptation to climate change by organizations. Wiley Interdisciplinary Reviews: Climate 13 Change, 3 (1), 91-106. 14
Bernie, D., J. Lowe, T. Tyrrell and O. Legge, 2010: Influence of mitigation policy on ocean acidification. Geophys. 15 Res. Lett., 37 (15), L15704. 16
Berrang-Ford, L., J. D. Ford and J. Paterson, 2011: Are we adapting to climate change? Global Environmental 17 Change, 21 (1), 25-33. 18
Berrens, R. P., A. K. Bohara, H. C. Jenkins-Smith, C. L. Silva and D. L. Weimer, 2004: Information and effort in 19 contingent valuation surveys: Application to global climate change using national internet samples. Journal of 20 Environmental Economics and Management, 47 (2), 331-363. 21
Besley, T. and T. Persson, 2011: The logic of political violence. The Quarterly Journal of Economics, 126 (3), 1411-22 1445. 23
Betts, R. A., M. Collins, D. L. Hemming, C. D. Jones, J. A. Lowe and M. G. Sanderson, 2011: When could global 24 warming reach 4°c? Philosophical Transactions of the Royal Society A: Mathematical, Physical and 25 Engineering Sciences, 369 (1934), 67-84. 26
Birkmann, J. and N. Fernando, 2008: Measuring revealed and emergent vulnerabilities of coastal communities to 27 tsunami in sri lanka. Disasters, 32 (1), 82-105. 28
Birkmann, J., 2006: Measuring vulnerability to promote disaster-resilient societies: Conceptual frameworks and 29 definitions. Journal, (Issue), 30
Birkmann, J., 2011: First- and second-order adaptation to natural hazards and extreme events in the context of 31 climate change. Natural Hazards, 58 (2), 811-840. 32
Birkmann, J., D. C. Seng and D. Suarez, 2011: Adaptive disaster risk reduction enhancing methods and tools of 33 disaster risk reduction in the light of climate change. 34
Birkmann, J., M. Garschagen, F. Kraas and N. Quang, 2010: Adaptive urban governance: New challenges for the 35 second generation of urban adaptation strategies to climate change. Sustainability Science, 5 (2), 185-206. 36
Birkmann, J., P. Buckle, J. Jaeger, M. Pelling, N. Setiadi, M. Garschagen, N. Fernando and J. Kropp, 2010: Extreme 37 events and disasters: A window of opportunity for change? Analysis of organizational, institutional and political 38 changes, formal and informal responses after mega-disasters. Natural Hazards, 55 (3), 637-655. 39
Birkmann, J., T. Welle, D. Krause, J. Wolfertz, D.-C. Suarez and N. J. Setiadi, 2011: Worldriskindex: Concept and 40 results. Journal, (Issue), 41
Blattman, C. and E. Miguel, 2010: Civil war. Journal of Economic Literature, 48 (1), 3-57. 42 Blaum, N., E. Rossmanith, A. Popp and F. Jeltsch, 2007: Shrub encroachment affects mammalian carnivore 43
abundance and species richness in semiarid rangelands. Acta Oecologica, 31 (1), 86-92. 44 Boe, J., A. Hall and X. Qu, 2009: September sea-ice cover in the arctic ocean projected to vanish by 2100. Nature 45
Geosci, 2 (5), 341-343. 46 Bohle, H. G., T. E. Downing and M. J. Watts, 1994: Climate change and social vulnerability: Toward a sociology 47
and geography of food insecurity. Global Environmental Change, 4 (1), 37-48. 48 Bohle, Hans-Georg (2001): Vulnerability and criticality: Perspectives from social geography. In IHDP Update (2), 49
pp. 1–6. 50 Bohlken, A. T. and E. J. Sergenti, 2010: Economic growth and ethnic violence: An empirical investigation of 51
hindu—muslim riots in india. Journal of Peace Research, 47 (5), 589-600. 52 Bosello, F., C. Carraro and E. D. Cian, 2010: Climate policy and the optimal balance between mitigation, adaptation 53
and unavoided damage. Journal, (Issue), 54
FIRST-ORDER DRAFT IPCC WGII AR5 Chapter 19
Do Not Cite, Quote, or Distribute 55 11 June 2012
Bosello, F., F. Eboli and R. Pierfederici, 2012: Assessing the economic impacts of climate change - an updated cge 1 point of view. 2
Bosello, F., R. Nicholls, J. Richards, R. Roson and R. Tol, 2012: Economic impacts of climate change in europe: 3 Sea-level rise. Climatic Change, 112 (1), 63-81. 4
Bouchama, A. and J. P. Knochel, 2002: Heat stroke. New England Journal of Medicine, 346 (25), 1978-1988. 5 Bouwer, L. M., P. Bubeck and J. C. J. H. Aerts, 2010: Changes in future flood risk due to climate and development 6
in a dutch polder area. Global Environmental Change, 20 (3), 463-471. 7 Bouwer, L. M., R. P. Crompton, E. Faust, P. Höppe and R. A. Pielke, 2007: Confronting disaster losses. Science, 8
318 (5851), 753. 9 Bouwman, A. F., T. Kram and K. Klein Goldewijk, 2006: Intergrated modelling of global environmenthal change : 10
An overview of image 2.4. Journal, (Issue), 11 Brauch, H., 2006: Desertification – a new security challenge for the mediterranean? Policy agenda for recognising 12
and coping with fatal outcomes of global environmental change and potentially violent societal consequences 13 Breitbarth, E., R. J. Bellerby, C. C. Neill, M. V. Ardelan, M. Meyerhöfer, E. Zöllner, P. L. Croot and U. Riebesell, 14
2010: Ocean acidification affects iron speciation during a coastal seawater mesocosm experiment. 15 Biogeosciences, 7 (3), 1065-1073. 16
Breton, M.-C., M. Garneau, I. Fortier, F. Guay and J. Louis, 2006: Relationship between climate, pollen 17 concentrations of ambrosia and medical consultations for allergic rhinitis in montreal, 1994–2002. Science of 18 The Total Environment, 370 (1), 39-50. 19
Brückner, M. and A. Ciccone, 2011: Rain and the democratic window of opportunity. Econometrica, 79 (3), 923-20 947. 21
Bruckner, T. and K. Zickfeld, 2009: Emissions corridors for reducing the risk of a collapse of the atlantic 22 thermohaline circulation. Mitigation and Adaptation Strategies for Global Change, 14 (1), 61-83. 23
Buckley, B. M., K. J. Anchukaitis, D. Penny, R. Fletcher, E. R. Cook, M. Sano, L. C. Nam, A. Wichienkeeo, T. T. 24 Minh and T. M. Hong, 2010: Climate as a contributing factor in the demise of angkor, cambodia. Proceedings 25 of the National Academy of Sciences, 107 (15), 6748-6752. 26
Buhaug, H., 2010: Climate not to blame for african civil wars. Proceedings of the National Academy of Sciences, 27 Burke, M. B., E. Miguel, S. Satyanath, J. A. Dykema and D. B. Lobell, 2009: Warming increases the risk of civil 28
war in africa. Proceedings of the National Academy of Sciences, 29 Burke, M. B., E. Miguel, S. Satyanath, J. A. Dykema and D. B. Lobell, 2010: Reply to sutton et al.: Relationship 30
between temperature and conflict is robust. Proceedings of the National Academy of Sciences, 107 (25), E103. 31 Burke, P. J. and A. Leigh, 2010: Do output contractions trigger democratic change? American Economic Journal: 32
Macroeconomics, 2 (4), 124-157. 33 Burke, P. J., 2012: Economic growth and political survival. The B.E. Journal of Macroeconomics, 12 (1), 34 Burton, I., J. Wilson and R. E. Munn, 1983: Environmental impact assessment: National approaches and 35
international needs. Environmental Monitoring and Assessment, 3 (2), 133-150. 36 Butler, C. K. and S. Gates, 2012: African range wars: Climate, conflict, and property rights. Journal of Peace 37
Research, 49 (1), 23-34. 38 Byrne, R. H., S. Mecking, R. A. Feely and X. Liu, 2010: Direct observations of basin-wide acidification of the north 39
pacific ocean. Geophys. Res. Lett., 37 (2), L02601. 40 Cai, B., T. Cameron and G. Gerdes, 2010: Distributional preferences and the incidence of costs and benefits in 41
climate change policy. Environmental & Resource Economics, 46 (4), 429-458. 42 Caldeira, K. and M. E. Wickett, 2005: Ocean model predictions of chemistry changes from carbon dioxide 43
emissions to the atmosphere and ocean. J. Geophys. Res., 110 (C9), C09S04. 44 Cameron, T. A., 2002: Individual option prices for climate change mitigation. Journal, (Issue), 45 Capaldo, K., J. J. Corbett, P. Kasibhatla, P. Fischbeck and S. N. Pandis, 1999: Effects of ship emissions on sulphur 46
cycling and radiative climate forcing over the ocean. Nature, 400 (6746), 743-746. 47 Cardona, O. D., 1986: Estudios de vulnerabilidad y evaluación del riesgo sísmico: Planificación física y urbana en 48
áreas propensas. Boletin tecnico - IMME, (33), 49 Cardona, O.D., 1990: Terminología de Uso Común en Manejo de Riesgos. AGID Reporte No. 13, Escuela de 50
Administración, Finanzas, y Tecnología, Medellín, Colombia. 51 Cardona, O.D., 2008: Indicators of Disaster Risk and Risk Management: Program for Latin America and the 52
Caribbean – Summary Report – Second Edition. INE-08-002, Inter-American Development Bank, Washington, 53 DC. 54
FIRST-ORDER DRAFT IPCC WGII AR5 Chapter 19
Do Not Cite, Quote, or Distribute 56 11 June 2012
Cardona, O.D., 2010: Indicators of Disaster Risk and Risk Management – Program for Latin America and the 1 Caribbean: Summary Report. Evaluación de Riesgos Naturales - Latino America, ERN-AL, Inter-American 2 Development Bank, Washington, DC. 3
Cardona, O.D., 2011: Disaster risk and vulnerability: Notions and measurement of human and environmental 4 insecurity. In: Coping with Global Environmental Change, Disasters and Security – Threats, Challenges, 5 Vulnerabilities and Risks 6
Carpenter, S., W. Brock and P. Hanson, 1999: Ecological and social dynamics in simple models of ecosystem 7 management. Conservation Ecology, 3 (2), 4. 8
Carreño, M., O. Cardona and A. Barbat, 2007: A disaster risk management performance index. Natural Hazards, 41 9 (1), 1-20. 10
Carson, R. T., J. J. Louviere and E. Wei, 2010: Alternative australian climate change plans: The public's views. 11 Energy Policy, 38 (2), 902-911. 12
CBD (Convention on Biological Diversity). 2009 Connecting biodiversity and climate change mitigation and 13 adaptation. Report of the Second Ad Hoc Technical Expert Group on Biodiversity and Climate change. CBD 14 Technical Series no. 41. Secretariat 15
Center for International Earth Science Information Network (CIESIN), Columbia University; International Food 16 Policy Research Institute (IFPRI); The World Bank; and Centro Internacional de Agricultura Tropical (CIAT). 17 2012. Global Rural-Urban Mapping Project (GRUMP): Population Count Grid for 2010 (alpha). Palisades, NY: 18 NASA Socioeconomic Data and Applications Center (SEDAC), Columbia University. 19
Chakraborty, S. and A. C. Newton, 2011: Climate change, plant diseases and food security: An overview. Plant 20 Pathology, 60 (1), 2-14. 21
Chandy, L. and G. Gertz, 2011: Poverty in numbers: The changing state of global poverty from 2005 to 2015. 22 Brookings Institution, 23
Chaney, E., 2011: Revolt on the nile: Economic shocks, religion and political power. Harvard University Working 24 Paper, 25
Chang Seng, S.D., 2010: Disaster Risk Preparedness: The Role of Risk Governance, Multi-Institutional 26 Arrangements and Polycentric Frameworks for a Resilient Tsunami Early Warning System in Indonesia, PhD 27 Dissertation, MathematischNaturwissensch 28
Chassang, S. and G. P. I. Miquel, 2009: Economic shocks and civil war. Quarterly Journl of Political Science, 4 (3), 29 221-228. 30
Chen, C.-C., B. Mccarl and C.-C. Chang, 2012: Climate change, sea level rise and rice: Global market implications. 31 Climatic Change, 110 (3), 543-560. 32
Chen, I.-C., J. K. Hill, R. Ohlemüller, D. B. Roy and C. D. Thomas, 2011: Rapid range shifts of species associated 33 with high levels of climate warming. Science, 333 (6045), 1024-1026. 34
Cheung, W. W. L., V. W. Y. Lam, J. L. Sarmiento, K. Kearney, R. E. G. Watson, D. Zeller and D. Pauly, 2010: 35 Large-scale redistribution of maximum fisheries catch potential in the global ocean under climate change. 36 Global Change Biology, 16 (1), 24-35. 37
Cheung, W. W. L., V. W. Y. Lam, J. L. Sarmiento, K. Kearney, R. Watson and D. Pauly, 2009: Projecting global 38 marine biodiversity impacts under climate change scenarios. Fish and Fisheries, 10 (3), 235-251. 39
Chown, S. L., A. H. L. Huiskes, N. J. M. Gremmen, J. E. Lee, A. Terauds, K. Crosbie, Y. Frenot, K. A. Hughes, S. 40 Imura, K. Kiefer, M. Lebouvier, B. Raymond, M. Tsujimoto, C. Ware, B. Van De Vijver and D. M. Bergstrom, 41 2012: Continent-wide risk assessment for the establishment of nonindigenous species in antarctica. Proceedings 42 of the National Academy of Sciences, 43
Cicerone, R. J., S. Elliott and R. P. Turco, 1992: Global environmental engineering. Nature, 356 (6369), 472-472. 44 Ciscar, J.-C., A. Iglesias, L. Feyen, L. Szabó, D. Van Regemorter, B. Amelung, R. Nicholls, P. Watkiss, O. B. 45
Christensen, R. Dankers, L. Garrote, C. M. Goodess, A. Hunt, A. Moreno, J. Richards and A. Soria, 2011: 46 Physical and economic consequences of climate change in europe. Proceedings of the National Academy of 47 Sciences, 48
Clarke, L., J. Edmonds, V. Krey, R. Richels, S. Rose and M. Tavoni, 2009: International climate policy 49 architectures: Overview of the emf 22 international scenarios. Energy Economics, 31 64-81. 50
Clot, B., 2003: Trends in airborne pollen: An overview of 21 years of data in neuchâtel (switzerland). Aerobiologia, 51 19 (3), 227-234. 52
Colwell, R. K., G. Brehm, C. L. Cardelús, A. C. Gilman and J. T. Longino, 2008: Global warming, elevational range 53 shifts, and lowland biotic attrition in the wet tropics. Science, 322 (5899), 258-261. 54
FIRST-ORDER DRAFT IPCC WGII AR5 Chapter 19
Do Not Cite, Quote, or Distribute 57 11 June 2012
Comfort, L., B. Wisner, S. Cutter, R. Pulwarty, K. Hewitt, A. Oliver-Smith, J. Wiener, M. Fordham, W. Peacock 1 and F. Krimgold, 1999: Reframing disaster policy: The global evolution of vulnerable communities. Global 2 Environmental Change Part B: Environmental Hazards, 1 (1), 39-44. 3
Conde, D. A., N. Flesness, F. Colchero, O. R. Jones and A. Scheuerlein, 2011: An emerging role of zoos to conserve 4 biodiversity. Science, 331 (6023), 1390-1391. 5
Cooley, S. R., N. Lucey, H. Kite-Powell and S. C. Doney, 2012: Nutrition and income from molluscs today imply 6 vulnerability to ocean acidification tomorrow. Fish and Fisheries, 13 (2), 182-215. 7
Cotrufo, M. F., M. a. J. I. Briones and P. Ineson, 1998: Elevated co2 affects field decomposition rate and palatability 8 of tree leaf litter: Importance of changes in substrate quality. Soil Biology and Biochemistry, 30 (12), 1565-9 1571. 10
Couttenier, M. and Soubeyran, R. (2011). Drought and civil war in sub-saharan africa. Paris School of Economics 11 Working Paper. 12
Crutzen, P., 2006: Albedo enhancement by stratospheric sulfur injections: A contribution to resolve a policy 13 dilemma? Climatic Change, 77 (3), 211-220. 14
Cullen, H. M., P. B. Demenocal, S. Hemming, G. Hemming, F. H. Brown, T. Guilderson and F. Sirocko, 2000: 15 Climate change and the collapse of the akkadian empire: Evidence from the deep sea. Geology, 28 (4), 379-382. 16
Curriero, F. C., J. A. Patz, J. B. Rose and S. Lele, 2001: The association between extreme precipitation and 17 waterborne disease outbreaks in the united states, 1948–1994. American Journal of Public Health, 91 (8), 1194-18 1199. 19
Cutter, S. L. and C. Finch, 2008: Temporal and spatial changes in social vulnerability to natural hazards. 20 Proceedings of the National Academy of Sciences, 105 (7), 2301-2306. 21
Cutter, S. L., L. Barnes, M. Berry, C. Burton, E. Evans, E. Tate and J. Webb, 2008: A place-based model for 22 understanding community resilience to natural disasters. Global Environmental Change, 18 (4), 598-606. 23
D'amato, G., L. Cecchi, M. D'amato and G. Liccardi, 2010: Urban air pollution and climate change as environmental 24 risk factors of respiratory allergy: An update. Journal of investigative allergology and clinical immunology, 20 25 (2), 95-102. 26
Dal Bó, E. and P. Dal Bó, 2011: Workers, warriors, and criminals: Social conflict in general equilibrium. Journal of 27 the European Economic Association, 9 (4), 646-677. 28
Damialis, A., J. M. Halley, D. Gioulekas and D. Vokou, 2007: Long-term trends in atmospheric pollen levels in the 29 city of thessaloniki, greece. Atmospheric Environment, 41 (33), 7011-7021. 30
Dasgupta, S. et al., 2009, Sea-level rise and storm surges: A comparative analysis of impacts in developing 31 countries, World Bank Policy Research Working Paper 4901. 32
David, R. M., E. K. Robert and O. Michael, 2009: Toward ethical norms and institutions for climate engineering 33 research. Environmental Research Letters, 4 (4), 045106. 34
Davis, S. J., K. Caldeira and H. D. Matthews, 2010: Future co2 emissions and climate change from existing energy 35 infrastructure. Science, 329 (5997), 1330-1333. 36
De Bruin, K., R. Dellink and R. Tol, 2009: Ad-dice: An implementation of adaptation in the dice model. Climatic 37 Change, 95 (1), 63-81. 38
Dell, M., B. F. Jones and B. A. Olken, In Press: Temperature shocks and economic growth: Evidence from the last 39 half century. American Economic Journal: Macroeconomics, 40
Demenocal, P. B., 2001: Cultural responses to climate change during the late holocene. Science, 292 (5517), 667-41 673. 42
Den Elzen, M. G. J. and D. P. Van Vuuren, 2007: Peaking profiles for achieving long-term temperature targets with 43 more likelihood at lower costs. Proceedings of the National Academy of Sciences, 104 (46), 17931-17936. 44
dendroclimatology. Journal, 11 (Issue), 297-327. 45 desertification in the mediterranean region. A security issue. Journal, 3 (Issue), 11-85. 46 Deutsch, C. A., J. J. Tewksbury, R. B. Huey, K. S. Sheldon, C. K. Ghalambor, D. C. Haak and P. R. Martin, 2008: 47
Impacts of climate warming on terrestrial ectotherms across latitude. Proceedings of the National Academy of 48 Sciences, 105 (18), 6668-6672. 49
Devictor, V., R. Julliard, D. Couvet and F. Jiguet, 2008: Birds are tracking climate warming, but not fast enough. 50 Proceedings of the Royal Society B: Biological Sciences, 275 (1652), 2743-2748. 51
Díaz, S., J. Fargione, F. S. Chapin, Iii and D. Tilman, 2006: Biodiversity loss threatens human well-being. PLoS 52 Biol, 4 (8), e277. 53
FIRST-ORDER DRAFT IPCC WGII AR5 Chapter 19
Do Not Cite, Quote, or Distribute 58 11 June 2012
Dickinson, R. E., 1996: Climate engineering a review of aerosol approaches to changing the global energy balance. 1 Climatic Change, 33 (3), 279-290. 2
Dietz, S., 2011: High impact, low probability? An empirical analysis of risk in the economics of climate change. 3 Climatic Change, 108 (3), 519-541. 4
Diffenbaugh, N. S., F. Giorgi, L. Raymond and X. Bi, 2007: Indicators of 21st century socioclimatic exposure. 5 Proceedings of the National Academy of Sciences, 104 (51), 20195-20198. 6
Donner, S. D., 2009: Coping with commitment: Projected thermal stress on coral reefs under different future 7 scenarios. PLoS ONE, 4 (6), e5712. 8
Dore, J. E., R. Lukas, D. W. Sadler, M. J. Church and D. M. Karl, 2009: Physical and biogeochemical modulation of 9 ocean acidification in the central north pacific. Proceedings of the National Academy of Sciences, 106 (30), 10 12235-12240. 11
Dossena, M., G. Yvon-Durocher, J. Grey, J. M. Montoya, D. M. Perkins, M. Trimmer and G. Woodward, 2012: 12 Warming alters community size structure and ecosystem functioning. Proceedings of the Royal Society B: 13 Biological Sciences, 14
Dronin, N. and A. Kirilenko, 2011: Climate change, food stress, and security in russia. Regional Environmental 15 Change, 11 (0), 167-178. 16
Dube, O. and Vargas, J. (2007). Commodity price shocks and civil conflict: Evidence from Colombia. Working 17 paper. 18
Edenhofer, O., B. Knopf, T. Barker, L. Baumstark, E. Bellevrat, B. Chateau, P. Criqui, M. Isaac, A. Kitous, S. 19 Kypreos, M. Leimbach, K. Lessmann, B. Mange, S. Scrieciu, H. Turton and D. P. Van Vuuren, 2010: The 20 economics of low stabilization: Model comparison of mitigation strategies and costs. The Energy Journal, 0 21 (Special I), 11-48. 22
Edwards, Scott. 2008. Social breakdown in Darfur. Forced Migration Review. 31: 23-24. 23 Elliott, J. R. and J. Pais, 2006: Race, class, and hurricane katrina: Social differences in human responses to disaster. 24
Social Science Research, 35 (2), 295-321. 25 Enarson, E. and B.H. Morrow (eds.), 1998: The Gendered Terrain of Disaster: Through Women’s Eyes. Praeger 26
Publishers, Westport, CT. 27 Environmental Pollution Panel, 1965: Restoring the Quality of Our Environment, (The White House, Washington, 28
Jan 21, 2008]. 31 EPA. 2005. Heat island effect. U.S. Environmental Protection Agency. http://www.epa.gov/heatisland/index.html 32
[accessed Oct 21, 2007]. 33 Erbs, M., R. Manderscheid, G. Jansen, S. Seddig, A. Pacholski and H.-J. Weigel, 2010: Effects of free-air co2 34
enrichment and nitrogen supply on grain quality parameters and elemental composition of wheat and barley 35 grown in a crop rotation. Agriculture, Ecosystems & Environment, 136 (1–2), 59-68. 36
Ericson, J. P., C. J. Vörösmarty, S. L. Dingman, L. G. Ward and M. Meybeck, 2006: Effective sea-level rise and 37 deltas: Causes of change and human dimension implications. Global and Planetary Change, 50 (1–2), 63-82. 38
Fabricius, K. E., C. Langdon, S. Uthicke, C. Humphrey, S. Noonan, G. De/'Ath, R. Okazaki, N. Muehllehner, M. S. 39 Glas and J. M. Lough, 2011: Losers and winners in coral reefs acclimatized to elevated carbon dioxide 40 concentrations. Nature Clim. Change, 1 (3), 165-169. 41
Fankhauser, S., J. B. Smith and R. S. J. Tol, 1999: Weathering climate change: Some simple rules to guide 42 adaptation decisions. Ecological Economics, 30 (1), 67-78. 43
FAO. (2010). Chapter 3 The state of ex situ conservation. The second report on the state of the world’s plant genetic 44 resources for food and agriculture (pp. 54-90). Rome. 45
Fargione, J., J. Hill, D. Tilman, S. Polasky and P. Hawthorne, 2008: Land clearing and the biofuel carbon debt. 46 Science, 319 (5867), 1235-1238. 47
Fearon, J. D. and D. D. Laitin, 2003: Ethnicity, insurgency, and civil war. The American Political Science Review, 48 97 (1), 75-90. 49
Feely, R. A., C. L. Sabine, K. Lee, W. Berelson, J. Kleypas, V. J. Fabry and F. J. Millero, 2004: Impact of 50 anthropogenic co2 on the caco3 system in the oceans. Science, 305 (5682), 362-366. 51
Feely, R. A., S. C. Doney and S. R. Cooley, 2009: Ocean acidification: Present conditions and future changes in a 52 high-co2 world. Oceanography, 22 (4), 53
FIRST-ORDER DRAFT IPCC WGII AR5 Chapter 19
Do Not Cite, Quote, or Distribute 59 11 June 2012
Feng, S., A. B. Krueger and M. Oppenheimer, 2010: Linkages among climate change, crop yields and mexico–us 1 cross-border migration. Proceedings of the National Academy of Sciences, 2
Feyen, L., J. Barredo and R. Dankers, 2009: Implications of global warming and urban land use change on flooding 3 in europe. Water & Urban Development Paradigms - Towards an Integration of Engineering, Design and 4 Management Approaches, 217-225. 5
Finer, M. and C. N. Jenkins, 2012: Proliferation of hydroelectric dams in the andean amazon and implications for 6 andes-amazon connectivity. PLoS ONE, 7 (4), e35126. 7
Fischer, R. A. and G. O. Edmeades, 2010: Breeding and cereal yield progress. Crop Sci., 50 (Supplement_1), S-85-8 S-98. 9
Fischlin, A., G. F. Midgley, J. Price, R. Leemans, B. Gopal, C. Turley, M. Rounsevall, P. Dube, J. Tarazona and A. 10 Velichko, 2007: Ecosystems, their properties, goods, and services. Journal, (Issue), 211-272. 11
Flannigan, M., B. Stocks, M. Turetsky and M. Wotton, 2009: Impacts of climate change on fire activity and fire 12 management in the circumboreal forest. Global Change Biology, 15 (3), 549-560. 13
Fleming, J. R., 2006: The pathological history of weather and climate modification: Three cycles of promise and 14 hype. Historical Studies in the Physical and Biological Sciences, 37 (1), 3-25. 15
Foden, W., G. F. Midgley, G. Hughes, W. J. Bond, W. Thuiller, M. T. Hoffman, P. Kaleme, L. G. Underhill, A. 16 Rebelo and L. Hannah, 2007: A changing climate is eroding the geographical range of the namib desert tree 17 aloe through population declines and dispersal lags. Diversity and Distributions, 13 (5), 645-653. 18
Foley, J. A., R. Defries, G. P. Asner, C. Barford, G. Bonan, S. R. Carpenter, F. S. Chapin, M. T. Coe, G. C. Daily, 19 H. K. Gibbs, J. H. Helkowski, T. Holloway, E. A. Howard, C. J. Kucharik, C. Monfreda, J. A. Patz, I. C. 20 Prentice, N. Ramankutty and P. K. Snyder, 2005: Global consequences of land use. Science, 309 (5734), 570-21 574. 22
Folke, C., 2006: Resilience: The emergence of a perspective for social–ecological systems analyses. Global 23 Environmental Change, 16 (3), 253-267. 24
Food and Agriculture Organisation of the United Nations (FAO) (2008) Climate change and food security: a 25 framework document. 26
Fordham, D. and B. Brook, 2010: Why tropical island endemics are acutely susceptible to global change. 27 Biodiversity and Conservation, 19 (2), 329-342. 28
Fordham, M. H., 1998: Making women visible in disasters: Problematising the private domain. Disasters, 22 (2), 29 126-143. 30
Foreign Policy (2012): The Failed State Index 2011 – The Rankings of Countries, website: 31 http://www.foreignpolicy.com/articles/2011/06/17/2011_failed_states_index_interactive_map_and_rankings 32 (accessed 09.02.2012) 33
Foresight (2011) The future of food and farming: challenges and choices for global sustainability. Government 34 Office for Science, UK. 35
Fothergill, A., E. G. M. Maestas and J. D. Darlington, 1999: Race, ethnicity and disasters in the united states: A 36 review of the literature. Disasters, 23 (2), 156-173. 37
Frank, E., H. Eakin and D. López-Carr, 2011: Social identity, perception and motivation in adaptation to climate risk 38 in the coffee sector of chiapas, mexico. Global Environmental Change, 21 (1), 66-76. 39
Frei, T. and E. Gassner, 2008: Climate change and its impact on birch pollen quantities and the start of the pollen 40 season an example from switzerland for the period 1969–2006. International Journal of Biometeorology, 52 (7), 41 667-674. 42
Frumkin, H., J. Hess, G. Luber, J. Malilay and M. Mcgeehin, 2008: Climate change: The public health response. 43 American Journal of Public Health, 98 (3), 435-445. 44
Fuchs, R., M. Conran and E. Louis, 2011: Climate change and asia’s coastal urban cities. Environment and 45 Urbanization Asia, 2 (1), 13-28. 46
Funabashi, Y. and K. Kitazawa, 2012: Fukushima in review: A complex disaster, a disastrous response. Bulletin of 47 the Atomic Scientists, 68 (2), 9-21. 48
Fund for Peace (2012): The Failed States Index 2011, website: http://www.fundforpeace.org/global/?q=fsi (accessed 49 09.02.2012) 50
Fung, F., A. Lopez and M. New, 2011: Water availability in +2°c and +4°c worlds. Philosophical Transactions of 51 the Royal Society A: Mathematical, Physical and Engineering Sciences, 369 (1934), 99-116. 52
Furgal, C. and T. Prowse, 2009: Climate impacts on northern canada: Introduction. AMBIO: A Journal of the 53 Human Environment, 38 (5), 246-247. 54
FIRST-ORDER DRAFT IPCC WGII AR5 Chapter 19
Do Not Cite, Quote, or Distribute 60 11 June 2012
Füssel, H.-M. and R. Klein, 2006: Climate change vulnerability assessments: An evolution of conceptual thinking. 1 Climatic Change, 75 (3), 301-329. 2
Füssel, H.-M., 2010: Modeling impacts and adaptation in global iams. Wiley Interdisciplinary Reviews: Climate 3 Change, 1 (2), 288-303. 4
G Nordenson, C Seavitt, A Yarinsky On the Water: Palisades Bay, Hatje Cantz Verlag, Ostfildern, Germany 2010 5 Gage, K. L., T. R. Burkot, R. J. Eisen and E. B. Hayes, 2008: Climate and vectorborne diseases. American journal of 6
preventive medicine, 35 (5), 436-450. 7 Galán, C., H. García-Mozo, L. Vázquez, L. Ruiz, C. D. De La Guardia and M. M. Trigo, 2005: Heat requirement for 8
the onset of the <i>olea europaea l. Pollen season in several sites in andalusia and the effect of the 9 expected future climate change. International Journal of Biometeorology, 49 (3), 184-188. 10
Gale, P., T. Drew, L. P. Phipps, G. David and M. Wooldridge, 2009: The effect of climate change on the occurrence 11 and prevalence of livestock diseases in great britain: A review. Journal of Applied Microbiology, 106 (5), 1409-12 1423. 13
Gallopín, G. C., 2006: Linkages between vulnerability, resilience, and adaptive capacity. Global Environmental 14 Change, 16 (3), 293-303. 15
Gange, A. C., E. G. Gange, T. H. Sparks and L. Boddy, 2007: Rapid and recent changes in fungal fruiting patterns. 16 Science, 316 (5821), 71. 17
GAR (The Global Assessment Report) 2011: Revealing Risk, Redefining Development, in: UN/ISDR, Geneva 18 Garamszegi, L. Z., 2011: Climate change increases the risk of malaria in birds. Global Change Biology, 17 (5), 19
1751-1759. 20 Garcia-Mozo, H., G. C., V. Jato, J. Belmonte, C. De La Guardia, D. Fernandez, M. Gutierrez, M. Aira, J. Roure, L. 21
Ruiz, M. Trigo and E. Dominquez-Vilches, 2006: Quercus pollen season dynamics in the iberian peninsula: 22 Response to meteorological parameters and possible consequences of climate change. Annals of Agricultural 23 and Environmental Medicine, 13 (2), 209-224. 24
Garrett, K. A., G. A. Forbes, S. Savary, P. Skelsey, A. H. Sparks, C. Valdivia, A. H. C. Van Bruggen, L. Willocquet, 25 A. Djurle, E. Duveiller, H. Eckersten, S. Pande, C. Vera Cruz and J. Yuen, 2011: Complexity in climate-change 26 impacts: An analytical framework for effects mediated by plant disease. Plant Pathology, 60 (1), 15-30. 27
Garschagen, M., Resilience and organisational institutionalism from a cross-cultural perspective: An exploration 28 based on urban climate change adaptation in vietnam. Natural Hazards, 1-22. 29
Gaston, K. J. and R. A. Fuller, 2008: Commonness, population depletion and conservation biology. Trends in 30 Ecology & Evolution, 23 (1), 14-19. 31
Githeko, A. K., S. W. Lindsay, U. E. Confalonieri and J. A. Patz, 2000: Climate change and vector-borne diseases: 32 A regional analysis. Bulletin of the World Health Organization, 78 1136-1147. 33
Gleditsch, N. P., 2012: Whither the weather? Climate change and conflict. Journal of Peace Research, 49 (1), 3-9. 34 Good, P., J. Caesar, D. Bernie, J. A. Lowe, P. Van Der Linden, S. N. Gosling, R. Warren, N. W. Arnell, S. Smith, J. 35
Bamber, T. Payne, S. Laxon, M. Srokosz, S. Sitch, N. Gedney, G. Harris, H. Hewitt, L. Jackson, C. D. Jones, F. 36 O'connor, J. Ridley, M. Vellinga, P. Halloran and D. Mcneall, 2011: A review of recent developments in 37 climate change science. Part i: Understanding of future change in the large-scale climate system. Progress in 38 Physical Geography, 35 (3), 281-296. 39
Gosling, S., G. Mcgregor and J. Lowe, 2009: Climate change and heat-related mortality in six cities part 2: Climate 40 model evaluation and projected impacts from changes in the mean and variability of temperature with climate 41 change. International Journal of Biometeorology, 53 (1), 31-51. 42
Govindasamy, B. and K. Caldeira, 2000: Geoengineering earth's radiation balance to mitigate co2‐induced 43 climate change. Geophys. Res. Lett., 27 (14), 2141-2144. 44
Govindasamy, B., K. Caldeira and P. B. Duffy, 2003: Geoengineering earth's radiation balance to mitigate climate 45 change from a quadrupling of co2. Global and Planetary Change, 37 (1–2), 157-168. 46
Govindasamy, B., S. Thompson, P. B. Duffy, K. Caldeira and C. Delire, 2002: Impact of geoengineering schemes 47 on the terrestrial biosphere. Geophys. Res. Lett., 29 (22), 2061. 48
Green, D., S. Jackson and J. Morrison, 2009: Risks from climate change to indigenous communities in the tropical 49 north of australia. 194. 50
Green, T. R., M. Taniguchi, H. Kooi, J. J. Gurdak, D. M. Allen, K. M. Hiscock, H. Treidel and A. Aureli, 2011: 51 Beneath the surface of global change: Impacts of climate change on groundwater. Journal of Hydrology, 405 52 (3–4), 532-560. 53
FIRST-ORDER DRAFT IPCC WGII AR5 Chapter 19
Do Not Cite, Quote, or Distribute 61 11 June 2012
Gregory, R. D., S. G. Willis, F. Jiguet, P. Voříšek, A. Klvaňová, A. Van Strien, B. Huntley, Y. C. Collingham, D. 1 Couvet and R. E. Green, 2009: An indicator of the impact of climatic change on european bird populations. 2 PLoS ONE, 4 (3), e4678. 3
Grothmann, T. and A. Patt, 2005: Adaptive capacity and human cognition: The process of individual adaptation to 4 climate change. Global Environmental Change, 15 (3), 199-213. 5
Grove, R. H., 2007: The great el niño of 1789–93 and its global consequences. The Medieval History Journal, 10 (1-6 2), 75-98. 7
Guillerminet, M. L. and R. S. J. Tol, 2008: Decision making under catastrophic risk and learning: The case of the 8 possible collapse of the west antarctic ice sheet. Climatic Change, 91 (1-2), 193-209. 9
hacia un marco de manejo para redes de áreas protegidas ante el cambio climático. Conservation Biology, 25 (2), 10 305-315. 11
Hall-Spencer, J. M., R. Rodolfo-Metalpa, S. Martin, E. Ransome, M. Fine, S. M. Turner, S. J. Rowley, D. Tedesco 12 and M.-C. Buia, 2008: Volcanic carbon dioxide vents show ecosystem effects of ocean acidification. Nature, 13 454 (7200), 96-99. 14
Hallegatte, S., V. Przyluski and A. Vogt-Schilb, 2011: Building world narratives for climate change impact, 15 adaptation and vulnerability analyses. Nature Clim. Change, 1 (3), 151-155. 16
Hansen, J., M. Sato, P. Kharecha, D. Beerling, R. Berner, V. Masson-Delmotte, M. Pagani, M. Raymo, D. L. Royer 19 and J. C. Zachos, 2008: Target atmospheric co2: Where should humanity aim? . Open Atmospheric Science 20 Journal, 2 217-231. 21
Harari, M. and Ferrara, E. L. (2011). Conflict, climate and cells: A disaggregated analysis. Working Paper 22 Hare, W. et al. 2010. Which emission pathways are consistent with a 2° C or 1.5° temperature limit? In The 23
Emissions Gap Report: Are the Copenhagen Accord Pledges Sufficient to Limit Global Warming to 2° C or 24 1.5° C? UNEP. 25
Hare, W., J. Lowe, J. Rogelj, E. Sawin and D. V. Vuuren, 2010: Which emission pathways are consistent with a 2° c 26 or 1.5° c temperature limit? Journal, (Issue), 27
Hare, W., W. Cramer, M. Schaeffer, A. Battaglini and C. Jaeger, 2011: Climate hotspots: Key vulnerable regions, 28 climate change and limits to warming. Regional Environmental Change, 11 (1), 1-13. 29
Hashizume, M., Y. Wagatsuma, A. S. G. Faruque, D. A. Sack, T. Hayashi, P. R. Hunter and B. Armstrong, 2008: 30 Factors determining vulnerability to diarrhea during and after severe floods in bangladesh. Journal of Water and 31 Health, 6 (3), 323-332. 32
Haug, G. H., D. Günther, L. C. Peterson, D. M. Sigman, K. A. Hughen and B. Aeschlimann, 2003: Climate and the 33 collapse of maya civilization. Science, 299 (5613), 1731-1735. 34
Hegland, S. J., A. Nielsen, A. Lázaro, A.-L. Bjerknes and Ø. Totland, 2009: How does climate warming affect plant-35 pollinator interactions? Ecology Letters, 12 (2), 184-195. 36
Hendrix, C. S. and I. Salehyan, 2012: Climate change, rainfall, and social conflict in africa. Journal of Peace 37 Research, 49 (1), 35-50. 38
Hendrix, C. S. and S. M. Glaser, 2007: Trends and triggers: Climate, climate change and civil conflict in sub-39 saharan africa. Political Geography, 26 (6), 695-715. 40
Henrion, M. and B. Fischhoff, 1986: Assessing uncertainty in physical constants. American Journal of Physics, 54 41 (9), 791-798. 42
Henry, S., B. Schoumaker and C. Beauchemin, 2004: The impact of rainfall on the first out-migration: A multi-level 43 event-history analysis in burkina faso. Population & Environment, 25 (5), 423-460. 44
Hersch, J. and W. K. Viscusi, 2005: The generational divide in support for environmental policies: European 45 evidence. National Bureau of Economic Research Working Paper Series, No. 11859 46
Hidalgo, F. D., S. Naidu, S. Nichter and N. Richardson, 2010: Economic determinants of land invasions. Review of 47 Economics and Statistics, 92 (3), 505-523. 48
Hinkel, J. and R. J. T. Klein, 2009: Integrating knowledge to assess coastal vulnerability to sea-level rise: The 49 development of the diva tool. Global Environmental Change, 19 (3), 384-395. 50
Hinkel, J., R. Nicholls, A. Vafeidis, R. Tol and T. Avagianou, 2010: Assessing risk of and adaptation to sea-level 51 rise in the european union: An application of diva. Mitigation and Adaptation Strategies for Global Change, 15 52 (7), 703-719. 53
Hoegh-Guldberg, O., J. C. Ortiz and S. Dove, 2011: The future of coral reefs. Science, 334 (6062), 1494-1495. 54
FIRST-ORDER DRAFT IPCC WGII AR5 Chapter 19
Do Not Cite, Quote, or Distribute 62 11 June 2012
Hoegh-Guldberg, O., L. Hughes, S. Mcintyre, D. B. Lindenmayer, C. Parmesan, H. P. Possingham and C. D. 1 Thomas, 2008: Ecology. Assisted colonization and rapid climate change. Science (New York, N.Y.), 321 2 (5887), 345-346. 3
Hof, A., C. Hope, J. Lowe, M. Mastrandrea, M. Meinshausen and D. Vuuren, 2011: The benefits of climate change 4 mitigation in integrated assessment models: The role of the carbon cycle and climate component. Climatic 5 Change, 1-21. 6
Hoffmann, V. H., D. C. Sprengel, A. Ziegler, M. Kolb and B. Abegg, 2009: Determinants of corporate adaptation to 7 climate change in winter tourism: An econometric analysis. Global Environmental Change, 19 (2), 256-264. 8
Hole, D. G., B. Huntley, J. Arinaitwe, S. H. M. Butchart, Y. C. Collingham, L. D. C. Fishpool, D. J. Pain and S. G. 9 Willis, 2011: Toward a management framework for networks of protected areas in the face of climate change 10
Holling, C. S., 2001: Understanding the complexity of economic, ecological, and social systems. Ecosystems, 4 (5), 11 390-405. 12
Homer-Dixon, T. F., 1991: On the threshold: Environmental changes as causes of acute conflict. International 13 Security, 16 (2), 76-116. 14
Hope, C. W., 2011: The social cost of co2 from the page09 model. Economics: The Open-Access, Open Assessment 15 E-Journal, 5 (2011-39), 16
Hope, C. W., 2011: The social cost of co2 from the page09 model. Journal, (Issue), 17 Hope, C., 2006: The marginal impact of co2 from page2002: An integrated assessment model incorporating the 18
ipcc's five reasons for concern. Integrated Assessment Journal, 6 (1), 19 Houghton, R. M. E., 2009: Domestic violence reporting and disasters in new zealand. Regional Development 20
Dialogue, 30 (1), 79-90. 21 Hsiang, S. M. and M. Burke, Submitted: Climate, conflict, and social stability: What do the data say? Climatic 22
Change, 23 Hsiang, S. M., 2010: Temperatures and cyclones strongly associated with economic production in the caribbean and 24
central america. Proceedings of the National Academy of Sciences, 107 (35), 15367-15372. 25 Hsiang, S. M., K. C. Meng and M. A. Cane, 2011: Civil conflicts are associated with the global climate. Nature, 476 26
(7361), 438-441. 27 Huang, T. C., Y. T. Hsu and Y. C. Chou, 2010: Influence of climate change on the incidence of rice diseases and our 28
189-195. 31 Hunter, L. M., 2005: Migration and environmental hazards. Population & Environment, 26 (4), 273-302. 32 Hutchins, D., F.-X. Fu, P. Bernhardt and M. Mulholland, 2007: Co2 control of trichodesmium n2 fixation, 33
photosynthesis, growth rates, and elemental ratios: Implications for past, present, and future ocean 34 biogeochemistry. Limnology and oceanography, 52 1293-1304. 35
ICSU-LAC, 2010a: Science for a better life: Developing regional scientific programs in priority areas for Latin 36 America and the Caribbean. Vol 2, Understanding and Managing Risk Associated with Natural Hazards: An 37 Integrated Scientific Approach 38
Idso, S. B. and K. E. Idso, 2001: Effects of atmospheric co2 enrichment on plant constituents related to animal and 39 human health. Environmental and Experimental Botany, 45 (2), 179-199. 40
Iglesias, A., S. Quiroga, M. Moneo and L. Garrote, 2012: From climate change impacts to the development of 41 adaptation strategies: Challenges for agriculture in europe. Climatic Change, 112 (1), 143-168. 42
Ilyina, T., R. E. Zeebe, E. Maier-Reimer and C. Heinze, 2009: Early detection of ocean acidification effects on 43 marine calcification. Global Biogeochem. Cycles, 23 (1), GB1008. 44
Interagency Working Group on Social Cost of Carbon, United States Government (2010). Appendix 15a. Social cost 45 of carbon for regulatory impact analysis under Executive Order 12866. In: Final Rule Technical Support 46 Document (TSD): Energy Efficiency Program for Commercial and Industrial Equipment: Small Electric 47 Motors, U.S. Department of Energy. 48
IPCC, 2012: Managing the Risks of Extreme Events and Disasters to Advance Climate Change Adaptation. A 49 Special Report of Working Groups I and II of the Intergovernmental Panel on Climate Change [Field, C.B., V. 50 Barros, T.F. Stocker, D. Qin, D.J. Dokken, K.L. Ebi, M.D. Mastrandrea, K.J. Mach, G.-K. Plattner, S.K. Allen, 51 M. Tignor, and P.M. Midgley (eds.)]. Cambridge University Press, Cambridge, UK, and New York, NY, USA, 52 582 pp. 53
FIRST-ORDER DRAFT IPCC WGII AR5 Chapter 19
Do Not Cite, Quote, or Distribute 63 11 June 2012
Irvine, P. J., D. J. Lunt, E. J. Stone and A. Ridgwell, 2009: The fate of the greenland ice sheet in a geoengineered, 1 high co 2 world. Environmental Research Letters, 4 (4), 045109. 2
Isaksen, I. S. A., M. Gauss, G. Myhre, K. M. Walter Anthony and C. Ruppel, 2011: Strong atmospheric chemistry 3 feedback to climate warming from arctic methane emissions. Global Biogeochem. Cycles, 25 (2), GB2002. 4
Ivey, J. L., J. Smithers, R. C. De Loë and R. D. Kreutzwiser, 2004: Community capacity for adaptation to climate-5 induced water shortages: Linking institutional complexity and local actors. Environmental Management, 33 (1), 6 36-47. 7
Jabry, A., 2003: Children in disasters: After the cameras have gone. Plan UK, London, UK, 8 Jacob, B., L. Lefgren and E. Moretti, 2007: The dynamics of criminal behavior: Evidence from weather shocks. The 9
Journal of Human Resources, 42 (3), 489-527. 10 Jaggard, K. W., A. Qi and E. S. Ober, 2010: Possible changes to arable crop yields by 2050. Philosophical 11
Transactions of the Royal Society B: Biological Sciences, 365 (1554), 2835-2851. 12 Jankowska, M. M., D. Lopez-Carr, C. Funk, G. J. Husak and Z. A. Chafe, 2012: Climate change and human health: 13
Spatial modeling of water availability, malnutrition, and livelihoods in mali, africa. Applied Geography, 33 (0), 14 4-15. 15
Jepsen, J. U., S. B. Hagen, R. A. Ims and N. G. Yoccoz, 2008: Climate change and outbreaks of the geometrids 16 operophtera brumata and epirrita autumnata in subarctic birch forest: Evidence of a recent outbreak range 17 expansion. Journal of Animal Ecology, 77 (2), 257-264. 18
Jinxia, W., G. S. a. R. Sabrina, C. Declan, Z. Lijuan, X. Wei, P. H. Ian and L. Yumin, 2012: China’s water–energy 19 nexus: Greenhouse-gas emissions from groundwater use for agriculture. Environmental Research Letters, 7 (1), 20 014035. 21
Johannessen, O. and M. Miles, 2011: Critical vulnerabilities of marine and sea ice–based ecosystems in the high 22 arctic. Regional Environmental Change, 11 (0), 239-248. 23
Jones, A., J. Haywood and O. Boucher, 2009: Climate impacts of geoengineering marine stratocumulus clouds. J. 24 Geophys. Res., 114 (D10), D10106. 25
Jones, A., J. Haywood, O. Boucher, B. Kravitz and A. Robock, 2010: Geoengineering by stratospheric so2 injection: 26 Results from the met office hadgem2 climate model and comparison with the goddard institute for space studies 27 modele. Atmos. Chem. Phys., 10 (13), 5999-6006. 28
Jones, B. F. and B. A. Olken, 2010: Climate shocks and exports. National Bureau of Economic Research Working 29 Paper Series, No. 15711 30
Jones, C., J. Lowe, S. Liddicoat and R. Betts, 2009: Committed terrestrial ecosystem changes due to climate change. 31 Nature Geosci, 2 (7), 484-487. 32
Jones, M. P. and S. Sanyang, 2008: Multiple pressures of soaring food prices and food security in africa. Current 33 Science, 95 (9), 34
Juliá, R. and F. Duchin, 2007: World trade as the adjustment mechanism of agriculture to climate change. Climatic 35 Change, 82 (3), 393-409. 36
Kahn, M., E., 2005: The death toll from natural disasters: The role of income, geography, and institutions. The 37 Review of Economics and Statistics, 87 (2), 271-284. 38
Kasperson, R. E. and J. X. Kasperson, 2001: Climate change , vulnerability and social justice. Stockholm 39 Environment Institute, Stockholm, 40
Kearney, M., R. Shine and W. P. Porter, 2009: The potential for behavioral thermoregulation to buffer “cold-41 blooded” animals against climate warming. Proceedings of the National Academy of Sciences, 106 (10), 3835-42 3840. 43
Keeney, R. and T. W. Hertel, 2009: The indirect land use impacts of united states biofuel policies: The importance 44 of acreage, yield, and bilateral trade responses. American Journal of Agricultural Economics, 91 (4), 895-909. 45
Keesing, F., L. K. Belden, P. Daszak, A. Dobson, C. D. Harvell, R. D. Holt, P. Hudson, A. Jolles, K. E. Jones, C. E. 46 Mitchell, S. S. Myers, T. Bogich and R. S. Ostfeld, 2010: Impacts of biodiversity on the emergence and 47 transmission of infectious diseases. Nature, 468 (7324), 647-652. 48
Keith, D. W., 2000: Geoengineering the climate: History and prospect. Annual Review of Energy and the 49 Environment, 25 245-284. 50
Keith, D. W., 2001: Geoengineering. Nature, 409 (6818), 420-420. 51 Keller, K. and D. Mcinerney, 2008: The dynamics of learning about a climate threshold. Climate Dynamics, 30 (2-52
3), 321-332. 53
FIRST-ORDER DRAFT IPCC WGII AR5 Chapter 19
Do Not Cite, Quote, or Distribute 64 11 June 2012
Keller, K., 2012: Bayesian decision theory and climate change. Encyclopedia of Energy, Natural Resource, and 1 Environmental Economics, 2
Keller, K., B. M. Bolker and D. F. D. F. Bradford, 2004: Uncertain climate thresholds and optimal economic 3 growth. Journal of Environmental Economics and Management, 48 (1), 723-741. 4
Keller, K., C. Deutsch, M. G. Hall and D. F. Bradford, 2007: Early detection of changes in the north atlantic 5 meridional overturning circulation: Implications for the design of ocean observation systems. Journal of 6 Climate, 20 (2), 145-157. 7
Keller, K., G. Yohe and M. Schlesinger, 2008: Managing the risks of climate thresholds: Uncertainties and 8 information needs. Climatic Change, 91 (1), 5-10. 9
Keller, K., M. Hall, S.-R. Kim, D. Bradford and M. Oppenheimer, 2005: Avoiding dangerous anthropogenic 10 interference with the climate system. Climatic Change, 73 (3), 227-238. 11
Kelly, A. E. and M. L. Goulden, 2008: Rapid shifts in plant distribution with recent climate change. Proceedings of 12 the National Academy of Sciences, 105 (33), 11823-11826. 13
Kelly, P. M. and W. N. Adger, 2000: Theory and practice in assessing vulnerability to climate change andfacilitating 14 adaptation. Climatic Change, 47 (4), 325-352. 15
Kenrick, D. T. and S. W. Macfarlane, 1986: Ambient temperature and horn honking. Environment and Behavior, 18 16 (2), 179-191. 17
Khazai, B., J. E. Daniel and F. Wenzel, 2011: The march 2011 japan earthquake - analysis of losses, impacts, and 18 implications for the understanding of risks posed by extreme events. Technikfolgenabschätzung – Theorie und 19 Praxis,, 20 (3), 22-33. 20
Khosla, R. and K. K. Guntupalli, 1999: Heat-related illnesses. Critical care clinics, 15 (2), 251-263. 21 Khunwishit, S., 2007: Increasing Vulnerable Populations: Implications for Disaster Response in the U.S, University 22
of North Texas. 23 Kittel, T., B. Baker, J. Higgins and J. Haney, 2011: Climate vulnerability of ecosystems and landscapes on alaska’s 24
north slope. Regional Environmental Change, 11 (0), 249-264. 25 Kjellstrom, T., R. S. Kovats, S. J. Lloyd, T. Holt and R. S. J. Tol, 2009: The direct impact of climate change on 26
regional labor productivity. Archives of Environmental & Occupational Health, 64 (4), 217-227. 27 Knopf, B., O. Edenhofer, C. Flachsland, M. T. J. Kok, H. Lotze-Campen, G. Luderer, A. Popp and D. P. Van 28
Vuuren, 2010: Managing the low-carbon transition - from model results to policies. The Energy Journal, 0 29 (Special I), 223-245. 30
Knowlton, K., B. Lynn, R. A. Goldberg, C. Rosenzweig, C. Hogrefe, J. K. Rosenthal and P. L. Kinney, 2007: 31 Projecting heat-related mortality impacts under a changing climate in the new york city region. American 32 Journal of Public Health, 97 (11), 2028-2034. 33
Kocmankova, E., M. Trnka, J. Eitzinger, H. Formayer, M. Dubrovsky, D. Semeradova, Z. Zalud, J. Juroch and M. 34 Mozny, 2010: Estimating the impact of climate change on the occurrence of selected pests in the central 35 european region. Climate Research, 44 (1), 95-105. 36
Kocmánková, E., M. Trnka, J. Eitzinger, H. Formayer, M. Dubrovský, D. Semerádová, Z. Žalud, J. Juroch and M. 37 Možný, 2010: Estimating the impact of climate change on the occurrence of selected pests in the central 38 european region. Climate Research, 44 (1), 95-105. 39
Koeller, P., C. Fuentes-Yaco, T. Platt, S. Sathyendranath, A. Richards, P. Ouellet, D. Orr, U. Skúladóttir, K. 40 Wieland, L. Savard and M. Aschan, 2009: Basin-scale coherence in phenology of shrimps and phytoplankton in 41 the north atlantic ocean. Science, 324 (5928), 791-793. 42
Kopp, R. E. and B. K. Mignone, 2012: The u.S. Government’s social cost of carbon estimates after their first two 43 years: Pathways for improvement. Economics: The Open-Access, Open Assessment E-Journal, 6 (2012-15), 44
Kopp, R. E., A. Golub, N. O. Keohane and C. Onda, 2011: The influence of the specification of climate change 45 damages on the social cost of carbon. Journal, (Issue), 46
Kopp, R. E., A. Golub, N. O. Keohane and C. Onda, 2012: The influence of the specification of climate change 47 damages on the social cost of carbon. Economics: The Open-Access, Open Assessment E-Journal, 6 (2012-13), 48
Kostyack, J., J. J. Lawler, D. D. Goble, J. D. Olden and J. M. Scott, 2011: Beyond reserves and corridors: Policy 49 solutions to facilitate the movement of plants and animals in a changing climate. BioScience, 61 (9), 713-719. 50
Kovats, R. S. and S. Hajat, 2008: Heat stress and public health: A critical review. Journal, 29 (Issue), 41-+. 51 Kovats, S. and R. Akhtar, 2008: Climate, climate change and human health in asian cities. Environment and 52
Urbanization, 20 (1), 165-175. 53
FIRST-ORDER DRAFT IPCC WGII AR5 Chapter 19
Do Not Cite, Quote, or Distribute 65 11 June 2012
Kranz, S. A., O. Levitan, K.-U. Richter, O. Prášil, I. Berman-Frank and B. Rost, 2010: Combined effects of co2 and 1 light on the n2-fixing cyanobacterium trichodesmium ims101: Physiological responses. Plant Physiology, 154 2 (1), 334-345. 3
Kranz, S., D. Sultemeyer, K. U. Richter and B. Rost, 2009: Carbon acquisition in trichodesmium: The effect of pco2 4 and diurnal changes. Limnology and oceanography, 54 (3), 548-559. 5
Kravitz, B., A. Robock, O. Boucher, H. Schmidt, K. E. Taylor, G. Stenchikov and M. Schulz, 2011: The 6 geoengineering model intercomparison project (geomip). Atmospheric Science Letters, 12 (2), 162-167. 7
Krawchuk, M. A., M. A. Moritz, M.-A. Parisien, J. Van Dorn and K. Hayhoe, 2009: Global pyrogeography: The 8 current and future distribution of wildfire. PLoS ONE, 4 (4), e5102. 9
Krey, V. and K. Riahi, 2009: Implications of delayed participation and technology failure for the feasibility, costs, 10 and likelihood of staying below temperature targets—greenhouse gas mitigation scenarios for the 21st century. 11 Energy Economics, 31, Supplement 2 (0), S94-S106. 12
Krieger, D. J., 2001: The economic value of forest ecosystem services: A review. Analysis prepared for the 13 Wilderness Society, 14
Kriegler, E., J. W. Hall, H. Held, R. Dawson and H. J. Schellnhuber, 2009: Imprecise probability assessment of 15 tipping points in the climate system. Proceedings of the National Academy of Sciences, 106 (13), 5041-5046. 16
Kriegler, E., O'Neill, B.C., Hallegatte, S., Kram, T., Lempert, R., Moss, R., Wilbanks, T. (2010) Socio-economic 17 scenario development for climate change analysis. CIRED Working Paper DT/WP No 2010-23, October 2010. 18
Krings. T., 2002: Migration –xx, in: Müller-Mahn, Detlef: Schleichende Katastrophen – Dürren und Hungerkrisen 19 in Afrika. In: Felgentreff, C., T. Glade (Hrsg.): Naturrisiken und Sozialkatastrophen, Berlin, Heidelberg: 20 Spektrum, 2008, 395-408 (ha 21
Kroeker, K. J., R. L. Kordas, R. N. Crim and G. G. Singh, 2010: Meta-analysis reveals negative yet variable effects 22 of ocean acidification on marine organisms. Ecology Letters, 13 (11), 1419-1434. 23
Kuhlbrodt, T., S. Rahmstorf, K. Zickfeld, F. Vikebø, S. Sundby, M. Hofmann, P. Link, A. Bondeau, W. Cramer and 24 C. Jaeger, 2009: An integrated assessment of changes in the thermohaline circulation. Climatic Change, 96 (4), 25 489-537. 26
Kundzewicz, Z., Y. Hirabayashi and S. Kanae, 2010: River floods in the changing climate—observations and 27 projections. Water Resources Management, 24 (11), 2633-2646. 28
Kuper, R. and S. Kröpelin, 2006: Climate-controlled holocene occupation in the sahara: Motor of africa's evolution. 29 Science, 313 (5788), 803-807. 30
Kuruppu, N. and D. Liverman, 2011: Mental preparation for climate adaptation: The role of cognition and culture in 31 enhancing adaptive capacity of water management in kiribati. Global Environmental Change, 21 (2), 657-669. 32
Kurz, W. A., C. C. Dymond, G. Stinson, G. J. Rampley, E. T. Neilson, A. L. Carroll, T. Ebata and L. Safranyik, 33 2008: Mountain pine beetle and forest carbon feedback to climate change. Nature, 452 (7190), 987-990. 34
Kusano, T. and M. Inoue, 2008: Long-term trends toward earlier breeding of japanese amphibians. Journal of 35 Herpetology, 42 (4), 608-614. 36
Ladeau, S. L. and J. S. Clark, 2006: Pollen production by pinus taeda growing in elevated atmospheric co2. 37 Functional Ecology, 20 (3), 541-547. 38
Lafferty, K. D., 2009: Calling for an ecological approach to studying climate change and infectious diseases. 39 Ecology, 90 (4), 932-933. 40
Larrick, R. P., T. A. Timmerman, A. M. Carton and J. Abrevaya, 2011: Temper, temperature, and temptation. 41 Psychological Science, 22 (4), 423-428. 42
Lautze, S., J. Leaning, A. Raven-Roberts, R. Kent and D. Mazurana, 2004: Assistance, protection, and governance 43 networks in complex emergencies. The Lancet, 364 (9451), 2134-2141. 44
Layton, D. F. and G. Brown, 2000: Heterogeneous preferences regarding global climate change. The Review of 45 Economics and Statistics, 82 (4), 616-624. 46
Le Roux, P. and M. Mcgeoch, 2008: Changes in climate extremes, variability and signature on sub-antarctic marion 47 island. Climatic Change, 86 (3), 309-329. 48
Lee, J. and T. Cameron, 2008: Popular support for climate change mitigation: Evidence from a general population 49 mail survey. Environmental & Resource Economics, 41 (2), 223-248. 50
Leemans, Rik, S. Agrawal, J. A. Edmunds, M. C. MacCracken, R. Moss, and P. S. Ramakrishnan, 1996: Mitigation: 51 Cross-sectoral and other issues. Chapter 25 of Climate Change 1995, Impacts Adaptations and Mitigation of 52 Climate Change: Scientific-Technical Analyses: Contribution of Working Group II to the the Intergovernmental 53 Panel on Climate Change 54
FIRST-ORDER DRAFT IPCC WGII AR5 Chapter 19
Do Not Cite, Quote, or Distribute 66 11 June 2012
Lei, Y. and G. Michaels, 2011: Do giant oilfield discoveries fuel internal armed conflicts? Center for Economic 1 Performance Discussion Paper No 1089, 2
Lei, Y. and Michaels, G. (2011). Do giant oilfield discoveries fuel internal armed conflicts? 3 Lenton, T. M. and N. E. Vaughan, 2009: The radiative forcing potential of different climate geoengineering options. 4
Atmos. Chem. Phys., 9 (15), 5539-5561. 5 Lenton, T. M., 2011: Beyond 2°c: Redefining dangerous climate change for physical systems. Wiley 6
Interdisciplinary Reviews: Climate Change, 2 (3), 451-461. 7 Lenton, T. M., 2011: Early warning of climate tipping points. Nature Clim. Change, 1 (4), 201-209. 8 Lenton, T. M., H. Held, E. Kriegler, J. W. Hall, W. Lucht, S. Rahmstorf and H. J. Schellnhuber, 2008: Tipping 9
elements in the earth's climate system. Proceedings of the National Academy of Sciences, 105 (6), 1786-1793. 10 Lenton, T.M., Integrating tipping points into climate impact assessments. Climatic Change in rev. 11 Levermann, A. N., J. L. Bamber, S. Drijfhout, A. Ganopolski, W. Haeberli, N. R. P. Harris, M. Huss, K. Krüger, T. 12
M. Lenton, R. W. Lindsay, D. Notz, P. Wadhams and S. Weber, 2011: Potential climatic transitions with 13 profound impact on europe - review of the current state of six 'tipping elements of the climate system'. Climatic 14 Change, 110 (3-4), 845-878. 15
Levitan, O., G. Rosenberg, I. Setlik, E. Setlikova, J. Grigel, J. Klepetar, O. Prasil and I. Berman-Frank, 2007: 16 Elevated co2 enhances nitrogen fixation and growth in the marine cyanobacterium trichodesmium. Global 17 Change Biology, 13 (2), 531-538. 18
Levy, M., Thorkelson, C., Vorosmarty, C., Douglas, E., Humphreys, M., and Hampshire, N. (2005). Freshwater 19 availability anomalies and outbreak of internal war: Results from a global spatial time series analysis. 20 International workshop on ‘Human Security and Climate Change’, Holmen, Norway. 21
Li, H., R. P. Berrens, A. K. Bohara, H. C. Jenkins-Smith, C. L. Silva and D. L. Weimer, 2004: Would developing 22 country commitments affect us households' support for a modified kyoto protocol? Ecological Economics, 48 23 (3), 329-343. 24
Lin, S., M. Luo, R. J. Walker, X. Liu, S.-A. Hwang and R. Chinery, 2009: Extreme high temperatures and hospital 25 admissions for respiratory and cardiovascular diseases. Epidemiology, 20 (5), 738-746 26 710.1097/EDE.1090b1013e3181ad5522. 27
Liu, J., S. Fritz, C. F. A. Van Wesenbeeck, M. Fuchs, L. You, M. Obersteiner and H. Yang, 2008: A spatially 28 explicit assessment of current and future hotspots of hunger in sub-saharan africa in the context of global 29 change. Global and Planetary Change, 64 (3–4), 222-235. 30
Lloyd, I.D. and M. Oppenheimer 2012: On the Design of an International Governance Framework for 31 Geoengineering, Submitted to Global Environmental Politics 32
Lloyd, S. J., R. S. Kovats and Z. Chalabi, 2011: Climate change, crop yields, and undernutrition: Development of a 33 model to quantify the impact of climate scenarios on child undernutrition. Environ Health Perspect, 119 (12), 34
Lobell, D. B., M. B. Burke, C. Tebaldi, M. D. Mastrandrea, W. P. Falcon and R. L. Naylor, 2008: Prioritizing 35 climate change adaptation needs for food security in 2030. Science, 319 (5863), 607-610. 36
Lobell, D. B., W. Schlenker and J. Costa-Roberts, 2011: Climate trends and global crop production since 1980. 37 Science, 333 (6042), 616-620. 38
Lobell, D., B. and C. Field, B. , 2007: Global scale climate–crop yield relationships and the impacts of recent 39 warming. Environmental Research Letters, 2 (1), 014002. 40
Lorenz, A., M. Schmidt, E. Kriegler and H. Held, 2012: Anticipating climate threshold damages. Environmental 41 Modeling and Assessment, 17 (1), 163-175. 42
Loss, S. R., L. A. Terwilliger and A. C. Peterson, 2011: Assisted colonization: Integrating conservation strategies in 43 the face of climate change. Biological Conservation, 144 (1), 92-100. 44
Luber, G. and M. Mcgeehin, 2008: Climate change and extreme heat events. American journal of preventive 45 medicine, 35 (5), 429-435. 46
Lunt, D. J., N. De Noblet-Ducoudré and S. Charbit, 2004: Effects of a melted greenland ice sheet on climate, 47 vegetation, and the cryosphere. Climate Dynamics, 23 (7), 679-694. 48
Maestre, F. T., J. L. Quero, N. J. Gotelli, A. Escudero, V. Ochoa, M. Delgado-Baquerizo, M. García-Gómez, M. A. 49 Bowker, S. Soliveres, C. Escolar, P. García-Palacios, M. Berdugo, E. Valencia, B. Gozalo, A. Gallardo, L. 50 Aguilera, T. Arredondo, J. Blones, B. Boeken, D. Bran, A. A. Conceição, O. Cabrera, M. Chaieb, M. Derak, D. 51 J. Eldridge, C. I. Espinosa, A. Florentino, J. Gaitán, M. G. Gatica, W. Ghiloufi, S. Gómez-González, J. R. 52 Gutiérrez, R. M. Hernández, X. Huang, E. Huber-Sannwald, M. Jankju, M. Miriti, J. Monerris, R. L. Mau, E. 53 Morici, K. Naseri, A. Ospina, V. Polo, A. Prina, E. Pucheta, D. A. Ramírez-Collantes, R. Romão, M. Tighe, C. 54
FIRST-ORDER DRAFT IPCC WGII AR5 Chapter 19
Do Not Cite, Quote, or Distribute 67 11 June 2012
Torres-Díaz, J. Val, J. P. Veiga, D. Wang and E. Zaady, 2012: Plant species richness and ecosystem 1 multifunctionality in global drylands. Science, 335 (6065), 214-218. 2
Magan, N., A. Medina and D. Aldred, 2011: Possible climate-change effects on mycotoxin contamination of food 3 crops pre- and postharvest. Plant Pathology, 60 (1), 150-163. 4
Malhi, Y., L. E. O. C. Aragão, D. Galbraith, C. Huntingford, R. Fisher, P. Zelazowski, S. Sitch, C. Mcsweeney and 5 P. Meir, 2009: Exploring the likelihood and mechanism of a climate-change-induced dieback of the amazon 6 rainforest. Proceedings of the National Academy of Sciences, 7
Manne, A. S. and R. G. Richels, 1999: The kyoto protocol: A cost-effective strategy for meeting environmental 8 objectives? The Energy Journal, 20 (Special Issue), 1-24. 9
Mansilla, E. (ed.), 1996: Desastres: modelo para armar. La RED, Lima, Peru. 10 Marten, A. L., 2011: Transient temperature response modeling in iams: The effects of over simplification on the scc. 11
Economics: The Open-Access, Open Assessment E-Journal, 5 (2011-18), 12 Maskrey, A. (Comp.), 1993a: Los Desastres No son Naturales. Red de Estudios Sociales en Prevención de Desastres 13
en América Latina, LA RED, Tercer Mundo Editores, La RED, Bogotá, Colombia. 14 Maskrey, A. (ed.), 1998: Navegando entre Brumas: La Aplicación de los Sistemas de Información Geográfica al 15
Análisis de Riesgo en América Latina. LA RED, ITDG, Lima, Peru. 16 Maskrey, A., 1989: Disaster mitigation: A community based approach. Oxfam, Oxford (United Kingdom), 17 Maskrey, A., 2011: Revisiting community-based disaster risk management. Environmental Hazards, 10 (1), 42-52. 18 Matthews, H. D. and K. Caldeira, 2007: Transient climate–carbon simulations of planetary geoengineering. 19
Proceedings of the National Academy of Sciences, 104 (24), 9949-9954. 20 Matthews, H. D. and K. Caldeira, 2008: Stabilizing climate requires near-zero emissions. Geophys. Res. Lett., 35 21
(4), L04705. 22 Mcalpine, C. A., J. G. Ryan, L. Seabrook, S. Thomas, P. J. Dargusch, J. I. Syktus, R. A. Pielke Sr, A. E. Etter, P. M. 23
Fearnside and W. F. Laurance, 2010: More than co2: A broader paradigm for managing climate change and 24 variability to avoid ecosystem collapse. Current Opinion in Environmental Sustainability, 2 (5–6), 334-346. 25
Mccann, D. G., 2011: A review of hurricane disaster planning for the elderly. World Medical & Health Policy, 3 (1), 26 McClellan, Justin, James Sisco, Brandon Suarez, and Greg Keogh, 2010: Geoengineering Cost Analysis, Report 27
UC01-001; AR10-182, (Aurora Flight Services, Cambridge, Massachusetts), 86 pp. 28 Mcinerney, D. and K. Keller, 2008: Economically optimal risk reduction strategies in the face of uncertain climate 29
thresholds. Climatic Change, 91 (1), 29-41. 30 Mcinerney, D., R. Lempert and K. Keller, 2012: What are robust strategies in the face of uncertain climate threshold 31
responses? Climatic Change, 112 (3), 547-568. 32 Mcleman, R. and B. Smit, 2006: Migration as an adaptation to climate change. Climatic Change, 76 (1), 31-53. 33 McLeman, Robert. 2011. Climate change, migration and critical international security considerations. International 34
Organization for Migration (IOM). 42: 9-33. 35 Mcneall, D., P. R. Halloran, P. Good and R. A. Betts, 2011: Analyzing abrupt and nonlinear climate changes and 36
their impacts. Wiley Interdisciplinary Reviews: Climate Change, 2 (5), 663-686. 37 Meier, P., D. Bond and J. Bond, 2007: Environmental influences on pastoral conflict in the horn of africa. Political 38
Geography, 26 (6), 716-735. 39 Mendelsohn, R., K. Emanuel, S. Chonabayashi and L. Bakkensen, 2012: The impact of climate change on global 40
tropical cyclone damage. Nature Clim. Change, 2 (3), 205-209. 41 Menkhaus, K., 2010: Stabilisation and humanitarian access in a collapsed state: The somali case. Disasters, 34 S320-42
S341. 43 Midgley, G. F., 2012: Biodiversity and ecosystem function. Science, 335 (6065), 174-175. 44 Miettinen, J., A. Hooijer, C. Shi, D. Tollenaar, R. Vernimmen, S. C. Liew, C. Malins and S. E. Page, 2012: Extent 45
of industrial plantations on southeast asian peatlands in 2010 with analysis of historical expansion and future 46 projections. GCB Bioenergy, n/a-n/a. 47
Miguel, E., S. Satyanath and E. Sergenti, 2004: Economic shocks and civil conflict: An instrumental variables 48 approach. Journal of Political Economy, 112 (4), 725-753. 49
Mohan, J. E., L. H. Ziska, W. H. Schlesinger, R. B. Thomas, R. C. Sicher, K. George and J. S. Clark, 2006: Biomass 50 and toxicity responses of poison ivy (toxicodendron radicans) to elevated atmospheric co2. Proceedings of the 51 National Academy of Sciences, 103 (24), 9086-9089. 52
FIRST-ORDER DRAFT IPCC WGII AR5 Chapter 19
Do Not Cite, Quote, or Distribute 68 11 June 2012
Mooney, H., A. Larigauderie, M. Cesario, T. Elmquist, O. Hoegh-Guldberg, S. Lavorel, G. M. Mace, M. Palmer, R. 1 Scholes and T. Yahara, 2009: Biodiversity, climate change, and ecosystem services. Current Opinion in 2 Environmental Sustainability, 1 (1), 46-54. 3
Moore, S. K., V. L. Trainer, N. J. Mantua, M. S. Parker, E. A. Laws, L. C. Backer and L. E. Fleming, 2008: Impacts 4 of climate variability and future climate change on harmful algal blooms and human health. Environmental 5 Health, 7 (Suppl 2: S4), 6
Moreno-Rueda, G., J. Pleguezuelos and E. Alaminos, 2009: Climate warming and activity period extension in the 7 mediterranean snake <i>malpolon monspessulanus</i>. Climatic Change, 92 (1), 235-242. 8
Moser, S., R. Kasperson, G. Yohe and J. Agyeman, 2008: Adaptation to climate change in the northeast united 9 states: Opportunities, processes, constraints. Mitigation and Adaptation Strategies for Global Change, 13 (5), 10 643-659. 11
Mougou, R., M. Mansour, A. Iglesias, R. Chebbi and A. Battaglini, 2011: Climate change and agricultural 12 vulnerability: A case study of rain-fed wheat in kairouan, central tunisia. Regional Environmental Change, 11 13 (0), 137-142. 14
Müller, C., B. Eickhout, S. Zaehle, A. Bondeau, W. Cramer and W. Lucht, 2007: Effects of changes in co2, climate, 15 and land use on the carbon balance of the land biosphere during the 21st century. J. Geophys. Res., 112 (G2), 16 G02032. 17
Munshi, K., 2003: Networks in the modern economy: Mexican migrants in the u. S. Labor market. The Quarterly 18 Journal of Economics, 118 (2), 549-599. 19
Murphy, D. M., 2009: Effect of stratospheric aerosols on direct sunlight and implications for concentrating solar 20 power. Environmental Science & Technology, 43 (8), 2784-2786. 21
Myers N, Kent J (1994) Environmental Exodus: An Emergent Crisis in the Global Arena (Climate Institute, 22 Washington, DC). 23
N.Rusin and L. Flit, Man versus climate. Peace Publishers, Moscow, 175. 24 Næss, L. O., G. Bang, S. Eriksen and J. Vevatne, 2005: Institutional adaptation to climate change: Flood responses 25
at the municipal level in norway. Global Environmental Change, 15 (2), 125-138. 26 National_Academy_of_Science (2010) Ocean Acidification: A National Strategy to Meet the Challenges of a 27
Changing Ocean, Washington, D.C., The National Academies Press. 28 Neumayer, E. and T. Plumper, 2007: The gendered nature of natural disasters: The impact of catastrophic events on 29
the gender gap in life expectancy Annals of the American Association of Geographers, 97 (3), 551-566. 30 Nicholls, R. J. and A. Cazenave, 2010: Sea-level rise and its impact on coastal zones. Science, 328 (5985), 1517-31
1520. 32 Nicholls, R. J., N. Marinova, J. A. Lowe, S. Brown, P. Vellinga, D. De Gusmão, J. Hinkel and R. S. J. Tol, 2011: 33
Sea-level rise and its possible impacts given a ‘beyond 4°c world’ in the twenty-first century. Philosophical 34 Transactions of the Royal Society A: Mathematical, Physical and Engineering Sciences, 369 (1934), 161-181. 35
Nicholls, R. J., Wong, P. P., Burkett, V. R., Codignotto, J. O., Hay, J. E., McLean, R. F., Ragoonaden, S. & 36 Woodroffe, C. D. 2007 Coastal systems and low-lying areas. In Climate Change 2007: impacts, adaptation and 37 vulnerability. 38
Nicholls, R., R. Tol and A. Vafeidis, 2008: Global estimates of the impact of a collapse of the west antarctic ice 39 sheet: An application of <i>fund</i>. Climatic Change, 91 (1), 171-191. 40
Niemeyer, S., J. Petts and K. Hobson, 2005: Rapid climate change and society: Assessing responses and thresholds. 41 Risk Analysis, 25 (6), 1443-1456. 42
Nordhaus, W.D., 2007. Accompanying Notes and Documentation on Development of DICE-2007 Model. 43 Nordhaus, William D., Estimates of the Social Cost of Carbon: Background and Results from the Rice-2011 Model 44
(October 2011). NBER Working Paper Series, Vol. w17540, pp. -, 2011. Available at SSRN: 45 http://ssrn.com/abstract=1950958 46
O'brien, K. L. and J. Wolf, 2010: A values-based approach to vulnerability and adaptation to climate change. Wiley 47 Interdisciplinary Reviews: Climate Change, 1 (2), 232-242. 48
O'connor, F. M., O. Boucher, N. Gedney, C. D. Jones, G. A. Folberth, R. Coppell, P. Friedlingstein, W. J. Collins, J. 49 Chappellaz, J. Ridley and C. E. Johnson, 2010: Possible role of wetlands, permafrost, and methane hydrates in 50 the methane cycle under future climate change: A review. Rev. Geophys., 48 (4), RG4005. 51
O'neill, M. S., 2003: Air conditioning and heat-related health effects Applied Environmental Science and Public 52 Health, 111 (16), 1861-1870. 53
FIRST-ORDER DRAFT IPCC WGII AR5 Chapter 19
Do Not Cite, Quote, or Distribute 69 11 June 2012
O’neill, B. C., K. Riahi and I. Keppo, 2010: Mitigation implications of midcentury targets that preserve long-term 1 climate policy options. Proceedings of the National Academy of Sciences, 107 (3), 1011-1016. 2
Oman, L., 2006: Modeling the distribution of the volcanic aerosol cloud from the 1783–1784 laki eruption. Journal 3 of geophysical research. Biogeosciences, 111 D12209. 4
Oman, L., A. Robock, G. L. Stenchikov, T. Thordarson, D. Koch, D. T. Shindell and G. Chaochao, 2006: Modeling 5 the distribution of the volcanic aerosol cloud from the 1783-1784 laki eruption. American Geophysical Union, 6 Washington, DC, ETATS-UNIS, 7
Oman, L., A. Robock, G. Stenchikov, G. A. Schmidt and R. Ruedy, 2005: Climatic response to high-latitude 8 volcanic eruptions. J. Geophys. Res., 110 (D13), D13103. 9
Oppenheimer, M., 2005: Defining dangerous anthropogenic interference: The role of science, the limits of science. 10 Risk Analysis, 25 (6), 1399-1407. 11
Oppenheimer, M., B. O’neill and M. Webster, 2008: Negative learning. Climatic Change, 89 (1), 155-172. 12 Orlove, B., 2009: Glacier retreat: Reviewing the limits of human adaptation to climate change. Environment: 13
Science and Policy for Sustainable Development, 51 (3), 22-34. 14 Orr, J. C., V. J. Fabry, O. Aumont, L. Bopp, S. C. Doney, R. A. Feely, A. Gnanadesikan, N. Gruber, A. Ishida, F. 15
Joos, R. M. Key, K. Lindsay, E. Maier-Reimer, R. Matear, P. Monfray, A. Mouchet, R. G. Najjar, G.-K. 16 Plattner, K. B. Rodgers, C. L. Sabine, J. L. Sarmiento, R. Schlitzer, R. D. Slater, I. J. Totterdell, M.-F. Weirig, 17 Y. Yamanaka and A. Yool, 2005: Anthropogenic ocean acidification over the twenty-first century and its 18 impact on calcifying organisms. Nature, 437 (7059), 681-686. 19
Ouyang, Z. Y., X. K. Wang and H. Miao, 1999: A primary study on chinese terrestrial ecosystem services and their 20 ecological-economic values. Acta Ecologica Sinica, 19 (5), 607-613. 21
Panel on Policy Implications of Greenhouse Warming, Committee on Science, Engineering, and Public Policy, 22 National Academy of Sciences, 1992: Policy Implications of Greenhouse Warming (National Academy Press, 23 Washington D.C.) 24
Parry, M. L., C. Rosenzweig, A. Iglesias, M. Livermore and G. Fischer, 2004: Effects of climate change on global 25 food production under sres emissions and socio-economic scenarios. Global Environmental Change, 14 (1), 53-26 67. 27
Parry, M.L. O.F. Canziani, J.P. Palutikof, P.J. van der Linden and C.E. Hanson, Eds. 2007: Climate Change 2007: 28 Impacts, Adaptation and Vulnerability. Contribution of Working Group II to the Fourth Assessment Report of 29 the Intergovernmental Pan 30
Partanen, A.-I., H. Kokkola, S. Romakkaniemi, V.-M. Kerminen, K. E. J. Lehtinen, T. Bergman, A. Arola and H. 31 Korhonen, 2012: Direct and indirect effects of sea spray geoengineering and the role of injected particle size. J. 32 Geophys. Res., 117 (D2), D02203. 33
Pasquale, B. and Travaglianti, M. (2010). The subnational origins of insurgency. NYU Working Paper. 34 Patt, A., D. Van Vuuren, F. Berkhout, A. Aaheim, A. Hof, M. Isaac and R. Mechler, 2010: Adaptation in integrated 35
assessment modeling: Where do we stand? Climatic Change, 99 (3), 383-402. 36 Pearce, D.W., W.R.Cline, A.N.Achanta, S.Fankhauser, R.K.Pachauri, R.S.J.Tol, and P.Vellinga (1996), 'The Social 37
Costs of Climate Change: Greenhouse Damage and the Benefits of Control', in Climate Change 1995: 38 Economic and Social Dimensions of Climate Change 39
Pelling, M., H. C., D. J. and D. Smith, 2008: Shadow spaces for social learning: A relational understanding of 40 adaptive capacity to climate change within organizations. Environment and Planning, 40 (4), 867-884. 41
Perch-Nielsen, Sabine. 2004. Understanding the effect of climate change on human migration: the contribution of 42 mathematical and conceptual models. Diplomathesis. Swiss Federal Institute of Technology, Zurich. 43
Peters, K., J. Quaas and H. Grafll, 2011: A search for large-scale effects of ship emissions on clouds and radiation in 44 satellite data. J. Geophys. Res., 116 (D24), D24205. 45
Philip, J. R., L. John and C. Chih-Chieh, 2009: Geoengineering by cloud seeding: Influence on sea ice and climate 46 system. Environmental Research Letters, 4 (4), 045112. 47
Phillips, O. L., L. E. O. C. Aragão, S. L. Lewis, J. B. Fisher, J. Lloyd, G. López-González, Y. Malhi, A. 48 Monteagudo, J. Peacock, C. A. Quesada, G. Van Der Heijden, S. Almeida, I. Amaral, L. Arroyo, G. Aymard, T. 49 R. Baker, O. Bánki, L. Blanc, D. Bonal, P. Brando, J. Chave, Á. C. A. De Oliveira, N. D. Cardozo, C. I. 50 Czimczik, T. R. Feldpausch, M. A. Freitas, E. Gloor, N. Higuchi, E. Jiménez, G. Lloyd, P. Meir, C. Mendoza, 51 A. Morel, D. A. Neill, D. Nepstad, S. Patiño, M. C. Peñuela, A. Prieto, F. Ramírez, M. Schwarz, J. Silva, M. 52 Silveira, A. S. Thomas, H. T. Steege, J. Stropp, R. Vásquez, P. Zelazowski, E. A. Dávila, S. Andelman, A. 53 Andrade, K.-J. Chao, T. Erwin, A. Di Fiore, E. H. C., H. Keeling, T. J. Killeen, W. F. Laurance, A. P. Cruz, N. 54
FIRST-ORDER DRAFT IPCC WGII AR5 Chapter 19
Do Not Cite, Quote, or Distribute 70 11 June 2012
C. A. Pitman, P. N. Vargas, H. Ramírez-Angulo, A. Rudas, R. Salamão, N. Silva, J. Terborgh and A. Torres-1 Lezama, 2009: Drought sensitivity of the amazon rainforest. Science, 323 (5919), 1344-1347. 2
Pielke Jr, R. A., 1998: Rethinking the role of adaptation in climate policy. Global Environmental Change, 8 (2), 159-3 170. 4
Pielke, R. A., 2007: Future economic damage from tropical cyclones: Sensitivities to societal and climate changes. 5 Philosophical Transactions of the Royal Society A: Mathematical, Physical and Engineering Sciences, 365 6 (1860), 2717-2729. 7
Polasky, S., S. R. Carpenter, C. Folke and B. Keeler, 2011: Decision-making under great uncertainty: Environmental 8 management in an era of global change. Trends in Ecology & Evolution, 26 (8), 398-404. 9
Portier CJ, Thigpen Tart K, Carter SR, Dilworth CH, Grambsch AE, Gohlke J, Hess J, Howard SN, Luber G, Lutz 10 JT, Maslak T, Prudent N, Radtke M, Rosenthal JP, Rowles T, Sandifer PA, Scheraga J, Schramm PJ, Strickman 11 D, Trtanj JM, Whung P-Y. 2010. A Human Health Perspective On Climate Change: A Report Outlining the 12 Research Needs on the Human Health Effects of Climate Change. Research Triangle Park, NC: Environmental 13 Health Perspectives/National Institute of Environmental Health Sciences. doi:10.1289/ehp.1002272 Available: 14 www.niehs.nih.gov/climatereport 15
PREVIEW/UNEP (2012): Global Change and Vulnerability – Project for Risk Evaluation, Information and Early 16 Warning (PREVIEW), website: 17 http://www.grid.unep.ch/index.php?option=com_content&view=article&id=47&Itemid=33&lang=en&project_i18 d=1BDE1705 (accessed 09.02.2012) 19
Pudas, E., M. Leppälä, A. Tolvanen, J. Poikolainen, A. Venäläinen and E. Kubin, 2008: Trends in phenology of 20 <i>betula pubescens across the boreal zone in finland. International Journal of Biometeorology, 52 (4), 21 251-259. 22
Rajagopal, D., S. E. Sexton, D. Roland-Holst and D. Zilberman, 2007: Challenge of biofuel: Filling the tank without 23 emptying the stomach? Environmental Research Letters, 2 (4), 044004. 24
Ranger, N., L. Gohar, J. Lowe, S. Raper, A. Bowen and R. Ward, 2012: Is it possible to limit global warming to no 25 more than 1.5°c? Climatic Change, 111 (3), 973-981. 26
Rasch, P. J., S. Tilmes, R. P. Turco, A. Robock, L. Oman, C.-C. Chen, G. L. Stenchikov and R. R. Garcia, 2008: An 27 overview of geoengineering of climate using stratospheric sulphate aerosols. Philosophical Transactions of the 28 Royal Society A: Mathematical, Physical and Engineering Sciences, 366 (1882), 4007-4037. 29
Rasmussen, A., 2002: The effects of climate change on the birch pollen season in denmark. Aerobiologia, 18 (3), 30 253-265. 31
Ray-Bennett, N. S., 2009: The influence of caste, class and gender in surviving multiple disasters: A case study from 32 orissa, india. Environmental Hazards, 8 (1), 5-22. 33
Renaud, F., J. Birkmann, M. Damm and G. Gallopín, 2010: Understanding multiple thresholds of coupled social–34 ecological systems exposed to natural hazards as external shocks. Natural Hazards, 55 (3), 749-763. 35
Renn, O., W. J. Burns, J. X. Kasperson, R. E. Kasperson and P. Slovic, 1992: The social amplification of risk: 36 Theoretical foundations and empirical applications. Journal of Social Issues, 48 (4), 137-160. 37
Resilience Alliance (2010). Assessing resilience in social-ecological systems. A workbook for scientists. Version 38 2.0. http://www.resalliance.org/3871.php 39
Richard Moss, Mustafa Babiker, Sander Brinkman, Eduardo Calvo, Tim Carter, Jae Edmonds, Ismail Elgizouli, 40 Seita Emori, Lin Erda, Kathy Hibbard, Roger Jones, Mikiko Kainuma, Jessica Kelleher, Jean Francois 41 Lamarque, Martin Manning, Ben Matthews, Jerry Meehl, Leo Meyer, John Mitchell, Nebojsa Nakicenovic, 42 Brian O’Neill, Ramon Pichs, Keywan Riahi, Steven Rose, Paul Runci, Ron Stouffer, Detlef van Vuuren, John 43 Weyant, Tom Wilbanks, Jean Pascal van Ypersele, Monika Zurek. 2008: Further work on scenarios: Report 44 from the IPCC expert meeting. Towards new scenarios for analysis of emissions, climate change, impacts, and 45 response strategies. IPCC-XXVIII/Doc.8 (19.III.2008). 46
Richardson, D. M., J. J. Hellmann, J. S. Mclachlan, D. F. Sax, M. W. Schwartz, P. Gonzalez, E. J. Brennan, A. 47 Camacho, T. L. Root, O. E. Sala, S. H. Schneider, D. M. Ashe, J. R. Clark, R. Early, J. R. Etterson, E. D. 48 Fielder, J. L. Gill, B. A. Minteer, S. Polasky, H. D. Safford, A. R. Thompson and M. Vellend, 2009: 49 Multidimensional evaluation of managed relocation. Proceedings of the National Academy of Sciences, 106 50 (24), 9721-9724. 51
Ridley, J., J. Gregory, P. Huybrechts and J. Lowe, 2010: Thresholds for irreversible decline of the greenland ice 52 sheet. Climate Dynamics, 35 (6), 1049-1057. 53
FIRST-ORDER DRAFT IPCC WGII AR5 Chapter 19
Do Not Cite, Quote, or Distribute 71 11 June 2012
Riera, P., J. Peñuelas, V. Farreras and M. Estiarte, 2007: Valuation of climate-change effects on mediterranean 1 shrublands. Ecological Applications, 17 (1), 91-100. 2
Risbey, J., 2011: Dangerous climate change and water resources in australia. Regional Environmental Change, 11 3 (0), 197-203. 4
Roberts, M. J. and W. Schlenker, 2009: World supply and demand of food commodity calories. American Journal of 5 Agricultural Economics, 91 (5), 1235-1242. 6
Roberts, Michael and Wolfram Schlenker. 2010. “Identifying Supply and Demand Elasticities of Agricultural 7 Commodities: Implications for the US Ethanol Mandate,” NBER Working Paper 15921. 8
Robinson, A., R. Calov and A. Ganopolski, 2012: Multistability and critical thresholds of the greenland ice sheet. 9 Nature Clim. Change, advance online publication 10
Robock, A., 2008: 20 reasons why geoengineering may be a bad idea. Bulletin of the Atomic Scientists, 64 (2), 14-11 18. 12
Robock, A., 2008: Regional climate responses to geoengineering with tropical and arctic so2 injections. Journal of 13 geophysical research. Biogeosciences, 113 (d16), D16101. 14
Robock, A., 2008: Whither geoengineering? Science, 320 (5880), 1166-1167. 15 Robock, A., A. Marquardt, B. Kravitz and G. Stenchikov, 2009: Benefits, risks, and costs of stratospheric 16
geoengineering. Geophys. Res. Lett., 36 (19), L19703. 17 Rogers, C. A., P. M. Wayne, E. A. Macklin, M. L. Muilenberg, C. J. Wagner, P. R. Epstein and F. A. Bazzaz, 2006: 18
Interaction of the onset of spring and elevated atmospheric co2 on ragweed (ambrosia artemisiifolia l.) pollen 19 production. Environmental Health Perspectives, 114 (6), 865-869. 20
Rohmberg M., 2009: The Mass Media and the Risk Communication of Climate Change: A Theoretical Observation, 21 Department of Communication and Cultural Management, Zeppeling University Friedrichshaften, Germany 22
Root, T. L. and S. H. Schneider, 2006: Conservation and climate change: The challenges ahead. Conservation 23 Biology, 20 (3), 706-708. 24
Roson, Roberto and Van der Mensbrugghe, Dominique, Climate Change and Economic Growth: Impacts and 25 Interactions (April 23, 2010). University Ca' Foscari of Venice, Dept. of Economics Research Paper Series No. 26 07_10. 27
Rothausen, S. G. S. A. and D. Conway, 2011: Greenhouse-gas emissions from energy use in the water sector. Nature 28 Clim. Change, 1 (4), 210-219. 29
Royal Society (2009) The Coral Reef Crisis: addressing the threats of global warming and ocean acidification. 30 Salter, S., 2008: Sea-going hardware for the cloud albedo method of reversing global warming. Philosophical 31
transactions of the Royal Society of London. Series A: Mathematical, physical, and engineering sciences, 366 32 (1882), 3989-4006. 33
Sanderson, B. M., 2011: The response of the climate system to very high greenhouse gas emission scenarios. 34 Environmental Research Letters, 6 (3), 034005. 35
Scharlemann, J. P. W., Walpole, M.J. (2010), 2010: Biodiversity scenarios: Projections of 21st century change in 36 biodiversity and associated ecosystem services. Secretariat of the Convention on Biological Diversity, 37 Montreal, 38
Schlenker, W., 2009: Nonlinear temperature effects indicate severe damages to u.S. Crop yields under climate 39 change. PNAS : Proceedings of the National Academy of Sciences, 106 (37), 15594-15598. 40
Schmidhuber, J., 2007: Climate change and food security special feature: Global food security under climate change. 41 PNAS : Proceedings of the National Academy of Sciences, 104 (50), 19703-19708. 42
Schmidt, H., K. Alterskjær, D. Bou Karam, O. Boucher, A. Jones, J. E. Kristjansson, U. Niemeier, M. Schulz, A. 43 Aaheim, F. Benduhn, M. Lawrence and C. Timmreck, 2012: Can a reduction of solar irradiance counteract co2-44 induced climate change? – results from four earth system models. Earth Syst. Dynam. Discuss., 3 (1), 31-72. 45
Schneider, S. H., 1996: Geoengineering: Could? Or should? We do it? Climatic Change, 33 (3), 291-302. 46 Schneider, S.H. and Co-authors, 2007. Assessing key vulnerabilities and the risk from climate change. Climate 47
Change 2007: Impacts, Adaptationand Vulnerability. Contribution of Working Group II to the Fourth 48 Assessment Report of the Intergovern 49
Schneider, S.H., S. Semenov, A. Patwardhan, I. Burton, C.H.D. Magadza, M. Oppenheimer, A.B. Pittock, A. 50 Rahman, J.B. Smith, A. Suarez and F. Yamin, 2007: Assessing key vulnerabilities and the risk from climate 51 change. In: Climate Change 2007: Impacts, Adaptation and Vulnerability. Contribution of Working Group II to 52 the Fourth Assessment Report of the Intergovernmental Panel on Climate Change. [M.L. Parry, O.F. Canziani, 53
FIRST-ORDER DRAFT IPCC WGII AR5 Chapter 19
Do Not Cite, Quote, or Distribute 72 11 June 2012
J.P. Palutikof, P.J. van der Linden and C.E. Hanson, Eds.] Cambridge University Press, Cambridge, UK, 779-1 810. 2
Schnitzler, J., 2007: Survey on the population's needs and the public health response during floods in germany 2002. 3 Journal of public health management and practice, 13 (5), 461. 4
Schreier, M., 2007: Global ship track distribution and radiative forcing from 1 year of aatsr data. Geophysical 5 research letters, 34 L17814. 6
Schröter, D., 2005: Assessing vulnerabilities to the effects of global change: An eight step approach. Mitigation and 7 Adaptation Strategies for Global Change, 10 (4), 573-595. 8
Sclar, E. D., 2005: The 21st century health challenge of slums and cities. The Lancet (British edition), 365 (9462), 9 901. 10
Scott, D., 2007: Climate change adaptation in the ski industry. Mitigation and Adaptation Strategies for Global 11 Change, 12 (8), 1411-1431. 12
Searchinger, T. D., 2009: Fixing a critical climate accounting error. Science (New York, N.Y.), 326 (5952), 527-13 528. 14
Searchinger, T., 2008: Use of u.S. Croplands for biofuels increases greenhouse gases through emissions from land-15 use change. Science (New York, N.Y.), 319 (5867), 1238-1240. 16
Sekercioglu, C. H., 2008: Climate change, elevational range shifts, and bird extinctions. Conservation Biology, 22 17 (1), 140-150. 18
Shea, K. M., 2008: Climate change and allergic disease. Journal of Allergy and Clinical Immunology, 122 (3), 443. 19 Shea, K., R. Truckner, R. Weber and D. Peden, 2009: Climate change and plant food allergens (reply). Journal of 20
Allergy and Clinical Immunology, 123 (1), 272. 21 Shepherd, J., K. Caldeira, P. Cox, J. Haigh, D. Keith, B. Launder, G. Mace, G. Mackerron, J. Pyle, S. Rayner, C. 22
Redgwell, and A. Watson, , 2009: Geoengineering the climate: Science, governance and uncertainty. The Royal 23 Society, London, 24
Sherwood, S. C., 2010: From the cover: An adaptability limit to climate change due to heat stress. PNAS : 25 Proceedings of the National Academy of Sciences, 107 (21), 9552-9555. 26
Silverman, J., 2009: Coral reefs may start dissolving when atmospheric co doubles. Geophysical research letters, 36 27 (5), L05606. 28
Singer, B. D., 2005: : Increasing amb a 1 content in common ragweed ( ) pollen as a function of rising atmospheric 29 co concentration. Functional plant biology : FPB, 32 (7), 667. 30
Sissoko, K., 2011: Agriculture, livelihoods and climate change in the west african sahel. Regional Environmental 31 Change, 11 (s1), 119-125. 32
Skelton, J. A., 2009: Prevalence and trends of severe obesity among us children and adolescents. Academic 33 pediatrics, 9 (5), 322-329. 34
Slovic, P., 1993: Perceived risk, trust, and democracy. Risk Analysis, 13 (6), 675-682. 35 Smit, B. and J. Wandel, 2006: Adaptation, adaptive capacity and vulnerability. Global Environmental Change, 16 36
(3), 282-292. 37 Smit, B., 2006: Adaptation, adaptive capacity and vulnerability. Global Environmental Change, 16 (3), 282. 38 Smit, B., I. Burton, R. J. T. Klein and R. Street, 1999: The science of adaptation: A framework for assessment. 39
Mitigation and Adaptation Strategies for Global Change, 4 (3), 199-213. 40 Smith, J. B., H.-J. Schellnhuber and M. M. Qader Mirza, 2001: Vulnerability to climate change and reasons for 41
concern: A synthesis. Climatic Change, 913. 42 Smith, J. B., S. H. Schneider, M. Oppenheimer, G. W. Yohe, W. Hare, M. D. Mastrandrea, A. Patwardhan, I. 43
Burton, J. Corfee-Morlot, C. H. D. Magadza, H.-M. Füssel, A. B. Pittock, A. Rahman, A. Suarez and J.-P. Van 44 Ypersele, 2009: Assessing dangerous climate change through an update of the intergovernmental panel on 45 climate change (ipcc) “reasons for concern”. Proceedings of the National Academy of Sciences, 106 (11), 4133-46 4137. 47
Smithers, J. and B. Smit, 1997: Human adaptation to climatic variability and change. Global Environmental Change, 48 7 (2), 129-146. 49
Solar Radiation Management Governance Initiative (SRMGI) Working Group, 2011: Solar Radiation Management: 50 The Governance of Research. (Royal Society, London), 69 pp. 51
Solomon et al., 2011 Climate Stabilization Targets: Emissions, Concentrations, and Impacts over Decades to 52 Millennia. National Research Council. Washington, DC: The National Academies Press, 2011. 53
FIRST-ORDER DRAFT IPCC WGII AR5 Chapter 19
Do Not Cite, Quote, or Distribute 73 11 June 2012
Solomon, S., 1999: Stratospheric ozone depletion: A review of concepts and history. Reviews of geophysics (1985), 1 37 275. 2
Solomon, S., G.-K. Plattner, R. Knutti and P. Friedlingstein, 2009: Irreversible climate change due to carbon dioxide 3 emissions. Proceedings of the National Academy of Sciences, 106 (6), 1704-1709. 4
Solomon, S., Qin, D., Manning, M., Marquis, M., Averyt, K., Tignor, M.M.B., Le Roy Miller Jr., H., and Chen, Z., 5 Eds. 2007: Climate Change 2007: The Physical Science Basis. Contribution of Working Group I to the Fourth 6 Asessment Report of the I 7
Stafoggia, M., F. Forastiere, D. Agostini, A. Biggeri, L. Bisanti, E. Cadum, N. Caranci, F. De'donato, S. De Lisio, 8 M. De Maria, P. Michelozzi, R. Miglio, P. Pandolfi, S. Picciotto, M. Rognoni, A. Russo, C. Scarnato and C. A. 9 Perucci, 2006: Vulnerability to heat-related mortality: A multicity, population-based, case-crossover analysis. 10 Epidemiology, 17 (3), 315-323 310.1097/1001.ede.0000208477.0000236665.0000208434. 11
Stahle, D. W. and J. S. Dean, 2011: North american tree rings, climatic extremes, and social disasters 12 Stahle, D. W., M. K. Cleaveland, D. B. Blanton, M. D. Therrell and D. A. Gay, 1998: The lost colony and 13
jamestown droughts. Science, 280 (5363), 564-567. 14 Stamatakis, E., J. Wardle and T. J. Cole, 2009: Childhood obesity and overweight prevalence trends in england: 15
Evidence for growing socioeconomic disparities. Int J Obes, 34 (1), 41-47. 16 Steffen, W., Å. Persson, L. Deutsch, J. Zalasiewicz, M. Williams, K. Richardson, C. Crumley, P. Crutzen, C. Folke, 17
L. Gordon, M. Molina, V. Ramanathan, J. Rockström, M. Scheffer, H. Schellnhuber and U. Svedin, 2011: The 18 anthropocene: From global change to planetary stewardship. AMBIO: A Journal of the Human Environment, 40 19 (7), 739-761. 20
Steffen, W., J. Sims, J. Walcott and G. Laughlin, 2011: Australian agriculture: Coping with dangerous climate 21 change. Regional Environmental Change, 11 (0), 205-214. 22
Sterner, T. and U. M. Persson, 2008: An even sterner review: Introducing relative prices into the discounting debate. 23 Review of Environmental Economics and Policy, 2 (1), 61-76. 24
Steve, N., G. Charles, C. M. Christopher, W. Ann and K. Elizabeth, 2010: The "social cost of carbon" made simple. 25 Journal, (Issue), 26
Storbjörk, S., 2010: ‘It takes more to get a ship to change course’: Barriers for organizational learning and local 27 climate adaptation in sweden. Journal of Environmental Policy & Planning, 12 (3), 235-254. 28
Stover, E. and P. Vinck, 2008: Cyclone nargis and the politics of relief and reconstruction aid in burma (myanmar). 29 JAMA: The Journal of the American Medical Association, 300 (6), 729-731. 30
Sultana, F., 2010: Living in hazardous waterscapes: Gendered vulnerabilities and experiences of floods and 31 disasters. Environmental Hazards, 9 (1), 43-53. 32
Surminski, S.; Lopez, A.; Birkmann, J.; Welle T. (2012): Current knowledge on relevant methodologies and data 33 requirements as well as lessons learned and gaps identified at different levels, in assessing the risk of loss and 34 damage associated with the adverse effect of climate change. UNFCC background paper. 35
Sutton, A. E., J. Dohn, K. Loyd, A. Tredennick, G. Bucini, A. Solórzano, L. Prihodko and N. P. Hanan, 2010: Does 36 warming increase the risk of civil war in africa? Proceedings of the National Academy of Sciences, 107 (25), 37 E102. 38
Swart, R. and N. Marinova, 2010: Policy options in a worst case climate change world. Mitigation and Adaptation 39 Strategies for Global Change, 15 (6), 531-549. 40
Tacoli, C., 2009: Crisis or adaptation? Migration and climate change in a context of high mobility. Environment and 41 Urbanization, 21 (2), 513-525. 42
Taub, D. R., B. Miller and H. Allen, 2008: Effects of elevated co2 on the protein concentration of food crops: A 43 meta-analysis. Global Change Biology, 14 (3), 565-575. 44
Te Linde, A. H., P. Bubeck, J. E. C. Dekkers, H. De Moel and J. C. J. H. Aerts, 2011: Future flood risk estimates 45 along the river rhine. Nat. Hazards Earth Syst. Sci., 11 (2), 459-473. 46
Teller, E., et al., 1999: Long-Range Weather Prediction and Prevention of Climate Catastrophes: A Status Report. 47 Lawrence Livermore National Laboratory Publication UCRL-JC-135414, 44 pp. available at 48 http://www.dge.ciw.edu/labs/caldeiralab/Caldeira%20downloads/Teller_etal_LLNL236324_1999.pdf 49
Teller, E., L. Wood, and R. Hyde, 1997: Global Warming and Ice Ages: I. Prospects for Physics-Based Modulation 50 of Global Change. Lawrence Livermore National Laboratory Publication UCRL-JC-128715, 18 pp. 51
Teller, Edward, Roderick Hyde, and Lowell Wood, 2002: Active Climate Stabilization: Practical Physics-Based 52 Approaches to Prevention of Climate Change, Lawrence Livermore National Laboratory Publication UCRL-JC-53 148012, 8 pp. 54
FIRST-ORDER DRAFT IPCC WGII AR5 Chapter 19
Do Not Cite, Quote, or Distribute 74 11 June 2012
Theisen, O. M., 2012: Climate clashes? Weather variability, land pressure, and organized violence in kenya, 1989–1 2004. Journal of Peace Research, 49 (1), 81-96. 2
Thibault, K. M. and J. H. Brown, 2008: Impact of an extreme climatic event on community assembly. Proceedings 3 of the National Academy of Sciences, 105 (9), 3410-3415. 4
Thomalla, F., T. Downing, E. Spanger-Siegfried, G. Han and J. Rockström, 2006: Reducing hazard vulnerability: 5 Towards a common approach between disaster risk reduction and climate adaptation. Disasters, 30 (1), 39-48. 6
Thomas, B., B. Tobias and K. Vally, 2012: Environmental changes and violent conflict. Environmental Research 7 Letters, 7 (1), 015601. 8
Thomas, C. D., 2011: Translocation of species, climate change, and the end of trying to recreate past ecological 9 communities. Trends in Ecology & Evolution, 26 (5), 216-221. 10
Thomas, C. D., J. K. Hill, B. J. Anderson, S. Bailey, C. M. Beale, R. B. Bradbury, C. R. Bulman, H. Q. P. Crick, F. 11 Eigenbrod, H. M. Griffiths, W. E. Kunin, T. H. Oliver, C. A. Walmsley, K. Watts, N. T. Worsfold and T. 12 Yardley, 2011: A framework for assessing threats and benefits to species responding to climate change. 13 Methods in Ecology and Evolution, 2 (2), 125-142. 14
Thornton, P. K., P. G. Jones, P. J. Ericksen and A. J. Challinor, 2011: Agriculture and food systems in sub-saharan 15 africa in a 4°c+ world. Philosophical Transactions of the Royal Society A: Mathematical, Physical and 16 Engineering Sciences, 369 (1934), 117-136. 17
Thuiller, W., D. M. Richardson and G. F. Midgley, 2007: Will climate change promote alien plant invasions? 18 Journal, 193 (Issue), 197-211. 19
Thuiller, W., S. Lavergne, C. Roquet, I. Boulangeat, B. Lafourcade and M. B. Araujo, 2011: Consequences of 20 climate change on the tree of life in europe. Nature, 470 (7335), 531-534. 21
Tilmes, S., R. Müller and R. Salawitch, 2008: The sensitivity of polar ozone depletion to proposed geoengineering 22 schemes. Science, 320 (5880), 1201-1204. 23
Tingley, M. W., W. B. Monahan, S. R. Beissinger and C. Moritz, 2009: Birds track their grinnellian niche through a 24 century of climate change. Proceedings of the National Academy of Sciences, 106 (Supplement 2), 19637-25 19643. 26
Tol, R. and S. Wagner, 2010: Climate change and violent conflict in europe over the last millennium. Climatic 27 Change, 99 (1), 65-79. 28
Tol, R. S. J. and S. Fankhauser, 1998: On the representation of impact in integrated assessment models of climate 29 change. Environmental Modeling and Assessment, 3 (1), 63-74. 30
Tol, R. S. J., 2005: The marginal damage costs of carbon dioxide emissions: An assessment of the uncertainties. 31 Energy Policy, 33 (16), 2064-2074. 32
Tol, R. S. J., 2009: The feasibility of low concentration targets: An application of fund. Energy Economics, 31, 33 Supplement 2 (0), S121-S130. 34
Tol, R. S. J., 2011: The social cost of carbon. Annual Review of Resource Economics, 3 (1), 419-443. 35 Tol, R. S. J., R. J. T. Klein and R. J. Nicholls, 2008: Towards successful adaptation to sea-level rise along europe's 36
coasts. Journal of coastal research, 242 432-442. 37 Transparency International 2012: The corruption perception index 2011, website: 38
http://cpi.transparency.org/cpi2011/results/ (accessed 02.03.2012) 39 Trenberth, K. E. and A. Dai, 2007: Effects of mount pinatubo volcanic eruption on the hydrological cycle as an 40
analog of geoengineering. Geophysical research letters, 34 (15), L15702. 41 Tschakert, P. and K. Dietrich, 2010: Anticipatory learning for climate change adaptation and resilience. Ecology and 42
society, 15 (2), 11. 43 Tubiello, F. N. and G. Fischer, 2007: Reducing climate change impacts on agriculture: Global and regional effects 44
of mitigation, 2000–2080. Technological Forecasting and Social Change, 74 (7), 1030-1056. 45 Turner, B. L., P. A. Matson, J. J. Mccarthy, R. W. Corell, L. Christensen, N. Eckley, G. K. Hovelsrud-Broda, J. X. 46
Kasperson, R. E. Kasperson, A. Luers, M. L. Martello, S. Mathiesen, R. Naylor, C. Polsky, A. Pulsipher, A. 47 Schiller, H. Selin and N. Tyler, 2003: Illustrating the coupled human–environment system for vulnerability 48 analysis: Three case studies. Proceedings of the National Academy of Sciences, 100 (14), 8080-8085. 49
Turner, B. L., R. E. Kasperson, P. A. Matson, J. J. Mccarthy, R. W. Corell, L. Christensen, N. Eckley, J. X. 50 Kasperson, A. Luers, M. L. Martello, C. Polsky, A. Pulsipher and A. Schiller, 2003: A framework for 51 vulnerability analysis in sustainability science. Proceedings of the National Academy of Sciences, 100 (14), 52 8074-8079. 53
FIRST-ORDER DRAFT IPCC WGII AR5 Chapter 19
Do Not Cite, Quote, or Distribute 75 11 June 2012
Twigg, J., 2001: Sustainable Livelihoods and Vulnerability to Disasters. Benfield Greig, Hazard Research Centre, 1 Disaster Management Working Paper 2/2001, BGHRC, UCL, London UK. 2
UN (1992). United Nations Framework Convention on Climate Change (UNFCCC), FCCC/INFORMAL/84, 3 GE.05-62220 (E) 200705 4
UN General Assembly. 2007. United Nations Declaration on the Rights of Indigenous Peoples. 5 UN-HABITAT, 2003: Slums of the World: The Face of Urban Poverty in the New Millennium? Monitoring the 6
Millennium Development Goal, Target 11 – World-Wide Slum Dweller Estimation. UN-Habitat, Nairobi, 7 Kenya. 8
UNDRO, 1980: Natural Disasters and Vulnerability Analysis. Report of Experts Group Meeting of 9-12 July 1979, 9 UNDRO, Geneva, Switzerland. 10
UNEP, 2007: Global Environment Outlook 4. United Nations Environment Programme, Nairobi, Kenya. 11 UNISDR, 2004: Living With Risk. United Nations International Strategy for Disaster Reduction, Geneva, 12
Switzerland. 13 UNISDR, 2009: Terminology on Disaster Risk Reduction. United Nations International Strategy for Disaster 14
Reduction, Geneva, Switzerland. unisdr.org/eng/library/lib-terminology-eng.htm 15 UNISDR, 2011: Global Assessment Report on Disaster Risk Reduction: Revealing Risk, Redefining Development. 16
United Nations International Strategy for Disaster Reduction, Geneva, 178 pp., www.preventionweb.net/gar. 17 United Nations Environment Program (UNEP). 2010. The Emissions Gap Report: Are the Copenhagen Accord 18
Pledges Sufficient to Limit Global Warming to 2° C or 1.5° C? A preliminary assessment. United Nations 19 Environment Program, Nairobi, Kenya. 52 20
United Nations. 2006. World Urbanization Prospects: The 2005 Revision. Department of Economic and Social 21 Affairs, Population Division. Working Paper No. ESA/P/WP/200. 22
Urban, N. M. and K. Keller, 2010: Probabilistic hindcasts and projections of the coupled climate, carbon cycle and 23 atlantic meridional overturning circulation system: A bayesian fusion of century-scale observations with a 24 simple model. Tellus A, 62 (5), 737-750. 25
Utzinger, J. and J. Keiser, 2006: Urbanization and tropical health — then and now. Annals of Tropical 26 Medicine and Parasitology, 100 (5-6), 517-533. 27
Vajjhala, S.P., 2009: The global adaptation atlas. Resources for the Future. 28 Van Sluis, E. and M.K. van Aalst, 2006: Climate change and disaster risk in urban environments. Humanitarian 29
Exchange, 35. 30 Van Vuuren D, Stehfest E (2009) Exploring the effectiveness of emergency responses to climate change. In: Swart 31
R, Marinova N, Bakker S, van Tilburg X (2009) Policy options to respond to rapid climate change. Alterra 32 Report 1950, Alterra, Wageningen 33
Van Vuuren, D., J. Edmonds, M. Kainuma, K. Riahi, A. Thomson, K. Hibbard, G. Hurtt, T. Kram, V. Krey, J.-F. 34 Lamarque, T. Masui, M. Meinshausen, N. Nakicenovic, S. Smith and S. Rose, 2011: The representative 35 concentration pathways: An overview. Climatic Change, 109 (1), 5-31. 36
Van Vuuren, D., J. Lowe, E. Stehfest, L. Gohar, A. Hof, C. Hope, R. Warren, M. Meinshausen and G.-K. Plattner, 37 2011: How well do integrated assessment models simulate climate change? Climatic Change, 104 (2), 255-285. 38
Velicogna, I., 2009: Increasing rates of ice mass loss from the greenland and antarctic ice sheets revealed by grace. 39 Geophys. Res. Lett., 36 (19), L19503. 40
Villagrán de León, J.C., 2006: Vulnerability: A conceptual and methodological review. SOURCE Publication Series 41 of UNU-EHS, 4, United Nations University Institute for Environment and Human Security (UNU-EHS), Bonn, 42 Germany. 43
Vine, E., 2012: Adaptation of california’s electricity sector to climate change. Climatic Change, 111 (1), 75-99. 44 Viscusi, W. and R. Zeckhauser, 2006: The perception and valuation of the risks of climate change: A rational and 45
behavioral blend. Climatic Change, 77 (1), 151-177. 46 Vitoria, M., R. Granich, C. F. Gilks, C. Gunneberg, M. Hosseini, W. Were, M. Raviglione and K. M. De Cock, 47
2009: The global fight against hiv/aids, tuberculosis, and malaria. American Journal of Clinical Pathology, 131 48 (6), 844-848. 49
Vittoz, P., C. Randin, A. Dutoit, F. Bonnet and O. Hegg, 2009: Low impact of climate change on subalpine 50 grasslands in the swiss northern alps. Global Change Biology, 15 (1), 209-220. 51
Vose, R. S., T. R. Karl, D. R. Easterling, C. N. Williams and M. J. Menne, 2004: Climate (communication arising): 52 Impact of land-use change on climate. Nature, 427 (6971), 213-214. 53
FIRST-ORDER DRAFT IPCC WGII AR5 Chapter 19
Do Not Cite, Quote, or Distribute 76 11 June 2012
Waldhoff, S. and A. Fawcett, 2011: Can developed economies combat dangerous anthropogenic climate change 1 without near-term reductions from developing economies? Climatic Change, 107 (3), 635-641. 2
Walther, G.-R., A. Roques, P. E. Hulme, M. T. Sykes, P. Pyšek, I. Kühn, M. Zobel, S. Bacher, Z. Botta-Dukát, H. 3 Bugmann, B. Czúcz, J. Dauber, T. Hickler, V. Jarošík, M. Kenis, S. Klotz, D. Minchin, M. Moora, W. Nentwig, 4 J. Ott, V. E. Panov, B. Reineking, C. Robinet, V. Semenchenko, W. Solarz, W. Thuiller, M. Vilà, K. Vohland 5 and J. Settele, 2009: Alien species in a warmer world: Risks and opportunities. Trends in Ecology & 6 Evolution, 24 (12), 686-693. 7
Wang, H., P. J. Rasch and G. Feingold, 2011: Manipulating marine stratocumulus cloud amount and albedo: A 8 process-modelling study of aerosol-cloud-precipitation interactions in response to injection of cloud 9 condensation nuclei. Atmospheric chemistry and physics, 11 (9), 4237-4249. 10
Wang, M. and J. E. Overland, 2009: A sea ice free summer arctic within 30 years? Geophys. Res. Lett., 36 (7), 11 L07502. 12
Wardle, D. A., R. D. Bardgett, R. M. Callaway and W. H. Van Der Putten, 2011: Terrestrial ecosystem responses to 13 species gains and losses. Science, 332 (6035), 1273-1277. 14
Warner, K., 2010: Global environmental change and migration: Governance challenges. Global Environmental 15 Change, 20 (3), 402-413. 16
Warner, K., C. Ehrhart, A. D. Sherbinin and S. Adamo, 2009: In search of shelter: Mapping the effects of climate 17 change on human migration and displacement. 18
Warren R., Arnell N., Berry P., Brown S., Dicks L, Gosling S., Hankin R., Hope C., Lowe J., Matsumoto K., Masui 19 T., Nicholls R., O’Hanley J., Osborn T., Scriecru S., 2010: The economics and climate change impacts of 20 various greenhouse gas emission pathways and a comparison between base line and policy emissions scenarios. 21 Report 1 of the AVOID programme (AV/WS1/D3/R01) 22
Warren, R., 2011: The role of interactions in a world implementing adaptation and mitigation solutions to climate 23 change. Philosophical Transactions of the Royal Society A: Mathematical, Physical and Engineering Sciences, 24 369 (1934), 217-241. 25
Warren, R., C. Hope, M. Mastrandrea, R. S. J. Tol, W. N. Adger and I. Lorenzoni, 2006: Spotlighting the impacts 26 functions in integrated assessments. Research report prepared for the stern review on the economics of climate 27 change. Journal, (Issue), 28
Warren, R., J. Price, A. Fischlin, S. De La Nava Santos and G. Midgley, 2011: Increasing impacts of climate change 29 upon ecosystems with increasing global mean temperature rise. Climatic Change, 106 (2), 141-177. 30
Warren, R., M. Mastrandrea, C. Hope and A. Hof, 2010: Variation in the climatic response to sres emissions 31 scenarios in integrated assessment models. Climatic Change, 102 (3), 671-685. 32
Warren, R., S. De La Nava Santos, N. W. Arnell, M. Bane, T. Barker, C. Barton, R. Ford, H. M. Füssel, R. K. S. 33 Hankin, R. Klein, C. Linstead, J. Kohler, T. D. Mitchell, T. J. Osborn, H. Pan, S. C. B. Raper, G. Riley, H. J. 34 Schellnhüber, S. Winne and D. Anderson, 2008: Development and illustrative outputs of the community 35 integrated assessment system (cias), a multi-institutional modular integrated assessment approach for modelling 36 climate change. Environmental Modelling & Software, 23 (5), 592-610. 37
Warren, R., VanDerWal, J., Price, J., Welbergen, J.A. et al. Quantifying the benefit of early climate change 38 mitigation in avoiding biodiversity loss. (submitted ) 39
Watkiss, P. and A. Hunt, 2012: Projection of economic impacts of climate change in sectors of europe based on 40 bottom up analysis: Human health. Climatic Change, 112 (1), 101-126. 41
Watts, M. J. and H. G. Bohle, 1993: The space of vulnerability: The causal structure of hunger and famine. Progress 42 in Human Geography, 17 (1), 43-67. 43
Wayne, P., S. Foster, J. Connolly, F. Bazzaz and P. Epstein, 2002: Production of allergenic pollen by ragweed 44 (ambrosia artemisiifolia l.) is increased in co2-enriched atmospheres. Annals of Allergy, Asthma & 45 Immunology, 88 (3), 279-282. 46
Weber, E. U., 2010: What shapes perceptions of climate change? Wiley Interdisciplinary Reviews: Climate Change, 47 1 (3), 332-342. 48
Weber, E., 2006: Experience-based and description-based perceptions of long-term risk: Why global warming does 49 not scare us (yet). Climatic Change, 77 (1), 103-120. 50
Webster, M., 2008: Incorporating path dependency into decision-analytic methods: An application to global climate-51 change policy. Decision Analysis, 5 (2), 60-75. 52
Weitzman, M. L., 2010: What is the "damages function" for global warming - and what difference might it make? 53 Climate Change Economics, 1 (1), 57-69. 54
FIRST-ORDER DRAFT IPCC WGII AR5 Chapter 19
Do Not Cite, Quote, or Distribute 77 11 June 2012
Wieser, H., R. Manderscheid, M. Erbs and H.-J. Weigel, 2008: Effects of elevated atmospheric co2 concentrations 1 on the quantitative protein composition of wheat grain. Journal of Agricultural and Food Chemistry, 56 (15), 2 6531-6535. 3
Wigley, T. M. L., 2006: A combined mitigation/geoengineering approach to climate stabilization. Science, 314 4 (5798), 452-454. 5
Wilkinson, S., G. Mills, R. Illidge and W. J. Davies, 2012: How is ozone pollution reducing our food supply? 6 Journal of Experimental Botany, 63 (2), 527-536. 7
Williams, J. W. and S. T. Jackson, 2007: Novel climates, no-analog communities, and ecological surprises. Front. 8 Ecol. Environ., 5 (9), 9
Williams, J. W., S. T. Jackson and J. E. Kutzbach, 2007: Projected distributions of novel and disappearing climates 10 by 2100 ad. Proceedings of the National Academy of Sciences, 104 (14), 5738-5742. 11
Williams, S. E., L. P. Shoo, J. L. Isaac, A. A. Hoffmann and G. Langham, 2008: Towards an integrated framework 12 for assessing the vulnerability of species to climate change. PLoS Biol, 6 (12), e325. 13
Willis, K. J. and S. A. Bhagwat, 2009: Biodiversity and climate change. Science, 326 (5954), 806-807. 14 Wisner, B., 1998: Marginality and vulnerability: Why the homeless of tokyo don't ‘count’ in disaster preparations. 15
Applied Geography, 18 (1), 25-33. 16 World Bank (2011) Food price watch. 17 World Commission on Dams. 2000. Dams and development: a new framework for decision-making. Earthscan, 18
London 19 Wyse-Jackson, P., 2001: Summary of the international review of the ex situ plant collections of the botanic gardens 20
of the world. Botanic Gardens Conservation International, 3 (6), 21 Yancheva, G., N. R. Nowaczyk, J. Mingram, P. Dulski, G. Schettler, J. F. W. Negendank, J. Liu, D. M. Sigman, L. 22
C. Peterson and G. H. Haug, 2007: Influence of the intertropical convergence zone on the east asian monsoon. 23 Nature, 445 (7123), 74-77. 24
Yohe, G. W., 2008: A research agenda to improve economic estimates of the benefits of climate change policies. 25 Integrated assessment, 8 (1), 26
Yohe, G., 2002: Indicators for social and economic coping capacity--moving toward a working definition of 27 adaptive capacity. Global Environmental Change, 12 (1), 25. 28
Zelazowski, P., Y. Malhi, C. Huntingford, S. Sitch and J. B. Fisher, 2011: Changes in the potential distribution of 29 humid tropical forests on a warmer planet. Philosophical Transactions of the Royal Society A: Mathematical, 30 Physical and Engineering Sciences, 369 (1934), 137-160. 31
Zhang, D. D., H. F. Lee, C. Wang, B. Li, Q. Pei, J. Zhang and Y. An, 2011: The causality analysis of climate change 32 and large-scale human crisis. Proceedings of the National Academy of Sciences, 108 (42), 17296-17301. 33
Zhang, D. D., P. Brecke, H. F. Lee, Y.-Q. He and J. Zhang, 2007: Global climate change, war, and population 34 decline in recent human history. Proceedings of the National Academy of Sciences, 104 (49), 19214-19219. 35
Zhang, D., C. Jim, G. Lin, Y.-Q. He, J. Wang and H. Lee, 2006: Climatic change, wars and dynastic cycles in china 36 over the last millennium. Climatic Change, 76 (3), 459-477. 37
Zhuang, Q., J. M. Melack, S. Zimov, K. M. Walter, C. L. Butenhoff and M. a. K. Khalil, 2009: Global methan 38 emissions from wetlands, rice paddies, and lakes. Eos Trans. AGU, 90 (5), 39
Zickfeld, K. and T. Bruckner, 2008: Reducing the risk of atlantic thermohaline circulation collapse: Sensitivity 40 analysis of emissions corridors. Climatic Change, 91 (3), 291-315. 41
Zickfeld, K., A. Levermann, M. Morgan, T. Kuhlbrodt, S. Rahmstorf and D. Keith, 2007: Expert judgements on the 42 response of the atlantic meridional overturning circulation to climate change. Climatic Change, 82 (3), 235-265. 43
Zickfeld, K., M. G. Morgan, D. J. Frame and D. W. Keith, 2010: Expert judgments about transient climate response 44 to alternative future trajectories of radiative forcing. Proceedings of the National Academy of Sciences, 107 45 (28), 12451-12456. 46
Ziervogel, G. and P. J. Ericksen, 2010: Adapting to climate change to sustain food security. Wiley Interdisciplinary 47 Reviews: Climate Change, 1 (4), 525-540. 48
Zimmerman, R. C., D. G. Kohrs, D. L. Steller and R. S. Alberte, 1997: Impacts of co2 enrichment on productivity 49 and light requirements of eelgrass. Plant Physiology, 115 (2), 599-607. 50
Ziska, L. H. and F. A. Caulfield, 2000: Rising co<sub>2</sub> and pollen production of common ragweed 51 (<i>ambrosia artemisiifolia</i> l.), a known allergy-inducing species: Implications for public health. Functional 52 Plant Biology, 27 (10), 893-898. 53
FIRST-ORDER DRAFT IPCC WGII AR5 Chapter 19
Do Not Cite, Quote, or Distribute 78 11 June 2012
Ziska, L. H. and P. J. Beggs, 2012: Anthropogenic climate change and allergen exposure: The role of plant biology. 1 Journal of Allergy and Clinical Immunology, 129 (1), 27-32. 2
Ziska, L. H., D. E. Gebhard, D. A. Frenz, S. Faulkner, B. D. Singer and J. G. Straka, 2003: Cities as harbingers of 3 climate change: Common ragweed, urbanization, and public health. Journal of Allergy and Clinical 4 Immunology, 111 (2), 290-295. 5
6
FIRST-ORDER DRAFT IPCC WGII AR5 Chapter 19
Do Not Cite, Quote, or Distribute 79 11 June 2012
Table 19-1: Emergent risks related to biofuel production as a mitigation strategy.
NOTES: (i) First-generation biofuel consumption has been projected to increase by up to 170-220% by 2020 and up to 250-620% by 2030 (IEA, 2009), with the larger numbers corresponding to the implementation of a limit of 450ppm for CO2 concentrations. Second generation biofuels are thought not to be commercially viable for large scale production until after 2020. Biofuels presently occupy about 2.2% of global cropland, whilst the area under cultivation itself is expanding at some 3.4 million ha/yr (FAO 2010) due to rising demand for food. Hence, such large projections for increase in biofuel production have profound implications for land use. If this biofuel induced land use change removes primary forest, the net contribution of the biofuel cropping towards climate change mitigation may be negative. The potential scope of the impact on a global scale is revealed in one study (Wise et al 2009) which considers a scenario leading to conversion of more than 40% of global land area to biofuel production by 2095. (ii) Large scale conversion of natural forest induced by a carbon tax that does not include terrestrial carbon would have a severe impact on biodiversity (see section 19.4.x) through the destruction of most remaining natural ecosystems (Wise et al 2009). In Brazil, the resulting biofuel expansion is likely to impinge upon the Cerrado, the Amazon and the Atlantic rainforest all three of which have high biodiversity and high levels of endemism (Lapola et a 2010). Concessions of large areas for biofuel production have been made in the Brazilian Amazon, Papua New Guinea, and Madagascar, all of which are biodiversity hotspots (Koh et al. 2009). Biodiversity is reduced by about 60% in U.S. corn and soybean fields and by about 85% in Southeast Asian oil palm plantations compared to unconverted habitat (Fitzherbert et a 2008, Fletcher et al. 2010, Fargione 2010). The resultant loss of ecosystem services (Xref section above) would impact on human populations. (iii)Displacement of agricultural land for biofuel crops would influence world food supply and prices (Hertel et al. 2010, Searchinger et al. 2008), as actually occurred during the food price crisis of 2007/2008 (Pimentel 2009), thus increasing risks of malnutrition. A new assessment of agricultural land availability projects that by 2050, substantial areas of agricultural land will be lost to urbanization, desertification, sea level rise and increasing salt water intrusion (Foresight 2011) which will act to increase competition between cropping for food and biofuels. Mellilo et al. (2009) project that up to twice as much carbon loss can occur as result of this indirect land use change, than from the direct land use change associated with biofuel production. Some biofuel feedstocks such as wastes, residues, cover crops, and forest thinnings (Tilman et al. 2009) are not in competition with cropland.
Issue number Issue description Nature of emergent risk Reference (i)Biofuel production Potential for enhancement of
greenhouse gas emissions Does not contribute to mitigation
Wise et al 2009 Mellilo et al 2009 Khanna et al 2011
(ii) Policies targeting only fossil carbon
Competition for land reducing natural forest impacting on biodiversity
Benefits of mitigation for biodiversity offset by land use change
Wise et al 2009 Mellilo et al 2009 Lapola et al 2010 Fargione et al 2010
(iii) Food/fuel competition for land
Competition for land driving up food prices and impacting on numbers of people at risk of hunger
Benefits of mitigation to agriculture offset by land use change
Hertel et al. 2010, Searchinger et al. 2008
(iv) Biofuels production effects water resources
Competition for water impacting on biodiversity and food cropping
Benefits of mitigation for biodiversity and agriculture offset by water stress
Fargione et al 2010, Fingerman et al 2010
(v) Land conversion causes air pollution
Potential for increased production of tropospheric ozone
Benefits of mitigation for biodiversity and agriculture offset by damage caused by tropospheric ozone
Hewitt et al 2009, Cancado et al. 2006
(vi) Fertilizer application Potential for increased emissions of N2O
Does not contribute to mitigation
Donner & Kucharik 2008, Searchinger et al. 2008, Fargione et al 2010
(vii) Land use change and local climate
Contributes to change in local climate caused by land use change generally
Benefits of mitigation to climate offset by disruption of local climate regime
Grossman & Clarke 2010
(viii) Invasive properties of biofuel crops
Potential to become an invasive species
Unintended consequences that damage agriculture and/or biodiversity
Barney & Ditomaso 2008, Council for Agricultural Science and Technology 2007, Raghu et al. 2006
FIRST-ORDER DRAFT IPCC WGII AR5 Chapter 19
Do Not Cite, Quote, or Distribute 80 11 June 2012
(iv) Demand for water use by biofuel cropping also has implications for the groundwater extraction issue discussed above, and hence can potentially reduce local water availability and quality. The water requirements of many biofuel crops are substantial (Fargione et al 2010, Fingerman et al 2010) and hence there would be potential for conflict with efforts to allocate water for domestic, industrial, agricultural and natural wetlands particularly where irrigation is required (find more refs). (v) Where rainforest is converted to oil palm plantations, or where land is converted to sugarcane ethanol production, emissions of the precursors of tropospheric ozone increase (Hewitt et al 2009, Cancado et al. 2006). (vi) Where biofuels displace nitrogen-fixing crops such as soybean, fertiliser application will increase, leading to increased N2O emissions and nitrogen runoff into rivers and oceans (Donner & Kucharik 2008). At the same time, displacement of food crops, in combination with reduced yields due to climate change impacts, would encourage farmers to increase yields through application of larger amounts of fertiliser, particularly in countries where there is a supply shortfall (Deryng et al. 2011) which in turn increases greenhouse gas emissions. Model estimates of 21st century land use project that at least 16% of the earth’s surface would be converted for first-generation biofuel production, bringing the total area under cultivation from its current 12% to 28%. Such large increases in the cultivated area of the earth’s surface would greatly exacerbate emissions of N2O, enhancing warming (Searchinger et al 2008, Fargione 2010). (vii) Land use change also has direct effects on local climate: for example, new urban developments caused an intensification and expansion of the area experiencing extreme temperatures, mainly increasing nighttime temperatures, by as much as 10 K. (Grossman & Clarke 2010). (viii) Traits that make a plant a good candidate for biomass production also make it a potential invasive species ( Barney & Ditomaso 2008, Council for Agricultural Science and Technology 2007, Raghu et al. 2006). This could result in damage to nearby ecosystems or agricultural systems. ___________________________________________________________ Table 19-2: Key risks from large temperature rise. Does not exist yet (To be provided with SOD)
FIRST-ORDER DRAFT IPCC WGII AR5 Chapter 19
Do Not Cite, Quote, or Distribute 81 11 June 2012
Table 19-3: A selection of the physical impacts or other hazards, key vulnerabilities, key risks, and emergent risks based on the judgments of authors of various chapters of this report, utilizing the framework and systematization described in 19.2. The table indicates how these four categories are related as well as how they differ. The table is illustrative rather than comprehensive, aiming to show some examples of how of the framework may be applied across different themes and topics in the chapters. In addition to these examples, key risks may also arise from moderate vulnerability interacting with a very large physical impact.
Examples of Physical Impacts, Key Vulnerabilities, Key Risks and Emergent Risks
based on the new systematization and classification
(using preliminary input from other chapters) Physical impacts/hazards Key vulnerabilities Key risks Emergent risks
Chapter 13 – Livelihood and Poverty Changing rainfall patterns (temporally and spatially)
High dependence on rain-fed agriculture. Little access to alternative modes of income.
Crop failure, food shortage, severe famine
May coincide with global food insecurity or periods of excessive global food prices which means that coping strategies (selling assets to buy food, relief operations) may not work. If widespread, adaptation mechanisms such as crop insurance (risk spreading) may collapse.
Soaring demand (and prices) of biofuels due to climate change policies.
Unclear and/or insecure land tenure arrangements.
Risk of dispossession of land due to “land grabbing” in developing countries.
Creation of large groups of landless farmers unable to support themselves. Social unrest due to disparities between intensive energy production and neglected food production.
Increasing frequency of extreme events (droughts, floods). For example if 1:20 year drought/flood becomes 1:5 year flood/drought.
Livelihoods subject to damage to their productive assets (if droughts – e.g. herds of livestock; if floods – dykes, fences, terraces).
Risk of the loss of livelihoods and harm due to the fact that the time for recovery between extreme events is progressively shorter. For example: pastoralists have to restock after a drought, which may take several years; in terraced agriculture there is a need to rebuild terraces after flood, which may take several years.
Collapse of coping strategies with risk of collapsing livelihoods. Adaptation mechanisms such as insurance fail due to increasing frequency of claims.
Chapter 19 Warming and increased high temperature extremes
Urbanisation, aging of population and vital infrastructure
Increase in morbidity and infrastructure failure during heat waves
Increasing risk under all scenarios; long-term adaptive capacity poorly understood; interactive effects important
Warming and drying (degree of precipitation changes uncertain)
Limits to coping capacity to deal with reduced water availability; increasing exposure and demand due to population increase; conflicting demands for alternative water uses; socio-cultural constraints on some adaptation options
Risk of harm and loss due to livelihood degradation from systematic constraints on water resource use that lead to supply falling far below demand. In addition limited coping and adaptation options increase the risk of harm and loss.
Negative outcomes to sending and/or receiving regions due to migration of populations due to limits on agricultural productivity and livelihoods
FIRST-ORDER DRAFT IPCC WGII AR5 Chapter 19
Do Not Cite, Quote, or Distribute 82 11 June 2012
Chapter 23 Extreme weather events Limited coping and adaptive
capacity as well as high sensitivity of different sectors, e.g. transport, energy and health sector
Stress on multiple sectors can cause systemic risks due to interdependencies between the different sectors
Disproportionate intensification of risk due to increasing interdependencies
Climate change increases the spatial distribution and seasonality of pests and diseases
Vulnerability of plants and animals exposed to pests and diseases
Increases in crop losses and animal diseases or even fatalities of livestock
Increasing risks due to limited response options and various feedback processes in agriculture, e.g. in terms of the use of pesticides or antibiotics to protect plants and livestock
Extreme weather events and reduced water availability due to climate change
Low adaptive capacity of power supply systems, might lead to limited energy supply as well as higher supply costs during such extreme events and conditions
Increasing risk of power shortages due to limited energy supply, e.g. of nuclear power plants due to limited cooling water during heat stress
Continued underinvestment in adaptive energy systems might increase the risk of mismatches between limited energy supply during these events and increased demands, e.g. during a heat wave
Chapter 26 Increases in frequency and/or intensity of extreme events, such as hurricanes, river and coastal floods, heat waves and droughts
Declining state of physical infrastructures in urban areas as well as increases in income disparities
Risk of serious harm and losses in urban areas, particularly in coastal environments due to enhanced vulnerabilities of social groups and physical systems combined with the increases of extreme weather events
Inability to reduce vulnerability in many areas results in increase in risk greater than change in physical hazard
Higher temperatures, decreases in runoff and lower soil moisture due to climate change
Increasing vulnerability of small landholders in agriculture
Increased losses and decreases in agricultural production increase food and job insecurity for small landholders and social groups in that region
Increasing risks of social instability and local economic disruption due to internal migration
Chapter 4 Rising air, soil, and water temperature
Exceedence of eco-physiological climate tolerance limits of species, increased viability of alien organisms
Loss of native biodiversity, increase in alien organism dominance
Cascades of native species loss due to interdependencies
Rising air, soil, and water temperature
Epidemiology of temperature-sensitive vectors (insects
Novel or much more severe pest and pathogen outbreaks
Pest, drought and fire interactions lead to risk of large impacts
Change in seasonality of rain
Vulnerability of plants and ecosystem services, due to mismatch of plant life strategy to growth opportunities
Changes in plant functional type mix leading to biome change with respective risks
Fire-promoting grasses and summer fuels in winter-rainfall areas
Chapter 6 Rising water temperature, increase of (thermal and haline) stratification, and marine acidification
Tolerance limits of endemic species surpassed, increased abundance of invasive organism, high vulnerability of warm water coral reefs and respective ecosystem services for coastal communities
Loss of endemic species, mixing of ecosystem types, increased dominance of invasive organisms, loss of coral cover and associated ecosystem with reduction of biodiversity
Enhancement of risk due to interactions, e.g., acidification and warming on calcareous organisms
FIRST-ORDER DRAFT IPCC WGII AR5 Chapter 19
Do Not Cite, Quote, or Distribute 83 11 June 2012
Enhanced harmful algal blooms in coastal areas due to rising water temperature
Important ecosystems and valuable services already suffering multiple stresses
Enhanced frequency of dinoflagellate blooms and respective losses and degradations of coastal ecosystems and ecosystem services
Disproportionate enhancement of risk due to interactions of stresses
Chapter 22 Increasing Temperature Health of exposed nd
vulnerable groups (increased exposure to heat, change in the transmission dynamics of vector-borne diseases)
Increase in disease burden – changes in the patterns of infection Decrease in outdoor worker productivity due to high temperature, increase in heat related morbidity and mortality
Emerging and re-emerging disease epidemics
Increasing Temperature Vulnerability of aquatic systems and vulnerability of aquatic ecosystem services due to increased water temperatures
Loss of aquatic ecosystems and risks for people who might depend on these resources
Extreme Events, e.g. floods and flash floods
Vulnerable and exposed urban areas, particularly in informal settlements
Increasing harm and losses due to water logging in terms of sudden volumes of rain
Due to water logging and contamination, compounded increase of the risk of epidemics
Chapter 24 Significant reduction of glacier meltwater due to deglaciation
Limited adaptive capacity of ecosystems and social-ecological systems
Water scarcity and shifts in water flow regimes combined with the vulnerability of rural or urban livelihoods
Limited adaptive capacity and degradation of ecosystem services might lead to high risk of livelihood erosion
Chapter 25 Warming and drying (uncertain degree of precipitation change)
Increasing exposure of human systems to these changes, increasing build-up of combustible material in CO2-enriched environment
Increased damages to ecosystems and settlements and risks to human life from wildfires
Warming and increased temperature high extremes
Urbanisation, aging of population and vital infrastructure
Increase in morbidity and infrastructure failure during heat waves
Large increase in risk from interactive stresses and vulnerability
Potential for sea level rise exceeding 1m
Long lifetime of coastal infrastructure, concentration and further expansion of coastal population and assets; conflicting priorities and time preferences constraining adaptation options; limited scope for managed retreat in highly developed areas
Widespread damages to coastal infrastructure and low-lying ecosystems
Interactions of large sea level rise with multiple stresses
FIRST-ORDER DRAFT IPCC WGII AR5 Chapter 19
Do Not Cite, Quote, or Distribute 84 11 June 2012
Table 19-4: Estimates of the Social Cost of Carbon. From AR4 WG2 20.6.1, with new values from DICE: Nordhaus, in rev.; FUND: Anthoff et al., 2009; PAGE: Hope, in rev.; CRED: Ackerman & Stanton, in rev.; matDICE: Kopp et al., in rev. Date of estimate / $/tCO2
1990 1995 2000 2005 2012
DICE/RICE $3 $2 $2 $12 FUND $2 to $6 -$4 to $30 $0 to $63 PAGE $3 to $16 $1 to $14 $10 to $270 CRED $28 to $900 matDICE $30 to $1000
FIRST-ORDER DRAFT IPCC WGII AR5 Chapter 19
Do Not Cite, Quote, or Distribute 85 11 June 2012
Figure19-1: Schematic of the interaction among the physical climate system, exposure, and vulnerability producing risk. The figure visualizes the different terms and concepts discussed in this chapter. It underscores that risks are a product of a complex interaction between physical impacts due to climate change and climate variability on the one hand and the vulnerability of a society or a social-ecological system and its exposure to climate-related hazards on the other. DRR means disaster risk reduction and CAA indicates climate change adaptation. The definition and use of “key” are indicated in Box 19-2 and the glossary. Vulnerability, as the figure shows, is largely the result of socio-economic development pathways and societal conditions. Both the changes in the climate system (left side) and the development processes (right side) are key drivers of the different core components (vulnerability, exposure, and physical impacts or hazards) that constitute risk (modified version of Figure 1, IPCC 2012).
FIRST-ORDER DRAFT IPCC WGII AR5 Chapter 19
Do Not Cite, Quote, or Distribute 86 11 June 2012
Figure 19-2: Assessment of impacts of ocean acidification on marine organisms through effects on various biogeochemical processes Assessment based on (1) estimated likelihood that the process will be affected by ocean acidification and (2) the magnitude of impacts to marine organisms. The width of the boxes roughly indicates the uncertainty in the likelihood of the process being affected by acidification, while the height of the boxes roughly indicates the magnitude of impacts to marine organisms. Height, width, and location of boxes are based on expert opinion, with greatest subjectivity in judging impacts. Judgments are based on impacts expected with atmospheric CO2 levels of 2-3x preindustrial levels (560-840 ppmv). This figure is meant to be broadly illustrative: with sufficient information Low, Medium, and High would be defined quantitatively. For example, while the sign of the impact on marine calcifiers is negative, the magnitude varies considerably across taxa and currently overall quantification is not feasible (based on a meta-analysis by Kroeker et al. 2010).
FIRST-ORDER DRAFT IPCC WGII AR5 Chapter 19
Do Not Cite, Quote, or Distribute 87 11 June 2012
Figure 19-3: Northern Hemisphere summer precipitation differences from the current climate averaged for the second 10 years of a 20-year geoengineering period emitting 5 Mt SO2 per year into the tropical lower stratosphere combined with A1B (Fig. 8, Robock et al., 2008). Hatch marks indicate changes significant at the 5% level. Note large reductions over India and China.
Figure 19-4: Definition of five Shared Socio-economic Pathways (SSPs) describing alternative development pathways that span a range of challenges to adaptation and mitigation (O’Neill et al., 2012).
Socio-economic challengesfor adaptation
Soc
io-e
co
nom
icc
halle
nge
s fo
r m
itig
atio
n
SSP 1:(Low Challenges)
Sustainability
SSP 3:(High Challenges)
Fragmentation
SSP 4:(Adapt. Challenges Dominate)
Inequality
SSP 5:(Mit. Challenges Dominate)
ConventionalDevelopment
SSP 2:(Intermediate Challenges)
Middle of the Road
FIRST-ORDER DRAFT IPCC WGII AR5 Chapter 19
Do Not Cite, Quote, or Distribute 88 11 June 2012
Figure 19-5: Representative global damage estimates, shown as a % of global output as a function of temperature. FUND: (Interagency Working Group on the Social Cost of Carbon, United States Government, 2010). DICE: (Nordhaus, 2008, 2011). PAGE: (Hope, 2011). CRED: (Ackerman et al., 2011). ENVISAGE: (Roson and Mensbrugghe, 2010). ICES: (Bosello et al., 2012). Note that, of models shown, only DICE and CRED (the damage function of which is recalibrated from that of DICE based on (Hanemann, 2008)) and PAGE attempt to include uncertain catastrophic damages, and only ENVISAGE includes labor productivity lost due to heat/humidity. For comparison, DICE 2007 damages are also shown considering only non-catastrophic impacts.
‐5%
0%
5%
10%
15%
0 1 2 3 4 5 6
Dam
age as % of global output
Warming above Pre‐Industrial (C)
DICE 2007 DICE 2007 ‐ non‐cat
DICE 2010 FUND 3.5
ENVISAGE ICES
CRED H‐N PAGE 2009
PAGE 2009 ‐ 5th PAGE 2009 ‐ 95th
FIRST-ORDER DRAFT IPCC WGII AR5 Chapter 19
Do Not Cite, Quote, or Distribute 89 11 June 2012
Figure 19-6: Breakdown of damages at 2.5°C above pre-industrial by sector in DICE 2007 (Nordhaus, 2007), FUND 2.7 (Warren et al., 2006) and ENVISAGE (Roson and Mensbrugghe, 2010), reflecting a low level of agreement among the integrated assessment models used to estimate global aggregate damages. Modified from (Kopp and Mignone, 2012). Note that the DICE calibration does not include damages due to changes in water resources as distinct from temperature impacts on agriculture and forestry, and FUND and ENVISAGE do not include expected catastrophic damages. Representations of changes in energy demand, coastal/sea level impacts, health and labor productivity impacts, and impacts on settlements, ecosystem and tourism are included in all three models.
‐0.5%
0.0%
0.5%
1.0%
1.5%
2.0% agriculture/forestry
water
energy
coastal/sea level
health/la
bor
se<lem
ents/
ecosystems/tourism
expe
cted
catastrop
hic Damages at 2
.5 C as %
of global G
DP
Sectoral Damages Breakdown at 2.5°C
DICE 2007 FUND 2.7 (A2 scenario) ENVISAGE 2010
FIRST-ORDER DRAFT IPCC WGII AR5 Chapter 19
Do Not Cite, Quote, or Distribute 90 11 June 2012
Figure 19-7: Illustration of the dependence of risk associated with the RFC related to aggregate impacts (section 19.6.3.4) on the level of climate change and vulnerability of society. For comparison, the representation from Smith et al. (2009) is shown, which does not explicitly take vulnerability into account. It is assumed here to be based implicitly on a medium level of future vulnerability. If future socio-economic conditions lead to more vulnerable societies, the aggregate impact risks associated with a given level of climate change would be higher. If future conditions lead to less vulnerable societies, risks for a given level of climate change would be lower. This figure is schematic; the specific degree of risk associated with particular levels of climate change has not been based on a literature assessment.
Figure 19-8: Climate change impacts avoided by two different mitigation scenarios compared to a no-mitigation case (SRES A1B scenario). Since increases and decreases in water stress, flood risks and crop suitability are not co-located and affect different regions, these effects are not combined. From Arnell et al 2012.