From meteorological input to inundation areas: the early warning system HORIX M. Disse, A. Bárdossy, J. Bliefernicht, T. Molnar, S. Pakosch, A. Yörük Introduction The aim of the BMBF funded project HORIX (2006 – 2008) is to develop an efficient management tool for floods in meso-scale watersheds. The flood warning system should thereby be fast and reliable. In the project the research group from several universities analyses all flood relevant processes (the so called flood chain): forecast of rainfall events – rainfall-runoff-model – hydraulic model with the help of sophisti- cated models. The name HORIX is an abbreviation for Development of an Operational Expert Sys- tem for Flood Risk Management Considering Prediction Uncertainty. Consequently, the research project considers uncertainties of the entire flood chain. Based on the results of the investigation an expert system will be developed, which is operationally applicable and easy to use, so that early warning of the population will be possible. The rules of the expert system are based on measurements and pre- calculated model runs of the flood chain. Flood alert systems have to be activated for several warning levels, which are defined by specified threshold values. At last (dy- namic) flood maps will be presented online in the internet (UMN Map Server) to get detailed spatial and temporal information about the inundation areas. Forecast of rainfall events High-resolved spatial and temporal precipitation fields A short-range flood forecasting model for a mesoscale catchment needs high- resolved precipitation fields in time and space. For this purpose the precipitation fields of a general circulation model could be used. However, these fields have coarse resolution which is not sufficiently in describing the precipitation process at the mesoscale. To overcome this problem a statistical downscaling method is used based on a conditional approach which provides daily areal precipitation for the test sites. This daily areal precipitation is then temporal and spatial disaggregated in de- pendence of the temporal and spatial distribution of the observation gauges to derive hourly precipitation series. Hourly precipitation scenarios are generated by the turn- ing bands method to describe the high variability of the precipitation process. These scenarios form the basis for the uncertainty analysis of the rainfall-runoff process. In the following subsection the downscaling approach and the generation of the precipi- tation szenarios is described in more detail. Statistical downscaling of daily areal precipitation The statistical downscaling approach is a conditional approach based on daily at- mospheric circulation patterns derived from a fuzzy-rule based classification method and an analogue method to provide a probabilistic precipitation forecast. The fuzzy-rule based classification method defines daily atmospheric circulation. It is an objective classification method, which has the advantage that for each catchment a specific set of circulation patterns can be determined. In contrast to a subjective classification, this classification method can be also used in operational forecasting.
Transcript
From meteorological input to inundation areas: the early warning system HORIX M. Disse, A. Bárdossy, J. Bliefernicht, T. Molnar, S. Pakosch, A. Yörük Introduction The aim of the BMBF funded project HORIX (2006 – 2008) is to develop an efficient management tool for floods in meso-scale watersheds. The flood warning system should thereby be fast and reliable. In the project the research group from several universities analyses all flood relevant processes (the so called flood chain): forecast of rainfall events – rainfall-runoff-model – hydraulic model with the help of sophisti-cated models. The name HORIX is an abbreviation for Development of an Operational Expert Sys-tem for Flood Risk Management Considering Prediction Uncertainty. Consequently, the research project considers uncertainties of the entire flood chain. Based on the results of the investigation an expert system will be developed, which is operationally applicable and easy to use, so that early warning of the population will be possible. The rules of the expert system are based on measurements and pre-calculated model runs of the flood chain. Flood alert systems have to be activated for several warning levels, which are defined by specified threshold values. At last (dy-namic) flood maps will be presented online in the internet (UMN Map Server) to get detailed spatial and temporal information about the inundation areas. Forecast of rainfall events High-resolved spatial and temporal precipitation fields A short-range flood forecasting model for a mesoscale catchment needs high-resolved precipitation fields in time and space. For this purpose the precipitation fields of a general circulation model could be used. However, these fields have coarse resolution which is not sufficiently in describing the precipitation process at the mesoscale. To overcome this problem a statistical downscaling method is used based on a conditional approach which provides daily areal precipitation for the test sites. This daily areal precipitation is then temporal and spatial disaggregated in de-pendence of the temporal and spatial distribution of the observation gauges to derive hourly precipitation series. Hourly precipitation scenarios are generated by the turn-ing bands method to describe the high variability of the precipitation process. These scenarios form the basis for the uncertainty analysis of the rainfall-runoff process. In the following subsection the downscaling approach and the generation of the precipi-tation szenarios is described in more detail. Statistical downscaling of daily areal precipitation The statistical downscaling approach is a conditional approach based on daily at-mospheric circulation patterns derived from a fuzzy-rule based classification method and an analogue method to provide a probabilistic precipitation forecast. The fuzzy-rule based classification method defines daily atmospheric circulation. It is an objective classification method, which has the advantage that for each catchment a specific set of circulation patterns can be determined. In contrast to a subjective classification, this classification method can be also used in operational forecasting.
The classification of the circulation patterns is based on an optimization. The task of this optimization is to derive atmospheric circulation pattern which describe the varia-bility of the precipitation process as much as possible. To define the circulation pat-tern, the anomalies of the 500 hPa-field of the geopotential height are used as large-scale information. The mean precipitation amount and the frequency of extreme events of each subsample are calculated to distinguish between circulation patterns with a higher and lower occurence of extreme events. After classifying the observed data into subsambles, the analogue method is chosen to get a more realistic description of the precipitation process. The analogue method represents an approach which has been already successfully applied in operational flood forecasting. It is often used as benchmark for other statistical downscaling ap-proaches. It relies on the concept, that the weather situation of the current day is compared to past situations to identify a subset of anlogue situations. To provide a probabilistic forecast for the current day, the precipitation of this subset is chosen as forecast. The weather situations are described by the daily 1000 hPa-fields of the geopotential height, the 700 hPa-field of the the moisture flux in western direction and 700 hPa-field of the relative humidity. A combination of the euclidean distance and the Pearson correlation is used as similarity criterion to find similar weather situa-tions. The conditional downscaling approach is tested for a period of more than 50 years (1950-2005) to incorporate a large number of extreme events. The large-scale infor-mation is taken from the NCEP-NCAR reanalysis project. The areal precipitation is interpolated by external drift kriging in a spatial resolution of 1 km x 1km. The perfor-mance of the downscaling approach is evaluated by an economic decision model based on a static cost-loss approach. This approach determines the economic bene-fit, which a user of the forecasting system gains, if the presented approach is used to forecast extreme precipitaton events. Generating of hourly precipitation scenarios The statistical downscaling delivers only an estimation of the daily precipitation amount, but the spatial and temporal distribution of a precipitation event is unknown. To get this information also hourly observations are taken from the test sites and in-terpolated by an external drift kriging routine. These hourly precipitation fields have the same resolution than the daily precipitation fields and for each grid cell the daily precipitation amount is disaggregated according to the corresponding temporal distri-bution of the hourly rainfall. It is assumed, that the precipitation fields derived from the daily data are a more reasonable estimation of the daily precipitation amount than the precipitation fields of the hourly observation due to low number of precipitation stations with hourly observations. The precipitation process is characterized by a high variability, which cannot be de-scribed by a single scenario. Therefore precipitation scenarios are generated using the turning bands method. Calibration of rainfall runoff models As is generally known the successful application of any kind of models depends on a good calibration quality, which normally requires a detailed model understanding and further depends strongly on the user’s experiences. Moreover, due to the nonlinearity of the processes and model characteristic, it is typically difficult, if not impossible, to obtain a unique set of parameters and model uncertainties are implied additionally to
the input uncertainties. To overcome this inadequacy of a manual calibration the ge-netic evolution algorithm SCE-UA (Shuffled Complex Evolution – University of Arizo-nas, Duan et al., 1992, 1993, 1994) is applied. With the SCE-UA algorithm it is possi-ble to find the global optimum of the sought parameter set and therefore makes the calibration more even-handed. The SCE-UA optimization algorithm itself is leaned on the natural biological evolution process and includes combinations of random and deterministic approaches, the concept of clustering and systematic evolution as well as the concept of competitive evolution. Because of this combination of concepts the optimization will not stuck within local optima, but will find the global optimum. As the first step a so-called popu-lation P with an arbitrary number of parameter sets N is randomly generated within the n-dimensional parameter space. Hereby, the variable n describes the number of model parameters to be calibrated. The population P is then divided into an arbitrary number of complexes C which includes equally m = N/C parameter sets. Afterwards each complex is evolved separately according to the above mentioned concepts. Then the complexes are shuffled, that means that first the complex structure is abol-ished and second new complexes are built of the new existing population again. Each of these new shuffled complexes evolves once more before they are newly shuffled. This routine ends as soon the global optimum is found. However, before the application of the SCE-UA algorithm it is advisable to do a pa-rameter sensitivity analysis. With the results of such an investigation it is possible to define the n-dimensional parameter space more precise, which consequently reduc-es the computational time of the optimization. In this case the General Sensitivity Analysis (GSA) based on Monte Carlo Simulations (Wade et al., 2001) has been car-ried out. One of the rainfall runoff model for which the SCE-UA algorithm is applied is the spa-tially distributed and physically based hydrological model WaSiM-ETH (Version 6.4). It uses the Richards-equation to simulate the water fluxes in the unsaturated soil zone. This is done vertically within a layered soil column for each grid cell. WaSiM-ETH 6.4 is employed for two investigation catchments of the Upper Main and the Freiberger Mulde. In the following results for the GSA analysis and the SCE-UA cali-bration with respect to the Upper Main river basin are presented. Because of the model setup, 6 parameters of WaSiM-ETH have to be considered, namely the recession coefficient Kd for the direct flow, the recession coefficient Kh and the scaling factor dr for the interflow, the recession coefficient Kb and the scaling factor Q0 for the base flow as well as the scaling factor krec for the saturated hydrau-lic conductivity. As the first step the GSA analysis was done for two head catchments with different catchment sizes (96 km², 313 km²) to get an impression of the parame-ter sensitiveness. For this, 5000 Monte Carlo Simulations were done for each of the following parameter combinations:
PI: all 6 parameters are variable (6-dimensional parameter space) PII: Kb is set to a constant value (5-dimensional parameter space) PIII: Kb and Q0 are set to constant values (4-dimensional parameter
space) The results of the GSA analysis show almost the same results. As expected the pa-rameter dr seems to be the most sensitive parameter because it regulates the
amount of water becoming direct flow, interflow or base flow. In contrast to this the parameter Kh, Kb and Q0 are not sensitive. This can be attributed to the catchments underground because in the considered areas the overburden thickness is not very high, so that these components do not play an important role. After the sensitivity analysis several tests with the SCE-UA algorithm were performed in order to find good calibration conditions with respect to the lower and upper boundaries of the parameter space, the size of the generated population, the number of used complexes, the used objective function, etc. These tests were mainly done for two head catchments with an area about 320 km². These catchments were also manual calibrated which served as the basis for the comparison of the SCE-UA cali-bration results. For further 4 head catchments (AE = 96 – 332 km²) only the SCE-UA calibration was done. In all cases the main focus of the calibration lay in the good reproduction of the flood event hydrographs. So far it seems that satisfactory calibration results can achieved by the SCE-UA algo-rithm using the overall Root Mean Square Error (oRMSE) as the objective function. Considering the comparison of the manual and automatic calibration, slightly better results are always achieved with the SCE-UA algorithm in a substantial minor time exposure. The automatic calibration provides for river basins with an area greater then 250 km² not only good results concerning the flood event hydrograph in a whole but also for the single discharge components direct flow, interflow and base flow. In the next step of HORIX we will couple the precipitation scenarios with the rainfall runoff models to distinguish between (meteorological) input uncertainties and model uncertainties. So far it is assumed that the model uncertainties will contribute only a minor part to the overall uncertainty. However, this has to be quantified within the next months of the research project. Uncertainties of hydraulic models The main part of the hydrodynamic numerical modelling is to find out the hydraulic model uncertainty. When applying the flood model chain for a forecast, it is very im-portant for the end-users to know the preciseness of the out coming water levels re-spectively inundation areas. To quantify the numerical and model errors of hydrodynamic models, two different river sections were built up with different complex models (1D, 2D as well as com-bined 1D/2D). The first stretch consists of a 20 km long artificial river and the second one is a 27 km long river section of the Upper Main in north Bavaria (Input gauge Mainleus (AE = 1170 km2 HQ100 = 460 m3/s), output gauge Schwürbitz (AE = 2420 km2 HQ100 = 950 m3/s)). The investigation was carried out to compare the model out-comes with same boundary conditions and parameters in order to quantify the model dependent error. Secondly, the quantitative influence of channel and foreland rough-ness was analysed (sensitivity analysis) due to the fact that generally only the chan-nel roughness can be calibrated precisely if measured data of the water level and discharge are available. In most cases the foreland roughness has to be estimated by literature values.
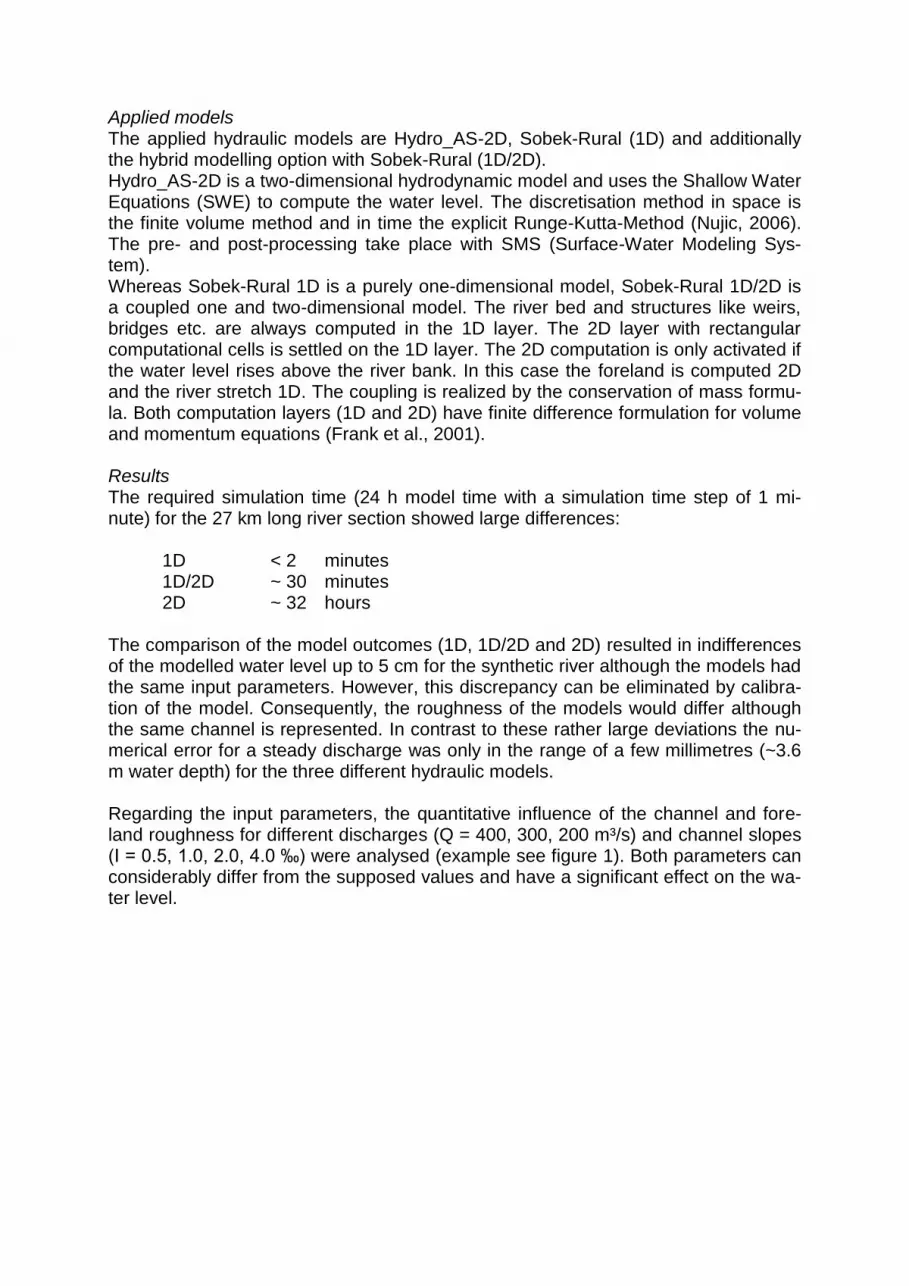
Applied models The applied hydraulic models are Hydro_AS-2D, Sobek-Rural (1D) and additionally the hybrid modelling option with Sobek-Rural (1D/2D). Hydro_AS-2D is a two-dimensional hydrodynamic model and uses the Shallow Water Equations (SWE) to compute the water level. The discretisation method in space is the finite volume method and in time the explicit Runge-Kutta-Method (Nujic, 2006). The pre- and post-processing take place with SMS (Surface-Water Modeling Sys-tem). Whereas Sobek-Rural 1D is a purely one-dimensional model, Sobek-Rural 1D/2D is a coupled one and two-dimensional model. The river bed and structures like weirs, bridges etc. are always computed in the 1D layer. The 2D layer with rectangular computational cells is settled on the 1D layer. The 2D computation is only activated if the water level rises above the river bank. In this case the foreland is computed 2D and the river stretch 1D. The coupling is realized by the conservation of mass formu-la. Both computation layers (1D and 2D) have finite difference formulation for volume and momentum equations (Frank et al., 2001). Results The required simulation time (24 h model time with a simulation time step of 1 mi-nute) for the 27 km long river section showed large differences: 1D < 2 minutes 1D/2D ~ 30 minutes 2D ~ 32 hours The comparison of the model outcomes (1D, 1D/2D and 2D) resulted in indifferences of the modelled water level up to 5 cm for the synthetic river although the models had the same input parameters. However, this discrepancy can be eliminated by calibra-tion of the model. Consequently, the roughness of the models would differ although the same channel is represented. In contrast to these rather large deviations the nu-merical error for a steady discharge was only in the range of a few millimetres (~3.6 m water depth) for the three different hydraulic models. Regarding the input parameters, the quantitative influence of the channel and fore-land roughness for different discharges (Q = 400, 300, 200 m³/s) and channel slopes (I = 0.5, 1.0, 2.0, 4.0 ‰) were analysed (example see figure 1). Both parameters can considerably differ from the supposed values and have a significant effect on the wa-ter level.
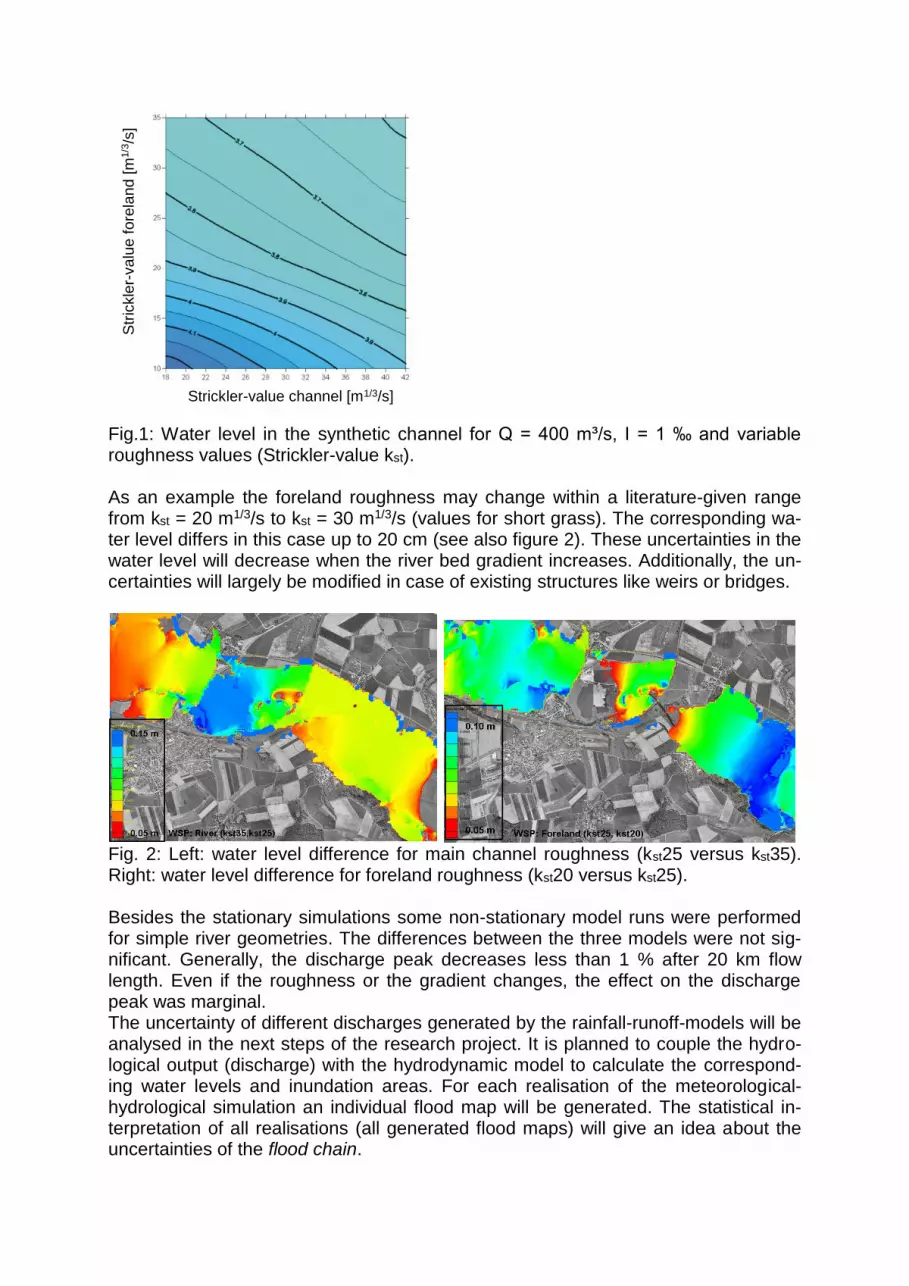
Fig.1: Water level in the synthetic channel for Q = 400 m³/s, I = 1 ‰ and variable roughness values (Strickler-value kst). As an example the foreland roughness may change within a literature-given range from kst = 20 m1/3/s to kst = 30 m1/3/s (values for short grass). The corresponding wa-ter level differs in this case up to 20 cm (see also figure 2). These uncertainties in the water level will decrease when the river bed gradient increases. Additionally, the un-certainties will largely be modified in case of existing structures like weirs or bridges.
Fig. 2: Left: water level difference for main channel roughness (kst25 versus kst35). Right: water level difference for foreland roughness (kst20 versus kst25). Besides the stationary simulations some non-stationary model runs were performed for simple river geometries. The differences between the three models were not sig-nificant. Generally, the discharge peak decreases less than 1 % after 20 km flow length. Even if the roughness or the gradient changes, the effect on the discharge peak was marginal. The uncertainty of different discharges generated by the rainfall-runoff-models will be analysed in the next steps of the research project. It is planned to couple the hydro-logical output (discharge) with the hydrodynamic model to calculate the correspond-ing water levels and inundation areas. For each realisation of the meteorological-hydrological simulation an individual flood map will be generated. The statistical in-terpretation of all realisations (all generated flood maps) will give an idea about the uncertainties of the flood chain.
Str
ickle
r-valu
e f
ore
land [
m1/3/s
]
Strickler-value channel [m1/3/s]
First approaches for the fuzzy-based expert system At the end of the research project HORIX we will establish a fuzzy-based expert sys-tem to replicate the above described flood model chain forecast of rainfall events – rainfall-runoff-model – hydraulic model and their included uncertainties in order to make the flood warnings within meso-scale river basins faster and more reliable. With the application of fuzzy logic it is possible to describe the relations between the given input and output data without any natural occurring process understanding. The data relations are represented through adaptable “If - Then” algorithms which are based on so-called fuzzy rules. In a first step measured state variables like discharge, precipitation, vegetation, etc. are analysed and further pre-event state variables like the antecedent precipitation index are derived with respect to flood events. In a second step the Simulated An-nealing algorithm is applied to assess the fuzzy rules according to these state varia-bles which gives a first rough impression of the system. Afterwards this system has to be extended so that further variables like input uncertainties as well as model uncer-tainties can be integrated. Finally, a two-stage forecasting system will be set up. Within the first system stage the inquiry “with which probability will the discharge ex-ceed a certain given threshold discharge” is done. If the threshold will be hold, no forecast will be done. Otherwise the second system stage will start with the flood forecast. Hereby, the uncertainty – expressed by confidential intervals – that an ex-treme flood event HQT will occur as well as the corresponding inundation areas will be given. Due to the fact, that concrete discharges as well as the corresponding in-undation areas, which depends on the discharge volume, should be forecasted, it will be necessary to combine the “If – Then” algorithm of Mamdani Method and Takagi-Sugeno Method (Bárdossy, 2005). WebGIS Application with UMN MapServer In order to communicate the flood maps (inundation areas) to the end-user, it was decided to implement a WebGIS application that does not need any license agree-ment. The WebGIS application for the test area Upper Main was realised with the Open Source and free Software UMN MapServer. The UMN MapServer is an devel-opment environment for building spatial data information for internet applications. MapServer excels at rendering spatial data (maps, images, and vector data) for the web. Beyond browsing GIS data, MapServer allows to create "geographic image maps", i.e. maps that can direct users to the content. MapServer was originally developed by the University of Minnesota (UMN) in coop-eration with NASA and the Minnesota Department of Natural Resources (MNDNR). The MapServer project is hosted by the TerraSIP project, a NASA sponsored project between the UMN and the consortium of land management interests. The program supports current spatial data formats of different systems, such vector data (ESRI Shapefiles, tab, mif, dgn), raster data (as GeoTIFF, GIF, PNG, JPEG, ERDAS und ArcGRID) and connection to object-oriented databases (about PostgreSQL/PostGIS, ArcSDE und Oracle Spatial). The output formats are mostly raster formats as JPG, GIF or PNG.
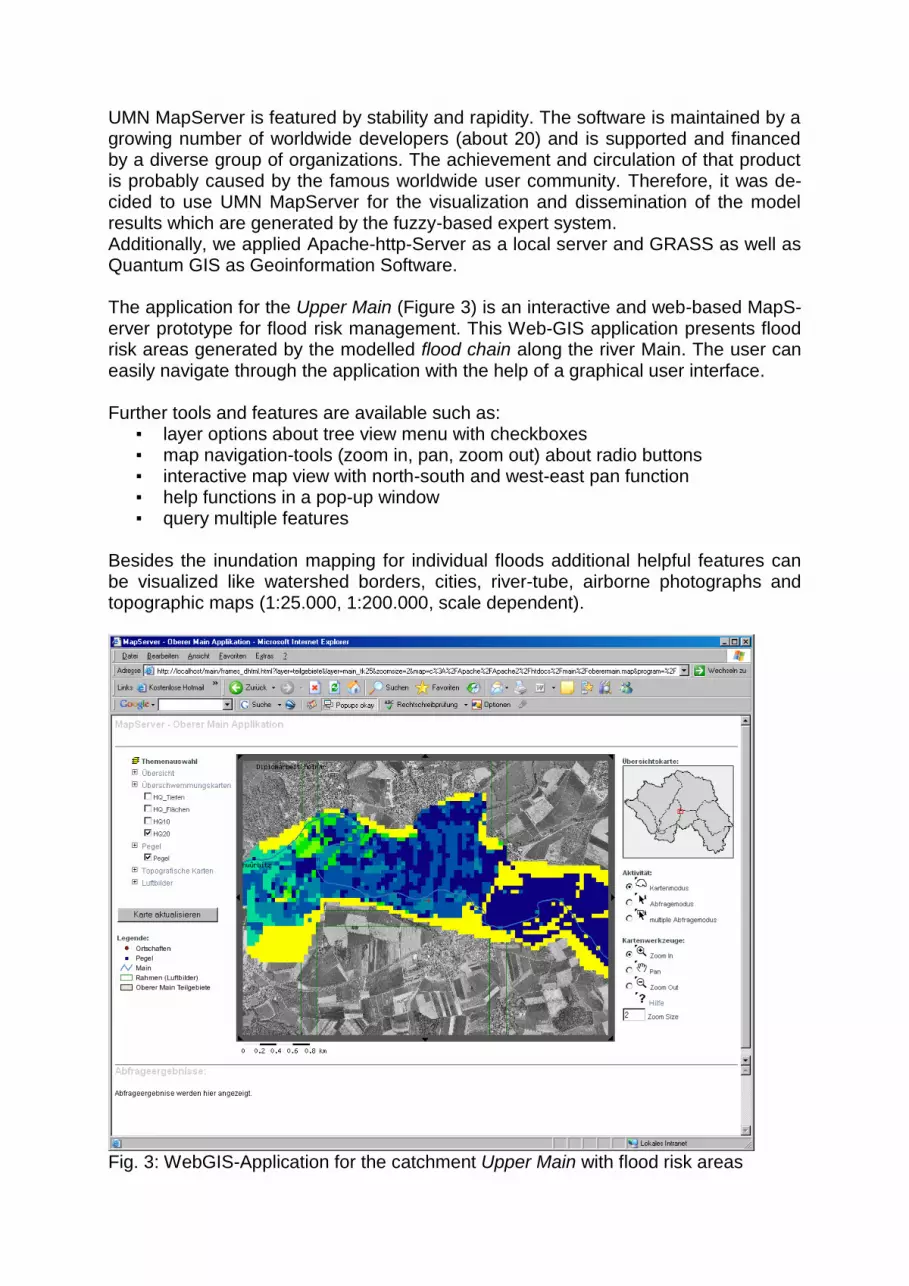
UMN MapServer is featured by stability and rapidity. The software is maintained by a growing number of worldwide developers (about 20) and is supported and financed by a diverse group of organizations. The achievement and circulation of that product is probably caused by the famous worldwide user community. Therefore, it was de-cided to use UMN MapServer for the visualization and dissemination of the model results which are generated by the fuzzy-based expert system. Additionally, we applied Apache-http-Server as a local server and GRASS as well as Quantum GIS as Geoinformation Software. The application for the Upper Main (Figure 3) is an interactive and web-based MapS-erver prototype for flood risk management. This Web-GIS application presents flood risk areas generated by the modelled flood chain along the river Main. The user can easily navigate through the application with the help of a graphical user interface. Further tools and features are available such as:
▪ layer options about tree view menu with checkboxes ▪ map navigation-tools (zoom in, pan, zoom out) about radio buttons ▪ interactive map view with north-south and west-east pan function ▪ help functions in a pop-up window ▪ query multiple features
Besides the inundation mapping for individual floods additional helpful features can be visualized like watershed borders, cities, river-tube, airborne photographs and topographic maps (1:25.000, 1:200.000, scale dependent).
Fig. 3: WebGIS-Application for the catchment Upper Main with flood risk areas
References Bárdossy, A. (2005): Fuzzy sets in rainfall/runoff modelling. John Wiley and Sons, Ltd. Q. Duan, S. Sorooshain, and V. K. Gupta (1992): Effective and efficient global opti-mization for conceptual rainfall-runoff models. Water Resources Research, 28(4):1015–1031. Q. Duan, S. Sorooshain, and V. K. Gupta (1993): Shuffled complex evolution ap-proach for effective and efficient global minimization. Journal of Optimization Theory and Applications, 76(3):501–521. Q. Duan, S. Sorooshain, and V. K. Gupta (1994): Optimal use of the sce-ua global optimization method for calibrating watershed models. Journal of Hydrology, 158:265–284. Frank, E., Ostan, A., Caccato, M. & Stelling, G.S. (2001): Use of an integrated one dimensional-two-dimensional hydraulic Modelling approach for flood hazard and risk mapping. River Basin Management, eds R.A. Falconer & W.R. Blain, WIT Press, Southampton, UK, pp. 99-108. Nujic, Marinko (2006): HYDRO_AS-2D – Ein zweidimensionales Strömungsmodell für die wasserwirtschaftliche Praxis; Benutzerhandbuch Wade, A.J., Hornberger, G.M., Whitehead, P.G., Jarvie, H.P. & Flynn, N. (2001): On modeling the mechanisms that control in-stream phosphorus, mycrophyte, and epi-phyte dynamics: An assessment of a new model using general sensitivity analysis. Water Resources Research, Vol. 37, No. 11, Pages 2777-2792.