arXiv:astro-ph/9907005v1 1 Jul 1999 E Galactic Winds and Circulation of the ISM in Dwarf Galaxies A. D’Ercole 1⋆ and F. Brighenti 2,3† 1 Osservatorio Astronomico di Bologna, via Zamboni 33, Bologna 40126, Italy 2 Dipartimento di Astronomia, Universit` a di Bologna, via Zamboni 33, Bologna 40126, Italy 3 University of California Observatories/Lick Observatory, Board of studies in Astronomy and Astrophysics, University of California, Santa Cruz, CA 95064 Accepted Received ; in original form ABSTRACT We study, through 2D hydrodynamical simulations, the feedback of a starburst on the ISM of typical gas rich dwarf galaxies. The main goal is to address the circulation of the ISM and metals following the starburst. We assume a single-phase rotating ISM in equilibrium in the galactic potential generated by a stellar disk and a spherical dark halo. The starburst is assumed to occur in a small volume in the center of the galaxy, and it generates a mechanical power of 3.8 × 10 39 erg s -1 or 3.8 × 10 40 erg s -1 for 30 Myr. We found, consistently with previous investigations, that the galactic wind is not very effective in removing the ISM. The metal rich stellar ejecta, instead, may be efficiently expelled from the galaxy and dispersed in the intergalactic medium. Moreover, we found that the central region of the galaxy is always replenished with cold and dense gas after a few 100 Myr from the starbust, achieving the requisite for a new star formation event in ≈ 0.5 - 1 Gyr. The hydrodynamical evolution of galactic winds is thus consistent with the episodic star formation regime suggested by many chemical evolution studies. We also discuss the X-ray emission of these galaxies and find that the observable (emission averaged) abundance of the hot gas underestimates the real one if thermal conduction is effective. This could explain the very low hot gas metallicities estimated in starburst galaxies. Key words: hydrodynamics - galaxies: irregular - galaxies: ISM - galaxies: starburst 1 INTRODUCTION Many gas rich dwarf galaxies are known to be in a starburst phase, or are believed to have experienced periods of intense star formation in the past (e.g. Gallagher & Hunter 1984; Thuan 1991; Tosi 1998, and references therein). These galax- ies, classified as “blue compact dwarf (BCD) galaxies” or “HII galaxies”, are thus excellent laboratories to investigate the feedback of vigorous star formation on the interstellar medium (ISM). Massive stars inject enormous amount of energy in the ISM through stellar winds and when they explode as type II supernovae (SNe); the impact of such an energy input on the galactic ISM may, in principle, be devastating. In fact it is often found that the total energy released during a star- burst is greater that the gas binding energy. Yet many dwarf ⋆ [email protected]† [email protected]galaxies in a post-starburst phase are still gas rich. As Skill- man & Bender (1995) pointed out, observational evidence (e.g. Marlowe et al. 1995; Martin 1996) are still insufficient to substantiate a disruptive impact of galactic winds on the ISM. Clearly, simple energetic considerations do not catch the essential nature of the feedback process, and detailed, time dependent hydrodynamical models are needed. Galactic winds are thought to have a key role in the for- mation and evolution of dwarf galaxies (Dekel & Silk 1986, Babul & Rees 1992, Matteucci & Chiosi 1983). In general, understanding the physics of the feedback of massive stars on the ISM is a key problem in cosmological theories of galaxy formation (Yepes et al. 1997, Cole et al. 1994). Gas outflows from dwarf galaxies are also suggested to be an im- portant factor for the production and enrichment of the in- tergalactic medium (Trentham 1994). However, persuasive arguments against this conclusion are given by Gibson & Matteucci (1997), and the origin of metals in clusters of c 1994 RAS
Transcript
arX
iv:a
stro
-ph/
9907
005v
1 1
Jul
199
9
Mon. Not. R. Astron. Soc. 000, 1–15 (1994) Printed 20 September 2018 (MN LATEX style file v1.4)
Galactic Winds and Circulation of the ISM in Dwarf
Galaxies
A. D’Ercole1⋆ and F. Brighenti2,3†1 Osservatorio Astronomico di Bologna, via Zamboni 33, Bologna 40126, Italy2Dipartimento di Astronomia, Universita di Bologna, via Zamboni 33, Bologna 40126, Italy3University of California Observatories/Lick Observatory, Board of studies in Astronomy and Astrophysics, University of California,Santa Cruz, CA 95064
Accepted Received ; in original form
ABSTRACT
We study, through 2D hydrodynamical simulations, the feedback of a starburst onthe ISM of typical gas rich dwarf galaxies. The main goal is to address the circulationof the ISM and metals following the starburst. We assume a single-phase rotating ISMin equilibrium in the galactic potential generated by a stellar disk and a spherical darkhalo. The starburst is assumed to occur in a small volume in the center of the galaxy,and it generates a mechanical power of 3.8 × 1039 erg s−1 or 3.8 × 1040 erg s−1 for30 Myr. We found, consistently with previous investigations, that the galactic wind isnot very effective in removing the ISM. The metal rich stellar ejecta, instead, may beefficiently expelled from the galaxy and dispersed in the intergalactic medium.
Moreover, we found that the central region of the galaxy is always replenishedwith cold and dense gas after a few 100 Myr from the starbust, achieving the requisitefor a new star formation event in ≈ 0.5 − 1 Gyr. The hydrodynamical evolution ofgalactic winds is thus consistent with the episodic star formation regime suggested bymany chemical evolution studies.
We also discuss the X-ray emission of these galaxies and find that the observable(emission averaged) abundance of the hot gas underestimates the real one if thermalconduction is effective. This could explain the very low hot gas metallicities estimatedin starburst galaxies.
Many gas rich dwarf galaxies are known to be in a starburstphase, or are believed to have experienced periods of intensestar formation in the past (e.g. Gallagher & Hunter 1984;Thuan 1991; Tosi 1998, and references therein). These galax-ies, classified as “blue compact dwarf (BCD) galaxies” or“HII galaxies”, are thus excellent laboratories to investigatethe feedback of vigorous star formation on the interstellarmedium (ISM).
Massive stars inject enormous amount of energy in theISM through stellar winds and when they explode as typeII supernovae (SNe); the impact of such an energy input onthe galactic ISM may, in principle, be devastating. In fact itis often found that the total energy released during a star-burst is greater that the gas binding energy. Yet many dwarf
galaxies in a post-starburst phase are still gas rich. As Skill-man & Bender (1995) pointed out, observational evidence(e.g. Marlowe et al. 1995; Martin 1996) are still insufficientto substantiate a disruptive impact of galactic winds on theISM. Clearly, simple energetic considerations do not catchthe essential nature of the feedback process, and detailed,time dependent hydrodynamical models are needed.
Galactic winds are thought to have a key role in the for-mation and evolution of dwarf galaxies (Dekel & Silk 1986,Babul & Rees 1992, Matteucci & Chiosi 1983). In general,understanding the physics of the feedback of massive starson the ISM is a key problem in cosmological theories ofgalaxy formation (Yepes et al. 1997, Cole et al. 1994). Gasoutflows from dwarf galaxies are also suggested to be an im-portant factor for the production and enrichment of the in-tergalactic medium (Trentham 1994). However, persuasivearguments against this conclusion are given by Gibson &Matteucci (1997), and the origin of metals in clusters of
galaxies is still a matter of debate (Brighenti & Mathews1998).
The fate of the (metal rich) material ejected by massivestars is of crucial importance in understanting the chem-ical evolution of these galaxies (Tosi 1998), in particularthe low α-elements abundance and the ‘strange’ values of(He/H) and (N/O) vs. (O/H). These problems have beenencompassed invoking a ‘differential ejection’, in which theenriched gas lost by massive stars escapes from the galaxyas galactic wind, while some (or most) of the original ISMis unaffected.
Recent hydrodynamical simulations have verified that,under many circumstances, galactic winds are able to ejectmost of the metal rich gas, preserving a significant fraction ofthe original ISM (MacLow & Ferrara 1998, hereafter MF; DeYoung & Heckman 1994; De Young & Gallagher 1991). Silich& Tenorio-Tagle (1998) and Tenorio-Tagle (1996), instead,found that even the metal-rich material is hardly lost fromgalaxies, since it is at first trapped in the extended halosand then accreted back onto the galaxy.
To investigate this subject further, we present here newhigh resolution calculations, addressing the ultimate fate ofthe ISM and SN ejecta, and their mixing, in a realistic star-bursting dwarf galaxy. We investigate in detail the differ-ent phases of the gas flow, with particular emphasis on thelate evolution, evolving the simulations for 500 Myr afterthe starburst event. We consider the effect of the dark mat-ter, gas rotation, thermal conduction and different starburststrengths. We also discuss the X-ray emission and its diag-nostic for the abundance of the hot gas, a particularly ex-citing topic in view of the forthcoming launch of AXAF andXMM.
We aim at investigating the evolution of galactic windsin a general way, without focusing on any specific object.Thus, we select the parameters of the galactic models (totalmass, ISM mass and distribution, etc.) to be representativeof the class of dwarf galaxies. Nevertheless, it can be use-ful to compare some of our results to a real, representativeobject. An ideal galaxy is NGC 1569, a nearby, well studiedstarburst galaxy.
Several independent lines of evidence indicate that NGC1569 is in a post-starburst phase (Israel 1988, Israel & deBruyn 1988, Waller 1991, Heckman et al. 1995, Greggio etal. 1998), with the major starburst activity ceased ∼ 5− 10Myr ago. Hα observations of NGC 1569 show (young) bub-bles complexes, filaments and arcs throughout the volumeof the galaxy (Tomita, Ohta & Saito 1994), suggesting a dif-fuse star formation. Heckman et al. (1995) found that the Hαemission of NGC 1569 can be separated in a quiescent com-ponent, permeating the starbursting region of the galaxy,and a more violent component, far more extended and withvelocities up to 200 km s−1. This high velocity component isinterpreted to be ionized shells of superbubbles and providesa direct evidence of a galactic-scale outflow.
Heckman et al. (1995) and Della Ceca et al. (1996) de-tected X-ray emission, extending for 1-2 kpc along the opti-cal minor axis of NGC 1569, thus probing the hot gas phasedirectly. This hot gas (T ≈ 107 K) is the signature of theviolent SN activity on the ISM.
As in almost all studies to date, we make a numberof simplifying assumptions in calculating our models. First,the ISM is assumed to be homogeneous and single phase.
Second, we neglect the selfgravity of the gas, even if thegas mass is of the same order of the stellar mass. Third, thestarburst is instantaneous and concentrated in a small regionat the center of the galaxy. While none of these hypothesesis likely to be strictly correct, they allow for a more directcomparison with previous works, and still make possible thecalculation of models retaining the basics attributes of realgalactic winds. We will relax some of these assumptions ina future paper in preparation.
2 GALAXY MODELS
Many ingredients play an important role in determining thehydrodynamical evolution of the galactic wind. Among oth-ers, the density distribution of the ISM in the pre-burstgalaxy, the energy injection rate of the newly formed stars,the gravitational potential of the galaxy and the effective-ness of transport processes in the gas, like thermal conduc-tion.
A thorough exploration of the parameter space wouldrequire an enormous amount of computational resources andit is beyond the scope of this paper. Thus, we hold approx-imately constant the stellar and ISM masses of the modelgalaxies (M∗ = 1.7 × 10⁸ M⊙ and MISM ∼ 1.3 × 10⁸ M⊙ ),although MISM is a crucial factor for the late evolution ofthe system (De Young & Heckman 1994; MF). Instead, wevary some of the others parameters as described below.
2.1 The gravitational potential and the gasdistribution
The gravitational potential for our standard model is dueto two mass distributions: a spherical quasi-isothermal darkmatter halo plus a stellar thin disk.
The halo density is given by ρh(r) = ρ0h/[1 + (r/rc)2],
and we chose a central density ρ0h = 4.34 × 10⁻²⁵ g cm−3
(6.4 × 10⁻³ M⊙ pc−3). The halo core radius is assumed tobe rc = 1 kpc. The dark halo is truncated at r = 20 kpc.The total dark matter mass is thus ∼ 2×10⁹ M⊙ , while thehalo mass inside the galactic region (defined hereafter as acylinder R < 2.2 kpc and |z| < 1.1 kpc, approximately theoptical size of NGC 1569) is only 0.66 × 10⁸ M⊙ .
For simplicity, we assume that the stars are distribuitedin an infinitesimally thin Kuzmin’s disk with surface density
Σ∗(R) =r∗M∗
2π(R2 + r2∗)3/2
where r∗ = 2 kpc is the radial scalelength and M∗ = 1.7 ×10⁸ M⊙ is the total stellar mass, a typical value for dwarfgalaxies. Although this mass distribution is clearly a roughapproximation of real stellar disks, it does not degrade theaccuracy of the large scale hydrodynamical flow. The stellarpotential generated by this mass distribution is
Φ∗(R, z) = −GM∗
√
R2 + (r∗ + |z|)2
(Binney & Tremaine 1987).It turns out that the stellar mass inside the galactic
region is M∗,gal ∼ 3.13 × 10⁷ M⊙ , about half of the darkhalo mass and about a factor of four less than the gas mass
Galactic Winds and Circulation of the ISM in Dwarf Galaxies 3
inside the same volume (see below). The dark halo totallydominates the mass budget at larger radii.
The ISM is assumed to be single-phase and in equilib-rium with the potential described above. In real dwarf galax-ies the neutral ISM is supported against gravity partly by ro-tation and partly by the HI velocity dispersion (see Hoffmanet al. 1996), with maximum rotational velocity that typicallyexceeds the velocity dispersion by a factor of few. Thus, inthe standard model (hereafter model STD) we allow theISM to rotate, to investigate the role played by the angularmomentum conservation on the late phase of the evolution,when (once the energy output is ceased) the gas tends torecollapse toward the central regions (see section 3.1). Thetemperature of the unperturbed ISM is set to T0 = 4.5×10³.
To build a rotating ISM configuration in equilibriumwith the given potential, we first arbitrarily assume a gasdistribution in the equatorial plane (z = 0) of the formρ(R, 0) = ρ0/[1 + (R/Rc)
2]3/2, where the central value isρ0 = 3.9×10⁻²⁴ g cm−3 and the gas core radius is Rc = 0.8kpc. The rotational velocity in the equatorial plane is thendetermined from the condition of equilibrium:
v2φ = v2c −R
ρ
∣
∣
∣
∣
dp
dR
∣
∣
∣
∣
z=0
where vc =√
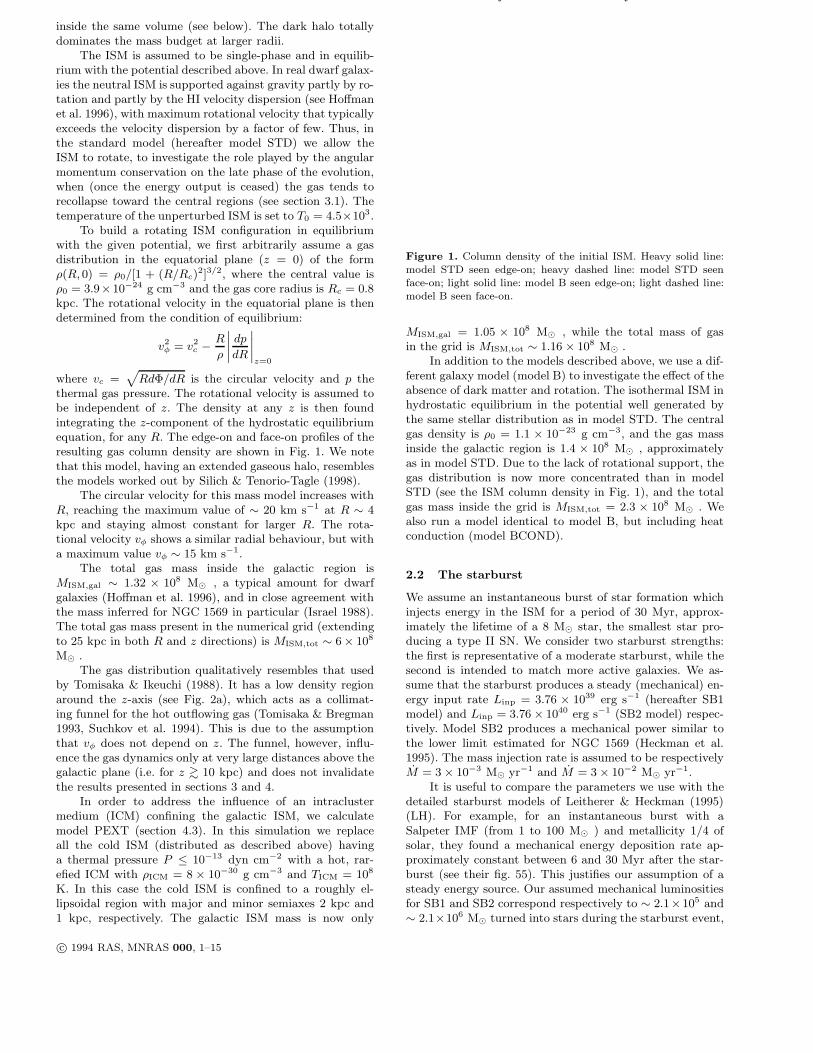
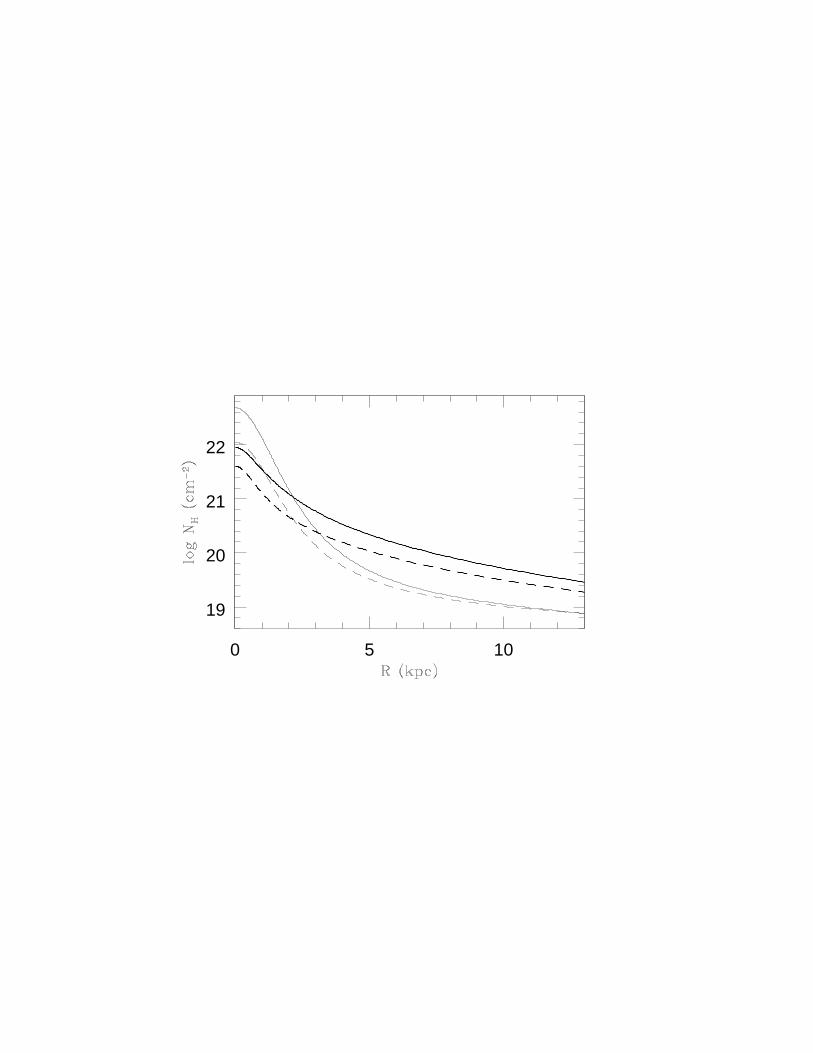
RdΦ/dR is the circular velocity and p thethermal gas pressure. The rotational velocity is assumed tobe independent of z. The density at any z is then foundintegrating the z-component of the hydrostatic equilibriumequation, for any R. The edge-on and face-on profiles of theresulting gas column density are shown in Fig. 1. We notethat this model, having an extended gaseous halo, resemblesthe models worked out by Silich & Tenorio-Tagle (1998).
The circular velocity for this mass model increases withR, reaching the maximum value of ∼ 20 km s−1 at R ∼ 4kpc and staying almost constant for larger R. The rota-tional velocity vφ shows a similar radial behaviour, but witha maximum value vφ ∼ 15 km s−1.
The total gas mass inside the galactic region isMISM,gal ∼ 1.32 × 10⁸ M⊙ , a typical amount for dwarfgalaxies (Hoffman et al. 1996), and in close agreement withthe mass inferred for NGC 1569 in particular (Israel 1988).The total gas mass present in the numerical grid (extendingto 25 kpc in both R and z directions) is MISM,tot ∼ 6× 10⁸
M⊙ .The gas distribution qualitatively resembles that used
by Tomisaka & Ikeuchi (1988). It has a low density regionaround the z-axis (see Fig. 2a), which acts as a collimat-ing funnel for the hot outflowing gas (Tomisaka & Bregman1993, Suchkov et al. 1994). This is due to the assumptionthat vφ does not depend on z. The funnel, however, influ-ence the gas dynamics only at very large distances above thegalactic plane (i.e. for z ∼
> 10 kpc) and does not invalidatethe results presented in sections 3 and 4.
In order to address the influence of an intraclustermedium (ICM) confining the galactic ISM, we calculatemodel PEXT (section 4.3). In this simulation we replaceall the cold ISM (distributed as described above) havinga thermal pressure P ≤ 10−13 dyn cm−2 with a hot, rar-efied ICM with ρICM = 8 × 10⁻³⁰ g cm−3 and TICM = 108
K. In this case the cold ISM is confined to a roughly el-lipsoidal region with major and minor semiaxes 2 kpc and1 kpc, respectively. The galactic ISM mass is now only
Figure 1. Column density of the initial ISM. Heavy solid line:model STD seen edge-on; heavy dashed line: model STD seenface-on; light solid line: model B seen edge-on; light dashed line:model B seen face-on.
MISM,gal = 1.05 × 10⁸ M⊙ , while the total mass of gasin the grid is MISM,tot ∼ 1.16 × 10⁸ M⊙ .
In addition to the models described above, we use a dif-ferent galaxy model (model B) to investigate the effect of theabsence of dark matter and rotation. The isothermal ISM inhydrostatic equilibrium in the potential well generated bythe same stellar distribution as in model STD. The centralgas density is ρ0 = 1.1 × 10⁻²³ g cm−3, and the gas massinside the galactic region is 1.4 × 10⁸ M⊙ , approximatelyas in model STD. Due to the lack of rotational support, thegas distribution is now more concentrated than in modelSTD (see the ISM column density in Fig. 1), and the totalgas mass inside the grid is MISM,tot = 2.3 × 10⁸ M⊙ . Wealso run a model identical to model B, but including heatconduction (model BCOND).
2.2 The starburst
We assume an instantaneous burst of star formation whichinjects energy in the ISM for a period of 30 Myr, approx-imately the lifetime of a 8 M⊙ star, the smallest star pro-ducing a type II SN. We consider two starburst strengths:the first is representative of a moderate starburst, while thesecond is intended to match more active galaxies. We as-sume that the starburst produces a steady (mechanical) en-ergy input rate Linp = 3.76 × 1039 erg s−1 (hereafter SB1model) and Linp = 3.76× 1040 erg s−1 (SB2 model) respec-tively. Model SB2 produces a mechanical power similar tothe lower limit estimated for NGC 1569 (Heckman et al.1995). The mass injection rate is assumed to be respectivelyM = 3× 10⁻³ M⊙ yr−1 and M = 3× 10⁻² M⊙ yr−1.
It is useful to compare the parameters we use with thedetailed starburst models of Leitherer & Heckman (1995)(LH). For example, for an instantaneous burst with aSalpeter IMF (from 1 to 100 M⊙ ) and metallicity 1/4 ofsolar, they found a mechanical energy deposition rate ap-proximately constant between 6 and 30 Myr after the star-burst (see their fig. 55). This justifies our assumption of asteady energy source. Our assumed mechanical luminositiesfor SB1 and SB2 correspond respectively to ∼ 2.1×10⁵ and∼ 2.1×10⁶ M⊙ turned into stars during the starburst event,
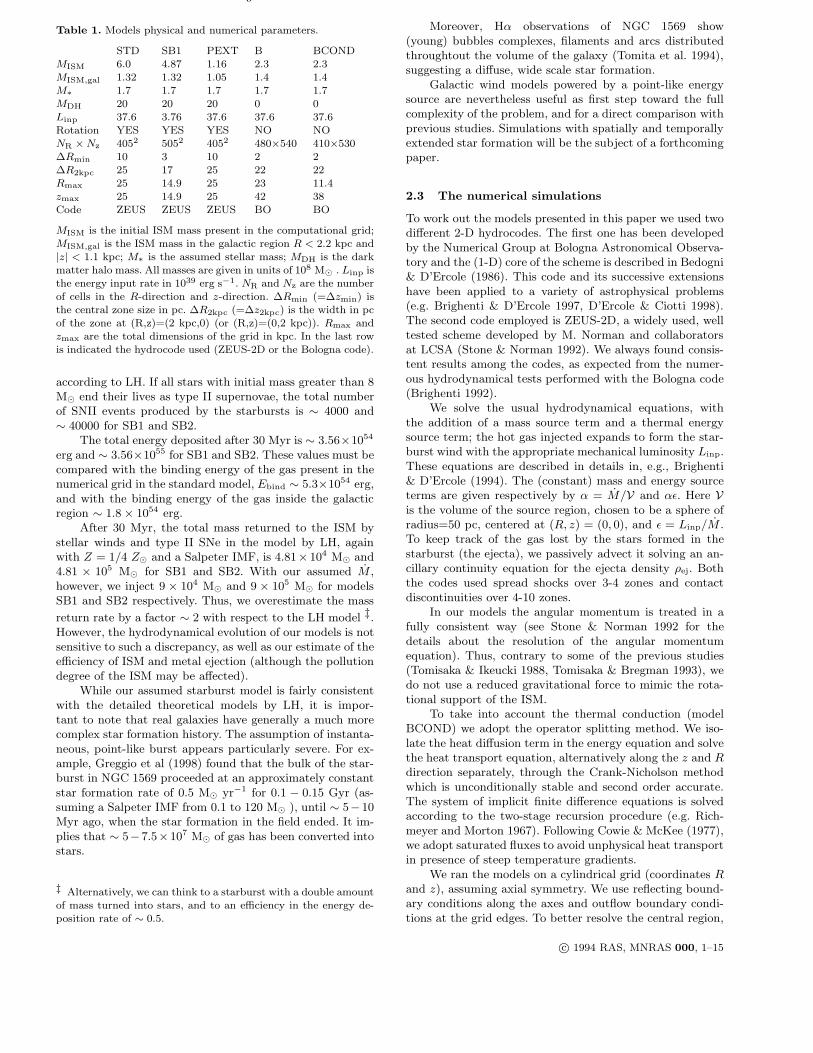
Table 1. Models physical and numerical parameters.
STD SB1 PEXT B BCONDMISM 6.0 4.87 1.16 2.3 2.3MISM,gal 1.32 1.32 1.05 1.4 1.4M∗ 1.7 1.7 1.7 1.7 1.7MDH 20 20 20 0 0Linp 37.6 3.76 37.6 37.6 37.6Rotation YES YES YES NO NONR ×Nz 4052 5052 4052 480×540 410×530∆Rmin 10 3 10 2 2∆R2kpc 25 17 25 22 22Rmax 25 14.9 25 23 11.4zmax 25 14.9 25 42 38Code ZEUS ZEUS ZEUS BO BO
MISM is the initial ISM mass present in the computational grid;MISM,gal is the ISM mass in the galactic region R < 2.2 kpc and|z| < 1.1 kpc; M∗ is the assumed stellar mass; MDH is the darkmatter halo mass. All masses are given in units of 108 M⊙ . Linp isthe energy input rate in 1039 erg s−1. NR and Nz are the numberof cells in the R-direction and z-direction. ∆Rmin (=∆zmin) isthe central zone size in pc. ∆R2kpc (=∆z2kpc) is the width in pcof the zone at (R,z)=(2 kpc,0) (or (R,z)=(0,2 kpc)). Rmax andzmax are the total dimensions of the grid in kpc. In the last rowis indicated the hydrocode used (ZEUS-2D or the Bologna code).
according to LH. If all stars with initial mass greater than 8M⊙ end their lives as type II supernovae, the total numberof SNII events produced by the starbursts is ∼ 4000 and∼ 40000 for SB1 and SB2.
The total energy deposited after 30 Myr is ∼ 3.56×1054
erg and ∼ 3.56×1055 for SB1 and SB2. These values must becompared with the binding energy of the gas present in thenumerical grid in the standard model, Ebind ∼ 5.3×1054 erg,and with the binding energy of the gas inside the galacticregion ∼ 1.8× 1054 erg.
After 30 Myr, the total mass returned to the ISM bystellar winds and type II SNe in the model by LH, againwith Z = 1/4 Z⊙ and a Salpeter IMF, is 4.81× 10⁴ M⊙ and4.81 × 105 M⊙ for SB1 and SB2. With our assumed M ,however, we inject 9 × 10⁴ M⊙ and 9 × 10⁵ M⊙ for modelsSB1 and SB2 respectively. Thus, we overestimate the mass
return rate by a factor ∼ 2 with respect to the LH model ‡.However, the hydrodynamical evolution of our models is notsensitive to such a discrepancy, as well as our estimate of theefficiency of ISM and metal ejection (although the pollutiondegree of the ISM may be affected).
While our assumed starburst model is fairly consistentwith the detailed theoretical models by LH, it is impor-tant to note that real galaxies have generally a much morecomplex star formation history. The assumption of instanta-neous, point-like burst appears particularly severe. For ex-ample, Greggio et al (1998) found that the bulk of the star-burst in NGC 1569 proceeded at an approximately constantstar formation rate of 0.5 M⊙ yr−1 for 0.1 − 0.15 Gyr (as-suming a Salpeter IMF from 0.1 to 120 M⊙ ), until ∼ 5−10Myr ago, when the star formation in the field ended. It im-plies that ∼ 5−7.5×10⁷ M⊙ of gas has been converted intostars.
‡ Alternatively, we can think to a starburst with a double amountof mass turned into stars, and to an efficiency in the energy de-position rate of ∼ 0.5.
Moreover, Hα observations of NGC 1569 show(young) bubbles complexes, filaments and arcs distributedthroughtout the volume of the galaxy (Tomita et al. 1994),suggesting a diffuse, wide scale star formation.
Galactic wind models powered by a point-like energysource are nevertheless useful as first step toward the fullcomplexity of the problem, and for a direct comparison withprevious studies. Simulations with spatially and temporallyextended star formation will be the subject of a forthcomingpaper.
2.3 The numerical simulations
To work out the models presented in this paper we used twodifferent 2-D hydrocodes. The first one has been developedby the Numerical Group at Bologna Astronomical Observa-tory and the (1-D) core of the scheme is described in Bedogni& D’Ercole (1986). This code and its successive extensionshave been applied to a variety of astrophysical problems(e.g. Brighenti & D’Ercole 1997, D’Ercole & Ciotti 1998).The second code employed is ZEUS-2D, a widely used, welltested scheme developed by M. Norman and collaboratorsat LCSA (Stone & Norman 1992). We always found consis-tent results among the codes, as expected from the numer-ous hydrodynamical tests performed with the Bologna code(Brighenti 1992).
We solve the usual hydrodynamical equations, withthe addition of a mass source term and a thermal energysource term; the hot gas injected expands to form the star-burst wind with the appropriate mechanical luminosity Linp.These equations are described in details in, e.g., Brighenti& D’Ercole (1994). The (constant) mass and energy sourceterms are given respectively by α = M/V and αǫ. Here Vis the volume of the source region, chosen to be a sphere ofradius=50 pc, centered at (R, z) = (0, 0), and ǫ = Linp/M .To keep track of the gas lost by the stars formed in thestarburst (the ejecta), we passively advect it solving an an-cillary continuity equation for the ejecta density ρej. Boththe codes used spread shocks over 3-4 zones and contactdiscontinuities over 4-10 zones.
In our models the angular momentum is treated in afully consistent way (see Stone & Norman 1992 for thedetails about the resolution of the angular momentumequation). Thus, contrary to some of the previous studies(Tomisaka & Ikeucki 1988, Tomisaka & Bregman 1993), wedo not use a reduced gravitational force to mimic the rota-tional support of the ISM.
To take into account the thermal conduction (modelBCOND) we adopt the operator splitting method. We iso-late the heat diffusion term in the energy equation and solvethe heat transport equation, alternatively along the z and Rdirection separately, through the Crank-Nicholson methodwhich is unconditionally stable and second order accurate.The system of implicit finite difference equations is solvedaccording to the two-stage recursion procedure (e.g. Rich-meyer and Morton 1967). Following Cowie & McKee (1977),we adopt saturated fluxes to avoid unphysical heat transportin presence of steep temperature gradients.
We ran the models on a cylindrical grid (coordinates Rand z), assuming axial symmetry. We use reflecting bound-ary conditions along the axes and outflow boundary condi-tions at the grid edges. To better resolve the central region,
Galactic Winds and Circulation of the ISM in Dwarf Galaxies 5
the grid is unevenly spaced, with the zone width increas-ing from the center to large radii. Specifically, in the stan-dard model (STD+SB2), the grid extends in both the R-direction and z-direction from 0 to 25 kpc. The first zone is∆R = ∆z = 10 pc wide, and the size ratio between adjacentzones is 1.00747.
For the other models we use different grid spacing. Formodel SB1 (§4.1) the inner grid size is 3 pc and the sizeratio is 1.00717. For model B and BCOND the central zoneis only 2 pc wide and the size ratio between adiacent zonesis 1.01.
The parameters used in the models and other charac-teristic quantities are summarized in Table 1.
3 THE STANDARD MODEL (STD+SB2)
3.1 The dynamics of the ISM
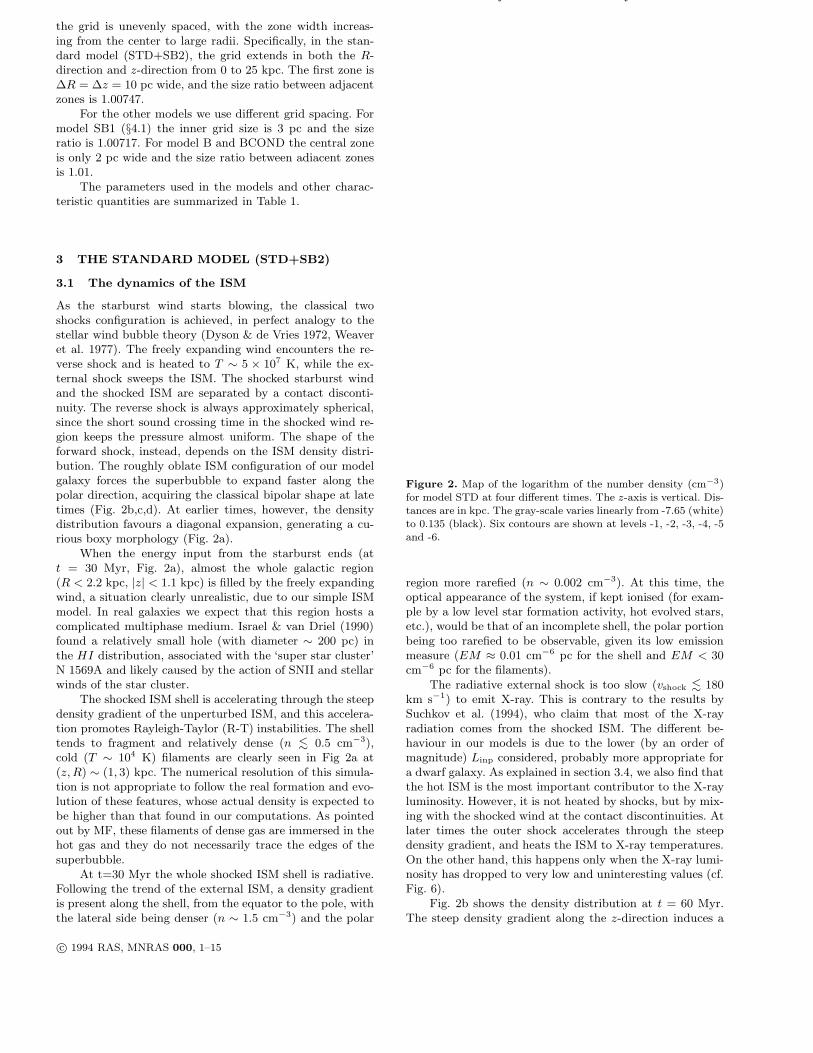
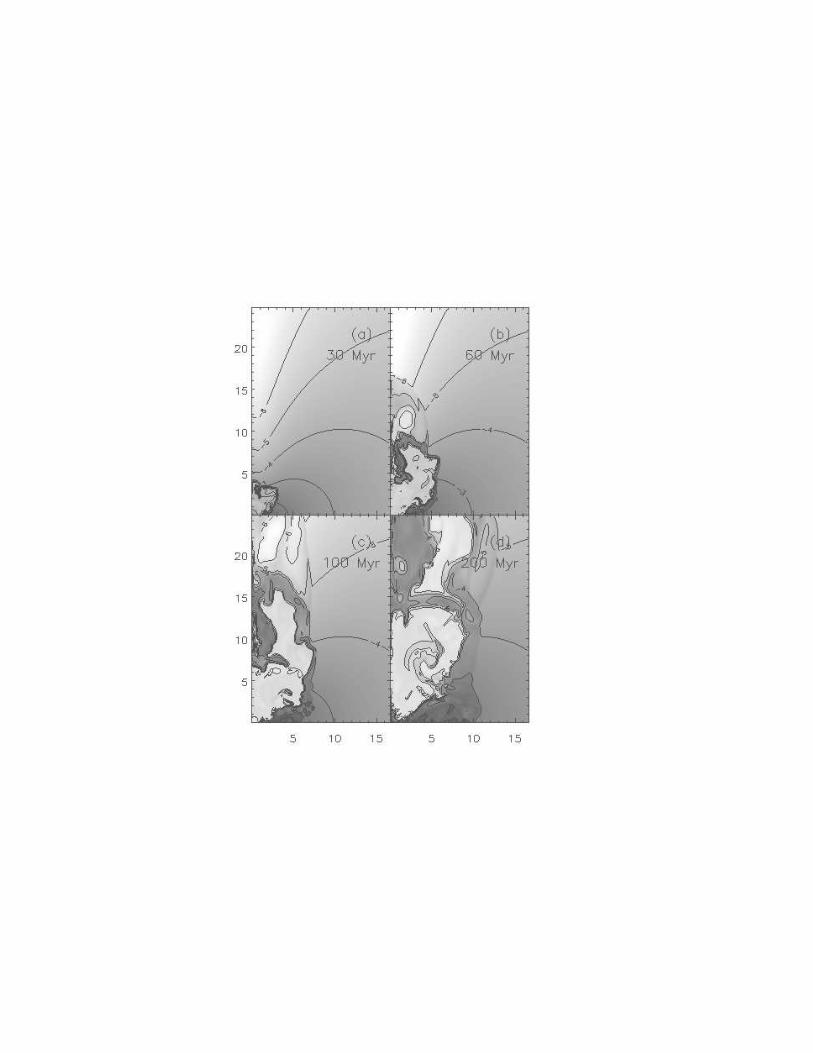
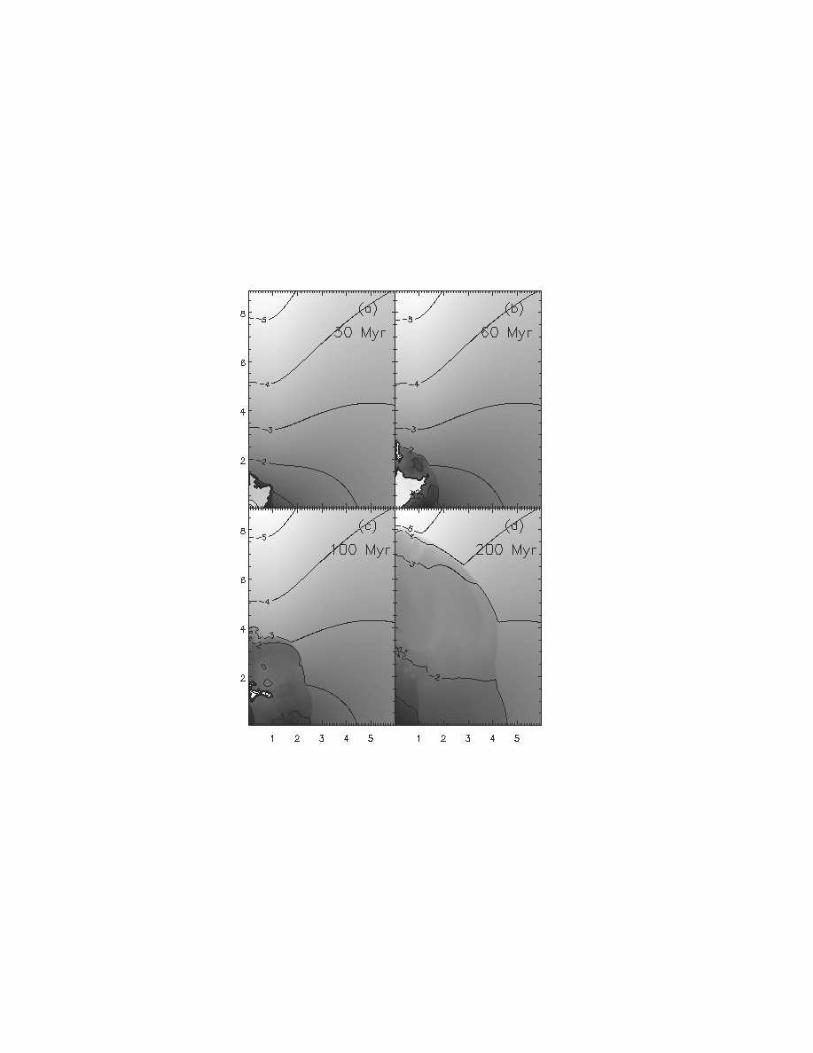
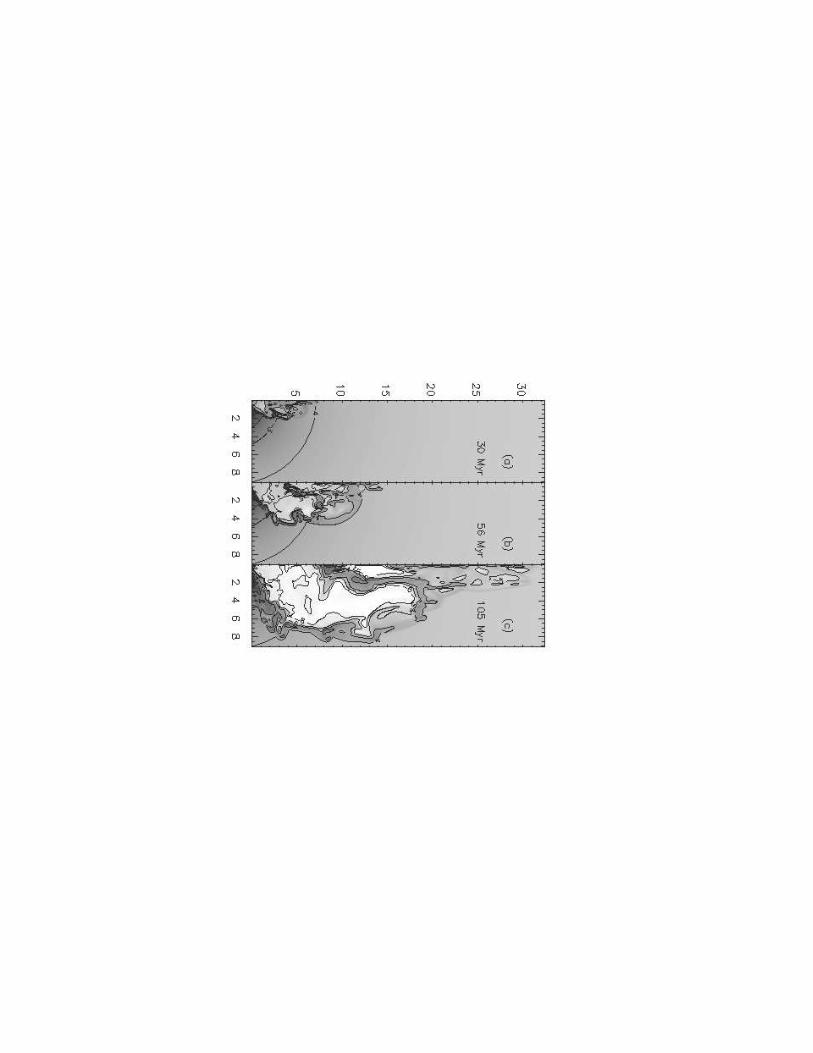
As the starburst wind starts blowing, the classical twoshocks configuration is achieved, in perfect analogy to thestellar wind bubble theory (Dyson & de Vries 1972, Weaveret al. 1977). The freely expanding wind encounters the re-verse shock and is heated to T ∼ 5 × 10⁷ K, while the ex-ternal shock sweeps the ISM. The shocked starburst windand the shocked ISM are separated by a contact disconti-nuity. The reverse shock is always approximately spherical,since the short sound crossing time in the shocked wind re-gion keeps the pressure almost uniform. The shape of theforward shock, instead, depends on the ISM density distri-bution. The roughly oblate ISM configuration of our modelgalaxy forces the superbubble to expand faster along thepolar direction, acquiring the classical bipolar shape at latetimes (Fig. 2b,c,d). At earlier times, however, the densitydistribution favours a diagonal expansion, generating a cu-rious boxy morphology (Fig. 2a).
When the energy input from the starburst ends (att = 30 Myr, Fig. 2a), almost the whole galactic region(R < 2.2 kpc, |z| < 1.1 kpc) is filled by the freely expandingwind, a situation clearly unrealistic, due to our simple ISMmodel. In real galaxies we expect that this region hosts acomplicated multiphase medium. Israel & van Driel (1990)found a relatively small hole (with diameter ∼ 200 pc) inthe HI distribution, associated with the ‘super star cluster’N 1569A and likely caused by the action of SNII and stellarwinds of the star cluster.
The shocked ISM shell is accelerating through the steepdensity gradient of the unperturbed ISM, and this accelera-tion promotes Rayleigh-Taylor (R-T) instabilities. The shelltends to fragment and relatively dense (n ∼
< 0.5 cm−3),cold (T ∼ 104 K) filaments are clearly seen in Fig 2a at(z,R) ∼ (1, 3) kpc. The numerical resolution of this simula-tion is not appropriate to follow the real formation and evo-lution of these features, whose actual density is expected tobe higher than that found in our computations. As pointedout by MF, these filaments of dense gas are immersed in thehot gas and they do not necessarily trace the edges of thesuperbubble.
At t=30 Myr the whole shocked ISM shell is radiative.Following the trend of the external ISM, a density gradientis present along the shell, from the equator to the pole, withthe lateral side being denser (n ∼ 1.5 cm−3) and the polar
Figure 2. Map of the logarithm of the number density (cm−3)for model STD at four different times. The z-axis is vertical. Dis-tances are in kpc. The gray-scale varies linearly from -7.65 (white)to 0.135 (black). Six contours are shown at levels -1, -2, -3, -4, -5and -6.
region more rarefied (n ∼ 0.002 cm−3). At this time, theoptical appearance of the system, if kept ionised (for exam-ple by a low level star formation activity, hot evolved stars,etc.), would be that of an incomplete shell, the polar portionbeing too rarefied to be observable, given its low emissionmeasure (EM ≈ 0.01 cm−6 pc for the shell and EM < 30cm−6 pc for the filaments).
The radiative external shock is too slow (vshock ∼< 180
km s−1) to emit X-ray. This is contrary to the results bySuchkov et al. (1994), who claim that most of the X-rayradiation comes from the shocked ISM. The different be-haviour in our models is due to the lower (by an order ofmagnitude) Linp considered, probably more appropriate fora dwarf galaxy. As explained in section 3.4, we also find thatthe hot ISM is the most important contributor to the X-rayluminosity. However, it is not heated by shocks, but by mix-ing with the shocked wind at the contact discontinuities. Atlater times the outer shock accelerates through the steepdensity gradient, and heats the ISM to X-ray temperatures.On the other hand, this happens only when the X-ray lumi-nosity has dropped to very low and uninteresting values (cf.Fig. 6).
Fig. 2b shows the density distribution at t = 60 Myr.The steep density gradient along the z-direction induces a
radiative-adiabatic transition of the polar portion of the ex-ternal shock. The cold filaments are slowly moving forward,and their density decreases to maintain the pressure equilib-rium with the expanding hot gas; now the densest filamentshave n ∼ 0.04 cm−3.
The shell is increasingly thicker with time. In fact, whilethe outer edge is still expanding, with v ∼ 25 km s−1, theinner edge of the shell near the equatorial plane is alreadyreceding toward the center with a velocity v ∼ 10 km s−1.This backward motion, due to the drop of the pressure insidethe expanding hot bubble, will eventually cause the collapseof the cold gas back inside the galactic region, as evident inFig. 2d (see also MF). The details of the collapse are shownin Fig. 3 and described below.
Fig. 2c and 2d show the density at 100 and 200 Myr re-spectively. The external shock assumes a prounounced cylin-drical shape because of the collimating effect of the low den-sity region around the z-axis (section 2.1). The polar shockcrossed the numerical grid edge (at z = 25 kpc); however,being the motion supersonic, the numerical noise generatedat the grid boundary does not propagate back. Moreover,given the very low densities in that region, the amount ofgas lost from the grid is completely neglibile.
The temperature of the hot, X-ray emitting gas de-creases with time. T ∼ 5 × 10⁷ K during the active energyinjection phase (t ∼
< 30 Myr). At later times, radiative lossesand especially expansion lower the temperature (T ∼
< 107 Kat 60 Myr; T ∼
< 2 × 10⁶ K at 100 Myr; T ∼< 106 K at 200
Myr). ASCA observations of NGC 1569 (Della Ceca et al1996) indicate that the diffuse X-ray emission comes from a(luminosity weighted) T ≈ 8×10⁶ K gas. We note, however,that the temperature inferred from simple fits to observedX-ray spectra may be a poor estimate of the actual tem-perature (Strickland & Stevens 1998). We warn that all themodel temperature values quoted are mass weighted andmay not represent the “observable” ones.
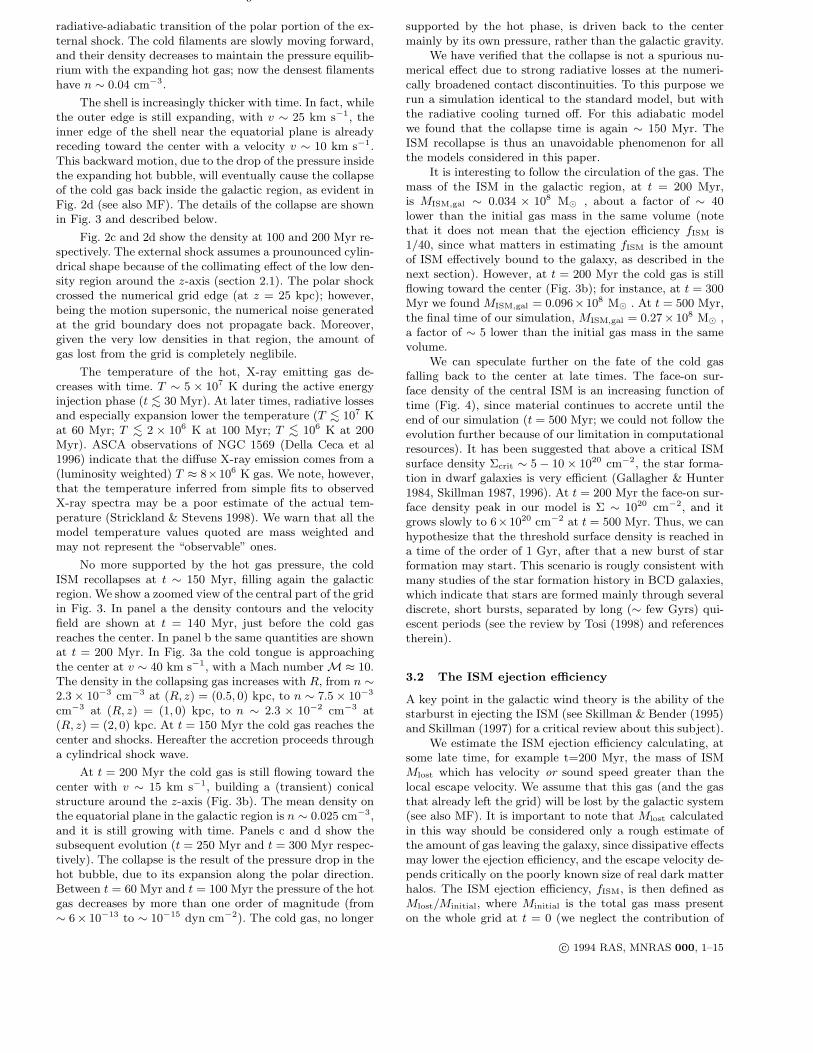
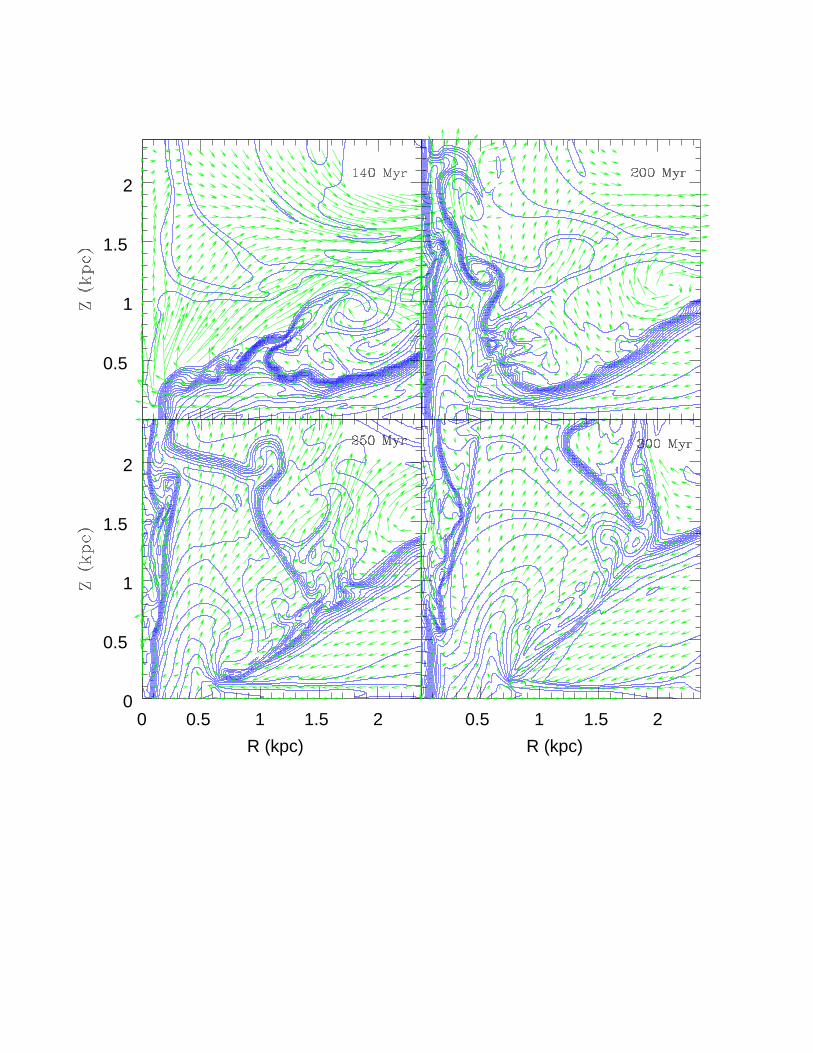
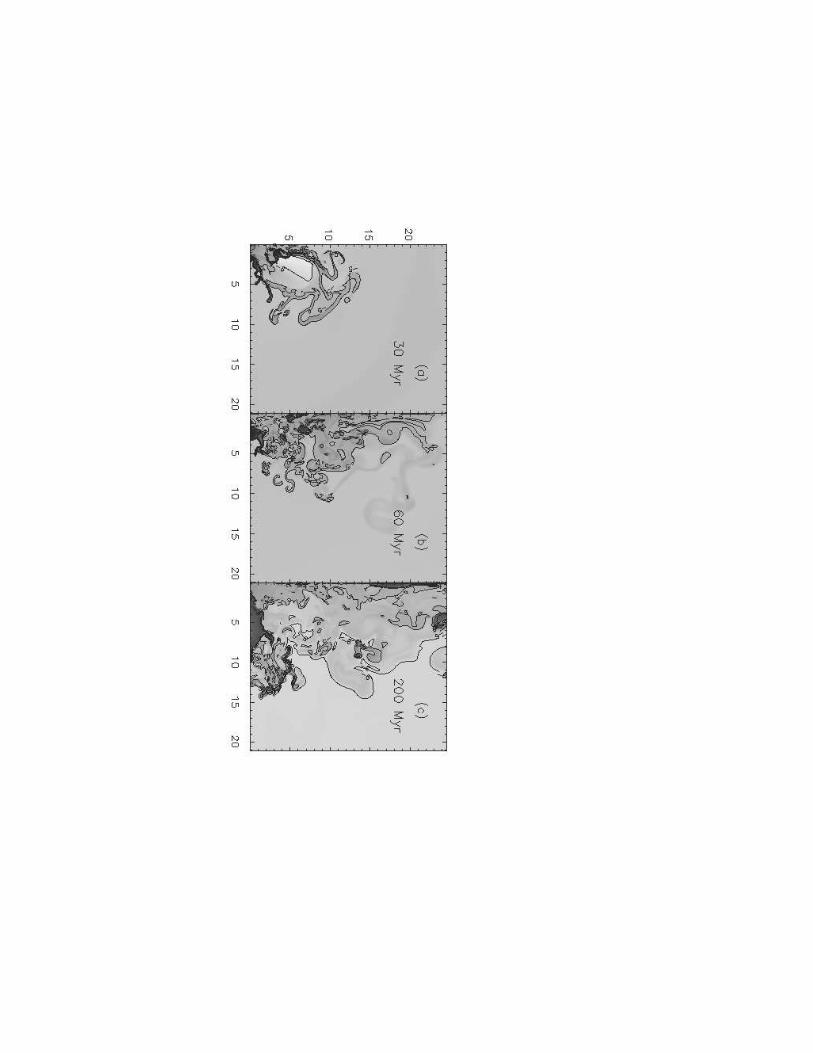
No more supported by the hot gas pressure, the coldISM recollapses at t ∼ 150 Myr, filling again the galacticregion. We show a zoomed view of the central part of the gridin Fig. 3. In panel a the density contours and the velocityfield are shown at t = 140 Myr, just before the cold gasreaches the center. In panel b the same quantities are shownat t = 200 Myr. In Fig. 3a the cold tongue is approachingthe center at v ∼ 40 km s−1, with a Mach number M ≈ 10.The density in the collapsing gas increases with R, from n ∼2.3× 10⁻³ cm−3 at (R, z) = (0.5, 0) kpc, to n ∼ 7.5× 10⁻³
cm−3 at (R, z) = (1, 0) kpc, to n ∼ 2.3 × 10⁻² cm−3 at(R, z) = (2, 0) kpc. At t = 150 Myr the cold gas reaches thecenter and shocks. Hereafter the accretion proceeds througha cylindrical shock wave.
At t = 200 Myr the cold gas is still flowing toward thecenter with v ∼ 15 km s−1, building a (transient) conicalstructure around the z-axis (Fig. 3b). The mean density onthe equatorial plane in the galactic region is n ∼ 0.025 cm−3,and it is still growing with time. Panels c and d show thesubsequent evolution (t = 250 Myr and t = 300 Myr respec-tively). The collapse is the result of the pressure drop in thehot bubble, due to its expansion along the polar direction.Between t = 60 Myr and t = 100 Myr the pressure of the hotgas decreases by more than one order of magnitude (from∼ 6× 10⁻¹³ to ∼ 10−15 dyn cm−2). The cold gas, no longer
supported by the hot phase, is driven back to the centermainly by its own pressure, rather than the galactic gravity.
We have verified that the collapse is not a spurious nu-merical effect due to strong radiative losses at the numeri-cally broadened contact discontinuities. To this purpose werun a simulation identical to the standard model, but withthe radiative cooling turned off. For this adiabatic modelwe found that the collapse time is again ∼ 150 Myr. TheISM recollapse is thus an unavoidable phenomenon for allthe models considered in this paper.
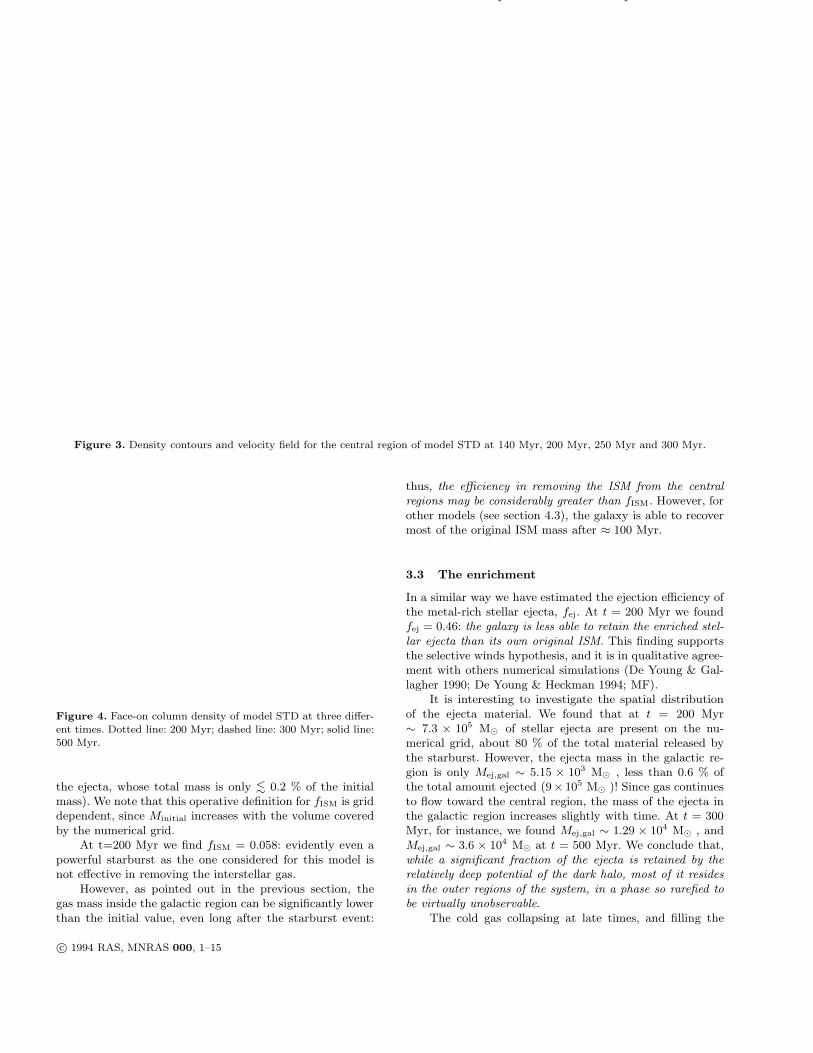
It is interesting to follow the circulation of the gas. Themass of the ISM in the galactic region, at t = 200 Myr,is MISM,gal ∼ 0.034 × 10⁸ M⊙ , about a factor of ∼ 40lower than the initial gas mass in the same volume (notethat it does not mean that the ejection efficiency fISM is1/40, since what matters in estimating fISM is the amountof ISM effectively bound to the galaxy, as described in thenext section). However, at t = 200 Myr the cold gas is stillflowing toward the center (Fig. 3b); for instance, at t = 300Myr we found MISM,gal = 0.096×10⁸ M⊙ . At t = 500 Myr,the final time of our simulation, MISM,gal = 0.27× 10⁸ M⊙ ,a factor of ∼ 5 lower than the initial gas mass in the samevolume.
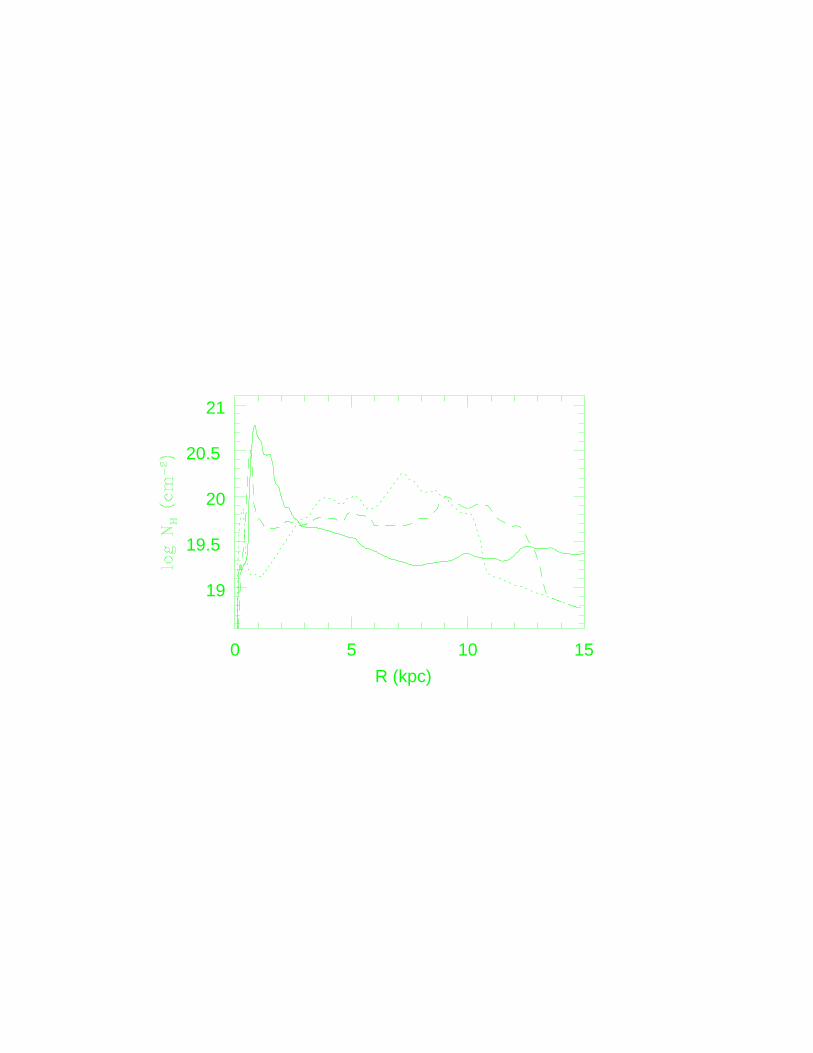
We can speculate further on the fate of the cold gasfalling back to the center at late times. The face-on sur-face density of the central ISM is an increasing function oftime (Fig. 4), since material continues to accrete until theend of our simulation (t = 500 Myr; we could not follow theevolution further because of our limitation in computationalresources). It has been suggested that above a critical ISMsurface density Σcrit ∼ 5− 10× 1020 cm−2, the star forma-tion in dwarf galaxies is very efficient (Gallagher & Hunter1984, Skillman 1987, 1996). At t = 200 Myr the face-on sur-face density peak in our model is Σ ∼ 1020 cm−2, and itgrows slowly to 6×1020 cm−2 at t = 500 Myr. Thus, we canhypothesize that the threshold surface density is reached ina time of the order of 1 Gyr, after that a new burst of starformation may start. This scenario is rougly consistent withmany studies of the star formation history in BCD galaxies,which indicate that stars are formed mainly through severaldiscrete, short bursts, separated by long (∼ few Gyrs) qui-escent periods (see the review by Tosi (1998) and referencestherein).
3.2 The ISM ejection efficiency
A key point in the galactic wind theory is the ability of thestarburst in ejecting the ISM (see Skillman & Bender (1995)and Skillman (1997) for a critical review about this subject).
We estimate the ISM ejection efficiency calculating, atsome late time, for example t=200 Myr, the mass of ISMMlost which has velocity or sound speed greater than thelocal escape velocity. We assume that this gas (and the gasthat already left the grid) will be lost by the galactic system(see also MF). It is important to note that Mlost calculatedin this way should be considered only a rough estimate ofthe amount of gas leaving the galaxy, since dissipative effectsmay lower the ejection efficiency, and the escape velocity de-pends critically on the poorly known size of real dark matterhalos. The ISM ejection efficiency, fISM, is then defined asMlost/Minitial, where Minitial is the total gas mass presenton the whole grid at t = 0 (we neglect the contribution of
Galactic Winds and Circulation of the ISM in Dwarf Galaxies 7
Figure 3. Density contours and velocity field for the central region of model STD at 140 Myr, 200 Myr, 250 Myr and 300 Myr.
Figure 4. Face-on column density of model STD at three differ-ent times. Dotted line: 200 Myr; dashed line: 300 Myr; solid line:500 Myr.
the ejecta, whose total mass is only ∼< 0.2 % of the initial
mass). We note that this operative definition for fISM is griddependent, since Minitial increases with the volume coveredby the numerical grid.
At t=200 Myr we find fISM = 0.058: evidently even apowerful starburst as the one considered for this model isnot effective in removing the interstellar gas.
However, as pointed out in the previous section, thegas mass inside the galactic region can be significantly lowerthan the initial value, even long after the starburst event:
thus, the efficiency in removing the ISM from the central
regions may be considerably greater than fISM. However, forother models (see section 4.3), the galaxy is able to recovermost of the original ISM mass after ≈ 100 Myr.
3.3 The enrichment
In a similar way we have estimated the ejection efficiency ofthe metal-rich stellar ejecta, fej. At t = 200 Myr we foundfej = 0.46: the galaxy is less able to retain the enriched stel-
lar ejecta than its own original ISM. This finding supportsthe selective winds hypothesis, and it is in qualitative agree-ment with others numerical simulations (De Young & Gal-lagher 1990; De Young & Heckman 1994; MF).
It is interesting to investigate the spatial distributionof the ejecta material. We found that at t = 200 Myr∼ 7.3 × 10⁵ M⊙ of stellar ejecta are present on the nu-merical grid, about 80 % of the total material released bythe starburst. However, the ejecta mass in the galactic re-gion is only Mej,gal ∼ 5.15 × 10³ M⊙ , less than 0.6 % ofthe total amount ejected (9× 10⁵ M⊙ )! Since gas continuesto flow toward the central region, the mass of the ejecta inthe galactic region increases slightly with time. At t = 300Myr, for instance, we found Mej,gal ∼ 1.29 × 10⁴ M⊙ , andMej,gal ∼ 3.6 × 10⁴ M⊙ at t = 500 Myr. We conclude that,while a significant fraction of the ejecta is retained by the
relatively deep potential of the dark halo, most of it resides
in the outer regions of the system, in a phase so rarefied to
be virtually unobservable.The cold gas collapsing at late times, and filling the
galactic region, has been only slightly polluted by the stellarejecta. To characterize the pollution degree we introduce thelocal ejecta fraction as Z = ρej/ρ, where ρej is the density ofthe ejecta. The average ejecta fraction in the galactic region,at t = 200 Myr, defined as < Zgal >= Mej,gal/MISM,gal, isZ ∼ 1.4 × 10⁻³. The cold galactic ISM, probably the onlycomponent detectable at late times because of its relativelyhigh density, shows only a small degree of enrichment.
We can estimate the increase in the metal abundancegenerated by the starburst from the total number of SNII,which we assume to be the only source of metals. The ironproduction and circulation is particularly worthwhile, be-cause the metallicity estimated through X-ray spectra of thehot gas phase (T ∼ 107 K) are especially sensitive to ironthrough the Fe-L complex at ∼ 1 keV. For the sake of sim-plicity we shall neglect the iron produced by SNIa, whoseiron release timescale is believed to be of the order of oneGyr (Matteucci & Greggio 1986), a time much longer thanthose considered in this paper.
In section 2.2 we estimated a total number of SNII ∼4000 and ∼ 40000 for SB1 and SB2 respectively (adoptingthe same IMF as in LH). The yields of metals from SNIIare rather uncertain, especially for iron and oxygen, becauseof the complications in the late evolution of massive starsand nuclear reactions rates. A compilation of IMF averagedyields, i.e., the mean ejected mass of a given element perSN, can be found in Loewenstein and Mushotzky (1996).Given the approximate nature of the calculations presentedin this paper, we simply adopt < yFe >= 0.1 M⊙ and <yO >= 1 M⊙ as reasonable values for averaged iron andoxygen yields. We assume that the metals are well mixedwithin the ejecta, whose abundances (by mass and relativeto H) are ZFe,ej ∼ 3.4 ZFe,⊙ and ZO,ej ∼ 4.6 ZO,⊙, wherewe adopt the meteoritic solar abundances from Anders &Grevesse (1989).
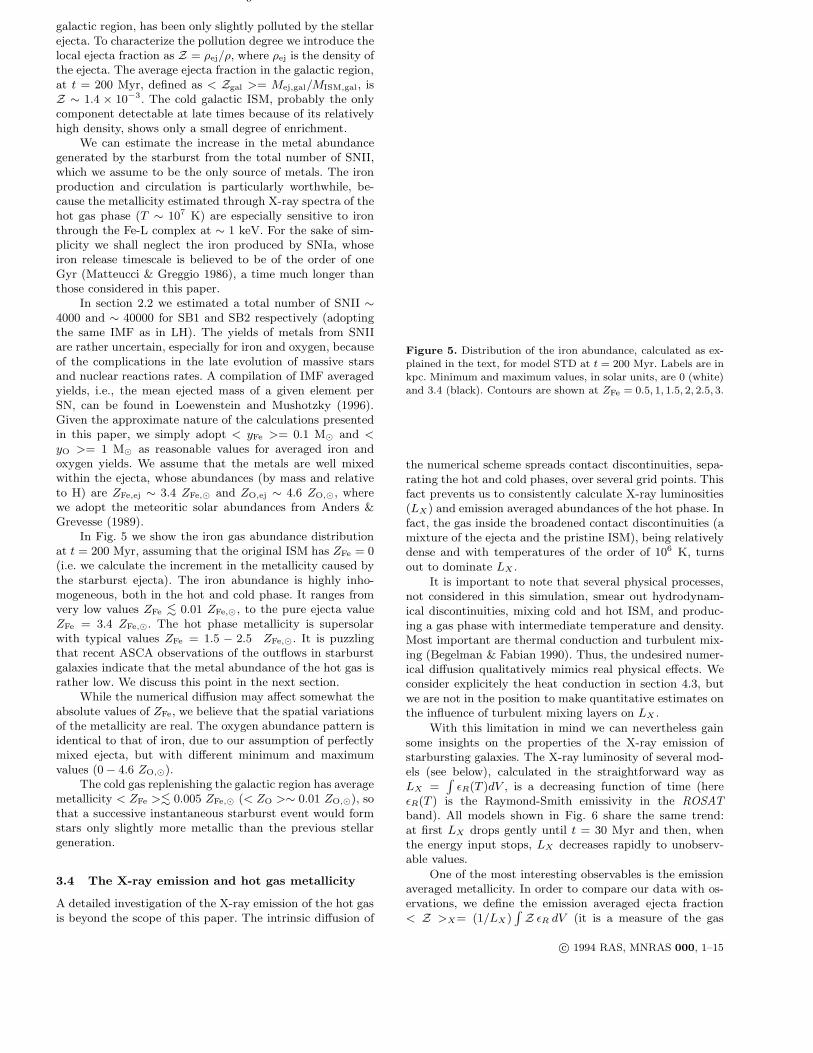
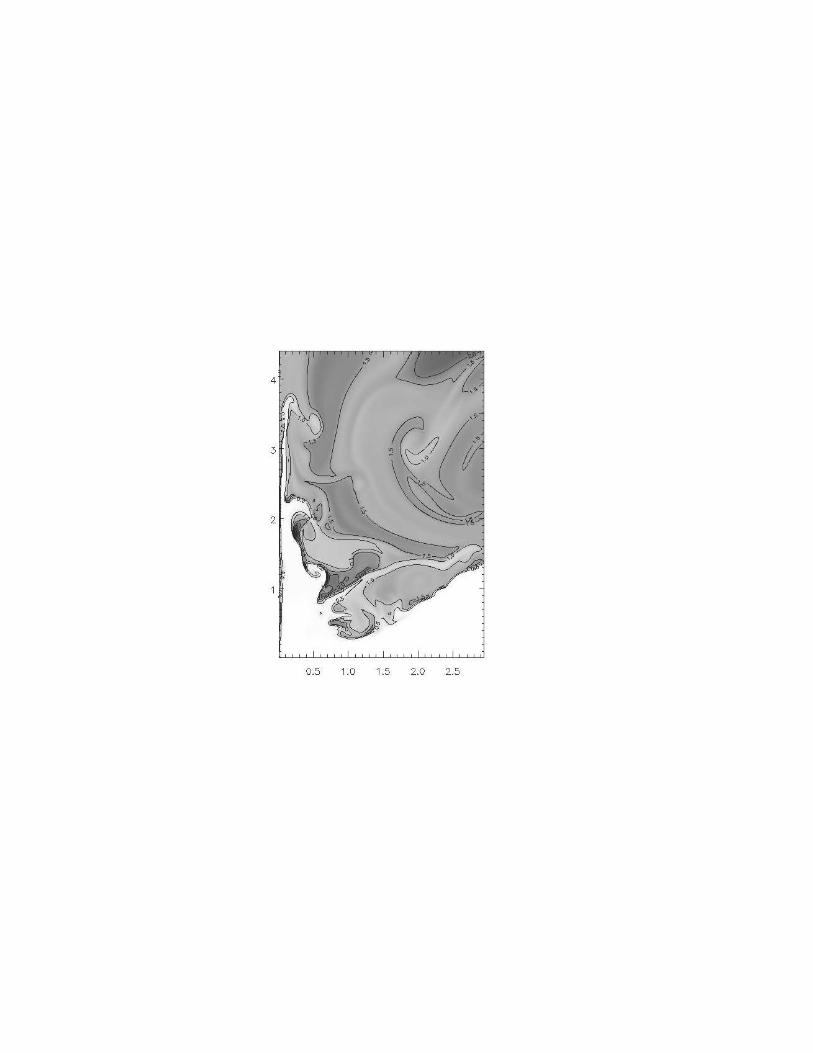
In Fig. 5 we show the iron gas abundance distributionat t = 200 Myr, assuming that the original ISM has ZFe = 0(i.e. we calculate the increment in the metallicity caused bythe starburst ejecta). The iron abundance is highly inho-mogeneous, both in the hot and cold phase. It ranges fromvery low values ZFe ∼
< 0.01 ZFe,⊙, to the pure ejecta valueZFe = 3.4 ZFe,⊙. The hot phase metallicity is supersolarwith typical values ZFe = 1.5 − 2.5 ZFe,⊙. It is puzzlingthat recent ASCA observations of the outflows in starburstgalaxies indicate that the metal abundance of the hot gas israther low. We discuss this point in the next section.
While the numerical diffusion may affect somewhat theabsolute values of ZFe, we believe that the spatial variationsof the metallicity are real. The oxygen abundance pattern isidentical to that of iron, due to our assumption of perfectlymixed ejecta, but with different minimum and maximumvalues (0− 4.6 ZO,⊙).
The cold gas replenishing the galactic region has averagemetallicity < ZFe >∼
< 0.005 ZFe,⊙ (< ZO >∼ 0.01 ZO,⊙), sothat a successive instantaneous starburst event would formstars only slightly more metallic than the previous stellargeneration.
3.4 The X-ray emission and hot gas metallicity
A detailed investigation of the X-ray emission of the hot gasis beyond the scope of this paper. The intrinsic diffusion of
Figure 5. Distribution of the iron abundance, calculated as ex-plained in the text, for model STD at t = 200 Myr. Labels are inkpc. Minimum and maximum values, in solar units, are 0 (white)and 3.4 (black). Contours are shown at ZFe = 0.5, 1, 1.5, 2, 2.5, 3.
the numerical scheme spreads contact discontinuities, sepa-rating the hot and cold phases, over several grid points. Thisfact prevents us to consistently calculate X-ray luminosities(LX) and emission averaged abundances of the hot phase. Infact, the gas inside the broadened contact discontinuities (amixture of the ejecta and the pristine ISM), being relativelydense and with temperatures of the order of 106 K, turnsout to dominate LX .
It is important to note that several physical processes,not considered in this simulation, smear out hydrodynam-ical discontinuities, mixing cold and hot ISM, and produc-ing a gas phase with intermediate temperature and density.Most important are thermal conduction and turbulent mix-ing (Begelman & Fabian 1990). Thus, the undesired numer-ical diffusion qualitatively mimics real physical effects. Weconsider explicitely the heat conduction in section 4.3, butwe are not in the position to make quantitative estimates onthe influence of turbulent mixing layers on LX .
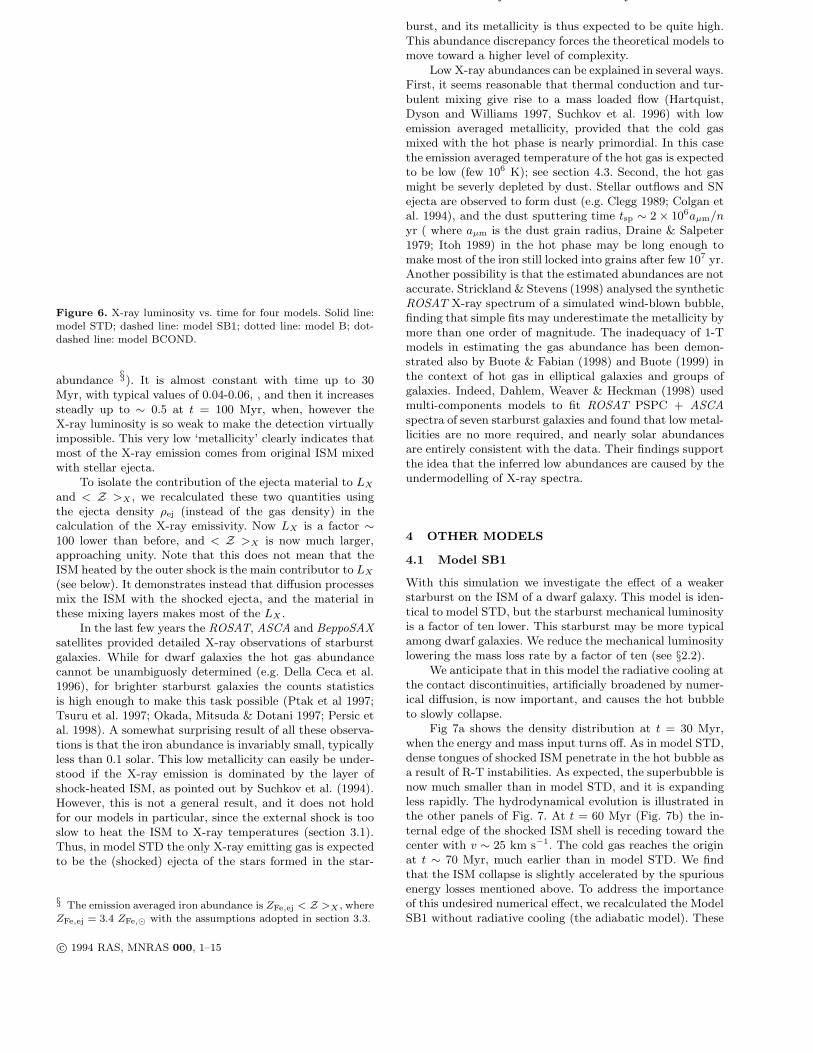
With this limitation in mind we can nevertheless gainsome insights on the properties of the X-ray emission ofstarbursting galaxies. The X-ray luminosity of several mod-els (see below), calculated in the straightforward way asLX =
∫
ǫR(T )dV , is a decreasing function of time (hereǫR(T ) is the Raymond-Smith emissivity in the ROSAT
band). All models shown in Fig. 6 share the same trend:at first LX drops gently until t = 30 Myr and then, whenthe energy input stops, LX decreases rapidly to unobserv-able values.
One of the most interesting observables is the emissionaveraged metallicity. In order to compare our data with os-ervations, we define the emission averaged ejecta fraction< Z >X= (1/LX)
Galactic Winds and Circulation of the ISM in Dwarf Galaxies 9
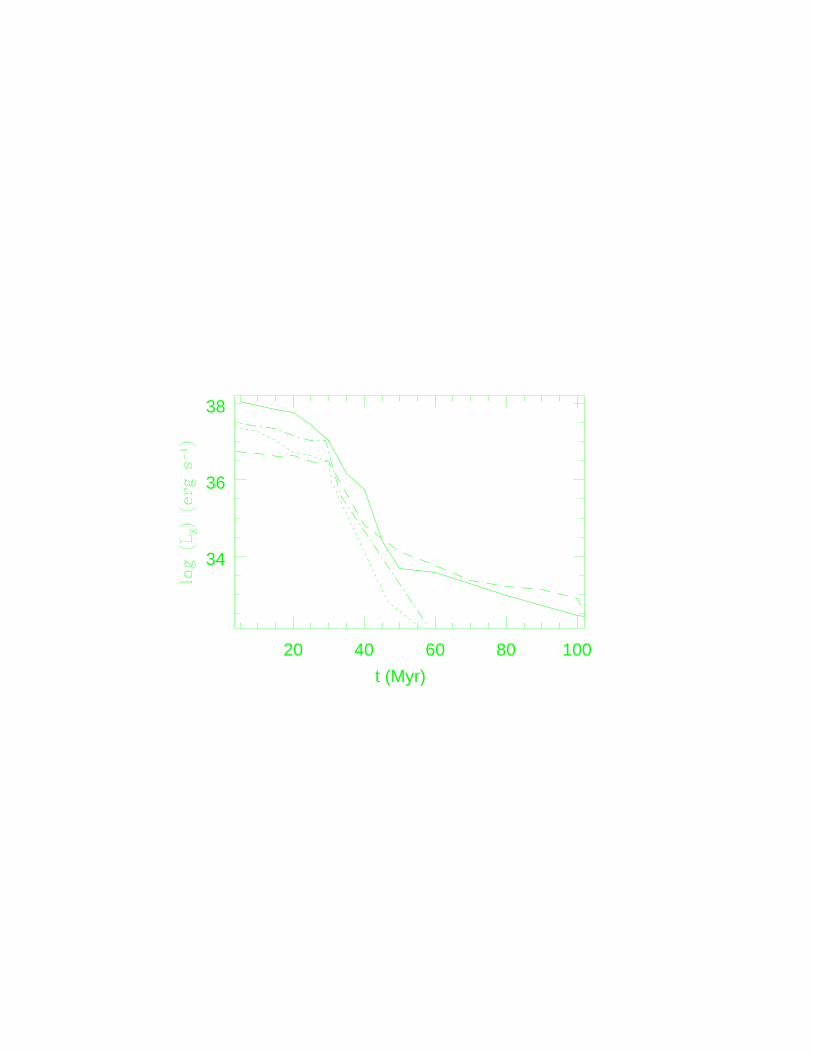
Figure 6. X-ray luminosity vs. time for four models. Solid line:model STD; dashed line: model SB1; dotted line: model B; dot-dashed line: model BCOND.
abundance §). It is almost constant with time up to 30Myr, with typical values of 0.04-0.06, , and then it increasessteadly up to ∼ 0.5 at t = 100 Myr, when, however theX-ray luminosity is so weak to make the detection virtuallyimpossible. This very low ‘metallicity’ clearly indicates thatmost of the X-ray emission comes from original ISM mixedwith stellar ejecta.
To isolate the contribution of the ejecta material to LX
and < Z >X , we recalculated these two quantities usingthe ejecta density ρej (instead of the gas density) in thecalculation of the X-ray emissivity. Now LX is a factor ∼100 lower than before, and < Z >X is now much larger,approaching unity. Note that this does not mean that theISM heated by the outer shock is the main contributor to LX
(see below). It demonstrates instead that diffusion processesmix the ISM with the shocked ejecta, and the material inthese mixing layers makes most of the LX .
In the last few years the ROSAT, ASCA and BeppoSAX
satellites provided detailed X-ray observations of starburstgalaxies. While for dwarf galaxies the hot gas abundancecannot be unambiguosly determined (e.g. Della Ceca et al.1996), for brighter starburst galaxies the counts statisticsis high enough to make this task possible (Ptak et al 1997;Tsuru et al. 1997; Okada, Mitsuda & Dotani 1997; Persic etal. 1998). A somewhat surprising result of all these observa-tions is that the iron abundance is invariably small, typicallyless than 0.1 solar. This low metallicity can easily be under-stood if the X-ray emission is dominated by the layer ofshock-heated ISM, as pointed out by Suchkov et al. (1994).However, this is not a general result, and it does not holdfor our models in particular, since the external shock is tooslow to heat the ISM to X-ray temperatures (section 3.1).Thus, in model STD the only X-ray emitting gas is expectedto be the (shocked) ejecta of the stars formed in the star-
§ The emission averaged iron abundance is ZFe,ej < Z >X , whereZFe,ej = 3.4 ZFe,⊙ with the assumptions adopted in section 3.3.
burst, and its metallicity is thus expected to be quite high.This abundance discrepancy forces the theoretical models tomove toward a higher level of complexity.
Low X-ray abundances can be explained in several ways.First, it seems reasonable that thermal conduction and tur-bulent mixing give rise to a mass loaded flow (Hartquist,Dyson and Williams 1997, Suchkov et al. 1996) with lowemission averaged metallicity, provided that the cold gasmixed with the hot phase is nearly primordial. In this casethe emission averaged temperature of the hot gas is expectedto be low (few 106 K); see section 4.3. Second, the hot gasmight be severly depleted by dust. Stellar outflows and SNejecta are observed to form dust (e.g. Clegg 1989; Colgan etal. 1994), and the dust sputtering time tsp ∼ 2× 10⁶aµm/nyr ( where aµm is the dust grain radius, Draine & Salpeter1979; Itoh 1989) in the hot phase may be long enough tomake most of the iron still locked into grains after few 107 yr.Another possibility is that the estimated abundances are notaccurate. Strickland & Stevens (1998) analysed the syntheticROSAT X-ray spectrum of a simulated wind-blown bubble,finding that simple fits may underestimate the metallicity bymore than one order of magnitude. The inadequacy of 1-Tmodels in estimating the gas abundance has been demon-strated also by Buote & Fabian (1998) and Buote (1999) inthe context of hot gas in elliptical galaxies and groups ofgalaxies. Indeed, Dahlem, Weaver & Heckman (1998) usedmulti-components models to fit ROSAT PSPC + ASCA
spectra of seven starburst galaxies and found that low metal-licities are no more required, and nearly solar abundancesare entirely consistent with the data. Their findings supportthe idea that the inferred low abundances are caused by theundermodelling of X-ray spectra.
4 OTHER MODELS
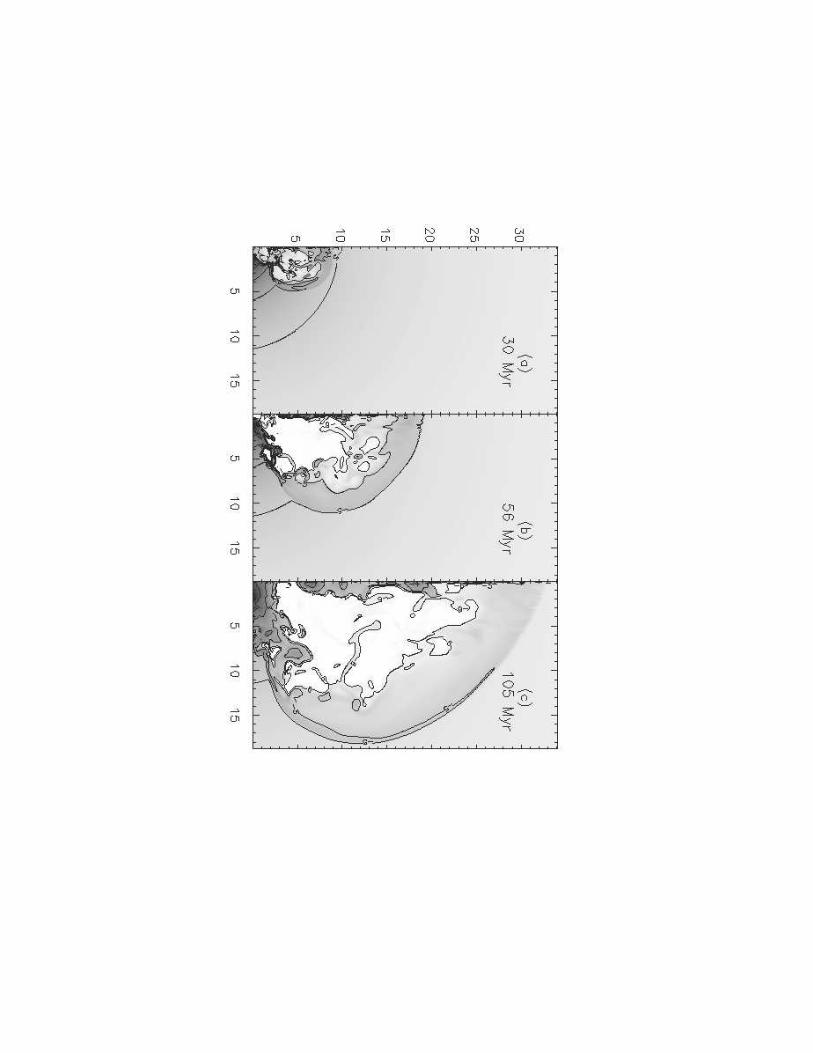
4.1 Model SB1
With this simulation we investigate the effect of a weakerstarburst on the ISM of a dwarf galaxy. This model is iden-tical to model STD, but the starburst mechanical luminosityis a factor of ten lower. This starburst may be more typicalamong dwarf galaxies. We reduce the mechanical luminositylowering the mass loss rate by a factor of ten (see §2.2).
We anticipate that in this model the radiative cooling atthe contact discontinuities, artificially broadened by numer-ical diffusion, is now important, and causes the hot bubbleto slowly collapse.
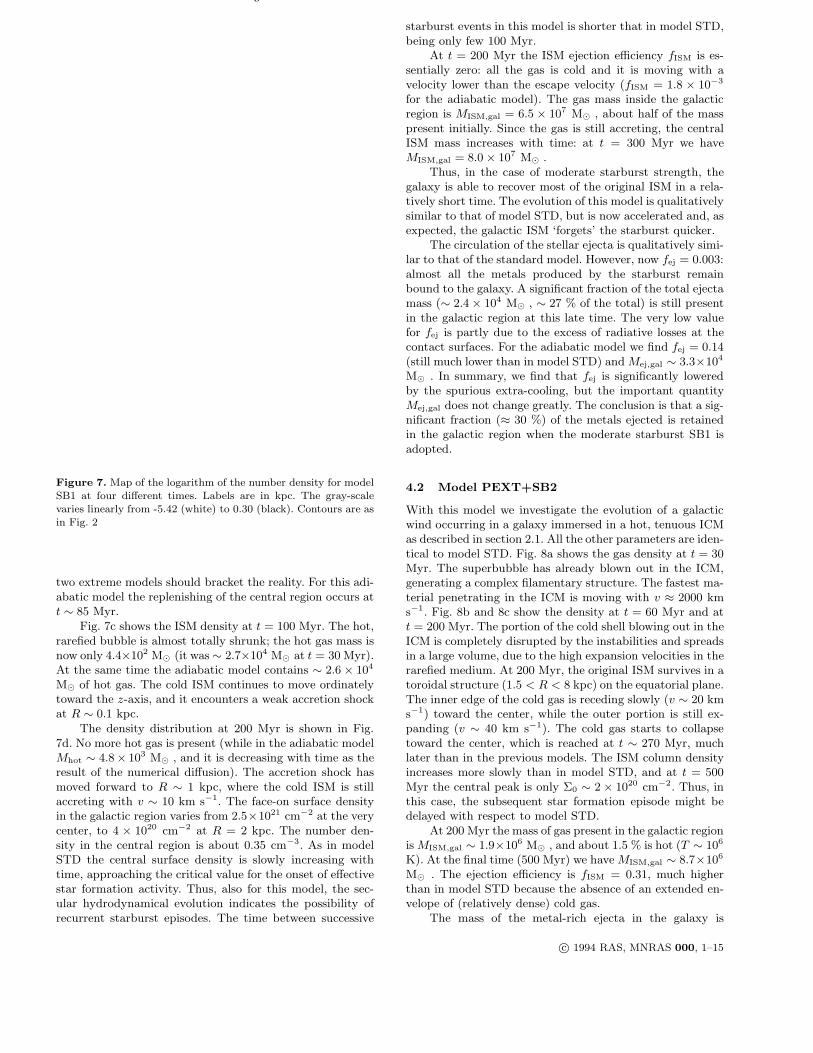
Fig 7a shows the density distribution at t = 30 Myr,when the energy and mass input turns off. As in model STD,dense tongues of shocked ISM penetrate in the hot bubble asa result of R-T instabilities. As expected, the superbubble isnow much smaller than in model STD, and it is expandingless rapidly. The hydrodynamical evolution is illustrated inthe other panels of Fig. 7. At t = 60 Myr (Fig. 7b) the in-ternal edge of the shocked ISM shell is receding toward thecenter with v ∼ 25 km s−1. The cold gas reaches the originat t ∼ 70 Myr, much earlier than in model STD. We findthat the ISM collapse is slightly accelerated by the spuriousenergy losses mentioned above. To address the importanceof this undesired numerical effect, we recalculated the ModelSB1 without radiative cooling (the adiabatic model). These
Figure 7. Map of the logarithm of the number density for modelSB1 at four different times. Labels are in kpc. The gray-scalevaries linearly from -5.42 (white) to 0.30 (black). Contours are asin Fig. 2
two extreme models should bracket the reality. For this adi-abatic model the replenishing of the central region occurs att ∼ 85 Myr.
Fig. 7c shows the ISM density at t = 100 Myr. The hot,rarefied bubble is almost totally shrunk; the hot gas mass isnow only 4.4×10² M⊙ (it was∼ 2.7×10⁴ M⊙ at t = 30 Myr).At the same time the adiabatic model contains ∼ 2.6× 10⁴
M⊙ of hot gas. The cold ISM continues to move ordinatelytoward the z-axis, and it encounters a weak accretion shockat R ∼ 0.1 kpc.
The density distribution at 200 Myr is shown in Fig.7d. No more hot gas is present (while in the adiabatic modelMhot ∼ 4.8× 10³ M⊙ , and it is decreasing with time as theresult of the numerical diffusion). The accretion shock hasmoved forward to R ∼ 1 kpc, where the cold ISM is stillaccreting with v ∼ 10 km s−1. The face-on surface densityin the galactic region varies from 2.5×1021 cm−2 at the verycenter, to 4 × 1020 cm−2 at R = 2 kpc. The number den-sity in the central region is about 0.35 cm−3. As in modelSTD the central surface density is slowly increasing withtime, approaching the critical value for the onset of effectivestar formation activity. Thus, also for this model, the sec-ular hydrodynamical evolution indicates the possibility ofrecurrent starburst episodes. The time between successive
starburst events in this model is shorter that in model STD,being only few 100 Myr.
At t = 200 Myr the ISM ejection efficiency fISM is es-sentially zero: all the gas is cold and it is moving with avelocity lower than the escape velocity (fISM = 1.8 × 10⁻³
for the adiabatic model). The gas mass inside the galacticregion is MISM,gal = 6.5 × 10⁷ M⊙ , about half of the masspresent initially. Since the gas is still accreting, the centralISM mass increases with time: at t = 300 Myr we haveMISM,gal = 8.0× 10⁷ M⊙ .
Thus, in the case of moderate starburst strength, thegalaxy is able to recover most of the original ISM in a rela-tively short time. The evolution of this model is qualitativelysimilar to that of model STD, but is now accelerated and, asexpected, the galactic ISM ‘forgets’ the starburst quicker.
The circulation of the stellar ejecta is qualitatively simi-lar to that of the standard model. However, now fej = 0.003:almost all the metals produced by the starburst remainbound to the galaxy. A significant fraction of the total ejectamass (∼ 2.4× 10⁴ M⊙ , ∼ 27 % of the total) is still presentin the galactic region at this late time. The very low valuefor fej is partly due to the excess of radiative losses at thecontact surfaces. For the adiabatic model we find fej = 0.14(still much lower than in model STD) and Mej,gal ∼ 3.3×10⁴
M⊙ . In summary, we find that fej is significantly loweredby the spurious extra-cooling, but the important quantityMej,gal does not change greatly. The conclusion is that a sig-nificant fraction (≈ 30 %) of the metals ejected is retainedin the galactic region when the moderate starburst SB1 isadopted.
4.2 Model PEXT+SB2
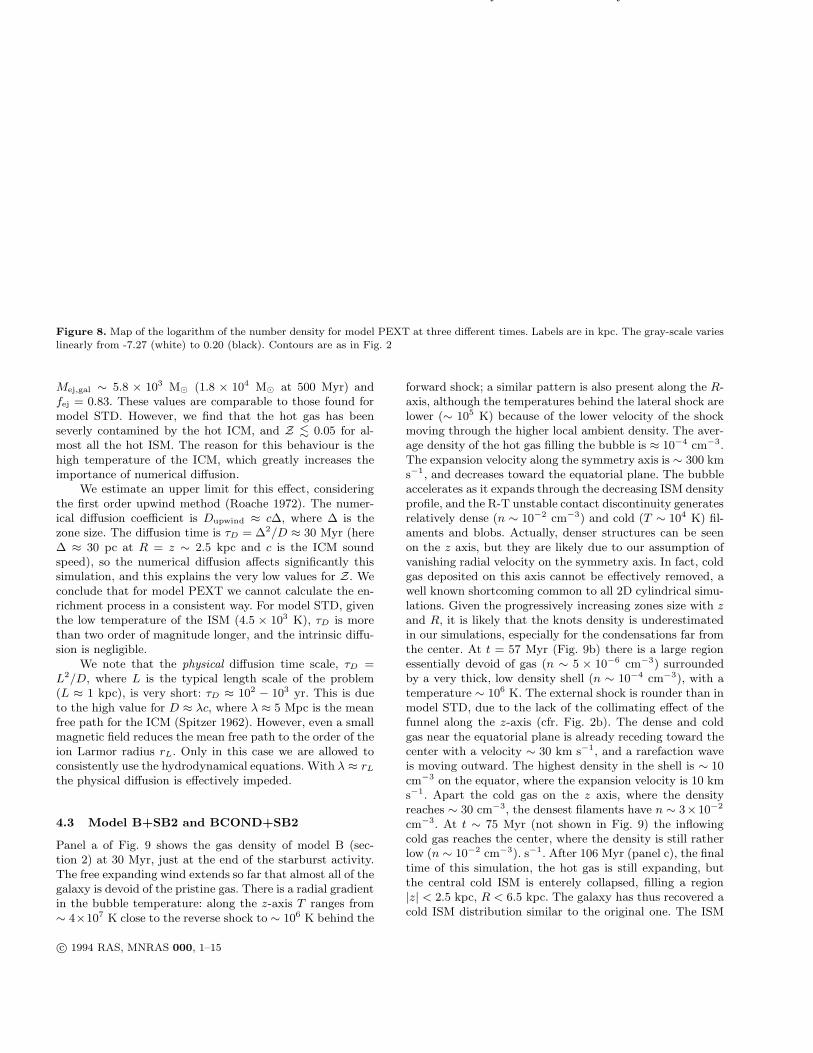
With this model we investigate the evolution of a galacticwind occurring in a galaxy immersed in a hot, tenuous ICMas described in section 2.1. All the other parameters are iden-tical to model STD. Fig. 8a shows the gas density at t = 30Myr. The superbubble has already blown out in the ICM,generating a complex filamentary structure. The fastest ma-terial penetrating in the ICM is moving with v ≈ 2000 kms−1. Fig. 8b and 8c show the density at t = 60 Myr and att = 200 Myr. The portion of the cold shell blowing out in theICM is completely disrupted by the instabilities and spreadsin a large volume, due to the high expansion velocities in therarefied medium. At 200 Myr, the original ISM survives in atoroidal structure (1.5 < R < 8 kpc) on the equatorial plane.The inner edge of the cold gas is receding slowly (v ∼ 20 kms−1) toward the center, while the outer portion is still ex-panding (v ∼ 40 km s−1). The cold gas starts to collapsetoward the center, which is reached at t ∼ 270 Myr, muchlater than in the previous models. The ISM column densityincreases more slowly than in model STD, and at t = 500Myr the central peak is only Σ0 ∼ 2× 1020 cm−2. Thus, inthis case, the subsequent star formation episode might bedelayed with respect to model STD.
At 200 Myr the mass of gas present in the galactic regionis MISM,gal ∼ 1.9×10⁶ M⊙ , and about 1.5 % is hot (T ∼ 106
K). At the final time (500 Myr) we have MISM,gal ∼ 8.7×10⁶
M⊙ . The ejection efficiency is fISM = 0.31, much higherthan in model STD because the absence of an extended en-velope of (relatively dense) cold gas.
The mass of the metal-rich ejecta in the galaxy is
Galactic Winds and Circulation of the ISM in Dwarf Galaxies 11
Figure 8. Map of the logarithm of the number density for model PEXT at three different times. Labels are in kpc. The gray-scale varieslinearly from -7.27 (white) to 0.20 (black). Contours are as in Fig. 2
Mej,gal ∼ 5.8 × 10³ M⊙ (1.8 × 10⁴ M⊙ at 500 Myr) andfej = 0.83. These values are comparable to those found formodel STD. However, we find that the hot gas has beenseverly contamined by the hot ICM, and Z ∼
< 0.05 for al-most all the hot ISM. The reason for this behaviour is thehigh temperature of the ICM, which greatly increases theimportance of numerical diffusion.
We estimate an upper limit for this effect, consideringthe first order upwind method (Roache 1972). The numer-ical diffusion coefficient is Dupwind ≈ c∆, where ∆ is thezone size. The diffusion time is τD = ∆2/D ≈ 30 Myr (here∆ ≈ 30 pc at R = z ∼ 2.5 kpc and c is the ICM soundspeed), so the numerical diffusion affects significantly thissimulation, and this explains the very low values for Z. Weconclude that for model PEXT we cannot calculate the en-richment process in a consistent way. For model STD, giventhe low temperature of the ISM (4.5 × 10³ K), τD is morethan two order of magnitude longer, and the intrinsic diffu-sion is negligible.
We note that the physical diffusion time scale, τD =L2/D, where L is the typical length scale of the problem(L ≈ 1 kpc), is very short: τD ≈ 102 − 103 yr. This is dueto the high value for D ≈ λc, where λ ≈ 5 Mpc is the meanfree path for the ICM (Spitzer 1962). However, even a smallmagnetic field reduces the mean free path to the order of theion Larmor radius rL. Only in this case we are allowed toconsistently use the hydrodynamical equations. With λ ≈ rLthe physical diffusion is effectively impeded.
4.3 Model B+SB2 and BCOND+SB2
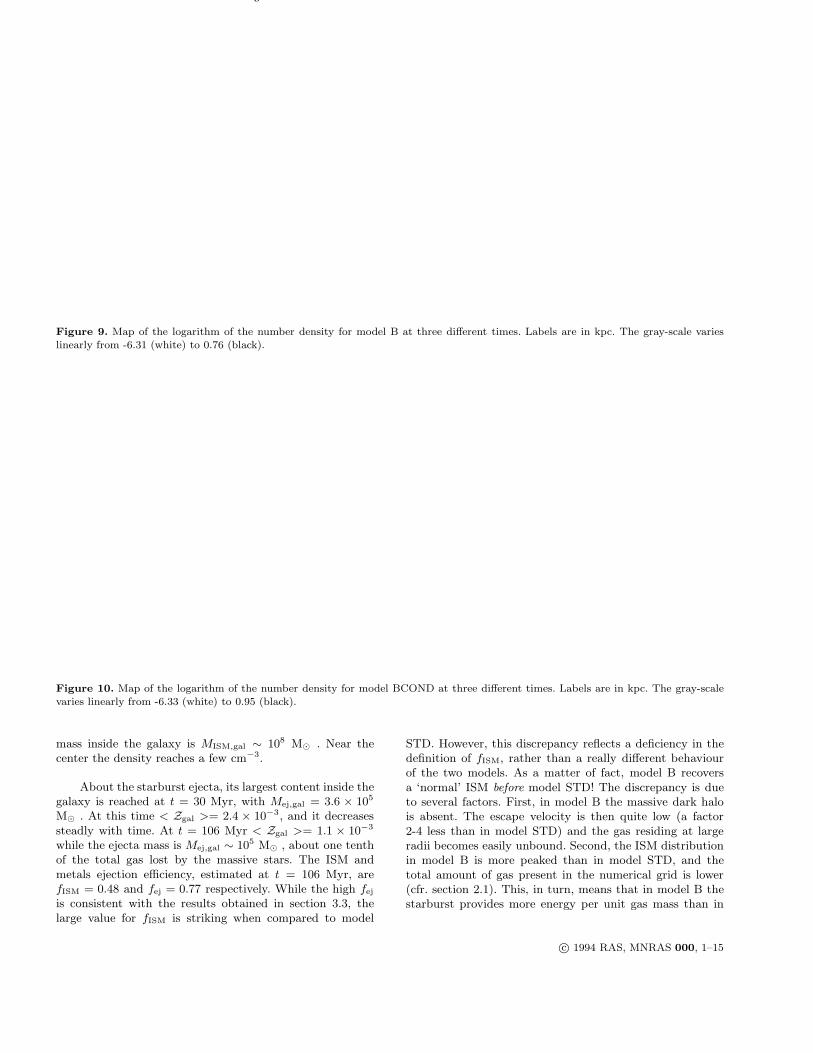
Panel a of Fig. 9 shows the gas density of model B (sec-tion 2) at 30 Myr, just at the end of the starburst activity.The free expanding wind extends so far that almost all of thegalaxy is devoid of the pristine gas. There is a radial gradientin the bubble temperature: along the z-axis T ranges from∼ 4×10⁷ K close to the reverse shock to ∼ 106 K behind the
forward shock; a similar pattern is also present along the R-axis, although the temperatures behind the lateral shock arelower (∼ 105 K) because of the lower velocity of the shockmoving through the higher local ambient density. The aver-age density of the hot gas filling the bubble is ≈ 10−4 cm−3.The expansion velocity along the symmetry axis is ∼ 300 kms−1, and decreases toward the equatorial plane. The bubbleaccelerates as it expands through the decreasing ISM densityprofile, and the R-T unstable contact discontinuity generatesrelatively dense (n ∼ 10−2 cm−3) and cold (T ∼ 104 K) fil-aments and blobs. Actually, denser structures can be seenon the z axis, but they are likely due to our assumption ofvanishing radial velocity on the symmetry axis. In fact, coldgas deposited on this axis cannot be effectively removed, awell known shortcoming common to all 2D cylindrical simu-lations. Given the progressively increasing zones size with zand R, it is likely that the knots density is underestimatedin our simulations, especially for the condensations far fromthe center. At t = 57 Myr (Fig. 9b) there is a large regionessentially devoid of gas (n ∼ 5 × 10⁻⁶ cm−3) surroundedby a very thick, low density shell (n ∼ 10−4 cm−3), with atemperature ∼ 106 K. The external shock is rounder than inmodel STD, due to the lack of the collimating effect of thefunnel along the z-axis (cfr. Fig. 2b). The dense and coldgas near the equatorial plane is already receding toward thecenter with a velocity ∼ 30 km s−1, and a rarefaction waveis moving outward. The highest density in the shell is ∼ 10cm−3 on the equator, where the expansion velocity is 10 kms−1. Apart the cold gas on the z axis, where the densityreaches ∼ 30 cm−3, the densest filaments have n ∼ 3×10⁻²
cm−3. At t ∼ 75 Myr (not shown in Fig. 9) the inflowingcold gas reaches the center, where the density is still ratherlow (n ∼ 10−2 cm−3). s−1. After 106 Myr (panel c), the finaltime of this simulation, the hot gas is still expanding, butthe central cold ISM is enterely collapsed, filling a region|z| < 2.5 kpc, R < 6.5 kpc. The galaxy has thus recovered acold ISM distribution similar to the original one. The ISM
Figure 9. Map of the logarithm of the number density for model B at three different times. Labels are in kpc. The gray-scale varieslinearly from -6.31 (white) to 0.76 (black).
Figure 10. Map of the logarithm of the number density for model BCOND at three different times. Labels are in kpc. The gray-scalevaries linearly from -6.33 (white) to 0.95 (black).
mass inside the galaxy is MISM,gal ∼ 108 M⊙ . Near thecenter the density reaches a few cm−3.
About the starburst ejecta, its largest content inside thegalaxy is reached at t = 30 Myr, with Mej,gal = 3.6 × 10⁵
M⊙ . At this time < Zgal >= 2.4 × 10⁻³, and it decreasessteadly with time. At t = 106 Myr < Zgal >= 1.1 × 10⁻³
while the ejecta mass is Mej,gal ∼ 105 M⊙ , about one tenthof the total gas lost by the massive stars. The ISM andmetals ejection efficiency, estimated at t = 106 Myr, arefISM = 0.48 and fej = 0.77 respectively. While the high fejis consistent with the results obtained in section 3.3, thelarge value for fISM is striking when compared to model
STD. However, this discrepancy reflects a deficiency in thedefinition of fISM, rather than a really different behaviourof the two models. As a matter of fact, model B recoversa ‘normal’ ISM before model STD! The discrepancy is dueto several factors. First, in model B the massive dark halois absent. The escape velocity is then quite low (a factor2-4 less than in model STD) and the gas residing at largeradii becomes easily unbound. Second, the ISM distributionin model B is more peaked than in model STD, and thetotal amount of gas present in the numerical grid is lower(cfr. section 2.1). This, in turn, means that in model B thestarburst provides more energy per unit gas mass than in
Galactic Winds and Circulation of the ISM in Dwarf Galaxies 13
model STD. We believe that the difference in fISM betweenmodel STD and model B should be considered with somecaution. In real galaxies, the gas at large radii, which is thesource of the difference in fISM, can be removed by rampressure and tidal stripping, processes not included in oursimple models. Thus, the contribution of this gas to fISM israther uncertain.
The X-ray emission averaged < Z >X is much higherthan < Zgal > and increases from < Z >X= 0.06 at t = 30Myr up to < Z >X∼ 0.2 at t ∼
> 50 Myr; at later times thebubble gas cools out of the X-ray temperatures and < Z >X
drops to zero at t ∼ 60 Myr.
In Fig. 10 we show model BCOND, identical to modelB but with the heat conduction activated. Again, panel ashows the density at 30 Myr. The superbubble is less ex-tended than in model B, because of the increased radiativelosses in the conduction fronts. The temperature distribu-tion inside the superbubble is now rather flat near the equa-tor, but a negative gradient is present along the z-direction,with the temperature in the range 106 < T < 107 K. As inthe previous models, cold structures are present due to theR-T instabilities. The density of these structures is n ∼ 3cm−3, while the density of the hot gas is ∼ 10−3 cm−3, oneorder of magnitude larger than in model B. This higher den-sity is due to the evaporation of the walls of the shocked ISMshell which ‘feed’ the inner region of the bubble. The expan-sion velocities are similar but lower than those of model Bat the same time. Panel b shows the density at 56 Myr andcan be compared with panel b of Fig. 9. The size of the su-perbubble remains smaller and the shape more elongated.The hot gas in the cavity is denser (n ∼ 5×10⁻⁵ cm−3) andslightly colder (T ∼ 2.5×10⁵ K) than in the non-conductivecase. The cold gas near the equatorial plane is receding to-ward the center, while the outer edge (where n ∼ 10 cm−3)is still expanding. The densest filaments have n ∼ 0.1 cm−3.Panel c shows the gas flow at 105 Myr. The cold inflowinggas has just reached the center, much later than model B.In fact, the pressure drop of the hot gas is slower than inmodel B because the density of the hot gas is kept higherby the shell evaporation and by the slower expansion rate.
At t = 125 Myr, the last time of this simulation,MISM,gal ∼ 0.92 × 10⁸ M⊙ , not far from the initial value.However, only a fraction of the galactic volume contains acold, dense ISM. In fact, roughly half of the galaxy is stillfilled with the rarefied gas of the cavity, now only moderatelyhot (T ∼
< 105 K). At this time the ISM ejection efficiency isfISM = 0.32.
The peculiar structure apparent on the simmetry axis(z ∼
> 20 kpc) at t = 105 Myr (Fig. 10c) is a numerical artifactdepending on our treatment of the heat conduction. Colli-sionless shocks (for istance, in supernova remnants) do notshow the hot precursor which would be expected (Zel’dovic& Raizer, 1966). This means that the plasma instabilities re-sponsible of the shock front formation also inhibit the heatflow through the front itself (Cowie 1977). To mimic thisphenomenon in numerical simulations, the heat conductioncoefficient must vanish at the shock front. To detect theshock front position on the computational grid is an easytask in 1D simulations, but becomes rather cumbersome intwo dimensions. Fortunately, the precursor length is rathershort (shorter than the grid size) unless the upwind densityis very low. We thus did not make any special treatment at
the shock front. Effectively, the heat flux overruns the frontonly at late times, when the upwind density becomes ratherlow. However, this happens when the shock is well outsidethe galaxy, and our conclusions are not affected.
The ejecta content inside the galaxy is Mej = 1.7× 10⁵
M⊙ after 30 Myr (< Zgal >∼ 1.2 × 10⁻³) and decreasessteadily down to Mej = 0.77× 10⁵ M⊙ after 125 Myr, when< Zgal >∼ 8.3× 10⁻⁴. At t = 125 Myr we find fej = 0.88.
It is particularly interesting to investigate the X-rayemission for model BCOND, since now the numerical dif-fusivity does not affect the value of LX and < Z >X (cfr.section 3.4). In fact, the thermal conduction naturally broad-ens the contact surfaces on lengthscales larger than thicknessdue to the numerical diffusion. The temporal variation of LX
is shown in Fig. 6. LX is higher than in model B becauseof the emission arising in conduction fronts. The emissionaveraged abundance < Z >X ranges between 0.13 and 0.20for t ∼
< 70 Myr. As the energy input stops, the temperaturesof the hot phase quickly drops and after t ∼ 70 Myr no moreX-ray emitting gas is present. The observable emission av-eraged temperature of the hot gas is < T >X∼ 2 × 10⁶ Kfor t ∼
< 30 Myr and drops quickly thereafter.
5 DISCUSSION AND CONCLUSIONS
The results presented here qualitatively confirm the conclu-sions of previous investigations on the effect of galactic windsin dwarf galaxies (e.g. MF). In general, it is found that theISM is more robust than expected, and it is not disruptedeven if the total energy input is much greater than the gasbinding energy. In fact, the gas in the optical region of dwarfgalaxies is only temporarily affected by the starburst, andthe galaxy is able to recover a ‘normal’ ISM after a time ofthe order of 100 Myr from the starburst event, here assumedto be instantaneous. Our results agree well with the ‘mod-erate form’ of galactic wind dominated evolution of dwarfgalaxies described by Skillman (1997). In Table 2 we sum-marize the values of the fraction of ISM and metal-rich ejectathat is lost by the galaxy.
We find that the evolution of the ISM can be separatedin two phases. The first one corresponds to the energy inputperiod (which lasts 30 Myr in our models). During this phasethe superbubble expands surrounded by a fragmented andfilamentary shell of cold gas. The hot gas inside the bubbleand the cold shell gas are in pressure equilibrium. The sec-ond phase starts when the energy input stops: the pressureof the hot bubble, still expanding along the polar direction,drops quickly. This causes the inner portion of the shell nearthe equator to collapse back toward the center, replenish-ing the galactic region with cold gas. The collapse is drivenmainly by the pressure gradient, with the gravity being ofsecondary importance.
The replenishment process occurs through inflow of coldgas moving parallel to the equatorial plane, thus resemblingthe inflows considered by Tenorio-Tagle & Munoz-Tunon(1997). However, the ram pressure associated to this flowin model STD, representative of all our models, is ≈ 10−14
dyn cm−2, five orders of magnitude lower than those as-sumed by Tenorio-Tagle & Munoz-Tunon (1997). Evidently,if such massive inflows exist, they must have a different ori-gin.
Quantities are calculated at t = 200 Myr, except for model Band BCOND, for which the final time is 106 Myr and 125 Myr,respectively. fISM is the ISM ejection efficiency defined in section3.2. fej is the metals ejection efficiency defined in section 3.3.< Zgal > is the average ejecta fraction in the galactic region (seesection 3.3). Masses are given in M⊙.
We found that the central ISM reaches the critical col-umn density required for rapid star formation after 0.1 - 1Gyr from the starbust, the exact value depending on thegalactic parameters, when a new starburst may start. Thisepisodic star formation regime is necessary to account forthe chemical evolution of BCD galaxies, and we have shownhere that it is consistent with the hydrodynamical evolutionof the ISM.
Most of the metal-rich material shed by the massivestars resides in the hot phase of the ISM, and for powerfulstarbursts it is easily lost from the galaxy (Table 2). Weestimate that a fraction of 0.5−0.9 of the total metal-rich gasis dispersed in the intergalactic medium when the starburstmodel SB2 is adopted. However, for moderate energy inputrates (model SB1), only a small fraction (∼
< 10 %) becomesformally unbound. In spite of the smallest fej, model SB1has the lowest < Zgal >, since the total amount of ejectais a factor of 10 lower than the other models. Most of theejecta material is pushed to large distance from the galaxy(several kpc), and its fate is uncertain, being subject to rampressure and tidal stripping. These processes may effectivelyremove material loosely bound to the galaxy.
There is some quantitative difference between our find-ings and those by MF. The generally lower fej found in ourmodel is likely to be the result of our more extended gaseoushalo. Their models, with a sharp truncation of the ISM, aresimilar to our model PEXT. The most striking disagree-ment is between model SB1, for which we find fej = 0.003,and their model with Mgas = 108 M⊙ and Linp = 1039 ergs−1 which has fej = 1. However, as explained in section 4.1,model SB1 suffers of some numerical extra-cooling; the samemodel without radiative losses gives fej = 0.14, probably amore realistic value if thermal conduction is not effective. Acomparison of our Fig. 7a-b with fig. 2a of MF (panel withthe model Mg = 108; L38 = 10, in their notations) dramati-cally shows the sensitivity of the superbubble dynamics (andsize) on the ISM distribution.
The cold gas replenishing the central region, from whicha successive starburst may form, has been only slightly pol-luted by the massive star ejecta, with < Z >≈ 4×10⁻⁴−2×10⁻³, or < ZO >≈ 2× 10⁻³ − 10−2 ZO,⊙, with the assump-tions described in section 3.3. Thus, many starburst episodesare necessary to build an average metallicity Z ∼ 0.25 Z⊙,as determined for NGC 1569 from observations of emissionlines gas (e.g. Kobulnicky & Skillman 1997). Many dwarfgalaxies, however, are more metal poor (the abundance of
IZw18 is only 0.07 solar), and few bursts may be sufficientto produce the observed metallicity.
The values listed in Table 2 demonstrate how the evo-lution of the ISM is not regulated by the ejection efficiencyparameters fISM and fej alone. For instance, model PEXTand BCOND have similar fISM and fej, but very differentISM and ejecta masses. Conversely, the gas mass evolution ofmodel SB1 and model B is comparable, despite of dissimilarejection efficiencies.
Comparing models STD and B, we found that a darkmatter halo has little direct influence on the final behaviourof the ISM. However, dark matter and rotation determinethe initial gas distribution, which is an important parame-ter for the flow evolution. For instance, the central region ofmodel STD is refilled with cold gas more slowly than modelB, a difference which reflects the different initial ISM distri-bution.
In order to evaluate how the assumption of an instan-taneous burst influences our results, we run an additionalmodel similar to STD, but with Linp = 1.128 × 1040 ergs−1, M = 0.009 M⊙ yr−1. The energy and mass sources arenow active for 100 Myr, so that the total energy and massinjected are the same as in STD. With this model, which ina simple way mimics the effect of a prolonged starburst, wewish to check the sensitivity of our results on the assumptionof a instantaneous starburst adopted in models illustrated inthe previous sections. We found that the general dynamicsis similar to that of model STD and is not described here.The ejection efficiencies, again calculated at t = 200 Myr,are fISM = 0.055 and fej = 0.40, almost identical to thosefound for STD (Table 2). Thus, it appears that the instan-taneous starburst hypothesis does not invalidate our generalfindings.
We devoted section 3.4 to discuss the complex X-rayemission arising from starburst galaxies. We warn again thatfor model BCOND only we can calculate the X-ray quan-tities in a strictly consistent way, the other models havingthe contact surfaces numerically spread by the intrinsic dif-fusion of the hydrocode (although several physical processesare thought to produce similar effect, cfr. section 3.4). Inmodel BCOND the thermal conduction generates physicallybroadened interfaces between hot and cold gas. We foundthat the X-ray luminosities in the ROSAT band (Fig. 7)are generally less than those estimated by Della Ceca et al.(1996, 1997) for NGC 1569 and NGC 4449. It is thus sug-gested that a mass loading mechanism is at work in thesesystems (see also Suchkov et al. 1996). Moreover, the lowabundances found in X-ray studies also indicate that ther-mal conduction (or some other process that mix cold andhot gas) is effective.
Contrary to Suchkov et al. (1994) we found that theshocked ISM layer does not contribute appreciably to theX-ray luminosity for t ∼
< 30 Myr, a fact indicating that theorigin of the X-ray radiation is model dependent. For Linp
appropriate for typical dwarf galaxies we found that LX isdominated by the ISM mixed with the shocked ejecta at thecontact discontinuities.
Galactic Winds and Circulation of the ISM in Dwarf Galaxies 15
ACKNOWLEDGMENTS
We are grateful to Luca Ciotti, Laura Greggio, Bill Mathewsand Monica Tosi for interesting discussions. We are indebtedto the referee for a number of thoughtful comments andsuggestions. This work has been partially supported by theItalian Ministry of Reserch (MURST) through a Cofin-98grant.
REFERENCES
Anders E., Grevesse N., 1989, Geochim. Cosmochim. Acta., 53,197
Babul A., Rees, M.J., 1992, MNRAS, 255, 346Bedogni R., D’Ercole A., 1986, A&A, 157, 101Begelman M.C., Fabian A.C., 1990, MNRAS, 26Binney J., Tremaine S., 1987, Galactic Dynamics, Princeton Uni-
versity PressBrighenti F., 1992, Tesi di Laurea, University of BolognaBrighenti F., D’Ercole A., 1994, MNRAS, 270, 65Brighenti F., D’Ercole A., 1997, MNRAS, 285, 387Brighenti F., Mathews W.G., 1998, ApJ, in press (astro-
ph/9811258)Buote D.A., 1999, astro-ph/9903278Buote D.A., Fabian A.C., 1998, MNRAS, 296, 977Clegg R.E.S., 1989, in Torres-Peimbert S. ed., Planetary Nebulae,
Dordrecht: Kluwer), p. 139Cole S., Aragon-Salamanca A., Frenk C.S., Navarro J.F., Zepf
Okada K., Mitsuda K., Dotani T., 1997, PASJ, 49, 653Persic M., et al., 1998, astro-ph/9809256Ptak A., Serlemitsos P., Yaqoob T., Mushotzky R.F., 1997, AJ,
113, 1286Richtmyer R.D., Morton K.W.: 1967, Difference Methods for