Journal of Maps, 2008, 225-234 Geomorphological map of the 1944 Vesuvius lava flow (Italy) GIUSEPPE VILARDO 1 and GUIDO VENTURA 2 1 Istituto Nazionale di Geofisica e Vulcanologia, Osservatorio Vesuviano, Via Diocleziano 128, 80124 Napoli, Italy; [email protected]2 Istituto Nazionale di Geofisica e Vulcanologia, Department Seismology and Tectonophysics, Via di Vigna Murata 605, 00143 Roma, Italy; [email protected](Received 21 st January 2008; Revised 24 th June 2008; Accepted 27 th June 2008) Abstract: The map of the 1944 lava flow shows the geomorphological characteristics of a sector of the Vesuvius volcano (Italy) covered by the products emitted during the last effusive phase. The map has been produced based on the analysis and interpretation of (a) thematic maps (slope, aspect, relative relief) derived from a high resolution (0.33 m pixel) Digital Terrain Model obtained by an Airborne Laser Scanning survey, and (b) a 1 m pixel digital colour orthophoto. Different flow structures and morphologies have been interpreted. The analytical approach proposed here can be used to characterize the smaller scale topographic/geomorphological features of volcanoes and gives constraints on the mechanism of emplacement and modelling strategies of lava flows. ISSN 1744-5647 http://www.journalofmaps.com 225
Transcript
Journal of Maps, 2008, 225-234
Geomorphological map of the 1944 Vesuvius
lava flow (Italy)
GIUSEPPE VILARDO1 and GUIDO VENTURA2
1 Istituto Nazionale di Geofisica e Vulcanologia, Osservatorio Vesuviano, Via Diocleziano 128, 80124Napoli, Italy; [email protected]
2 Istituto Nazionale di Geofisica e Vulcanologia, Department Seismology and Tectonophysics, Via diVigna Murata 605, 00143 Roma, Italy; [email protected]
(Received 21st January 2008; Revised 24th June 2008; Accepted 27th June 2008)
Abstract: The map of the 1944 lava flow shows the geomorphological characteristics ofa sector of the Vesuvius volcano (Italy) covered by the products emitted during the lasteffusive phase. The map has been produced based on the analysis and interpretation of(a) thematic maps (slope, aspect, relative relief) derived from a high resolution (0.33 mpixel) Digital Terrain Model obtained by an Airborne Laser Scanning survey, and (b) a 1m pixel digital colour orthophoto. Different flow structures and morphologies have beeninterpreted. The analytical approach proposed here can be used to characterize thesmaller scale topographic/geomorphological features of volcanoes and gives constraintson the mechanism of emplacement and modelling strategies of lava flows.
Journal of Maps, 2008, 225-234 Vilardo, G. and Ventura, G.
1. Introduction
Lidar (Light detection and ranging) remote sensing from aerial platformshas been applied to the mapping of the Earth surface because Lidar-deriveddata allows the production of high resolution digital elevation models(DEMs) or digital terrain models (DTMs) (Gamba and Houshmand, 2002;Cin et al., 2005; Shrestha et al., 2005; Glenn et al., 2006). The possibilityto obtain information on the terrain topography makes this techniquesuitable for studies in hydrology, geomorphology, geology, and geotechnicalengineering (Irish and Lillycrop, 1999; Roering et al., 1999; Carter et al.,2001; Woolard and Colby, 2002; Hofton and Blair, 2002; Glenn et al.,2006). In a volcanic environment, Lidar data acquired from an aerialplatform are commonly used to determine the volume of lava flows orpyroclastic flow deposits and measure topographic changes (Carabajalet al., 2005; Mazzarini et al., 2005; Mouginis-Mark and Garbeil, 2005;Hofton et al., 2006). Here, we use a different methodological approach: aLidar-derived, high resolution (0.33 m x 0.33 m) DTM of a lava emittedfrom the Vesuvius volcano (Italy) in 1944 is analyzed to obtain a detailedgeomorphological map of the lava surface. Results allow us to decipher thekinematic significance of the lava flow structures and to put constraints onthe mechanism of emplacement and modelling of lava flows.
2. The 1944 eruption and its effusive phase
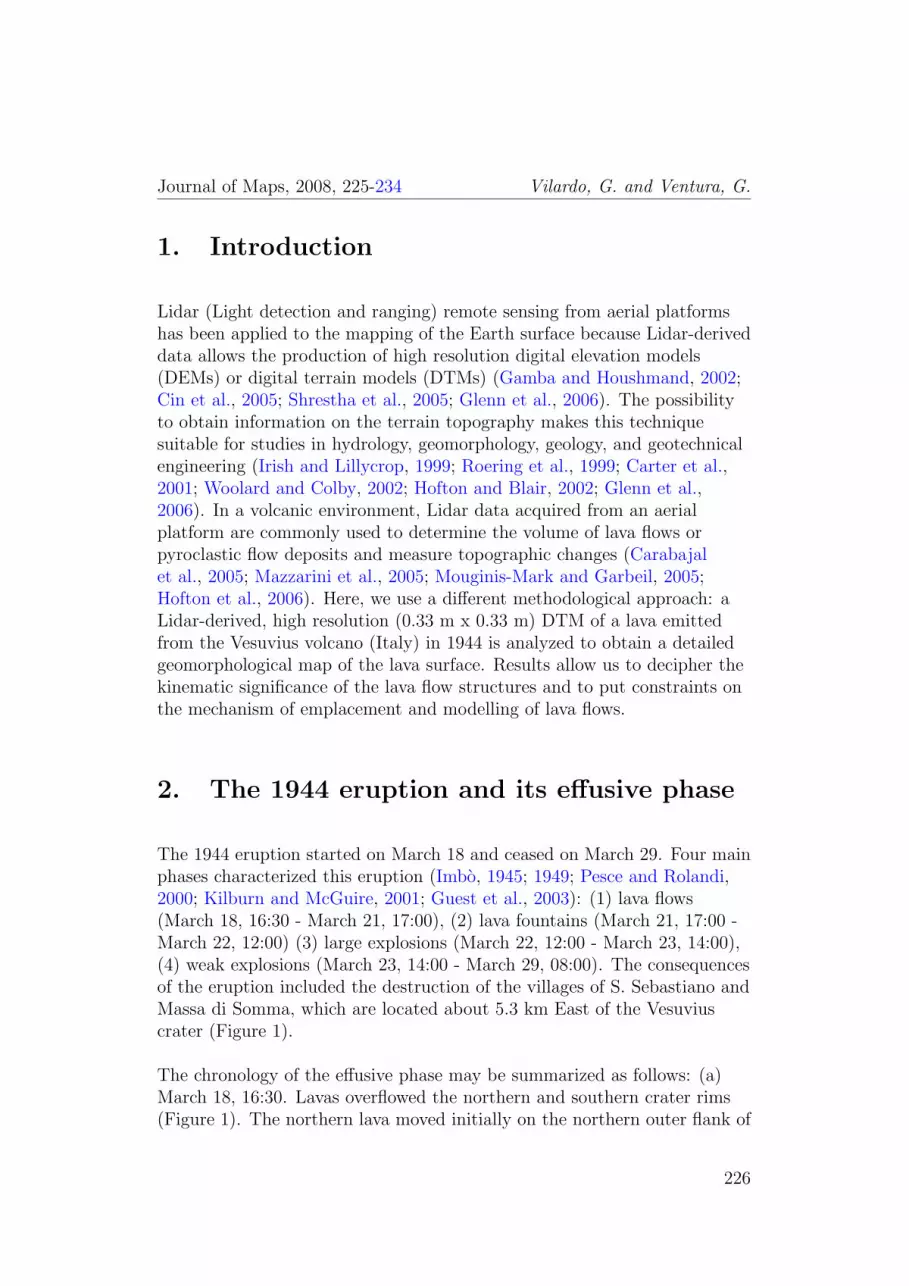
The 1944 eruption started on March 18 and ceased on March 29. Four mainphases characterized this eruption (Imbo, 1945; 1949; Pesce and Rolandi,2000; Kilburn and McGuire, 2001; Guest et al., 2003): (1) lava flows(March 18, 16:30 - March 21, 17:00), (2) lava fountains (March 21, 17:00 -March 22, 12:00) (3) large explosions (March 22, 12:00 - March 23, 14:00),(4) weak explosions (March 23, 14:00 - March 29, 08:00). The consequencesof the eruption included the destruction of the villages of S. Sebastiano andMassa di Somma, which are located about 5.3 km East of the Vesuviuscrater (Figure 1).
The chronology of the effusive phase may be summarized as follows: (a)March 18, 16:30. Lavas overflowed the northern and southern crater rims(Figure 1). The northern lava moved initially on the northern outer flank of
226
Journal of Maps, 2008, 225-234 Vilardo, G. and Ventura, G.
445000 450000 455000
4515
000
4520
000
Gulf of Naples
Somma
Vesuvius
S. Sebastiano
Ercolano
Pompei
Terzigno
Torre del GrecoBoscotrecase
Torre Annunziata
Somma Vesuviana
OttavianoMassa diSomma
Pyroclastic flows and fall deposits eruptedbetween 19 ka and the A.D. 1631 eruption
Lava flows of the 1913 - 1944 period
Lava flows of the 1798 - 1906 period
Lava flows erupted between AD 79 and AD 1794
Hot landslides of the 1944 eruption
Welded scorias, pyroclastics of the 1944 eruption
Reworked pyroclastics and alluvium
Lava flows, welded scorias of the Mt. Somma covered by younger thin pyroclastic cover (north-facing slope). Lava flows, welded scorias and dykes (south and west facing slope of Somma) Age > 18ka
Figure 1. Location and simplified geological map of the Somma-Vesuvius volcano superimposedon a shaded relief image of the Digital Terrain Model (UTM WGS84 projection, distance in km).Contour line intervals are 100 m. Geological data are from Santacroce (1987) and Santacroceet al. (2003). The black rectangle shows the area of the 1944 lava flow analyzed in this work.
the crater, and bent to the west when it reached the caldera floor (Figure1). At 23:00, a new outpouring of lava occurred from the western craterrim. (b) March 19, 09:00. A new outpouring of lava occurred from thenorthern crater rim. This flow covered part of the northern lava emitted onMarch 18. (c) March 21, 1:00. The northern lava flow reached the villagesof S. Sebastiano and Massa di Somma. At the end of the eruption, the totallength of the lava flow was 5.6 km. The volume of the 1944 lava flow is∼106 m3 (Imbo, 1949).
3. Lidar data and DTM
The Airborne Laser Scanning (ALS) data were acquired on January 2005from an aerial platform operated by Nuova Avioriprese SrL Company ofNapoli (Italy) using an Optech ALTM 2050 Lidar system. The Lidarsurvey covered the northern and central sectors of the Somma caldera,which includes the Vesuvius cone and the northern flow of the 1944 lava(Figure 1). The sensor, which acquires data at a rate of 50 kHz, was
227
Journal of Maps, 2008, 225-234 Vilardo, G. and Ventura, G.
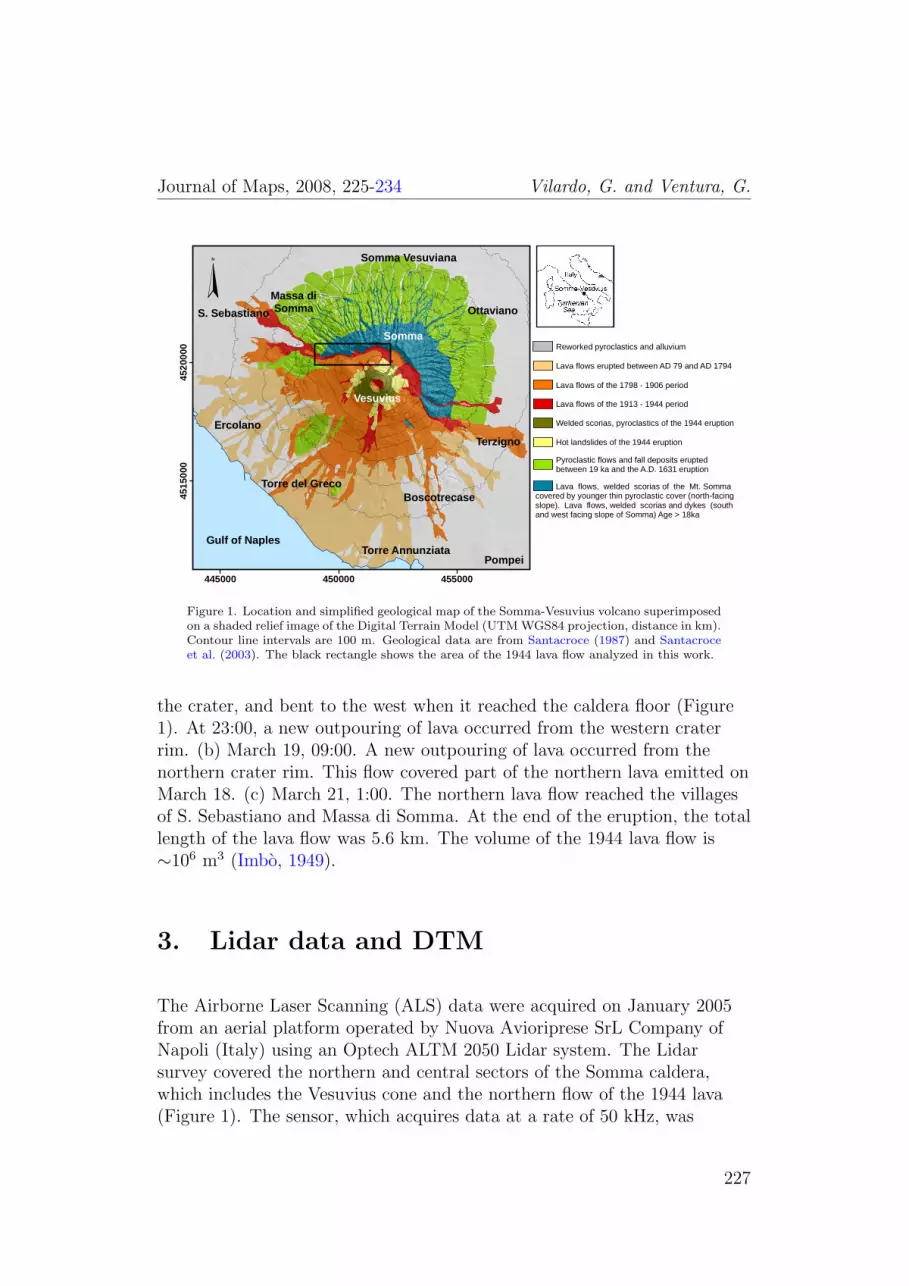
mounted on a fixed wing aircraft flying with a minimum airspeed ofapproximately 50 m s−1. The data were collected from an altitude ofapproximately 700 m, resulting in a footprint diameter of 0.20 m for eachlaser pulse. Both first and last pulse data sets were acquired, eachconsisting of over 17 million individual postings covering an area of about2,000 hectares. The data were collected in eight, 600 m wide flight lines.The overlap of the flightlines is about 30%. The sensor utilizes a high-endApplanix Pos/AV Inertial Navigation System (INS) and a dual-frequencyNovAtel Millennium GPS receiver. The Vesuvius survey was georeferencedusing a GPS reference station on a IGM95 geodetic point. The collecteddata were integrated with those obtained from GPS/INS to obtain the rawdata. The analysis of the times between first and last pulses allowed us todiscriminate between the elevation points and those related to vegetation orartificial features. The final point cloud covering the 1944 lava flow area,which is free of vegetation, includes about 4 million elevation points withdensities up to 12 points m−2 (Figure 2a). No data are available for thewesternmost sector of the 1944 lava.
449000 450000 451000 452000
4520
000
4521
000
no data1
2 -34 - 5
6 -77 - 12
Legend
450000 451000 452000
4520
000
4520
500
a
b
Figure 2. Lidar survey (June 2005). (a) Sampling density (number of data/m2) of the 1944lava flow; (b) Shaded relief image of the 0.33 m x 0.33 m DTM. The boundary of the 1944 lavaflow is also reported. (UTM WGS84 projection, distance in km).
The altimetry accuracy is ≤ 20 cm based on total station and GPS singlepoint elevations. A regular 0.33 by 0.33 m elevation grid was created from
228
Journal of Maps, 2008, 225-234 Vilardo, G. and Ventura, G.
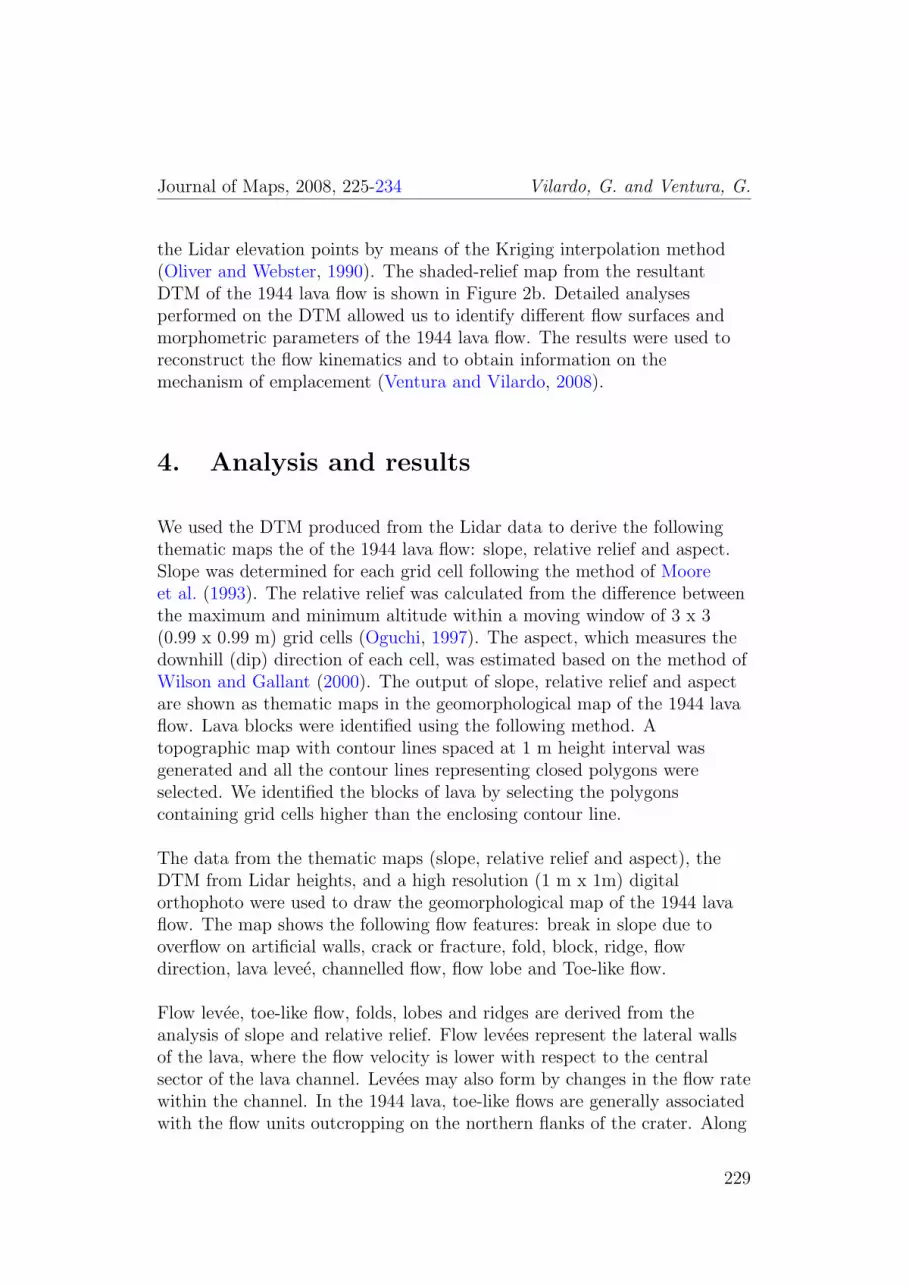
the Lidar elevation points by means of the Kriging interpolation method(Oliver and Webster, 1990). The shaded-relief map from the resultantDTM of the 1944 lava flow is shown in Figure 2b. Detailed analysesperformed on the DTM allowed us to identify different flow surfaces andmorphometric parameters of the 1944 lava flow. The results were used toreconstruct the flow kinematics and to obtain information on themechanism of emplacement (Ventura and Vilardo, 2008).
4. Analysis and results
We used the DTM produced from the Lidar data to derive the followingthematic maps the of the 1944 lava flow: slope, relative relief and aspect.Slope was determined for each grid cell following the method of Mooreet al. (1993). The relative relief was calculated from the difference betweenthe maximum and minimum altitude within a moving window of 3 x 3(0.99 x 0.99 m) grid cells (Oguchi, 1997). The aspect, which measures thedownhill (dip) direction of each cell, was estimated based on the method ofWilson and Gallant (2000). The output of slope, relative relief and aspectare shown as thematic maps in the geomorphological map of the 1944 lavaflow. Lava blocks were identified using the following method. Atopographic map with contour lines spaced at 1 m height interval wasgenerated and all the contour lines representing closed polygons wereselected. We identified the blocks of lava by selecting the polygonscontaining grid cells higher than the enclosing contour line.
The data from the thematic maps (slope, relative relief and aspect), theDTM from Lidar heights, and a high resolution (1 m x 1m) digitalorthophoto were used to draw the geomorphological map of the 1944 lavaflow. The map shows the following flow features: break in slope due tooverflow on artificial walls, crack or fracture, fold, block, ridge, flowdirection, lava levee, channelled flow, flow lobe and Toe-like flow.
Flow levee, toe-like flow, folds, lobes and ridges are derived from theanalysis of slope and relative relief. Flow levees represent the lateral wallsof the lava, where the flow velocity is lower with respect to the centralsector of the lava channel. Levees may also form by changes in the flow ratewithin the channel. In the 1944 lava, toe-like flows are generally associatedwith the flow units outcropping on the northern flanks of the crater. Along
229
Journal of Maps, 2008, 225-234 Vilardo, G. and Ventura, G.
with folds, which are structures related to flow shortening, the toe-like flowstestify to a decrease in the slope of the substratum. Lobes and ridgesrepresent the front and lateral boundary of single flow units, respectively.Channelled flows are derived from the analysis of aspect. The distributionof blocks is also included in the map together with the inferred flowdirections, cracks, and breaks in slope. The breaks represent pre-1944artificial barriers overlain by the lava. Flow direction was extracted fromthe aspect map. Cracks and breaks in slope were derived from the shadedrelief images of the DTM and orthophoto, and from the slope map,respectively. Cracks are related to the rupture of the upper crust of lavaflows. The width of the lava is measured along 180 cross sectionsperpendicular to a longitudinal section of the lava. The lava flow width andelevation are reported as ancillary data in the geomorphological map.
5. Conclusions
The data presented here show that high-resolution DEM data of lava flowsmay be used to map and quantitatively estimate some relevant topographicparameters of lava flows. The map of the 1944 lava clearly shows that theflow can be divided in to three main portions: (a) a near vent portioncharacterized by a toe-like surface, (b) an intermediate portion with abrittle surface in which lava blocks and cracks concentrate, and (c) a moredistal portion with a poorly fragmented and/or broken surface. Fold-likesurfaces occur in the near vent sector and reflect local shortening processesdue to a decrease in the slope of the substratum and to overflows from themain channel. It is worth nothing that the distal and intermediate portionsof the 1944 lava emplaced between March 18 and 21, whereas the moreproximal portion emplaced on March 19 and partly covered the unitsemplaced on March 18. Lateral levee and channels occur in theintermediate and distal portions. Therefore, the map of the 1944 lava flowsidentifies three parts of the flows characterized by different mechanisms ofemplacement. In particular, we highlight that the transition from theintermediate to the distal portion is due, according to the altitude andslope thematic maps, to an abrupt increase in the slope of the substratum.This is relatively anomalous in volcanic terrains, which are generallycharacterized by a decrease in the slope with decreasing altitude. As aresult, the detailed mapping of lava flows allow us to detect morphologicalfeatures related to changes in the slope of the substratum. In addition, our
230
Journal of Maps, 2008, 225-234 Vilardo, G. and Ventura, G.
data show that the 1944 lava is characterized by an intermediate portionwith features consistent with a tube-like flow, whereas the more distalportion have features consistent with a sheet-like, channelized flow. Theabove reported results have implications for the physical modelling of lavaflows because tube-like and sheet-like flows require different modellingstrategies (e.g., Sakimoto and Gregg, 2001). This is particularly importantfor the analysis of the emplacement mechanisms and for thecharacterization of the small scale topographic features of volcanoes.
Acknowledgements
This study has been carried out with funds from the Campanian Region(Italy). We thank the two JoM reviewers for the very useful comments andMike Smith for the editorial handling.
Software
The DTM was created from the Lidar elevation points using Surfer 8 byGolden Software Inc. Slope, relative relief and aspect maps were processedin Surfer 8. The quantitative DTM analyses for the extraction of themorphological features was perfromed using ESRIs ArcGIS. ErdasIMAGINE 9.0 software by Leica Geosystems was used forphotointerpretative analyses of DTM derived maps.
References
CARABAJAL, C. C., HARDING, D. J. and HAUGERUD, R. A.(2005) Monitoring Mount St. Helens activity by airborne and space-basedlaser altimetry elevation measurements, American Geophysical Union,Fall Meeting 2005, abstract# G53B-0888.
CARTER, W., SHRESTHA, R., TUELL, G., BLOOMQUIST, D.and SARTORI, M. (2001) Airborne laser swath mapping shines newlight on Earth’s topography, EOS Transactions, 82, 549.
231
Journal of Maps, 2008, 225-234 Vilardo, G. and Ventura, G.
CIN, C. D., MOENS, L., DIERICKX, P. H., BASTIN, G. andZECH, Y. (2005) An Integrated Approach for Realtime FloodmapForecasting on the Belgian Meuse River, Natural Hazards, 36, 237–256.
GAMBA, P. and HOUSHMAND, B. (2002) Joint analysis of SAR,LIDAR and aerial imagery for simultaneous extraction of land cover,DTM and 3D shape of buildings, International Journal of RemoteSensing, 23, 4439–4450.
GLENN, N. F., STREUTKER, D. R., CHADWICK, D. J.,THACKRAY, G. D. and DORSCH, S. J. (2006) Analysis ofLiDAR-derived topographic information for characterizing anddifferentiating landslide morphology and activity, Geomorphology, 73,131–148.
GUEST, J., COLE, P., DUNCAN, A. and CHESTER, D. (2003)Volcanoes of Southern Italy, Earth in View Series, Geological Society ofLondon, 284 pp.
HOFTON, M. A. and BLAIR, J. B. (2002) Laser altimeter return pulsecorrelation: a method for detecting surface topographic change, Journalof Geodynamics, 34, 477–489.
HOFTON, M. A., MALAVASSI, E. and BLAIR, J. B. (2006)Quantifying recent pyroclastic and lava flows at Arenal Volcano, CostaRica, using medium-footprint lidar, Geophysical Research Letters, 33.
IMBO, G. (1945) Il parossismo vesuviano del Marzo 1944, RendicontiAccademia Scienze, Fisiche e Matematiche di Napoli, 13, 309–325.
IMBO, G. (1949) L’attivita eruttiva vesuviana e relative osservazioni nelcorso dell’intervallo 1906-1944 ed in particolare del parossismo del Marzo1944, Annali Osservatorio Vesuviano, 5, 185–380.
IRISH, J. L. and LILLYCROP, W. J. (1999) Scanning laser mapping ofthe coastal zone: the SHOALS system, ISPRS Journal ofPhotogrammetry and Remote Sensing, 54, 123–129.
KILBURN, C. and MCGUIRE, B. (2001) Italian Volcanoes (Classicgeology in Europe 2), Terra Publishing (UK), 166 pp.
MAZZARINI, F., PARESCHI, M. T., FAVALLI, M., ISOLA, I.,TARQUINI, S. and BOSCHI, E. (2005) Morphology of basaltic lavachannels during the Mt. Etna September 2004 eruption from airbornelaser altimeter data, Geophysical Research Letters, 32, L04,305.
232
Journal of Maps, 2008, 225-234 Vilardo, G. and Ventura, G.
MOORE, I. D., LEWIS, A. and GALLANT, J. C. (1993) ModelingChange in Environmental Systems, chap. Terrain properties: EstimationMethods and Scale Effects, John Wiley and Sons, New York.
MOUGINIS-MARK, P. and GARBEIL, H. (2005) Quality of TOPSARtopographic data for volcanology studies at Kilauea Volcano, Hawaii: Anassessment using airborne Lidar data, Remote Sensing of Environment,96, 149–164.
OGUCHI, T. (1997) Drainage density and relative relief in humid steepmountains with frequent slope failure, Earth Surface Processes andLandforms, 22, 107–120.
OLIVER, M. A. and WEBSTER, R. (1990) Kriging: a method ofinterpolation for geographical information system, International JournalGeographical Information Systems, 4, 313–332.
PESCE, A. and ROLANDI, G. (2000) Vesuvio 1944. L’ultima eruzione,Magma Ed., 230 pp.
ROERING, J. J., KIRCHNER, J. W. and DIETRICH, W. E. (1999)Evidence for nonlinear, diffusive sediment transport on hillslopes andimplications for landscape morphology, Water Resources Research, 35,580–853.
SAKIMOTO, S. E. H. and GREGG, T. K. P. (2001) Channeled flow:analytic solutions, laboratory experiments, and applications to lava flows,Journal of Geophysical Research, 106, 8629–8648.
SANTACROCE, R. (1987) Somma-Vesuvius, Quaderni RicercaScientifica, 114.
SANTACROCE, R., SBRANA, A., ANDRONICO, D., CIONI, R.,DI VITO, M., MARIANELLI, P., SULPIZIO, R., ZANCHETTA,G., ARRIGHI, S., BENVENUTI, E., GURIOLI, L., LEONI,F. M. and LUPERINI, W. (2003) Carta Geologica del Vesuvio, scale1:15.000, In Santacroce, R. and Sbrana, A., (eds.) S.E.L.C.A.,Firenze.
SHRESTHA, R. L., CARTER, W. E., SARTORI, M., LUZUM,B. J. and SLATTON, K. C. (2005) Airborne Laser Swath Mapping:Quantifying changes in sandy beaches over time scales of weeks to years,ISPRS Journal of Photogrammetry and Remote Sensing, 59, 222–232.
233
Journal of Maps, 2008, 225-234 Vilardo, G. and Ventura, G.
VENTURA, G. and VILARDO, G. (2008) Emplacement mechanism ofgravity flows inferred from high resolution Lidar data: The 1944Somma-Vesuvius lava flow (Italy), Geomorphology, 95, 223–235.
WILSON, J. P. and GALLANT, J. C. (2000) Digital terrain analysis,In Terrain analysis, John Wiley and Sons, New York.
WOOLARD, J. W. and COLBY, D. (2002) Spatial characterization,resolution, and volumetric change of coastal dunes using airborne Lidar,Geomorphology, 48, 269–287.