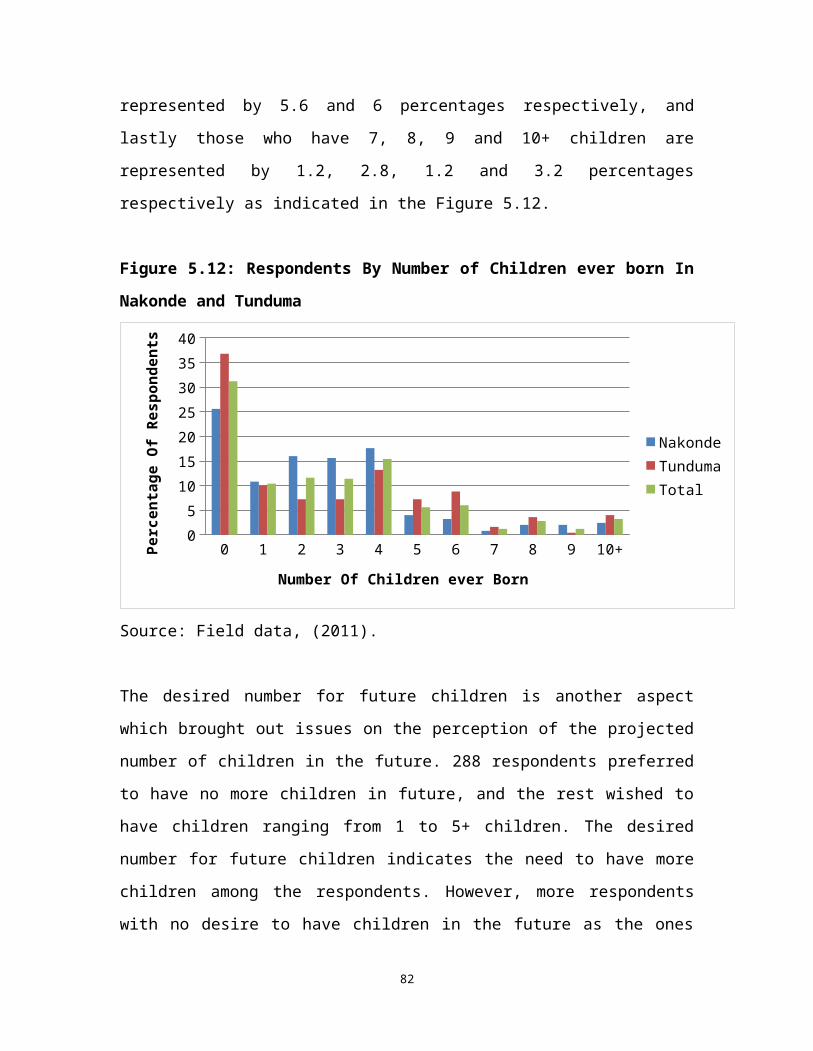
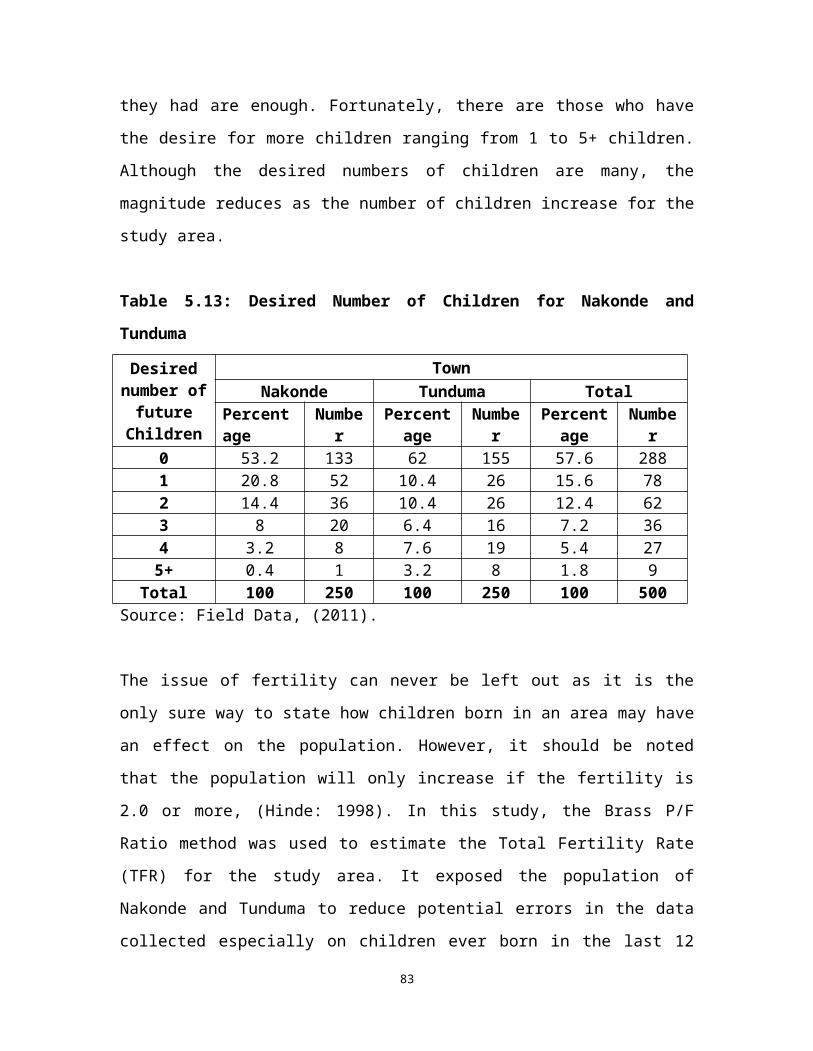
CHAPTER ONE INTRODUCTION 1.0 Introduction This chapter brings out the main issues of this research by highlighting the flow of information for this dissertation in six chapters. Chapter one is on the background, the statement of the problem, aim, objectives, research questions, hypotheses and rationale; chapter two is on the literature review, conceptual and theoretical framework; chapter three looks at the methodology, chapter four brings out the study area, chapter five outlines the findings and chapter six gives a discussion of the findings, conclusion and recommendations. There is also the references which indicated all the quoted authors and the appendixes. 1.1 Background Zambia got her independence in 1964 with a very small population of 3.5 million people and it had continued to increase to above 13 million people, CSO (2011). The country’s increase in population also affected all the provinces, districts as well as towns. The Muchinga Province which consist of parts of former Northern and Eastern Provinces is no exception especially one of its towns Nakonde. CSO (2011: 6) states, “Northern Province had a population of 1, 759, 600...has increased from 1, 258, 696 1
Transcript
CHAPTER ONE
INTRODUCTION1.0 Introduction
This chapter brings out the main issues of this research by
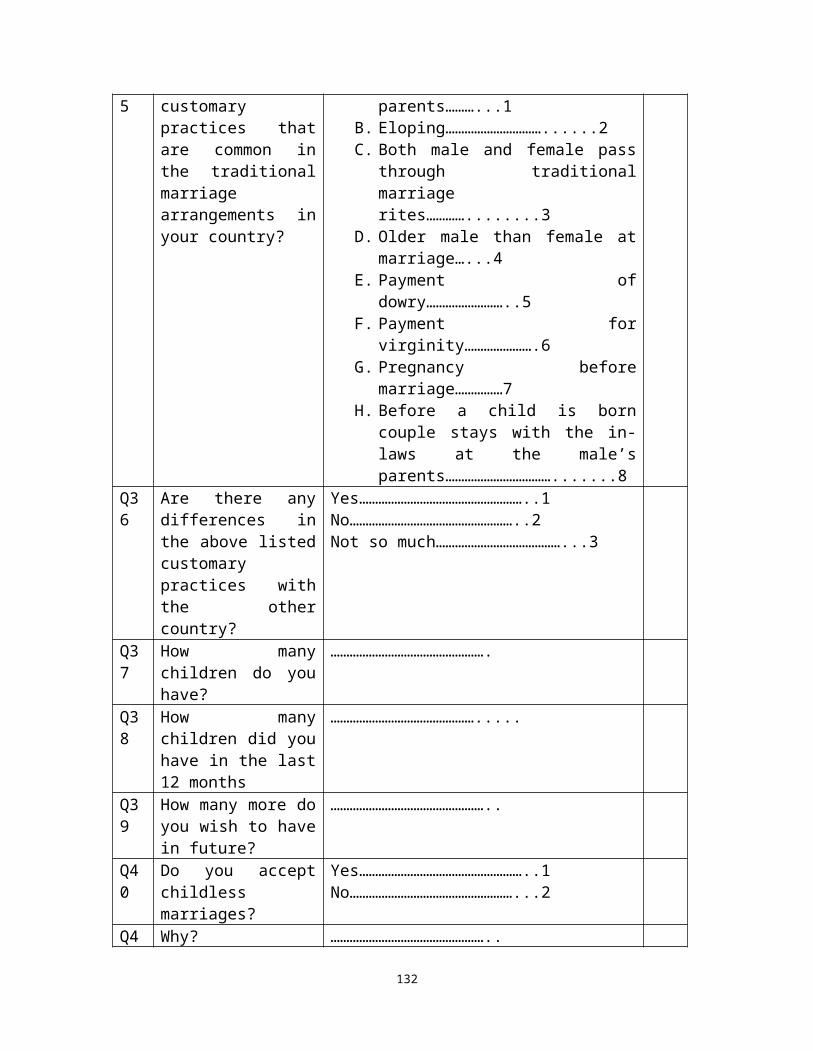
highlighting the flow of information for this dissertation
in six chapters. Chapter one is on the background, the
statement of the problem, aim, objectives, research
questions, hypotheses and rationale; chapter two is on the
literature review, conceptual and theoretical framework;
chapter three looks at the methodology, chapter four brings
out the study area, chapter five outlines the findings and
chapter six gives a discussion of the findings, conclusion
and recommendations. There is also the references which
indicated all the quoted authors and the appendixes.
1.1 Background
Zambia got her independence in 1964 with a very small
population of 3.5 million people and it had continued to
increase to above 13 million people, CSO (2011). The
country’s increase in population also affected all the
provinces, districts as well as towns. The Muchinga Province
which consist of parts of former Northern and Eastern
Provinces is no exception especially one of its towns
Nakonde. CSO (2011: 6) states, “Northern Province had a
population of 1, 759, 600...has increased from 1, 258, 696
1
in 2000...indicates an annual population growth rate of 3.4
percent”. The population increase had also paved way for
other developmental issues such as increase in the need for
housing, education, health services, good roads only to
mention but a few. All these issues were the basis for the
topic under study which was ‘Factors associated with the
conurbation of Nakonde and Tunduma towns’.
Conurbation is defined as ...a region comprising a number of
cities, large towns and other urban areas that through
population growth and physical expansion have merged to form
one continuous urban and industrially developed areas
(conurbationencyclopedic.com).
The conurbation of Nakonde and Tunduma towns had also been
as a result of the high rate of urbanization and migration
over the years. For instance, “Zambia is one of the most
urbanized countries in the Sub-Saharan Africa. The
proportion of the population that lived in urban areas was
40 percent in 1980, 39 percent in 1990 and 35 percent in
2000”, MoFNP (2007:5). Nakonde was also being urbanized at a
very fast rate with its population density of 25.5 percent,
a growth rate of 4.6 percent and 25, 063 houses just to
cater for a population of 138, 110 people, (CSO: 2011).
Migration also played a major role in the development of a
2
conurbation of this area especially internal migration. This
has been as a result of experiencing a lot of temporal
urban-rural migration which has increased the size of
population as people migrated to Nakonde just to do
business. Also, the increase in the number of government
departments in Nakonde had increased the migration of
government workers through transfers in various ministries.
The scenario dates back in time as, “the country has had a
long history of internal migration, dating back to the
colonial era,” (MoFNP, 2007:4).
Tunduma also accounted for a small population of 36, 500 out
of the total 2, 070, 046 of the Mbeya region of Tanzanian
Southern province, (www.tageo.com). This was because it was
the least developed and the people of Tanzania were not too
keen to settle there. The people who migrate to Tunduma are
mainly businessmen and women and also government workers for
the Immigration and the Tanzania Revenue Authority (TRA).
Therefore, it had been noted that most the developments were
mainly on the Zambian side, that is Nakonde.
However, in relation to the ever increasing population in
Zambia, while the government has been under a lot of
pressure to reduce poverty and enhance development not only
at the national level but also at family and individual
levels, the standards of living were still very low
3
especially for those in the low income earning group. About
67 percent of Zambians are living in poverty even though the
government has tried to reverse this scenario with the
various policies to diversify the economy and reduce on the
copper dependence (MoFNP: 2007). This has led to the
development of not only urban towns but also the rural
towns. This development has led to the growth of towns in
both population and geographical area. The transport
sector, that is road (Great North Road) and railway line
(Tanzania Zambia Railways) has also helped in the
development of Nakonde and Tunduma as they are both good in
both towns. A very good example of such a rural town growing
was Nakonde which had also expanded towards Tunduma town
leading to the formation of a conurbation between the two
towns.
1.2 Statement of the Problem
Nakonde town in Zambia and Tunduma town in Tanzania have
formed a conurbation which is between the border areas of
the two countries. It is a well-known fact that this area
has developed as a result of the transport system which
included the Tanzania-Zambia Railways (TAZARA) and the Great
North road. Unfortunately, this area had no secondary
industries as well as large commercial activities which are
the main driving forces for conurbation. Against all odds,
as compared to other countries or areas where conurbations
4
developed, it has also occurred on the border of Nakonde and
Tunduma which is between two countries, Zambia and Tanzania.
There have been some assumptions that this conurbation is
associated with a lot of factors such as economic
activities, marriages and the high demand for housing units
in Nakonde and Tunduma due to people migrating to this area.
It was believed that the economic activities had brought
multiplier effects in terms of incomes generated,
international trade, especially for agricultural produce,
increased employment opportunities and construction of
private houses. The booming business has also brought
increased crime rates evidenced by vices like smuggling,
robbery, prostitution and corruption. Marriage is assumed to
have played its role in factors such as the size of families
and the increased demand for housing units. Against such a
background, the researcher found it worthwhile to undertake
this research and investigate into the factors associated
with the conurbation of Nakonde and Tunduma towns and
ascertain the assumptions by bringing out the economic
activities, assess how marriage, children and fertility
affect population growth and ascertain the effects of
migration on the attitudes of life.
1.3 Aim
The main aim of this research was to investigate the factors
5
associated with the development of conurbation of Nakonde in
Zambia and Tunduma in Tanzania.
1.4 Objectives
i. To establish the types of economic activities which
encourage people to migrate into the conurbation of
Nakonde and Tunduma towns.
ii. To establish how marriage, children and fertility can
affect population growth to lead to the conurbation of
Nakonde and Tunduma towns.
iii. To ascertain the effects that the migration has on the
likelihood to settle as the development of the
conurbation of Nakonde and Tunduma towns occur.
1.5 Research Questions
i. Which economic activities encourage people to migrate
into the conurbation of Nakonde and Tunduma towns?
ii. How can marriage, children and fertility affect
population growth to lead to the conurbation of Nakonde
and Tunduma towns?
iv. What are the effects that the migration has on the
likelihood to settle as the development of the
conurbation of Nakonde and Tunduma towns occur?
1.6 Hypotheses
i. People migrate to Nakonde and Tunduma due to the
economic activities which have contributed to the
6
conurbation of the area.
ii. People settle in Nakonde and Tunduma due to the
presence of services in the two towns.
1.7 Rationale
Governments need to fully understand factors that impact on
population growth in the country in order to better provide
services for their people. Appropriate policies can also be
best made if challenges are identified and possible
solutions found. The results of this research will,
therefore, add knowledge to the existing data especially on
conurbation. Since the issues on migration play a very low
profile in the census for Zambia, this research will show
how it affects some geographical areas of Zambia. This study
will also be a basis for other researchers in future,
especially those who would want to improve, add or challenge
the findings of this research. The policy makers such as the
government of Zambia may also use the findings of this
research to improve or remove some of the policies which
have brought challenges in governance, programme
implementation and ultimately the lives of the people.
7
CHAPTER TWO
LITERATURE REVIEW, CONCEPTUAL AND THEORETICAL
FRAMEWORK
2.1 Introduction
The conurbation of towns or cities is a topic which has been
there as far back as the 19th Century. Even if this has been
the case, it has not received a considerable amount of
publication for a common person to understand its meaning,
how it came about and the factors that were associated with
its development. Furthermore, its literature is scanty as
well as almost unavailable to researchers and even the
common person. Although, related topics have highlighted
8
conurbation in brief in Urban Geography under urban sprawl,
Borderlands and Transborder mobility. However, literature
records that, Patrick Goddes in his book (Cities in
Evolution) coined the term as a neologism in 1915, where he
drew attention to the ability of the term then, as new
technology of electric power and motorized transport to
allow cities to spread and agglomerate together. Goddes gave
an example of Midlanton in England, the Ruhr in Germany, New
York in United States of America (USA) and the Greater Tokyo
area and Taiheiyo in Japan (conurbationencyclopedic.com).
This literature review further highlights on the global
trends, regional trends, Zambian trends and the study area
of conurbation by stating a number of examples about the
development of conurbation. In addition, the vital concepts
and theories are examined as they focused on how the subject
matter is handled and the aspects which needed more emphasis
as stated in the conceptual and theoretical framework.
2.2 Definitions
The main concepts that are used include conurbation,
economic activities, marriages as well as migration which
are the main or core of the topic under study. The
understanding of the term conurbation came from the
definition as given by Patrick Goddes who was quoted by
(conurbationencyclopedic.com) as;“...a region comprising a number of cities, large towns and
9
other urban areas that through
population growth and physical expansion have merged to form
one continuous urban and industrially developed area.”
Nevertheless, a conurbation as defined above could only
occur if there is the migration of the population and
capital both liquid and fixed. Therefore, migration is a
concept that could never be left out when investigating an
issue of conurbation. In simple terms, migration is the
movement of people from one place of origin to another area
of destination (Todaro: 2003). For the research under review
to be completely investigated, economic activities were
those practices that helped in the development of an area.
It could be trade, education, agriculture, mining and
infrastructural development to mention only but a few,
(Encyclopedia Britannica: 2009). Lastly, marriage was stated
to be a legally and socially sanctioned union, usually
between a man and a woman, that was regulated by laws,
rules, customs, beliefs, and attitudes that prescribe the
rights and duties of the partners and accords status to
their offspring (if any), (Encyclopedia Britannica: 2009).
The universality of marriage within different societies and
cultures was attributed to the many basic social and
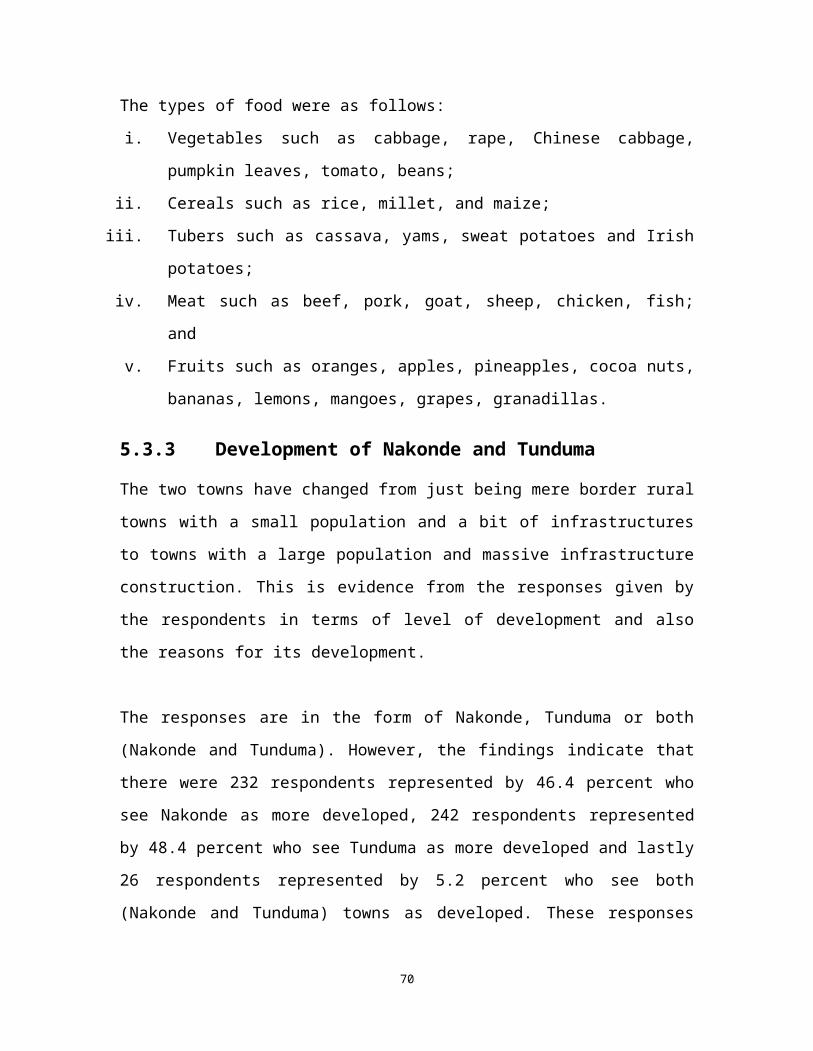
personal functions for which it provided structure, such as
sexual gratification and regulation, division of labour
between the sexes, economic production and consumption, and
satisfaction of personal needs for affection, status, and
10
companionship; perhaps its strongest function concerned
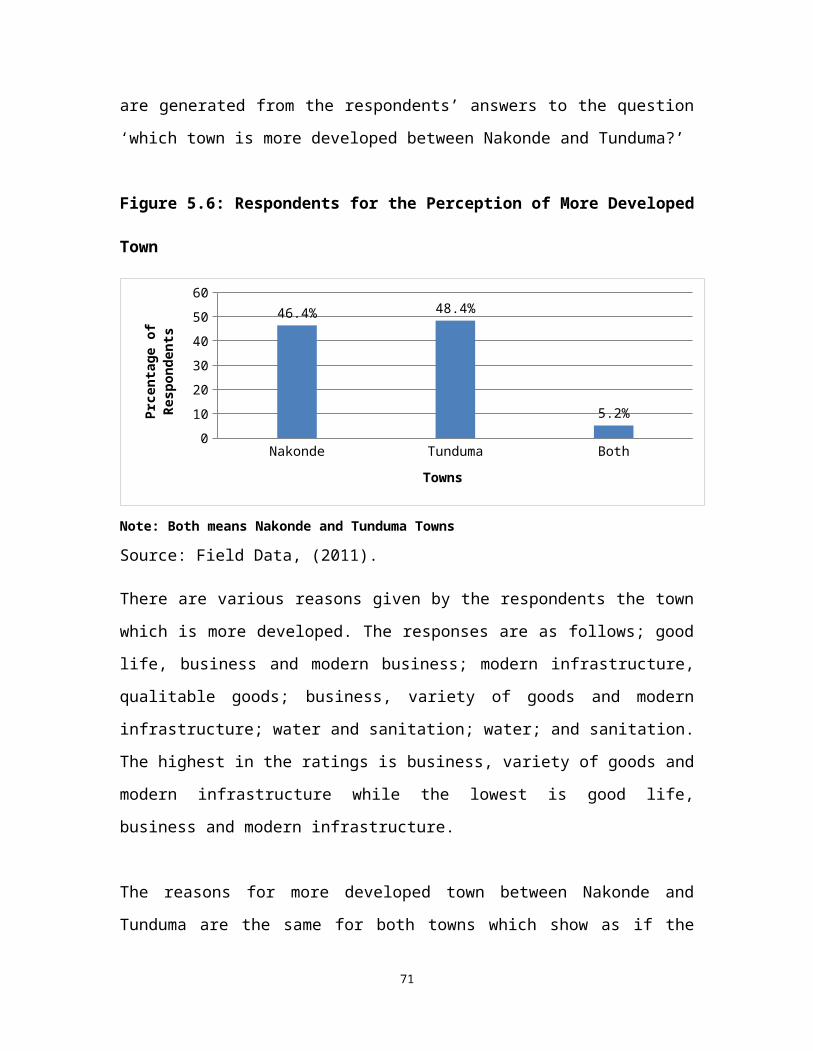
procreation, the care of children and their education and
socialization, and regulation of lines of descent. With
time, marriages have taken a great number of forms. However,
the forms of marriage that were important to this research
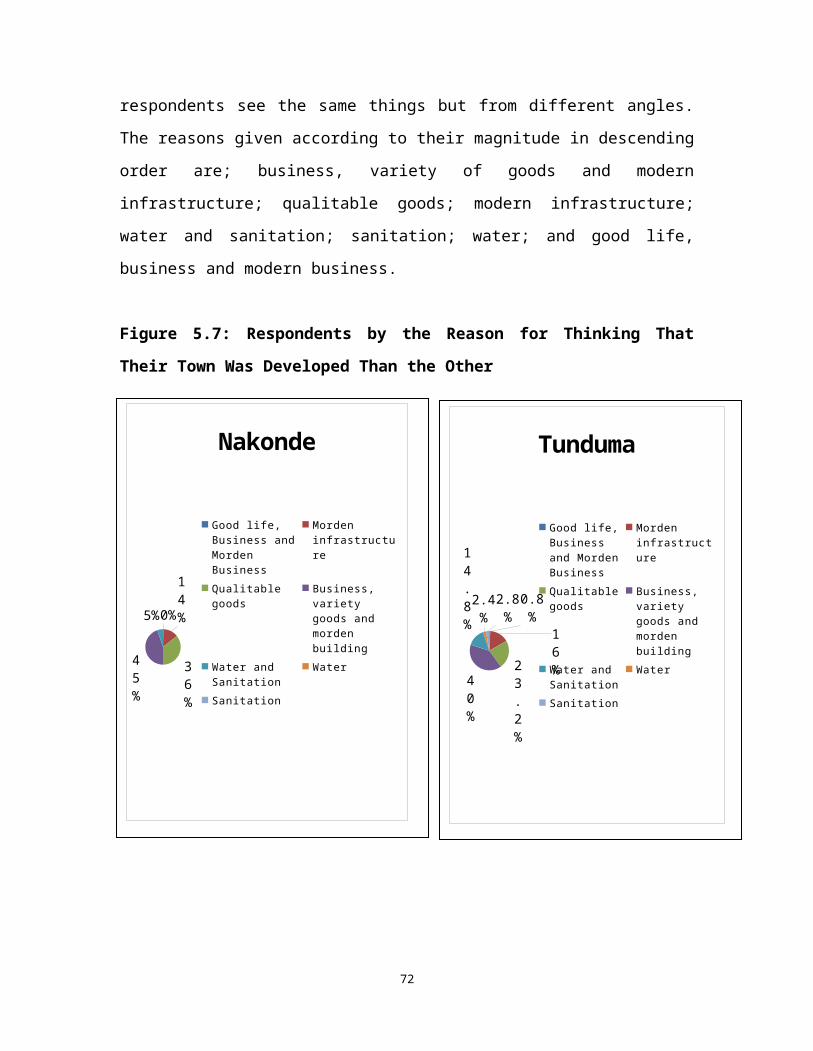
were intermarriages. This is because marriage can be a way
of contributing to population growth through child bearing
especially when the issue of age at first marriage and the
bias toward having many children is considered. It can also
contribute to the physical expansion of land through the
building up of the houses as the need for houses increases
as people get into marriage in most of the African settings.
2.3 Global Trends of Conurbations
Global trends or examples of conurbations are many as they
have occurred on different degrees in terms of time,
population, space and number of cities. This literature
reviewed eight conurbation occurrences at a global level.
In this regard, there was a list of conurbation examples in
the United Kingdom which included Greater London and the
Green Belt of England. Both occurred during the nineteenth
and twentieth centuries and where as a result of industrial
and housing growth of urban and later rural area.
Since the 1930s, there have been migrations of population
11
from the inner cities to the suburbs. This was accelerated
by improved public transport provisions and private car
ownership which helped in the migration process. This was as
a result of poor housing quality, traffic congestion,
decline of older secondary industries, lack of open space,
low income only to mention but a few, (Waugh: 1995). The
suburbs are able to offer the opposite of what the inner
cities were offering. However, recently there has been a
reversal of this migration and the inner cities had become
regenerated and attracted a counter current of migration to
the inner cities. It led to the development of both inner
cities and suburbs and had created a conurbation of three
cities that were Croydon, Bromley and Baxley known as the
Greater London, (Hall: 2002).
The other incidence of conurbation in the United Kingdom was
that of the Green Belt which happened in the mid-1950s in
the country side of England. This area had various cities
involved and all of them experienced conurbation as a result
of the urbanization of the countryside of England.
The Ruhr city in Germany was yet another global example of
conurbation. It had a densely populated polycentric
metropolitan region in the western part comprising the three
sub regions of the Ruhr metropolitan region, Düsseldorf –
Moncheng – Ladbach – Wippertal region and Cologne/ Boun
12
Metropolitan region (Hall: 2002). All of the three were
interlinked by a continuous urban settlement which at the
same time housing different cultural and economic agendas.
For instance, the Ruhr was into mining and the iron and
steel industry while the second was into assembly and the
third into manufacturing.
The United States of America (USA) also had four areas which
clearly indicated the occurrence of conurbation. These were
New York tri-state area, San Francisco Bay area, Greater Los
Angeles area and Baltimore-Washington area. The New York
tri-state included New Jersey-Connecticut, Pennsylvania and
New York State itself. These resulted into conurbation as
several central cities expanded their economic activities
and attracted new industries and services such as banking,
insurance and government offices. There were also high
levels of capital and technology which attracted a lot of
in-migrants from the rural areas and the result was the
merging together of all these cities. The United States
Census Bureau (USCB) (2007), affirmed to this conurbation
where it stated that the New York metropolitan area (the
tri-state region) centred around New York city including 30
cities which spread between New York state, New Jersey-
Connecticut and Pennsylvania, with an estimated population
of 21, 961, 961 in 2007 were approximately 1 out of 15
United States residents lived in the Great New York city
13
area.
Francisco Bay area, known for its recreation and tourism was
another conurbation which was a combination of the
metropolitan areas of San Francisco, Oakland and San Jose.
The Greater Los Angeles area known for its entertainment
industry was a conurbation which consisted of several
district central cities namely; Los Angeles, Santa Ana,
Riverside and San Bernardino. There was also the Baltimore-
Washington area which had shared suburbs and a continuous
urbanization between the two central cities (USCB: 2007).
Conurbation had occurred in Japan in two major areas called
the Taiheiyo belt and Greater Tokyo. The two areas not only
had a continuous expansion of the area but also supported
large populations and had well developed economic
activities. The Taiheiyo belt was the largest in Japan
extending from Ibaraki prefecture to Fukuoka prefecture
running almost 1, 200km with a total population of 82.9
million while the Greater Tokyo were also known as Shutoken
(the National Capital Region) was a metropolitan area in the
Kanto region with estimated population of 35, 676, 000 in
2007. The latter was often referred to as the west populous
and economically largest metropolitan area in the world
(Hall: 2002)
14
Statistics Canada (SC) (2006), acclaimed to conurbation of
the ‘Golden Horseshoe’ which was a densely populated and
industrialized region centred on the west end of Lake
Ontario in southern Ontario. It covered the Windsor-Quebec
city corridor. By the year 2006, it supported a population
of 8.1 million people which made it slightly over a quarter
(25.6 Percent) of the population of Canada and containing
approximately 75 percent of Ontario’s population (SC: 2006).
Asia is another global trend of conurbation with an example
of India. With its rapid growing economy and population, it
is definitely unavoidable to find cities merging together
due to rural-urban migration. The National Capital Region
New Delhi was the Tri-state region which was the name for
conurbation area which encompassed the entire national
capital territory of Delhi as well as urban areas ringing it
in neighbouring states of Uttar Pradesh, Haryana and
Rajasthan. It was one of the largest world conurbations with
a total area of 33, 578 km² and an estimated population of
21, 961, 994 in 2007 (conurbation encyclopaedic.com).
Another appropriate example of conurbation is the Randstad
of the Netherlands. The area was densely populated
consisting of the four biggest cities (Amsterdam, Haurlem,
Hague and Rotterdam) of the country and several smaller
cities, towns and urbanized villages. The area developed
15
rapidly and attracted a large population from all over
Europe due to “fertile soils which encourage intensive
commercial farming and its proximity to a large domestic
market,” (Waugh 1995: 448).
2.4 Regional Trends of Conurbation
Regional trends of conurbation were not so many in Africa as
a whole as most of the cities and towns were still growing
and are economically young. Sudan has a conurbation of two
principal cities that was Khartoum and Omdurman. They did
not cover a very extensive area but supported a population
of 2, 919, 713 by 1993 (United Nations (UN): 2009). However,
over the years this population had grown rapidly as there
had been massive rural-urban migration especially from
Southern Sudan were the war had dominated. Most of these
migrants sought refuge from the war and looked for
employment on a permanent basis according to Brinkoff (2006:
104), “Khartoum and Omdurman towns had a large influx of in-
migrants who seek to find peace and jobs...they end up
building permanent housing units on every land that has
space, hence expanding towns towards each other and
providing labour to the agriculture sector and a few
industries found in the area”.
Another example of conurbation is in South Africa which
extends from Pretoria, Witwatersrand and Vereeniging
16
complex. It was an extensive conurbation in southern Africa
with the combination of urban and peri-urban areas covering
an area exceeding
5, 000 km². This region had attracted an in-migrant and in-
immigrant from within the country, Sothern Africa and the
world at large to its mining and iron industries. These not
only provided employment but also housing units for the
massive employees
(Tyson: 1972). However, over the years the area has an
economic agglomeration of industries which supported the
mining sector such as commercial centers and service
(banking and government offices). All these provided an
added number of jobs and attracted a lot of migrants who
were employment seekers.
Kinshasa and Brazzaville was another conurbation. However,
it had a natural barrier the Congo River between the borders
of the Democratic Republic of Congo (CDR) and the Republic
of Congo (RC). Due to the advantage of the deep sea bigger
port on the Republic of Congo and the economic integration
with the west of Africa, the two countries had signed an
agreement on the project of the bridge road-rail Kinshasa to
connect them, (www.skyscrapercity.com). This would boost the
economic activities which already existed, activate the
construction of buildings and also enhance the integration
of the two cultures.
17
2.5 Zambian trends of Conurbation
Studies on conurbation have barely been done in Zambia. This
was evident by the scanty availability of its written
documentation on Zambia. However, it is worth mentioning
that similar studies on this subject had been conducted
although such attempts had been partial and not fully
satisfactory to the subject of conurbation. Similarly in
1978, a student Chanda Raban in the School of Natural
Sciences Geography Department did a research on ‘Rural-urban
migration in Zambia: an economic Imperative?’ This research
brought out issues that were related to conurbation. For
instance, if rural-urban migration was not controlled, it
would have led to an expansion of urban areas in terms of
space, population and stimulated numerous economic
activities, (Chanda: 1978). This issue of rural urban
migration as illustrated by Chanda Raban clearly indicated
an element of conurbation. It is important to note that even
though studies have not been made but observed that Lusaka-
Chilanga-Kafue, Ndola-Luanshya and Chiliabombwe-Chingola are
also conurbation in the making.
18
2.6 Study Area of Conurbation.
Nakonde town’s District was initially part of Isoka district
until in 1994 when it was declared an independent district.
However, it took about 16 years for it to be considered an
independent town as most of the paper work had not changed.
For example, the official counting of people in Nakonde was
only considered for the 2010 Census, the government
employees would travel to Isoka to collect their salaries as
Nakonde had no bank until 2000, only to mention a few. As
for Tunduma, it was part of Mbeya for a long time. This is
because the area was not being developed by the Tanzanians
as it was considered an agricultural area. However, when
business started growing, Mbeya could no longer handle is
affairs hence was separated in the early 1990.
It is also noted that both Nakonde and Tunduma towns were
one at one point and that is the reason for their having the
development of a conurbation on a faster rate. This was
confirmed by the Immigration officer who stated that:the border was Mupemba River regarded as the tail of Muchinga Escarpment and all
the people in this area were
regarded as Namwangas and the last station by then was Tunduma. However, after
independence for both countries
in 1964 and 1961 for Zambia and Tanzania respectively, there was a need to
repartition the boundaries. It is believed
by the local and indigenous people that between 1964 and 1970 the boundary for
Zambia was compromised,
hence, Mupemba was cut off from Zambia. This was done as a result of the then
republican presidents Kenneth
Kaunda and Julius Nyerere for Zambia and Tanzania respectively being in-laws.
19
Kaunda’s son had married the
daughter to Nyerere. Unfortunately, boundary issue brought a lot of problems as
the people who were Zambians
were misplaced and refused to move to the repartitioned Zambian border as they had
no enough land for farming or
cattle rearing. Therefore, they decided to stay in Tanzania but still maintained
that they were Zambian. Therefore, this
is the reason why the border area has the same languages that is Namwanga and
Swahili, same names and the same
Chief Wayitwika. For these reasons, the Immigration Office has a challenging task
in ensuring that issues of migration
are handled properly. This gives a history of the development of the conurbation
that exists between Nakonde and
Tunduma towns and verifies the reasons for the similarities in years of migration.
All in all, the selection of Nakonde and Tunduma towns as a
practical example of conurbation qualified well. This was
because the state of these towns provided a perfect model of
study. Its growing economy satisfied and quantified the
literature evidence as compared to several examples given
earlier in my research. Above all the theories of
conurbation and its occurrences matched well to this.
Unfortunately, this area had not seen any growth of large
industries that could attract migrants as it had been the
cases with other countries where conurbations have
developed. Global trends of migration had shown that
conurbation was stimulated by migration and also the
presence of industries and a large population. However,
regional and Zambia on conurbation trends has shown very few
areas of conurbation due to the fact that their cities and
towns were still growing and were developing yet also had
20
young economies. As for Zambia there is scanty literature on
any studies undertaken on conurbation. This research
investigated the factors associated with the Conurbation of
Nakonde and Tunduma towns and paid particular attention to
the fact that these two towns were in different countries
(Zambia and Tanzania) and did not have well-developed
industries as was the case in all the conurbations reviewed
in the literature.
2.7 Conceptual Framework
The main concepts in this research were conurbation,
economic activities, culture, migration and urbanization
which are defined by the way they operated in this research.
2.7.1 Concept Definitions
Conurbation is a region comprising a number of cities, towns
and other urban areas that through population growth and
physical expansion has merged to form one continuous urban
or industrially developed area.
Economic activities are those elements which run the economy
such as business, trade, education (where it is seen as a
business as well as a social service), agriculture and
industries
Education is a place where learning takes place for the
pupil while business takes place for the provider
Marriage is a legally and socially sanctioned union, usually
between a man and a woman, that was regulated by laws,
21
rules, customs, beliefs, and attitudes that prescribe the
rights and duties of the partners and accords status to
their offspring (if any)
Migration is the permanent change of residence by an
individual or group.
Urbanization is the process by which large numbers of people
become permanently concentrated in relatively small areas
which may form cities.
Traditional Marriages are marriages built on traditional
ideals.
Western marriages are marriages which are characterized by a
white wedding with no traditions attached to it.
Businesses are those activities which provide a working
environment with employers and employees
Own (Houses) refers to the self-built houses.
Likelihood to settle is to be able to live in one area
without migrating.
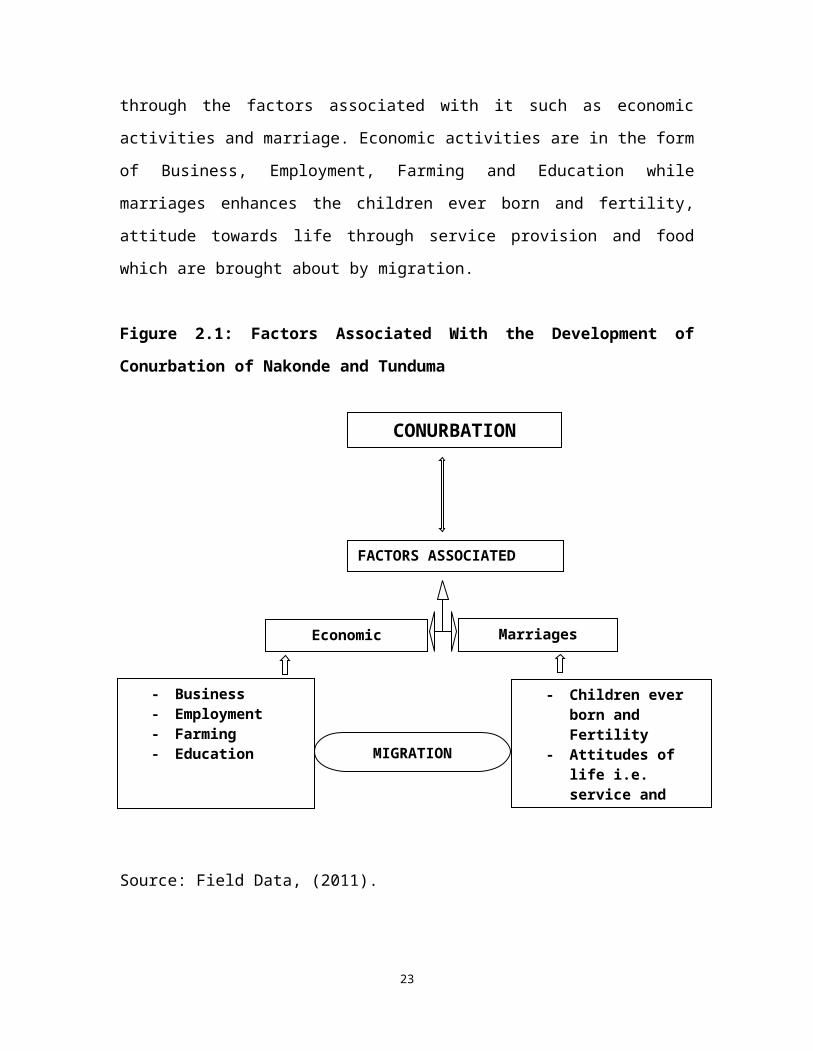
2.7.2 Operational of concepts
Figure 2.1 illustrates how the factors associated with
conurbation could be related to Nakonde and Tunduma towns.
This is a simple typologies design to help understand the
formation or development of conurbation from the eyes of the
researcher. It shows how the relationship of conurbation
with migration is enhanced through the factors associated
with it. To begin with, conurbation development is enhanced
22
through the factors associated with it such as economic
activities and marriage. Economic activities are in the form
of Business, Employment, Farming and Education while
marriages enhances the children ever born and fertility,
attitude towards life through service provision and food
which are brought about by migration.
Figure 2.1: Factors Associated With the Development of
Conurbation of Nakonde and Tunduma
Source: Field Data, (2011).
23
CONURBATION
FACTORS ASSOCIATED
EconomicActivities
Marriages
MIGRATION
- Business- Employment- Farming- Education
- Children ever born and Fertility
- Attitudes of life i.e. service and
2.8 Theoretical Framework
This theoretical framework adopted two theories of migration
for the investigation of the topic at hand. These were Lee’s
(1969) theory of migration that is the revised ‘Pull and
Push model’ and the Ravenstein (1885) theory of migration –
migration laws.
Lee’s theory on the pull and push model is used to explain a
conurbation. The pull factors are those which encouraged
people to migrate to towns or cities. The favourable
conditions such as “better housing, job prospects, more
reliable sources of food and better services in health and
education” (Waugh, 1995: 343). This usually pulls people
from rural areas to urban areas.
Therefore, it is a common trend today to be attached to a
place with all the good conditions perceived to aid the
betterment of one’s life. It is in this process of migration
that people migrated with their skills which they used and
ended up developing the areas they migrated to. Hence, if
there are two or more towns or other cities with the same
trend, they grew outside till they looked like one town from
an aerial view there by forming a conurbation of towns.
There are also the push factors which forced or encouraged
people to move from the rural areas. These included the
unfavourable conditions such as natural disasters as
droughts, floods, earthquakes, the inability to own land due
24
to stiff laws of the land, food shortages, unemployment and
witchcraft only to mention but a few, (Waugh: 1995).
In another theory by Ravenstein (1885), on migration laws,
migration led to conurbation of towns. Even though the
migration laws were based on his studies of migration within
the United Kingdom, they could also be applied to other
areas. For instance, one of his laws of migration was quoted
by Waugh, (1995: 337), as, “migration occurs in waves and
the vacuum left as one group of people moves out will later
be filled by a counter current of people moving in”. This
could be related to conurbation as the population would
never drop as long as the counter current of people moving
in such places continued. This means that labour would
always be there and also trade would equally continue.
Hence, such areas will always grow economically.
Waugh, (1995: 337), also states that, “the longer the
journey, the more likely it is that the migrants will end up
in a major center of industry and commerce”. The areas where
conurbation has occurred usually received migrants from very
far off areas. Therefore, these migrants are not likely to
migrate back to their places of origin. Instead, they will
cause more migration activities to take place especially of
their close relatives as they reduced the cost of migration
for them with the income they had made by sponsoring their
25
journey and also the accommodation they have acquired. Such
migrants are usually not the returning type, hence they
migrate to urban areas on permanent basis. Therefore, for
the fact that they are on permanent basis, they are able to
provide labour on a permanent arrangement and also find or
build permanent accommodation. Hence, if such happens there
would be not only population increase but also the area
under coverage would also spread in a conurbated area.
In most cases of conurbation, females migrate in greater
numbers than males within their country of birth. However,
males did not only migrate within their country but to other
countries. For this reason, most areas where conurbation had
occurred had more males than females. The male are mainly
involved in trade and also provide labour in the industries.
These migrants usually move with different skills such as
marketing, engineering, and management, while others had
monetary capital (liquid capital). With these things, the
area that migrants moved to would not remain static in terms
of development but would be dynamic. This was in line with
Ravenstein migration law, which states that, “females
migrate more than males within their country of birth, but
males are more likely to move further afield,” (Waugh, 1995:
337).
26
CHAPTER THREE
METHODOLOGY3.1 Introduction
This chapter brings out the research methodology based on an
exploratory study design that used both qualitative and
quantitative data sources. Qualitative data sources are
mainly for the informative information for description
purposes while quantitative data source is for the numerical
information for statistical analysis. It also highlights on
the study population, sampling procedures, instruments for
data collection and data analysis.
3.2 Study Population
The study population has both women and men who resided or
migrated in Nakonde or Tunduma. It consisted of the
residents or traders who were in formal or informal
employment and also the managers of some government
departments. This selection is based on the fact that these
are the kind of people who will help in bringing out the
27
information on the factors associated with the development
of the conurbation of Nakonde and Tunduma.
3.2.1 Sample Size and Procedure
The population for Nakonde is 138, 110, (CSO: 2011) and for
Tunduma is 36, 500. The sample size is 500 consisting of 250
people for Nakonde which has 124 males and 126 females and
also 250 people from Tunduma consisted of 126 males and124
females. The age group was confined to the ages from 15 and
above. The sample size was determined by using computer
aided software called the Survey System where both Nakonde
and Tunduma have confidence level of 95 percent and
confidence interval (also called margin of error) is 6.2.
The confidence level will indicate that the results will
reflect a 95 percent certainty while the confidence interval
will be at 6.2 meaning that 50 percent of the initial
population, if they answered the questions will lie between
43.8 percent (50 – 6.2) and 56.2 percent (50 + 6.2) in terms
of accuracy. The formula used is as follows:
ss=Z²∗(p)∗(1−p)
c²
where:
ss = sample size
Z = Z values (1.96 for 95 percent confidence level)
28
P = percentage picking a choice, expressed in decimal
(0.5 used for sample size
needed)
C = confidence interval, expressed as a decimal
(example 0.04 = ±4).
There are also 5 key informants who include one person from
each of the Zambian government departments, Nakonde
Municipal Council, Immigration and ZRA and one person from
Immigration Department of Tanzania and one person from the
Tanzania Revenue Authority.
The sampling procedure followed Systematic sampling method
in selecting the 500 respondents for the research. The
method used the following formulas to come up with an
interval when collecting data from the population as
indicated below:
iv= pss
where: iv = interval between respondents
p = total population
ss = sample size
However, it should be noted that the interval obtained for
Nakonde is 552.44 and Tunduma 146 which was too big for an
29
interval, therefore, they were both divided by 100 in order
to reduce the interval to a manageable size. The results
were Nakonde 6 and Tunduma 1. The starting point for Nakonde
was done with a simple random sampling Rotary where numbers
1 to 6 where put in a box and the first number which was
picked was the starting point. As for Tunduma it was
automatically person number 1.
A purposeful technique was used on the key informants in
gathering information which was specific especially that the
topic touched some very sensitive issues hence the use of
personnel from the government departments. These came from
the Municipal councils, Immigration offices and Revenue
Authority both in Nakonde and Tunduma towns.
3.3 Data Collection Methods
There were two methods that were used for the collection of
data, namely; primary and secondary sources.
3.3.1 Primary Sources
This was the information that was first hand to the
researcher by the use of a questionnaire and a non-scheduled
interview.
3.3.1.1 Questionnaire
This was the principal source of data collection from the
ordinary people. The questions were both open ended
30
questions and closed-ended. Open ended questions gave the
respondents freedom to express their views without
restrictions, guidelines or suggestions while closed-ended
questions helped in gathering facts and confirming already
known facts. They were also designed clearly so as to
achieve the objectives of the research on economic
activities, marriage patterns and the effects of migration
on the attitudes towards life.
3.3.1.2 Non Scheduled Interview
This was used on key people from the government departments
as they were providing very sensitive information. The
questions were closed-ended just to confirm the facts and
also open ended to solicit for clarity on certain issues
that related to the research at hand. The information was
mainly concerned with the objective on coping mechanisms
developed by the Zambian government’s departments (Nakonde
Municipal Council, Immigration and Zambia Revenue Authority)
in dealing with the consequences of the conurbation of
Nakonde and Tunduma towns. It also provided the background
information on the development of the town in terms of when
it was established, the functions of the government
departments and how they have contributed to the development
of the towns.
3.3.2 Secondary Sources
This information was second hand to the researcher. It was
31
collected from the available literature materials that were
research books, articles, journals, publications and other
academic materials from the library and the internet. This
information was on the already worked on data which was
analyzed, criticized and also interpreted in an academic
manner. Most of this information was used for literature
review which provided insight on the topic on the
development of conurbations in the world.
3.4 Data Analysis
The data was analyzed using quantitative methods which were
computer based. The computer statistical software which was
used for data analysis was Microsoft Excel, Statistical
Package for Social Sciences (SPSS), Chi-square test, Binary
Logistic Regression and the Brass Estimation of Fertility
Method. These helped in presenting the data in tables,
graphs and flow charts to show relationships or patterns.
3.5 Variables
Variables included both the independent and dependent
variables. The independent variables were economic
activities, marriages, children and fertility among the
people in Nakonde and Tunduma towns. The dependent variables
were migration and the services provided in Nakonde and
Tunduma.
32
3.6 Ethical Consideration
Firstly, approval to carry out the research was obtained
from the Research Ethics Committee. Secondly, written
permission to carry out the study was obtained from the
Nakonde Municipal Council, Immigration departments and ZRA.
Lastly, strict confidentiality was maintained and observed
at all times and assured that responses were purely for
academic purposes. This was done by informing the
respondents that the information collected was for academic
purposes only and that the all the responses given would
remain confidential and that their participation would not
pose any risk to them. The respondents were further assured
of anonymity, and that, although some of the information
they provided may be published, their names would not be
associated with the publication.
3.7 Challenges of the Study
The undertaking of this research was not easy due to the
limited time and finances. However, the researcher applied
for an extended local leave from work after being recalled
for work during the progression of the course and also got a
loan from the bank to cover the extra expenses that were
involved. The long distance from Lusaka to Nakonde was also
a challenge while in addition to the language barrier
especially when dealing with foreign traders and those who
could neither speak neither English nor Bemba. Fortunately,
33
the researcher found time by staying in the area for a month
in order to collect data and also used the help of research
assistants who were residents of Nakonde and also spoke
Swahili. There was also the aspect of hostility on the
Tanzanian side as people thought that the study was under
the government of Zambia and likely to reduce their business
at the border. This was handled well as the researcher
followed the right channels in getting written permission to
undertake this research from the department, Ministry of
Foreign Affairs and lastly the Tanzanian Embassy. Due to
these measures which were taken, the results were not
affected in any way as there was a solution for each of the
challenges faced as stated above.
CHAPTER FOUR
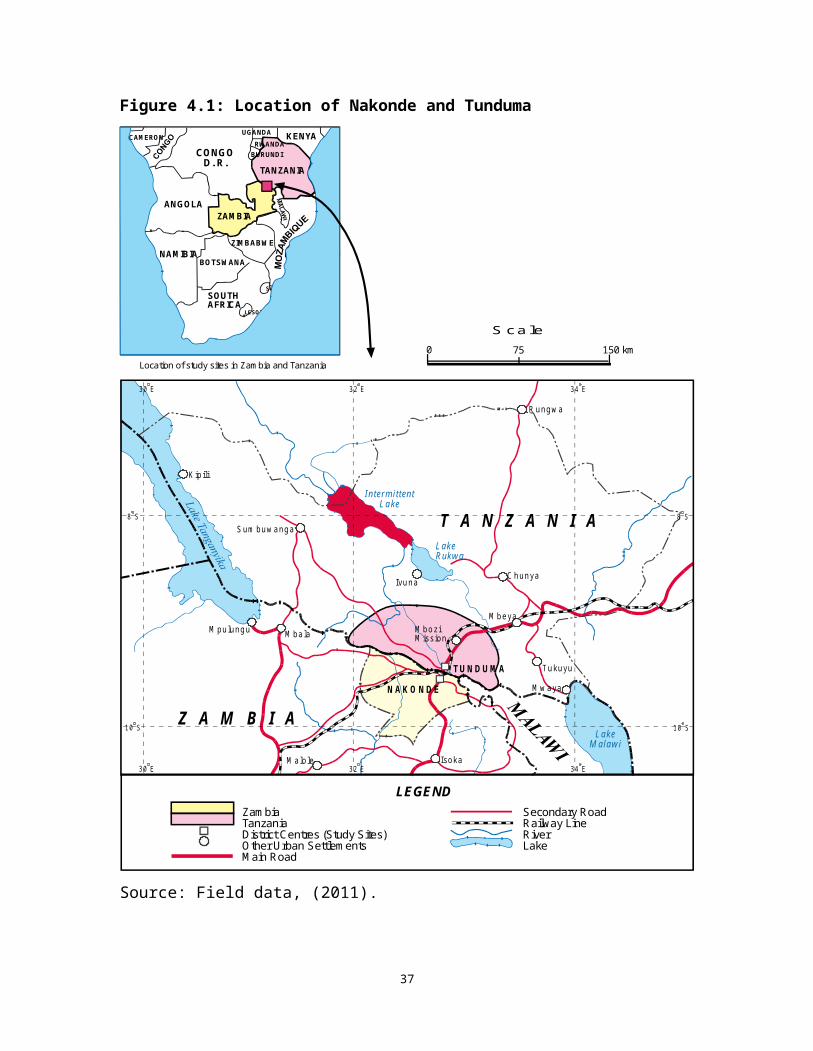
THE STUDY AREA4.0 Introduction
This section will highlight on the location and importance
of the study area in relation to the development of a
34
conurbation in Nakonde and Tunduma towns. The location will
show the geographical position of Nakonde in Zambia and
Tunduma in Tanzania. The importance of Nakonde and Tunduma
towns being an exceptional border area where the development
of conurbation has taken place in two different countries
and also the business which is the major reason for trade.
4.1 Location
Nakonde town is located in Muchinga Province (includes parts
of Northern and Eastern Provinces) and located to the north
east of Zambia while Tunduma town is located in Mbeya region
also referred to as the Southern Province and located to the
south west of Tanzania. Geographically, the area under study
was Nakonde which is located 9 degree 19 minutes south of
the equator and 32 degrees 46minutes East of Greenwich
meridian (9 19S 32 46E) while Tunduma is located 9 degree 19
minutes south of the equator and 32 degrees 47 minutes east
of the Greenwich meridian (9 19S 32 47E). These two towns
border the two countries of Zambia and Tanzania.
Both towns have a tropical climate with three distinct
seasons that is the warm wet season from November to April
(Rain season), a cool dry winter from May to August (Cold
season) and the hot dry season during September and October
(Hot season). The main seasons are winter and summer as it
is found in the tropical region of the world. During the
35
rainy season the area received rainfall above average that
was above 2000 mm while in the hot season temperatures are
as high as 38 degrees Celsius.
The area also has a tropical vegetation consisted of
woodlands and also grasslands. The woodlands are covered
with forests endured with different kinds of trees while the
grasslands are covered with short and tall grass.
soils
36
Figure 4.1: Location of Nakonde and Tunduma
CONG OD. R.
KENYAUGANDARW ANDABURUNDI
ANGOLA
ZIM BABW E
BOTSW ANANAM IBIA
SW AZILAND
LESO THO
SOUTHAFRICA
CAM ERO N
TANZANIA
ZAM BIA
Nakonde/Nakonde/Tundum aTundum a
LEGE NDZam biaTanzaniaDistrict Centres (Study Sites)Other Urban Settlem entsM ain Road
Secondary RoadRailway LineRiverLake
T U N D U M A
N A K O N D E
L akeM alaw i
L akeR ukwa
IntermittentL ake
Isoka
S cale0 75 150 km
30 E
30 E
32 E
32 E
34 E
34 E
8 S8 S
10 S10 S
Location of study sites in Zam bia and Tanzania
M balaM pulungu
M alole
Ivuna
M beya
T ukuyu
M boziM ission
S um buw anga
K ipili
C hunya
R ungw a
T A N Z A N I A
M w aya
Z A M B I A
Source: Field data, (2011).
37
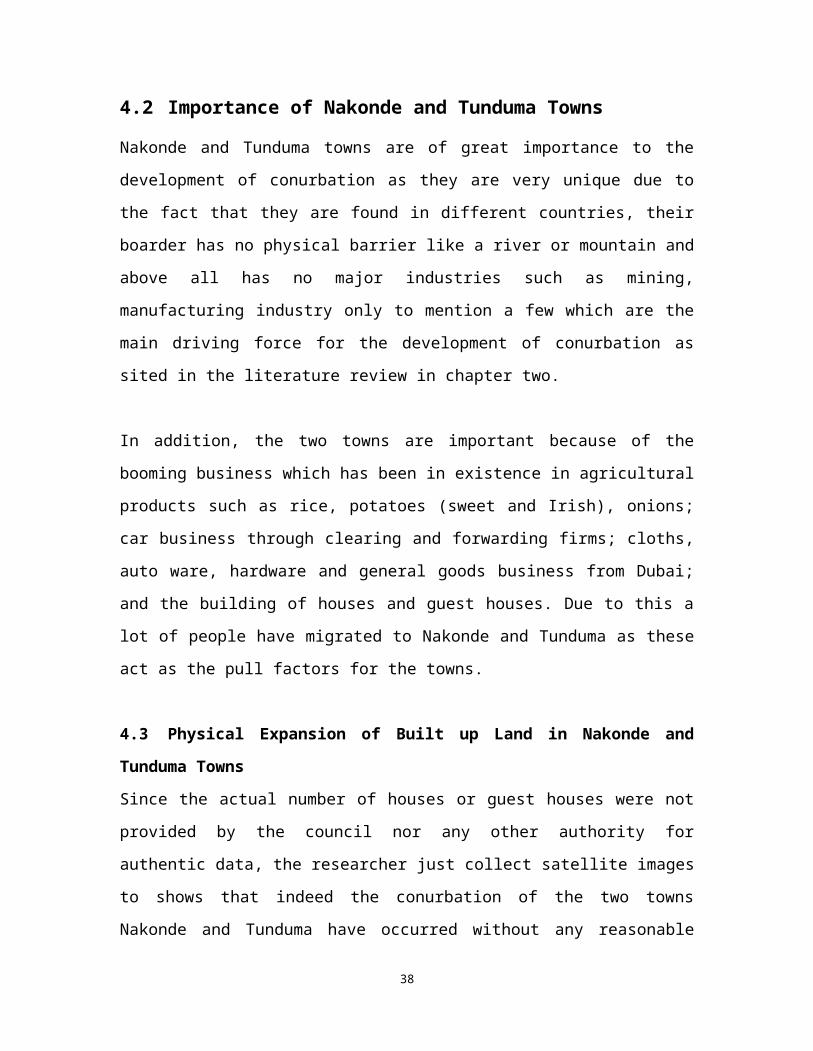
4.2 Importance of Nakonde and Tunduma Towns
Nakonde and Tunduma towns are of great importance to the
development of conurbation as they are very unique due to
the fact that they are found in different countries, their
boarder has no physical barrier like a river or mountain and
above all has no major industries such as mining,
manufacturing industry only to mention a few which are the
main driving force for the development of conurbation as
sited in the literature review in chapter two.
In addition, the two towns are important because of the
booming business which has been in existence in agricultural
products such as rice, potatoes (sweet and Irish), onions;
car business through clearing and forwarding firms; cloths,
auto ware, hardware and general goods business from Dubai;
and the building of houses and guest houses. Due to this a
lot of people have migrated to Nakonde and Tunduma as these
act as the pull factors for the towns.
4.3 Physical Expansion of Built up Land in Nakonde and
Tunduma Towns
Since the actual number of houses or guest houses were not
provided by the council nor any other authority for
authentic data, the researcher just collect satellite images
to shows that indeed the conurbation of the two towns
Nakonde and Tunduma have occurred without any reasonable
38
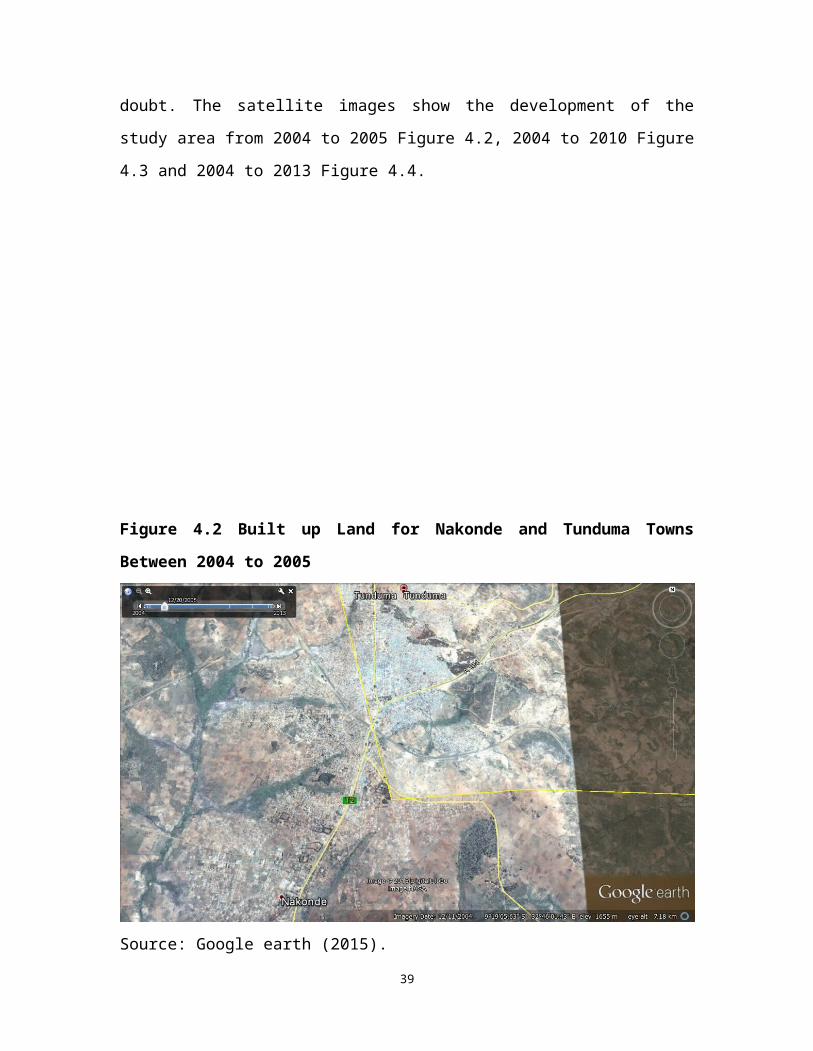
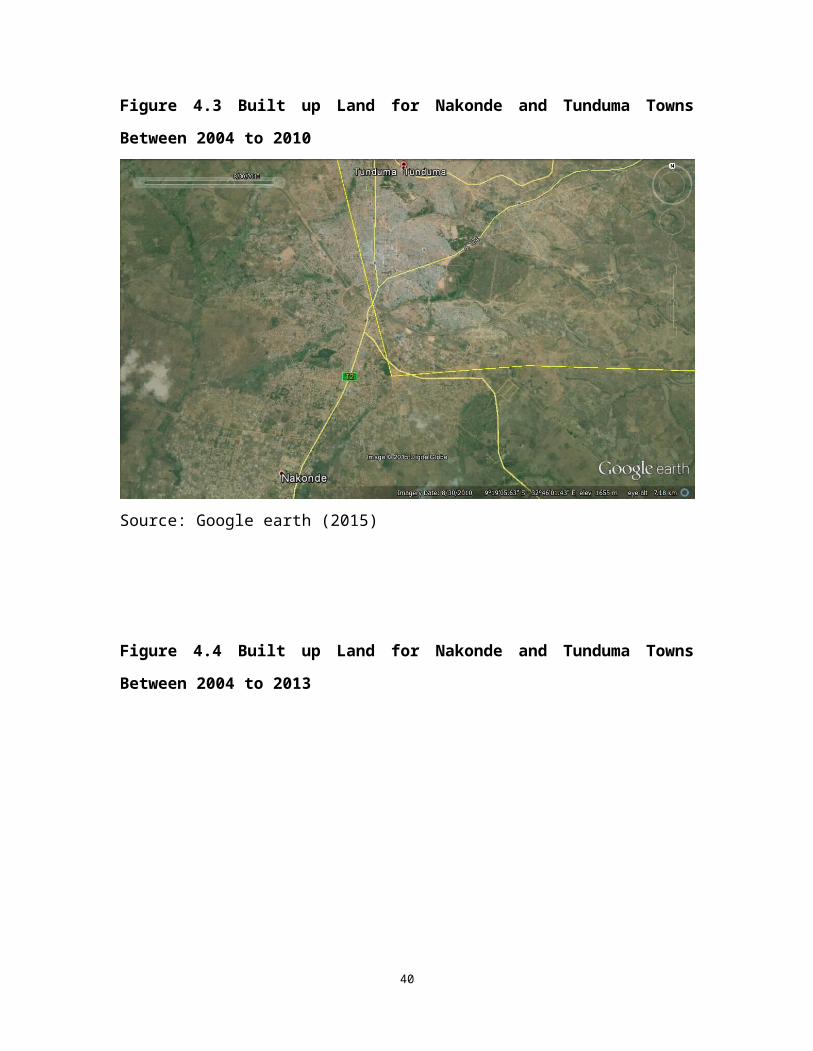
doubt. The satellite images show the development of the
study area from 2004 to 2005 Figure 4.2, 2004 to 2010 Figure
4.3 and 2004 to 2013 Figure 4.4.
Figure 4.2 Built up Land for Nakonde and Tunduma Towns
Between 2004 to 2005
Source: Google earth (2015).
39
Figure 4.3 Built up Land for Nakonde and Tunduma Towns
Between 2004 to 2010
Source: Google earth (2015)
Figure 4.4 Built up Land for Nakonde and Tunduma Towns
Between 2004 to 2013
40
Source: Google earth (2015)
CHAPTER FIVE
PRESENTATION AND ANALYSIS OF RESULTS
41
5.0 Introduction
This chapter gives a presentation and analysis of results in
four sections namely; Social, Economic and Demographic
characteristics; Economic activities in relation to
migration; Services and likelihood to settle; and Marriage,
Children and Fertility. These are presented and analyzed to
show how they have been factors associated with the
conurbation of Nakonde and Tunduma Towns the study area.
5.1 Social, Economic and Demographic
Characteristics
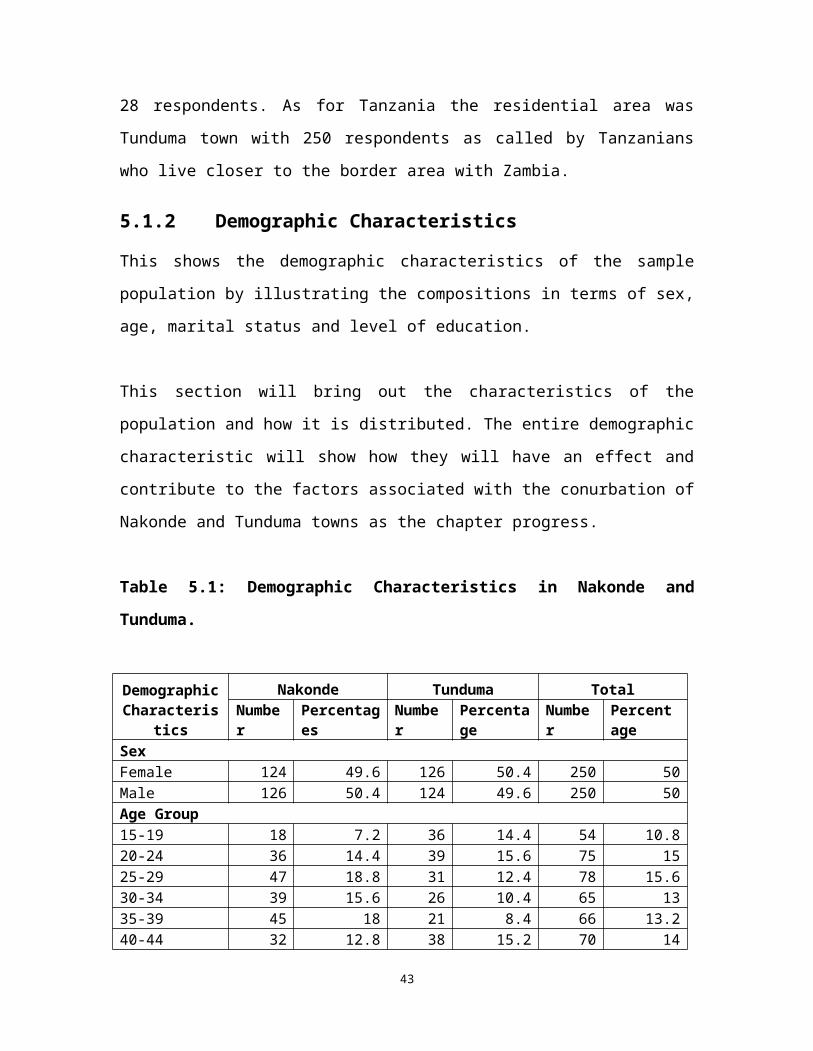
This section presents the findings on the background
information, countries, demographic characteristics such as
sex, age, marital status and education level; and
accommodation (type and number) of the study area.
5.1.1 Country
The countries involved are Zambia and Tanzania. In Zambia,
the findings are from the town of Nakonde in the new
province called Muchinga province which was recently formed
while in Tanzania it was done in the town of Tunduma in the
Southern province also referred to as the Mbeya region.
In Zambia all the residential areas in Nakonde were
considered namely; Wulonga with 67 respondents, Ntindi with
75 respondents, Mukoma with 80 respondents and Katozi with
42
28 respondents. As for Tanzania the residential area was
Tunduma town with 250 respondents as called by Tanzanians
who live closer to the border area with Zambia.
5.1.2 Demographic Characteristics
This shows the demographic characteristics of the sample
population by illustrating the compositions in terms of sex,
age, marital status and level of education.
This section will bring out the characteristics of the
population and how it is distributed. The entire demographic
characteristic will show how they will have an effect and
contribute to the factors associated with the conurbation of
Nakonde and Tunduma towns as the chapter progress.
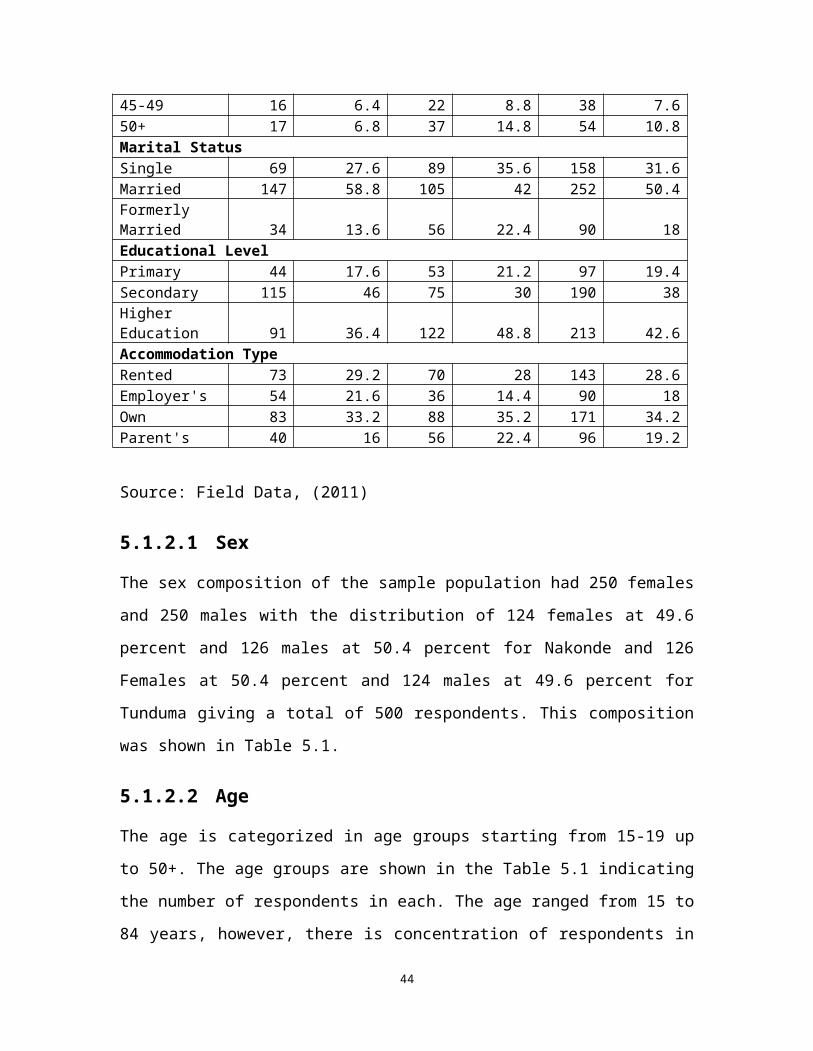
Table 5.1: Demographic Characteristics in Nakonde and
Where C (12m) is the number of children born in the
last 12 months
Hinde (1998:97)
This was also used to make comparison s between the
Fertility level between Nakonde and Tunduma towns. The
results indicates that the Total Fertility Rate (TFR) is
presented in three ways fi as TFR without adjustments, fi*
as TFR which is adjusted using P2/P2 in order to increase
the current fertility by 50 percent and fi** TFR is adjusted
by using the P1/P1 in order to reduce the TFR lower.
The results indicate that the fi TFRs for Nakonde is 5.6,
Tunduma 3.4 and the total 5.5. All these TFRs were closer to
the TFR for Nakonde which is at 5.3 as per 2010 Census
Preliminary results, (CSO: 2011). The fi* TFR for Nakonde is
2.5, Tunduma is 4.4 and the total is 3.3 are established in
order to reduce the number of misreported information on the
number of births in the past one year as a result of the
reference period error especially that some women have a
poor concept of ‘in the last year’. Lastly, the fi** TFR for
Nakonde is 3.2, Tunduma is 3 and the total is 3.8 which is a
further way of reducing the misreporting of the children in
the past 12 months or 1 year. The actual calculations are
indicated in the appendix c.
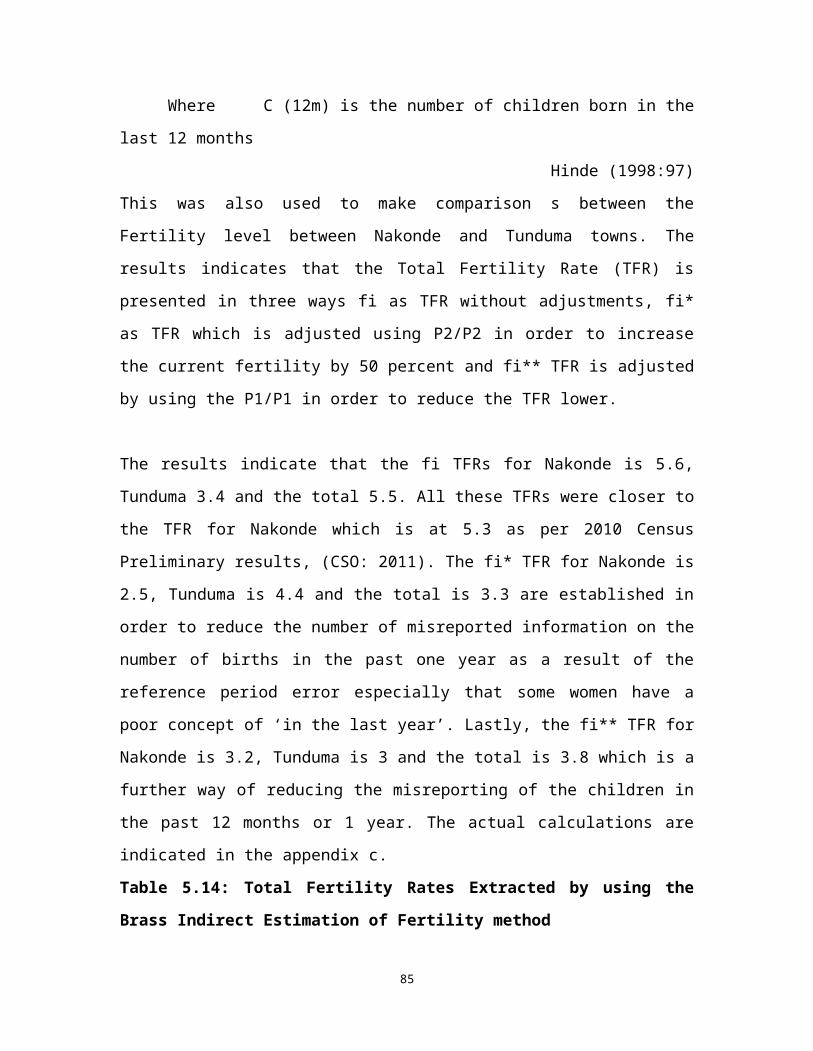
Table 5.14: Total Fertility Rates Extracted by using the
Brass Indirect Estimation of Fertility method
85
S/N
Total FertilityRate
Nakonde Tunduma Total
1 Fi 5.6 3.4 5.52 fi* 2.5 4.4 3.33 fi** 3.2 3.0 3.8Source: Field Data, (2011).
86
CHAPTER SIX
DISCUSSION AND CONCLUSION6.1 Introduction
This chapter gives a discussion and conclusion of the
presented and analyzed results from chapter five on social,
economic and demographic characteristics; economic
activities in relation to migration; services and attitudes
towards the standard of living; and Marriage, children and
fertility. It also gives an interpretation of what was found
in the field as illustrated in chapter five in relation to
the objectives on the factors associated with conurbation in
Nakonde and Tunduma.
6.2 Economic Activities in Relation to Migration
The discussions are based on the economic activities with
emphasis on the year of migration, migration duration,
reasons for migration, salient issues in the reasons for
migration and other activities engaged in apart from the
reason for migration. The level of satisfaction for the
respondents, booming business, reasons for booming business
and problems associated with the business also added their
own share in the discussion.
6.2.1 Year and Duration of Migration
In Nakonde there has been a fluctuation in migration such
that there were more respondents who migrated in the period
87
<1990 but reduced in the period 1991-2000 and then increased
in 2001-2011. It shows that the reduced number of migrants
in the period 1990-2000 has a lot to do with the economic
hardships which existed such as economic wage freeze and the
new economic programs of liberalization and privatization of
parastatals which brought a lot of uncertainties for many
people in Zambia. However, the trend changed in the period
2001-2011 as this is the period of benefits from the
hardships of the previous period as people then became more
enlightened and open minded by stopping their dependency on
the government for everything in order to survive. There was
also a lot of diversification of the economy with a huge
reduction on the dependency on copper which led to an
increase in agricultural production. The transport and
communication sector also improved and enhanced the fast and
efficient delivery of goods and services. In addition, the
population increased from 78, 000 in 2000 to 121, 000
thousand in 2010 as was observed by the Nakonde Municipal
Council. This showed a clear indication that the population
of this area had definitely increased there by contributing
to conurbation of the study area.
As for Tunduma, the migration period shows a steady increase
from <1990, 1991-2000 and with the highest being in the
period 2001-2011. This scenario has an inclination for the
increased business ventures at the border of Nakonde and
88
Tunduma which increased the cross border trade between
Zambia and Tanzania.
The year of migration as presented in Chapter five in Figure
5.2 gives a clear picture of the similarities in the
migration trends in both Nakonde and Tunduma towns. In
addition, the Immigration offices for both Zambia and
Tanzania, which opened in 1967 when a need to control and
monitor the movements of people in and out of both countries
was seen, confirmed these similarities in migration trends
for both Nakonde and Tunduma. The offices confirmed that as
a result of Nakonde and Tunduma being in one country (Zambia
before independence) as indicated in letereture review on
the study area conurbation.
Migration duration of the respondents in the 22+ years
category was the President Kaunda era which is represented
by 21 percent (as per year for data collection and analysis
2011). It records such a high percentage because of the
policies which existed at that time that is ‘back to the
land’ where those who had retired and the unemployed
migrated back to their villages. For Tanzania it was also
the same as with a policy on ‘Ujama’ which was a system of
establishing people in farming settlements especially those
who were not in formal employment and it was mainly
established in the Southern Province which is regarded as
89
the farming area because of its fertile soils and rain
patterns which were favourable for agriculture. These
policies encouraged people who were not in formal employment
to go back to their villages and farm. Therefore, these are
the reasons for a high record of migration into Nakonde and
Tunduma areas. These migrants settled in Nakonde mainly to
start farming and in the process contributed to an increase
in the population and also built village houses which
contributed to the physical expansion of the built up the
land which led to the conurbation of Nakonde and Tunduma.
As for 11-21 years migration duration, it is a revival
period for Zambia which changed its government to that of
the late President Chiluba. This era is characterized by
liberalization of the economy and privatization of most of
the government owned companies. A lot of companies were
taken over by the private sector especially the transport
sector which directly affected Nakonde and Tunduma as they
were opened up for business and settlement. However, all
these were not easily achieved as they were accompanied by
things such as wage free and high import taxes which also
contributed to the hard times that were experienced. This is
the reason for the observed low migration percent of 16.
For 1-10 years migration duration, this is under three
Presidents namely; Mwanawasa, Banda and Sata. All these are
90
in the post era of liberalization and privatization, hence,
enjoyed their benefits. Special interest is directed to the
transport sector and also private business sector. Those two
opened up the study area further such that people from all
over Zambia and also Tanzania easily accessed Nakonde and
Tunduma in one day coupled with the good rates in terms of
import taxes which pulled a lot of migrants to this area. As
a result of the increased population, the conurbation of
this area has made it look like one area with no boundaries.
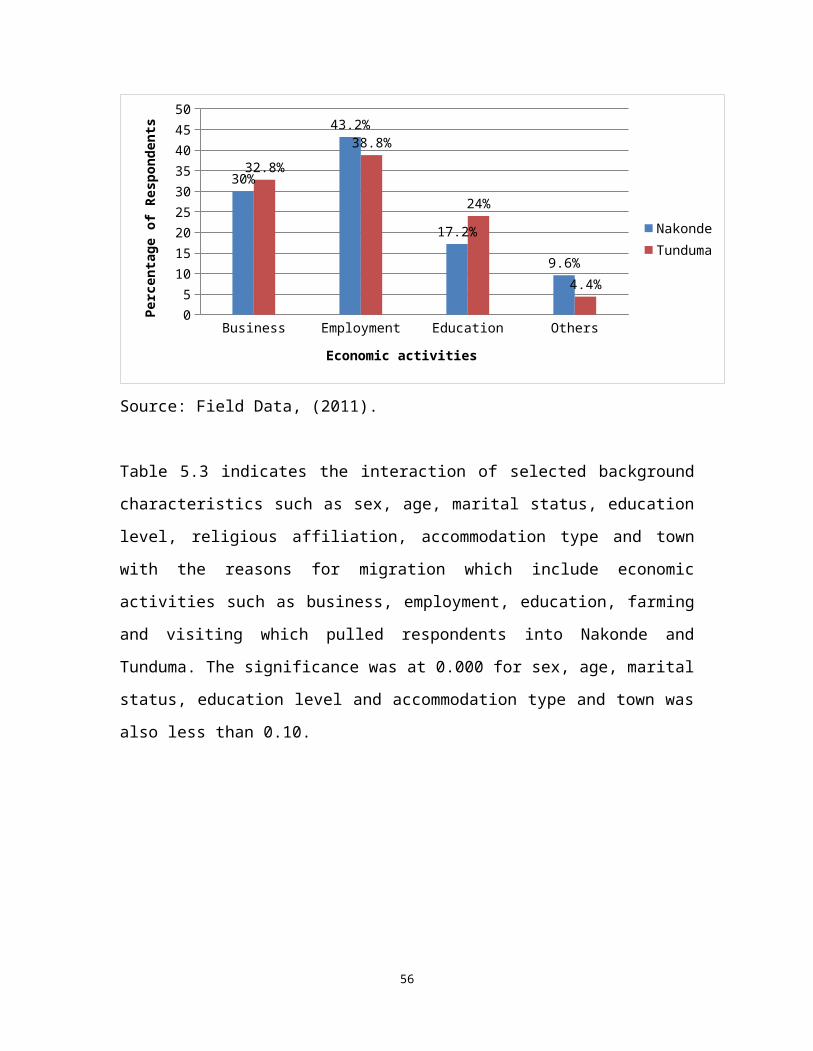
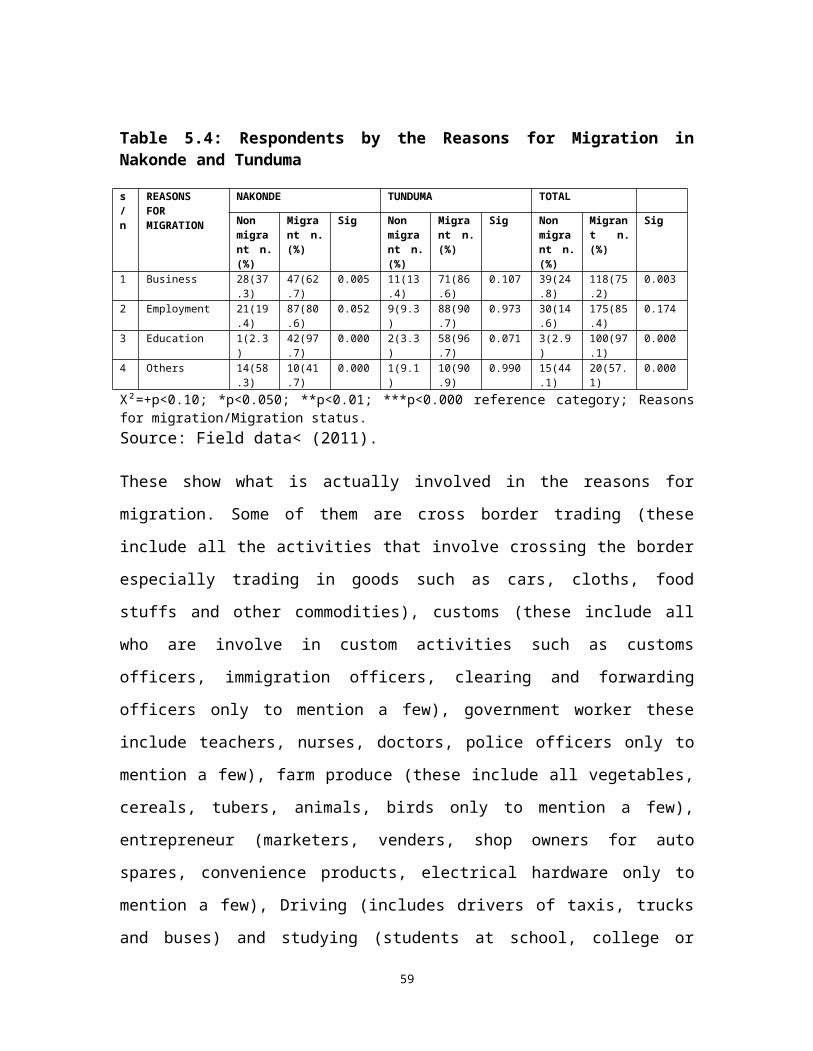
6.2.2 Reasons for Migration
Figure 5.3 shows those who migrate as a result of employment
move because this area is promising to whoever employed
them. On comparison bases between the two towns in terms of
employment, Nakonde has 43.2 percent higher than Tunduma
which is at 38.8 percent. This shows that the majority of
the migrants in both towns moved as a result of employment
opportunities which act as a pull factor according to Lee’s
‘Pull and Push Model’. As a result of this, most of these
migrants would need accommodation and definitely settle for
a long period. In the end, this contributes to population
increase and also the demand for accommodation which are
factors associated with conurbation.
Business as the main notable reason for migration shows that
Tunduma at 32.8 percent was higher than Nakonde with 30
91
percent. Both towns are on a higher side for business as a
reason for migration as any area which has the potential for
business always pull people. As for this area, it already
has a large population which consisted of permanent and
transit population to provide a good market and high demand
for goods of any sort. With such advantage, it has made the
area to pull a lot of people which leads to population
increase and provision of business for the transport sector.
These findings are confirmed by the ZRA and TRA as indicated
in chapter for presentation and analysis of findings. It is
also important to note that business does not only stand on
its on but is able to stimulate the creation of other forms
of employment. Education as a reason for migration had Tunduma with 24
percent which is higher than Nakonde at 17.2 percent. This
disparity was mainly due to the fact that more Tanzanians
preferred to send their children to schools in Zambia while
Zambians had a variety of school choices even in other towns
such as Isoka (Isoka high school), Chinsali (Chinsali Girls
Secondary school) among others. In addition, these were
mainly students who were seasonal migrants who always
returned to their areas of origin. However, this disparity
was also confirmed by the Immigration offices for Zambia and
Tanzania who indicated that there were many Tanzanians who
had acquired Education permits for their children through
92
their offices even though some did so illegally. Others (includes all the other reasons such as
accommodation, transport, electricity only to mention a few)
indicated that Nakonde had 9.6 percent which is higher than
Tunduma with 4.4 percent. This difference and also low
percentage for both towns was due to the fact that most of
the respondents took farming as a secondary reason for
migrating to this area while their primary reason was
business. However, farming had also contributed to the
development of conurbation in this area as it provided the
farm products such as rice, Irish potatoes, Sweet potatoes,
onions that are used in trading. The products had also
pulled people as they are very affordable and readily
available.
All in all, these are the pull factors for Nakonde and
Tunduma which encouraged migration of people to this area.
They are factors which are also associated with the
development of a conurbation as they directly contributed to
population increase and physical expansion of the land
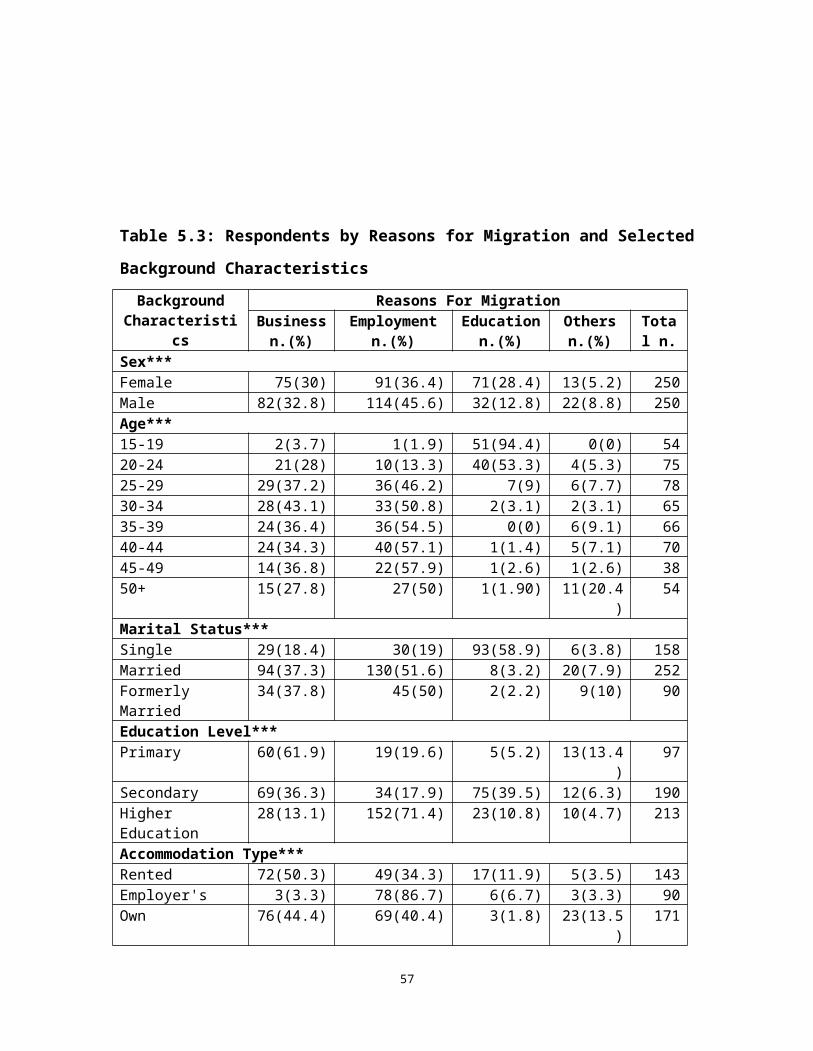
through the building of either houses or offices. Table 5.3 indicates that all the selected background
characteristics are significant. This gives the impression
that the respondents’ who migrated were greatly influenced
93
by the background characteristics and are being pulled by
Business, Employment, Education and Farming into Nakonde and
Tunduma. As the Lee’s ‘pull and push’ factor indicates that
there are main ways in which a population can be encouraged
to migrate to a place with positive and attractive things
which are better than those found where they are currently
stationed.
On a general view, sex shows that all the reasons for
migration have more males than females except for education.
The reason for this is that generally males are mostly the
bread winners of families and therefore tend to migrate more
often than their female counterparts who mostly take care of
their households hence the reason for more of the males in
business, employment, farming and visiting. However,
education had more females than males mainly as a result of
the presence of the Mwenzo Girls’ Secondary School.
Age also show more respondents between the ages of 15 to 24
who migrated as a result of education and also between ages
20 to 50+ migrated as a result of business and employment.
Those who were married mostly migrated as a result of
business and employment while many of the single respondents
migrated due to education. In terms of education levels,
there were more respondents who had a secondary and college
education level, although as a whole most of the respondents
94
migrated for business and employment.
Business as an economic activity was a pull factor which
contributed to the migration of people into the study area.
Despite the fact that business was significant enough to
have caused the respondents to migrate into the study area,
the scenario was not mutual for Nakonde and Tunduma
separately. Nakonde had business as the reasons for
migration and not Tunduma. Therefore, this means that the
respondents were attracted to Nakonde because of business
ventures, thereby conforming to the Lee’s ‘Pull and Push’
model which states that people migrated to another area
because they are attracted to the positive things such as
business, employment, education opportunities and in this
case business conforms.
Employment is also an economic activity, but the question is
did it really pull respondents to the study area? The Chi-
Square analysis shows that it did not cause migration of
people to the whole area. However, in comparison between
Nakonde and Tunduma, it did pull respondents to Nakonde with
a significance of 0.052 although very weak while for Tunduma
it did not. For Nakonde it was due to an increase in the
employment sectors such as the clearing and forwarding and
hospitality industry.
95
Education as one of the economic activities had pulled
respondents to the study area as a whole as it was very
significant at 0.000 in terms of migration. However, Nakonde
at 0.000 was greater than Tunduma 0.071 significance. This
is due to the fact that Nakonde had a lot of schools
especially at secondary level which attracted people 15
years and above as per the ages for this study. Some of the
secondary schools included Mwenzo and Nakonde Day. These are
schools which attracted people not only in Zambia but also
Tanzania as it was noticed that most of the Tanzanians
preferred to attend Zambian schools as they offered better
quality education than those in their country. In addition,
Tunduma had little significance as most of the respondents
migrated to Tunduma for research or attachment. Therefore,
it is an indication that education had also contributed to
the conurbation of Nakonde and Tunduma by increasing the
population although the number of students migrated as a
result of Education.
Others also pulled people to the study area, hence is one of
the economic activities which caused respondents to migrate.
For the whole study area the significance is 0.000 hence it
caused migration for those who are in search of other things
such as Farming. However, only Nakonde has a significance of
0.000 unlike for Tunduma with 0.990. This is as a result of
Nakonde having a lot of land for agriculture especially that
96
the land was not owned by the council but by the chief.
Therefore, headmen gave out land to their people so that
they could grow crops and sustain their families. In
addition, the soils were among the most fertile in Zambia
and hence had attracted a lot of farmers. As for Tunduma,
farming was mainly done in the areas which were closer to
the equator as they received rainfall throughout the year.
The main economic activities which caused migration of
respondents to the study area were business, education and
employment. These are the pull factors of this area which
had contributed to the conurbation of Nakonde and Tunduma
through population increase and physical expansion of built
up land. However, on comparison basis, Nakonde had the
economic activities which caused migration including
business, employment, education and others while Tunduma has
only education as it was the only activity which was
significant according to the regression analysis as shown in
Table 5:4.
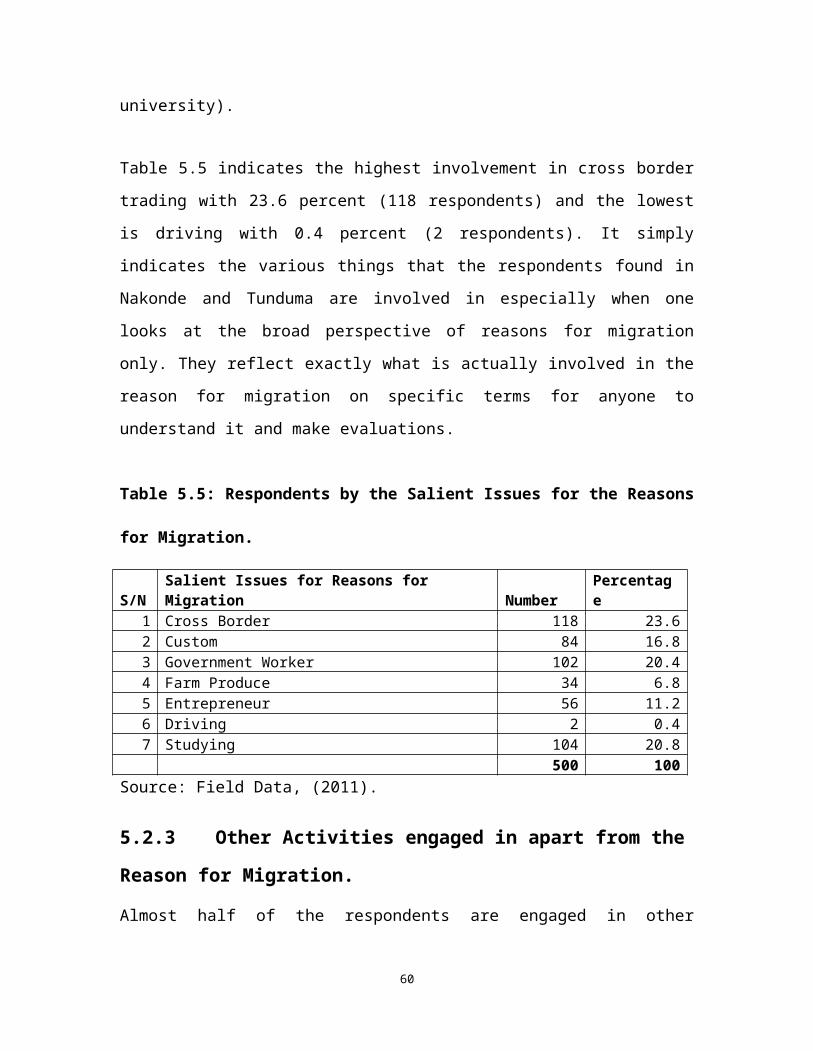
The salient issues in the reasons for migration are very
wide in every aspect. To begin with, those who were employed
government workers included nurses, doctors, teachers and
police officers; customs include Immigration officers, ZRA
workers and those for clearing and forwarding; and Driving.
Those who were in Business had cross border and entrepreneur
97
who were either in big business ventures or who owned big
shops or worked at the market and street venders. Those in
Education were mainly studying at secondary, college or
university. Finally, farming involved the production of farm
produce which were used for various activities such as
provision of food in homes and also goods for business.
A combination of customs, government workers and driving (as
taxi, bus or truck driver) had a large proportion. Those
involved in cross border and entrepreneurs were second.
These were followed by those who were studying and lastly
the farm produce. All these salient issues in the reasons
for migration give a clear picture that Nakonde and Tunduma
are multifaceted in terms of means to earn a living.
Therefore, the pull factors are into various circles of life
thereby contributing to the development of a conurbation of
the study area.
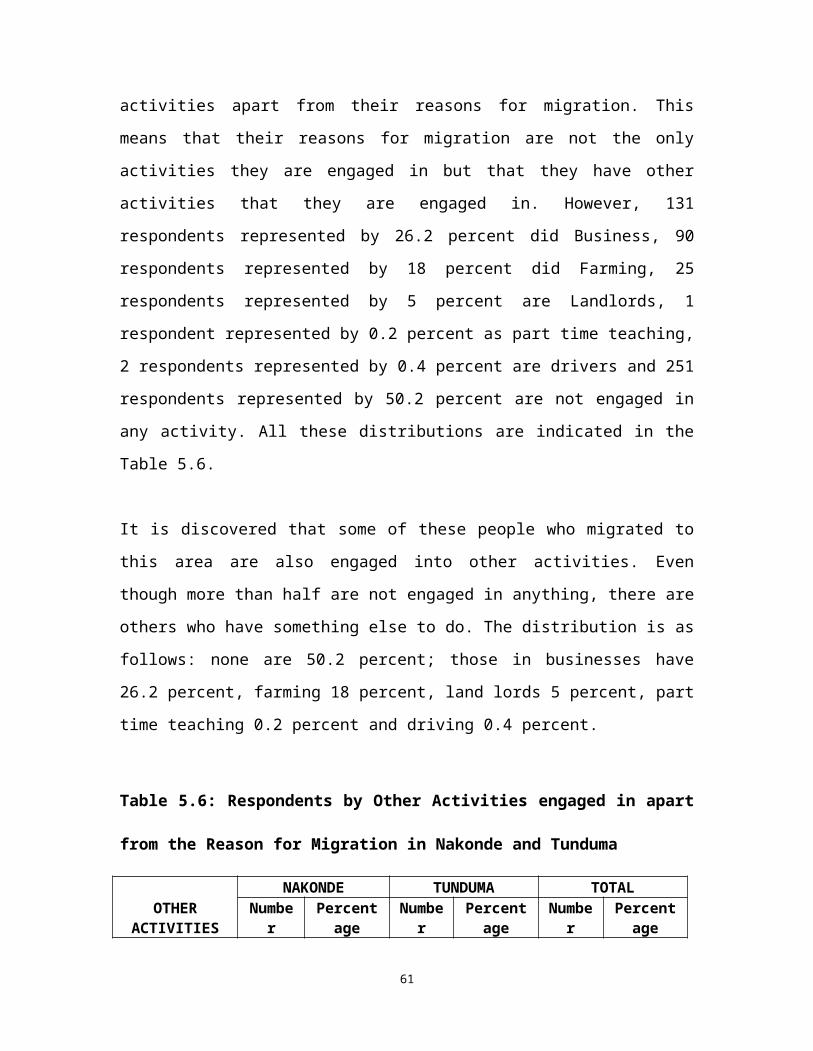
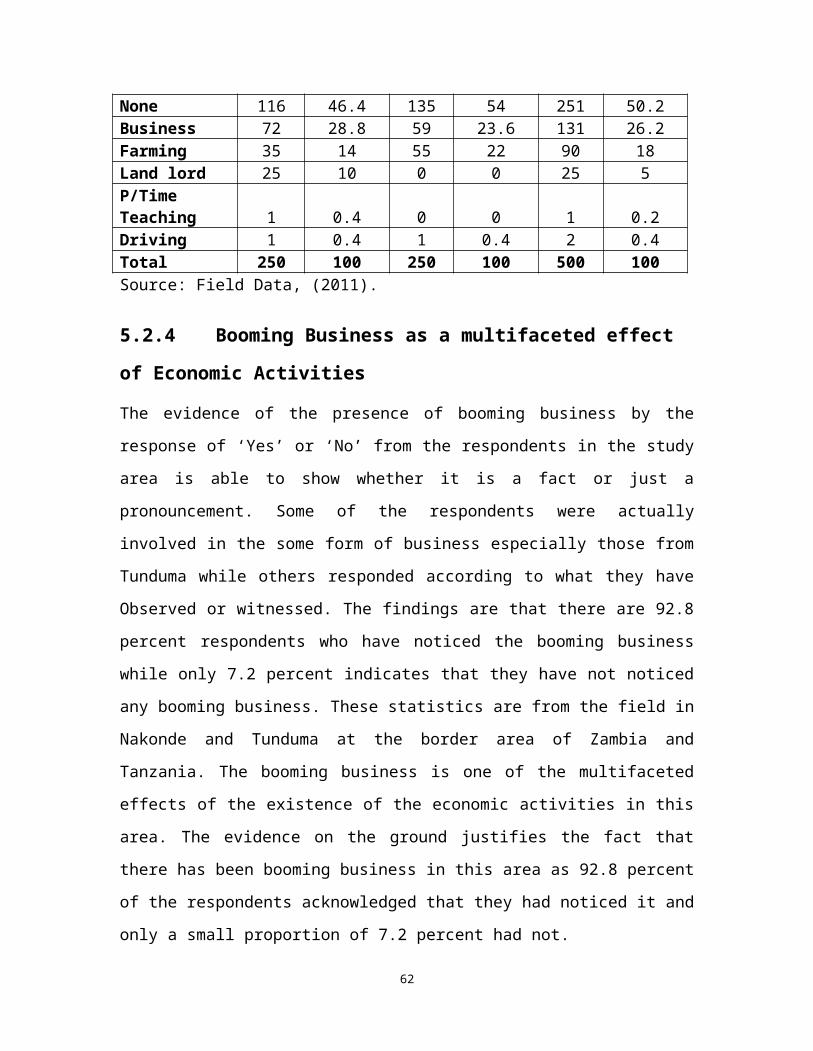
6.2.3 Other Activities engaged in apart from the
Reason for Migration.
The pattern was also almost the same in the comparison of
Nakonde and Tunduma. However, Nakonde had fewer respondents
who were not engaged in other activities while business,
farming, land lord, part time teaching and driving were in
descending order in terms of magnitude. Whereas for Tunduma
there were more respondents who were not engaged in other
98
activities and only business, farming and driving are also
represented in descending magnitude.
The idea was to make a verification that respondents in the
study area also noticed the potential for a lot of ways to
make money hence they took the opportunities presented to
them and migrated to this area. This is the reason why they
found alternative or extra ways of making an extra income
and made them decide to stay longer in the area and probably
build permanent structures such as houses. Therefore, when
it happened, a contribution has been made to the conurbation
through population increase and physical expansion of the
built up land through building with reference to landlords.
In addition to the economic hardships found in most of the
developing countries, the respondents indicated that they
could also earn extra income not only through one activity
but in many ways so as to make ends meet. This is in line
with a saying that states, ‘do not put eggs in one basket’.
Therefore, the more extra activities they engaged in, the
more likely they would stay in Nakonde and Tunduma for a
longer time. Others would also hire people to work for them
and stay for a long time.
99
6.2.4 Booming Business as a multifaceted effect
of Economic Activities
The booming business is as a result of the growing business
activities in Nakonde and Tunduma towns as the results
showed that more than three quarters of the respondents
acknowledged this fact. It can be also confirmed that a
number of businessmen and women in both Zambia and Tanzania
had been travelling to the border of Nakonde and Tunduma to
do business. For example, in Lusaka and Kitwe the number of
long distance buses increased especially the ones that head
to Nakonde such that some companies (Jordan Motors) ended up
sending two big buses on the same day. On the goods that
were transported by buses and tracks in the name of business
were always on the road as the Immigration and ZRA officers
confirmed to this. They further acknowledged that the
business was into different kinds of things such as cloths,
hardware, automobile ware, electronic goods and also food.
All these are evidence enough to say there is booming
business in Nakonde and Tunduma.
This booming business pulled a lot of respondents. It can be
traced back to the reasons for migration were business had
30 percent for Nakonde and 32.8 percent for Tunduma and to
add on to this some people were employed in these same
businesses are part of booming business meaning that a
percent on employment where Nakonde has 43.2 percent and
100
Tunduma 38.8 percent can be added to business. As the
business is booming the number of people being pulled to
this area are too numerous to mention and state that they
add to the population thereby increasing it hence
contributing to the conurbation of Nakonde and Tunduma.
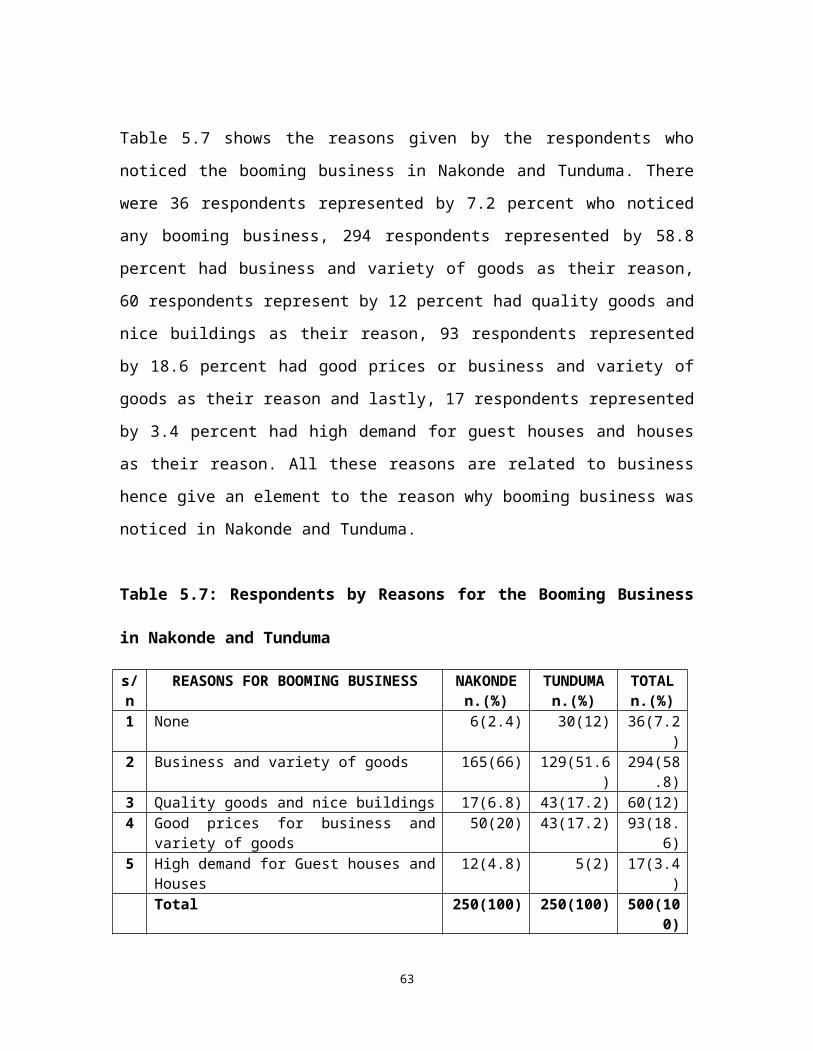
The reasons for booming business were all in line with
business. The highest are those who stated ‘business and
variety of goods’ represented by 58.8 percent. The second
stated ‘good prices for business and variety of goods’ with
18.4 percent. ‘Quality goods and nice buildings’ indicated
12 percent. The lowest of all reasons was ‘high demand for
guest houses and houses’ with 3.4 percent.
All the reasons given depend on a market and high demand
which cause the booming business. Therefore, the market and
high demand is provided by the population found in this area
(not forgetting that some traders are from other areas where
there is also a market and demand for goods in the study
area) and maintained the business meaning that the
population will always be on the increase just to satisfy
the market. Eventually, this in itself gives a justification
that the population of this area is still growing and there
is physical expansion of the built up land through the
building of infrastructure such as guest houses and houses.
101
The comparison in terms of reasons for booming business
between Nakonde and Tunduma shows the same pattern. They
both have more respondents who confirmed that the reasons
for the booming business are business and a variety of
goods. This indicates that indeed the two towns have the
same causes for booming business hence the reasons for the
whole area still stands for each town.
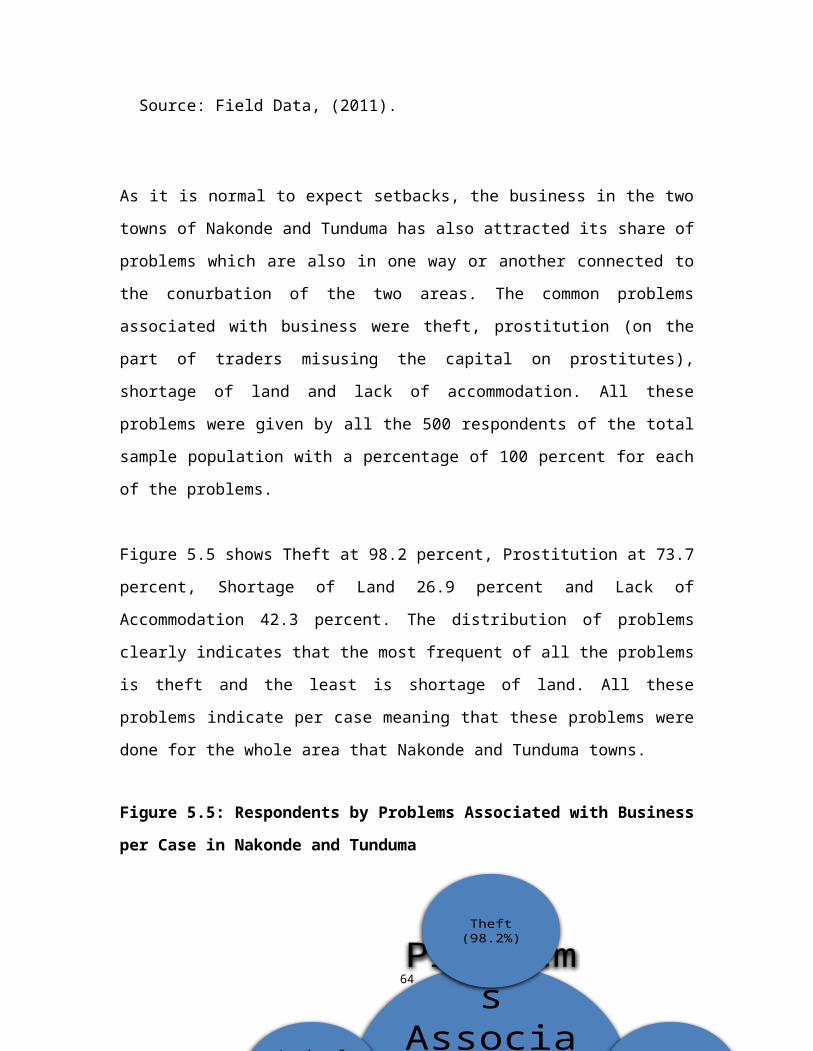
The problems that were associated to business in the study
area are theft, prostitution, shortage of land and lack of
accommodation. Out of all these problems the most prominent
ones were theft and prostitution (it may bring moral decay,
spreads HIV/AIDS, breaks marriages and they are sometimes
thieves). This has been mainly because in any area with
booming business, these two vices cropped in as a negative
force of business. The Nakonde Municipal Council also
confirmed that through the council police a lot of cases
involving theft and prostitution had been recorded. They
have been attributed to none existence of a visible physical
separation at the border between Zambia and Tanzania. The
experiences in theft are in terms of vehicles being stolen
and burglary especially for shop owners. It was reported
that prostitution was on the rise due to the increased
number of guest houses in the area and also the number of
truck drivers in transit. It was noticed that they made a
lot of money hence the vulnerable women on business trips
102
engaged themselves in prostitution for an extra income or a
room to rest as they did their business.
The shortage of land was only common to areas close to the
border area as there existed structures already. However, it
is noted that since the township boundaries are not yet
gazette, most of the land is under customary or is under the
chiefs. The allocation of land is through the chief and the
council comes in only to place it on their plan. As a result
of this, the area had a lot of unplanned settlements which
did not have roads. Consequently, the area from Nakonde to
Tunduma looked like one continuous area with no proper
physical boundary. In addition, the Nakonde Municipal
Council had no authority on the development of the land
which contributes to the conurbation of Nakonde and Tunduma
towns as it has experienced a lot of challenges. Some of the
challenges lay in the planning of the land that is allocated
to people before roads into residential areas are
constructed which in turn led to the mushrooming of
unplanned settlements. This also affects the planning for
infrastructure such as hospitals, clinics and recreation
area; collection of garbage which has been exacerbated by
the increase in population which also leads to the outbreaks
of typhoid; and also failed to collect levy especially from
those who operated on the black market. With such a report
from the municipal council it is clear that the area has
103
formed a conurbation and building of various infrastructures
has also contributed.
6.3 Services and Likelihood to Settle In Relation
To Migration
This section highlights the services and how their
availability (presence) enhance respondents likelihood to
settle, food and its effects on attitudes towards life, how
perceptions on the development of a town affects attitudes
towards life, and their relation to migration issues in the
conurbation of Nakonde and Tunduma towns.
6.3.1 Services
The services (piped water, transport and electricity)
available act as ‘Pull factors’ which make people migrate to
or decide to settle in this area. The end result in most
cases is that the area attracts migrants thereby increasing
the population and hence the development of conurbation of
the area. This was analysed using the odds ratio of the
binary logistic regression.
To begin, with pipe water in relation to sex, the male
respondents have odds ratio 1.467 more likely than females
to settle in Nakonde and Tunduma. This conforms to the
Ravenstien ‘laws of migration’ which emphasizes that males
migrate to far lands across the known boundaries than their
female counterparts. As for the age groups, 25-34 has 1.169
104
and 35+ has 1.687as their odds ratio which are both more
likely to settle than the age group 15-24 as a result of
piped water in Nakonde and Tunduma. This is as a result of
the fact that the older the respondents are the more stable
and independent about their lives in terms of issues of
settlement than the young ones. The married and the formerly
married respondents are odds ratios 0.467 and 0.568
respectively less likely to settle than the single in terms
of piped water. This is because they can source for
alternative sours of water such as bore holes, wells and
rivers. The significance for marital status is at 0.10 for
both married and formerly married which shows how important
they are to the study. As for Educational level, secondary
odds ratio 0.614 and higher education odds ratio 0.429 less
likely than those who have primary education to settle as a
result of piped water in Nakonde and Tunduma. In terms of
towns, the respondents from Tunduma odds ratio 1.264 are
more likely than those from Nakonde to settle as a result of
piped water. The non-migrants also have an odds ratio of
1.593 likely than the migrants to settle in Nakonde and
Tunduma which is the more reason why they have even remained
in the area.
The respondents who had settled in Nakonde and Tunduma as a
result of the availability of transport as a service in
relation to the selected background characteristics are sex,
105
age, marital status, educational level, town and migration
status. In specific terms, the males odds ratio 1.231 more
likely to settle than the females; 25-34 has odds ratio
0.571 and 35+ has odds ratio 0.110 less likely to settle
than the age group 15-24; married and formerly married
respective odds ratios are 2.34 and 3.756 more likely to
settle than the singles; the respondents with secondary and
higher education respectively odds ratios 2.648 and 3.627
more likely to settle than those who only had primary
education; the respondents from Tunduma are odds ratio 4.352
more likely to settle than those from Nakonde; and lastly,
the non-migrant are odds ratio 2.326 more likely to settle
than the migrants. Transport is one of the most important
factors associated with the conurbation of Nakonde and
Tunduma especially that the area has no natural physical
barrier such as a river. This is because it is able to
attract a lot of settlements especially along the road which
in turn has expanded the built up area. In the same manner
the growth of the population has also been on the increase.
Electricity as a service is an essential element which can
make people settle or migrate to a place where it is being
provided. In relation to selected background
characteristics; males odds ratio 1.799 are more likely to
settle than the females; age groups with their respective
odds ratios where25-34 has 0.709 and 35+ has 0.602 are more
106
likely to settle than those in age group 15-19; the married
odds ratio 0.470 and the formerly married odds ratio 0.657
are less likely to settle than the single; respondents from
Tunduma odds ratio 0.288 are less likely to settle than
those from Nakonde; and non-migrants are odds ratio 2.892
more likely to settle than the migrants.
6.3.2 Food
Food is very important in any country, town, culture, or
individual and usually any area with food is regarded as
being richer than anything else as no rich man could work
without food. The issues at hand are that the study area has
a variety of food which is at the same time affordable. Most
people believe that Nakonde and Tunduma are very rich in
food because they are both not only business areas but also
agricultural areas. As a result of Agricultural activities
in this area people tend to settle in this area
Both towns have very fertile soils and good rainfall to
support any kind of farming. Since most of the food is
produced in this same area, it is affordable and people find
it cheaper to settle in this area thereby pulling a large
population and also creating a large domestic market
(demand) for the food. Reference for an area which developed
into a conurbation as a result of food produced due to its
fertile soil is the Randstad of the Netherlands as quoted in
107
Literature Review. As a result, people spend less money on
food and invest the rest of their funds in different things
ranging from building houses to businesses. Therefore,
Nakonde and Tunduma have developed into a conurbation due to
the fact that the area has food which has attracted a large
population and also has attracted a lot of construction
especially in roads and housing which has a continuous
expansion of the built up land.
The area is very rich in different kinds of food. This is
because the types of foods that are found here are used to
make different dishes and also balanced diets could be made.
The types food included vegetables, cereals, meat, tubers
and fruits. Among the vegetables were cabbage, rape,
tomatoes, beans and onion; cereals included rice, maize and
millet; meat included beef, pork, goat, sheep, chicken and
fish; tubers included cassava, yams sweet and Irish
potatoes; and fruits such as oranges, apples, cocoanuts,
bananas, lemons, mangoes, grapes and granadillas. From all
these types of food any dish from any country could be made
as the basics ingredient of most of the dishes are found in
this area.
6.3.3 Development of Nakonde and Tunduma
The development of these two towns is noticeable on the
ground as the area has developed over the years from a rural
108
to an urban area. The development mainly is on the number of
infrastructures that have been constructed in the area.
These include the ‘One stop office’ for Immigration and ZRA,
banks, insurance offices, shops, houses only to mention a
few. However, this can be justified by reviewing the town
which is more developed between Nakonde and Tunduma and the
reasons for their development.
Even though it is perceived that Tunduma is more developed
than Nakonde, the difference between them according to the
responses from the respondents is only 2 percent which is
very small. Those who acknowledged that both (Nakonde and
Tunduma) are developed are only 5.2 percent. Therefore,
these results show that the differences in development are
very minimal and can be approached as if the respondents are
viewing the same area from different sides. In a nut shell,
it will be very appropriate to say that the development of
each of these towns compliment the other.
To start with, business is the most prominent reason
followed by modern infrastructure. These complimented each
other because business is the one which attracted the
building of modern infrastructure. The business component
brings in the aspect of population increase while the
component of modern infrastructure brings in the aspect of
building which leads to the physical expansion of the built
109
up land in the area. Therefore, both reasons are the factors
associated with the conurbation of the two towns in terms of
population increase and expansion of physical built up land
through buildings such as banks, houses, offices, guest
houses only to mention a few.
Water and sanitation are the two most important aspects
which are very cardinal to the development of any area which
includes the area under study. The Nakonde Municipal Council
reported that these two are there, however, where it failed
to reach out the people have opted for wells, bore holes and
the use of septic tanks. However, when the septic tanks are
full for both towns, vacuum tanks from Tanzania service
them. However, the on separate terms water and sanitation
are not represented in Nakonde but only in Tunduma as same
parts of Tunduma have water only while others have only
sanitation.
6.4 Marriage, Children and Fertility
This section interprets the topic at hand ‘factors
associated with the conurbation of Nakonde and Tunduma
towns’ in relation to marriages, children and fertility. It
looks at intermarriages between Zambians and Tanzanians,
patterns of marriage, age at first marriage, customary
practices in traditional marriage arrangements, number of
children ever born and total fertility rate in Nakonde and
110
Tunduma towns. All these issues help in the discussion of
the findings in relation to the topic at hand and how they
contributed to the conurbation of Nakonde and Tunduma towns.
6.4.1 Intermarriages between Zambia and Tanzania
Intermarriages contributed to the conurbation of Nakonde and
Tunduma towns as they brought out the need for accommodation
and children. In terms of accommodation, it leads to a
situation where the married rent or build houses. The houses
will increase the area of built up land and cause the
physical expansion for built up land especially that it is
done on the land towards the border between Nakonde and
Tunduma thereby contributing to the development of a
conurbation. In addition, these intermarriages would
encourage a family to settle within the same area which is
similar to them. In terms of children who are born in these
intermarriages, they contribute to the population thereby
increasing the number of people in Nakonde and Tunduma towns
and causing a direct contribution to the development of a
conurbation in terms of population.
6.4.2. Patterns of Marriage in Nakonde and Tunduma
While there are more respondents who are married,
inclination was towards those who followed the traditional
marriage pattern as they were most likely to uphold the
importance of children in a marriage. The fact that
traditional marriages were more than the other types, it
111
meant that their ideologies about a family were mainly based
on the bearing of children. This is because child bearing is
one of the measures of marriage in the traditional matters.
Therefore, with these aspects on marriages, it simply leads
to the fact that respondents with traditional type marriages
have to bear children who in turn will contribute to the
population increase of this area and also enhance the
development of conurbation. In addition, the respondents are
more likely to have more children in the traditional type of
marriage than those who in the western type of marriage. The
children contribute to the population increase of the area
thereby enhancing the development of a conurbation.
In order to justify how a pattern of marriage can influence
the number of children in a marriage, Figure 5.9 is used to
display this relationship. It compares the number of
children between traditional and western type of marriages
between Nakonde and Tunduma towns and indicates the one
which had attracted a lot of children among respondents. In
general, traditional marriages support more children than
western marriages as it was confirmed among the respondents
in Figure 5.9 shows which clearly indicates that traditional
marriages both in Nakonde and Tunduma the number of children
increased as the steadily even with 5+ children whereas for
western type of marriage the number of children decreased as
the number of children ever born increased from 1 to 5+. For
112
instance, traditional marriage in both Nakonde increased
from 9 respondents with 1 child to 29 respondents with 5+
children while Tunduma increased from 6 respondents with 1
child to 48 respondents with 5+ children.
These percentages show that children in marriages are needed
based on the fact that the results have more respondents who
did not accept childless marriages. This can be an
indication that Nakonde and Tunduma towns are dominated with
the traditional beliefs mostly because children are regarded
highly in most traditional marriages. Therefore, if all the
marriages especially the traditional marriage patterns, who
have showed in Figure 5.9, that they have more respondents
with more children (more than 5+ children) then it will mean
that should all the women have these children in their life
time, they will have the potential to grow in size in terms
of population increase. As a result of this, the population
of this area will increase and the built up area expand as
more land will be needed for housing thereby making a
continuous conurbation between Nakonde and Tunduma.
The two universal reasons send a message that the desire to
have children in the marriage is present. For example, a
childless marriage is accepted because it is not the end of
a marriage but a second wife or children is the solution.
This also applies to those who did not accept childless
113
marriages. As for the reason ‘God gives children’, it has
different meanings. that is those who accepted God decides
to give children or not while those who did not accept God
must give children. Furthermore, those who accepted
childless marriages show that ‘love’ and ‘adoption’. For
those who did not accept the childless marriages, the other
reasons are ‘the reason for marriage’, ‘carry on business’
and ‘source of happiness’. The first looks at children as
the only reason why people get married and this is to
discourage children out of wedlock. The second put children
as the inheritance of all that they achieve in their life
time and also as helpers when they are older. The third put
children as the only ingredient for happiness in the
marriage.
In all these, children are important as long as they are
born in the marriage. Therefore, the issues of fertility are
important for the study area. In terms of women among the
respondents bearing children of more than 5+ in their life
time can lead to population increase which can also
contribute to the development of a conurbation. Therefore,
children are important in marriages as they contribute to
the population increase and also the high need for
accommodation as it expands the built up area which are the
main factors associated with conurbation according to
Patrick Gobbes.
114
6.4.3 Age at First Marriage
This area has the potential to grow as most of the
respondents are married within the child bearing ages of 15
to 49 years. In additional, the number of years before the
respondents in age groups 15-19, 20-24 and 25-29 reached 49
years are many, hence, has the potential of contributing to
the population increase if all the female respondents are
having more than five children with a spacing of 2 years
between children. Eventually, this may lead to population
growth which in turn contributes to the development of a
conurbation and can also be a case of Nakonde and Tunduma
towns.
In terms of age at first marriage of the female respondents,
Nakonde had 89 and Tunduma 69 giving a total of 158 females.
These females have the potential of increasing the
population of the study area if they are able to have live
births with a spacing of 2 years between children. However,
these are not the only female respondents who have the
potential to contribute to population increase but also
single females who have never been married before and have
children. Therefore, it can be more prudent to suggest that
the female respondents’ age at first marriage has the
potential to increase the population which is one of the
factors which helps the development of a conurbation in
this case of Nakonde and Tunduma.
115
6.4.4 Customary Practices in the Traditional
Marriage arrangements
Table 5.12 shows Nakonde and Tunduma having the same
customary practices which try to consolidated and cement
traditional marriages. In both towns issues of marriage are
very serious and children outside marriage are not
encouraged as no respondent acknowledged that pregnancy
before marriage is part of the customary practices. Hence
those who want children enter into marriages which are well
established as per traditional circles. It also brought out
the issue that married people usually have children who in
turn contribute to the population growth of the area which
is also one of the factors which lead to the development of
a conurbation. Since 252 respondents are married while 90
respondents are formerly married (Table 5.1) or 342
respondents have been married before, hence, there is a high
possibility of increased demand for houses (however, this is
not to say single respondents will not need houses but the
issue at hand is customary practices in traditional marriage
arrangements). The combination of population increase from
the children born in traditional marriages coupled with the
building of houses to meet the increased demand clearly
shows that they are the factors associated with the
development of conurbation through population increase and
expansion of the built up land of Nakonde and Tunduma towns.
116
The results indicate that a lot of respondents did not
notice any differences in the customary practices in the
traditional marriage arrangement. This implies that the
customary practices were similar between Nakonde and Tunduma
towns. This means that the conurbation of Nakonde and
Tunduma towns can also be noticed in customary practices in
the traditional marriage arrangements. The areas that are
close to each other tend to have some common practices in a
lot of things because people are like one. The case for
Nakonde and Tunduma towns is not different as the area has
developed into a conurbation which makes it look like one.
This can also be attributed to the fact that the area has
one common chief who resides in Tanzania be oversees the two
towns and a common language Namwanga which is between
Nakonde and Tunduma. Therefore, as the two towns developed
into a conurbation, their customary practices have no
differences as the respondents have been living as one big
family in one big area although in different countries.
6.4.5 Number of Children Ever Born and Fertility
Rate in Nakonde and Tunduma
The findings show that the fertility rate is relatively high
in this study area as most of the respondents prefer to have
between 1 to 4 children. Such high numbers of children may
contribute to the population growth which in turn is one of
the factors associated with development of a conurbation.
117
Therefore, the number of children ever born has a direct
effect on conurbation through population increase which can
also be the same with Nakonde and Tunduma towns.
The number of children ever born which goes up to 10+
children among the respondents is a clear indication that
female respondents had more children born from one
individual in their life time. This can also give an
impression that the respondents have a lot of children due
to the fact that their age at first marriage is within the
child bearing ages between 15 and 35 years hence have a lot
of years in which to consider having children.
The desire for future children should be handled with
caution as it should be noted that these are just desired
number of children among the respondents, hence, only the
real numbers of children are the only justifiable measure to
warrant an effect on the rate of population increase.
Therefore, the issue of fertility has to be brought out in
order to show how the number of children born has an effect
on population which is a measure of the development of
conurbation. However, parents’ desire to have more children
due to the benefits generated from child service is also a
factor. Additional services can be obtained extensively by
having additional children or intensively by devoting
additional resources to the upbringing of existing children
118
and thereby raising the level of quality per child. The cost
of unit of child service is determined by the quality and
price of each input (parental time, various goods and
services) used to produce the unit of child service’,
(Snyder 1994: 613).
As the results indicated in Chapter five, it indicates that
the population of Nakonde and Tunduma towns will have a
positive effect on the population by increasing it as it
shows that the TFR for Nakonde and Tunduma are above 2 even
after the final parity adjustments are done. As for the
whole study area it also indicates that the population will
increase as it is also more than the 2.
Therefore, the TFR for the study area is more than 2 hence
will increase the population which will eventually
contribute to the development of the conurbation of Nakonde
and Tunduma towns. The issue at hand is that the population
of the study area is a growing population and will continue
to grow as most of the female respondents are in the
reproductive age group of 15 to 49 which gives them more
time to contribute to the population.
6.5 Conclusion
The factors associated with the conurbation of Nakonde and
Tunduma towns is a very challenging topic to explore and
119
fortunately the results posed a mind opener to what people
tend to overlook or under estimate when it came to the topic
at hand. To begin with, the progression of conurbation
involves the merging of towns that is Nakonde and Tunduma
through population growth and physical expansion of built up
land to form a continuous urban and industrialized area is
the back born of this study. The issue is to find out if
this is on the ground and indeed it is with an exception on
the part of industrially developed area which is not there
as there are no industries whatsoever in Nakonde and
Tunduma. Despite all this a conurbation has been formed
against all odds.
The factors which are associated with conurbation are the
economic activities enhanced by migration. People migrate to
Nakonde and Tunduma towns because they are responding to
what Lee called the ‘Pull and Push model’. It supports the
fact that people are pulled or pushed to a certain area
because they are attracted to better housing, job prospects,
more reliable source of food, or education or are pushed
because they are not there. As for this area, people
migrated to this area as way back as 1953 to 2011 although
the numbers were in the last 10 years of this period. Most
of them migrated because of business, employment, education
and others as these are the economic activities which pulled
them to this area. Of all these, those who migrated because
120
of business and employment are far more than the rest. This
is a clear indication that these economic activities
contribute to the development of the conurbation of the
area. Hence, they tend to make long term investments such as
building houses and also having children. These in
themselves contributed to population growth and also
physical expansion of built up land to form a continuous
urban area.
The other factors are linked to the likelihood to settle in
Nakonde and Tunduma. These include services which indicate
that all of them are more likely to settle as their odds
ratio is exceed 1, food and development of the area. The
area is able to provide services such as transport that is
road and rail, electricity and piped water which pulled
people to this. These services are complimented by other
things such as a variety of foods which are affordable and
also the area is developing into an urban area as there has
booming business and also expansion of modern
infrastructure.
Marriage, children and fertility are also the main
contributor to population growth. Basically, intermarriages
occur between Zambia and Tanzania which shows that people
from both countries are free with each in terms of them
staying together for a life time despite them having
121
different nationalities. This clearly shows that their
ideals about having children are almost the same.
The patterns of marriage which are mostly followed are the
traditional marriages even though there are a few who also
followed western marriages. It gives a conclusion that
traditionally a lot of children are encouraged. In addition
to this, the age at first marriage ranged between 15 years
and 35 years and these are child bearing ages.
Customary practices followed in traditional marriages are
similar between Nakonde and Tunduma because most of the
respondents confirmed that there were very few differences.
People in both towns did not believe in bearing children
outside marriages, hence promoted marriages. The fertility
rates are high that is above 2 which means that they are
able to contribute to population growth by having a lot of
children who ranged from 1 to 10+ children. Most of the
respondents had children between 1 and 4 and a large group
of them did not have prospects of having more children in
the near future. In addition, this is an area which
encouraged people to have children in marriages as most of
them did not believe in childless marriages.
6.6 Recommendations
The following were the recommendations which came out as
122
some of the ways of exposing the topic to the public and
calls for further investigation as:
1. The government of Zambia should gazette part of the
customary land especially the one closer to the border
to the municipal councils so that they regulate the
mushrooming of illegal settlements and monitor the
development of conurbation.
2. Further research is carried out on mechanisms of how to
monitor migration and its effect on the economic
development of Nakonde and Tunduma.
3. There is need for the government and other stakeholders
to expand economic and business opportunities to cater
for growing population. Also increase the use of
contraception to curb natural population increase.
REFERENCESBrinkoff, T. (2006), The Principle Agglomeration of the
world, Oxford University press, London.
Chanda, R. (1978), Rural-Urban Migration: An Eco-Economic
imperative? Master’s Dissertation, University of Zambia,
Lusaka.
Central Statistical Office (CSO), (2011), 2010 Census
123
Preliminary Report, CSO, Lusaka.
Encyclopedia Britannica (2009), Encyclopedia Britannica-
2009, Oxford University Press, London. Hall, P. (2003), Cities of tomorrow, Oxford University
press, London.
Hinde, A. (1998), Demographic Methods, Oxford University
Press, London.
Hosmer, W. and Lemeshow, S. (2000), Applied logistic
Regression, Toronto, John Wiley and sons Inc.
Lee, E. S. (1966), A Theory of Migration. Demography, Vol. 3
(1): 47 – 57.
Ministry of Finance and National Planning (MoFNP), (2007),
National population Policy, MoFNP, Lusaka.
Ravenstein, E.G. (1885), The Laws of Migration, Journal of the
Royal Statistical Society 48:167-227
Ravenstein, E.G. (1889), The Laws of Migration, Journal of the
Royal Statistical Society 52:214-301
124
Snyder, D. (1974), ‘Economic Determinants of Family Size in
West Africa’, Demography Vol.11 No. 4 (November) pp. 613-
622.
Statistics Canada (SC), (2006), Portrait of the Canadian
population in 2006: Sub provincial population dynamics,
greater Golden Horse, census of population, Statistics
Canada, Quebec.
Todaro, P. (2003), Economic Development, Dorling Kindersley
limited, Delhi.
Tyson, T. (1972), Temperature Structure above cities: Review
and Preliminary findings from Johannesburg urban heat Island
project, Oxford University press, Cape town.
Unite Nations (UN), (2009), World Urbanization prospects,
Harvard University press, New York.
United States Census Bureau (UNCB), (2007), Annual Estimates
of the population of combined Statistical areas: April 1,
2006 to July 1, 2007, Population Division United states
Census Bureau, New York.
Waugh, D. (1995), Geography: An Integrated Approach, Thomas
Nelson and Sons limited, London.
125
WORLD WIDE WEB
www.conurbationencyclopaedic.com
www.skyscrapercity.com
www.tageo.com
126
APPENDICESAPPENDIX A
QUESTIONNAIRE
THE UNIVERSITY OF ZAMBIASCHOOL OF HUMANITIES AND SOCIAL SCIENCES
POPULATION STUDIES DEPARTMENT
RESEARCH TOPIC: FACTORS ASSOCIATED WITH THECONURBATION OF NAKONDE AND TUNDUMATOWNS.
Dear Respondent,My name is Gomezgani Kawonga pursuing my studies in Masters
127
of Population Studies at the University of Zambia. I amresearching on the ‘factors associated with the Conurbationof Nakonde and Tunduma towns’. All the responses that willbe given to the questions will be treated with utmostconfidentiality and will only be used for academic pursesonly. Therefore, I will be very grateful for yourparticipation and the information that you will provide asit will help me in writing my dissertation and finish mycourse.INSTRUCTIONS
1. Tick in the brackets for the appropriate answer.[ ]
2. Write in the spaces provided.3. Use ink when writing.
No BACKGROUND RESPONSES SKIPTO
Q01
Country ……………………………………….
Q02
Province ……………………………………….
Q03
District ……………………………………….
Q04
Residential ………………………………………
Q05
Date ofInterview
..../…./………
Q06
Indicate yourSex
…………………………………………
Q07
Indicate yourReligion
…………………………………………
Q08
How Old are you? …./…./……..
Q09
When were youborn?
Q10
What is yourMarital Status?
Single …………………………………………1Married………………………………………..2Divorced………………………………………3Separated……………………………...........
Thank you for your time and co-operation. May God bless you.
APPENDIX B
NON-SCHEDULED STRUCTURED INTERVIEW
MUNICIPAL COUNCILTHE UNIVERSITY OF ZAMBIA
SCHOOL OF HUMANITIES AND SOCIAL SCIENCESPOPULATION STUDIES DEPARTMENT
RESEARCH TOPIC: FACTORS ASSOCIATED WITH THECONURBATION OF NAKONDE AND TUNDUMATOWNS.
Dear Respondent,My name is Gomezgani Kawonga pursuing my studies in Mastersof Population Studies at the University of Zambia. I am
133
researching on the ‘factors associated with the Conurbationof Nakonde and Tunduma towns’. All the responses that willbe given to the questions will be treated with utmostconfidentiality and will only be used for academic pursesonly. Therefore, I will be very grateful for yourparticipation and the information that you will provide asit will help me in writing my dissertation and finish mycourse.
INTERVIEW QUESTIONS1. What is the name of this government department?2. When did its operation commerce?3. What is your position in this office?4. What are the functions of your office?5. What are some of the challenges in the following:
a) Land allocationb) Illegal settlementsc) Water provisiond) Sanitatione) Crime
Thank you for all your responses.
IMMIGRATION OFFICE
THE UNIVERSITY OF ZAMBIA
134
SCHOOL OF HUMANITIES AND SOCIAL SCIENCES
POPULATION STUDIES DEPARTMENT
RESEARCH TOPIC: FACTORS ASSOCIATED WITH THE
CONURBATION OF NAKONDE AND TUNDUMA
TOWNS.
Dear Respondent,My name is Gomezgani Kawonga pursuing my studies in Mastersof Population Studies at the University of Zambia. I amresearching on the ‘factors associated with the Conurbationof Nakonde and Tunduma towns’. All the responses that willbe given to the questions will be treated with utmostconfidentiality and will only be used for academic pursesonly. Therefore, I will be very grateful for yourparticipation and the information that you will provide asit will help me in writing my dissertation and finish mycourse.INTERVIEW QUESTIONS
1. What is the name of the government department?2. When did it start its operations?3. What is position do you hold in this office?4. What are the main functions of your office?5. How does your office monitor the movement of people in
and out of Zambia and Tanzania?6. How do you deal with the issues of illegal immigrants?7. How is the trend of immigrants since 2000?8. How do you store your records?
Thank you for all your responses.
135
REVENUE AUTHORITYTHE UNIVERSITY OF ZAMBIA
SCHOOL OF HUMANITIES AND SOCIAL SCIENCES
POPULATION STUDIES DEPARTMENT
RESEARCH TOPIC: FACTORS ASSOCIATED WITH THE CONURBATION
OF NAKONDE AND TUNDUMA TOWNS.
Dear Respondent,My name is Gomezgani Kawonga pursuing my studies inMasters of Population Studies at the University ofZambia. I am researching on the ‘factors associated withthe Conurbation of Nakonde and Tunduma towns’. All theresponses that will be given to the questions will betreated with utmost confidentiality and will only be usedfor academic purses only. Therefore, I will be verygrateful for your participation and the information thatyou will provide as it will help me in writing mydissertation and finish my course.
INTERVIEW QUESTIONS1. What is the name of his government department?2. When did it start its operations?3. What is your position in this office?4. What are the functions of this government department?5. How do you monitor the collection of revenue on the
Nakonde/Tunduma border?6. What are the types of goods that pass through the
Nakonde/Tunduma border?7. What are their countries of origin?8. What are some of the challenges that you face in