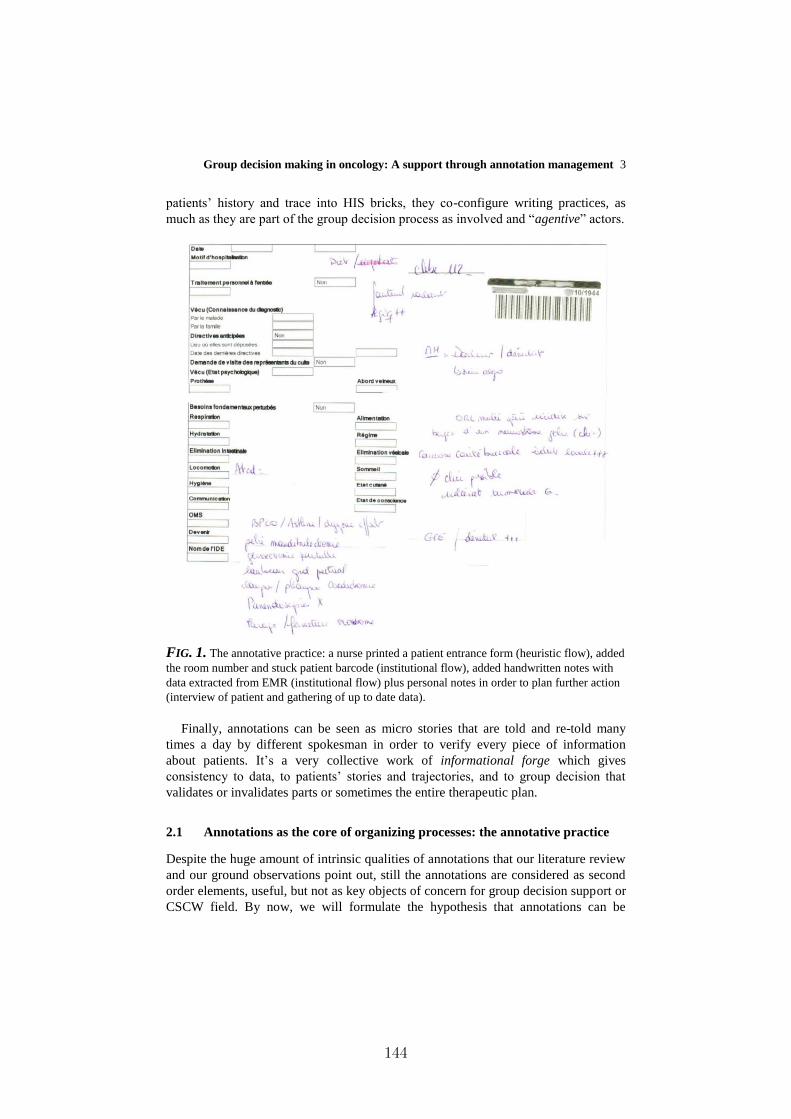
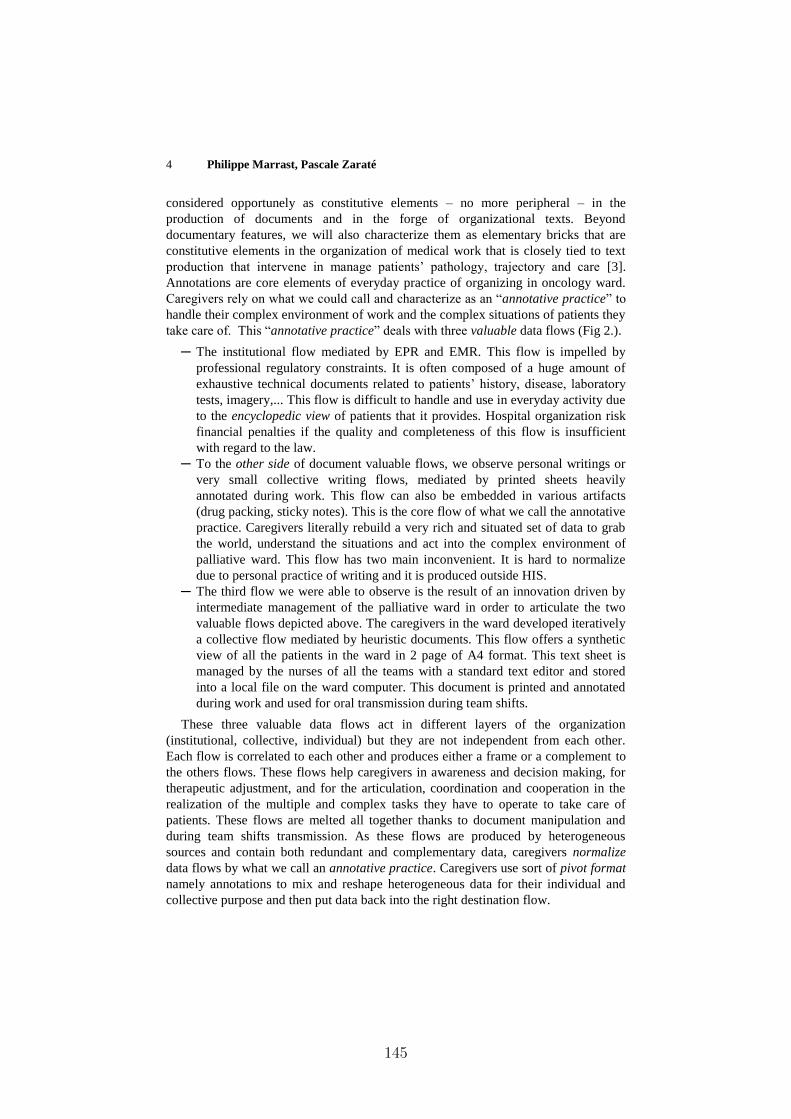
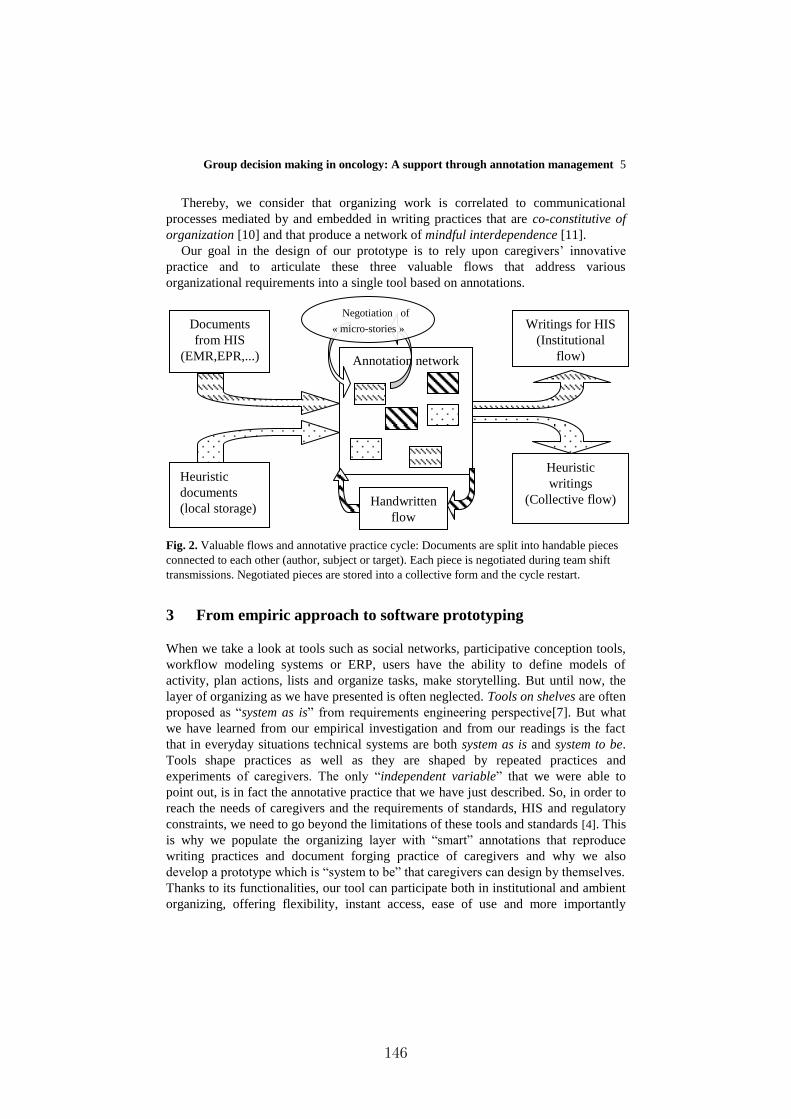
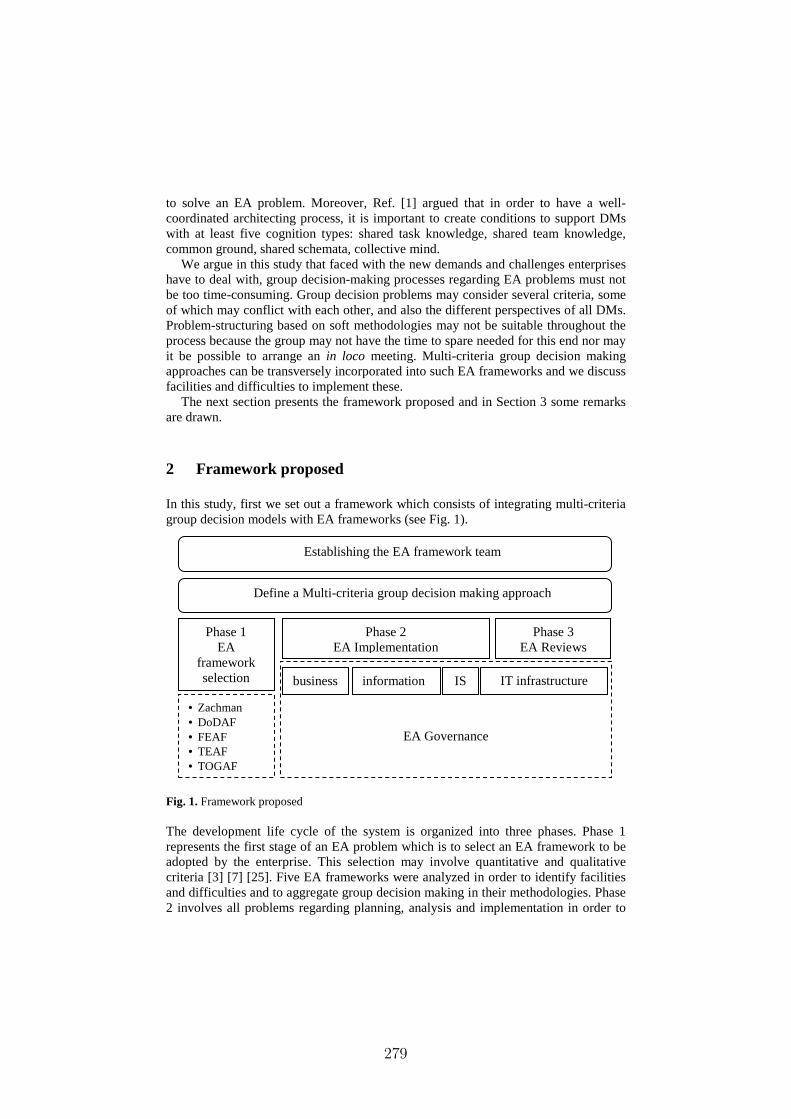
Group Decision and Negotiation 2014 GDN 2014 Proceedings of the Joint International Conference of the INFORMS GDN Section and the EURO Working Group on DSS Editors : P. Zaraté, G. Camilleri, D. Kamissoko, F. Amblard
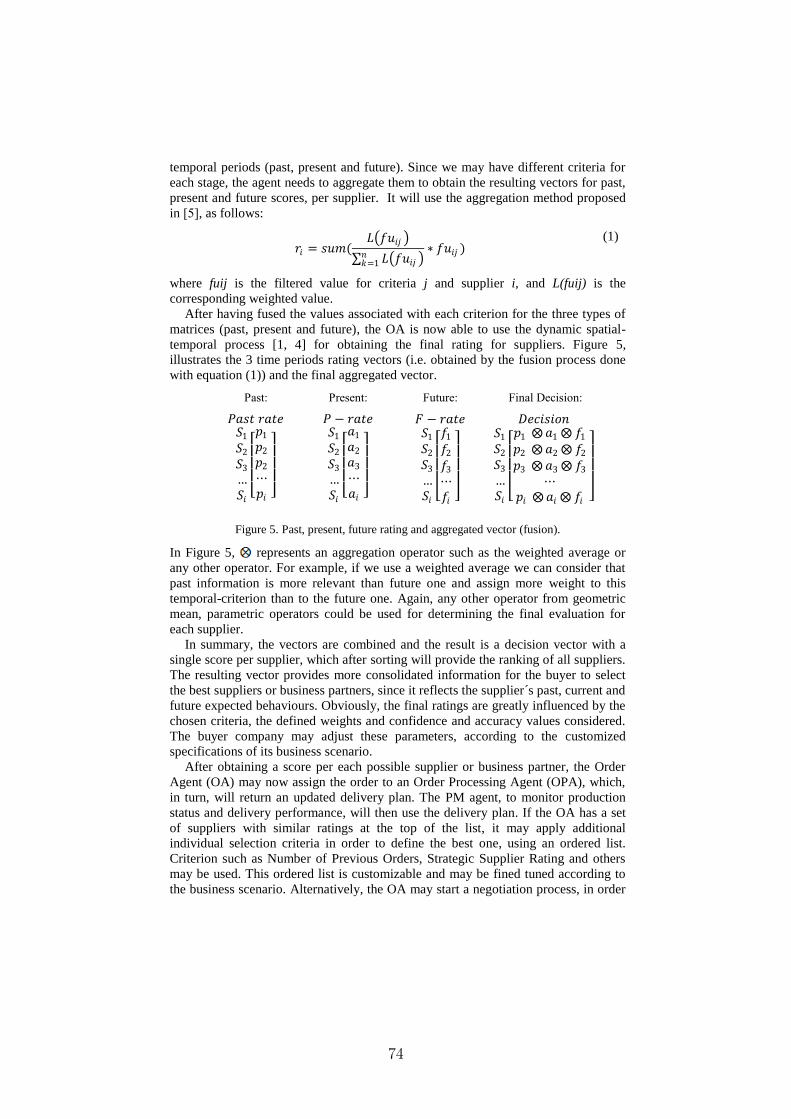
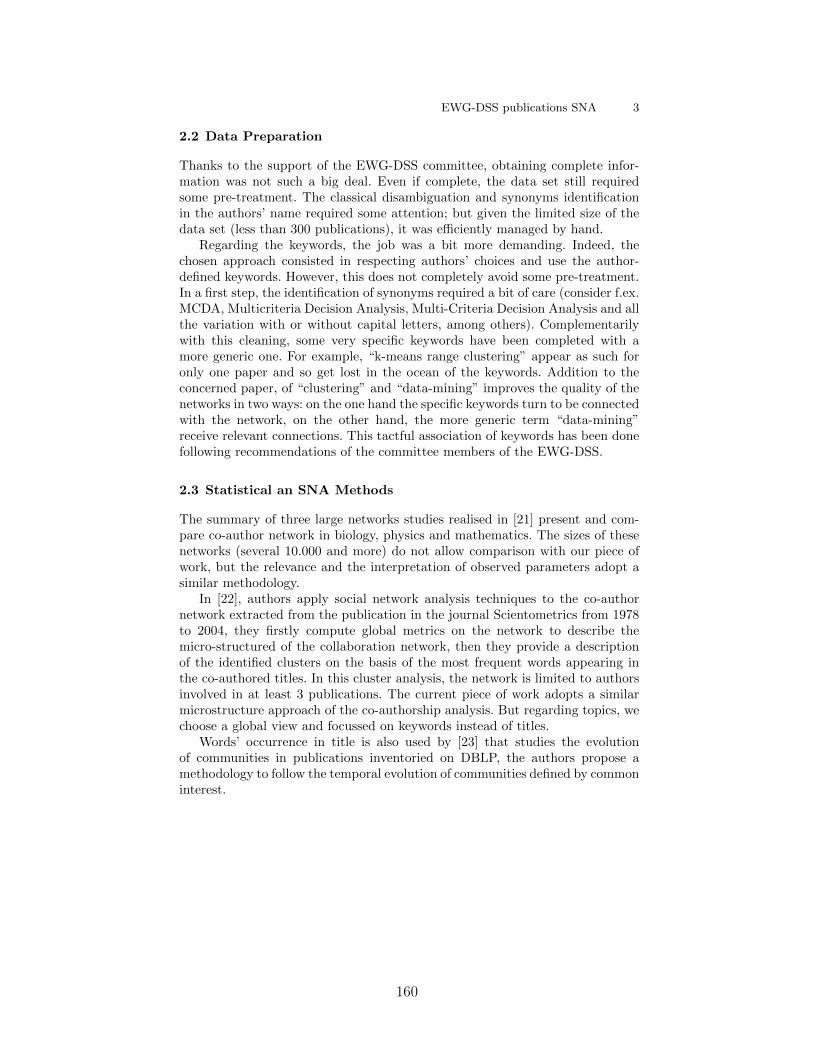
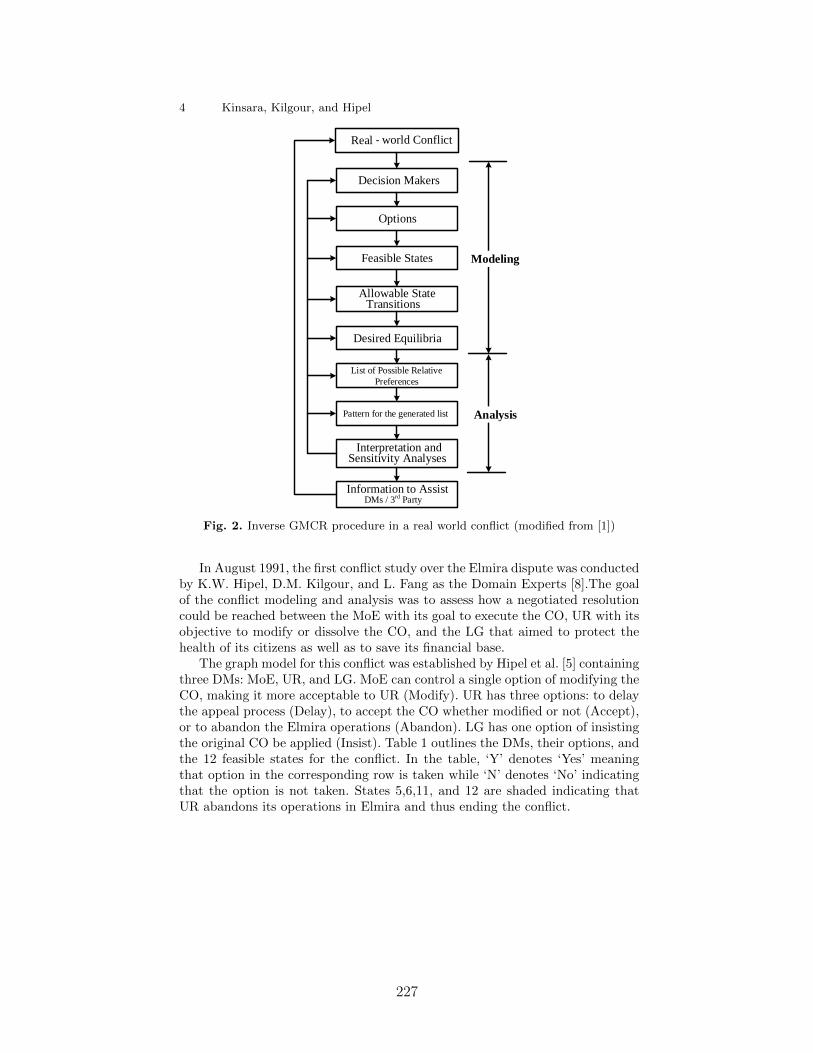
Transcript
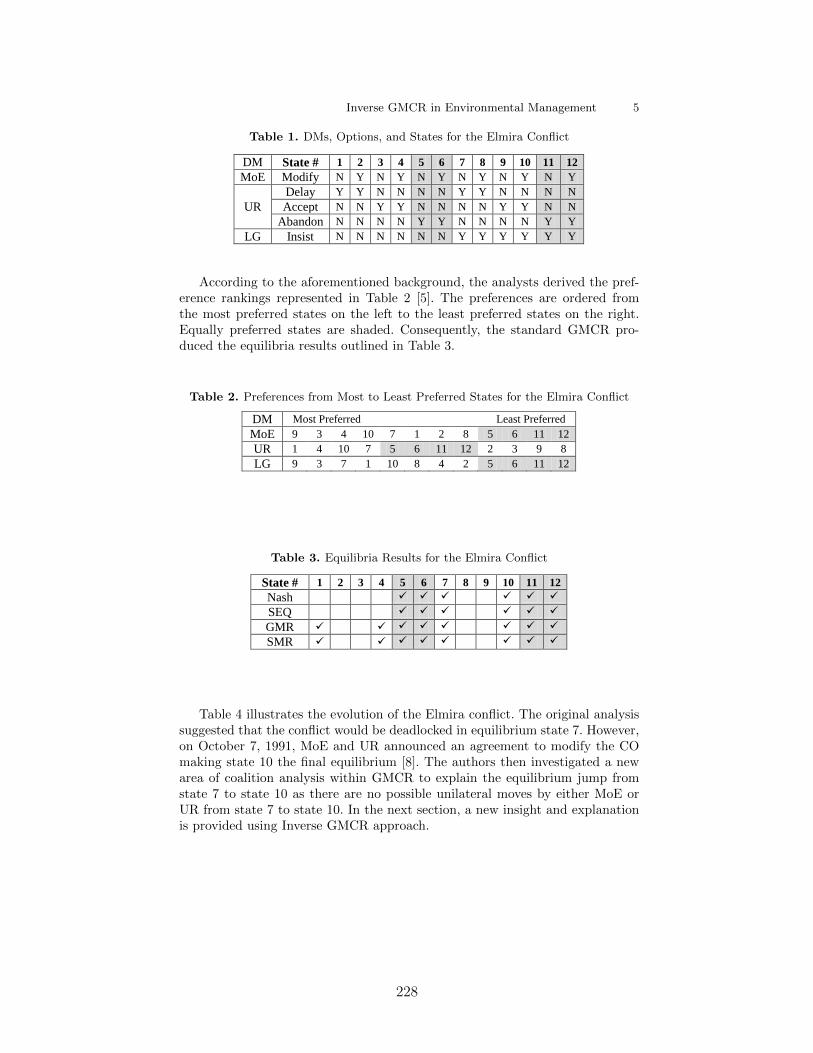
Group Decision and Negotiation 2014
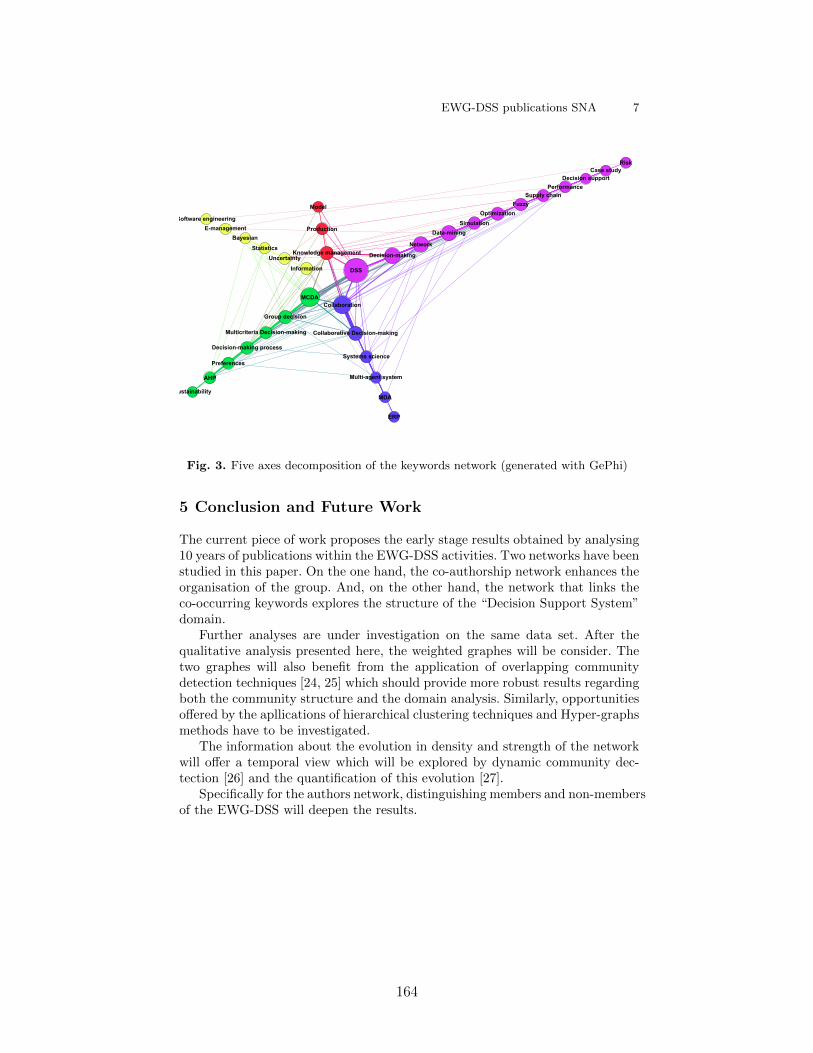
GDN 2014
Proceedings of the Joint International
Conference of the INFORMS GDN Section
and the EURO Working Group on DSS
Editors : P. Zaraté, G. Camilleri, D. Kamissoko, F. Amblard
Toulouse University
France
ISBN : 978-2-917490-27-3
GDN INFORMS Group Preface
Meetings of the Group Decision and Negotiation series aim to bring together researchers and practitioners
from the humanities, social sciences, economics, law, management, engineering, decision science and
computer science. These diverse areas are characterized by different paradigms, methods of inquiry and
goals. But we focus on common challenges, including the problems faced by decision makers who must
address tensions and conflicts through all phases of negotiations and group decision processes. These
challenges require researchers to understand both the dynamics of independent entities and the
consequences of their interactions. To provide practitioners with knowledge and tools, researchers
construct models and systems that can not only aid decision makers, but in some cases undertake decision-
related activities on their behalf.
As in all previous GDN meetings, Melvin F. Shakun has led us with his good spirit and a helping hand.
He, together with Colin Eden, Keith W. Hipel, Gregory Kersten, Marc Kilgour and Floyd Lewis have
helped us to adhere to the traditions that took root from the first GDN meeting in Glasgow, in 2000.
Following memorable GDN meetings, including Vienna hosted by Rudolf Vetschera, Karlsruhe hosted by
Christof Weinhardt, Montreal hosted by Gregory Kersten, Coimbra hosted by João Climaco and João
Paulo Costa, Toronto hosted by Marc Kilgour, Delft hosted by Gwendolyn Kolfschoten, Recife hosted by
Adiel Teixeira de Almeida, and Stockholm hosted by Bilyana Martinovski, the GDN 2014 meeting takes
place in Toulouse and has been organized by Pascale Zaraté.
Marc Kilgour (Conference General Chair)
Melvin Shakun (Conference General Chair)
EWG-DSS
EURO Working Group on
Decision Support Systems
The EWG-DSS is a Working Group on Decision Support Systems within EURO, the
Association of the European Operational Research Societies
The main purpose of the EWG-DSS is to establish a platform for encouraging state-of-the-art
high quality research and collaboration work within the DSS community. Other aims of the EWG-
DSS are to:
o Encourage the exchange of information among practitioners, end-users, and
researchers in the area of Decision Systems.
o Actively contribute to enlarge the networking among the DSS communities available
and facilitate activities that are essential for developing international cooperation
research and projects.
o Facilitate professional academic and industrial opportunities for its members.
o Support the development of innovative models, methods and tools in the field Decision
Support and related areas.
o Actively promote the interest on Decision Systems in the scientific community by
organizing dedicated workshops, seminars, mini-conferences and conference streams
in major conferences, as well as editing special and contributed issues in relevant
scientific journals.
The EWG-DSS was founded during a memorable EURO Summer Institute on DSS that took
place at Madeira, Portugal, in May 1989. This Summer Institute was organized by two well-known
academics of the OR Community: Jean-Pierre Brans and José Paixão. It counted with the participation
of 24 (at that time) young researchers of 16 different nationalities. Most of them still continue
nowadays to pursue their goals, working actively in their research areas.
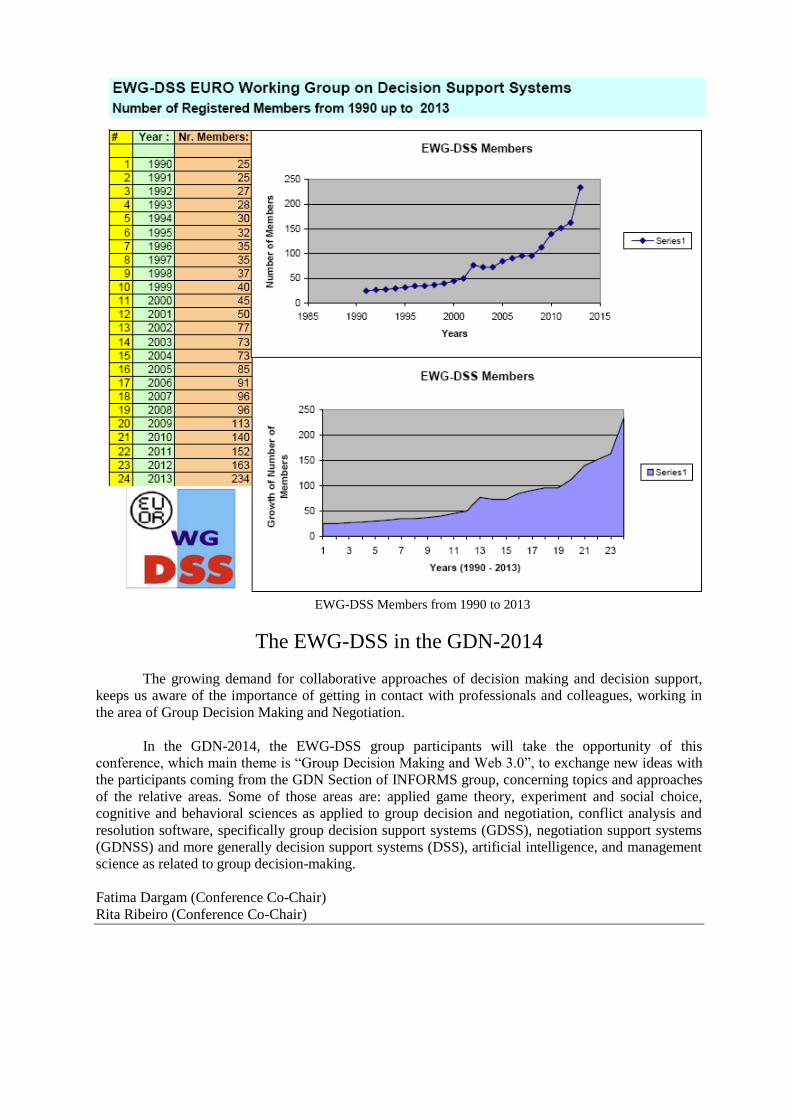
The number of EWG-DSS members has substantially grown along the years with members
coming from all parts of the globe. Several research co-operations within the group members are
leading to important contributions to the DSS field and joint journal publications.
Since its creation, the EWG-DSS has held annual Meetings in various European countries, and
has taken active part in the EURO Conferences on decision-making related subjects.
Since 2007 the EWG-DSS has been managed by a Coordination Board. One of the aims of this
coordination board is to better promote joint-work among the group members and to encourage more
participation of the whole group in DSS related projects and events. In the period of June 2007 to
January 2011 the EWG-DSS Coordination Board was composed by: Pascale Zaraté, Fátima Dargam
and Rita Ribeiro. Since the beginning of 2011, the EWG-DSS Managing Board counts with the
assistance of other three Board Members, namely: Jorge Hernández; Boris Delibašić; and Shaofeng
Liu. From 2013 onwards, the board will count with two extra members: Isabelle Linden and Jason
Papathanasious to better administrate the activities of the group, as well as to bring new ideas to it.
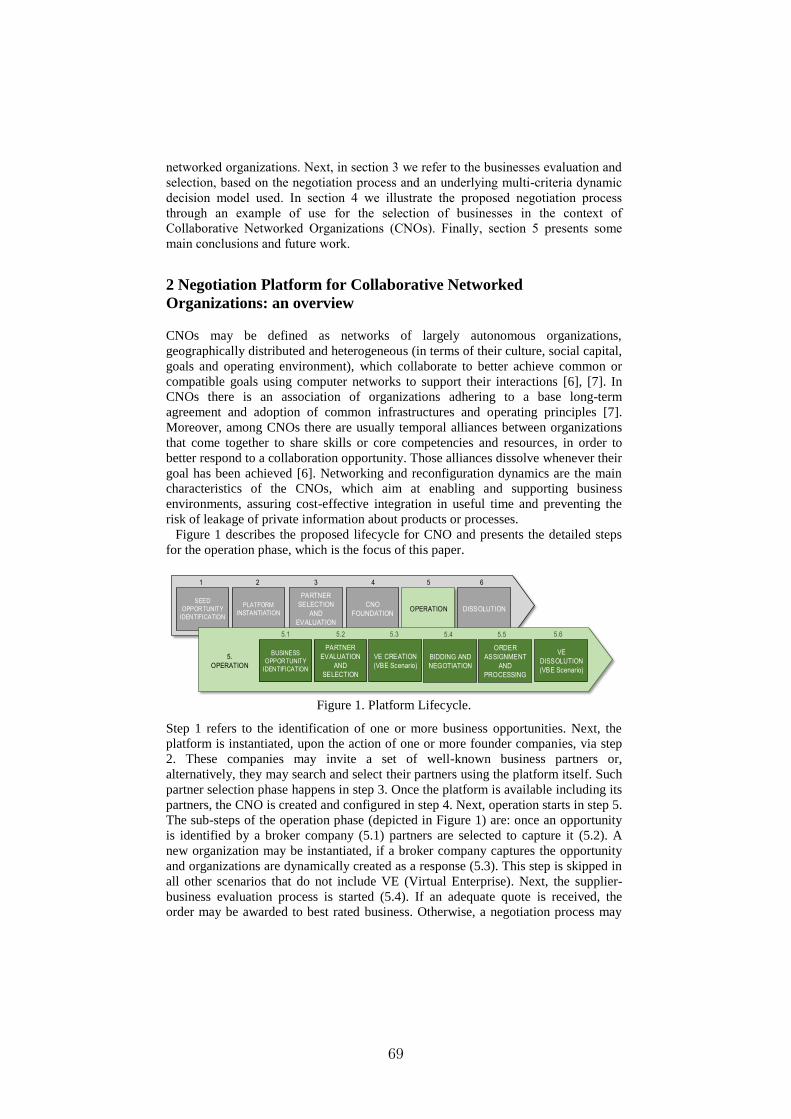
2 University of Vienna, Vienna, Austria,patrick.hippmann,[email protected]
Abstract. Negotiation processes involve a substantive, a communica-tion and an emotional dimension. These dimensions have been analyzedmainly in isolation of each other. We introduce an approach to considerall dimensions simultaneously and present an empirical study on interac-tions between these dimensions. Results indicate a strong linkage betweencommunication behavior, emotions and agreement, while connections tothe substantive dimension of the negotiation process are weaker.
Negotiations can be analyzed from many different perspectives [7, 17]. Over thelast decades, two main streams of research dealing with negotiation processeshave emerged. One stream is mainly concerned with the substantive side ofnegotiations. This stream can perhaps best be exemplified by the concept ofnegotiation analysis [10, 14]. This stream sees a negotiation mainly as a sequenceof offers and counteroffers, leading to an agreement in terms of the substantiveissues. It is predominantly concerned with economic criteria like efficiency andthe payoff obtained by each negotiator – measured, for example, in terms ofutilities.
In parallel, a more behaviorally oriented stream of negotiation research hasemerged, which emphasizes the role of communication in negotiations [5]. Re-searchers in this stream have developed classification schemes for communicationacts [8] and phase models of negotiations [1], which explain how communicationcontent changes over time, and how these different communication contents af-fect the outcome of a negotiation. The main outcome dimension in this streamof research is whether a negotiation reaches an agreement at all.
More recently, researchers have begun to consider emotions as yet anotherdimension of the negotiation process [4]. This research has uncovered differentpatterns in the development of emotional behaviors over time in successful andfailed negotiations and thus has contributed to our understanding how emotionsshape processes and outcomes of negotiations.
9
2 Filzmoser, Hippmann, Vetschera
These different dimensions of negotiation processes, and their related out-come measures, are also clearly reflected in the design of existing negotiationsupport systems (NSS). Many systems like for example Inspire [6] follow aneconomic approach and provide tools to elicit utility functions, evaluate offers,and other decision support tools. Other systems like Negoisst [12] also imple-ment features to enhance communication quality by, e.g., allowing for the explicitclassification of messages as “question” or “offer”. NSS that explicitly consideremotions, given the relative novelty of this perspective, are yet to be developed[2].
However, the interactions between these dimensions of negotiation processes,and their mutual influence on related outcome measures, have only rarely beenstudied. The emotional dimension so far has been studied mostly in isolation.Analyses of the substantive dimension of negotiation processes often ignore thecontent of communication besides the exchanged offers. Studies that focus onthe communication dimension of negotiation processes consider emotional orsubstantive content similar to any other type of content. At a quite cursorylevel, content of the emotional dimension is assigned to categories like “affec-tive persuasion” [1] and content of the substantive dimension to categories like“single-issue offer”, “multi-issue offer” [1, 9], or “concession” [8, 9].
One reason for this lack of multidimensional analyses might be the lack ofa unified framework for negotiation processes, which is needed to study thesedimensions simultaneously. In the present paper, we apply such a framework,the standardized interpolated path analysis (SIPA) approach [18] to conductan exploratory analysis of the interactions between different dimensions of thenegotiation process. The remainder of this paper is structured as follows: In thesubsequent Section 2, we give a brief overview of methods employed to measurethe different dimensions of the negotiation process as well as the SIPA approach.In Section 3, we present some exemplary results and Section 4 evaluates theoutcomes of this study and provides directions for future research.
2 Methods
Our analysis is based on the SIPA approach [18]. This approach provides aconsistent representation of negotiation processes, in which a variable number ofoffers is made at varying points in time. To make processes comparable, SIPAinterprets each offer or message as one observation of a continuous time process,i.e. one assumes that the underlying variables characterizing the process changecontinuously over time. Linear interpolation between observations is used toapproximate values at fixed points in time, e.g., each quarter of the negotiation.This provides a comparable representation of the processes of all negotiations ina study.
This approach can be applied to all dimensions of the negotiation process.To model the substantive dimension, each offer is characterized by the utilities itprovides to the party making the offer, and to the opponent. Consequently, theprocess is modeled by four utility values. Similarly, the communication process
Kamineta
Rectangle
10
Multidimensional analysis 3
can be represented by interpreting the fractions of different types of communi-cation acts in total communication as state variables, which are interpolated atfixed time intervals. The emotional dimension of negotiation processes can berepresented by a dimensional model of emotions [11], which distinguishes the twobipolar dimensions of valence (pleasure vs. displeasure) and activation (activa-tion vs. deactivation). The following sections present the results of an illustrativeapplication of these concepts to data gathered in negotiation experiments.
3 Data
We use data from a previous negotiation experiment with the NSS Negoisst
conducted in 2011 [13]. In total, 234 students (i.e. 117 dyads) from four Europeanuniversities participated in this experiment. The bargaining case used was abouta joint venture negotiation.1 The system recorded all offers made, so data on thesubstantive level of the negotiations was readily available. Following the SIPAapproach, utilities to both sides from offers of both sides were interpolated atthe end of each quarter of each negotiation. From this utility data, we calculatedjoint utilities as the sum of utilities to both parties, and contract imbalance asthe difference of utilities. Both values were calculated for offers from both sides,and then averaged across sides to obtain one unique measure for each negotiationat the end of each quarter.
To measure communication content, all messages exchanged were assignedto content categories by independent coders following the content analysis ap-proach of [15]. These content categories in turn were mapped to the four basiccategories introduced by [8], which consist of two action-oriented types of cre-ating and claiming value, and two information-oriented types of communicationproviding integrative and distributive information. The relative shares of thesefour categories in each message were used as status variables of the negotiation,and interpolated again at the end of each quarter of each negotiation.
To measure the emotional content of messages, a free-sorting task was used[16]. Messages were first sorted according to their emotional similarity by groupsof untrained raters, who were not familiar with the research questions involved.From these ratings, a two dimensional emotional score was obtained using MDS.By considering messages located at extreme values, the dimensions obtainedthrough MDS could readily by identified with the theoretical emotional dimen-sions of valence and activation.
4 Results
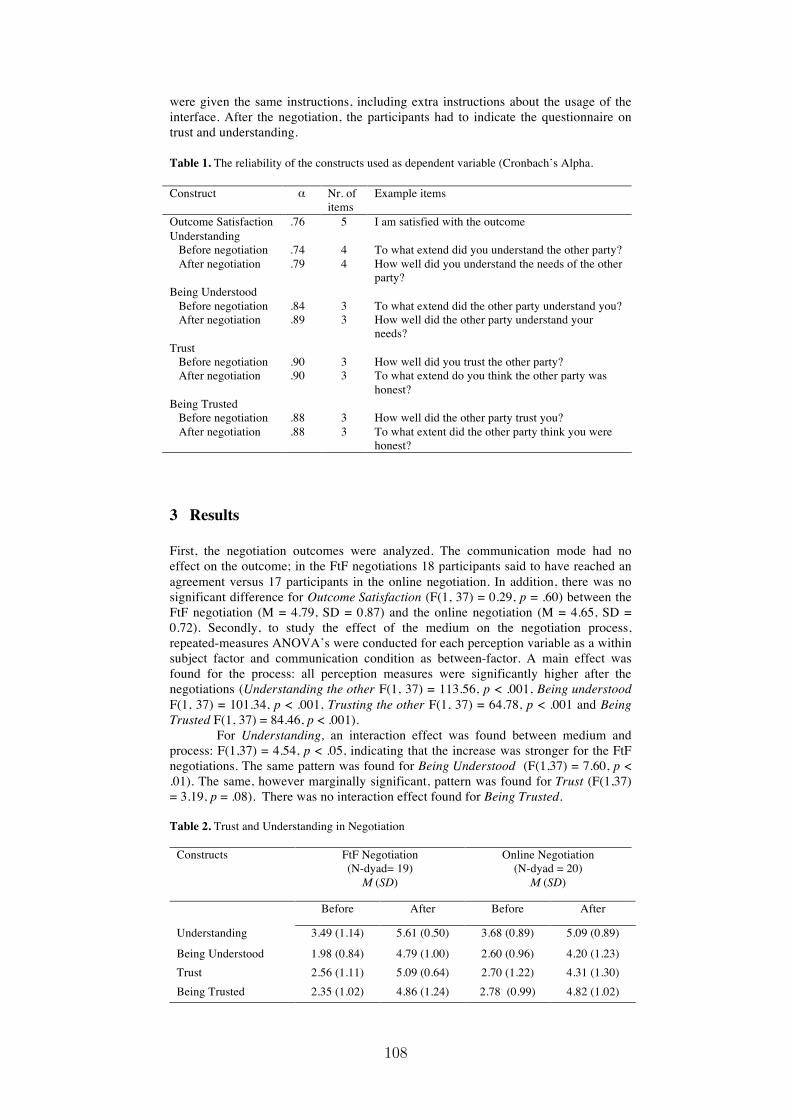
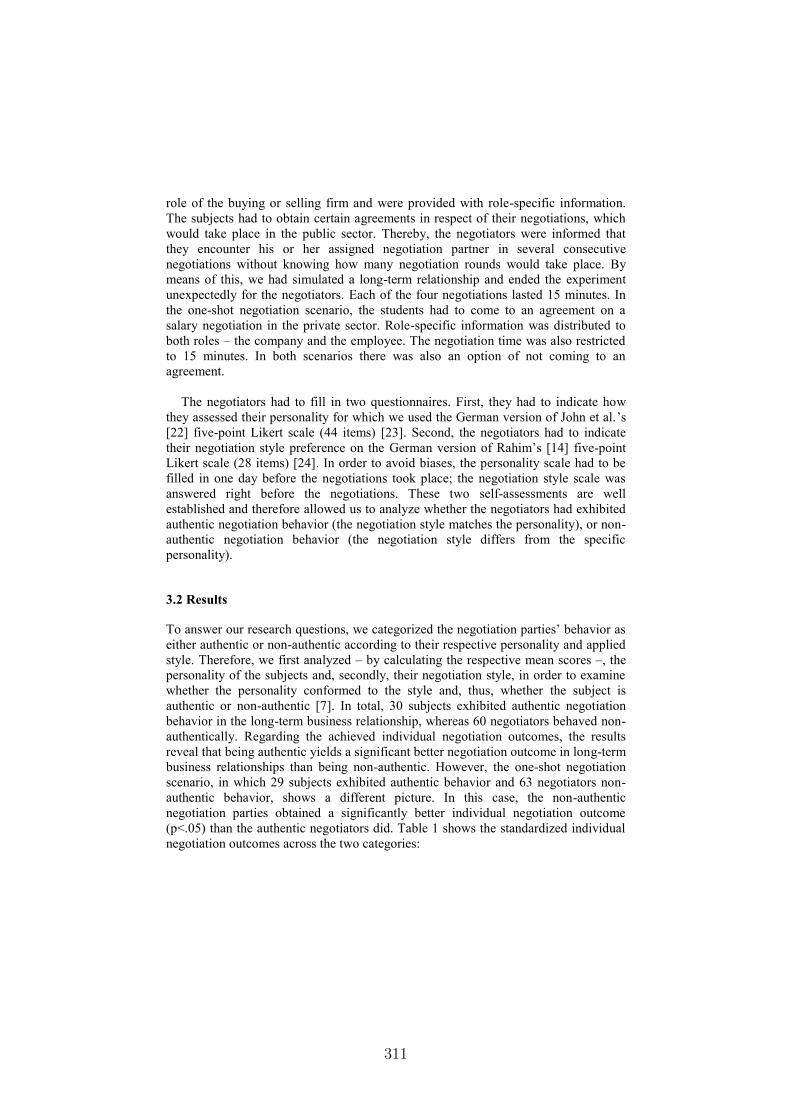
Before we present results on the relationships between different process dimen-sions of the negotiation, we give a brief overview of the impact of these dimen-sions on negotiation outcomes. As already explained, we describe the process
1 Further details about the case, the experiments and experimental conditions can befound in [3, 13].
Kamineta
Rectangle
11
4 Filzmoser, Hippmann, Vetschera
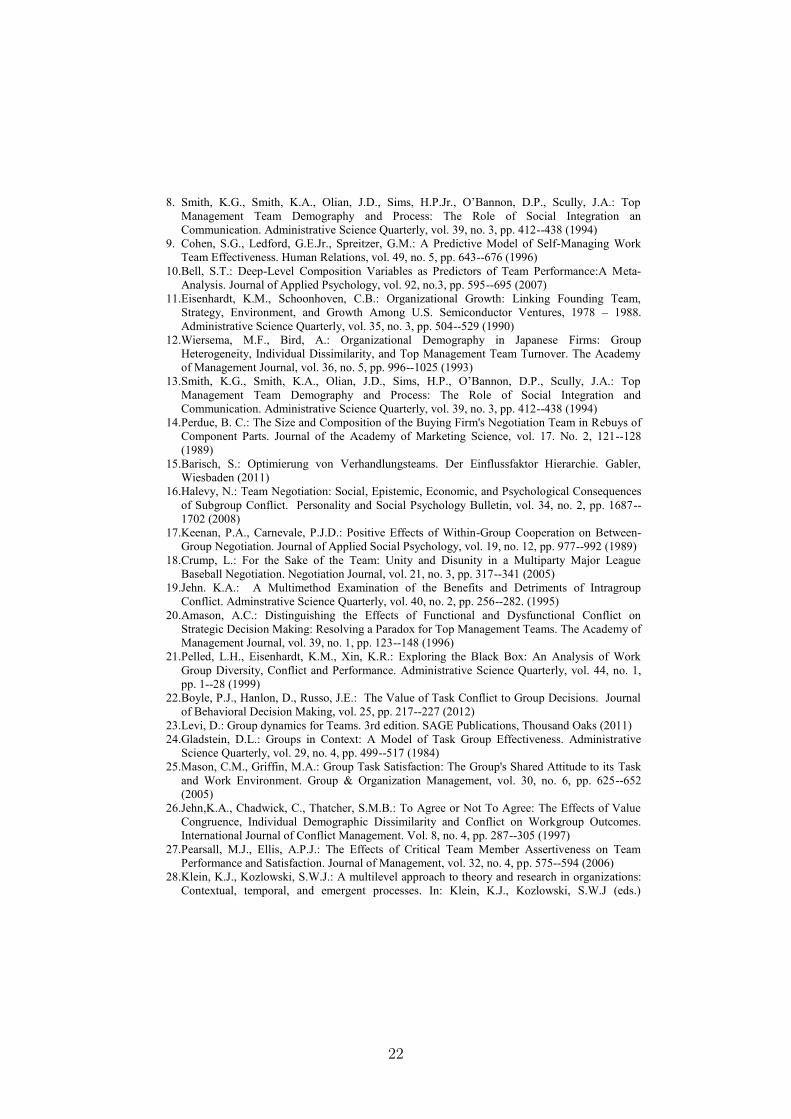
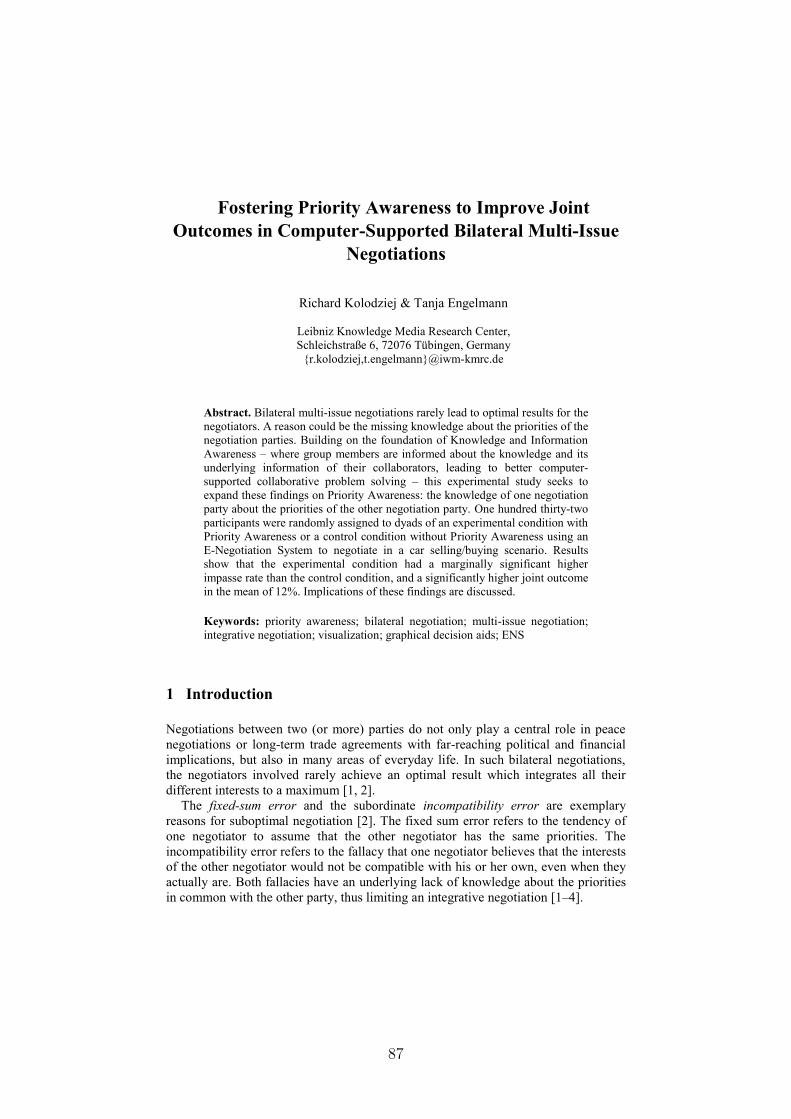
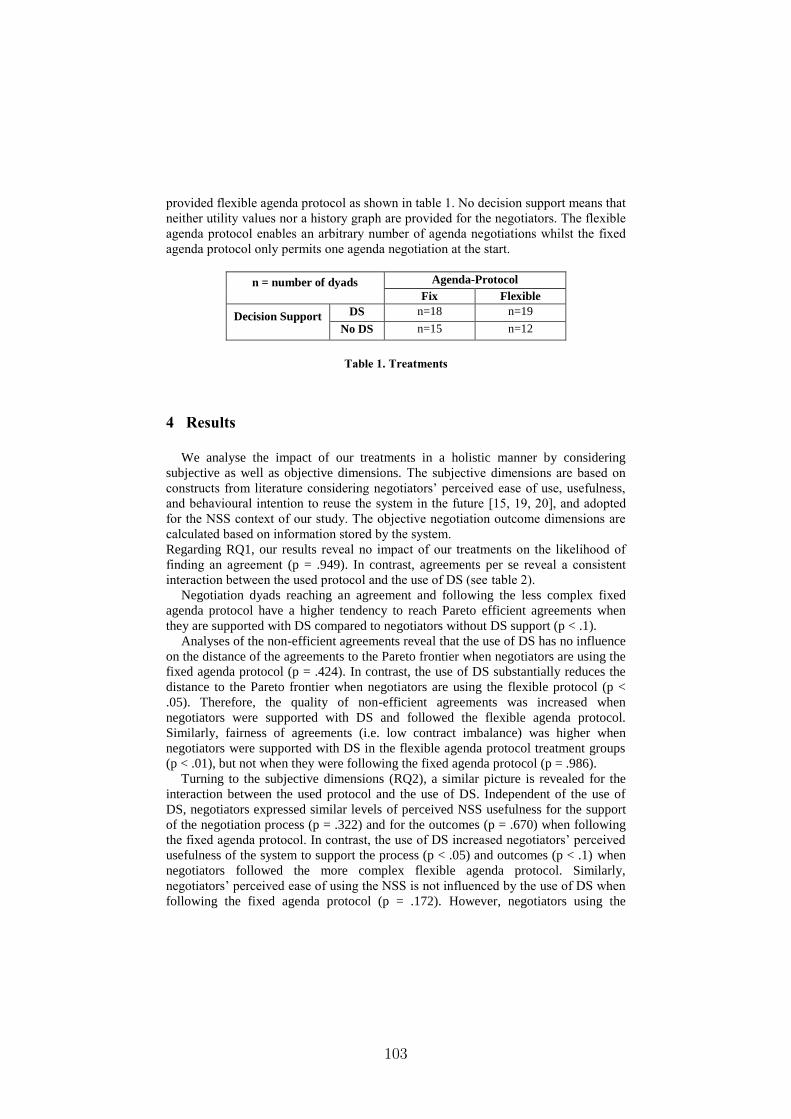
at the substantive level by the outcome-related dimensions of joint utility andcontract imbalance. Therefore, we focus on agreement as the main outcome di-mension.
Y:25% N:25% Y:50% N:50% Y:75% N:75% Y:100% N:100%
0.9
1.0
1.1
1.2
Joint utility by Agreement
Y:25% N:25% Y:50% N:50% Y:75% N:75% Y:100% N:100%
0.0
0.2
0.4
0.6
0.8
1.0
Contract imbalance by Agreement
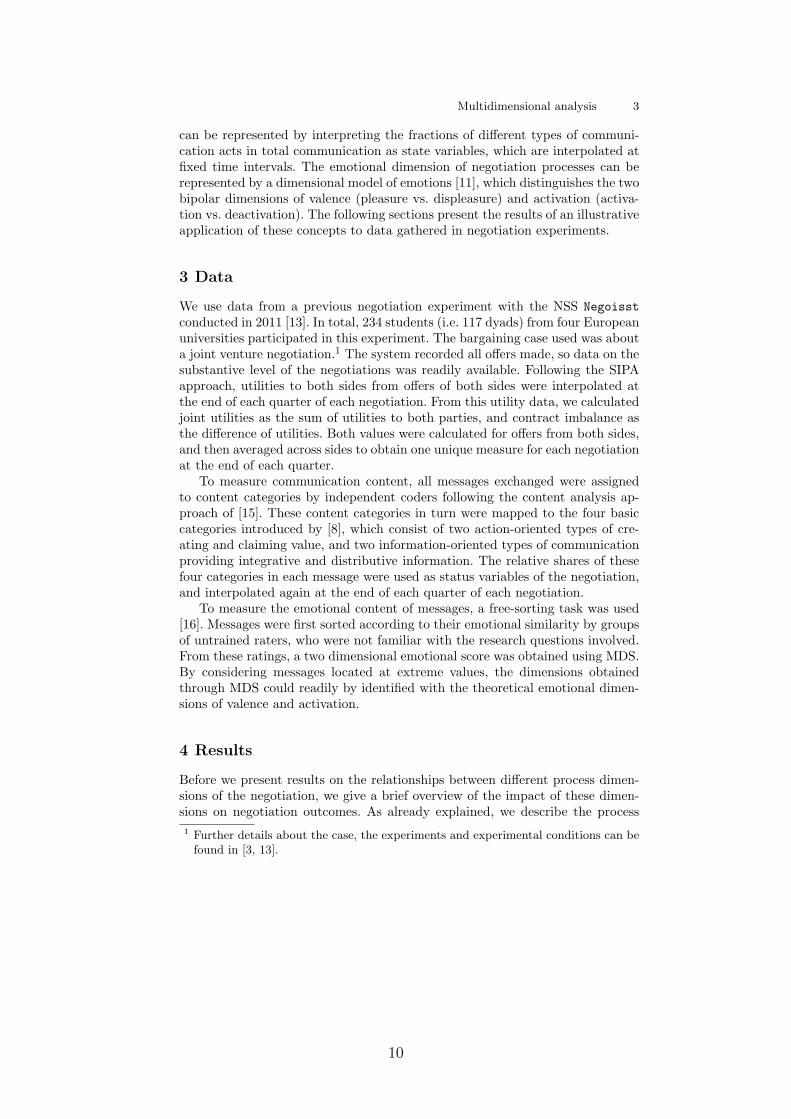
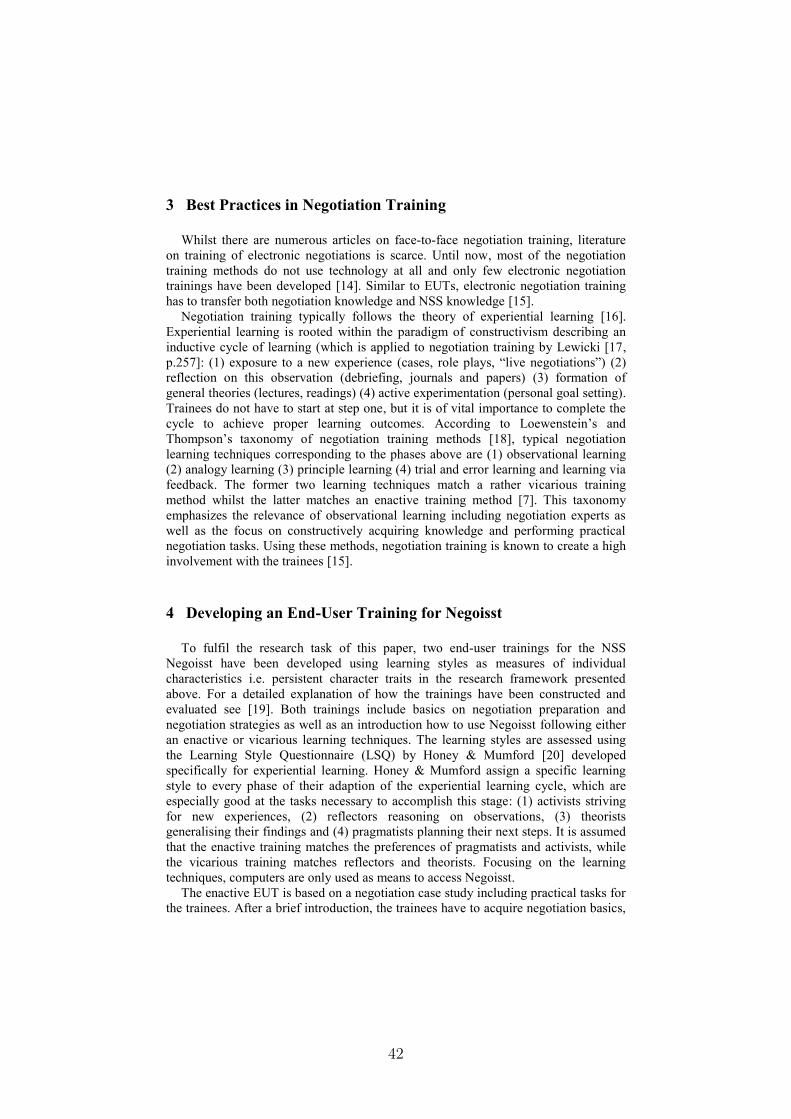
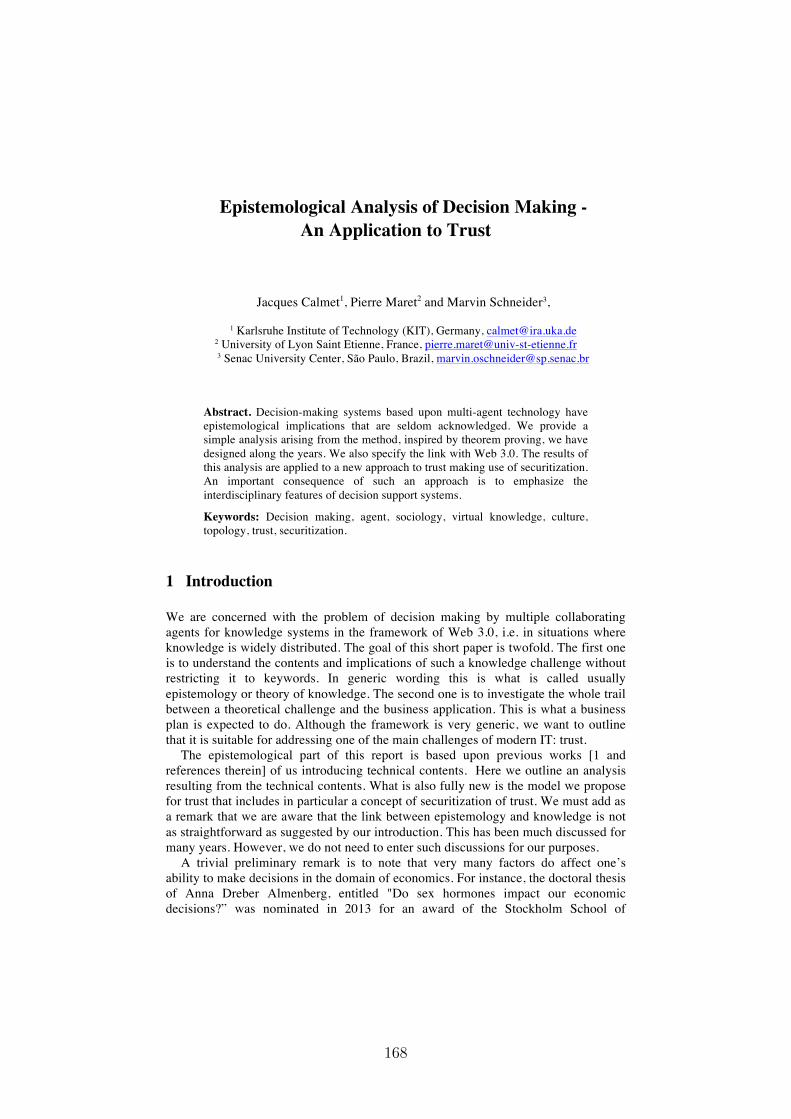
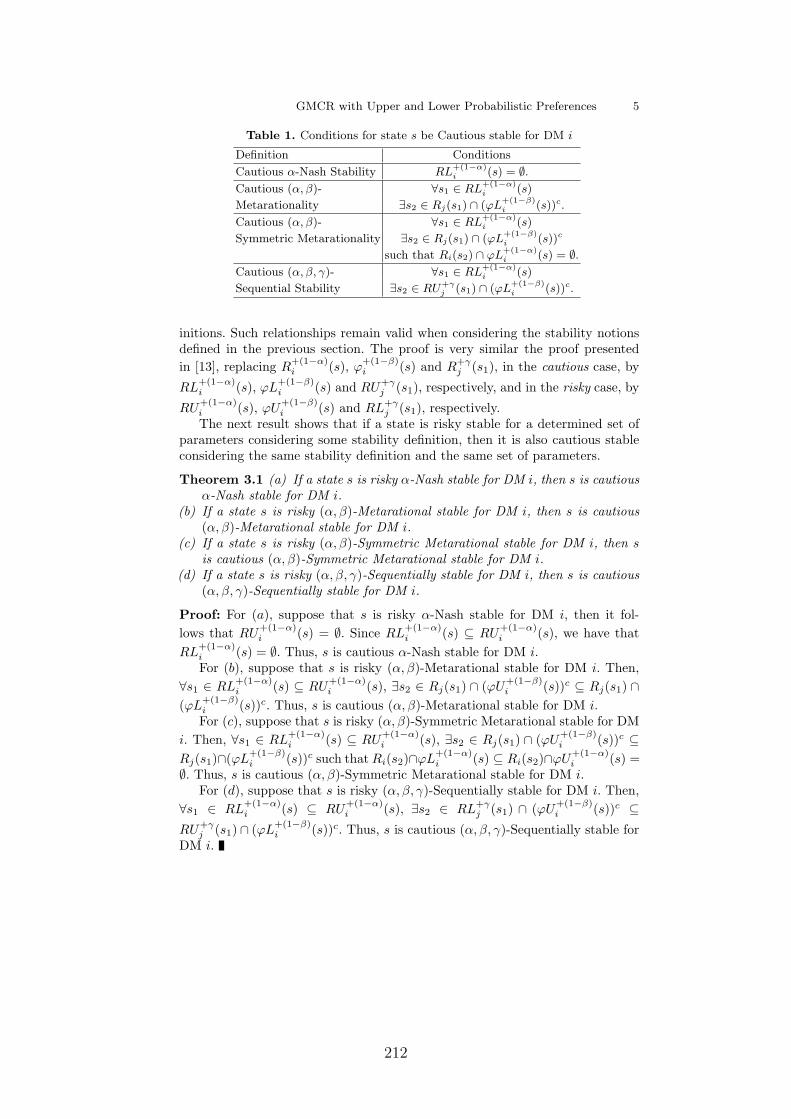
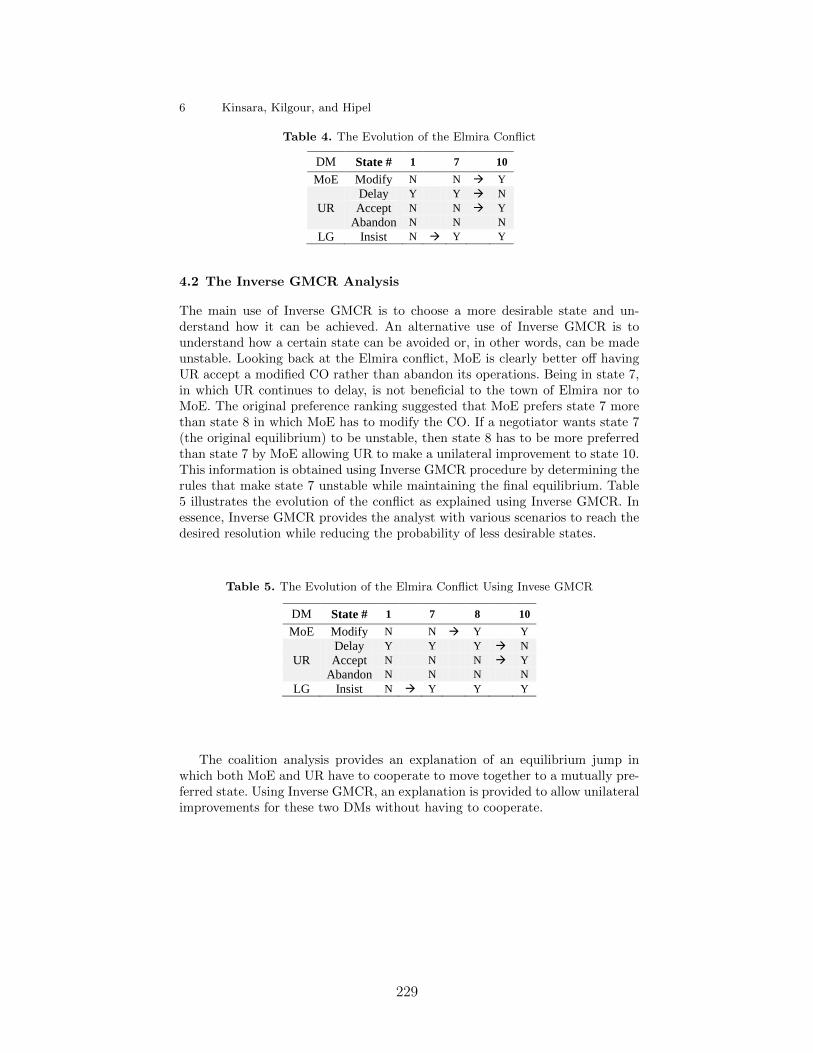
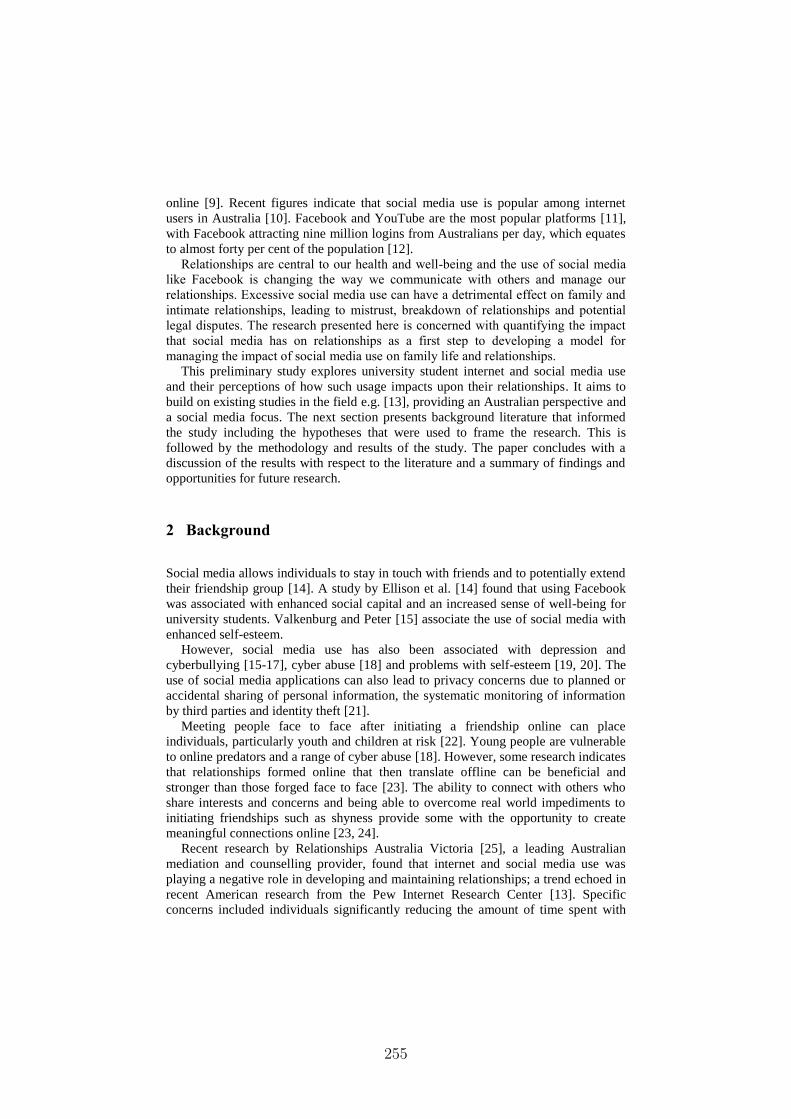
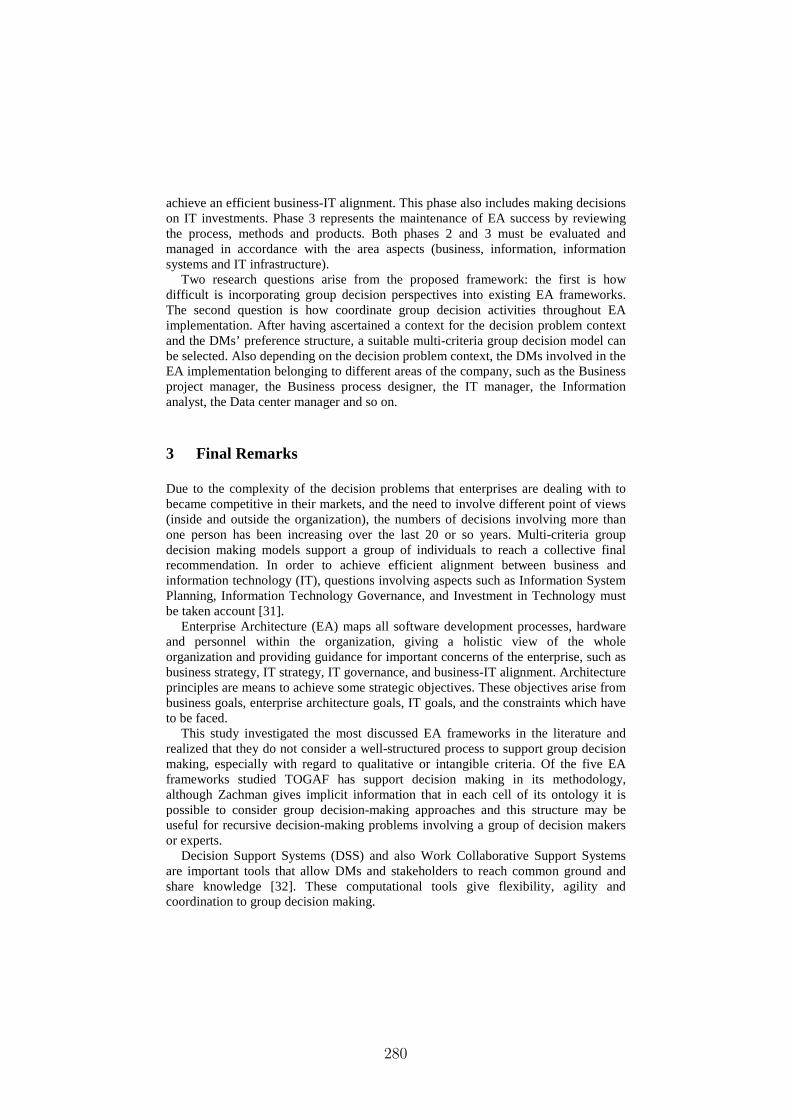
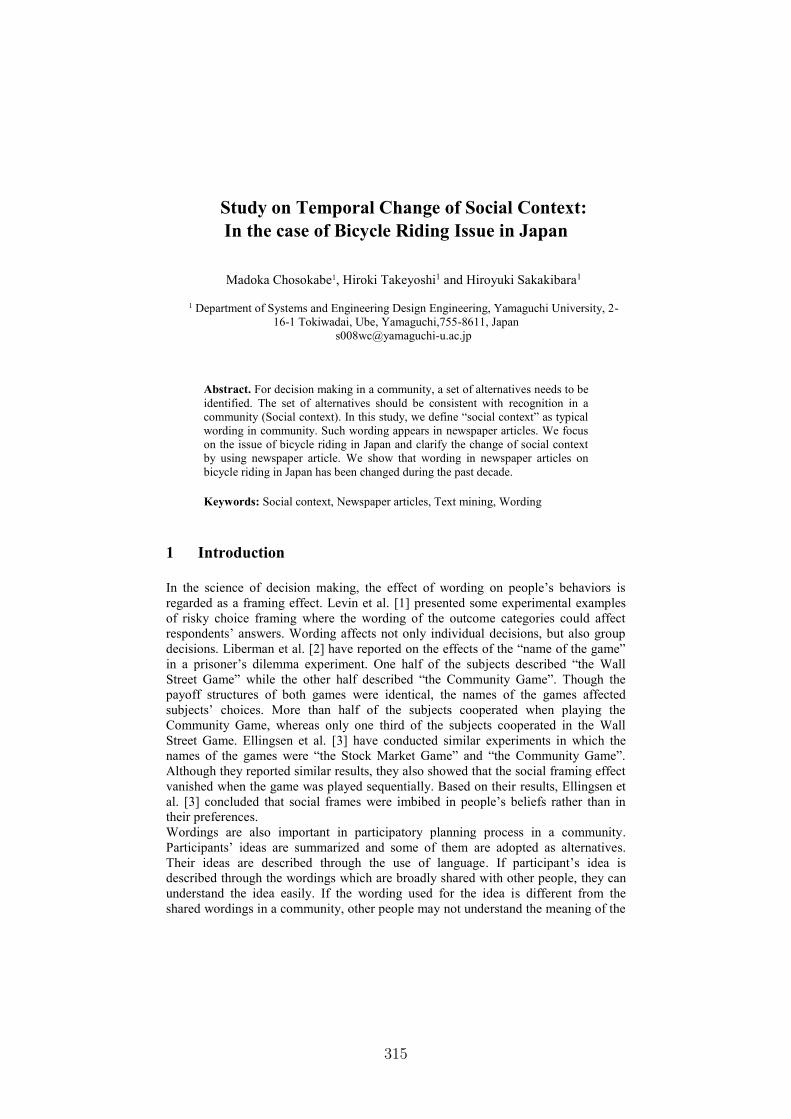
Fig. 1. Joint utility and contract imbalance over time in successful (Y) and failed (N)negotiations
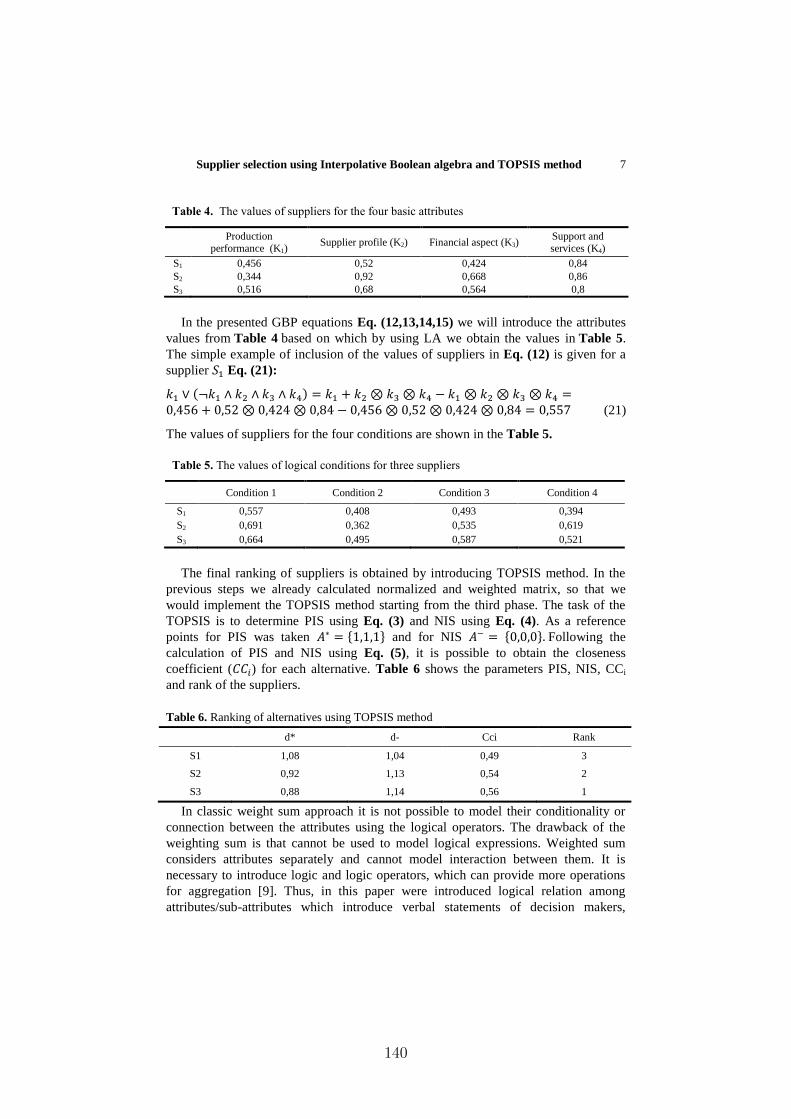
Figure 1 shows the development of the two substantive process dimensionsover time in failed and successful negotiations. There is a considerable decreasein joint utility over the last quarter of (successful) negotiations, indicating theclassical negotiator’s dilemma that aiming for high outcomes and thus efficiencyat the same time reduces the chances of reaching an agreement at all. In general,patterns of failed and successful negotiations over time are very similar, the onlysignificant difference according to a non-parametric Wilcoxon test exists in thelast quarter of negotiations with respect to contract imbalance (W = 2091, p <0.1%).
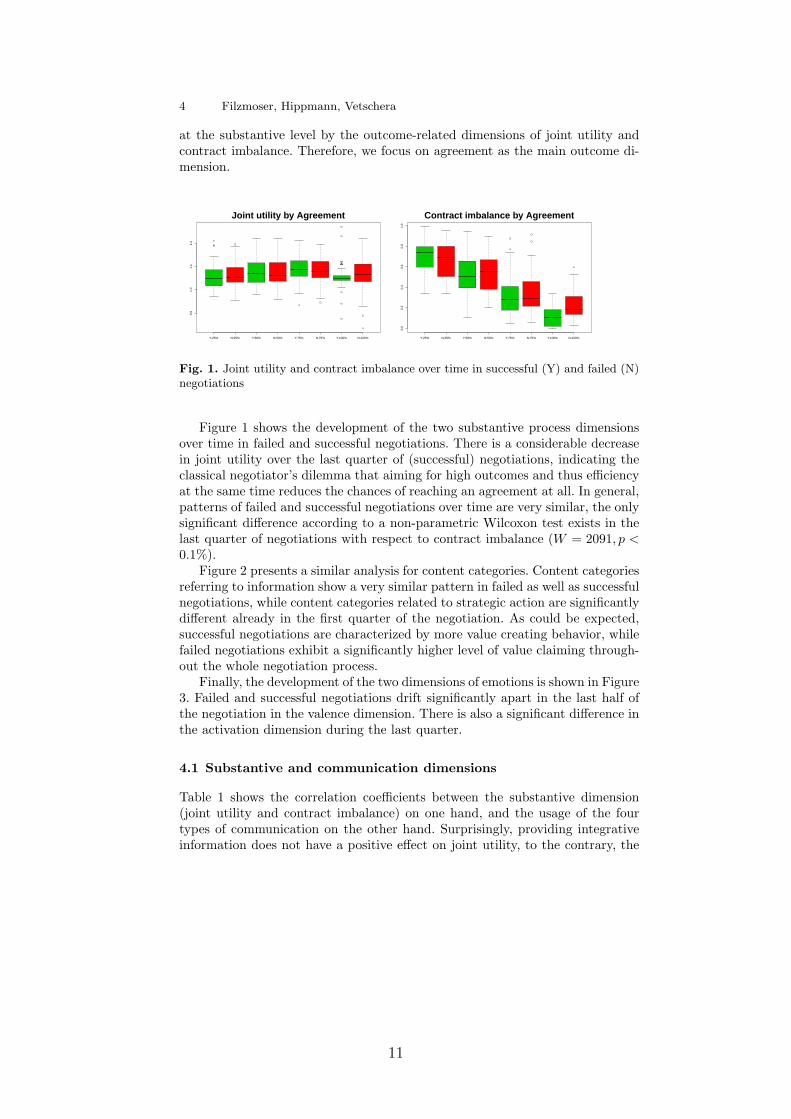
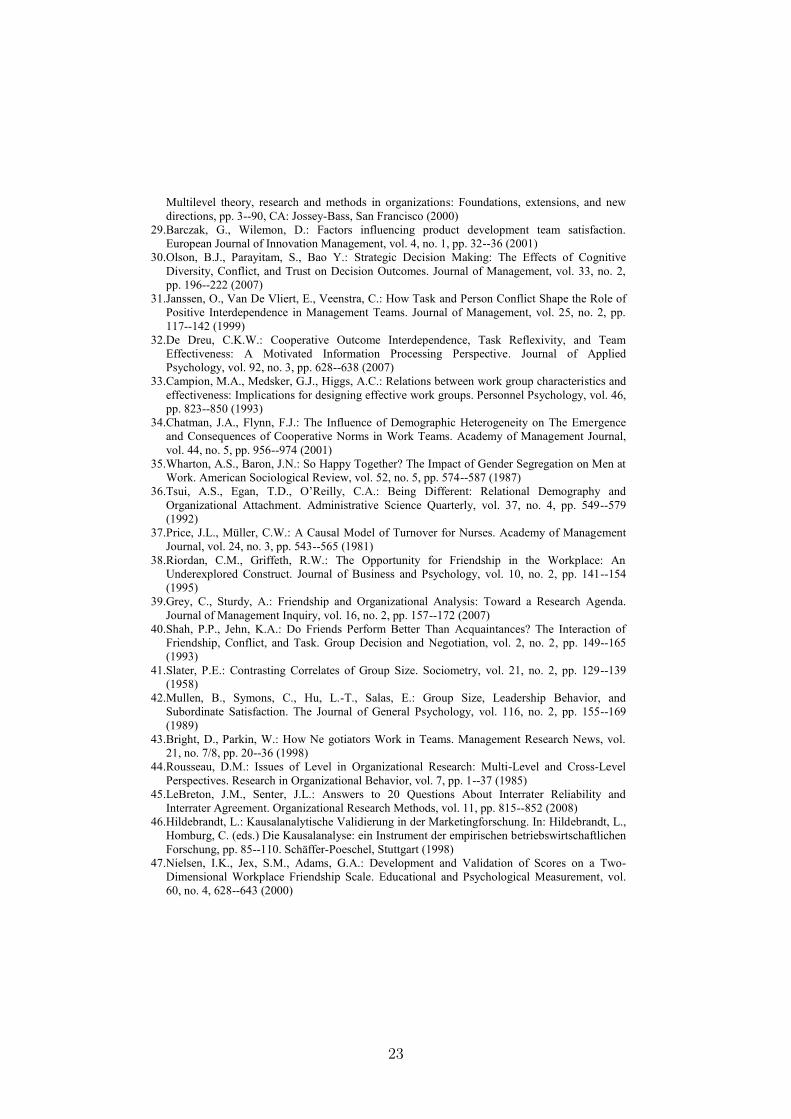
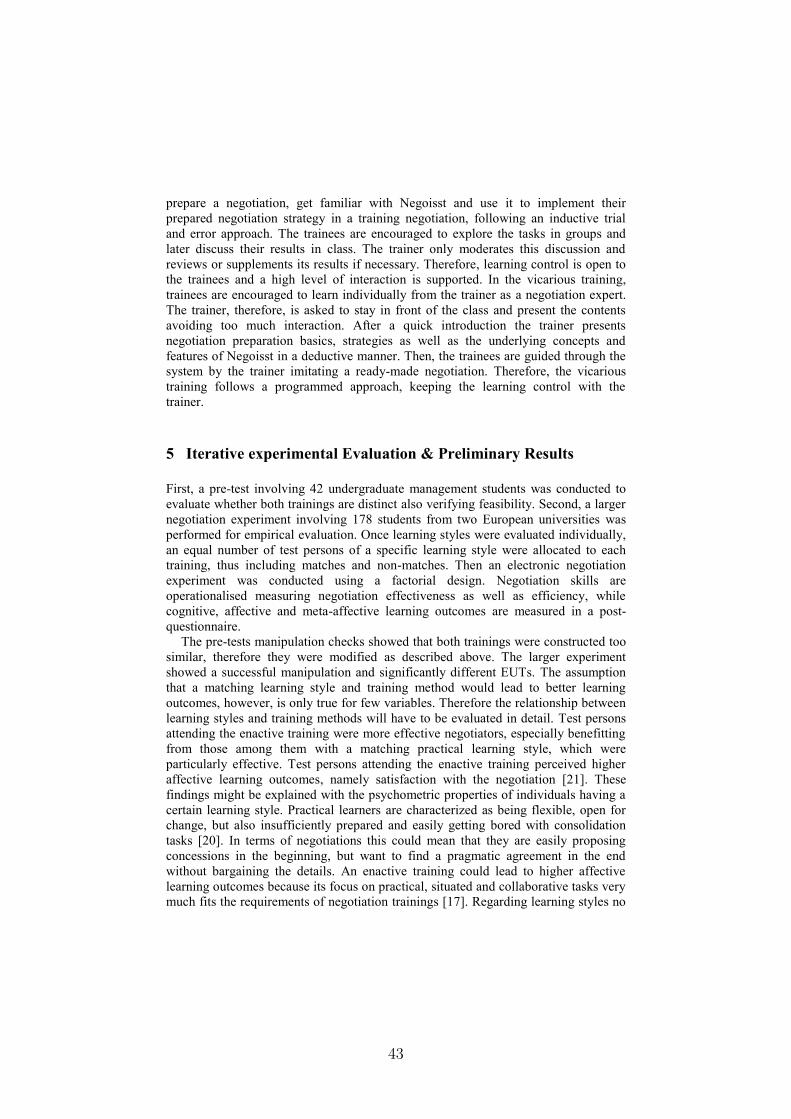
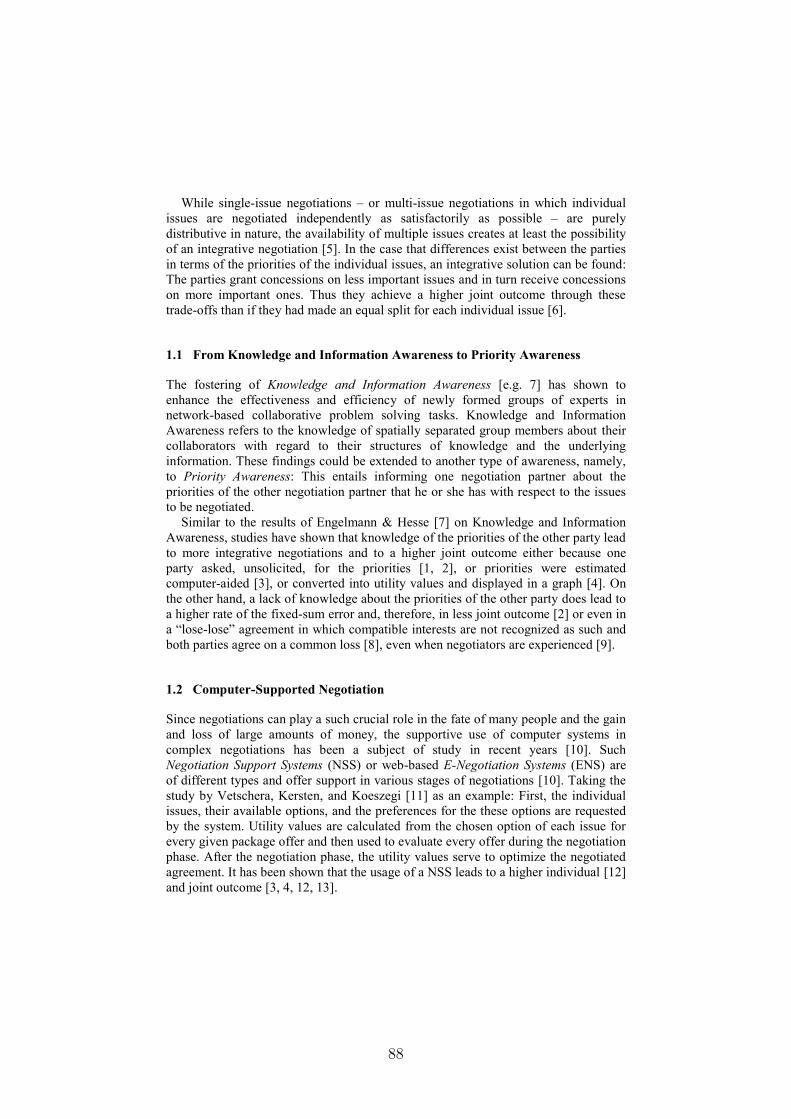
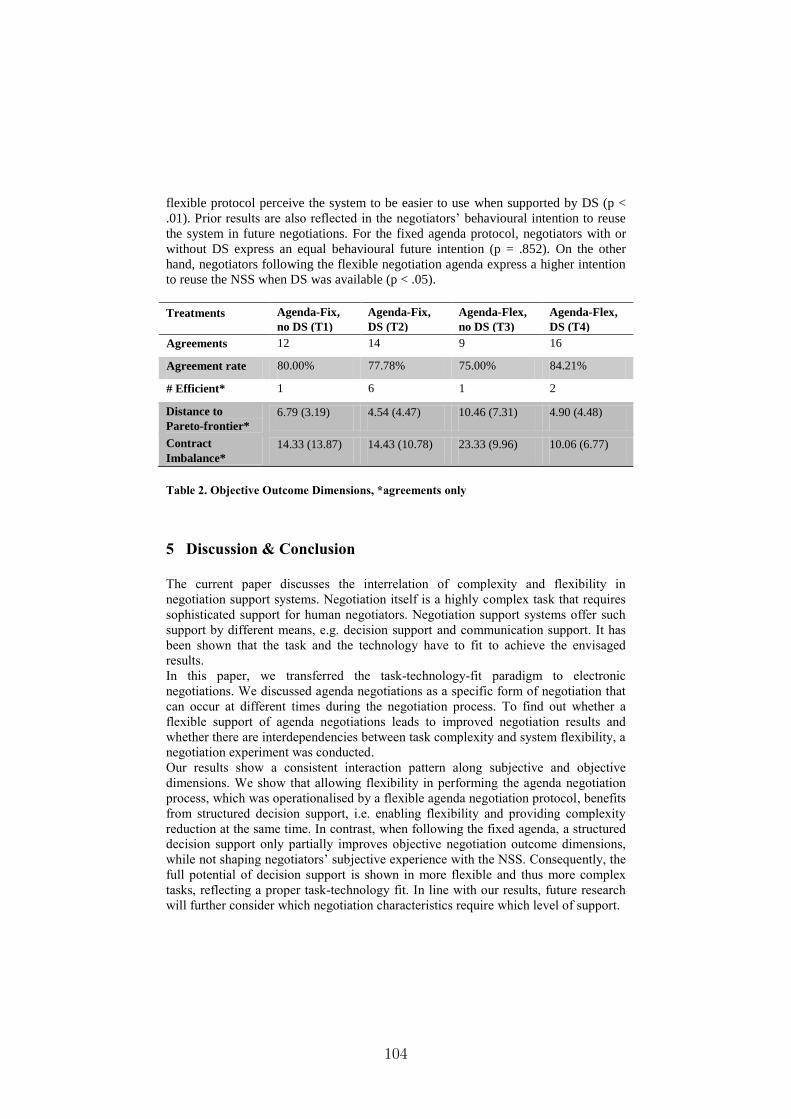
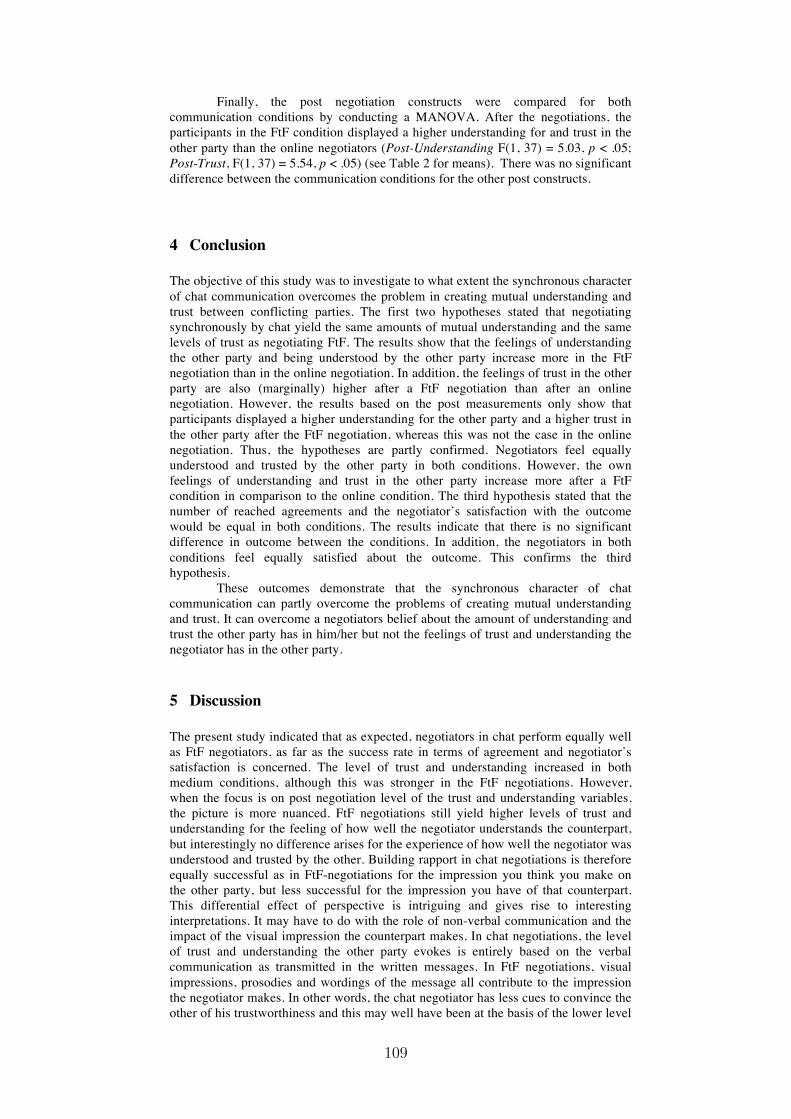
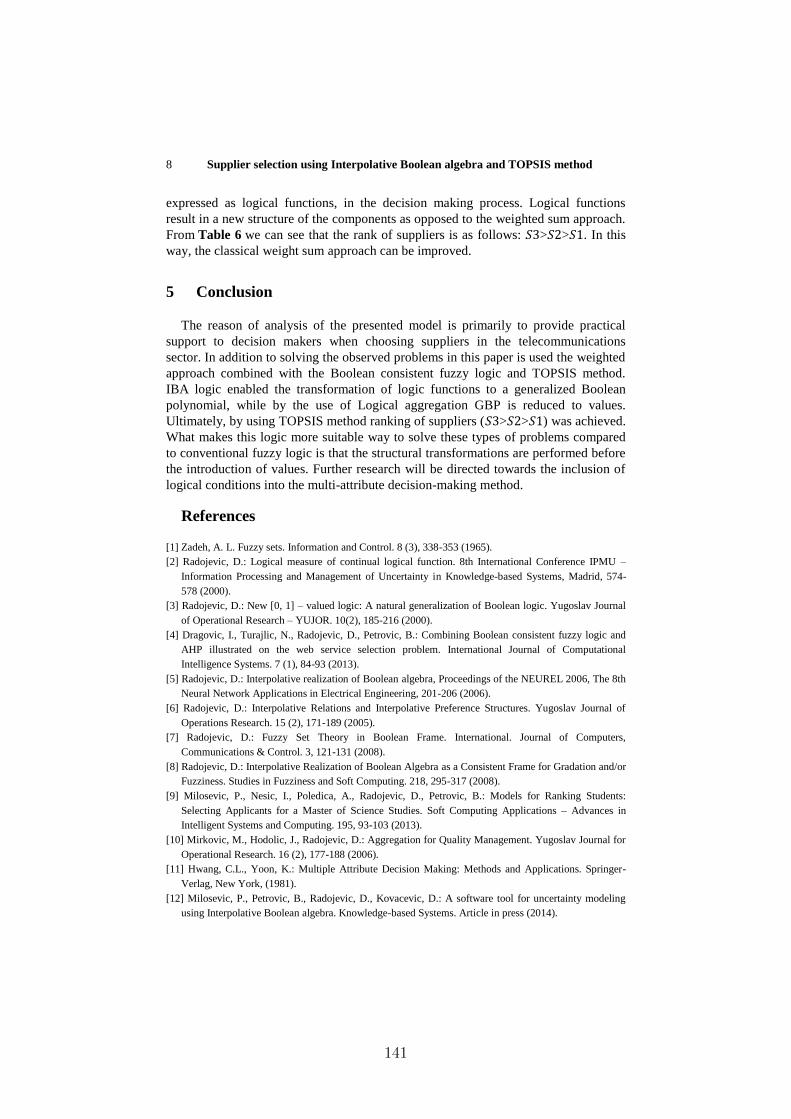
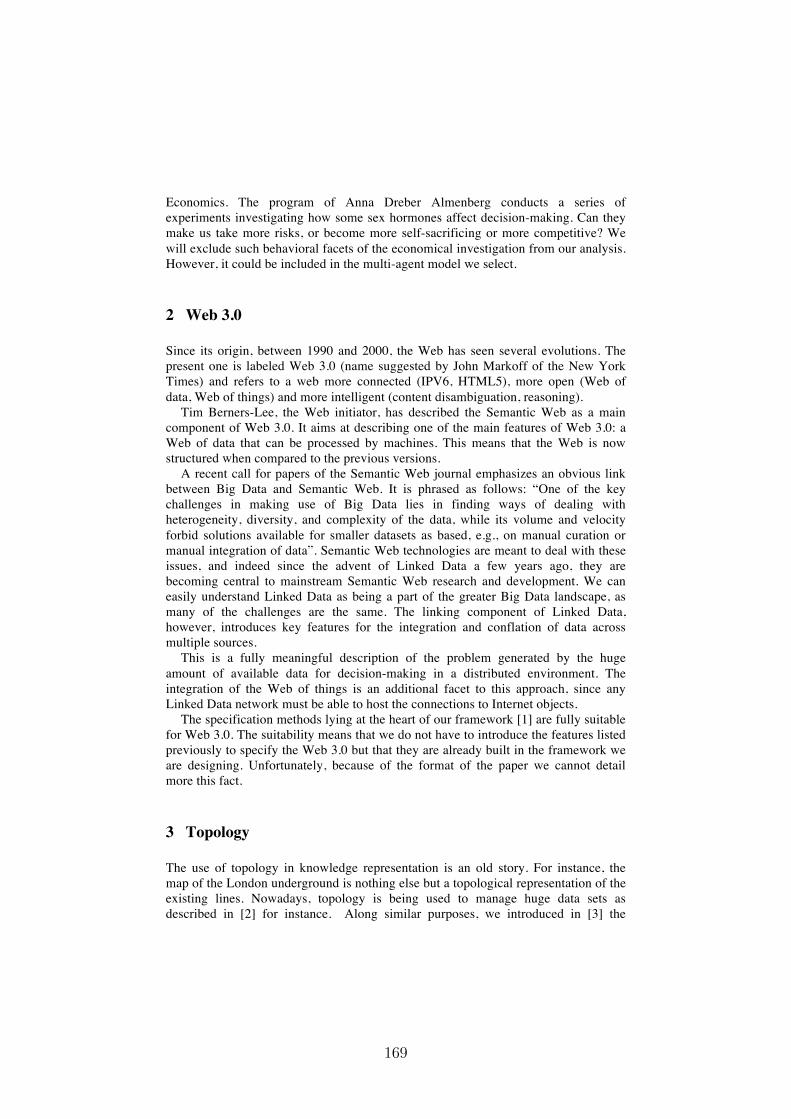
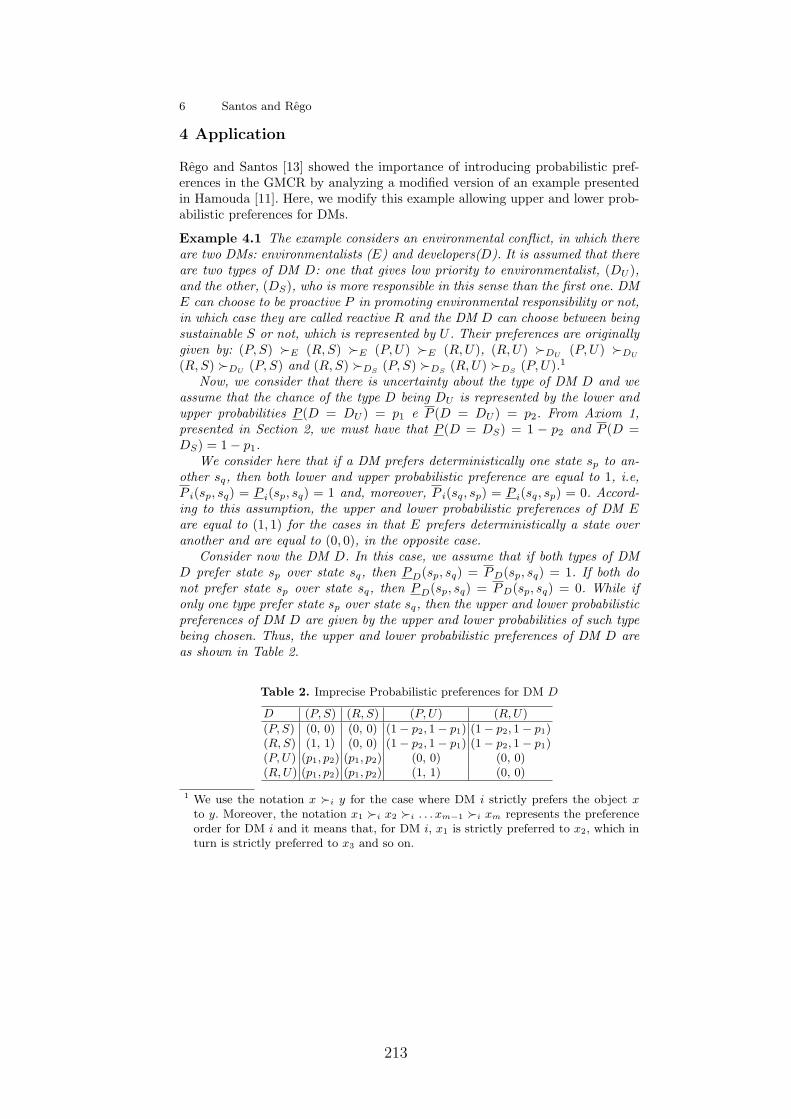
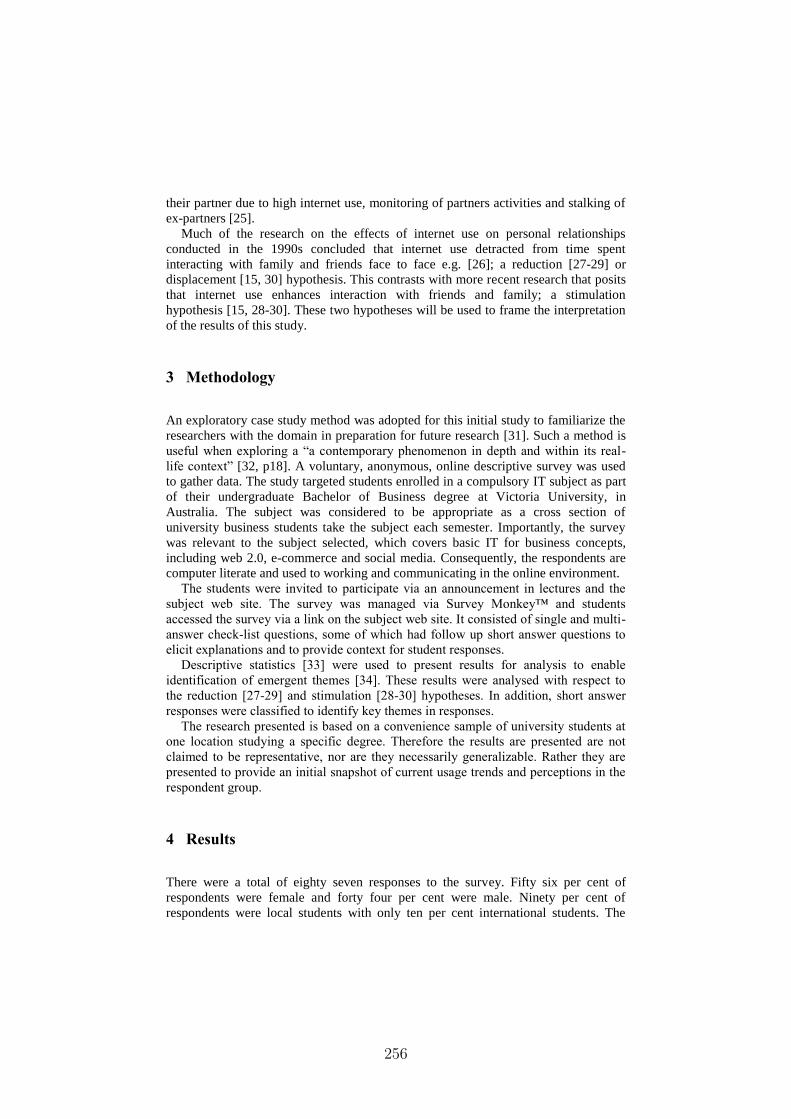
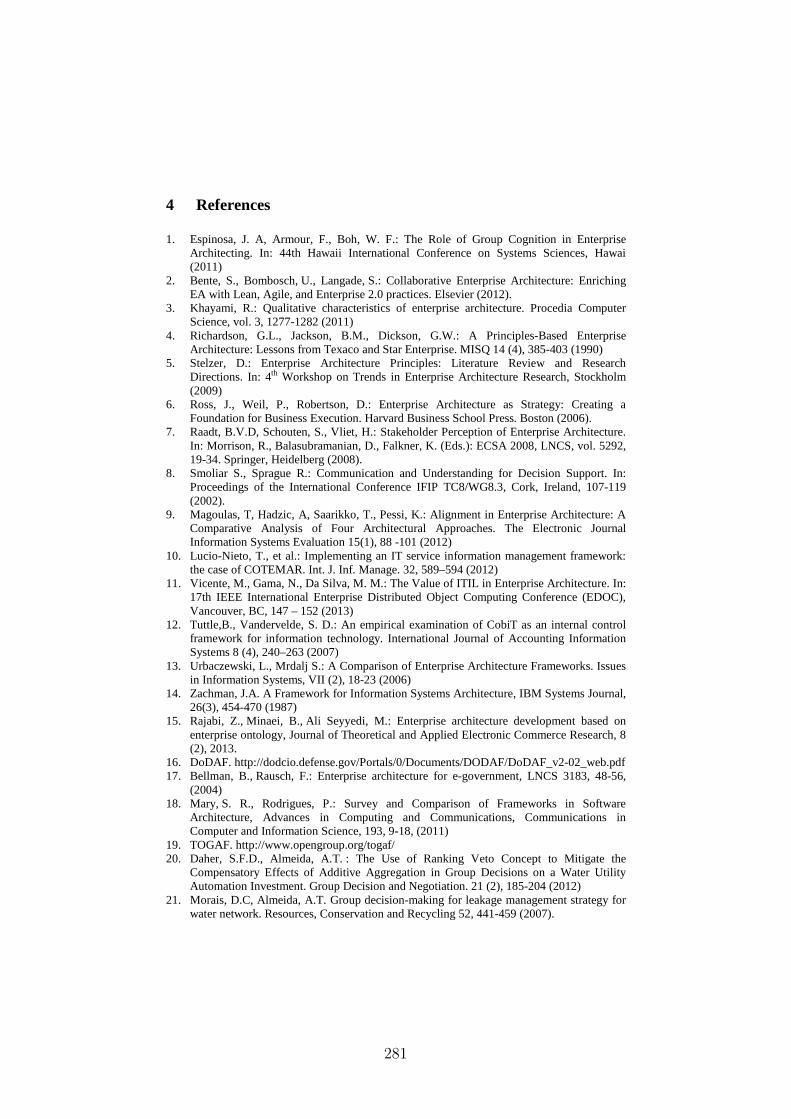
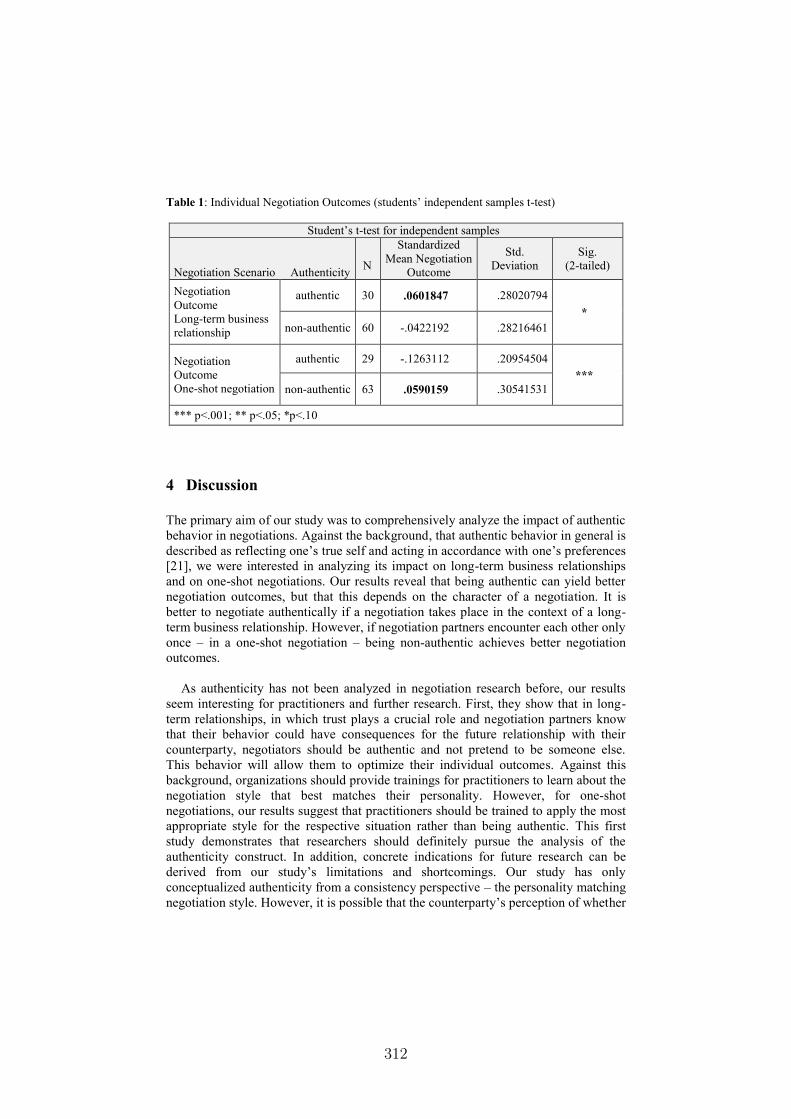
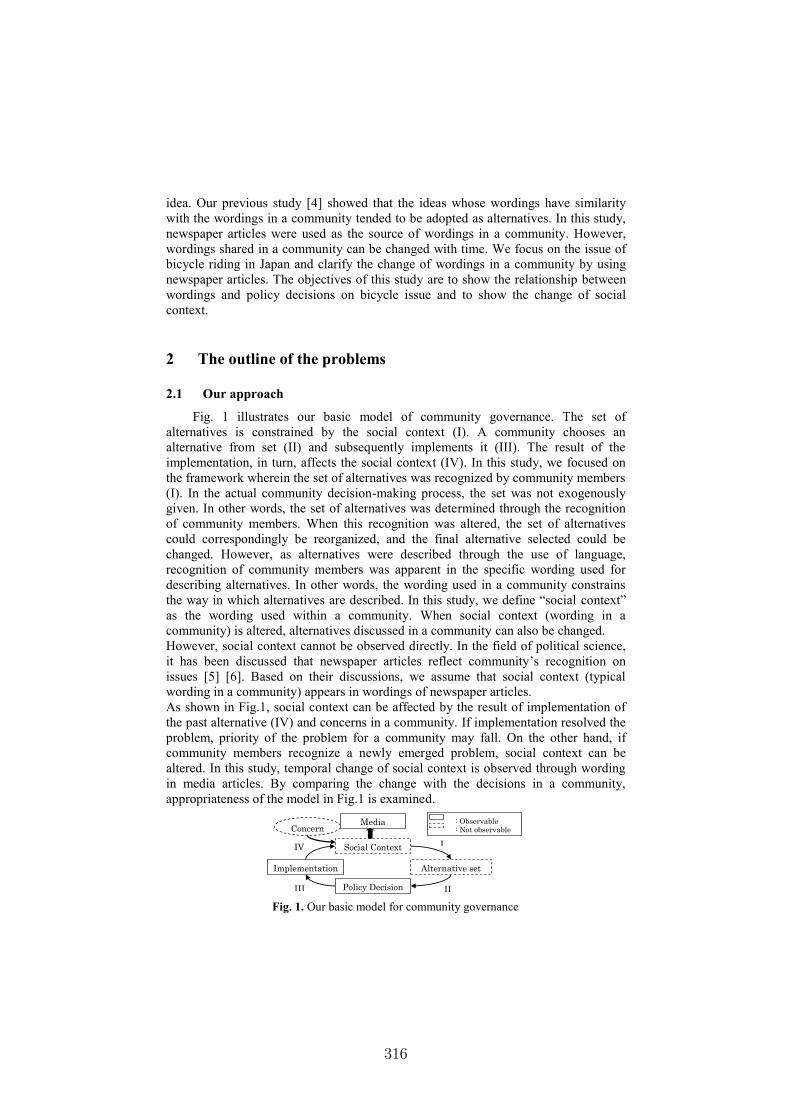
Figure 2 presents a similar analysis for content categories. Content categoriesreferring to information show a very similar pattern in failed as well as successfulnegotiations, while content categories related to strategic action are significantlydifferent already in the first quarter of the negotiation. As could be expected,successful negotiations are characterized by more value creating behavior, whilefailed negotiations exhibit a significantly higher level of value claiming through-out the whole negotiation process.
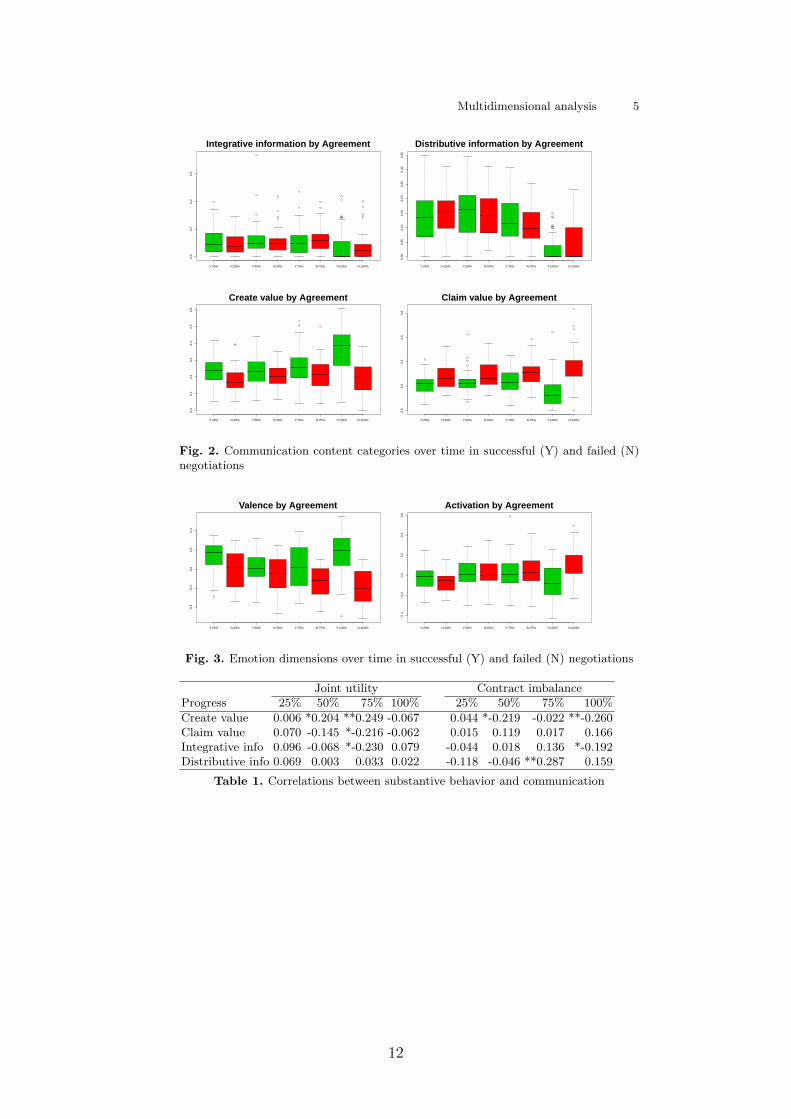
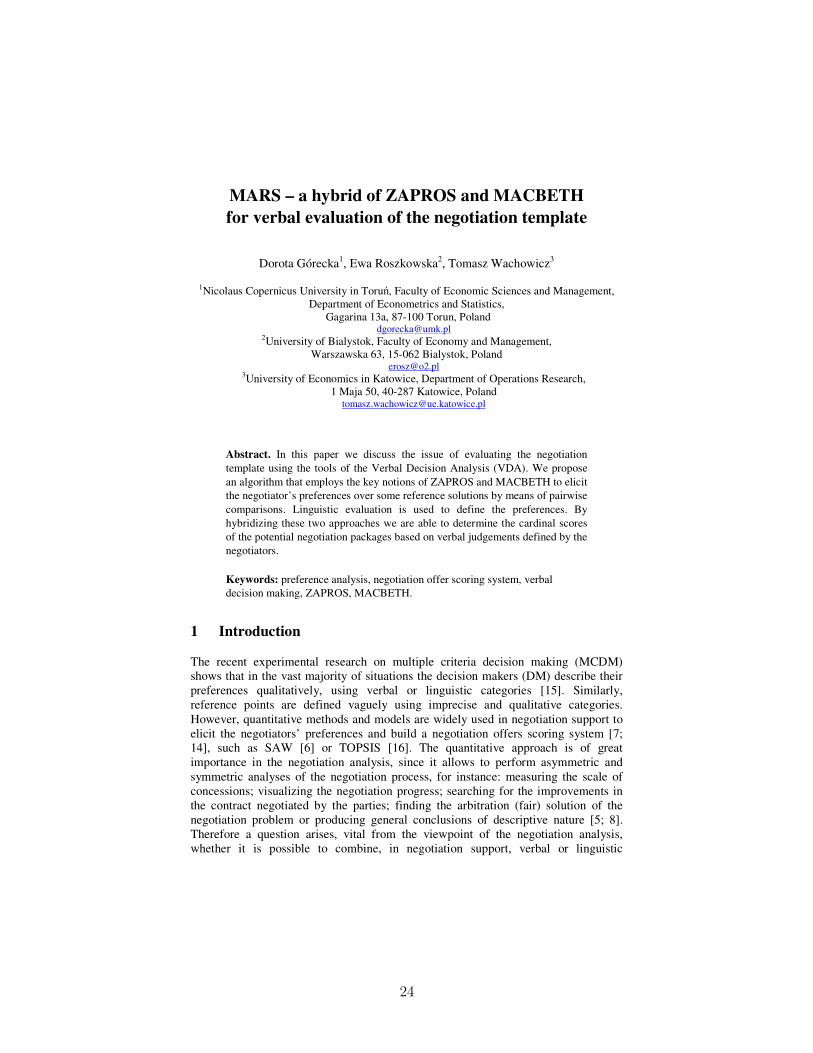
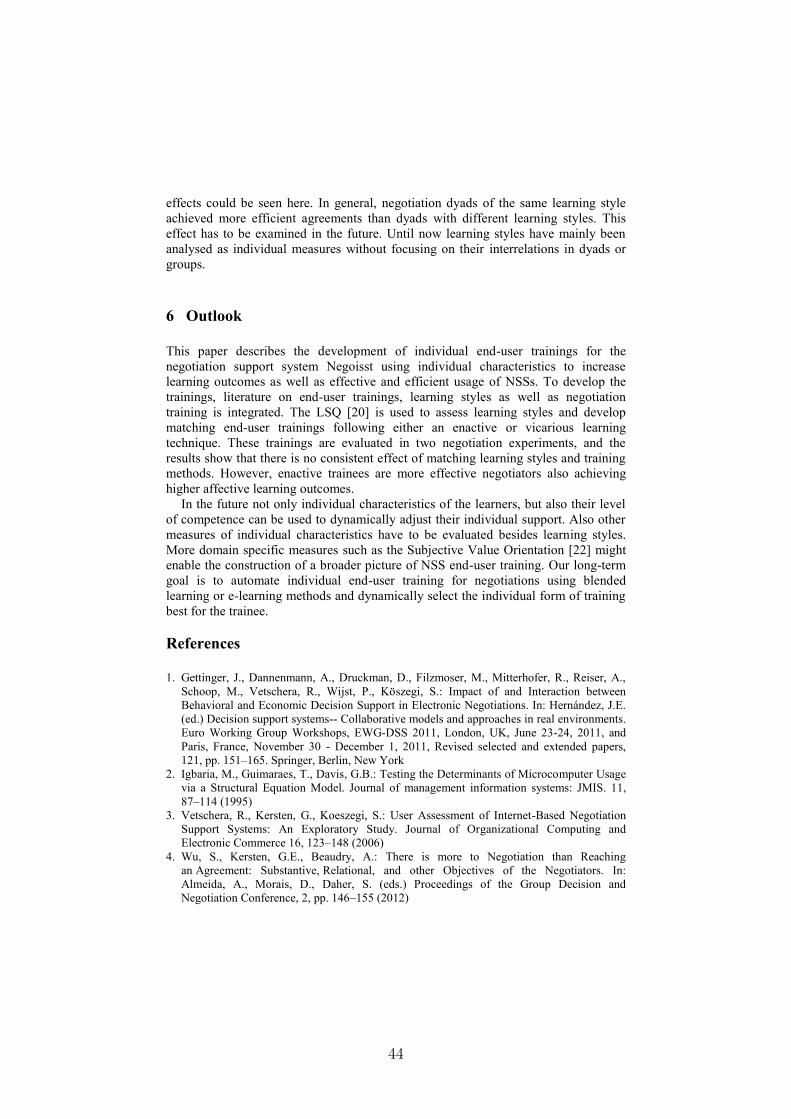
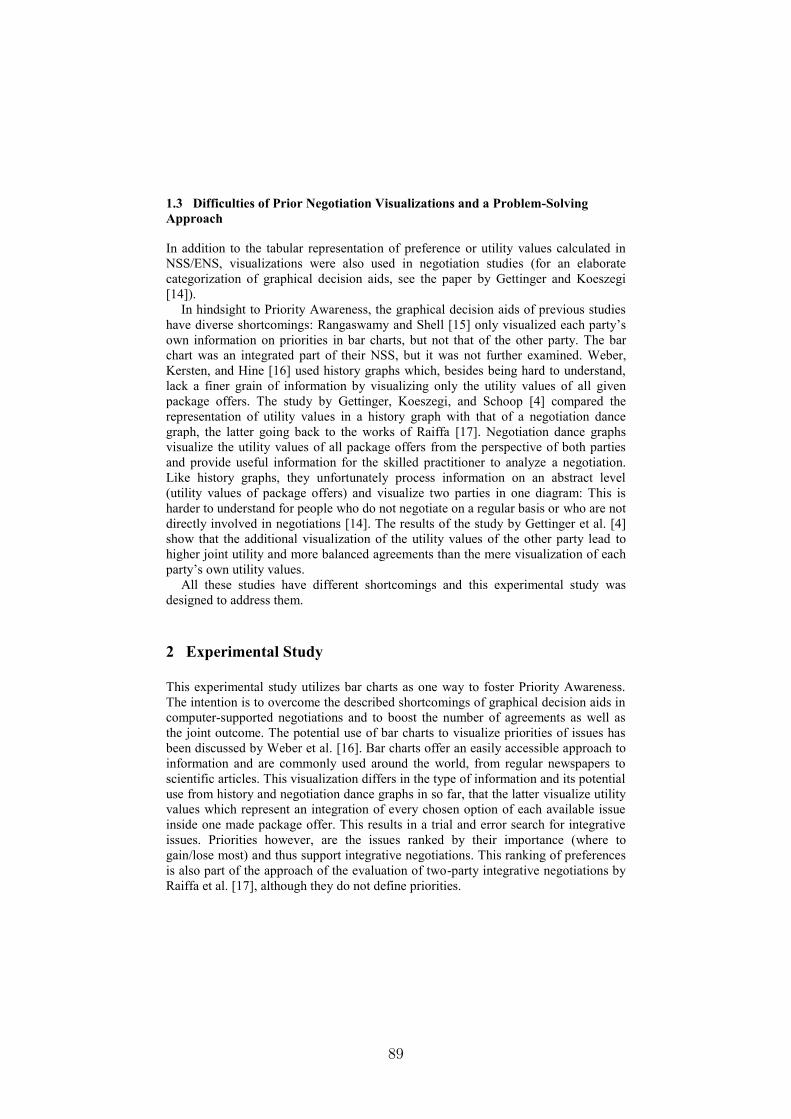
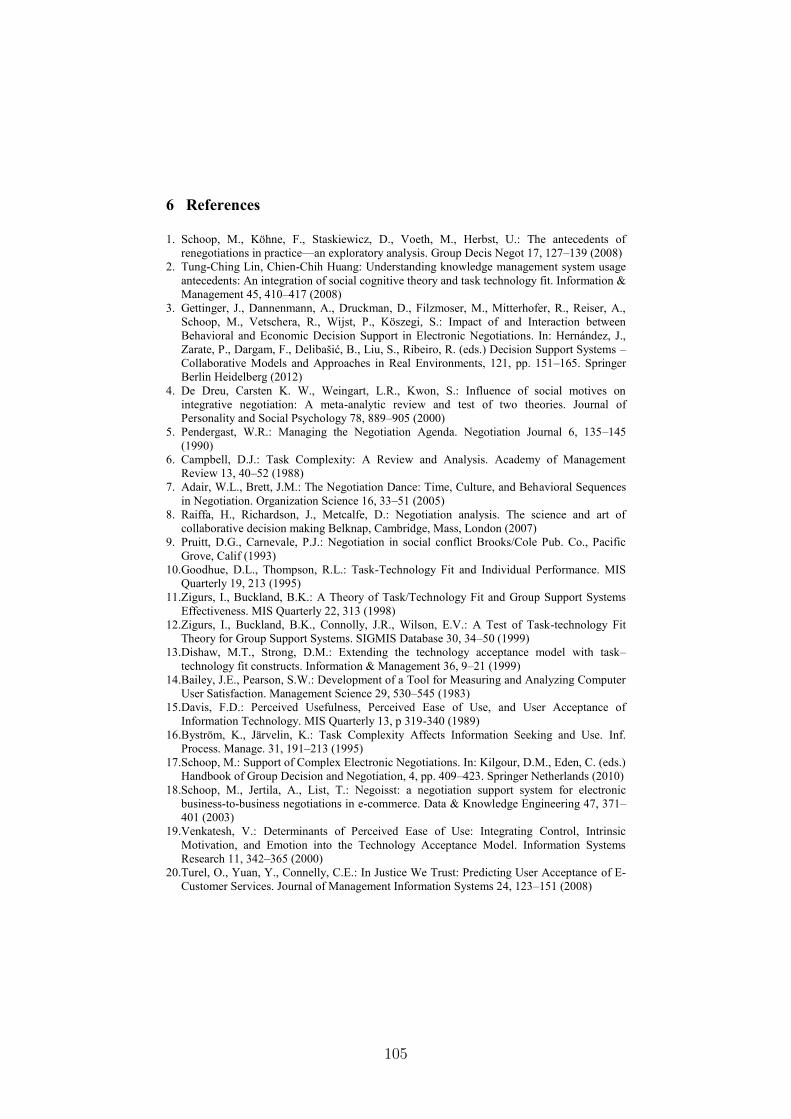
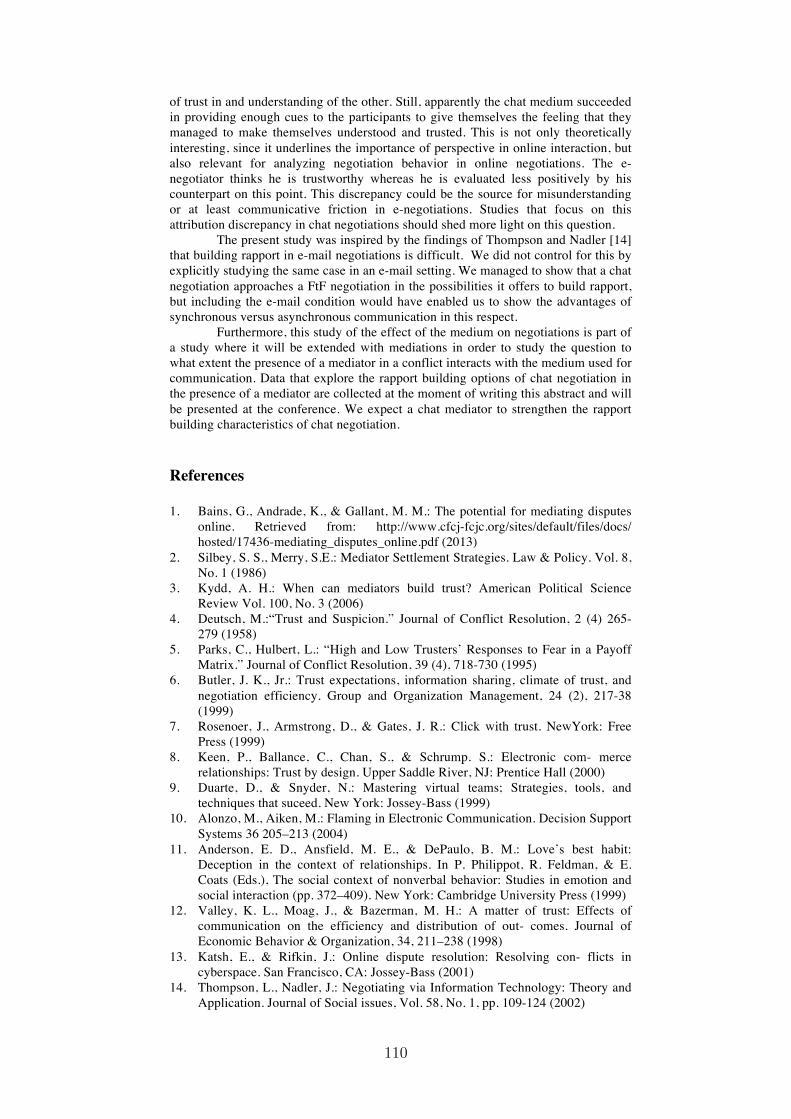
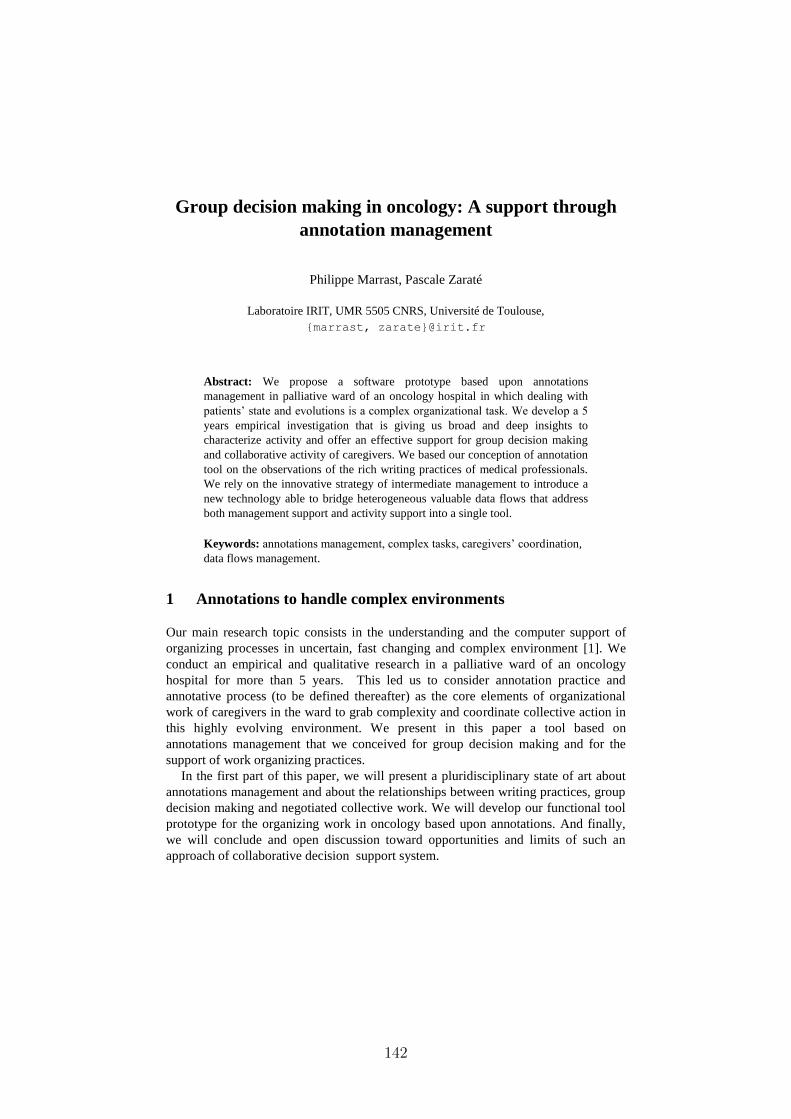
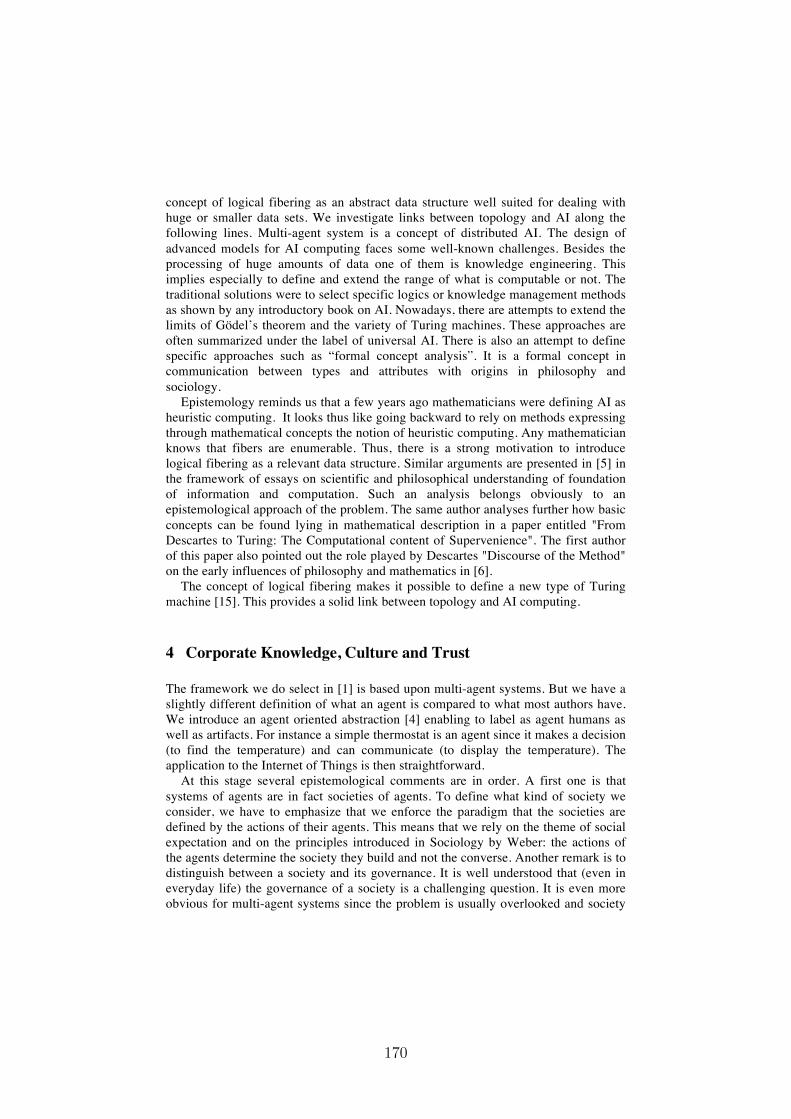
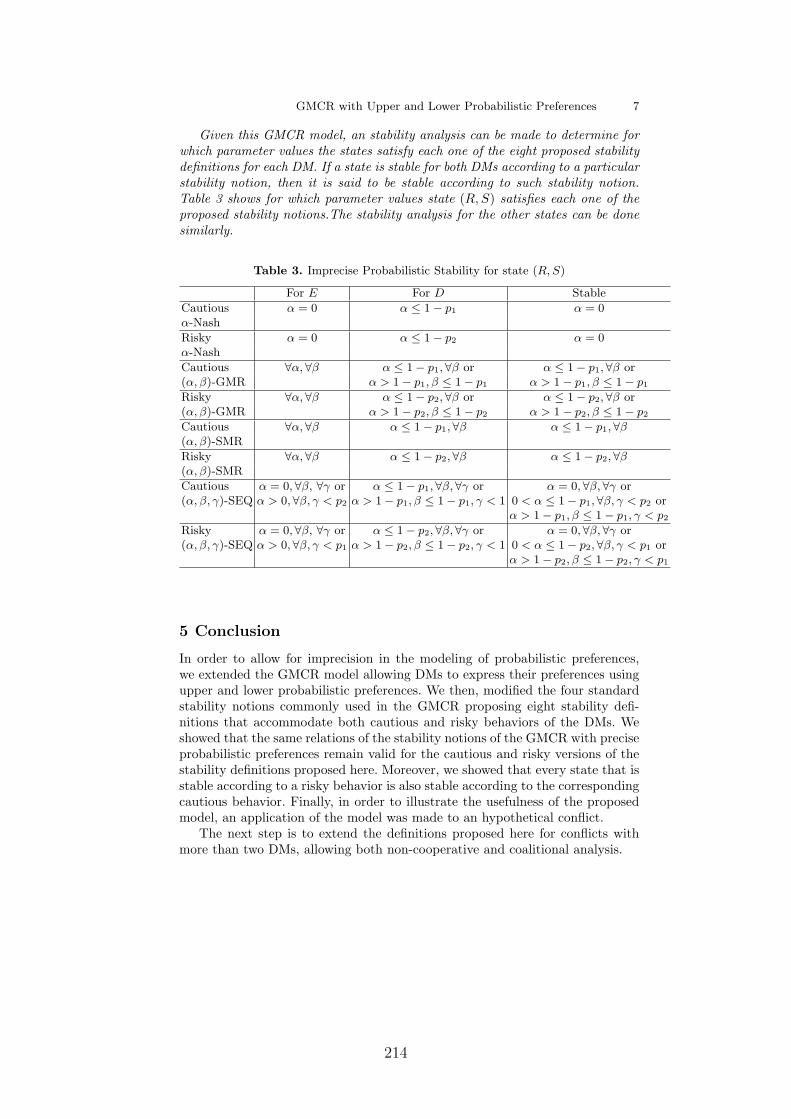
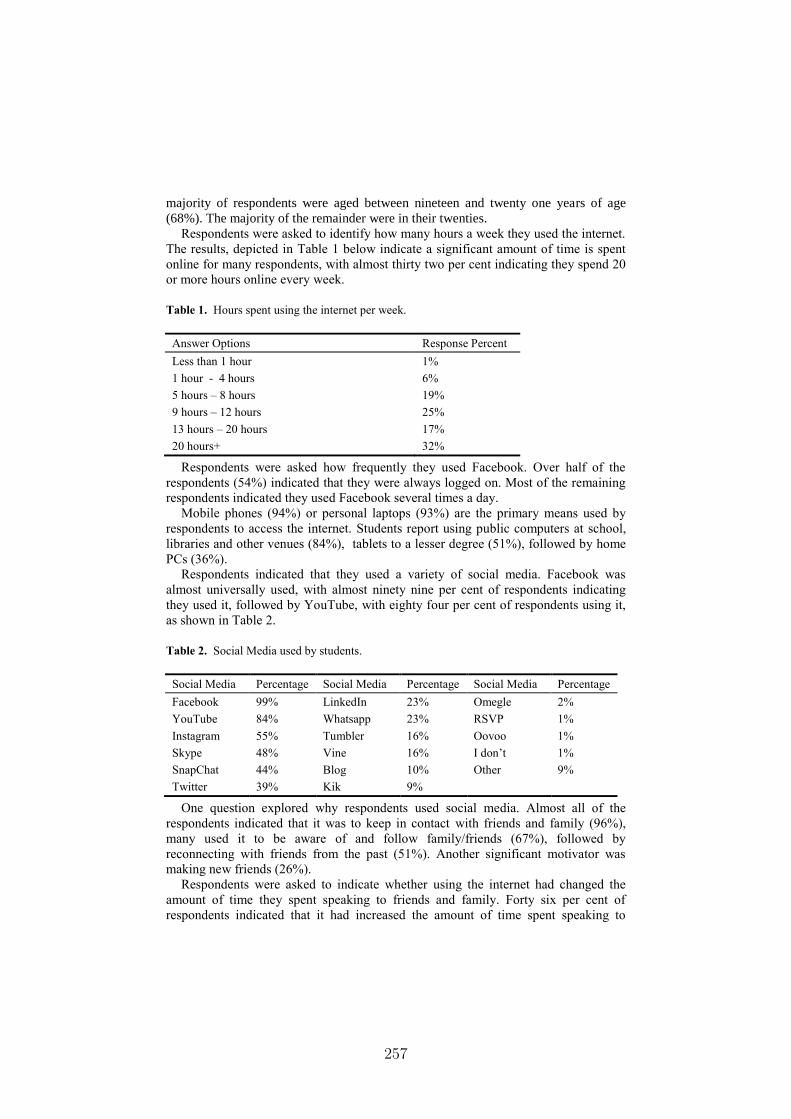
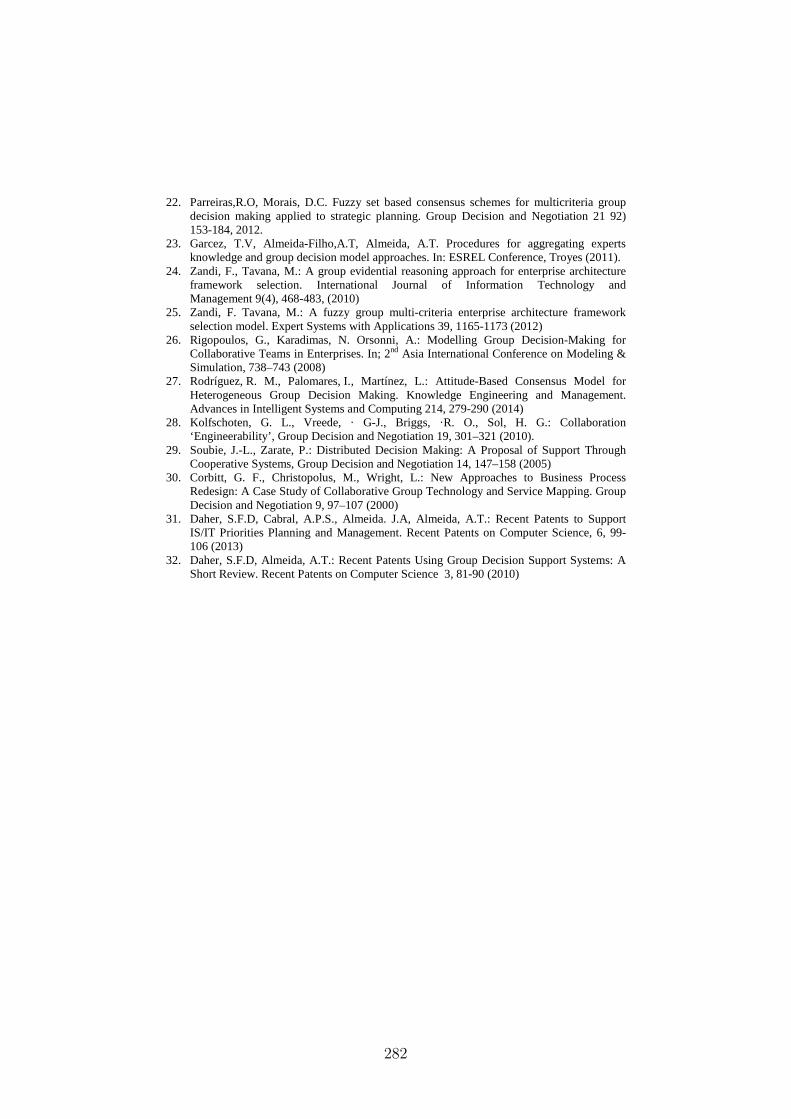
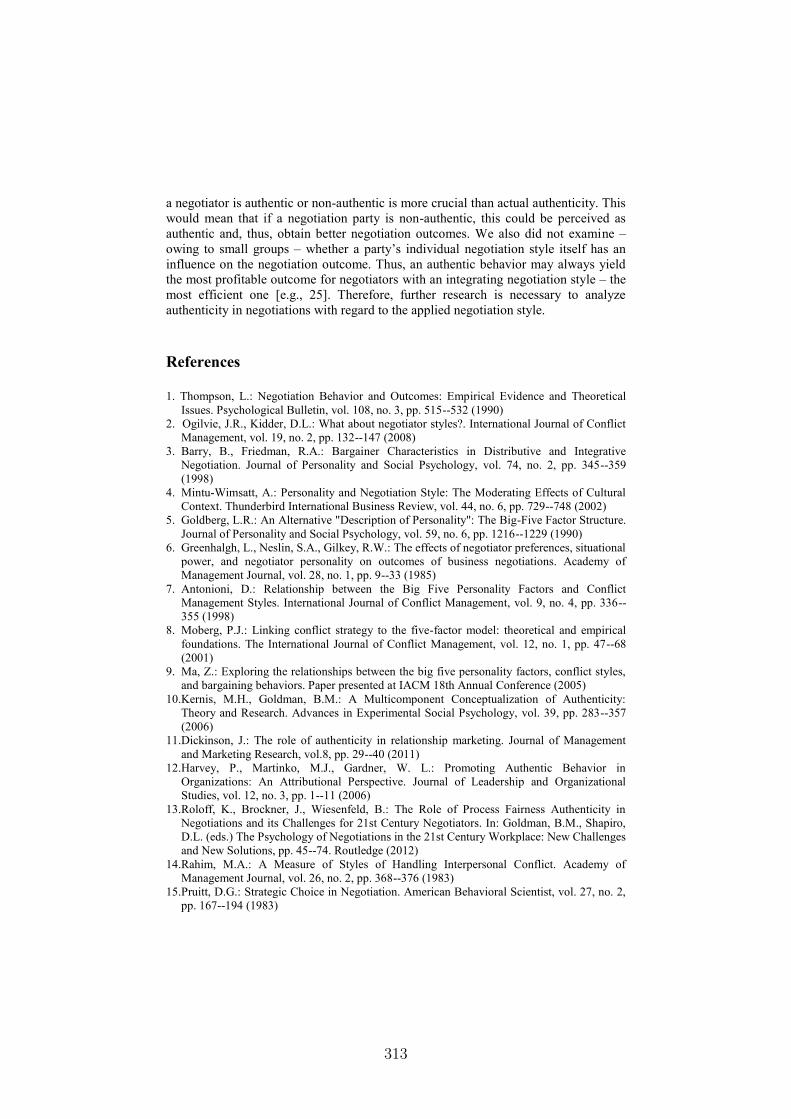
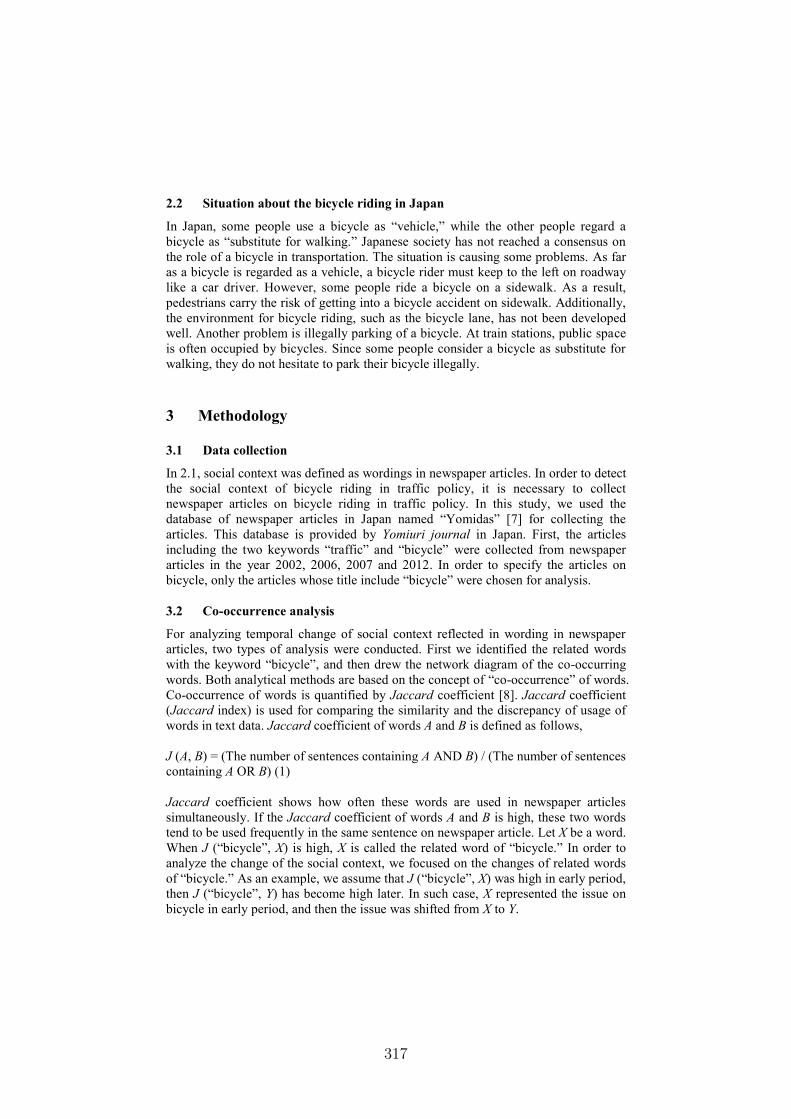
Finally, the development of the two dimensions of emotions is shown in Figure3. Failed and successful negotiations drift significantly apart in the last half ofthe negotiation in the valence dimension. There is also a significant difference inthe activation dimension during the last quarter.
4.1 Substantive and communication dimensions
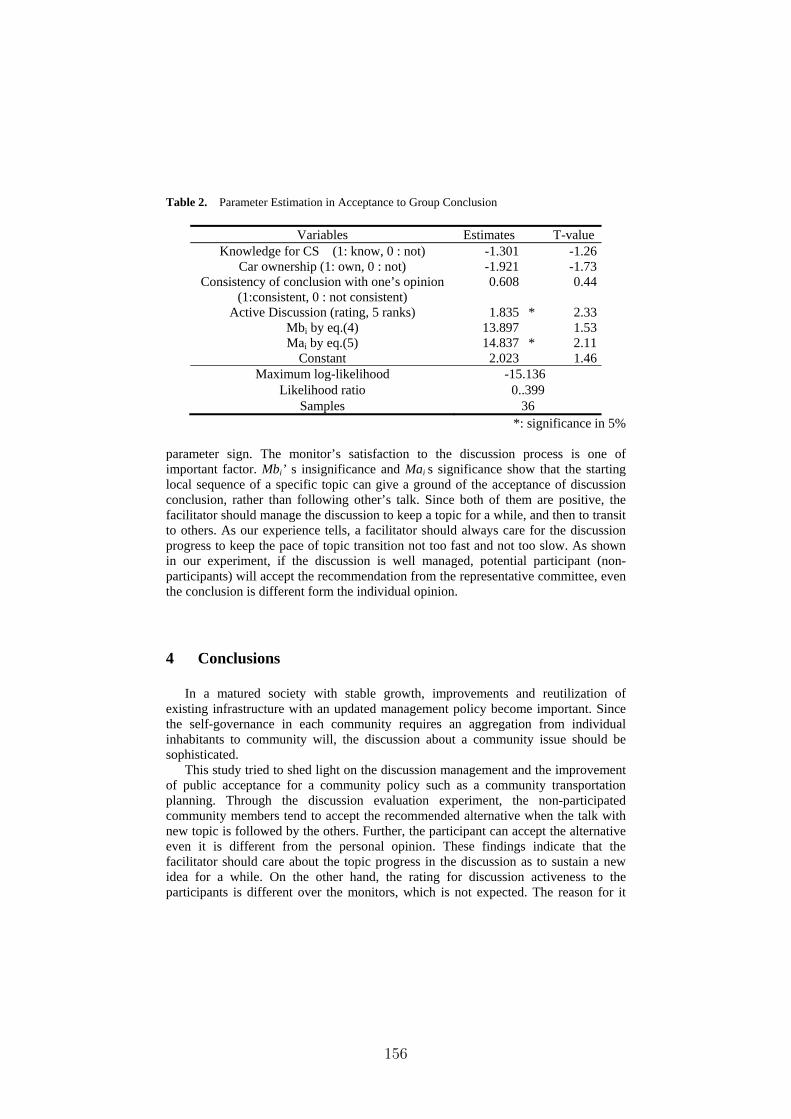
Table 1 shows the correlation coefficients between the substantive dimension(joint utility and contract imbalance) on one hand, and the usage of the fourtypes of communication on the other hand. Surprisingly, providing integrativeinformation does not have a positive effect on joint utility, to the contrary, the
Kamineta
Rectangle
12
Multidimensional analysis 5
Y:25% N:25% Y:50% N:50% Y:75% N:75% Y:100% N:100%
0.0
0.1
0.2
0.3
Integrative information by Agreement
Y:25% N:25% Y:50% N:50% Y:75% N:75% Y:100% N:100%
0.00
0.05
0.10
0.15
0.20
0.25
0.30
0.35
Distributive information by Agreement
Y:25% N:25% Y:50% N:50% Y:75% N:75% Y:100% N:100%
0.0
0.1
0.2
0.3
0.4
0.5
0.6
Create value by Agreement
Y:25% N:25% Y:50% N:50% Y:75% N:75% Y:100% N:100%
0.0
0.2
0.4
0.6
0.8
Claim value by Agreement
Fig. 2. Communication content categories over time in successful (Y) and failed (N)negotiations
Y:25% N:25% Y:50% N:50% Y:75% N:75% Y:100% N:100%
−0.
4−
0.2
0.0
0.2
0.4
Valence by Agreement
Y:25% N:25% Y:50% N:50% Y:75% N:75% Y:100% N:100%
−0.
4−
0.2
0.0
0.2
0.4
0.6
Activation by Agreement
Fig. 3. Emotion dimensions over time in successful (Y) and failed (N) negotiations
Create value 0.006 *0.204 **0.249 -0.067 0.044 *-0.219 -0.022 **-0.260Claim value 0.070 -0.145 *-0.216 -0.062 0.015 0.119 0.017 0.166Integrative info 0.096 -0.068 *-0.230 0.079 -0.044 0.018 0.136 *-0.192Distributive info 0.069 0.003 0.033 0.022 -0.118 -0.046 **0.287 0.159
Table 1. Correlations between substantive behavior and communication
Kamineta
Rectangle
13
6 Filzmoser, Hippmann, Vetschera
only significant correlation is a negative one (in the third quarter of the negotia-tions). As could be expected, there is a positive relationship between distributiveinformation and contract imbalance at least in some parts of the negotiations,and a negative relationship with integrative information.
However, joint utility is an accumulated value resulting from all concessionsand offers made during the negotiation up to the point at which joint utilityis measured. If one instead considers actual value creation within each quar-ter of the negotiation (i.e. joint utility at the end compared to joint utility atthe beginning of each quarter), there is no significant correlation between anycommunication category and actual value creation.
Create value ***0,567 **0,427 ***0,672 ***0,695 0,203 -0,132 -0,180 0,068Claim value ***-0,442 ***-0,620 ***-0,553 ***-0,463 -0,044 0,226 *0,338 *0,330Integrative info -0,187 0,045 -0,154 0,002 0,121 -0,094 *0,301 0,250Distributive info *-0,288 0,065 -0,098 -0,253 0,074 0,169 0,110 0,095
Table 2. Correlations between communication and emotions
Table 2 shows the correlations between the usage of different communica-tion categories and the two emotional dimensions. There is a strong correlationbetween action-oriented communication and the valence dimension of emotionsin the expected direction: Value creating communication is strongly related topositive emotions, value claiming behavior to negative emotions.
These correlations do not imply a causal relationship. In fact, causal rela-tionships could work in both directions: Receiving communication which claimsvalue could lead to negative emotions, and negotiators expressing negative emo-tions could be more likely to use value claiming strategies. To disentangle theseeffects, we analyzed the two parties separately and calculated the correlationsbetween the emotions of one party, and the communication behavior of the sameparty as well as the opponent.
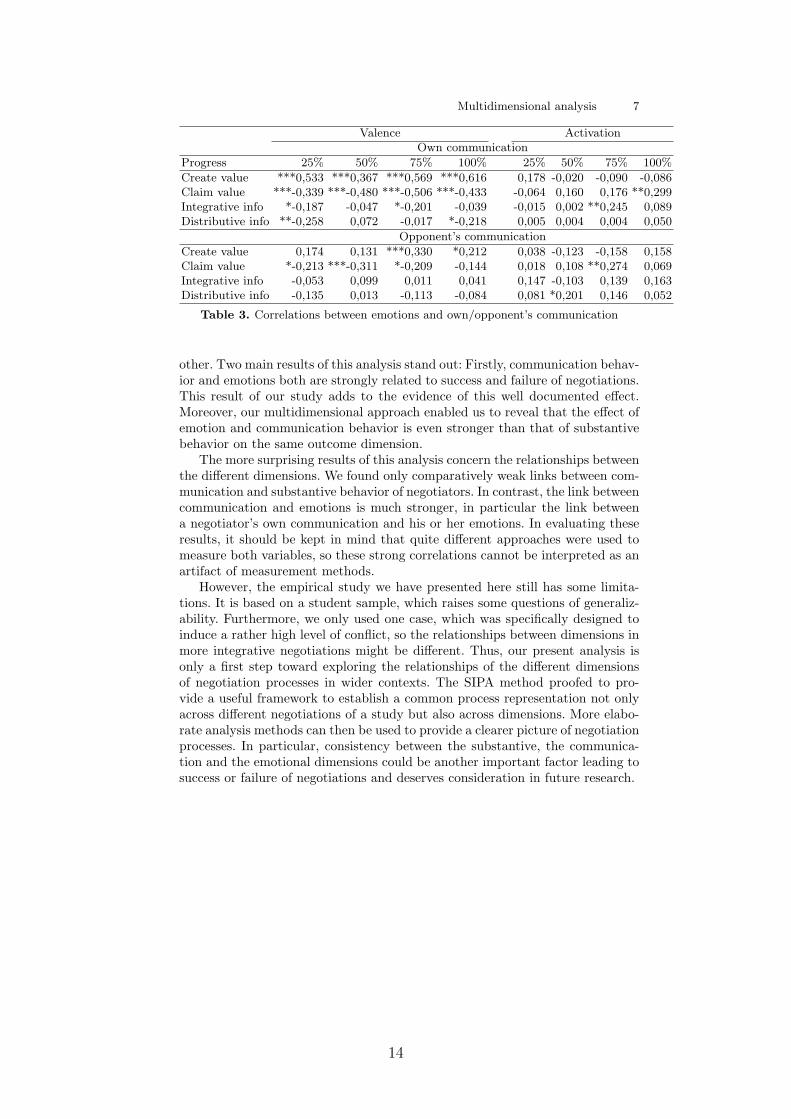
The results of this analysis are shown in Table 3. While there are significanteffects for both parties, the correlation between emotions and communicationbehavior is stronger within the same party than with the opponent’s communi-cation behavior. This makes an influence of emotions on communication behaviormore plausible than vice versa.
5 Conclusions, limitations, and outlook
In the present paper, we have provided a first glimpse at the relationships of dif-ferent dimensions of negotiation processes to negotiation outcomes and to each
Kamineta
Rectangle
14
Multidimensional analysis 7
Valence ActivationOwn communication
Progress 25% 50% 75% 100% 25% 50% 75% 100%
Create value ***0,533 ***0,367 ***0,569 ***0,616 0,178 -0,020 -0,090 -0,086Claim value ***-0,339 ***-0,480 ***-0,506 ***-0,433 -0,064 0,160 0,176 **0,299Integrative info *-0,187 -0,047 *-0,201 -0,039 -0,015 0,002 **0,245 0,089Distributive info **-0,258 0,072 -0,017 *-0,218 0,005 0,004 0,004 0,050
Opponent’s communication
Create value 0,174 0,131 ***0,330 *0,212 0,038 -0,123 -0,158 0,158Claim value *-0,213 ***-0,311 *-0,209 -0,144 0,018 0,108 **0,274 0,069Integrative info -0,053 0,099 0,011 0,041 0,147 -0,103 0,139 0,163Distributive info -0,135 0,013 -0,113 -0,084 0,081 *0,201 0,146 0,052
Table 3. Correlations between emotions and own/opponent’s communication
other. Two main results of this analysis stand out: Firstly, communication behav-ior and emotions both are strongly related to success and failure of negotiations.This result of our study adds to the evidence of this well documented effect.Moreover, our multidimensional approach enabled us to reveal that the effect ofemotion and communication behavior is even stronger than that of substantivebehavior on the same outcome dimension.
The more surprising results of this analysis concern the relationships betweenthe different dimensions. We found only comparatively weak links between com-munication and substantive behavior of negotiators. In contrast, the link betweencommunication and emotions is much stronger, in particular the link betweena negotiator’s own communication and his or her emotions. In evaluating theseresults, it should be kept in mind that quite different approaches were used tomeasure both variables, so these strong correlations cannot be interpreted as anartifact of measurement methods.
However, the empirical study we have presented here still has some limita-tions. It is based on a student sample, which raises some questions of generaliz-ability. Furthermore, we only used one case, which was specifically designed toinduce a rather high level of conflict, so the relationships between dimensions inmore integrative negotiations might be different. Thus, our present analysis isonly a first step toward exploring the relationships of the different dimensionsof negotiation processes in wider contexts. The SIPA method proofed to pro-vide a useful framework to establish a common process representation not onlyacross different negotiations of a study but also across dimensions. More elabo-rate analysis methods can then be used to provide a clearer picture of negotiationprocesses. In particular, consistency between the substantive, the communica-tion and the emotional dimensions could be another important factor leading tosuccess or failure of negotiations and deserves consideration in future research.
Kamineta
Rectangle
15
8 Filzmoser, Hippmann, Vetschera
References
1. W. L. Adair and J. M. Brett. The negotiation dance: Time, culture, and behavioralsequences in negotiation. Organization Science, 16(1):33–51, 2005.
2. J. Broekens, C. M. Jonker, and J. Ch. Meyer. Affective negotiation support sys-tems. Journal of Ambient Intelligence and Smart Environments, 2(2):121–144,2010.
3. D. Druckman, R. Mitterhofer, M. Filzmoser, and S. T. Koeszegi. Resolving im-passes in e-negotiation: Does e-mediation work? Group Decision and Negotiation,23(2):193–210, 2014.
4. M. Griessmair and S. T. Koeszegi. Exploring the cognitive-emotional fugue inelectronic negotiations. Group Decision and Negotiation, 18(3):213–234, 2009.
5. M. E. Holmes. Phase structures in negotiation. In L. L. Putnam and M. E. Roloff,editors, Communication and negotiation, pages 83–105. Sage, Newbury Park, 1992.
6. G. E. Kersten and S. J. Noronha. WWW-based negotiation support: Design,implementation, and use. Decision Support Systems, 25(2):135–154, 1999.
7. S. T. Koeszegi and R. Vetschera. Analysis of negotiation processes. In D. M.Kilgour and C. Eden, editors, Handbook of Group Decision and Negotiation, pages121–137. Springer, Dordrecht, 2010.
8. M. Olekalns, J. M. Brett, and L. R. Weingart. Phases, transitions and interruptions:Modeling processes in multi-party negotiations. International Journal of ConflictManagement, 14(3/4):191–211, 2003.
9. M. Olekalns and P. L. Smith. Social motives in negotiation: The relationship be-tween dyad composition, negotiation processes and outcomes. International Jour-nal of Conflict Management, 14(3/4):233–254, 2003.
10. H. Raiffa. The Art and Science of Negotiation. Belknap, Cambridge, Mass, 1982.11. J. A. Russell and L. F. Barrett. Core affect, prototypical emotional episodes, and
other things called emotion: Dissecting the elephant. Journal of Personality andSocial Psychology, 76(5):805–819, 1999.
12. M. Schoop, A. Jertila, and T. List. Negoisst: A negotiation support system forelectronic business-to-business negotiations in e-commerce. Data and KnowledgeEngineering, 47(3):371–401, 2003.
13. M. Schoop, M. van Amelsvoort, J. Gettinger, M. Koerner, S. T. Koeszegi, andP. van der Wijst. The interplay of communication and decisions in electronicnegotiations: Communicative decisions or decisive communication? Group Decisionand Negotiation, 23(2):167–192, 2014.
14. J. K. Sebenius. Negotiation analysis: A characterization and review. ManagementScience, 38(1):18–38, 1992.
15. K. J. Srnka and S. T. Koeszegi. From words to numbers – how to transformrich qualitative data into meaningful quantative results: Guidelines and exemplarystudy. Schmalenbach’s Business Review, 59:29–57, 2007.
16. L. Tsogo, M. H. Masson, and A. Bardot. Multidimensional scaling methods formany-object sets: A review. Multivariate Behavioral Research, 35(3):307–319, 2000.
17. R. Vetschera. Negotiation processes: An integrated perspective. EURO Journalon Decision Processes, 1(1-2):135–164, 2013.
18. R. Vetschera and M. Filzmoser. Standardized interpolated path analysis of offerprocesses in e-negotiations. In R. J. Kauffman, editor, International Conferenceon Electronic Commerce ICEC 2012, pages 134–140, Singapore, 2012.
Abstract. Important economic systems, like financial, transportationor electricity, can be represented as interconnected networks. Those net-works often spread across many countries. Each country has its own reg-ulatory institution with different objectives that can make independentdecisions. Hence, each sub-network is being managed on a local scale.However results of those decisions can be observed on an internationalscale due to network’s cascading failure property — a failure of a singlenode leads to an increased probability of failures in adjacent (connected)nodes. Hence, a decision made by one regulatory body can strongly af-fect the other involved parties. In order to ensure an optimal networkoperation the countries can coordinate the their regulatory policies usingsome negotiation protocol.In the paper we formulate a problem of searching for an optimal nego-tiation strategy for a network risk management where decision makersnegotiate a global decision regarding the network maintenance. The prob-lem is tackled through a simulation model that allows to analyze possibleoutcomes of various offers placed by a negotiating parties.
Several systems can be represented as networks including financial, transporta-tion, liquid gas, electricity systems. The above networks have two common fea-tures 1) exhibitcascading failure property [1] i.e. failure of single node can resultin malfunction of adjacent nodes and 2) are transnational i.e. expand acrossseveral countries.
The cascading failure property means that a malfunction of a single nodeleads to an increased probability of failures in adjacent (connected) nodes. Suchsituation can be observed for an example in financial markets when problemsof a single company can result can result in problems for connected companiesand can lead to crises on large scale [2]. Cascade failure has been shown to bean important factor shaping the recent financial crisis [3, 4]. Hence, a need fornetwork optimization approaches arises that will lead to an increase of networkrobustness against failures [5]. However the transnational feature of large scale
33
2 P. Szufel, B. Kaminski and T. Szapiro
networks leads to heterogeneity in malfunction probability and means a dis-tributed decision making process with several decision makers. An internationalnetwork consists of several connected national networks with higher connectivitylevel within a single country than the connectivity on the entire network. Theheterogeneity of malfunction probability means that different countries have dif-ferent budgets and resources to keep a network at an operational state. Hence,the average node malfunction probability can vary substantially among coun-tries. Each country has independent bodies that decide on its network mainte-nance. However, due to networks effects (e.g. cascading failures) decisions madeby one country strongly depend on the malfunction probability in other coun-tries. This can be observed in economic systems - for example the Iceland crisisresulted in run on connected banks in the UK and Netherlands. Moreover, themalfunction probability is heterogeneous throughout the network. Heterogeneityof malfunction probability means that different countries have different budgetsand resources to keep a network at an operational state. Decisions made by onecountry strongly influence cascading failure probability in other countries due tonetworks effects.
In the paper we analyze efficiency of various negotiation strategies of networkmaintenance with a simulation approach [6]. We show how adding a mediatorwho helps parties to reach a global optimum leads to a more efficient outcomethan independent network maintenance optimization. Hence, we compare twoscenarios for a network maintenance: (1) independent bodies optimizing decisionsin particular sub-networks versus (2) a cooperative decision making where partiesagree on the negotiation protocol jointly negotiate a global decision.
The remainder of the paper is aligned as follows. In the section 2 we formulatea mathematical model for negotiation on shared network maintenance. In thesection 3 we present a simulation model and simulation results. We conclude inthe final remarks section.
2 Negotiating network maintenance in cascading failuresetting
In the paper we apply the classical multi-criteria decision modeling (MCDM)approach for analysis of negotiation of an optimal network maintenance. Henceour description focuses on feasible decision made by negotiating parties andoutcomes of those decisions.
Let’s consider an undirected network (graph) G = (V,E) having k nodes. Theordered pair (V,E) comprises of a set of nodes (vertices) V and a set of edges E,where each edge is represented as a pair of nodes (v, u), v, u ∈ V . A network Gcontains k nodes, i.e. |V | = k. Let N(v) = u : (v, u) ∈ E be a set of neighborsof node v. We assume that G is undirected, i.e. (v, u) ∈ E ⇔ (u, v) ∈ E and doesnot have self-loops, i.e. (v, v) /∈ E. Additionally without loss of generality we willtake that V = 1, 2, . . . , k. In this way each vertex can be simply referencedby its number. Business interpretation of the setup is that nodes of the graph
Kamineta
Rectangle
34
Simulating optimal negotiation strategy ... 3
are entities that produce value to their owners and edges indicate relationshipsbetween them. If edge between entities exists it means that failure of one nodeinfluences the risk of failure of the other node.
In the paper we consider m > 1 negotiating parties who negotiate decisionregarding maintenance of the network G = (V,E), where each party controls apart of the network. Each negotiating party i controls a subset of nodes Vi ⊂ V .Sets Vi cover whole set V and are disjoint. Formally we assume that Vi ∩ Vj = ∅for i 6= j and V1∪, . . . ,∪Vm = V . Let ki = |Vi| be the number of nodes controlledby party i. Under the above assumptions we have
∑mi=1 ki = k. The economic
interpretation is that nodes of the network G are spread among m regions, whereeach region has it’s decision maker responsible for regulatory policy.
Let s(t) ∈ 0, 1k be a vector representing node states in time t ∈ Z. Weassume that 1 represents a node malfunction (or bankruptcy in case of compa-nies or financial institutions) and 0 means a normally operating node. In thebeginning of a simulation t = 0 all nodes are operational so s(0) = 0. Similarlyw ∈ Rk
+ represents node size (importance) in the network (it is not indexed bytime because we assume that it is constant in time). The i-th elements of vectorsw and s(t) will be presented by wi and si(t) respectively.
Let p(v, t) be the probability that functioning node v in time t breaks downin time t + 1. We assume that the probability a node malfunction depends onit’s endogenous probability of failure and state of the neighbors in time t.
p(v, t) = f(pv, N(v), s(t),w, h(v), xv) (1)
where pv represents endogenous probability of v malfunction, h(v) representssupport (number of repairs) received by the node from the system regulator.Hence, the probability of node failure depends on node’s endogenous fragilityand state and size of neighborhood nodes. We assume that the help receivedby a node decreases probability for future failure i.e. ∂p/∂h(v) < 0. Finally xvrepresnts regulatory effort for the node x, xv ∈ 0, 1, where xv = 0 means noadditional regulatory effort is present for the node v and xv = 1 means that aregulatory effort was made.
Similarly when the node v in time t is broken down it is being repairedin period t + 1 + tr(v) where tr(v) is the repair time. In the simulation modelpresented in the next section we assume that tr(v) is a random value drawn fromPoisson distribution with the mean λ = 3 i.e. tr(v) ∼ Poiss(3). When a node isbeing repaired the network regulator incurs repair costs equal to the node sizewv. Additionally we assume that after the repair the probability p(v, t) decreases— each additional repair decreases the probability of next malfunction by half.
The processes of breaking down and fixing of nodes constitute the dynamicsof the system. Notice that in the long run system reaches a state where all nodesare repaired — due to fact that having node repaired decreases the probabilityof future failures (in the example simulation it is assumed that each malfunctiondecreases node failure probability by half).
Each negotiating party i can make investments or regulatory actions regard-ing nodes Vi it controls. The decision to repair a particular set of nodes will be
Kamineta
Rectangle
35
4 P. Szufel, B. Kaminski and T. Szapiro
presented as x = [x1, . . . , xk] ∈ 0, 1k, 0 means that no regulatory action istaken and 1 means that a regulatory action is taken for a particular node andit’s bankruptcy (malfunction) probability is reduced. Depending on a particulareconomic system such a decision could mean inducement of strict control or sup-port for a particular financial institution or (in case of transportation network)a decision can be an effort to optimize flow at a particular node v.
The goal of the negotiating parties is to find such compromise that for arandom malfunction process the expected cost of network repairs (wv) duringthe simulation period will be the lowest. Negotiation parties are constrained bythe number of available regulatory decisions, i.e. we assume that for party i thatcontrols the sub-network Vi the following budget constraint holds:∑
v∈Vi
xv <= bi (2)
where bi is the arability of regulatory decisions.The negotiating parties evaluate outcomes of their decisions — minimize the
the costs of handling network failures. Different network control/maintenancedecision lead to different volumes of node failures (e.g. bankruptcies) and henceto different cost incurred by decision makers. As it was stated earlier we haveassumed that the public (budget) cost of node failures to the node size w.
Since the nodes may fail with a given probability p(v, t) the outcome ofdecision x is random and is changing from one simulation run to the other.Let ψi(x) present expected outcome for a considered compromise x for decisionmaker i (taking into account all costs incurred by party i in the whole simulationprocess), which she wants to minimize. The value of ψ(x) cannot be observeddirectly but has to be obtained as an can estimated through averaging repeatedsimulation of them model for given set of parameters x.
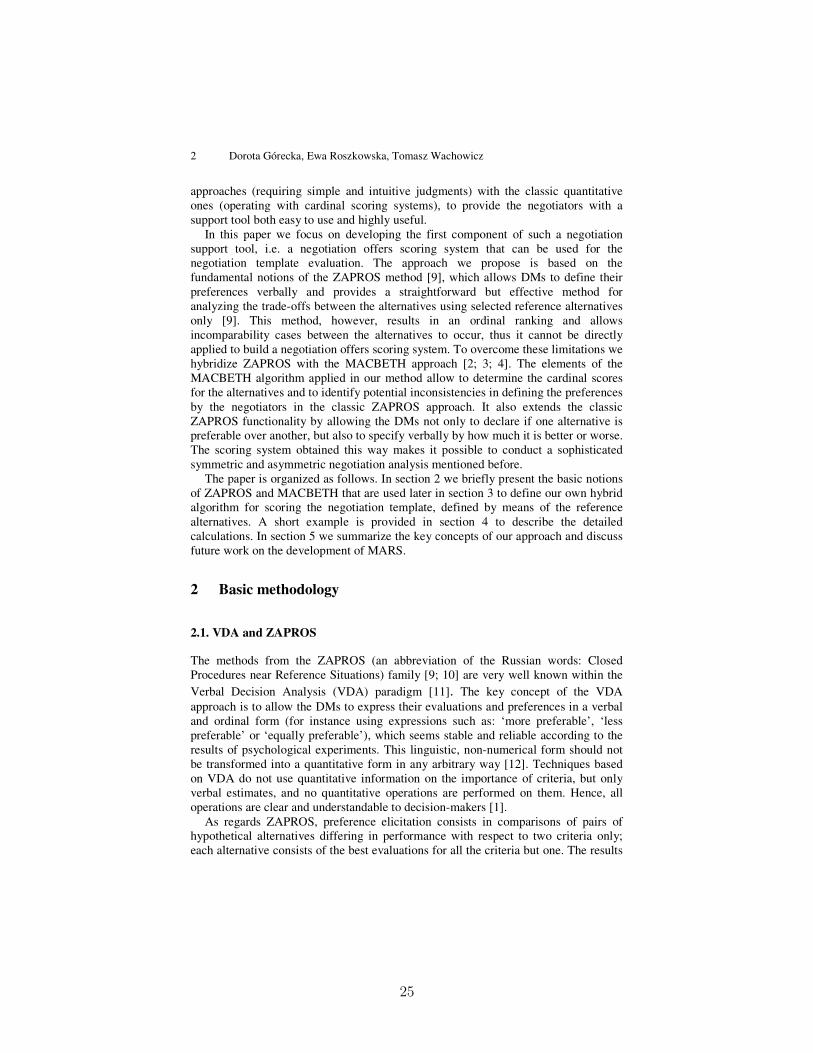
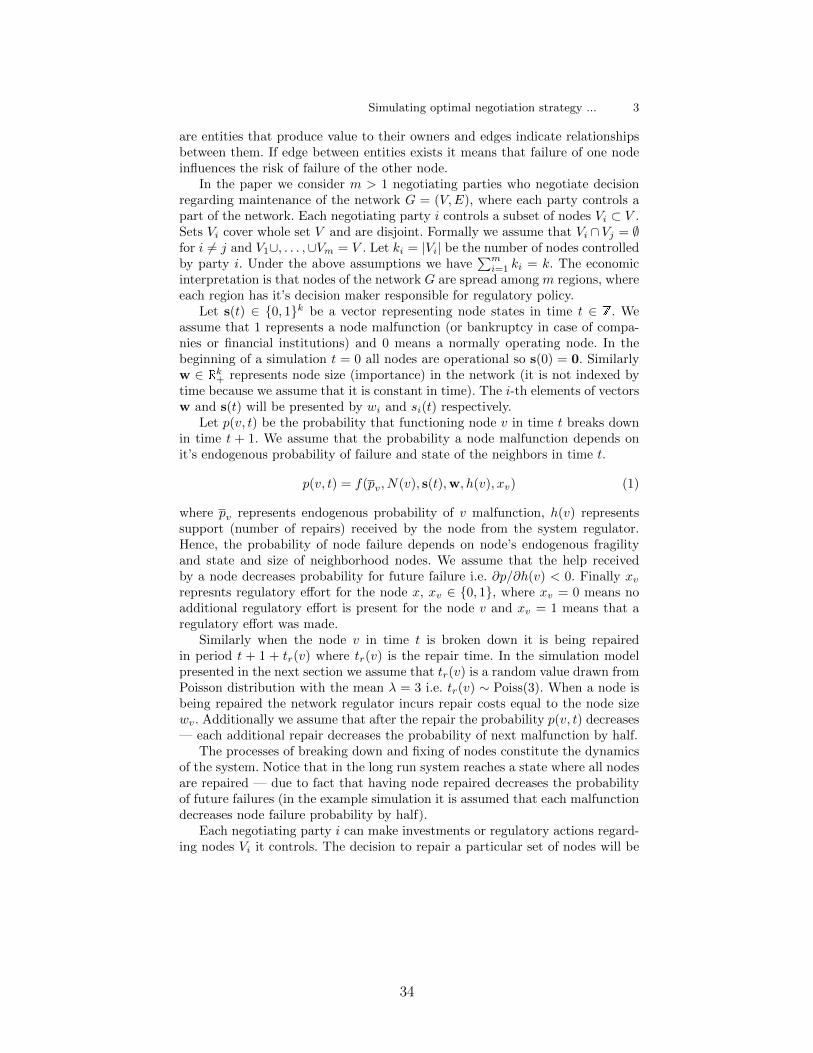
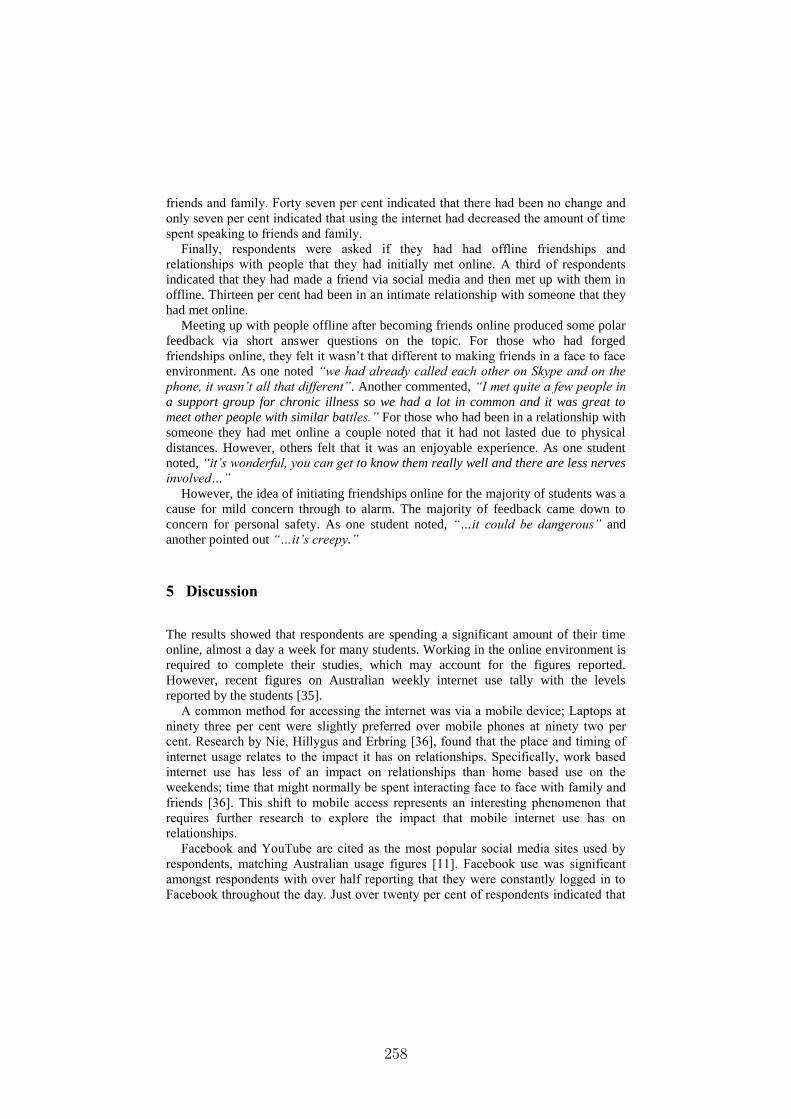
The goal of the negotiation process is to find a network regulation that min-imizes expected malfunctions costs for all parties. The negotiating parties se-quentially propose regulatory policy x. The outcomes ψ(x) for a given policy xare calculated with the network simulation model. A sample network controlledby two parties has been presented on Figure 1.
3 Simulated negotiation outcomes for network withcascading failure
We use simulation analysis to analyze possible negotiation outcomes for networkmaintenance decisions we propose simulation analysis. The simulation model wascreated with the Python1 [8] programming languages using NumPy [9] and theNetworkX library [10] — this is a standard approach for computational comput-ing of network dynamics [9]. The description of simulated negotiation consists
1 after creating the simulation model in Python we rewrote some of its parts in Cython[7] in order to increase the computational speed
Kamineta
Rectangle
36
Simulating optimal negotiation strategy ... 5
Fig. 1. A sample network structure controlled by two parties who jointly negotiateregulatory decision. The Party A could be particularly interested in the status of thenode v36 since a malfunction of that particularly large node may spread to it’s node.
of two parts: In the section 3.1 we discuss the simulation model and simulatednegotiation scenario while in the section 3.2 results of simulation experimentsare presented.
3.1 Simulation scenario
Two negotiation-simulation scenarios for negotiation simulation policy:
– local optimization scenario - the parties independently decide on regulatorypolicy for their share of the network — i.e. decision regarding nodes v ∈ Vi.
– global optimization scenario - the parties jointly negotiate a global regulatorypolicy x.
In the local optimization scenario we assume that single decision maker ican influence only its own nodes, i.e. those elements of x that are indexed byvalues from the set Vi. We assume that parties 1, . . . ,m make their decisionssequentially. Without loss of generality we take that the sequence is given bydecision maker number (starting from 1 and finishing with m). In the globalnegotiation scenario the parties negotiate regulatory scenarios x, x ∈ 0, 1k forthe entire network.
We assume that the negotiation protocol agreed by the parties enforces thatoffers are placed sequentially by the negotiating parties. The expected value ofeach offer is evaluated with a simulation. Hence, the offer placed in step s willbe represented as xs. Analogously for sequential individual decision making wewill shall represent a decision of i-th decision-maker at step s by elements of xt
contained in set Vi.We consider a simulated negotiation scenario with m = 2 parties with each
decision maker controlling nodes V1, V2 ∈ V respectively of a network G=(V,E).We assume that the network V contains k = 30 nodes with each subnetworkhaving 15 nodes i.e. k1 = k2 = 15, node sizes w are generated from log-normal
Kamineta
Rectangle
37
6 P. Szufel, B. Kaminski and T. Szapiro
Algorithm 1 Simulation scenario for network maintenance decision x
1: procedure evaluate(x,G) . regulatory compromise x for the network G2: t := 0, s(t) := 0
3: total(1)CTR, total
(2)CTR := 0 . total costs for repairs of both parties
4: Randomly select two nodes v1, v2 ∈ V5: sv1(t) := 1, sv2(t) := 1 . simulate node failure6: repeat7: t:=t + 18: Calculate p(v, t) for all nodes v ∈ V . failure probability9: for all v ∈ V do
10: if p(v, t) > rand() and sv(t) = 0 then11: sv(t) := 1, tr(v) ∼ Poiss(3) + t + 112: else if sv(t) = 1 and t = tr(v) then13: sv(t) := 0 . Recover the node v
14: total(j)CTR += wv . update total repair cost for respective party j
15: end if16: end for17: until s(t) = 0 . all nodes repaired
18: return (total(1)CTR, total
(2)CTR) . a two element tuple is returned
19: end procedure
distribution w ∼ LN(0, 1). The network G, G = (V,E) is generated as preferen-tial attachment network [11] where node sizes are used as weights (attachmentprobability for a particular node v is proportional to wv).
For a given network G = (V,E) we simulate exchange of regulatory offersby the parties. For each offer x a outcomes ψi(x) are estimated through simu-lation according to the Algorithm 1. Hence, a value of the stochastic functionevaluate(x, G) needs to be calculated many times in order to achieve statisticalsignificance. In order to reduce variance and ensure comparability of results weuse the common random numbers technique [12].
3.2 Simulation results
We have simulated local optimization scenario for the negotiation presented inthe previous subsection.
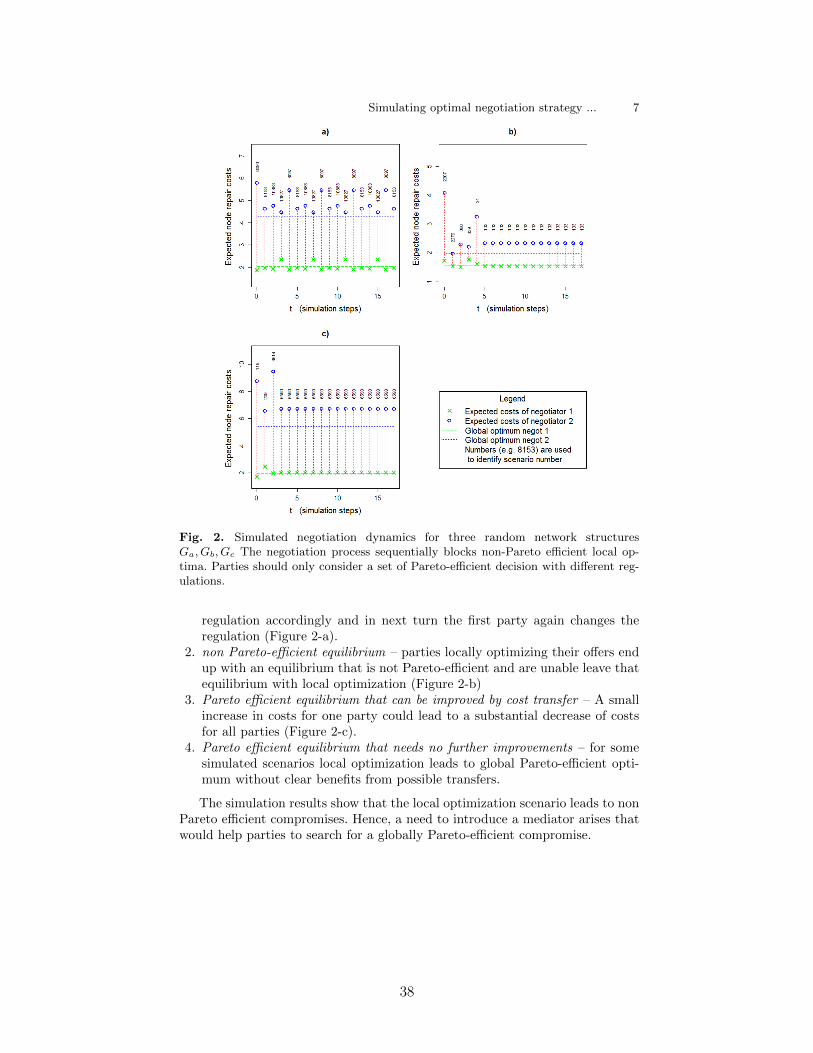
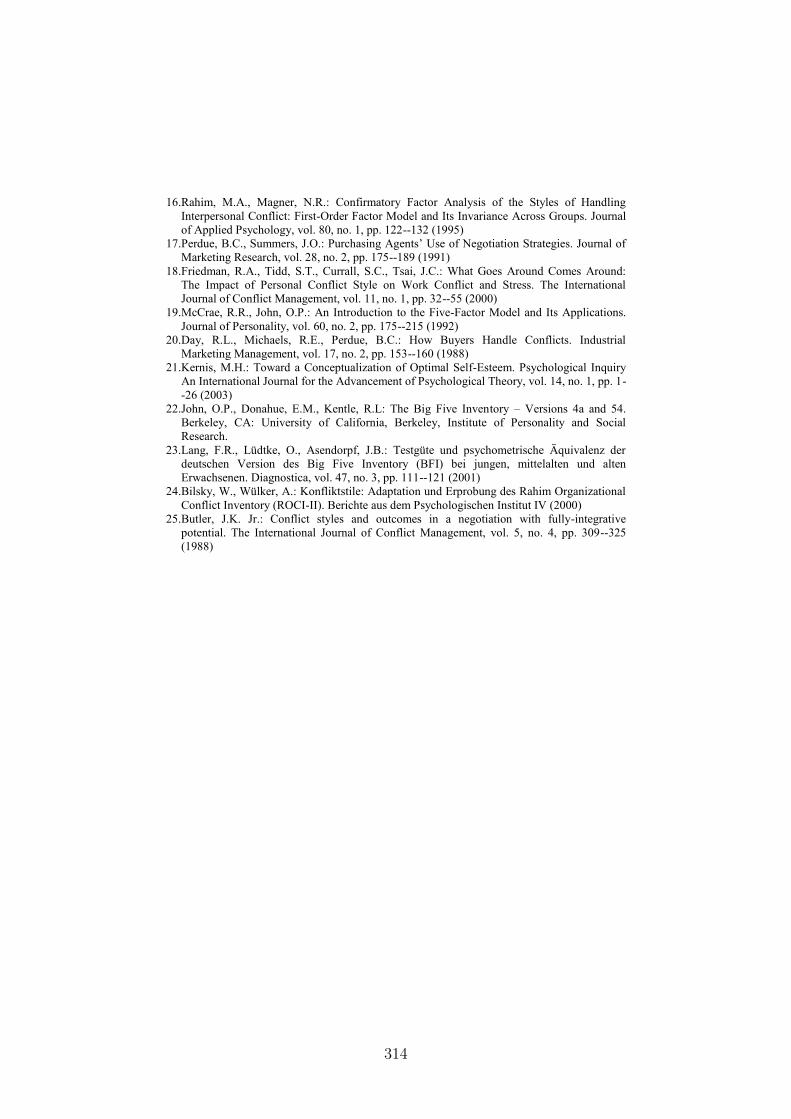
The simulations have been carried out for various networks G = (V,E). Sim-ulation trajectories in the local optimization setting for three network structures(Ga, Gb, Gc) have been presented on Figure 2. In order to enable comparisoneach regulatory scenario x can be identified on the figures by the scenario num-ber. For each network structure Ga, Gb, Gc a global optimal decision has beenidentified, where the goal function was sum of the total network malfunctioncosts incurred by both negotiating parties.
We can observe three different negotiation process trajectories can lead tothree types of inefficiencies:
1. unstable cyclic exchange of offers – In each step a party performs a localoptimization and provides a regulatory scenario. The other party adapts it’s
Kamineta
Rectangle
38
Simulating optimal negotiation strategy ... 7
Fig. 2. Simulated negotiation dynamics for three random network structuresGa, Gb, Gc The negotiation process sequentially blocks non-Pareto efficient local op-tima. Parties should only consider a set of Pareto-efficient decision with different reg-ulations.
regulation accordingly and in next turn the first party again changes theregulation (Figure 2-a).
2. non Pareto-efficient equilibrium – parties locally optimizing their offers endup with an equilibrium that is not Pareto-efficient and are unable leave thatequilibrium with local optimization (Figure 2-b)
3. Pareto efficient equilibrium that can be improved by cost transfer – A smallincrease in costs for one party could lead to a substantial decrease of costsfor all parties (Figure 2-c).
4. Pareto efficient equilibrium that needs no further improvements – for somesimulated scenarios local optimization leads to global Pareto-efficient opti-mum without clear benefits from possible transfers.
The simulation results show that the local optimization scenario leads to nonPareto efficient compromises. Hence, a need to introduce a mediator arises thatwould help parties to search for a globally Pareto-efficient compromise.
Kamineta
Rectangle
39
8 P. Szufel, B. Kaminski and T. Szapiro
4 Final remarks
In the paper we have applied the simulation approach to analyze outcomes ofvarious negotiation processes for network system control.
The results show that agreeing the common maintenance scenario at the ne-gotiation table can lead to more efficient outcomes than local decision optimiza-tion by particular decision makers without contacting other parties. Howeverwe have also shown that in some simulation scenarios where parties do not de-cide to negotiate a common network maintenance strategy but take decisionsindependently the achieved equilibrium can still be Pareto-efficient.
The further research will focus on extending simulations to multi-lateral ne-gotiation scenarios and making the costs of regulatory decisions dependent onthe node size. Another interesting area is calibrating the simulation model withdata from some parts of real-world networks.
References
1. Vespignani, A.: Predicting the behavior of techno-social systems. Science325(5939) (2009) 425
2. Vitali, S., Glattfelder, J.B., Battiston, S.: The network of global corporate control.PloS one 6(10) (2011) e25995
3. Schweitzer, F., Fagiolo, G., Sornette, D., Vega-Redondo, F., Vespignani, A., White,D.R.: Economic networks: The new challenges. science 325(5939) (2009) 422
4. Harmon, D., Stacey, B., Bar-Yam, Y., Bar-Yam, Y.: Networks of economic marketinterdependence and systemic risk. arXiv preprint arXiv:1011.3707 (2010)
5. Ash, J., Newth, D.: Optimizing complex networks for resilience against cascadingfailure. Physica A: Statistical Mechanics and its Applications 380 (2007) 673–683
6. Gilbert, N., Troitzsch, K.: Simulation for the social scientist. McGraw-Hill Inter-national (2005)
7. Behnel, S., Bradshaw, R.W., Seljebotn, D.S.: Cython tutorial. In Varoquaux,G., van der Walt, S., Millman, J., eds.: Proceedings of the 8th Python in ScienceConference, Pasadena, CA USA (2009) 4 – 14
8. PSF: Python Software Foundation, Python Language Reference, version 3.39. Perez, F., Granger, B.E., Hunter, J.D.: Python: an ecosystem for scientific com-
puting. Computing in Science & Engineering 13(2) (2011) 13–2110. Hagberg, A., Swart, P., S Chult, D.: Exploring network structure, dynamics,
and function using networkx. Technical report, Los Alamos National Laboratory(LANL) (2008)
11. Barabasi, A.L., Albert, R.: Emergence of scaling in random networks. science286(5439) (1999) 509–512
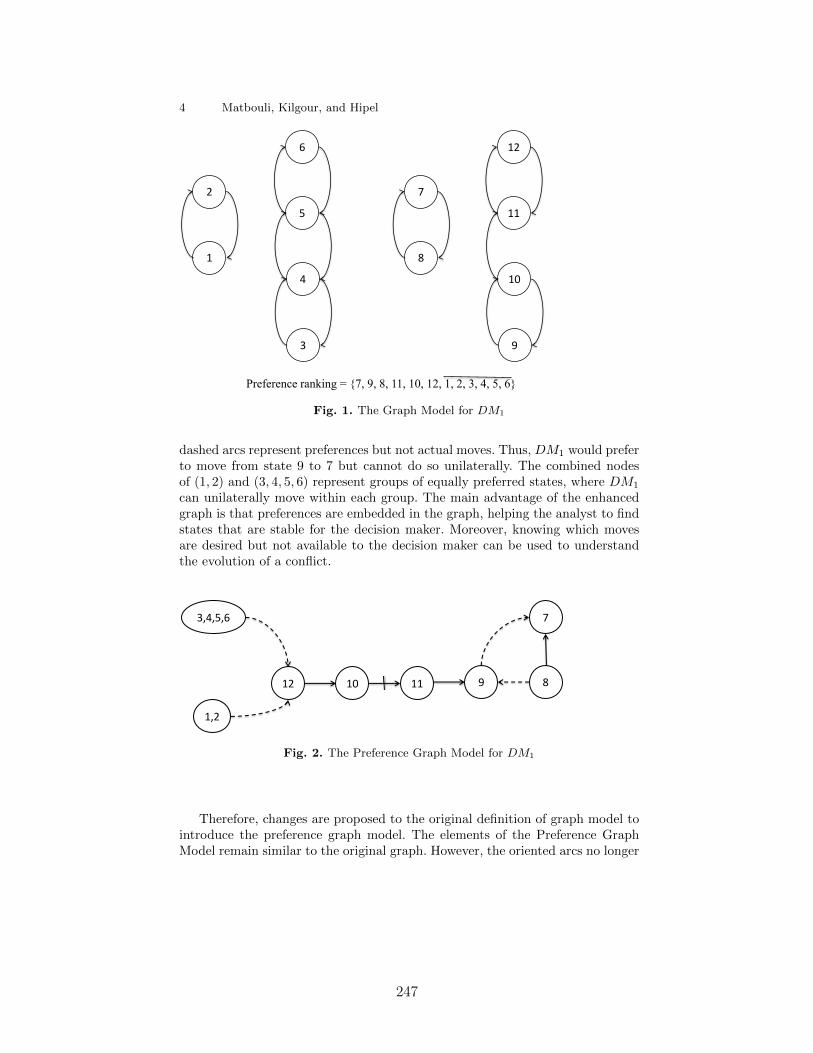
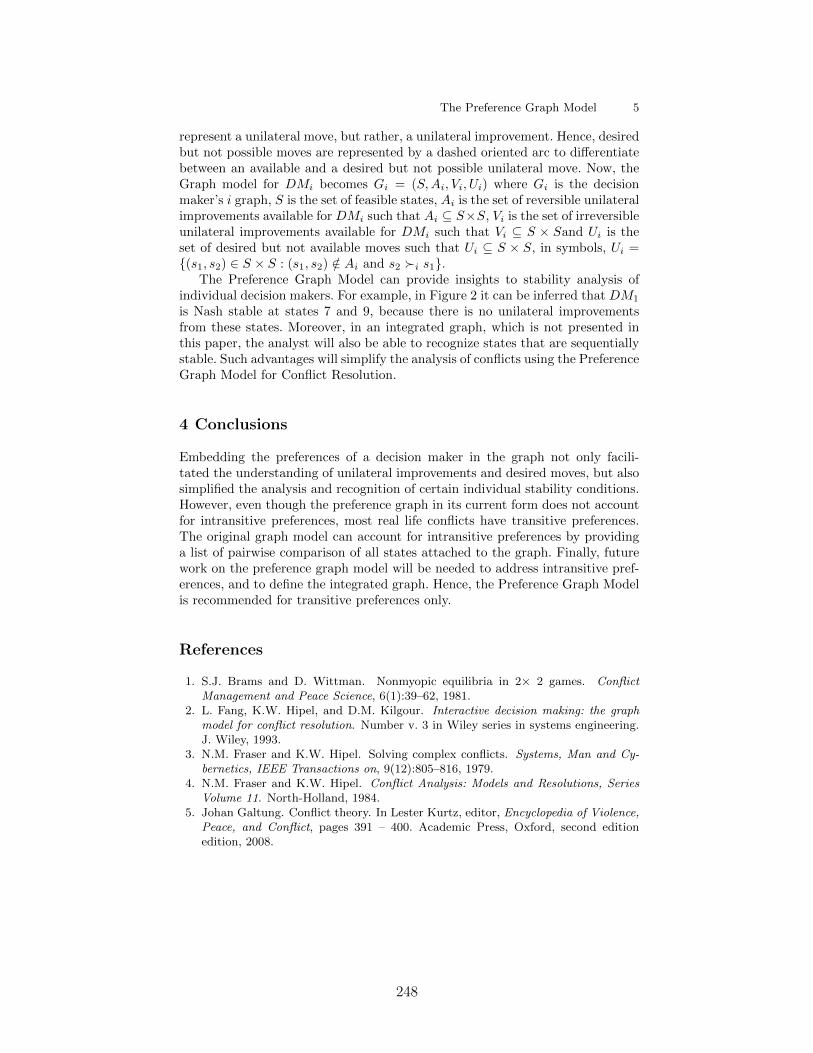
Abstract. The allocation of water resources has been a source of tension between people all over the world. The need for water which everyone holds in common should be a motive for cooperation and not conflict. Very often in a problem-solving conflict, the lack of information leads to a distributive negotiation. A distributive negotiation can turn into an integrative negotiation when values are created. We propose a model for pre-negotiation by value creation in water resource conflicts using Valued-Focused Thinking (VFT) approach. When values are created this means that the parties in conflict want a way to enhance the number of issues that will be shared between them so there can be improvements for all parties.
Keywords: integrative negotiation, value creation, water resources conflicts
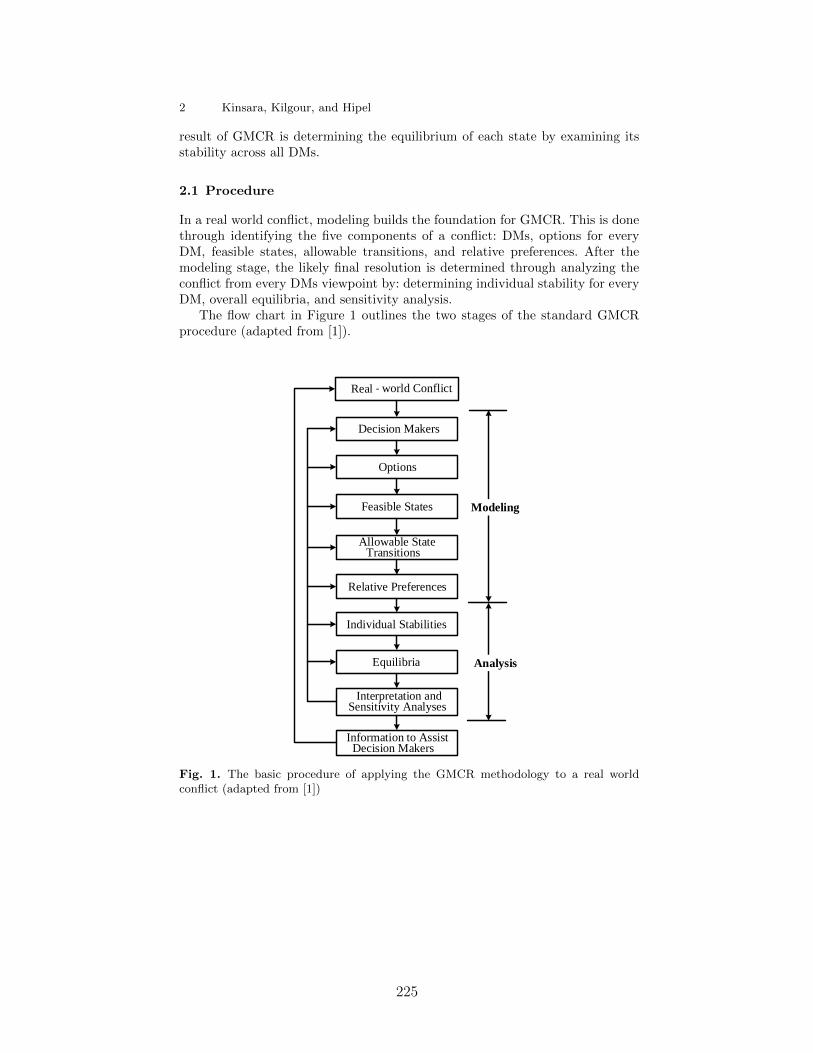
1 Introduction
The fair allocation of water is a key issue in managing water resources and is regarded as one of the main reasons for conflicts related to watersheds around the world [1].
The need for management agencies to establish and adopt appropriate methodologies and policies for water allocation is recognized by researchers, government and experts in water planning. Despite this, there are still many obstacles to be overcome when seeking efficient, fair and sustainable allocations [2].
Negotiation has always been an important tool for resolving conflicts among people, countries and organizations. People cannot achieve all objectives by imposing their decisions; they must negotiate with each other as they depend on others to undertake their activities [3].
There are features regarding water resources negotiations that distinguish them from other negotiations such as among members of a supply chain, employers and employees. First, there are laws that regulate water resource management in each county that cannot be violated during the negotiation process. Also, decisions regarding water usually have a wider impact as they affect the population, social life, environment and economy of a region.
To improve and create new negotiation models, it is fundamental to analyze the relevant factors regarding the negotiation process for water resources,
47
emphasizing the aspects that can contribute to designing tools based on the interests of the parties such that these facilitate understanding, communication and learning.
Identifying appropriate decisions makers (DMs), objectives, criteria and constraints on the problem should be done prior to the negotiation process and regarded as part of the phase of structuring a problem. This is a key element if the results of the negotiation itself are to be successful. Problem structuring methods can also be of great help when drafting Negotiation Support Systems (NSS) as a negotiation is a process of interaction and communication involving many variables. NSS tend to facilitate the negotiation process and make it more efficient; problem structuring helps the negotiator think outside the box and creatively define the problem, find new alternatives, objectives, and, in some cases, even decision opportunities.
Even in pure conflict scenarios, which often occur when allocating water resources, there could be coordination between the parties as in the well-known example of two sisters arguing over an orange, where one sister wants the whole orange to make juice and the other wants the peel to make marmalade. If they both have this information, each can have the entire part that interests them. Otherwise, they will compete for the largest piece of orange possible [4].
Water cannot continue as a source of tension between people living in the same geographical area; in fact, their common need should serve as a catalyst for cooperation, not conflict [5].
In an integrative negotiation other values are involved, enabling tradeoffs between the parties involved. A dealer might agree to invest in water pollution prevention if he can use a larger volume of water, while the population might agree to have access to less water if the smaller amount is of better quality.
Creation of value, exchange of relevant information, and problem structuring are key elements for integrative negotiation [6]. Thus, by engaging on these activities, awareness is raised of the importance of structuring problems involving water resources, before the negotiation process itself.
Strategic Options Development and Analysis (SODA) is a problem structuring method that helps the DM identify and learn about a problem. It uses cognitive maps and workshops as modeling devices to understand and incorporate individuals’ views about the problem [7].
Another important method is Valued-Focused Thinking (VFT) by Keeney (1992). First, the DM focuses his/her thinking on values and only later on alternatives of how to achieve them. The method is structured to help compile a list of objectives and these objectives will later help the DM identify decision opportunities [8].
Based on that perspective, we propose a model for pre-negotiating water resource conflicts that sets out to help negotiators create values that make an integrative negotiation possible. The model uses VFT and SODA techniques to elicit objectives and structure them for each negotiator separately. The next step of the model is to aggregate the values elicited for all parties into a single list that represents the interests of them all. The facilitator enables this by holding a workshop with all parties involved in the negotiation process.
48
2 Proposed Approach
The objective of the proposed model is to assist negotiators to achieve a more cooperative environment by creating negotiation issues. The creation of values is possible by using problem structuring. The presence of a facilitator is needed to guide the whole process.
The first step of VFT will help DMs to think creatively about values individually. After creating a list of objectives, the VFT structuring step will separate them between mean objectives and fundamental objectives. Each negotiator will then have a list of objectives (issues) that he has an interest in negotiating.
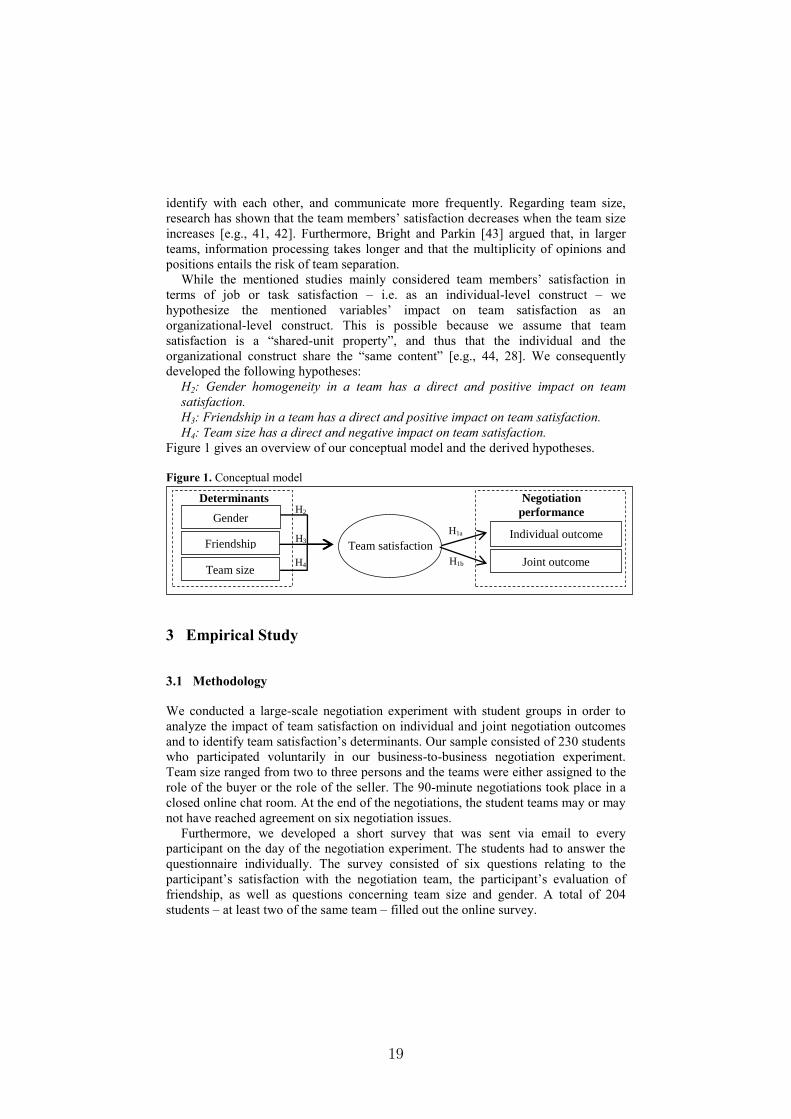
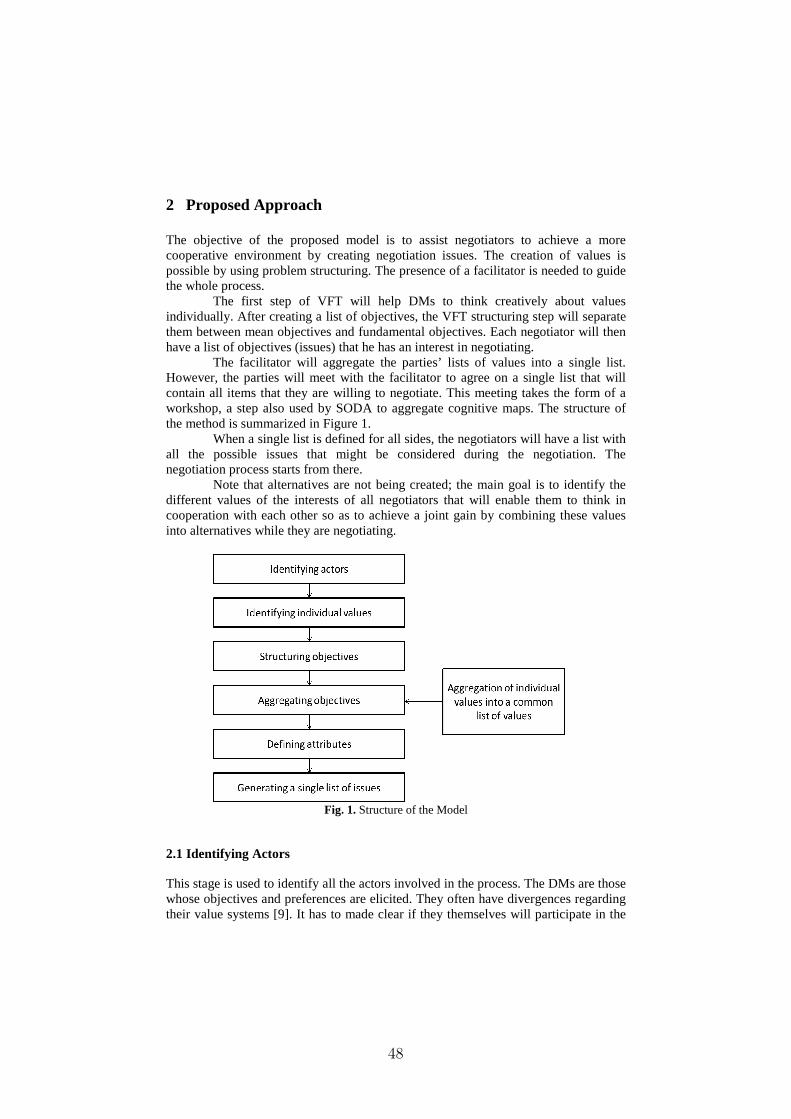
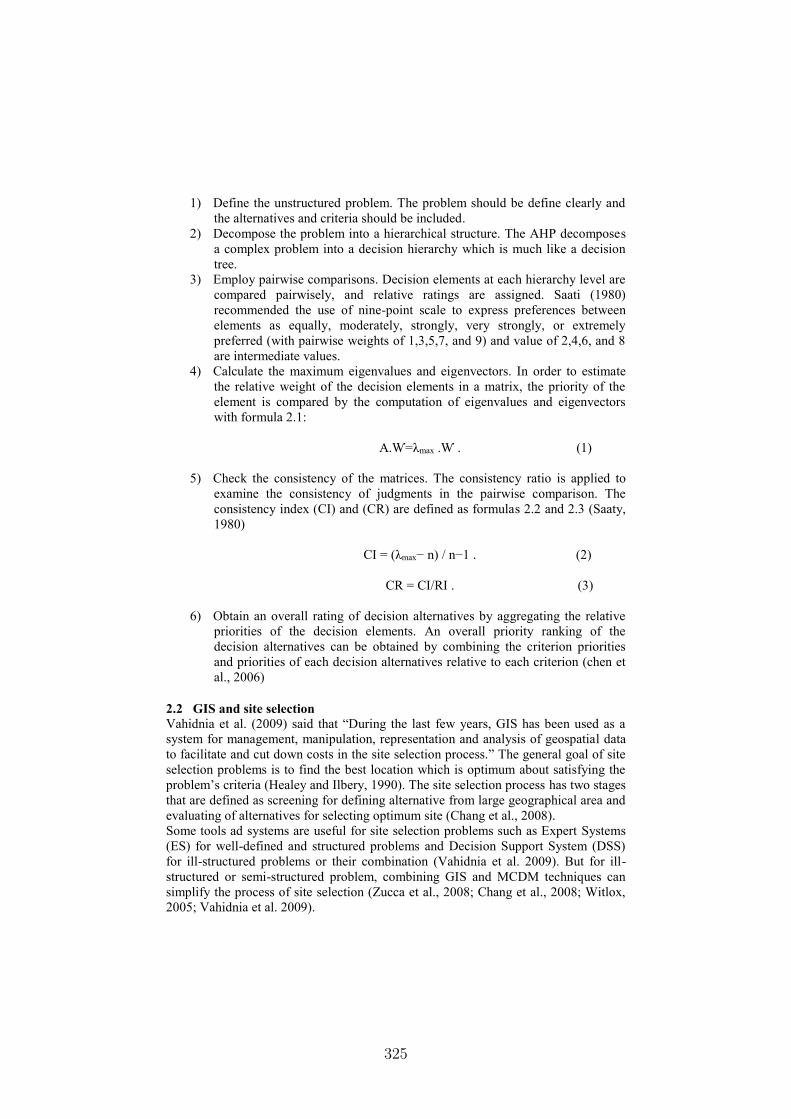
The facilitator will aggregate the parties’ lists of values into a single list. However, the parties will meet with the facilitator to agree on a single list that will contain all items that they are willing to negotiate. This meeting takes the form of a workshop, a step also used by SODA to aggregate cognitive maps. The structure of the method is summarized in Figure 1.
When a single list is defined for all sides, the negotiators will have a list with all the possible issues that might be considered during the negotiation. The negotiation process starts from there.
Note that alternatives are not being created; the main goal is to identify the different values of the interests of all negotiators that will enable them to think in cooperation with each other so as to achieve a joint gain by combining these values into alternatives while they are negotiating.
Fig. 1. Structure of the Model
2.1 Identifying Actors
This stage is used to identify all the actors involved in the process. The DMs are those whose objectives and preferences are elicited. They often have divergences regarding their value systems [9]. It has to made clear if they themselves will participate in the
49
process or if they will contribute indirectly by having someone else represent them during the process (a client).
Other actors that might be part of the process should also be identified at this stage. In this model, the presence of a facilitator is mandatory.
2.2 Identifying Individual Values
In the first step VTF is used to identify objectives and structure these objectives. The most obvious way to create value is to think in terms of the interests of the
disputing parties - What do you want to achieve in this situation [10]? Various techniques that stimulate the identification of objectives are shown in
Keeney (1996) and include the questions below: 1. A wish list. What do you want? What do you value? What should you want? 2. Alternatives. What is a perfect alternative, a terrible alternative, a reasonable alternative? What is good or bad about each? 3. Problems and shortcomings, what is wrong or right with your organization? What needs fixing? 4. Consequences. What has occurred that was good or bad? What might occur that you care about? 5. Goals, constraints, and guidelines. What are your aspirations? What limitations are placed upon you? 6. Different perspectives. What would your competitor or your constituency be concerned about? At some time in the future, what would concern you? 7. Strategic objectives. What are your ultimate objectives? What are your values that are absolutely fundamental? 8. Generic objectives. What objectives do you have for your customers, your employees, your shareholders, yourself? What environmental, social, economic, or health and safety objectives are important? 9. Structuring objectives. Follow means-ends relationships: why is that objective important, how can you achieve it? Use specification: what do you mean by this objective? 10. Quantifying objectives. How would you measure achievement of this objective? Why is objective A three times as important as objective B?
Consider a dispute between the population and the agricultural industry in the context of water allocation; instead of only considering the volume of water that would be allocated to each party, they could also consider water pollution as another issue to be negotiated that could improve their current state.
A facilitator will help each side create an individual list of values that could be included in the negotiation process guided by the type of questions shown above.
50
2.3 Structuring Objectives
The first lists generated by the negotiators will include many items such as alternatives, constraints and criteria that are not objectives. The facilitator will guide the DMs as to how to transform these items into objectives and to classify them into means objectives and fundamental objectives [10].
Fundamental objectives concern the ends that DMs value in a specific decision context while means objectives are how they can achieve these ends. Notice that ends and means are context dependent [11].
This approach not only helps to identify all of the relevant objectives, including previously unrecognized objectives, but it also provides a logical and consistent way of identifying the relationships among objectives [11].
2.4 Aggregating Objectives
With the lists of objectives of each negotiator at hand, the facilitator will aggregate these values into a single list identifying clusters. Similar objectives are put together in the general list while objectives not held in common will be discussed with the negotiators to see if they will make the final list or will be discarded.
The workshop is a very important step of the procedure. Not only will it be useful to define the list of issues, but it can also generate a friendly environment for the parties as they will work together as a team with the same purpose: that of enhancing the quality of negotiation results.
In the workshop, the facilitator will discuss definitions with the negotiators, withdraw redundant objectives from the list, and with the synergy created by the discussion, may even include new objectives. They will exchange information and concepts, and agree and disagree on what values they are willing to negotiate.
2.5 Defining Attributes
After having the lists of values aggregated into a single list, the group will also decide what attributes will represent the objectives, so they can evaluate how an offer could satisfy these objectives.
At the end of this step the negotiators will have a list of issues that could be used during the negotiation process that would contribute to integrative negotiation. That does not mean that the parties would have to make use of all objectives to reach an agreement; they could find a compromise with just a few. If they find that is necessary or that they could achieve a higher joint gain by adding another issue to the negotiation that issue can be found on the list. In this case, preferences should be elicited again considering all objectives.
After the final list is available, the parties can begin the negotiation process itself.
51
3 Final comments
When value is created this means that the parties in conflict have found a way to enhance the number of issues that will be shared between them. Thus, there are improvements for all sides. The creation of values improves the chance of the parties getting what they want out of the negotiation in a more cooperative environment. This is especially important in the context of water resource conflicts as water has a vital role in the life and development of the population, which makes the disputes in general even more fraught and severe.
The model presented aims to create values to turn distributive negotiation into integrative negotiation so that the parties can rely on integrative negotiation models to reach an agreement.
The creation of values using problem structuring demands more flexible management of issues and options, so that new issues might be added to the negotiation process when should all parties agree to this. This would be possible by using an NSS that allows the inclusion of issues during the negotiation process in the existing model and considers the constraints and objectives already in the model and also the negotiators’ preferences.
This study stems from on-going research and the next step will be to apply the model in a conflict about the allocation of water resources.
Acknowledgements. This research is part of research studies supported by The Foundation for Science and Technology of Pernambuco (FACEPE) and the Brazilian Research Council (CNPq).
References
1. Wang, L. Z.;Fang, L.; Hipel ,K. W. Water Resources Allocation: A Cooperative Game Theoretic Approach. Journal of Environmental Informatics, v.2, n.2, p.11-22 (2003)
2. Wolf AT. Criteria for equitable allocations: The heart of international water conflict. Nat Resour Forum, v. 23, p. 3-30 (1999)
3. Watkins, M. Negotiating in a Complex World. Negotiation Journal, v.15, n3, 245-270 (1999) 4. Kersten, G. E.. Modeling Distributive and Integrative Negotiations. Review and Revised Characterization. Group Decision and Negotiation, 10 (6). 493-514 (2001) 5. Atwi, M.; Chóliz, J S. A negotiated solution for the Jordan Basin. Journal of the Operational Research Society n.62,p. 81-91 (2011) 6. Raiffa, H..Lectures on Negotation Analysis. Cambridge, MA, PON Books (1996) 7. Eden, C and Ackermann, F. SODA - the principles. In: Rosenhead, J and Mingers, J Rational Analysis for a Problematic World Revisited. Wiley: Chichester (2001a) 8. Keeney, R. Value-focused thinking. A path to creative decision-making. Cambridge: Harvard University Press (1992) 9. Roy, B. Multicriteria Methodology for Decision Aiding. Kluwer Academic Plublishers, Netherlands (1996) 10. Keeney, R. Value-focused thinking: Identifying decision opportunities and creating alternatives. European Journal of Operational Research, 92, 537–549 (1996) 11. Morais, D. C.; Alencar, L. H.; Costa, A. P. C. S.; Keeney, R. L. Using Value-Focused Thinking in Brazil. Pesquisa Operacional, v. 33, p. 1-16 (2013)
52
What’s Next? Predicting the Issue a Negotiator Would Choose to Concede On.
Real Carbonneau & Rustam Vahidov
Concordia University, Montreal, Quebec, Canada
Abstract. The aim of this paper is to propose a simple and intuitive model for predicting which issue an opponent would choose next for making concessions. The model is based on the concept of concession potential. The findings indicate that negotiators tend to rotate issues during negotiations, picking the ones with the most concession potential.
1 Introduction
Negotiations are an important type of exchange mechanism. Multi-issue
negotiations allow the parties to look for the mutually acceptable
agreements in an integrative fashion. This is due to the fact that parties may,
in general, have different preferences over the issues. However, the
preferences are kept private, thus making solution search an offer exchange
process. Insights about the other parties preferences, as well as the ability to
predict the opponent’s moves may help the negotiator to better understand
the opponent and plan offers accordingly.
Attempts to profile and predict the opponent have been reported in the past
research. For example, past concessions made by the counterpart have been
used to construct the model of the counterpart [1]. If, on the average, they
exceeded a pre-defined threshold level, the opponent was modeled as
having a “positive” attitude. Some other past works for profiling an opponent
included: game-theoretic approach with Bayesian belief revision for
modeling a negotiation counterpart [2]; probabilistic influence diagrams
representing the counterpart’s decision-making [3]; and opponent
53
2 Real Carbonneau & Rustam Vahidov
preference modeling using non-linear regression analysis [4, 5], Chebyshev’s
polynomials [6] and genetic algorithms [7]. There has also been work on
predicting opponent’s next offer using neural networks [8, 9]. However,
neural networks are black box tools and one cannot, in general, get an
insight into their workings. This work aims at providing a simple model for
predicting on which issue a negotiator will make a concession next.
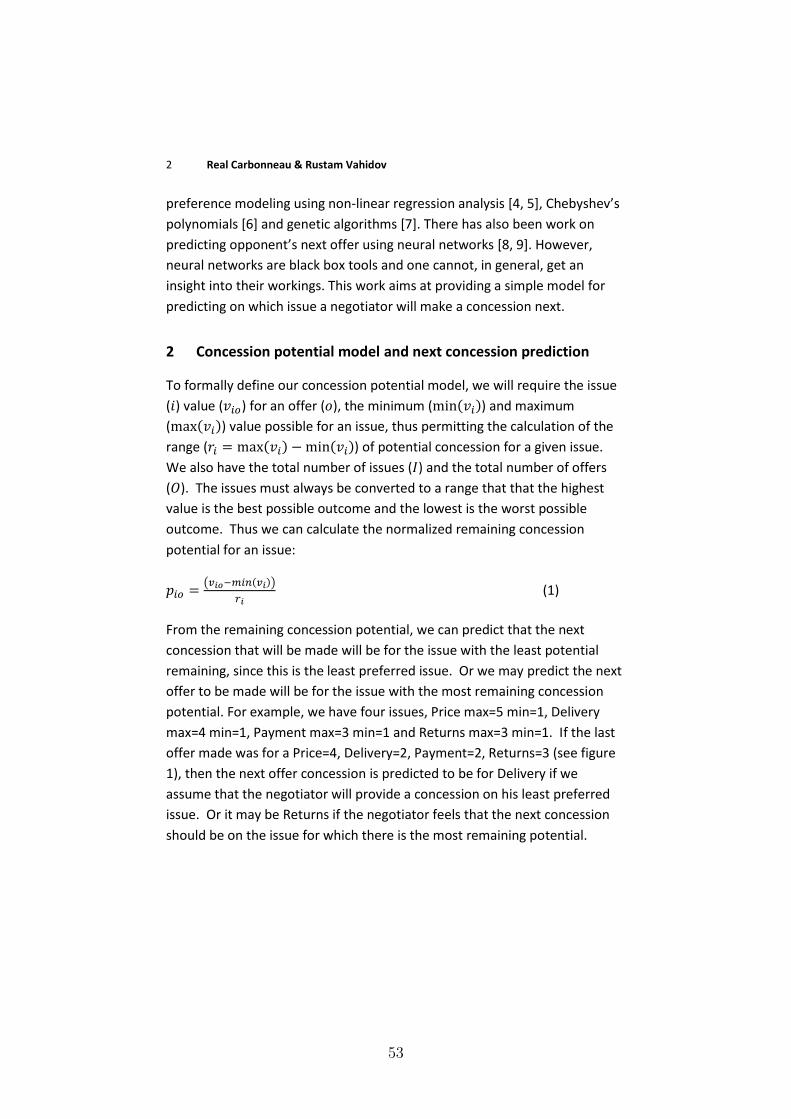
2 Concession potential model and next concession prediction
To formally define our concession potential model, we will require the issue
( ) value ( ) for an offer ( ), the minimum ( ( )) and maximum
( ( )) value possible for an issue, thus permitting the calculation of the
range ( ( ) ( )) of potential concession for a given issue.
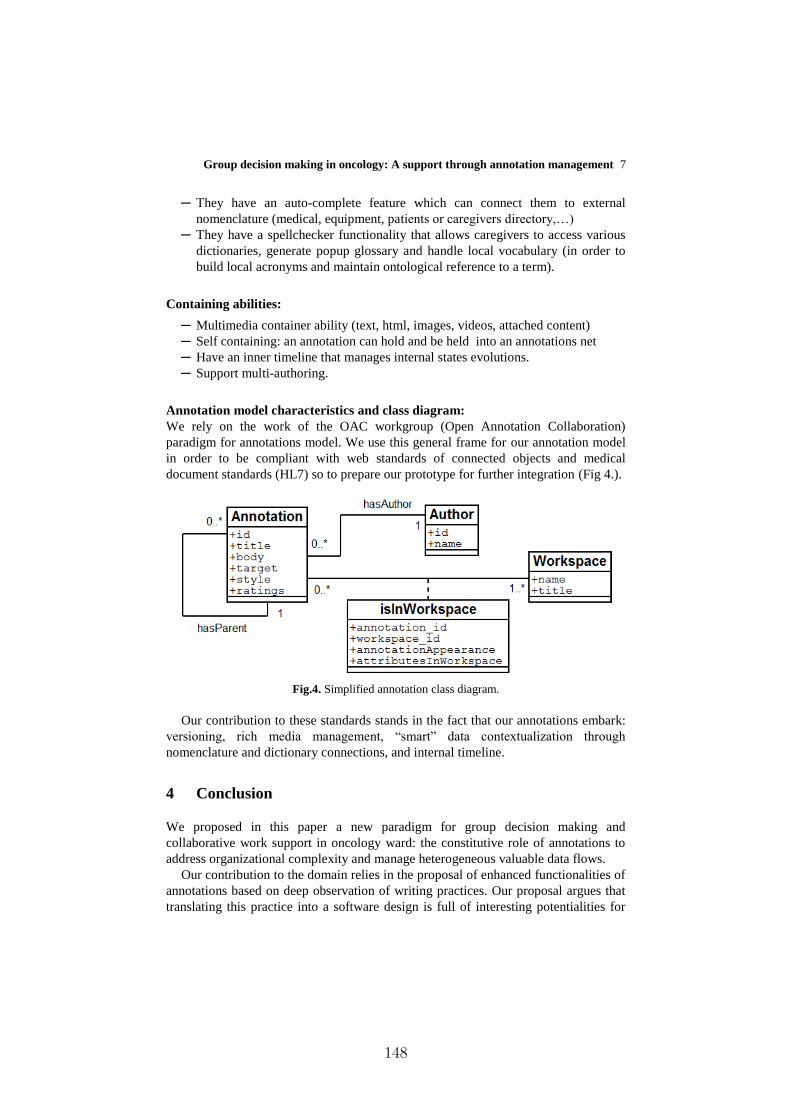
We also have the total number of issues ( ) and the total number of offers
( ). The issues must always be converted to a range that that the highest
value is the best possible outcome and the lowest is the worst possible
outcome. Thus we can calculate the normalized remaining concession
potential for an issue:
( ( ))
(1)
From the remaining concession potential, we can predict that the next
concession that will be made will be for the issue with the least potential
remaining, since this is the least preferred issue. Or we may predict the next
offer to be made will be for the issue with the most remaining concession
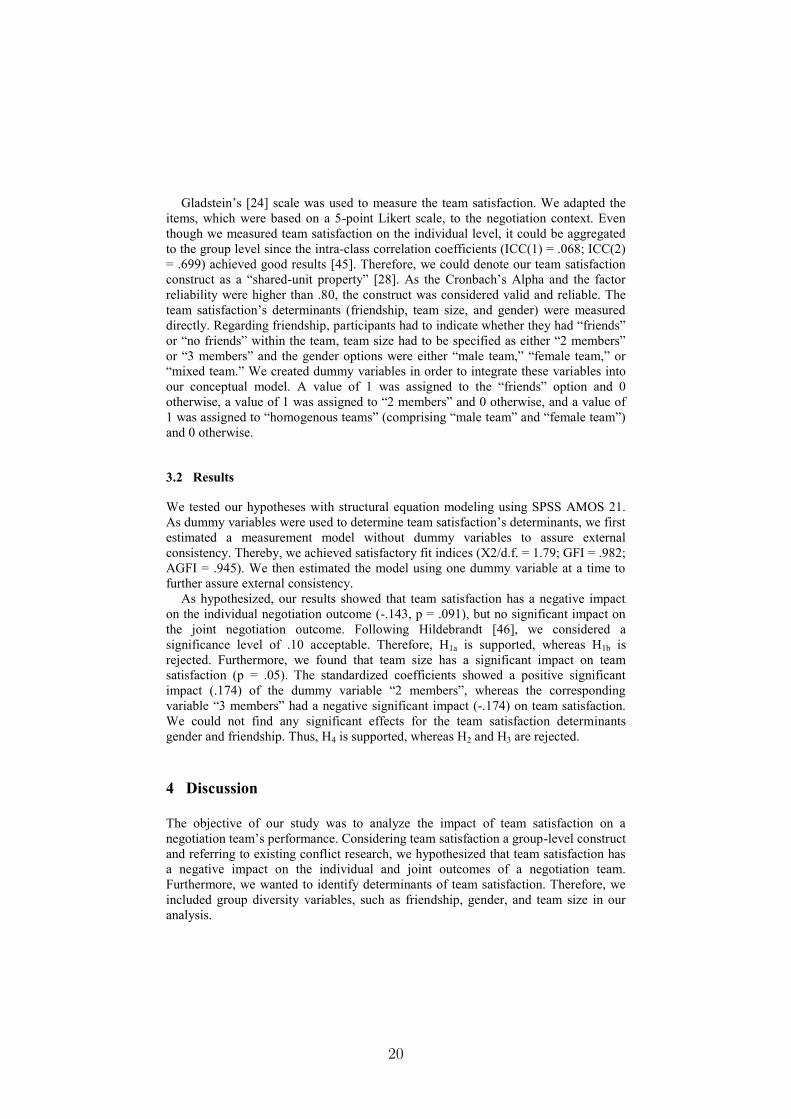
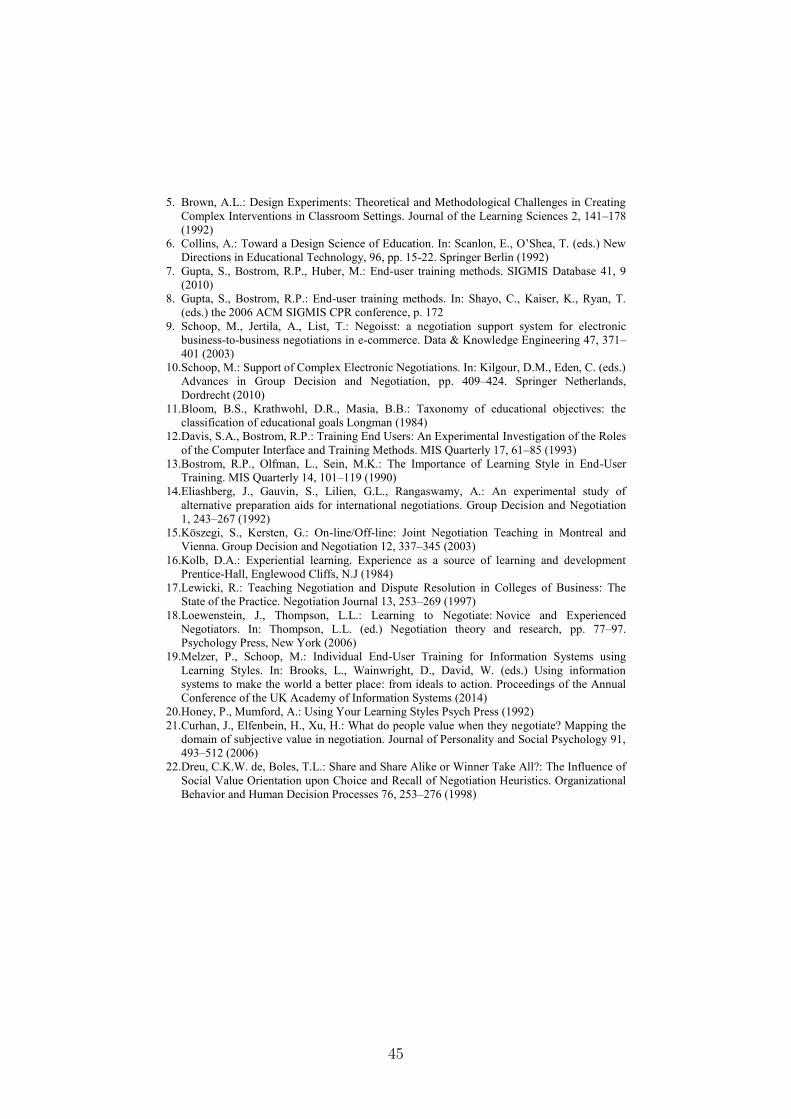
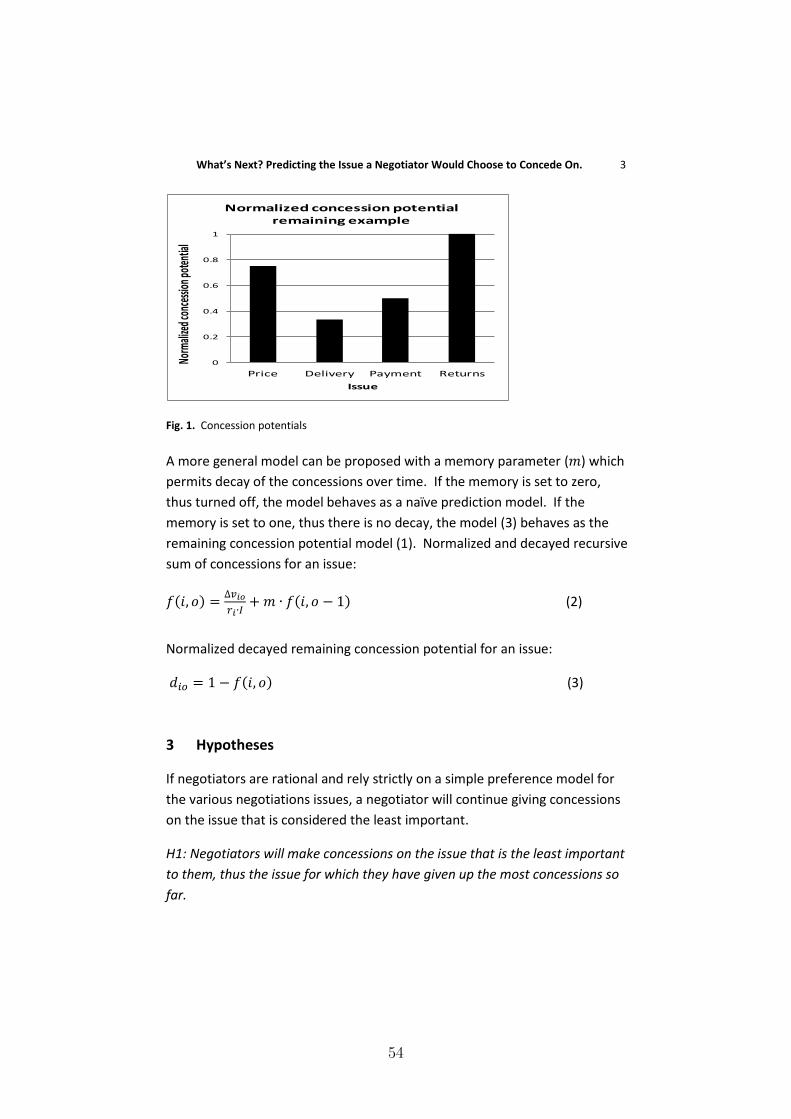
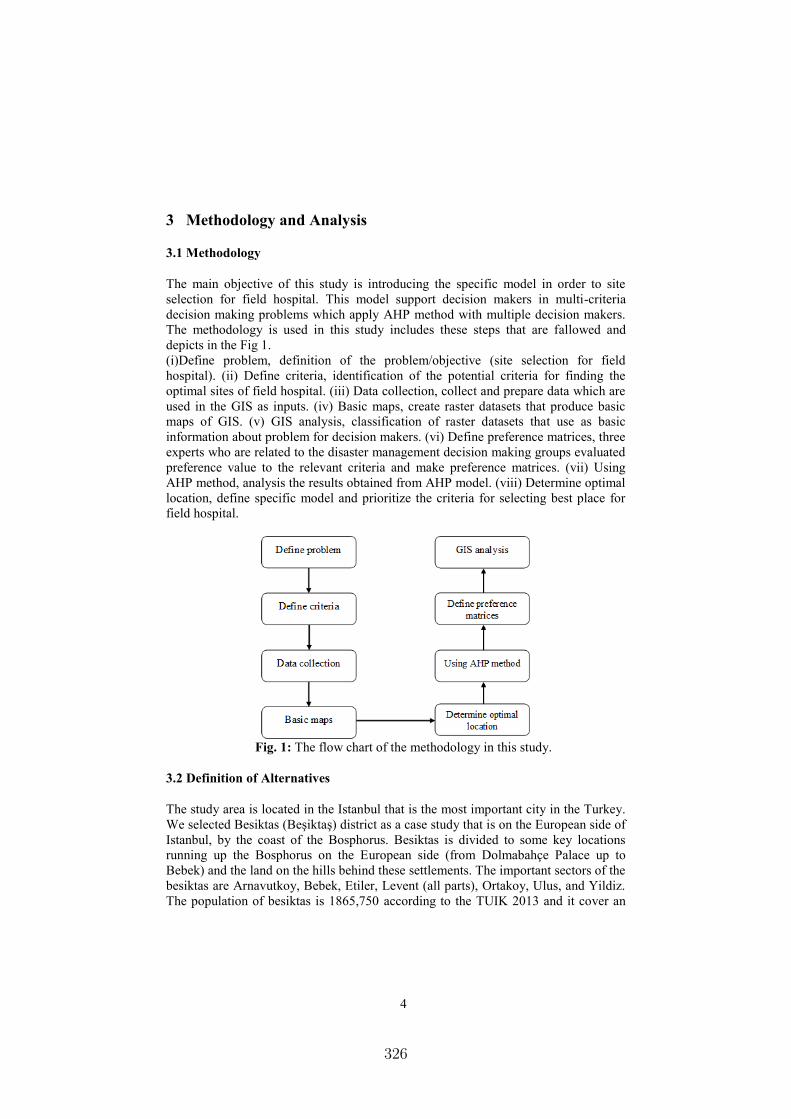
potential. For example, we have four issues, Price max=5 min=1, Delivery
max=4 min=1, Payment max=3 min=1 and Returns max=3 min=1. If the last
offer made was for a Price=4, Delivery=2, Payment=2, Returns=3 (see figure
1), then the next offer concession is predicted to be for Delivery if we
assume that the negotiator will provide a concession on his least preferred
issue. Or it may be Returns if the negotiator feels that the next concession
should be on the issue for which there is the most remaining potential.
Kamineta
Rectangle
54
What’s Next? Predicting the Issue a Negotiator Would Choose to Concede On. 3
Fig. 1. Concession potentials
A more general model can be proposed with a memory parameter ( ) which
permits decay of the concessions over time. If the memory is set to zero,
thus turned off, the model behaves as a naïve prediction model. If the
memory is set to one, thus there is no decay, the model (3) behaves as the
remaining concession potential model (1). Normalized and decayed recursive
sum of concessions for an issue:
( )
( ) (2)
Normalized decayed remaining concession potential for an issue:
( ) (3)
3 Hypotheses
If negotiators are rational and rely strictly on a simple preference model for
the various negotiations issues, a negotiator will continue giving concessions
on the issue that is considered the least important.
H1: Negotiators will make concessions on the issue that is the least important
to them, thus the issue for which they have given up the most concessions so
far.
0
0.2
0.4
0.6
0.8
1
Price Delivery Payment Returns
Norm
alize
d con
cessi
on po
tentia
l
Issue
Normalized concession potential remaining example
Kamineta
Rectangle
55
4 Real Carbonneau & Rustam Vahidov
Alternatively, negotiators may have a more complex preference model,
where subsequent concessions on the same issue are less desirable, thus
meaning that the negotiator will make subsequent concession on different
issues. Additionally, the negotiator may wish to provide concessions on
alternate issues to probe for reactions from the counterpart and thus get a
better understanding of the counterparts own preferences. In this case, the
negotiator may choose to provide concessions on the issue that has the most
concession potential remaining:
H2: Negotiators will make concessions on the issue for which there is the
most remaining concession possible.
As a reference, we will also test the simple Naïve model:
H3: Negotiators will make a future concession on the same issue as that of
their last concession.
It is also possible that negotiators change their preferences over time. In this
case, the most recent concessions provide more information than older
concessions. Since the normalized decayed remaining concession model (3)
is more complex than the more simplified one (1) we would like to test to
see if this additional complexity provides a benefit.
H4: The models with decay over time (3) will perform better than the model
without decay (1).
4 Results
For testing the models a dataset from bicycle parts negotiation case was
used: the same dataset as used in [8, 9]. Our findings are as follows.
H1: Not supported, p-value 0.00000. The empirical results demonstrate that
only 21.1% of the time, the next concession made by the negotiator is for the
least preferred issue, thus one with the most concessions so far. This is in
contrast to a random issue which matches 33.6% of the time.
H2: Supported, p-value 0.00000. The empirical results demonstrate that
44.8% of the time, the next concession made by the negotiator is for the
Kamineta
Rectangle
56
What’s Next? Predicting the Issue a Negotiator Would Choose to Concede On. 5
issue with the most remaining concession potential. This is in contrast to a
random issue which matches 33.6% of the time. Thus we find that H2 is
supported.
H3: Not supported, p-value 0.00000. The empirical results demonstrate that
20.2% of the time, the next concession made by the negotiator is for the
issue same issue as the previous concession. This is in contrast to a random
issue which matches 33.6% of the time. Thus we find that H3 is not
supported.
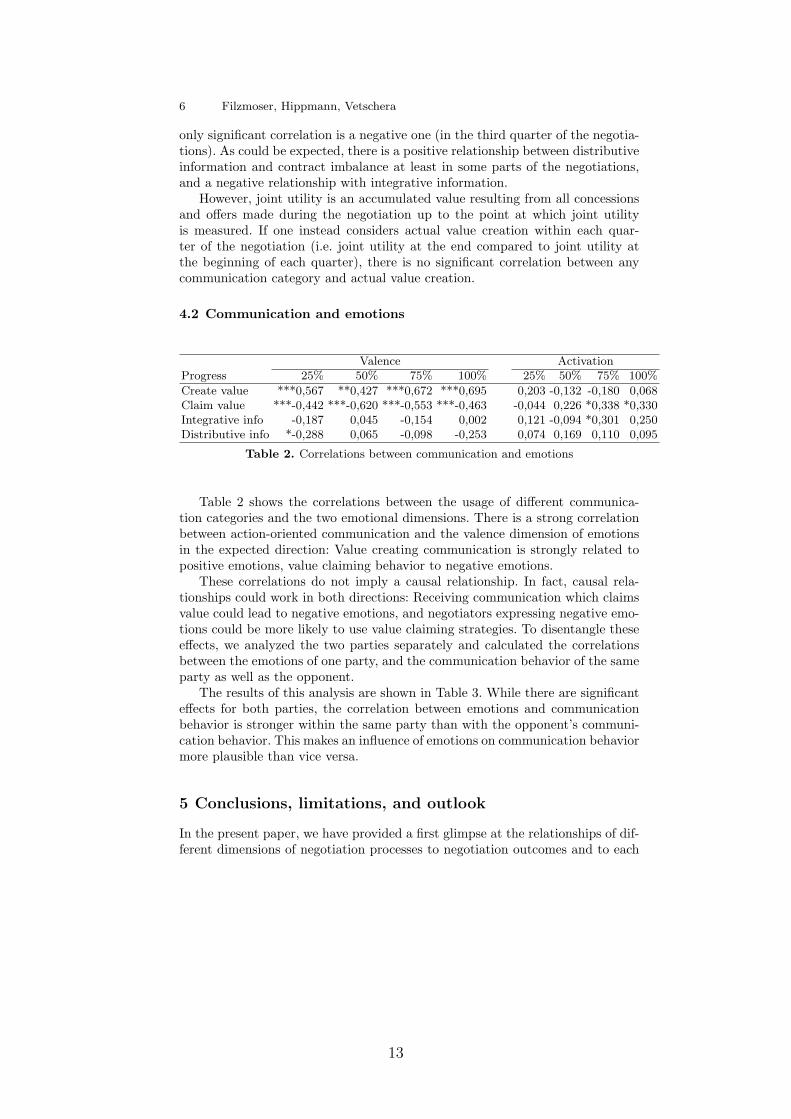
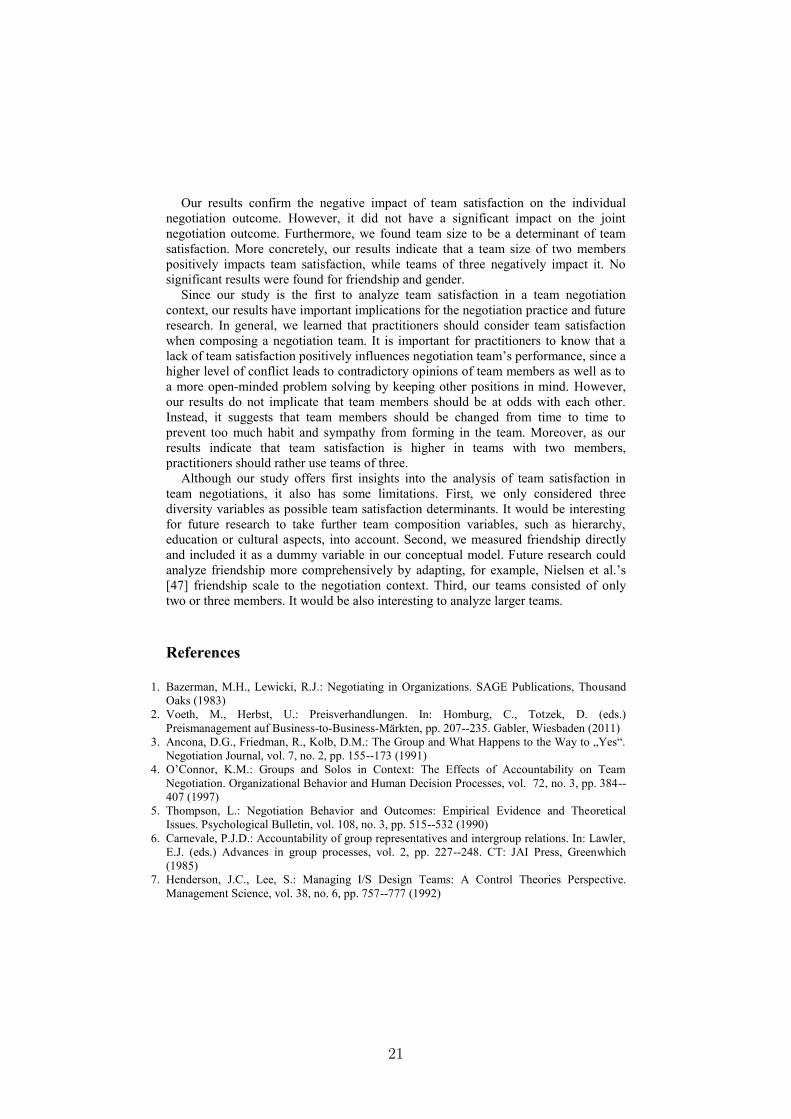
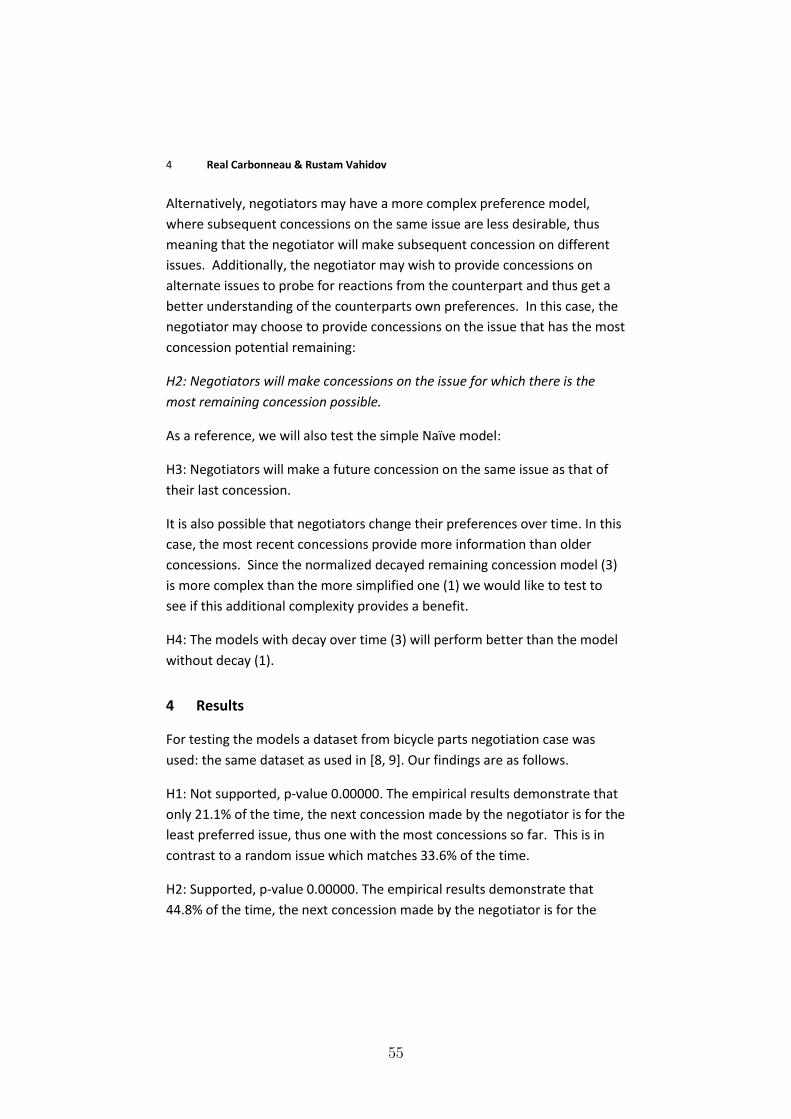
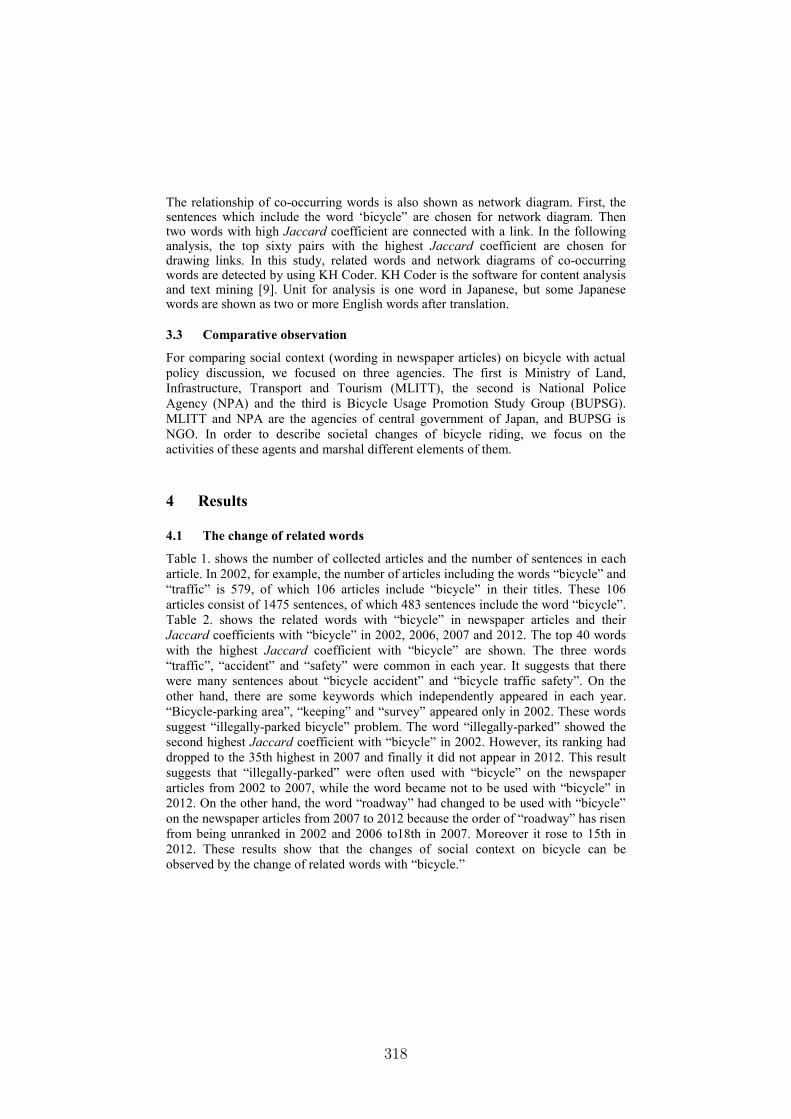
H4: Not supported. For predicting the next concessions based on the least
preferred issue, we find that with a memory parameter of 0.90, the model
with decay (21.0%) performs almost identically to the model without decay
(21.0%). For predicting the next concessions based on the issue with the
most remaining concessions potential, we find that with a memory
parameter of 0.90, the model with decay (45.5%) slightly outperforms the
model without decay (44.8%).
Fig. 2. Impact of memory parameter on prediction accuracy.
5 Conclusions
The current study has interesting findings into the nature of concession-
making by negotiators. Apparently, they tend to rotate issues while making
concessions. Also they tend to pick issues with most concession potential.
Although we do not find a significant different between the performance of
the models with decay and without, the model with decay is more general
0.4
0.41
0.42
0.43
0.44
0.45
0.46
0 0.2 0.4 0.6 0.8 1
Acc
urac
y
Memory Parameter
Accuracy for the Memory Parameter
Kamineta
Rectangle
57
6 Real Carbonneau & Rustam Vahidov
and more flexible since in can behave as the naïve model, the full memory
model or anywhere in between, and thus might still be of interest in future
research.
References
1. Lee, W.-P.: Towards agent-based decision making in the electronic marketplace: interactive recommendation and automated negotiation. Expert Systems with Applications 27 (2004) 665-679
2. Zeng, D., Sycara, K.: Bayesian learning in negotiation. International Journal of Human-Computer Studies 48 (1998) 125-141
3. Mudgal, C., Vassileva, J.: Bilateral Negotiation with Incomplete and Uncertain Information: A Decision-Theoretic Approach Using a Model of the Opponent. In: Klusch, M., Kerschberg, L. (eds.): Proceedings of the 4th International Workshop on Cooperative Information Agents IV, The Future of Information Agents in Cyberspace Springer-Verlag, London, UK (2000) 107-118
4. Hou, C.: Predicting agents tactics in automated negotiation. International Conference on Intelligent Agent Technology, Beijing, China (2004) 127-133
5. Brzostowski, J., Kowalczyk, R.: Adaptive Negotiation with On-Line Prediction of Opponent Behaviour in Agent-Based Negotiations. International Conference on Intelligent Agent Technology, Hong Kong, China (2006) 263-269
6. Saha, S., Biswas, A., Sen, S.: Modeling opponent decision in repeated one-shot negotiations. In: Pechoucek, M., Steiner, D., Thompson, S. (eds.): Proceedings of the fourth international joint conference on Autonomous agents and multiagent systems, Utrecht, Netherlands (2005) 397 - 403
8. Carbonneau, R., Kersten, G., Vahidov, R.: Pairwise issue modeling for negotiation counteroffer prediction using neural networks. Decision Support Systems 50 (2011) 449-459
9. Carbonneau, R., Kersten, G.E., Vahidov, R.: Predicting opponent's moves in electronic negotiations using neural networks. Expert Systems with Applications 34 (2008) 1266-1273
Kamineta
Rectangle
58
Law by Design in ODR - definition of relevant legal
information in consumer law disputes to enhance the
decision making process
Cristiana Santos1
1 Phd candidate of the Joint International Doctoral Degree in Law, Science and Technology
and Universitat Autònoma de Barcelona, Institute of Law and Technology, Spain
Abstract. This contribution introduces a new theoretical completion to the
online dispute resolution landscape and portrayals the performativity that a
legal layer seems to convey to the lifecycle of a dispute, thus, to the decision-
making process. We will substantiate the need to provide to consumers relevant
and meaningful legal information regarding their consumer dispute. We
envision with this perspective to go beyond the cartography of ODR and update
the ODR and consumer law framework for a technologically-oriented
environment and to the marketplace, by giving a new methodological trend,
shaping the interface with the end-user and enhancing informed decisions.
This approach might potentiate an early settlement and leverage consumers' trust,
according to the European Consumer-Program 2014-20203.
1 Corresponding author: Cristiana Santos. Email: [email protected] 2 Regulation n. º 524/2013 of the European Parliament and of the Council on online dispute resolution for
consumer disputes (Regulation on consumer ODR), hereinafter termed simply as ODR. We consider ODR as a communicative process involving the parties engaged in an interactive decision-making task,
as a mean for consumer redress. 3 Proposal for a Regulation of the Parliament and of the Council on a consumer programme 2014-2020
(COM(2011) 707 final).
59
The innovation stands in the fact that in the current online conflict resolution space,
even though the existence of technological innovation and maturity in the prominent
players, there are no dispute resolution services (public nor private) nor methods (in
negotiation and mediation4) that provides legal information on the content of the legal
rule that applies to a conflict. The implementation of this legal layer into the
technological and operational field, through an ontological modeling, may portray a
completely new completion to ODR that is not negligible: a customizing knowledge-
based support system, that applies and permeates the market - the locus where
disputes occur. We intend with this vision to go beyond the cartography of ODR and
update the ODR and consumer law framework for a technologically-oriented
environment and to the marketplace, by giving a new methodological trend, shaping
the interface with the end-user. To do so we will analyze in section 2 the current state-
of-the-art of legislation and regulation pertaining to Online Dispute Resolution and
we will point towards areas of regulation that are in need of adjustment or revision. In
section 3 we intend to justify the need for the envisioned legal layer in reference to
the disputants pre-conduct, having in mind the hyper law and hyper justice concepts
that the average consumer contingently have and we assemble the advantages of such
a legal layer to the stakeholders. In section 3 we figurate in general terms the legal
cover into an ontology framework and in section 4 we conclude.
2 Brief literature review
In a brief overview, we evoke the prominent players and their techniques5 and
conclude that in the current online conflict resolution space there are no dispute
resolution services (public nor private) that provides legal information on the content
of the legal rule that applies to a conflict. Moreover, the EU Regulation primarily
continues to rely on procedural rules (the coordination between the ADR entities)
4 Mediation means a structured process, however named or referred to, whereby two or more parties, on a
voluntary basis, try to reach an agreement on the settlement of their dispute with the assistance of a
mediator. This process may be initiated by the parties or suggested or ordered by a court or prescribed by the law of a Member State, as stated in Article 3 (a) of the Directive 2008/52/EC, of the European
Parliament and of the Council of 21 May 2008 on certain aspects of mediation in civil and commercial
matters (OJ L136/3). 5 Mediate.com that facilitates e- mediation and arbitration (www.mediate.com/); eBay’s paypal
dispute resolution system is settling 60 million complaints an year are processed through
simple automated-negotiation (http://resolutioncenter.ebay.com); online chat rooms and
document automation sites where disputants can meet up and exchange documents and
evidence; VirtualCourtRoom, LegalZoom, RocketLawyer, HotDocs, Exari and Juripax are
more elaborate mediator-sites with diagnostic forms, where conflict resolution is achieved by
identifying and separating issues and collecting them in the same space; Smartsettle tries to
find an optimal solution to conflicts based on preferences of the parties and even help shape
negotiation strategies; Context-aware conflict resolution environments using ambient
intelligence; Negotiating support systems (using algorithms such as Batnas and Watnas);
SPLIT-UP, combination of rule-based systems and neural networks to assist disputes about
properties distribution; FAMILY-WINNER, game theory-based approach for Australian
family negotiations; BEST-project, semantic web technologies as support to law cases
retrieval.
60
without approaching to the substantial content of the dispute, and both their theory
and practice are saturated with the inferences of contact and communications theories
paradigm6. Therefore, settling agreements "in the shadow of the law" [Error!
Bookmark not defined.], or "in the shadow of procedure" should not be delegated to
self-regulation, but within the law itself. It would reduce the need for participants in a
consumer law dispute to divert excessive time and resources to schemes that are time-
consuming, especially considering the inherent nature of consumer services and goods
(telecommunications, gas, electricity, water, insurances, banking, etc.) Hereby we are
cognizant that the inherent nature of the ODR concept is descriptively and
theoretically incomplete. We argue that ODR has been developing without its own
cogent theoretical base [3] which resides in providing legal information to the parties,
promote access to justice and endow consumer protection (empowerment) and redress
[4].
According to research, ODR experiences show some difficulties [5], such as lack
of funding; lack of enforceability and the correlated reluctance to participate in ODR
processes[6]; mediators might be seen biased and cannot give legal information to the
case (absence of legal information is linked to the source of dispute). We emphasize
the theoretical models of mediation techniques (for instance, pressing, facilitation,
transformation, reflexive, evaluative, contextual, etc.) that are developed [7] and we
even dare to quote this apprehension "(...) mediators have about 100 techniques at
their disposal that are as varied as they are numerous (...) scholars have pursued three
avenues, characterizing the behavior/techniques according to concurrent usage,
technique similarity and similar goals (...)". Mediators are the "party control" of the
communication process, the party that is parameterized in its role of healing
relationships between the parties [8]. We concede that the mediators' and negotiator's
role, regarding the strength and the content of the communication flow, would be
more situated and intensified if the parties were in a previous stage endowed with the
meaningful and relevant information regarding their domain of dispute.
3. The need for a legal layer
Consumer disputes have impacted interest and are often categorized by time-
consumption, cost-disproportionality and are convoluted into complex procedures. It
comprises acrimonious, since prolonged, legal wrangling which epitomizes long-term
damage. Conversely, the presupposed characteristics can be avoided through
technology that facilitates engagement with the relevant legal information in order to
have customizability to consumers. Mediation in consumer law is particularly suitable
to be modeled and integrated into a platform for web-based ODR semantic web
6 According to the ODR Regulation 524/2013, we claim that is still a complex system (it is only
the complaint that is submitted electronically and than it has a three-phase re-routing system
not carried out online, but only through traditional ADR methods); time consuming, with a
deadline from 3 up to 6 months; and it is still difficult to achieve to an agreement: if parties
don’t agree with the alternative dispute resolution body, or with the mediator, the process
ends; also, if the dispute is not solved within the offers and counteroffers, there is a “time-out
period” due to a dislogical performative structure workflow.
61
technologies [9]. As methodology, a legal ontology is a possible way to model the
legal information layer and the disputes that could be incorporated by the ODR
providers.
3.1 Pre-dispute conduct
We employ the ex ante perspective (looking forward from the point just before
litigation has begun), back in the stylized chronology of the lifecycle of a dispute [11]
to the point in time that precedes the conduct that gave rise to the dispute. From this
perspective, we might consider that if the parties were knowledgeable about the
applicable law and the abstract rights in their situation, there was no complaint and
thus no dispute at all, or a dispute emerges with substantial cause (for further
illustration, we conceive the plausible rights in the case of a delayed flight, or in case
if there was no defect in the dress that was bought yesterday, but the color or the size
was not aimed). In consumer law disputes, the stakeholders (ombudsman, regulators,
ADR and ODR providers, consumer associations, among others) assume more
palatably that the lack of legal information related to the case is linked to the root-
cause of disputes [10]. We ascertain that if the current legal dispute resolution
framework would encompass this "pre-dispute conduct", by assuring the layer of legal
information (substantive rules), this would fulfill the desideratum of ODR:
empowerment of consumers, readiness of consumers, their "smartening". We define,
in this framework, the needed content and its participants: the primary conduct for
disputes ("pre-dispute conduct", dispute acculturation or "self-litigation conduct")
[11] is obtaining legal "relevant information", addressed to consumers, to ODR
providers and to traders. Traders, which so far were considered economic entities, are
being described as "information-based organizations", "learning organizations",
"knowledge-creating companies" or "knowledge intensive organizations", within a
knowledge information society that we live in. Providing relevant legal information as
an early intervention, with settlement oriented style, is more likely to lead to high
joint gains outcomes; thus, we will call this system as Law by Design in ODR.
3.2 The hyper law and hyper justice concepts
The missing link is the legal information for the case dispute. Legal information
concerning the dispute domain (for instance, consumers, in general, think they have
the right to cancel the contract when they have poor adsl connection; or when a flight
is cancelled, consumers have a generalized idea that is due total refund), can be
misunderstood with popular law [12] and popular understanding (polarization
between popular law and expert law). Popular law consists in "popular right beliefs
about ethical or legal issues disseminated in the media or network, wish is defined as
"hyper-law""[13]. And the Web 2.0 and 3.0 have enhanced their scope and effects.
And from hyperrealism, we will find "hyper justice" [13] due to the dynamic
projection and unconsciously and subliminally consolidation of inner general
concepts, values, principles, norms that ascribe nonexistent obligations and rights.
This is what is known as "confirmation bias". Within a rights-based architecture of
62
informational protection, by reconducting popular law into legal information can
change this perspective.
We should not forget that in Online Dispute Resolution, consumers are "one-
shooters" while businesses are "repeated players", dealing with a multitude of cases at
any given time. Consumers will often get more involved in the dispute, taking it more
personal, and thus requiring a more transformative solution, while the business is
mostly interested in resolving the dispute as fast and inexpensively as possible [10, p.
151]. This features in consumer disputes sustain that ODR methods and techniques
should be employed first and foremost to avoid consumer complaints in order to
convey informed and clarified decisions and foster negotiation and mediation.
3.3 The average consumer
In the completion of the EU definition of consumer, the premise sets a single
prototypical personification of an “average consumer"[14], which is the benchmark
consumer known in the case-law7 as the reasonably well-informed and reasonably
observant and circumspect consumer, taking into account social, cultural, and
linguistic factors, as interpreted by the ECJ. Nevertheless, the average consumer test
overlooks the real world of individual consumer behavior and sets an overly
demanding standard for consumers, though it responds to the appreciable intent of
offering a useful tool to firms, their consultants, and the judicial authorities in the
assessment of unfair commercial practices[14], dispute resolution (as negotiation and
mediation) and ultimately, the decision making process. In fact, “consumers do not
fall in a consistent unvarying category; choosing the identity of the benchmark
consumer-as-victim is clearly of vital importance to the practical implications of a
regime designed to control commercial practices which will not have a uniform
impact on consumers precisely because consumers themselves do not form a
homogenous group”[15]. For instance, this "average" definition doesn't comply with a
consumer who is distracted or uninformed about the goods or services which are the
subject matter of a commercial practice. Nor does it include those consumers who
naively allow themselves to be convinced by deceptive exaggerations in advertising.
Nor even doesn´t sympathizes with the "hyper justice" notion of consumers. The real
consumer: the hypo-sufficient [16] consumer needs consumer protection through its
legislation (the whole spectrum of enforcement of the different service directives) but
also when facing dispute resolution. It is unfortunate that this salutary mechanism for
promoting a fair and balanced decision between the transacting and disputant parties
has been overlooked in the development of the conflict market, but we assert that law
is still practiced as a reactive discipline.
3.4 Advantages for the stakeholders
The implementation of the legal layer into the technological and operational field,
implies a new completion to ODR: a customizing legal-based system that applies and
7 Cfr. Sentence Gut Springenheide (1998) C-210/96, 1998, C. I-:4567.
63
permeates the market - the locus where disputes arise. Feeding back legal domain
information to ODR providers can be an asset in the conflict resolution market and
will raise the legal standards of ODR. Information is central in our information
society and it is important to find the right balance between information overload and
too little information to make an informed decision. Information about the rights and
the applicable law related to a claim is considered the "meaningful information" that
consumers need. Thus, integrating a legal layer into the traditional workflow may
endow the parties with the legal information that can, if the case, settle better
afterwards in mediation, conciliation, arbitration. By allocating adequate information
according to the case (legal information cover or legal validation regarding the policy
of the companies), will promote access to justice and endow consumer protection and
redress, it will replace the balance between consumers and the company.
In the consumers' perspective, an efficient delivery of self-tailored legal
information service to end-users (by providing domain-specific information), may
improve the awareness of consumers to personally evaluate the outcome of a potential
litigation (self-litigation conduct), to be guided to a non-conflict settlement and to be
assisted in selecting the potential support. It is foreseen to be a way to support the
dispute and its resolution: consumers can determine their legal position (to go ahead
with the claim or perceive that there is no case at all) at an early stage of dispute
(which can discourage unmeritorious complaints). As such, we assume that
consumers may feel entrusted (digital trust in e-society) and aware if the trader is
acting in good-faith when filling a complaining and taking decision. Hence, we posit
that this approach can avoid escalatory versus de-escalatory cycles if not solved in the
earlier stage (and foster ulterior phases of mediation) and potentiates the continuation
of relationship with the trader. Ultimately we can anticipate that providing the legal
cover to the consumer as an early intervention[17] to the conflict, will provide earlier
results on impacts on mediation; foster fewer impasses, produce more concessions
leading to agreements (more willingness to compromise).
These essentials portray other estimable prospects: it may avoid overlapping
jurisdictions between different ADR bodies (according to the EU Regulation of ODR)
and the burden of proof from the rogue operator is mitigated.
In-House Customer Care or Internal Complaint Systems may incorporate this legal
cover also in their mass customization strategy, and not only ODR providers. For the
purpose of this paper we will only be concerned with the provision of the legal cover;
undoubtedly, principles such as impartiality and independence are allocated, but we
won't pursue these matters at this stage. It is a plausible deduction that such a legal
incorporation may neutralize and calibrate the pronouncement offered by the internal
business policies, which in turn, might improve the market behaviour and will
maintain the legal compliance for every stakeholder. This leads us to the
consideration that the envisioned legal information system can also reward the
economic operators, such as reputable and competitive businesses that render
consumer services and goods. As effective consumer policy, recharged with this legal
cover, supports the proper functioning of the single market and drives out rogue
operators, due to clear legal rules and better coordinated enforcement addressed by
the companies. We assert that the market aims good practices to held the consumers
allegiance, decrease the number of complaints (reputation and operational costs),
which enables systemic accuracy. We contend that this configuration (customer
64
centricity) can be seen as a quick response to the sectorial market problems which can
incorporate preventive measures. The provision of ODR information by e-vendors can
facilitate institutional based structural assurances, promote trust in e-vendors, and
ultimately, advance (e-)commerce; business needs to conduct its business in
compliance with regulatory guidelines (regulatory compliance).
4 Conclusions
In a prospective assertion, we aim to seek if this furnishing of one-to-one legal
relevant information approach can become a one-to-many legal information decision-
making tool, or Law by Design ODR. We are cognizant that the inherent nature of the
ODR concept is descriptively and theoretically incomplete in order to attain an
informed and clarified decision and we argue that ODR has been developing without
its own cogent theoretical base which resides in providing legal information to the
parties, promote access to justice and endow consumer protection (empowerment) and
redress. The average consumer should have general but meaningful legal information
about the rights that the law ascribes and therefore it would dimension is legal
position at an early stage of a dispute (and avoid hyper law unreal conceptions). Any
ODR provider or consumer business sector can evade from this transformation that
will change the way to render consumer products and services and mechanisms
relating to consumers. The use of industrial, commercial opportunities and service
provision related to this evolutionary process represents one of the major challenges
for every country's economy.
We acknowledge that in the present stage of research, it’s intricate to provide
something more than simplistic and naive predictions regarding the inclusion of a
legal layer into ODR, but only modest views for the revision of EU policies and
regulations. The particular display of configuring the legal layer into ODR needs
more empirical research to be fully understood. Models and tests are required to
contrast or confirm the envisioned validity in a more general level, which is what we
intend to present in the forthcoming research. Nevertheless, this new advent is a
promising line of research for the future of ODR.
Acknowledgments
(i) CROWDSOURCING-DER2012-39492-C02-01, DGCYT (ii) IPT-2012-0968-
Abstract. In this work we propose a methodology based on the pro-cess mining approach to discover coordinated patterns of behavior ina customer service request handling process. We analyze a real datasetcontaining events from an incident and a problem management informa-tion system, and deliver results that eventually can raise the capacity ofthe company to manage the process. The core of the work comprises thelooking for coordinated patterns among involved actors, a discrepancyanalysis and a robust classification technique.
1 Introduction
Customer service request handling is a reactive business process that is triggeredwhen a customer submits a service request to the help desk of a company. Ithas been identified as a core function of modern organizations, due to its tightrelationship with their marketing function [1]. Establishing a service responsecapability includes a number of actions [2], like creating a service response policy,setting guidelines for communicating with outside parties regarding customerrequests, selecting a team structure and staffing model, establishing relationshipsbetween the help desk team and other groups, both internal (e.g., technicalsupport teams) and external, determining what services the incident responseteam should provide and staffing and training the incident response team.
There are multiple factors that affect the complexity of the process, such asthe number of support teams involved, the organizational hierarchy, the numberof products / product categories being served, special business rules etc. Dueto the complexity of this process, special IT systems are often employed. Acommon practice reference model that introduces standard best practices for ITservice management is the Information Technology Infrastructure Library [3].Nevertheless, the processes described in ITIL are deliberately non-prescriptive.In practice, the actual behavior can significantly vary, not just according to theorganizational implementation but because of a plethora of other implementationparameters as well (e.g. the resource performing the activities). Process mining
78
[4] is a promising approach to expose the real behavior of the process from ITsystems’ logs.
The process mining approach has recently attracted researchers for the ser-vice request management process analysis [5]. Since the respective process takesplace in a highly flexible environment, multiple techniques are typically combinedto deliver a solution. In [6], authors propose a combination of trace clustering andtext mining to enhance process discovery techniques with the purpose of retriev-ing more useful insights from process data, while in [7] process mining is used toassess whether a business process is implemented according to ITIL guidelines.In this work we propose a methodology based on the process mining approachto discover coordinated patterns of behavior in a customer service request han-dling process. The process perspective is a necessary dimension of the proposedmethodology, since ordinary data mining techniques would fail to capture thesequencing of the related events. Eventually, the results of this methodology canbe used to raise the capability of the company to handle service requests by i)
establishing more robust response policies and procedures and ii) aid the teams’structure decision, including outsourcing considerations. The basic steps of theproposed methodology is to arrange data with a process perspective (yet overmultiple views), to draw the pertinent social networks, to perform a discrepancyanalysis for the observed behavioral variation, and to apply a robust classifi-cation technique to explain the factors affecting the behavior and to deliver apredictive model for undesired behaviors as well.
2 Case Study
2.1 Description of the Case and the Dataset
Volvo IT Belgium provided a dataset3 from its information system that sup-ports the incidents management for the 2013 edition of the BPI challenge. Thedataset contains events from an incident and a problem management informa-tion system. The primary goal of the incident management process is restoring acustomer’s normal service operation as quickly as possible when incidents ariseensuring that the best possible levels of service quality and availability are main-tained. The dataset contains 65533 timestamped events related to the incidentmanagement process. Each record contains a number of variables such as theunique ticket number of the service request, the impact of the case (a measureof the business criticality of the incident), the case status (queued, accepted,completed or closed) and sub-status (assigned, awaiting assignment, cancelled,closed, in progress, wait or unmatched), the business area of the user reportingthe incident, the technology-wise division of the organization, the support teamthat will try to respond to the service request and the location that takes theownership of the support team.
The process is roughly the following: A customer submits a service request.The process reactively triggers a “first line” response, in other words, the Service3 doi:10.4121/500573e6-accc-4b0c-9576-aa5468b10cee
79
Desk or the Expert Help Desk tries to resolve the issue. When this is not possible,the case should be escalated to Second Line and/or Third Line teams. The quickresolution of the issue is defined within Service Level Agreement of the company.
2.2 Description of Patterns
There is an announced policy of the company that most of the incidents needto be resolved by the first line support teams (mainly service desks). This iscalled “Push to Front” tactic and it is mostly a matter of efficiency. Pushing toFront, allows the 2nd and 3rd line support teams to focus on their special, moredemanding tasks (usually not related to customer service support). Unless thistactic is consistently applied a lot of ’easy’, big volume cases will end up in thoselines. The definition of push to front in this paper refers to the case when the 1stline support teams can resolve the service request without interference of a 2ndor 3rd line support team. As such, pushing to front is an important coordinatedpattern that may arise during the process execution.
Besides pushing work towards the front, any team upon receiving a taskcan either try to resolve the issue by itself or hand over the task to anotherteam (of the same or of another line). Handover of work is an ordinary action,however if this is excessively used it may have an inadmissible effect on processefficiency. Namely, extensive handover may reveal dodging or deferring behavior.The opposite (extensive takeover) may also reveal some undesired elements likelack of collaboration mentality of lack of knowledge transferring. Therefore, theinter-team handovers may also include coordinated patterns of (social) behavior.
A special case of handover of work is when support teams send the samecase to each other again and again. We shall call this undesirable situation “PingPong”. The definition of “Ping Pong” that we use in this work is that a PingPong occurs when a support team is revisited during the case, after it has passedthe work to another team. However, we count a single Ping Pong per supportteam, even if this is revisited multiple times. This definition allows for a numericrepresentation of the Ping Pong behavior (a case may have multiple Ping Pongs,yet attributed to different teams). Ping Pong is also an undesirable coordinatedbehavior that may affect significantly the process performance.
3 Looking for Patterns
The dataset in its original format contains a list of timestamped events. It isquite hard to elicit patterns of behavior from within this format, since the se-quencing of events and their aggregation per case are not exploited. Therefore,the leading step is to reach a process perspective for the dataset. In particular,the methodology unfolds in the following stages:
1. Commit data to process format(a) Control flow-wise (trajectories of status / substatus changes)(b) Social-wise (transactions among support teams or lines)
80
2. Discover the process map and check the flows.3. Get the social networks for the social-wise process view and analyze social
behavioral patterns4. Perform a discrepancy analysis to analyze how the state sequences are related
to one or more covariates5. Apply a robust classification technique for both explanatory and predictive
purposes.
3.1 Control Flow-wise Patterns
Control flow refers to how the status / substatus of a case changes during itslifecycle. There are 13 distinct alternatives for the status / substatus of a case(presented in Table 1). Although the set of activities (status changes) is small, wenoticed that there are 2278 different variants of the same process (for a datasetof 7554 cases). Out these 2278 variants, just 88 have a frequency higher than100, while the dominant variant represents just a 23% of total cases, a fact thatconfirms that the process environment is highly flexible.
Since there is no strict sequencing rule, discovering an exact behavior wouldnot reflect the real situation, and would probably be of little importance. Ingeneral terms, cases go from some Accepted substatus to either a Completed
substatus or to Queued. In the latter option, the case returns to an Accepted
substatus. A process map is depicted in Fig. 1, where some labels for performancemeasures are printed. In particular, the heavier the weight of an edge, the worstits performance. The illustration has been created using Disco® [8] and it isa direct way to visualize the process’ bottlenecks. The largest delays happenbetween Completed-Resolve and Completed-Closed (7.2 days), Accepted-WaitUser and Completed-Resolve (5.3 days) and Accepted-Wait Implementation andCompleted-Resolved (4.7 days). It is also interesting to regard that there is ameantime of 4.3 days between the Completed-Closed status and the Accepted-In Progress status, a fact that indicates that some cases are closed only to bere-inititiated after 4-5 days.
Status SubstatusAccepted Assigned, In Progress, Wait, Wait-User, Wait-Customer,
Completed In Call, Resolved, Closed, CancelledUnmatched Unmatched
Table 1: Status and Substatus alternatives
81
59.9 secs
8.5 hrs
2.9 mins
5.8 mins
32.1 secs
4.9 mins
45.5 hrs
89.9 secs
5.5 mins
5 mins
36.1 hrs
14.4 mins
7.2 d
60 secs
4 mins
2.2 hrs
23.1 hrs
23.6 hrs
2.1 hrs
3.6 hrs
68.8 hrs
14.1 hrs
106.2 mins
12.7 hrs
117.3 mins
4.3 d
24.4 hrs
67.3 hrs
1.1 secs
11.3 hrs
50.6 mins
73 mins
39.8 hrs
22.1 hrs
4.7 d
12.4 hrs
5.3 d
60.7 hrs
8.1 hrs
14.9 hrs
31.8 hrs
3.5 d
Accepted\\In Progressinstant
Queued\\Awaiting Assignmentinstant
Completed\\Resolvedinstant
Accepted\\Assignedinstant
Completed\\Closedinstant
Accepted\\Wait - Userinstant
Accepted\\Wait - Implementationinstant
Accepted\\Waitinstant
Accepted\\Wait - Vendorinstant
Completed\\In Callinstant
Accepted\\Wait - Customerinstant
Unmatched\\Unmatchedinstant
Completed\\Cancelledinstant
Fig. 1: Process Performance Map
3.2 Social-wise Patterns
First of all, we need to evaluate the “Ping Pong” and the “Push to Front” patternsfor each case, based on the descriptions of section 2.2. To this end, the followingR [9] script was developed.
#---Evaluate Ping Pong behavior---
PingPong<-c();
#...Loop over traces....(traces contain Support Teams as activities)
Rle<-rle(traceRow)
#Does the case Ping Pong?
PingPong<-c(PingPong,sum(duplicated(Rle$values)))
#---Evaluate Push to Front behavior---
PushtoFront<-c();
#...Loop over traces....(traces contain Lines as activities)
As expected, both behaviors have a negative effect on the case duration.Figure 2 illustrates these effects for the mainstream cases (outliers, i.e. casesthat last more than 50000 minutes are removed). While for Push to Front a
82
binary variable is sufficient, for Ping Pong a numerical scale is preferred. Anillustrative argument for this choice is presented in Fig. 3. In this point we shallremind that a Ping Pong is assigned per team, i.e., even if a pair of teamshandover their work multiple times during a case, that will still count for two(one for each team that is revisited).
0 1
010
000
2000
030
000
4000
050
000
Push to Front
Dur
atio
n in
min
utes
(a) Duration of cases that Push toFront (1) or not (0)
0
20000
40000
60000
0 5 10 15 20Ping Pongs during case
Dur
atio
n in
min
utes
(b) Duration of cases over the num-ber of Ping Pongs they contain
Fig. 2: The effect on case duration
4 Analyzing the Relevance of Factors
4.1 Discrepancy Analysis
In a case evolving framework, discrepancy measures the between-case variabil-ity of the case lifecycle trajectories. Therefore, higher discrepancy, for example,would reflect a greater level of uncertainty about the path followed by the cases.The discrepancy of sequences will be defined from their pairwise dissimilarities.Perhaps the most popular dissimilarity measure used for sequence analysis is thegeneralized Levenshtein distance. It is defined as the lowest cost of transform-ing one sequence into the other by means of state insertions–deletions and statesubstitutions.
In this section, we integrate the sequence discrepancy analysis with the re-gression tree method introduced in [10]. The intuition of this regression treemethod is the following: Start with all cases grouped in an initial node. Then,
83
4
1
1
1
D26
V51 2nd2
(a) Single Ping Pong
7
1
2
1
1
1
1
1
11
D59
D44
N26 2nd2
M22 2nd2
(b) Double Ping Pong
33
1 1
30
2 7
4
1
3
2
163
1
10
1
1
3
D543
N14 2nd40
D48
A172
J6 2nd10
M19 2nd13
(c) Multiple Ping Pong
Fig. 3: A numerical scale for the Ping Pong behavior is preferable
recursively partition each node using values of another variable. At each node,the variable and the split are chosen in such a way that the resulting child nodesdiffer as much as possible from one another or have, more or less equivalently,lowest within-group discrepancy. The process is repeated on each new node untila certain stopping criterion is reached. For the implementation of this method,we used the TraMineR [11] package of R.
As illustrated in Fig. 4, both social patterns (Push to Front and Ping Pong)result in clustered behaviors. In particular, the first split is among cases thatPing Pong or not (0 and greater than 0). Cases of the later category (no PingPong) last significantly less and visit a lot less frequently the “Queued ” status.At the second level, leftmost the split is among cases that Push to Front (>0)and not (0). We regard that cases that Push to Front reach a “Completed ” statusearlier, and that their average duration is smaller. The rightmost split is again
84
based on the Ping Pong behavior, but this time the critical value is two. Casesthat Ping Pong more than twice spend an important percentage of their lifetimein a “Queued ” status, and are naturally prolonged.
Fig. 4: Discrepancy Analysis for cases lifecycle trajectories
4.2 Binary Classification
Support Vector Machines (SVM) is one of the most well-known supervised clas-sification algorithms. It was originally proposed by Vapnik [12]. The intuitionof SVM is that the goal is to get an hyperplane that optimally distinguishestwo classes of data. The major advantage of SVM is its minimal generalizationerror (at least in the case of binary classification - two classes of data) reachedcomputationally efficiently. The SVM is one of the most applied algorithm ofrobust optimization in data mining. For a thorough exploration of theoreticaland practical issues, we cite the classic work [13] and the works of Trafalis et al.[14] and Xu et al. [15]. We used 10-fold cross validation on a training data setof case-label pairs (xi, yi) , i = 1, . . . , 7, where xi 2 <nand y 2 1, 17. Number7 indicate that seven factors (Country, Impact, Line, Function, Organization,number of Events and Push to Front) were examined to predict the Ping Pong
85
behavior. We used a linear kernel, as implemented by the LIBSVM library [16].The overall accuracy of the model (for all folds, both classes) was 89.48%, butwhat is more important is to try to explain the factors that appear to be themost critical. According to [17], in linear SVMs, the use of w2
i can be justified asa feature ranking criterion. Therefore, the following interesting points emerged:
– We identified that there are 3 countries (China, Sweden and U.S.A.) whosesupport teams are more prone to Ping Pong.
– The impact of cases does not appear to have an effect– Ping Pong appears the most when cases are initiated in the front line.– There are some particular Function Divisions and Organizations that are
more prone to Ping Pong behavior– Pushing to Front seems to have a negative impact– As expected, the number of events per case is the most critical predictor of
Ping Pong behavior
Overall, this paper applied a process mining approach to explore a real case studywith the goal to provide insights to this implicit business process and to raise thecapability of the company to handle service requests. The results presented in theprevious sections allow the company to reach evidence-based response policies. Inaddition, since the identified issues are localized (certain support teams, certaindivisions etc.), the evidence provided could aid company’s decision about theteams’ structure.
Acknowledgement
This research has been co-financed by the European Union (European SocialFund) and Greek national funds through the Operational Program "Educationand Lifelong Learning"
References
1. Alan Wilson, Valarie A Zeithaml, Mary Jo Bitner, and Dwayne D Gremler. Servicesmarketing: Integrating customer focus across the firm. Number 2nd Eu. McGrawHill, 2012.
2. Tim Grance, Karen Kent, and Brian Kim. Computer security incident handlingguide. NIST Special Publication, pages 800–61, 2004.
3. A. Hochstein, R. Zarnekow, and W. Brenner. Itil as common practice referencemodel for it service management: formal assessment and implications for practice.In e-Technology, e-Commerce and e-Service, 2005. EEE ’05. Proceedings. The 2005IEEE International Conference on, pages 704–710, March 2005.
4. Wil Aalst, Arya Adriansyah, Ana Karla Alves Medeiros, Franco Arcieri, ThomasBaier, Tobias Blickle, Jagadeesh Chandra Bose, Peter Brand, Ronald Brandt-jen, Joos Buijs, Andrea Burattin, Josep Carmona, Malu Castellanos, Jan Claes,Jonathan Cook, Nicola Costantini, Francisco Curbera, Ernesto Damiani, Massi-miliano Leoni, Pavlos Delias, Boudewijn F. Dongen, Marlon Dumas, Schahram
86
Dustdar, Dirk Fahland, Diogo R. Ferreira, Walid Gaaloul, Frank Geffen, SukritiGoel, Christian Günther, Antonella Guzzo, Paul Harmon, Arthur Hofstede, JohnHoogland, Jon Espen Ingvaldsen, Koki Kato, Rudolf Kuhn, Akhil Kumar, Mar-cello Rosa, Fabrizio Maggi, Donato Malerba, Ronny S. Mans, Alberto Manuel,Martin McCreesh, Paola Mello, Jan Mendling, Marco Montali, Hamid R. Motahari-Nezhad, Michael Muehlen, Jorge Munoz-Gama, Luigi Pontieri, Joel Ribeiro, AnneRozinat, Hugo Seguel Pérez, Ricardo Seguel Pérez, Marcos Sepúlveda, Jim Sinur,Pnina Soffer, Minseok Song, Alessandro Sperduti, Giovanni Stilo, Casper Stoel,Keith Swenson, Maurizio Talamo, Wei Tan, Chris Turner, Jan Vanthienen, GeorgeVarvaressos, Eric Verbeek, Marc Verdonk, Roberto Vigo, Jianmin Wang, BarbaraWeber, Matthias Weidlich, Ton Weijters, Lijie Wen, Michael Westergaard, and MoeWynn. Process mining manifesto. In Wil Aalst, John Mylopoulos, Michael Rose-mann, Michael J. Shaw, Clemens Szyperski, Florian Daniel, Kamel Barkaoui, andSchahram Dustdar, editors, Business Process Management Workshops, volume 99,pages 169–194. Springer Berlin Heidelberg, Berlin, Heidelberg, 2012.
5. Business process intelligence challenge 2013. In Boudewijn van Dongen, BarbaraWeber, Diogo Ferreira, and Jochen De Weerdt, editors, Proceedings of the 3rdBusiness Process Intelligence Challenge, volume 1052. CEUR.
6. J. De Weerdt, S.K.L.M. vanden Broucke, J. Vanthienen, and B. Baesens. Leverag-ing process discovery with trace clustering and text mining for intelligent analysisof incident management processes. In Evolutionary Computation (CEC), 2012IEEE Congress on, pages 1–8, June 2012.
7. Diogo R. Ferreira and Miguel Mira da Silva. Using process mining for ITIL as-sessment: a case study with incident management. Bournemouth University, April2008.
8. Fluxicon. Disco. Fluxicon, 2012.9. R Core Team. R: A Language and Environment for Statistical Computing. R
Foundation for Statistical Computing, Vienna, Austria, 2013.10. Matthias Studer, Gilbert Ritschard, Alexis Gabadinho, and Nicolas S. Müller. Dis-
crepancy analysis of state sequences. Sociological Methods and Research, 40(3):471–510, 2011.
11. Alexis Gabadinho, Gilbert Ritschard, Nicolas S Müller, and Matthias Studer. An-alyzing and visualizing state sequences in r with traminer. Journal of StatisticalSoftware, 40(4):1–37, 4 2011.
12. Vladimir Naoumovitch Vapnik. The nature of statistical learning theory. Springer.13. ChristopherJ.C. Burges. A tutorial on support vector machines for pattern recog-
nition. Data Mining and Knowledge Discovery, 2(2):121–167, 1998.14. Theodore B. Trafalis and Robin C. Gilbert. Robust classification and regression us-
ing support vector machines. European Journal of Operational Research, 173(3):893– 909, 2006.
15. Huan Xu, Constantine Caramanis, and Shie Mannor. Robustness and regulariza-tion of support vector machines. J. Mach. Learn. Res., 10:1485–1510, December2009.
16. Chih-Chung Chang and Chih-Jen Lin. LIBSVM: A library for support vectormachines. ACM Transactions on Intelligent Systems and Technology, 2:27:1–27:27,2011. Software available at http://www.csie.ntu.edu.tw/ cjlin/libsvm.
17. Isabelle Guyon, Jason Weston, Stephen Barnhill, and Vladimir Vapnik. Geneselection for cancer classification using support vector machines. Machine Learning,46(1-3):389–422, 2002.
87
Fostering Priority Awareness to Improve Joint
Outcomes in Computer-Supported Bilateral Multi-Issue
Abstract. This paper presents a proposal to incorporate the personal styles of negotiators into a Negotiation Support System. The Myers-Briggs Type Indicator (MBTI) model was implanted in an e-negotiation system to capture some personal styles of negotiators, starting from the hypothesis that some prior knowledge about the negotiator helps to improve the negotiation in terms of the satisfaction and communication of the actor involved and the time to completion of the negotiation. Experiments are being conducted on a developed platform that incorporates the MBTI to accept or reject this hypothesis.
Keywords: Negotiation support system, e-negotiation, Myers-Briggs Type Indicators, personal style.
1 Introduction
This paper presents the initial results of a research study in progress. From the literature review it is observed that in many situations whenever a negotiating process is absent from face-to-face negotiating supported by a Negotiation Support System (NSS), the process is more time consuming and the results sought by the negotiators are not achieved, thus generating dissatisfaction with the negotiation. This indicates that optimizing the parties’ use of time and satisfaction are key factors for a good negotiation [1].
The literature suggests that incorporating communication strategies into the process can facilitate understanding the information presented by each negotiator thereby helping to improve the interaction between those involved [2]. Lack of knowledge of other stakeholders also hinders communication and negotiation. [3].
Drawing on the literature, this paper starts from the premise that one way to minimize the difficulties reported in a negotiation process supported by a NSS is to provide some knowledge about the personality characteristics of the negotiators.
Thus, a model to capture the style of an individual personality was chosen and was incorporated into an NSS developed for this purpose. In addition to this functionality, the proposed NSS evaluates, at the end of negotiation, the quality of communication, the satisfaction of those involved and the duration of the negotiation, thus enabling it to be inferred that if one party knows the personality traits of the other party in a negotiation process, this contributes to a good negotiation.
96
2 Literature Review
The first Web-based NSS found in the literature was INSPIRE which has been tested and used in teaching and training in several countries [4]. Since then, it has been common to find different NSS (Negotiation Support System) [5] [6] [7] and also the development of studies on the effects and influences of these systems on the negotiation process [8] [9] [10].
Kersten and Lai [10] present a historical overview of software used in supporting Negotiations and propose a distinction between two generations of negotiation systems: NSS designed for a stand-alone computer or a local-area network and ENSS in which systems use internet technologies. They discussed these categories from three perspectives: real-life applications; systems used in business, research and training; and research results. As an example of empirical studies using NSS, Szpakowicz and Sokolova [9] explored how influence strategies are reflected in the language of e-Negotiations systems. The results show that language signals influence strategies and tactics ; the authors give a reliable prediction of the negotiation outcome based on the first half of the negotiation.
The web-based negotiation support system (NSS) Inspire also has been used in experimental Negotiations by over 2000 negotiators worldwide. As a result of a survey conducted among users, it was verified that users' assessment on complex and analytical features of web-based NSS are evaluated differently from communication features between various components of such systems. Assessments along these dimensions are strongly influenced by users' national culture [8].
Zandi and Tavana [6] propose a fuzzy electronic negotiation (e-negotiation) support system based on multicriteria cooperative game theory. The Internet is used to facilitate the e-negotiation process and to minimize the response time in the decision-making process. The objective of this study was to integrate multicriteria fuzzy cooperative game theory and Internet technologies within a collaborative e-negotiation support system .
In this research, in a similar way to other studies, we seek to investigate how knowledge of negotiators’ personality traits can influence the outcome of the negotiation in terms of improve satisfaction, communication and time.
Many models can be found in the literature to identify personality traits [11] [12] [13] [14] [15]. However, to capture the personality traits of the individual to be incorporated into an NSS what is needed is a model that can be implemented quickly and which at the same time is robust and has already been extensively tested. From these assumptions, the model chosen for this study is the Myers-Briggs Type Indicator (MBTI) [11] [12]. MBTIs identify an individual’s personality styles by combining four dimensions obtained from responses to a questionnaire. The dimensions are extroversion and introversion; Sensing and Intuition. The intensity in each dimension represents the spectrum of an individual’s personality in which there are sixteen combinations in total.
The MBTI questionnaire comprises 28 forced-choice questions i.e. the respondent has to choose only one of two possible answers to each question. After the questionnaire has been fully completed, the individual traits of personality are assigned to a category defined by the four dimensions considered in the model.
97
Other MBTI, buthat maketo how th
Drawinhypothes
H1: knsupportedthe percep
H2: knsupportedperceptio
H3: knsupported
Althouobjective
Researc
The putraits of oand time
To accbased tecwith (somhave prio
Fig 1 s
Fi In the
graduate negotiatio
models [13] ut in most ofe the negotiat
he decision mang on the litees: nowledge of pd by a web NSption of the nnowledge of pd by a web Non of the negotnowledge of pd by a web NSugh the MBTs proposed fo
ch Method
urpose of this other negotiatneeded to con
complish this,chnology thatme of the) peor knowledge oshows the rese
ig. 1. Research
e current phastudents is beon using the N
[14] [15] fouf them, the qution procedureaker came to herature cited a
personality traSS improves negotiator.
personality traNSS improves
tiator. personality traSS reduces theTI has also be
r this study sa
research is totors influencenduct the nego, we developet incorporatesersonality traiof each other.earch model to
h model
ase of the reeing conductedNSS.
und in the literuestionnaires ce difficult andhis/her decisioabove, this art
aits of the othenegotiator sati
aits of the othecommunicati
aits of the othee time to compeen criticized atisfactorily.
o evaluate whes the level ofotiation. ed the NegPlac the MBTI [
its of those in o be explored
esearch, an ed in which the
rature have thcontain a largd do not incluon. ticle sets out
er negotiator iisfaction at th
er negotiator iion in the neg
er negotiator iplete the nego
[16] in the
ether or not knf satisfaction,
ce (www.negp11] model annvolved, thus
.
experiment wey will be invo
he same purpoge number of ude a dimensi
it to test the
in a negotiatiohe end of nego
in a negotiatiogotiating proce
in a negotiatiootiation. literature, it s
nowledge of pcommunicatio
place.com), a nd provides n
enabling the
with undergradolved with a p
ose as the f questions on related
following
on process otiation, in
on process ess, in the
on process
serves the
personality on quality
NSS web negotiators e actors to
duate and predefined
98
Some students, randomly selected, use the NegPlace system with information about personality traits of the other negotiator while other students do not.
The constructs of satisfaction and communication will be assessed by a constructed attribute from a questionnaire to be answered at the end of the negotiation. The duration of negotiation will be measured directly by the NegPlace system.
Initially the system only allows negotiations in pairs, although any one negotiator can participate in multiple negotiations.
A new version of the system is being developed in which negotiators can access the system via the internet, register and start negotiations, and invite other actors to negotiate or enter into negotiations of interest already begun. The idea is to provide free access to the system to any person anywhere in the world.
The system will randomly choose a user who will be provided with the functionality of personality traits of the other negotiator.
The NegPlace environment
The NegPlace is a web NSS which has the following features: it registers the negotiator, the participation in a negotiation, offers and counter-offers in a negotiation process, and the access given to information on personality traits of negotiator.
On registering as a new system user, he/she must answer a questionnaire based on the MBTI model that will provide information about the personality of the other negotiator. Some personality traits that may contribute to the negotiation process will be captured and exhibited on the system.
Such information may help negotiators to define the negotiation strategies to be adopted and also the resources to be selected, such as: videos, texts, in order to submit offers and counter offers to improve the communication process.
At the end of the negotiation process, the negotiators should fill out another form that will assess the constructs presented in the research model. This enables the hypotheses proposed to be tested.
The next steps are to conclude the first controlled experiment with students and analyze the data collected. Thereafter, a new version of the system will be drawn up and the data collected will be analyzed using the revised NSS in experimental negotiations.
Conclusion
This paper proposes an exploratory study to evaluate the influences of one negotiator having knowledge of some personality traits of another negotiator on the results of a negotiation supported by a Web NSS.
NegPlace, the system that embeds the MBTI model which captures the traits of personality was developed. A theoretical model was put forward which will test three hypotheses. Initially, a controlled experiment is being conducted using undergraduate and graduate students. In parallel a new version of NegPlace is being constructed that will enable anyone anywhere in the world access this system and register on it. The
99
objective is to ascertain what effect the knowledge provided about unknown actors, which negotiators receive about each other, has on a negotiation process, supported by a web negotiation system.
References
1. Harinck, F., Dreu, C.K.W.: Take a break! or not? The impact of mindsets during breaks on negotiation processes and outcomes. Journal of Experimental Social Psychology. 44, 397--404. (2008). 2. Gettinger, J., Koeszegi, S.T., Schoop, M.: Shall we dance? — The effect of information presentations on negotiation processes and outcomes. Decision Support Systems. 53, 161–174 (2012). 3. Kim, J., Lee, A., Ryu, H.: Personality and its effects on learning performance: Design guidelines for an adaptive e-learning system based on a user model. International Journal of Industrial Ergonomics. 1-12 (2013). 4. Kersten, G.E., Noronha, J.S.: WWW-based negotiation support: design, implementation, and use. Decision Support Systems. 25, 135–154 (1999). 5. Brink, C.v.d., Zaadnoordijk, W. J., Grift, B. v.d. Ruiter, P.C., Griffioen, J.: Using a groundwater quality negotiation support system to change land-use management near a drinking-water abstraction in the Netherlands. Journal of Hydrology 350, 339– 356 (2008). 6. Zandi, F. and Tavan, M.: A fuzzy e-negotiation support system for inter-firm collaborative product development. International Journal of Computer Integrated Manufacturing. 25, 8, 671–688 (2012). 7.Madani, K,. Rouhani, O.M., Mirchi, A. Gholizadeh, S.. A negotiation support system for resolving an international trans-boundary natural resource conflict. Environmental Modelling & Software 51 240-249 (2014). 8. Vetschera, R., Kersten, G.E., Köszegi, S.: User Assessment of Internet-Based Negotiation Support Systems: An Exploratory Study. InterNeg Research Papers INR 04/03. 9. Sokolova, M, Szpakowicz, S.: Strategies and language trends in learning success and failure of negotiation. Group Decis Negot 16:469–484 (2007). 10. Kersten, G.E., Lai, H.:. Negotiation Support and E-negotiation Systems: An Overview. Group Decis Negot 16:553–586. (2007). 11. Myers, I.B., McCaulley, M.H.: Manual: A guide to the development and use of the Myers–Briggs Type Indicator. Consulting Psychologists Press. Palo Alto. CA USA (1988). 12. Myers, I. B.: The Myers Briggs Type Indicator. Consulting Psychologists Press. Palo Alto. CA.USA (1987). 13. Kolb, D.A.: Learning style inventory: technical manual. MecBer. Boston Mass. USA (1985). 14.Felder, R.M., Silverman, L.K.: Learning and teaching styles in engineering education. Engineering Education. 7, 674-681 (1988). 15. Pelley, J.: The success types learning style type indicator. Texas Tech Univ. Extended Learning (1997). 16. Saggino, A., Kline, P.: The Location of the Myers-Briggs Type Indicator in Personality Factor Space. Personality Individual Difference. 21, 591-597 (1996).
100
Agenda Negotiations in Electronic Negotiation Support
Systems– Complexity versus Flexibility
Marc Fernandes1, Johannes Gettinger1, Philipp Melzer1, Mareike Schoop1
1 University of Hohenheim,
Information Systems I, Institute for Interorganisational Management & Performance
6. Campbell, D.J.: Task Complexity: A Review and Analysis. Academy of Management
Review 13, 40–52 (1988)
7. Adair, W.L., Brett, J.M.: The Negotiation Dance: Time, Culture, and Behavioral Sequences
in Negotiation. Organization Science 16, 33–51 (2005)
8. Raiffa, H., Richardson, J., Metcalfe, D.: Negotiation analysis. The science and art of
collaborative decision making Belknap, Cambridge, Mass, London (2007)
9. Pruitt, D.G., Carnevale, P.J.: Negotiation in social conflict Brooks/Cole Pub. Co., Pacific
Grove, Calif (1993)
10. Goodhue, D.L., Thompson, R.L.: Task-Technology Fit and Individual Performance. MIS
Quarterly 19, 213 (1995)
11. Zigurs, I., Buckland, B.K.: A Theory of Task/Technology Fit and Group Support Systems
Effectiveness. MIS Quarterly 22, 313 (1998)
12. Zigurs, I., Buckland, B.K., Connolly, J.R., Wilson, E.V.: A Test of Task-technology Fit
Theory for Group Support Systems. SIGMIS Database 30, 34–50 (1999)
13. Dishaw, M.T., Strong, D.M.: Extending the technology acceptance model with task–
technology fit constructs. Information & Management 36, 9–21 (1999)
14. Bailey, J.E., Pearson, S.W.: Development of a Tool for Measuring and Analyzing Computer
User Satisfaction. Management Science 29, 530–545 (1983)
15. Davis, F.D.: Perceived Usefulness, Perceived Ease of Use, and User Acceptance of
Information Technology. MIS Quarterly 13, p 319-340 (1989)
16. Byström, K., Järvelin, K.: Task Complexity Affects Information Seeking and Use. Inf.
Process. Manage. 31, 191–213 (1995)
17. Schoop, M.: Support of Complex Electronic Negotiations. In: Kilgour, D.M., Eden, C. (eds.)
Handbook of Group Decision and Negotiation, 4, pp. 409–423. Springer Netherlands (2010)
18.Schoop, M., Jertila, A., List, T.: Negoisst: a negotiation support system for electronic
business-to-business negotiations in e-commerce. Data & Knowledge Engineering 47, 371–
401 (2003)
19. Venkatesh, V.: Determinants of Perceived Ease of Use: Integrating Control, Intrinsic
Motivation, and Emotion into the Technology Acceptance Model. Information Systems
Research 11, 342–365 (2000)
20. Turel, O., Yuan, Y., Connelly, C.E.: In Justice We Trust: Predicting User Acceptance of E-
Customer Services. Journal of Management Information Systems 24, 123–151 (2008)
106
Trust and Understanding in Face-to-Face and Synchronous Online Negotiations
Yvonne van der Toorn1, Per van der Wijst1, Debby Damen1 and Marije van Amelsvoort1
1 Department of Communication and Information Sciences Tilburg University,
Postbus 90153, 5000 LE Tilburg, the Netherlands Abstract. This study investigates to what extent the synchronous character of chat communication overcomes the problems in creating mutual understanding and trust between conflicting parties. An experimental study was conducted in which participants negotiated with a confederate in either a face-to-face or online setting. The results show that negotiators feel equally understood and trusted by the other party in both conditions. However, their own ideas about understanding and trusting the other party are higher after a FtF negotiation than after an online negotiation. Keywords: Negotiation, Synchronicity, Online Face-to-Face, Trust, Understanding
1 Introduction
In negotiations two essential factors for a mutually acceptable resolution are understanding and trust [1,2]. The sources of conflict are mostly misunderstandings or failures of communication, rather than fundamental differences of interest [2]. In addition, trust is a key factor for negotiators in their decision to share information [3]. Without trust, individuals are more inclined towards competitive behavior [4, 5]. Trust is generally known to be a prerequisite to cooperative behavior and information sharing [6,7,8] and ultimately to a mutually beneficial outcome.
The upcoming of the Internet and digital communication have increased the popularity of online communication for all kind of purposes, including negotiations. Different studies have shown that feelings of mutual understanding and trust suffer from these online developments [7,8,9]. The relative anonymity and safety of the online environment give easily rise to flaming and other negative forms of communication [10]. The lack of social cues such as facial expressions, gestures, posture, voice tones and eye contact in online communication can negatively influence the feelings of trust since people heavily rely on these indicators when assessing another’s sincerity [11]. When non-verbal information is unavailable, negotiators tend to engage in bluffs, exaggerations and lies [12] which in turn violate feelings of trust for both parties. Studies of online negotiations confirm the greater challenges for rapport building in e-negotiations in comparison to face-to-face (FtF) negotiations [8, 13]. The study by Thompson and Nadler [14] demonstrated that negotiations by e-mail suffered from different biases that hampered successful rapport building. Like ordinary e-mail communication, e-mail negotiations are prone to a greater risk of burned bridges, because of the emotions that stay visible in the message. Other biases that Thompson and Nadler studied were the squeaky wheel bias, the temporal synchrony bias and the attribution errors that occurred more often in asynchronous e-mail negotiations. The question arises to what extent the greater challenges for relationship building in online negotiations are related to the synchronous character of the medium. Whereas negative emotions in FtF communication can be handled directly and even kept within limits, the emotions expressed in an e-mail, remain unchanged, and possibly even gain in strength over time. Negotiations conducted by synchronous chat should suffer less from these dangers. We do not know of studies that systematically compare rapport building in chat-negotiations to FtF negotiations and the present study aims at filling that gap. The central research question in our study is therefore to what extent the synchronous character of chat communication overcomes the problem in rapport building between
107
participants in e-mail negotiations as reported by Thompson and Nadler. More precisely, we focus on the effect of chat on the trust and understanding a negotiator experiences compared to negotiators in FtF-settings. In this context, the following hypotheses will be tested: H1: Negotiating synchronously by chat will yield the same amounts of mutual
understanding as negotiating face-to-face. H2: Negotiating synchronously by chat will lead to the same level of mutual trust
as negotiating face-to-face H3: The number of reached agreements and the negotiator’s satisfaction with the
outcome will be equal for negotiations by chat and negotiations performed face-to-face.
2 Methodology
2.1 Participants
Thirty-nine people (18 male and 21 female) participated in the study. All participants were communication students from Tilburg University who received a credit point in exchange for their participation. The ages ranged from 18 to 25 with an average of 21.1 (SD = 2.36). The participants were randomly assigned to either the FtF negotiation (N = 19) or the online negotiation (N = 20).
Participants negotiated with a confederate, in both the online and the FtF negotiation. The four confederates (2 male and 2 female) prepared for their role by reading the case, and were instructed to behave as naturally as possible yet very engaged in the negotiation.
2.2 Material
For the experiment a 2,5 page long case was used, based on a case developed by professional negotiation trainers. This case describes a personalized chronological story about a neighbors' quarrel between a student representing a student’s house and his/her full time working neighbor. The case provides information about the feelings of the protagonists about the conflict, personalized accusations and personalized objectives. A questionnaire was developed to measure outcome satisfaction, understanding and perceived trust. The outcome of the negotiation was assessed by a yes/no question (successful or not), all other questions consisted of 7-points Likert scales ranging from ‘I completely disagree to I completely agree’ or ‘not at all – very well’ as extremes. The questionnaire items can be categorized into five constructs: Outcome satisfaction, Understanding, Being Understood, Trust and Being Trusted. The latter four are subdivided into constructs before and after negotiation. Cronbach’s alpha was high for all constructs, ranging from .74 to .90 (see Table 1).
2.3 Procedure
The FtF negotiations took place at a small conference room and the chat negotiations in the laboratory facilities, both at the Tilburg University Campus. Upon arrival, the participants were asked to fill in a consent form. Then, they were asked to read the case and to prepare their specific role. In all conditions, the participants played the role of the student. The role of the neighbor was played by a confederate. While reading the case the participant and the confederate were placed in different rooms. During the whole experiment the notion that the confederate was also a participant was upheld. After final instructions, the experiment leader in the FtF condition turned on the camera in order to record the interaction process and left the room. In the online condition the participants were placed into an individual computer cabin and
108
were given the same instructions, including extra instructions about the usage of the interface. After the negotiation, the participants had to indicate the questionnaire on trust and understanding.
Table 1. The reliability of the constructs used as dependent variable (Cronbach’s Alpha.
Construct α Nr. of items
Example items
Outcome Satisfaction .76 5 I am satisfied with the outcome Understanding Before negotiation After negotiation
.74 .79
4 4
To what extend did you understand the other party? How well did you understand the needs of the other party?
Being Understood Before negotiation After negotiation
.84 .89
3 3
To what extend did the other party understand you? How well did the other party understand your needs?
Trust Before negotiation After negotiation
.90 .90
3 3
How well did you trust the other party? To what extend do you think the other party was honest?
Being Trusted Before negotiation After negotiation
.88 .88
3 3
How well did the other party trust you? To what extent did the other party think you were honest?
3 Results
First, the negotiation outcomes were analyzed. The communication mode had no effect on the outcome; in the FtF negotiations 18 participants said to have reached an agreement versus 17 participants in the online negotiation. In addition, there was no significant difference for Outcome Satisfaction (F(1, 37) = 0.29, p = .60) between the FtF negotiation (M = 4.79, SD = 0.87) and the online negotiation (M = 4.65, SD = 0.72). Secondly, to study the effect of the medium on the negotiation process, repeated-measures ANOVA’s were conducted for each perception variable as a within subject factor and communication condition as between-factor. A main effect was found for the process: all perception measures were significantly higher after the negotiations (Understanding the other F(1, 37) = 113.56, p < .001, Being understood F(1, 37) = 101.34, p < .001, Trusting the other F(1, 37) = 64.78, p < .001 and Being Trusted F(1, 37) = 84.46, p < .001).
For Understanding, an interaction effect was found between medium and process: F(1,37) = 4.54, p < .05, indicating that the increase was stronger for the FtF negotiations. The same pattern was found for Being Understood (F(1,37) = 7.60, p < .01). The same, however marginally significant, pattern was found for Trust (F(1,37) = 3.19, p = .08). There was no interaction effect found for Being Trusted. Table 2. Trust and Understanding in Negotiation
Finally, the post negotiation constructs were compared for both communication conditions by conducting a MANOVA. After the negotiations, the participants in the FtF condition displayed a higher understanding for and trust in the other party than the online negotiators (Post-Understanding F(1, 37) = 5.03, p < .05; Post-Trust, F(1, 37) = 5.54, p < .05) (see Table 2 for means). There was no significant difference between the communication conditions for the other post constructs.
4 Conclusion
The objective of this study was to investigate to what extent the synchronous character of chat communication overcomes the problem in creating mutual understanding and trust between conflicting parties. The first two hypotheses stated that negotiating synchronously by chat yield the same amounts of mutual understanding and the same levels of trust as negotiating FtF. The results show that the feelings of understanding the other party and being understood by the other party increase more in the FtF negotiation than in the online negotiation. In addition, the feelings of trust in the other party are also (marginally) higher after a FtF negotiation than after an online negotiation. However, the results based on the post measurements only show that participants displayed a higher understanding for the other party and a higher trust in the other party after the FtF negotiation, whereas this was not the case in the online negotiation. Thus, the hypotheses are partly confirmed. Negotiators feel equally understood and trusted by the other party in both conditions. However, the own feelings of understanding and trust in the other party increase more after a FtF condition in comparison to the online condition. The third hypothesis stated that the number of reached agreements and the negotiator’s satisfaction with the outcome would be equal in both conditions. The results indicate that there is no significant difference in outcome between the conditions. In addition, the negotiators in both conditions feel equally satisfied about the outcome. This confirms the third hypothesis.
These outcomes demonstrate that the synchronous character of chat communication can partly overcome the problems of creating mutual understanding and trust. It can overcome a negotiators belief about the amount of understanding and trust the other party has in him/her but not the feelings of trust and understanding the negotiator has in the other party.
5 Discussion
The present study indicated that as expected, negotiators in chat perform equally well as FtF negotiators, as far as the success rate in terms of agreement and negotiator’s satisfaction is concerned. The level of trust and understanding increased in both medium conditions, although this was stronger in the FtF negotiations. However, when the focus is on post negotiation level of the trust and understanding variables, the picture is more nuanced. FtF negotiations still yield higher levels of trust and understanding for the feeling of how well the negotiator understands the counterpart, but interestingly no difference arises for the experience of how well the negotiator was understood and trusted by the other. Building rapport in chat negotiations is therefore equally successful as in FtF-negotiations for the impression you think you make on the other party, but less successful for the impression you have of that counterpart. This differential effect of perspective is intriguing and gives rise to interesting interpretations. It may have to do with the role of non-verbal communication and the impact of the visual impression the counterpart makes. In chat negotiations, the level of trust and understanding the other party evokes is entirely based on the verbal communication as transmitted in the written messages. In FtF negotiations, visual impressions, prosodies and wordings of the message all contribute to the impression the negotiator makes. In other words, the chat negotiator has less cues to convince the other of his trustworthiness and this may well have been at the basis of the lower level
110
of trust in and understanding of the other. Still, apparently the chat medium succeeded in providing enough cues to the participants to give themselves the feeling that they managed to make themselves understood and trusted. This is not only theoretically interesting, since it underlines the importance of perspective in online interaction, but also relevant for analyzing negotiation behavior in online negotiations. The e-negotiator thinks he is trustworthy whereas he is evaluated less positively by his counterpart on this point. This discrepancy could be the source for misunderstanding or at least communicative friction in e-negotiations. Studies that focus on this attribution discrepancy in chat negotiations should shed more light on this question. The present study was inspired by the findings of Thompson and Nadler [14] that building rapport in e-mail negotiations is difficult. We did not control for this by explicitly studying the same case in an e-mail setting. We managed to show that a chat negotiation approaches a FtF negotiation in the possibilities it offers to build rapport, but including the e-mail condition would have enabled us to show the advantages of synchronous versus asynchronous communication in this respect.
Furthermore, this study of the effect of the medium on negotiations is part of a study where it will be extended with mediations in order to study the question to what extent the presence of a mediator in a conflict interacts with the medium used for communication. Data that explore the rapport building options of chat negotiation in the presence of a mediator are collected at the moment of writing this abstract and will be presented at the conference. We expect a chat mediator to strengthen the rapport building characteristics of chat negotiation.
References
1. Bains, G., Andrade, K., & Gallant, M. M.: The potential for mediating disputes online. Retrieved from: http://www.cfcj-fcjc.org/sites/default/files/docs/ hosted/17436-mediating_disputes_online.pdf (2013)
2. Silbey, S. S., Merry, S.E.: Mediator Settlement Strategies. Law & Policy. Vol. 8, No. 1 (1986)
3. Kydd, A. H.: When can mediators build trust? American Political Science Review Vol. 100, No. 3 (2006)
4. Deutsch, M.:“Trust and Suspicion.” Journal of Conflict Resolution, 2 (4) 265-279 (1958)
5. Parks, C., Hulbert, L.: “High and Low Trusters’ Responses to Fear in a Payoff Matrix.” Journal of Conflict Resolution, 39 (4), 718-730 (1995)
6. Butler, J. K., Jr.: Trust expectations, information sharing, climate of trust, and negotiation efficiency. Group and Organization Management, 24 (2), 217-38 (1999)
7. Rosenoer, J., Armstrong, D., & Gates, J. R.: Click with trust. NewYork: Free Press (1999)
8. Keen, P., Ballance, C., Chan, S., & Schrump. S.: Electronic com- merce relationships: Trust by design. Upper Saddle River, NJ: Prentice Hall (2000)
9. Duarte, D., & Snyder, N.: Mastering virtual teams; Strategies, tools, and techniques that suceed. New York: Jossey-Bass (1999)
10. Alonzo, M., Aiken, M.:
Flaming in Electronic Communication. Decision Support Systems 36 205–213 (2004)
11. Anderson, E. D., Ansfield, M. E., & DePaulo, B. M.: Love’s best habit: Deception in the context of relationships. In P. Philippot, R. Feldman, & E. Coats (Eds.), The social context of nonverbal behavior: Studies in emotion and social interaction (pp. 372–409). New York: Cambridge University Press (1999)
12. Valley, K. L., Moag, J., & Bazerman, M. H.: A matter of trust: Effects of communication on the efficiency and distribution of out- comes. Journal of Economic Behavior & Organization, 34, 211–238 (1998)
13. Katsh, E., & Rifkin, J.: Online dispute resolution: Resolving con- flicts in cyberspace. San Francisco, CA: Jossey-Bass (2001)
14. Thompson, L., Nadler, J.: Negotiating via Information Technology: Theory and Application. Journal of Social issues, Vol. 58, No. 1, pp. 109-124 (2002)
111
15. Damen, J.D., van der Wijst, P.J., van der Toorn, M.A.H., Amelsvoort, M.A.A.: Circular and open questions in mediations. In prep.
2 Supplier selection using Interpolative Boolean algebra and TOPSIS method
logical interactions between attributes, i.e. they are not in the Boolean frame, the
consistent fuzzy logic is introduced. The aim of this study is to develop a practical
tool for mapping linguistic requirements of decision makers with an appropriate
Boolean polynomial. The basis of proposed approach is interpolative realization of
Boolean algebra that transforms logical conditions between attributes into a
generalized Boolean polynomial, then merges logical conditions into a single value by
using a logic aggregation function. Finally, the ranking of the suppliers is provided
using the Technique for Order Performance by Similarity to Ideal Solution.
The paper is structured as follows: in Section 2 an introduction of Boolean
consistent fuzzy logic is given. Section 3 explains steps of TOPSIS method. Section 4
analyzes the problem of selecting suppliers by using Boolean consistent fuzzy logic
and TOPSIS. Finally, the paper concludes with Section 5.
2 Boolean consistent fuzzy logic
Fuzzy logic was introduced by Zadeh [1] as an efficient way to mathematically
represent uncertain and imprecise human assessments. The main advantage of fuzzy
logic is that it is generalization of classical (binary) logic and does not require
completely exact data, elements can take values from the interval [0,1]. However, the
main disadvantage of fuzzy logic is that it is not in the Boolean frame. Extension of fuzzy logic by introducing logical interactions is enabled by using
Interpolative Boolean Algebra - IBA [2,3], which is a consistent generalization of
fuzzy logic. IBA is a real valued, and/or, [0,1] value realization of Boolean algebra
[4]. Under the IBA all Boolean axioms and theorems apply. IBA has two levels –
symbolic and valued.
On symbolic level one of the basic concepts is the structure of IBA elements. The
principle of structural functionality indicates that the structure of any element of IBA
may be directly calculated based on the structure of its components. The structure is
an independent value and that is the key to preserving Boolean laws both at the
symbolic and at the level of values [5]. This principle treats negation differently and
that allows preservation of the excluded middle ( ) which is not respected
in the conventional fuzzy logic [6].
On a valued level the values are introduced in this way to preserve all the laws set
symbolically, in the general case it is a matter of interpolation [7,8]. Elements take
values from an interval and suitable operator for generalized product is chosen [9].
2.1 Generalized Boolean polynomial and logical aggregation
IBA is technically based on generalized Boolean polynomial (GBP) [8]. That
means if any element of Boolean algebra can be represented in a canonical disjunction
way, it can be represented also by appropriate GBP. And thus, it allows for the
processing of the corresponding element of Boolean algebra into the value on the real
interval [0,1] using operators such as classical (+), classical (-) and generalized
Kamineta
Rectangle
136
Supplier selection using Interpolative Boolean algebra and TOPSIS method 3
product ( ) [9]. The generalized product (GP) is a subclass of the conventional fuzzy
T norm satisfying the non-negativity axiom [7].
Within the IBA, the method enabling unification of factors is referred to as Logical
Aggregation (LA). The main task of LA is the fusion of the primary attributes into
one globally representative value using logical function. A Boolean logical function
enables the aggregation of factors, i.e. it is an expression that transforms into GBP.
3 TOPSIS method (Technique for Order Performance by
Similarity to Ideal Solution)
TOPSIS represents a classical multi-criteria decision-making method. This method
ranks alternatives according to their distance from the Positive ideal solution (PIS)
and Negative ideal solution (NIS). The ranking of alternatives is based on the relative
similarity to the ideal solution, which avoids the situation of the alternative having the
same similarity to both PIS and NIS. The TOPSIS methodology presented by Hwang
and Yoon [11] consists of the following steps:
Step 1,2: The decision matrix is normalized and weighted.
Step 3: PIS and NIS are determined by Eq. (1,2):
(1)
(2)
Step 4: The distance of each alternative from PIS and NIS is calculated by Eq. (3,4):
√∑ (
)
(3)
√∑ (
)
(4)
Step 5: The closeness coefficient for each alternative ( ) is calculated by Eq. (5):
(5)
Step 6: At the end of the analysis, the ranking of alternatives is made possible
by comparing the values.
4 The method of solving the problem of supplier selection by
using IBA and TOPSIS
A real-life company specialized in installation and maintenance of
telecommunications systems wants to select the most suitable supplier that would
deliver distributed antenna systems. Three suppliers were considered that are ranked
based on four basic attributes and eleven sub-attributes (Table 1).
Kamineta
Rectangle
137
4 Supplier selection using Interpolative Boolean algebra and TOPSIS method
Table 1. Presentation of attributes and sub-attributes
Attributes Sub-attributes Attribute type Unit Max/Min
Pro
du
ct
per
form
ance
(K1)
Technical features (k11) Qualitative EX, VG, G, ST, US Max
Product quality (k12) Qualitative EX, VG, G, ST, US Max
Delivery time (k13) Quantitative Day Min
Su
pp
lier
pro
file
(K
2)
Reference (k21) Qualitative EX, VG, G, ST, US Max
Brand position (k22) Qualitative EX, VG, G, ST, US Max
Fin
anci
al
aspec
t
(K3)
Product price (k31) Quantitative Eur Min
Transport costs (k32) Quantitative Eur Min
Customs and fees (k33) Quantitative Eur Min
Su
ppo
rt a
nd
serv
ices
(K
4)
Service and maintenance (k41)
Qualitative EX, VG, G, ST, US Max
Technical support (k42) Qualitative EX, VG, G, ST, US Max
Training aids (k43) Qualitative EX, VG, G, ST, US Max
Self containing: an annotation can hold and be held into an annotations net
Have an inner timeline that manages internal states evolutions.
Support multi-authoring.
Annotation model characteristics and class diagram:
We rely on the work of the OAC workgroup (Open Annotation Collaboration)
paradigm for annotations model. We use this general frame for our annotation model
in order to be compliant with web standards of connected objects and medical
document standards (HL7) so to prepare our prototype for further integration (Fig 4.).
Fig.4. Simplified annotation class diagram.
Our contribution to these standards stands in the fact that our annotations embark:
versioning, rich media management, “smart” data contextualization through
nomenclature and dictionary connections, and internal timeline.
4 Conclusion
We proposed in this paper a new paradigm for group decision making and
collaborative work support in oncology ward: the constitutive role of annotations to
address organizational complexity and manage heterogeneous valuable data flows.
Our contribution to the domain relies in the proposal of enhanced functionalities of
annotations based on deep observation of writing practices. Our proposal argues that
translating this practice into a software design is full of interesting potentialities for
Kamineta
Rectangle
149
8 Philippe Marrast, Pascale Zaraté
group decision support domain. This allows to maintain a structuring, organizing and
constitutive practice, and to build robustness and resilience by the intensive everyday
usage of writing tool and the co-creation process that we observed [6]. The stake in
our proposal is to go beyond annotation tools as a collaborative tool for collective
writing. We propose to equip classical HIS with a layer of organizing based upon
annotations to manage valuable flows of data and co-create organizing and mindful
interdependence. This construction could help caregivers to build a culture of
interoperable writings that both match activity needs and normative standards of
medical documents. Hence, our tool could help to build a richer and extended writing
culture toward professionalization of medical writings. For now, the prototype is
under development and the tests step with real end-users is until yet not feasible.
References:
1. Adla, A., Zarate, P.: A Cooperative Intelligent Decision Support System. Service Systems
and Service Management, 2006 International Conference on. pp. 763–769 (2006).
2. Bardram, J.E., Bossen, C.: A web of coordinative artifacts: collaborative work at a
hospital ward. Proceedings of the 2005 international ACM SIGGROUP conference on
Supporting group work. pp. 168–176 (2005).
3. Berg, M.: Patient care information systems and health care work: a sociotechnical
approach. Int. J. Med. Inf. 55, 2, 87–101 (1999).
4. Briggs, R.O. et al.: Facilitator in a box: Computer assisted collaboration engineering and
process support systems for rapid development of collaborative applications for high-
value tasks. System Sciences (HICSS), 2010 43rd Hawaii International Conference on.
pp. 1–10 IEEE (2010).
5. Bringay, S. et al.: Annotations: A functionality to support cooperation, coordination and
awareness in the electronic medical record. Proceeding of the 2006 conference on
Cooperative Systems Design: Seamless Integration of Artifacts and Conversations–
Enhanced Concepts of Infrastructure for Communication. pp. 39–54 (2006).
6. Hartswood, M. et al.: Working IT out in medical practice: IT systems design and
development as co-realisation. Methods Inf. Med. 42, 4, 392–397 (2003).
7. Van Lamsweerde, A.: Requirements Engineering - From System Goals to UML Models to
Software Specifications. Wiley (2009).
8. Lewkowicz, M. et al.: A web-based annotation system for improving cooperation in a care
network. ICWE Workshops. pp. 227–239 (2004).
9. Montani, S.: How to use contextual knowledge in medical case-based reasoning systems:
A survey on very recent trends. Artif. Intell. Med. 51, 2, 125–131 (2011).
10. Taylor, J.R., Van Every, E.J.: The emergent organization: Communication as its site and
surface. Lawrence Erlbaum (2000).
11. Weick, K.E.: The reduction of medical errors through mindful interdependence. Med.
Error What We Know What We. 177–99 (2002).
12. Weng, C., Gennari, J.H.: Asynchronous collaborative writing through annotations.
Proceedings of the 2004 ACM conference on Computer supported cooperative work. pp.
578–581 ACM (2004).
Kamineta
Rectangle
150
Analysis of the Audience’s Acceptance to Discourse
Focusing on the Sequence of Independent Words
Makoto Tsukai1 and Sousuke Shiino1
1 Graduate School of Engineeing, Hiroshima University, 1-4-1, Kagamiyama
Higashi-hiroshima City, Japan, 739-8527
Abstract. Community transportation policy is an important issue for those who do not have personal transportation measure to live on. In this study, we try to clarify a mechanism how the community transportation policy is accepted by a special committee composed by the representatives of the inhabitants. Text mining was applied to get the utterance vectors for each talk. The local similarity of the utterance was calculated by the angle between a set of vectors. By using the calculated local indices about the topic sequence, logit regression model was estimated. The estimated model showed that the starting local sequence of a specific topic can contribute the acceptance of discussion conclusion, rather than following other’s talk.
Keywords: Discussion Experiment, Text mining, Vector Space Model
1 Introduction
A planning for community transportation in Japan has been focused due to the difficulties to sustain local bus lines. The inhabitants who do not have own cars are in lower mobility in daily life. In order to redesign the local transportation service, a special committee composed of inhabitant, bus service provider and local government is often organized to find out a new community transportation policy [1]. For a transparency of decision making process, the records of the committee are often issued on website. An open access to public issue requires a careful management about the acceptance to the discussion from the non-participated inhabitants of the community, in order to overcome the conflict among the stakeholders [2], and to achieve a fruitful feedback among them [3]. Therefore, the quality of discussion in the committee should be kept higher in order to get understandings and supports to fulfill various requests or potential needs of the stakeholders.
There are several approaches to analyze group decision making. Klamler classified the existing mathematical approaches based on common structures of the problem setting [4]. Kibris reviewed the studies applying cooperative game theory to negotiation [5]. Kilgour and Hipel introduced several approaches in conflict analysis theories focusing on a graph model [6]. Parallel to the above normative approaches based on preference or utility theory, decision support system [7] or facilitation tools
151
[8] are proposed. Salo and Hämäläinen proposed multicriteria decision support system not only to evaluate policy alternative but to facilitate the decision process [9].
In terms of public acceptance to a policy alternative, Zoellner et al. focused on a public acceptance of renewable energies in German publics by a questionnaire, and the acceptance of new energy policies were analyzed [10]. Heras-Saizarbitoria et al. also studied in the energy policy in Spain [11], focusing on the longitudinal transition of the opinions on newspaper articles summarized by the authors. Koeszegi and Vetschera notified that an elementary unit of analysis in negotiation could range from micro (utterance) to macro (entire process) [12]. As a microscopic approach, text mining to count the key words in the documents based on syntax rules would shed light on the public acceptance to the prior discussions in policy. Dafouz-Milne compared the articles on newspaper about public issues with several countries, based on a text mining approach [13]. His study clarified that the “meta discourse” such as a style or way of discourse embedded in each utterances was significantly different over the countries. Text mining approach was also applied for public speech and its acceptance in Japanese [14], or in English [15].
This paper purposes to clarify how the acceptance to the proposed policy alternative by a special committee in which people did not participate is affected by sequence of utterances during the committee. For this purpose, we took a “discussion experiment” about community transportation planning by the members, and then the “discussion evaluation experiment” to evaluate the discussion by other community members was conducted. After watching the video of the discussion, a questionnaire survey was conducted for the others. In section 2, we summarized an aggregation analysis about the questionnaire survey in discussion evaluation experiment. On the other hand, a text mining was applied to the discussion record to make a quantitative index about the topic sequence, focusing on independent words. In section 3, the quantitative index for each talk is shown together with the frequencies of the judgment ground of acceptance. And then a statistical model in the acceptance of recommended policy alternative is estimated to find out the significant factors. The model includes a quantitative index calculated by using utterance vector as one of explanatory variables. Conclusions are shown in section 4.
2 Data Collection by Experiments
2.1 Discussion Experiment
Prior to a discussion evaluation experiment, we conducted a discussion experiment about public issue. The discussion topic was required to be a common issue among the monitors. Since the monitors were supposed to be university students due to easiness to sample collection, we set the theme as “introduction of car sharing system” at university. In order to attract the monitor’s interest on the discussion, a reward to the monitors was given, which amount is equivalent to the fee with tentative working as the time to join the experiment. The discussion group was composed of a
152
Table 1. Summary of Discussion Records
1st wave 2nd wave 3rd wave total Num. of words variation 181 144 190 -
facilitator and six monitors. The facilitator was a student in charge of this experiment. The facilitator mainly concentrated on a progression of the topics and did not so often propose a novel idea to the discussion. The monitors were collected from different departments in our university. The three of monitors owned a car they could use, while the others did not. They repeated three waves of discussion about the car sharing system, and the group was required to conclude a recommendation in policy alternative. Each wave of discussion was about 60 minutes. All the utterances in the discussions were recorded by an IC-recorder and a digital video recorder and these were converted into text documents with tag-number for each person’s talk; in this paper, a sequence of sentences told by a person is called a “talk”. To make the discussion active, some of fundamental information about car sharing and three initial options of the possible car sharing system including no-implementation alternative were given at first wave with some paper handouts. After the three waves of discussion, they chose a home-based car sharing system at selected spots, which was slightly modified from the initial alternative.
The result of morphological processing to pick up independent words from the records is shown in table 1. Here, the independent words are defined to have own sense by that word such as noun, verb, adjective and quasi-adjective. Since the facilitator was controlled not to propose a novel idea, we removed the facilitator’s talks from the documents. As shown in table 1, the word variation in each wave (i.e. removing multiple counts for each independent word) was the least at second wave but the largest at third wave. The frequency of each participant’s talk was almost even for all the participants at the first wave, but it became different in the second and third wave. An average number of words in a talk were around 18.4 for the first and the second wave, while it was 22.6 at the third wave. Since the words variation is not so different between the first and the third, the discussion had been concentrated into a specific topic with longer talk of a few participants.
2.2 Discussion Evaluation Experiments
In discussion evaluation experiment, we collected different monitors with the discussion experiment from our university, and 37 students participated to the experiment. The monitors were provided the documents recording all the utterances in three waves and the handouts about car sharing system at beginning. Then, they
153
7 7 14 9
0% 20% 40% 60% 80% 100%
Not consistent and Not acceptable Consistent but Not acceptable
Not consistent but Acceptance Consistent and Acceptable
Fig. 1. Consistency with One’s Opinion and Acceptance to Group Conclusion
watched the video at the third wave of discussion for 60 min., and answered a questionnaire about discussion evaluation. The questionnaire includes following 5 sections as 1) individual characteristics, 2) supporting alternative, 3) evaluation for the third wave, 4) acceptance of group conclusion and 5) evaluation for each participant of the discussion experiment. In section 3 and 4, we asked the tag number of the talks giving the judgment ground of acceptance.
Fig.1 shows an aggregation for discussion acceptance. The acceptance is asked with the consistency with the respondent’s initial opinion, so then there are following four categories (consistent / not consistent and acceptable / not acceptable). As shown in this figure, over 60 % of the respondents can accept the group conclusion. It is interesting that almost 40 % of the respondents accepted the group conclusion even if the initial opinion for car sharing was different with it.
3 Statistical Analysis in Non-participant’s Acceptance
3.1 Vector Space Model and Local Similarity
In order to get quantitative indices in topic sequence, a vector space model is applied to independent words appearing in the discussion records. In this model, each independent word is set as an axis of the utterance space and the frequency is plotted on it. Suppose a number of talks pN at wave p, and a number of variations of independent words pK at wave p. The utterance vector of talk i is in eq.(1).
Tpk
pppi wwwU 21 , (1)
where pNi 1 , pKk 1 and superscript T is a transpose of a vector. A similarity between talk i and j is defined as a cosine of a set of vectors in eq. (2).
For simplicity, a superscript p will be dropped, hereafter.
ji
jTi
ijUU
UUM
(2)
An average similarity of talk i to the other talks in wave p is in eq.(3).
154
1
11
p
N
jij
i N
M
M
p
(3)
Note that 1iiM .
The local similarity of talk i with the talks before three and with that after three are obtained in eq. (4) and in eq.(5), respectively.
Ni
UU
UU
Mb
iiji
j
i
T
ijij
i
3
3
3 (4)
31
3
3
Ni
UU
UU
Ma
jjiji
jjij
Ti
i
(5)
The higher Mbi indicates that the talk similar with the former talk so that the topic in the talk follows the previous talks. On the other hand, the higher Mai indicates that the talk similar with the following talks so that the topic in the talk provides the novel topic to be followed by the latter talks.
Fig.2 and fig. 3 show the transition of Mbi and of Mai calculated by eq.(4) and (5), respectively, with the number of indicated talks as “Ground of acceptance” and “there
Fig. 3. Transition of Mai and Indicated Talks are a room for further discussion”, respectively. Comparing with the average of Mbi, the higher values seem to be appearing at the talks giving the ground for acceptance infig. 2. The similar consideration can be obtained in fig. 3 for Mai, as that the higher values are appearing at the talks giving the ground for acceptance. On the other hand, the correspondence of a room for discussion with Mbi or Mai seems bit ambiguous.
3.2 Acceptance Model to Group Conclusion
The acceptance to the group discussion is modeled by a binary logit, which objective variable is to accept the recommended alternative (yi=1) or not (yi=0) . The explanatory variables are selected by several trials and errors. As a result, knowledge for car sharing, car ownership, consistency of conclusion with the participant’s opinion, rating for activeness in discussion, Mbi and of Mai are adopted. The estimated parameter is shown in table 2. The likelihood ratio of the estimated model is 0.399, so then the fitting is well. In the table, positively estimated parameters indicate the positive factor to accept the recommended alternative and vice versa. Knowledge for car sharing and the car ownership were negative but not significant. Consistency of conclusion with the participant’s opinion is positive but insignificant. Active discussion and Mai are positive with significant, while Mbi is positive but not significant.
The insignificant parameter for the consistency of conclusion with one’s opinion indicates that the monitors are flexible to change their mind, and they would carefully watch the discussion process. Therefore, the discussion experiment can provide the enough ground to judge the new community transportation policy. The activeness rating for the discussion is corresponding with our preliminarily expectation in
156
Table 2. Parameter Estimation in Acceptance to Group Conclusion
Car ownership (1: own, 0 : not) -1.921 -1.73 Consistency of conclusion with one’s opinion
(1:consistent, 0 : not consistent) 0.608 0.44
Active Discussion (rating, 5 ranks) 1.835 * 2.33 Mbi by eq.(4) 13.897 1.53 Mai by eq.(5) 14.837 * 2.11
Constant 2.023 1.46 Maximum log-likelihood -15.136
Likelihood ratio 0..399 Samples 36
*: significance in 5% parameter sign. The monitor’s satisfaction to the discussion process is one of important factor. Mbi’ s insignificance and Mai s significance show that the starting local sequence of a specific topic can give a ground of the acceptance of discussion conclusion, rather than following other’s talk. Since both of them are positive, the facilitator should manage the discussion to keep a topic for a while, and then to transit to others. As our experience tells, a facilitator should always care for the discussion progress to keep the pace of topic transition not too fast and not too slow. As shown in our experiment, if the discussion is well managed, potential participant (non-participants) will accept the recommendation from the representative committee, even the conclusion is different form the individual opinion.
4 Conclusions
In a matured society with stable growth, improvements and reutilization of existing infrastructure with an updated management policy become important. Since the self-governance in each community requires an aggregation from individual inhabitants to community will, the discussion about a community issue should be sophisticated.
This study tried to shed light on the discussion management and the improvement of public acceptance for a community policy such as a community transportation planning. Through the discussion evaluation experiment, the non-participated community members tend to accept the recommended alternative when the talk with new topic is followed by the others. Further, the participant can accept the alternative even it is different from the personal opinion. These findings indicate that the facilitator should care about the topic progress in the discussion as to sustain a new idea for a while. On the other hand, the rating for discussion activeness to the participants is different over the monitors, which is not expected. The reason for it
157
would be the participant’s difference in background knowledge for the discussion topic. This is to be fixed in the next experiment.
References
1. Paget-Seekins, L.: Competing mobility needs: The users, actors, and discourses in Atlanta, Georgia, Transport Policy, 27, 142–149, 2013.
2. Mert. A.: Partnerships for sustainable development as discursive practice: Shifts in discourses of environment and democracy, Forest Policy and Economics, 11, 326–339, 2009.
3. Wierzbicki, A.: Group decisions and negotiations in knowledge civilization era, (Kilgour, D. and Eden, E (eds.): Advances in group decision and negotiation vol.4, Handbook of group decision and negotiation), Springer, 2010.
4. Klamler, C.: Fair division, (Kilgour, D. and Eden, E (eds.): Advances in group decision and negotiation vol.4, Handbook of group decision and negotiation), Springer, 2010
5. Kibris, Ö.: Cooperative game theory approaches to negotiation, (Kilgour, D. and Eden, E (eds.): Advances in group decision and negotiation vol.4, Handbook of group decision and negotiation), Springer, 2010.
6. Kilgour, D. and Hipel, K : Conflict Analysis methods: the graph model for conflict resolution, (Kilgour, D. and Eden, E (eds.): Advances in group decision and negotiation vol.4, Handbook of group decision and negotiation), Springer, 2010.
7. Richardson, G. and Anderson, D.: System thinking, mapping, and modeling in group decision and negotiation, (Kilgour, D. and Eden, E (eds.): Advances in group decision and negotiation vol.4, Handbook of group decision and negotiation), Springer, 2010.
8. Kolfschoten, G. Vreede, G. and Briggs, R.: Collaboration engineering, (Kilgour, D. and Eden, E (eds.): Advances in group decision and negotiation vol.4, Handbook of group decision and negotiation), Springer, 2010.
9. Salo, A. and Hämäläinen, P.: Multicriteria decision analysis in group decision process, (Kilgour, D. and Eden, E (eds.): Advances in group decision and negotiation vol.4, Handbook of group decision and negotiation), Springer, 2010.
10. Zoellner, J., Schweizer-Ries, P. and Wemheuer, C.: Public acceptance of renewable energies: Results from case studies in Germany, Energy Policy, 36, 4136–4141, 2006.
11. Heras-Saizarbitoria, I., Cilleruelo, E. and Zamanillo, I.: Public acceptance of renewables and the media: an analysis of the Spanish PV solar experience, Renewable and Sustainable Energy Reviews, 15, 4685– 4696, 2011.
12. Koeszegi, S. and Vetschera, R. : Analysis of negotiation process, (Kilgour, D. and Eden, E (eds.): Advances in group decision and negotiation vol.4, Handbook of group decision and negotiation), Springer, 2010.
13. Dafouz-Milne, E.: The pragmatic role of textual and interpersonal meta-discourse markers in the construction and attainment of persuasion: A cross-linguistic study of newspaper discourse, Journal of Pragmatics, 40, 95–113, 2008.
14. Dunn, C.: Information structure and discourse stance in a monologic 'public speaking' register of Japanese, Journal of Pragmatics, 42, 1890-1911, 2010.
15. Han, D.: Utterance production and interpretation: A discourse-pragmatic study on pragmatic markers in English public speeches, Journal of Pragmatics, 43, 2776–2794, 2011.
158
A Reflection of the EWG-DSS’s Life through theApplication of SNA Techniques to its
Publications
Isabelle Linden and Melanie Motte
University of Namur, Department of Business Administration8, Rempart de la Vierge, 5000 Namur, Belgium
Abstract. In the last decades, scientific collaboration analysis has ben-efited of improvements in techniques and tools that support networksanalysis. Taking advantage of these opportunities, the Euro WorkingGroup on Decision Support Systems (EWG-DSS) launched the Collab-Net project. This project aims at analysing the life of the group. Emergedas an autonomous parallel thread within the project, the work reportedin this paper studies the publications generated by the activity of thegroup for the decade 2003-2012.The analyses reported here apply Social Network Analysis (SNA) tech-niques to explore two axes. The first one studies the co-authors’ networkand studies authors’ involvement and their positions within this network.The second one examines the keywords associated to these publicationsand, considering the network of their co-occurrences, proposes some ele-ments about the domain covered by the selected set of publications.
Key words: EWG-DSS, SNA, co-authorship, keywords
1 Introduction
For several years, the Euro Working Group on Decision Support Systemsis interested in the evolution of the network formed by its members. Theproject, launched to follow and analyse the community, is known as the EWG-DSS Collab-Net Project. The first results have been published in several pa-pers [1, 2, 3, 4, 5, 6, 7, 8]. They particularly highlighted the leadership positionof some of the early members among which the committee members. Moreover,these last ones are acting as efficient bridges within the community. The roadmapfor the future of the project is drawn in [9].
Taken an alternative path with respect to this agenda the present piece ofwork studies the network through the set of publications issued from the eventsorganised by the group. Indeed, since the creation of the EWG-DSS in 1989several events have been organised. Together with the committee meetings andstreams in the EURO conference organized since the early years, the groupproposes now workshops and tracks in mini-conferences. Moreover, these events
159
2 I. Linden and M. Motte
do not only give rise to proceedings but also, extended versions of selected bestpapers are published in special issues of journals and in books.
With respect to the original program, this restricted set of publications pro-vides a limited view on the real activity of the members. Therefore, the projectis still running and a platform to support a sound data collection process is un-der development. However, focussing this piece of work on events and editionsmanaged by the group offers interesting aspects:
1. the data collection is complete and does not suffer methodological discussion;2. moreover, the available information involves not only title and authors but
also keywords and abstracts;3. the study enhances the part of the activity of the members whose association
with the group is obvious.
The paper is structured as follows. After a few words on the data collectionand the methodology, similar works applied to other communities are brieflymentioned. Then, the results obtained using the social network analysis (SNA)techniques are described in two sections that cover the two main axes of theanalysis. The first one studies relations between the authors in the network. Thesecond axis is dedicated to the keywords analysis and identifies the main areas inthe domain covered by the publications. The last section draws some conclusionand lines for future work.
2 Methodology
2.1 Data Collection
The data collected for this work cover 10 years of activities of the EWG-DSSfrom 2003 to 2012. They consist of
– streams in 4 EURO conferences (Prague 2007, Bonn 2009, Lisbon 2010 andVilnius 2012)
– 4 (co)-organised workshops (Graz 2005, Paris 2011, London 2011 and Liver-pool 2012),
– the co-organized International Conference on Creativity and Innovation inDecision Making and Decision Support (CIDMDS London 2006)
– the co-organized International Conference on Collaborative Decision Making(CDM Toulouse 2008)
Moreover, 10 journal special issues (IJDSST [14, 16, 17, 18] GDN [15], EJOR [10,13] CEJOR [12] and JDS [9, 11] and one book [19] involve extended versions ofselected best papers.
The choice of the initial year of 2003 corresponds to the first edition of aspecial issue [9] by the group and initiated a period of significant activity asconfirmed by the list above. Limiting the period to 10 years (2003-2012) offeredboth a symbolic size and the warranty of access to the complete information atthe time of launching the work (2013).
Kamineta
Rectangle
160
EWG-DSS publications SNA 3
2.2 Data Preparation
Thanks to the support of the EWG-DSS committee, obtaining complete infor-mation was not such a big deal. Even if complete, the data set still requiredsome pre-treatment. The classical disambiguation and synonyms identificationin the authors’ name required some attention; but given the limited size of thedata set (less than 300 publications), it was efficiently managed by hand.
Regarding the keywords, the job was a bit more demanding. Indeed, thechosen approach consisted in respecting authors’ choices and use the author-defined keywords. However, this does not completely avoid some pre-treatment.In a first step, the identification of synonyms required a bit of care (consider f.ex.MCDA, Multicriteria Decision Analysis, Multi-Criteria Decision Analysis and allthe variation with or without capital letters, among others). Complementarilywith this cleaning, some very specific keywords have been completed with amore generic one. For example, “k-means range clustering” appear as such foronly one paper and so get lost in the ocean of the keywords. Addition to theconcerned paper, of “clustering” and “data-mining” improves the quality of thenetworks in two ways: on the one hand the specific keywords turn to be connectedwith the network, on the other hand, the more generic term “data-mining”receive relevant connections. This tactful association of keywords has been donefollowing recommendations of the committee members of the EWG-DSS.
2.3 Statistical an SNA Methods
The summary of three large networks studies realised in [21] present and com-pare co-author network in biology, physics and mathematics. The sizes of thesenetworks (several 10.000 and more) do not allow comparison with our piece ofwork, but the relevance and the interpretation of observed parameters adopt asimilar methodology.
In [22], authors apply social network analysis techniques to the co-authornetwork extracted from the publication in the journal Scientometrics from 1978to 2004, they firstly compute global metrics on the network to describe themicro-structured of the collaboration network, then they provide a descriptionof the identified clusters on the basis of the most frequent words appearing inthe co-authored titles. In this cluster analysis, the network is limited to authorsinvolved in at least 3 publications. The current piece of work adopts a similarmicrostructure approach of the co-authorship analysis. But regarding topics, wechoose a global view and focussed on keywords instead of titles.
Words’ occurrence in title is also used by [23] that studies the evolutionof communities in publications inventoried on DBLP, the authors propose amethodology to follow the temporal evolution of communities defined by commoninterest.
Kamineta
Rectangle
161
4 I. Linden and M. Motte
3 Authors’ Network Analysis
The analysed set of publications involves 218 abstracts and papers in proceedingswritten by 417 authors and 78 papers in journals and book, by 207 authors.Most of these 78 are revised and extended versions of the works presented in theproceedings.
Among the 218 publications in the proceedings, only 50 publications are sin-gle author, others involve 2 to 7 authors, only one involves 10 authors. Figure 1presents the network of the authors obtained by connected authors that are in-volved in (at least one) common publication, and self-looping authors appearingas single author.
Fig. 1. Proceedings co-authors network (realised with NodeXL)
Kamineta
Rectangle
162
EWG-DSS publications SNA 5
Average degree (5,5 for proceedings, and 2,7 for journals) and density (0,0115for proceedings, and 0,0131 for journals) of the network are quite low. However,the group members are not single players. . . This claim can be supported on theone hand by the small number of single author papers and on the other hand bythe observation of the connected components.
Indeed, 50 (23%) publications have a single author, but only 36 (9%) authorsappear only as single authors. Regarding the journal publications, single authorpapers number drop to 8 (10%), and only 6 (3%) authors are always publishingalone. The average number of authors per publication is 2,6 for the proceedingsand 2,9 for the journals. These appear to be higher than results obtained bystudies in other domains [22]
Considering the graph of authors involved in proceedings (illustrated on fig-ure [1]), a huge set of components (at the bottom of the figure) correspondsto single authors or subset of authors involve in only one (common) publica-tion. The interesting connected components are theones that connect groups ofco-authors that do not (or not always) publish all together. Among them 4 com-ponents involving 10-20 authors (the four first ones on top row). A single bigcomponent (the giant component of the network) involves 53 (13%) authors.
The giant component illustrates how the early commity members (F. Dargam,R. Ribeiro and P. Zarate) are bridging the community. The three componentson the right of the top row illustrate the position of active members involvedin multiple co-authors teams (as J.-M. Moreno-Jimenez and J. Hernandez). Theparticular component on top left of the figure corresponds to one publicationwritten by ten co-authors. Four of them collaborate with an eleventh author toanother publication.
The centralities (degree, betweenes and eigen vector) analysis confirms theleadership role of committee members already identified in previous publications.
4 Keywords’ Network Analysis
The set of 479 keywords are extracted from the same set of 218 abstracts andpapers published in proceedings. Their co-occurrences in a publication define1486 connections. The resulting network involves 18 connected components:
– 428/479 (89%) nodes in the big component– 51 other keywords are involves in 17 small components each one corresponding
to one publication.
A part of the size of the giant component is due to strong attractiveness of DSS(59 papers, centrality degree 128) and MCDA (26 papers, centrality degree 81).However, even cumulated they do not explain half of the size of the component.This strong inter-connection may suggest that the domain covered by the EWG-DSS is well identified by the participants. However, there is also place in theevents for more presentation of work more “off the beaten track”.
The top 10s of the centrality study are presented in figure 2. The degreecentrality is highly related to the frequency distribution of the keywords. One can
already observe that a variety of domains is covered by this top 10. Betweenesscentrality reveals node that act as connectors between elements in the networks,observe the apparition in this top ten of “Information” and “Performance” andthe progression of “Data Mining”. This suggests their “service” role in manydifferent areas of DSS. The eigen-vector centrality by taking weights of nodesand connections into account, reveal the node how are strongly connected to thestrong actors, and in this top ten appear “Multiciteria Decision-Making”.
The Louvain method [20] has been shown efficient in identifying “communi-ties” in graphs. Its application to our keywords networks, limited to nodes witha degree above 5 (involved in at least two publications) provide a five axes de-composition. For sake of readability, figure 3 provides their visualisation limitedto nodes with a degree above 12.
These axis are as follows (starting from the longer one on the right andturning clockwise):
– axis 1: DSS, Decision making, Network, Data-Mining, Simulation, Optimi-sation, Fuzzy, Supply chain, Performance, Decision support, Case study andRisk,
Fig. 3. Five axes decomposition of the keywords network (generated with GePhi)
5 Conclusion and Future Work
The current piece of work proposes the early stage results obtained by analysing10 years of publications within the EWG-DSS activities. Two networks have beenstudied in this paper. On the one hand, the co-authorship network enhances theorganisation of the group. And, on the other hand, the network that links theco-occurring keywords explores the structure of the “Decision Support System”domain.
Further analyses are under investigation on the same data set. After thequalitative analysis presented here, the weighted graphes will be consider. Thetwo graphes will also benefit from the application of overlapping communitydetection techniques [24, 25] which should provide more robust results regardingboth the community structure and the domain analysis. Similarly, opportunitiesoffered by the apllications of hierarchical clustering techniques and Hyper-graphsmethods have to be investigated.
The information about the evolution in density and strength of the networkwill offer a temporal view which will be explored by dynamic community dec-tection [26] and the quantification of this evolution [27].
Specifically for the authors network, distinguishing members and non-membersof the EWG-DSS will deepen the results.
Kamineta
Rectangle
165
8 I. Linden and M. Motte
Regarding the keywords study, the approach based on author-defined key-words, will be completed by the association of “topic” through text-mining anal-ysis of title and/or abstract.
This study of the keywords underlines high variations in authors’ strategy todefine them, this opens many questions on the best practices. A by-product ofthe research could be a set of recommendations that the group could provide toauthors presenting their work in its events.
By adding the citations in the data set, a third network can be formed thatconnects publications. Citation and co-citation analysis methodology is describein [28]
Finally, summarizing the survey realised in order to support these spe-cific analyses, a more generic contribution will consist in the development ofa methodolgical framework to analyse the evolution of a scientific community.
Acknowledgment The authors want to express acknowledgements to all themembers of the EWG-DSS who support this research by they recommendationsand offering access to complete information about events and publications andparticipate in the keywords redefinition process. They also want to thank the(anonymous) reviewers for their caring and informed recommendations concern-ing future work.
References
1. Dargam, F., Ribeiro, R., Zarate, P.: How does the EURO Working Group on DSSinteract? A social academic network analysis 1998-2008. In: Proceedings of the24th European Conference on Operational Research, EURO XXIV, Lisbon (July2010)
2. Bouaziz, R., Simas, T., Dargam, F., Ribeiro, R., Zarate, P.: A Social-AcademicNetwork Analysis of the EURO Working Group on DSS. International Journal ofDecision Support Systems Technologies 2(4), 13-36 (2010)
3. Dargam, F., Ribeiro, R., Zarate, P.: Networking the EWG-DSS: How do we proceednow? (Short Paper). In: Dargam, F., Hernandez, J., Liu, S., Ribeiro, R., Zarate), P.(eds.) Proceedings of the EWG-DSS London-2011 Workshop on Decision Systems,IRIT, Report IRIT/RR-2011-14-FR, Universite Paul Sabatier (June 2011)
4. Dardenne, D., Dargam, F., Linden, I., Liu, S., Ribeiro, R., Sun, W., Zarate, P.:Extending the Analysis of the EURO Working Group on DSS Research Collabora-tion Network (EWG-DSS Collab-Net V.2). In: Proceedings of the 25th EuropeanConference on Operational Research, EURO XXV (Stream: Decision Support Sys-tems), Vilnius, July 8- 11 (2012)
5. Dargam, F., Ribeiro, R., Zarate, P., Liu, S.: A social network perspective of DSSresearch collaboration in Europe. IRIT, Research Report IRIT/RR-2013-27-FR.Universite Paul Sabatier (2013)
6. Dardenne, D.: Analyse de reseaux sociaux Propositions pour des etudes de cas.Master en Ingenieur de Gestion. University of Namur, Faculte des SciencesEconomiques, Sociales et de Gestion, 2011-2012 (2012) (in French)
7. Branco, A.C.S., Dargam, F., Rademaker, A., Souza, R.: Applying Ontology in theAnalysis of a DSS Research Collaboration Network. In: Proceedings of the 25th
Kamineta
Rectangle
166
EWG-DSS publications SNA 9
European Conference on Operational Research, EURO XXV (Stream: DecisionSupport Systems), Vilnius, July 8-11 (2012)
8. Dargam, F., Linden, I., Liu, S., Ribeiro, R., Zarate, P., The Development Roadmapof the EWG-DSS Collab-Net Project: A Social Network Perspective of DSS Re-search Collaboration in Europe, in Decision Support Systems II - Recent Devel-opments Applied to DSS Network Environments. Lecture Notes in Business Infor-mation Processing, Volume 164, 2013, pp 1-18
9. Zarate, P. (Ed). Decision Support Systems : from theory to practice. Journal ofDecision Systems (JDS), Hermes, Vol. 12 (3-4), 2003.
10. Ribeiro, R., Rodriguez, A., Zarate, P.(Eds). Decision Support Systems : CurrentResearch. European Journal of Operational Research (EJOR), Elsevier, Vol. 145(2), March 2003.
11. Dargam, F., Zarate, P. (Eds). Decision Support Systems: Methodologies and Ap-plication. Journal of Decision Systems (JDS), Hermes Science Publications, Vol.15 (2-3), September 2006.
12. Dargam, F., Rodrigues, A. (Eds). Methods and Strategies for Decision and Man-agement Problems. Central European Journal of Operations Research (CEJOR),Springer-Verlag, Vol.14 (4), December 2006.
13. Zarate, P. (Ed). Formal Tools and Methodologies for DSS; European Journal ofOperational Research (EJOR), Special Issue, Vol.195(3), 2009.
14. Zarate, P., Respicio, A. Technologies for Collaborative Decision Making. In Inter-national Journal of Decision Support System Technology (IJDSST), IGI Global,Hershey - USA, Vol. 1 (4), October 2009.
15. Zarate, P., Pino, J. Collaborative Approaches for Multi Decision Makers. In GroupDecision and Negotiation (GDN), Springer, Vol. 20 (1), 2011.
16. Dargam, F., Zarate, P.. Technologies for Collaborative Decision Making.In Inter-national Journal of Decision Support System Technology (IJDSST), IGI Global,Hershey - USA, Vol. 2 (4), Decembre 2010.
17. Dargam, F.; Delibasic, B.; Hernandez, J. E.; Liu, S.(Eds). Special Issue on Network-ing Decision Making and Negotiation (Part 1). International Journal of DecisionSupport System Technology (IJDSST). Vol.4 (2), July - September 2012.
18. Dargam, F.; Delibasic, B.; Hernandez, J. E. ; Liu, S. (Eds) Special Issue on Net-working Decision Making and Negotiation (Part 2). International Journal of De-cision Support System Technology (IJDSST). Vol. 4 (3), July - September 2012.
19. Hernandez, J. E., Zarate, P., Dargam, F., Delibasic, B., Liu, S., Ribeiro, R. De-cision Support Systems:Collaborative Models and Approaches in Real Environ-ments, Springer, Vol. 121, Lecture Notes in Business Information Processing series(LNBIP), Augustus 2012.
20. Blondel, V.D., Guillaume, J.-L., Lambiotte, R., Lefebvre, E., Fast Unfolding ofCommunities in Large Networks, Journal of Statistical Mechanics: Theory andExperiment 2008 (10), P1000.
21. Newman, M.E.J., Coauthorship Networks and Patterns of Scientific Collaboration.Proceedings of the National Academy of Sciences of the United States of America101(1):5200-5205, April 2004.
22. Hou, H., Kretschmer, H and Liu, Z., The Structure of Scientific CollaborationNetworks in Scientometrics, Scientometrics, vol. 75 (2), 189-202, 2008.
23. Babskova, A., Drazdilova, P., Martinovic, J., Svaton, V. and Snasel, V. Evolutionof co-authors Communities formed by Terms on DBLP in Proceedings of 13thInternational Workshop on Databses, Texts, Specifications and Objects, April 2013,pp. 109-118.
Kamineta
Rectangle
167
10 I. Linden and M. Motte
24. Palla, G., Dernyi, I., Farkas, I. and Vicsek, T. Uncovering the Overlapping Com-munity Structure of Complex Networks in Nature and Society Nature 435, 814,(2005).
25. Xie, J., Kelley, S. and Szymanski, B. Overlapping Community Detection in Net-works: the State of the Art and Comparative Study, ACM Computing Surveys, vol.45(4) (2013).
26. Cazabet, R., Takeda, H., Hamasaki, M. and Amblard, F. Using Dynamic Com-munity Detection to Identify Trends in User-Generated Content. Social NetworkAnalysis and Mining, vol. 2(4), 361-371 (2012).
27. Palla, G., Barabsi, A.-L. and Vicsek, T. Quantifying Social Group Evolution Nature446, 664 (2007).
28. Meyer, M., Lorscheid, I., and Troitzsch, K. The Development of Social Simulationas Reflected in the First Ten Years of JASSS: a Citation and Co-Citation Analysis,Journal of Artificial Societies and Social Simulation, 12 (4) 12 (2009).
168
Epistemological Analysis of Decision Making - An Application to Trust
Jacques Calmet1, Pierre Maret2 and Marvin Schneider3,
1 Karlsruhe Institute of Technology (KIT), Germany, [email protected]
Abstract. Decision-making systems based upon multi-agent technology have epistemological implications that are seldom acknowledged. We provide a simple analysis arising from the method, inspired by theorem proving, we have designed along the years. We also specify the link with Web 3.0. The results of this analysis are applied to a new approach to trust making use of securitization. An important consequence of such an approach is to emphasize the interdisciplinary features of decision support systems.
We are concerned with the problem of decision making by multiple collaborating agents for knowledge systems in the framework of Web 3.0, i.e. in situations where knowledge is widely distributed. The goal of this short paper is twofold. The first one is to understand the contents and implications of such a knowledge challenge without restricting it to keywords. In generic wording this is what is called usually epistemology or theory of knowledge. The second one is to investigate the whole trail between a theoretical challenge and the business application. This is what a business plan is expected to do. Although the framework is very generic, we want to outline that it is suitable for addressing one of the main challenges of modern IT: trust.
The epistemological part of this report is based upon previous works [1 and references therein] of us introducing technical contents. Here we outline an analysis resulting from the technical contents. What is also fully new is the model we propose for trust that includes in particular a concept of securitization of trust. We must add as a remark that we are aware that the link between epistemology and knowledge is not as straightforward as suggested by our introduction. This has been much discussed for many years. However, we do not need to enter such discussions for our purposes.
A trivial preliminary remark is to note that very many factors do affect one’s ability to make decisions in the domain of economics. For instance, the doctoral thesis of Anna Dreber Almenberg, entitled "Do sex hormones impact our economic decisions?” was nominated in 2013 for an award of the Stockholm School of
169
Economics. The program of Anna Dreber Almenberg conducts a series of experiments investigating how some sex hormones affect decision-making. Can they make us take more risks, or become more self-sacrificing or more competitive? We will exclude such behavioral facets of the economical investigation from our analysis. However, it could be included in the multi-agent model we select.
2 Web 3.0
Since its origin, between 1990 and 2000, the Web has seen several evolutions. The present one is labeled Web 3.0 (name suggested by John Markoff of the New York Times) and refers to a web more connected (IPV6, HTML5), more open (Web of data, Web of things) and more intelligent (content disambiguation, reasoning).
Tim Berners-Lee, the Web initiator, has described the Semantic Web as a main component of Web 3.0. It aims at describing one of the main features of Web 3.0: a Web of data that can be processed by machines. This means that the Web is now structured when compared to the previous versions.
A recent call for papers of the Semantic Web journal emphasizes an obvious link between Big Data and Semantic Web. It is phrased as follows: “One of the key challenges in making use of Big Data lies in finding ways of dealing with heterogeneity, diversity, and complexity of the data, while its volume and velocity forbid solutions available for smaller datasets as based, e.g., on manual curation or manual integration of data”. Semantic Web technologies are meant to deal with these issues, and indeed since the advent of Linked Data a few years ago, they are becoming central to mainstream Semantic Web research and development. We can easily understand Linked Data as being a part of the greater Big Data landscape, as many of the challenges are the same. The linking component of Linked Data, however, introduces key features for the integration and conflation of data across multiple sources.
This is a fully meaningful description of the problem generated by the huge amount of available data for decision-making in a distributed environment. The integration of the Web of things is an additional facet to this approach, since any Linked Data network must be able to host the connections to Internet objects.
The specification methods lying at the heart of our framework [1] are fully suitable for Web 3.0. The suitability means that we do not have to introduce the features listed previously to specify the Web 3.0 but that they are already built in the framework we are designing. Unfortunately, because of the format of the paper we cannot detail more this fact.
3 Topology
The use of topology in knowledge representation is an old story. For instance, the map of the London underground is nothing else but a topological representation of the existing lines. Nowadays, topology is being used to manage huge data sets as described in [2] for instance. Along similar purposes, we introduced in [3] the
170
concept of logical fibering as an abstract data structure well suited for dealing with huge or smaller data sets. We investigate links between topology and AI along the following lines. Multi-agent system is a concept of distributed AI. The design of advanced models for AI computing faces some well-known challenges. Besides the processing of huge amounts of data one of them is knowledge engineering. This implies especially to define and extend the range of what is computable or not. The traditional solutions were to select specific logics or knowledge management methods as shown by any introductory book on AI. Nowadays, there are attempts to extend the limits of Gödel’s theorem and the variety of Turing machines. These approaches are often summarized under the label of universal AI. There is also an attempt to define specific approaches such as “formal concept analysis”. It is a formal concept in communication between types and attributes with origins in philosophy and sociology.
Epistemology reminds us that a few years ago mathematicians were defining AI as heuristic computing. It looks thus like going backward to rely on methods expressing through mathematical concepts the notion of heuristic computing. Any mathematician knows that fibers are enumerable. Thus, there is a strong motivation to introduce logical fibering as a relevant data structure. Similar arguments are presented in [5] in the framework of essays on scientific and philosophical understanding of foundation of information and computation. Such an analysis belongs obviously to an epistemological approach of the problem. The same author analyses further how basic concepts can be found lying in mathematical description in a paper entitled "From Descartes to Turing: The Computational content of Supervenience". The first author of this paper also pointed out the role played by Descartes "Discourse of the Method" on the early influences of philosophy and mathematics in [6].
The concept of logical fibering makes it possible to define a new type of Turing machine [15]. This provides a solid link between topology and AI computing.
4 Corporate Knowledge, Culture and Trust
The framework we do select in [1] is based upon multi-agent systems. But we have a slightly different definition of what an agent is compared to what most authors have. We introduce an agent oriented abstraction [4] enabling to label as agent humans as well as artifacts. For instance a simple thermostat is an agent since it makes a decision (to find the temperature) and can communicate (to display the temperature). The application to the Internet of Things is then straightforward.
At this stage several epistemological comments are in order. A first one is that systems of agents are in fact societies of agents. To define what kind of society we consider, we have to emphasize that we enforce the paradigm that the societies are defined by the actions of their agents. This means that we rely on the theme of social expectation and on the principles introduced in Sociology by Weber: the actions of the agents determine the society they build and not the converse. Another remark is to distinguish between a society and its governance. It is well understood that (even in everyday life) the governance of a society is a challenging question. It is even more obvious for multi-agent systems since the problem is usually overlooked and society
171
and governance are mixed without analyzing the implications. We make a strong distinction between society and governance. Thus, our framework is suitable for studying social relationship and networking in the context of sociological features for culture and social networks. We state that these are not general implications but as noted in [4] consequences of the method of Weber and its implication with the Theory of Games and Economic Behavior as introduced in 1944 by John von Neumann and Oskar Morgenstern.
The building stones of our implementation are the so-called “Virtual Knowledge Communities (VKC)”. They are tools simple to implement and to reason about [11, 12]. We define a society of agents but not its governance. It is up to the designer of the system to define its governance. In political science, this is usually defined as the proximity and accessibility of the agents and the governing body.
We have shown [11] that this definition of agents is suitable to define a company through its corporate knowledge. Even the communication methodologies among the various entities of a corporation are defined through VKCs.
As for any methodology, the challenges are privacy, trust and security. We will emphasize this for intercultural communications where to enforce trust is mandatory.
The next step is to claim that culture belongs to the corporate knowledge of a nation of an international grouping of countries or of a corporation. We assume the very different approaches to culture that are investigated in various areas nowadays. Linguistic is a distinct one assuming that most troubles arise for an imperfect mastering of the languages. Economists do identify some criteria that are gathered in models and then assessed for a better accuracy. Sociologists are right to suggest that societal organizational features are at the origin of troubles. Philosophers will tend to put more weight on the native way of thinking of cultural groups, taking into account history and geography. Engineers with a solid background in management may propose meaningful changes in the decision making process. We do not claim that we have a new approach to what culture is. We simply claim that we can adopt any of these approaches, transform it into a knowledge management process that can be abstracted as Abstraction-Based Information Technology along the following lines:
• A theory is an ontology, • The control means to infer facts from this ontology. It is a decision making
process, • The environment consists in specializing these facts to a specific cultural
group. Trust and culture did attract much attention in Sociology. A very rich book [13] is
restricted to French-German cooperation but displays a large collection of intercultural troubles that are easy to find and difficult to solve. Although Germany and France do collaborate extensively for many years now, their collaboration is still prone to acute troubles. Paper [14] reports on trust and culture in virtual organizations. It is only one among many reports devoted to this topic. These two documents [13, 14] are written by sociologists in the framework of sociology. Our goal is to solve similar conflicts but with tools from Artificial Intelligence. The knowledge detained by people belonging to an organization is part of the corporate knowledge. Additional knowledge is detained within the IT system. Moreover,
172
corporate knowledge is composed of some communication means for exchanging information. Considering the definition of the VKC abstraction, we claim that it is a convenient abstraction for Corporate Knowledge. Indeed, VKC strongly supports the principle of autonomy of actors (individuals as well as artifacts). Actors hold knowledge and decision ability (algorithm). Thus, VKC allows building corporate knowledge in a bottom-up approach, which is fully compliant with real world processes and which can be implemented for fuzzy but effective knowledge exchanges and management. In [11, 12] we showed how to model corporate knowledge using VKCs. The latter look like knowledge bases and can be thought of as knowledge systems also.
5 Securitization of Trust
In our approach trust has several facets. Most of them are related to the context that can affect the belief in a “statement”. In most cases the context can be represented by knowledge bases, in our model VKCs. Then, trust results from the exchange, sharing and mixing of knowledge bases. These operations can be disturbed by any intruder thus the idea to distribute knowledge as done for assets in finance using securitization. To start from we simply rely on definitions provided by Wikipedia: “Securitization is the financial practice of pooling various types of contractual debt such as residential mortgages, commercial mortgages, auto loans or credit card debt obligations and selling said consolidated debt as bonds, pass-through securities, or collateralized mortgage obligation (CMOs), to various investors. The principal and interest on the debt, underlying the security, is paid back to the various investors regularly. Securities backed by mortgage receivables are called mortgage-backed securities (MBS), while those backed by other types of receivables are asset-backed-securities (ABS)”.
The concept has been made famous during the sub-primes crisis. But, it was already introduced in the area of international relation by the so-called Copenhagen’s school as a synthesis of constructivist and classical political realism in an approach to international security [7]. This is not far away from the domain of trust that we investigate. It also implies a strong semantic meaning for each involved concept.
Another interesting recent piece of work is in the domain of re-insurance and achieved at the London School of Economics by Barrieu and Louberge [8]. They consider a simplified economy composed of three different types of agent, namely an insurer, a reinsurer and a representative investor. The exposure of the insurer can be diversified within a larger portfolio. The reinsurer can transfer part of its risk to the capital markets by sponsoring an insurance related bond. The decision criterion is based upon existing regulations. More precisely, the different agents considered assess their risk using a convex risk measure. For the sake of simplicity, they consider entropic risk measures in order to derive explicit formulae for the different quantities involved. In our framework, we can use well-known concepts of information theory. In information theory, Shannon entropy represents the information content of a message or, from the receiver point of view, the uncertainty about the message the sender produced prior to its reception. The Kullback-Leibler distance or relative entropy can be used to define a “distance” between two discrete sets. Basic definitions
173
can be found in [9]. A more general introduction to the relationship between entropy and knowledge is given in [10].
At this stage it is worth asking whether such ideas are relevant or not in economy. A supporting idea is in fact provided by the announcement by the Nobel committee of the laureates in 2013 for trend spotting in assets market. It is as follows: "There is no way to predict the price of stocks and bonds over the next few days or weeks. But it is quite possible to foresee the broad course of these prices over longer periods, such as the next three to five years. These findings, which might seem both surprising and contradictory, were made and analyzed by this year’s Laureates, Eugene Fama, Lars Peter Hansen and Robert Shiller”. This award unifies two lines of thinking that may be seen as opposite. We interpret it as a proof that there is a need to further the concept of trust and investigate new approaches.
A key remark is that trust results from sharing and exchanging knowledge bases. Thus, the link to our epistemological analysis ought to be now clear. Another link is the fact that we must be able to store very large amount of data. To this end, we use logical fibering as abstract data structures. Another feature is that logical fibering can be tailored to carry values of selected function as it is done for securitization in financial mathematics.
6 Draft of a Business Plan
The main steps of a business plan as taught in any business school cover well-known domains. A first one deals with the market environment and assesses the macro-economical environment, the market size, the consumer behaviors and an analysis of the competitive situation. A second one is more specific for the product under consideration. It evaluates the product, the localization or place, the price and the marketing or promotion expectations. The third one is usually referred to as SWOT (Strengths, Weaknesses, Opportunities and Threats) [16]. It covers both the external and internal criteria that an enterprise must face, including regulations and laws. Finally there is usually a finance plan covering between 1 and 5 years of business activities.
At this stage we do not want to fine analyze a business plan for Web-based business. A first remark is that if no company can start without a business plan, it usually proves itself to be inaccurate within the first months of activities, even when the company is successful. Such a comment is routinely made by most of business founders but usually not written down. This is a weakness that can be corrected. Indeed, each of the points mentioned in a business plan is a decision making step. We claim that having decision making modeled as theorem-proving process formalizes most of the steps of a business plan (once a product has been selected) and thus there is hope of a more meaningful business plan.
As mentioned previously the discourse on the method of Descartes is probably the first business plan presented to get a financial support. That it is mathematically oriented is almost trivial when translating "essences" into "axioms".
A complementary remark is that Virtual Knowledge Communities (VKCs) are fully suitable to represent each step of a business plan. Then, the trust model outlined
174
in this paper ought to increase the confidence level given to a business plan. This arises from the fact that any company can be modeled through VKCs and such a fact provides the skeleton of a business plan. More precise characteristics can be introduced as annotations within the logical fibers.
7 Conclusion
We have broadly outlined several concepts that arise from an epistemological analysis of decision-making system based on a specific multi-agents and theorem-proving technology and web-based communities. The resulting framework is fully suited for group making decision since each agent in the game can be regarded as carrying one decisions making actor. It is tailored for Web 3.0 because we do not distinguish between artifacts and humans and thus can readily model the Internet of Things. Due to the required format of the paper and to the large multi-disciplinary scope of the problem, it is not possible to get into technical details.
Works in progress on logical fibering applied to the identification of denial of service attacks [15] and on the design of an Erasmus coach will bring more understanding. The topic of securitization of trust will also be better described in a forthcoming publication.
The main lesson to be learned from this brief outline is that it is not possible to ignore the epistemological consequences of decisions based upon some fashionable keywords. To put it gently, let us add that one cannot use a multi-agent system without understanding the conditions arising from the gathering of such agents into a society.
Acknowledgements: The authors thank the anonymous referees for interesting comments on the original version. The have been partly acknowledged but not fully because of the required format of the paper.
References
1. Calmet, J., Schneider, M.: Decision Making Modeled as Theorem Proving Process, International Journal of Decision Support System Technology (IJDSST), 4(3), pp. 1--11 (2012)
2. Morozov, D., Weber, G.: Distributed Merge Trees, In: 18th ACM SIGPLAN symposium on Principles and practice of parallel programming, pp. 93--102, ACM, New York, USA (2013)
3. Calmet, J., Schneider, M.: Logical Fibering and Knowledge Bases, International Journal of Computer Science and Applications (IJCAS), Vol. 9, No. 2, pp. 42--52 (2012)
4. Calmet, J., Maret P., Endsuleit, R.: Agent Oriented Abstraction, Revista Real Academia de Ciencias (Madrid), Special Volume on Symbolic Computing and Artificial Intelligence, Vol. 98, No. 1, pp. 77--83 (2004)
5. Cooper, S.B.: Incomputability after Alan Turing, Notices of the American Mathematical Society, Volume 59, Number 6, pp. 776--784 (2012)
175
6. Calmet, J.: Foreword on the Relationship of Computer Algebra with Mathematics and Physics, AMAI vol. 64, Issue 4, pp. 337--342 (2012)
7. Williams, M.C.: Words, Images, Enemies, Securitization and International Politics, International Studies Quarterly, Issue 47, p. 512, (2003)
8. Barrieu, P., Louberge, H.: Reinsurance and Securitization of Life Insurance Risk: The Impact of Regulatory Constraints, Insurance: Mathematics and Economics, 52 (2) pp. 135--144 (2013). Also available at http://ssrn.com/abstract=1965398
9. Calmet, J., Calmet, X.: Distance between physical theories based on information theory. Modern Physics Letters A, Vol. 26, No. 5, pp. 319--323 (2011)
10. Xu, W., Zhang X., Zhang, W.: Knowledge granulation, knowledge entropy and knowledge uncertainty measure in ordered information system. Applied Soft Computing, 9.4, pp. 1244--1251 (2009)
11. Maret, P., Hammond, M., Calmet, J.: Virtual knowledge communities for corporate knowledge issues, LNCS 3451, pp. 33--44, Springer, Heidelberg (2004)
12. Maret, P., Calmet, J.: Agent-based knowledge communities, International Journal of Computer Science and Applications, Vol. 6, No. 2, pp. 1--18 (2009)
13. Plateau, J.: Une étrange alchimie: La dimension interculturelle dans la coopération franco-allemande. Cirac Pub., Cergy-Pontoise (1998)
14. Grudzewski, W.M., Hedjuk, I.K., Sankowska, A., Wantuchowicz, M.: Trust Management in Virtual Work Environments: A Human Factors Perspective. Series: Ergonomics Design and Mgmt. Theory and Applications. Volume: 2. Taylor and Francis CRC Press, Boca Raton (2008)
15. Calmet, J., Schneider, M.: Logical Fibering: Abstract Data Structure and the Fibered Guard Application, forthcoming preprint (2014)
16. Porter, M.E.: The Five Competitive Forces that Shape Strategy. Harvard Business Review, pp. 86--104 (2008)
176
Towards a Web-Based Spatial Decision Support System
for the Multiple Capacitated Facility Location Problem
Nikolaos Ploskas1, Jason Papathanasiou
2, Nikolaos Samaras
1
1 Department of Applied Informatics, School of Information Sciences, University of
Macedonia, 156 Egnatia Str., 54006 Thessaloniki, Greece 2 Department of Business Administration, School of Business Administration, University of
Abstract. The Graph Model for Conflict Resolution is modified tomodel misperception of preferences by decision makers (DMs) in a con-flict. DMs’ relative preferences are represented by pairwise comparisonsof possible states in a conflict. A two step procedure is presented to as-certain equilibria of the modified graph model. The Cuban Missile Crisisis utilized to illustrate the applicability of the modified graph modelapproach.
A conflict is a condition in which there is a situation of opposition and partieswith contrasting goals affect each other [1],[2],[3],[4],[5]. A number of approacheshave been proposed to model real world disputes such as metagame analysis[6], conflict analysis [1], and the Graph Model for Conflict Resolution (GMCR)[2],[7],[8]. GMCR is capable of graphically representing all the possible movesand countermoves among decision makers (DMs), and can predict possible com-promise resolutions for the conflict by using a range of solution concepts [9],[10], [11], [12]. A common feature of all of the aforementioned approaches is thatthey can represent and analyze any real world dispute under the assumption ofcomplete information.
2 Background
This research considers a conflict model involving incomplete information,namely, a hypergame [13]. This approach allows one to model any dispute basedon the way a certain DM views the situation of the conflict; as a result, different
201
2 Yasir M. Aljefri, Liping Fang, Keith W. Hipel
perceptions among DMs are developed, different games are played, and differ-ent resolutions are reached. The notion of the hypergame goes back to [13], [14]in which a general model for the theory of hypergames was established. Subse-quently, Wang et al. [15] enhanced the theory of hypergames by developing aclear mathematical model and practical processes for conducting the individualstability analysis and the group equilibria. Furthermore, Wang et al. [16] pre-sented a comprehensive development of the theory of hypergames. The goal ofthis paper is to develop an approach for modeling and analyzing misperceptionof preferences by DMs within the GMCR framework. In particular, the first levelhypergame involving misperception of preferences is considered.
3 Modified Graph Model for Modeling Misperception ofPreferences
The present work addresses the simplest class of the first level hypergame, whichis misperception of preferences by DMs [16]. In this situation, one or more of theDMs misperceive other DMs’ preferences. Other components of the game suchas options, strategies, and the set of feasible states are not susceptible to anymisperception.
Fig. 1 shows the procedure for forming the modified graph model incorpo-rating consideration of preference misperception. As can be seen, the first foursteps are the same as the ones used in the standard graph model [2],[7],[8]. How-ever, Step 5, in which the DMs’ relative preferences are obtained, is modified tohandle the way each DM views his or her opponents’ preferences. Without lossof generality, it is assumed in this paper that all DMs correctly view their ownpreferences, and the set of the states are defined by using the option form [1],[2].
Op#ons'
Decision'Makers'
States'
State'Transi#ons'
Rela#ve'Preferences'
Integrated'Graph'Model'
Mispercep#on'of'Preferences''
Step%1%
Step%2%
Step%3%
Step%4%
Step%5%
Step%6%
Fig. 1. Modified graph model for modeling misperception of preferences
Kamineta
Rectangle
202
Misperception of Preferences 3
3.1 Formal Definitions
A 2-DM modified graph model that can model misperception about preferencescan be represented by individual games as expressed in Eq. (1); moreover, it canalso be described by a 4-tuple as shown in Eq. (2):
G = Gk, k ∈ N (1)
Gk = N,S, ki ,k
j , Ai, Aj (2)
The notations are explained as follows. Gk is the game perceived by DMk,k ∈ N . N = i, j is the set of DMs. S is a non-empty, finite set, called theset of feasible states, which denotes the vertex set. The binary relationship k
i
is DMi’s preference as perceived by DMk. Similarly, kj is DMj ’s preference as
perceived by DMk. Finally, for each DMk ∈ N,Ak ⊆ S × S = (s1, s2) ∈ S isDMk’s set of directed arcs, which contains the movements in one step controlledby DMk.
The preference relationships for the modified graph model share the sameproperties as those of the standard graph model [2]; on the other hand, they donot share the same properties as those of theory of hypergames [16]. That is, themodified graph model uses pairwise comparisons to represent DMs’ preferencesand as a result, is able to handle both transitive and intransitive preferences.However, the theory of hypergame represents DMs’ preferences by ordinal rank-ing, and as a result, can only handle transitive preferences. The preference re-lationships for the modified graph model are defined below for DMj as seen byDMk.
For any given DMk ∈ N , a preference structure over the set of states can berepresented by a pairwise comparison between any two states. A complete andreflexive weak preference relationship (k
j ) consists of two binary relationships
kj ,∼k
j . For any pair of states s and q ∈ S, DMj strictly prefers q over s as
perceived by DMk q kj s if and only if (iff) q k
j s, but not s kj q. However, if
DMj is indifferent between s and q as perceived by DMk s ∼kj q, then s k
j q,
and q kj s must be true. It is assumed that, k
j ,∼kj is strongly complete; i.e.,
for any s, q ∈ S, at least one of the following conditions is true: s kj q, q k
j s,
or s ∼kj q.
3.2 Stability Analysis
Under the modified graph model for preference misperception, the hypergameequilibria can be obtained in two steps [15] as shown in Fig. 2. In Step 1, the indi-vidual games that are played by both of DMi and DMj are analyzed by using thestandard stability analysis. As a result, individual stabilities and equilibria canbe determined. A variety of solution concepts including Nash stability (Nash),general metarationality (GMR), symmetric metarationality (SMR), and sequen-tial stability (SEQ) has been defined within the GMCR framework [2],[7],[8]. In
Kamineta
Rectangle
203
4 Yasir M. Aljefri, Liping Fang, Keith W. Hipel
Step 2, hypergame equilibria are ascertained. A state is a first level hypergameequilibrium for a given solution concept [2],[7],[8] if it is stable for DMk in hisor her own game in Step 1 for k ∈ i, j under the particular solution concept.
DMi’s Individual Stability in DMi’s Game
DMj’s Preferences as Perceived by DMi
DMj’s Individual Stability in DMj’s Game
DMi’s Preferences as Perceived by DMj
DMi’s Own Preferences
DMj’s Own Preferences
Standard'Solu+on'Concepts'
Standard'Solu+on'Concepts'
Hypergame'Equilibria'
Group'Stability''
Step 2
Step 1
DMi’s'Game' DMj’s'Game'
Fig. 2. First level hypergame equilibria
4 Case Study: The Cuban Missile Crisis
4.1 Background
In 1957, which was during the dictatorial reign of Batista, the United States ofAmerica (US) had control of most of the Cuban economy. As a result, many UScompanies had invested in the Cuban agriculture and tourism industries. How-ever, in 1959, the Batista regime was overthrown by the educated middle classcommunist Fidel Castro. During his reign, most of the US investments in Cubawere nationalized and a strong relationship with the Soviet Union (USSR) wasestablished. In October 1962, upon learning that the USSR had been installingmissiles just over 90 miles off the American mainland, the US considered a num-ber of different responses. The USSR was motivated to install missiles in Cubafor several reasons. One reason was to use it as a negotiation tool with the US toforce it to dismantle its missiles in Turkey and Italy. Further information aboutthe dispute can be found in [17],[18],[19],[1].
4.2 Modified Graph Model for the Cuban Missile Crisis
Two DMs are identified for the Cuban missile crisis: the US and the USSR. Asof October 14, 1962, the US had two options: execute a surgical air strike or
Kamineta
Rectangle
204
Misperception of Preferences 5
impose a blockade. The USSR also had two options: withdraw its missiles fromCuba or escalate the dispute.
In an option form, an option can be selected or not. Thus, the total num-ber of possible states for the dispute can be mathematically calculated as2Numberofoptions. In this dispute, this comes to 24 = 16. However, after removingthe infeasible states, only 12 states remain. Table 1 lists the feasible states for theCuban missile conflict. As can be seen in Table 1, each column that is composedof “Y” or “N” stands for a possible state or scenario that may happen in reallife. Y indicates “yes”, which means that the option opposite the Y is selectedby the DM who controls it. N stands for “no”, and means that the option is nottaken.
Table 1. Feasible States in the Cuban Missile Crisis
The preference relationships for the Cuban missile crisis are obtained basedon the analysis provided by [17],[18],[19],[1]. The US preference relationship isbased on the concern of avoiding the conflict evolving into nuclear war, andthe desire for the USSR to withdraw its missiles. Therefore, the preference re-lationship for the US is found to be transitive and can be expressed by ordinalpreferences (most to least preferred) as 〈5 7 6 8 3 2 4 1 12 10 11 9〉. Moreover, the USSR also wishes to avoid nuclear war, and wishesalso to avoid escalating the conflict if no surgical air strike is started first by theUS. As a result, the preference relationship for the USSR is expressed also byordinal preferences as 〈1 5 7 3 6 2 8 4 12 10 11 9〉.One can use the preference relationships for both the US and the USSR tocarry out the stability analysis under GMCR. However, the Cuban Missile Cri-sis encounters a very common form of hypergame, which is that one of theDMs misinterprets his or her opponent’s preferences, yet none of the DMs areaware of any misinterpretation happening. As a result, the modified graph modelfor preference misperception must be used to conduct the stability analysisand calculate the hypergame equilibria. In particular, the USSR misinterpretsthe US preference relationship over the set of feasible states. As illustrated in[1],[17],[18],[19], the USSR did not expect a strong response from the US re-garding installing the USSR missiles in Cuba. As a result, the preference re-lationship for the US is modified based on the USSR’s perspective; that is〈5 1 7 3 6 2 8 4 12 10 11 9〉. Fig. 3 shows theintegrated graph model for the Cuban Missile Crisis, which is composed of the
Kamineta
Rectangle
205
6 Yasir M. Aljefri, Liping Fang, Keith W. Hipel
graph model for movements as shown at the top and preference information asperceived by two DMs at the bottom.
Fig. 3. Modified graph model for the Cuban missile crisis
4.3 Stability Analysis and Equilibria
In this section, the stability analysis and compromise resolutions are identifiedbased on the modified graph model for preference misperception. The two stepexplained in Section 3.2 can be used to ascertain the hypergame equilibria. Thefirst step is to find the individual stability for both the US and the USSR. Thiscan be accomplished by analyzing the dispute based on how each DM sees it andby using the standard soluation concepts. Table 2 shows the individual stabilityand the equilibria results for the US game. As can be seen, states 1, 2, 3, 6, and 8are found to be weak equilibria for the dispute; that is, they are equilibria underboth GMR and SMR solution concepts. In contrast, states 5 and 7 are found tobe the strong equilibria for the dispute; that is, they are also equilibria under theSEQ solution concept. On the other hand, Table 3 shows the individual stabilityand the equilibria results for the USSR game. States 2, 3, 5, 6, 7, and 8 are foundto be weak equilibria, and state 1 is found to be the strong equilibrium. That is,it is also equilibrium under Nash and SEQ solution concepts. After determiningthe individual stability analysis for both of the US and the USSR, one can easilycalculate the hypergame equilibria, which is the second step. Table 4 shows theequilibria results for the first level hypergame. States 1, 2, 3, 5, 6, and 8 are foundto be the weak equilibria, and state 7 is found to be the only strong equilibrium.State 7 is predicted to be a strong equilibrium under the US game in Table 2,
Kamineta
Rectangle
206
Misperception of Preferences 7
but not under the USSR game in Table 3. That is, the USSR misperceives theUS preferences; as a result, faces a surprise during the dispute.
The modified graph model for preference misperception was defined and a twostep procedure for identifying the first level hypergame equilibria was presented.The Cuban missile crisis was used to illustrate the foregoing development. Future
Kamineta
Rectangle
207
8 Yasir M. Aljefri, Liping Fang, Keith W. Hipel
work is needed to enhance the proposed model. More specifically, the model couldbe improved to handle different degrees of misperception among DMs. It is alsoworth investigating the possibility of modeling different forms of misperception,namely misperception about options and the DMs participating in the disputewithin the structure of the GMCR.
References
1. Fraser, N.M., Hipel, K.W.: Conflict Analysis: Models and Resolutions. North-Holland, New York (1984)
2. Fang, L., Hipel, K.W., Kilgour, D.M.: Interactive Decision Making: The GraphModel for Conflict Resolution. Wiley, New York (1993)
3. Hipel, K.W., ed.: Conflict Resolution. Volume 1. Encyclopedia of Life SupportSystems. Eolss Publishers, Oxford, UK (2002)
4. Hipel, K.W., ed.: Conflict Resolution. Volume 2. Encyclopedia of Life SupportSystems. Eolss Publishers, Oxford, UK (2002)
5. Kilgour, D.M., Eden, C.: Introduction to the Handbook of Group Decision andNegotiation. Springer, Dordrecht (2010)
6. Howard, N.: Paradoxes of Rationality: Theory of Metagames and Political Behav-ior. MIT Press, Cambridge, MA (1971)
7. Fang, L., Hipel, K.W., Kilgour, D.M., Peng, X.: A Decision Support System forInteractive Decision Making-Part I: Model Formulation. IEEE Transactions onSystems, Man, and Cybernetics, Part C: Applications and Reviews 33(1) (2003)42–44
8. Fang, L., Hipel, K.W., Kilgour, D.M., Peng, X.: A Decision Support System forInteractive Decision Making-Part II: Analysis and Output Interpretation. IEEETransactions on Systems, Man, and Cybernetics, Part C: Applications and Reviews33(1) (2003) 56–66
9. Kilgour, D.M., Hipel, K.W., Fang, L.: The Graph Model for Conflicts. Automatica23(1) (1987) 41–55
10. Kilgour, D.M., Hipel, K.W.: The Graph Model for Conflict Resolution: Past,Present, and Future. Group Decision and Negotiation 14(6) (2005) 441–460
11. Inohara, T., Hipel, K.W.: Coalition Analysis in the Graph Model for ConflictResolution. Systems Engineering 11(4) (2008) 343–359
12. Inohara, T., Hipel, K.W.: Interrelationships among Noncooperative and CoalitionStability Concepts. Journal of Systems Science and Systems Engineering 17(1)(2008) 1–29
13. Bennett, P.G.: Toward a Theory of Hypergames. Omega 5(6) (1977) 749–75114. Bennett, P.G.: Hypergames: Developing a Model of Conflict. Futures 12(6) (1980)
489–50715. Wang, M., Hipel, K.W., Fraser, N.M.: Modeling Misperceptions in Games. Behav-
ioral Science 33(3) (1988) 207–22316. Wang, M., Hipel, K.W., Fraser, N.M.: Solution Concepts in Hypergames. Applied
Mathematics and Computation 34(3) (1989) 147–17117. Fraser, N.M., Hipel, K.W.: Dynamic Modelling of the Cuban Missile Crisis. Con-
flict Management and Peace Science 6(2) (1982) 1–1818. Abel, E.: The Missiles of October: The Story of the Cuban Missile Crisis, 1962.
MacGibbon & Kee, London (1966)19. Allison, G.T., Zelikow, P.: Essence of Decision. Longman, New York (1971)
Kamineta
Rectangle
208
Graph Model for Conflict Resolution withUpper and Lower Probabilistic Preferences
Andrea Maria dos Santos1,2 and Leandro Chaves Rego2
1 Federal Institute of Education, Science and Technology of Pernambuco, PE 60, km14, California, 55590-000, Ipojuca, PE, Brazil,
2 Federal University of Pernambuco, Statistics Department, Cidade Universitaria,50740-540 Recife, PE, Brazil
Abstract. We generalize the Graph Model for Conflict Resolution(GMCR), introducing the possibility of decision makers expressing theirpreferences among the possible conflict scenarios using upper and lowerprobabilities. After we introduce the model, we propose stability defini-tions (solution concepts) that are generalizations of the four standardstability notions commonly used in the GMCR model and relations be-tween these definitions are stated. We deal with conflict situations thatinvolve two decision makers. An application of the proposed model ispresented and the analysis of this application highlights the advantagesgained by allowing individuals to have the uncertainty about their ownpreferences expressed by upper and lower probabilities.
Key words: Graph Model for Conflict Resolution, Solution Concepts,Upper and Lower Probabilities, Probabilistic Preferences
1 Introduction
According to Kilgour and Hipel [1], a strategic conflict is an interaction amongtwo or more decision makers (DMs) who make choices that together determinehow the interaction evolves and each DM has preferences over the final state,or resolution. There are many different approaches in negotiation research fordealing with conflicts and they come from different fields such as operationsresearch, computer science, psychology, political economy, systems engineering,social choice theory and game theory. These approaches address issues that spanfrom how to design a reliable and efficient e-negotiation system [2] to the un-derstanding of the role of emotions in negotiations [3]. The Graph Model forConflict Resolution (GMCR) is a relevant technique, based on some importantgame theory concepts [4], to represent conflicts. It was presented by Kilgour etal. [5], and is an enhancement of the conflict analysis of Fraser and Hipel [6] andmetagames analysis [7].
After defining the structure that represent the conflict, an important step isthe stability analysis. In this step, the decision maker’s preference has a funda-mental role, since his possible moves from one state to another one is directly
209
2 Santos and Rego
determined by his preferences over the states. However, it is not always the casethat these preferences are clear or precise. Several generalizations of the GMCRtry to capture other preference features that can better model real world sit-uations. New preference structures are introduced, for example, in Li et al. [8]and Li et al. [9] (preference uncertainty for two-DM and multi-DM conflicts,respectively), Al-Mutairi et al. [10] (fuzzy preferences) and Hamouda, Kilgourand Hipel [11] (preference degree). Another formal approach to model prefer-ence uncertainty is to use probabilistic preferences. Campello [12] argumentsthat the use of such preferences can accommodate the fluctuations of behaviorin the choices of individuals. Rego and Santos [13] introduced probabilistic pref-erences into GMCR, allowing for the possibility of decision makers expressingtheir preferences for state a over state b by the precise probability P (a, b). Here,we called such a case precise probabilistic preferences. However, in some situa-tions there may be not enough information to determine a precise probabilitythat express the decision maker’s preferences, i.e, the probabilistic preferencecan be imprecise.
We present here a generalization of the GMCR allowing the DMs to expresstheir preferences using upper and lower probabilities [14]. The paper is organizedas follows: in Section 2, we make a brief review of the literature about upperand lower probabilities; in Section 3, we propose the GMCR with impreciseprobabilistic preferences for two DMs and we present new stability definitionsfor the proposed model; in Section 4, we present an application of the proposedmodel; and we conclude with final remarks on Section 5.
2 Review of literature
Situations in which individuals must make a decision have been modeled con-sidering that they can be uncertain about the available scenarios and possibleresults of their actions. Here, the uncertainty is not about scenarios or actions’consequences, but the DM has uncertainty about his own preferences.
In the field of modeling beliefs, the most highly developed theory is theBayesian theory. In this theory, beliefs are modeled by an unconditional proba-bility P (A) or by a conditional probability P (A|B), which are precise numbersbetween zero and one. At first, the Bayesian theory can be applied in any prob-lem involving uncertainty, but in practice it is difficult to satisfy all coherenceconditions in order to determine precise probabilities [15]. In situations of realworld, it is common that individuals express their preferences by linguistics as-sessments that can be vague.
Fine [14] sees the Bayesian theory as one that has an important role inmodeling individuals beliefs, but questions the necessity of a precise measureof probability to represent real situations and arguments that upper and lowerprobabilities can be an alternative to model individual beliefs without a high levelof precision. The theory of upper and lower probability is centered on a pair offunctions P and P , taking values in the unit interval, where P denotes the lowerprobability and P the upper probability. The approach is similar to standard
Kamineta
Rectangle
210
GMCR with Upper and Lower Probabilistic Preferences 3
probability measure, considering a sample space Ω and an algebra event A of Ω.A is the domain of the functions P and P and these must satisfy the followingaxioms:
1. P (A) + P (Ac) = 1;2. P (Ω) = 1;3. P (A) ≥ 0;4. If A and B are disjoint events, then P (A ∪B) ≥ P (A) + P (B) and P (A) +
P (B) ≥ P (A ∪B).
Probabilistic models of preferences have a long history. Luce [16] develops aprobabilistic utility model in which P (a, b) represents the probability that theDM strictly prefers the alternative a over b when presented to choose one ofthem. In such model, it is assumed that the choices of DMs have some kindof regularity that enable such preference to be modeled by a precise probabilitydistribution. However, as in the case of modeling beliefs, it is not always possibleidentify precisely such probabilistic preference. Here, we propose to relax theassumption of precision and propose a new preference model based on upperand lower probabilities. Such upper and lower probabilistic preference functionshave common domain S × S and must satisfy:
1. P (a, b) ≥ P (a, b) ≥ 0 for each a, b ∈ S,2. P (a, b) + P (b, a) ≤ 1 for each a, b ∈ S.
3 GMCR with imprecise probabilistic preferences
GMCR consists of a collection of graphs (S,Ai), one for each DM i ∈ N =1, 2, 3, . . . , n, where all the graphs have the same set of vertices or nodes,S = 1, 2, . . . , s, representing the possible states of the conflict. The set of arcsAi of the graph (S,Ai) represent the possible transitions that DM i can makefrom one state to another according to his available options. The set of statesthat DM i can achieve from a determined state s in a single step is denoted byRi(s), i.e., Ri(s) = t ∈ S : (s, t) ∈ Ai.
In the original GMCR, the preference is represented without uncertainty,as it is usual in models of game theory. In GMCR with precise probabilisticpreferences introduced by Rego and Santos [13], it is allowed that the preferencecan be non-deterministic, i.e., a DM i can express his preference for a state aover a state b, using the probability Pi(a, b), which indicates the chance of DM ichoosing state a over state b, for every pair of states a and b in a conflict. Now,we consider that each DM i can express his uncertainty about his own preferencebetween states a and b using lower and upper probabilities, P i(a, b) and P i(a, b),that satisfy the axioms presented in Section 2. Thus, if the current state of theconflict is a, a DM i imprecise probabilistic preference for state a over state b isrepresented now by the pair of lower and upper probabilities P (a, b) and P (a, b),respectively.
Kamineta
Rectangle
211
4 Santos and Rego
3.1 Stability Definitions for Conflicts with Two DMs
The stability analysis has a important role because it leads to determine solutionsfor the conflict. Here, we modify the following definitions: Nash stability [17, 18],general metarationality (GMR) [7], symmetric metarationality (SMR) [7] andsequential stability (SEQ) [6].
The stability definitions proposed here consider two profiles for the DMs: thecautious and the risky. The cautious DM is the one that acts always consideringthe lower probabilistic preference when analyzing his own choice and considersthat the other DM acts always considering the upper probabilistic preference.As an example, suppose that a cautious DM knows that his lower and upperprobabilistic preferences for chocolate ice cream over strawberry ice cream is,respectively, 0 and 0.6. As he knows that it is possible that his probabilisticpreference is equal to zero, i.e. he knows that it is possible that he does notprefer chocolate over strawberry, for caution, he prefers to consider this lowerprobability. The cautious DM is averse to ambiguity. On the other hand, the riskyDM is the one that acts always considering the upper probabilistic preferenceswhen analyzing his own choice and considers that the other DM acts alwaysconsidering the lower probabilistic preferences.
As in GMCR with precise probabilistic preferences, for the stability defini-tions, we consider parameters α, β and γ in the interval [0, 1]. Now, we definetwo notions of improvement for a DM: a notion for the cautious DM and an-other for the risky DM. The set of improvements for a cautious DM is definedas RL+γ
i (s) = t ∈ Ri(s) : P i(t, s) > γ, while the set of improvements for arisky DM is defined as RU+γ
i (s) = t ∈ Ri(s) : P i(t, s) > γ. We also define thesets φL+γ
i (s) = t ∈ S : P i(t, s) > γ and φU+γi (s) = t ∈ S : P i(t, s) > γ
of the states (not necessarily achievable from s) that are preferred over s bya cautious and a risky DM i, respectively. Note that RL+γ
i (s) ⊆ RU+γi (s)
and φL+γi (s) ⊆ φU+γ
i (s), since if s1 ∈ RL+γi (s) or s1 ∈ φL+γ
i (s), thenP i(s1, s) > 1 − α and, therefore, it is true that P i(s1, s) > 1 − α. Thus,s1 ∈ RU+γ
i (s) or s1 ∈ φU+γi (s), respectively.
Table 1 shows what conditions a state s must satisfy in order to be cautiousstable according to each stability definition. Thus, for example, a state s iscautious α-Nash stable for DM i if among all the states that i can achieve whenhe is in s there is no state such that he prefers to s with lower probability greaterthan 1−α. For example, a state s that is cautious 0.9-Nash stable for DM i is suchthat among all the states that i can achieve from s there is none that i prefersto s with lower probability greater than 0.10. The interpretations of the othercautious stability notions are similar. The risky stability definitions are easily
obtained by replacing, in Table 1, RL+(1−α)i (s), φL
+(1−β)i (s) and RU+γ
j (s1) by
RU+(1−α)i (s), φU
+(1−β)i (s) and RL+γ
j (s1), respectively.
3.2 Relations Among Stability Definitions and Other Results
Based on the standard stability definitions of the GMCR model [19], Rego andSantos [13] presented some relations among the precise probabilistic stability def-
Kamineta
Rectangle
212
GMCR with Upper and Lower Probabilistic Preferences 5
Table 1. Conditions for state s be Cautious stable for DM i
initions. Such relationships remain valid when considering the stability notionsdefined in the previous section. The proof is very similar the proof presented
in [13], replacing R+(1−α)i (s), φ
+(1−β)i (s) and R+γ
j (s1), in the cautious case, by
RL+(1−α)i (s), φL
+(1−β)i (s) and RU+γ
j (s1), respectively, and in the risky case, by
RU+(1−α)i (s), φU
+(1−β)i (s) and RL+γ
j (s1), respectively.The next result shows that if a state is risky stable for a determined set of
parameters considering some stability definition, then it is also cautious stableconsidering the same stability definition and the same set of parameters.
Theorem 3.1 (a) If a state s is risky α-Nash stable for DM i, then s is cautiousα-Nash stable for DM i.
(b) If a state s is risky (α, β)-Metarational stable for DM i, then s is cautious(α, β)-Metarational stable for DM i.
(c) If a state s is risky (α, β)-Symmetric Metarational stable for DM i, then sis cautious (α, β)-Symmetric Metarational stable for DM i.
(d) If a state s is risky (α, β, γ)-Sequentially stable for DM i, then s is cautious(α, β, γ)-Sequentially stable for DM i.
Proof: For (a), suppose that s is risky α-Nash stable for DM i, then it fol-
lows that RU+(1−α)i (s) = ∅. Since RL
+(1−α)i (s) ⊆ RU
+(1−α)i (s), we have that
RL+(1−α)i (s) = ∅. Thus, s is cautious α-Nash stable for DM i.For (b), suppose that s is risky (α, β)-Metarational stable for DM i. Then,
∀s1 ∈ RL+(1−α)i (s) ⊆ RU
+(1−α)i (s), ∃s2 ∈ Rj(s1) ∩ (φU
+(1−β)i (s))c ⊆ Rj(s1) ∩
(φL+(1−β)i (s))c. Thus, s is cautious (α, β)-Metarational stable for DM i.For (c), suppose that s is risky (α, β)-Symmetric Metarational stable for DM
i. Then, ∀s1 ∈ RL+(1−α)i (s) ⊆ RU
+(1−α)i (s), ∃s2 ∈ Rj(s1) ∩ (φU
+(1−β)i (s))c ⊆
Rj(s1)∩(φL+(1−β)i (s))c such thatRi(s2)∩φL+(1−α)
i (s) ⊆ Ri(s2)∩φU+(1−α)i (s) =
∅. Thus, s is cautious (α, β)-Symmetric Metarational stable for DM i.For (d), suppose that s is risky (α, β, γ)-Sequentially stable for DM i. Then,
∀s1 ∈ RL+(1−α)i (s) ⊆ RU
+(1−α)i (s), ∃s2 ∈ RL+γ
j (s1) ∩ (φU+(1−β)i (s))c ⊆
RU+γj (s1) ∩ (φL
+(1−β)i (s))c. Thus, s is cautious (α, β, γ)-Sequentially stable for
DM i.
Kamineta
Rectangle
213
6 Santos and Rego
4 Application
Rego and Santos [13] showed the importance of introducing probabilistic pref-erences in the GMCR by analyzing a modified version of an example presentedin Hamouda [11]. Here, we modify this example allowing upper and lower prob-abilistic preferences for DMs.
Example 4.1 The example considers an environmental conflict, in which thereare two DMs: environmentalists (E) and developers(D). It is assumed that thereare two types of DM D: one that gives low priority to environmentalist, (DU ),and the other, (DS), who is more responsible in this sense than the first one. DME can choose to be proactive P in promoting environmental responsibility or not,in which case they are called reactive R and the DM D can choose between beingsustainable S or not, which is represented by U . Their preferences are originallygiven by: (P, S) ≻E (R,S) ≻E (P,U) ≻E (R,U), (R,U) ≻DU (P,U) ≻DU
(R,S) ≻DU(P, S) and (R,S) ≻DS
(P, S) ≻DS(R,U) ≻DS
(P,U).1
Now, we consider that there is uncertainty about the type of DM D and weassume that the chance of the type D being DU is represented by the lower andupper probabilities P (D = DU ) = p1 e P (D = DU ) = p2. From Axiom 1,presented in Section 2, we must have that P (D = DS) = 1 − p2 and P (D =DS) = 1− p1.
We consider here that if a DM prefers deterministically one state sp to an-other sq, then both lower and upper probabilistic preference are equal to 1, i.e,P i(sp, sq) = P i(sp, sq) = 1 and, moreover, P i(sq, sp) = P i(sq, sp) = 0. Accord-ing to this assumption, the upper and lower probabilistic preferences of DM Eare equal to (1, 1) for the cases in that E prefers deterministically a state overanother and are equal to (0, 0), in the opposite case.
Consider now the DM D. In this case, we assume that if both types of DMD prefer state sp over state sq, then PD(sp, sq) = PD(sp, sq) = 1. If both donot prefer state sp over state sq, then PD(sp, sq) = PD(sp, sq) = 0. While ifonly one type prefer state sp over state sq, then the upper and lower probabilisticpreferences of DM D are given by the upper and lower probabilities of such typebeing chosen. Thus, the upper and lower probabilistic preferences of DM D areas shown in Table 2.
Table 2. Imprecise Probabilistic preferences for DM D
1 We use the notation x ≻i y for the case where DM i strictly prefers the object xto y. Moreover, the notation x1 ≻i x2 ≻i . . . xm−1 ≻i xm represents the preferenceorder for DM i and it means that, for DM i, x1 is strictly preferred to x2, which inturn is strictly preferred to x3 and so on.
Kamineta
Rectangle
214
GMCR with Upper and Lower Probabilistic Preferences 7
Given this GMCR model, an stability analysis can be made to determine forwhich parameter values the states satisfy each one of the eight proposed stabilitydefinitions for each DM. If a state is stable for both DMs according to a particularstability notion, then it is said to be stable according to such stability notion.Table 3 shows for which parameter values state (R,S) satisfies each one of theproposed stability notions.The stability analysis for the other states can be donesimilarly.
Table 3. Imprecise Probabilistic Stability for state (R,S)
In order to allow for imprecision in the modeling of probabilistic preferences,we extended the GMCR model allowing DMs to express their preferences usingupper and lower probabilistic preferences. We then, modified the four standardstability notions commonly used in the GMCR proposing eight stability defi-nitions that accommodate both cautious and risky behaviors of the DMs. Weshowed that the same relations of the stability notions of the GMCR with preciseprobabilistic preferences remain valid for the cautious and risky versions of thestability definitions proposed here. Moreover, we showed that every state that isstable according to a risky behavior is also stable according to the correspondingcautious behavior. Finally, in order to illustrate the usefulness of the proposedmodel, an application of the model was made to an hypothetical conflict.
The next step is to extend the definitions proposed here for conflicts withmore than two DMs, allowing both non-cooperative and coalitional analysis.
Kamineta
Rectangle
215
8 Santos and Rego
Acknowledgements The authors would like to thanks the Conselho Nacionalde Desenvolvimento Cientıfico e Tecnologico (CNPQ) and the Fundacao de Am-paro a Ciencia e Tecnologia do Estado de Pernambuco (FACEPE) for financialsupport.
References
1. D. M. Kilgour and K. W. Hipel. Handbook of Group Decision and Negotiation,chapter Conflict Analysis Methods: The Graph Model for Conflict Resolution,pages 203–222. Advances in Group Decision and Negotiation 4. Springer, 2010.
2. G. E. Kersten and H. Lai. Negotiation support and e-negotiation systems: anoverview. Group Decision and Negotiation, 16(6):553–586, 2007.
3. B. Martinovsky and W. Mao. Emotion as an argumentation engine: Modeling therole of emotion in negotiation. Group Decision and Negotiation, 18(3):235–259,2009.
4. J. Von Neumann and O. Morgenstern. Theory of Games and Economic Behavior.Princeton University Press, Princeton, New Jersey, 1953.
5. D.M. Kilgour, K.W. Hipel, and L. Fang. The graph model for conflicts. Automatica,23(1):41–55, 1987.
6. N. Fraser and K.W. Hipel. Conflicts Analysis: Models and Resolutions. North-Holland, New York, 1984.
7. N. Howard. Paradoxes of Rationality: Theory of Metagames and Political Behavior.MIT press, Cambridge, Massachusetts, 1971.
8. K.W. Li, K.W. Hipel, D.M. Kilgour, and L. Fang. Stability definitions for 2-playerconflict models with uncertain preferences. IEEE Int.Conf. Syst. Man Cybern.,7:13–18, 2002.
9. K.W. Li, K.W. Hipel, D.M. Kilgour, and L. Fang. Preference uncertainty in thegraph model for conflict resolution. IEEE Transactions on Systems, Man, andCybernetics-Part A: Systems and Humans, 34(4):507–520, 2004.
10. M.S. Al-Mutairi, K.W. Hipel, and M.S. Kamel. Fuzzy preferences in conflicts.Journal of Systems Science and Systems Engineering, 17:257–276, 2008.
11. L. Hamouda, D.M. Kilgour, and K.W. Hipel. Strength of preferences in the graphmodels for conflict resolution. Group Decision and Negotiation, 13:449–462, 2004.
12. F. M. Campello de Souza. Mixed models, random utilities and the triangle in-equality. Journal of Mathematical Psychology, 27(2):183–200, 1983.
13. L.C. Rego and A.M. Santos. Graph model for conflict resolution with stochasticpreferences. In Proceedings of Group Decision and Negotiation - GDN 2013, pages67–77, Stockholm, Sweden, June 2013.
14. T. L. Fine. Lower probability models for uncertainty and nondeterministic pro-cesses. Journal of Statistical Planning and Inference, 20(3):389–411, 1988.
15. P. Walley. Measures of uncertainty in expert systems. Artificial Intelligence,83(1):1–58, 1996.
16. R.D. Luce. A probabilistic theory of utility. Econometrica, 26(2):193–224, 1958.17. J. Nash. Equilibrium points in n-person games. Proceedings of National Academy
of Science, 36:48–49, 1950.18. J. Nash. Non-cooperative games. Annals of Mathematics, 54:286–295, 1951.19. L. Fang, K.W. Hipel, and D.M. Kilgour. Interactive Decision Making: The Graph
Model for Conflict Resolution. Wiley, New York, 1993.
Kamineta
Rectangle
216
Grey-based Graph Model for Conflict Resolution withMultiple Decision Makers
Hanbin Kuang1, M. Abul Bashar1 Keith W. Hipel1, and D. Marc Kilgour1,2
1 Department of Systems Design Engineering, University of Waterloo, Waterloo, ON, N2L3G1, Canada
2 Department of Mathematics, Wilfrid Laurier University, Waterloo, ON, N2L 3C5, Canada
Summary. A definition of grey preference is designed for incorporation into theGraph Model for Conflict Resolution in order to model and represent uncertainhuman behaviour in a strategic conflict. In analyzing a strategic conflict, incom-plete information regarding many conflict situations, cognitive limitations of de-cision makers, the interplay of stakeholders and the complexity of disputes makeit hard to capture accurate preferences of all decision makers across all possiblescenarios, or states. In this paper, a grey preference structure (based on grey num-bers) is extended to represent decision makers’ uncertain preferences in a graphmodel. Then grey stability definitions are provided and corresponding equilibriaare defined for a grey-based conflict model with multiple decision makers.
Key words: graph model for conflict resolution, multiple decision makers, greynumbers, grey preferences, grey stability, grey equilibrium
1 Introduction
The Graph Model for Conflict Resolution (GMCR) constitutes a flexible systematicmethodology for modelling and analyzing strategic conflicts [5]. Using four solutionconcepts—Nash Stability (R), general metarationality (GMR), symmetric metarational-ity (SMR), and sequential stability(SEQ)—defined within a rigorous mathematicalframework, stability analysis can be carried out for conflict models, so that insightscan be accessed and reasonable suggestions be provided to stakeholders. To realizeGMCR’s role in real-world decision problems, a user-friendly decision support systemnamed GMCR II was developed [6, 7]. To formally model a strategic conflict, the graphmodel contains four main fundamental components: (i) a set of DMs, (ii) a set of op-tions for each DM, (iii) possible moves between feasible states controlled by each DM,and (iv) the relative preferences for each DM over the feasible states [5, 8].
In GMCR, if a DM has no incentive to move from the present state, the scenario iscalled stable for the DM. If a scenario is stable for all DMs in the conflict, it constitutesan equilibrium [9, 10, 11]. The relative preferences of each DM over potential scenariosin a conflict is a key factor in judging whether it is worthwhile for a DM to move fromthe initial state, thereby determining stable states, or equilibria according to the foursolution concepts. Unfortunately, in real cases, it is sometimes hard for DMs to pro-vide exact relative preferences over possible scenarios in a conflict because of limitedinformation and the uncertainties of human judgement. To counter this problem, much
217
2 Hanbin Kuang, M. Abul Bashar Keith W. Hipel, and D. Marc Kilgour
valuable research has been carried out into how GMCR can take uncertain preferencesof DMs into account. Some results are: a new preference relation structure consider-ing ”unknown” preferences of DMs [13], incorporation of information-gap model intoGMCR [18], matrix representation of preference uncertainty [16], fuzzy preferences[1], and grey-based preferences [12]. These approaches extend the graph model foremployment in conflict analysis when DMs hold uncertain preferences.
2 Grey Numbers and Grey Preference
Grey system theory, originally introduced by Julong Deng in 1982 [3], is a methodologythat focuses on addressing systematic problems with uncertain information, which maybe discrete or continuous numerical values[4, 14]. In grey system theory, a system withcomplete information is called a White System; a system with no information at all isreferred to as a Black System; a system with partially known information is called aGrey System. The fundamental definitions of grey numbers and grey preferences areillustrated in this section.
2.1 Grey Numbers
In the study of a grey system, grey numbers are the most fundamental concept. In theoriginal definitions, a white number is a real number, x ∈ R. A grey number, written⊗x, means an indeterminate real number that takes its possible values within an intervalor a discrete set of numbers. Specifically, a discrete grey number ⊗x is an unknownreal number, taking its value from a finite set, denoted as ⊗x ∈ x1,x2, . . . ,xk; whilea continuous grey number ⊗x is an interval, and is thought of as potentially taking avalue within that interval, written ⊗x ∈ [x−, x], where x−, x∈ R, and x−6 x, [14]. Yang andJohn[19] put forward a generalized definition of a general grey number, which allowsgrey numbers to represent uncertainty in a more general way.
Definition 1. A general grey number ⊗x is an unknown real number with a clear lowerbound x− and an upper bound x, x−, x ∈ R, taking its value from the closed interval, [x−, x],denoted [19]:
⊗x ∈k⋃i
[x−i, xi] (1)
where 1 6 k < ∞. Note that x−i, xi ∈ R, and xi−1 < x−i 6 xi < x−i+1. The lower boundx− = min
ix−i and the upper bound x = max
ixi. This is a generalized definition of a grey
number, because it can represent a discrete grey number, an interval grey number, awhite number, and a union set of discrete grey numbers and continuous grey numbers.
– If xi = x−i = xi for all i = 1,2, ...,k, ⊗x ∈ x1,x2, ...,xk is a discrete grey number .
– If k = 1 and x− = x−i and x = xi for all i = 1,2, ...,k, ⊗x ∈ [x−, x] is a continuous greynumber .
Kamineta
Rectangle
218
Grey-based GMCR 3
– If k = 1 and x = x−i = xi, the general grey number is a white number, ⊗x = x.
Let⊗x1 and⊗x2 be two general grey numbers,⊗x1 ∈m⋃i[x−i, xi] and⊗x2 ∈
n⋃j[x− j, x j],
1 6 m,n < ∞. The arithmetic operations on general grey numbers are [19]:
⊗x1 +⊗x2 ∈m⋃i
n⋃j
[x−i + x− j, xi + x j
](2)
⊗x1−⊗x2 ∈m⋃i
n⋃j
[x−i− x j, xi− x− j
](3)
⊗x1×⊗x2 ∈m⋃i
n⋃j
[min(x−ix− j,x−ix j, xix− j, xix j),max(x−ix− j,x−ix j, xix− j, xix j)] (4)
⊗x1÷⊗x2 ∈m⋃i
n⋃j
[min(
xi
x j,
xi
x j,
xi
x j,
xi
x j
),max
(xi
x j,
xi
x j,
xi
x j,
xi
x j
)] (5)
Note that in (5), for all j = 1, . . . ,n, either x j < 0 or x− j > 0; otherwise, the operationis undefined.
2.2 Grey Preference Degree
A grey preference uses generalized grey numbers, ranging from 0 to 1, to indicate aDM’s preference degree for one state over another.
Definition 2. Let D[0,1]⊗ represent the set of all grey numbers within the interval [0,1].A grey preference is represented by a matrix ⊗P = (⊗pi j)m×m, where
⊗p(si,s j) =⊗pi j ∈ D[0,1]⊗ (6)
represents the grey preference degree (GPD) for state si over s j. The grey preferencessatisfy p
−i jl + p ji
l = p− ji
l + pi jl = 1 for all i, j = 1,2, . . . ,m, and ⊗pii = 0.5, for all i =
1,2, . . . ,m., when ⊗pi j =L⋃l
[p−i j
l , pi jl]
and ⊗p ji =L⋃l
[p− ji
l , p jil]
, where 1 6 l < ∞.
2.3 Grey Relative Certainty of Preference
The grey relative certainty of preference is defined to represent the intensity of prefer-ence of one state over another. As mentioned above, ⊗p(si,s j) denotes the grey prefer-ence degree for state si over s j, while⊗p(s j,si) can represent the grey preference degreefor state s j over si, then the following definition represents the grey relative certainty ofpreference for si over s j.
Kamineta
Rectangle
219
4 Hanbin Kuang, M. Abul Bashar Keith W. Hipel, and D. Marc Kilgour
Definition 3. Let ⊗pk(si,s j) represent the grey preference degree for state si over s jof DM k ∈ N, and D[−1,1]⊗ represent the set of all grey numbers within the interval[−1,1]. The grey relative certainty of preference (GRCP) for DM k of state si relativeto s j is
⊗rk(si,s j) =⊗pk(si,s j)−⊗pk(s j,si) (7)
In (7),⊗rk(si,s j) ∈ D[−1,1]⊗. To simplify the notation,⊗rk(si,s j) is written as⊗rki j in
the following parts of this paper. Then, a grey relative certainty of preference for DM kin a conflict can be represented by a matrix (⊗rk
i j)m×m.
⊗rk =
⊗rk
11 ⊗rk12 ... ⊗rk
1m⊗rk
21 ⊗rk22 ... ⊗rk
2m... ... ... ...⊗rk
m1 ⊗rkm2 ... ⊗rk
mm
(8)
3 Grey-based Graph Model for Conflict Resolution with MultipleDecision Makers
In this paper, when multiple DMs are involved in a conflict, the grey preference struc-ture is employed to represent uncertain preferences of these DMs, and identify statesthat are worthwhile for one or more DMs to move to. Note that the unilateral movesfrom the initial state for DMs in the grey-based graph model is the same as the defi-nition of ulnilateral moves in GMCR. Considering uncertain preferences of DMs, thegrey unilateral improvements (GUIs) from a given state depend on two more factors:anticipated preference (AP) and grey satisficing threshold (GST).
3.1 Anticipated Preferences of Decision Makers
In real world conflicts, DMs having different characteristics (optimism, pessimism andneutrality) may choose different strategies within the same decision context [15, 17, 2].Thus, estimating possible reactions of DMs with uncertain preferences requires takingcharacteristics of DMs into account. Note that GRCP is expressed in the form of ageneral grey number. Then, AP is provided based on three forms of characteristics ofDMs: optimistic, pessimistic and neutral to estimate the preference of a DM expressedby GRCP.
Definition 4. For k ∈ N, si,s j ∈ S, let⊗rk(si,s j) =n⋃l[x−l , xl ] denote the GRCP for DM k
of si relative to s j, and let r−i jk and ri j
k represent the lower bound and the upper bound
of ⊗rk(si,s j) =n⋃l[x−l , xl ] respectively. Then, the DM k’s anticipated preference for si
over s j, APk(si,s j), is:
– If DM k is pessimistic, thenAPk(si,s j) = r−i j
k (9)
Kamineta
Rectangle
220
Grey-based GMCR 5
– If DM k is optimistic, thenAPk(si,s j) = ri j
k (10)
– If DM k is neutral, then
APk(si,s j) =
1n
n∑
l=1x−l , if x−l = xl for all l = 1,2, . . . ,n
n∑
l=1(xl−xl)(
xl+xl2 )
n∑
i=1(xl−xl)
, otherwise(11)
Definition 5. For k ∈ N and s,si ∈ S, let APk(si,s) denote the AP of DM k for state siover s. DM k would prefer to move from state s to si, if and only if APk(si,s) > γk,where γk is called the grey satisficing threshold of DM k.
The GST of a DM means the degree of confidence over which a state is worthwhile fora DM to move to, otherwise the DM prefers to stay. Specifically, a move is worthwhileonly when the AP is greater or equal to the GST for the DM, based on his characteristics.In a conflict, DMs may have different GSTs.
3.2 Grey Unilateral Improvement
Since AP and GST have been standardized and explained, a DM’s grey unilateral im-provement is introduced as follows:
Definition 6. For k ∈N and s∈ S, let γk be the GST for DM k. Recall that Rk(s) denotesthe set of states reachable from the state s of DM k. A state si ∈ Rk(s) is called a greyunilateral improvement (GUI) from s for DM k, if and only if APk(si,s) > γk.
A GUI is a reachable state by a DM from the initial state, and the state is worthwhilefor the DM to move to. Specifically, a GUI si is a state within the reachable list for DMk from state s, and DM k’s AP for si over s is greater than or equal to his/her GST.
Definition 7. For s ∈ S and k ∈ N, let Rk(s) denote the set of states reachable fromthe state s of DM k, and γk be the GST for DM k. The grey unilateral improvementlist , denoted ⊗R+
k,γk(s), is the collection of all GUIs from s for DM k, represented
mathematically as
⊗R+k,γk
(s) = si ∈ Rk(s) : APk(si,s)> γk (12)
When more than two DMs are involved in a conflict, joint unilateral improvementsfor two or more DMs must be taken into account. The unilateral improvement list forn (n > 1) DMs from a given state represents the collection of all possible states towhich some or all of the DMs can move via a legal sequence of movements, and eachmovement is a grey unilateral improvement. A legal sequence of moves means that thesame DM may move more than once, but not twice consecutively.
Kamineta
Rectangle
221
6 Hanbin Kuang, M. Abul Bashar Keith W. Hipel, and D. Marc Kilgour
Definition 8. For s∈ S, H ⊆N and H ≥ 2, let H = 1,2, . . . ,h, and γH = γ1,γ2, . . . ,γhrepresent the set of GUIs for corresponding DMs in H. Let Ω
+H (s,si) denote the set of
all last DMs in legal sequences allowable for unilateral improvement from s to si. Then,the grey unilateral improvement(s) list for two or more DMs ⊗R+
H,γH(s) from state s for
H is defined inductively as(1) if k ∈ H, and s1 ∈ ⊗R+
k,γk(s), then s1 ∈ ⊗R+
H,γH(s) and k ∈Ω
+H (s,s1)
(2) if s1 ∈ ⊗R+H,γH
(s), k ∈ H, s2 ∈ ⊗R+k,γk
(s1), and Ω+H (s,s1) 6= k, then s2 ∈
⊗R+H,γH
(s) and k ∈Ω+H (s,s2)
Note that the definition stops only when no new state can be added. A joint grey unilat-eral improvement from a given state by multiple DMs is a state that is in the reachablelist for these DMs from the initial state and worthwhile for some or all of the DMs.Specifically, if a group of DMs, H, moves the conflict from state s1 to s2 via a legalsequence of moves and each movement is a grey unilateral improvement for corre-sponding DM judged by the Definition 6, then s2 is a grey unilateral improvement forH, as well as are other movements. The grey unilateral improvement list for multipleDMs is the collection of all grey unilateral improvements from the given state for anynon-empty subset of the DMs.
3.3 Grey Stability Definitions and Equilibria
The four basic grey-based stabilities in a strategic conflict are defined for a graph modelhaving any finite number of DMs greater than unity. Specifically, grey Nash stability(GR), grey general metarationality (GGMR), grey symmetric metarationality (GSMR),and grey sequential stability (GSEQ) are introduced. These definitions depend on uni-lateral moves controlled by DMs, GUIs, GSTs, characteristics of DMs and their corre-sponding APs. Note that S = s1,s2, . . . ,sm, m > 1 denotes the set of feasible statesand N represents the set of DMs. The formal definitions of the four grey stabilities aregiven below.
Definition 9. A state s ∈ S is grey Nash stable or grey rational for DM k, given bys ∈ SGR
k , if and only if ⊗R+k,γk
(s) = /0.
If there is no state that is reachable from the initial state and is worthwhile for a DMto move to based on his characteristics and satisficing criterion, then the state is GR forthe DM. In particular, a state s ∈ S is GR stable for DM k if and only if the DM has noGUI from s.
Definition 10. A state s ∈ S is grey general metarational for DM k, denoted by s ∈SGGMR
k , if and only if for every s1 ∈ ⊗R+k,γk
(s) there exists at least one s2 ∈ RN−k(s1)
such that APk(s2,s)< γk.
If DM k chooses to move from s to a GUI, s1, and the other DMs, N−k, have at leastone unilateral movement from state s1 to a state s2 , which is less preferred for DM kthan s, based on his preference, characteristics, and satisficing criterion, then the GUIfrom s to s1 for DM k is blocked. If every GUI from s by DM k can be blocked by someor all the other DMs’ unilateral movements, then the state s is GGMR for DM k.
Kamineta
Rectangle
222
Grey-based GMCR 7
Definition 11. A state s ∈ S is grey sequential stable for DM k, denoted by s ∈ SGSEQk ,
if and only if for every s1 ∈ ⊗R+k,γk
(s) there exists at least one s2 ∈ ⊗R+N−k,γN−k
(s1)
such that APk(s2,s)< γk.
If DM k chooses a GUI s1 from state s to move to, and the other DMs, N−k, haveat least one GUI from state s1 to s2, which is not worthwhile for DM k to move from sbased on his preference, characteristics, and satisficing criterion, then the GUI from sto s1 by DM k is blocked by other DMs’ credible action. If every GUI from s by DM kcan be blocked by some or all the other DMs using GUIs given in Definition 8, then thestate s is GSEQ for DM k.
Definition 12. A state s ∈ S is grey symmetric metarational for DM k, denoted by s ∈SGSMR
k , if and only if for every s1 ∈ ⊗R+k,γk
(s) there exists at least one s2 ∈ RN−k(s1)
such that APk(s2,s)< γk, and APk(s3,s)< γk for all s3 ∈ Rk(s2).
If DM k chooses to move to a GUI s1 from s, and the other DMs, N−k, have subse-quent unilateral movements from state s1 to s2, which is not worthwhile for DM k froms to move to, and neither is any unilateral movement of DM k from s2, based on his pref-erence, characteristics, and satisficing criterion, then the GUI from s to s1 is blocked forDM k. If every GUI from s by DM k can be blocked in the manner described above,,then the state s is GSMR for DM k.
Definition 13. A state s ∈ S is called a grey equilibrium under a specific grey stabilitydefinition if and only if s is grey stable for all DMs under that grey stability definition.
This research, using grey numbers to express uncertain preferences of DMs, aims to de-fine grey-based stability concepts and corresponding equilibria within the GMCR struc-ture, thereby extending the graph model methodology. These definitions can account formore missing preference information of a multiple participant-multiple objective deci-sion model, and therefore, provide more realistic resolutions for a conflict being studiedin the face of uncertainty.
References
1. M Abul Bashar, D. Marc Kilgour, and Keith W. Hipel. Fuzzy preferences in the graph modelfor conflict resolution. IEEE Transactions on Fuzzy Systems, 20(4):760–770, 2012.
2. Ting-Yu Chen. A multimeasure approach to optimism and pessimism in multiple crite-ria decision analysis based on atanassov fuzzy sets. Expert Systems with Applications,38(10):12569 – 12584, 2011.
3. Ju Long Deng. The control problems of grey systems. Systems and Control Letters,1(5):288–294, 1982.
4. Ju Long Deng. Introduction to grey system theory. Journal of Grey System, 1(1):1–24, Nov1989.
5. Liping Fang, Keith W. Hipel, and D. Marc Kilgour. Interactive Decision Making: TheGgraph Model for Conflict Resolution. Wiley, New York, 1993.
Kamineta
Rectangle
223
8 Hanbin Kuang, M. Abul Bashar Keith W. Hipel, and D. Marc Kilgour
6. Liping Fang, Keith W Hipel, D. Marc Kilgour, and Xiaoyong Peng. A decision supportsystem for interactive decision making-part I: model formulation. IEEE Transactions onSystems, Man, and Cybernetics, Part C: Applications and Reviews, 33(1):42–55, 2003.
7. Liping Fang, Keith W Hipel, D. Marc Kilgour, and Xiaoyong Peng. A decision support sys-tem for interactive decision making-part II: analysis and output interpretation. IEEE Trans-actions on Systems, Man, and Cybernetics, Part C: Applications and Reviews, 33(1):56–66,2003.
8. Luai Hamouda, D. Marc Kilgour, and Keith W. Hipel. Strength of preference in the graphmodel for conflict resolution. Group Decision and Negotiation, 13(5):449–462, 2004.
9. Keith W. Hipel. Conflict Resolution - Volume 1. Eolss Publisher, Oxford, UK, 2009.10. Keith W. Hipel. Conflict Resolution - Volume 2. Eolss Publisher, Oxford, UK, 2009.11. D. Marc Kilgour and Colin Eden. Handbook of Group Decision and Negotiation, volume 4.
Springer, Dordrecht, 2010.12. Hanbin Kuang, Keith W. Hipel, D. Marc Kilgour, and M. Abul Bashar. A case study of
grey-based preference in a graph model for conflict resolution with two decision makers. InSystems, Man, and Cybernetics (SMC), 2013 IEEE International Conference on, 2013.
13. Kevin W Li, Keith W. Hipel, D. Marc Kilgour, and Liping Fang. Preference uncertainty in thegraph model for conflict resolution. IEEE Transactions on Systems, Man and Cybernetics,Part A: Systems and Humans, 34(4):507–520, 2004.
14. Sifeng Liu and Jeffrey Yi Lin Forrest. Grey Systems: Theory and Applications, volume 68.Springer Verlag, 2010.
15. Michael F Scheier and Charles S Carver. Optimism, coping, and health: assessment andimplications of generalized outcome expectancies. Health psychology, 4(3):219, 1985.
16. Haiyan Xu, D Marc Kilgour, and Keith W Hipel. Matrix representation of conflict resolutionin multiple-decision-maker graph models with preference uncertainty. Group Decision andNegotiation, 20(6):755–779, 2011.
17. Ronald R. Yager. An approach to ordinal decision making. International Journal of Approx-imate Reasoning, 12(3-4):237 – 261, 1995.
18. Ben-Haim Yakov and Keith W. Hipel. The graph model for conflict resolution withinformation-gap uncertainty in preferences. Applied Mathematics and Computation,126(2):319–340, 2002.
19. Yingjie Yang and Robert John. Grey sets and greyness. Information Science, 185(1):249–264, February 2012.
Kamineta
Rectangle
224
The Inverse Approach to Conflict Resolution inEnvironmental Management
Rami A. Kinsara1,2, D. Marc Kilgour3, and Keith W. Hipel1
1 Department of Systems Design Engineering, University of Waterloo, Waterloo,Ontario, Canada N2L 3G1
2 Department of Industrial Engineering, King Abdulaziz University, Jeddah, SaudiArabia
3 Department of Mathematics, Wilfrid Laurier University, Waterloo, Ontario,Canada N2L 3C5
Abstract. The recently developed Inverse approach to the Graph Modelfor Conflict Resolution (Inverse GMCR) is used to model an environmen-tal conflict that occurred in Elmira, a small agricultural town in south-western Ontario, Canada [5]. The outcome of the conflict is examinedusing coalition analysis and from a negotiation perspective. These ap-proaches are compared to emphasize the contribution of Inverse GMCR.
Negotiation and mediation are vital components of conflict resolution. GMCR isan established methodology to model and analyze conflicts. However, it does nothave the capacity to explicitly model negotiation and third party intervention.Therefore, the authors developed a new Inverse GMCR to model negotiationand third party intervention [12] [13] [11].
2 The Graph Model for Conflict Resolution
GMCR is a methodology for strategic conflict modeling and analysis. It is robust,easy-to-use, flexible, and insightful in results interpretation [1, 2, 7, 10].
GMCR was developed in the early 1980s and is being continually enhanced[9]. The essence of GMCR is its ability to strategically analyze moves and countermoves within a conflict to predict equilibria based on a number of stabilitydefinitions.
Basic stability definitions include Nash stability [14], sequential stability(SEQ) [3] [4], general metarationality (GMR), and symmetric metarationality(SMR) [6]. These stability definitions determine how stable a state is for eachdecision maker (DM) and whether a DM is motivated to move from it. The final
225
2 Kinsara, Kilgour, and Hipel
result of GMCR is determining the equilibrium of each state by examining itsstability across all DMs.
2.1 Procedure
In a real world conflict, modeling builds the foundation for GMCR. This is donethrough identifying the five components of a conflict: DMs, options for everyDM, feasible states, allowable transitions, and relative preferences. After themodeling stage, the likely final resolution is determined through analyzing theconflict from every DMs viewpoint by: determining individual stability for everyDM, overall equilibria, and sensitivity analysis.
The flow chart in Figure 1 outlines the two stages of the standard GMCRprocedure (adapted from [1]).
Real - world Conflict
Decision Makers
Options
Feasible States
Allowable State Transitions
Relative Preferences
Individual Stabilities
Equilibria
Interpretation and Sensitivity Analyses
Information to Assist Decision Makers
Modeling
Analysis
Fig. 1. The basic procedure of applying the GMCR methodology to a real worldconflict (adapted from [1])
Kamineta
Rectangle
226
Inverse GMCR in Environmental Management 3
3 The Inverse GMCR
Although GMCR provides an excellent outline to structure and examine con-flicts, it proves challenging in understanding the comparative inclinations of theDMs involved in the dispute. Negotiators need the ability to motivate DMs tomove to a more desired resolution. To allow this to happen, a negotiation toolcontaining information about DMs’ motivations is required.
Introduction of Inverse GMCR allows the negotiator to predict all likelyinclinations to achieve the desired resolution to the conflict. This tool is usefulnot only to negotiators, but can be used by actual stakeholders to influence theiradversaries.
The standard GMCR procedure and the Inverse GMCR each follow an orderof steps as illustrated in Figure 1 for the standard GMCR procedure, and Figure 2for Inverse GMCR. The similarities in the order of steps are in the determinationof (1) the DMs and (2) the option choices for each DM. While in the standardGMCR procedure the next step is to determine the rankings of states for eachDM, Inverse GMCR will instead determine the desired outcome and stabilitydefinition. What results in Inverse GMCR is a record of likely state rankings thatwill make the desired resolution stable under the chosen stability definition. Inother words, Inverse GMCR is a modification of the standard GMCR to functionas a negotiation tool rather than a prediction tool.
4 Application
4.1 The Elmira Conflict
In late 1989, a controversy surfaced in the small town of Elmira, located north ofthe cities of Kitchener and Waterloo in southwestern Ontario, Canada. With apopulation of about 12,000 residents, Elmira is known for its agriculture and var-ious industries, including a pesticide and rubber manufacturer, Uniroyal Chem-ical Ltd (UR). The municipal water supply of the town was formerly obtainedfrom an underground aquifer, until the Ontario Ministry of Environment (MoE)uncovered that this fresh water supply was polluted with a carcinogen chemical,N-nitroso dimethylamine or NDMA.
Local residents, the Regional Municipality of Waterloo, and the Township ofWoolwich (LG) collectively suspected UR to have caused the pollution, citing along history of environmental problems and NDMA being a by-product of theirmanufacturing. Subsequently, the MoE issued a Control Order (CO) under theEnvironment Protection Act of Ontario, which required UR to, among otherthings, execute the necessary cleanup under the supervision of the MoE. Soonafter, as per the Environment Protection Act, UR exercised its right to appealthe CO which allowed a hearing to decide whether the CO should be enforced,a modified version be proposed, or whether it should be dismissed.
Kamineta
Rectangle
227
4 Kinsara, Kilgour, and Hipel
Real - world Conflict
Decision Makers
Options
Feasible States
Allowable State Transitions
Desired Equilibria
List of Possible Relative
Preferences
Pattern for the generated list
Interpretation and Sensitivity Analyses
Information to Assist DMs / 3rd Party
Modeling
Analysis
Fig. 2. Inverse GMCR procedure in a real world conflict (modified from [1])
In August 1991, the first conflict study over the Elmira dispute was conductedby K.W. Hipel, D.M. Kilgour, and L. Fang as the Domain Experts [8].The goalof the conflict modeling and analysis was to assess how a negotiated resolutioncould be reached between the MoE with its goal to execute the CO, UR with itsobjective to modify or dissolve the CO, and the LG that aimed to protect thehealth of its citizens as well as to save its financial base.
The graph model for this conflict was established by Hipel et al. [5] containingthree DMs: MoE, UR, and LG. MoE can control a single option of modifying theCO, making it more acceptable to UR (Modify). UR has three options: to delaythe appeal process (Delay), to accept the CO whether modified or not (Accept),or to abandon the Elmira operations (Abandon). LG has one option of insistingthe original CO be applied (Insist). Table 1 outlines the DMs, their options, andthe 12 feasible states for the conflict. In the table, ‘Y’ denotes ‘Yes’ meaningthat option in the corresponding row is taken while ‘N’ denotes ‘No’ indicatingthat the option is not taken. States 5,6,11, and 12 are shaded indicating thatUR abandons its operations in Elmira and thus ending the conflict.
Kamineta
Rectangle
228
Inverse GMCR in Environmental Management 5
Table 1. DMs, Options, and States for the Elmira Conflict
DM State # 1 2 3 4 5 6 7 8 9 10 11 12
MoE Modify N Y N Y N Y N Y N Y N Y
UR
Delay Y Y N N N N Y Y N N N N
Accept N N Y Y N N N N Y Y N N
Abandon N N N N Y Y N N N N Y Y
LG Insist N N N N N N Y Y Y Y Y Y
According to the aforementioned background, the analysts derived the pref-erence rankings represented in Table 2 [5]. The preferences are ordered fromthe most preferred states on the left to the least preferred states on the right.Equally preferred states are shaded. Consequently, the standard GMCR pro-duced the equilibria results outlined in Table 3.
Table 2. Preferences from Most to Least Preferred States for the Elmira Conflict
DM Most Preferred Least Preferred
MoE 9 3 4 10 7 1 2 8 5 6 11 12
UR 1 4 10 7 5 6 11 12 2 3 9 8
LG 9 3 7 1 10 8 4 2 5 6 11 12
Table 3. Equilibria Results for the Elmira Conflict
State # 1 2 3 4 5 6 7 8 9 10 11 12
Nash
SEQ
GMR
SMR
Table 4 illustrates the evolution of the Elmira conflict. The original analysissuggested that the conflict would be deadlocked in equilibrium state 7. However,on October 7, 1991, MoE and UR announced an agreement to modify the COmaking state 10 the final equilibrium [8]. The authors then investigated a newarea of coalition analysis within GMCR to explain the equilibrium jump fromstate 7 to state 10 as there are no possible unilateral moves by either MoE orUR from state 7 to state 10. In the next section, a new insight and explanationis provided using Inverse GMCR approach.
Kamineta
Rectangle
229
6 Kinsara, Kilgour, and Hipel
Table 4. The Evolution of the Elmira Conflict
DM State # 1 7 10
MoE Modify N N Y
UR
Delay Y Y N
Accept N N Y
Abandon N N N
LG Insist N Y Y
4.2 The Inverse GMCR Analysis
The main use of Inverse GMCR is to choose a more desirable state and un-derstand how it can be achieved. An alternative use of Inverse GMCR is tounderstand how a certain state can be avoided or, in other words, can be madeunstable. Looking back at the Elmira conflict, MoE is clearly better off havingUR accept a modified CO rather than abandon its operations. Being in state 7,in which UR continues to delay, is not beneficial to the town of Elmira nor toMoE. The original preference ranking suggested that MoE prefers state 7 morethan state 8 in which MoE has to modify the CO. If a negotiator wants state 7(the original equilibrium) to be unstable, then state 8 has to be more preferredthan state 7 by MoE allowing UR to make a unilateral improvement to state 10.This information is obtained using Inverse GMCR procedure by determining therules that make state 7 unstable while maintaining the final equilibrium. Table5 illustrates the evolution of the conflict as explained using Inverse GMCR. Inessence, Inverse GMCR provides the analyst with various scenarios to reach thedesired resolution while reducing the probability of less desirable states.
Table 5. The Evolution of the Elmira Conflict Using Invese GMCR
DM State # 1 7 8 10
MoE Modify N N Y Y
UR
Delay Y Y Y N
Accept N N N Y
Abandon N N N N
LG Insist N Y Y Y
The coalition analysis provides an explanation of an equilibrium jump inwhich both MoE and UR have to cooperate to move together to a mutually pre-ferred state. Using Inverse GMCR, an explanation is provided to allow unilateralimprovements for these two DMs without having to cooperate.
Kamineta
Rectangle
230
Inverse GMCR in Environmental Management 7
5 Conclusions
Understanding the dynamics is a vital element in conflict modeling and anal-ysis. Inverse GMCR is a valuable negotiation tool that explains how a statecan or cannot be achieved. It allows the negotiator to motivate DMs to movetoward a desired equilibrium state. The Elmira dispute is a suitable environmen-tal conflict that illustrates the advantage of using a variety of conflict modelingapproaches, standard GMCR, coalition analysis, and Inverse GMCR, to achievea sustainable equilibrium. Applying these approaches provides deeper insightsand comprehensive understanding about the conflict at hand.
Acknowledgments. The authors would like to thank Dr. M. Abual Bashar,and Sara Omar for proofreading and editing the paper.
References
1. Liping Fang, Keith W Hipel, and D Marc Kilgour. Interactive decision making:The graph model for conflict resolution. Wiley New York, 1993.
2. Liping Fang, Keith W. Hipel, and D.Marc Kilgour. Conflict models in graph form:Solution concepts and their interrelationships. European Journal of OperationalResearch, 41(1):86 – 100, 1989.
3. Niall M Fraser and Keith W Hipel. Solving complex conflicts. Systems, Man andCybernetics, IEEE Transactions on, 9(12):805–816, 1979.
4. Niall M Fraser and Keith W Hipel. Conflict Analysis: Models and Resolutions,Series Volume 11. North-Holland, 1984.
5. K.W. Hipel, Liping Fang, D.M. Kilgour, and M. Haight. Environmental conflictresolution using the graph model. In Systems, Man and Cybernetics, 1993. ’Sys-tems Engineering in the Service of Humans’, Conference Proceedings., Interna-tional Conference on, pages 153–158 vol.1, Oct 1993.
6. Nigel Howard. Paradoxes of rationality: theory of metagames and political behavior.Cambridge: MIT Press, 1971.
7. Takehiro Inohara. Majority decision making and the graph model for conflict reso-lution. Systems Man and Cybernetics (SMC), 2011 IEEE International Conferenceon, pages 2702–2070, 2011.
8. Takehiro Inohara and Keith W. Hipel. Coalition analysis in the graph model forconflict resolution. Systems Engineering, 11(4):343–359, 2008.
9. D Marc Kilgour and Keith W Hipel. The graph model for conflict resolution: past,present, and future. Group Decision and Negotiation, 14(6):441–460, 2005.
10. D.Marc Kilgour, Keith W. Hipel, and Liping Fang. The graph model for conflicts.Automatica, 23(1):41 – 55, 1987.
11. R.A. Kinsara, K.W. Hipel, and D.M. Kilgour. Inverse approach application inthird party intervention. In Systems, Man, and Cybernetics (SMC), 2013 IEEEInternational Conference on, Midland Hotel, Manchester, United Kingdom, 2013.IEEE.
12. Rami A Kinsara, D Marc Kilgour, and Keith W Hipel. Conflict resolution andmediation. In Systems, Man, and Cybernetics (SMC), 2012 IEEE InternationalConference on, pages 2780–2784. IEEE, 2012.
Kamineta
Rectangle
231
8 Kinsara, Kilgour, and Hipel
13. Rami A. Kinsara, D. Marc Kilgour, and Keith W. Hipel. Strategic modeling ap-proach for third party intervention. In Bilyana Martinovski, editor, Group Decisionand Negotiation – GDN 2013, pages 45–48, Department of Computer and SystemsSciences (DSV), Stockholm University, Stockholm, Sweden, June 2013. GDN.
14. John F Nash et al. Equilibrium points in n-person games. Proceedings of thenational academy of sciences, 36(1):48–49, 1950.
Kamineta
Rectangle
232
Application of the Graph Model for Conflict Resolution to the Jackpine Mine Expansion Dispute in the Alberta
Oil Sands
Yi Xiao1, Keith W. Hipel1, and Liping Fang1,2
1 Department of Systems Design Engineering, University of Waterloo, Waterloo, Ontario, Canada N2L3G1
2 Department of Mechanical and Industrial Engineering, Ryerson University, Toronto, Ontario, Canada M5B2K3
Abstract. The conflict of Jackpine Mine Expansion project is systematically studied using the Graph Model for Conflict Resolution methodology to gain insights. The results imply that the Federal Government of Canada is more concerned about the economic benefits generated by the oil sands projects. It is suggested that more efforts should be put on the environment conservation by the government.
Keywords: Graph Model for Conflict Resolution, Jackpine Mine Expansion, Oil Sands
1 Introduction
The oil sands are one of the most controversial energy resources in Canada. They create great economic benefits but at the same time could cause significant environmental damages. Environmental issues result in protest over the oil sands development at the Jackpine Mine Expansion project. The dispute commenced when Shell intended not to fulfill its commitments with regard to the significant reduction of the greenhouse gas emission.
To formally study the conflict of the Jackpine Mine Expansion dispute, the Graph Model for Conflict Resolution (GMCR) methodology is utilized. The dispute is divided into three phases because each phase involves different decision makers and corresponding options. Phase I commenced in 2007 when Shell was unwilling to implement its commitments of reducing greenhouse gas emissions, and ended when a joint federal and provincial review panel was established in September 2011. Phase II ran from September 2011 until the joint review panel released a report in July 2013. Phase III started from July 2013 and concluded when the Federal Government of Canada issued a decision statement in December 2013.
233
2 Background of the Jackpine Mine Expansion Dispute
The Jackpine Mine Expansion project is an oil sands mining program located about 70 km north of Fort McMurray on the east side of the Athabasca River, and it extends to the north of the current Jackpine Mine project. A location map of the project can be seen in Fig. 1.
Fig. 1. Map of the Project Location [1]
On May 31, 2002, Shell submitted an application for the Jackpine Mine-Phase I (JMPI). The JMPI project received regulatory approval by the governments of Alberta and Canada in 2004, and began operations in August 2011 [1]. On September 18, 2003, Shell and Oil Sands Environmental Coalition (OSEC) reached a bilateral agreement which included commitments to significantly reduce greenhouse gas pollution from the JMPI project. OSEC believed that the approval of the JMPI project was assisted by this agreement [2]. In December 2007, Shell submitted an application
234
for the Jackpine Mine Expansion (JPME) project which would increase the production by 100,000 barrels of bitumen per day. The JMPE project was approved in January 2009.
During the period from November 2007 to January 2009, in written correspondence and face-to-face meetings, OSEC realized that Shell did not intend to fulfill the commitments, rather it planned to comply with future federal greenhouse gas (GHG) regulatory requirements [2]. OSEC believed that even if Shell were to comply with the federal GHG reduction requirements, Shell’s GHG pollution from these projects would increase by an estimated 900,000 tonnes without the commitments. OSEC was disappointed and decided to take action. On behalf of the OSEC, the Pembina Institute submitted a complaint to the Alberta Energy Resources Conservation Board (ERCB) and the Canadian Environmental Assessment Agency (CEAA) on April 7, 2009. In the complaint, OSEC requested a new public hearing regarding the approval of JPME project because Shell reneged on written agreements with OSEC [3].
On September 20, 2011, a joint federal and provincial review panel was established, and a public hearing was conducted on October 29, 2012 in Fort McMurray, Alberta. Shell and OSEC both provided supplemental information to the panel. On July 9, 2013, the Joint Review Panel (JRP) released a report claiming that there would be significant adverse project effects on certain wildlife and vegetation, but these effects could be justified. The project was recommended to be approved with a series of recommendations [4].
The Panel’s report was taken into account when the federal government made a final decision. On December 6, 2013, the Federal Ministry of the Environment issued a decision statement declaring that the project might proceed in accordance with conditions set out in the statement [5]. The Pembina Institute reacted to the decision on December 9, 2013, stating that it was disappointed about the decision [6]. A lawsuit was filed to the Federal Court by the Athabasca Chipewyan First Nation in January 2014.
3 Modeling and Analysis
GMCR is a comprehensive and flexible methodology for modeling and analyzing strategic conflict [7]. This technique requires relatively less information to construct a model: decision makers (DMs), options and preferences. For the JPME Phase I conflict, the DMs are Shell, OSEC, and ERCB. The options for Shell are to "comply with the federal GHG requirements" and "negotiate with OSEC to reach a new agreement". OSEC’s options include to "request a public hearing" and "negotiate with Shell". The option for ERCB is to "hold a public hearing". The DMs and their options for the three phases of the JPME conflict are summarized in Table 1. A dash “—” in the table means the corresponding DM is not involved in that phase.
A conflict with n options has 2n states in total. However, not all states are possible to occur in reality, the infeasible states should be eliminated. For example, in Phase I, Shell will not choose its two options simultaneously, and must choose at least one of
235
its options. OSEC is the same. Moreover, ERCB will conduct a public hearing if and only if OSEC requests one. The elimination process leaves six feasible states in Phase I of the conflict, as shown in Table 2. In this table, letter “Y” means the option is selected while “N” means the option is not chosen.
Table 1. Summary of Decision Makers and Options in the JPME conflict
DMs Phase I Phase II Phase III
Shell 1. Comply with federal requirements 1. Continue the
project 1. Accept the decision
2. Negotiate with OSEC
OSEC 3. Request public hearing 2. Against the project 2. Protest
4. Negotiate with Shell ERCB 5. Hold public hearing — —
JRP — 3. Approve the project
— 4. Modify the project 5. Reject the project
Federal Government — —
3. Agree the decision 4. Reject the decision
Table 2. Feasible States for Phase I
DMs Options Shell Comply Y N Y N Y N
Negotiate N Y N Y N Y OSEC Request Y Y Y Y N N
Negotiate N N N N Y Y ERCB Hearing N N Y Y N N
State 1 2 3 4 5 6 Preferences are an important aspect in a conflict study. Option prioritizing [8] is a
common technique to apply. It specifies preferences through assigning priorities to the preference statements in the model, the top statement has the highest priority and the last statement has the lowest priority. For example, in Phase I, Shell most prefers ERCB not hold a public hearing, next prefers to comply with the federal requirements. Shell’s least important preference statement is to negotiate with OSEC. As obtained by using the option prioritization technique, Shell’s preference ranking of states is: (5, 1, 6, 2, 3, 4). OSEC prefers to request a public hearing the most because Shell insists not to implement its commitments with OSEC. Then OSEC would like ERCB to hold a public hearing if OSEC requests one. OSEC also would like to negotiate if and only if Shell is willing to negotiate. OSEC’s preference ranking of states is: (3, 4, 1, 2, 6, 5). ERCB’s most preferred statement is that Shell and OSEC negotiate with each other. Next, it would like to hold a public hearing if and only if OSEC requests one. ERCB’s preference ranking of states is: (6, 5, 4, 2, 3, 1). The same analysis is performed for Phase II and Phase III.
236
A state is stable for a DM if and only if the DM has no incentive to move away from the state. A state that is stable for all DMs is called an equilibrium. There are different types of stability definitions that are used to search for equilibria, including Nash Stability, General Metarationality, Symmetric Metarationality, Sequential Stability, Limited-move Stability, and Non-myopic Stability. An equilibrium provides a possible resolution to the conflict. The equilibria can be identified using the decision support system GMCR II [8, 9].
According to GMCR II, there are two equilibria for Phase I: a weak equilibrium (state 2) and a strong equilibrium (state 3). State 2 is stable for all stabilities except Nash stability. State 3 indicates that Shell chose to comply with the federal requirements. OSEC was disappointed and requested a new public hearing. ERCB decided to conduct a public hearing. Similarly, the single equilibrium for Phase II indicates that Shell preferred to continue the project while OSEC preferred to be against the project. JRP recommended a modification to the original project. In fact, these results were the actual situations that happened in September 2009 and July 2013, respectively.
Moreover, the results calculated by GMCR II indicate that there are two equilibria for Phase III. If the Federal Government rejects the project, Shell would not accept the decision while OSEC would glad to see this situation. If the Federal Government approves the project, OESC would be against the decision. In this case, the final result would depend on the preference of the Federal Government. In fact, the government approved the project in reality, which means that the government preferred the latter situation to the former one. A historical evolution of the dispute is illustrated in Fig. 2.
Fig. 2. Historical Evolution of the JPME conflict
4 Insights and Conclusions
Economic benefits and environmental damages are two important sides of the rapid expanded oil sands projects. A balance between these two sides would significantly benefit the sustainable energy future. According to the results predicted by GMCR, we can presume that the Federal Government of Canada cares more about economic benefits than environmental impacts. The position of the government results in massive protests and complainants from environmental organizations and Aboriginal
237
people. The government should make sure that the oil sands projects are developed in a responsible manner and put more efforts on the environment conservation.
Moreover, a sensitivity analysis for Phase II suggests that there exists a certain DM who holds the balance of power (JRP in this case). Changes in the preference of this DM would vary the equilibrium of the conflict, while changes in the preferences of other DMs (Shell and OSEC) would not change the equilibrium. This information can be useful in understanding the role of each DM in a multi-participant decision making problem.
References
1. Jackpine Mine Expansion Project Description, http://s06.static-shell.com/content/dam/shell-new/local/country/can/downloads/pdf/aboutshell/aosp/vol-1-jpme-projectdescription.pdf. Accessed on December 1, 2013
2. Shell Breaks Global Warming Promise for Oilsands Projects, http://www.pembina.org/media-release/1808. Accessed on December 1, 2013
3. Letter to CEAA and ERCB regarding Shell-OSEC agreement, http://www.pembina.org/pub/1807. Accessed on December 1, 2013
4. Report of the Joint Review Panel, http://www.ceaa.gc.ca/050/documents/p59540/90873E.pdf. Accessed on December 5, 2013
5. Jackpine Mine Expansion Project - Release of Environmental Assessment Decision Statement, http://www.ceaa-acee.gc.ca/050/document-eng.cfm?document=96783. Accessed on December 12, 2013
6. Pembina reacts to federal approval of Shell Jackpine mine expansion, http://www.pembina.org/media-release/2509. Accessed on December 12, 2013
7. Fang, L., Hipel, K.W., Kilgour, D. M.: Interactive Decision Making: The Graph Model for Conflict Resolution. Wiley, New York (1993)
8. Fang, L., Hipel, K.W., Kilgour, D. M., Peng, X.: A Decision Support System for Interactive Decision Making, Part 1: Model Formulation. IEEE Transactions on Systems, Man and Cybernetics, Part C 33(1), 42-55 (2003)
9. Fang, L., Hipel, K.W., Kilgour, D. M., Peng, X.: A Decision Support System for Interactive Decision Making, Part 2: Analysis and Output Interpretation. IEEE Transactions on Systems, Man and Cybernetics, Part C 33(1), 56-66 (2003)
Abstract. The water diversion conflicts in China caused by the SouthNorth Water Diversion Project (SNWDP) are analyzed in a hierarchicalstructure. The hierarchical conflicts are modeled within the paradigm ofthe Graph Model for Conflict Resolution (GMCR) and represented inmatrices to carry out calculation. Comprehensive resolutions based onthe stability results provide possible courses of action for decision makersto follow.
To ease the severe water shortages in the North China Plain, the South NorthWater Diversion Project (SNWDP) has been proposed covering three locations.Conflicts arise with the implementation of this project. These conflicts are mod-eled in a hierarchical structure and within the paradigm of the Graph Modelfor Conflict Resolution (GMCR). Possible resolutions of the hierarchical conflictcan be obtained to provide decision makers with courses of action to follow.
With 19% of the world’s population and low water availability per capita,China suffers from frequent water shortages. In the North China Plain, severedroughts are caused by the increase of population and the decrease of precipita-tion. The increasing demand for water in industry and agriculture in the NorthChina Plain worsens these water storages.
The South-North Water Diversion Project is designed to better utilize Chi-nas water resources. According to the project plan, water is diverted from thefrequently flooded Yangtze River Basin to the dry North China Plain. This hugeproject consists of three main routes, Eastern, Central, and Western, as shown inFig.1. As the project could have significant impacts on local societies and theirenvironment, disputes among stakeholders, such as provincial governments andresidents, arise on the three routes.
239
2 Shawei He, D. Marc Kilgour, and Keith W. Hipel
Fig. 1. The three routes of the South-North Water Diversion Project (Source:http://francistopia.edublogs.org/2011/06/03/south-north-water-diversion-project/,2011)
Water diversion has been an important area of research from several perspec-tives. Interbasin water diversion projects in Brazil have been compared with tworelevant projects: the Colorado-Big Thompson Project in the US and anotherin Australia [1]. Environmental, political, and economic complexities are oftenassociated with these interbasin water diversion plans. Disputes caused by wa-ter diversions from the North American Great Lakes were investigated usinggame theory [3]. For SNWDP, water shortages were evaluated in areas aroundthe Danjiangkou Reservoir [6]. A flexible water storage limit was set to allocatewater effectively in the Yellow River Basin [16].
Methodologies to deal with conflicts have been developed, such as GameTheory [17], Metagame analysis [8], Conflict Analysis [5], Drama Theory [9], andGraph Model for Conflict Resolution (GMCR) [4]. In particular, GMCR has aflexible structure to model conflicts and can provide meaningful analytical results[14]. The basic components of a graph model include a set of decision makers(DMs), possible states, movements among states, and the relative preferencesof each DM [4]. The matrix representation of a graph model was proposed byXu et al. [18, 19]. It is an effective way of expressing conflicts and carryingout necessary calculations. Other studies on the graph model include coalitionanalysis [11, 12, 13], preference uncertainty [15], strength of preference [7], andFuzzy preferences [2, 10].
The objective of the present study is to represent the hierarchical graphmodel in matrix form to investigate strategies in the water diversion conflictsin China. The analytical results indicate a comprehensive resolution for DMs tofollow.
Kamineta
Rectangle
240
Matrix Representation of a Hierarchical Water Diversion Conflict in China 3
2 A basic Hierarchical Graph Model
A graph model for a strategic conflict contains a finite set of DMs, a finiteset of feasible states, and preference relations for each DM. A hierarchical graphmodel consists of more than one smaller graph models, each of which represents asubconflict. A basic hierarchical graph model contains two smaller graph models,called subgraphs. In the basic hierarchical model, there is one common DM(CDM) who participates in both subconflicts. In each subgraph, the other DMbesides CDM can only participate in the corresponding subconflict, which isdefined as local DM (LDM). Thus, there are two LDMs and one CDM in abasic hierarchical model. The structure of this model is shown in Fig. 2, wherea line represents an interaction between two DMs. The two LDMs are labeledas LDM1 and LDM2.
Fig. 2. Interaction among DMs in a basic hierarchical model
As CDM may consider one subgraph more important than the other, thispriority is defined as subgraph importance for CDM. The preference relations forCDM are determined by its preferences in the two subgraphs and the subgraphimportance.
3 Matrix Representation of Hierarchical Graph Model
In a graph model, possible moves among feasible states for each DM can berepresented by a reachable list. The possible improvements among states foreach DM can be denoted by a unilateral improvement list. The reachable listand unilateral improvement list can also be represented by reachability matrixand preference matrix.
The states in the hierarchical model are the Cartesian product of states inthe subgraphs. Hence, the reachability matrix for CDM in the hierarchical graphcan be defined as a tensor product of the two reachability matrices for CDM
Kamineta
Rectangle
241
4 Shawei He, D. Marc Kilgour, and Keith W. Hipel
in subgraphs. With the information of subgraph importance, the hierarchicalpreference matrix for CDM can be constructed by two preference matrices forCDM in subgraphs. For each LDM in the basic hierarchical graph model, thehierarchical reachability matrix is expanded from the local reachability matrix.In this hierarchical reachability matrix, the entries representing the moves inthe other subgraph should be zero. Similarly, the hierarchical preference matrixfor each LDM can be obtained. Accordingly, Nash rationality (R), sequentialstability (SEQ), general metarationality (GMR), and symmetric metarationality(SMR) can be determined by using the relationship between matrix elements andthe state set in the hierarchical graph model [20].
4 Hierarchical Water Diversion Conflicts in China
As the eastern project is complete, conflicts arise on the central and westernroute and will affect the construction of the related projects. Local residents areaffected by the construction on the central route. These residents oppose thisproject since they suffer from the relocation due to the inadequate compensationprovided by the Central Government, in terms of providing subsidies, new resi-dences, and job opportunities. As water will be diverted from some internationalrivers in the Tibetan Plateau, some neighboring countries show their concernsover the western project. They would protest this project and seek negotiationswith Beijing.
The aforementioned conflicts are modeled in a basic hierarchical graph. Theconflicts on the central and western routes are modeled by two subgraphs re-spectively. Chinese central government (CG) is CDM and local residents (LRs)and neighboring countries (NCs) are two LDMs, each of which is in the corre-sponding subgraph. As the western plan is still under discussion, CG considersthe central conflict more important. The options and preferences for each DMare determined. Hence, the reachability and preference matrices for each DMin two subgraphs can be obtained. The hierarchical reachability and preferencematrices for each DM can be constructed accordingly.
5 Stability Analysis
Four types of stabilities, Nash rationality (R), sequential stability (SEQ), generalmetarationality (GMR), and symmetric metarationality (SMR) in the hierarchi-cal graph model are calculated with these hierarchical matrices. The equilibriathat reflect possible outcomes of the hierarchical conflict are obtained. Accord-ing to the analytical results, CG can carry out the projects on the central routeregardless of opposition from LRs. However, on the western route, CG shouldsuspend the projects in order to appease NCs. The difference in CG’s resolutionon two routes is caused by CGs priority over the central route. The two LDMsshould also be inspired by the analytical results. Confronted with CGs strongdetermination in implementing the central projects, LRs should rethink their
Kamineta
Rectangle
242
Matrix Representation of a Hierarchical Water Diversion Conflict in China 5
options to achieve a more favorable outcome. NCs are satisfied by the suspen-sion of the western projects. However, they should still be alerted because CGmay resume the projects once it sets priority on the western route.
6 Conclusions
To model the hierarchical conflicts caused by SNWDP, GMCR is extended toa basic hierarchical model consisting of two subgraphs. The hierarchical graphmodel is then represented in matrices to facilitate calculation. The reachable andpreference matrices are constructed by the corresponding matrices in subgraphs.The analytical results reveal the resolutions for all DMs in the hierarchical con-flict.
The basic hierarchical graph model can be further extended into a generalhierarchical model with more than one CDM. It may also be possible to assumemore subgraphs and LDMs in each subgraph. Coalitions among LDMs withina subgraph can also be investigated. The matrix representation on the generalhierarchical model should be studied accordingly.
References
1. de Andrade, J., Barbosa, P., Souza, L., Makino, D.: Interbasin Water Transfers:The Brazilian Experience and International Case Comparisons. Water ResourcesManagement, 25, 1915–1934 (2011).
2. Bashar, M.A., Kilgour, D.M., and Hipel, K.W.: Fuzzy preferences in the graphmodel for conflict resolution. IEEE Transactions on Fuzzy Systems, 20(4), 760–770 (2012).
3. Becker, N., Easter, K.: Water Diversions in the Great Lakes Basin Analyzed in aGame Theory Framework. Water Resources Management, 9, 221–242 (1995).
4. Fang, L.: Interactive decision making: The graph model for conflict resolution,volume 3. New York: Wiley (1993).
5. Fraser, N. M. and Hipel, K. W.: Conflict analysis: Models and resolutions. North-Holland (1984).
6. Gu, W., Shao, D., Jiang, Y.: Risk Evaluation of Water Shortage in Source Areaof Middle Route Project for South-to-North Water Transfer in China. Water Re-sources Management, 26, 3479–3493 (2012).
7. Hamouda, L., Kilgour, D. M., and Hipel, K. W.: Strength of preference in thegraph model for conflict resolution. Group Decision and Negotiation, 13(5):449–462 (2004).
8. Howard, N.: Paradoxes of rationality: theory of metagames and political behavior.Cambridge: MIT Press (1971).
9. Howard, N.: Confrontation analysis: how to win operations other than war. Tech-nical report, C4ISR Cooperation Research Program, The Pentagon, Washington,D.C. (1999).
10. Hipel, K.W., Kilgour, D.M., and Bashar, M.A.: Fuzzy preferences in multiple par-ticipant decision making. Scientia Iranica, Transactions D: Computer Science andEngineering and Electrical Engineering, special publication dedicated to the life-long achievements of Professor Lotfi A. Zadeh, 18(3)(D1), 627–638 (2011).
Kamineta
Rectangle
243
6 Shawei He, D. Marc Kilgour, and Keith W. Hipel
11. Inohara, T. and Hipel, K. W.: Coalition analysis in the graph model for conflictresolution. Systems Engineering, 11(4):343–359 (2008).
12. Inohara, T. and Hipel, K. W.: Interrelationships among noncooperative and coali-tion stability concepts. Journal of Systems Science and Systems Engineering,17(1):1–29 (2008).
13. Kilgour, D. M., Hipel, K. W., Fang, L., and Peng, X. J.: Coalition analysis in groupdecision support. Group Decision and Negotiation, 10(2):159–175 (2001).
14. Kilgour, D. M. and Hipel, K. W.: The graph model for conflict resolution: past,present, and future. Group Decision and Negotiation, 14(6):441–460 (2005).
15. Li, W., Hipel, K. W., Kilgour, D. M., and Noakes, D.: Intergrating uncertainpreferences into status quo analysis with application to an environmental conflict.Group Decision and Negotiation, 14(6):461–479 (2005).
16. Shao, W., Yang, D., Hu, H., Sanbongi, K.: Water Resources Allocation Consideringthe Water Use Flexible Limit to Water Shortage-A Case Study in the Yellow RiverBasin of China. Water Resources Management, 23, 869–880 (2009).
17. Von Neumann, J. and Morgenstern, O.: Theory of games and economic behavior(1st Ed). Princeton: Princeton University Press (1944).
18. Xu, H., Kilgour, D. M., and Hipel, K. W.: Matrix rep- resentation and extensionof coalition analysis in group decision support. Computers and Mathematics withApplications, 60(5):1164–1176 (2010).
19. Xu, H., Kilgour, D. M., Hipel, K. W., and Kemkes, G.: Using matrices to link con-flict evolution and resolution in a graph model. European Journal of OperationalResearch, 207(1):318–329 (2010).
20. Xu, H., Hipel, K. W., and Kilgour, D. M.: Matrix representation of conflicts withtwo decision-makers. In Systems, Man and Cybernetics, 2007. ISIC. IEEE Inter-national Conference, 1764–1769 (2007).
Kamineta
Rectangle
244
The Preference Graph Model for ConflictResolution
Yasser T. Matbouli1,2, D. Marc Kilgour3, and Keith W. Hipel1
1 Department of Systems Design Engineering, University of Waterloo, Waterloo,Ontario, Canada N2L 3G1
2 Department of Industrial Engineering, King Abdulaziz University, Rabigh, SaudiArabia
3 Department of Mathematics, Wilfrid Laurier University, Waterloo, Ontario,Canada N2L 3C5
Abstract. The Graph Model for Conflict Resolution provides a rich il-lustration of real life conflicts. In this paper, the Graph Model for ConflictResolution is enhanced to provide the analyst with more in-depth infor-mation about an underlying conflict. This improvement is achieved byrepresenting decision makers’ preferences within the graph, which makesit possible to infer certain individual stability condition by glancing atthe graph. A short background on modelling techniques for conflicts isgiven, including two types of stability properties that can be inferredfrom the graph.
Conflicts are a complex form of decision-making [12] in which two or more de-cision makers (DMs) pursue incompatible goals [5]. Game theoretic approachesprovide the basis for modelling and analyzing conflicts. There is a number ofways to model conflicts, including the normal form, the extensive form, the op-tion form, and the graph model for conflict resolution. Each modelling strategyconveys a particular amount of information based on its illustrative capacity.The normal form, for instance, is compact, easy to draw, and simple to read.However, it can only be used for small conflicts where the number of decisionmakers is limited to two or three. There is also a limited amount of informationconveyed through the extensive form. The Graph Model for Conflict Resolution(GMCR), which can use the option form for notation, is the most comprehensivemodelling approach for conflicts. It presents moves and countermoves only whenthey exist. GMCR can account for moves that are reversible or irreversible andcommon, and preferences that are either transitive or intransitive.
245
2 Matbouli, Kilgour, and Hipel
2 Background
In order to understand and analyze a conflict, different modelling techniques areused. The modelling of a conflict aims to provide in-depth understanding of a aconflict.
2.1 Conflict Resolution Models
A conflict resolution model is an abstraction of a real life conflict where two ormore DMs are engaged in a dispute [2, 6, 7, 13]. Modelling conflicts falls undernoncooperative game theory where DMs act independently [2, 8]. There are anumber of ways to model a conflict: normal form [21], extensive form [18, 21],option form [9], and the graph model [2, 6, 7, 13].
The normal form is usually used to present a two-person game in a matrix,where the columns represent strategies available to one player, and the rowsrepresent strategies available to the other. Each cell represents a combinationof column and row strategy, which is useful to present compact games. In thenormal form, all moves seem reversible, which is not always the case. An im-provement over the normal form is the extensive form, which is a tree-like formatthat shows moves when they are available unilaterally. Nonetheless, because theextensive form branches out to show every possible move from each node, a con-flict presented this way can be very large and hard to work with. In contrast, theoption form, which uses a tabular format, can present large games [22], but lacksthe ability to illustrate limitations in moves and countermoves. The option formis widely used to model conflicts [2,9]. Finally, the graph model is the most ad-vanced form to present moves that are possible for a DM, reversible, irreversible,or common. It also handles cardinal as well as ordinal preferences of DMs. Thegraph model can be used to present the moves of one DM, or combined to presentthe collective moves and countermoves of all DMs [2,6, 7, 10,11,13,16,17].
2.2 Resolution Concepts
The resolution of a conflict is assumed to take place when the conflict becomesstable, as is assumed based on several sociological scenarios [2]. From DM’sposition in a conflict, systematic what-if questions can be asked to investigate thechoices available. When all DMs find a certain scenario of a conflict acceptable,then this scenario is considered a possible resolution or equilibrium.
Individual Stability There are a number of stability concepts used in conflictresolution. Considering the preferences of DMs, their available moves and coun-termoves, stability definitions identify the likelihood of a state being accepted.For example, a DM who cannot unilaterally improve to a more preferred state,his or her state is considered stable for this particular DM. The previous ex-ample is called Nash stable (R) [19, 20]. However, a state that is stable for oneplayer may not necessarily be stable for others. A resolution exists only when
Kamineta
Rectangle
246
The Preference Graph Model 3
an equilibrium is reached, which happens when all DMs find the same state tobe stable.
Other stability definitions include general metarationality (GMR) [9], sym-metric metarationality (SMR) [9], sequential stability (SEQ) [3,4], limited-movestability (Lh) [15,17,23], and nonmyopic stability (NM) [1,14,15,17]. The fore-sight by which these stability definitions investigate what-if scenarios is different.In Nash stability, the oversight is considered low [2] because it considers only onemove beyond present point. GMR and SEQ take into account one step furtherto examine countermoves, and SMR two steps. Limited-move stability has vari-able foresight; the analyst defines the horizon, or number of foreseeable steps.Finally, nonmyopic stability provides the highest level of foresight. It extendslimited-move stability to take into account all possible steps beyond a certainstate [2]. Nonetheless, both limited-move and nonmyopic stability assume tran-sitive preferences.
2.3 The Graph Model for Conflict Resolution
For each decision maker, the Graph Model for Conflict Resolution consists ofthree main elements: feasible states, unilateral moves, and preferences. TheGraph model for DMi is Gi = (S,Ai, i,∼i) where Gi is the decision maker’si graph, S is the set of feasible states, Ai is the set of unilateral moves availablefor DMi such that Ai ⊆ S × S, and i,∼i represents DMis preference rela-tion; for any s, q ∈ S, s i q means state s is more preferred than state q, ands ∼i q means state s is indifferent to state q for DMi.
Consider the graph model for DM1 given in Figure 1. There are twelve statesS = 1, 2, 3, 4, 5, 6, 7, 8, 9, 10, 11, 12 and the preference relation for DM1 is:
In Figure 1, all elements of the graph are represented: states by numberednodes referring to each feasible states’, oriented arcs, which represent possibleunilateral moves for DM1, and finally preferences, which are written at thebottom of the graph. Although the preferences are written with the graph, theyseem more like an attachment to the graph rather than an original element ofthe graph. This leads to the proposed improvement in the graph model, whichis presented in the next section.
3 The Preference Graph Model
Utilizing the same illustrative example given in Section 2.3, the enhanced graphmodel as shown in Figure 2 represents the proposed developments in the graphmodel. Solid arcs represent preferred unilateral moves for DM1. All solid arcs inthis graph are reversible, except the move between node 10 and 11 where a verti-cal line crosses the solid arc, 7→ or 9, which represent an irreversible move. The
dashed arcs represent preferences but not actual moves. Thus, DM1 would preferto move from state 9 to 7 but cannot do so unilaterally. The combined nodesof (1, 2) and (3, 4, 5, 6) represent groups of equally preferred states, where DM1
can unilaterally move within each group. The main advantage of the enhancedgraph is that preferences are embedded in the graph, helping the analyst to findstates that are stable for the decision maker. Moreover, knowing which movesare desired but not available to the decision maker can be used to understandthe evolution of a conflict.
1,2
3,4,5,6
8
7
11 12 10 9
Fig. 2. The Preference Graph Model for DM1
Therefore, changes are proposed to the original definition of graph model tointroduce the preference graph model. The elements of the Preference GraphModel remain similar to the original graph. However, the oriented arcs no longer
Kamineta
Rectangle
248
The Preference Graph Model 5
represent a unilateral move, but rather, a unilateral improvement. Hence, desiredbut not possible moves are represented by a dashed oriented arc to differentiatebetween an available and a desired but not possible unilateral move. Now, theGraph model for DMi becomes Gi = (S,Ai, Vi, Ui) where Gi is the decisionmaker’s i graph, S is the set of feasible states, Ai is the set of reversible unilateralimprovements available for DMi such that Ai ⊆ S×S, Vi is the set of irreversibleunilateral improvements available for DMi such that Vi ⊆ S × Sand Ui is theset of desired but not available moves such that Ui ⊆ S × S, in symbols, Ui =(s1, s2) ∈ S × S : (s1, s2) /∈ Ai and s2 i s1.
The Preference Graph Model can provide insights to stability analysis ofindividual decision makers. For example, in Figure 2 it can be inferred that DM1
is Nash stable at states 7 and 9, because there is no unilateral improvementsfrom these states. Moreover, in an integrated graph, which is not presented inthis paper, the analyst will also be able to recognize states that are sequentiallystable. Such advantages will simplify the analysis of conflicts using the PreferenceGraph Model for Conflict Resolution.
4 Conclusions
Embedding the preferences of a decision maker in the graph not only facili-tated the understanding of unilateral improvements and desired moves, but alsosimplified the analysis and recognition of certain individual stability conditions.However, even though the preference graph in its current form does not accountfor intransitive preferences, most real life conflicts have transitive preferences.The original graph model can account for intransitive preferences by providinga list of pairwise comparison of all states attached to the graph. Finally, futurework on the preference graph model will be needed to address intransitive pref-erences, and to define the integrated graph. Hence, the Preference Graph Modelis recommended for transitive preferences only.
References
1. S.J. Brams and D. Wittman. Nonmyopic equilibria in 2× 2 games. ConflictManagement and Peace Science, 6(1):39–62, 1981.
2. L. Fang, K.W. Hipel, and D.M. Kilgour. Interactive decision making: the graphmodel for conflict resolution. Number v. 3 in Wiley series in systems engineering.J. Wiley, 1993.
3. N.M. Fraser and K.W. Hipel. Solving complex conflicts. Systems, Man and Cy-bernetics, IEEE Transactions on, 9(12):805–816, 1979.
4. N.M. Fraser and K.W. Hipel. Conflict Analysis: Models and Resolutions, SeriesVolume 11. North-Holland, 1984.
5. Johan Galtung. Conflict theory. In Lester Kurtz, editor, Encyclopedia of Violence,Peace, and Conflict, pages 391 – 400. Academic Press, Oxford, second editionedition, 2008.
Kamineta
Rectangle
249
6 Matbouli, Kilgour, and Hipel
6. K. W. Hipel, editor. Conflict resolution, volume 1. Eolss Publisher, Oxford, UK,isbn-978-1-84826-120-4 (adobe e-book), isbn-978-1-84826-570-7 library edition edi-tion, 2009.
7. K. W. Hipel, editor. Conflict resolution, volume 2. Eolss Publisher, Oxford, UK,isbn-978-1-84826-121-1 (adobe e-book), isbn-978-1-84826-571-4 library edition edi-tion, 2009.
8. Keith W Hipel and Amer Obeidi. Trade versus the environment: Strategic settle-ment from a systems engineering perspective. Systems Engineering, 8(3):211–233,2005.
9. N. Howard. Paradoxes of Rationality: Games, Metagames, and Political Behavior.MIT Press, Cambridge, Massachusetts, 1971.
10. Takehiro Inohara and Keith W Hipel. Coalition analysis in the graph model forconflict resolution. Systems Engineering, 11(4):343–359, 2008.
11. Takehiro Inohara and Keith W Hipel. Interrelationships among noncooperative andcoalition stability concepts. Journal of Systems Science and Systems Engineering,17(1):1–29, 2008.
12. Ho-Won Jeong, Charles Lerche, and Silvia Susnjic. Conflict management andresolution. In Lester Kurtz, editor, Encyclopedia of Violence, Peace, and Conflict(Second Edition), pages 379 – 390. Academic Press, Oxford, second edition, 2008.
13. D Marc Kilgour and Colin Eden. Handbook of group decision and negotiation,volume 4. Springer, 2010.
14. D.M. Kilgour. Equilibria for far-sighted players. Theory and Decision, 16(2):135–157, 1984.
15. D.M. Kilgour. Anticipation and stability in two-person noncooperative games.Dynamic Models of International Conflict, pages 26–51, 1985.
16. D.M. Kilgour and Keith W. Hipel. The graph model for conflict resolution:Past, present, and future. Group Decision and Negotiation, 14:441–460, 2005.10.1007/s10726-005-9002-x.
17. D.Marc Kilgour, Keith W. Hipel, and Liping Fang. The graph model for conflicts.Automatica, 23(1):41 – 55, 1987.
18. H.W. Kuhn. Extensive games and the problem of information. Contributions tothe Theory of Games, 2(28):193–216, 1953.
19. J. Nash. Non-cooperative games. Annals of mathematics, 54(2):286–295, 1951.20. J.F. Nash. Equilibrium points in n-person games. Proceedings of the national
academy of sciences, 36(1):48–49, 1950.21. J. Von Neumann and O. Morgenstern. Theory of Games and Economic Behavior.
Princeton University Press, 1944.22. Muhong Wang, Keith W Hipel, and Niall M Fraser. Solution concepts in hyper-
games. Applied Mathematics and Computation, 34(3):147–171, 1989.23. F.C. Zagare. Limited-move equilibria in 2× 2 games. Theory and Decision, 16(1):1–
19, 1984.
Kamineta
Rectangle
250
A Proposed Methodology for Predicting Opponent
Behaviour in Conflict Analysis
Amanda Garcia1, Amer Obeidi1,2, and Keith W. Hipel1
1Department of Systems Design Engineering, University of Waterloo, Ontario, Canada 2Department of Management Sciences, University of Waterloo, Ontario, Canada
36. Nie, N.H., D.S. Hillygus, and L. Erbring, Internet use, interpersonal relations, and
sociability, in The Internet in everyday life, B. Wellman and C. Haythornthwaite, Editors.
2002, Wiley. p. 215-243.
37. Kraut, R., et al., Internet Paradox Revisited. Journal of Social Issues, 2002. 58(1): p. 49-74.
262
1 THE USE OF CIRCULAR QUESTIONS IN MEDIATIONS
The Use of Circular Questions in Mediations
Debby Damen1, Per van der Wijst1, Yvonne van der Toorn1, Marije van Amelsvoort1,
1 Department of Communication- and Information Sciences, Tilburg University, Warandelaan
2, 5037 AB Tilburg, The Netherlands.
Abstract. This experimental research investigated the effect of circular questions in face-to-face mediations on the mutual understanding and interpersonal trust between disputants, and on the satisfaction of the disputants with the outcome of the mediation. Our study showed that mediation ‘works’: after the mediation, the interpersonal trust of disputants and the mutual understanding between disputants was significantly higher than before the mediation. However, no effects were found of circular questioning on the improvement of mutual understanding and interpersonal trust from before to after the mediation session.
Disputants ask for a mediator when they cannot solve their differences themselves. When disputants enter a mediation session, they are often unwilling or simply unable to take the perspective of their counterpart and to reflect on their actions. One of the mediator’s most important tasks is to help his clients just to take that other perspective [1]. In order to reach that objective, mediators can apply the communication technique of circular questioning. By asking a quarreling neighbor question like: “How do you think your neighbor will react to your insults?”, the addressee is obliged to think about the effect his behavior has on his neighbor [1]. Hence, in each circular question lies an implicit request for understanding the other. On the contrary, an open question such as “Mary, how do you feel about the broken glass?” only enables Mary to vent her own thoughts and feelings, without forcing her to take on the perspective of her counterpart. In addition, circular questions also address reciprocity and they invite disputants to take each their responsibility for the conflict [2]. Since both disputants are responsible for the conflict, they are also both responsible for its solution. For example, an circular question like “John, what do you think that Mary needs from you in order to fulfill your wish of keeping the shared front yard clean?”, forces John to think about ways to contribute to the dispute’s solution that suits Mary, whereas an open question like “John, what do you need from Mary?” focuses only on what John needs from the other party and not on what the other party needs from him. By also asking the reciprocity question to the other party Mary, both disputants can reflect on the fact whether their counterpart has the right perspective of their personal needs, feelings and whishes. The power of a circular question lies in the fact that perspective taking takes place right in the presence of the other party. Disputants see and hear the other party taking over their perspective and they judge their counterpart’s level of correctness. These effective communication techniques help develop the interpersonal rapport between disputants [3], [4], which consists of physical closeness, mutual attention, friendliness and spontaneous communication. The development of interpersonal rapport between disputants reduces tensions and facilitates the construction of mutual understanding (e.g. the feeling of being understood and understanding the other party) and interpersonal trust (e.g. the feeling of being trusted and trusting the other). Both mutual understanding and interpersonal trust are important factors influencing disputants’ satisfaction with the outcome [1], [5], [6]. In addition, these factors also influence how mutual beneficial the outcome is perceived to be [3]. Although it is assumed that circular questioning has a powerful influence on
Kamineta
Rectangle
263
2 THE USE OF CIRCULAR QUESTIONS IN MEDIATIONS
establishing understanding and trust between disputants, empirical tests of the assumed relation in a mediation setting are yet to be performed. Therefore, this research aims at clarifying that relation. The following hypotheses will be tested: H1 The use of circular questions by a mediator will increase the level of mutual understanding between the disputants, compared to using open questions. H2 The use of circular questions by a mediator will increase the level of interpersonal trust of the disputants. H3 A mediator using circular questions will be found to be more trustworthy, professional and impartial than a mediator who uses open questions only. H4 A higher mutual understanding between disputants after the mediation leads to a greater satisfaction with the negotiated results. H5 A higher interpersonal trust between disputants after the mediation increases the satisfaction with the negotiated results. H6 The use of circular questions by a mediator will increase the level of mutual satisfaction with the negotiated results: circular questions will increase the feeling that a settlement is beneficial for both parties.
2 Method
2.1 Participants and Design
The experimental design had one manipulation, namely question mode (open vs. circular) as a between subject factor. Forty participants, all bachelor students from the department of Communication and Information Sciences at Tilburg University participated in the study.
2.2 Confederates and Conflict Scenario
In each mediation setting, one participant and one confederate were invited. Seven different confederates (three males and four females) took part in the study. Out of these seven confederates, five were members of the Tilburg University drama club. All confederates were trained to take part in the study and were asked to act consistently in all sessions. All confederates were paid €5,- per session and played the role of the same neighbor in all sessions. In addition, one professional, NMI1-certified mediator (male) and two trained mediators (females) were invited to mediate the disputes. The trained mediators followed a two-day NMI certified course in “Applying Mediation Skills”. In this way, real-life mediation sessions could be simulated. The conflict scenario used was a neighbor’s quarrel, describing a conflict between a student (participants’ role) and their full-time working neighbor (confederates’ role).
1 The Netherlands Mediation Institute (NMI) is a national mediation platform in the Netherlands that assures the quality of its registered mediators.
Kamineta
Rectangle
264
3 THE USE OF CIRCULAR QUESTIONS IN MEDIATIONS
2.3 Procedure of the Mediations
Before the mediation started, participants were invited in a separate room in which they could not meet the confederate. Subsequently, they were handed a conflict scenario of the neighbors’ quarrel in which the participant was only confronted with the student’s version of the conflict. After having read the scenarios, participants were told they had to negotiate with their neighbor, that they would be assisted by a mediator, that they wanted to attain certain goals (described in the scenario), that they also wanted to have a good relationship with their neighbor in the future, and that there was no time pressure, although the experiment leader would ask the parties to wrap up the mediation after thirty minutes. After the mediation session, participants were asked to fill out a questionnaire.
2.4 Questionnaire
The questionnaire measured (1) whether a result was reached (yes/no), (2) the satisfaction level of both parties, (3) how mutual beneficial the outcome was perceived to be, (4) the mutual understanding between parties (before and after the mediation), (5) the interpersonal trust between parties (before, during and after the mediation), and (6) the trustworthiness, (7) professionalism and (8) perceived impartiality of the mediator. For these measurements, an adapted version of the Organizational Trust Inventory – Short Form (OTI-SF) created by Naquin and Paulson [7] was used, who adjusted the OTI-SF scale so that it would be more appropriate for negotiation settings. The items measuring the affective and cognitive components of all three dimensions of trust (i.e. reliability, honesty and good faith in the fulfillment of the counterpart’s commitments) [7] were supplemented with items concerning the professionalism, trustworthiness and partiality of the mediator, items concerning disputants’ satisfaction with the outcome, and items concerning disputants’ mutual understanding. For these constructs, 49 seven-point scales were made. All constructs had a high reliability, Cronbach’s α ranged from .69 to .89.
3 Results
Factorial ANOVAs for Repeated Measures were run to test for the effect of Question Type (circular vs. open) on Feeling Understood (before and after the mediation) and on Understanding (before and after the mediation). The means are presented in table 1.
Table 1. Question Type (Open vs. Circular) in Relation to Feeling Understood and Understanding (1 = minimum, 7 = maximum; SD between parentheses)
Significant main effects were found for Feeling Understood, F (1, 37) = 39.49, p < .001, and for Understanding, F (1, 37) = 165.74, p < .001, indicating that scores on these measures increased from before to after the mediation irrespectively from Question Type used by the mediator. There was no significant main effect of Question Type, F (1, 37) = 0.91, p = .347, indicating that open and circular questions did not differ in their effect on Feeling Understood nor on Understanding. However, there was a marginally significant interaction between Question Type and Feeling Understood before and after the mediation, F (1, 37) = 3.47, p = .071. The feeling of being understood tended to
Feeling Understood Understanding Before After Before After Open 1.98 (0.66) 4.60 (1.23) 2.96 (1.00) 5.35 (0.64) Circular 2.11 (1.04) 5.19 (1.02) 2.66 (1.07) 5.58 (0.68)
Kamineta
Rectangle
265
4 THE USE OF CIRCULAR QUESTIONS IN MEDIATIONS
improve more after circular questions, Mbefore = 2.11, SD = 1.04; Mafter = 5.19, SD = 1.02, compared to open questions, Mbefore = 1.98, SD = 0.66; Mafter = 4.60, SD = 1.23. The second analysis investigated the interaction effect of Question Type (circular vs. open) on Feeling Trusted (before, during and after the mediation) and Trust in the Other (before, during and after the mediation). The means are presented in table 2.
Table 2. Question Type in Relation to Feeling Trusted and Trust in the Other (1 = minimum, 7 = maximum; SD between parentheses).
There were main effects for Feeling Trusted, F (1.35, 51.09) = 128.36, p < .001, and Trust in the Other, F (1.38, 50.96) = 111.22, p < .001. Contrasts revealed that the ratings for Feeling Trusted before the mediation significantly improved during, F (1, 37) = 185.41, p < .001, and after the mediation, F (1, 38) = 116.96, p < .001. In addition, the ratings for Trust in the Other before the mediation significantly improved during, F (1, 37) = 145.06, p. < .001, and after the mediation, F (1, 37) = 107.99, p < .001. However, no significant interaction effects were found for Question Type on the three levels of Feeling Trusted, F (1.35, 51.09) = 0.95, p = .360, and on the three levels of Trust in the Other, F (1.38, 50.96) = 1.19, p = .299.
The third analysis tested the main effect of Question Type on the Professionalism, Trustworthiness and Partiality of the mediator. The means are presented in table 3.
Table 3. Question Type (Open vs. Circular) in Relation to the Professionalism, Trustworthiness and Partiality of the Mediator (1 = minimum, 7 = maximum; SD between parentheses).
The analysis revealed non-significant results for Question Type on the Professionalism, F (1, 38) = 0.01, p = .922, Trustworthiness, F (1, 38) = 0.06, p = .805, and the Partiality of the mediator, F (1, 38) = 0.56, p = .460. The fourth analysis tested the relationship between mutual understanding after the mediation and disputants’ satisfaction with the outcome of the mediation. There were significant positive relationships between Feeling Understood and the Satisfaction With the Outcome, r = .50, p (one tailed) < .001, and between Understanding and the Satisfaction With the Outcome, r = .55, p (one tailed) < .001. The fifth analysis investigated the relationship between the interpersonal trust after the mediation and disputants’ satisfaction with the outcome. There were significant positive relationships between Feeling Trusted and the Satisfaction With the Outcome, r = .47, p (one-tailed) < .001, and between Trust in the Other and the Satisfaction With the Outcome, r = .55, p (one-tailed) < .001. The last analysis looked at the main effect of Question Type on the Mutual Satisfaction of the Outcome (e.g. beneficial for both disputants). The means are presented in table 4.
Feeling Trusted Trust in the Other Before During After Before During After Open 2.50
Table 4. Question Type (Open vs. Circulair) in Relation to the Mutual Satisfaction, Personal Gain Only, Gain for Counterpart Only (1 = minimum, 7 = maximum; SD between parentheses).
The results showed that there were no significant main effects of Question Type on Mutually Beneficial, F (1, 38) = 0.15, p = .699, Personal Gain Only, F (1, 38) = 0.11, p = .739, and Gain For Counterpart Only, F (1, 38) = .25, p = .622.
4 Discussion
In general, mediation seems to ‘work’. The mutual understanding and interpersonal trust improved from before to after the mediation. Moreover, the improved mutual understanding and interpersonal trust made disputants more satisfied with the settlements they had reached. Further, the type of question (open vs. circular) tended to interact with the feeling of being understood, indicating that the feeling of being understood improved more from after a session of a mediator using circular questions, compared to open questions. However, regardless whether disputants were confronted with open or circular questions, the feeling of understanding the other party, being trusted and trusting the other party was higher after the mediation than before the mediation. Furthermore, the type of questioning did not affect the mediators’ trustworthiness, professionalism or partiality, and the type of question did not have a significant effect on how mutually beneficial the outcome was perceived to be. Although perspective taking would be beneficial in theory, we did not find empirical evidence for it. Does the theory not hold for mediation processes, or could other factors account for this result? We did find that disputants were much happier with the settlements they reached when their mutual understanding and interpersonal trust was higher. Establishing understanding and trust is thus important for the mediation process. Therefore, it could be that other factors accounted for the effect of circular questioning in the mediations.
A factor that could have accounted for the results is the naturalistic environment of our mediations. The realistic face-to-face settings and the presence of the mediator could have intensified the feeling of conflict. Disputants’ feeling of being wronged could have led them to resist empathizing with their counterpart. To examine whether this could have been the case in our mediation experiments, we will analyze the (non-)verbal behaviors of the disputants in the video-recordings of our mediation sessions. Moreover, the timing of the circular question is very important for perspective taking. If a mediator asks a circular question too early in the process, then disputants will - reluctantly - answer the question, because they are not ready to take over the perspective of their counterpart. To the other party, this can come across as a forced understanding [6] and it may hamper disputants’ feeling of being understood. Our video-recordings may show whether the circular questions were asked too soon in the process. Furthermore, although no circular questions where used in the open questioning conditions, it could be that other communicative techniques, such as summarizing, paraphrasing, or reflecting might have an influence on establishing understanding and trust. Future research might investigate the influence of these communication techniques on the mediation process and how they interact with circular questions.
Finally, although we examined naturalistic mediations, disputants still had to engage in a role. This could have influenced their initial and final feelings of mutual understanding and interpersonal trust, simply because they could not empathize with their role.
Future research might address this and the above mentioned issues by adjusting the experimental method. For instance, in future research we could test the perception of mutual understanding and interpersonal trust in a more quantitative manner, by – for example - letting participants read and interpret different mediation scenario’s in which open versus circular questions are used by a mediator. In addition, as a follow-up study, we are investigating the effect of the communication mode (online vs. face-to-face) on the mediation process and outcome. Because of the greater physical proximity, social, personal and non-verbal information exchange, and interpersonal rapport in face-to-face settings [8], [9], it has been argued that offline mediations (e.g. richer media) attain a higher level of interpersonal trust [10] and mutual understanding [11] between disputants compared to online mediations. Furthermore, it is believed that the loss of non-verbal cues disable mediators to set a professional, understanding, and trustworthy mediation setting [12], [13]. These assumptions, however, have not been tested experimentally in settings in which face-to-face and online mediations are directly compared. Moreover, the use of circular questions might improve the level of interpersonal trust and mutual understanding in online settings. In our follow-up study, we address these assumptions and investigate the effect of the communication mode on the mutual understanding, interpersonal trust, (mutual) satisfaction with the outcome, and the trustworthiness, professionalism and impartiality of the mediator. At the conference, we will report our initial findings.
References
1. Prein, H.: Mediation in Praktijk: Beroepsvaardigheden en Interventietechnieken (3th Ed.). Boom, Amsterdam (2007)
2. Kalff, S., & Uitslag, M.: (2007). Het Wat en Hoe van Mediation. Retrieved from: http://www.cursussen.hu.nl/TotaalAanbod/Centra/Centrum%20Maatschappij%20en%20Rech/Mediation/Publicaties/~/media/HUCURSUSSEN/docs/Maatschappij%20en%20Recht/HU%20Mediation/Het-wat-en-hoe-van mediation.ashx.
3. Thompson, L., & Nadler, J.: Negotiating via Information Technology: Theory and Application. Journal of Social Issues. 58, 109-124 (2002)
4. Bakić-Mirić, N. M., & Bakić, N. M.: Successful Doctor-Patient Communication and Rapport Building as the Key Skills of Medical Practice. Medicine and Biology. 15, 74-79 (2008)
5. Yuan, Y., Head, M., & Du, M.: The Effects of Multimedia Communication on Web-Based Negotiation. Group Decision and Negotiation. 12, 89-109 (2003)
6. Brenninkmeijer, A. F. M., Bonenkamp, H.J., van Oyen, K., & Prein, H.C.M.: Handoek Mediation (4th Ed.). Sdu Uitgevers, Den Haag (2009)
7. Naquin, C. E., & Paulson, G. D.: Online bargaining and interpersonal trust. Journal of Applied Psychology. 88, 113-120 (2003)
8. Goodman, J. W.: The Pros and Cons of Online Dispute Resolution: An Assessment of Cyber-Mediation Websites. Duke Law & Technology Review. 2, 1-16 (2003)
9. Cole, S. R., & Blankley, K. M.: Online Mediation: Where We Have Been, Where We Are Know, and Where We Should Be. University of Toledo Law Review. 38, 193-212 (2006)
10. Yuan, Y.: Online Negotiation in Electronic commerce. International Journal of Management Theory and Practices. 1-7 (2003)
12. Beal, B. L.: Online Mediation: Has Its Time Come? Ohio State Journal of Dispute Resolution. 735-737 (2000)
13. Shah, A.: Using ADR to Resolve Online Disputes. Richmond Journal of Law & Technology. 10, 32-33 (2004)
Kamineta
Rectangle
PART VIII
Group
Decision
Systems
269
Aiding the choice of a voting procedurefor a business decision problem
Adiel Teixeira de Almeida and Hannu Nurmi
Abstract Since all voting procedures have some serious drawbacks that leadto undesirable outcomes under some circumstances, we aim to characterizedecision settings that make certain performance criteria particularly perti-nent, while at the same time rendering other criteria largely irrelevant. Thesettings are distinguishable in terms of the goals of group choice as well asof the assumptions one can reasonably impose on the individuals participat-ing. In business organization the mcdm group decision process, consideringfinal aggregation of DMs preference, usually uses voting procedure. However,a specific decision problem has to be accounted for in this situation. Thisproblem consists of choosing the voting procedure. In this paper we assumethat this decision should be made by the DMs with some methodological andtechnical aiding given by an analyst, using a specific decision model. There-fore, this paper presents some features related to an mcdm model for aidingthe choice of a voting procedure for a business organization decision problem.
Although, one might think that voting procedures have been designed forpolitical election rather than to a business decision in group context, theseprocedures are quite appropriate for a range of business decision problems.The range of business decision problems analyzed in this paper has a fewcharacteristics, including the consideration of multiple objectives by each de-
Federal University of Pernambuco, Brazil · University of Turku, Finland,
cision maker (DM). That is, a multi-criteria decision making (mcdm) processis faced by each DM.
In business organization the mcdm group decision process, except in situ-ations related to negotiation process, may be of two kinds: a) initial aggrega-tion of DMs preference; b) final aggregation of DMs preference. In the formerthe DMs share the same objectives and the criteria are aggregated in an in-tegrated process. In the latter, the DMs may have different objectives andcriteria and the integration amongst them is conducted over the alternativerankings given by each one of them separately.
For group decision processes considering final aggregation of DMs pref-erence, voting procedure is a natural approach. However, another decisionproblem comes up in this situation, which is related to the choice of the vot-ing procedure. Usually, this decision is based on technical issues associated tothe characteristics and formal properties of the voting procedures. Although,this decision is not directly related to actual decision faced by the DMs andappears to be as one of the technical decisions alongside the process, we arguethat this decision should be made by the DMs with some methodological andtechnical support. This paper is concerned with proposing an mcdm modelfor aiding the choice of a voting procedure for a business organization decisionproblem.
Also, in this study we aim to look at the circumstances of social choicesfrom a another angle. We try to characterize some modal categories of choicesituations in which certain performance criteria of choices would seem to bea crucial importance at the expense of others. We then list a few social choicerules that would be suitable for those types of circumstances in the sense ofsatisfying those desiderata that are crucial. Some of our circumstances per-tain to the standard environments where each group member is assumed tobe endowed with complete and transitive preference relations over the set ofalternatives, but the goal of the procedure is assumed to be shared by all de-cisions makers. Some, in turn, are situations where the group members knownothing about each other’s views. Another set of circumstances is one wherethe standard assumptions about preference relations simple aren’t plausible,e.g. people may typically use different criteria in comparing some pairs of al-ternatives than in comparing some other pairs or they may exhibit preferencereversals or incomplete preferences.
2 A model for aiding the choice of a voting procedure
The type of decision problem may have a great influence in the choice of theprocedure. However, the main distinction, regarding the type of decision maynot be related to the two kinds of decisions mentioned; that is: a businessdecision and a political election. The main issue which makes difference isrelated to either: choice of a person or choice of a policy. Both problems may
Kamineta
Rectangle
271
Aiding the choice of a voting procedure for a business decision problem 3
be faced in business organizations, although the latter may be more regularand usually may be referred to as a choice of an alternative course of action;for instance, choosing a project. In business organizations the choice of aperson may be rather related to selecting an employee (or a member of stafffor occupation of some kind of function, for which specific skill are required)than choosing a representative of other people.
For choosing of such a procedure, two situations have to be considered.The first situation is related to choice of a procedure to be applied in everydecision making process. This is a typical process of group decision on a boardof any business organization. Normally, norms and formal procedures of theorganization have to state which voting procedure should be applied. Thesecond situation is associated to the choice of a procedure applied in a specificbusiness decision problem in the organization. In this kind of situation, eachdecision problem requires differentiated considerations which may lead toa particular suitable procedure. The focus of this work is for the secondsituation, although an mcdm model for aiding the choice of a voting procedureshould also be applied for the first kind of situation.
In the second situation, most of the cases, the decision makers (DMs)may have already made their own ranking of alternatives, before an aggre-gation procedure starts to be considered. The basic criteria for such kind ofmcdm decision problem are basic properties of voting procedures and othercharacteristics, such as paradoxes that may be relevant to be considered inanalyzing a voting procedure. A selection of a set of criteria consisting onthe most relevant properties for the voting procedures may be considered(Nurmi, 1983; 1987). Also, the matrix of evaluation of these properties forthe main voting procedures can be built. This matrix evaluation depends onthe context of the decision problem and its scores have to be consistent withthe mcdm method.
It is assumed that such an aiding process considers the participation ofan analyst or facilitator, who has the role of support all DMs in the groupdecision process. One of the steps of the procedure requires that the analystexplain to the DMs the main voting procedures available and their maincharacteristics, as well as their behavior regarding to paradoxes and mainproperties related to such procedures. The analyst may adopt two differentsequences for the decision process, as follows:
• DMs chooses the voting procedure first; that is, before the DMs make theranking of alternatives.
• DMs chooses the voting procedure after all DMs have made the rankingof alternatives.
The second procedure is fine, if the DMs do not know the rankings of eachother. The first process may lead to manipulation, by means of adoptingstrategic choices for the rankings.
Kamineta
Rectangle
272
4 Adiel Teixeira de Almeida and Hannu Nurmi
3 Comparing voting procedures
The best-known results of modern social choice theory pertain to compati-bility of various choice desiderata. Typically they aim to show that from aset of intuitively plausible principles of choice only a proper subset can beadhered to by any given rule under all circumstances. That circumstances areimportant for the incompatibility captured by Arrow’s (1963) impossibilitytheorem has been pointed out by many authors. E.g. Black (1958) introducedthe notion of single-peakedness to give a sufficient condition for the avoidanceof the incompatibility. This notion turned out to be but one of several pos-sible restrictions on the domain of preference profiles that would guaranteethe satisfaction of Arrow’s other conditions.
3.1 Non-strategic settings
Most of us most do our daily shopping by simply revealing our true pref-erences ( given the budget restrictions) in selecting goods to our basket. Itwould seem that this also holds for our responses to most opinion surveys.Some voters (perhaps a vast majority of them) also reveal their true opinionsin political elections. This is called expressive voting.
Although a variety of criteria for comparing voting systems has been intro-duced over the past decades, it would seem that two of them are of particularimportance since they can be related to rationality. To wit, participation con-dition can be viewed as an individual rationality criterion since a failure onparticipation would conceivably confront an individual with a contingencywhere his vote would be harmful to his own interest in the sense that theoutcome following from his abstinence would be better for him.
A similarly compelling and rationality-related criterion applicable in thesecircumstances is Pareto optimality. This can be viewed as a collective ratio-nality criterion since it states that if each participant strictly prefers alter-native x to alternative y, then y is not chosen. Clearly, a failure on Paretooptimality would be be collectively irrational.
Of somewhat more controversial nature are criteria connected with thename of Condorcet: the winner and loser criteria. The former dictates thechoice of an alternative that would defeat all others in pairwise round-robincontests by a majority of votes. The latter, in turn, requires that an alterna-tive that would lose against every other alternative in pairwise comparisonsnot be elected.
Of these two Condorcet criteria especially the former has been very com-monly advocated as a plausible desideratum for social choice rules. Thoserules that satisfy it do, however, not satisfy another plausible condition, viz.positional domination (Fishburn 1982). An alternative x positionally domi-nates alternative y, if for each of ranks j = 2, . . . , k , the number of voters
Kamineta
Rectangle
273
Aiding the choice of a voting procedure for a business decision problem 5
assigning x to rank j or higher is larger than the number of voters rankingy to rank j or higher. The positional dominance criterion dictates that thosealternatives that are positionally dominated by some other alternative, notbe chosen.
3.2 Strategic settings
In settings where the voters are primarily interested in the outcomes ratherthan expressing their opinions, the opinions expressed in balloting may de-viate from the opinions held by the voters. Since the idea of taking a voteis to elicit the opinions of voters as accurately as possible, it would makesense to resort to systems where it is difficult to improve upon outcomes bymisrepresenting one’s opinions. But how to define this difficulty in an objec-tive way? Successful preference misrepresentation requires information aboutthe preferences (more precisely, expressed preferences) of other voters. Oneway of measuring the difficulty of misrepresentation is to ask how detailedknowledge of the overall profile one needs to succeed in misrepresentation.E.g. in plurality voting one typically needs only information about the dis-tribution of votes over the first ranked alternatives. At the other extreme ofdifficulty is single transferable vote (see Bartholdi et al.). Similarly, Nanson’sand Kemeny’s rules would seem difficult to manipulate.
4 How to Deal with Voting Paradoxes
4.1 Dealing with intransitivity
It is not difficult to envision a setting where not only collective majority pref-erences but even individual ones could be intransitive (see, e.g. May 1954 ).Consider for example an individual who has been given the task of rankingthree universities. In his opinion, three criteria of equal importance shoulddetermine the ranking: research excellence, quality of education and externalimpact. Suppose that in terms of the first criterion the ranking is ABC, interms of the second BCA and in terms of the third CAB. Using pairwise com-parisons and majority rule in determining the pairwise winners, one ends upwith an intransitive ranking: ABCA... The occasional plausibility of intran-sitive individual preferences suggests that social choice rules could be basedon pairwise comparison matrices representing individual opinions, i.e. k × kmatrices with entry (i, j) equaling 1 if i’th alternative is viewed preferableto the j’th one, equalling 0 if j’th alternative is preferred to the i’th one.
Kamineta
Rectangle
274
6 Adiel Teixeira de Almeida and Hannu Nurmi
This approach has, in fact, a long, albeit little known, history starting fromZermelo’s (1929) seminal work.
Social choice rules can easily be defined using various tournament solutionconcepts: Pareto set, uncovered set, Copeland winners and the Banks set.
4.2 Dealing with incomplete preferences
Incomplete preferences can also be dealt with using the tournament appara-tus. If an individual is unable to express preference between two alternativesi and j, the tournament matrix can accommodate this by inserting 0 intoboth the position (i, j) and (j, i). Incomplete tournaments have been the fo-cus of some scholarly attention for a long time. E.g. Zermelo (1929) discussedchess tournaments with unequal number of contests between various pairs ofplayers. The methodology devised for these settings is immediately applicablealso in voting settings.
4.3 Dealing with other issues in voting
Many paradoxical observations of voting systems turn out to be aggregationparadoxes. Some of them, e.g. inconsistencies of choice, can be avoided byresorting to consistent procedures. Usually, however, avoiding one paradoxicalcontingency leads to another type of paradox. So, there are trade-offs to bemade in dealing with paradoxes (see e.g. Nurmi 1987 for a summary).
5 A kind of MCDM method for comparing votingprocedures
The are many mcdm methods, which may have a few different classifications.For the purpose of this study, some of these classifications may be useful.First, an mcdm method may be classified according to the action space, whichcan be either discrete of continuous. The former is of interest for the kindof problem analyzed. Another classification considers the form of compensa-tion, if any, for aggregating the criteria. Two situations may be considered:compensatory and non-compensatory methods (Vincke, 1992; Figueira et al2005). A number of methods may be included in the first type, for instance:MAUT (multi-attribute utility theory) and deterministic additive methods,such as AHP, SMARTS, MACBETH, among many others (Figueira et al2005; Keeney and Raiffa, 1976). The latter includes lexicographical and out-ranking methods, such as: ELECTRE, PROMETHEE, among many others
Kamineta
Rectangle
275
Aiding the choice of a voting procedure for a business decision problem 7
(Figueira et al 2005; Vincke, 1992; Roy, 1996). A preference relation P isnon-compensatory if the preference between two voting procedures x and yonly depends on the subset of criteria in favor of x and y (Fishburn, 1976).Let P (x, y) = i : xiPiyi, then:
P (x, y) = P (z, w)P (y, x) = P (w, z)
⇒ [xPy ⇔ zPw]
In this case, it does not matter how much is the performance of x or y ineach criterion. An important consideration may be taken at this point withregard to the kind of rationality which would be more appropriate for thedecision problem considered. That is, a voting procedure should be analyzedby a compensatory or non-compensatory approach? Some reflections may beprovided regarding to which rationality would be more appropriate for theDMs in this particular decision problem. It is hard to consider the possibilityof any DM analyzing any two properties or characteristics of a voting proce-dure, by making compensation between them. On the other hand, it seemsreasonable to consider that a DM may analyze two properties or characteris-tics of a voting procedure, comparing them in terms of which would be moreacceptable. Conversely, a DM could consider which of them would be moreunsuitable for being present in a voting procedure. Therefore, it seems tobe reasonable to assume that a non-compensatory method would be moreappropriate to be applied in a specific decision problem
6 Conclusions
The study for building a decision model for aiding the choice of a votingprocedure for a business decision problem is a working in progress in whichthe following main issues are being considered: the non-compensatory ratio-nality; the sequence of the decision process; the set of relevant criteria; andthe evaluation matrix of properties by voting procedures. The sequence ofthe decision process and the assumption of non-compensatory approach forthe mcdm method can have a more detailed justification based on the char-acteristics and typical context of this kind of decision. The set of relevantcriteria and the evaluation matrix of properties by voting procedures has al-ready been suggested with several considerations to be included in the model(Nurmi, 1987).
References
1. Arrow, K. (1963), Social Choice and Individual Values, 2nd edition. New York: Wiley.
Kamineta
Rectangle
276
8 Adiel Teixeira de Almeida and Hannu Nurmi
2. Bartholdi, J. J. and Orlin, J. B. (1991), Single transferable vote resists strategic voting,
Social Choice and Welfare 8, 341-354.3. Black, D. (1958), Theory of Committees and Elections, Cambridge: Cambridge Uni-
versity Press.
4. Figueira, J., Greco, S. and Ehrgott, M. (Ed)(2005), Multiple Criteria Decision Anal-ysis: State of the Art Surveys, Berlin-Heidelberg: Springer Verlag.
5. Fishburn, P. C. (1976), Noncompensatory preferences, Synthese 33, 393-403.
6. Fishburn, P. C. (1982), Monotonicity paradoxes in the theory of elections, DiscreteApplied Mathematics 4, 119-134.
7. Keeney, R. L. and Raiffa, H. (1976), Decision with Multiple Objectives: Preferencesand Value Trade-offs, New York: John Wiley & Sons
8. May, K. O. (1954), Intransitivity, utility and aggregation of preference patterns, Econo-
metrica 22, 1-13.9. Nurmi, H. (1983), Voting procedures: A summary analysis, British Journal of Political
Science 13 (2), 181-208.
10. Nurmi, H. (1987), Comparing Voting Systems, Dordrecht: D. Reidel Publishing Com-pany.
11. Roy, B. (1996), Multicriteria Methodology For Decision Aiding, Dordrecht: Kluwer
Academic Publishers.12. Vincke, P. (1992), Multicriteria Decision-Aid, New York: John Wiley & Sons. Ltd.
13. Zermelo, E. (1929), Die Berechnung der Turnier-Ergebnisse als ein Maximumproblem
der Wahrscheinlichkeitsrechnung, Mathematische Zeitschrift 29 : 436-460.
Kamineta
Rectangle
277
Introducing a Multi-criteria Group Decision Perspective into Enterprise Architecture Frameworks
Suzana de França Dantas Daher and Ana Paula Cabral Seixas Costa
Abstract. Due to the complexity of the decision problems that enterprises are dealing with to became competitive in their markets, and the need to involve different point of views (inside and outside the organization), the numbers of decisions involving more than one person have been increasing over the last 20 or so years. Enterprise Architecture (EA) maps all software development processes, hardware and personnel within the organization, thus giving a holistic view of the whole organization and providing guidance for important enterprise concerns. This study proposes a framework to incorporate multi-criteria group decision approaches into EA frameworks.
Keywords: Enterprise architecture, EA framework, business-IT alignment, multi-criteria group decision making
1 Introduction
Organizations are investing in improving the alignment between their business and information technology (IT) activities in order to achieve the effective conduct of their business processes, especially because business is requiring more interaction between customers, partners and employees [1][2]. Technological changes such as business digitization, green computing, cloud computing, Web 2.0 and a future Web 3.0, are demanding changes in the management practices of enterprises and these will modify not only their IT infrastructure but also their policies, processes, and how their staff tackle their tasks [2]. Information technology enterprise architecture, in short Enterprise Architecture (EA), is a strategic information asset that describes and documents relationships among business/management processes and technology [1][3]. EA practitioners and enthusiasts advocate that EA approach can provide several benefits such as better IT operations by providing direction for the design, development and assessment of technological and managerial developments, thereby creating a coherent information infrastructure, reducing risk, improving scalability, etc.[1][4][5].
The level of EA maturity varies from one organization to the next. The levels of technology diffusion and dependence on technology have a direct relation with an organization’s IS/IT maturity. According to [6], EA maturity has four stages: business
278
silos, standardized technology, optimized core and business modularity. A company evolves through these stages as it (and its stakeholders) learn new organizational processes and change its IT investment practices. The more mature the company is, the greater the number of modular standards and repeatable processes it has. This may help to organize resources and plan future actions. By adopting an EA framework, a company provides a means to better understand the complexity of its business and its stakeholders’ expectations, and also it supports decisions making about the future state of the organization and how best to communicate decisions taken [7]. Moreover the architecting process and decision making problems involve many stakeholders, whose perspectives and interests are diverse [7][8].
EA frameworks offer a guide to create and implement EA and several well-known examples of these are discussed in the literature [9]. Frameworks may specify a process, method or format of architecture activities and products. Actually, EA can also be supported by classical IT methods such as ITIL (Information Technology Infrastructure Library) [10][11] and COBIT (Control Objectives for Information and related Technology) [12], but EA frameworks are commonly used to organize enterprise architectures into different views that are meaningful to stakeholders. Some of the available EA frameworks were developed for very specific areas and proposals, whereas others have a broader functionality [13]. The five most discussed EA frameworks are: the Zachman Framework for Enterprise Architecture [14][15], DoDAF (Department of Defense Architecture Framework) [16], FEAF (Federal Enterprise Architecture Framework) [17], TEAF (Treasury Enterprise Architecture Framework) [18], and TOGAF (The Open Group Architectural Framework) [19].
The levels of complexity and responsibility for decisions which decision makers (DMs) deal with during the several phases of EA processes (selection, implementation, maintenance and updating) as well as consideration being given to different aspects of the areas of business, information, information systems (IS) and the technical infrastructure) have been stimulating a need to aggregate both the preferences of different DMs [20][21][22] and/or experts’ knowledge [23]. In the context of EA the stakeholders may be architects, IT staff and business staff. Ref. [7] proposed a 4 by 4 matrix of EA stakeholders in which the columns represent the four EA aspect areas (business, information, information systems, technical infrastructure) and the rows represent the four organizational levels (Enterprise, Domain, Project, Operational). Undoubtedly, some of these stakeholders may act as DMs in certain EA problems. For instance, there may be a decision making problem involving a Business project manager, a Business process designer (both from a business/project cell), an Information analyst (from an Information/project cell), a data center manager (from a Technical Infrastructure/Operational cell) and an application manager (from an Information Systems/Operational cell).
Group decision making approaches and how they can improve problems of business effectiveness have been the focus of several studies which involve selecting an EA framework [24][25], the coordination of architecting work [26][27], collaborative processes [28][29] and business process redesign [30].
On analyzing the EA frameworks mentioned previously, we realized that although using them is widely encouraged by practitioners and academics, these methodologies do not explicitly consider a structured mechanism or procedure to aggregate decision makers’ preferences in order to achieve a group decision that makes recommendations
279
to solve an EA problem. Moreover, Ref. [1] argued that in order to have a well- coordinated architecting process, it is important to create conditions to support DMs with at least five cognition types: shared task knowledge, shared team knowledge, common ground, shared schemata, collective mind.
We argue in this study that faced with the new demands and challenges enterprises have to deal with, group decision-making processes regarding EA problems must not be too time-consuming. Group decision problems may consider several criteria, some of which may conflict with each other, and also the different perspectives of all DMs. Problem-structuring based on soft methodologies may not be suitable throughout the process because the group may not have the time to spare needed for this end nor may it be possible to arrange an in loco meeting. Multi-criteria group decision making approaches can be transversely incorporated into such EA frameworks and we discuss facilities and difficulties to implement these.
The next section presents the framework proposed and in Section 3 some remarks are drawn.
2 Framework proposed
In this study, first we set out a framework which consists of integrating multi-criteria group decision models with EA frameworks (see Fig. 1).
Fig. 1. Framework proposed
The development life cycle of the system is organized into three phases. Phase 1 represents the first stage of an EA problem which is to select an EA framework to be adopted by the enterprise. This selection may involve quantitative and qualitative criteria [3] [7] [25]. Five EA frameworks were analyzed in order to identify facilities and difficulties and to aggregate group decision making in their methodologies. Phase 2 involves all problems regarding planning, analysis and implementation in order to
EA Governance
Define a Multi-criteria group decision making approach
Phase 1 EA
framework selection
Phase 2 EA Implementation
Phase 3 EA Reviews
Establishing the EA framework team
business information IS IT infrastructure
• Zachman • DoDAF • FEAF • TEAF • TOGAF
280
achieve an efficient business-IT alignment. This phase also includes making decisions on IT investments. Phase 3 represents the maintenance of EA success by reviewing the process, methods and products. Both phases 2 and 3 must be evaluated and managed in accordance with the area aspects (business, information, information systems and IT infrastructure).
Two research questions arise from the proposed framework: the first is how difficult is incorporating group decision perspectives into existing EA frameworks. The second question is how coordinate group decision activities throughout EA implementation. After having ascertained a context for the decision problem context and the DMs’ preference structure, a suitable multi-criteria group decision model can be selected. Also depending on the decision problem context, the DMs involved in the EA implementation belonging to different areas of the company, such as the Business project manager, the Business process designer, the IT manager, the Information analyst, the Data center manager and so on.
3 Final Remarks
Due to the complexity of the decision problems that enterprises are dealing with to became competitive in their markets, and the need to involve different point of views (inside and outside the organization), the numbers of decisions involving more than one person has been increasing over the last 20 or so years. Multi-criteria group decision making models support a group of individuals to reach a collective final recommendation. In order to achieve efficient alignment between business and information technology (IT), questions involving aspects such as Information System Planning, Information Technology Governance, and Investment in Technology must be taken account [31].
Enterprise Architecture (EA) maps all software development processes, hardware and personnel within the organization, giving a holistic view of the whole organization and providing guidance for important concerns of the enterprise, such as business strategy, IT strategy, IT governance, and business-IT alignment. Architecture principles are means to achieve some strategic objectives. These objectives arise from business goals, enterprise architecture goals, IT goals, and the constraints which have to be faced.
This study investigated the most discussed EA frameworks in the literature and realized that they do not consider a well-structured process to support group decision making, especially with regard to qualitative or intangible criteria. Of the five EA frameworks studied TOGAF has support decision making in its methodology, although Zachman gives implicit information that in each cell of its ontology it is possible to consider group decision-making approaches and this structure may be useful for recursive decision-making problems involving a group of decision makers or experts.
Decision Support Systems (DSS) and also Work Collaborative Support Systems are important tools that allow DMs and stakeholders to reach common ground and share knowledge [32]. These computational tools give flexibility, agility and coordination to group decision making.
281
4 References
1. Espinosa, J. A, Armour, F., Boh, W. F.: The Role of Group Cognition in Enterprise Architecting. In: 44th Hawaii International Conference on Systems Sciences, Hawai (2011)
2. Bente, S., Bombosch, U., Langade, S.: Collaborative Enterprise Architecture: Enriching EA with Lean, Agile, and Enterprise 2.0 practices. Elsevier (2012).
3. Khayami, R.: Qualitative characteristics of enterprise architecture. Procedia Computer Science, vol. 3, 1277-1282 (2011)
4. Richardson, G.L., Jackson, B.M., Dickson, G.W.: A Principles-Based Enterprise Architecture: Lessons from Texaco and Star Enterprise. MISQ 14 (4), 385-403 (1990)
5. Stelzer, D.: Enterprise Architecture Principles: Literature Review and Research Directions. In: 4th Workshop on Trends in Enterprise Architecture Research, Stockholm (2009)
6. Ross, J., Weil, P., Robertson, D.: Enterprise Architecture as Strategy: Creating a Foundation for Business Execution. Harvard Business School Press. Boston (2006).
7. Raadt, B.V.D, Schouten, S., Vliet, H.: Stakeholder Perception of Enterprise Architecture. In: Morrison, R., Balasubramanian, D., Falkner, K. (Eds.): ECSA 2008, LNCS, vol. 5292, 19-34. Springer, Heidelberg (2008).
8. Smoliar S., Sprague R.: Communication and Understanding for Decision Support. In: Proceedings of the International Conference IFIP TC8/WG8.3, Cork, Ireland, 107-119 (2002).
9. Magoulas, T, Hadzic, A, Saarikko, T., Pessi, K.: Alignment in Enterprise Architecture: A Comparative Analysis of Four Architectural Approaches. The Electronic Journal Information Systems Evaluation 15(1), 88 -101 (2012)
10. Lucio-Nieto, T., et al.: Implementing an IT service information management framework: the case of COTEMAR. Int. J. Inf. Manage. 32, 589–594 (2012)
11. Vicente, M., Gama, N., Da Silva, M. M.: The Value of ITIL in Enterprise Architecture. In: 17th IEEE International Enterprise Distributed Object Computing Conference (EDOC), Vancouver, BC, 147 – 152 (2013)
12. Tuttle,B., Vandervelde, S. D.: An empirical examination of CobiT as an internal control framework for information technology. International Journal of Accounting Information Systems 8 (4), 240–263 (2007)
13. Urbaczewski, L., Mrdalj S.: A Comparison of Enterprise Architecture Frameworks. Issues in Information Systems, VII (2), 18-23 (2006)
14. Zachman, J.A. A Framework for Information Systems Architecture, IBM Systems Journal, 26(3), 454-470 (1987)
15. Rajabi, Z., Minaei, B., Ali Seyyedi, M.: Enterprise architecture development based on enterprise ontology, Journal of Theoretical and Applied Electronic Commerce Research, 8 (2), 2013.
(2004) 18. Mary, S. R., Rodrigues, P.: Survey and Comparison of Frameworks in Software
Architecture, Advances in Computing and Communications, Communications in Computer and Information Science, 193, 9-18, (2011)
19. TOGAF. http://www.opengroup.org/togaf/ 20. Daher, S.F.D., Almeida, A.T. : The Use of Ranking Veto Concept to Mitigate the
Compensatory Effects of Additive Aggregation in Group Decisions on a Water Utility Automation Investment. Group Decision and Negotiation. 21 (2), 185-204 (2012)
21. Morais, D.C, Almeida, A.T. Group decision-making for leakage management strategy for water network. Resources, Conservation and Recycling 52, 441-459 (2007).
282
22. Parreiras,R.O, Morais, D.C. Fuzzy set based consensus schemes for multicriteria group decision making applied to strategic planning. Group Decision and Negotiation 21 92) 153-184, 2012.
23. Garcez, T.V, Almeida-Filho,A.T, Almeida, A.T. Procedures for aggregating experts knowledge and group decision model approaches. In: ESREL Conference, Troyes (2011).
24. Zandi, F., Tavana, M.: A group evidential reasoning approach for enterprise architecture framework selection. International Journal of Information Technology and Management 9(4), 468-483, (2010)
25. Zandi, F. Tavana, M.: A fuzzy group multi-criteria enterprise architecture framework selection model. Expert Systems with Applications 39, 1165-1173 (2012)
26. Rigopoulos, G., Karadimas, N. Orsonni, A.: Modelling Group Decision-Making for Collaborative Teams in Enterprises. In; 2nd Asia International Conference on Modeling & Simulation, 738–743 (2008)
27. Rodríguez, R. M., Palomares, I., Martínez, L.: Attitude-Based Consensus Model for Heterogeneous Group Decision Making. Knowledge Engineering and Management. Advances in Intelligent Systems and Computing 214, 279-290 (2014)
28. Kolfschoten, G. L., Vreede, · G-J., Briggs, ·R. O., Sol, H. G.: Collaboration ‘Engineerability’, Group Decision and Negotiation 19, 301–321 (2010).
29. Soubie, J.-L., Zarate, P.: Distributed Decision Making: A Proposal of Support Through Cooperative Systems, Group Decision and Negotiation 14, 147–158 (2005)
30. Corbitt, G. F., Christopolus, M., Wright, L.: New Approaches to Business Process Redesign: A Case Study of Collaborative Group Technology and Service Mapping. Group Decision and Negotiation 9, 97–107 (2000)
31. Daher, S.F.D, Cabral, A.P.S., Almeida. J.A, Almeida, A.T.: Recent Patents to Support IS/IT Priorities Planning and Management. Recent Patents on Computer Science, 6, 99-106 (2013)
32. Daher, S.F.D, Almeida, A.T.: Recent Patents Using Group Decision Support Systems: A Short Review. Recent Patents on Computer Science 3, 81-90 (2010)
PART IX
Preferences
Aggregation
284
Determinants of Perceived Expertise in Group Problem Solving
Clemens Hutzinger1
1 Department of Business Administration, University of Vienna, Oskar-Morgenstern-Platz 1,
Abstract. Given the important functions perceived expertise has in problem solving groups, this piece of research focusses on its determinants. In addition to traditional determinant of perceived expertise (gender, age, and actual expertise), we examine the effects of more contemporary determinants, which are general self-efficacy, normative influence, and informational influence. We show that the more contemporary determinants explain a larger amount of the variance of perceived expertise. Specifically, exerting normative and informational influence during group discussions increases group members’ perceived expertise.
Keywords: Perceived expertise, gender, age, actual expertise, general self-efficacy, group discussion, normative influence, informational influence.
1 Introduction
Perceived expertise is the extent to which individual group members are assumed to possess expertise. Why care about perceived expertise? Perceived expertise has at least two highly important functions in groups. First, it impacts the formation of leadership hierarchies in favor of those perceived to have high expertise [1]. Second, in order to make good decisions and solve difficult problems appropriately, groups need to be able to accurately recognize the expertise of their members [2] [3]. Therefore, it is important to examine the determinants of perceived expertise in groups [4].
Literature has shown that certain cues can act as determinants of perceived expertise in groups [5]. There are traditional determinants of perceived expertise, which have been frequently examined. In this piece of research we include three traditional determinants of perceived expertise, which are gender [6], age [7], and actual expertise [8]. Additionally, we include three contemporary determinants of perceived expertise, which have, to the best of our knowledge, not been considered as determinants of perceived expertise. These are general self-efficacy, normative influence, and informational influence. Our research model, which is formulated in accordance with input-process-output models [9], is depicted in figure 1.
Input Process Output Gender Age Normative Influence Perceived Expertise Actual Expertise Informational Influence General Self-Efficacy
Figure 1. Research Model
2 Traditional Determinants of Perceived Expertise
We consider three traditional determinants of perceived expertise in groups. These are gender, age, and actual expertise.
2.1 Gender
Gender has been shown to reflect competence on many different tasks, and men are often perceived as more competent in performing a task [10]. Due to stereotypes, many decisions in organizations may trigger performance expectations in favor of men. Conversely, women are often perceived to possess lower expertise, even though men and women have been shown to have comparable levels of actual expertise [6]. Thus, we propose that men are perceived higher in expertise, as compared to women.
2.2 Age
The older a person is, the more experience the person normally has, which is associated with increased perceived expertise, especially in organization [7] [11]. Thus, we propose that age is positively related to perceived expertise.
2.3 Actual Expertise
Actual expertise is the expertise a person objectively possesses. In problem solving, actual expertise of group members is often conceptualized as the proximity of the group member’s solution to an objectively correct solution [2]. It has been found that actual expertise predicts perceived expertise [8]. Thus, we propose that actual influence is positively related to perceived expertise.
3 Contemporary Determinants of Perceived Expertise
In addition to the traditional determinants of perceived expertise, there are some more contemporary determinants, including general self-efficacy and the group discussion
286
content, specifically normative and informational influence group members exert during group discussion.
3.1 General Self-Efficacy
General self-efficacy is defined as “individuals’ perception of their ability to perform across a variety of situations” [12, p.170]. Thus, self-efficacy is not a behavior, but an expectation to be able to perform a behavior. The positive impact of self-efficacy on performance is well documented in the literature [13] and self-efficacy is considered as a fundamental topic especially in the literature on organizational behavior [14]. People high in general self-efficacy have a larger self-esteem, are more confident in their ideas and actions, and consider themselves as capable to deal with many difficult situations in life [12], such as solving a complex problem. Therefore, given these properties of people high in general self-efficacy, we argue that the other group members attribute more expertise to those group members, as compared to those low in general self-efficacy. Thus, we propose that general self-efficacy is positively related to perceived expertise.
3.2 Normative and informational influence during the group discussion
According to [15], there a two types of social influence present in groups. These are normative influence and informational influence. Normative influence is defined as “an influence to conform with the positive expectations of another” [15, p.629]. Informational influence is defined as “an influence to accept information obtained from another as evidence about reality” [15, p.629]. During group discussions, normative influence is exerted through the conformity to group member’s preferences and informational influence is exerted through arguments and information [16]. Specifically, statements that express a group member’s preference, such as “Item 4 is the most important item.”, are considered to generate normative influence [17]. Statements that express a group member’s argument, such as “This item has many different functions.”, are considered to generate informational influence [17]. In groups, normative and informational influence generally operate together, however, to varying degrees [16]. We argue that both normative influence and informational influence exerted by a group member during a group discussion are related to attributions of expertise to this group member. Given the nature of informational influence, we assume that informational influence exerted by a group member will be a better predictor for perceived expertise, as compared to normative influence. Thus, we propose that normative and informational influence are positively related to perceived expertise.
4 Study Design and Methodology
To test our research model, we ran a laboratory study with 100 business students (48 women and 52 men). In the pre group discussion part, the participants got a
287
questionnaire in which they indicated their gender and age, and self-rated themselves on general self-efficacy. General self-efficacy was measured by the New General Self-Efficacy Scale [18] which has eight items (e.g. item 2: “When facing difficult tasks, I am certain that I will accomplish them.” [18, p.79]) that are scored on a five-point Likert-type scale ranging from 1 (totally disagree) to 5 (totally agree). In our study, the eight items of the construct general self-efficacy show a highly satisfactory reliability (Cronbach’s Alpha: .812). Next, participants had to indiviually work on a classical problem solving task, in which they had to rank 15 items (e.g. raincoat, knife) according to priority for survival in the desert [19]. The task has an objectively correct, however hard to verify, solution, which is common in business [20]. Actual expertise was measured by a Spearman rank correlation coefficient [21] between each individual ranking and the objectively correct expert ranking available for the task.
In the group discussion part, participants were randomly assigned to five-person groups, in which they had to work on the same ranking task again in a face-to-face group discussion, reaching an unanimous agreement. The group discussions were videotaped and, after the study, following [22], content coded, among others, for preferences statements (Cohen’s Kappa: .86) and arguments (Cohen’s Kappa: .79). Preferences statements correspond to normative influence, and arguments correspond to informational influence [17]. We calculated the relative number of preference statements for every group member in each group as measure of normative influence. We calculated the relative number of arguments for every group member in each group as measure of informational influence.
In the post group discussion part, participants rated each other on perceived expertise on a single item adapted from [7] with a seven point scale, ranging from 1 (very little expertise) to 7 (very much expertise). Those seven out of 100 participants that have performed the task or a comparable task before (M = 4.32) and those who have not (M = 4.23) do not significantly differ in perceived expertise, F (1, 98) = .045, ns..
5 Results
First, we test the determinants of perceived expertise, and second, we explore the relationship of (self-)perceived expertise, actual expertise, and gender.
5.1 The Determinants of Perceived Expertise
The means, standard deviations, and correlations of our variables are displayed in table 1.
Table 1. Means, Standard Deviations, and Correlations (n = 100)
To test our models we ran a hierarchical multiple regression [23]. The results are shown in table 2.
Perceived Expertise
Perceived Expertise
Perceived Expertise
Perceived Expertise
Model 1 Model 2 Model 3 Model 4 Gender (0 = male; 1 = female) -.290*** -.289*** -.200** -.145* Age .162* .148 .087 .015 Actual Expertise .086 .125 .007 General Self-Efficacy .391*** .221*** Normative Influence .199** Informational Influence .411*** R2 .121 .128 .268 .519 Adj. R2 .103 .101 .237 .488 ∆R2 .007 .140 .251 Sig. F-change .374 .000 .000
F-value F (2, 97) = 6.666***
F (3, 96) = 4.701***
F (4, 95) = 8.685***
F (6, 93) = 16.723***
Values are standardized beta-coefficients. *** p < .01; ** p < .05; * p < .10
Table 2. Multiple Regression: Perceived Expertise
Our results show, that when only gender and age are entered as predictors, i.e. model 1, gender is negatively, t (97) = -3.022, p < .01, and age is positively, t (97) = .1696, p < .10, related to perceived expertise. When actual expertise is entered in model 2, it is non-significant, t (96) = .893, ns., gender stays significant, t (96) = -3.008, p < .01, and age becomes non-significant, t (96) = 1.516, ns.. When general self-efficacy is entered in model 3, it is significant, t (95) = 4.257, p < .01, gender stays significant, t (95) = -2.205, p < .05, and age (t (95) = .957, ns.) and actual expertise (t (95) = 1.400, ns.) remain non-significant. When normative and informational influence are entered in model 4, both normative influence (t (93) = 2.088, p < .05) and informational influence (t (93) = 3.842, p < .01) are significant, gender (t (93) = -1.936, p < .10) and
289
general self-efficacy (t (93) = 2.738, p < .01) remain significant, and age (t (93) = .204, ns.) and actual expertise (t (93) = .090, ns.) remain non-significant. As evidenced by the increase in R2, normative and informational influence add most in explaining the variance of perceived expertise, followed by general self-efficacy.
5.2 The Relationship of (Self-)Perceived Expertise, Actual Expertise, and Gender
Perceived expertise has been rated by the four group members. However, participants also rated their own expertise, i.e. their self-perceived expertise. Self-perceived expertise and perceived expertise are positively correlated, r = .459, p < .01. However, neither self-perceived expertise (r = -.049, ns.) nor perceived expertise (r = .121, ns.) are significantly correlated to actual expertise. As evidenced by three ANOVAs, even though men (M = .32) and women (M = .30) do not significantly differ in actual expertise, F (1, 98) = .090, ns., men (M = 4.67) perceive their own expertise, i.e. self-perceived expertise, higher than women (M = 3.96), as evidenced by F (1, 98) = 11.427, p < .01. Furthermore, men (M = 4.55) are perceived as higher in expertise by their group members, as compared to women (M= 3.91), as evidenced by F (1, 98) = 10.260, p < .01.
6 Discussion
Given the importance of perceived expertise for the formation of leadership hierarchies and for the quality of group decisions, we examined the determinants of perceived expertise. We have shown that from the traditional determinants, gender is the only significant one. That is, women, as compared to men, are perceived as lower in expertise by their group members. This is also consistent with the self-perception of women with regard to expertise. It might be that women are more humble and behave more cautiously in groups solving complex problems. However, women and men do not differ in actual expertise. Furthermore, we did not find a significant effect of age on perceived expertise, which could be due to the fact that our sample consisted of students which do not differ too much on age. However, an effect of age on perceived expertise is supposed to exist in groups with larger age differences. Surprisingly, actual expertise is not significantly related to perceived expertise. That is, in our study, group members were not able to recognize group members’ actual expertise, which is consistent with [24].
Most importantly, our results confirm the importance of more contemporary determinants of perceived expertise. First, we have shown that general self-efficacy is positively related to perceived expertise. That is, the more a person holds the belief to be able to successfully master many difficult situations, the more the other group members perceive this person to be high in expertise. Second, we have shown that individual discussion content, specifically normative and informational influence exerted during group discussions, leads to higher perceived expertise. Hereby, consistent with our theoretical considerations, exerting informational influence, has a larger effect on attributions of expertise, as compared to normative influence. Thus,
290
the more a group member exerts informational influence via arguments, the higher the other group members rate this member on perceived expertise. In addition, it has to be noted that the effect of gender on perceived expertise is clearly reduced, once normative and informational influence are also included as predictors of perceived expertise.
There are at least three areas of future research. First, our study, which was carried out in a controlled laboratory, used groups composed of members having comparable status and basically being not familiar to each other. Therefore, future research should examine the attribution of expertise in problem solving group in organizations in which members differ in status. If such groups have been working together for a certain period, high cohesion among group members is likely and that tends to result in high pressure towards conformity [25]. This might distort the perceptions of expertise, especially on a specific task. Second, the participants of our study were comparable with regard to culture. However culture might be an additional determinant of perceived expertise, such as in cultures with high uncertainty avoidance, expertise has a greater weight, as compared to cultures with low uncertainty avoidance [26]. Therefore, differences in culture are supposed to have an impact on perceptions of expertise. Third, we analyzed perceived expertise in face-to-face group discussions. However, [27] has shown that computer-mediated groups produced more normative influence (via preference statements), while face-to-face groups produced informational influence (via arguments). Therefore, we assume differences in perceived expertise when group discussions are computer-mediated. Finally, we advocate more research to further explore the determinants of perceived expertise in groups.
References
1. French, J.R.P., Raven, B.H.: The bases of social power. In D. Cartwright (Ed.), Studies in social power (pp. 150--167). Ann Arbor: Institute for Social Research (1959)
2. Littlepage, G.E., Mueller, A.L.: Recognition and utilization of expertise in problem-solving groups: Expert characteristics and behavior. Group Dynamics: Theory, Research, and Practice, 1(4), 324--328 (1997)
3. Hollingshead, A.B.: Perceptions of expertise and transactive memory in work relationships. Group Processes & Intergroup Relations, 3(3), 257--267 (2000)
4. Littlepage, G., Robison, W., Reddington, K.: Effects of task experience and group experience on group performance, member ability, and recognition of expertise. Organizational Behavior and Human Decision Processes, 69(2), 133--147 (1997)
5. Karakowsky, L., McBey, K.: Do my contributions matter? The influence of imputed expertise on member involvement and self-evaluations in the work group. Group & Organization Management, 26(1), 70--92 (2001)
6. Thomas-Hunt, M.C., Phillips, K.W.: When what you know is not enough: Expertise and gender dynamics in task groups. Personality and Social Psychology Bulletin, 30(12), 1585--1598 (2004)
7. Bunderson, J.S.: Recognizing and utilizing expertise in work groups: A status characteristics perspective. Administrative Science Quarterly, 48, 557--591 (2003)
8. Bonner, B.L., Sillito, S.D., Baumann, M.R.: Collective estimation: Accuracy, expertise, and extroversion as sources of intra-group influence. Organizational Behavior and Human Decision Processes, 103(1), 121--133 (2007)
291
9. Gladstein, D.L.: Groups in context: A model of task group effectiveness. Administrative Science Quarterly, 29(4), 499--517 (1984)
10. Correll, S.J., Ridgeway, C.L.: Expectation states theory. In J. Delamater (Ed.), Handbook of social psychology (pp. 29--51). New York: Kluwer Academic/Plenum Publishers (2003)
11. Krauss, R.M., Fussell, S.R.: Perspective-taking in communication: Representations of others’ knowledge in reference. Social Cognition, 9(1), 2--24 (1991)
12. Judge, T.A., Erez, A., Bono, J.E.: The power of being positive: The relation between positive self-concept and job performance. Human Performance, 11(2/3), 167--187 (1998)
13. Choi, N.: Sex role group differences in specific, academic, and general self-efficacy. Journal of Psychology, 138(2), 149--159 (2004)
14. Thoms, P., Moore, K.S., Scott, K.S.: The relationship between self-efficacy for participating in self-managed work groups and the big five personality dimensions. Journal of Organizational Behavior, 17(4), 349--362 (1996)
15. Deutsch, M., Gerard, H.B.: A study of normative and informational social influences upon individual judgment. Journal of Abnormal and Social Psychology, 51(3), 629--636 (1955)
16. Kaplan, M.F., Miller, C.E.: Group decision making and normative versus informational influence: Effects of type of issue and assigned decision rule. Journal of Personality and Social Psychology, 53(2), 306--313 (1987)
17. Kelly, J.R., Jackson, J.W., Hutson-Comeaux, S.L.: The effects of time pressure and task differences on influence modes and accuracy in decision-making groups. Personality and Social Psychology Bulletin, 23(1), 10--22 (1997)
18. Chen, G., Gully, S.M., Eden, D.: Validation of a new general self-efficacy scale. Organizational Research Methods, 4(1), 62--83 (2001)
19. Lafferty, J.C., Pond, A.W.: Desert survival situation. Plymouth: Human Synergistics (1974) 20. Rogelberg, S.G., Barnes-Farrell, J.L., Lowe, C.A.: The stepladder technique: An alternative
group structure facilitating effective group decision making. Journal of Applied Psychology, 77(5), 730--737 (1992)
21. Graney, M.J.: Nomogram for obtaining z-test statistic from spearman rs and sample Size 10 to 1000. Teaching Sociology, 5(2), 201--210 (1978)
22. Srnka, K.J., Koeszegi, S.T.: From words to numbers: How to transform qualitative data into meaningful quantitative results. Schmalenbach Business Review, 59(1), 29--57 (2007)
23. Cohen, J., Cohen, P., West, S.G., Aiken, L.S.: Applied multiple regression/correlation analysis for the behavioral sciences (3rd ed.). New York: Routledge (2003)
24. Littlepage, G.E., Schmidt, G.W., Whisler, E.W., Frost, A.G.: An input-process-output analysis of influence and performance in problem-solving groups. Journal of Personality and Social Psychology, 69(5), 877--889 (1995)
25. Greenberg, J., Baron, R.A.: Behavior in organizations (9th ed.). Upper Saddle River: Pearson Prentice Hall (2008)
26. Hofstede, G.: National cultures in four dimensions: A research-based theory of cultural differences among nations. International Studies of Management and Organization, 13(1/2), 46--74 (1983)
27. Weisband, S.P.: Group discussion and first advocacy effects in computer-mediated and face-to-face decision making groups. Organizational Behavior and Human Decision Processes, 53, 352--380 (1992)
292
Factorization of large tournaments for themedian linear order problem
Alain Guenoche
Institut de Mathematiques de Marseille (I2M - CNRS),[email protected]
Abstract. Computing a median linear order on a set of linear orders onn elements, is an ordinary task for aggregating preferences. This problemis formalized by a tournament (complete directed graph) with n vertices,arcs corresponding to majority preferences. A median linear order hasa minimum remoteness to this tournament. To build such an order isto make it transitive, realizing a minimum number of arc-reversal oper-ations. This computation is made using a Branch & Bound algorithmwhich cannot be applied when n overpasses a few tens. In this text wetry to decompose a large tournament (n > 100) into sub-tournamentsand to assemble the orders on each one into a linear order on n elements.We show, making several simulations on random tournaments, weightedor unweighted, that this decomposition strategy is efficient.
Key words: Preferences, linear orders, tournament, median order
1 Problem
A group E of experts (|E| = m), ranking a set X of items (|X| = n), defines alinear order profile Π = S1, S2, . . . , Sm. We try to establish a linear order πfrom this profile, being a median order for Π according to distance δ : S×S → N.It means that ∑
i=1,...,m
δ(Si, π) (1)
is minimum over the linear order set S on X [1].Classically, δ is the symmetric difference distance between item pairs on X.
Thus, to build a median order from profile Π a table T indexed on X×X is firstcomputed. T (x, y) = |S ∈ Π such that x ≺S y| ; evidently T (x, y) +T (y, x) =m. This table is associated to a tournament having arc (x, y) directed from x toy iff T (x, y) > T (y, x). This arc can be weighted by w(x, y) = T (x, y)− T (y, x)and w(y, x) = 0.
Often, in practical problems, preferences are not linear orders because ofties. In that case, preferences are weak orders. Nevertheless, the summarizing ofa profile can be done the same way, defining a majority tournament.
A linear order is equivalent to a transitive tournament. Consequently, a set ofarcs to reverse, denoted the reversal arcs set, is searched to make the computedtournament transitive. This set must have minimal weight to give a median
293
2 A. Guenoche
order. It is the Kemeny (1959) problem, which is NP-hard (see [8] for a largesurvey). Using a Branch & Bound algorithm, a linear order π with minimumremoteness to the tournament is built. It is a median order for profile Π [6, 2].Its remoteness W is the sum of weights of the reversal arcs, that are arcs directedfrom y to x, when x is before y in π:
WΠ(π) =∑x≺πy
w(y, x). (2)
For unweighted tournaments, it is the number of reversal arcs which mustbe minimized. It becomes the Slater problem [10], which is the same as beforewith weights all equal to 1. It is also NP-hard and the same algorithm is usedto solve both problems.
In this article, we are interested with large problems (100 ≤ n < 1000). Theygenerally do not occur in preference aggregation, because experts cannot ranka so large number of items. But this type of instances exists when comparingfunctions defined over points on a triangulated surface. The points correspondto the items and the orders are defined according to models generating functionvalues (as for simulation of car crashes). Some variables allow to compare thesefunctions and a median function is searched either to characterize an average caseor to define quantile of deformations. But we keep the preference aggregationscheme to develop our factorization method.
A transitive tournament corresponds to a single linear order, which is easilybuilt ranking the internal half-degrees in increasing order. But if the tournamentcontains many circuits, the Branch & Boundprocedure can be very long andfail because of computation time or memory to extend the tree. Each nodecorresponds to a beginning sections (prefix) of an linear order which can beextended to a median one. Despite many careful efforts [3, 4], as soon as n islarger than 20 elements, the tree can overpass 500 000 nodes. Then, heuristicsare used to get an upper bound to the remoteness of an optimal linear orderfrom the tournament, and also an approximate solution to the problem.
2 Classical heuristics
We only keep two of them, because the Borda’s method (increasing order of thesum of item ranks in the profile) and the Smith & Payne method [11] (reversalof arcs involved in the largest number of 3-cycles) have been found withoutefficiency for the problem size we tackle.
2.1 The increasing order of internal half degrees
Vertex x is said to be dominated by vertex y when T (y, x) > T (x, y) and theinternal half degree of x is the number of vertices dominating x. It is very naturalto put at the first place, in the searched linear order, vertex having the smallestdegree and to continue according to this increasing order. This heuristic is themost efficient for unweighted tournaments. The degree sum is computed in O(n2)and the increasing order is in O(n log n).
Kamineta
Rectangle
294
Tournament factorization 3
2.2 The greedy heuristic
It uses the same principle as for the Branch & Bound procedure, except thetree of beginning sections is not developed. At each step the item promising thesmallest remoteness is selected and the costs of the remaining items are updated.The column sums of the weight table are first computed
Sum(y) =∑x∈X
w(x, y). (3)
Sum(x) is the contribution of x to the remoteness of an order beginning byx. At each step
– item x such that Sum(x) is minimum is selected ;– weights are updated : Sum(y)← Sum(y)− w(x, y).
This heuristic is clearly in O(n2) ; it is the best one for weighted tournaments.
There are many other stochastic optimization heuristics, for instances, Sim-ulated Annealing (Metropolis), Variable neighborhood search [7] or the Noisingmethods [5]. We do not consider them in this study, because of parameters toadapt, computation time to manage, of computer codes only made by these au-thors. But any heuristic solution giving a linear order can be a starting point ofoptimization procedures. Again, we select only two of them that are determin-istic.
2.3 Two local optimization procedures
Any heuristic establishes a linear order O = (o1, o2, . . . , on) on X. We applytwo local optimization procedures. The first one is very classical : two consec-utive items such that w(oi+1, oi) > 0 are searched. It is clear that transposingthese elements will make the remoteness decrease, erasing a reversal arc. Thisprocedure is iteratively applied until there is no such pair to apply.
The second one is only for weighted tournaments. For each element oj , weseek for an item oi placed before and dominated by oj ; so we have i ≺π j,w(oj , oi) > 0 and (oj , oi) is the shortest reversal arc from oj . It is interesting toswap oj and oi if the items placed between oi and oj do not create reversal arcswith a larger weight. This is checked summing values
Q =∑i>k>j
w(ok, oj) +∑
i>k>j−1
w(oi, ok). (4)
The first sum corresponds to arcs ending in oj and the second one to arcsstarting from oi which would became reversal arcs after swapping oi and oj . Thelast weight w(oi, oj−1) is not counted in the second sum because, if it is positive,it is enough to transpose oj−1 and oi which takes the place of oj .
So, if w(oj , oi) > Q the interval (oi, oi+1, . . . , oj−1, oj) becomes either (oj , oi+1, . . . , oi, oj−1),or (oj , oi+1, . . . , oj−1, oi) according w(oi, oj−1) is positive or not.
Kamineta
Rectangle
295
4 A. Guenoche
As far as I know, this latter optimization procedure is new and we have testedits efficiency. It is fast, since for each element, it suffices to go back to the lastdominated item and to apply formula (1.4) within this interval ; its complexityis O(n2).
3 Factorization of a tournament
For median linear order problems of large size (n 100), these heuristicsare poorly efficient. We study the idea of a tournament decomposition in sub-tournaments, that is to separate the X items into clusters of close elements ina median linear order. It could be efficient to compute a linear order for eachclass and to concatenate them to make an order on X. We are going to test ifthis composed order is closer to the tournament than the classical heuristic oneswhen they are applied to X as a whole.
3.1 A balanced decomposition
The linear order given by the best heuristic (BestH, the one giving the smallestremoteness) infers a balanced decomposition. Given a number of clusters p, itsuffices to built classes as intervals along this order. The n/p first ranked itemsare in the first class, the next n/p in the second, and so on. One get a partitionin balanced clusters denoted PB .
3.2 A partition based on a distance
Considering the W table of the arc weights, one can associate to each elementx a bipartition : Let x+, be the set of items which would be ranked before xbecause they dominate it, and x−, those which would be placed after x becauseit dominates them.
x+ = z ∈ X|w(z, x) > 0 and x− = z ∈ X|w(x, z) > 0.
Using these bipartitions, on can define a dissimilarity index on X
D(x, y) = ∆(x+, y+) +∆(x−, y−) (5)
in which ∆(x+, y+) is the symmetric difference distance between sets x+ and y+(resp. x− and y−).
Remark : D is not a distance, because D(x, y) = 0 if w(x, y) = w(y, x) = 0.
Proposition 1. If T is a transitive tournament,
– Two consecutive elements in its median order have distance equal to 2 ;– D(x, y) is proportional to the rank difference between x and y in the median
order ;
Kamineta
Rectangle
296
Tournament factorization 5
– D is a robinsonian distance.
Proof. Let x ≺ y be two consecutive elements in the order corresponding to atransitive tournament. Classes x+ and y+ (resp. x− and y−) only differ by asingle element, x (resp. y) and so D(x, y) = 2. In the same way, if x and y areseparated by k items in the order, D(x, y) = 2(k + 1). Thus, values increasealong rows from the diagonal, and D is a distance (because there is no tie inpreferences). This is the definition of a robinsonian distance.
Consequently, homogeneous classes according to D would gather close ele-ments in a median linear order. The number of clusters, implying the averagenumber of items per sub-tournament, will be defined by a simulation processdescribed in section 4.
The partitionning algorithm is based on a criterion optimization. Given apartition of n items in p classes, denoted P = P1, . . . , Pp, it tends to minimizethe sum M of the average distances of each element to the items belonging toits class.
M =
p∑k=1
[∑x∈Pk
1
|Pk|∑y∈Pk
D(x, y)] (6)
The resulting partition PM is computed by an iterative procedure similarto k-means. One start from the atomic partition only made with singletons. Ateach iteration one element is assigned to the class for which its average distanceis minimum. It stops when there is no more element to transfer.
3.3 Composition, Complexity and Efficiency
For each class from PB or PM , one evaluate
– its rank index value, equal to the average of its item ranks in the best heuristicorder ;
– the sub-tournament corresponding to this class, with weights given in W ;– a linear order minimizing, as much as possible, its remoteness to the sub
tournament. For the following computations, I retain the first heuristic forunweighted problems and the second one for weighted tournaments.
Then, the linear orders corresponding to clusters are concatenated accord-ing their rank index values, making this way a composed linear order. Thelocal optimization procedures are applied, making finally two linear orders,CompB , CompM for the two decomposition methods.
The balanced decomposition algorithm is linear. The distance array compu-tation in in O(n3), since for each item pair, the relative positions of n elementsare compared. Partition PM is established by an iterative algorithm, without toknow its iteration number, as for k-means, which is well known for its efficiency.Then, classical heuristics are applied to each class followed by local optimizationto the composed order which remain in O(n2).
Thus, the Composed Linear Order method is fast. For a tournament having1000 nodes, a linear order in computed in 1”20 by PB and 19”30 by PM , usingan ordinary desk computer.
Kamineta
Rectangle
297
6 A. Guenoche
4 Simulations and results
4.1 On random permutations profiles
The m permutations of order n selected at random make a profile [9] and theW matrix. The two classical heuristics give the BestH linear order. Fixing thenumber of classes p makes on one side, the partitionning PB and the composedlinear order CompB and on the other side, calculating distance D and applyingthe partitionning algorithm gives partition PM and the CompM linear order.For these three orders their remoteness to the tournament is measured.
Tests are made on 100 profiles with the same parameters. Each row in Ta-ble 1 gives the average remoteness. The three first columns are for unweightedtournaments and the three others for weighted ones.
Table 1 : Remoteness values of the orders given by heuristics on unweighted(left) and weighted (right) tournaments
The composed linear orders are much better than the best classical heuristic.They win at each trial, except for a few problems with n = 100. But these areaverage results and, for a specific problem, both decomposition methods mustbe applied. Two questions remain : which is the optimal number of class forfactorization and how far are these figures from the optimum (a median linearorder) ?
To answer the first one, we consider 100 orders on 300 items (n = 300,m =100), for which we seek the optimal number of classes in the average. The twofirst columns correspond to unweighted tournament and the two others are againfor weighted ones. Classical heuristics give remoteness values independent of p,respectively 8333 and 30240, always larger than those obtained factorizing thetournament.
Table 2 : Average remoteness values of the orders given by decomposition ofunweighted (left) and weighted (right) tournaments, making the number of
classes p vary.
Remoteness average values decrease when the class number increases, thenthey increase. It is why we don’t go further. The minimum value is obtained withclass number depending on the method. But the best decomposition is reachedfor 11 or 12 corresponding to around 30 elements per class.
4.2 Tournaments with bounded remoteness
Selecting independent permutations as before, generates tournaments far to betransitive and the computed orders have a large remoteness. The best linear ordercannot be seen as a consensus order, because there is no meaningful consensus tothese profiles. We are going to generate tournaments from a unique linear order,making transpositions between random items. Let t be the parameter countingthe transposition number. There are two generating processes :
– Starting from the natural linear order, corresponding to a transitive un-weighted tournament, one select at random t pairs. If x < y, T (x, y) = 1and T (y, x) = 0 . Transposing (x, y) will make T (x, y) = 0 and T (y, x) = 1.Doing so, we are sure there exists a linear order with a remoteness to the finaltournament lower than or equal to t.
– The m permutations are built from the natural order transposing t randompairs in each one. The weighted tournament is then computed, according tothe usual majority rule. But if t is small compared to n, the consensus andmedian order would be the natural order.
The first tests are for unweighted tournaments with n = 300 in which 2000,3000, 4000 random transpositions are made, over the 34850 possible. So themedian order must be very close to the natural order, for which the remotenessis calculated. The same algorithms as before are run with a factorization in 10clusters :
n t p BestH CompB CompM NatOrd300 2000 10 1965 1903 1898 1895300 3000 10 2915 2796 2786 2779300 4000 10 3841 3661 3643 3628
Kamineta
Rectangle
299
8 A. Guenoche
Table 3 : Average remoteness values for the BestH heuristic, the twofactorization methods and the natural order expected to be a median one, on
unweighted tournaments obtained after t random transpositions.
These are again average values over 100 problems. The given bound, equal to t islargely improved by composed linear orders. And partition PM provides valuesvery close to those of the natural order suspected to be optimal.
The second test is made with permutations on which 100 transpositions havebeen made before to calculate the weighted tournament. Factorizations are al-ways made with 10 classes.
n m t p BestH CompB CompM NatOrd300 30 100 10 2065 1721 1434 1555300 50 100 10 800 677 558 544300 100 100 10 56 51 49 46
Table 4 : Average remoteness values for the same linear orders as in Table 3,on weighted tournaments obtained after t random transpositions on m natural
orders.
The larger is the number of permutations (m), the lower is the remoteness be-cause the corresponding tournament becomes transitive. The second decompo-sition method proves its efficiency for problems with a strong consensus.
5 Conclusion
The factorization strategy is always the winner. And so, it is better to concate-nate small orders optimized from sub-tournaments than to compute an opti-mized linear order from the whole tournament. More, for tournaments close tobe transitive, the PM decomposition gives linear orders close to the median one.
So, for a large specific tournament coming from real data, I will first computean optimal number of classes with the balanced partitionning, which is very fast,since there are no distance array to measure. And around this value, I will testpartitionning algorithms. A last trial with a 1000 vertices tournament provides,with the balanced decomposition in 15 clusters, the smallest remoteness value.
References
1. J.P. Barthelemy, B. Monjardet. The Median Procedure in Cluster Analysis andSocial Choice Theory, Mathematical Social Sciences, 1, pp. 235-267, 1981.
2. J.P. Barthelemy, A. Guenoche, O. Hudry. Median linear orders: Heuristics andBranch and Bound algorithm. European Journal of Operational Research, 42, pp.555-579, 1989.
3. I. Charon, A. Guenoche, O. Hudry, F. Woirgard. A Bonsaı Branch and Boundmethod applied to voting theory, Proceedings of ”Ordinal and Symbolic Data Anal-ysis”, OSDA’95, E. Diday et al. (Eds.), Springer Verlag, 309-318, 1996.
Kamineta
Rectangle
300
Tournament factorization 9
4. I. Charon, O. Hudry, F. Woirgard. Ordres medians et ordres de Slater des tournois,Mathematiques et Sciences Humaines, 133, pp. 23-56, 1996.
5. I. Charon, O. Hudry. The noising methods: a generalization of some metaheuristics,European Journal of Operational Research, 135 (1), 86-101, 2001.
6. A. Guenoche. Un algorithme pour pallier l’effet Condorcet, R.A.I.R.O. RechercheOperationnelle, 11, 1, 77-83, 1977.
7. P. Hansen, N. Mladenovic. Variable neighborhood search : Principles and Applica-tions, European Journal of Operational Research, 130(3), 449-467, 2001.
8. O. Hudry. On the computation of median linear orders, of median complete pre-orders and of median weak orders, Mathematical Social Sciences, 64, 2-10, 2012.
9. A. Nijenhuis, H. Wilf. Combinatorial Algorithms, Academic Press, New-York, 1975.10. P. Slater. Inconsistencies in a schedule of paired comparisons, Biometrika, 48, 303-
312, 1961.11. A.F.M. Smith, C.D. Payne. An algorithm for determining Slater’s i and all nearest
adjoining orders, British Journal of Mathematical and Statistical Psychology, 27,49-52, 1974.
Kamineta
Rectangle
301
Portfolio optimization and preferences
Cristinca Fulgaa,b,
aBucharest University of Economic Studies, Department of Applied Mathematics,6 Piata Romana, 010374 Bucharest, Romania
bInstitute of Mathematical Statistics and Applied Mathematics of Romanian Academy,13 Calea 13 Septembrie, 050711 Bucharest, Romania
Abstract
In this paper we address two issues considered as weaknesses of the Mean-Variance,respectively Mean-Risk, portfolio selection models. The rst one is related to theamount of signicant information contained in the return distributions, but ignoredduring the decision process, and second is the implicit assumption of neutrality at riskof the individual investor. We work with the forecasted empirical return distributionfunction; thus the higher moments of the return distributions and implicitely theinformation contained in them are not neglected. We propose a portfolio selectionmodel incorporating the individual preferences in the objective related to the portfo-lio return. We evaluate the di¤erences and the similarities between the two e¢ cientfrontiers corresponding to the proposed model and the classical Mean-Variance.
A crucial question in nancial management is how to combine risky assets intoa portfolio such that the investment decision taken at the present moment has themost rewarding consequences at the end of a given time horizon T . Starting withMarkowitzseminal work [2], the most used approach for solving the portfolio se-lection problem in practice relies on the Mean-Risk models. In this framework, thedecisions are based on the comparison of two numerical values characterizing theportfolio return distributions: the expected value and the value of a particular risk
Preprint submitted to UT1C Proceedings April 24, 2014
Kamineta
Rectangle
302
measure. The fact that during the optimization process only these two statistics aretaken into consideration have attracted some criticism from two viewpoints:
the rst one is related to the amount of signicant information contained inthe distribution which is ignored and therefore lost for the decision process,
the second is driven by the very practice of risk which shows that individualinvestors can di¤er in their attitudes toward risk, in their preferences and hencein what they consider a suitable Mean-Risk trade-o¤ .
In order to correct the rst shortcoming, many researchers have argued that thehigher moments of the portfolio return distribution cannot be neglected. One way toachieve this is by droping the usual simplifying assumptions about the returns distri-butions (like the hypothesis of being gaussian or spherical or eliptical) and workingwith the empirical distributions, more precisely with the forecasted ones which de-pend on their higher moments. Other authors consider that the higher momentsshould be added to the Mean-Risk model as objective functions. Consequently, insome recent studies, the concept of Mean-Variance trade-o¤ has been extended toinclude the skewness of return in portfolio selection, or the kurtosis.The second reason of skepticism regarding the basic Mean-Risk models is driven
by the implicit disregard of the individual investors preferences. The investorspref-erences are usually described by increasing, smooth and concave utility functions. Inthis paper we consider the exponential utility dened as
U (w) =1
1 ew
; w 2 R; (1)
where the parameter = Aa (w) ;8w; where Aa (w) = U 00(w)=U 0(w);8w; is thecoe¢ cient of absolute risk aversion.In this paper, we address both these issues by considering portfolio selection
models in the Mean-Risk framework, but allowing the consideration of individualpreferences by using the decision-makers specic utility/disutility function. Andmoreover, we work with the forecasted empirical return distribution function whichallows the dependence of the return distribution on its higher moments. Thus, theinformation contained in the distribution is fully taken into consideration.
2. Utility-based portfolio selection models
Let n be the number of securities available for the portfolio. The key randominputs in the portfolio management problem are the asset prices at the end of the
2
Kamineta
Rectangle
303
planning horizon denoted by p (!) = (p1 (!) ; :::; pn (!)) ; ! 2 or simply by p (weuse bold symbols for vectors). The set represents the set of future states of knowl-edge and has the mathematical structure of a probability space with a probabilitymeasure P for comparing the likelihood of future states !. Let l (x;p) be the lossassociated with the decision vector x 2 X Rn and the random vector p, where xis interpreted as a portfolio and X is the set of available portfolios subject to variousconstraints. The loss equals to the di¤erence between the initial wealth W0 and thenal random wealth, l (x;p) = W0 W; where W = xTp: Positive outcomes of lossfunction are disliked, while negative outcomes are welcome because they representgains. For each x 2 X, the loss l (x;p) is a random variable having a distribution inR induced by that of p. Throughout this paper, the loss function can have a moregeneral form if it is continuous in x, measurable in p and E (jl (x;p)j) <1 8x 2 X.The underlying probability distribution of p in Rn is assumed to have the probabilitydensity function (pdf) denoted by g (p), p 2 Rn.Variance was the rst risk measure used in portfolio optimization, Markovitz [2].
More recently, regulations for nance businesses formulate some of the risk manage-ment requirements in terms of percentiles of loss distributions. The most commonlyused is the Value at Risk (VaR). Given z a level of losses, the cumulative distri-bution function (cdf) of l (x;p) is dened by Gl(x;p) (z) = P (fp jl (x;p) zg) =Rl(x;p)z g (p) dp and is assumed continuous with respect to z. Let G
l(x;p) : (0; 1)! R
be the quantile function, given by G l(x;p) () = minGl(x;p)(z)
z. Within risk manage-
ment, it is called the Value at Risk of the loss l (x;p) at a probability level of 2 (0; 1) and denoted by VaR (l (x;p)) or z (x). VaR can be e¢ ciently estimatedand managed when underlying risk factors are normally distributed. However, fornon-normal distributions, VaR may have undesirable properties (see Artzner et al.[1]) such as the lack of sub-additivity. Also, VaR is di¢ cult to control/optimize fordiscrete distributions, when it is calculated using scenarios. In this case, VaR is non-convex and non-smooth as a function of positions, and has multiple local extrema.To alleviate these problems, Artzner et al. [1] introduced the concept of coherentrisk measure and proposed the Conditional Value at Risk (CVaR). The CVaR ofthe loss l (x;p) at probability level 2 (0; 1) proved to be coherent. The dedicatednotation which associates any portfolio x 2 X to its corresponding CVaR is : X! R given by
(x) =1
1
Zl(x;p)z(x)
l (x;p) g (p) dp: (2)
The CVaR continues to be intensively studied and applied in di¤erent contexts. Dueto its good properties both from theoretical and computational point of view, the
3
Kamineta
Rectangle
304
Mean-Risk models studied in this paper are based on the CVaR risk measure.We consider the single-period portfolio problem which involves portfolio decisions
in response to new information on market future prices (returns) of the risky assets.The decision maker starts (at t = 0) with an initial portfolio x0 2 Rn having fullknowledge of the current asset prices p0. We consider the vector of asset logarithmicrates of return r = (r1; :::; rn)
T : The action taken on asset i at time t = 0 is denotedby ui and represents the amount of the ith purchased/sold asset. The investor caneither hold the asset i (ui = 0), buy more (ui > 0), or sell o¤ a part of asset i(ui < 0). The decision vector is u 2 Rn and the adjusted portfolio is x = x0 +u. We assume that no short selling is allowed, i.e. x 0. Buying and sellingcauses transaction costs which we assume to be proportional to the amount of assettraded. In our model, 100c represents the transaction costs expressed as a percentageassociated with buying/selling one unit of asset i. The budget constraint xTp0 +nXi=1
p0;i juij c = W0 represents the assumption that there is no exogenous intervention
in the amount of money involved in transactions during the time period. The basicExpected wealth/return-CVaR (E-CVaR) model with transaction costs is:
minx2X
(E (W (x;p)) ;CVaR (l (x;p))) (3)
X =
(x 2 Rn
xTp0 +nXi=1
p0;i juij c = W0; 0 xi W0
p0;i; i = 1; n
)(4)
We note that the model (3)-(4) is the same for all investors, whatever theirrisk prole. A more realistic approach is to consider that the decision maker ischaracterized by an increasing convex disutility function D. We mention that weuse the notations: D for the investors increasing convex disutility function whenwe refer to losses, and U for the corresponding increasing concave utility function ofthe same investor when we refer to wealth/returns, where U (w) = D (w) ;8w 2R: Introducing the utility/disutility function in the portfolio model will allow theselection of not only protable, but also suitable portfolios. The models to be studiedin this paper are designed to meet this requirement. Following this path, we notethat the inuence of the investors preferences can be incorporated in the rst or inthe second objective function of the basic model (3)-(4).
2.1. Incorporating the investors preferences in the meanFirstly, for a given probability level 2 (0; 1) ; we consider the class of models
minx2X
(E (U (W (x;p))) ;CVaR (l (x;p))) (5)
4
Kamineta
Rectangle
305
incorporating the preferences in the rst objective function of (3)-(4). These mod-els are maximizing the expected utility of the portfolio terminal wealth/return andsimoultaneously minimizing the CVaR of the portfolio loss distribution. The model(5) will be referred to as the Expected Utility-CVaR (EU-CVaR) portfolio model.
2.2. Comparison of the E-Var and EU-CVaR e¢ cient frontiers for the CARA classof utility functions
In order to quantify these di¤erences we have calculated the di¤erences in com-position and the relative variations of the weights of the E-Var e¢ cient portfoliosin relation to the EU-CVaR e¢ cient portfolios. We have followed the proceduredescribed in Phillips [3], the results are presented in Table 1. The computationalresults corresponds to a CARA utility (1) with = 2:5.
The sub-table Common assets. The diagonal terms represent the average num-ber of assets in the respective e¢ cient frontier. The o¤-diagonal terms representthe average number of assets in common for e¢ cient portfolios of both corre-sponding models. For example, the pair of e¢ cient frontiers EU CV aR =E V ar has an average of 7.26 assets in common.
The sub-table Portfolio overlap index. Each o¤-diagonal term represents theaverage percentage of common assets for the corresponding models. For exam-ple, the value of 76:42% means that on average, 76:42% of asset contained in anE V ar e¢ cient portfolio are also contained in EU CV aR. This does notmean that the portfolios are almost identical because the weights within port-folios could vary markedly - this has major investment implications. When twoportfolios have the same composition the overlap is 100% (the diagonal terms).
The sub-table Portfolio weight index. Each o¤-diagonal term represents thesum of the minimum weights corresponding to each common asset for thecorresponding models. This index measures the importance of the respectiveasset in the portfolio, therefore it is a measure of how similar are the twoportfolios due to the weights of the assets. An o¤-diagonal value of this indexclose to 100% would mean that the weights of all common assets are almost thesame. For example, the value of 39:96% corresponding to the pair of e¢ cientfrontiersEV ar = EUCV aR for which the Portfolio overlap index is 76:42%indicates that on the average the variation in weight goes from simple to double.
The sub-table Portfolio similarity index. Each o¤-diagonal term is calculatedas the product of the Portfolio overlap index and the Portfolio weight index for
5
Kamineta
Rectangle
306
Indices Model E V ar EU CV aRCommon E V ar 100assets EU CV aR 7.26 100
Portfolio E V ar 100overlap EU CV aR 76.42 100
Portfolio E V ar 100weight EU CV aR 39.96 100
Portfolio E V ar 100similarity EU CV aR 30.53 100
Table 1: Analysis of asset allocation similarity.
each model. This index gives the proportion of common assets to both modelswith similar weights. For example, if we consider the same pair of e¢ cientfrontiers as before E V ar = EU CV aR, the value of 30:53% represents thepercentage of common assets having similar weights in portfolios belonging tothese two e¢ cient frontiers.
We conclude from this analysis that the model EUCV aR shows a low similarityof 30.53% with the EV ar model and therefore the consideration of the preferencesresults in a di¤erent investment. Subsequent work will show the advantages of usingthe EU CV aR model instead of the classic E V ar:
Acknowledgement This work was supported by a grant of the Romanian NationalAuthority for Scientic Research, CNCS UEFISCDI, project number PN-II-RU-TE-2012-3-0007.
References
[1] Artzner, P., Delbaen, F., Eber, J. M., & Heath, D. (1999). Coherent measures ofrisk. Mathematical Finance, 9, 203-228.
[2] Markowitz, H. M. (1952). Portfolio selection, Journal of Finance. 7, 7791.
[3] Phillips, H.E. (1993) Portfolio Optimization Algorithms, Simplied Criteria, andSecurity Selection: A Contrast and Evaluation, Review of Quantitative Financeand Accounting, 3, 91-97.
Abstract. For decision making in a community, a set of alternatives needs to be
identified. The set of alternatives should be consistent with recognition in a
community (Social context). In this study, we define “social context” as typical
wording in community. Such wording appears in newspaper articles. We focus
on the issue of bicycle riding in Japan and clarify the change of social context
by using newspaper article. We show that wording in newspaper articles on
bicycle riding in Japan has been changed during the past decade.
Keywords: Social context, Newspaper articles, Text mining, Wording
1 Introduction
In the science of decision making, the effect of wording on people’s behaviors is
regarded as a framing effect. Levin et al. [1] presented some experimental examples
of risky choice framing where the wording of the outcome categories could affect
respondents’ answers. Wording affects not only individual decisions, but also group
decisions. Liberman et al. [2] have reported on the effects of the “name of the game”
in a prisoner’s dilemma experiment. One half of the subjects described “the Wall
Street Game” while the other half described “the Community Game”. Though the
payoff structures of both games were identical, the names of the games affected
subjects’ choices. More than half of the subjects cooperated when playing the
Community Game, whereas only one third of the subjects cooperated in the Wall
Street Game. Ellingsen et al. [3] have conducted similar experiments in which the
names of the games were “the Stock Market Game” and “the Community Game”.
Although they reported similar results, they also showed that the social framing effect
vanished when the game was played sequentially. Based on their results, Ellingsen et
al. [3] concluded that social frames were imbibed in people’s beliefs rather than in
their preferences.
Wordings are also important in participatory planning process in a community.
Participants’ ideas are summarized and some of them are adopted as alternatives.
Their ideas are described through the use of language. If participant’s idea is
described through the wordings which are broadly shared with other people, they can
understand the idea easily. If the wording used for the idea is different from the
shared wordings in a community, other people may not understand the meaning of the
316
idea. Our previous study [4] showed that the ideas whose wordings have similarity
with the wordings in a community tended to be adopted as alternatives. In this study,
newspaper articles were used as the source of wordings in a community. However,
wordings shared in a community can be changed with time. We focus on the issue of
bicycle riding in Japan and clarify the change of wordings in a community by using
newspaper articles. The objectives of this study are to show the relationship between
wordings and policy decisions on bicycle issue and to show the change of social
context.
2 The outline of the problems
2.1 Our approach
Fig. 1 illustrates our basic model of community governance. The set of
alternatives is constrained by the social context (I). A community chooses an
alternative from set (II) and subsequently implements it (III). The result of the
implementation, in turn, affects the social context (IV). In this study, we focused on
the framework wherein the set of alternatives was recognized by community members
(I). In the actual community decision-making process, the set was not exogenously
given. In other words, the set of alternatives was determined through the recognition
of community members. When this recognition was altered, the set of alternatives
could correspondingly be reorganized, and the final alternative selected could be
changed. However, as alternatives were described through the use of language,
recognition of community members was apparent in the specific wording used for
describing alternatives. In other words, the wording used in a community constrains
the way in which alternatives are described. In this study, we define “social context”
as the wording used within a community. When social context (wording in a
community) is altered, alternatives discussed in a community can also be changed.
However, social context cannot be observed directly. In the field of political science,
it has been discussed that newspaper articles reflect community’s recognition on
issues [5] [6]. Based on their discussions, we assume that social context (typical
wording in a community) appears in wordings of newspaper articles.
As shown in Fig.1, social context can be affected by the result of implementation of
the past alternative (IV) and concerns in a community. If implementation resolved the
problem, priority of the problem for a community may fall. On the other hand, if
community members recognize a newly emerged problem, social context can be
altered. In this study, temporal change of social context is observed through wording
in media articles. By comparing the change with the decisions in a community,
appropriateness of the model in Fig.1 is examined.
Social Context
Policy Decision
Implementation
Concern
Alternative set
Media
IV
III
I
II
: Observable
: Not observable
Fig. 1. Our basic model for community governance
317
2.2 Situation about the bicycle riding in Japan
In Japan, some people use a bicycle as “vehicle,” while the other people regard a
bicycle as “substitute for walking.” Japanese society has not reached a consensus on
the role of a bicycle in transportation. The situation is causing some problems. As far
as a bicycle is regarded as a vehicle, a bicycle rider must keep to the left on roadway
like a car driver. However, some people ride a bicycle on a sidewalk. As a result,
pedestrians carry the risk of getting into a bicycle accident on sidewalk. Additionally,
the environment for bicycle riding, such as the bicycle lane, has not been developed
well. Another problem is illegally parking of a bicycle. At train stations, public space
is often occupied by bicycles. Since some people consider a bicycle as substitute for
walking, they do not hesitate to park their bicycle illegally.
3 Methodology
3.1 Data collection
In 2.1, social context was defined as wordings in newspaper articles. In order to detect
the social context of bicycle riding in traffic policy, it is necessary to collect
newspaper articles on bicycle riding in traffic policy. In this study, we used the
database of newspaper articles in Japan named “Yomidas” [7] for collecting the
articles. This database is provided by Yomiuri journal in Japan. First, the articles
including the two keywords “traffic” and “bicycle” were collected from newspaper
articles in the year 2002, 2006, 2007 and 2012. In order to specify the articles on
bicycle, only the articles whose title include “bicycle” were chosen for analysis.
3.2 Co-occurrence analysis
For analyzing temporal change of social context reflected in wording in newspaper
articles, two types of analysis were conducted. First we identified the related words
with the keyword “bicycle”, and then drew the network diagram of the co-occurring
words. Both analytical methods are based on the concept of “co-occurrence” of words.
Co-occurrence of words is quantified by Jaccard coefficient [8]. Jaccard coefficient
(Jaccard index) is used for comparing the similarity and the discrepancy of usage of
words in text data. Jaccard coefficient of words A and B is defined as follows,
J (A, B) = (The number of sentences containing A AND B) / (The number of sentences
containing A OR B) (1)
Jaccard coefficient shows how often these words are used in newspaper articles
simultaneously. If the Jaccard coefficient of words A and B is high, these two words
tend to be used frequently in the same sentence on newspaper article. Let X be a word.
When J (“bicycle”, X) is high, X is called the related word of “bicycle.” In order to
analyze the change of the social context, we focused on the changes of related words
of “bicycle.” As an example, we assume that J (“bicycle”, X) was high in early period,
then J (“bicycle”, Y) has become high later. In such case, X represented the issue on
bicycle in early period, and then the issue was shifted from X to Y.
318
The relationship of co-occurring words is also shown as network diagram. First, the sentences which include the word ‘bicycle” are chosen for network diagram. Then two words with high Jaccard coefficient are connected with a link. In the following analysis, the top sixty pairs with the highest Jaccard coefficient are chosen for drawing links. In this study, related words and network diagrams of co-occurring words are detected by using KH Coder. KH Coder is the software for content analysis and text mining [9]. Unit for analysis is one word in Japanese, but some Japanese words are shown as two or more English words after translation.
3.3 Comparative observation
For comparing social context (wording in newspaper articles) on bicycle with actual
policy discussion, we focused on three agencies. The first is Ministry of Land,
Infrastructure, Transport and Tourism (MLITT), the second is National Police
Agency (NPA) and the third is Bicycle Usage Promotion Study Group (BUPSG).
MLITT and NPA are the agencies of central government of Japan, and BUPSG is
NGO. In order to describe societal changes of bicycle riding, we focus on the
activities of these agents and marshal different elements of them.
4 Results
4.1 The change of related words
Table 1. shows the number of collected articles and the number of sentences in each
article. In 2002, for example, the number of articles including the words “bicycle” and
“traffic” is 579, of which 106 articles include “bicycle” in their titles. These 106
articles consist of 1475 sentences, of which 483 sentences include the word “bicycle”.
Table 2. shows the related words with “bicycle” in newspaper articles and their
Jaccard coefficients with “bicycle” in 2002, 2006, 2007 and 2012. The top 40 words
with the highest Jaccard coefficient with “bicycle” are shown. The three words
“traffic”, “accident” and “safety” were common in each year. It suggests that there
were many sentences about “bicycle accident” and “bicycle traffic safety”. On the
other hand, there are some keywords which independently appeared in each year.
“Bicycle-parking area”, “keeping” and “survey” appeared only in 2002. These words
suggest “illegally-parked bicycle” problem. The word “illegally-parked” showed the
second highest Jaccard coefficient with “bicycle” in 2002. However, its ranking had
dropped to the 35th highest in 2007 and finally it did not appear in 2012. This result
suggests that “illegally-parked” were often used with “bicycle” on the newspaper
articles from 2002 to 2007, while the word became not to be used with “bicycle” in
2012. On the other hand, the word “roadway” had changed to be used with “bicycle”
on the newspaper articles from 2007 to 2012 because the order of “roadway” has risen
from being unranked in 2002 and 2006 to18th in 2007. Moreover it rose to 15th in
2012. These results show that the changes of social context on bicycle can be
observed by the change of related words with “bicycle.”
319
Table 2. Related words with “bicycle” in 2002, 2006, 2007 and 2012.
N Word Jaccard Word Jaccard Word Jaccard Word Jaccard
Fig. 3. The relationship between the ranking of related words with “bicycle” from 2002 to
2012 and the number of municipalities which settled on a plan for bicycle lane
network from 1999 to 2012
321
bicycle path”. On the other hand, there is also the word group including “sidewalk” in
2012 and the most central word had been changed from “sidewalk” in 2002 to
“roadway” in 2012. “Sidewalk” had three links with other words in 2012, while
“roadway” had six links. It means that “roadway” became to be used with the words
including “pass”, “exclusive use” and “lane” on the newspaper articles in 2012. And it
suggests the issue on “development of bicycle lane on the roadway”. These analytical
results are summarized as follows.
The word group including “illegally-parked” represented the context of “the
illegally-parked bicycle” problem in 2002.
The word group including “roadway” represented the context of “development of
bicycle path” issue in 2012.
The context and relationship between “roadway” and “sidewalk” have been
changed from 2002 to 2012.
4.3 Activities for bicycle riding in Japan; MLITT, NPA and BUPSD
In this section, the several major events on bicycle riding from 2000 to 2013 are
explained. MLITT started the pilot programs in 2000, which promoted to decrease
illegally-parked bicycle and developed parking area for bicycle and bicycle lane. This
program had been conducted in 57 cities in Japan until 2006. MLITT set up a panel to
discuss the future of bicycle riding in 2007 and also set up 98 model zones to develop
a bicycle lane in 2008. Finally guideline of safety bicycle use was formulated in 2012.
NPA has revised the Road Traffic Low. In 2008, the Road Traffic Law including
bicycle riding had been revised. Under revised law, bicycle rider except such as
disabled people need to use the roadway in principle. BUPSG was established in 2000
to diffuse the effective and safe use of bicycle riding. This group claims that both
governmental agencies and municipalities need to change their policy from a
comprehensive and cross-cutting perspective for safe bicycle riding. They proposed
the legislation for promoting bicycle riding to diet members in 2002. They regularly
hold a study meeting and encourage different parts of society to ride a bicycle safely.
Especially they have strongly expressed that bicycle rider must keep to the left.
Fig. 3. shows the ranking of related words with “bicycle” from 2002 to 2012 and the
number of municipalities which settled on a plan for bicycle lane network. From 2002
to 2006, the word “illegally-parked” strongly co-occurred with “bicycle”. Then the
word “roadway” became to co-occur with “bicycle” more than “illegally-parked”
from 2007. On the other hand, the number of municipalities which settled on a plan
for bicycle lane network increased in 2011. It showed that municipalities began to
recognize bicycle lane network plan as an alternative for transportation policy.
5 Discussion and Conclusion
In this study, social context is defined as wording in newspaper articles. Wording in
newspaper articles on bicycle riding in Japan has been changed during the past decade.
It was observed that the related words with “bicycle” have been changed from 2002 to
2012. The word group including “illegally-parked” co-occurred with “bicycle” in
322
newspaper articles in 2002. From 2000 to 2006, MLITT conducted pilot program
including illegally-parked bicycle problem. The word group including “roadway” and
“lane” became to co-occur with “bicycle” from 2007. In 2007, MLITT set up a panel
to discuss a safe bicycle riding and finally formulated a guideline for safe bicycle
riding in 2012. The guideline includes implementation of development of bicycle lane
and informs the public of bicycle rule.
There was a time lag between the change of co-occurring words in newspaper articles
and municipalities’ decisions. Actually, MLITT have shown the development of
bicycle path as is the case with illegally-parked problem at the pilot program in 2000.
Nevertheless, the word “illegally-parked” strongly co-occurred with “bicycle” from in
2000 to in 2006. It suggested that the most important problem in bicycle issue was
“illegally-parked bicycle” problem. Some municipalities began to settle on bicycle
lane network plan from 2011. The word “roadway” had begun to co-occur with
bicycle since 2005 as shown in Fig.3. These results suggested social recognition of
bicycle problem had been changed from illegally-parked problem to bicycle network
planning.
As a result of our study, the change of co-occurring words was observed. The result
shows two important facts. First, social context as wording in a community can be
changed. Second, municipalities’ decisions were affected by the change of social
context. Our analytical results have some implication for participatory planning
process. We need to consider social context in generating the set of alternatives. If the
planner does not focus on the issue of illegally-parked bicycle in local traffic planning
in 2002, there is a gap between the planning process and social context. This is
because the issue of illegally-parked bicycle had higher social priority in 2002. This
social context was observed from the co-occurrence words in the newspaper articles
in this study. On the other hand, when planner generates the alternatives in 2012, it
would be better to focus on “the development of bicycle lane” and “the promotion of
the rule of bicycle riding,” because they have higher social priority in 2012 as shown
co-occurring words.
References 1. Levin, I.P., Schneider, S.L., Gaeth, G.J.: All Frames Are Not Created Equal: A Typology and Critical
Analysis of Framing Effects, Organizational Behavior and Human Decision Processes, 76 (2), pp. 149-188 (1998)
2. Liberman, V., Samuels, S.M., Ross, L. :The name of the game: Predictive power of reputations versus
situational labels in determining Prisoner's Dilemma game moves, Personality and Social Psychology Bulletin, 30 (9), pp. 1175-1185 (2004)
3. Ellingsen, T., Johannesson, M., Mollerstrom, J., Munkhammar, S.: Social framing effects: Preferences or beliefs?, Games and Economic Behavior, 76 (1), pp. 117-130 (2012)
4. Chosokabe, M., Umeda, H., Sakakibara, H.: Comparative Study of Workshop Discussions From the
Viewpoint of Social Context, Proceedings of the 2013 IEEE International Conference on Systems, Man and Cybernetics, pp. 310-322 (2013)
5. Prince, V.: Social Identification and Public Opinion: Effects of Communicating Group Conflict, American Association for Public Opinion Research, 53(2), pp. 197-224 (1989)
6. Brains, L. C, Wattenberg, P. M.: Campaign Issue Knowledge and Salience: Comparing Reception from
TV commercials, TV News and Newspapers, 40(1), pp. 172-193 (1996) 7. Yomiuri Journal: YOMIURI ONLINE, http://www.yomiuri.co.jp/rekishikan/ (in Japanese)
8. Henning, C.: Cluster-wise assessment of cluster stability, Computational Statics & Data analysis, 52, pp. 258-271 (2007)
Vahidnia, M.H., Alesheikh, A.A., Alimohammadi, A.: Hospital site selection using fuzzy AHP
and its derivatives, Journal of Environmental Management, 90, 3048–3056(2009).
Witlox, F.: Expert systems in land-use planning: an overview. Expert Systems with
Applications 29, 437–445 (2005).
336
14
Zucca, A., Sharifi, A.M., Fabbri, A.G.: Application of spatial multi-criteria analysis to site
selection for a local park: a case study in the Bergamo Province, Italy. Journal of
Environmental Management 88, 752–769 (2008).
Kamineta
Rectangle
PART XI
Posters
338
Notes on leadership identification in Social Cognocracy Network
Alberto Turón1, Juan Aguarón, José María Moreno-Jiménez and María Teresa Escobar
The Zaragoza Multicriteria Decision Making Group, Universidad de Zaragoza (Spain)
Abstract. The Social Cognocracy Network is a social network developed by the Multicriteria Decision Making Group (GDMZ) that is based on the principles that support the model of democracy known as e-cognocracy. It aims to respond to one of the most important weaknesses found when citizens are incorporated into public decision making and the joint construction of a better society: the lack of citizen participation. The network considers three levels of interaction: information, content creation and decision making. E-cognocracy uses two rounds in order to incorporate preferences through an e-voting module and an intermediate round of discussion in which the arguments that support the individual positions are added by means of a forum. In the voting rounds the priorities associated to the alternatives are compared on two separate occasions; in the discussion step, the arguments for and against these alternatives, which are defended by the decision makers, are incorporated by posting messages and comments to the messages. In addition to the text that contains the decision makers’ arguments, each post provides three quantitative measures that reflect the importance given by the author and the reader to the post and the extent of their agreement with it. All this quantitative information and the relationships and influence indicators within the discussion network are used to propose a procedure for the identification of the social leaders - the people whose opinions influence the actions of others.
Bayesian Models for AHP-Negotiated Decision Making
Alfredo Altuzarra1, Pilar Gargallo, José María Moreno-Jiménez and Manuel Salvador
Grupo Decisión Multicriterio Zaragoza (http://gdmz.unizar.es), Facultad de Economía y
Empresa, Universidad de Zaragoza, Gran Vía nº 2, 50005 Zaragoza, Spain
Abstract. The Analytic Hierarchy Process (AHP) is one the most widely used discrete multicriteria decision making techniques, with one or with many decision makers. In the latter context (multiactor), three different situations are identified: Group Decision Making (GDM), Negotiated Decision Making (NDM) and Systemic Decision Making (SDM). The second situation (NDM) is characterized by the existence of several decision makers that solve a specific and common problem in an individual context; this is followed by a search for regions of agreement and disagreement among the multiple actors involved in the resolution of the problem. This poster presents a number of Bayesian models for dealing with AHP-NDM in a global context, that is to say, a hierarchy. Its operative support uses: (i) the Bayesian Prioritization Procedure (BPP) proposed for a local context (one criterion) by Altuzarra et al. (2007) and (ii) Monte Carlo simulation techniques. The new approach has been applied to several case studies taken from the scientific literature. Their results are compared with those obtained from other multicriteria approaches in the AHP context.
José María Moreno-Jiménez1, Juan Aguarón, María Teresa Escobar and Alberto Turón
Grupo Decisión Multicriterio Zaragoza (http://gdmz.unizar.es), Facultad de Economía y
Empresa, Universidad de Zaragoza, Gran Vía nº 2, 50005 Zaragoza, Spain
Abstract. Firstly, this paper extends the decisional tool named Precise Consensus Consistency Matrix (PCCM) to the case of decision makers with different weights. Secondly, taking into account that one of the critical points of this decisional tool is that for some problems it is not possible to achieve a complete matrix because the consistency interval judgments of all the decision makers have a null intersection for one or more entries of the matrix, we analyse different options for achieving a complete common consensus judgement matrix, or for (at least) obtaining a matrix with the minimum number of entries that are required to derive the priorities. Finally, we compare the results obtained when applying the PCCM with those obtained using two traditional procedures (AIJ and AIP) in group decision making with the Analytic Hierarchy Process (AHP-GDM). In order to do this, we use a set of indicators that measure the consistency of the group pairwise matrices and the compatibility between the individuals and group positions with the analysis of the individual judgments and the group priorities.
Keywords: Analytic Hierarchy Process (AHP), Group Decision Making (GDM), Precise Consensus Consistency Matrix (PCCM), Compatibility, Consistency.
1 Corresponding author: José María Moreno-Jiménez, Facultad de Economía y Empresa, Gran
A new decision support system based on matrix representation for coali-tional analysis under unknown preference is designed for analyzing and solvingconflict when some decision makers cooperate. Unknown preference has beenincorporated into the graph model for conflict resolution to analyze coalitionalstabilities that were defined logically. However, as was noted in the developmentof the decision support system GMCR II, the nature of logical representationsmakes coding difficult. In this paper, four basic coalitional stabilities, CNash,CGMR, CSMR, and CSEQ, indexed a,b,c, and d, under unknown preference,are expressed using matrix forms. Compared with existing graphical or logicalrepresentation, matrix representation for coalitional analysis is more effectiveand convenient for computer implementation and for adapting to new analysistechniques. Therefore, an integrated decision support system with the functionto analyze these coalitional stabilities under unknown preference is developed.Existing decision support system GMCR II, is available for four basic stabilitiesand Nash coalitional analysis within simple preference only. The new decisionsupport system may deal with more complex strategic conflicts containing coali-tional analysis within unknown preference. The new system is illustrated in thispaper using an international environmental dispute, called the Gisborne Lakeconflict.
342
Preference Awareness in the negotiation preparation of
teams for fostering joint team priorities as a precondition