Page 1
1-1
UNIVERSITY OF NAIROBI
DEPARTMENT OF ELECTRICAL AND
INFORMATION ENGINEERING
PROJECT 3: GSM BASED DATALOGGING
SYSTEM
NAME: NGIGI DANIEL
ADM NO: F17/1787/2006
SUPERVISOR: MR. AHMED SAYYID
EXAMINER: DR. G.N. KAMUCHA
Page 2
1-2
DEDICATION
To my son Jeremy and my mother Margaret.
Page 3
1-3
ACKNOWLEDGEMENTS
First and foremost, I would like to thank God for giving me the strength and ability to carry
out this project.
I would also like to thank my supervisor, Mr. Ahmed Sayyid, for being a source of guidance
throughout the duration of the project. I would also like to thank all the lecturers and other
staff members who have assisted me during the course of my studies especially the workshop
technologists who have been of much help throughout the project‟s implementation period.
My appreciation goes out to my classmates for their suggestions and opinions on the project.
Lastly and most importantly, I would like to appreciate my family for their continuous
support during the course of my studies.
Page 4
1-4
DECLARATION AND CERTIFICATION
This is my original work and has not been presented for a degree award in this or any other
university.
………………………………………..
NGIGI DANIEL
F17/1787/2006
This report has been submitted to the Department of Electrical and Information Engineering,
The University of Nairobi with my approval as supervisor:
………………………………
Mr. Ahmed Sayyid
Date: ……………………
Page 5
1-5
ABSTRACT
The ability to record data from events and view the results at a place far away from where the
event is occurring is very essential and can be applied in many areas such as weather stations
to monitor various climatic conditions, industries to monitor changes in industrial processes
and to record changes in laboratory experiments. This project handles the design and
implementation of a system that reads analog or digital voltage from the output of a sensor.
The sensor output voltage must satisfy the conditions that 0v represents the lowest value of
the event to be monitored, 10v represents the highest value of the event to be measured and
the voltage output of the sensor is linear for all values of the event to be measured. The
voltage output is attenuated, using a signal conditioning circuit, to a voltage range compatible
with the MSP430G2553 microcontroller. The MSP430G2553 converts the conditioned
voltage signal to a decimal number and sends the decimal number through a G.P.R.S. module
to a PHP server. The PHP server processes the data and displays the results on a website
which can be accessed by a user over the internet.
Page 6
1-6
Contents 1 INTRODUCTION ............................................................................................................................ 1-7
1.1 Problem Definition ............................................................................................................... 1-7
1.2 Objectives............................................................................................................................. 1-8
1.3 Justification .......................................................................................................................... 1-8
1.4 Scope .................................................................................................................................... 1-9
2 LITERATURE REVIEW .................................................................................................................. 2-10
2.1 Data loggers ....................................................................................................................... 2-10
2.1.1 Sensors and transducers ........................................................................................... 2-10
2.1.2 Field wiring ................................................................................................................ 2-11
2.1.3 Signal conditioning .................................................................................................... 2-11
2.1.4 Data Converter ........................................................................................................... 2-12
2.1.5 Data Transmission system ......................................................................................... 2-15
2.1.6 Data storage and display hardware ............................................................................ 2-20
3 METHODOLOGY ......................................................................................................................... 3-21
3.1 System specifications ......................................................................................................... 3-21
3.2 The system Design Process ................................................................................................ 3-23
3.2.1 Introduction ............................................................................................................... 3-23
4 ANALYSIS AND RESULTS ............................................................................................................. 4-26
4.1 Simulation Results .............................................................................................................. 4-26
4.2 Configuring the Data Logger .............................................................................................. 4-29
4.3 Results from the website ................................................................................................... 4-29
5 CONCLUSIONS AND RECOMMENDATIONS ................................................................................ 5-32
5.1 Conclusion .......................................................................................................................... 5-32
5.2 Recommendations for future work ................................................................................... 5-33
6 Bibliography ............................................................................................................................... 6-34
7 APPENDIX ................................................................................................................................... 7-35
7.1 APPENDIX A: Program code ............................................................................................... 7-35
7.1.1 Energia Program ......................................................................................................... 7-35
7.1.2 Webserver program ................................................................................................... 7-39
Page 7
1-7
1 INTRODUCTION
[1]A data logger is an electronic device that records data over time. Data can be recorded
manually or electronically. In manual recording of data a user observes an event and enters
the results on a paper or in a computer. In electronic recording of data an electronic device
records data periodically to a storage device and displays the data to a user when the data is
required. To introduce the basis of this project the problem to be solved by designing and
implementing this system is defined, the objectives to be achieved by building such a system
are set out, the need to build such a system is justified by looking at the limitations of other
systems currently available and how the current system overcomes such limitations.
1.1 Problem Definition
[1]Recording of data is very important for purposes of monitoring and future analysis of
physical, chemical and biological systems. Recording of data finds application in areas such
as:
At weather stations to monitor the wind speed, wind direction, temperature and
humidity.
In greenhouses to monitor the soil moisture level, temperature, humidity and light
intensity.
Road traffic counting.
In industries to monitor the processes where temperature readings, liquid level, gas
level and energy consumption can be recorded over time.
At electrical substations to record the line voltages, currents and power factor of the
three-phase lines.
In scientific investigations and monitoring of changes in scientific experiments.
Recording of energy consumption from energy meters.
In most cases a user wants to view the recorded data from a place away from where the data
is being recorded. A good example is a weather forecaster in Nairobi would want to know the
hourly temperature values in a weather station in Mombasa in order to formulate a weather
forecast schedule for Mombasa town on the following day. Such a problem requires the
design of a system that acquires such data from the weather station in Mombasa and makes it
accessible to the weather forecaster in Nairobi. The system should also be flexible as not all
users want to record similar types of events. The data logger has to accept both analog and
digital voltages as sensors currently in the market have both digital and analog voltage
outputs.
Page 8
1-8
1.2 Objectives
The main objective of the project are to design and implement a system that records data
from events and displays the data on a website. Specifically, the system should be able to
accomplish the following functions:
Get analog voltage from analog sensor output.
Get digital pulse voltage from a digital sensor output.
Condition the signals in 1 and 2 above into a voltage range that the MSP430G2553
microcontroller can accept at its input.
Convert the analog or digital pulse voltage to a decimal number and avail this decimal
number to a G.P.R.S. module interfaced with the microcontroller.
Send the data availed to the G.P.R.S. module to a webserver so that any user can
access it over the internet from any place in the world.
1.3 Justification The system to be designed seeks to overcome the limitations in the means of recording of
data that currently exist. The means for recording data can be manual or electronic. Manual
logging of data has the following limitations:
Requires dedicated human presence.
Bulky records, especially in paper based systems.
Prone to human error.
Difficult to retrieve records especially in paper based system.
Tedious in collection of repetitive data.
Most available electronic means of recording data have some or all the following
limitations:
They record data serially to a dedicated PC connected to the data logger. This has
limitation that availability of data is dependent upon the status of the PC. If the PC
goes off the data is made unavailable. The PC also requires a dedicated supply of
power which might be unavailable in remote locations such as in upcountry weather
stations. In case the data is to be made available to a user remotely the P.C. needs to
be connected to the internet and the data rates needed to convey such data from a PC
to a website are a bit high (> 100kbps) making the systems inapplicable in areas with
low internet connection speed. The length of the serial cable gives a limited range
within which the data logger can be placed away from the PC. Other means of
transmitting data, such as Wi-Fi, Zig-bee and Bluetooth, from have a limited range of
use.
Standalone data loggers that only record data in a storage device such an SD card
connected to the data logger have the limitation that the user has to be near the data
Page 9
1-9
logger to read the recorded results.
The other limitation is that standalone data loggers have limited available space for
storage of data.
Data loggers commercially available are mostly specific to the recording of one type
event. If a user buys a data logger to record temperature, he/she cannot re-use the data
logger to monitor another event later such as humidity.
The system designed in this project overcomes the above limitations as:
Recording data to a website via a G.P.R.S. network makes the data available to any
user situated anywhere in the world where there is an internet connection.
Once installed it operates unattended doing away with the need for dedicated human
presence.
The data logger can be used to record different types of events provided their sensor
outputs satisfy the (0-10v) voltage range and linearity conditions. This offers a wide
range of application and re-usability.
Recording data on a webserver utilizes the large storage capacity of computer servers
thus one can log data over a long period of time.
It is easy to use and process the data availed on the website using commercially
available software such as Ms. Excel.
These reasons make it viable to design and implement the system for which this project
entails.
1.4 Scope
The project will be limited to only the collection, processing, transmission and displaying of
the data. This will be achieved by reading an analog voltage or a digital pulse voltage within
the range of 0-10v from a signal generator and, converting the data to a decimal number
using a microcontroller, transmitting the decimal number streams using a G.P.R.S. network
and displaying the data logs on a website.
The project does not involve the analysis or design of a control system that will modify the
source of the data on the basis of the data recorded.
The project also assumes that the user will have conditioned his sensor output such that it is
linear for all ranges of values of the sensor output.
Page 10
2-10
2 LITERATURE REVIEW
2.1 Data loggers
Data loggers are electronic devices that transform physical events from the real world into
electrical signals that are measured and converted into a digital format for processing,
analysis and storage. Data loggers consist of the following elements: [1]
Sensors and transducers
Field wiring.
Signal conditioning circuit.
Data converter.
Data transmission system.
Data storage and display hardware
Primarily, data recording systems are categorized depending on:
The Physical phenomenon for which they are being used for e.g. a meteo-logger is a
data logger used to record weather conditions.
The means by which they process the data e.g. p.c. digital signal processing or data
processing using a microcontroller.
The means through which they transmit data e.g. Wi-Fi-data logger, G.S.M.-based
data logger, Bluetooth based data logger.
The means by which they store and display data e.g. stand-alone data logger with an
L.C.D. display, a web-based data logger, a pc-based data logger system.
The location of the place the data is being displayed in relation with the place the
event is taking place that is remote or local data loggers.
2.1.1 Sensors and transducers [1]
A transducer is a device that converts a signal in one form of energy to a different form of
energy. A sensor is a transducer that converts a measurable quantity into an electrical voltage
or current.
Sensors are the actual interface that converts the physical phenomenon into electrical signals
that can be processed. Sensors are classified as:
Active or passive. Active if the majority of the output power is provided from an
external source of power, passive if the output power is almost entirely drawn from
the measured signal.
Analog or digital, analog if the output is continuous and proportional to the measured
Page 11
2-11
signal, digital if the output is a pulse or binary. Analog signals are characterized by
their signal level, shape and frequency. Digital signals are characterized by the
state/level of the signal and the rate at which the signal changes its state.
Primary input quantity: Commercially available sensors can measure a wide range of
physical phenomena. The following are a few of the physical phenomena and the
sensors that are used to measure them;
Temperature - Thermocouple, Thermistors, IC sensors.
Force and pressure - Strain gauge, piezo-electric transducer.
Acceleration - Accelerometer
Water flow - Flow-meter
Sound - Microphone
The choice of a sensor is dictated by the accuracy needed, environmental conditions such
as temperature and humidity of where it will be placed, the range of the sensor, the
resolution of the sensor and cost.
2.1.2 Field wiring [1]
This is the physical connection between the sensors and the signal conditioning circuit. This
component of the system is very susceptible to the effects of noise from external sources
especially in industrial environments. The sensor outputs are usually very slowly varying
signals and noise interference can result in very large errors in the input signal applied to the
signal conditioning circuit. The cables used in the field wiring need to be properly grounded
and shielded to minimize the effects of noise.
2.1.3 Signal conditioning [1] [2]
Signal conditioning is the conversion of signals generated by a transducer to a form that can
be accepted by the data processor. Signal conditioning is done mainly through:
2.1.3.1 Filtering
In noisy environments such as industries the sensor outputs are affected by noise by the time
they get to the signal conditioning circuit. The noise must be filtered out so as not to distort
the desired signal. This is done by using low pass filters which eliminate high frequency
noise signals.
2.1.3.2 Amplification
The signals generated by the sensors need to be amplified to increase the resolution of the
signal to be processed. The maximum resolution can be achieved by amplifying the
maximum voltage swing of the sensor output to a level equal to the input range level of the
data processing circuit. When designing the circuit, the amplifier should be placed as close as
possible to the sensor to minimize the effects of external noise.
Page 12
2-12 2.1.3.3 Linearization
Some sensors, such as the thermocouple, have a non-linear relationship with the physical
event they are to measure. The sensor output thus needs to be linearized so that a change in
the physical phenomenon translates to a change in the signal applied to the data processor.
2.1.3.4 Isolation
If there is a possibility of high voltage transient such as when using a sensor to monitor high
voltage transmission lines, isolation should be provided to protect the data logger from
damage. This is particularly important in application where such an output is connected to a
pc where such a transient can lead to injury to the computer user and damage to the
equipment.
2.1.3.5 Excitation
Active sensors require an external source of power. This can be provided by the signal
conditioning circuit.
2.1.4 Data Converter
The data converter is where the electrical signal obtained from the signal conditioning circuit
is converted into a binary, decimal, octal or hexadecimal form that can be accepted by digital
transmission, storage and display devices. Data conversion can be done in two ways; pc
based or standalone. If the data acquired is processed by a standalone system, the system is
known as a data logger. If the data acquired is to be processed by a dedicated pc tethered to
the system, then the system is a data acquisition system only. The output of the data logger is
in a form that can be interpreted by the user and needs no further processing by the pc. While
a data acquisition system feeds binary data to the pc which must be processed in software
before being availed to the intended user.
2.1.4.1 PC/Server Based [1]
Here the data collected is processed by a dedicated pc connected to data acquisition system.
PC based data processing has the following advantages;
a) Real time data visualization: Data can be viewed as it is being written to the drive.
b) Inline analysis: due to the high processing power of the multicore processors and
RAM one can easily analyze and process data simultaneously.
c) User defined functionality: By editing the software in the pc one can easily customize
the functionality of the data acquisition system.
d) Storage: It is easy to store huge data logs in hard disk drives attached to the pc or in a
cloud server.
e) Network connectivity: Once the data is processed by the pc it can be availed to a
Local area network or to the internet easily.
2.1.4.2 Standalone [1]
In a standalone data logging system, the data is entirely processed by the device. Standalone
Page 13
2-13
data loggers are based on a microcontroller. The processing of the data collected takes place
in the microcontroller.
2.1.4.2.1 Microcontrollers
2.1.4.2.1.1 Definition
A microcontroller is a programmable digital processor with necessary peripherals on chip.
2.1.4.2.1.2 Basic structure of a microcontroller
A typical microcontroller has functional blocks that carry out the functions below: [3]
a) The C.P.U. is the central processing unit. The C.P.U. scrutinizes and manages all
processes that are carried out in the microcontroller. This is done by interpreting and
carrying out the programs stored in the R.O.M. It consists of several smaller subunits
the most important being;
i. Instruction decoder which recognizes program instructions and runs the other
circuit based on the instructions. The capabilities of this circuit are expressed
in the „instruction set‟ which is different for different microcontroller families.
ii. Arithmetical logical unit (ALU) which performs all mathematical and logical
operations on data.
iii. Accumulator is a special function register used for storing all data upon which
some operations should be executed. It also stores results for which further
processing is required.
b) Interrupt control which handles interrupts. An interrupt is a sub-routine call that
changes the sequence of execution of the microcontroller programs so that the
microcontroller can perform some other program which is extra important at the time.
c) The Read Only Memory (R.O.M) stores a set of commands known as a program. This
program instructs the microcontroller to perform specific tasks.
d) The Random Access Memory (R.A.M.) is a storage space which momentarily stores
data during the execution of a program.
e) A bus is a group of wires carrying information with a common purpose. There are
three types of buses: Address bus which carries the address of a specific location, data
bus which carries information between the C.P.U. and memory or I/O devices and
control bus which carries the control signals from the C.P.U. to synchronize the
movement of information on the address and data bus. I/O ports enable us to connect
the microcontroller to peripheral devices.
f) The oscillator generates even pulses which enable harmonic and synchronous
operation of all circuits within the microcontroller.
Page 14
2-14
g) Timers/counters: These are special function registers which are automatically
incremented during the execution of a program.
2.1.4.2.1.3 Classification of microcontrollers
There are millions of microcontrollers that have been manufactured to date. This makes it very
difficult to explicitly classify them as many of them are made specific to a given application.
Nevertheless, when one is designing a system that incorporates a microcontroller the main
considerations one has to consider are:
2.1.4.2.1.3.1 Hardware architecture
Hardware architecture is how the various components in the microcontroller relate with each other.
There are two main architectural categories which differ in the way data and programs are accessed.
They are:
a) Von-Neumann
/Princeton architecture [4]
Microcontrollers based on this architecture have a single bus for fetching instructions and data.
Program instructions and data are stored in a common main memory. If the microcontroller wants
to process data stored in the memory, it first fetches the instruction, and then it fetches the data to
support the instruction. Thus for a single operation we need at least two fetches which slows up the
microcontroller’s operation. The main advantage of this architecture is that it simplifies the
microcontroller design because only one memory is needed. An example of a microcontroller that
uses the von Neumann architecture is the Motorola 68hc11.
b) Harvard
architecture [4]
In the Harvard architecture, the microcontroller’s instruction bus is separate from the data bus.
Program instructions and data are also stored on different memory spaces. With this architecture as
the next instruction is being fetched, the current instruction is being executed. This leads to a much
faster execution as compared with the Princeton architecture but this is achieved at the expense of
hardware complexity. Most microcontrollers available in the market use the Harvard architecture.
Examples of microcontrollers using the Harvard architecture are the PIC microcontrollers.
2.1.4.2.1.3.2 Instruction bus width
Here the microcontrollers are divided depending on whether the ALU performs arithmetic and
logical operations on a nibble, byte, word or double-word per instruction. If the operation is on a
nibble then the microcontroller is a 4-bit microcontroller. If the operation is on a byte then the
microcontroller is an 8-bit microcontroller, if it’s on a word then it is a 16-bit microcontroller and if
it’s on a double-word then it’s a 32-bit microcontroller. The computing power increases with the
more n-bits that one can process thus making the 32-bit microcontroller the most powerful in terms
of computing performance and the 4-bit microcontroller the least powerful.
2.1.4.2.1.3.3 Instruction set architecture
Instructions are specific commands ordered which if executed in a specific order carry out a
desired task. All commands available for a given microcontroller are known as an instruction
set. Instruction set architecture is the interface that allows for easy communication between
software and hardware. The performance of any architecture can be evaluated using the
Page 15
2-15
formula: Time/program = instructions/program * cycles/instruction * time/cycle.
There are two main types of instruction set architecture:
a) Complex instruction set computer (C.I.S.C.). [4]
In CISC architecture the instruction set is large and easy to use. The CISC
architecture increases performance by reducing the number of overall instructions.
This is done using a microcode that handles complex instructions and tells the
processor what to do with them. The instructions in CISC require many clock cycles
to implement a single instruction.
b) Reduced instruction set computer (R.I.S.C.) [4]
RISC architecture has a small but efficient instruction set. It doesn‟t have a micro
code engine. RISC architecture uses less complex instructions over multiple times to
carry out a program. Every instruction takes one clock cycle to implement.
2.1.4.2.1.3.4 Included Features
Important features include an inbuilt ADC that is very important in applications where we
need to convert data from analog to digital format, built-in program flash memory which is
important if we need to rewrite the program in the microcontroller, facility to interface with
external memory, timers especially a watchdog timer and the available interrupts.
2.1.4.2.1.4 Application of microcontrollers
Some of the well-known microcontroller applications include the following:
Robotics
Aerospace
Automobiles(climate control, diagnostics, engine control)
Environmental control (greenhouse, factory)
Appliances (television, stereos, microwave oven and refrigerators)
Instrumentation
2.1.4.2.1.5 The MSP430G2553 [5] [6] [7]
[3] The MSP430G2553 is a microcontroller manufactured by Texas instruments. Its CPU is
based on the von-Neumann architecture and has a RISC instruction set architecture. It has 16-
bit registers and a clock that can operate up to a frequency of 16MHz. There are two
programming environments available for the msp430g2553; the energia IDE and the code
composer studio IDE.
2.1.5 Data Transmission system
The data transmission system relays the processed data to the intended user. The means for
Page 16
2-16
transmitting data is either through a wired or wireless connection.
2.1.5.1 Wired communication
This can be done using a serial cable or an Ethernet cable. The main advantage of having a
wired connection is that the cables tend to be less expensive as compared to the wireless
equipment needed for a wireless connection. The main drawback for wired connection is that
there has to be a physical connection between the data acquisition device and the PC where
the data is being recorded.
2.1.5.2 Wireless communication
There are different means of wireless communication standards that can be used with a data
logger. These are:
2.1.5.2.1 Bluetooth communication
Bluetooth is a wireless network for short range communication which falls under the IEEE
standard: IEEE 802.15.1. Bluetooth transmission in a data logger is done by using a
Bluetooth module connected to the microcontroller. Bluetooth module has a limited broadcast
range thus the receiver of the data must be stationed at a close distance to the microcontroller.
2.1.5.2.2 Cellular Communication [4]
This is a means of communication through a wireless network distributed over land areas
called cells, each served by at least one fixed-location transceiver, known as a base station.
There are different mobile technologies available for mobile communication. In Kenya the
mobile service providers have the following technologies which can be used with a data
logger for the transmission of data. They can be classified into messaging services and data
services.
2.1.5.2.2.1 Messaging services
2.1.5.2.2.1.1 Groupe Spe’ciale Mobile (G.S.M.) [5]
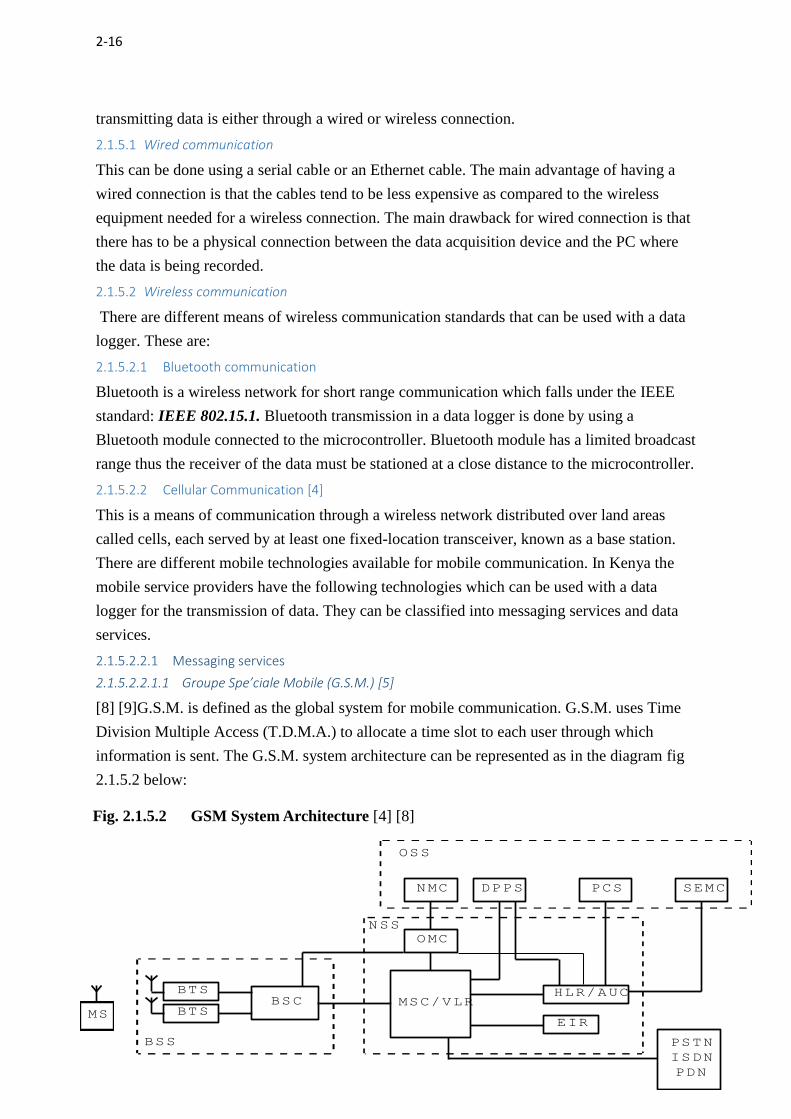
[8] [9]G.S.M. is defined as the global system for mobile communication. G.S.M. uses Time
Division Multiple Access (T.D.M.A.) to allocate a time slot to each user through which
information is sent. The G.S.M. system architecture can be represented as in the diagram fig
2.1.5.2 below:
MS
BTS
BTSBSC
BSS
OMC
MSC/VLR
NMC
EIR
HLR/AUC
DPPS PCS SEMC
OSS
PSTN
ISDN
PDN
NSS
Fig. 2.1.5.2 GSM System Architecture [4] [8]
Page 17
2-17
The G.S.M. network system consists of three subsystems:
a. The Radio Subsystem [8]
The radio subsystem consists of the mobile station (MS) and the base station subsystem
(BSS). [4]
The Mobile station comprises of the mobile equipment such as a mobile handset and
the Subscriber Identity Module. The mobile equipment provides the interface
between the network and the user. It contains the audio, visual and data entry tools
required for the effective interaction between the user and the network. The S.I.M.
card is a small memory device that stores the identification information specific to a
network user. It can also store messages, phone numbers and authentication codes.
The base station subsystem (BSS) consists of the base station controller (BSC) which
controls the radio network, the base transceiver station (BTS) which maintains an air
interface between the mobile station and the base station subsystem and ciphers
circuit-switched data.
b. Network Switching Subsystem [4] [5]
The second subsystem is the Network Switching Subsystem consists of:
The Mobile Switching Centre (MSC) responsible for controlling calls and messaging
in the mobile network
The Home Location Register (HLR) which maintains a permanent register of the
subscribers and keeps track of their current location
The Visitor Location Register (VLR) which contains information about the
subscribers currently within the service area of the MSC.
The Authentication Centre (AuC) which verifies the security information on the SIM
card and ciphers the information being transmitted over the air interface,
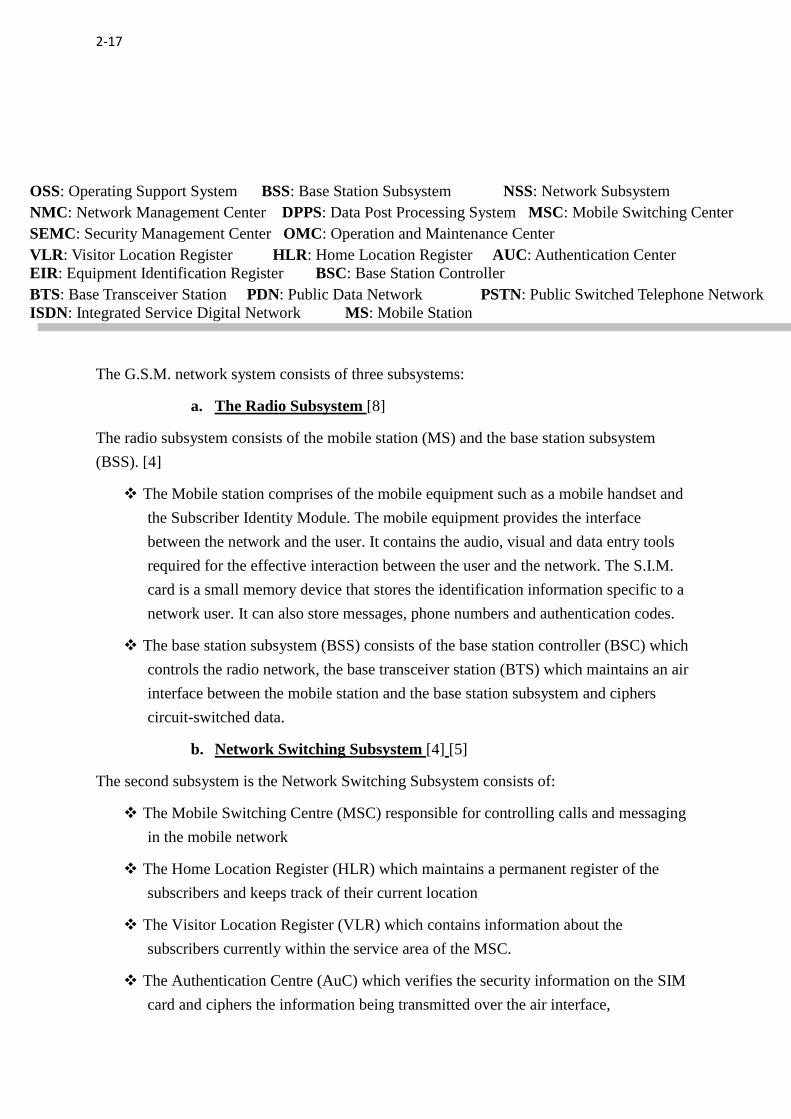
OSS: Operating Support System BSS: Base Station Subsystem NSS: Network Subsystem
NMC: Network Management Center DPPS: Data Post Processing System MSC: Mobile Switching Center
SEMC: Security Management Center OMC: Operation and Maintenance Center
VLR: Visitor Location Register HLR: Home Location Register AUC: Authentication Center
EIR: Equipment Identification Register BSC: Base Station Controller
BTS: Base Transceiver Station PDN: Public Data Network PSTN: Public Switched Telephone Network
ISDN: Integrated Service Digital Network MS: Mobile Station
Page 18
2-18
The Equipment Identification Register which checks for the International Mobile
Equipment Identity (IMEI) of the mobile equipment thus verifying the validity of the
mobile equipment.
c. Network Management Subsystem (NMS) [4]
The third subsystem is the Network Management Subsystem (NMS) consists of a
number of workstations, servers and routers which connect to a data communication
network (DCN) connected to the other two subsystems. The network management
subsystem monitors various functions and elements of the network. It ensures the
smooth operation of the network, maintains up-to-date information of the status of
the network elements and collects data that helps to evaluate the performance of the
network.
2.1.5.2.2.1.2 Code Division Multiple Access (C.D.M.A.) [8]
In C.D.M.A. each user is assigned a unique code that differentiates one user from
the other users. The architecture of the C.D.M.A. system is similar to that of the
G.S.M. system. The main difference being the communication between the mobile
station and the base station subsystem uses C.D.M.A. instead of T.D.M.A. Only
one mobile service provider operates a C.D.M.A. and the network is unavailable
in very remote regions.
2.1.5.2.2.2 Data services [6] [4]
In data services transmission information is grouped into packets that are then sent
through a network. The technologies available under this category are General packet
radio service (GPRS), Enhanced Data rates for GSM Evolution (EDGE) and
Universal Mobile Telecommunications System (U.M.T.S.).
a. In G.P.R.S. mobile system the information is grouped into packets that are
then transmitted through a network. The G.P.R.S. is based on the G.S.M. and
uses time division multiplexing for allocation of the channel through which
data is sent. [10] [8] [9]
The modifications needed for the G.S.M. network analyzed above to operate
as a G.P.R.S. network by providing packet switched data services the
following modifications are needed:- [5]
The addition of network nodes called GSNs (GPRS Support Nodes)
which are responsible for the routing and delivery of the data packets
to and from the MS and external packet data networks (PDN). There
are two main nodes that perform these functions. The Serving GPRS
Support Node (SGSN) and the Gateway GPRS Support Node (GGSN).
The SGSN is the node that serves the mobile station‟s needs. G.P.R.S.
Page 19
2-19
users are mobile users who need an active connection for the time they
are accessing the network. The SGSN establishes a mobility
management context for an attached MS and ciphers packet-switched
data. The GGSN with the help of the HLR is capable of routing
packets to the current location of the mobile station.
The addition of a packet control unit (PCU) and a channel coding unit
(CCU). The PCU discriminates circuit switched data from packet
switched data while the CCU recognizes the user‟s needs whether it‟s a
voice, messaging or data service request and manages how the channel
will be utilized for phone calls bursty packet data phone calls and
messages for different G.P.R.S. users.
The home location register, the visitor location register and the
databases have to be upgraded to handle the data functions of G.P.R.S.
The BSC and the BTS requires a software upgrade and the PCU to be
added to the BSC.
The following interfaces need to be added for effective communication
of the units which have been added or modified. Gb between the PCU
and SGSN using Frame Relay, Gr between SGSN and HLR
Application Part (MAP), Gn between SGSN and GGSN using the
GPRS Tunneling Protocol (GTP) which manages tunneling of user
packets, Gi Between GGSN, Packet Data Networks (PDNs) and the
Internet Protocol (IP), Gs Between SGSN and MSC/VLR, for some
simultaneous GPRS and GSM operations, Gd Delivers SMS messages
via GPRS and Gc Between GGSN and the HLR.
The advantage of the G.P.R.S. network over the G.S.M. is that it has faster
data rates. Sending the data collected using a G.P.R.S. network is cheaper than
sending the same data as text messages. In Kenya a reliable G.P.R.S.
connection is available in most areas of the country. This makes G.P.R.S. the
best mode of transmission of data in most areas of the country.
b. [9]E.D.G.E. is an improvement of the G.P.R.S. system with better data rates.
The EDGE network in Kenya covers a large area than the C.D.M.A. network
but less than the G.P.R.S. network.
c. [9]U.M.T.S. is a third generation network that uses wideband code division
multiple access (W-C.D.M.A.). It offers better data rates than all the above
networks but it‟s coverage is only limited to major towns and the connection
is not reliable at most times.
Page 20
2-20 2.1.5.2.3 Wi-Fi Communication
Wi-Fi is a wireless local area network communication system that allows
electronic devices to exchange data or to connect to the internet using radio waves.
The Wi-Fi networks are based on the I.E.E.E. standards 802.11. A data logger can
use a Wi-Fi network to transmit data to a webserver, storage or display device by
connecting a wife module to the microcontroller. The range of Wi-Fi is limited
thus the device that the data is being sent to must be close to the data logger.
2.1.5.2.4 Zig-bee communication
Zig-bee is a standard, IEEE 802. 15. 4, that defines a set of communication
protocols for low data rate up to 250 kbps short range wireless networks. The
advantage of zig bee over the other wireless network is that a zig bee module only
utilizes power when in use but it goes to sleep mode when not in use. The zig
range is limited thus it has the limitations discussed under Bluetooth
communication.
2.1.6 Data storage and display hardware
Data can be stored in a memory location in a pc such as a hard drive or in a memory device
such as an sd card connected to the microcontroller. The data thus stored can be displayed
using a liquid crystal display (lcd) or light emitting diode (led) screen connected to the
microcontroller, a display monitor connected to a pc or using a mobile device (such as a
phone or tablet) screen.
Storing data in a PC or webserver has the advantage of having virtually unlimited space for
storage of data as opposed to storing the data on a memory device attached to a standalone
data logger.
Displaying data on a website makes the data available worldwide provided the user of the
data has a device that can access the internet.
Page 21
3-21
3 METHODOLOGY
3.1 System specifications
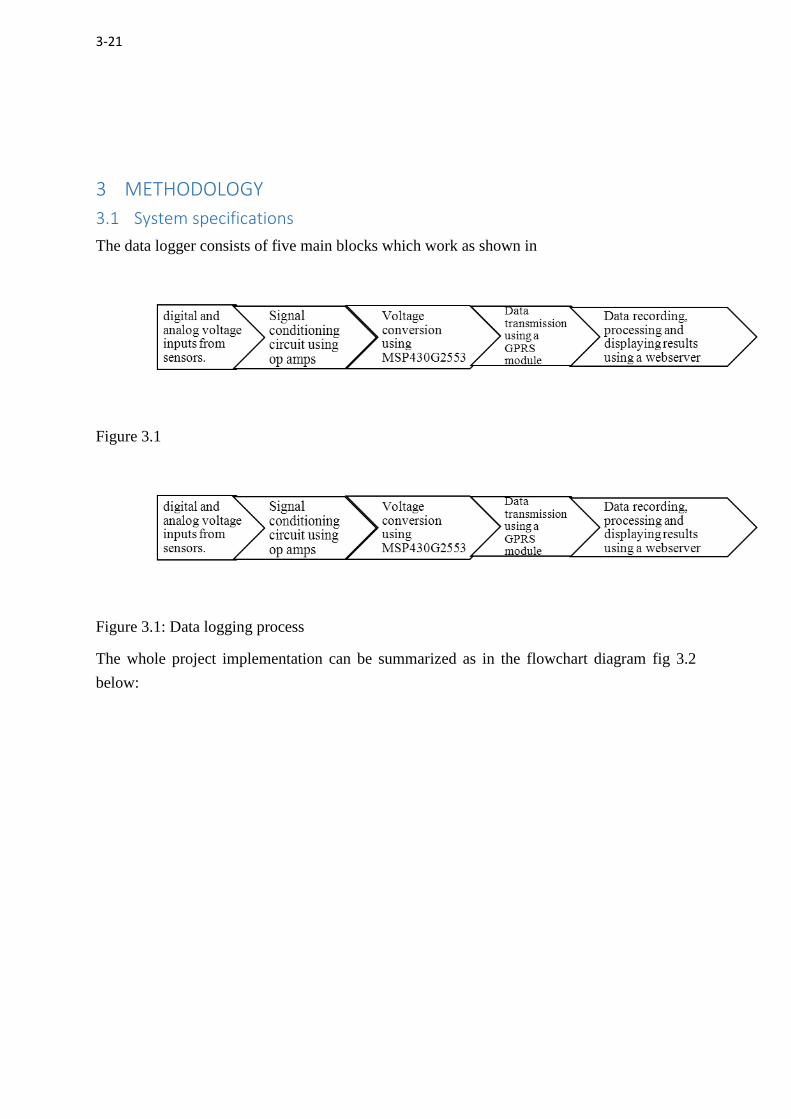
The data logger consists of five main blocks which work as shown in
Figure 3.1
Figure 3.1: Data logging process
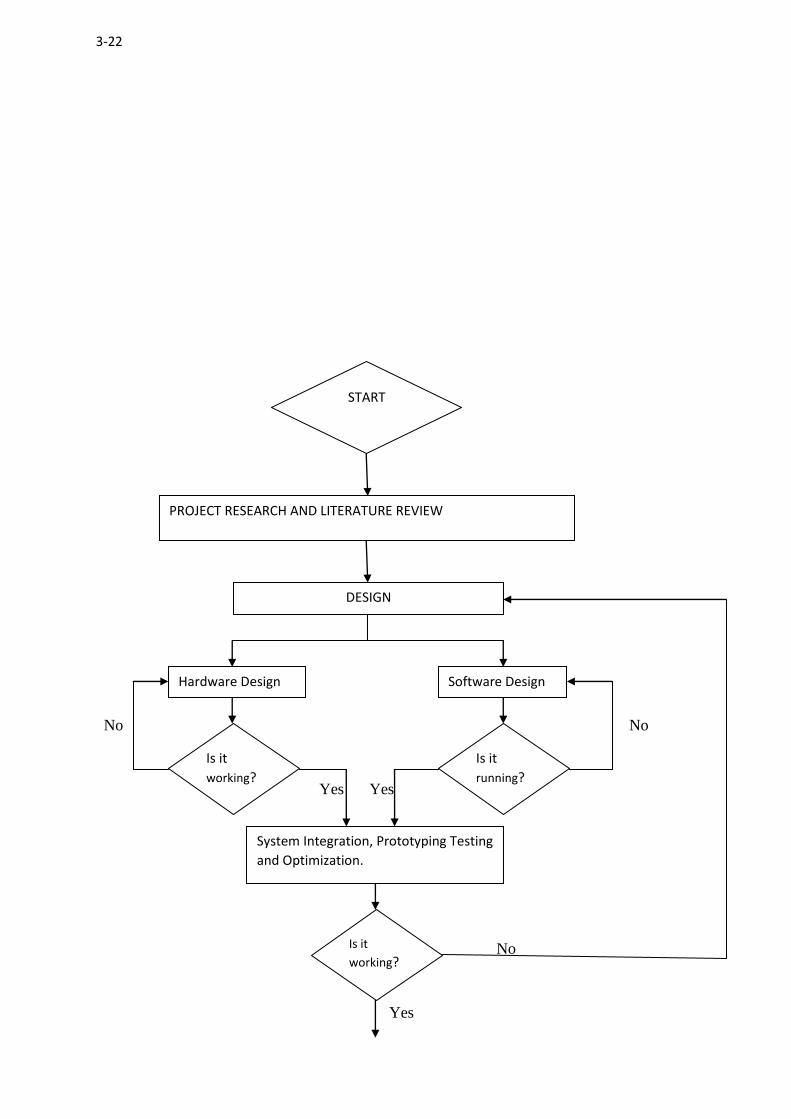
The whole project implementation can be summarized as in the flowchart diagram fig 3.2
below:
Page 22
3-22
No No
Yes Yes
No
Yes
START
PROJECT RESEARCH AND LITERATURE REVIEW
DESIGN
Software Design Hardware Design
Is it
working?
Is it
running?
System Integration, Prototyping Testing
and Optimization.
Is it
working?
Page 23
3-23
Fig: 3.2
3.2 The system Design Process
3.2.1 Introduction
The process of designing the data logger was done in three stages:
i. Hardware Design
ii. Software Design
iii. System Integration
3.2.1.1 Hardware Design
The circuitry for the data logger can be divided into three parts:
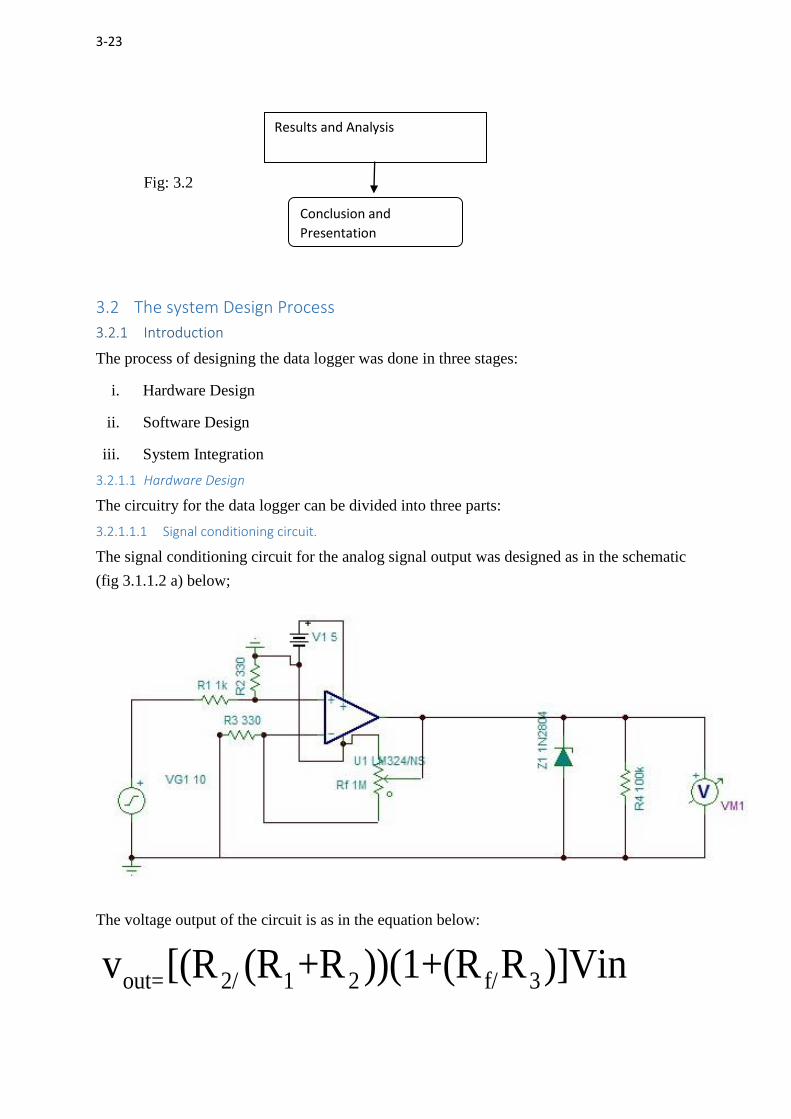
3.2.1.1.1 Signal conditioning circuit.
The signal conditioning circuit for the analog signal output was designed as in the schematic
(fig 3.1.1.2 a) below;
The voltage output of the circuit is as in the equation below:
Results and Analysis
Conclusion and
Presentation
out= 2/ 1 2 f/ 3v [(R (R +R ))(1+(R R )]Vin
Page 24
3-24
The feedback resistor, Rf, was implemented using a potentiometer so that the circuit could
have different values of maximum input voltages.R2 = 330Ω, R1 = 1kΩ R3=330Ω. The
following are the ranges of input voltages, the value of Rf that gives us an output of 2.5V and
the allowable bandwidth of the input signals.
The absolute bandwidth of the input signals was obtained from the open loop frequency
graph which has values of voltage gain in dB against the bandwidth of the signals. With the
open loop gain, Ao(dB)=20log( f/ 31+(R R ) )) the bandwidth was read from the open loop
frequency graph of the LM324 available from the datasheet [7].
Vin(V) Rf (Ω) Bandwidth(Hz)
10 2.5 1M
5 335 500k
1 1k 400k
100m 33k 10k
10m 332k 1k
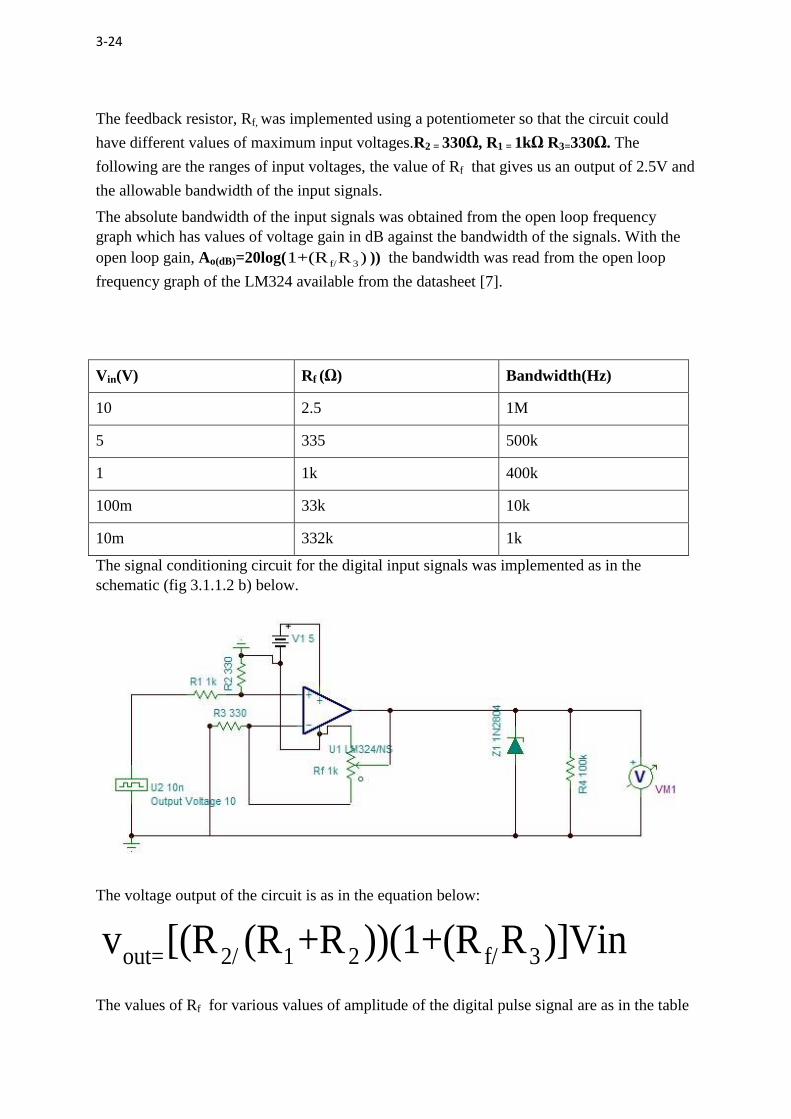
The signal conditioning circuit for the digital input signals was implemented as in the
schematic (fig 3.1.1.2 b) below.
The voltage output of the circuit is as in the equation below:
The values of Rf for various values of amplitude of the digital pulse signal are as in the table
out= 2/ 1 2 f/ 3v [(R (R +R ))(1+(R R )]Vin
Page 25
3-25
below.(fig. 3.1.1.2.c)
Vin(V) Rf (Ω)
10 2.5
5 335
fig. 3.1.1.2.c
3.2.1.1.2 Data conversion and transmission circuit.
The circuit for processing and transmission of data comprises of the MSP430G2553
microcontroller from Texas instruments and the SIM 900 GSM/GPRS module from
Itead Studio. The msp-exp430g2 software UART channels P1.3 and P1.4 were
connected to the Rx and Tx pins of the G.P.R.S. module respectively. The reasons why
the msp430g2553 was used are [3] [8]:
Low power consumption taking into account that the data logger is powered
using a battery.
16-Bit RISC Architecture with 62.5ns cycle time enabling the microcontroller
to convert analog to digital signals within a short time.
Internally calibrated stable analog voltage reference useful when sampling
analog signals.
The programming environment energia I.D.E. is easy to use as compared to
other I.D.E.s available for the other microcontroller.
The MSP-EXP430G2 launchPad that is sold together with the msp430g2553
has a software serial port that makes it easy to interface it with the SIM900
G.P.R.S. module.
14 digital input or output pins and 8 analog input pins were available for use.
Cheaper than other alternatives at Kshs. 890 for the Launchpad and two
microcontrollers.
The G.P.R.S. module from Itead studio was used because: [9]
It was locally available.
The AT commands available in the sim-com AT command manual are easy to
understand and use. [12] [13]
It supports the http protocol which makes it easier to send data from the module to
a webserver.
Low power consumption.
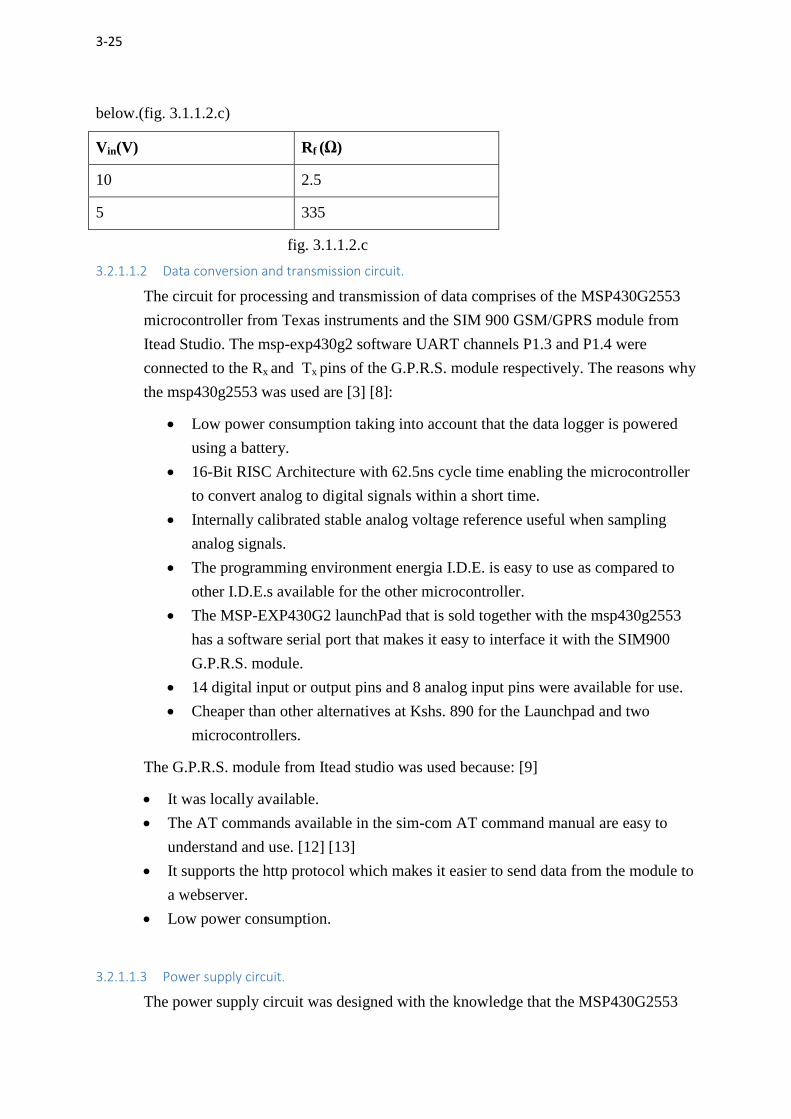
3.2.1.1.3 Power supply circuit.
The power supply circuit was designed with the knowledge that the MSP430G2553
Page 26
3-26
micro-controller operates at a bias voltage of 3.3v and the G.P.R.S. module and the op
amps in the signal conditioning circuit operate with a bias voltage of 5v. There arises
a need to have a power supply unit that delivers the required bias voltage for each of
the components. The data logger user can choose to power the data logger using the
power supply unit or a 9V battery. The battery voltage is regulated using the lm7805
to provide 5V bias voltage for the G.P.R.S. module and the op amp and regulated to
3.3v to provide 3.3v bias voltage for the
msp430g2553.
3.2.1.2 Software Design
The software design involved the writing of programs that will be executed by the
microcontroller, the G.P.R.S. module and the web server.
The software design can be divided into two different implementations:
3.2.1.2.1 Microcontroller Program
The microcontroller program was developed in the c language and was compiled,
verified and uploaded to the MSP430G2553 using the Energia software. The program
involves the conversion of the sensor voltages (from the output of the signal
conditioning circuit) to decimal numbers that can be transmitted using the G.P.R.S.
module and the program that instructs the G.P.R.S. how to handle the data that has
been forwarded to it by the MSP430G2553. This is made possible by the use of AT
commands [10] for the SIM900 module. The AT commands used in the program were
picked from the SIM 900 AT command manual [10]. The program is as in the
appendix.
3.2.1.2.2 Web server Program
The program for the website was written in the PhP [13] web programming language
and the database for storing the data collected was created using MySQL. The
program thus written is contained in the appendix.
3.2.1.3 System Integration
The signal conditioning circuit, the power supply circuit, the Launchpad and the
Page 27
4-27
G.P.R.S. module were connected together to form the data logger circuit. The
programs for the server and the microcontroller were ran and after numerous
debugging and troubleshooting instances the circuit did work as desired.
4 ANALYSIS AND RESULTS
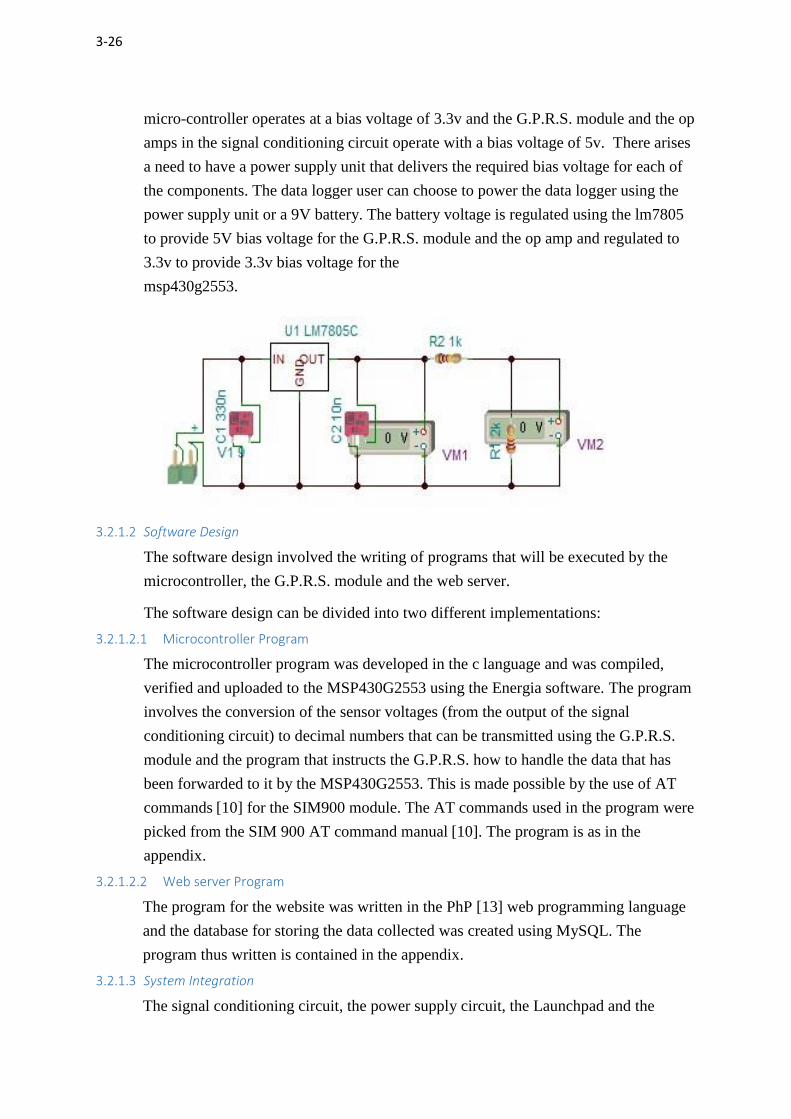
4.1 Simulation Results
The simulation results for the power supply circuit are as in the graphs below plotted using
the tina-ti
software:
These results show that the circuit has an output of 3.3V and 5V which is the required bias voltage
for the microcontroller and the G.P.R.S. module respectively.
The simulation results for the analog signal conditioning circuit are as in the graphs below
plotted using the tina-ti software:
Dc transfer
characteristic
Page 28
4-28
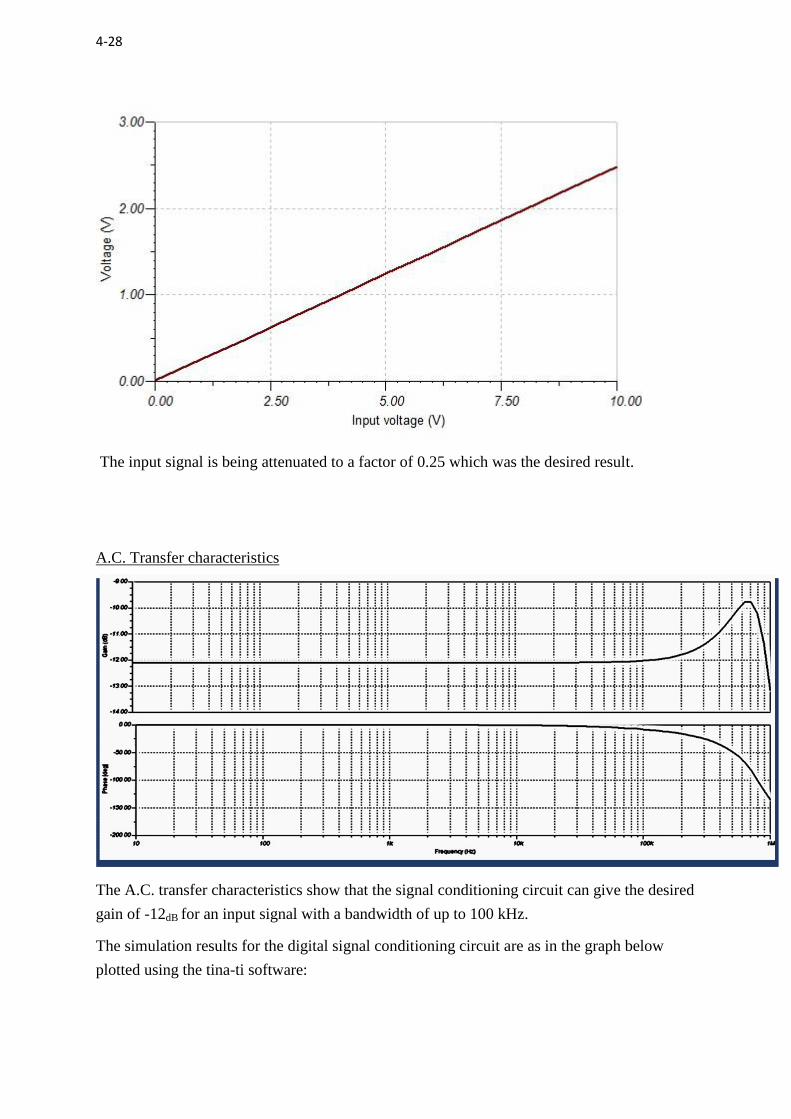
The input signal is being attenuated to a factor of 0.25 which was the desired result.
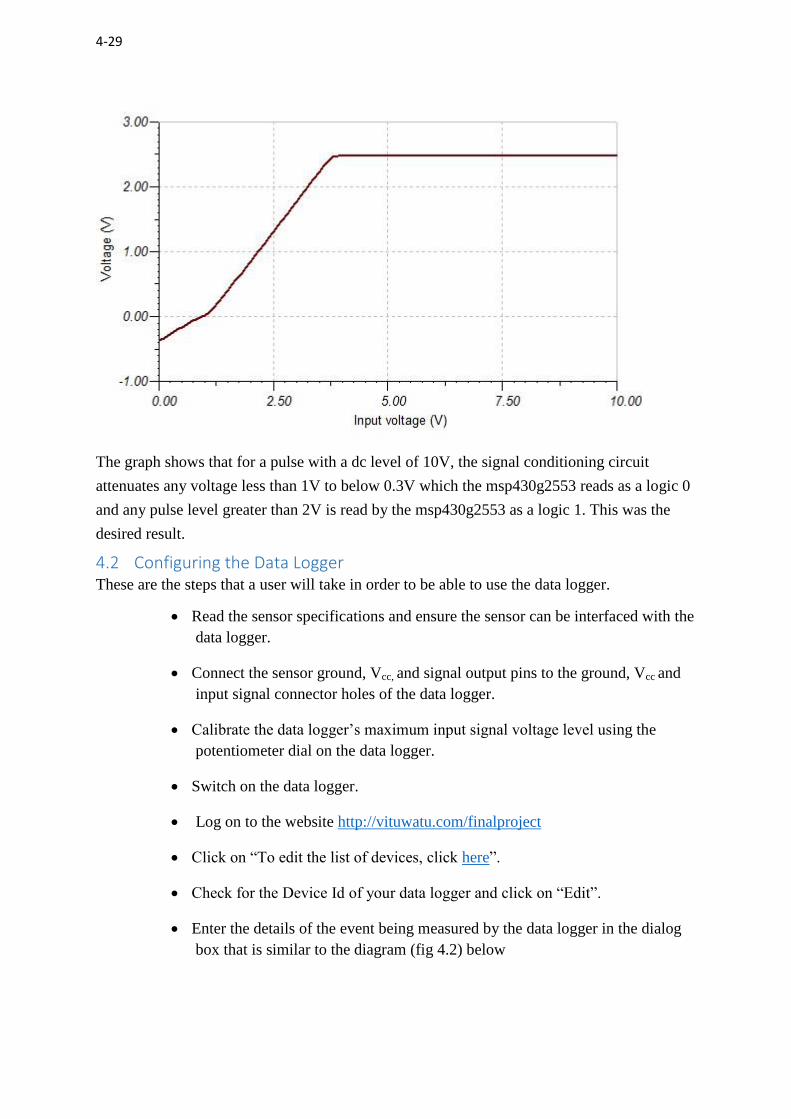
A.C. Transfer characteristics
The A.C. transfer characteristics show that the signal conditioning circuit can give the desired
gain of -12dB for an input signal with a bandwidth of up to 100 kHz.
The simulation results for the digital signal conditioning circuit are as in the graph below
plotted using the tina-ti software:
Page 29
4-29
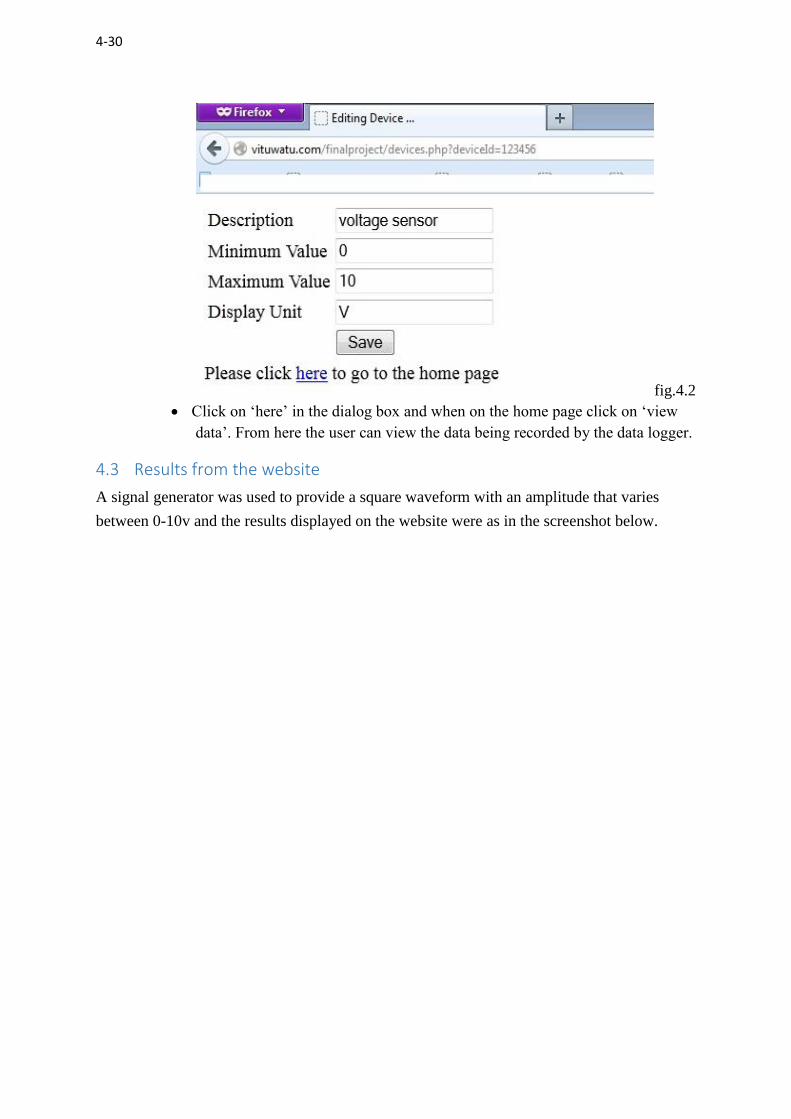
The graph shows that for a pulse with a dc level of 10V, the signal conditioning circuit
attenuates any voltage less than 1V to below 0.3V which the msp430g2553 reads as a logic 0
and any pulse level greater than 2V is read by the msp430g2553 as a logic 1. This was the
desired result.
4.2 Configuring the Data Logger These are the steps that a user will take in order to be able to use the data logger.
Read the sensor specifications and ensure the sensor can be interfaced with the
data logger.
Connect the sensor ground, Vcc, and signal output pins to the ground, Vcc and
input signal connector holes of the data logger.
Calibrate the data logger‟s maximum input signal voltage level using the
potentiometer dial on the data logger.
Switch on the data logger.
Log on to the website http://vituwatu.com/finalproject
Click on “To edit the list of devices, click here”.
Check for the Device Id of your data logger and click on “Edit”.
Enter the details of the event being measured by the data logger in the dialog
box that is similar to the diagram (fig 4.2) below
Page 30
4-30
fig.4.2
Click on „here‟ in the dialog box and when on the home page click on „view
data‟. From here the user can view the data being recorded by the data logger.
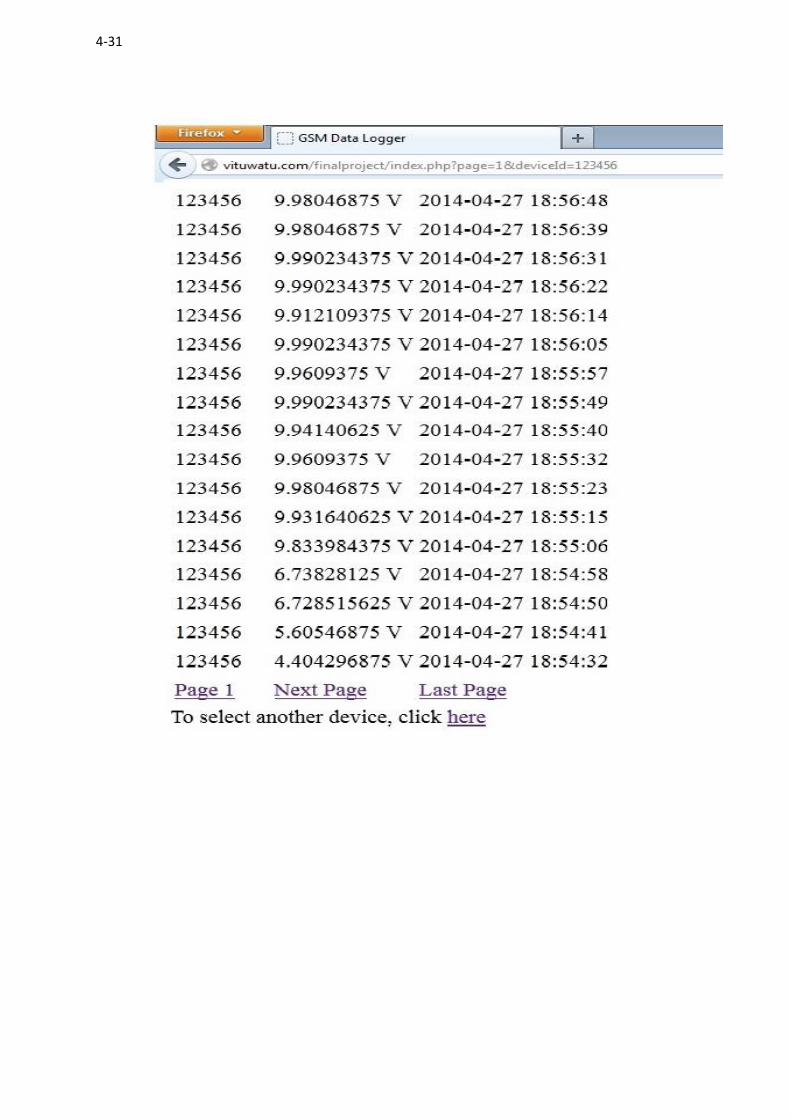
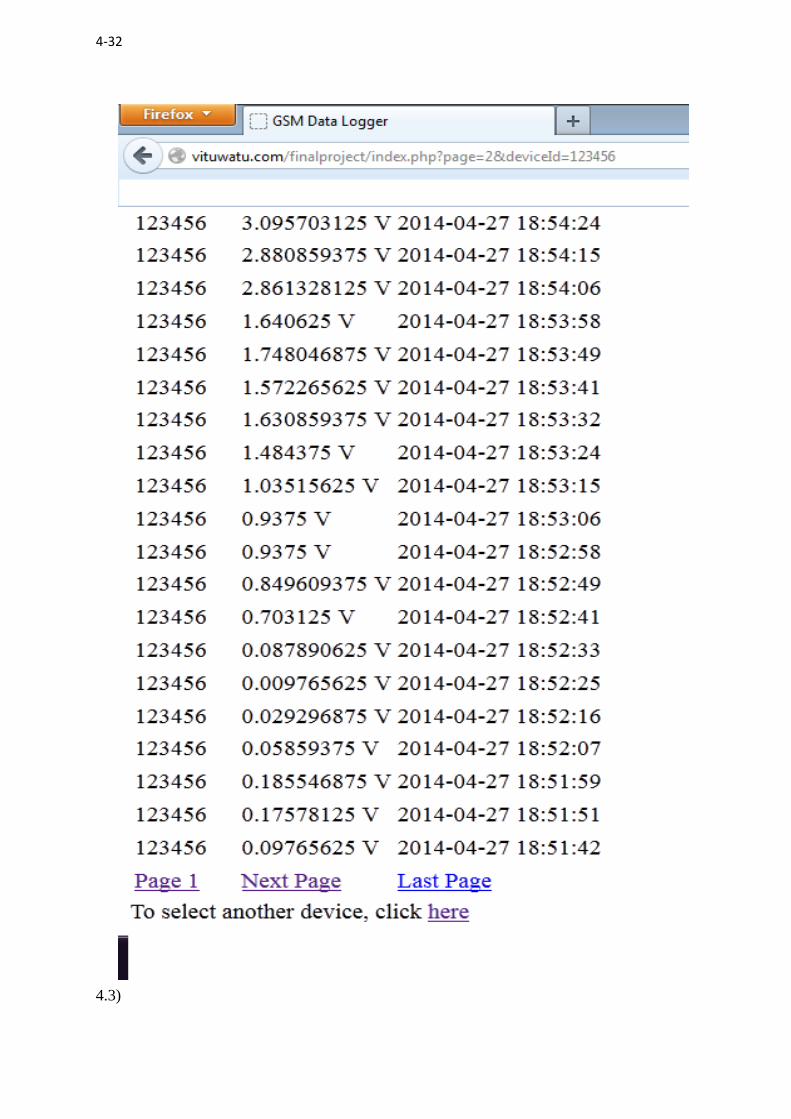
4.3 Results from the website
A signal generator was used to provide a square waveform with an amplitude that varies
between 0-10v and the results displayed on the website were as in the screenshot below.
Page 33
5-33
The data logger was able to measure the signal generator voltage output and post the values
on the website as in the results posted above. The error for the analogue signals was 0.97%
because the input to the Launchpad was very susceptible to noise of an average value of 2.5
mV.
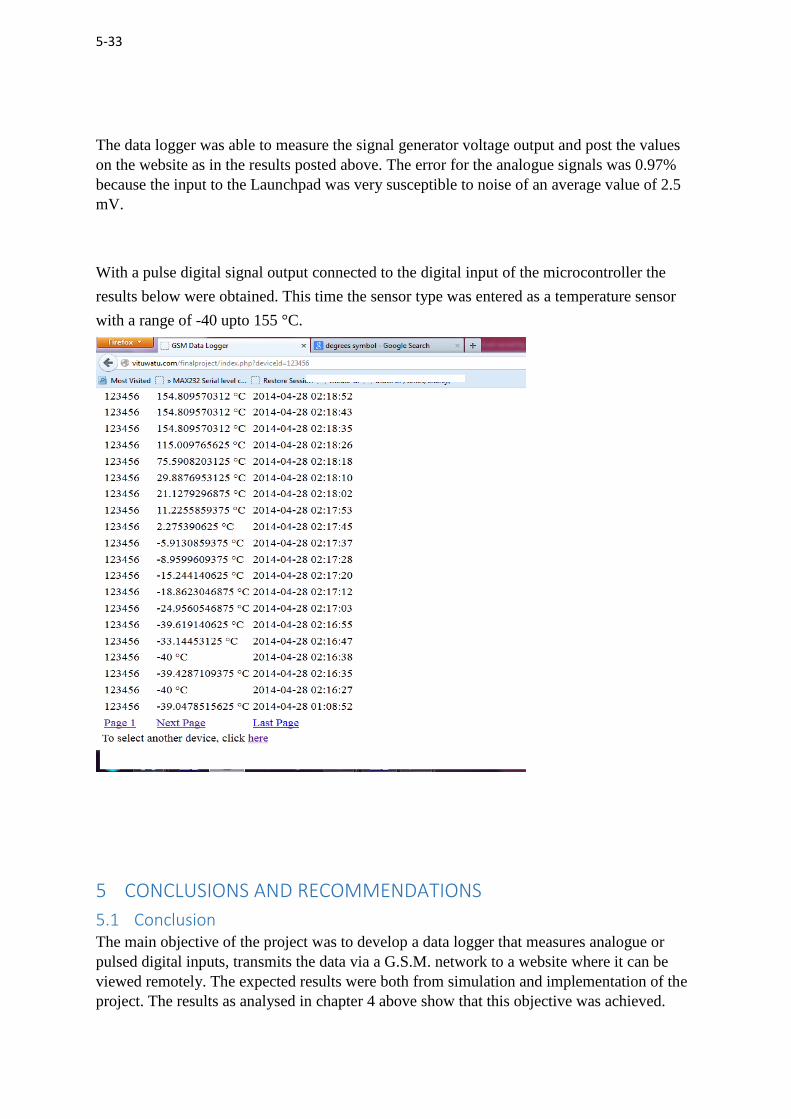
With a pulse digital signal output connected to the digital input of the microcontroller the
results below were obtained. This time the sensor type was entered as a temperature sensor
with a range of -40 upto 155 °C.
5 CONCLUSIONS AND RECOMMENDATIONS
5.1 Conclusion The main objective of the project was to develop a data logger that measures analogue or
pulsed digital inputs, transmits the data via a G.S.M. network to a website where it can be
viewed remotely. The expected results were both from simulation and implementation of the
project. The results as analysed in chapter 4 above show that this objective was achieved.
Page 34
5-34
5.2 Recommendations for future work The recommendations for future work are as follows:
1. Developing a means of modifying the G.P.R.S. bearer settings in the microcontroller
program such that a user won‟t be restricted to using the Safaricom network.
2. Investigate how to protect the data collected on the website by making sure users only
get to access only those devices that they are authorized to.
3. Developing a means of further processing the data that has been posted on the
website. Such processing can include plotting of graphs and converting the data into a
format easily transferrable to another website or to other programs such as
spreadsheets.
Page 35
6-35
6 Bibliography
[1] S. M. John Park, practical data acquisition for instrumentation and control systems, Oxford:
Newnes, 2003.
[2] Practical Design Techniques for sensor signal conditioning, United States of America: PRENTICE
HALL, 1999.
[3] Texas Instruments, Mixed Signal Microcontroller, Texas: Texas Instruments, 2013.
[4] Huawei Technologies co. Ltd., Basic Training on Telecom Network Fundamentals, Huawei
Technologies co. Ltd.
[5] H. S. Gunnar Heine, GPRS: Gateway to Third Generation, Boston: Artech House, 2003.
[6] L. T. M. R. O. R. S. D. Geoff Sanders, GPRS Networks, West Sussex: John Wiley & Sons Ltd, 2003.
[7] ON Semiconductor, LM324, LM324A, LM224,LM2902, LM2902V, NCV2902 single supply op
amps, Denver, Colorado: ON semiconductors, 2013.
[8] J. H. Davies, MSP430 Microcontroller Basics, Oxford: Newnes, 2008.
[9] Itead studio, SIM900 GSM/GPRS Module, Itead studio, 2011.
[10] Texas instruments, Op Amps for Everyone, Texas: Texas Instruments, 2002.
[11] Onsemi Semiconductors, Single Supply Quad operational amplifiers, Colorado: Literature
Distribution Center for ON Semiconductor, 2011.
[12] L. T. Luke Wellin, PHP and MySQL Web Development, United States: SAMS Publishing, 2001.
[13] Texas Instruments, MSP430x2xx Family User's Guide, Texas: Texas Instruments, 2013.
[14] D. D. adrian Fernandez, Getting Started with the MSP430G2553 Launchpad, Oxford: Newness
Press, 2013.
[15] J. Crisp, Introduction to Microprocessors and Microcontrollers, Oxford: Newnes, 2004.
[16] simcom, SIM 900 AT COMMAND MANUAL, SIMTECH, 2010.
Page 36
7-36
7 APPENDIX
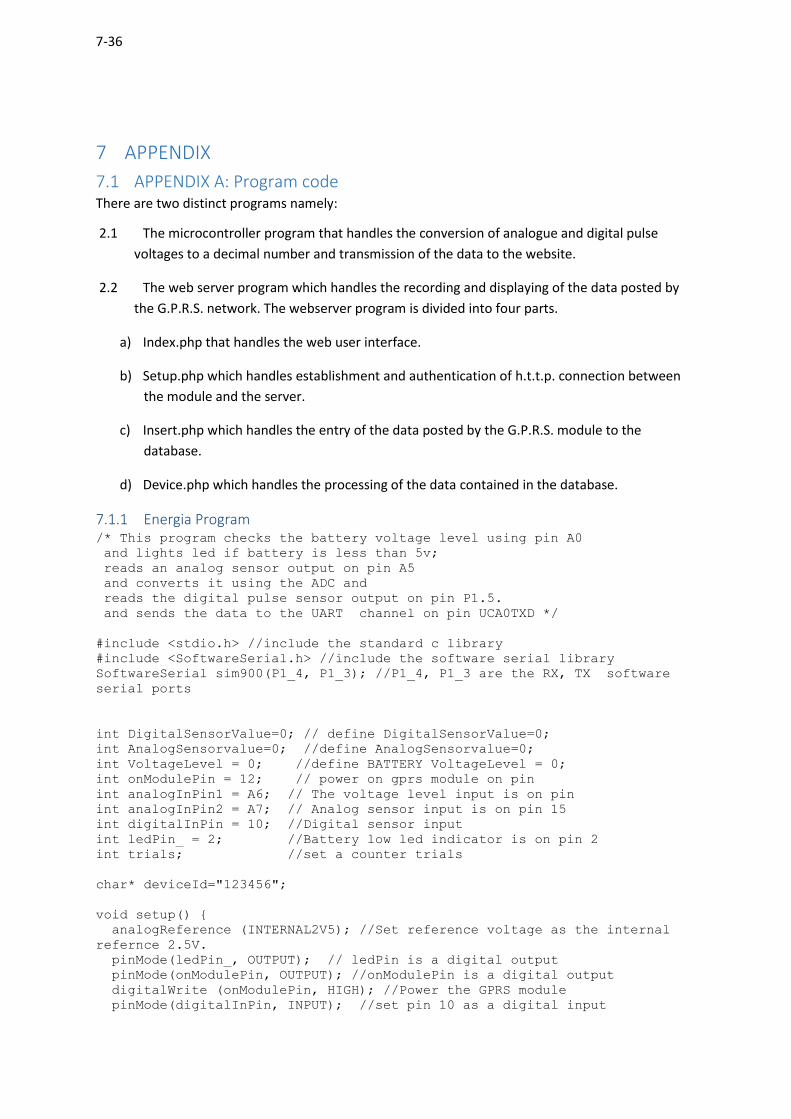
7.1 APPENDIX A: Program code There are two distinct programs namely:
2.1 The microcontroller program that handles the conversion of analogue and digital pulse
voltages to a decimal number and transmission of the data to the website.
2.2 The web server program which handles the recording and displaying of the data posted by
the G.P.R.S. network. The webserver program is divided into four parts.
a) Index.php that handles the web user interface.
b) Setup.php which handles establishment and authentication of h.t.t.p. connection between
the module and the server.
c) Insert.php which handles the entry of the data posted by the G.P.R.S. module to the
database.
d) Device.php which handles the processing of the data contained in the database.
7.1.1 Energia Program /* This program checks the battery voltage level using pin A0
and lights led if battery is less than 5v;
reads an analog sensor output on pin A5
and converts it using the ADC and
reads the digital pulse sensor output on pin P1.5.
and sends the data to the UART channel on pin UCA0TXD */
#include <stdio.h> //include the standard c library
#include <SoftwareSerial.h> //include the software serial library
SoftwareSerial sim900(P1_4, P1_3); //P1_4, P1_3 are the RX, TX software
serial ports
int DigitalSensorValue=0; // define DigitalSensorValue=0;
int AnalogSensorvalue=0; //define AnalogSensorvalue=0;
int VoltageLevel = 0; //define BATTERY VoltageLevel = 0;
int onModulePin = 12; // power on gprs module on pin
int analogInPin1 = A6; // The voltage level input is on pin
int analogInPin2 = A7; // Analog sensor input is on pin 15
int digitalInPin = 10; //Digital sensor input
int ledPin_ = 2; //Battery low led indicator is on pin 2
int trials; //set a counter trials
char* deviceId="123456";
void setup()
analogReference (INTERNAL2V5); //Set reference voltage as the internal
refernce 2.5V.
pinMode(ledPin_, OUTPUT); // ledPin is a digital output
pinMode(onModulePin, OUTPUT); //onModulePin is a digital output
digitalWrite (onModulePin, HIGH); //Power the GPRS module
pinMode(digitalInPin, INPUT); //set pin 10 as a digital input
Page 37
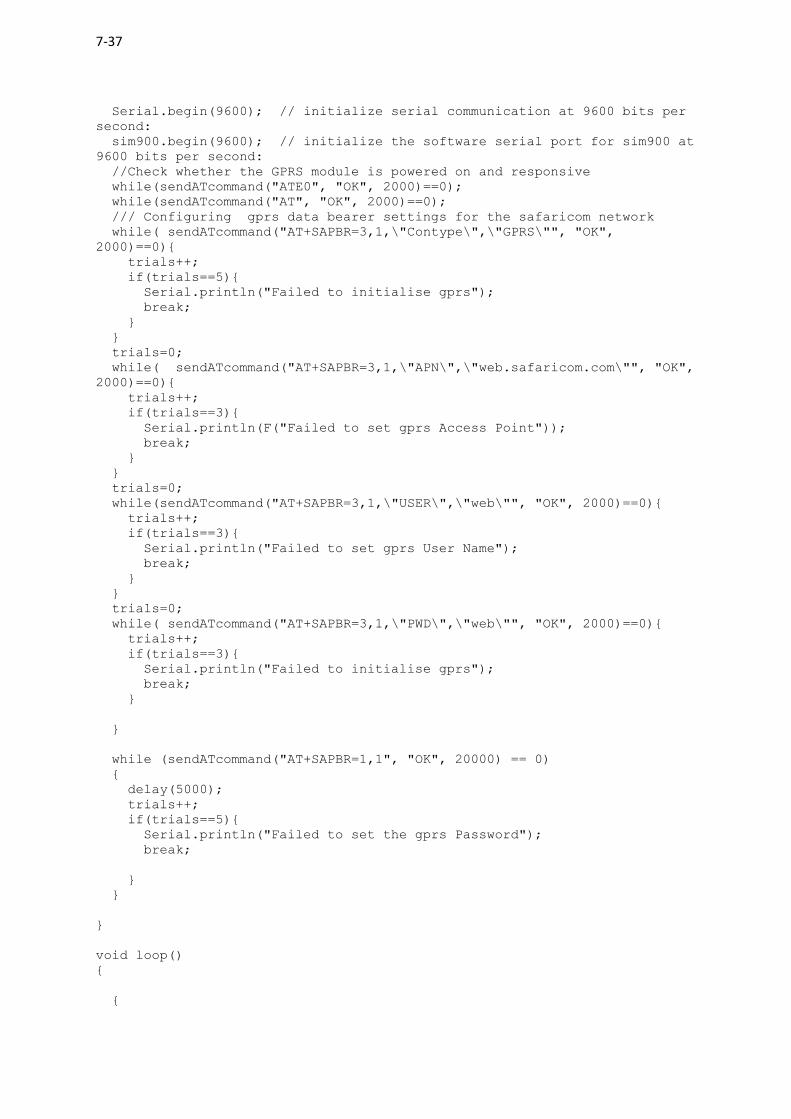
7-37 Serial.begin(9600); // initialize serial communication at 9600 bits per
second:
sim900.begin(9600); // initialize the software serial port for sim900 at
9600 bits per second:
//Check whether the GPRS module is powered on and responsive
while(sendATcommand("ATE0", "OK", 2000)==0);
while(sendATcommand("AT", "OK", 2000)==0);
/// Configuring gprs data bearer settings for the safaricom network
while( sendATcommand("AT+SAPBR=3,1,\"Contype\",\"GPRS\"", "OK",
2000)==0)
trials++;
if(trials==5)
Serial.println("Failed to initialise gprs");
break;
trials=0;
while( sendATcommand("AT+SAPBR=3,1,\"APN\",\"web.safaricom.com\"", "OK",
2000)==0)
trials++;
if(trials==3)
Serial.println(F("Failed to set gprs Access Point"));
break;
trials=0;
while(sendATcommand("AT+SAPBR=3,1,\"USER\",\"web\"", "OK", 2000)==0)
trials++;
if(trials==3)
Serial.println("Failed to set gprs User Name");
break;
trials=0;
while( sendATcommand("AT+SAPBR=3,1,\"PWD\",\"web\"", "OK", 2000)==0)
trials++;
if(trials==3)
Serial.println("Failed to initialise gprs");
break;
while (sendATcommand("AT+SAPBR=1,1", "OK", 20000) == 0)
delay(5000);
trials++;
if(trials==5)
Serial.println("Failed to set the gprs Password");
break;
void loop()
Page 38
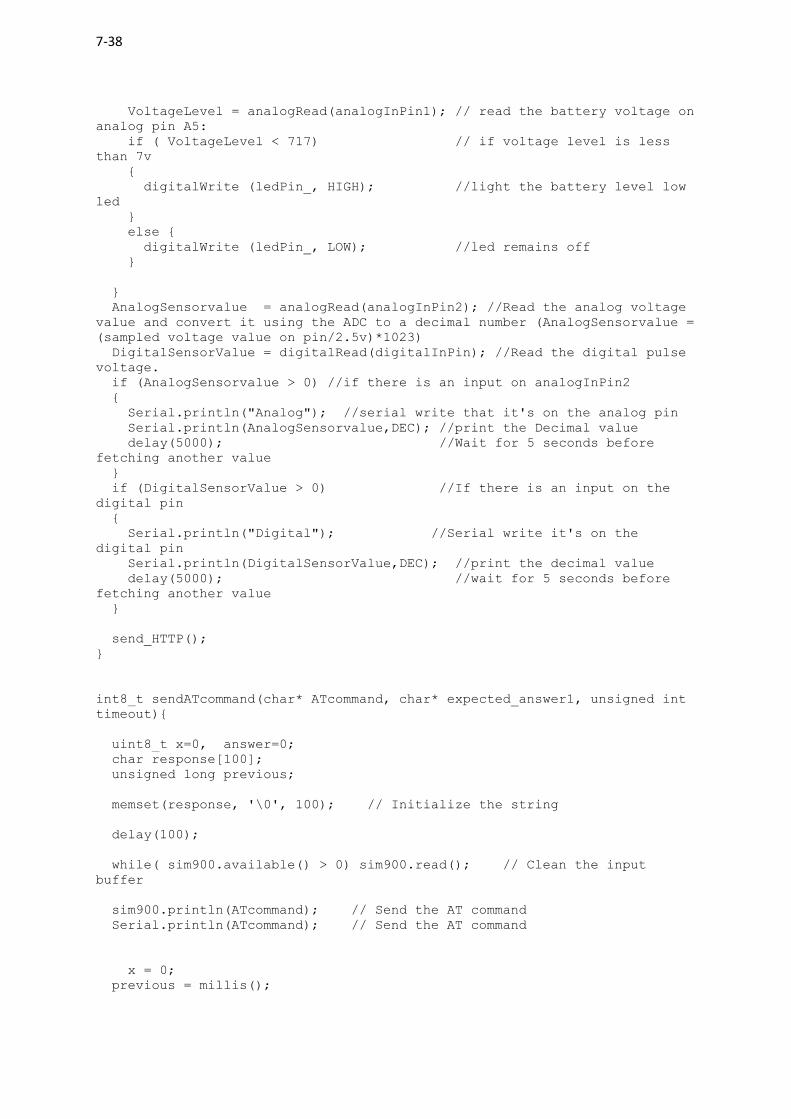
7-38 VoltageLevel = analogRead(analogInPin1); // read the battery voltage on
analog pin A5:
if ( VoltageLevel < 717) // if voltage level is less
than 7v
digitalWrite (ledPin_, HIGH); //light the battery level low
led
else
digitalWrite (ledPin_, LOW); //led remains off
AnalogSensorvalue = analogRead(analogInPin2); //Read the analog voltage
value and convert it using the ADC to a decimal number (AnalogSensorvalue =
(sampled voltage value on pin/2.5v)*1023)
DigitalSensorValue = digitalRead(digitalInPin); //Read the digital pulse
voltage.
if (AnalogSensorvalue > 0) //if there is an input on analogInPin2
Serial.println("Analog"); //serial write that it's on the analog pin
Serial.println(AnalogSensorvalue,DEC); //print the Decimal value
delay(5000); //Wait for 5 seconds before
fetching another value
if (DigitalSensorValue > 0) //If there is an input on the
digital pin
Serial.println("Digital"); //Serial write it's on the
digital pin
Serial.println(DigitalSensorValue,DEC); //print the decimal value
delay(5000); //wait for 5 seconds before
fetching another value
send_HTTP();
int8_t sendATcommand(char* ATcommand, char* expected_answer1, unsigned int
timeout)
uint8_t x=0, answer=0;
char response[100];
unsigned long previous;
memset(response, '\0', 100); // Initialize the string
delay(100);
while( sim900.available() > 0) sim900.read(); // Clean the input
buffer
sim900.println(ATcommand); // Send the AT command
Serial.println(ATcommand); // Send the AT command
x = 0;
previous = millis();
Page 39
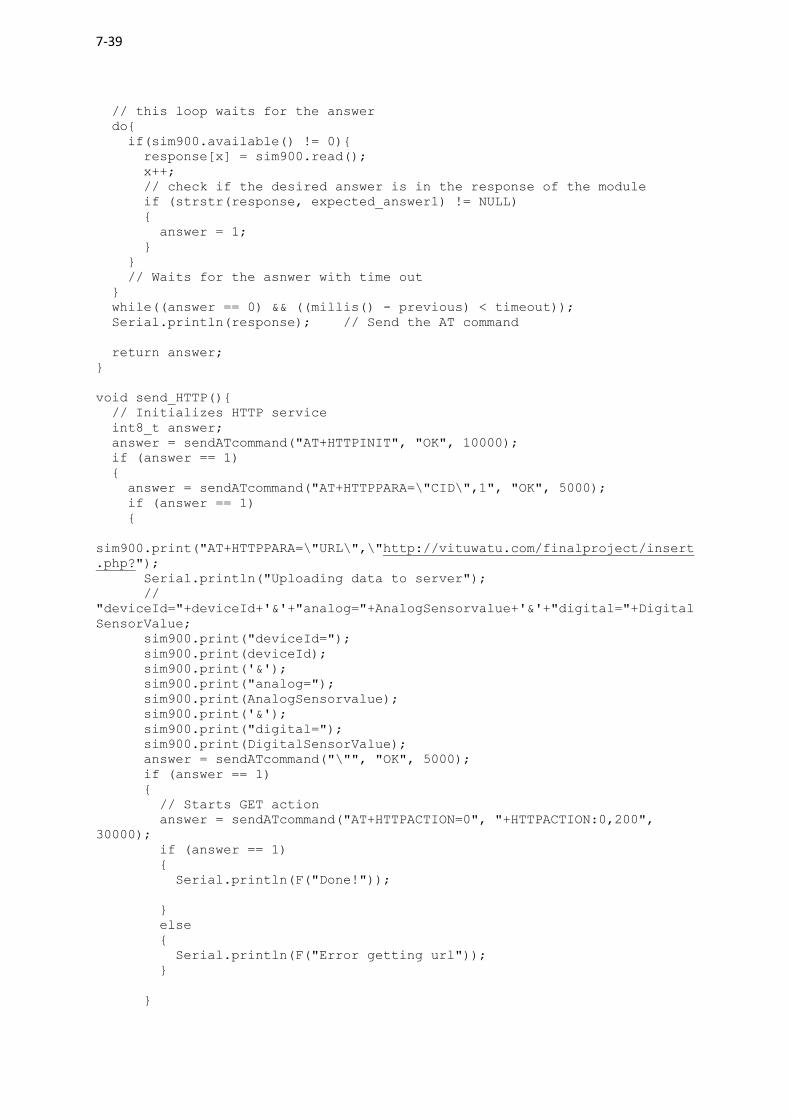
7-39 // this loop waits for the answer
do
if(sim900.available() != 0)
response[x] = sim900.read();
x++;
// check if the desired answer is in the response of the module
if (strstr(response, expected_answer1) != NULL)
answer = 1;
// Waits for the asnwer with time out
while((answer == 0) && ((millis() - previous) < timeout));
Serial.println(response); // Send the AT command
return answer;
void send_HTTP()
// Initializes HTTP service
int8_t answer;
answer = sendATcommand("AT+HTTPINIT", "OK", 10000);
if (answer == 1)
answer = sendATcommand("AT+HTTPPARA=\"CID\",1", "OK", 5000);
if (answer == 1)
sim900.print("AT+HTTPPARA=\"URL\",\"http://vituwatu.com/finalproject/insert
.php?");
Serial.println("Uploading data to server");
//
"deviceId="+deviceId+'&'+"analog="+AnalogSensorvalue+'&'+"digital="+Digital
SensorValue;
sim900.print("deviceId=");
sim900.print(deviceId);
sim900.print('&');
sim900.print("analog=");
sim900.print(AnalogSensorvalue);
sim900.print('&');
sim900.print("digital=");
sim900.print(DigitalSensorValue);
answer = sendATcommand("\"", "OK", 5000);
if (answer == 1)
// Starts GET action
answer = sendATcommand("AT+HTTPACTION=0", "+HTTPACTION:0,200",
30000);
if (answer == 1)
Serial.println(F("Done!"));
else
Serial.println(F("Error getting url"));
Page 40
7-40 else
Serial.println(F("Error setting the url"));
else
Serial.println(F("Error setting the CID"));
else
Serial.println(F("Error initializing"));
sendATcommand("AT+HTTPTERM", "OK", 5000);
////////////////////////////////////////////////////////////////////////
////////////////////////////////////////////////////////////////////////
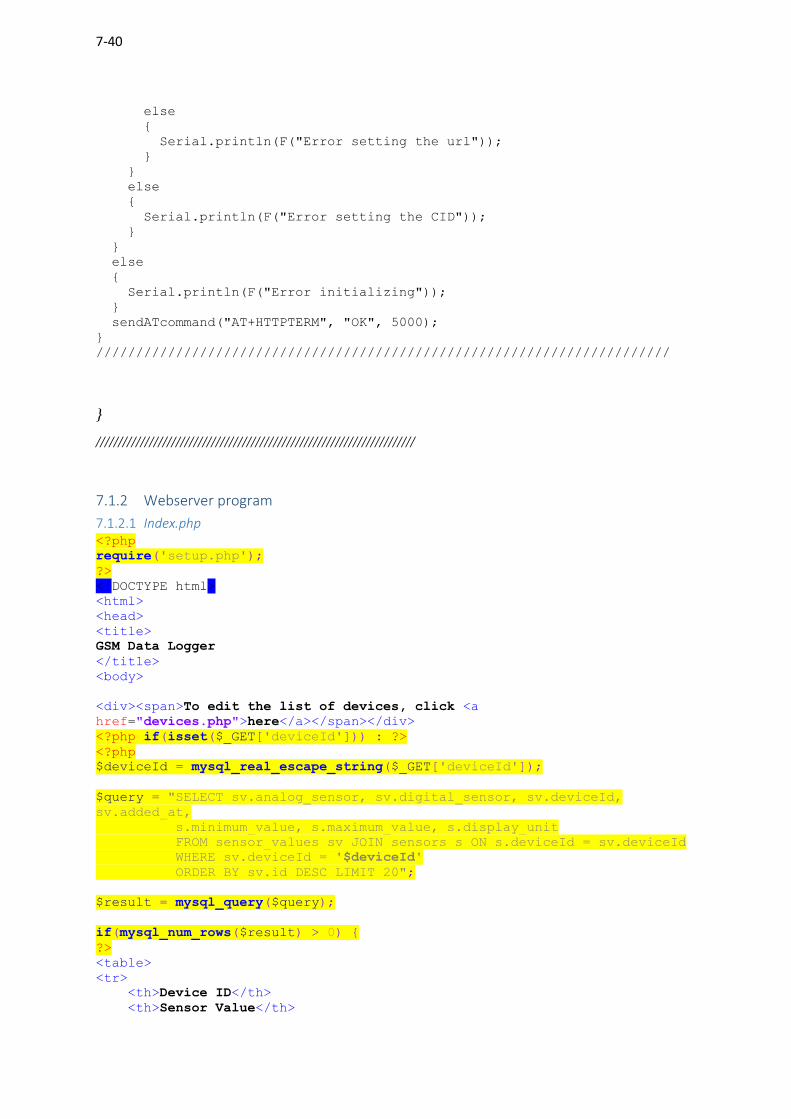
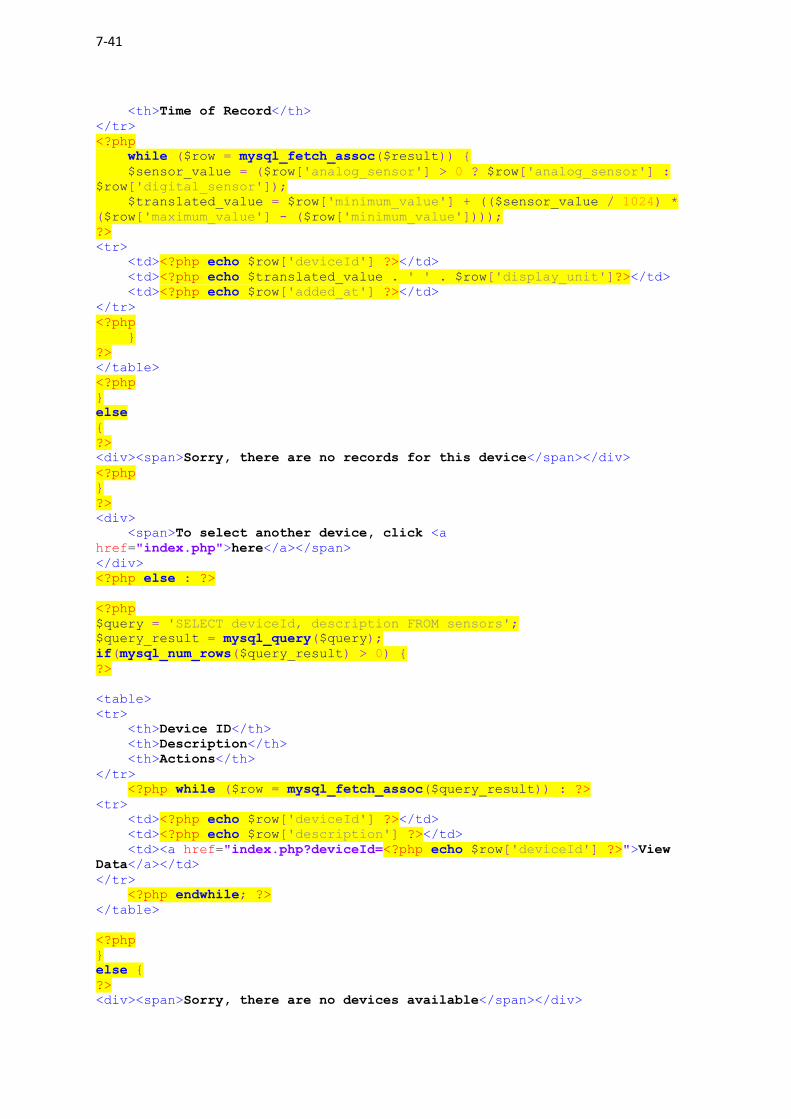
7.1.2 Webserver program
7.1.2.1 Index.php <?php
require('setup.php');
?>
<!DOCTYPE html>
<html>
<head>
<title>
GSM Data Logger
</title>
<body>
<div><span>To edit the list of devices, click <a
href="devices.php">here</a></span></div>
<?php if(isset($_GET['deviceId'])) : ?>
<?php
$deviceId = mysql_real_escape_string($_GET['deviceId']);
$query = "SELECT sv.analog_sensor, sv.digital_sensor, sv.deviceId,
sv.added_at,
s.minimum_value, s.maximum_value, s.display_unit
FROM sensor_values sv JOIN sensors s ON s.deviceId = sv.deviceId
WHERE sv.deviceId = '$deviceId'
ORDER BY sv.id DESC LIMIT 20";
$result = mysql_query($query);
if(mysql_num_rows($result) > 0)
?>
<table>
<tr>
<th>Device ID</th>
<th>Sensor Value</th>
Page 41
7-41 <th>Time of Record</th>
</tr>
<?php
while ($row = mysql_fetch_assoc($result))
$sensor_value = ($row['analog_sensor'] > 0 ? $row['analog_sensor'] :
$row['digital_sensor']);
$translated_value = $row['minimum_value'] + (($sensor_value / 1024) *
($row['maximum_value'] - ($row['minimum_value'])));
?>
<tr>
<td><?php echo $row['deviceId'] ?></td>
<td><?php echo $translated_value . ' ' . $row['display_unit']?></td>
<td><?php echo $row['added_at'] ?></td>
</tr>
<?php
?>
</table>
<?php
else
?>
<div><span>Sorry, there are no records for this device</span></div>
<?php
?>
<div>
<span>To select another device, click <a
href="index.php">here</a></span>
</div>
<?php else : ?>
<?php
$query = 'SELECT deviceId, description FROM sensors';
$query_result = mysql_query($query);
if(mysql_num_rows($query_result) > 0)
?>
<table>
<tr>
<th>Device ID</th>
<th>Description</th>
<th>Actions</th>
</tr>
<?php while ($row = mysql_fetch_assoc($query_result)) : ?>
<tr>
<td><?php echo $row['deviceId'] ?></td>
<td><?php echo $row['description'] ?></td>
<td><a href="index.php?deviceId=<?php echo $row['deviceId'] ?>">View
Data</a></td>
</tr>
<?php endwhile; ?>
</table>
<?php
else
?>
<div><span>Sorry, there are no devices available</span></div>
Page 42
7-42 <?php
?>
<?php endif; ?>
</body>
</html>
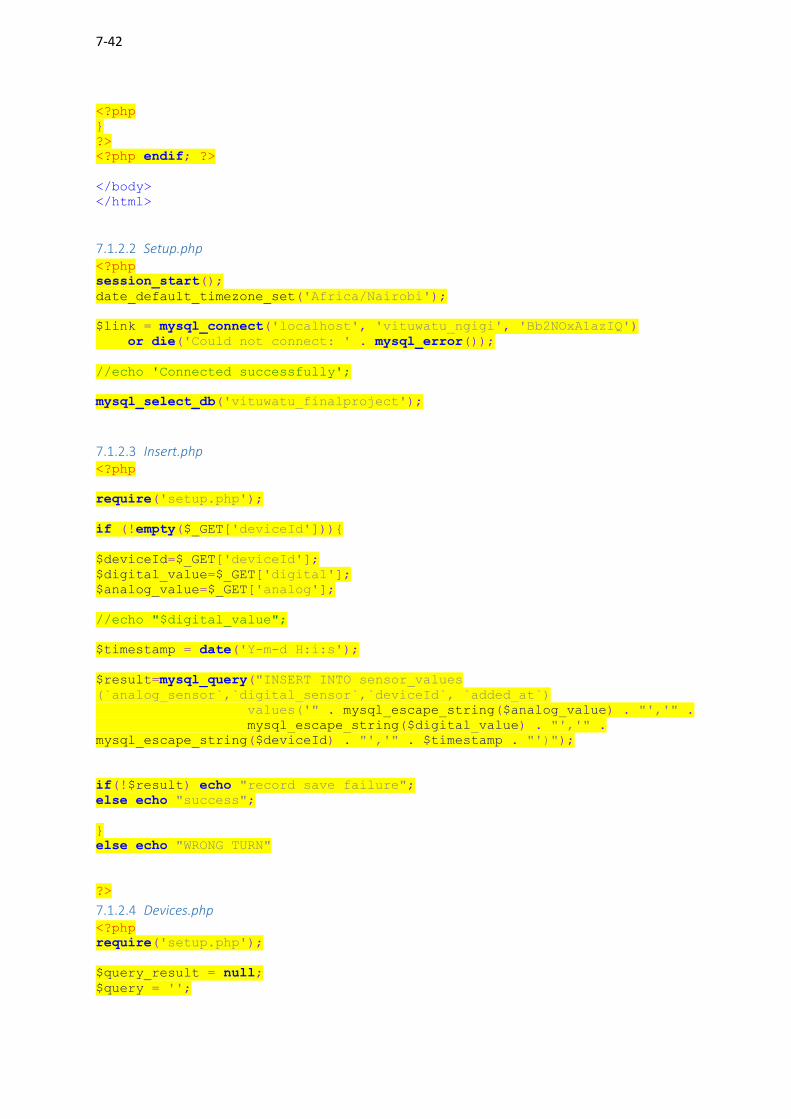
7.1.2.2 Setup.php <?php
session_start();
date_default_timezone_set('Africa/Nairobi');
$link = mysql_connect('localhost', 'vituwatu_ngigi', 'Bb2NOxA1azIQ')
or die('Could not connect: ' . mysql_error());
//echo 'Connected successfully';
mysql_select_db('vituwatu_finalproject');
7.1.2.3 Insert.php <?php
require('setup.php');
if (!empty($_GET['deviceId']))
$deviceId=$_GET['deviceId'];
$digital_value=$_GET['digital'];
$analog_value=$_GET['analog'];
//echo "$digital_value";
$timestamp = date('Y-m-d H:i:s');
$result=mysql_query("INSERT INTO sensor_values
(`analog_sensor`,`digital_sensor`,`deviceId`, `added_at`)
values('" . mysql_escape_string($analog_value) . "','" .
mysql_escape_string($digital_value) . "','" .
mysql_escape_string($deviceId) . "','" . $timestamp . "')");
if(!$result) echo "record save failure";
else echo "success";
else echo "WRONG TURN"
?>
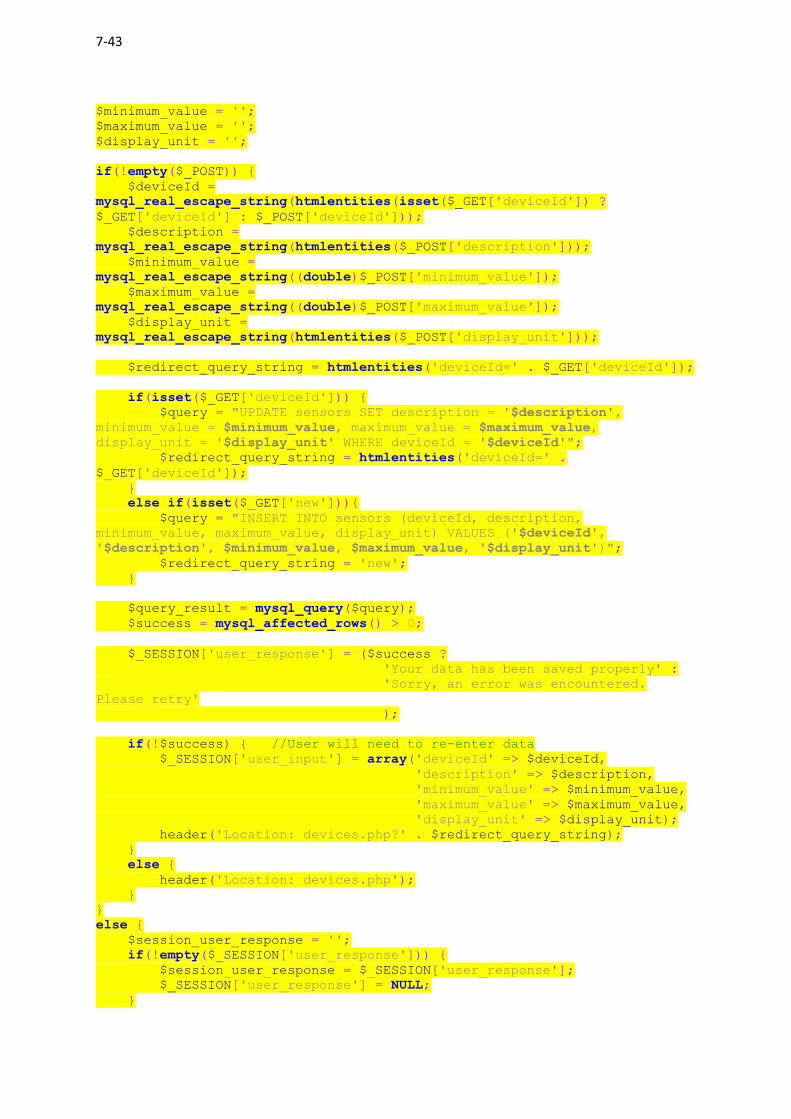
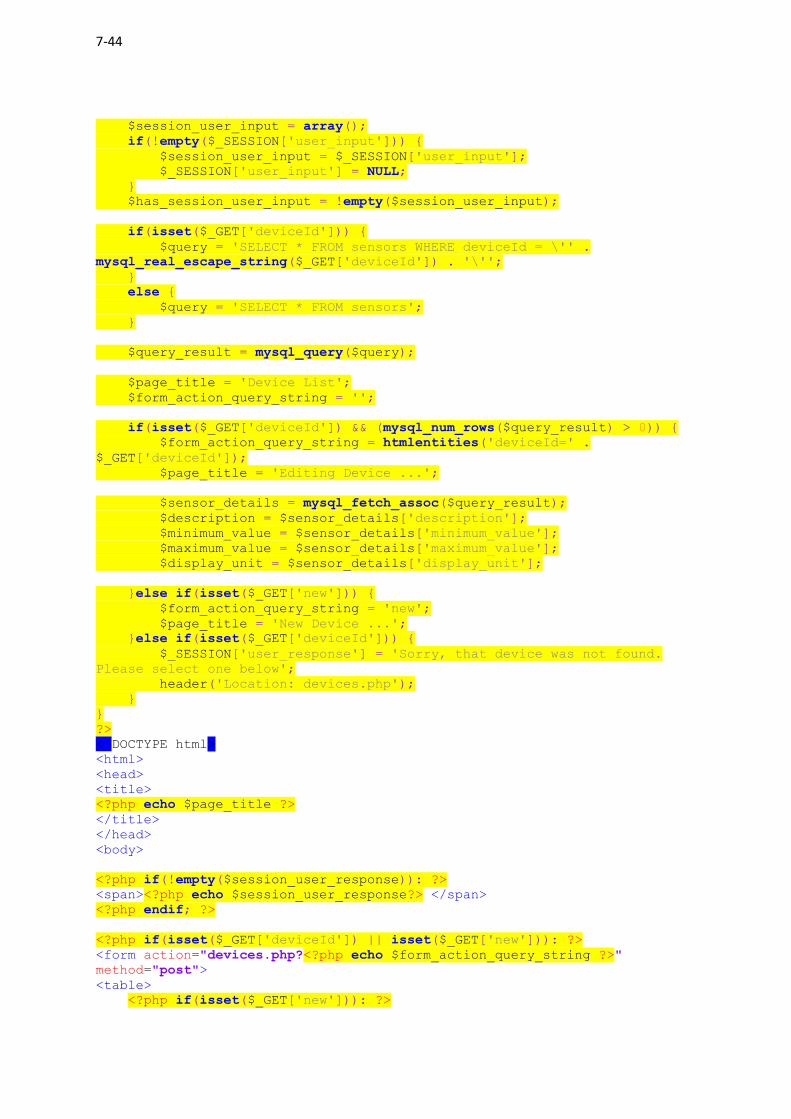
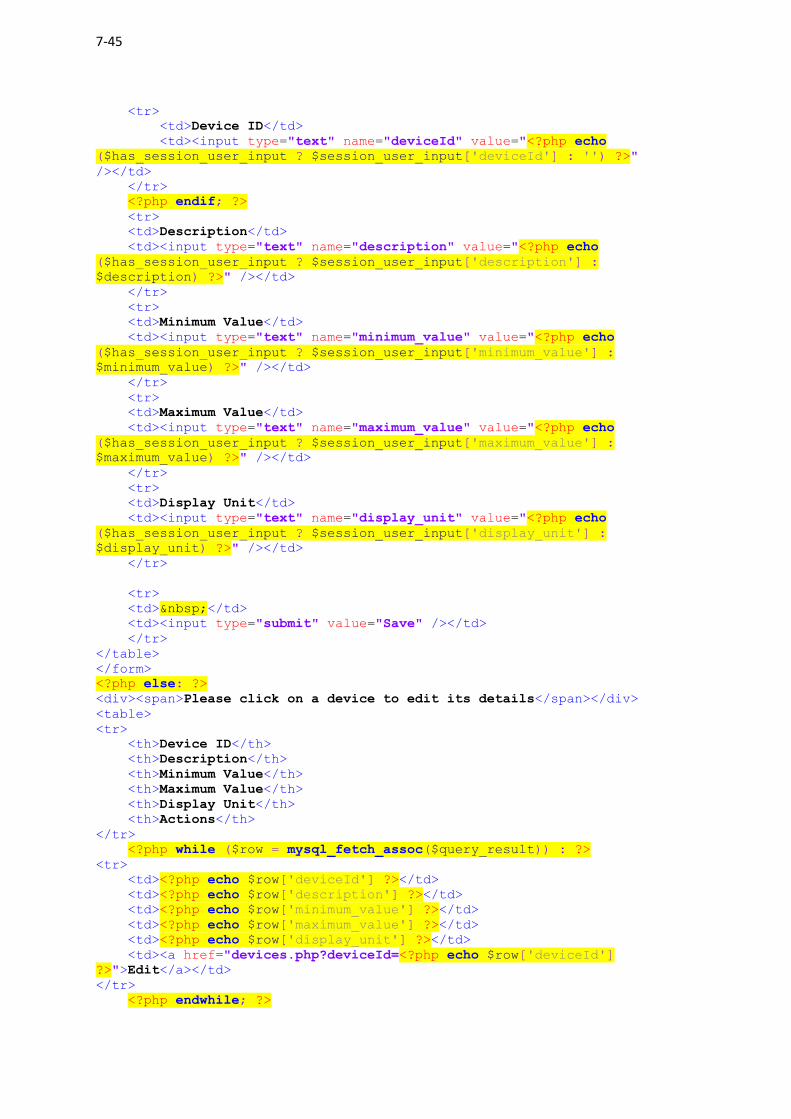
7.1.2.4 Devices.php <?php
require('setup.php');
$query_result = null;
$query = '';
Page 43
7-43 $minimum_value = '';
$maximum_value = '';
$display_unit = '';
if(!empty($_POST))
$deviceId =
mysql_real_escape_string(htmlentities(isset($_GET['deviceId']) ?
$_GET['deviceId'] : $_POST['deviceId']));
$description =
mysql_real_escape_string(htmlentities($_POST['description']));
$minimum_value =
mysql_real_escape_string((double)$_POST['minimum_value']);
$maximum_value =
mysql_real_escape_string((double)$_POST['maximum_value']);
$display_unit =
mysql_real_escape_string(htmlentities($_POST['display_unit']));
$redirect_query_string = htmlentities('deviceId=' . $_GET['deviceId']);
if(isset($_GET['deviceId']))
$query = "UPDATE sensors SET description = '$description',
minimum_value = $minimum_value, maximum_value = $maximum_value,
display_unit = '$display_unit' WHERE deviceId = '$deviceId'";
$redirect_query_string = htmlentities('deviceId=' .
$_GET['deviceId']);
else if(isset($_GET['new']))
$query = "INSERT INTO sensors (deviceId, description,
minimum_value, maximum_value, display_unit) VALUES ('$deviceId',
'$description', $minimum_value, $maximum_value, '$display_unit')";
$redirect_query_string = 'new';
$query_result = mysql_query($query);
$success = mysql_affected_rows() > 0;
$_SESSION['user_response'] = ($success ?
'Your data has been saved properly' :
'Sorry, an error was encountered.
Please retry'
);
if(!$success) //User will need to re-enter data
$_SESSION['user_input'] = array('deviceId' => $deviceId,
'description' => $description,
'minimum_value' => $minimum_value,
'maximum_value' => $maximum_value,
'display_unit' => $display_unit);
header('Location: devices.php?' . $redirect_query_string);
else
header('Location: devices.php');
else
$session_user_response = '';
if(!empty($_SESSION['user_response']))
$session_user_response = $_SESSION['user_response'];
$_SESSION['user_response'] = NULL;
Page 44
7-44
$session_user_input = array();
if(!empty($_SESSION['user_input']))
$session_user_input = $_SESSION['user_input'];
$_SESSION['user_input'] = NULL;
$has_session_user_input = !empty($session_user_input);
if(isset($_GET['deviceId']))
$query = 'SELECT * FROM sensors WHERE deviceId = \'' .
mysql_real_escape_string($_GET['deviceId']) . '\'';
else
$query = 'SELECT * FROM sensors';
$query_result = mysql_query($query);
$page_title = 'Device List';
$form_action_query_string = '';
if(isset($_GET['deviceId']) && (mysql_num_rows($query_result) > 0))
$form_action_query_string = htmlentities('deviceId=' .
$_GET['deviceId']);
$page_title = 'Editing Device ...';
$sensor_details = mysql_fetch_assoc($query_result);
$description = $sensor_details['description'];
$minimum_value = $sensor_details['minimum_value'];
$maximum_value = $sensor_details['maximum_value'];
$display_unit = $sensor_details['display_unit'];
else if(isset($_GET['new']))
$form_action_query_string = 'new';
$page_title = 'New Device ...';
else if(isset($_GET['deviceId']))
$_SESSION['user_response'] = 'Sorry, that device was not found.
Please select one below';
header('Location: devices.php');
?>
<!DOCTYPE html>
<html>
<head>
<title>
<?php echo $page_title ?>
</title>
</head>
<body>
<?php if(!empty($session_user_response)): ?>
<span><?php echo $session_user_response?> </span>
<?php endif; ?>
<?php if(isset($_GET['deviceId']) || isset($_GET['new'])): ?>
<form action="devices.php?<?php echo $form_action_query_string ?>"
method="post">
<table>
<?php if(isset($_GET['new'])): ?>
Page 45
7-45 <tr>
<td>Device ID</td>
<td><input type="text" name="deviceId" value="<?php echo
($has_session_user_input ? $session_user_input['deviceId'] : '') ?>"
/></td>
</tr>
<?php endif; ?>
<tr>
<td>Description</td>
<td><input type="text" name="description" value="<?php echo
($has_session_user_input ? $session_user_input['description'] :
$description) ?>" /></td>
</tr>
<tr>
<td>Minimum Value</td>
<td><input type="text" name="minimum_value" value="<?php echo
($has_session_user_input ? $session_user_input['minimum_value'] :
$minimum_value) ?>" /></td>
</tr>
<tr>
<td>Maximum Value</td>
<td><input type="text" name="maximum_value" value="<?php echo
($has_session_user_input ? $session_user_input['maximum_value'] :
$maximum_value) ?>" /></td>
</tr>
<tr>
<td>Display Unit</td>
<td><input type="text" name="display_unit" value="<?php echo
($has_session_user_input ? $session_user_input['display_unit'] :
$display_unit) ?>" /></td>
</tr>
<tr>
<td> </td>
<td><input type="submit" value="Save" /></td>
</tr>
</table>
</form>
<?php else: ?>
<div><span>Please click on a device to edit its details</span></div>
<table>
<tr>
<th>Device ID</th>
<th>Description</th>
<th>Minimum Value</th>
<th>Maximum Value</th>
<th>Display Unit</th>
<th>Actions</th>
</tr>
<?php while ($row = mysql_fetch_assoc($query_result)) : ?>
<tr>
<td><?php echo $row['deviceId'] ?></td>
<td><?php echo $row['description'] ?></td>
<td><?php echo $row['minimum_value'] ?></td>
<td><?php echo $row['maximum_value'] ?></td>
<td><?php echo $row['display_unit'] ?></td>
<td><a href="devices.php?deviceId=<?php echo $row['deviceId']
?>">Edit</a></td>
</tr>
<?php endwhile; ?>
Page 46
7-46 </table>
<?php endif; ?>
<div>
<span>Please click <a href="index.php">here</a> to go to the home
page</span>
</div>
</body>
</html>