Page 1/18 Gut microbiota of homologous Chinese soft-shell turtles ( Pelodiscus sinensis ) in different habitats Benli Wu Anhui Academy of Agricultural Sciences Long Huang Anhui Academy of Agricultural Sciences Jing Chen Anhui Academy of Agricultural Sciences Ye Zhang Anhui Academy of Agricultural Sciences Jun Wang Xi'an University of Technology Jixiang He ( [email protected]) Anhui Academy of Agricultural Sciences Research article Keywords: gut microbial variation, diversity, habitat, rice-turtle coculture Posted Date: October 23rd, 2020 DOI: https://doi.org/10.21203/rs.3.rs-51862/v2 License: This work is licensed under a Creative Commons Attribution 4.0 International License. Read Full License
Transcript
Page 1/18
Gut microbiota of homologous Chinese soft-shell turtles ( Pelodiscussinensis ) in different habitatsBenli Wu
AbstractBackground Chinese soft-shell turtle (Pelodiscus sinensis) is an important commercial species for their high nutritional value and unique taste,but it has been a vulnerable species due to habitat loss. In this study, homologous juvenile turtles were allocated to lake, pond and paddy �eld toinvestigate the habitat effects on turtles.
Results The growth, morphology and gut microbial communities were monitored during the 4 months cultural period. It showed higher growthrate of turtles in paddy �eld and pond. The appearance, visceral coe�cients, gut morphology and microbial communities in turtles were distinctamong different habitats. The alpha diversity was obviously lower in initial turtle guts from greenhouses, whereas it was obviously higher inturtle guts sampled from paddy �elds than ponds and lake. Signi�cant differences on dominant phyla, genera and species were found amonginitial samples and subsequent samples from different habitats. Firmicutes was the most abundant phylum in the guts of turtles sampled fromthe greenhouse initially, while Proteobacteria was the most abundant phylum after cultivation in different habitats, followed by Bacteroidetes.The microbial composition were distinct in different habitats at 60d, and the appearance of dominant phyla and genera was more driven bysampling time than habitats at 120d. Both the sampling time and habitats affected the appearance of dominant phyla and genera during thecultivation. The functional predictions indicated that both habitat type and sampling time had signi�cant effects on metabolic pathways,especially amino acid and carbohydrate metabolism.
Conclusion The turtles could adapt to natural lakes, arti�cial ponds and paddy �elds. The gut microbial abundance was different among thehabitats and sampling time. The species of microbes were signi�cantly more diverse in paddy �eld specimens than in those from ponds andlakes. Rice-turtle coculture is a potential ecological and economic farming mode that plays important roles in wild turtle protection and foodsecurity.
BackgroundOwing to their high nutritional value and unique taste, the consumption of wild animals is popular in many countries and areas, which hasaccelerated the recession of wild resources. However, some of the wild animals that are consumed may carry highly pathogenic viruses andbacteria that pose a potential threat to humans. Moreover, wildlife conservation has become an impending issue in recent decades. Chinese soft-shell turtle (Pelodiscus sinensis, hereinafter referred to as turtle) is an important commercial aquatic species in Southeast Asia, including China,and is commonly considered a tonic food due to its high nutritive and medicinal value[1,2]. P. sinensis has become a vulnerable species due tohabitat loss and over�shing[3]. These turtles live in water and have been traditionally cultured in lakes, rivers or reservoirs at low stockingdensities. Currently, several modes of captive culture have been promoted to satisfy market demand; greenhouses and arti�cial ponds arecommonly selected as sites for high production turtle aquaculture[4]. Intensive cultivation can signi�cantly increase the production ofcommercial turtles while shortening the culture period; however, it is also accompanied by problems such as a high risk of disease, defectiveappearance and low quality. Furthermore, the high energy consumption of these rearing patterns is not conducive to sustainable agriculturaldevelopment and has aroused increasing public concern[4,5]. Intensive breeding can cause diseases such as bacterial infection and mesenteritisdue to the associated crowded living spaces and super�uous but simple food sources[6-8]. Consequently, antiseptic medicines and antibioticshave been abused leading the rise in antibiotic resistance[9,10], thus leading to more serious environmental and health problems that affect boththe quality of the product and animal welfare[11-13]. Probiotics have been developed for cultured animals as immunopotentiators[14,15], buttheir positive effects are limited and temporary; thus, more healthy culture modes should be applied for high-quality products[16,17].
Turtles from different habitats generally show obvious differences in appearance, morphology, textural properties, chemical composition and�avor substance contents[5,18]. Physiological disorders are associated with marked changes in gut microbial communities. The gut microbiotais a protective barrier of organisms to prevent pathogen invasion[19] and is affected by both the internal and external environment[20,21]. Thediversity and variation of gut microbial communities have been considered indicators of the health status of the gut and host[22]. In recentyears, the coculture of rice and aquatic animals, such as rice-�sh, rice-cray�sh and rice-turtle systems, has been rapidly developed in SoutheastAsian regions, especially in South China[23]. Paddy �elds can provide capacious space, shelter and natural food for cultured animals. Culturedanimals prey on pests, and the activities of the cultured animals could loosen the soil and provide organic fertilizer for paddies, thus signi�cantlydecreasing the utilization of chemical fertilizers and pesticides[24,25]. Therefore, the coculture mode has been considered an economic andecological culture mode in rice-growing regions.
Host genetics, diets and ambient environmental conditions could affect the composition of the complex gut microbiota[26,27]. It is di�cult tofully unravel the diversity and dynamics of gut microbiota and identify keystone species for speci�c functions[28]. In the present study,homologous juvenile turtles with similar genotypes and early life conditions were allocated to different habitats to investigate their differences ingrowth and morphology and analyze the diversity and variation in their gut microbial communities within cultural periods. Efforts were alsomade to identify functional microbes or representative communities as biomarkers of the physiological status of turtles in different habitats.
Turtle growth and morphology under different habitats
Mortality was negligible in both paddy �elds and ponds during the experimental period. However, only a small number of turtles were caughtfrom the lake at 60 d, and no marked turtles were recaptured at 120 d, resulting in incomplete statistics for mortality and growth for turtles in thelake. No wild turtles were caught during sampling. A relatively small sample size (n=3) for each group was designed for turtle resource protectionpurposes, and it was di�cult to sample from natural lakes. There were signi�cant differences in growth among the different groups; the bodyweights of turtles in paddy �elds and ponds were obviously higher than those in lakes (p<0.05), and divergence occurred in the early days. Thegrowth rates of turtles were 0.76%/d, 0.68%/d and 0.40%/d for those from paddy �elds, ponds and lakes, respectively, in the �rst 60 d. The ratewas 0.72%/d and 0.62%/d for turtles from paddy �elds and ponds, respectively, during the whole 120 d. The hepato-somatic index and clumpyfat index were highest in ponds, second in paddy �elds and lowest in lakes (p<0.05). The gut-somatic index of weight (DSIW) for turtles fromponds was signi�cantly higher than that for turtles from lakes and paddy �elds (p<0.05). Conversely, the gut-somatic index of length (DSIL) washigher for turtles from paddy �elds and lakes than those from ponds. Measured values are presented as the mean ± standard deviation, and thedifferent superscript letters in the same row indicate signi�cant differences (p<0.05) (Table 1).
There was no obvious trauma experienced by most turtles from the lake except occasional parasitic leeches observed on the calipash. However,more bruises or scars were observed for the turtles from ponds than those from paddy �elds. The appearance, such as the color, of the carapaceand plastron were different among turtles from different habitats. The carapace of turtles cultured in ponds presented a bottle green color, butthe individuals from paddy �elds presented a bottle green color with a slight golden yellow color, which was similar to turtles from lakes. Therewere signi�cant differences in carapace width/carapace length (CW/CL) and calipash lateral width/carapace length (CLW/CL) values at 60 dand 120 d (p>0.05), but the CW/CL value was relatively higher for turtles from lakes, and CLW/CL was higher for turtles from lakes and pondsthan for those from paddy �elds (p<0.05) (Table 1).
Composition and diversity of turtle gut microbiota
Dominant microbesThe grouping details for samples from different habitats, culture days and intestinal segments are listed in Table 2. For gutsamples, a total of 1 723 158 valid bacterial 16S rRNA gene reads were obtained, and 4 901 OTUs were identi�ed from all samples. Theobserved total OTUs varied from 64~822. The total number of OTUs was signi�cantly lower in initial groups IF and IL and higher in groups F1Fand F1L from paddy �elds at 60 d. The number of OTUs was 17~48, representing more than 0.01% of the total OTUs (Table S1). Signi�cantdifferences were found in OTU composition among groups (Fig S1). Guts sampled at 120 d had few unique OTUs, both in the foregut andhindgut. The alpha diversity was calculated according to the composition and relative abundance of total OTUs. Generally, the alpha diversityindices of microbes in the hindgut were higher than those in the foregut. In addition, the alpha diversity was obviously lower in initial turtle gutsfrom greenhouses (p<0.05), whereas it was obviously higher in turtle guts sampled from paddy �elds than ponds and lakes (Fig. 1). The speciesand number of OTUs varied signi�cantly at 60 d, different from the relatively similar results across groups obtained at 120 d. The microbialabundance was higher in samples from paddy �elds than in samples from lakes and ponds during the experiment. The microbial communitypresented relatively high similarity in guts sampled at the same time. The PCoA (principal coordinate analysis) of the Bray-Curtis dissimilarityshowed high microbial community similarity in guts from the same individual or group and signi�cant discrepancy in samples from differenthabitats, sampling times and gut sections (Fig. 2). Generally, both sampling time and habitat affected the variation in the gut microbialcommunities.
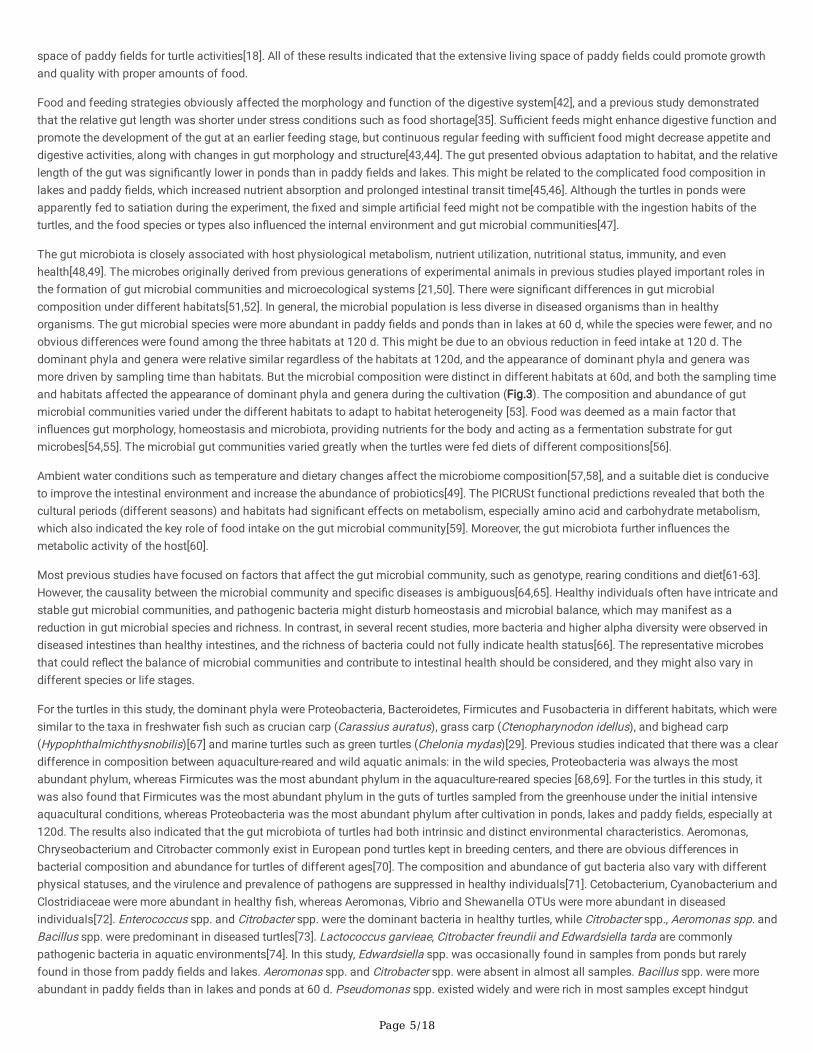
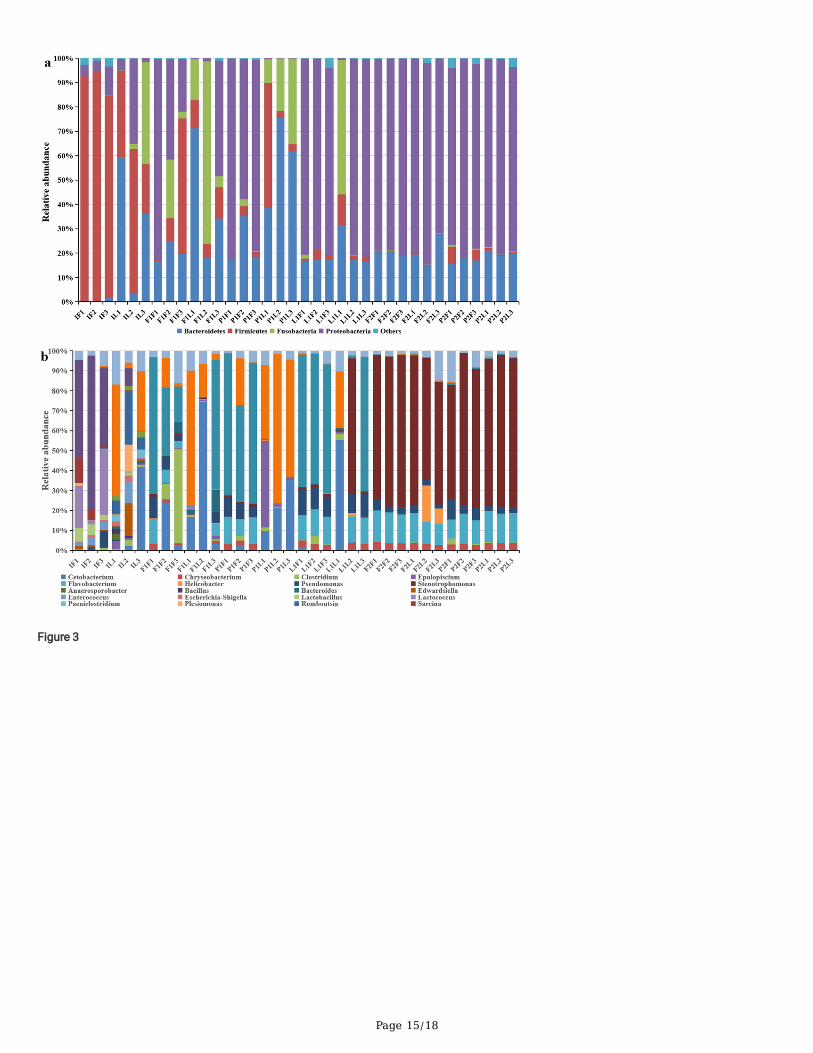
The recognized microbes belonged to 27 phyla, 59 classes, 97 orders, 151 families, and 219 genera from all the samples based on GreenGene.The phylum and genus levels were emphasized in the analysis. Bacteroidetes, Firmicutes, Fusobacteria and Proteobacteria were the mostdominant phyla, accounting for more than 95% of the total bacteria in all samples. Firmicutes was the most abundant phylum in the guts ofturtles sampled from the greenhouse initially, while Proteobacteria was the most abundant phylum after cultivation in different habitats,followed by Bacteroidetes. Firmicutes and Fusobacteria commonly existed at 60 d but were rarely present at 120 d in turtles from all threehabitats (Fig. 3a). Additionally, the unidenti�ed bacteria were more abundant in turtles from lakes than those from paddy �elds and ponds.
There was a signi�cant difference in dominant genera among initial samples and subsequent samples from different habitats. The dominantgenera in the initial samples were an unclassi�ed genus belonging to Bacteroidales, Romboutsia, Cetobacterium, Weissella, Lactococcus,Lactobacillus, Clostridium, Edwardsiella, Plesiomonas, and Sarcina. For samples from the three habitats mentioned above, the dominant generawere Cetobacterium, Chryseobacterium, Clostridium, Epulopiscium, Flavobacterium, Helicobacter, Pseudomonas, Stenotrophomonas andanother unclassi�ed genus belonging to Xanthomonadaceae. The abundance of dominant genera varied with habitat, sampling time and gutlocation. For turtles sampled from paddy �elds, the most dominant genus in foregut samples taken at 60 d was Clostridium, and in the hindgut,it was Cetobacterium, while at 120 d, the most dominant genus was Stenotrophomonas both in the foregut and hindgut. For turtles sampledfrom ponds, the most dominant genera at 60 d were Flavobacterium and Cetobacterium in the foregut and hindgut, while at 120 d, the mostdominant genus was also Stenotrophomonas. For turtles sampled from the lake, the most dominant genera at 60 d were Flavobacterium andCetobacterium in the foregut and hindgut, respectively (Fig. 3b).
Page 4/18
The dominant species in different gut locations were also distinct. In the foregut, the dominant species were Weissella cibaria, Enterococcusdurans, Lactobacillus sakei, Lactococcus lactis, Lactococcus garvieae, Sarcina sp. and Pseudomonas sp., whereas in the hindgut, Clostridiumsensu stricto, Romboutsia sp., Weissella cibaria, Escherichia coli, Plesiomonas shigelloides, Edwardsiella tarda, Paeniclostridium sp.,Cetobacterium sp., Terrisporobacter sp. and two other unclassi�ed species belonging to Bacteroidales were the most abundant.
Microbial communities in turtles from different habitats and at different sampling times
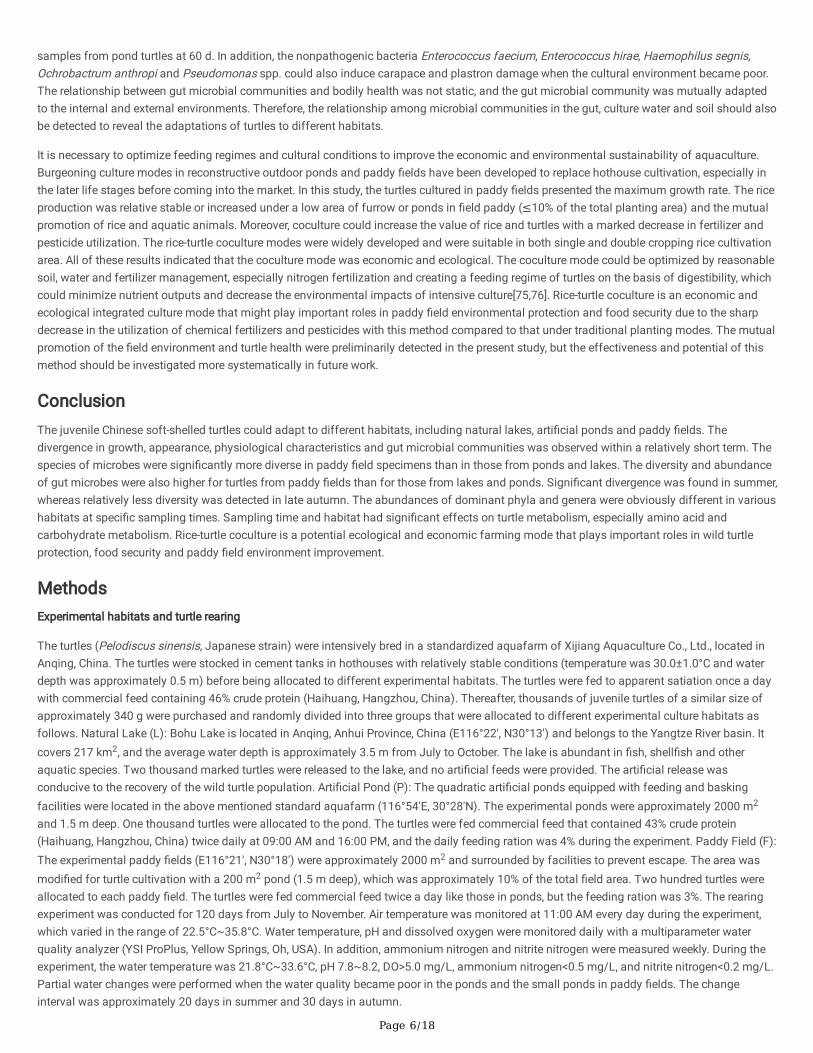
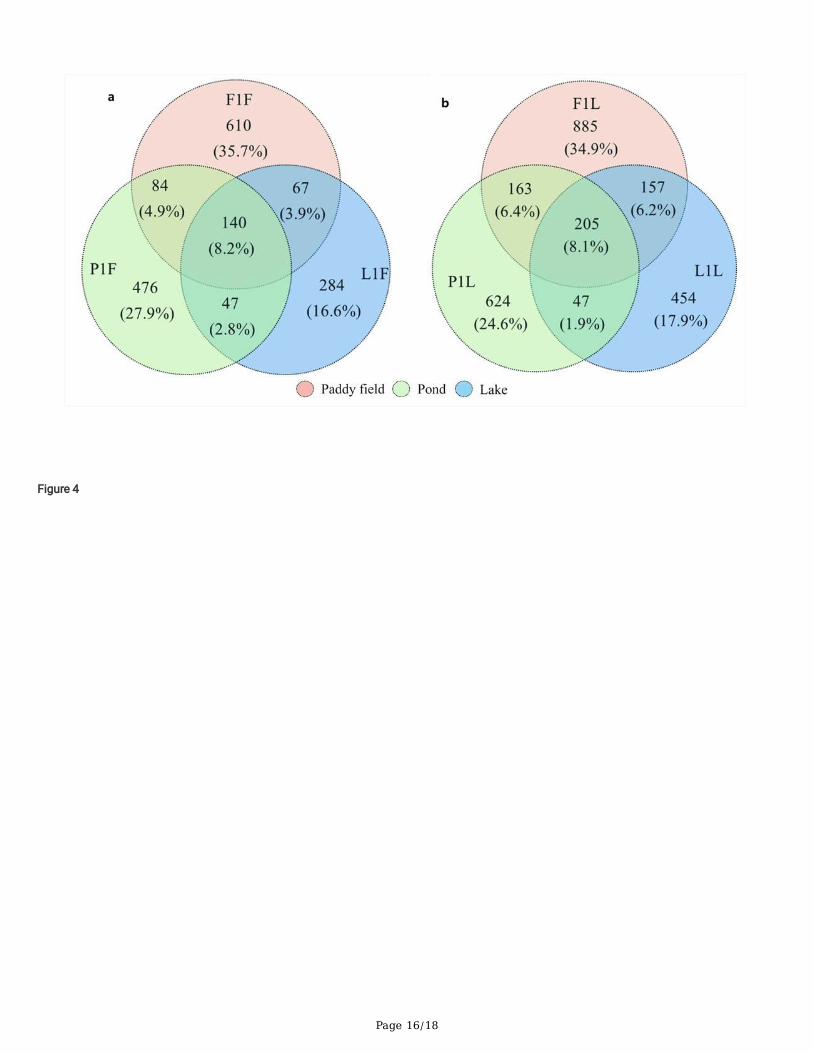
The microbial community was relatively complex at 60 d, especially in the foregut. At 60 d, the species of microbes were signi�cantly moreabundant in turtles from the �elds, followed by those from ponds and lakes. There were 140 common species (8.2%) in the foreguts of turtlesfrom the three different habitats (Fig. 4a); Flavobacterium sp., Pseudomonas sp., Chryseobacterium sp. and two species belonging toXanthomonadaceae were relatively abundant. Cetobacterium somerae was more abundant in turtles from paddy �elds than in those from pondsand lakes. For the hindgut, there were 205 common species (8.1%) in turtles from the three different habitats (Fig. 4b). Among these, one speciesbelonging to Bacteroidaceae was abundant in all habitats. Cetobacterium somerae, Epulopiscium sp., Pseudomonas sp., Stenotrophomonas sp.and Flavobacterium sp. were more abundant in turtles from paddy �elds and lakes than in ponds, while Clostridium sp. and Epulopiscium sp.were relatively abundant in specimens from ponds. Moreover, Chryseobacterium sp., Parabacteroides sp., Sphingobacterium faecium,Clostridium perfringens, Pseudomonas sp., Bacteroides sp. and Pseudomonas sp. commonly existed in samples from lakes and paddy �eldsbut did not appear in pond samples. At 120 d, speci�c foregut microbes were more abundant in pond turtles (74%) than paddy �eld turtles(33.4%), and the common species accounted for 18.6%; for the hindgut, speci�c microbes were more abundant in paddy �eld turtles (44%) thanpond turtles (34.4%), and the common species accounted for 26.1% (Fig. S2).
LEfSe analysis was also conducted to identify representative microbes among various groups. For the initial groups, representative genera wereWeissella, Cetobacterium, Chryseobacterium, Epulopiscium, Escherichia, Flavobacterium, Lactococcus, Leuconostoc, Plesiomonas, Romboutsia,Sarcina and Stenotrophomonas. For groups cultured in different habitats, F1L contained more different species than the other groups, includingmembers of Cetobacterium, Lactobacillaceae, Bacteroides, Parabacteroides, Plesiomonas, and several species belonging to the phylumFirmicutes presented higher LDA scores than those of the other groups. For F1F, the representative taxa were Sutterella, Bacteroides andClostridiales. For samples from the lake, Xanthomonadaceae and Pseudomonadales were representative taxa, especially at 60 d. Therepresentative microbes in pond turtles were numerous and belonged to various phyla, especially the phylum Proteobacteria, and someunassigned species were found turtles from this habitat (Fig. 5).
Functional predictions
The nearest sequenced taxon index (NSTI) was developed to quantify the availability of nearby genome representatives for groups (Table S2). Intotal, 41 predicted functional categories that represented 7 pathway maps in KEGG level 2 were indicated by PICRUSt (Fig. 6), including 330functions on level 3 (Fig.S3). Culture period and habitats had signi�cant effects on metabolism such as amino acid and carbohydratemetabolism, environmental and genetic information processing such as membrane transport, replication and repair. At 60 d, the functionalmicrobiota related to amino acid and carbohydrate metabolism was distinct higher in lake samples compared to those from ponds and paddy�elds(Fig. 6, Fig.S3).
DiscussionTurtles had the same general microbiota regardless of origin, body size and habitat and presented fast adaptation after allocation to differenthabitats[29]. The differentiation of growth, behavior and physiology of the homologous turtles appeared under different living habitats in a shortperiod. Environmental changes can substantially in�uence the gut microbiome[30,31]. The differences might be attributed to living space[6],water quality, food composition and abundance[32,33], and prey and predation conditions for different habitats[34,35]. Considering the similarityof natural conditions, such as geographical location, climate, rainfall and temperature, among the mentioned three habitats, the food intake andrelative living space might be the main factors determining the growth and physiology of turtles in this study[36,37]. Wild turtles arepredominantly carnivorous and prey on small �sh, mollusks, crustaceans, insects or their larvae, and occasionally some plant seeds, but foodabundance is affected by the aquatic environment, competitors and natural enemies [38,39]. In the present study, turtles in paddy �elds andponds were regularly fed arti�cial feeds, but no such feeds were provided for turtles in the lake during the experiment. In addition, gastropodsand insect larvae commonly exist as supplementary food in lakes and paddy �elds but rarely exist in ponds[40]. The stocking density in lakeswas undoubtedly lower than that in paddy �elds and ponds, and the lake environment was relatively stable with capacious water and lessdisturbance. However, more competitors, predators and parasites existed in the lake, , but negligible interspeci�c competition occurs in thishabitat[41]. The paddy �eld in this study was a complicated habitat with environmental features such as common �elds and ponds. The paddy�eld provided spacious living space, and rice plants served as shelter for turtles. The high growth rate of turtles in this habitat might be attributedto the relatively low stocking density and su�cient food in paddy �elds. He et al. (2017) demonstrated that the taste of turtles cultured in paddy�elds was better than that of turtles in cultured ponds based on the texture and chewiness of the meat, which might also be due to the broad
space of paddy �elds for turtle activities[18]. All of these results indicated that the extensive living space of paddy �elds could promote growthand quality with proper amounts of food.
Food and feeding strategies obviously affected the morphology and function of the digestive system[42], and a previous study demonstratedthat the relative gut length was shorter under stress conditions such as food shortage[35]. Su�cient feeds might enhance digestive function andpromote the development of the gut at an earlier feeding stage, but continuous regular feeding with su�cient food might decrease appetite anddigestive activities, along with changes in gut morphology and structure[43,44]. The gut presented obvious adaptation to habitat, and the relativelength of the gut was signi�cantly lower in ponds than in paddy �elds and lakes. This might be related to the complicated food composition inlakes and paddy �elds, which increased nutrient absorption and prolonged intestinal transit time[45,46]. Although the turtles in ponds wereapparently fed to satiation during the experiment, the �xed and simple arti�cial feed might not be compatible with the ingestion habits of theturtles, and the food species or types also in�uenced the internal environment and gut microbial communities[47].
The gut microbiota is closely associated with host physiological metabolism, nutrient utilization, nutritional status, immunity, and evenhealth[48,49]. The microbes originally derived from previous generations of experimental animals in previous studies played important roles inthe formation of gut microbial communities and microecological systems [21,50]. There were signi�cant differences in gut microbialcomposition under different habitats[51,52]. In general, the microbial population is less diverse in diseased organisms than in healthyorganisms. The gut microbial species were more abundant in paddy �elds and ponds than in lakes at 60 d, while the species were fewer, and noobvious differences were found among the three habitats at 120 d. This might be due to an obvious reduction in feed intake at 120 d. Thedominant phyla and genera were relative similar regardless of the habitats at 120d, and the appearance of dominant phyla and genera wasmore driven by sampling time than habitats. But the microbial composition were distinct in different habitats at 60d, and both the sampling timeand habitats affected the appearance of dominant phyla and genera during the cultivation (Fig.3). The composition and abundance of gutmicrobial communities varied under the different habitats to adapt to habitat heterogeneity [53]. Food was deemed as a main factor thatin�uences gut morphology, homeostasis and microbiota, providing nutrients for the body and acting as a fermentation substrate for gutmicrobes[54,55]. The microbial gut communities varied greatly when the turtles were fed diets of different compositions[56].
Ambient water conditions such as temperature and dietary changes affect the microbiome composition[57,58], and a suitable diet is conduciveto improve the intestinal environment and increase the abundance of probiotics[49]. The PICRUSt functional predictions revealed that both thecultural periods (different seasons) and habitats had signi�cant effects on metabolism, especially amino acid and carbohydrate metabolism,which also indicated the key role of food intake on the gut microbial community[59]. Moreover, the gut microbiota further in�uences themetabolic activity of the host[60].
Most previous studies have focused on factors that affect the gut microbial community, such as genotype, rearing conditions and diet[61-63].However, the causality between the microbial community and speci�c diseases is ambiguous[64,65]. Healthy individuals often have intricate andstable gut microbial communities, and pathogenic bacteria might disturb homeostasis and microbial balance, which may manifest as areduction in gut microbial species and richness. In contrast, in several recent studies, more bacteria and higher alpha diversity were observed indiseased intestines than healthy intestines, and the richness of bacteria could not fully indicate health status[66]. The representative microbesthat could re�ect the balance of microbial communities and contribute to intestinal health should be considered, and they might also vary indifferent species or life stages.
For the turtles in this study, the dominant phyla were Proteobacteria, Bacteroidetes, Firmicutes and Fusobacteria in different habitats, which weresimilar to the taxa in freshwater �sh such as crucian carp (Carassius auratus), grass carp (Ctenopharynodon idellus), and bighead carp(Hypophthalmichthysnobilis)[67] and marine turtles such as green turtles (Chelonia mydas)[29]. Previous studies indicated that there was a cleardifference in composition between aquaculture-reared and wild aquatic animals: in the wild species, Proteobacteria was always the mostabundant phylum, whereas Firmicutes was the most abundant phylum in the aquaculture-reared species [68,69]. For the turtles in this study, itwas also found that Firmicutes was the most abundant phylum in the guts of turtles sampled from the greenhouse under the initial intensiveaquacultural conditions, whereas Proteobacteria was the most abundant phylum after cultivation in ponds, lakes and paddy �elds, especially at120d. The results also indicated that the gut microbiota of turtles had both intrinsic and distinct environmental characteristics. Aeromonas,Chryseobacterium and Citrobacter commonly exist in European pond turtles kept in breeding centers, and there are obvious differences inbacterial composition and abundance for turtles of different ages[70]. The composition and abundance of gut bacteria also vary with differentphysical statuses, and the virulence and prevalence of pathogens are suppressed in healthy individuals[71]. Cetobacterium, Cyanobacterium andClostridiaceae were more abundant in healthy �sh, whereas Aeromonas, Vibrio and Shewanella OTUs were more abundant in diseasedindividuals[72]. Enterococcus spp. and Citrobacter spp. were the dominant bacteria in healthy turtles, while Citrobacter spp., Aeromonas spp. andBacillus spp. were predominant in diseased turtles[73]. Lactococcus garvieae, Citrobacter freundii and Edwardsiella tarda are commonlypathogenic bacteria in aquatic environments[74]. In this study, Edwardsiella spp. was occasionally found in samples from ponds but rarelyfound in those from paddy �elds and lakes. Aeromonas spp. and Citrobacter spp. were absent in almost all samples. Bacillus spp. were moreabundant in paddy �elds than in lakes and ponds at 60 d. Pseudomonas spp. existed widely and were rich in most samples except hindgut
Page 6/18
samples from pond turtles at 60 d. In addition, the nonpathogenic bacteria Enterococcus faecium, Enterococcus hirae, Haemophilus segnis,Ochrobactrum anthropi and Pseudomonas spp. could also induce carapace and plastron damage when the cultural environment became poor.The relationship between gut microbial communities and bodily health was not static, and the gut microbial community was mutually adaptedto the internal and external environments. Therefore, the relationship among microbial communities in the gut, culture water and soil should alsobe detected to reveal the adaptations of turtles to different habitats.
It is necessary to optimize feeding regimes and cultural conditions to improve the economic and environmental sustainability of aquaculture.Burgeoning culture modes in reconstructive outdoor ponds and paddy �elds have been developed to replace hothouse cultivation, especially inthe later life stages before coming into the market. In this study, the turtles cultured in paddy �elds presented the maximum growth rate. The riceproduction was relative stable or increased under a low area of furrow or ponds in �eld paddy (≤10% of the total planting area) and the mutualpromotion of rice and aquatic animals. Moreover, coculture could increase the value of rice and turtles with a marked decrease in fertilizer andpesticide utilization. The rice-turtle coculture modes were widely developed and were suitable in both single and double cropping rice cultivationarea. All of these results indicated that the coculture mode was economic and ecological. The coculture mode could be optimized by reasonablesoil, water and fertilizer management, especially nitrogen fertilization and creating a feeding regime of turtles on the basis of digestibility, whichcould minimize nutrient outputs and decrease the environmental impacts of intensive culture[75,76]. Rice-turtle coculture is an economic andecological integrated culture mode that might play important roles in paddy �eld environmental protection and food security due to the sharpdecrease in the utilization of chemical fertilizers and pesticides with this method compared to that under traditional planting modes. The mutualpromotion of the �eld environment and turtle health were preliminarily detected in the present study, but the effectiveness and potential of thismethod should be investigated more systematically in future work.
ConclusionThe juvenile Chinese soft-shelled turtles could adapt to different habitats, including natural lakes, arti�cial ponds and paddy �elds. Thedivergence in growth, appearance, physiological characteristics and gut microbial communities was observed within a relatively short term. Thespecies of microbes were signi�cantly more diverse in paddy �eld specimens than in those from ponds and lakes. The diversity and abundanceof gut microbes were also higher for turtles from paddy �elds than for those from lakes and ponds. Signi�cant divergence was found in summer,whereas relatively less diversity was detected in late autumn. The abundances of dominant phyla and genera were obviously different in varioushabitats at speci�c sampling times. Sampling time and habitat had signi�cant effects on turtle metabolism, especially amino acid andcarbohydrate metabolism. Rice-turtle coculture is a potential ecological and economic farming mode that plays important roles in wild turtleprotection, food security and paddy �eld environment improvement.
MethodsExperimental habitats and turtle rearing
The turtles (Pelodiscus sinensis, Japanese strain) were intensively bred in a standardized aquafarm of Xijiang Aquaculture Co., Ltd., located inAnqing, China. The turtles were stocked in cement tanks in hothouses with relatively stable conditions (temperature was 30.0±1.0°C and waterdepth was approximately 0.5 m) before being allocated to different experimental habitats. The turtles were fed to apparent satiation once a daywith commercial feed containing 46% crude protein (Haihuang, Hangzhou, China). Thereafter, thousands of juvenile turtles of a similar size ofapproximately 340 g were purchased and randomly divided into three groups that were allocated to different experimental culture habitats asfollows. Natural Lake (L): Bohu Lake is located in Anqing, Anhui Province, China (E116°22′, N30°13′) and belongs to the Yangtze River basin. Itcovers 217 km2, and the average water depth is approximately 3.5 m from July to October. The lake is abundant in �sh, shell�sh and otheraquatic species. Two thousand marked turtles were released to the lake, and no arti�cial feeds were provided. The arti�cial release wasconducive to the recovery of the wild turtle population. Arti�cial Pond (P): The quadratic arti�cial ponds equipped with feeding and baskingfacilities were located in the above mentioned standard aquafarm (116°54′E, 30°28′N). The experimental ponds were approximately 2000 m2
and 1.5 m deep. One thousand turtles were allocated to the pond. The turtles were fed commercial feed that contained 43% crude protein(Haihuang, Hangzhou, China) twice daily at 09:00 AM and 16:00 PM, and the daily feeding ration was 4% during the experiment. Paddy Field (F):The experimental paddy �elds (E116°21′, N30°18′) were approximately 2000 m2 and surrounded by facilities to prevent escape. The area wasmodi�ed for turtle cultivation with a 200 m2 pond (1.5 m deep), which was approximately 10% of the total �eld area. Two hundred turtles wereallocated to each paddy �eld. The turtles were fed commercial feed twice a day like those in ponds, but the feeding ration was 3%. The rearingexperiment was conducted for 120 days from July to November. Air temperature was monitored at 11:00 AM every day during the experiment,which varied in the range of 22.5°C~35.8°C. Water temperature, pH and dissolved oxygen were monitored daily with a multiparameter waterquality analyzer (YSI ProPlus, Yellow Springs, Oh, USA). In addition, ammonium nitrogen and nitrite nitrogen were measured weekly. During theexperiment, the water temperature was 21.8°C~33.6°C, pH 7.8~8.2, DO>5.0 mg/L, ammonium nitrogen<0.5 mg/L, and nitrite nitrogen<0.2 mg/L.Partial water changes were performed when the water quality became poor in the ponds and the small ponds in paddy �elds. The changeinterval was approximately 20 days in summer and 30 days in autumn.
Page 7/18
Measurement and sampling
Turtles were randomly collected at 0 d and 60 d, and then as many as possible were collected at 120 d for measurement. The turtles collectedfrom different habitats were randomly numbered, the investigator who selected individuals for analysis was unaware of the grouping details,and another investigator (also unaware of grouping details) conducted the anesthetic and anatomical procedures. Every three male individualswith no trauma, bruises or scars from each habitat and cultural periods were collected for sampling. The turtles were anesthetized after 48 h offasting by intramuscular injection with tiletamine and zolazepam (1:1) at a dosage of 30 mg/kg. The turtles were under deep anesthesia andunconscious within 15-20 min after injection from the left foreleg. The somatotype index, including body weight, carapace length, carapacewidth and calipash lateral width, was measured. Then, turtles were quickly decapitated in an unconscious state and dissected by sharp boneshears. The livers, clumpy fat, and guts were carefully removed on ice and weighed under sterile conditions. Gut length, i.e., the length from theend of the esophagus to the end of the rectum were separated and made straight and then measured without tensile force by using an electronicVernier caliper (Guanglu. Guilin, China). The gastrointestinal tract of turtle is structurally complex and the morphology, digestive function aredifferent in different intestine parts. In view of the microbes in former parts of intestinal may more affected by environmental factors such asfood composition and abundant microbes in later gut. We chose both gastric area and rectum as objects of study to compare the differences onmicrobial composition and dynamic variation in different habitats and sampling time. The gastric area (expressed as foregut “F”) and rectum(expressed as hindgut “L”) were separated, rapidly frozen in liquid nitrogen, and then stored at -80°C until DNA extraction for microbial analysis.The grouping details are listed in Table 2. The speci�c growth rate (SGR), hepato-somatic index (HSI), fat-somatic index (FSI), and gut-somaticindex of weight (DSIW) and length (DSIL) were calculated. All operations on turtles were conducted in accordance with the institutional animalcare guidelines and the supervision of Anhui Academy of Agricultural Sciences committees.
Bacterial DNA extraction and 16S rRNA gene amplicon sequencing
Bacterial DNA extraction was conducted using a TIANamp Stool DNA Kit (DP328, TIANGEN, Beijing, China) according to the manufacturer'sinstructions. The V4~V5 variable region of the 16S rRNA gene was ampli�ed by the bacterial primers 515F (5'-GTGCCAGCMGC CGCGGTAA-3')and 907R (5'-CCGTCAATTCMTTTRAGT TT-3') with overhang adapters attached. The PCRs (25 μL) contained approximately 2.5 μL DNAtemplates (5 ng/μL), 5.0 μL reverse/forward primer (1 μM), and 12.5 μL 2×KAPA HiFi HotStart Ready Mix. PCR was performed on a Step OnePlus Real-time PCR System (Thermo Fisher Scienti�c, Waltham, MA, USA) with the following program: 95°C for 3 minutes, followed by 25 cyclesof 30 sec at 95°C, 30 sec at 55°C, and 30 sec at 72°C with a postampli�cation extension of 10 min at 72°C. The products were con�rmed byagarose gel electrophoresis (Peiqing, Shanghai, China). AMPure XP beads (Beckman Coulter, Indianapolis, IN, USA) and fresh 80% EtOH wereused to purify the 16S V4 and V5 amplicons away from free primers and primer dimer species for index PCR. Dual indices and Illuminasequencing adapters were attached by using the Nextera XT Index Kit (FC-131-1002, Illumina, San Diego, CA, USA). PCR was performed on athermal cycler using the following program: 95°C for 3 minutes, followed by 8 cycles of 30 sec at 95°C, 30 seconds at 55°C, and 30 sec at 72°Cwith a postampli�cation extension of 5 min at 72°C. AMPure XP beads were used to clean up the �nal library before quanti�cation,normalization and pooling. The puri�ed bacterial DNA samples were sent to Sangon Biotech Co., Ltd. (Shanghai, China) for Illumina MiSeqsequencing.
16S Metagenomics sequencing analysis
The sequencing analysis methods were mainly as described by Campos et al. (2018) and Abdelrhman et al. (2016)[29,77]. The obtained DNAreads were compiled in FastQC version 0.11.5 for further processing. QIIME version 1.9.1 was used for microbiome analysis of raw DNAsequencing data, including demultiplexing and quality �ltering, OTU picking, taxonomic assignment, phylogenetic reconstruction, diversityanalyses and visualizations. The barcode and primer sequences were cut off after the samples were loaded, read pairs were merged usingPANDAseq assembler version 2.10 for raw tags, and the sequences were �ltered if there was no overlap between them. Then, the chimeras andhost sequences were further �ltered for clean tags. Singletons were removed before operational taxonomical unit (OTU) clustering (with anidentity threshold of 97%). The valid data were clustered into OTUs using UPARSE. The rarefaction curves for each sample were produced, anddiversity values were estimated. The distances among samples were calculated according to the abundance, and the samples were clustered onOTUs to evaluate the similarity. The cluster dendrogram and a phylogenetic tree were also built. Speci�c differences in community compositionwere determined using PCoA based on the Bray-Curtis distance matrix. OTUs were taxonomically classi�ed using USEARCH (a unique sequenceanalysis tool) version 5.2.236 against GreenGenes databases and compiled into each taxonomic level. The composition, abundance anddiversity analyses of OTUs were conducted for the species richness and evenness and mutual or proper traits of OTUs for various samples orgroups. A test of the signi�cance of differences in OTU composition was conducted using LEfSe analysis to identify the various species. Theprediction of microbial community function was conducted by using PICRUSt to evaluate the abundance of functional genes in the samples.
Statistical analysis
All differences among biometric measurements were determined by analysis of variance (ANOVA) using SPSS 20.0. The measured data weresubjected to one-way ANOVA. Differences among treatments were tested by Tukey's multiple range test, and p < 0.05 indicated statistically
Page 8/18
signi�cant differences. Duncan's multiple comparison was carried out to determine the difference among repeated groups. All statistics on gutmicrobiota were conducted by using R (version 3.2.2).
Abbreviations16S rRNA: 16S ribosomal RNA; OTU: Operational taxonomic unit; PCA: Principal component analysis; ANOVA: Analysis of variance; LEfSe: Lineardiscriminant analysis coupled with effect size; LDA: Liner discriminant analysis; PICRUSt: Phylogenetic Investigation of Communities byReconstruction of Unobserved States.
DeclarationsEthics approval and consent to participate
The experimental protocol was established, according to the ethical guidelines of the Basel Declaration and was approved by the ExperimentalAnimal Welfare and Ethical of Anhui Academy of Agricultural Sciences (NO.AAAS 2020-11).
Consent for publication
Not applicable.
Availability of data and materials
All data generated or analyzed during this study are included in this published article [and its supplementary information �les]. Raw sequencedata on 16s RNA gene had been submitted to the NCBI Sequence Read Archive (SRA) with the accession number PRJNA639398(http://trace.ncbi.nlm.nih.gov/Traces/sra/).
Competing interests
The authors declare that they have no competing interests.
Funding
This work was supported by National Key Research and Development Project of China [2018YFD0300904-4], Key Research and DevelopmentProjects in Anhui Province [1704g07020118] and National Natural Science Foundation of China [51709225]. The funding agencies had no rolein the study design, samples and data collection, analysis, and manuscript preparation.
Authors’ contributions
JXH and BLW designed the work, BLW drafted the manuscript, LH collected samples and performed the study, JC and YZ acquired importantphysiological and environmental data, JW revised the manuscript and provided effective suggestions on data analysis. All authors read andapproved the �nal manuscript.
Acknowledgements
We sincerely thank Xiang Wang and Song Wu for their assistance in sampling and environmental factors collection.
Authors' Information
Corresponding author Prof. Jixiang He is the deputy director of Fisheries Research Institute, Anhui Academy of Agricultural Sciences, and themajor research directions are healthy aquaculture and nutrient physiology of aquatic animals.
Dr. Benli Wu, Long Huang, Jing Chen and Ye Zhang are research assistants at Fisheries Research Institute, Anhui Academy of AgriculturalSciences, and the research directions involve aquatic animal nutrition and environment, aquatic ecology and aquaculture.
Dr. Jun Wang is a lecturer at State Key Laboratory of Eco-hydraulic in Northwest Arid Region of China, and the research directions were �shecology and aquatic resource protection.
References1. Nagai N, Kobayashi H, Katayama S et al. Preparation and characterization of collagen from soft-shelled turtle (Pelodiscus Sinensis) skin for
biomaterial applications. J Biomater Sci Polym Ed 2009;20:567-76.
2. Lu JF, Wan Q, Yin ZM et al. Extraction and characterization of collagen from calipash of Chinese soft-shelled turtle (Pelodiscus sinensis).Journal of Fisheries of China 2010;34: 801-8 (in Chinese with English Abstract).
3. Rhodin AGJ, Iverson R, Bour U, Fritz A, Georges HB, Shaffer PPV, Dijk JB. 2017. Turtles of the world annotated checklist and atlas oftaxonomy, synonymy, distribution, and conservation status. 8th ed. Baltimore:Johns Hopkins University Press.
4. Zhang J, Wang F, Jiang YL et al. Modern greenhouse culture of juvenile soft-shelled turtle, Pelodiscus sinensis. Aquacul Int 2017;25:1607-24.
5. Weng LP, Chen FD, Wang HH et al. Investigation on the volatile �avor compounds of Pelodiscus sinensis grown in greenhouse by SPME-GC-MS. Food Industry 2014;35:266-9 (in Chinese with English Abstract).
�. Chen X, Niu C, Pu L. Effects of stocking density on growth and non-speci�c immune responses in juvenile soft-shelled turtle, Pelodiscussinensis. Aquacul Res 2007; 38:1380-6.
7. Zhou XQ, Niu CJ, Sun RY. The effects of vitamin E on non-speci�c immune response of the juvenile soft-shelled turtle Pelodiscus sinensis.Fisheries Sci 2010;71:612-7.
�. Zhou XQ, Niu CJ, Sun RY. The effect of vitamin C on stress withstanding capability in the juvenile soft-shelled turtle (Pelodiscus sinensis).Aquacul Nutr 2015;11:169-74.
9. Montalban-Arques A, Schryver PD, Bossier P et al. Selective manipulation of the gut microbiota improves immune status in vertebrates.Front Immuno 2015;6:512.
10. Standen B, Rodiles A, Peggs D et al. Modulation of the intestinal microbiota and morphology of tilapia, Oreochromis niloticus, following theapplication of a multi-species probiotic. Appl Microbiol Biot 2015;99:8403-17.
11. Cabello FC. Heavy use of prophylactic antibiotics in aquaculture: a growing problem for human and animal health and for the environment.Environ microbiol 2006; 8:1137-44.
12. Brandt KK, Amézquita A, Backhaus T et al. Ecotoxicological assessment of antibiotics: A call for improved consideration ofmicroorganisms. Environ Int 2015;85:189-205.
13. Patil HJ, Ayana BP, Alon N et al. Evidence of increased antibiotic resistance in phylogenetically-diverse aeromonas isolates from semi-intensive �sh ponds treated with antibiotics. Front Microbiol 2016;7:1875.
14. Adel M, Yeganeh S, Dawood MAO et al. Effects of Pediococcus pentosaceus supplementation on growth performance, intestinal micro�oraand disease resistance of white shrimp, Litopenaeus vannamei. Aquacult Nutr 2017; 23:1401-9.
15. Chua MC, Benamor K, Lay C et al. Effect of synbiotic on the gut microbiota of caesarean delivered infants: a randomized, double-blind,multicenter study. J Pediatr Gastr Nutr 2017;65:102-6.
1�. De Bruijn I, Liu Y, Wiegertjes GF et al. Exploring �sh microbial communities to mitigate emerging diseases in aquaculture. FEMS MicrobiolEcol 2018;94: �x161.
17. Guerreiro I, Serra CR, Pousão-Ferreira P et al. Prebiotics effect on growth performance, hepatic intermediary metabolism, gut microbiota anddigestive enzymes of white sea bream (Diplodus sargus). Aquacul Nutr 2018;24:153-63.
1�. He JX, Chen J, Song GT et al. Comparison of nutritional composition and quality between the paddy-cultured and pond-cultured Pelodiscussinensis Japanese strain. Journal of Anhui Agricultural University 2017;44:1005-9 (in Chinese with English Abstract).
19. Marques TM, Wall R, Ross RP et al. Programming infant gut microbiota: in�uence of dietary and environmental factors. Curr Opin in Biotech2010;21:149-56.
20. Vrieze A, Holleman F, Zoetendal EG et al. The environment within: how gut microbiota may in�uence metabolism and body composition.Diabetologia 2010;53:606-13.
21. Snijders AM, Langley SA, Kim YM et al. In�uence of early life exposure, host genetics and diet on the mouse gut microbiome andmetabolome. Nat Microbiol 2016;2:16221.
22. Xiong JB, Nie L, Chen J. Current understanding on the roles of gut microbiota in �sh disease and immunity. Zool Res 2019;40:70-6.
23. Frei M , Becker Integrated rice-�sh culture: Coupled production saves resources. Nat Resour Forum 2005; 29:135-43.
24. Tsuruta T, Yamaguchi M, Abe SI et al. Effect of �sh in rice-�sh culture on the rice yield. Fisheries Sci. 2011;77:95-106.
25. Hu L, Zhang J, Tang JJ et al. The productivity of traditional rice-�sh co-culture can be increased without increasing nitrogen loss to theenvironment. Agr Ecosys Enviro 2013;177:28-34.
2�. Ghanbari M, Kneifel W, Domig KJ. A new view of the �sh gut microbiome: advances from next-generation sequencing. Aquaculture2015;448:464-75.
27. Sullam KE, Essinger SD, Lozupone CA et al. Environmental and ecological factors that shape the gut bacterial communities of �sh: a meta-analysis. Mol Ecol 2012;21:3363-78.
Page 10/18
2�. De Bruijn I, Liu Y, Wiegertjes GF, et al. Exploring �sh microbial communities to mitigate emerging diseases in aquaculture. FEMS MicrobiolEcol 2017;94:�x161.
29. Campos P, Guivernau M, Prenafeta-Boldú FX et al. Fast acquisition of a polysaccharide fermenting gut microbiome by juvenile green turtlesChelonia mydas after settlement in coastal habitats. Microbiome 2018;6:69.
30. Stecher B, Maier L, Hardt W-D. ‘Blooming’ in the gut: how dysbiosis might contribute to pathogen evolution. Nat Rev Microbiol 2013;11:277-84.
31. Yan Q, Li J, Yu Y et al. Environmental �ltering decreases with �sh development for the assembly of gut microbiota. Environ Microbiol2016;18:4739-54.
32. Fazeli M, Hassanzadeh P, Alaei S. Cadmium chloride exhibits a profound toxic effect on bacterial micro�ora of the mice gastrointestinaltract. Hum Exp Toxicol 2011;30: 152-9.
33. Clarke SF, Murphy EF, O'Sullivan O et al. Exercise and associated dietary extremes impact on gut microbial diversity. Gut 2014;63:1913-20.
34. Lee SM, Wong WP, Hiong KC et al. Nitrogen metabolism and excretion in the aquatic Chinese soft-shelled turtle, Pelodiscus sinensis,exposed to a progressive increase in ambient salinity. J Exp Zool Part A 2010; 305A:995-1009.
35. Zha Y, Eiler A, Johansson F et al. Effects of predation stress and food ration on perch gut microbiota. Microbiome 2018;6:28.
3�. Kim SG, Han XY, Wei D et al. In�uence of Cu2+-loaded silicate on the growth performance and micro�ora of crucian carp Carassius auratus.Dis Aquat Organ 2009;85: 239-43.
37. Baldo L, Joan LR, Toomingklunderud A et al. Gut microbiota dynamics during dietary shift in eastern African cichlid �shes. PLoS One2015;10: e0127462.
3�. Cremona F, Järvalt A, Bhele U et al. Relationships between �sheries, foodweb structure, and detrital pathway in a large shallow lake.Hydrobiologia 2018;820:145-63.
39. Koomen R, Herrmann E. The effects of social context and food abundance on chimpanzee feeding competition. AM J of Primatol 2018;80:e22734.
40. Wang CF, Wang JP, Cao CG. Effect of rice-duck farming ecosystem on zoobenthos biodiversity in paddy �eld. Chinese Journal of Eco-Agriculture 2008;16:933-7 (in Chinese with English Abstract).
41. Bartrons M, Arranz I, Cañedo-Argüelles M et al. Fish shift the feeding behaviour and trophic niche diversi�cation of their prey in subarcticLake Mývatn, Iceland. Hydrobiologia 2018;816:896-906.
42. Lei SJ. Effects of ration level and feeding frequency on digestibility in juvenile soft-shelled turtle, Pelodiscus sinensis. J Zhejiang Univ B2006;7:580-5 (in Chinese with English Abstract).
43. Wu BL, Luo S, Wang JW. Effects of temperature and feeding frequency on ingestion and growth for rare minnow. Physiol Behav2015;140:197-202.
44. Serra CR, Júnior FM, Couto A et al. Gut microbiota and gut morphology of gilthead sea bream (Sparus aurata) juveniles are not affected bychromic oxide as digestibility marker. Aquacul Res 2018;49:1347-56.
45. Lin WY, Huang CH. Fatty acid composition and lipid peroxidation of soft-shelled turtle, Pelodiscus sinensis, fed different dietary lipid source.Comp Biochem Phys C 2007;144:327-33.
4�. Li XH, Zhou L, Yu YH et al. Composition of gut microbiota in the gibel carp (Carassius auratus gibelio) varies with host development.Microbl Ecol 2017;74: 1-11.
47. Wu GD, Chen J, Hoffmann C et al. Linking long-term dietary patterns with gut microbial enterotypes. Science 2011;334:105-8.
4�. Merri�eld DL, Shaw BJ, Harper GM et al. Ingestion of metal-nanoparticle contaminated food disrupts endogenous microbiota in zebra�sh(Danio rerio). Environ Pollut 2013;174:157-63.
49. Zhou Z, Ringø E, Olsen RE et al. Dietary effects of soybean products on gut microbiota and immunity of aquatic animals: A review. AquaculNutr 2018;24:644-65.
50. Goodrich JK, Davenport ER, Beaumont M et al. Genetic determinants of the gut microbiome in UK twins. Cell Host Microbe 2016;19:731-43.
51. Rawls JF, Mahowald MA, Ley RE et al. Reciprocal gut microbiota transplants from zebra�sh and mice to germ-free recipients reveal hosthabitat selection. Cell 2006;127:423-33.
52. Nelson TM, Rogers TL, Carlini AR et al. Diet and phylogeny shape the gut microbiota of Antarctic seals: a comparison of wild and captiveanimals. Environ Microbiol 2013;15:1132-45.
53. Smith CC, Snowberg LK, Gregory CJ et al. Dietary input of microbes and host genetic variation shape among-population differences instickleback gut microbiota. ISME J 2015;9:2515-26.
54. Stagaman K, Burns A R, Guillemin K et al. The role of adaptive immunity as an ecological �lter on the gut microbiota in zebra�sh. ISME J2017;11:1360-9.
Page 11/18
55. Masuoka H, Shimada K, Kiyosueyasuda T et al. Transition of the intestinal microbiota of dogs with age. Bioscience of Microbiota Food andHealth 2017;36:27-31.
5�. Schmidt V, Amaral-Zettler L, Davidson J et al. In�uence of �shmeal-free diets on microbial communities in Atlantic salmon (Salmo salar)recirculation aquaculture systems. Appl Environ Microb 2016;82:4470-81.
57. Hatje E, Neuman C, Stevenson H et al. Population dynamics of Vibrio and Pseudomonas species isolated from farmed tasmanian Atlanticsalmon (Salmo salar L.): a seasonal study. Microb Ecol 2014;68:679–87.
5�. Zarkasi KZ, Taylor RS, Abell GC et al. Atlantic salmon (Salmo salar L.) gastrointestinal microbial community dynamics in relation to digestaproperties and diet. Microb Ecol 2016;71:589–603.
59. Maurice CF, Cl Knowles S, Ladau J et al. Marked seasonal variation in the wild mouse gut microbiota. ISME J 2015;9:2423-34.
�0. Patrick S, Willemsen D, Popkes M et al. Regulation of life span by the gut microbiota in the short-lived African turquoise killi�sh. eLife2017;6: e27014.
�1. Zhang C. Interactions between gut microbiota, host genetics and diet relevant to development of metabolic syndromes in mice. ISME J2010;4:232-41.
�2. Kuz’mina VV, Zolotareva GV, Sheptitskii Effect of habitat conditions on proteinase and glycosidase activities in the gut microbiota of cruciancarp in a wide range of pH. Russ J Ecol 2014;45:303-9.
�3. Wang S, Chen L, He M et al. Different rearing conditions alter gut microbiota composition and host physiology in Shaoxing ducks. Sci Rep-UK 2018;8:7387.
�4. Turnbaugh PJ, Ley RE, Mahowald MA et al. An obesity-associated gut microbiome with increased capacity for energy harvest. Nature 444:1027-31.
�5. Zhao LP. The gut microbiota and obesity: from correlation to causality. Nat Rev Microbio 2013;11: 639-47.
��. Tran NT, Zhang J, Xiong F et al. Altered gut microbiota associated with intestinal disease in grass carp (Ctenopharyngodon idellus). World JMicrobiol Biot 2018;34:71.
�7. Li XM, Yan QY, Xie SQ et al. Gut microbiota contributes to the growth of fast-growing transgenic common carp (Cyprinus carpio L.). PLoSOne 2013;8: e64577.
��. Ramírez C, Romero J. Fine �ounder (Paralichthys adspersus) microbiome showed important differences between wild and rearedspecimens. Front Microbiol 2017;8:271.
�9. Wang AR, Ran C, Ringø E et al. Progress in �sh gastrointestinal microbiota research. Rev Aquac. 2017;10:626-40.
70. Nowakiewicz A, Ziółkowska G, Zięba P et al. Aerobic bacterial microbiota isolated from thecloaca of the European pond turtle (Emysorbicularis) in Poland. J Wildlife Dis 2015;51:255-9.
71. Ahasan MS, Waltzek TB, Huerlimann R et al. Comparative analysis of gut bacterial communities of green turtles (Chelonia mydas) pre-hospitalization and post-rehabilitation by high-throughput sequencing of bacterial 16S rRNA gene. Microbiol Res 2018; 207:91-9.
72. Li T, Li H, Gatesoupe FJ et al. Bacterial signatures of “Red Operculum” disease in the gut of crucian carp (Carassius auratus). Microb Ecol2017;74:510-21.
73. Zhu NY, Bei YJ, Zheng TL et al. Comparison of bacteria �oras in intestines of healthy and diseased Chinese soft-shelled turtles (Pelodiscussinensis) and in aquatic water. Acta Agriculturae Zhejiangensis 2014;26:1176-9 (in Chinese with English Abstract).
74. Barelli C, Albanese D, Donati C et al. Habitat fragmentation is associated to gut microbiota diversity of an endangered primate: implicationsfor conservation. Sci Rep-UK 2015;5:14862.
75. Lee SM, Wong WP, Loong AM et al. Postprandial increases in nitrogenous excretion and urea synthesis in the Chinese soft-shelled turtle,Pelodiscus sinensis. J Comp Physiol B 2007;177:19-29.
7�. Wang J, Qi Z, Yang Z. Evaluation of the protein requirement of juvenile Chinese soft-shelled turtle (Pelodiscus sinensis, Wiegmann) fed withpractical diets. Aquaculture 2014; 433:252-5.
77. Abdelrhman KFA, Giovanni B, Cecilia M et al. A �rst insight into the gut microbiota of the sea turtle Caretta caretta. Front Microbiol 2016;7.
TablesTable1 The anatomical indices of turtles from different habitats and cultured days
The letters or numbers in groups names indicated "Habitat", "Sampling time"and "Gut segment" , respectively, which were also shown in theparentheses. Body weight here was average body weight of the three sampled turtles for each groups.
Figures
Figure 1
Page 14/18
Figure 2
Page 15/18
Figure 3
Page 16/18
Figure 4
Page 17/18
Figure 5
Page 18/18
Figure 6
Supplementary Files
This is a list of supplementary �les associated with this preprint. Click to download.