Abstract: Gut microbiota and biological rhythms are emerging as key factors in the modulation ofseveral physiological and metabolic processes. However, little is known about their interaction andhow this may affect host physiology and metabolism. Several studies have shown oscillations of gutmicrobiota that follows a circadian rhythmicity, but, in contrast, variations due to seasonal rhythmshave not been sufficiently investigated yet. Thus, the goal of this study was to investigate the impactof different photoperiods, which mimic seasonal changes, on fecal microbiota composition and howthis interaction affects diet-induced obesity development. To this aim, Fisher 344 male rats werehoused under three photoperiods (L6, L12 and L18) and fed with standard chow diet or cafeteriadiet (CAF) for 9 weeks. The 16S ribosomal sequencing of collected fecal samples was performed. Thephotoperiod exposure significantly altered the fecal microbiota composition under L18, especiallyin CAF-fed rats. Moreover, these alterations were associated with changes in body weight gain anddifferent fat parameters. These findings suggest a clear impact of seasonal rhythms on gut microbiota,which ultimately translates into different susceptibilities to diet-induced obesity development. Thisis the first time to our knowledge that the photoperiod impact on gut microbiota composition hasbeen described in an obesity context although further studies are needed in order to elucidate themechanisms involved.
Keywords: gut microbiota; photoperiods; seasonal rhythms; obesity; cafeteria diet
1. Introduction
Gut microbiota composition has been described as critical for the maintenance ofhomeostasis and metabolic function in the host [1]. Alterations in gut microbiota, alsoknown as dysbiosis, may interfere with this balance, contributing to the developmentof metabolic diseases such as obesity and metabolic syndrome (MetS) [2]. Changes indietary patterns are one of the most critical, modifiable factors that significantly alter thegut microbiota composition [3]. Thus, traditional diets such as the Mediterranean diet,which consists of high consumption of fiber and low consumption of sugar and fat, havelong been associated with an increase in gut microbiota diversity and with a higher healthstatus [4]. By contrast, Western-style diets have been shown to have strong effects on gutmicrobiota diversity and composition, often correlated with deleterious metabolic healtheffects [5]. For instance, the chronic consumption of a cafeteria diet significantly decreasedgut bacterial diversity, reducing Firmicutes and increasing Bacteroidetes and Proteobacteriaabundances, which were correlated with altered levels of plasma leptin and glycerol, aswell as adipose tissue and liver inflammation, leading to the development of obesity andMetS [6].
In addition to diet, biological rhythms are emerging as a key factor to take into consid-eration when investigating gut microbiota changes. Indeed, several studies have shown
oscillations of gut microbiota during 24 h cycles [7,8]. In the latest years, a growing bodyof evidence has shown that circadian rhythms can interact with nutrients, influencingseveral metabolic and physiological functions [9,10]. This relatively new field is describedas “chrononutrition”. Hence, the food-intake pattern during the day has a significantinfluence on postprandial glucose, consequently affecting metabolism. The presence ofthese rhythms allows the organism to adjust to environmental factors such as changes infood availability or climatic variability, ensuring reproductive success and survival [11].The effects of circadian rhythms on metabolism and physiology have been the most studiedbut those related to circannual rhythms are recently receiving increasing interest due totheir important role in the regulation of physiological responses [12,13]. The synchroniza-tion between seasonal rhythms and physiological processes is driven by changes in thelength of the daylight phase duration (photoperiods) [14,15]. The response to changes inphotoperiods is encoded by the suprachiasmatic nucleus in the hypothalamus throughthe control of pineal melatonin production [15,16]. The melatonin signal communicatesphotoperiod information to a variety of targets throughout the body and brain, being there-fore the hypothalamic–pituitary axis indispensable for the interaction between seasonalchanges and both metabolic and physiological processes [17]. Thus, seasonal rhythmshave been related to psychiatric disorders [18] and reproductive alterations in humans [19].Furthermore, recent studies have shown that exposure of normal-weight rats to differentphotoperiods led to different metabolic changes suggesting that glucose- and lipid-relatedpathologies, such as obesity and MetS, could be influenced by light variations such asthose observed in the different seasons [20]. However, little is known about the specificmechanisms involved. In fact, the effects of seasonal rhythms on gut microbiota which,as mentioned above, is one of the main links between diet and host metabolism, have notbeen sufficiently investigated yet.
In this regard, it has been shown that gut microbiota composition changes in both win-ter and summer due to seasonal variations in both the length of the daylight phase [21] andin dietary patterns [22]. Previous studies indicated that the relative abundance of certainbacteria differed for Siberian hamsters housed in long- versus short-day lengths [21,23].In addition, seasonal variations in gut bacteria related to dietary changes were foundin plateau pikas [24]. In another study in giant pandas, seasonal oscillations of gut mi-crobiota and higher short chain fatty acid (SCFA) production in the shoot-eating seasonwere observed [25]. In addition, seasonal changes including an increase in the breedingseason of the relative abundance of gut bacteria related to lipid metabolism, carbohydratemetabolism, and nucleotide metabolism were observed in wild ground squirrels [26]. Sig-nificant seasonal oscillations in structure and function of gut bacteria were also found inforest and alpine musk deer [27]. In particular, a decrease in both the relative abundanceof Firmicutes and the ratio of Firmicutes to Bacteroidetes, as well as an increase in Bac-teroidetes, was observed in summer compared to winter. Authors concluded that thesechanges may contribute to a better environmental adaptation by promoting the digestionand metabolism of food. In another study carried out in frogs, seasonal food and bodymass oscillations were significantly correlated with gut microbiota composition suggestingthat gut bacteria may change due to dietary pattern variations associated with seasonalenvironmental changes [28]. Furthermore, a recent study in mice also demonstrated thatexposure to regular light/dark cycles or the constant darkness exposure promoted a dif-ferent gut microbiota profile [29]. In another recently published study with mice housedunder different photoperiod conditions, although no significant differences were observedin the overall composition of the gut microbiota, authors were able to extract ampliconsequence variants that were predictive of photoperiod conditions with >91% accuracy [30].Hence, these studies identify the photoperiod as an important factor which can modulatethe gut microbiota composition. However, all of them were done in healthy animals and,therefore, further studies are needed to elucidate the relationship between photoperiod,gut microbiota and diet and its impact on metabolic diseases such as obesity.
Nutrients 2022, 14, 722 3 of 14
Therefore, the aim of the current study was to investigate the effects of photoperiodson fecal microbiota and its impact on body weight gain and different fat depots in healthyand cafeteria-induced obese Fisher 344 rats.
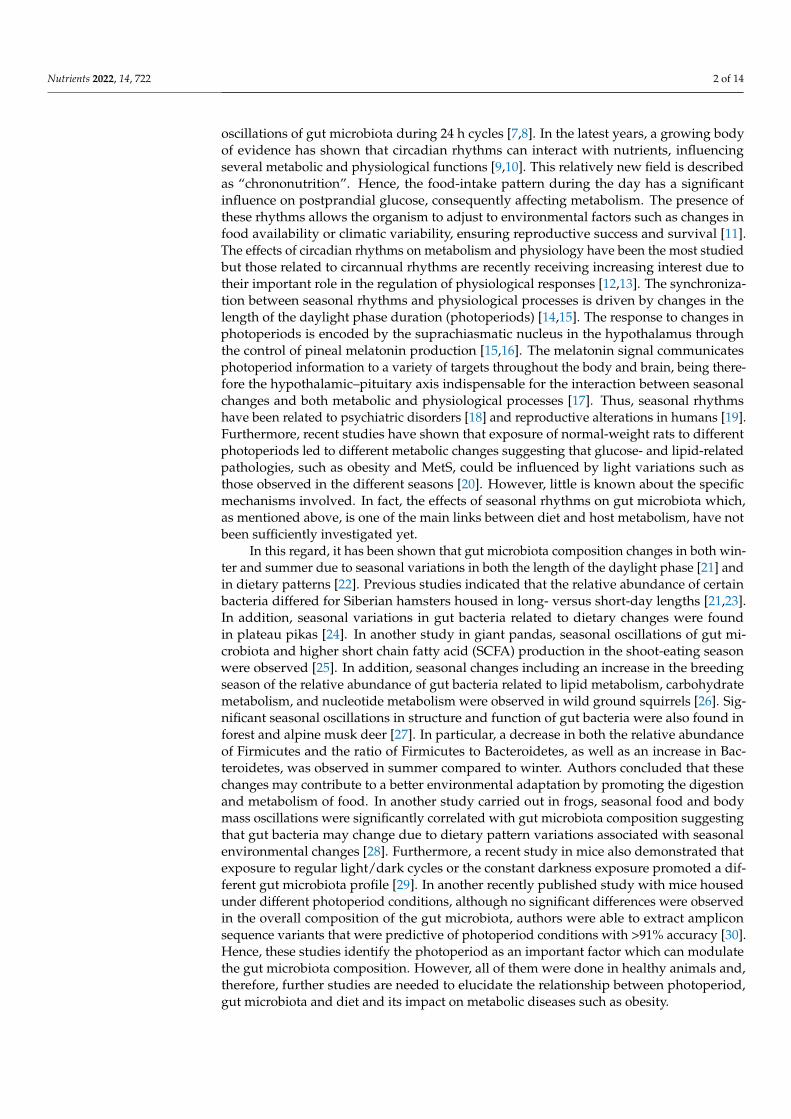
2. Materials and Methods2.1. Animals
Forty-eight 13-week-old male Fisher 344 rats from Janvier Laboratories (Le Genest-Saint-Isle, France) were housed in pairs at standard conditions (22 ◦C, 65% relative humidityand 12:12 h light/dark cycle). After one week of adaptation to the facility with free accessto food and water, animals were weighed and randomly distributed under specific light-dark cycles to simulate three specific photoperiods: short photoperiod (L6, 6 h light/18 hdarkness), standard photoperiod (L12, 12 h light/12 h darkness), or long photoperiod (L18,18 h light/6 h darkness). In each photoperiod, rats were fed either a standard chow diet(STD) (72% carbohydrate, 8% lipid, and 19% protein; Safe-A04c, Scientific Animal Food andEngineering, Barcelona, Spain) or a cafeteria diet (CAF) composed of highly palatable andenergy-dense human foods (58% CH, 31% lipid, and 11% protein) for 9 weeks (6 groups,n = 7–8 per group) (Figure 1). CAF diet was freshly prepared every day as previouslydescribed [31]. Body weight and food intake were recorded weekly during the wholeexperimental procedure.
Nutrients 2022, 14, x FOR PEER REVIEW 3 of 15
animals and, therefore, further studies are needed to elucidate the relationship between photoperiod, gut microbiota and diet and its impact on metabolic diseases such as obesity.
Therefore, the aim of the current study was to investigate the effects of photoperiods on fecal microbiota and its impact on body weight gain and different fat depots in healthy and cafeteria-induced obese Fisher 344 rats.
2. Materials and Methods 2.1. Animals
Forty-eight 13-week-old male Fisher 344 rats from Janvier Laboratories (Le Genest-Saint-Isle, France) were housed in pairs at standard conditions (22 °C, 65% relative hu-midity and 12:12 h light/dark cycle). After one week of adaptation to the facility with free access to food and water, animals were weighed and randomly distributed under specific light-dark cycles to simulate three specific photoperiods: short photoperiod (L6, 6 h light/18 h darkness), standard photoperiod (L12, 12 h light/12 h darkness), or long photo-period (L18, 18 h light/6 h darkness). In each photoperiod, rats were fed either a standard chow diet (STD) (72% carbohydrate, 8% lipid, and 19% protein; Safe-A04c, Scientific Ani-mal Food and Engineering, Barcelona, Spain) or a cafeteria diet (CAF) composed of highly palatable and energy-dense human foods (58% CH, 31% lipid, and 11% protein) for 9 weeks (6 groups, n = 7–8 per group) (Figure 1). CAF diet was freshly prepared every day as previously described [31]. Body weight and food intake were recorded weekly during the whole experimental procedure.
Animals were sacrificed by decapitation. Fecal samples were freshly collected from the colon and immediately snap-frozen until further microbiota analysis. The cecum as well as white adipose tissue depots, including mesenteric (mWAT), retroperitoneal (RWAT), inguinal (iWAT), epididymal (eWAT) and subcutaneous, were collected, weighed and immediately frozen in liquid nitrogen. The visceral mass was calculated as the sum of visceral adipose tissue depots (mWAT, RWAT and eWAT). Total body fat mass was measured as the sum of the visceral fat and subcutaneous fat (iWAT and subcutane-ous). The adiposity index was expressed as total body fat mass/final body weight. All the samples were stored at −80 °C until further analyses. The Animal Ethics Committee of the Rovira i Virgili University (Tarragona, Spain) and the Generalitat de Catalunya approved all the procedures (number reference 9495) in accordance with the EU Directive 2010/63/EU for animal experiments.
Figure 1. Animal experimental design. 13-week-old male STD- or CAF-fed Fischer 344 rats were pair-housed under three different photoperiods (6, 12 or 18 h of light per day) for 9 weeks. (n = 7–8). ♂: represents male sex; L6: short photoperiod (6 h light/18 h dark); L12: standard photoperiod (12 h light/12 h dark); L18: long photoperiod (18 h light/6 h dark); STD: standard chow diet; CAF: cafeteria diet.
2.2. Physical Activity Measurements Physical activity was evaluated using OxyletProTM system (Panlab, Barcelona,
Spain). The measurements were performed at weeks 8 and 9 of the study. Animals were transferred to a standard rodent home cage (Oxylet LE 405 gas analyzer, Panlab) to ensure a contained sample environment. Rats were maintained at 22 °C under the different
Figure 1. Animal experimental design. 13-week-old male STD- or CAF-fed Fischer 344 rats werepair-housed under three different photoperiods (6, 12 or 18 h of light per day) for 9 weeks. (n = 7–8).♂: represents male sex; L6: short photoperiod (6 h light/18 h dark); L12: standard photoperiod(12 h light/12 h dark); L18: long photoperiod (18 h light/6 h dark); STD: standard chow diet; CAF:cafeteria diet.
Animals were sacrificed by decapitation. Fecal samples were freshly collected fromthe colon and immediately snap-frozen until further microbiota analysis. The cecumas well as white adipose tissue depots, including mesenteric (mWAT), retroperitoneal(RWAT), inguinal (iWAT), epididymal (eWAT) and subcutaneous, were collected, weighedand immediately frozen in liquid nitrogen. The visceral mass was calculated as the sumof visceral adipose tissue depots (mWAT, RWAT and eWAT). Total body fat mass wasmeasured as the sum of the visceral fat and subcutaneous fat (iWAT and subcutaneous).The adiposity index was expressed as total body fat mass/final body weight. All thesamples were stored at −80 ◦C until further analyses. The Animal Ethics Committee of theRovira i Virgili University (Tarragona, Spain) and the Generalitat de Catalunya approved allthe procedures (number reference 9495) in accordance with the EU Directive 2010/63/EUfor animal experiments.
2.2. Physical Activity Measurements
Physical activity was evaluated using OxyletProTM system (Panlab, Barcelona, Spain).The measurements were performed at weeks 8 and 9 of the study. Animals were transferredto a standard rodent home cage (Oxylet LE 405 gas analyzer, Panlab) to ensure a containedsample environment. Rats were maintained at 22 ◦C under the different light/dark cycleconditions, according to the photoperiod, with free access to food and water. The cages
Nutrients 2022, 14, 722 4 of 14
were placed on a platform with strain weight transducers to register movements. Datawere collected and analyzed.
2.3. 16S rRNA Analysis
DNA from fecal samples was isolated using QiAamp Fast DNA Stool mini kit (QiagenInc., Hilden, Germany) and stored at−20 ◦C until further analysis. The 16S ribosomal RNAsequencing was carried out using an Ion S5 system (Life Technologies, Carlsbad, CA, USA)as described previously [32]. Briefly, V3 and V4 regions were amplified using the followingprimer pairs: 341F-532R (5′-CCTACGGGRSGCAGCAG-3′; 5′-ATTACCGCGGCTGCT-3′)and 15F-806R (5′-GTGCCAGCMGCCGCGGTAA-3′; 5′-GGACTACHVGGGTWTCTAAT-3′). Specific Ion Torrent compatible adapters and a barcode sequence were added in orderto sequence several samples simultaneously. Amplicons were visualized by electrophoresis(2% agarose) and DNA purification was performed with NucleoSpin (Macherey-Nagel,Berlin, Germany). Quality, length, and concentration of the libraries were analyzed usingan Agilent 2100 Bioanalyzer (Agilent Technologies, CA, USA). Individual libraries (40 pM)were combined in equimolar amounts in groups of 38 samples. Template preparation andanalysis was carried out in an Ion 510 & 520 & Ion 530 Kit-Chef (A34019, Life Technologies,Carlsbad, CA, USA) according to the manufacturer’s instructions. Samples were loadedon a 530 chip (Ion 530TM Chip Kit–4 Reactions) and sequenced using the Ion S5 system(Life Technologies, Carlsbad, CA, USA). Low-quality reads (phred quality score <17) andpolyclonal sequences were removed by filtering with the PGM software resulting in a totalof 63,212,452 reads. Final sequences were further analyzed by QIIME (quantitative insightsinto microbial ecology) and GreenGenes database.
2.4. Statistical Analysis
Statistical analysis was performed using SPSS software (IBM SPSS statistics 25, Ar-monk, NY, USA). In the case of body weight gain, food intake, activity and fats depots data,normality as well as homogeneity of variance were tested by Shapiro–Wilk and Levenetest, respectively. Body weight gain over time was analyzed using repeated-measuredANOVA followed by LSD post hoc test at each individual time point. AUC of body weightgain, food intake, activity and fat parameters were analyzed by two-way ANOVA followedby LSD post hoc test. Data were represented as mean ± standard deviation (SD) usingGraphpad Prism (v.8.0; Graphapad software Inc., San Diego, CA, USA).
MicrobiomeAnalyst web-based tool [32,33] was used for fecal microbiota analysis.Relative abundance data was filtered (minimum count: 2; prevalence in sample: 10%) inorder to exclude low abundance data or those appearing in only one sample. After datafiltering, the number of features left was 35,759. Chao1 index and Kruskal–Wallis testwere used to calculate and to elucidate alpha diversity differences between groups. Betadiversity was calculated based on Bray–Curtis distances and analyzed by permutationalmultivariate analysis of variance (PERMANOVA). Differences in relative abundance ofspecific bacteria taxa were analyzed using either Mann–Whitney (if comparing two groups)or Kruskal–Wallis test followed by Dunn’s multiple comparison with Bonferroni adjustmentof p values.
Spearman’s rank-order correlation analysis between fecal microbiota at differenttaxonomic levels with body weight gain and fat parameters was carried out using Pythonscript as previously described [31]. The FDR (false discovery rate) control for p-valuecorrection in multiple comparisons was applied. The script was developed using PyCharmsoftware (v.2018.2.4, JetBrains s.r.o., Prague, Czech Republic) and Python version 3.7.7.
Statistical significances were depicted as follows: *indicating diet effect p < 0.05, andab letters indicating photoperiod effect p < 0.05.
Nutrients 2022, 14, 722 5 of 14
3. Results3.1. Photoperiod Effect on Body Weight
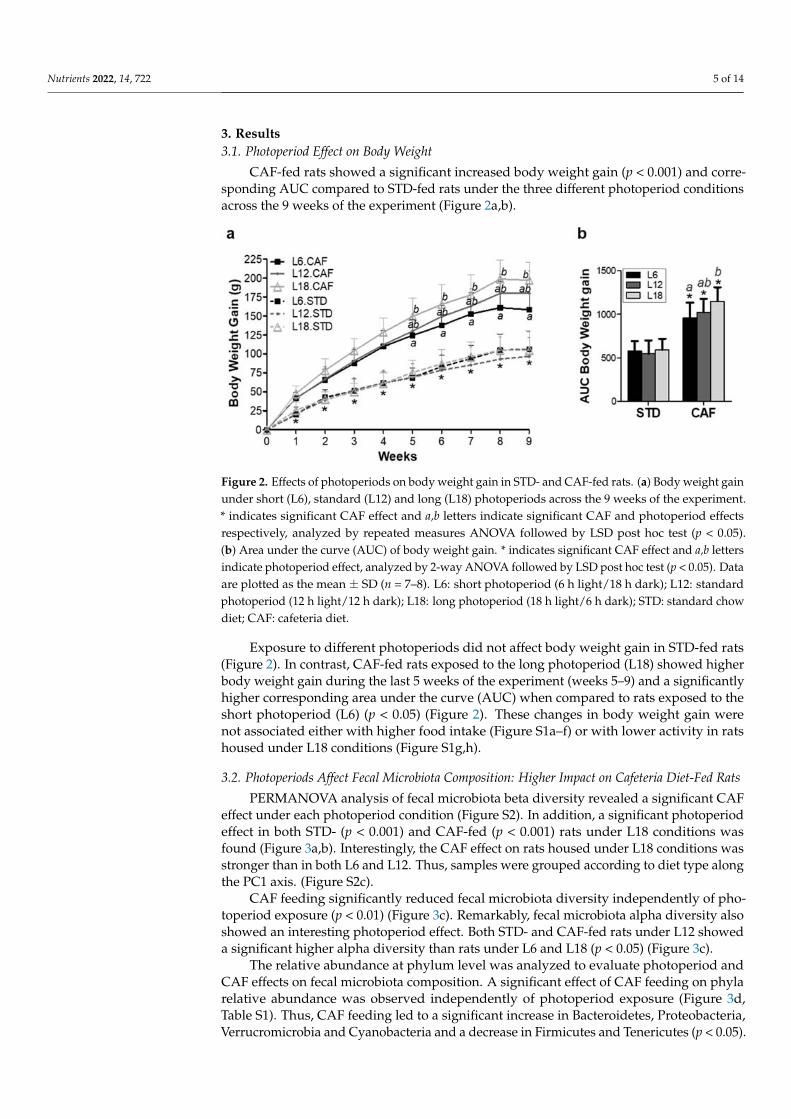
CAF-fed rats showed a significant increased body weight gain (p < 0.001) and corre-sponding AUC compared to STD-fed rats under the three different photoperiod conditionsacross the 9 weeks of the experiment (Figure 2a,b).
Nutrients 2022, 14, x FOR PEER REVIEW 5 of 15
3.1. Photoperiod Effect on Body Weight CAF-fed rats showed a significant increased body weight gain (p < 0.001) and corre-
sponding AUC compared to STD-fed rats under the three different photoperiod condi-tions across the 9 weeks of the experiment (Figure 2a,b).
Exposure to different photoperiods did not affect body weight gain in STD-fed rats (Figure 2). In contrast, CAF-fed rats exposed to the long photoperiod (L18) showed higher body weight gain during the last 5 weeks of the experiment (weeks 5–9) and a significantly higher corresponding area under the curve (AUC) when compared to rats exposed to the short photoperiod (L6) (p < 0.05) (Figure 2). These changes in body weight gain were not associated either with higher food intake (Figure S1a–f) or with lower activity in rats housed under L18 conditions (Figure S1g–h).
Figure 2. Effects of photoperiods on body weight gain in STD- and CAF-fed rats. (a) Body weight gain under short (L6), standard (L12) and long (L18) photoperiods across the 9 weeks of the exper-iment. * indicates significant CAF effect and a,b letters indicate significant CAF and photoperiod effects respectively, analyzed by repeated measures ANOVA followed by LSD post hoc test (p < 0.05). (b) Area under the curve (AUC) of body weight gain. * indicates significant CAF effect and a,b letters indicate photoperiod effect, analyzed by 2-way ANOVA followed by LSD post hoc test (p < 0.05). Data are plotted as the mean ± SD (n = 7–8). L6: short photoperiod (6 h light/18 h dark); L12: standard photoperiod (12 h light/12 h dark); L18: long photoperiod (18 h light/6 h dark); STD: stand-ard chow diet; CAF: cafeteria diet.
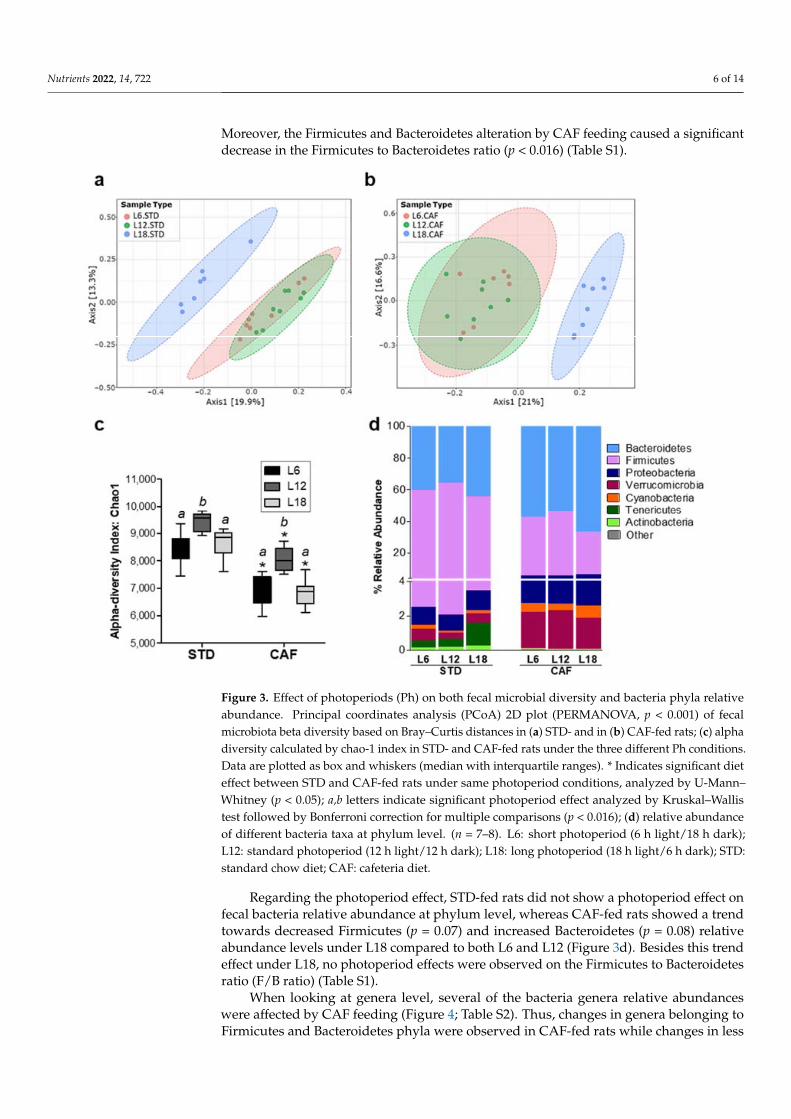
PERMANOVA analysis of fecal microbiota beta diversity revealed a significant CAF effect under each photoperiod condition (Figure S2). In addition, a significant photoperiod effect in both STD- (p < 0.001) and CAF-fed (p < 0.001) rats under L18 conditions was found (Figure 3a,b). Interestingly, the CAF effect on rats housed under L18 conditions was stronger than in both L6 and L12. Thus, samples were grouped according to diet type along the PC1 axis. (Figure S2c).
CAF feeding significantly reduced fecal microbiota diversity independently of pho-toperiod exposure (p < 0.01) (Figure 3c). Remarkably, fecal microbiota alpha diversity also showed an interesting photoperiod effect. Both STD- and CAF-fed rats under L12 showed a significant higher alpha diversity than rats under L6 and L18 (p < 0.05) (Figure 3c).
The relative abundance at phylum level was analyzed to evaluate photoperiod and CAF effects on fecal microbiota composition. A significant effect of CAF feeding on phyla relative abundance was observed independently of photoperiod exposure (Figure 3d, Ta-ble S1). Thus, CAF feeding led to a significant increase in Bacteroidetes, Proteobacteria, Verrucromicrobia and Cyanobacteria and a decrease in Firmicutes and Tenericutes (p <
Figure 2. Effects of photoperiods on body weight gain in STD- and CAF-fed rats. (a) Body weight gainunder short (L6), standard (L12) and long (L18) photoperiods across the 9 weeks of the experiment.* indicates significant CAF effect and a,b letters indicate significant CAF and photoperiod effectsrespectively, analyzed by repeated measures ANOVA followed by LSD post hoc test (p < 0.05).(b) Area under the curve (AUC) of body weight gain. * indicates significant CAF effect and a,b lettersindicate photoperiod effect, analyzed by 2-way ANOVA followed by LSD post hoc test (p < 0.05). Dataare plotted as the mean ± SD (n = 7–8). L6: short photoperiod (6 h light/18 h dark); L12: standardphotoperiod (12 h light/12 h dark); L18: long photoperiod (18 h light/6 h dark); STD: standard chowdiet; CAF: cafeteria diet.
Exposure to different photoperiods did not affect body weight gain in STD-fed rats(Figure 2). In contrast, CAF-fed rats exposed to the long photoperiod (L18) showed higherbody weight gain during the last 5 weeks of the experiment (weeks 5–9) and a significantlyhigher corresponding area under the curve (AUC) when compared to rats exposed to theshort photoperiod (L6) (p < 0.05) (Figure 2). These changes in body weight gain werenot associated either with higher food intake (Figure S1a–f) or with lower activity in ratshoused under L18 conditions (Figure S1g,h).
PERMANOVA analysis of fecal microbiota beta diversity revealed a significant CAFeffect under each photoperiod condition (Figure S2). In addition, a significant photoperiodeffect in both STD- (p < 0.001) and CAF-fed (p < 0.001) rats under L18 conditions wasfound (Figure 3a,b). Interestingly, the CAF effect on rats housed under L18 conditions wasstronger than in both L6 and L12. Thus, samples were grouped according to diet type alongthe PC1 axis. (Figure S2c).
CAF feeding significantly reduced fecal microbiota diversity independently of pho-toperiod exposure (p < 0.01) (Figure 3c). Remarkably, fecal microbiota alpha diversity alsoshowed an interesting photoperiod effect. Both STD- and CAF-fed rats under L12 showeda significant higher alpha diversity than rats under L6 and L18 (p < 0.05) (Figure 3c).
The relative abundance at phylum level was analyzed to evaluate photoperiod andCAF effects on fecal microbiota composition. A significant effect of CAF feeding on phylarelative abundance was observed independently of photoperiod exposure (Figure 3d,Table S1). Thus, CAF feeding led to a significant increase in Bacteroidetes, Proteobacteria,Verrucromicrobia and Cyanobacteria and a decrease in Firmicutes and Tenericutes (p < 0.05).
Nutrients 2022, 14, 722 6 of 14
Moreover, the Firmicutes and Bacteroidetes alteration by CAF feeding caused a significantdecrease in the Firmicutes to Bacteroidetes ratio (p < 0.016) (Table S1).
Nutrients 2022, 14, x FOR PEER REVIEW 6 of 15
0.05). Moreover, the Firmicutes and Bacteroidetes alteration by CAF feeding caused a sig-nificant decrease in the Firmicutes to Bacteroidetes ratio (p < 0.016) (Table S1).
Regarding the photoperiod effect, STD-fed rats did not show a photoperiod effect on fecal bacteria relative abundance at phylum level, whereas CAF-fed rats showed a trend towards decreased Firmicutes (p = 0.07) and increased Bacteroidetes (p = 0.08) relative abundance levels under L18 compared to both L6 and L12 (Figure 3d). Besides this trend effect under L18, no photoperiod effects were observed on the Firmicutes to Bacteroidetes ratio (F/B ratio) (Table S1).
Figure 3. Effect of photoperiods (Ph) on both fecal microbial diversity and bacteria phyla relative abundance. Principal coordinates analysis (PCoA) 2D plot (PERMANOVA, p < 0.001) of fecal micro-biota beta diversity based on Bray–Curtis distances in (a) STD- and in (b) CAF-fed rats; (c) alpha diversity calculated by chao-1 index in STD- and CAF-fed rats under the three different Ph condi-tions. Data are plotted as box and whiskers (median with interquartile ranges). * Indicates signifi-cant diet effect between STD and CAF-fed rats under same photoperiod conditions, analyzed by U-Mann–Whitney (p < 0.05); a,b letters indicate significant photoperiod effect analyzed by Kruskal–Wallis test followed by Bonferroni correction for multiple comparisons (p < 0.016); (d) relative abun-dance of different bacteria taxa at phylum level. (n = 7–8). L6: short photoperiod (6 h light/18 h dark); L12: standard photoperiod (12 h light/12 h dark); L18: long photoperiod (18 h light/6 h dark); STD: standard chow diet; CAF: cafeteria diet.
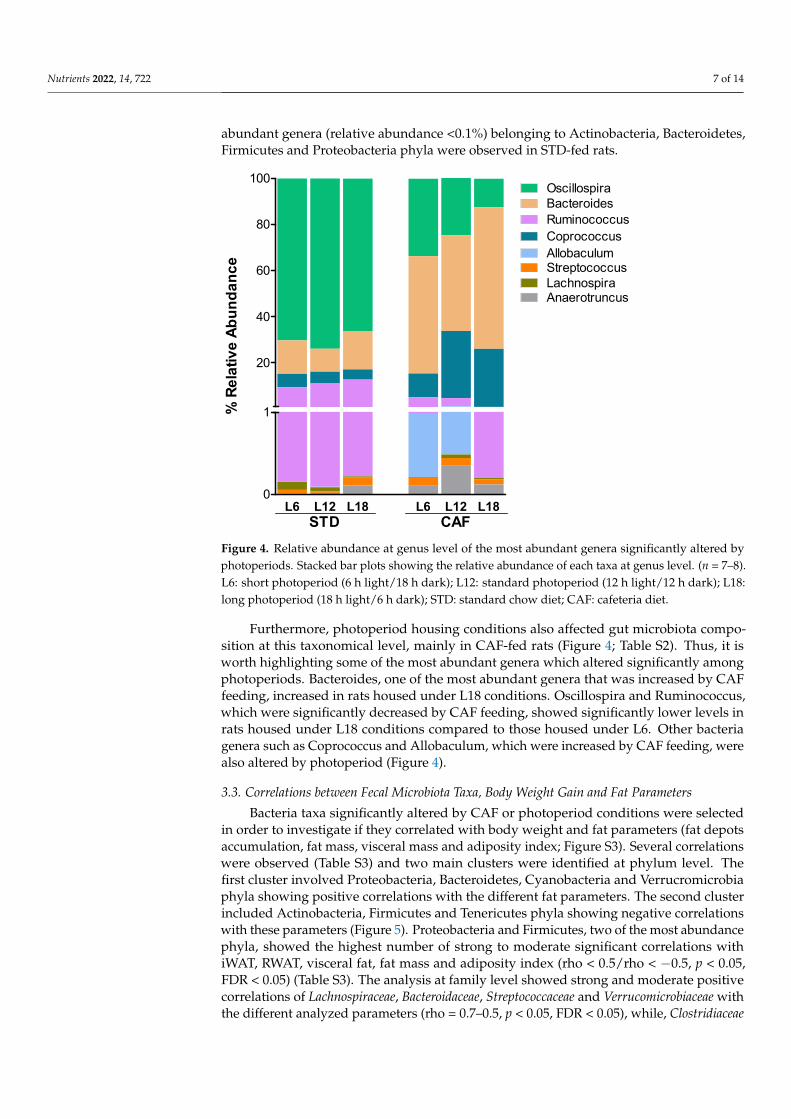
When looking at genera level, several of the bacteria genera relative abundances were affected by CAF feeding (Figure 4; Table S2). Thus, changes in genera belonging to Fir-micutes and Bacteroidetes phyla were observed in CAF-fed rats while changes in less abundant genera (relative abundance <0.1%) belonging to Actinobacteria, Bacteroidetes, Firmicutes and Proteobacteria phyla were observed in STD-fed rats.
Furthermore, photoperiod housing conditions also affected gut microbiota composi-tion at this taxonomical level, mainly in CAF-fed rats (Figure 4; Table S2). Thus, it is worth
Figure 3. Effect of photoperiods (Ph) on both fecal microbial diversity and bacteria phyla relativeabundance. Principal coordinates analysis (PCoA) 2D plot (PERMANOVA, p < 0.001) of fecalmicrobiota beta diversity based on Bray–Curtis distances in (a) STD- and in (b) CAF-fed rats; (c) alphadiversity calculated by chao-1 index in STD- and CAF-fed rats under the three different Ph conditions.Data are plotted as box and whiskers (median with interquartile ranges). * Indicates significant dieteffect between STD and CAF-fed rats under same photoperiod conditions, analyzed by U-Mann–Whitney (p < 0.05); a,b letters indicate significant photoperiod effect analyzed by Kruskal–Wallistest followed by Bonferroni correction for multiple comparisons (p < 0.016); (d) relative abundanceof different bacteria taxa at phylum level. (n = 7–8). L6: short photoperiod (6 h light/18 h dark);L12: standard photoperiod (12 h light/12 h dark); L18: long photoperiod (18 h light/6 h dark); STD:standard chow diet; CAF: cafeteria diet.
Regarding the photoperiod effect, STD-fed rats did not show a photoperiod effect onfecal bacteria relative abundance at phylum level, whereas CAF-fed rats showed a trendtowards decreased Firmicutes (p = 0.07) and increased Bacteroidetes (p = 0.08) relativeabundance levels under L18 compared to both L6 and L12 (Figure 3d). Besides this trendeffect under L18, no photoperiod effects were observed on the Firmicutes to Bacteroidetesratio (F/B ratio) (Table S1).
When looking at genera level, several of the bacteria genera relative abundanceswere affected by CAF feeding (Figure 4; Table S2). Thus, changes in genera belonging toFirmicutes and Bacteroidetes phyla were observed in CAF-fed rats while changes in less
Nutrients 2022, 14, 722 7 of 14
abundant genera (relative abundance <0.1%) belonging to Actinobacteria, Bacteroidetes,Firmicutes and Proteobacteria phyla were observed in STD-fed rats.
Nutrients 2022, 14, x FOR PEER REVIEW 7 of 15
highlighting some of the most abundant genera which altered significantly among photo-periods. Bacteroides, one of the most abundant genera that was increased by CAF feeding, increased in rats housed under L18 conditions. Oscillospira and Ruminococcus, which were significantly decreased by CAF feeding, showed significantly lower levels in rats housed under L18 conditions compared to those housed under L6. Other bacteria genera such as Coprococcus and Allobaculum, which were increased by CAF feeding, were also altered by photoperiod (Figure 4).
Figure 4. Relative abundance at genus level of the most abundant genera significantly altered by photoperiods. Stacked bar plots showing the relative abundance of each taxa at genus level. (n = 7–8). L6: short photoperiod (6 h light/18 h dark); L12: standard photoperiod (12 h light/12 h dark); L18: long photoperiod (18 h light/6 h dark); STD: standard chow diet; CAF: cafeteria diet.
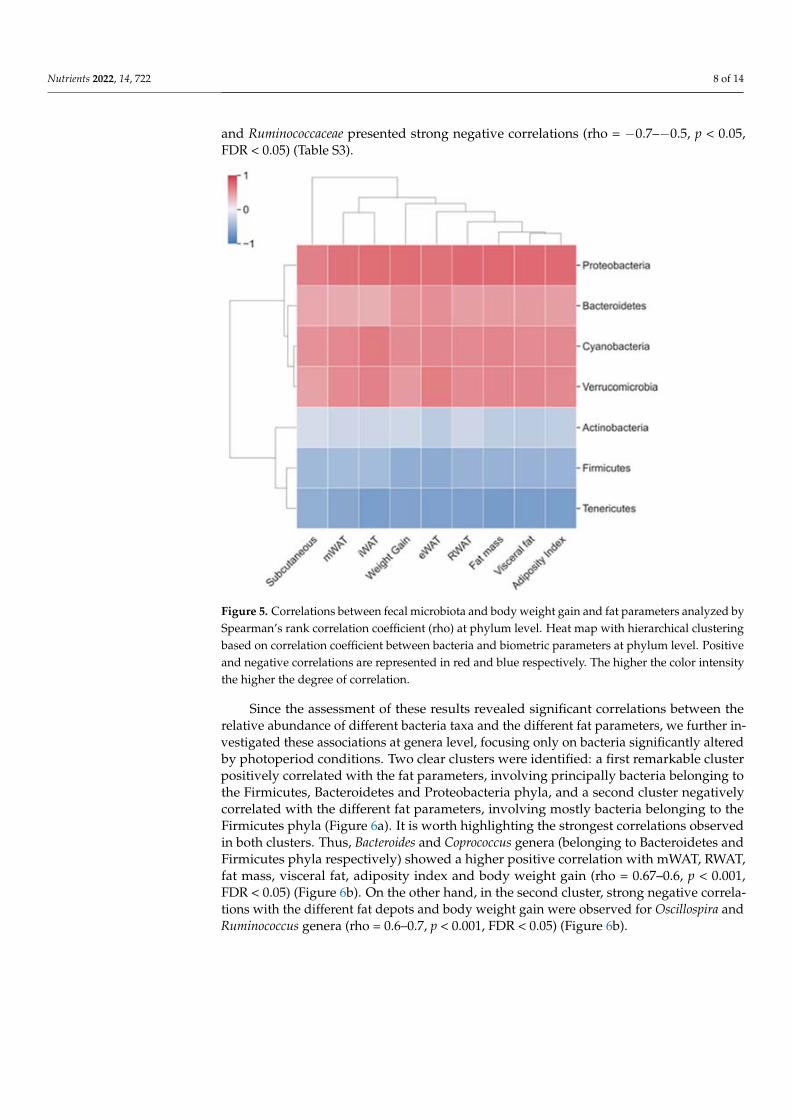
3.3. Correlations between Fecal Microbiota Taxa, Body Weight Gain and Fat Parameters Bacteria taxa significantly altered by CAF or photoperiod conditions were selected in
order to investigate if they correlated with body weight and fat parameters (fat depots accumulation, fat mass, visceral mass and adiposity index; Figure S3). Several correlations were observed (Table S3) and two main clusters were identified at phylum level. The first cluster involved Proteobacteria, Bacteroidetes, Cyanobacteria and Verrucromicrobia phyla showing positive correlations with the different fat parameters. The second cluster included Actinobacteria, Firmicutes and Tenericutes phyla showing negative correlations with these parameters (Figure 5). Proteobacteria and Firmicutes, two of the most abun-dance phyla, showed the highest number of strong to moderate significant correlations with iWAT, RWAT, visceral fat, fat mass and adiposity index (rho < 0.5/rho < −0.5, p < 0.05, FDR < 0.05) (Table S3). The analysis at family level showed strong and moderate positive correlations of Lachnospiraceae, Bacteroidaceae, Streptococcaceae and Verrucomicrobiaceae with the different analyzed parameters (rho = 0.7–0.5, p < 0.05, FDR < 0.05), while, Clostridiaceae and Ruminococcaceae presented strong negative correlations (rho = −0.7–−0.5, p < 0.05, FDR < 0.05) (Table S3).
L6 L12 L18 L6 L12 L180
1
20
40
60
80
100
Bacteroides
Streptococcus
Coprococcus
LachnospiraAnaerotruncus
Oscillospira
Ruminococcus
Allobaculum
STD CAF
% R
elat
ive
Abun
danc
e
Figure 4. Relative abundance at genus level of the most abundant genera significantly altered byphotoperiods. Stacked bar plots showing the relative abundance of each taxa at genus level. (n = 7–8).L6: short photoperiod (6 h light/18 h dark); L12: standard photoperiod (12 h light/12 h dark); L18:long photoperiod (18 h light/6 h dark); STD: standard chow diet; CAF: cafeteria diet.
Furthermore, photoperiod housing conditions also affected gut microbiota compo-sition at this taxonomical level, mainly in CAF-fed rats (Figure 4; Table S2). Thus, it isworth highlighting some of the most abundant genera which altered significantly amongphotoperiods. Bacteroides, one of the most abundant genera that was increased by CAFfeeding, increased in rats housed under L18 conditions. Oscillospira and Ruminococcus,which were significantly decreased by CAF feeding, showed significantly lower levels inrats housed under L18 conditions compared to those housed under L6. Other bacteriagenera such as Coprococcus and Allobaculum, which were increased by CAF feeding, werealso altered by photoperiod (Figure 4).
3.3. Correlations between Fecal Microbiota Taxa, Body Weight Gain and Fat Parameters
Bacteria taxa significantly altered by CAF or photoperiod conditions were selectedin order to investigate if they correlated with body weight and fat parameters (fat depotsaccumulation, fat mass, visceral mass and adiposity index; Figure S3). Several correlationswere observed (Table S3) and two main clusters were identified at phylum level. Thefirst cluster involved Proteobacteria, Bacteroidetes, Cyanobacteria and Verrucromicrobiaphyla showing positive correlations with the different fat parameters. The second clusterincluded Actinobacteria, Firmicutes and Tenericutes phyla showing negative correlationswith these parameters (Figure 5). Proteobacteria and Firmicutes, two of the most abundancephyla, showed the highest number of strong to moderate significant correlations withiWAT, RWAT, visceral fat, fat mass and adiposity index (rho < 0.5/rho < −0.5, p < 0.05,FDR < 0.05) (Table S3). The analysis at family level showed strong and moderate positivecorrelations of Lachnospiraceae, Bacteroidaceae, Streptococcaceae and Verrucomicrobiaceae withthe different analyzed parameters (rho = 0.7–0.5, p < 0.05, FDR < 0.05), while, Clostridiaceae
Nutrients 2022, 14, 722 8 of 14
and Ruminococcaceae presented strong negative correlations (rho = −0.7–−0.5, p < 0.05,FDR < 0.05) (Table S3).
Nutrients 2022, 14, x FOR PEER REVIEW 8 of 15
Figure 5. Correlations between fecal microbiota and body weight gain and fat parameters analyzed by Spearman’s rank correlation coefficient (rho) at phylum level. Heat map with hierarchical clus-tering based on correlation coefficient between bacteria and biometric parameters at phylum level. Positive and negative correlations are represented in red and blue respectively. The higher the color intensity the higher the degree of correlation.
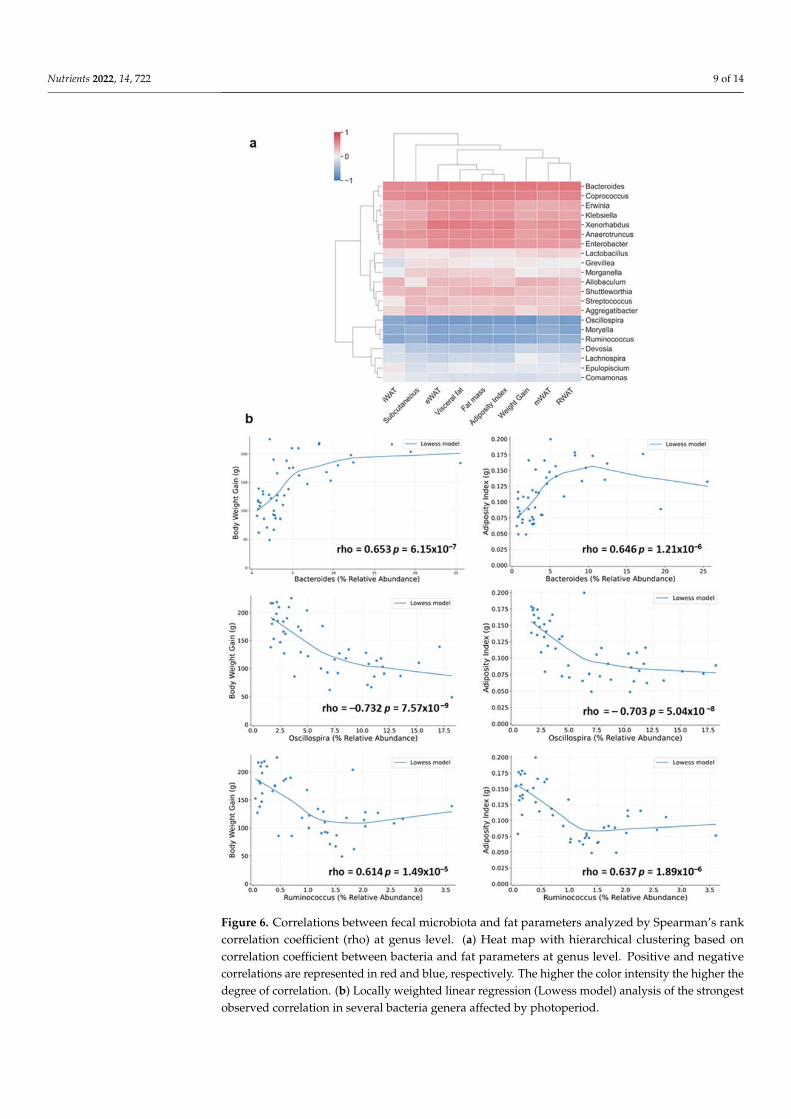
Since the assessment of these results revealed significant correlations between the relative abundance of different bacteria taxa and the different fat parameters, we further investigated these associations at genera level, focusing only on bacteria significantly al-tered by photoperiod conditions. Two clear clusters were identified: a first remarkable cluster positively correlated with the fat parameters, involving principally bacteria be-longing to the Firmicutes, Bacteroidetes and Proteobacteria phyla, and a second cluster negatively correlated with the different fat parameters, involving mostly bacteria belong-ing to the Firmicutes phyla (Figure 6a). It is worth highlighting the strongest correlations observed in both clusters. Thus, Bacteroides and Coprococcus genera (belonging to Bac-teroidetes and Firmicutes phyla respectively) showed a higher positive correlation with mWAT, RWAT, fat mass, visceral fat, adiposity index and body weight gain (rho = 0.67–0.6, p < 0.001, FDR < 0.05) (Figure 6b). On the other hand, in the second cluster, strong negative correlations with the different fat depots and body weight gain were observed for Oscillospira and Ruminococcus genera (rho = 0.6–0.7, p < 0.001, FDR < 0.05) (Figure 6b).
Figure 5. Correlations between fecal microbiota and body weight gain and fat parameters analyzed bySpearman’s rank correlation coefficient (rho) at phylum level. Heat map with hierarchical clusteringbased on correlation coefficient between bacteria and biometric parameters at phylum level. Positiveand negative correlations are represented in red and blue respectively. The higher the color intensitythe higher the degree of correlation.
Since the assessment of these results revealed significant correlations between therelative abundance of different bacteria taxa and the different fat parameters, we further in-vestigated these associations at genera level, focusing only on bacteria significantly alteredby photoperiod conditions. Two clear clusters were identified: a first remarkable clusterpositively correlated with the fat parameters, involving principally bacteria belonging tothe Firmicutes, Bacteroidetes and Proteobacteria phyla, and a second cluster negativelycorrelated with the different fat parameters, involving mostly bacteria belonging to theFirmicutes phyla (Figure 6a). It is worth highlighting the strongest correlations observedin both clusters. Thus, Bacteroides and Coprococcus genera (belonging to Bacteroidetes andFirmicutes phyla respectively) showed a higher positive correlation with mWAT, RWAT,fat mass, visceral fat, adiposity index and body weight gain (rho = 0.67–0.6, p < 0.001,FDR < 0.05) (Figure 6b). On the other hand, in the second cluster, strong negative correla-tions with the different fat depots and body weight gain were observed for Oscillospira andRuminococcus genera (rho = 0.6–0.7, p < 0.001, FDR < 0.05) (Figure 6b).
Nutrients 2022, 14, 722 9 of 14Nutrients 2022, 14, x FOR PEER REVIEW 9 of 15
Figure 6. Correlations between fecal microbiota and fat parameters analyzed by Spearman’s rank correlation coefficient (rho) at genus level. (a) Heat map with hierarchical clustering based on cor-relation coefficient between bacteria and fat parameters at genus level. Positive and negative corre-lations are represented in red and blue, respectively. The higher the color intensity the higher the
Figure 6. Correlations between fecal microbiota and fat parameters analyzed by Spearman’s rankcorrelation coefficient (rho) at genus level. (a) Heat map with hierarchical clustering based oncorrelation coefficient between bacteria and fat parameters at genus level. Positive and negativecorrelations are represented in red and blue, respectively. The higher the color intensity the higher thedegree of correlation. (b) Locally weighted linear regression (Lowess model) analysis of the strongestobserved correlation in several bacteria genera affected by photoperiod.
Nutrients 2022, 14, 722 10 of 14
4. Discussion
In the latest years, several studies have demonstrated that gut bacteria significantlyaffect host metabolism and physiology [1]. This has led to an increasing interest in under-standing how gut microbiota composition is modulated. Dietary pattern is among the mainfactors that shape these gut microbes [34], but other environmental and intrinsic factorssuch as antibiotic intake [35], age [36], gender [37], physical activity [38] or stress [39] maybe also involved. In addition to these factors, the exposure to different light cycles hasrecently been demonstrated to impact gut microbiota composition [21,29]. This is importantas changes in gut microbiota composition may lead to different metabolic and physiologicresponses, contributing to the adaptation to changes in environmental conditions associatedto the different seasons. However, the relationship between seasonal rhythms and gutmicrobiota and its impact on the host physiology is still poorly understood. Hence, asmentioned earlier, only a few studies have focused on investigating seasonal variationsof gut bacteria. Moreover, these studies have used non-obese animals and therefore theeffects of seasonal variations under an obesogenic context has not been sufficiently inves-tigated yet [24,25,27,40]. Therefore, we investigated the effect of different photoperiodson gut microbiota composition in both healthy and obese rats and how those changescorrelated with parameters related to obesity development such as body weight gain andfat depots accumulation.
Obesity was induced by cafeteria diet feeding. This diet is a well-established modelto induce obesity and other pathologies related to the metabolic syndrome and consistsof highly palatable foods that lead to high caloric intake with poor nutritional valuecontributing to the development of different disorders such as insulin resistance, metabolicdisruption and alterations of the gut microbiota composition [41,42]. Indeed, CAF-fedrats showed higher body weight gain, higher adiposity accumulation and gut microbiotadysbiosis compared to STD-fed rats. Additionally, obesity has been widely related with areduction of alpha microbial diversity [43] and an increase of the Firmicutes to Bacteroidetesratio in obese humans and animals [44]. In this context, CAF-fed rats showed lower alphadiversity but the Firmicutes/Bacteroidetes ratio was decreased due to the increase ofBacteroidetes and the reduction of Firmicutes relative abundance. However, this is inaccordance with other studies using this type of cafeteria diet [4,45]. This discrepancyregarding Firmicutes/Bacteroidetes ratio with other high fat diets induced obesity modelsmay be promoted by differences in the type of fat present in the diets, mainly lard and milk-derived fat-based diets [46]. Thus, the conflicting effects of CAF and other high fat dietson the Firmicutes/Bacteroidetes ratio may be explained by higher consumption of milkfat in CAF and higher intake of lard in other high fat diets. Indeed, clinical studies havealso demonstrated that increased Firmicutes/Bacteroidetes ratio is not always related toobesity [47]. Hence, the association of this ratio with obesity should be considered carefully.Moreover, it is worth highlighting that CAF feeding did also significantly alter other phylasuch as Proteobacteria and Verrucromicrobia, and other bacteria relative abundances atdifferent taxonomic levels such as Clostridiaceae, Lachnospiraceae and Prevotellaceae at familylevel and Bacteroides, Oscillospira, Ruminococcus and Akkermansia at genus level, which havebeen related with obesity and metabolic disorders [48].
Different photoperiod conditions were used to simulate seasonal rhythms. Thus,the short photoperiod conditions emulated the hours of light in short days typical of thewinter season while the long photoperiod conditions simulated the long days typical ofthe summer season. Interestingly, the photoperiod conditions significantly affected theoverall fecal microbiota profile, and these changes were associated with differences inbody weight gain and fat content. These results are in accordance with previous studiesin Siberian hamsters, which showed variations in gut microbiota composition caused bydifferent photoperiod conditions [21,23]. In particular, we observed a decreased alphamicrobial diversity under L6 and L18 compared to L12 in both STD- and CAF-fed rats. Thisis in accordance with a previous studies that found that alpha diversity of fecal microbiotawas significantly decreased in mice under 24 h light conditions compared to those under
Nutrients 2022, 14, 722 11 of 14
normal 12-h LD cycles, suggesting that light cycles help to maintain a higher variety ofgut microbiota [49]. In addition, rats housed under L18 conditions showed a significantdifferent overall gut microbiota composition as elucidated by beta diversity analysis inboth the STD- and CAF-fed diet. Interestingly, CAF-fed rats housed under this photoperiodcondition also showed higher body weight gain and fat content. Remarkably, the increasein these parameters was not due to a change either in diet or in activity. This is common inmammals which are able to adapt to changes in the environment driven by changes in thelight and dark cycle during the different seasons [50]. Hence, one specific trait of seasonalmanifestation in mammals is a more efficient pattern of energy harvesting, expenditure andstorage during the reproductive part of the year, which usually happens under the longphotoperiod. In contrast, energy exploitation is scarce during the short photoperiod, whichusually corresponds to the unproductive season [51,52]. Thus, it seems that the enhancedmasses may be due to differences in the ability of the rats to harvest energy from theconsumed food, being more efficient under L18 conditions. In addition, the gut microbiotaprofile from obese animals has been shown to have a higher capacity to harvest energyfrom the diet due to an increased glucose absorption and fatty acid absorption and pro-duction [53,54]. CAF-fed rats housed under L18 showed higher abundance of Bacteroidetesand lower abundance of Firmicutes. Indeed, Bacteroidetes was positively correlated with thebody composition while Firmicutes was negatively correlated with these parameters. Inter-estingly, both phyla are often involved in carbohydrate metabolism [55,56]. The productsof carbohydrate fermentation provide the host with energy, supporting the idea that thesephyla are associated with an obesity susceptibility in the host [57]. In CAF-fed rats, mostof the bacteria genera altered by photoperiod belonged to Firmicutes and Bacteroidetesphyla. Interestingly, two of the most abundant genera, Oscillospira and Ruminococcus weredecreased in CAF rats under L18 and correlated negatively with the biometric parameters.These genera have been shown to be decreased in obese subjects and are known as potentialbutyrate producers [58,59]. This short chain fatty acid has been demonstrated to exertbeneficial effects against obesity by increasing energy expenditure and lipid oxidation [60].In addition, Bacteroides genera, prominent among obese individuals, was increased in thisgroup and correlated positively with body composition. Therefore, these results revealed arelationship between gut microbiota and body weight gain and fat depots that might bedriven by photoperiod conditions.
Finally, it is remarkable that STD-fed rats also showed a photoperiod effect on thefecal microbiota composition. However, these changes were observed in genera with a lowrelative abundance (<0.1%). In addition, these changes were not associated with differencesin the body weight gain and fat depots, which were not affected by photoperiod in STD-fed rats. These findings were in agreement with previous work by our laboratory [20,61],but in contrast with other studies that showed significant changes in body weight gainand fat depot accumulation after a chronic exposure to different photoperiods in STD-fedrats [62,63]. This absence of variation in these parameters may be due to a potential adap-tative response to chronic short photoperiod exposition, ensuring survival and avoidingreproductive suppression [64]. Thus, these results could mean that there is an interac-tion between photoperiod, diet and gut microbiota, obese-induced diet rats being moresusceptible to photoperiod.
5. Conclusions
In conclusion, the current study suggests an interaction between photoperiod and gutmicrobiota being linked to metabolic disorders such as obesity. This interaction, whichaffects the body composition, may also affect physiological responses. Therefore, ourresearch can set the basis to understand the potential benefits of microbiota-targetedtherapies and to continue the study of the mechanisms regulating seasonal shifts associatedwith the development of metabolic diseases such as obesity.
Nutrients 2022, 14, 722 12 of 14
Supplementary Materials: The following supporting information can be downloaded at: https://www.mdpi.com/article/10.3390/nu14030722/s1, Figure S1: Food intake and physical activity,Figure S2: Effect of diet on the beta-diversity in STD and CAF groups, Figure S3: Effects of photope-riod on white adipose tissue depots and cecum weight, Table S1: Relative abundance at phylumlevel of STD- and CAF-fed rats under the three different photoperiod conditions (L6, L12 and L18),Table S2: Significant photoperiod and diet effect at genus level, Table S3: Significant Spearman’scorrelations between body weight gain and fat parameters with the relative abundance bacteria atdifferent taxonomic levels.
Author Contributions: Conceptualization, V.A.-G., A.A.-A. and C.T.-F.; methodology, V.A.-G.,A.A.-A. and C.T.-F.; validation, V.A.-G., A.A.-A. and C.T.-F.; formal analysis, V.A.-G. and I.E.-M.; in-vestigation, V.A.-G., I.E.-M., M.S., F.I.B., B.M., A.A.-A. and C.T.-F.; resources, M.S., F.I.B., B.M., A.A.-A.and C.T.-F.; data curation, V.A.-G.; writing—original draft preparation, V.A.-G.; writing—reviewand editing, A.A.-A. and C.T.-F.; visualization, V.A.-G.; supervision, A.A.-A. and C.T.-F.; projectadministration, V.A.-G., M.S., F.I.B., B.M., A.A.-A. and C.T.-F.; funding acquisition, M.S., F.I.B., B.M.,A.A.-A. and C.T.-F. All authors have read and agreed to the published version of the manuscript.
Funding: Project AGL2016-77105-R funded by MCIN/AEI/10.13039/501100011033/ FEDER “Unamanera de hacer Europa”. V.A.-G. has a predoctoral Fellowship supported by Universitat Rovira iVirgili (PMF-PIPF-35 Martí i Franquès). I.E.-M. is supported by Youth Employment Initiative fromthe European Social Fund, Minesterio de Ciencia e Innovación, Agencia Estatal de Investigación andUniversitat Rovira i Virgili (PEJ2018-002778-A). A.A.-A. and F.I.B. are Serra Húnter Fellows. C.T.-F. issupported by Beatriu de Pinós postdoctoral programme of the Government of Catalonia’s Secretariatfor Universities and Research of the Ministry of Economy and Knowledge.
Institutional Review Board Statement: The animal study protocol was approved by the Institu-tional Review Board (or Ethics Committee) of University Rovira i Virgili (Tarragona, Spain) (Projectidentification code 9495; File number: FUE-2017-00499873).
Informed Consent Statement: Not applicable.
Data Availability Statement: The data presented in this study are available, on request from authors,in Zenodo repository at doi:10.5281/zenodo.5785702.
Acknowledgments: The authors would like to thank Niurka Dariela Llópiz and Rosa Pastor for theirassistance and technical support and Jorge Ricardo Soliz Rueda for developing python correlationscript and bioinformatics support.
Conflicts of Interest: The authors declare no conflict of interest.
References1. Patterson, E.; Ryan, P.M.; Cryan, J.F.; Dinan, T.G.; Ross, R.P.; Fitzgerald, G.F.; Stanton, C. Gut microbiota, obesity and diabetes.
Postgrad. Med. J. 2016, 92, 286–300. [CrossRef] [PubMed]2. Torres-Fuentes, C.; Schellekens, H.; Dinan, T.G.; Cryan, J.F. The microbiota–gut–brain axis in obesity. Lancet Gastroenterol. Hepatol.
microbiome, and neuropsychiatry. Transl. Res. 2017, 179, 223–244. [CrossRef]4. Del Chierico, F.; Vernocchi, P.; Dallapiccola, B.; Putignani, L. Mediterranean diet and health: Food effects on gut microbiota and
disease control. Int. J. Mol. Sci. 2014, 15, 11678–11699. [CrossRef]5. Shi, Z. Gut microbiota: An important link between western diet and chronic diseases. Nutrients 2019, 11, 2287. [CrossRef]
[PubMed]6. Del Bas, J.M.; Guirro, M.; Boqué, N.; Cereto, A.; Ras, R.; Crescenti, A.; Caimari, A.; Canela, N.; Arola, L. Alterations in gut
microbiota associated with a cafeteria diet and the physiological consequences in the host. Int. J. Obes. 2018, 42, 746–754.[CrossRef]
7. Nobs, S.P.; Tuganbaev, T.; Elinav, E. Microbiome diurnal rhythmicity and its impact on host physiology and disease risk. EMBORep. 2019, 20, e47129. [CrossRef]
11. Refinetti, R. Integration of biological clocks and rhythms. Compr. Physiol. 2012, 2, 1213–1239. [CrossRef] [PubMed]12. Rácz, B.; Dušková, M.; Stárka, L.; Hainer, V.; Kunešová, M. Links between the circadian rhythm, obesity and the microbiome.
Mukerji, A.; et al. Circadian and circannual timescales interact to generate seasonal changes in immune function. Brain Be-hav. Immun. 2019, 83, 33–43. [CrossRef] [PubMed]
14. Murphy, B.A. Circadian and Circannual Regulation in the Horse: Internal Timing in an Elite Athlete. J. Equine Veter. Sci. 2019, 76,14–24. [CrossRef]
15. Tackenberg, M.C.; McMahon, D.G. Photoperiodic Programming of the SCN and Its Role in Photoperiodic Output. Neural Plast.2018, 2018, 1–9. [CrossRef]
16. Coomans, C.; Ramkisoensing, A.; Meijer, J.H. The suprachiasmatic nuclei as a seasonal clock. Front. Neuroendocr. 2015, 37, 29–42.[CrossRef]
17. Haus, E. Chronobiology in the endocrine system. Adv. Drug Deliv. Rev. 2007, 59, 985–1014. [CrossRef]18. Vitale, J.A.; Briguglio, M.; Galentino, R.; Dell’Osso, B.; Malgaroli, A.; Banfi, G.; Porta, M. Exploring circannual rhythms and
chronotype effect in patients with Obsessive-Compulsive Tic Disorder (OCTD): A pilot study. J. Affect. Disord. 2020, 262, 286–292.[CrossRef]
19. Jin, J.; Yaegashi, T.; Hashizume, T. Effects of photoperiod on the secretion of growth hormone and prolactin during nighttime infemale goats. Anim. Sci. J. 2013, 84, 130–135. [CrossRef]
20. Mariné-Casadó, R.; Coca, C.D.; Del Bas, J.M.; Bladé, C.; Arola, L.; Caimari, A. The exposure to different photoperiods stronglymodulates the glucose and lipid metabolisms of normoweight fischer 344 rats. Front. Physiol. 2018, 9, 416. [CrossRef]
21. Bailey, M.T.; Walton, J.C.; Dowd, S.; Weil, Z.; Nelson, R.J. Photoperiod modulates gut bacteria composition in male Siberianhamsters (Phodopus sungorus). Brain Behav. Immun. 2010, 24, 577–584. [CrossRef]
22. Davenport, E.; Mizrahi-Man, O.; Michelini, K.; Barreiro, L.; Ober, C.; Gilad, Y. Seasonal variation in human gut microbiomecomposition. PLoS ONE 2014, 9, e90731. [CrossRef]
23. Shor, E.K.; Brown, S.P.; Freeman, D.A. A novel role for the pineal gland: Regulating seasonal shifts in the gut microbiota ofSiberian hamsters. J. Pineal Res. 2020, 69, e12696. [CrossRef] [PubMed]
24. Fan, C.; Zhang, L.; Jia, S.; Tang, X.; Fu, H.; Li, W.; Liu, C.; Zhang, H.; Cheng, Q.; Zhang, Y. Seasonal variations in the compositionand functional profiles of gut microbiota reflect dietary changes in plateau pikas. Integr. Zool. 2022. [CrossRef] [PubMed]
25. Huang, G.; Wang, L.; Li, J.; Hou, R.; Wang, M.; Wang, Z.; Qu, Q.; Zhou, W.; Nie, Y.; Hu, Y.; et al. Seasonal shift of the gutmicrobiome synchronizes host peripheral circadian rhythm for physiological adaptation to a low-fat diet in the giant panda. CellRep. 2022, 38, 110203. [CrossRef]
26. Yang, X.; Yao, Y.; Zhang, X.; Zhong, J.; Gao, F.; Zhang, H.; Han, Y.; Weng, Q.; Yuan, Z. Seasonal Changes in the Distinct Taxonomyand Function of the Gut Microbiota in the Wild Ground Squirrel (Spermophilus dauricus). Animals 2021, 11, 2685. [CrossRef]
27. Jiang, F.; Gao, H.; Qin, W.; Song, P.; Wang, H.; Zhang, J.; Liu, D.; Wang, D.; Zhang, T. Marked Seasonal Variation in Structure andFunction of Gut Microbiota in Forest and Alpine Musk Deer. Front. Microbiol. 2021, 12, 2460. [CrossRef] [PubMed]
28. Huang, C.; Liao, W. Seasonal variation in gut microbiota related to diet in Fejervarya limnocharis. Animals 2021, 11, 1393. [CrossRef][PubMed]
29. Wu, G.; Tang, W.; He, Y.; Hu, J.; Gong, S.; He, Z.; Wei, G.; Lv, L.; Jiang, Y.; Zhou, H.; et al. Light exposure influences the diurnaloscillation of gut microbiota in mice. Biochem. Biophys. Res. Commun. 2018, 501, 16–23. [CrossRef]
30. Oyola, M.G.; Johnson, R.C.; Bauman, B.M.; Frey, K.G.; Russell, A.L.; Cho-Clark, M.; Buban, K.N.; Bishop-Lilly, K.A.; Merrell, D.S.;Handa, R.J.; et al. Gut microbiota and metabolic marker alteration following dietary isoflavone-photoperiod interaction.Endocrinol. Diabetes Metab. 2021, 4, e00190. [CrossRef]
31. Ávila-Román, J.; Arreaza-Gil, V.; Cortés-Espinar, A.J.; Soliz-Rueda, J.R.; Mulero, M.; Muguerza, B.; Arola-Arnal, A.; Arola, L.;Torres-Fuentes, C. Impact of gut microbiota on plasma oxylipins profile under healthy and obesogenic conditions. Clin. Nutr.2021, 40, 1475–1486. [CrossRef] [PubMed]
32. Dhariwal, A.; Chong, J.; Habib, S.; King, I.L.; Agellon, L.B.; Xia, J. MicrobiomeAnalyst: A web-based tool for comprehensivestatistical, visual and meta-analysis of microbiome data. Nucleic Acids Res. 2017, 45, W180–W188. [CrossRef] [PubMed]
33. Chong, J.; Liu, P.; Zhou, G.; Xia, J. Using MicrobiomeAnalyst for comprehensive statistical, functional, and meta-analysis ofmicrobiome data. Nat. Protoc. 2020, 15, 799–821. [CrossRef]
34. Voreades, N.; Kozil, A.; Weir, T.L. Diet and the development of the human intestinal microbiome. Front. Microbiol. 2014, 5, 494.[CrossRef]
35. Gibson, M.K.; Crofts, T.S.; Dantas, G. Antibiotics and the developing infant gut microbiota and resistome. Curr. Opin. Microbiol.2015, 27, 51–56. [CrossRef] [PubMed]
36. Coman, V.; Vodnar, D.C. Gut microbiota and old age: Modulating factors and interventions for healthy longevity. Exp. Gerontol.2020, 141, 111095. [CrossRef]
37. Kim, Y.S.; Unno, T.; Kim, B.-Y.; Park, M.-S. Sex Differences in Gut Microbiota. World J. Mens Health 2020, 38, 48–60. [CrossRef]
38. O’Sullivan, O.; Cronin, O.; Clarke, S.F.; Murphy, E.F.; Molloy, M.G.; Shanahan, F.; Cotter, P. Exercise and the microbiota. GutMicrobes 2015, 6, 131–136. [CrossRef]
39. Rea, K.; Dinan, T.; Cryan, J.F. The microbiome: A key regulator of stress and neuroinflammation. Neurobiol. Stress 2016, 4, 23–33.[CrossRef]
40. Ren, C.C.; Sylvia, K.E.; Munley, K.M.; Deyoe, J.E.; Henderson, S.G.; Vu, M.P.; Demas, G.E. Photoperiod modulates the gutmicrobiome and aggressive behavior in Siberian hamsters. J. Exp. Biol. 2020, 223, jeb212548. [CrossRef]
41. Macedo, I.C.; de Freitas, J.S.; Torres, I.L.D.S. The influence of palatable diets in reward system activation: A mini review. Adv.Pharmacol. Sci. 2016, 2016, 1–7. [CrossRef] [PubMed]
42. Guirro, M.; Costa, A.; Gual-Grau, A.; Herrero, P.; Torrell, H.; Canela, N.; Arola, L. Effects from diet-induced gut microbiotadysbiosis and obesity can be ameliorated by fecal microbiota transplantation: A multiomics approach. PLoS ONE 2019, 14,e0218143. [CrossRef] [PubMed]
43. Le Chatelier, E.; Nielsen, T.; Qin, J.; Prifti, E.; Hildebrand, F.; Falony, G.; Almeida, M.; Arumugam, M.; Batto, J.-M.;Kennedy, S.; et al. Richness of human gut microbiome correlates with metabolic markers. Nature 2013, 500, 541–546. [CrossRef]
44. Zhang, C.; Zhang, M.; Pang, X.; Zhao, Y.; Wang, L.; Zhao, L. Structural resilience of the gut microbiota in adult mice underhigh-fat dietary perturbations. ISME J. 2012, 6, 1848–1857. [CrossRef]
45. Gual-Grau, A.; Guirro, M.; Mayneris-Perxachs, J.; Arola, L.; Boqué, N. Impact of different hypercaloric diets on obesity features inrats: A metagenomics and metabolomics integrative approach. J. Nutr. Biochem. 2019, 71, 122–131. [CrossRef] [PubMed]
47. Magne, F.; Gotteland, M.; Gauthier, L.; Zazueta, A.; Pesoa, S.; Navarrete, P.; Balamurugan, R. The firmicutes/bacteroidetes ratio:A relevant marker of gut dysbiosis in obese patients? Nutrients 2020, 12, 1474. [CrossRef] [PubMed]
48. Crovesy, L.; Masterson, D.; Rosado, E.L. Profile of the gut microbiota of adults with obesity: A systematic review. Eur. J. Clin.Nutr. 2020, 74, 1251–1262. [CrossRef]
49. Deaver, J.A.; Eum, S.Y.; Toborek, M. Circadian disruption changes gut microbiome taxa and functional gene composition. Front.Microbiol. 2018, 9, 737. [CrossRef]
50. Goldman, B.D. Mammalian photoperiodic system: Formal properties and neuroendocrine mechanisms of photoperiodic timemeasurement. J. Biol. Rhythm. 2001, 16, 283–301. [CrossRef]
51. Varpe, O.H. Life History Adaptations to Seasonality. In Integrative and Comparative Biology; Oxford University Press: Oxford, UK,2017; Volume 57, pp. 943–960. [CrossRef]
52. Hut, R.A.; Beersma, D.G.M. Evolution of time-keeping mechanisms: Early emergence and adaptation to photoperiod. Philos.Trans. R. Soc. B Biol. Sci. 2011, 366, 2141–2154. [CrossRef] [PubMed]
53. Jumpertz, R.; Le, D.S.; Turnbaugh, P.J.; Trinidad, C.; Bogardus, C.; Gordon, J.I.; Krakoff, J. Energy-balance studies revealassociations between gut microbes, caloric load, and nutrient absorption in humans. Am. J. Clin. Nutr. 2011, 94, 58–65. [CrossRef][PubMed]
54. Bäckhed, F.; Ding, H.; Wang, T.; Hooper, L.V.; Koh, G.Y.; Nagy, A.; Semenkovich, C.F.; Gordon, J.I. The gut microbiota as anenvironmental factor that regulates fat storage. Proc. Natl. Acad. Sci. USA 2004, 101, 15718–15723. [CrossRef]
55. Ramakrishna, B. Role of the gut microbiota in human nutrition and metabolism. J. Gastroenterol. Hepatol. 2013, 28, 9–17. [CrossRef]56. Samuel, B.S.; Shaito, A.; Motoike, T.; Rey, F.E.; Backhed, F.; Manchester, J.K.; Hammer, R.E.; Williams, S.C.; Crowley, J.;
Yanagisawa, M.; et al. Effects of the gut microbiota on host adiposity are modulated by the short-chain fatty-acid binding Gprotein-coupled receptor, Gpr41. Proc. Natl. Acad. Sci. USA 2008, 105, 16767–16772. [CrossRef]
57. Ottman, N.; Smidt, H.; De Vos, W.M.; Belzer, C. The function of our microbiota: Who is out there and what do they do? Front. Cell.Infect. Microbiol. 2012, 2, 104. [CrossRef] [PubMed]
58. Raman, M.; Ahmed, I.; Gillevet, P.M.; Probert, C.S.; Ratcliffe, N.M.; Smith, S.; Greenwood, R.; Sikaroodi, M.; Lam, V.;Crotty, P.; et al. Fecal microbiome and volatile organic compound metabolome in obese humans with nonalcoholic fatty liverdisease. Clin. Gastroenterol. Hepatol. 2013, 11, 868–875.e3. [CrossRef] [PubMed]
59. Zarrinpar, A.; Chaix, A.; Yooseph, S.; Panda, S. Diet and feeding pattern affect the diurnal dynamics of the gut microbiome. CellMetab. 2014, 20, 1006–1017. [CrossRef] [PubMed]
60. Gao, Z.; Yin, J.; Zhang, J.; Ward, R.E.; Martin, R.J.; Lefevre, M.; Cefalu, W.T.; Ye, J. Butyrate improves insulin sensitivity andincreases energy expenditure in mice. Diabetes 2009, 58, 1509–1517. [CrossRef]
61. Mariné-Casadó, R.; Domenech-Coca, C.; Del Bas, J.M.; Bladé, C.; Arola, L.; Caimari, A. Intake of an Obesogenic Cafeteria DietAffects Body Weight, Feeding Behavior, and Glucose and Lipid Metabolism in a Photoperiod-Dependent Manner in F344 Rats.Front. Physiol. 2018, 9, 1–16. [CrossRef]
62. Shoemaker, M.B.; Heideman, P.D. Reduced body mass, food intake, and testis size in response to short photoperiod in adult F344rats. BMC Physiol. 2002, 2, 11. [CrossRef] [PubMed]
63. Tavolaro, F.M.; Thomson, L.M.; Ross, A.; Morgan, P.; Helfer, G. Photoperiodic Effects on Seasonal Physiology, ReproductiveStatus and Hypothalamic Gene Expression in Young Male F344 Rats. J. Neuroendocr. 2015, 27, 79–87. [CrossRef] [PubMed]
64. Heideman, P.D.; Sylvester, C.J. Reproductive Photoresponsiveness in Unmanipulated Male Fischer 344 Laboratory Rats1. Biol.Reprod. 1997, 57, 134–138. [CrossRef] [PubMed]