35
For updated information, please visit www.ibef.org August 2020 INSURANCE
| Date post: | 27-Mar-2023 |
| Category: |
Documents |
| Upload: | khangminh22 |
| View: | 0 times |
| Download: | 0 times |
For updated information, please visit www.ibef.org August 2020
INSURANCE
Table of Contents
Executive Summary……………….….…….3
Advantage India…………………..….……...4
Market Overview …………………….….…..6
Trends and Strategies..………...…………..23
Growth Drivers……………………................21
Opportunities…….……….......…………...…26
Useful Information……….......…………...….31
For updated information, please visit www.ibef.orgInsurance3
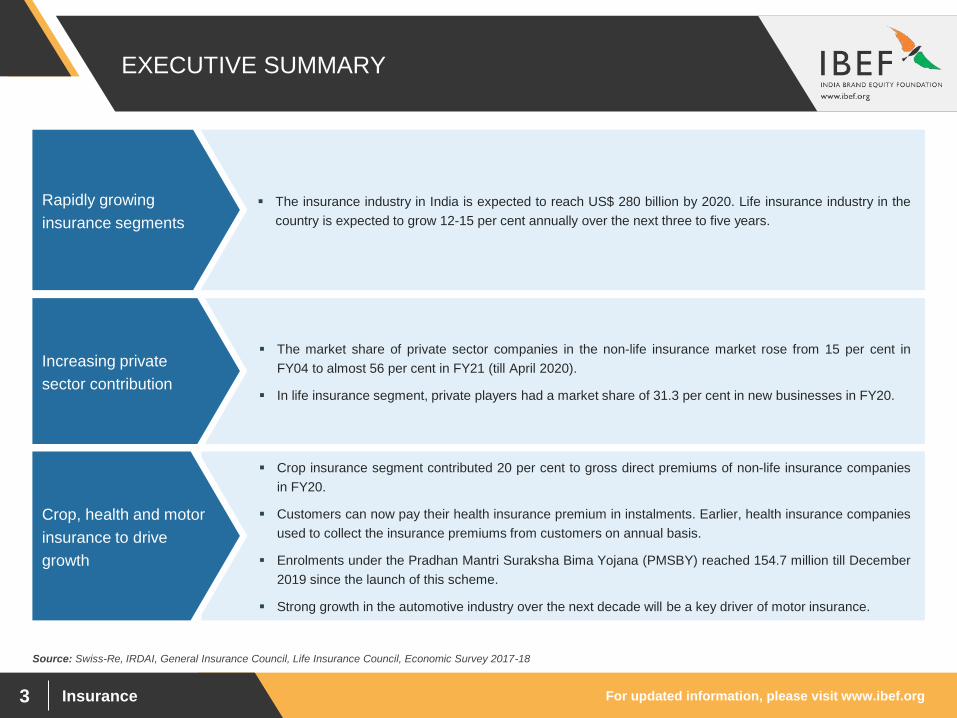
EXECUTIVE SUMMARY
▪ The insurance industry in India is expected to reach US$ 280 billion by 2020. Life insurance industry in the
country is expected to grow 12-15 per cent annually over the next three to five years.
Rapidly growing
insurance segments
▪ The market share of private sector companies in the non-life insurance market rose from 15 per cent in
FY04 to almost 56 per cent in FY21 (till April 2020).
▪ In life insurance segment, private players had a market share of 31.3 per cent in new businesses in FY20.
Increasing private
sector contribution
▪ Crop insurance segment contributed 20 per cent to gross direct premiums of non-life insurance companies
in FY20.
▪ Customers can now pay their health insurance premium in instalments. Earlier, health insurance companies
used to collect the insurance premiums from customers on annual basis.
▪ Enrolments under the Pradhan Mantri Suraksha Bima Yojana (PMSBY) reached 154.7 million till December
2019 since the launch of this scheme.
▪ Strong growth in the automotive industry over the next decade will be a key driver of motor insurance.
Crop, health and motor
insurance to drive
growth
Source: Swiss-Re, IRDAI, General Insurance Council, Life Insurance Council, Economic Survey 2017-18

Insurance
ADVANTAGE INDIA
For updated information, please visit www.ibef.orgInsurance5
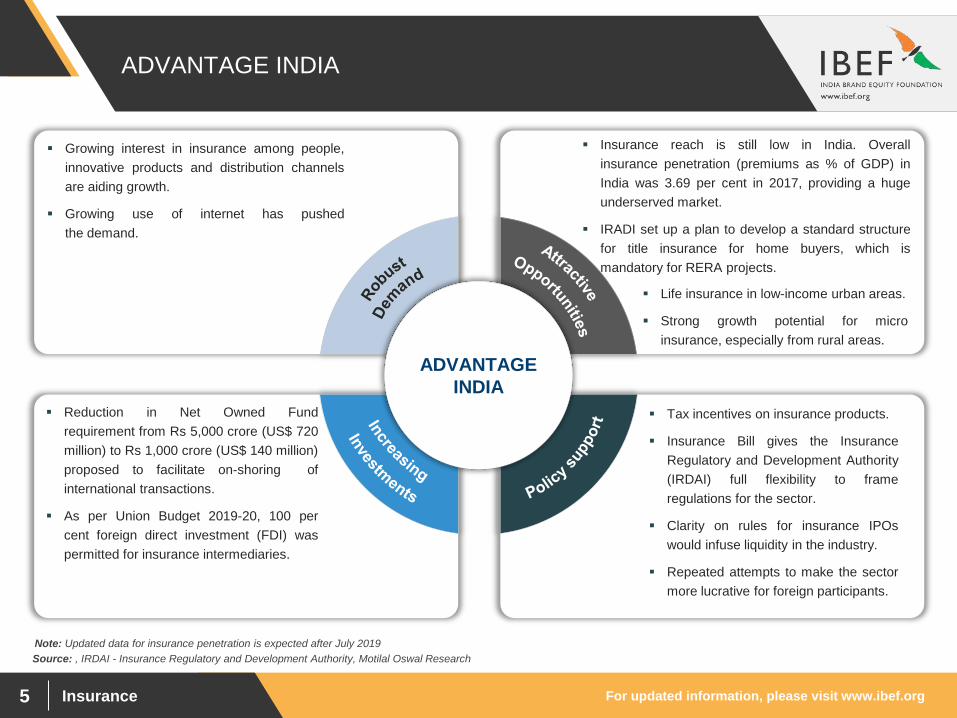
ADVANTAGE INDIA
▪ Growing interest in insurance among people,
innovative products and distribution channels
are aiding growth.
▪ Growing use of internet has pushed
the demand.
▪ Insurance reach is still low in India. Overall
insurance penetration (premiums as % of GDP) in
India was 3.69 per cent in 2017, providing a huge
underserved market.
▪ IRADI set up a plan to develop a standard structure
for title insurance for home buyers, which is
mandatory for RERA projects.
▪ Reduction in Net Owned Fund
requirement from Rs 5,000 crore (US$ 720
million) to Rs 1,000 crore (US$ 140 million)
proposed to facilitate on-shoring of
international transactions.
▪ As per Union Budget 2019-20, 100 per
cent foreign direct investment (FDI) was
permitted for insurance intermediaries.
▪ Tax incentives on insurance products.
▪ Insurance Bill gives the Insurance
Regulatory and Development Authority
(IRDAI) full flexibility to frame
regulations for the sector.
▪ Clarity on rules for insurance IPOs
would infuse liquidity in the industry.
▪ Repeated attempts to make the sector
more lucrative for foreign participants.
ADVANTAGE
INDIA
Source: , IRDAI - Insurance Regulatory and Development Authority, Motilal Oswal Research
Note: Updated data for insurance penetration is expected after July 2019
▪ Life insurance in low-income urban areas.
▪ Strong growth potential for micro
insurance, especially from rural areas.

Insurance
MARKET OVERVIEW
For updated information, please visit www.ibef.orgInsurance7
EVOLUTION OF THE INDIAN INSURANCE SECTOR
Source: IRDAI
Notes: LIC - Life Insurance Corporation of India, GIC - General Insurance Corporation of India, IRDAI - Insurance Regulatory and Development Authority
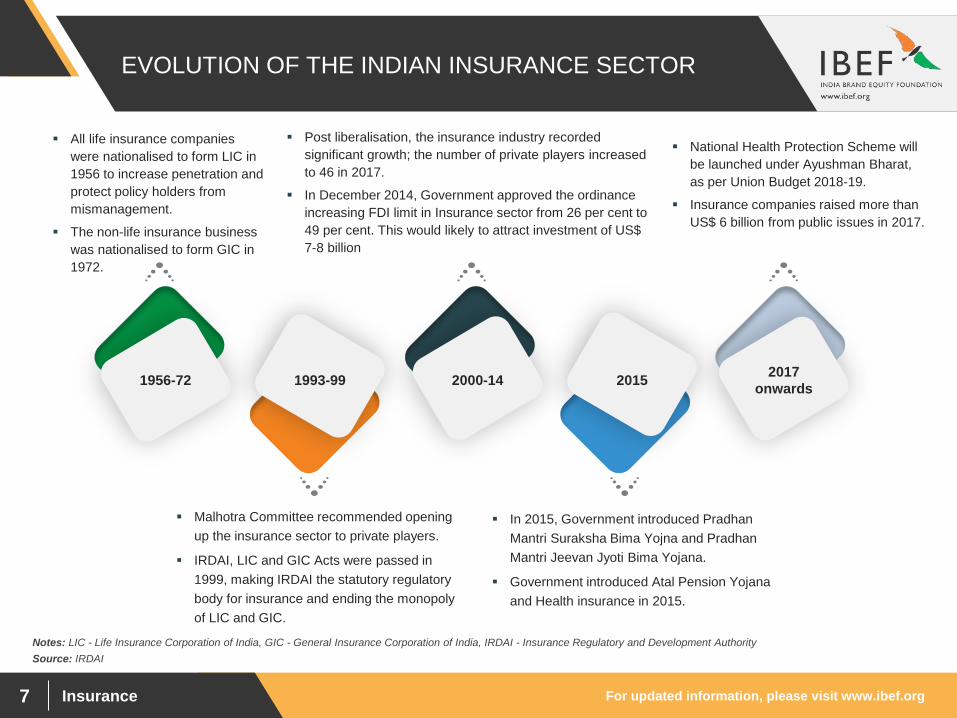
▪ All life insurance companies
were nationalised to form LIC in
1956 to increase penetration and
protect policy holders from
mismanagement.
▪ The non-life insurance business
was nationalised to form GIC in
1972.
▪ Post liberalisation, the insurance industry recorded
significant growth; the number of private players increased
to 46 in 2017.
▪ In December 2014, Government approved the ordinance
increasing FDI limit in Insurance sector from 26 per cent to
49 per cent. This would likely to attract investment of US$
7-8 billion
▪ National Health Protection Scheme will
be launched under Ayushman Bharat,
as per Union Budget 2018-19.
▪ Insurance companies raised more than
US$ 6 billion from public issues in 2017.
▪ Malhotra Committee recommended opening
up the insurance sector to private players.
▪ IRDAI, LIC and GIC Acts were passed in
1999, making IRDAI the statutory regulatory
body for insurance and ending the monopoly
of LIC and GIC.
▪ In 2015, Government introduced Pradhan
Mantri Suraksha Bima Yojna and Pradhan
Mantri Jeevan Jyoti Bima Yojana.
▪ Government introduced Atal Pension Yojana
and Health insurance in 2015.
1956-72 1993-99 20152000-142017
onwards
For updated information, please visit www.ibef.orgInsurance8
IRDAI GOVERNS THE INDIAN INSURANCE SECTOR
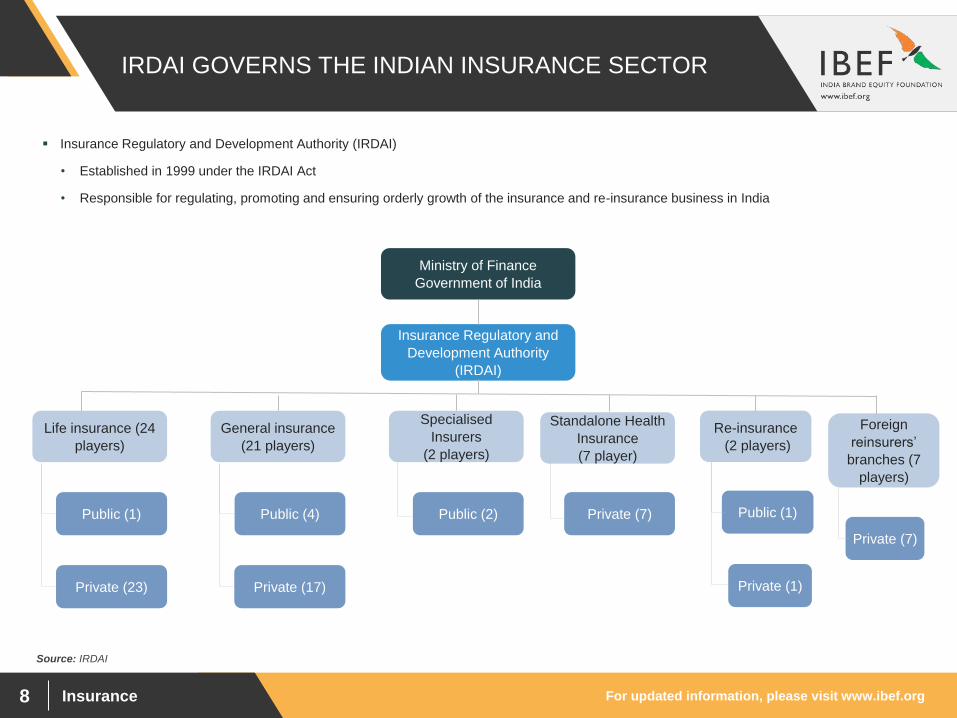
▪ Insurance Regulatory and Development Authority (IRDAI)
• Established in 1999 under the IRDAI Act
• Responsible for regulating, promoting and ensuring orderly growth of the insurance and re-insurance business in India
Ministry of Finance
Government of India
Insurance Regulatory and
Development Authority
(IRDAI)
Source: IRDAI
Private (23) Private (17)
Life insurance (24
players)
General insurance
(21 players)
Specialised
Insurers
(2 players)
Standalone Health
Insurance
(7 player)
Public (1) Public (4) Public (2) Private (7)
Re-insurance
(2 players)
Public (1)
Private (1)
Foreign
reinsurers’
branches (7
players)
Private (7)
For updated information, please visit www.ibef.orgInsurance9
INCREASING PENETRATION AND DENSITY OF
INSURANCE OVER THE YEARS
Source: Swiss Re Institute
2.62.7 2.7 2.8
0.70.7 0.8
0.9
0
0.5
1
1.5
2
2.5
3
3.5
4
2014 2015 2016 2017
Life Non-Life
Insurance Penetration (Premiums as % of GDP) Insurance Density (Premiums Per Capita) (US$)
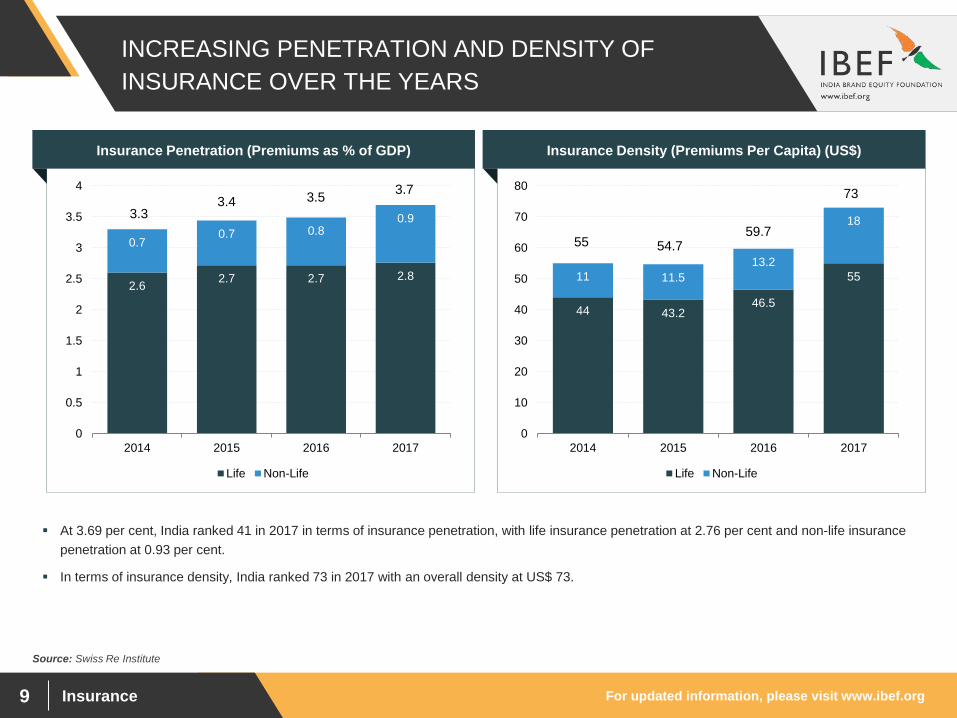
▪ At 3.69 per cent, India ranked 41 in 2017 in terms of insurance penetration, with life insurance penetration at 2.76 per cent and non-life insurance
penetration at 0.93 per cent.
▪ In terms of insurance density, India ranked 73 in 2017 with an overall density at US$ 73.
44 43.246.5
5511 11.5
13.2
18
0
10
20
30
40
50
60
70
80
2014 2015 2016 2017
Life Non-Life
3.33.4 3.5
3.7
55 54.759.7
73
For updated information, please visit www.ibef.orgInsurance10
VIBRANT LIFE INSURANCE MARKET2
1.5
27
.2 30
.1
30
.7
37
.0
4.1
35
.3 37
.7 41
.0
42
.0 44
.3
0.0
0.0
5.0
10.0
15.0
20.0
25.0
30.0
35.0
40.0
45.0
50.0
FY16 FY17 FY18 FY19 FY20 FY21*
New Business Premium Renewal Premium
Source: Insurance Regulatory and Development Authority, Deloitte – Redefining Insurance
Life Insurance Premiums (US$ billion)
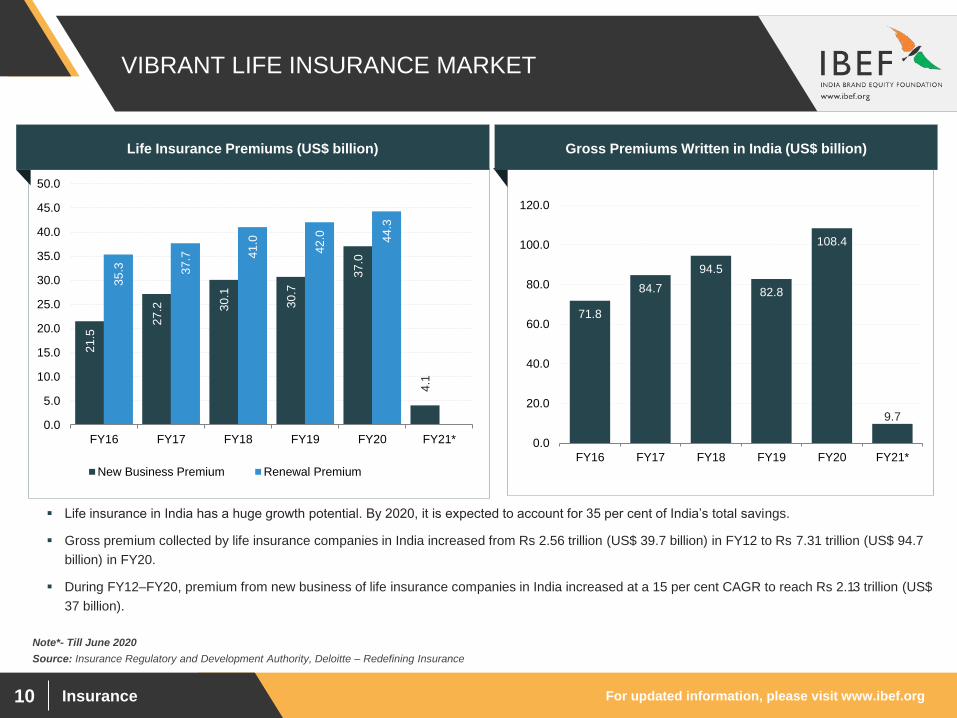
▪ Life insurance in India has a huge growth potential. By 2020, it is expected to account for 35 per cent of India’s total savings.
▪ Gross premium collected by life insurance companies in India increased from Rs 2.56 trillion (US$ 39.7 billion) in FY12 to Rs 7.31 trillion (US$ 94.7
billion) in FY20.
▪ During FY12–FY20, premium from new business of life insurance companies in India increased at a 15 per cent CAGR to reach Rs 2.13 trillion (US$
37 billion).
71.8
84.7
94.5
82.8
108.4
9.7
0.0
20.0
40.0
60.0
80.0
100.0
120.0
FY16 FY17 FY18 FY19 FY20 FY21*
Gross Premiums Written in India (US$ billion)
Note*- Till June 2020
For updated information, please visit www.ibef.orgInsurance11
INCREASING PRIVATE SECTOR ACTIVITY IN LIFE
INSURANCE SEGMENT
Source: IRDAI, Life Insurance Council
Note: Figures are as per latest data available, share based on new business premium collection
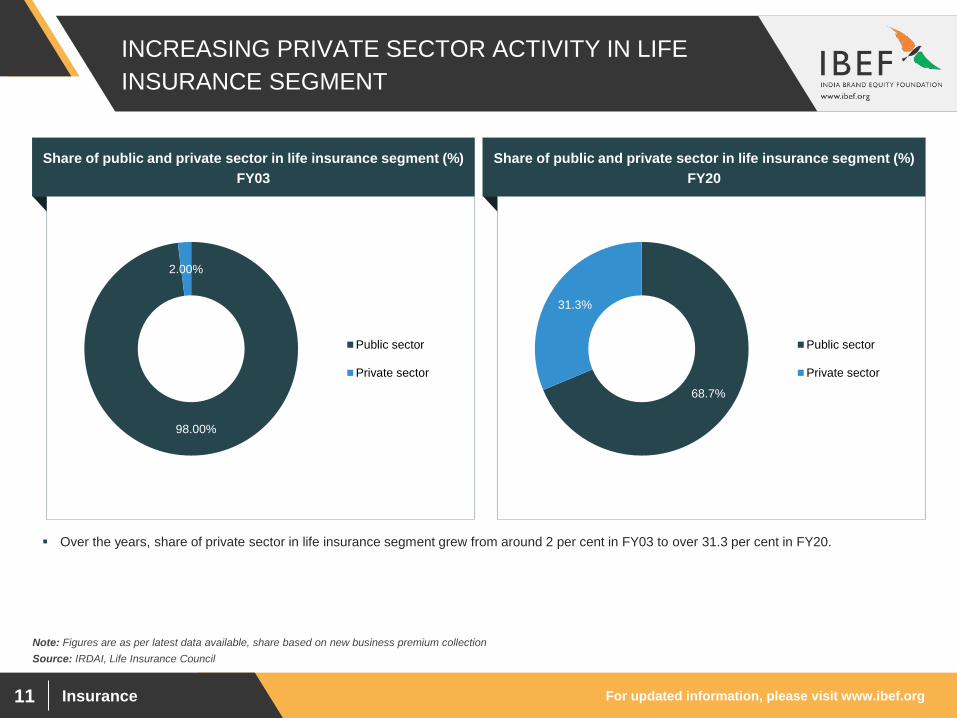
▪ Over the years, share of private sector in life insurance segment grew from around 2 per cent in FY03 to over 31.3 per cent in FY20.
98.00%
2.00%
Public sector
Private sector
Share of public and private sector in life insurance segment (%)
FY03
Share of public and private sector in life insurance segment (%)
FY20
68.7%
31.3%
Public sector
Private sector
For updated information, please visit www.ibef.orgInsurance12
LIC CONTINUES TO DOMINATE LIFE INSURANCE
SEGMENT
Source: Life Insurance Council, IRDAI
Visakhapatnam port traffic (million tonnes)Premiums Market Share in First Year Life Insurance (FY20)
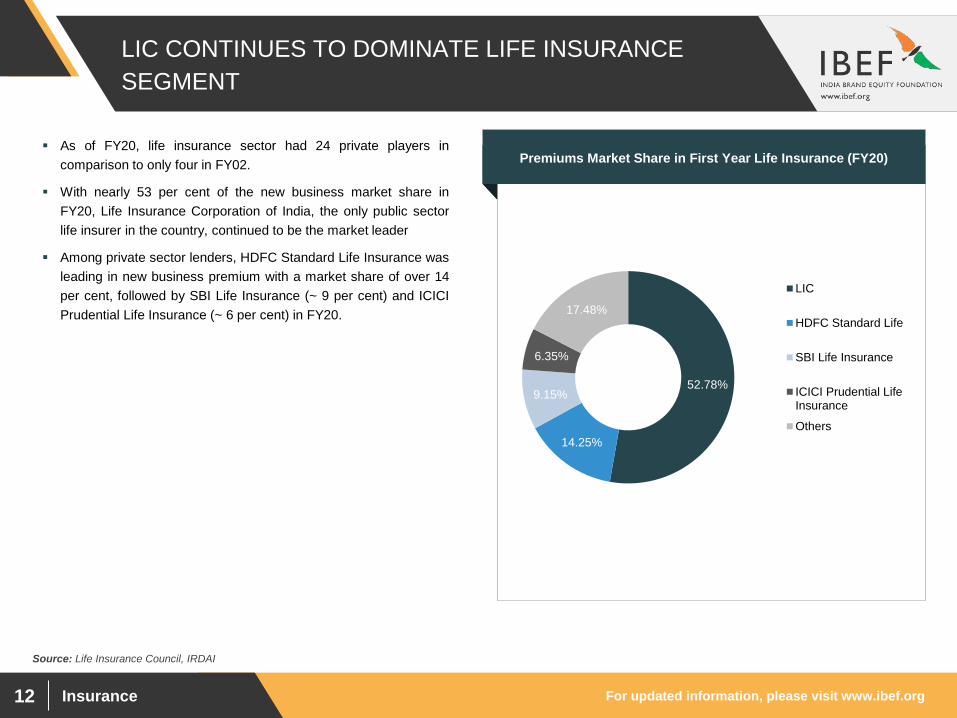
▪ As of FY20, life insurance sector had 24 private players in
comparison to only four in FY02.
▪ With nearly 53 per cent of the new business market share in
FY20, Life Insurance Corporation of India, the only public sector
life insurer in the country, continued to be the market leader
▪ Among private sector lenders, HDFC Standard Life Insurance was
leading in new business premium with a market share of over 14
per cent, followed by SBI Life Insurance (~ 9 per cent) and ICICI
Prudential Life Insurance (~ 6 per cent) in FY20.
52.78%
14.25%
9.15%
6.35%
17.48%
LIC
HDFC Standard Life
SBI Life Insurance
ICICI Prudential LifeInsurance
Others
For updated information, please visit www.ibef.orgInsurance13
STRONG GROWTH IN NON-LIFE INSURANCE MARKET
Source: IRDAI, General Insurance Council
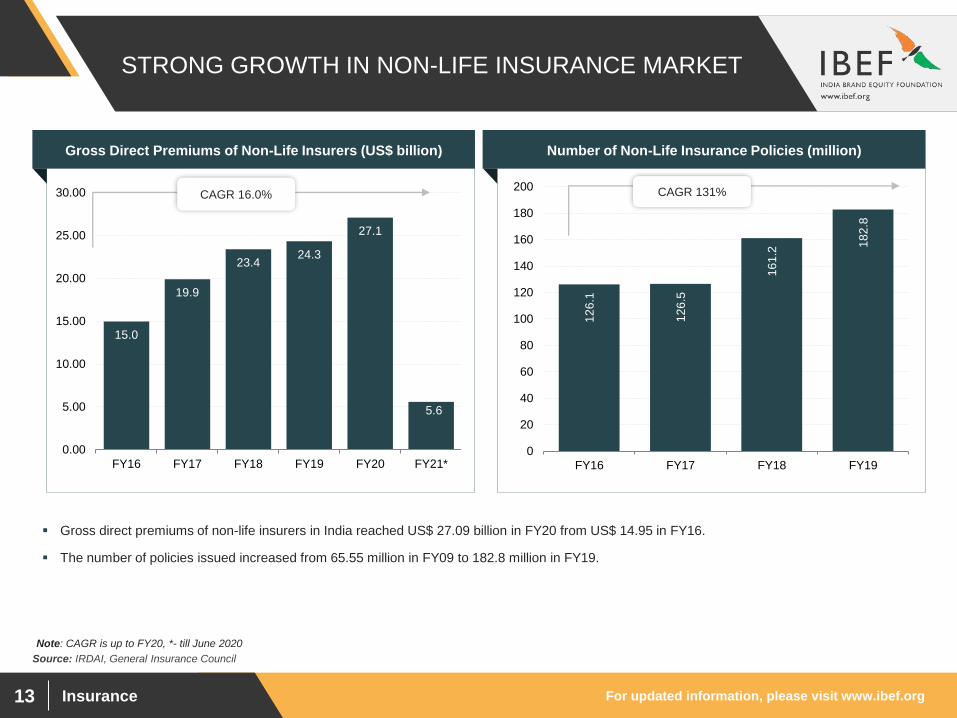
▪ Gross direct premiums of non-life insurers in India reached US$ 27.09 billion in FY20 from US$ 14.95 in FY16.
▪ The number of policies issued increased from 65.55 million in FY09 to 182.8 million in FY19.
12
6.1
12
6.5
16
1.2
18
2.8
0
20
40
60
80
100
120
140
160
180
200
FY16 FY17 FY18 FY19
Gross Direct Premiums of Non-Life Insurers (US$ billion) Number of Non-Life Insurance Policies (million)
CAGR 131%
Note: CAGR is up to FY20, *- till June 2020
15.0
19.9
23.424.3
27.1
5.6
0.00
5.00
10.00
15.00
20.00
25.00
30.00
FY16 FY17 FY18 FY19 FY20 FY21*
CAGR 16.0%
For updated information, please visit www.ibef.orgInsurance14
SHARES IN NON-LIFE INSURANCE MARKET: MOTOR
INSURANCE LEADS
Source: General Insurance Council, IRDAI
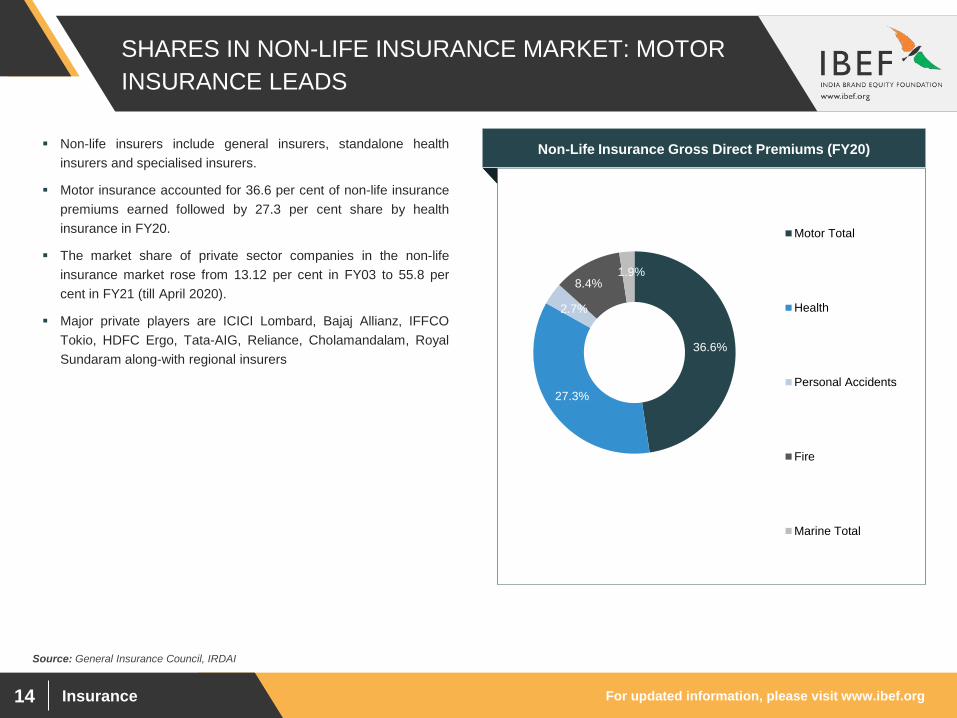
Non-Life Insurance Gross Direct Premiums (FY20)▪ Non-life insurers include general insurers, standalone health
insurers and specialised insurers.
▪ Motor insurance accounted for 36.6 per cent of non-life insurance
premiums earned followed by 27.3 per cent share by health
insurance in FY20.
▪ The market share of private sector companies in the non-life
insurance market rose from 13.12 per cent in FY03 to 55.8 per
cent in FY21 (till April 2020).
▪ Major private players are ICICI Lombard, Bajaj Allianz, IFFCO
Tokio, HDFC Ergo, Tata-AIG, Reliance, Cholamandalam, Royal
Sundaram along-with regional insurers36.6%
27.3%
2.7%
8.4%1.9%
Motor Total
Health
Personal Accidents
Fire
Marine Total
For updated information, please visit www.ibef.orgInsurance15
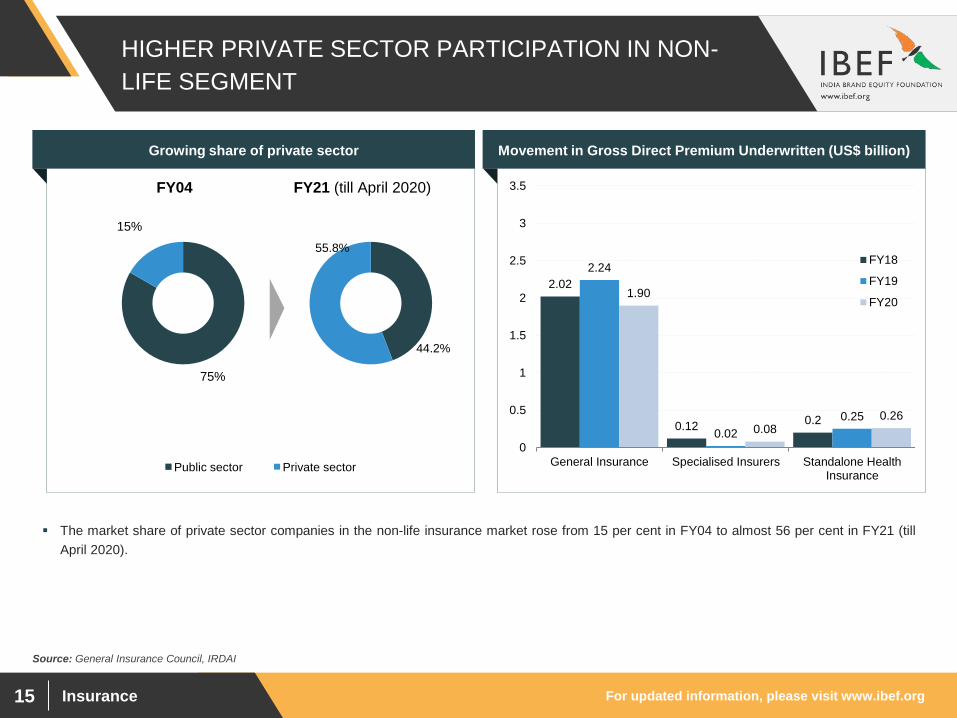
HIGHER PRIVATE SECTOR PARTICIPATION IN NON-
LIFE SEGMENT
Source: General Insurance Council, IRDAI
▪ The market share of private sector companies in the non-life insurance market rose from 15 per cent in FY04 to almost 56 per cent in FY21 (till
April 2020).
2.02
0.120.2
2.24
0.02
0.25
1.90
0.080.26
0
0.5
1
1.5
2
2.5
3
3.5
General Insurance Specialised Insurers Standalone HealthInsurance
FY18
FY19
FY20
Growing share of private sector Movement in Gross Direct Premium Underwritten (US$ billion)
44.2%
55.8%
FY21 (till April 2020)
75%
15%
FY04
Public sector Private sector
For updated information, please visit www.ibef.orgInsurance16
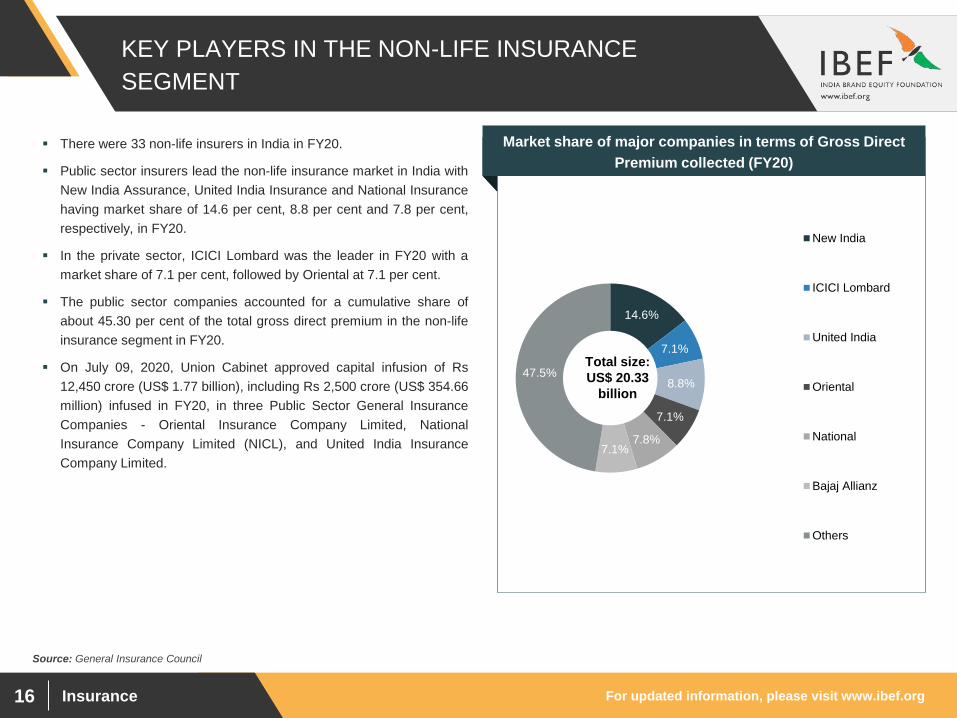
KEY PLAYERS IN THE NON-LIFE INSURANCE
SEGMENT
Source: General Insurance Council
Visakhapatnam port traffic (million tonnes)Market share of major companies in terms of Gross Direct
Premium collected (FY20)
▪ There were 33 non-life insurers in India in FY20.
▪ Public sector insurers lead the non-life insurance market in India with
New India Assurance, United India Insurance and National Insurance
having market share of 14.6 per cent, 8.8 per cent and 7.8 per cent,
respectively, in FY20.
▪ In the private sector, ICICI Lombard was the leader in FY20 with a
market share of 7.1 per cent, followed by Oriental at 7.1 per cent.
▪ The public sector companies accounted for a cumulative share of
about 45.30 per cent of the total gross direct premium in the non-life
insurance segment in FY20.
▪ On July 09, 2020, Union Cabinet approved capital infusion of Rs
12,450 crore (US$ 1.77 billion), including Rs 2,500 crore (US$ 354.66
million) infused in FY20, in three Public Sector General Insurance
Companies - Oriental Insurance Company Limited, National
Insurance Company Limited (NICL), and United India Insurance
Company Limited.
Total size:
US$ 20.33
billion
14.6%
7.1%
8.8%
7.1%
7.8%7.1%
47.5%
New India
ICICI Lombard
United India
Oriental
National
Bajaj Allianz
Others
For updated information, please visit www.ibef.orgInsurance17
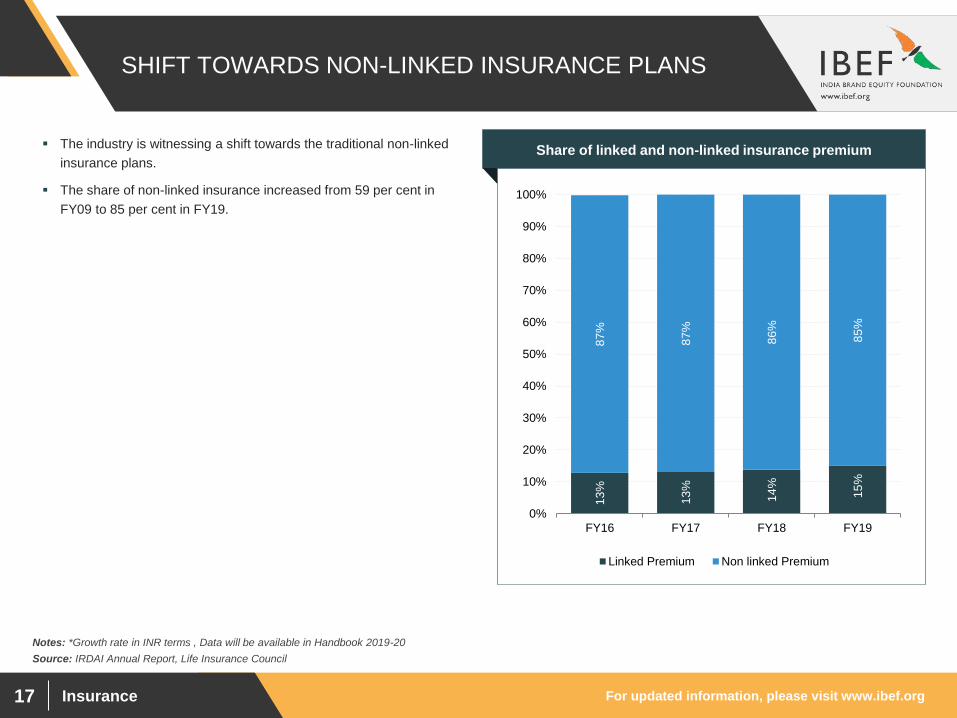
SHIFT TOWARDS NON-LINKED INSURANCE PLANS
13
%
13
%
14
%
15
%
87
%
87
%
86
%
85
%
0%
10%
20%
30%
40%
50%
60%
70%
80%
90%
100%
FY16 FY17 FY18 FY19
Linked Premium Non linked Premium
Source: IRDAI Annual Report, Life Insurance Council
Notes: *Growth rate in INR terms , Data will be available in Handbook 2019-20
Visakhapatnam port traffic (million tonnes)Share of linked and non-linked insurance premium▪ The industry is witnessing a shift towards the traditional non-linked
insurance plans.
▪ The share of non-linked insurance increased from 59 per cent in
FY09 to 85 per cent in FY19.

Insurance
NOTABLE TRENDS
AND STRATEGIES
For updated information, please visit www.ibef.orgInsurance19
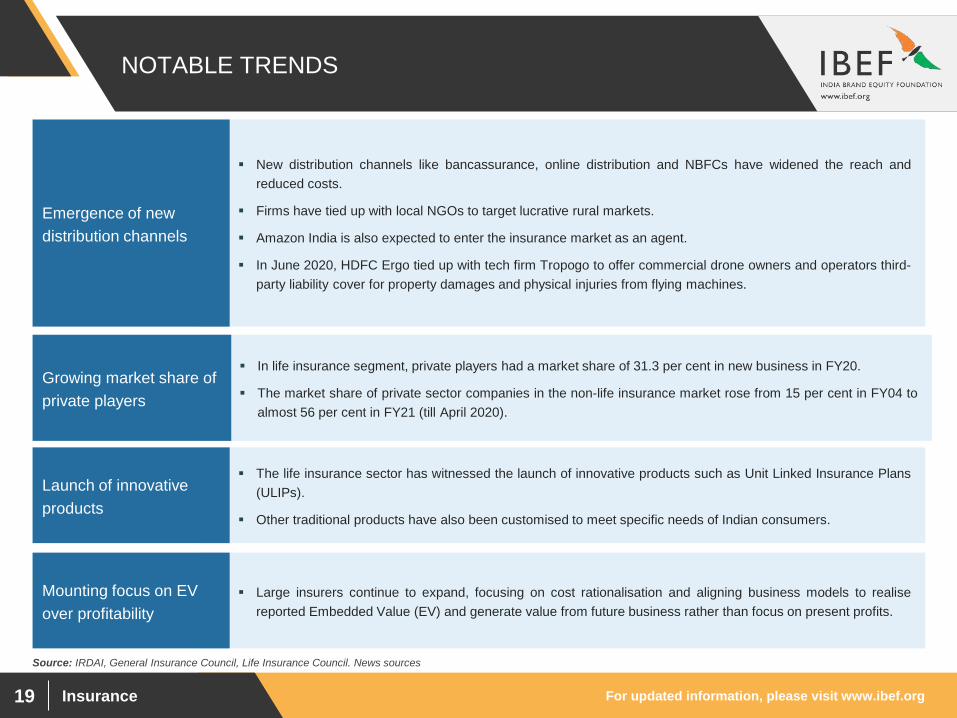
NOTABLE TRENDS
▪ New distribution channels like bancassurance, online distribution and NBFCs have widened the reach and
reduced costs.
▪ Firms have tied up with local NGOs to target lucrative rural markets.
▪ Amazon India is also expected to enter the insurance market as an agent.
▪ In June 2020, HDFC Ergo tied up with tech firm Tropogo to offer commercial drone owners and operators third-
party liability cover for property damages and physical injuries from flying machines.
Emergence of new
distribution channels
Source: IRDAI, General Insurance Council, Life Insurance Council. News sources
▪ In life insurance segment, private players had a market share of 31.3 per cent in new business in FY20.
▪ The market share of private sector companies in the non-life insurance market rose from 15 per cent in FY04 to
almost 56 per cent in FY21 (till April 2020).
Growing market share of
private players
▪ The life insurance sector has witnessed the launch of innovative products such as Unit Linked Insurance Plans
(ULIPs).
▪ Other traditional products have also been customised to meet specific needs of Indian consumers.
Launch of innovative
products
▪ Large insurers continue to expand, focusing on cost rationalisation and aligning business models to realise
reported Embedded Value (EV) and generate value from future business rather than focus on present profits.
Mounting focus on EV
over profitability
For updated information, please visit www.ibef.orgInsurance20
STRATEGIES ADOPTED
Source: TechSci Research
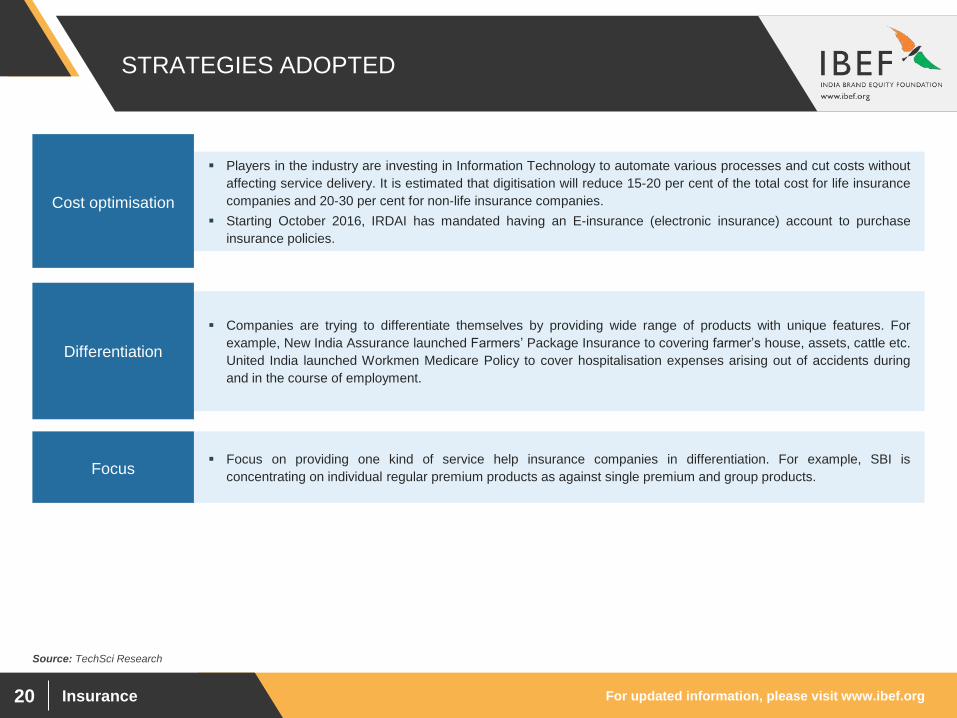
▪ Players in the industry are investing in Information Technology to automate various processes and cut costs without
affecting service delivery. It is estimated that digitisation will reduce 15-20 per cent of the total cost for life insurance
companies and 20-30 per cent for non-life insurance companies.
▪ Starting October 2016, IRDAI has mandated having an E-insurance (electronic insurance) account to purchase
insurance policies.
Cost optimisation
▪ Companies are trying to differentiate themselves by providing wide range of products with unique features. For
example, New India Assurance launched Farmers’ Package Insurance to covering farmer’s house, assets, cattle etc.
United India launched Workmen Medicare Policy to cover hospitalisation expenses arising out of accidents during
and in the course of employment.
Differentiation
▪ Focus on providing one kind of service help insurance companies in differentiation. For example, SBI is
concentrating on individual regular premium products as against single premium and group products.Focus
Insurance
GROWTH DRIVERS
For updated information, please visit www.ibef.orgInsurance22
GROWTH DRIVERS FOR INSURANCE IN INDIA… (1/2)
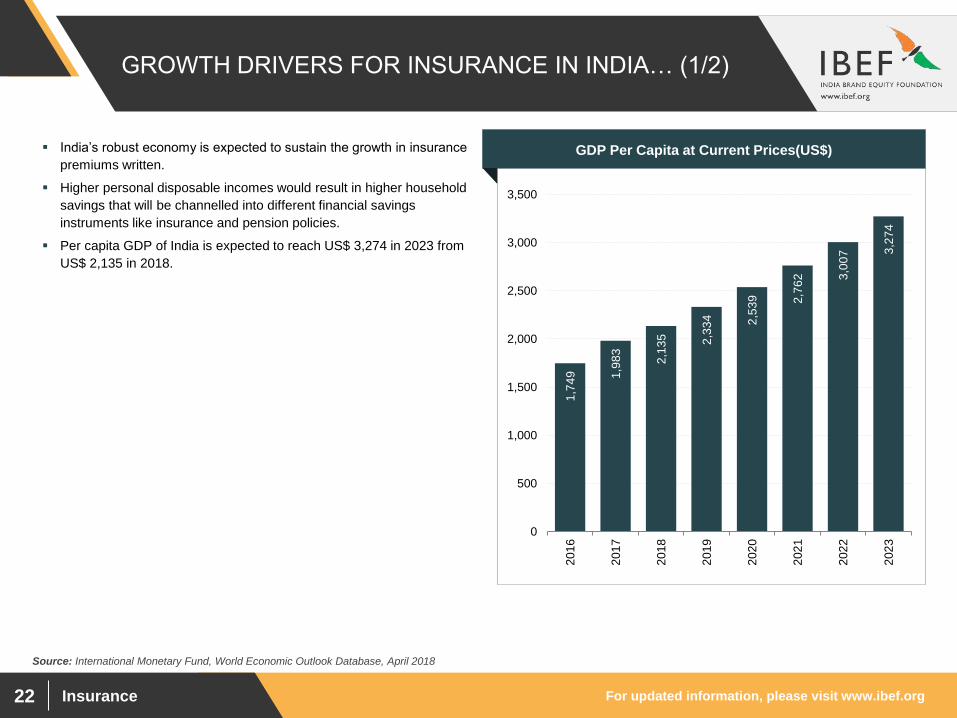
▪ India’s robust economy is expected to sustain the growth in insurance
premiums written.
▪ Higher personal disposable incomes would result in higher household
savings that will be channelled into different financial savings
instruments like insurance and pension policies.
▪ Per capita GDP of India is expected to reach US$ 3,274 in 2023 from
US$ 2,135 in 2018.
1,7
49
1,9
83
2,1
35
2,3
34
2,5
39
2,7
62
3,0
07
3,2
74
0
500
1,000
1,500
2,000
2,500
3,000
3,500
201
6
201
7
201
8
201
9
202
0
202
1
202
2
202
3
Visakhapatnam port traffic (million tonnes)GDP Per Capita at Current Prices(US$)
Source: International Monetary Fund, World Economic Outlook Database, April 2018
For updated information, please visit www.ibef.orgInsurance23
GROWTH DRIVERS FOR INSURANCE IN INDIA… (2/2)
Source: EY - Insurance industry - Challenges, reforms and realignment
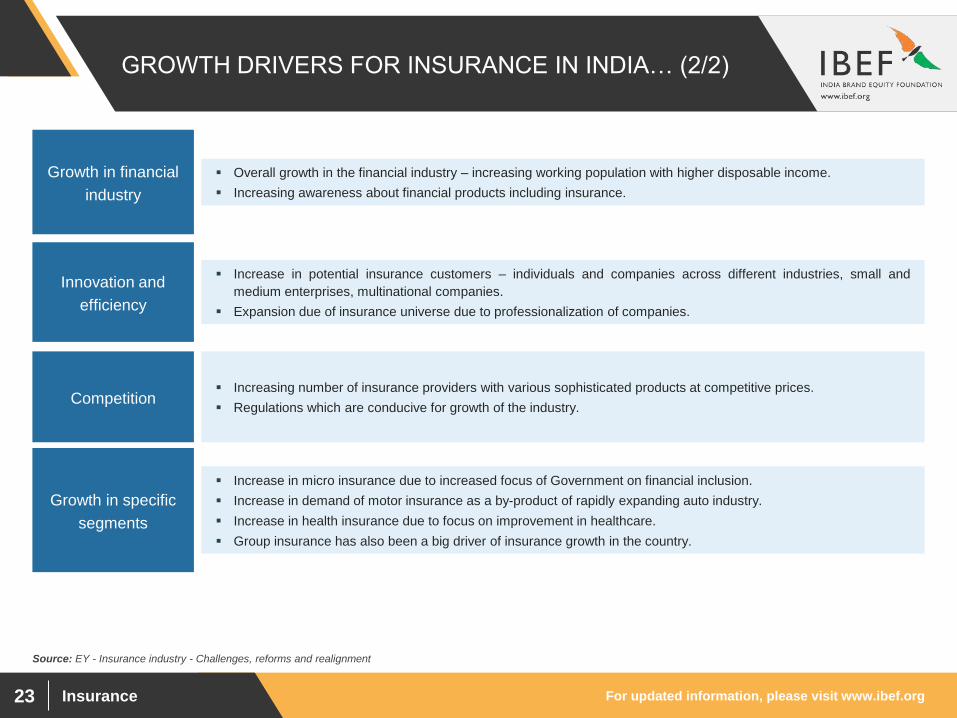
▪ Increasing number of insurance providers with various sophisticated products at competitive prices.
▪ Regulations which are conducive for growth of the industry.Competition
▪ Increase in potential insurance customers – individuals and companies across different industries, small and
medium enterprises, multinational companies.
▪ Expansion due of insurance universe due to professionalization of companies.
Innovation and
efficiency
▪ Overall growth in the financial industry – increasing working population with higher disposable income.
▪ Increasing awareness about financial products including insurance.
Growth in financial
industry
▪ Increase in micro insurance due to increased focus of Government on financial inclusion.
▪ Increase in demand of motor insurance as a by-product of rapidly expanding auto industry.
▪ Increase in health insurance due to focus on improvement in healthcare.
▪ Group insurance has also been a big driver of insurance growth in the country.
Growth in specific
segments
For updated information, please visit www.ibef.orgInsurance24
FAVOURABLE POLICY MEASURES AID THE SECTOR
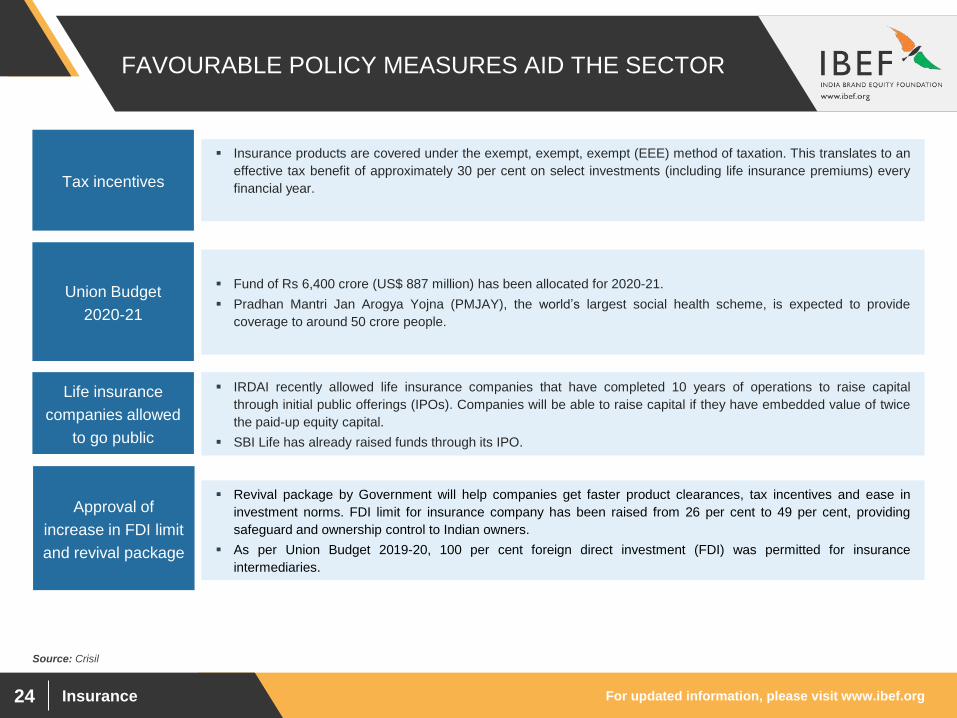
▪ IRDAI recently allowed life insurance companies that have completed 10 years of operations to raise capital
through initial public offerings (IPOs). Companies will be able to raise capital if they have embedded value of twice
the paid-up equity capital.
▪ SBI Life has already raised funds through its IPO.
Life insurance
companies allowed
to go public
▪ Fund of Rs 6,400 crore (US$ 887 million) has been allocated for 2020-21.
▪ Pradhan Mantri Jan Arogya Yojna (PMJAY), the world’s largest social health scheme, is expected to provide
coverage to around 50 crore people.
Union Budget
2020-21
▪ Insurance products are covered under the exempt, exempt, exempt (EEE) method of taxation. This translates to an
effective tax benefit of approximately 30 per cent on select investments (including life insurance premiums) every
financial year.Tax incentives
▪ Revival package by Government will help companies get faster product clearances, tax incentives and ease in
investment norms. FDI limit for insurance company has been raised from 26 per cent to 49 per cent, providing
safeguard and ownership control to Indian owners.
▪ As per Union Budget 2019-20, 100 per cent foreign direct investment (FDI) was permitted for insurance
intermediaries.
Approval of
increase in FDI limit
and revival package
Source: Crisil
For updated information, please visit www.ibef.orgInsurance25
RISING PRIVATE SECTOR INVESTMENT IN
INSURANCE
Source: Towers Watson; Assorted news articles, EY
▪ In January 2019, online insurance distribution platform, Turtlemint, raised US$ 25 million in funding.
▪ True North, a private equity (PE) investor, acquired 51 per cent stake in Max Bupa Health Insurance Company for Rs 511 crore (US$ 71.80 million).
▪ Global insurance broker, Marsh, raised its shareholding in its Indian joint venture to the maximum FDI limit of 49 per cent from 26 per cent.
▪ In December 2017, IRDAI allowed PE investors to become promoters in unlisted insurance companies. The move is expected to enhance PE
investments in the sector.
▪ Most of the existing players are tying up with banks to expand their distribution network.
▪ In April 2020, Axis Bank acquired an additional 29 per cent stake in Max Life Insurance.

Insurance
OPPORTUNITIES
For updated information, please visit www.ibef.orgInsurance27
INDIA’S INSURANCE MARKET OFFERS A HOST OF
OPPORTUNITIES ACROSS BUSINESS LINES
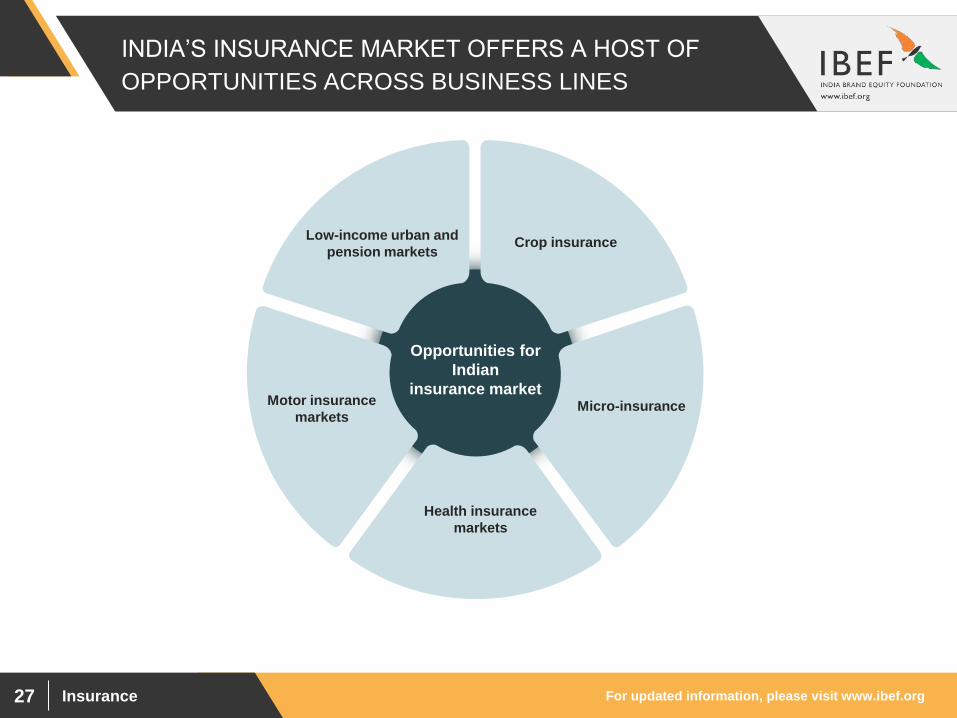
Opportunities for
Indian
insurance market
Low-income urban and
pension markets Crop insurance
Motor insurance
marketsMicro-insurance
Health insurance
markets
For updated information, please visit www.ibef.orgInsurance28
NON-LIFE INSURERS: MOTOR INSURANCE MARKETS
Source: IRDAI, ACMA, SIAM
Note: E -estimates, CAGR - Compound Annual Growth Rate, ACMA - Automotive Component Manufacturers Association of India
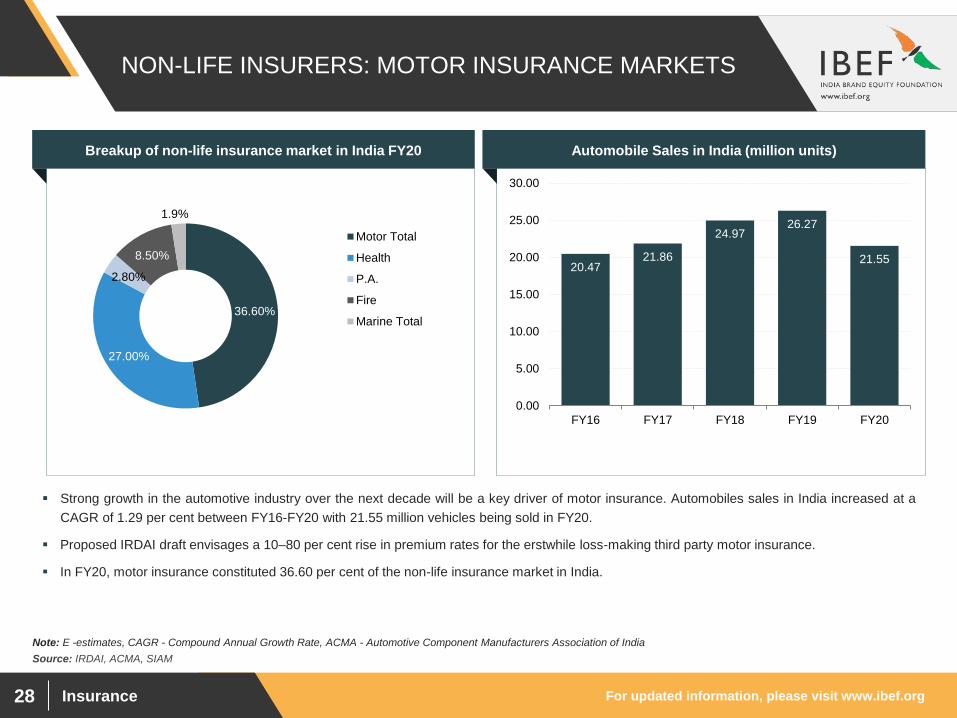
▪ Strong growth in the automotive industry over the next decade will be a key driver of motor insurance. Automobiles sales in India increased at a
CAGR of 1.29 per cent between FY16-FY20 with 21.55 million vehicles being sold in FY20.
▪ Proposed IRDAI draft envisages a 10–80 per cent rise in premium rates for the erstwhile loss-making third party motor insurance.
▪ In FY20, motor insurance constituted 36.60 per cent of the non-life insurance market in India.
Breakup of non-life insurance market in India FY20 Automobile Sales in India (million units)
36.60%
27.00%
2.80%
8.50%
1.9%
Motor Total
Health
P.A.
Fire
Marine Total
20.4721.86
24.9726.27
21.55
0.00
5.00
10.00
15.00
20.00
25.00
30.00
FY16 FY17 FY18 FY19 FY20
For updated information, please visit www.ibef.orgInsurance29
NON-LIFE INSURERS: HEALTH INSURANCE MARKETS
▪ Only 1.5–2.0 per cent of total healthcare expenditure in India is currently covered by insurance providers.
▪ Only 18 per cent of people in urban areas and 14 per cent in rural areas are covered under any kind of health insurance scheme.
▪ Gross direct premium from health insurance reached Rs 848.4 lakhs (US$ 1.21 billion) in FY20 (till May 2019) and contributed 30.2 per cent to the
gross direct premiums of non-life insurance companies in India.
▪ Absence of a government-funded health insurance makes the market attractive for private players. In August 2018, coverage of mental illness
under health policies was also mandated by the IRDAI.
▪ Introduction of health insurance portability expected to boost the orderly growth of the health insurance sector.
▪ Private insurance coverage is estimated to grow by nearly 15 per cent annually till 2020.
▪ Government-sponsored programmes are expected to provide coverage to nearly 380 million people by 2020, driven by initiatives such as RSBY
and ESIC.
▪ RSBY is a centrally sponsored scheme to provide health insurance to below poverty line (BPL) families and eleven other defined categories of
unorganised workers, namely building and other construction workers, licensed railway porters, street vendors, and MGNREGA workers among
others.
Note: RSBY - Rashtriya Swasthya Bima Yojana, ESIC – Employees’ State Insurance Corporation, MREGA – Mahatma Gandhi National Rural Employment Guarantee Act., NSSO
For updated information, please visit www.ibef.orgInsurance30
STRONG POTENTIAL IN CROP INSURANCE
Source: Agricultural Insurance Company of India Annual Report, Department of Agriculture and Cooperation, IRDAI, Livemint, PTI
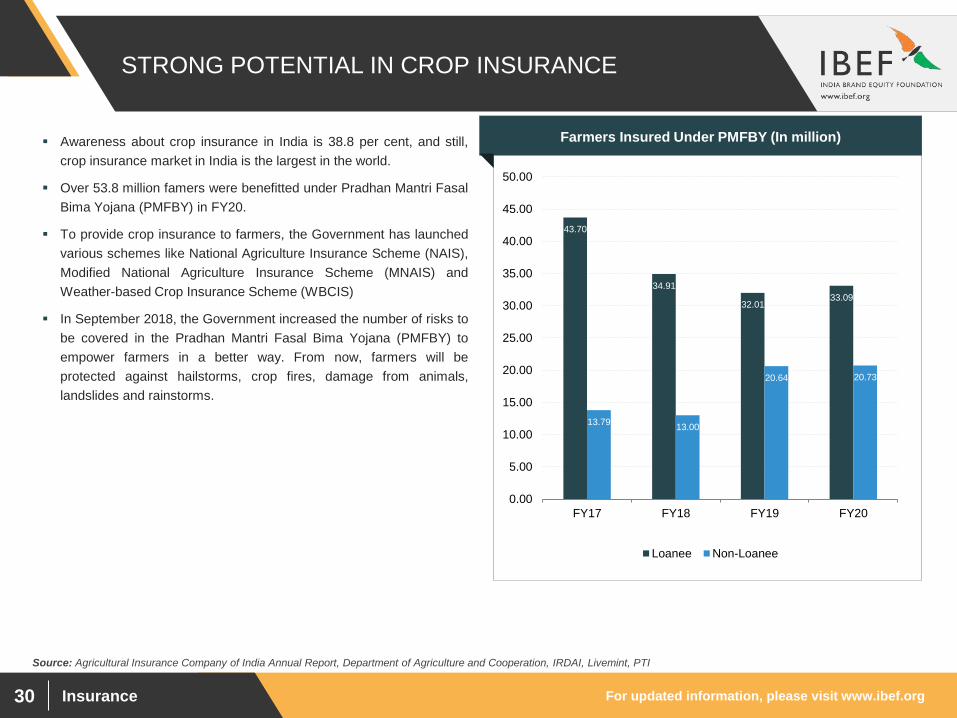
▪ Awareness about crop insurance in India is 38.8 per cent, and still,
crop insurance market in India is the largest in the world.
▪ Over 53.8 million famers were benefitted under Pradhan Mantri Fasal
Bima Yojana (PMFBY) in FY20.
▪ To provide crop insurance to farmers, the Government has launched
various schemes like National Agriculture Insurance Scheme (NAIS),
Modified National Agriculture Insurance Scheme (MNAIS) and
Weather-based Crop Insurance Scheme (WBCIS)
▪ In September 2018, the Government increased the number of risks to
be covered in the Pradhan Mantri Fasal Bima Yojana (PMFBY) to
empower farmers in a better way. From now, farmers will be
protected against hailstorms, crop fires, damage from animals,
landslides and rainstorms.
Farmers Insured Under PMFBY (In million)
43.70
34.91
32.0133.09
13.7913.00
20.64 20.73
0.00
5.00
10.00
15.00
20.00
25.00
30.00
35.00
40.00
45.00
50.00
FY17 FY18 FY19 FY20
Loanee Non-Loanee
Insurance
USEFUL
INFORMATION
For updated information, please visit www.ibef.orgInsurance32
INDUSTRY ORGANISATIONS
3rd Floor, Parisrama Bhavan, Basheer Bagh, Hyderabad–500 004
Phone: 91-040-23381100
Fax: 91-040-66823334
E-mail: [email protected]
Insurance Regulatory and Development Authority (IRDAI)
5th Floor, Royal Insurance Building, 14, Jamshedji TATA Road,
Churchgate, Mumbai–400020
Phone: 91-22-22817511, 22817512
Fax: 91-22-22817515
E-mail: [email protected]
General Insurance Council
4th Floor, Jeevan Seva Annexe Bldg. S. V. Road, Santacruz (W),
Mumbai–400054
Phone: 91-22-26103303, 26103306
E-mail: [email protected]
Life Insurance Council
For updated information, please visit www.ibef.orgInsurance33
GLOSSARY
▪ CAGR: Compound Annual Growth Rate
▪ IRDAI: Insurance Regulatory and Development Authority
▪ IPO: Initial Public Offering
▪ FDI: Foreign Direct Investment
▪ LIC: Life Insurance Corporation of India
▪ GIC: General Insurance Corporation of India
▪ NBFC: Non-Banking Financial Company
▪ NGO: Non-Governmental Organisation
▪ RSBY: Rashtriya Swasthya Bima Yojana
▪ PFRDA: Pension Fund Regulatory and Development Authority
▪ GDP: Gross Domestic Product
▪ ESIC: Employees State Insurance Corporation
▪ FY: Indian Financial Year (April to March)
▪ So, FY12 implies April 2011 to March 2012
▪ GOI: Government of India
▪ INR: Indian Rupee
▪ US$ : US Dollar
▪ Where applicable, numbers have been rounded off to the nearest whole number
For updated information, please visit www.ibef.orgInsurance34
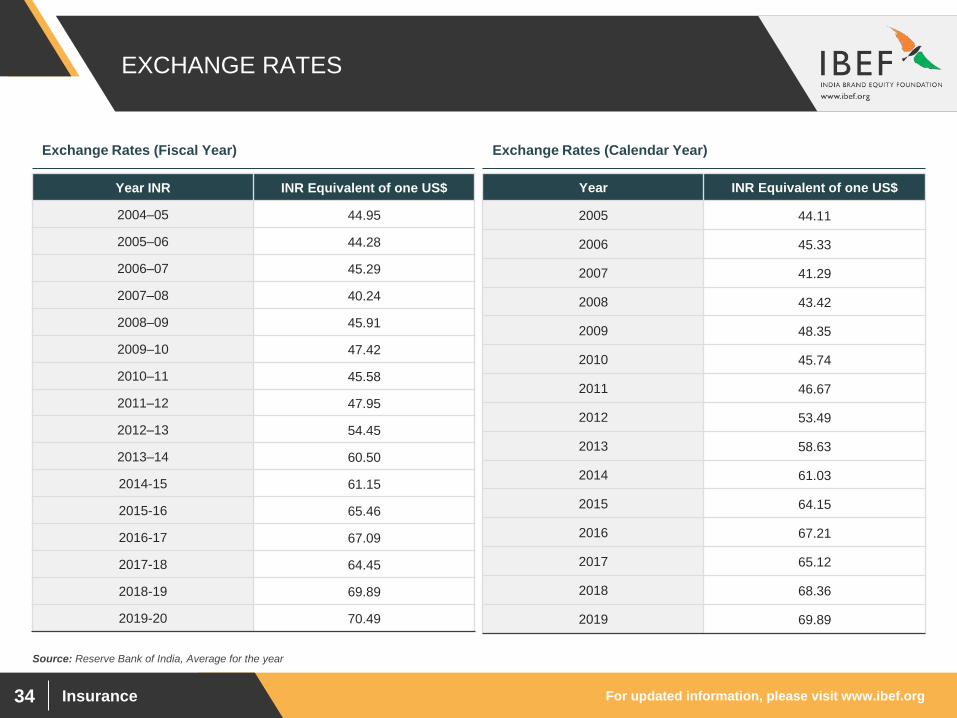
EXCHANGE RATES
Exchange Rates (Fiscal Year) Exchange Rates (Calendar Year)
Year INR INR Equivalent of one US$
2004–05 44.95
2005–06 44.28
2006–07 45.29
2007–08 40.24
2008–09 45.91
2009–10 47.42
2010–11 45.58
2011–12 47.95
2012–13 54.45
2013–14 60.50
2014-15 61.15
2015-16 65.46
2016-17 67.09
2017-18 64.45
2018-19 69.89
2019-20 70.49
Year INR Equivalent of one US$
2005 44.11
2006 45.33
2007 41.29
2008 43.42
2009 48.35
2010 45.74
2011 46.67
2012 53.49
2013 58.63
2014 61.03
2015 64.15
2016 67.21
2017 65.12
2018 68.36
2019 69.89
Source: Reserve Bank of India, Average for the year
For updated information, please visit www.ibef.orgInsurance35
DISCLAIMER
India Brand Equity Foundation (IBEF) engaged TechSci Research to prepare this presentation and the same has been prepared by TechSci
Research in consultation with IBEF.
All rights reserved. All copyright in this presentation and related works is solely and exclusively owned by IBEF. The same may not be reproduced,
wholly or in part in any material form (including photocopying or storing it in any medium by electronic means and whether or not transiently or
incidentally to some other use of this presentation), modified or in any manner communicated to any third party except with the written approval
of IBEF.
This presentation is for information purposes only. While due care has been taken during the compilation of this presentation to ensure that the
information is accurate to the best of TechSci Research and IBEF’s knowledge and belief, the content is not to be construed in any manner
whatsoever as a substitute for professional advice.
TechSci Research and IBEF neither recommend nor endorse any specific products or services that may have been mentioned in this presentation
and nor do they assume any liability or responsibility for the outcome of decisions taken as a result of any reliance placed on this presentation.
Neither TechSci Research nor IBEF shall be liable for any direct or indirect damages that may arise due to any act or omission on the part of the user
due to any reliance placed or guidance taken from any portion of this presentation.


