Page 1
INVESTIGATION OF ARBUSCULAR MYCORRHIZAL
INOCULATION ON GROWTH OF TROPICAL FRUIT
SEEDLINGS UNDER SALINE, FLOODING AND
NUTRIENT STRESS CONDITIONS
DANIEL KIPROP CHEBET
DOCTOR OF PHILOSOPHY
(Horticulture)
JOMO KENYATTA UNIVERSITY OF
AGRICULTURE AND TECHNOLOGY
2020
Page 2
Investigation of arbuscular mycorrhizal inoculation on growth of
tropical fruit seedlings under saline, flooding and nutrient stress
conditions
Daniel Kiprop Chebet
A Thesis Submitted in Partial Fulfillment for the Degree of Doctor
of Philosophy in Horticulture in the Jomo Kenyatta University of
Agriculture and Technology
2020
Page 3
ii
DECLARATION
This is my original work and has not been presented for a degree in any other
University
Signature ________________________ Date _______________________
Daniel Kiprop Chebet
This thesis has been submitted for examination with the approval of the University
Supervisors
Signature ________________________ Date _______________________
Prof. Wariara Kariuki, PhD
SCU, Kenya
Signature ________________________ Date _______________________
Prof. Leonard Wamocho, PhD
MMUST, Kenya
Signature ________________________ Date _______________________
Dr. Fredah K. Rimberia Wanzala, PhD
JKUAT, Kenya
Page 4
iii
DEDICATION
This thesis is dedicated to the most important people in my life: my wife Viola Kiprop,
son Brian Ruto, our niece Wanda Abigael and parents Enock and Christine Chebet.
You are simply the best, and I thank God for you.
Page 5
iv
ACKNOWLEDGEMENTS
I wish to first thank God for his goodness, favour and mercy that has made it possible
for me to get to this stage in this study. Thank you Lord for your protection and
sustenance as I undertook this study. All glory and honour be unto you my God.
I also wish to thank my supervisors Professor Wariara Kariuki, Professor Leonard
Wamocho and Dr. Fredah K.Rimberia Wanzala for their invaluable guidance and
advice as I undertook the study. Thank you too for your patience as you waited for me
to complete this work. May God bless you abundantly. I wish to thank Dr. Laban
Kipkoriony Rutto (formerly of JKUAT) for his advice, guidance and encouragement
as I started this work, and his assistance in setting up the greenhouse in JKUAT and
his support of the study.
I thank the technicians of Horticulture laboratories in JKUAT, Soil Science and
Chemistry laboratory in University of Eldoret for their support as I undertook the
analytical work. I especially want to thank Patrick Kavagi of JKUAT and the following
staff in University of Eldoret labs: Jebet Arusei, Moses Kiplagat, Evelyne Wanjiru and
Rispah Kosgey. Without you, this work would not have been completed successfully.
I sincerely thank the Government of Kenya through HELB and the German
government (through DAAD) for providing the funds and scholarships needed to
undertake this study.
I also wish to thank my family for standing with me and bearing with my long absence
as I undertook this study. Special thanks go to my parents Mr. Enock Chebet and Mrs
Christine Chebet and my lovely wife Mrs Viola Kiprop and son Brian Ruto for their
patience and prayers as I undertook this study. Special thanks also to our niece Wanda
Jepchumba for also standing with me. This work would not have been possible without
the contributions of these loved ones.
Page 6
v
TABLE OF CONTENTS
DECLARATION ....................................................................................................... II
DEDICATION ..........................................................................................................III
ACKNOWLEDGEMENTS ..................................................................................... IV
TABLE OF CONTENTS .......................................................................................... V
LIST OF TABLES .................................................................................................... X
LIST OF FIGURES .............................................................................................. XIII
LIST OF PLATES ................................................................................................. XV
LIST OF APPENDICES .................................................................................... XVII
ABSTRACT ........................................................................................................ XXIII
CHAPTER ONE ........................................................................................................ 1
INTRODUCTION ...................................................................................................... 1
1.1 Background Information ................................................................. 1
1.2 Problem Statement .......................................................................... 3
1.3 Justification for the Study ............................................................... 7
1.4 Objectives ........................................................................................ 8
1.4.1 Main Objective ......................................................................... 8
1.4.2 Specific Objectives ................................................................... 8
Page 7
vi
CHAPTER TWO ..................................................................................................... 10
LITERATURE REVIEW ........................................................................................ 10
2.1 General introduction to Mycorrhiza Fungi ...................................................... 10
2.2 Effect of Arbuscular Mycorrhizal Inoculation on the Survival and Growth of
Tropical Fruit Seedlings under Salt Stress........................................................ 17
2.2.1 Introduction on Salt Stress ........................................................................ 17
2.2.2 Effect of Salt Stress on Crop Productivity ................................................ 18
2.2.3 Effect of Arbuscular Mycorrhiza Fungi on Growth of Plants under salt
stress ................................................................................................................... 18
2.2.4 Effect of Salt Stress on Arbuscular Mycorrhizal Colonization ................. 20
2.2.5 Effect of Salt Stress and Arbuscular Mycorrhizal Inoculation on the
Nutrient Uptake of Seedlings ............................................................................. 21
2.3 Effect of Arbuscular Mycorrhizal Inoculation on the Survival and Growth of
Tropical Fruit Seedlings under Flooding Stress ............................................. 22
2.3.1 Introduction on Flooding Stress ................................................................ 22
2.3.2 Effect of Flooding Stress on Arbuscular Mycorrhizal Colonization ........ 24
2.3.3 Effect of Arbuscular Mycorrhizal on Growth and Nutrient Uptake of
Seedlings under Flooding Stress ........................................................................ 25
2.4 Effect of Arbuscular Mycorrhizal Inoculation on Growth and Nutrient Uptake
of Tropical Fruit Seedlings ............................................................................... 26
2.4.1 Role of Arbuscular Mycorrhiza on Physical Growth of Plants................. 26
2.4.2 Role of Arbuscular Mycorrhiza on Nutrient Uptake of seedlings ............ 27
Page 8
vii
CHAPTER THREE ................................................................................................. 31
MATERIALS AND METHODS ............................................................................ 31
3.1 Study Sites ........................................................................................................ 31
3.2 Seed Germination ............................................................................................. 31
3.3 Mycorrhizal Inoculum Content ........................................................................ 31
3.4 Treatments and Experimental Design for Salinity Stress Experiment ............. 32
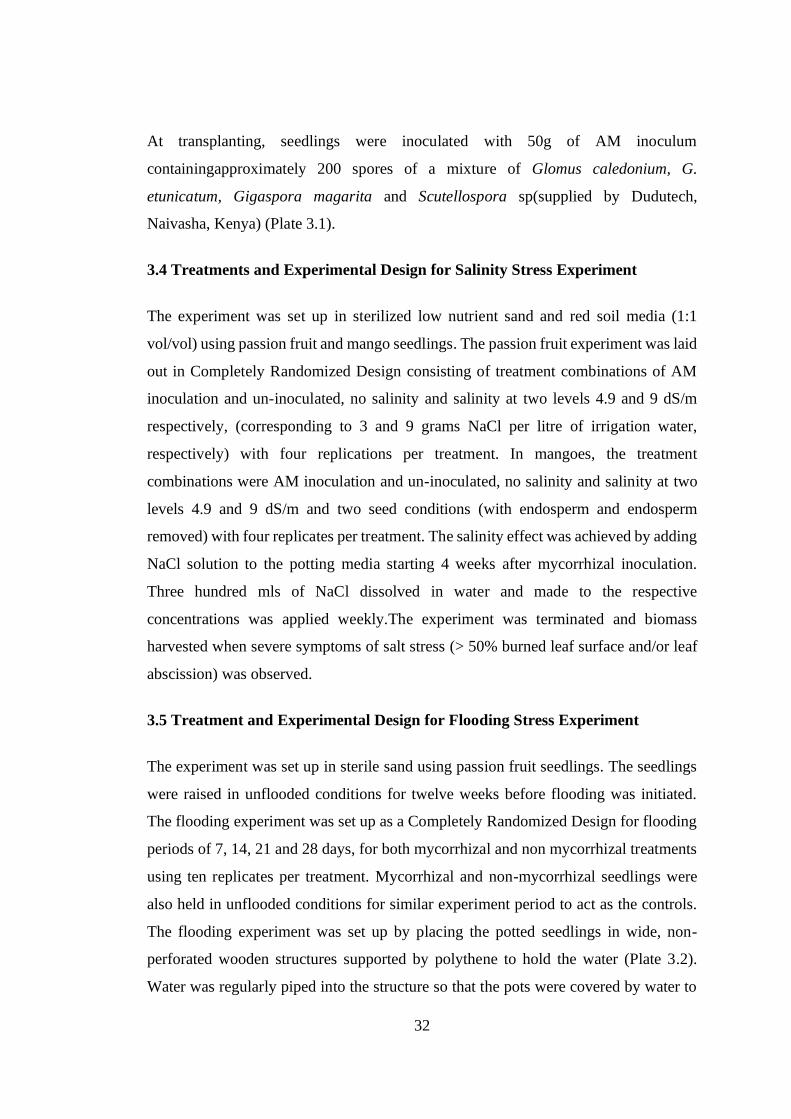
3.5 Treatment and Experimental Design for Flooding Stress Experiment ............ 32
3.6 Treatments and Experimental Design for Nutrient Stress Experiment ............ 33
3.7 Plant Growth Measurements ............................................................................ 34
3.8 Nutrient Analysis Determinations .................................................................... 34
3.9 Evaluation of Mycorrhizal Root Infection Levels ........................................... 35
3.10 Determination of the Soil Mycorrhizal Colonization .................................... 36
3.11 Determination of Chlorophyll and Carotenoids Content ............................... 36
3.12 Determination of Proline and Total Soluble Sugars: ..................................... 37
3.13 Statistical analysis .......................................................................................... 37
CHAPTER FOUR .................................................................................................... 38
RESULTS ................................................................................................................. 38
4.1 Effect of Arbuscular Mycorrhizal Fungi on Salt Stress of Passion Fruits and
Mango Seedlings .............................................................................................. 38
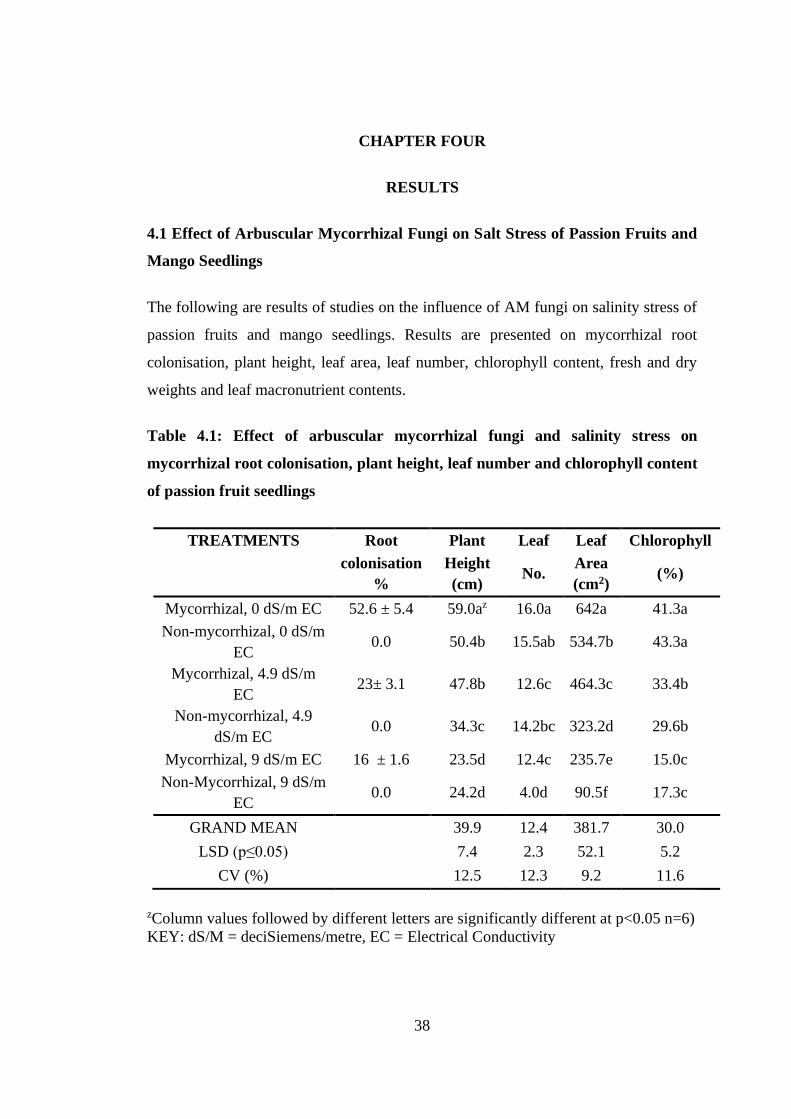
4.1.1 Mycorrhizal Root Colonisation Levels ......................................................... 39
Page 9
viii
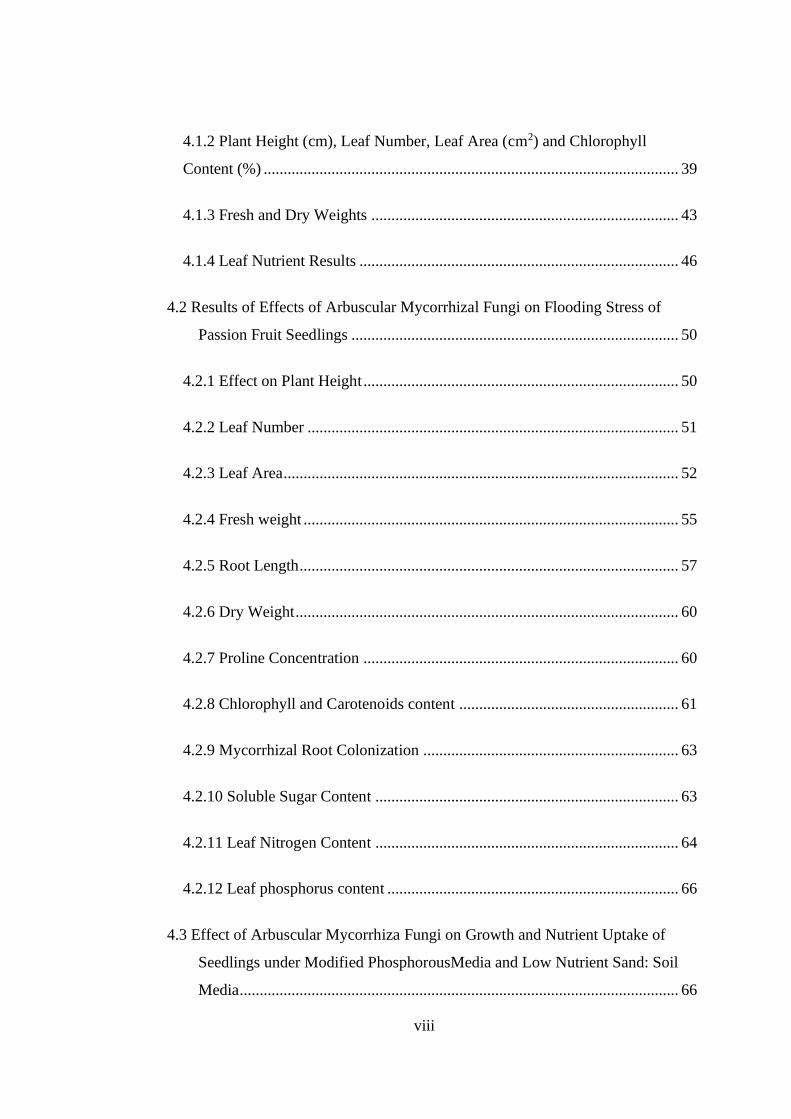
4.1.2 Plant Height (cm), Leaf Number, Leaf Area (cm2) and Chlorophyll
Content (%) ........................................................................................................ 39
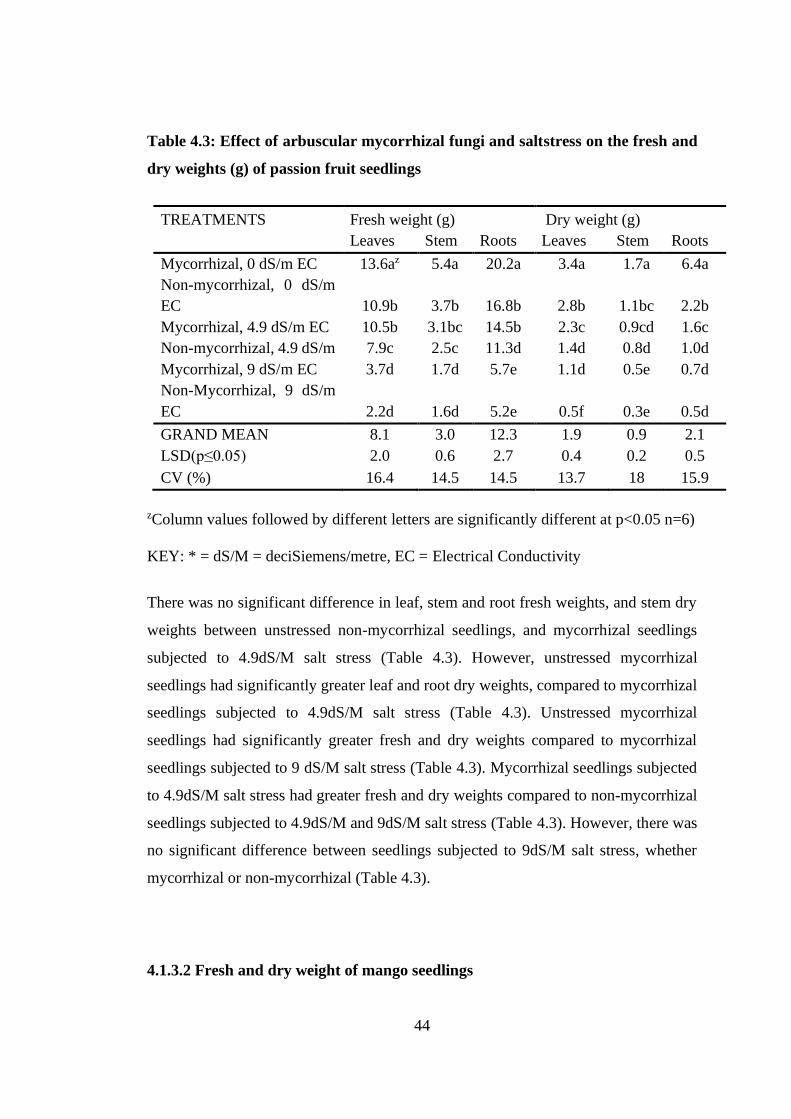
4.1.3 Fresh and Dry Weights ............................................................................. 43
4.1.4 Leaf Nutrient Results ................................................................................ 46
4.2 Results of Effects of Arbuscular Mycorrhizal Fungi on Flooding Stress of
Passion Fruit Seedlings .................................................................................. 50
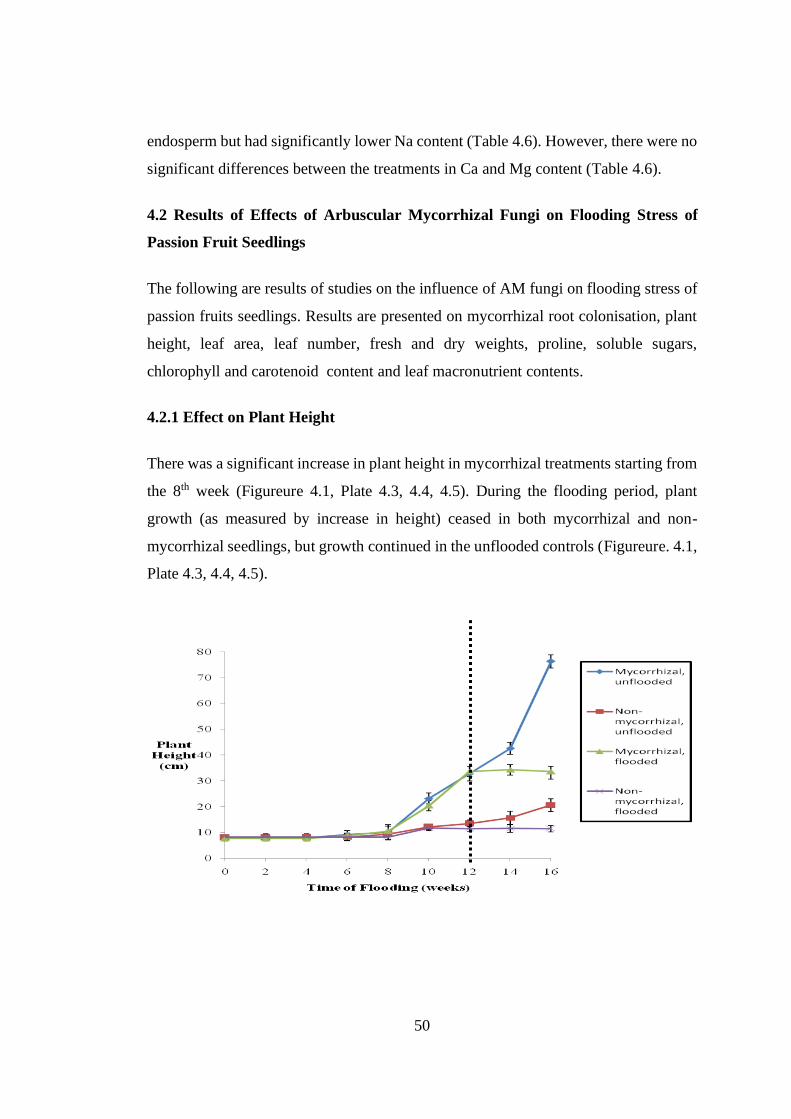
4.2.1 Effect on Plant Height ............................................................................... 50
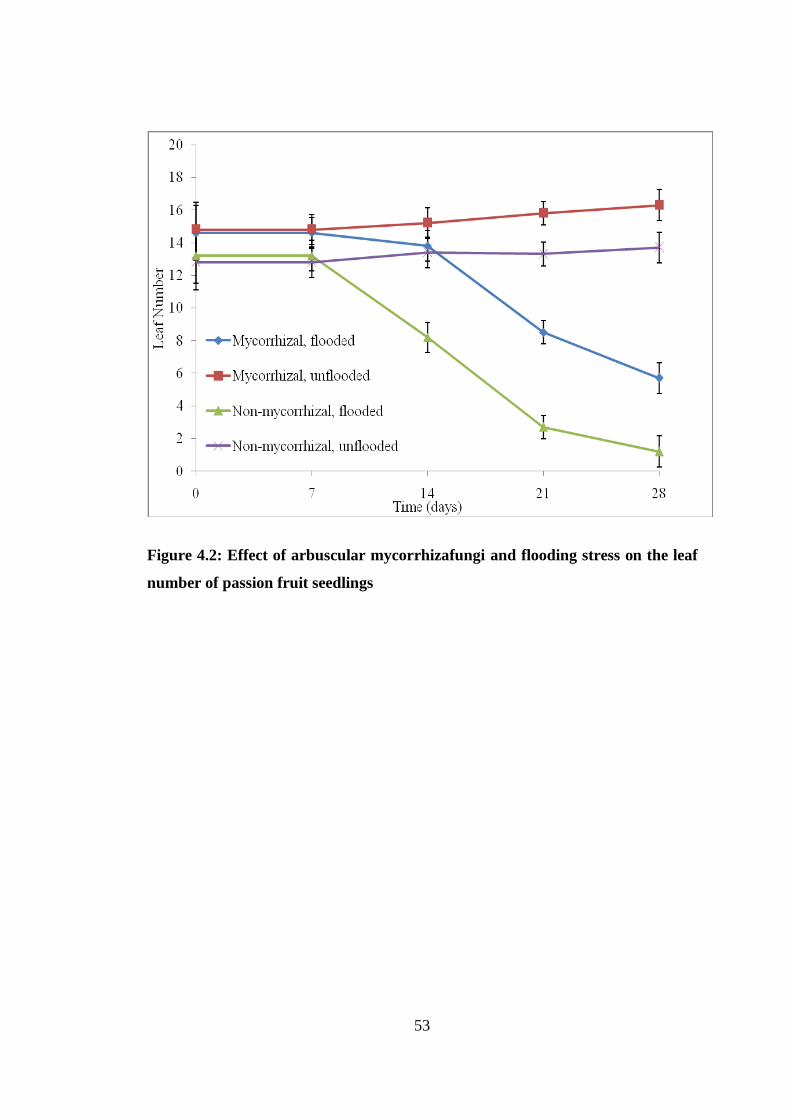
4.2.2 Leaf Number ............................................................................................. 51
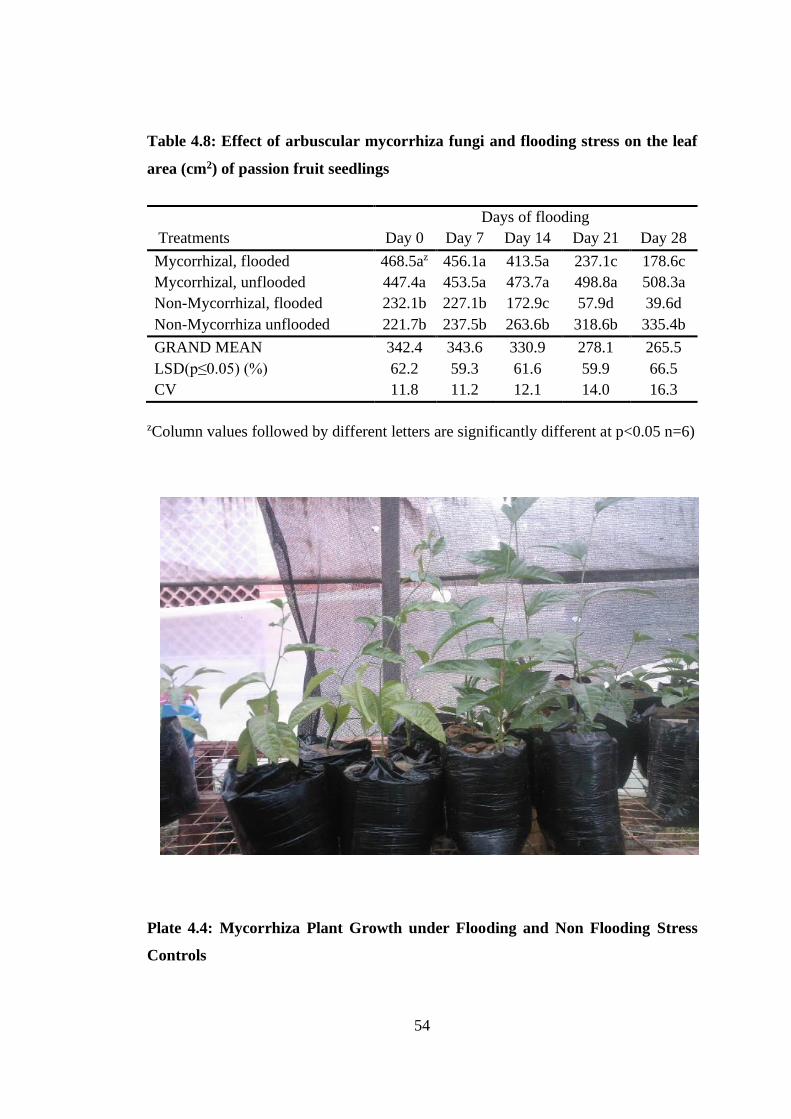
4.2.3 Leaf Area ................................................................................................... 52
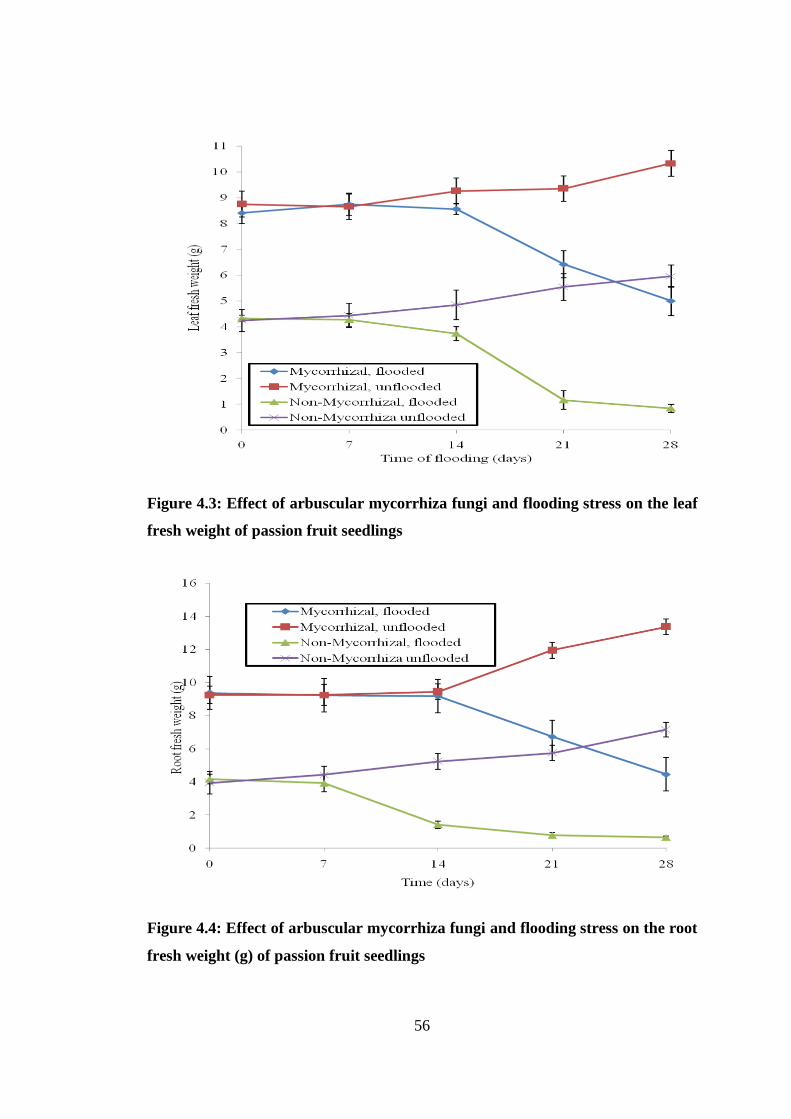
4.2.4 Fresh weight .............................................................................................. 55
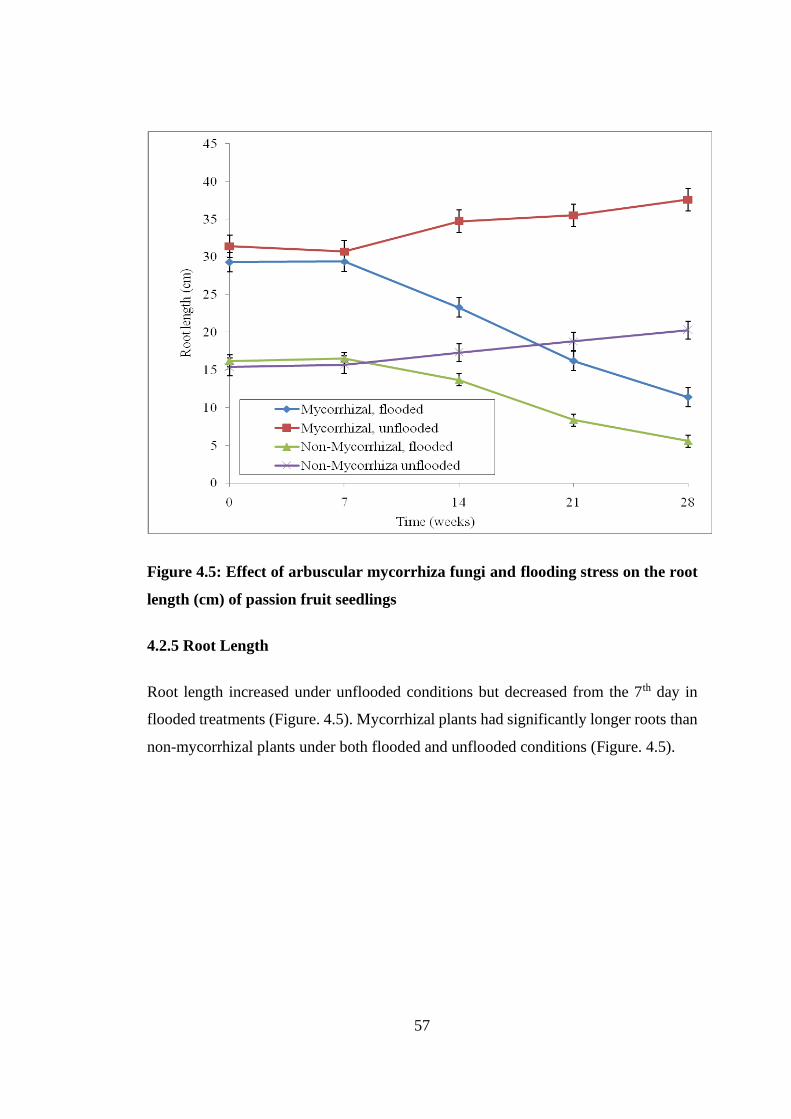
4.2.5 Root Length ............................................................................................... 57
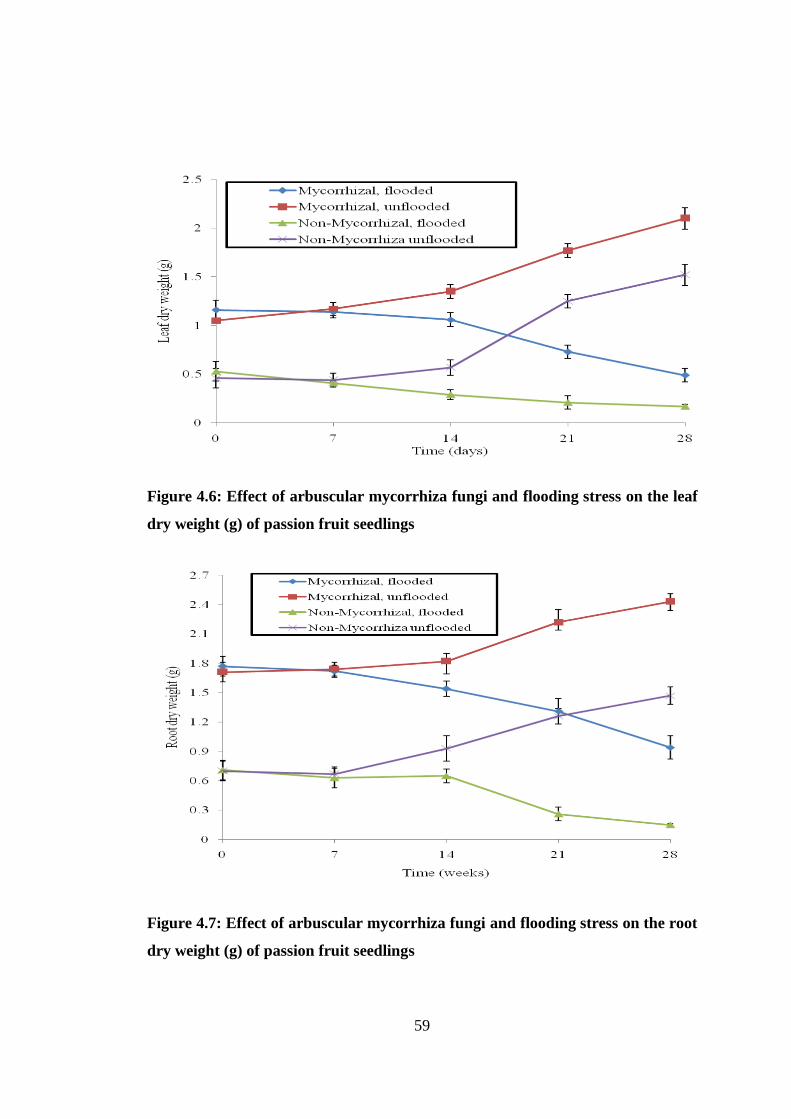
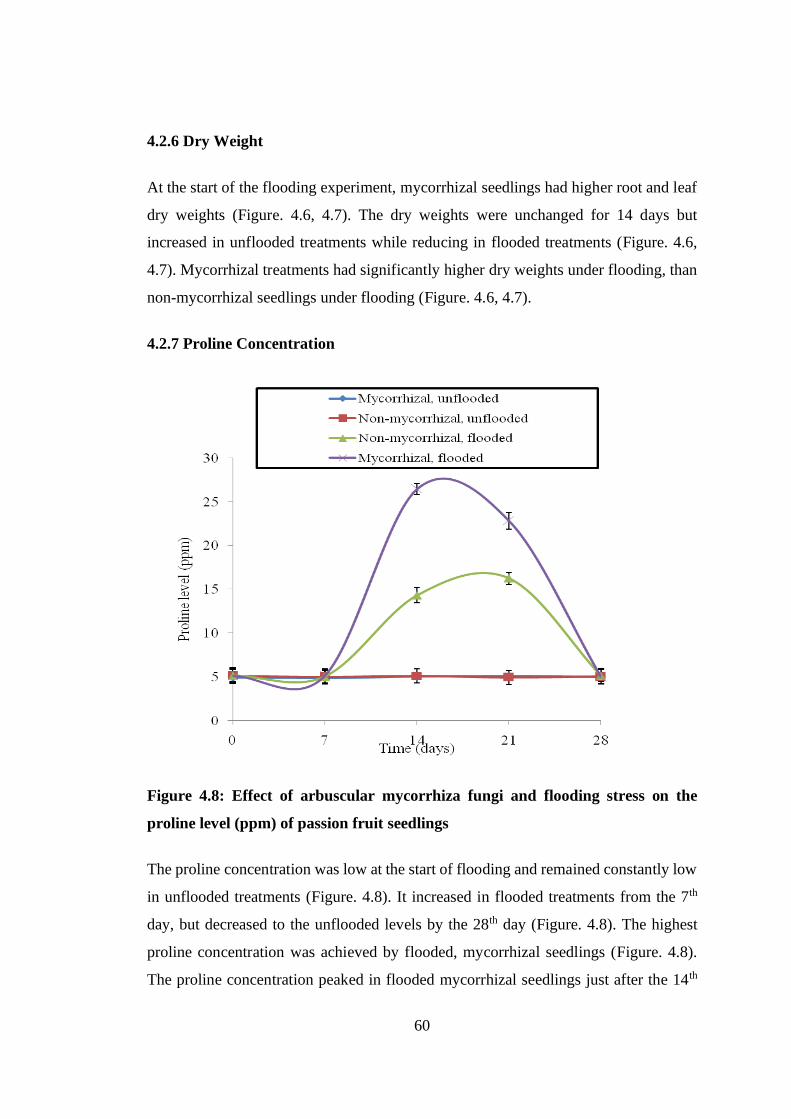
4.2.6 Dry Weight ................................................................................................ 60
4.2.7 Proline Concentration ............................................................................... 60
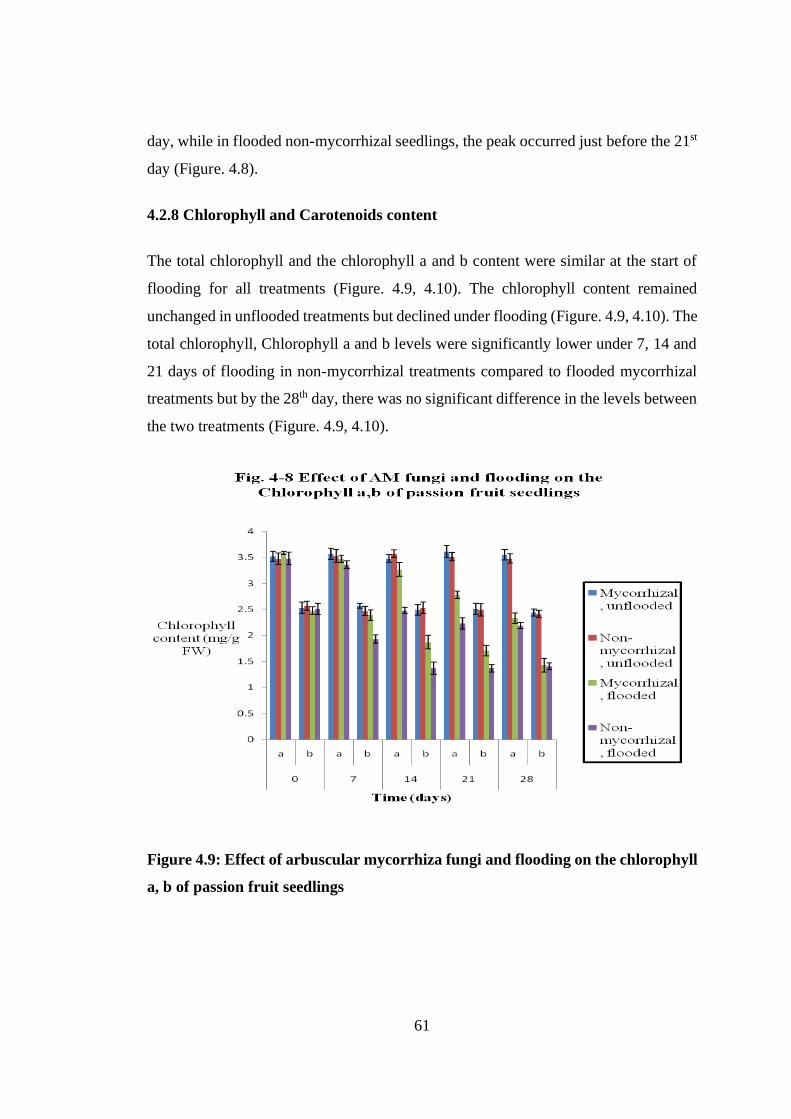
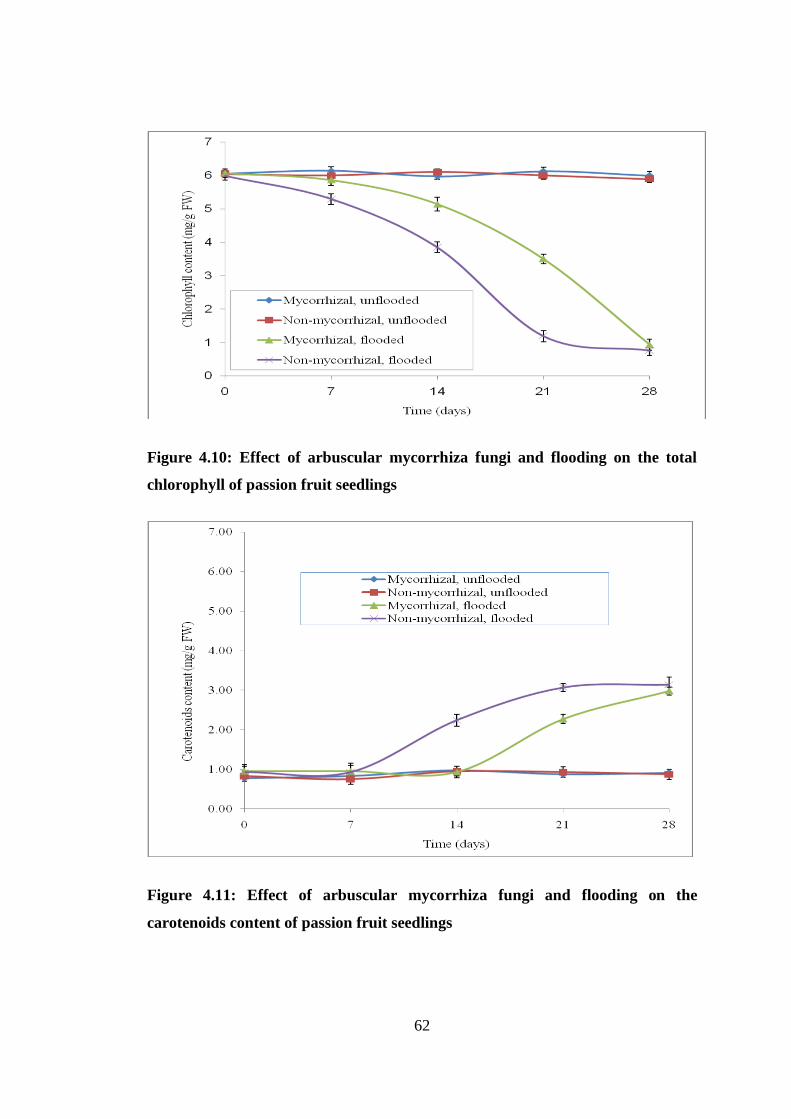
4.2.8 Chlorophyll and Carotenoids content ....................................................... 61
4.2.9 Mycorrhizal Root Colonization ................................................................ 63
4.2.10 Soluble Sugar Content ............................................................................ 63
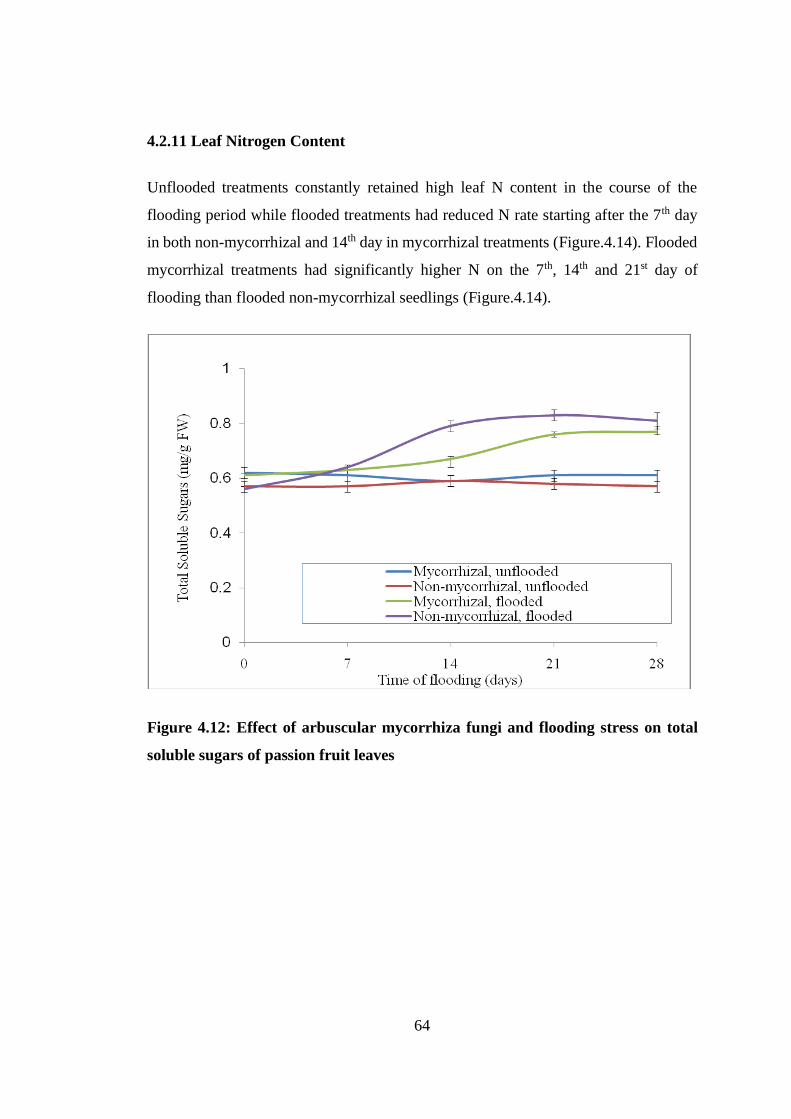
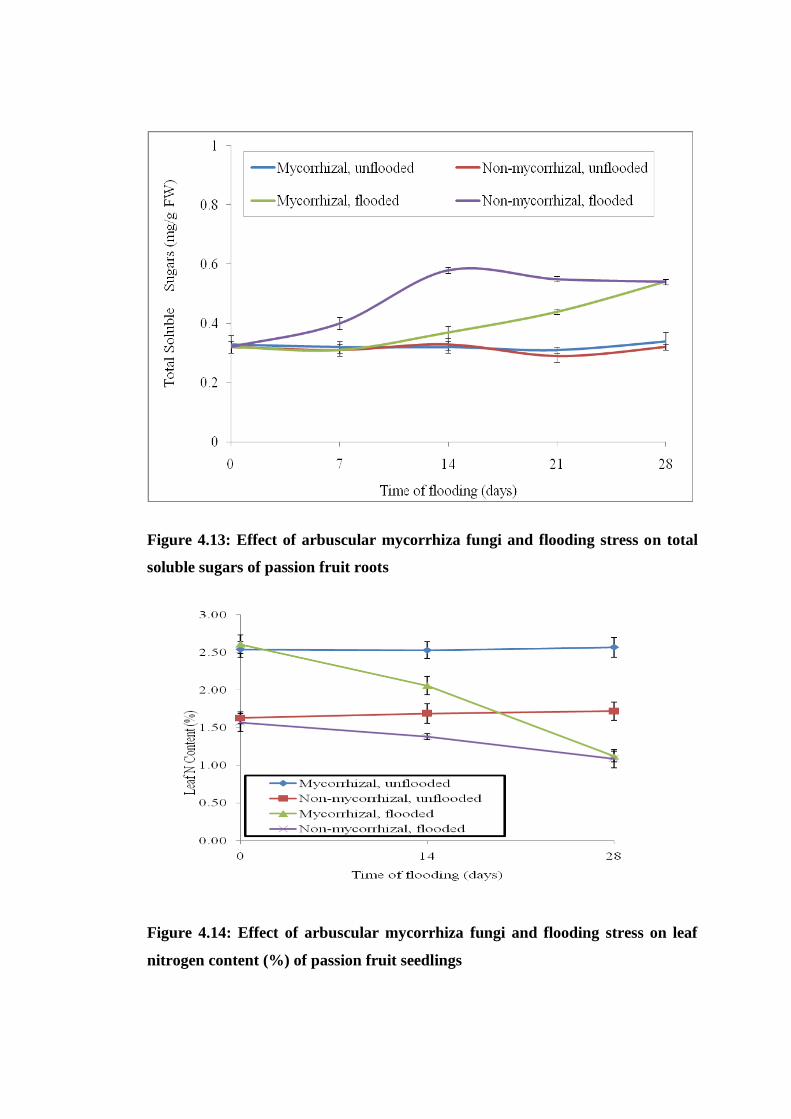
4.2.11 Leaf Nitrogen Content ............................................................................ 64
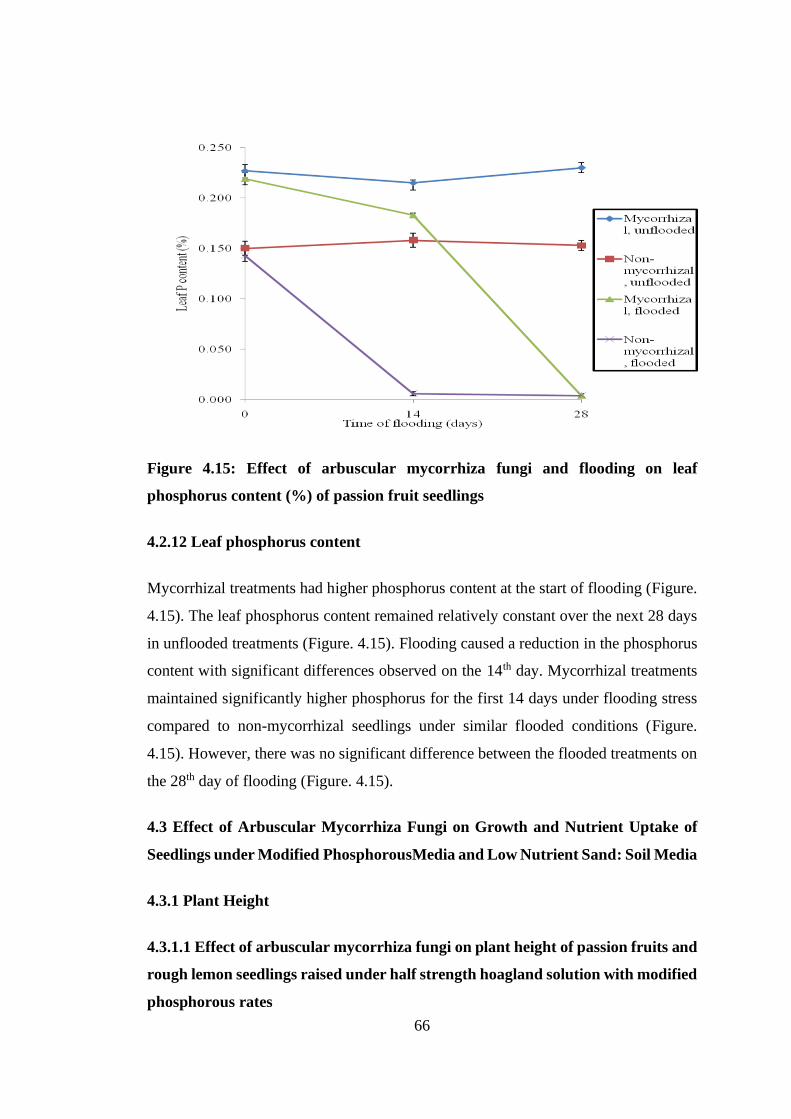
4.2.12 Leaf phosphorus content ......................................................................... 66
4.3 Effect of Arbuscular Mycorrhiza Fungi on Growth and Nutrient Uptake of
Seedlings under Modified PhosphorousMedia and Low Nutrient Sand: Soil
Media .............................................................................................................. 66
Page 10
ix
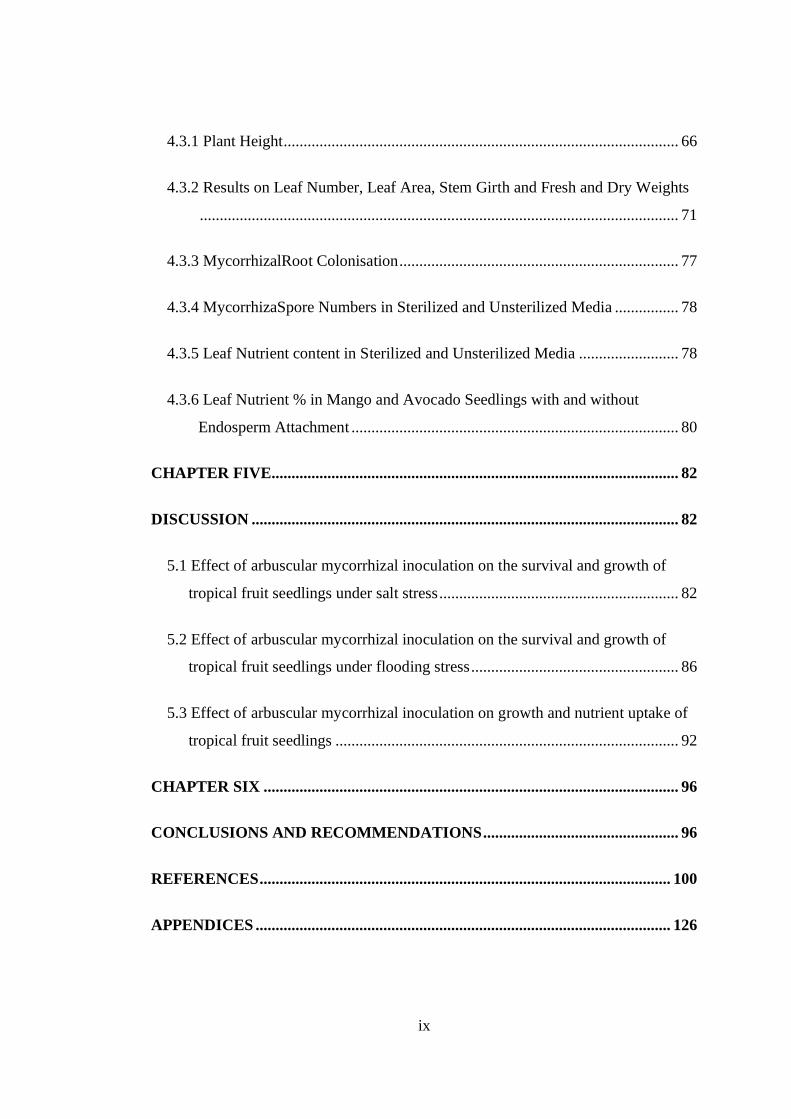
4.3.1 Plant Height ................................................................................................... 66
4.3.2 Results on Leaf Number, Leaf Area, Stem Girth and Fresh and Dry Weights
........................................................................................................................ 71
4.3.3 MycorrhizalRoot Colonisation ...................................................................... 77
4.3.4 MycorrhizaSpore Numbers in Sterilized and Unsterilized Media ................ 78
4.3.5 Leaf Nutrient content in Sterilized and Unsterilized Media ......................... 78
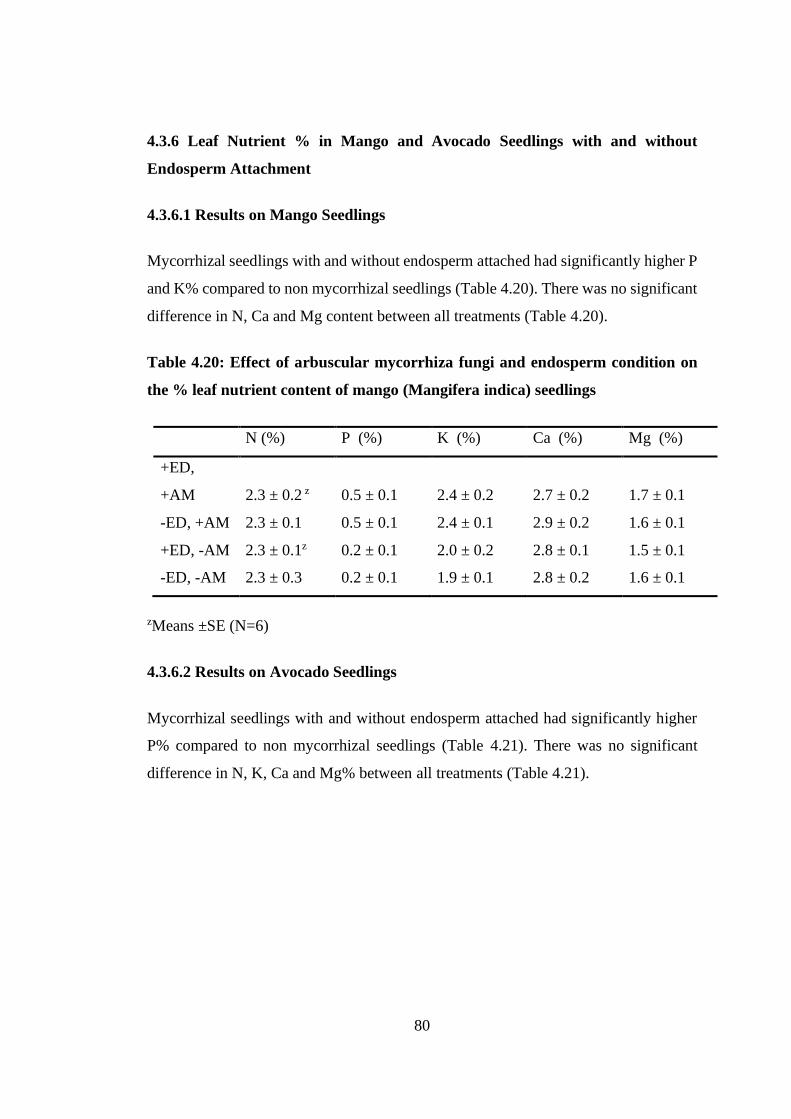
4.3.6 Leaf Nutrient % in Mango and Avocado Seedlings with and without
Endosperm Attachment .................................................................................. 80
CHAPTER FIVE ...................................................................................................... 82
DISCUSSION ........................................................................................................... 82
5.1 Effect of arbuscular mycorrhizal inoculation on the survival and growth of
tropical fruit seedlings under salt stress ............................................................ 82
5.2 Effect of arbuscular mycorrhizal inoculation on the survival and growth of
tropical fruit seedlings under flooding stress .................................................... 86
5.3 Effect of arbuscular mycorrhizal inoculation on growth and nutrient uptake of
tropical fruit seedlings ...................................................................................... 92
CHAPTER SIX ........................................................................................................ 96
CONCLUSIONS AND RECOMMENDATIONS ................................................. 96
REFERENCES ....................................................................................................... 100
APPENDICES ........................................................................................................ 126
Page 11
x
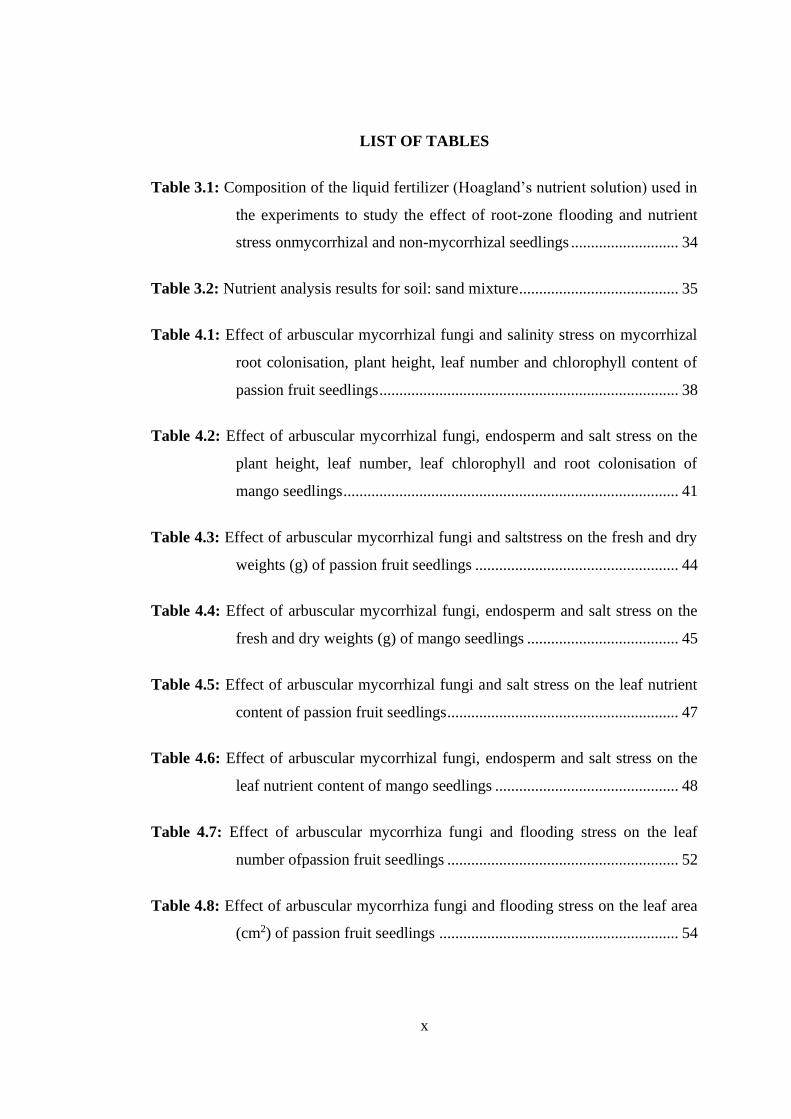
LIST OF TABLES
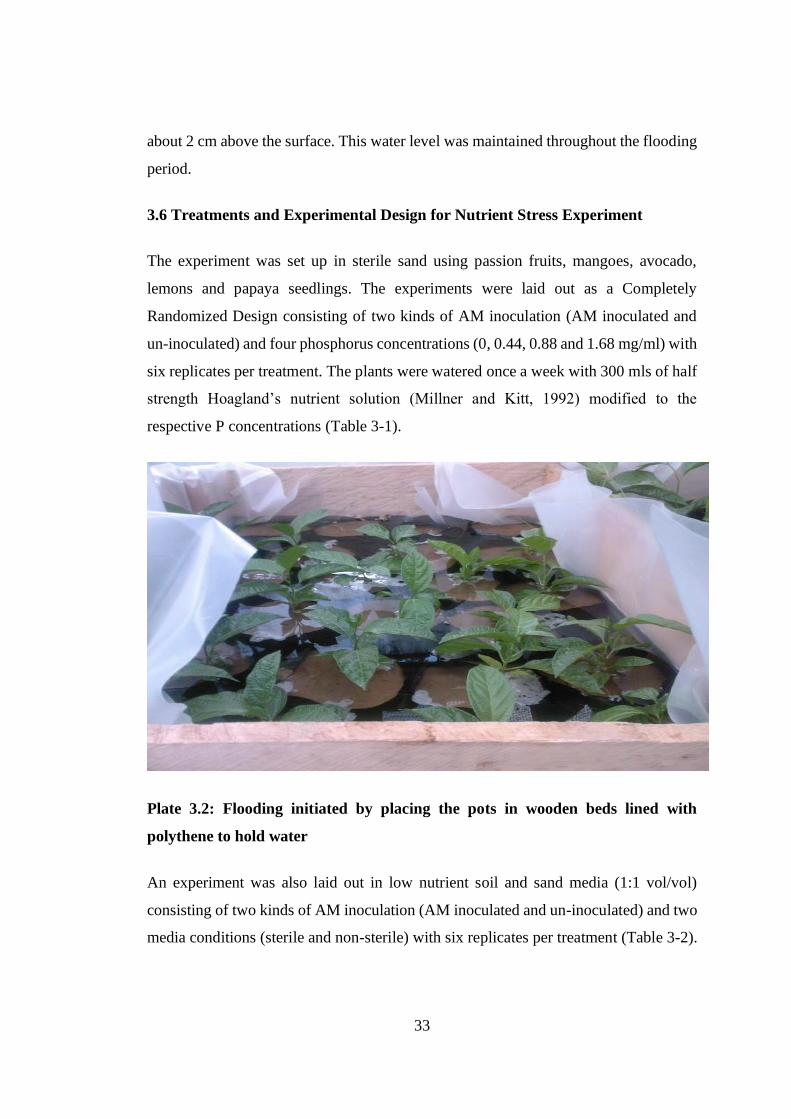
Table 3.1: Composition of the liquid fertilizer (Hoagland’s nutrient solution) used in
the experiments to study the effect of root-zone flooding and nutrient
stress onmycorrhizal and non-mycorrhizal seedlings ........................... 34
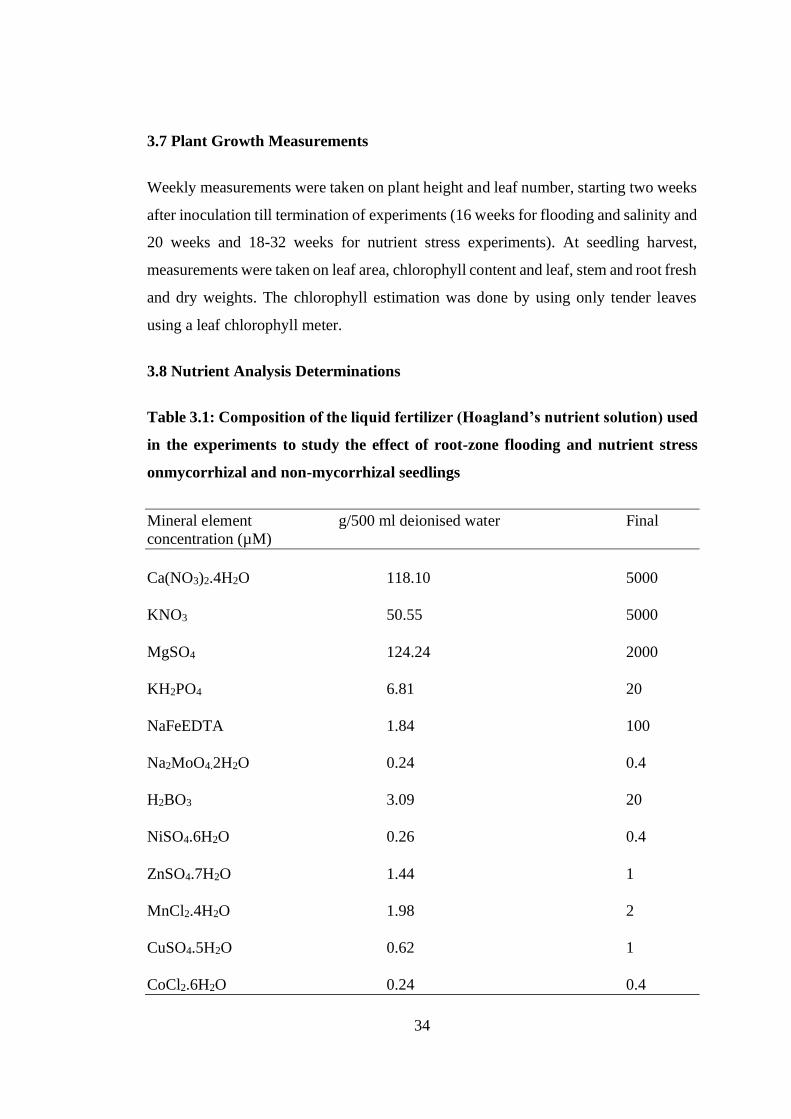
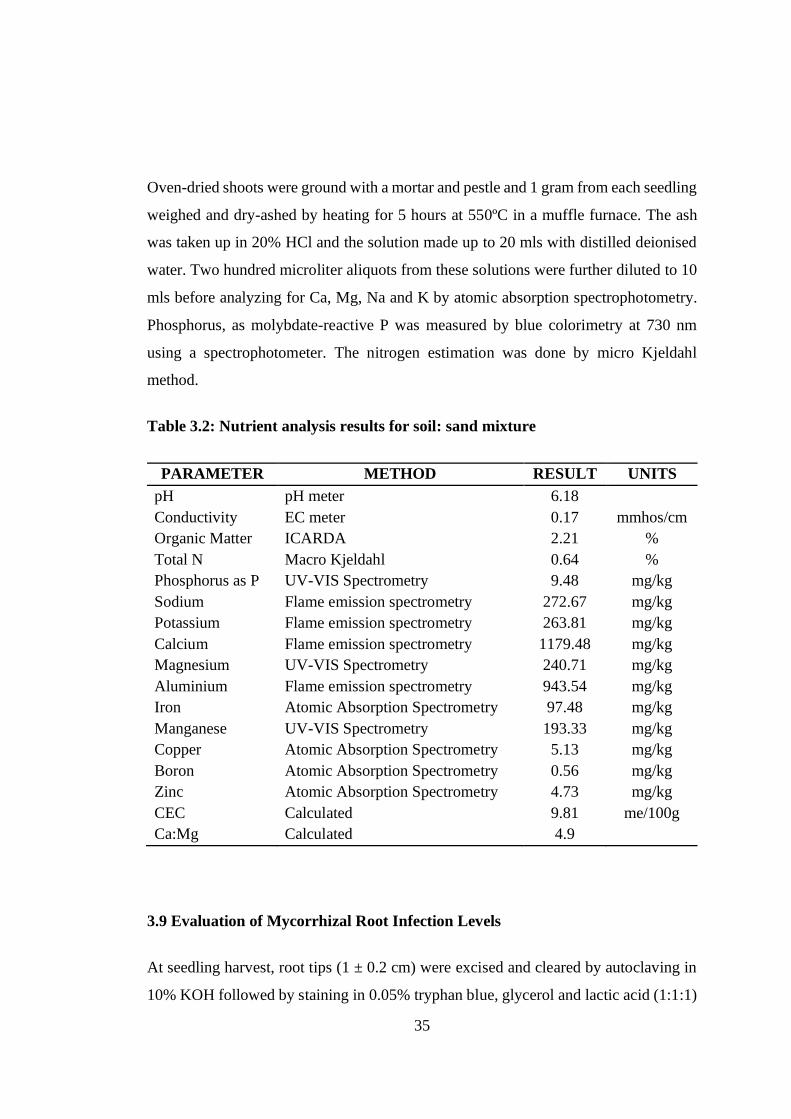
Table 3.2: Nutrient analysis results for soil: sand mixture........................................ 35
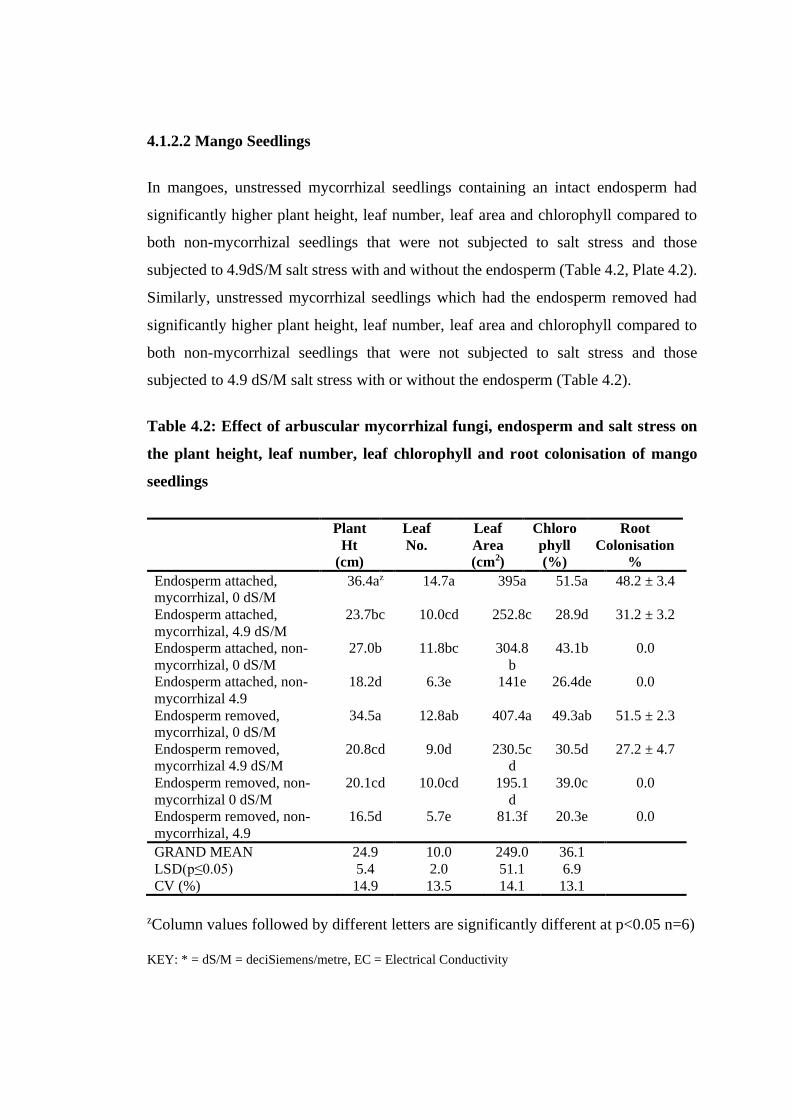
Table 4.1: Effect of arbuscular mycorrhizal fungi and salinity stress on mycorrhizal
root colonisation, plant height, leaf number and chlorophyll content of
passion fruit seedlings ........................................................................... 38
Table 4.2: Effect of arbuscular mycorrhizal fungi, endosperm and salt stress on the
plant height, leaf number, leaf chlorophyll and root colonisation of
mango seedlings .................................................................................... 41
Table 4.3: Effect of arbuscular mycorrhizal fungi and saltstress on the fresh and dry
weights (g) of passion fruit seedlings ................................................... 44
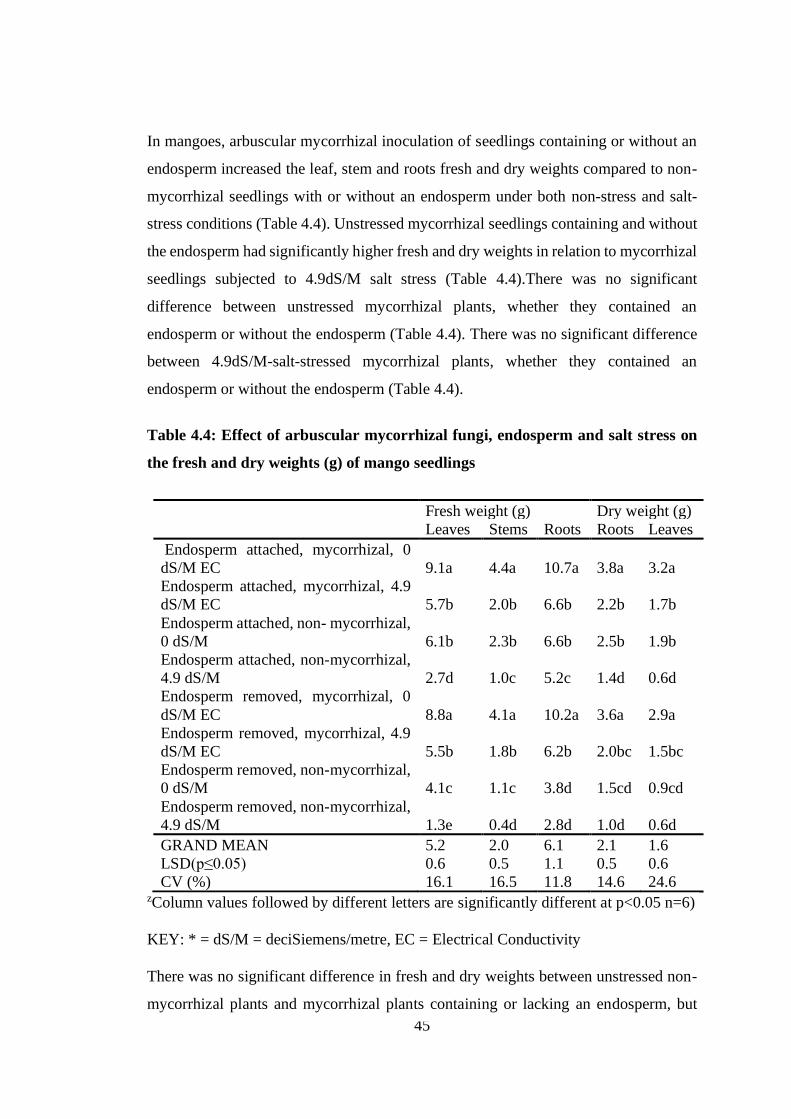
Table 4.4: Effect of arbuscular mycorrhizal fungi, endosperm and salt stress on the
fresh and dry weights (g) of mango seedlings ...................................... 45
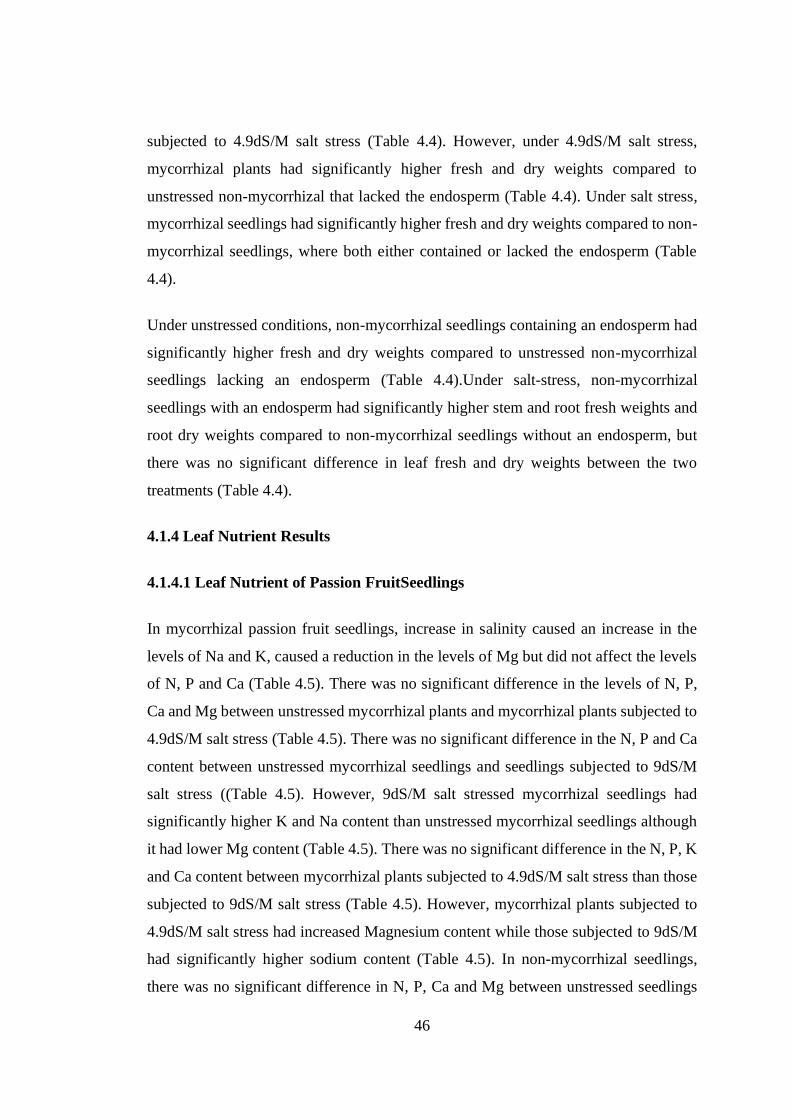
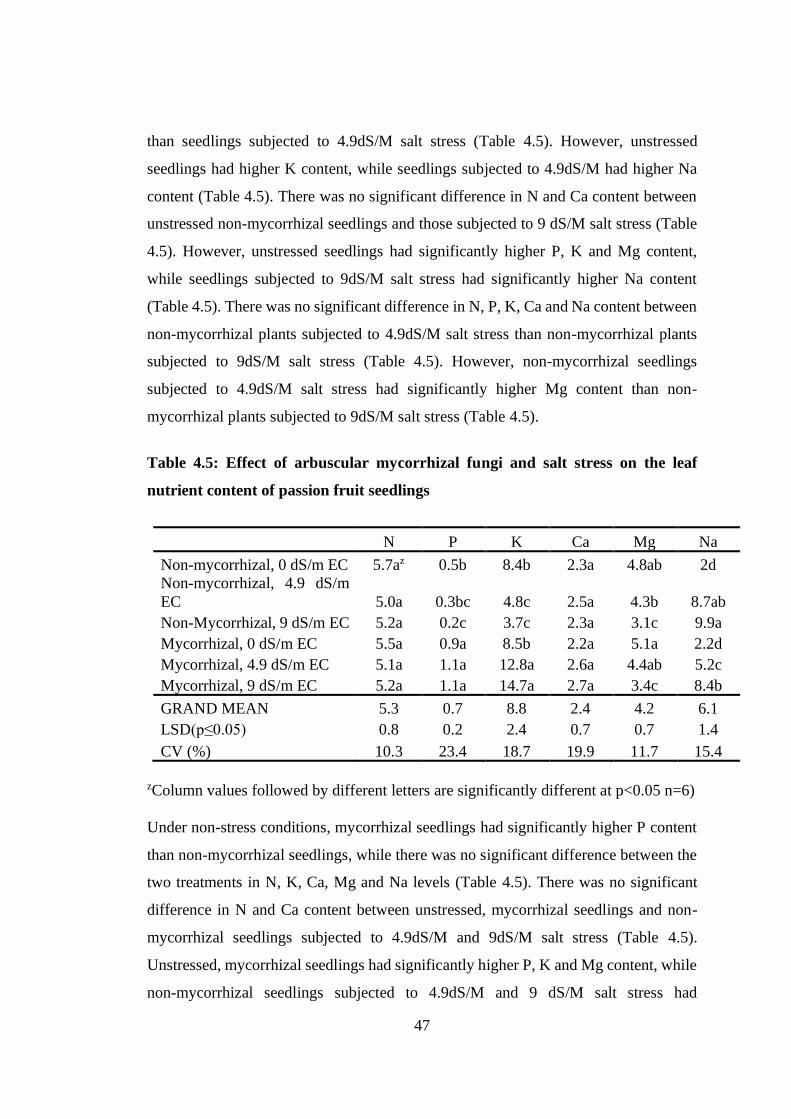
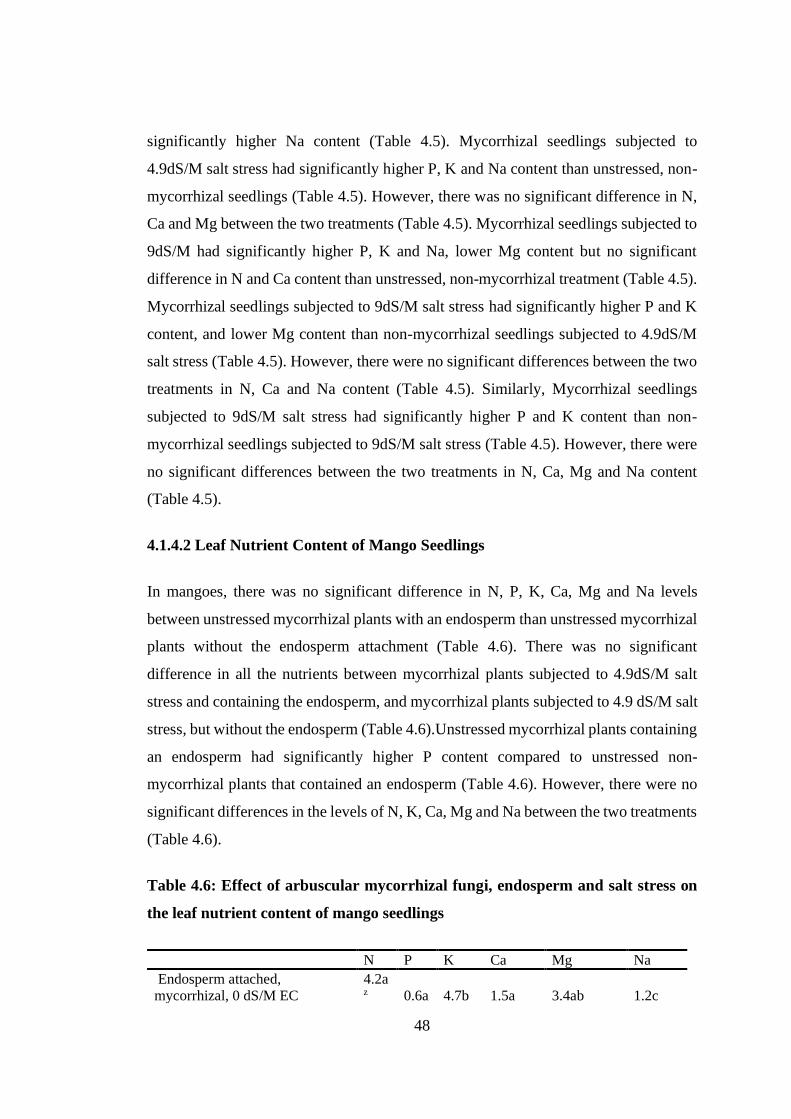
Table 4.5: Effect of arbuscular mycorrhizal fungi and salt stress on the leaf nutrient
content of passion fruit seedlings.......................................................... 47
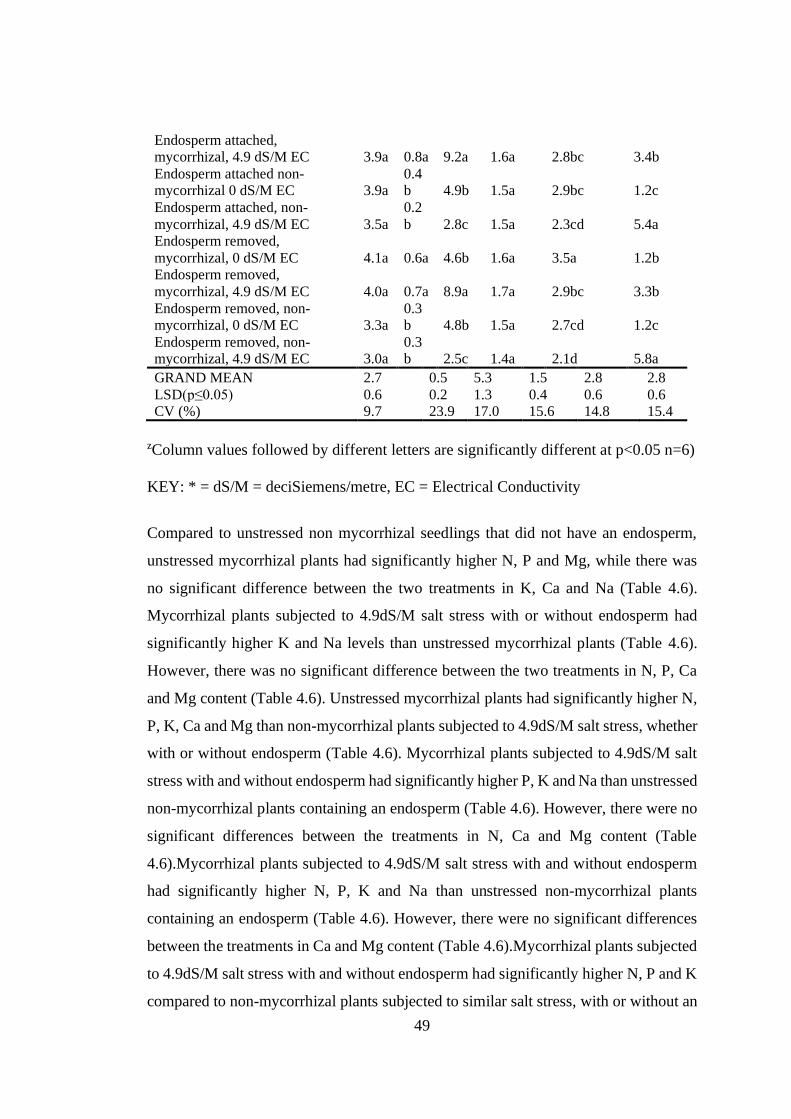
Table 4.6: Effect of arbuscular mycorrhizal fungi, endosperm and salt stress on the
leaf nutrient content of mango seedlings .............................................. 48
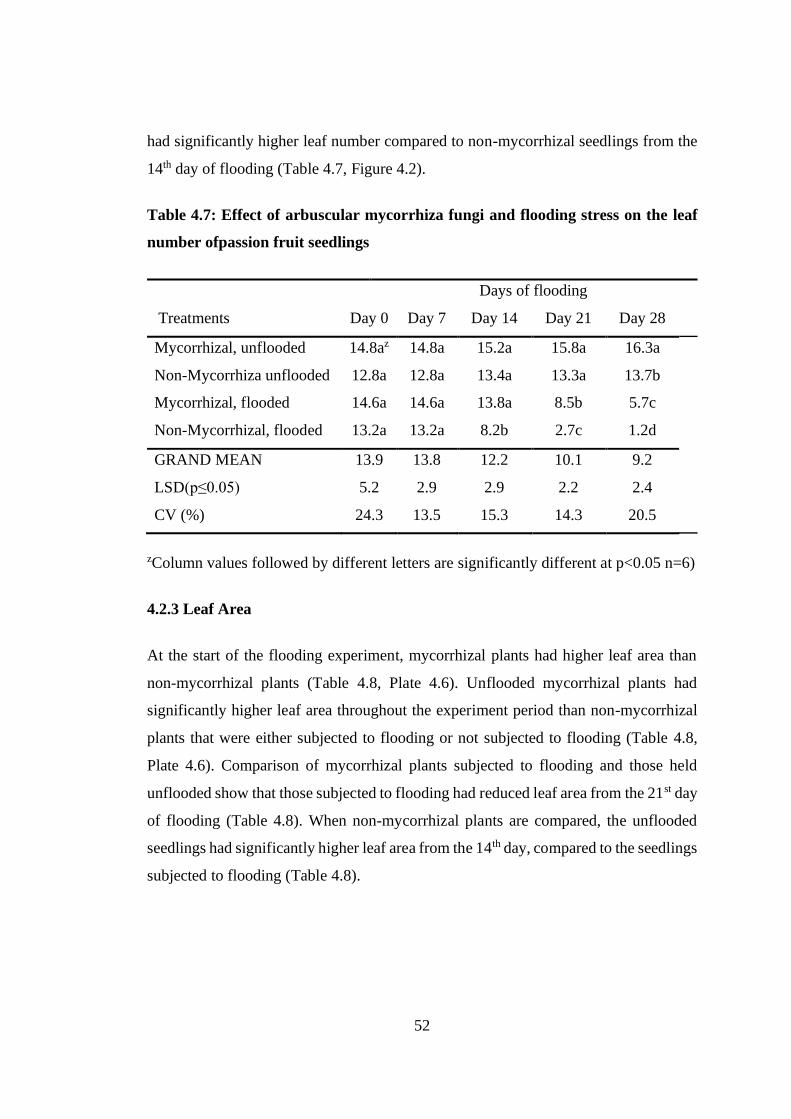
Table 4.7: Effect of arbuscular mycorrhiza fungi and flooding stress on the leaf
number ofpassion fruit seedlings .......................................................... 52
Table 4.8: Effect of arbuscular mycorrhiza fungi and flooding stress on the leaf area
(cm2) of passion fruit seedlings ............................................................ 54
Page 12
xi
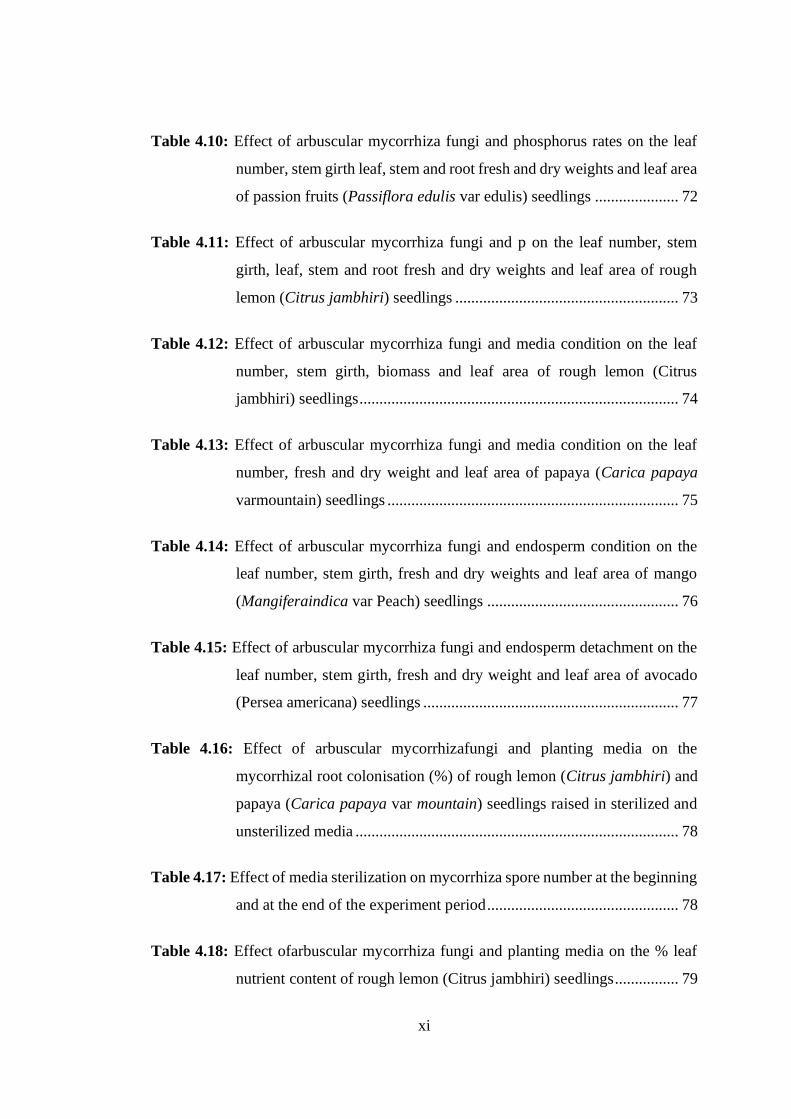
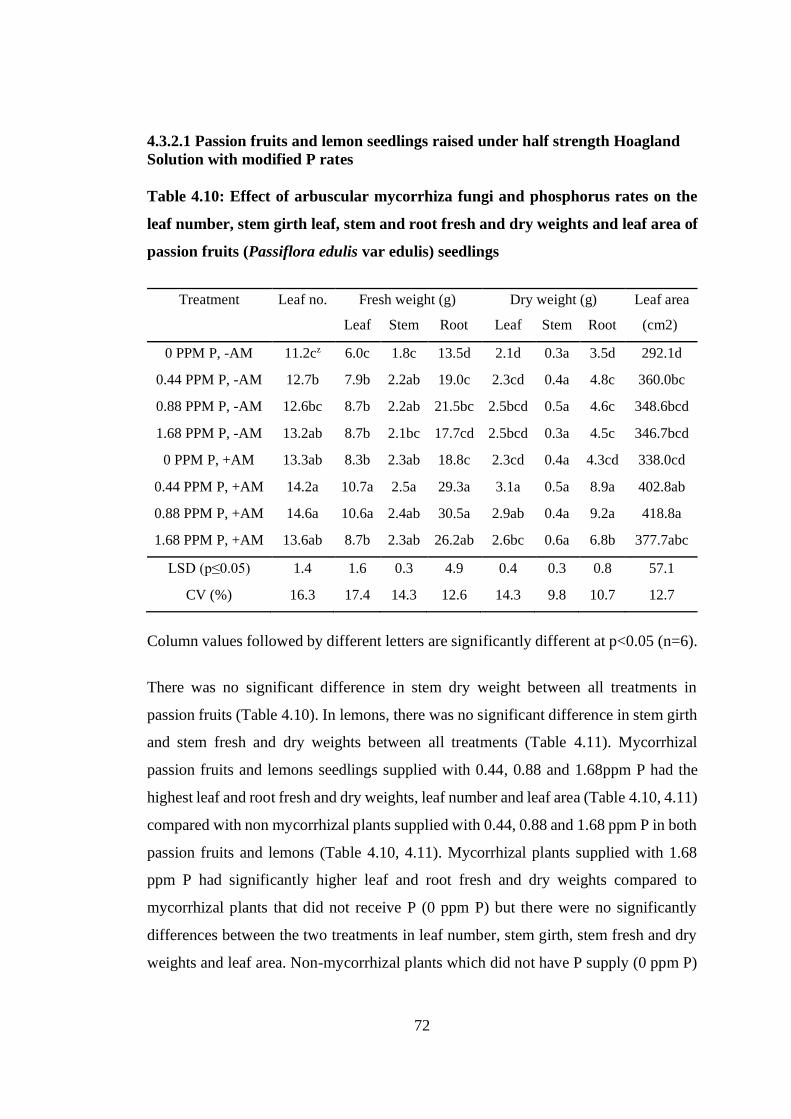
Table 4.10: Effect of arbuscular mycorrhiza fungi and phosphorus rates on the leaf
number, stem girth leaf, stem and root fresh and dry weights and leaf area
of passion fruits (Passiflora edulis var edulis) seedlings ..................... 72
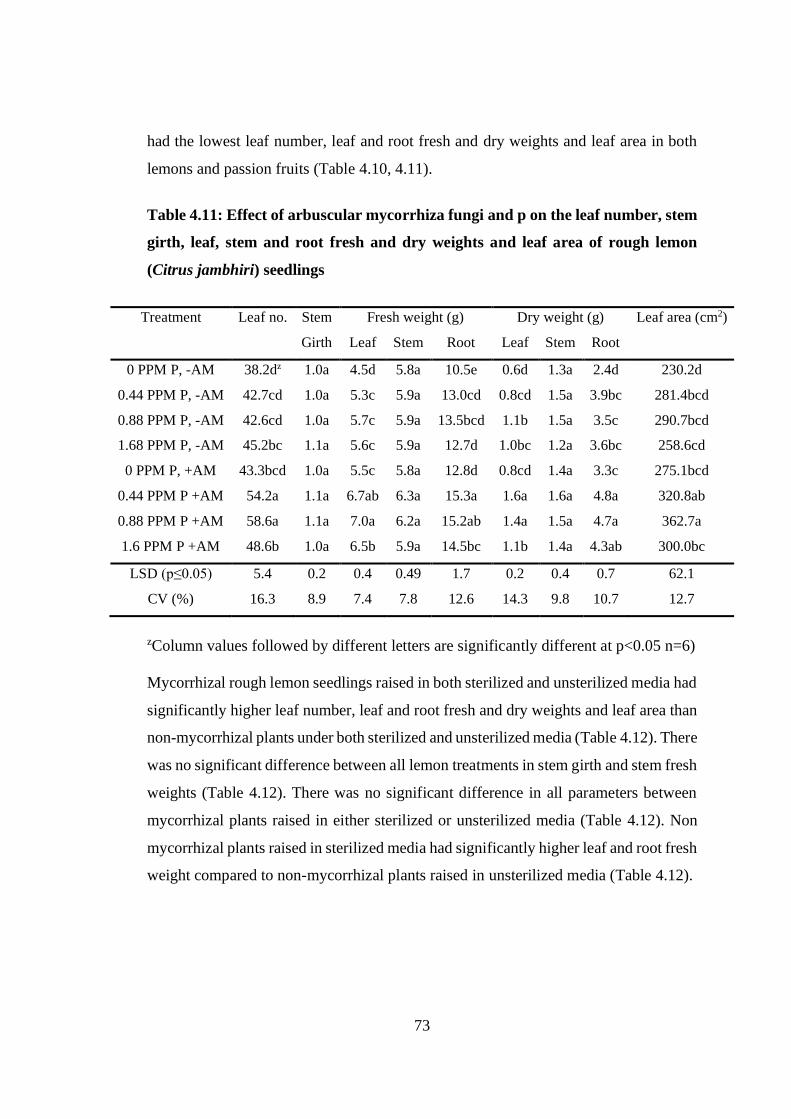
Table 4.11: Effect of arbuscular mycorrhiza fungi and p on the leaf number, stem
girth, leaf, stem and root fresh and dry weights and leaf area of rough
lemon (Citrus jambhiri) seedlings ........................................................ 73
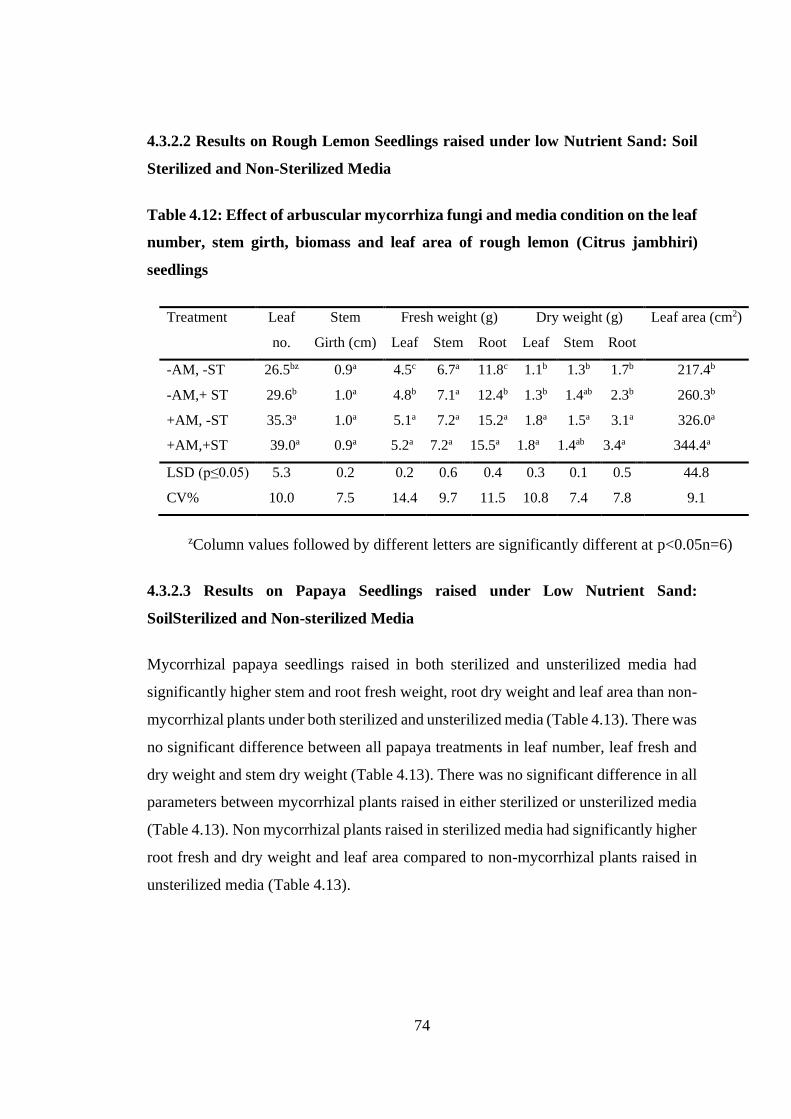
Table 4.12: Effect of arbuscular mycorrhiza fungi and media condition on the leaf
number, stem girth, biomass and leaf area of rough lemon (Citrus
jambhiri) seedlings ................................................................................ 74
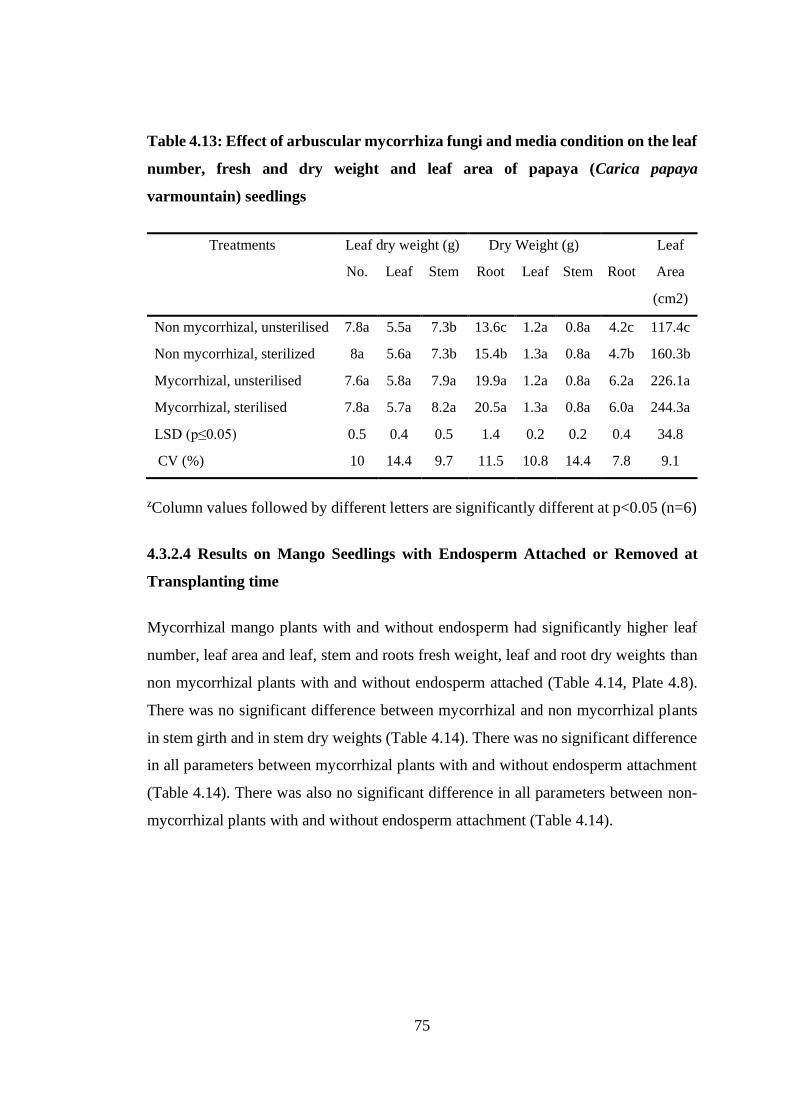
Table 4.13: Effect of arbuscular mycorrhiza fungi and media condition on the leaf
number, fresh and dry weight and leaf area of papaya (Carica papaya
varmountain) seedlings ......................................................................... 75
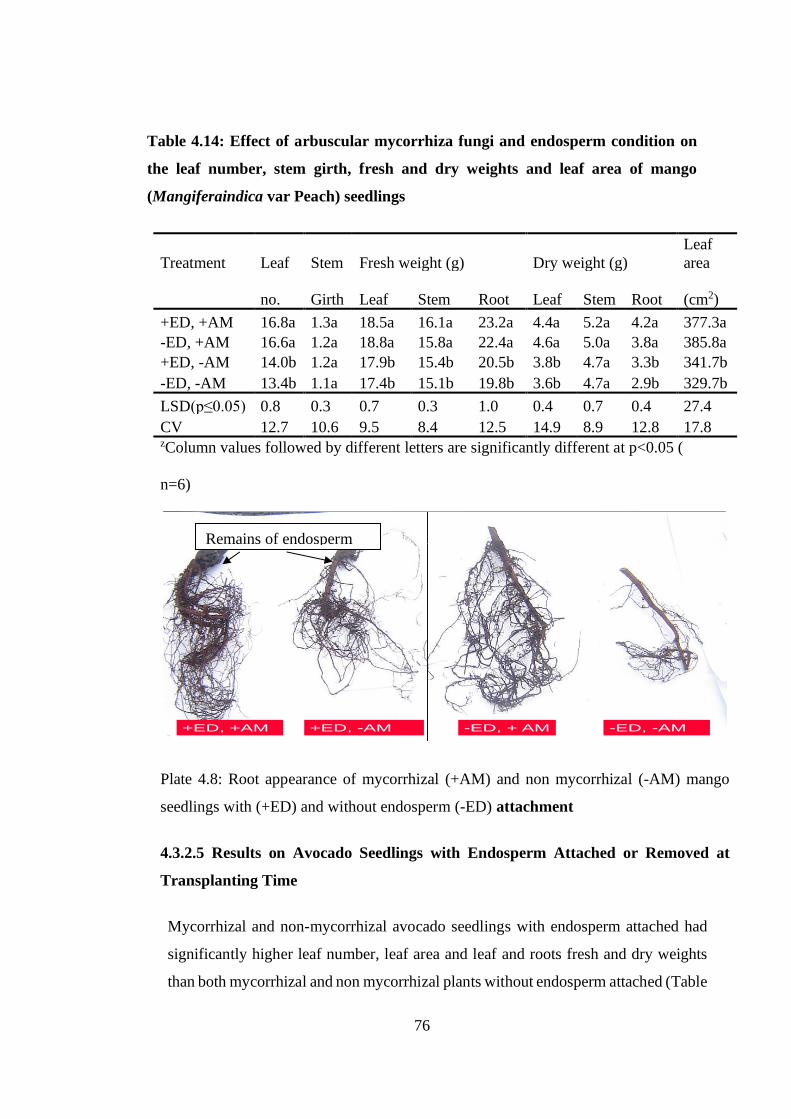
Table 4.14: Effect of arbuscular mycorrhiza fungi and endosperm condition on the
leaf number, stem girth, fresh and dry weights and leaf area of mango
(Mangiferaindica var Peach) seedlings ................................................ 76
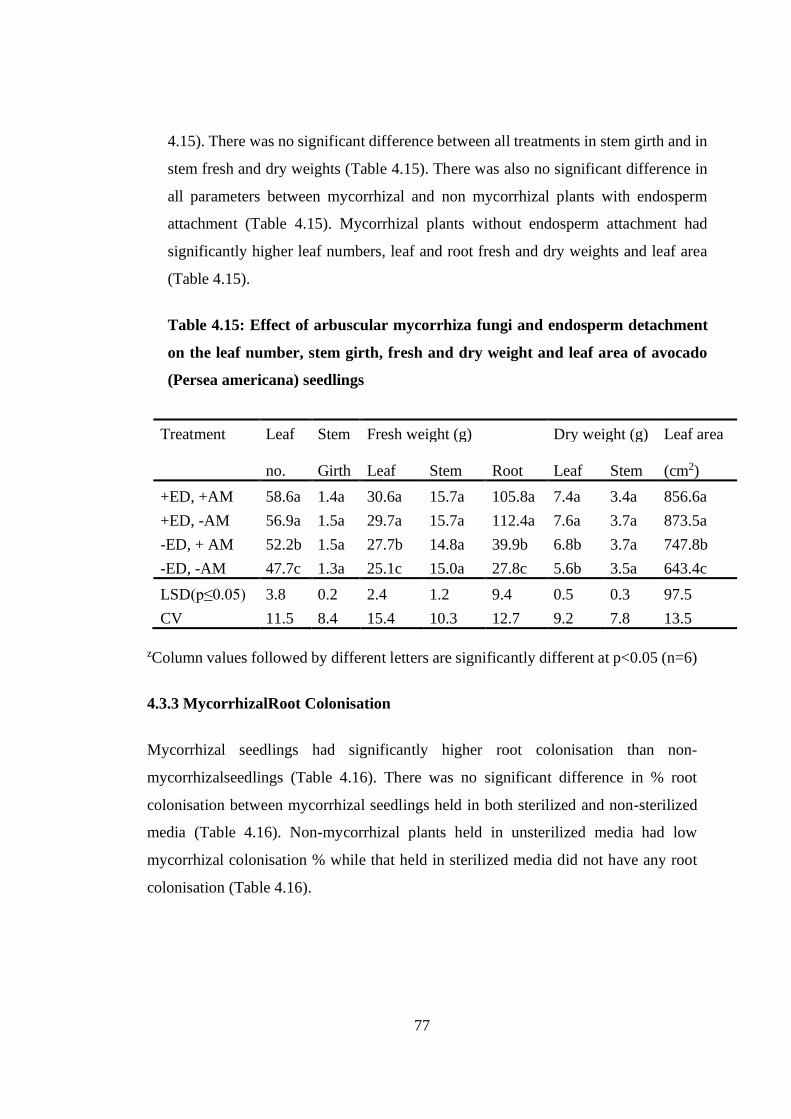
Table 4.15: Effect of arbuscular mycorrhiza fungi and endosperm detachment on the
leaf number, stem girth, fresh and dry weight and leaf area of avocado
(Persea americana) seedlings ................................................................ 77
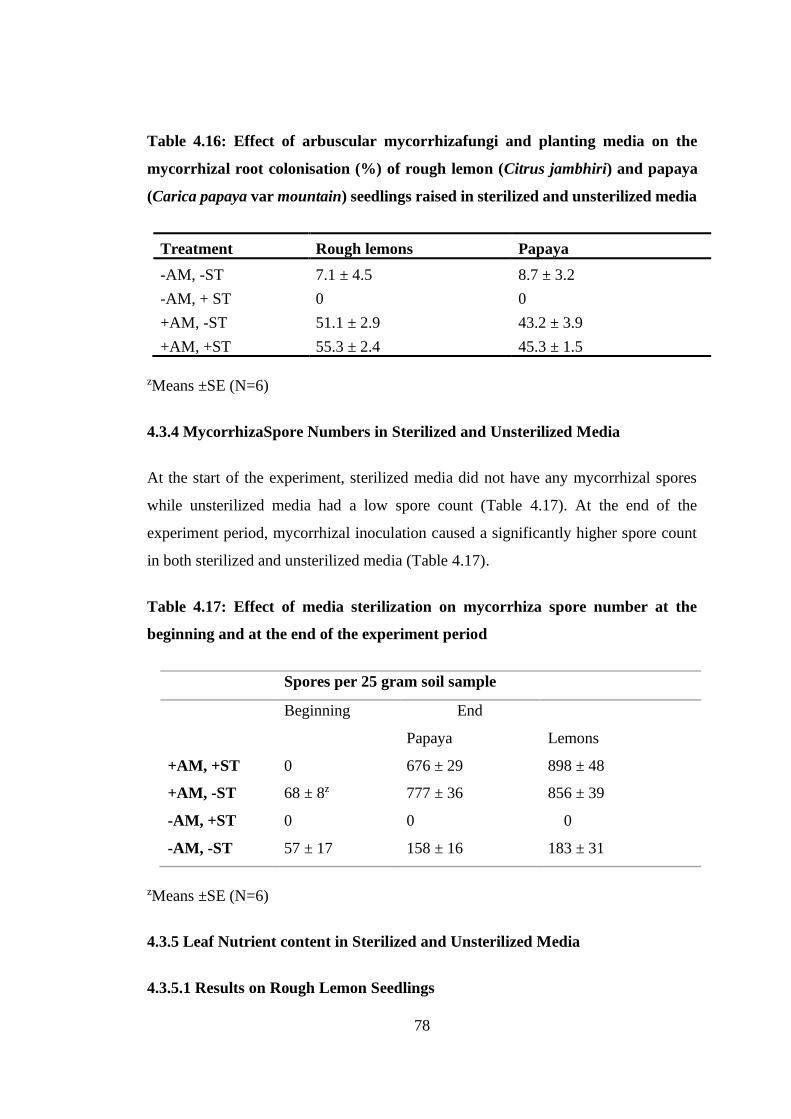
Table 4.16: Effect of arbuscular mycorrhizafungi and planting media on the
mycorrhizal root colonisation (%) of rough lemon (Citrus jambhiri) and
papaya (Carica papaya var mountain) seedlings raised in sterilized and
unsterilized media ................................................................................. 78
Table 4.17: Effect of media sterilization on mycorrhiza spore number at the beginning
and at the end of the experiment period ................................................ 78
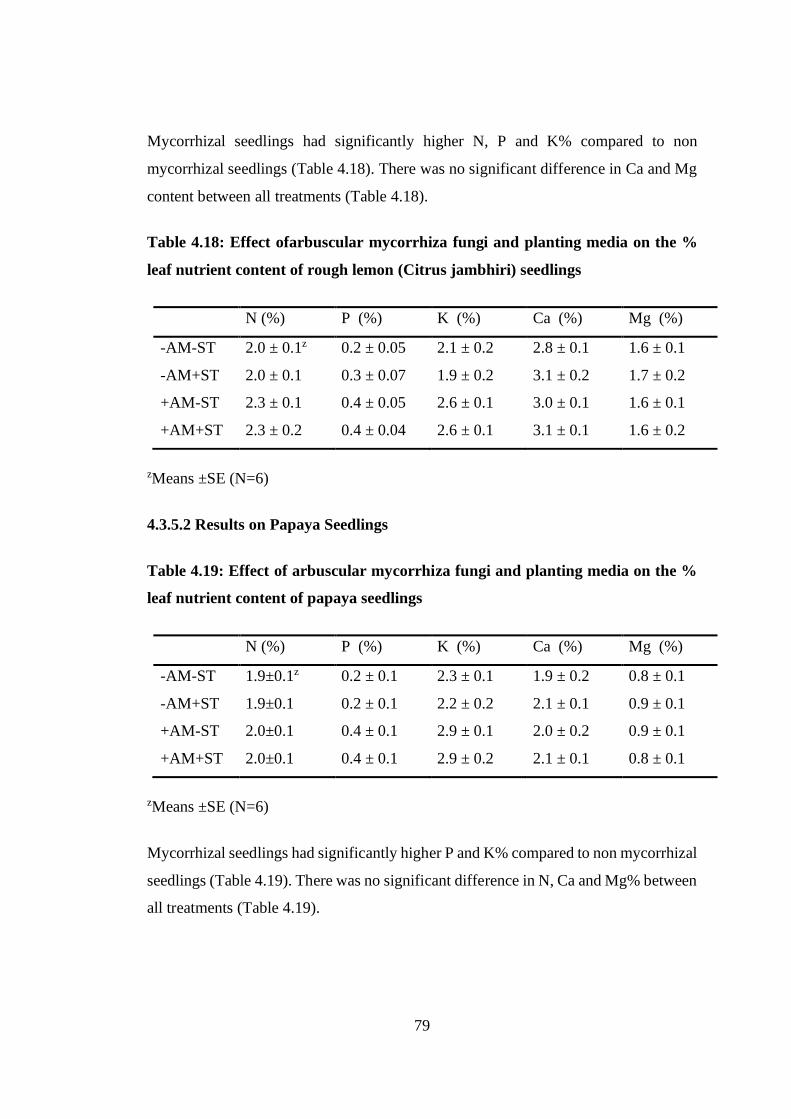
Table 4.18: Effect ofarbuscular mycorrhiza fungi and planting media on the % leaf
nutrient content of rough lemon (Citrus jambhiri) seedlings ................ 79
Page 13
xii
Table 4.19: Effect of arbuscular mycorrhiza fungi and planting media on the % leaf
nutrient content of papaya seedlings ..................................................... 79
Table 4.20: Effect of arbuscular mycorrhiza fungi and endosperm condition on the %
leaf nutrient content of mango (Mangifera indica) seedlings ............... 80
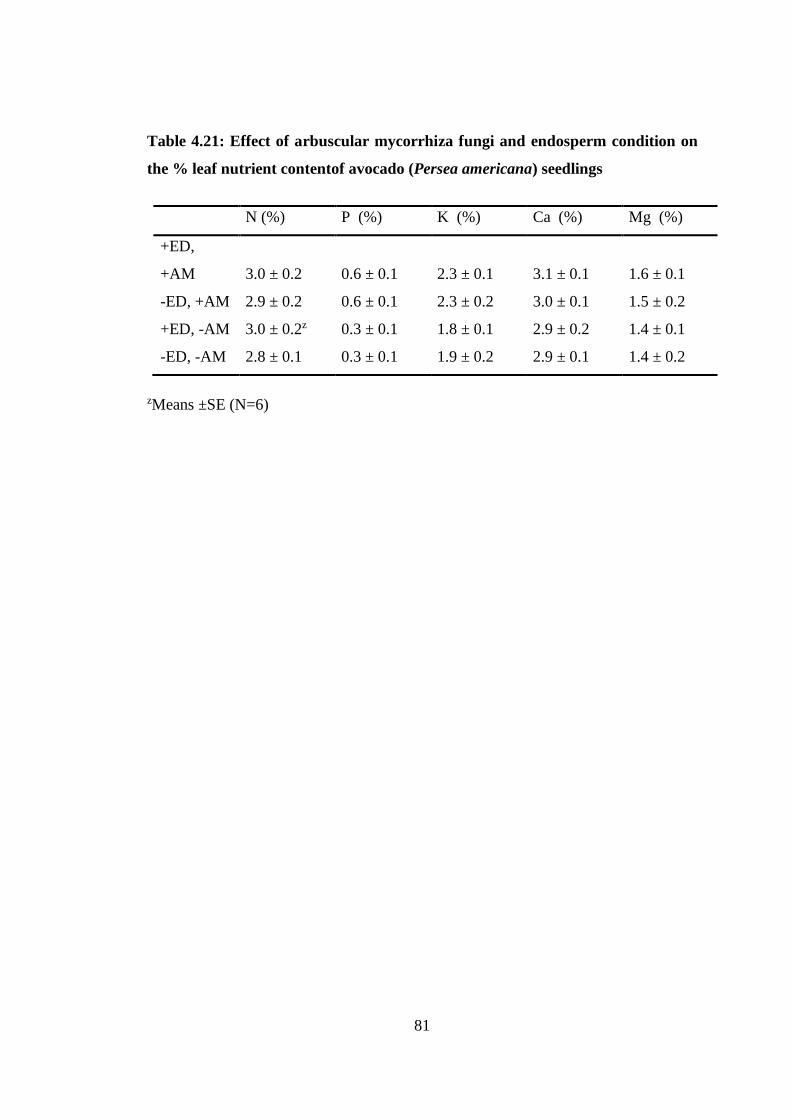
Table 4.21: Effect of arbuscular mycorrhiza fungi and endosperm condition on the %
leaf nutrient contentof avocado (Persea americana) seedlings ............ 81
Page 14
xiii
LIST OF FIGURES
Figure 2.1: Hyphae penetration into a host cell, intercellular growth, and
mycorrhizalstructure formation .......................................................... 13
Figure 4.1: Effect of arbuscular mycorrhiza fungi and flooding stress on plant height
(cm) of passion fruit seedlings ........................................................... 51
Figure 4.2: Effect of arbuscular mycorrhizafungi and flooding stress on the leaf
number of passion fruit seedlings ....................................................... 53
Figure 4.3: Effect of arbuscular mycorrhiza fungi and flooding stress on the leaf fresh
weight of passion fruit seedlings ........................................................ 56
Figure 4.4: Effect of arbuscular mycorrhiza fungi and flooding stress on the root fresh
weight (g) of passion fruit seedlings .................................................. 56
Figure 4.5: Effect of arbuscular mycorrhiza fungi and flooding stress on the root
length (cm) of passion fruit seedlings ................................................ 57
Figure 4.6: Effect of arbuscular mycorrhiza fungi and flooding stress on the leaf dry
weight (g) of passion fruit seedlings .................................................. 59
Figure 4.7: Effect of arbuscular mycorrhiza fungi and flooding stress on the root dry
weight (g) of passion fruit seedlings .................................................. 59
Figure 4.8: Effect of arbuscular mycorrhiza fungi and flooding stress on the proline
level (ppm) of passion fruit seedlings ................................................ 60
Figure 4.9: Effect of arbuscular mycorrhiza fungi and flooding on the chlorophyll a,
b of passion fruit seedlings ................................................................. 61
Figure 4.10: Effect of arbuscular mycorrhiza fungi and flooding on the total
chlorophyll of passion fruit seedlings ................................................ 62
Page 15
xiv
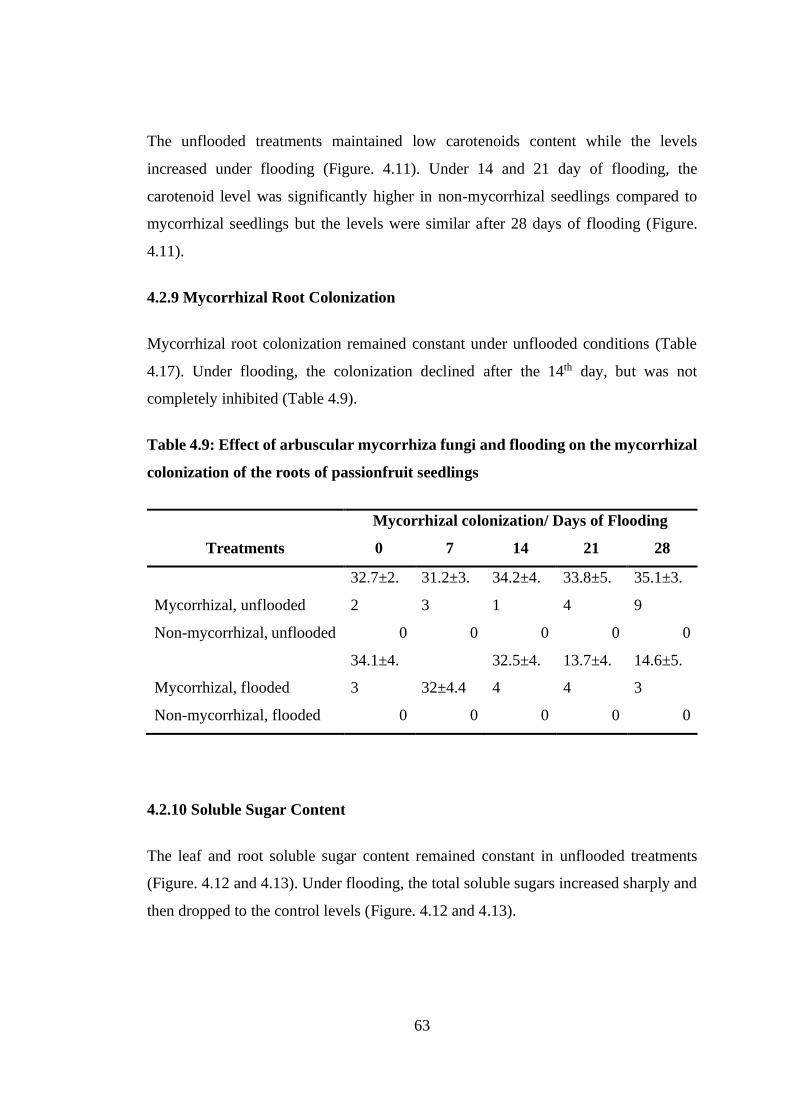
Figure 4.11: Effect of arbuscular mycorrhiza fungi and flooding on the carotenoids
content of passion fruit seedlings ....................................................... 62
Figure 4.12: Effect of arbuscular mycorrhiza fungi and flooding stress on total soluble
sugars of passion fruit leaves .............................................................. 64
Figure 4.13: Effect of arbuscular mycorrhiza fungi and flooding stress on total soluble
sugars of passion fruit roots ................................................................ 65
Figure 4.14: Effect of arbuscular mycorrhiza fungi and flooding stress on leaf nitrogen
content (%) of passion fruit seedlings ................................................ 65
Figure 4.15: Effect of arbuscular mycorrhiza fungi and flooding on leaf phosphorus
content (%) of passion fruit seedlings ................................................ 66
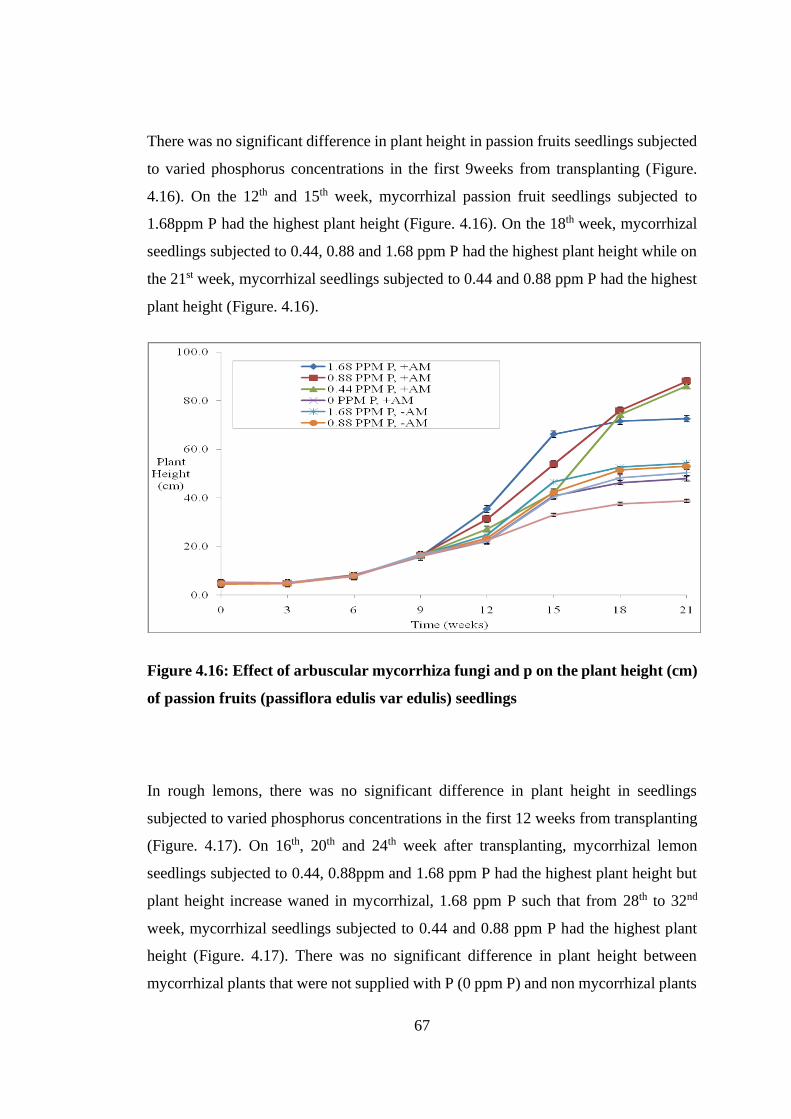
Figure 4.16: Effect of arbuscular mycorrhiza fungi and p on the plant height (cm) of
passion fruits (passiflora edulis var edulis) seedlings ........................ 67
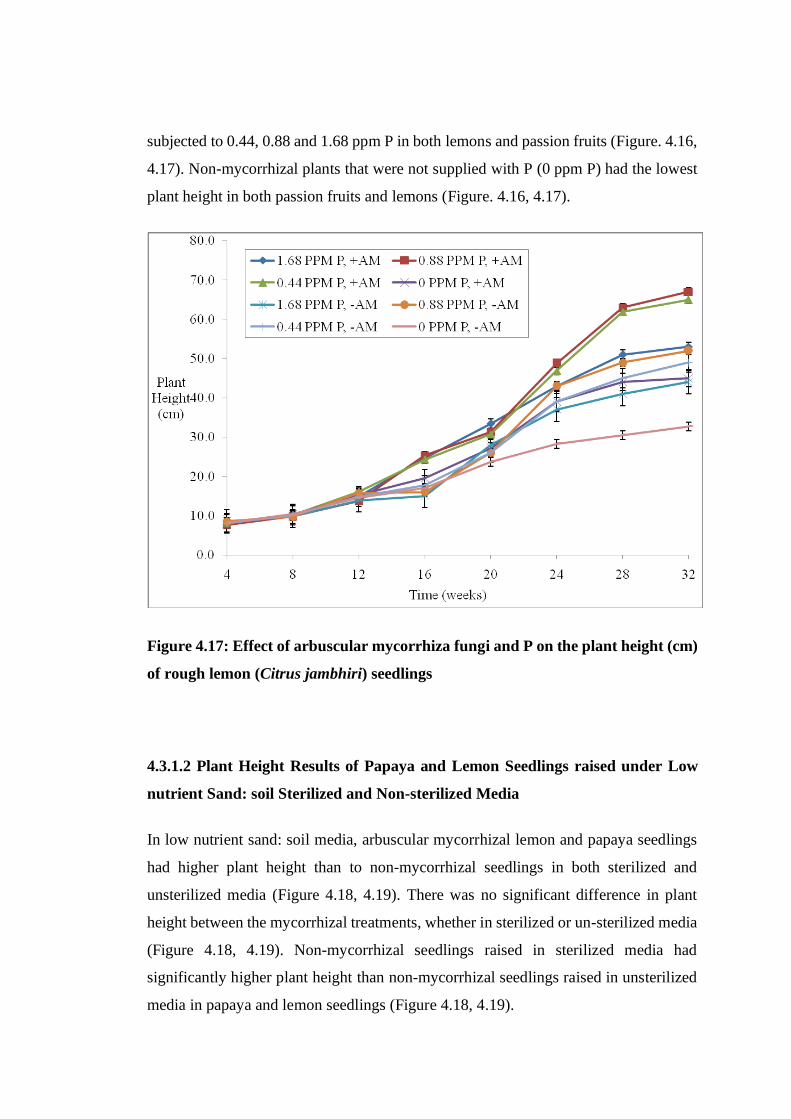
Figure 4.17: Effect of arbuscular mycorrhiza fungi and P on the plant height (cm) of
rough lemon (Citrus jambhiri) seedlings ........................................... 68
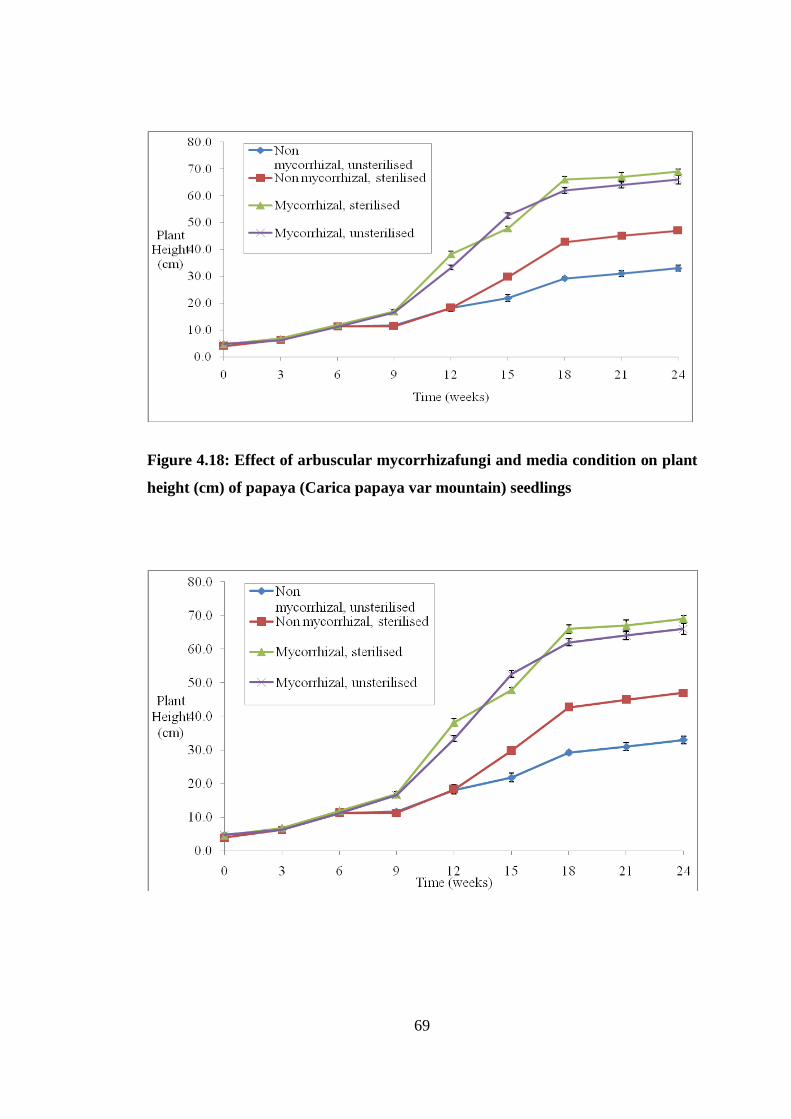
Figure 4.18: Effect of arbuscular mycorrhizafungi and media condition on plant height
(cm) of papaya (Carica papaya var mountain) seedlings ................... 69
Figure 4.19: Effect of arbuscular mycorrhiza fungi and media condition on plant
height (cm) of roughlemon (Citrus jambhiri) seedlings .................... 70
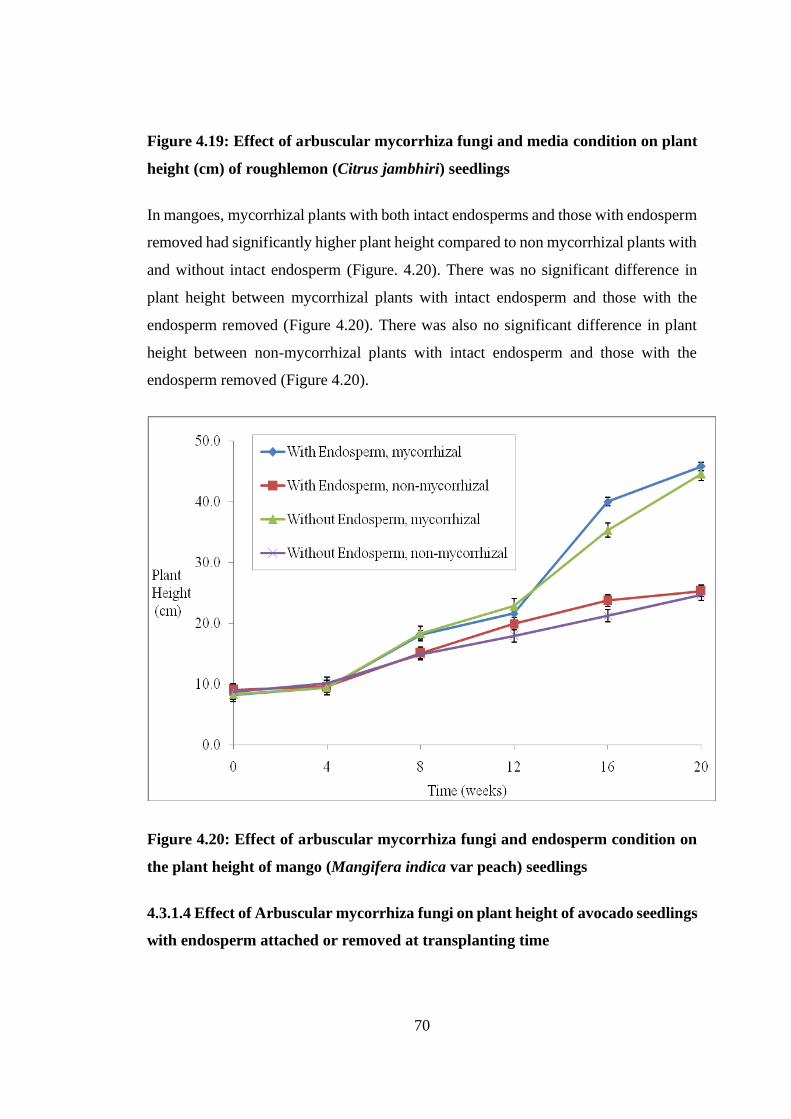
Figure 4.20: Effect of arbuscular mycorrhiza fungi and endosperm condition on the
plant height of mango (Mangifera indica var peach) seedlings ......... 70
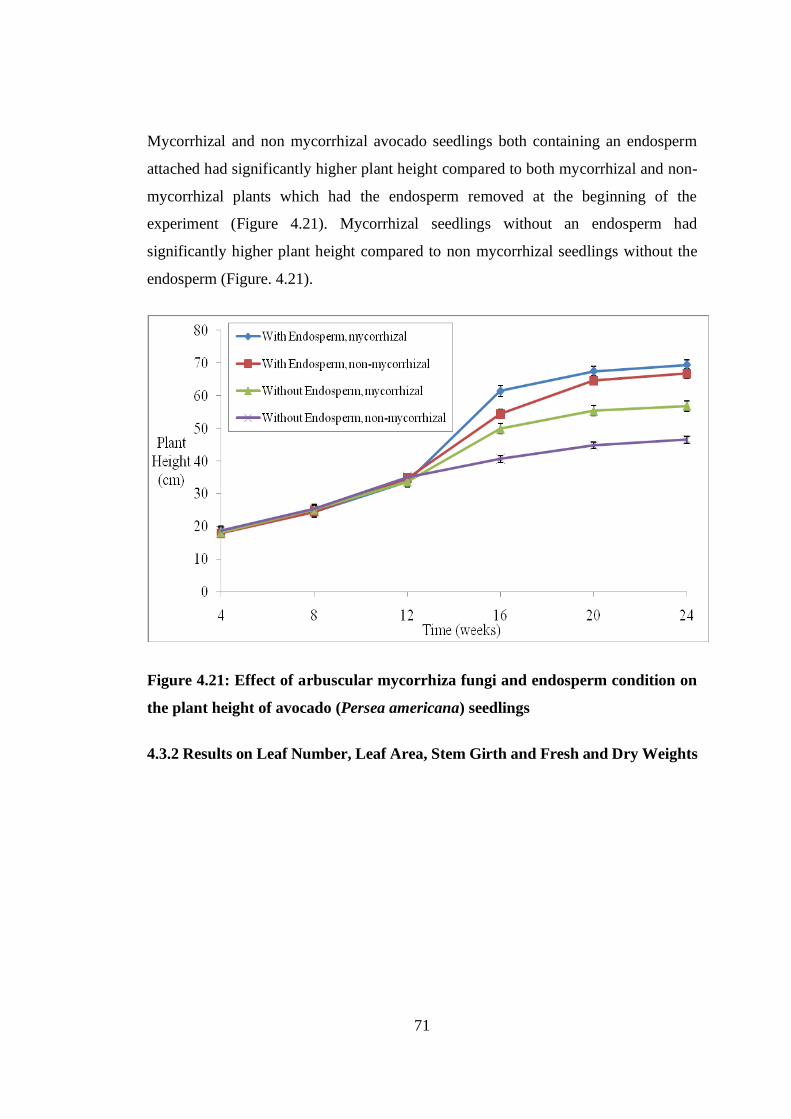
Figure 4.21: Effect of arbuscular mycorrhiza fungi and endosperm condition on the
plant height of avocado (Persea americana) seedlings ...................... 71
Page 16
xv
LIST OF PLATES
Plate 2.1: Living spores of Gigaspora (a) Sporocarp of Glomus invermaium (b) typical
of the spores often found in field-collected soil ...................................... 11
Plate 2.2: Soil hyphae produced by a single germinated spore of Gigaspora (arrow)
used to start a mycorrhizal association .................................................... 12
Plate 2.3: Mycorrhizal root system washed carefully from coarse sand to reveal
theintact network with external hyphae (arrow) with spores (S) produced
by Glomus mosseae ................................................................................. 13
Plate 2.4: Mature arbuscule of Glomus mosseae....................................................... 14
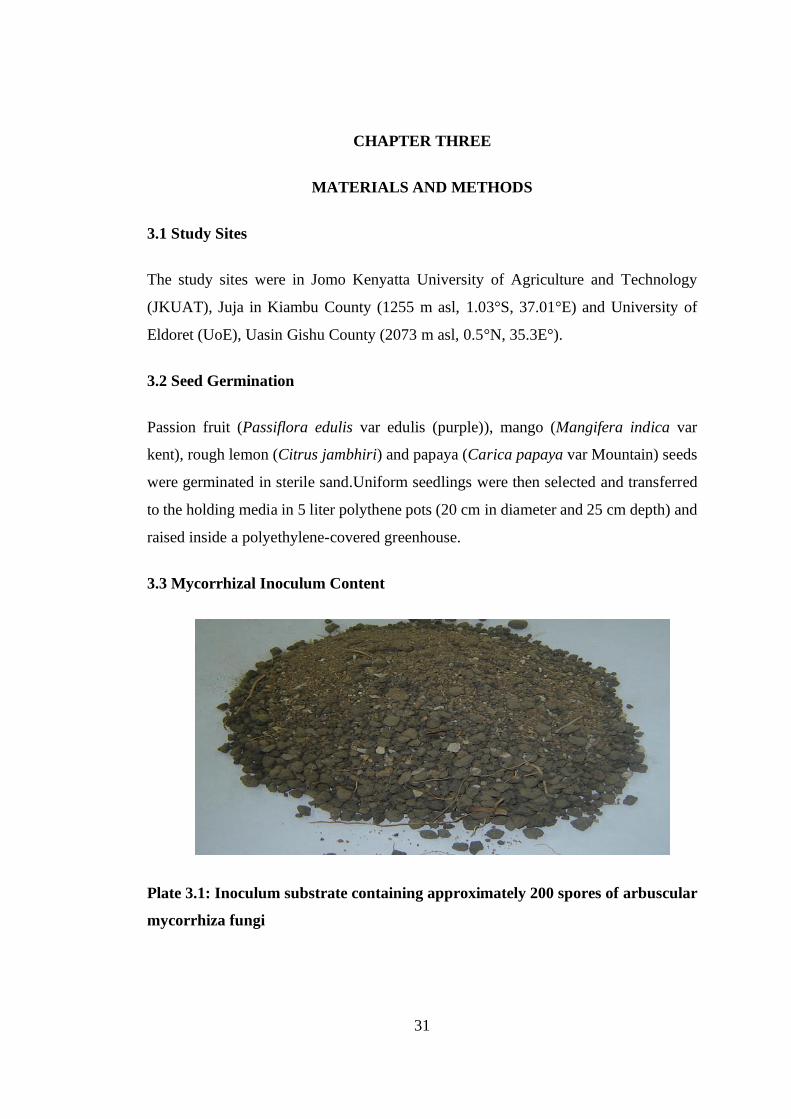
Plate 3.1: Inoculum substrate containing approximately 200 spores of arbuscular
mycorrhiza fungi ..................................................................................... 31
Plate 3.2: Flooding initiated by placing the pots in wooden beds lined with polythene
to hold water ............................................................................................ 33
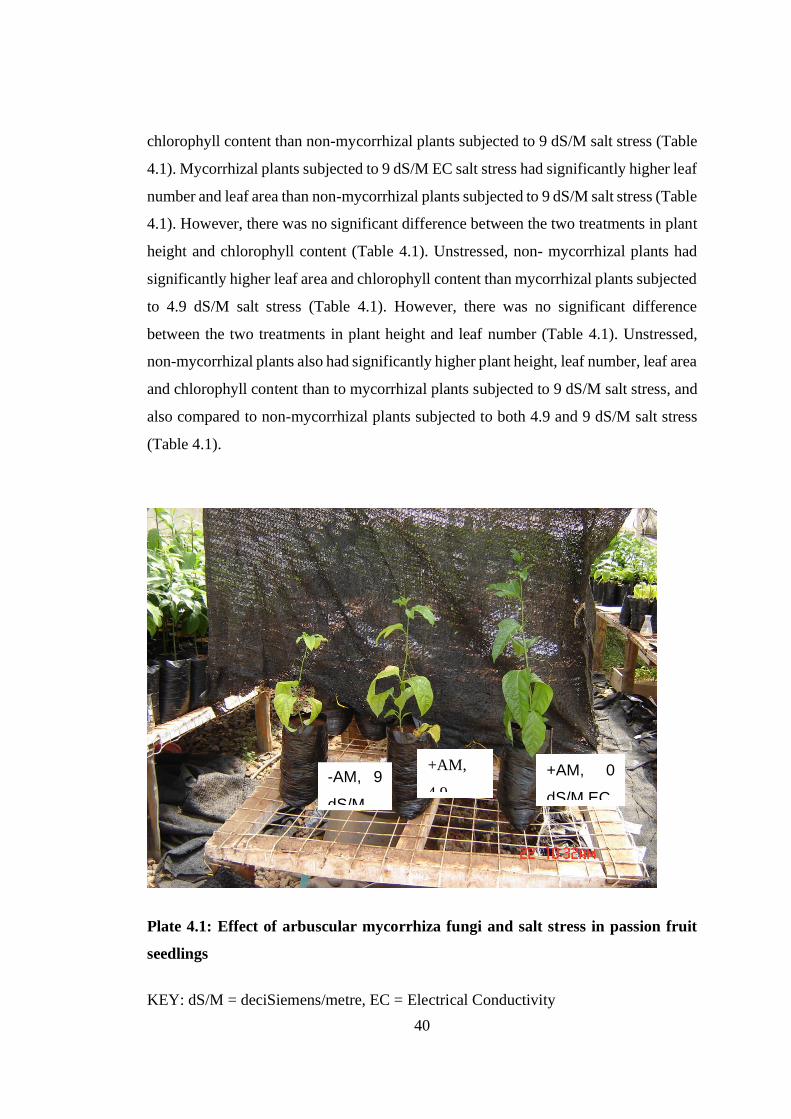
Plate 4.1: Effect of arbuscular mycorrhiza fungi and salt stress in passion fruit
seedlings .................................................................................................. 40
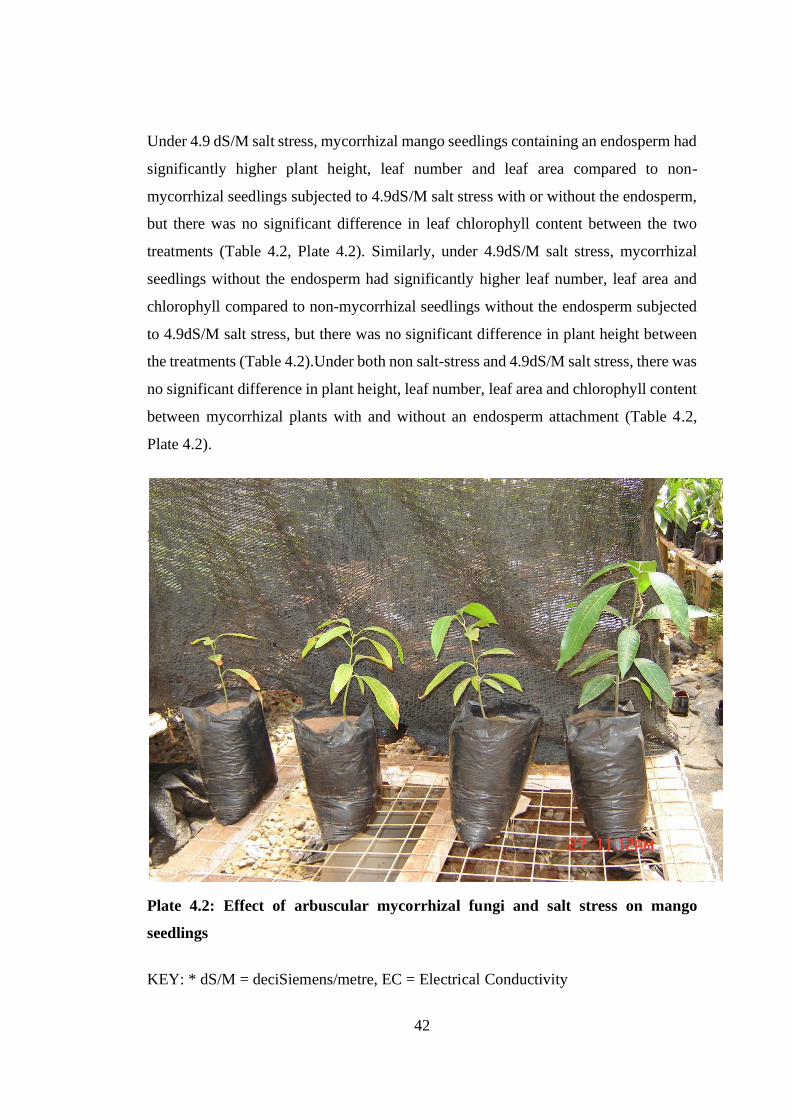
Plate 4.2: Effect of arbuscular mycorrhizal fungi and salt stress on mango seedlings
................................................................................................................. 42
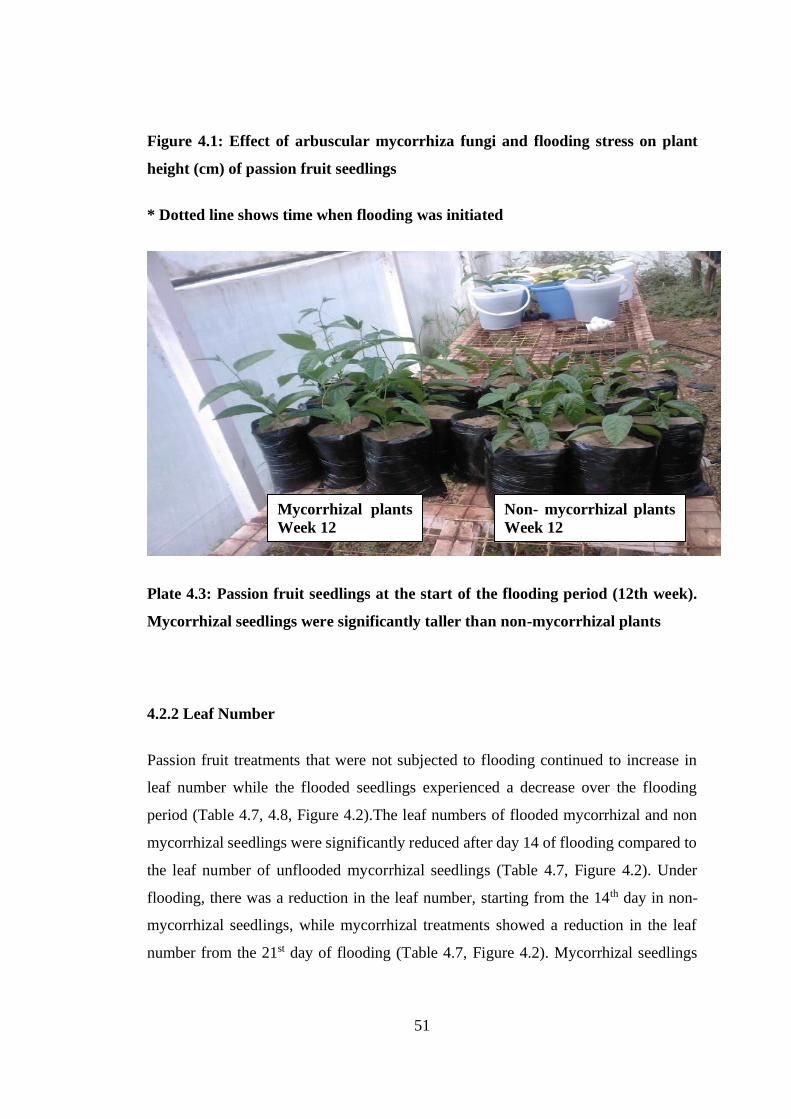
Plate 4.3: Passion fruit seedlings at the start of the flooding period (12th week).
Mycorrhizal seedlings were significantly taller than non-mycorrhizal
plants ....................................................................................................... 51
Plate 4.4: Mycorrhiza Plant Growth under Flooding and Non Flooding Stress Controls
................................................................................................................. 54
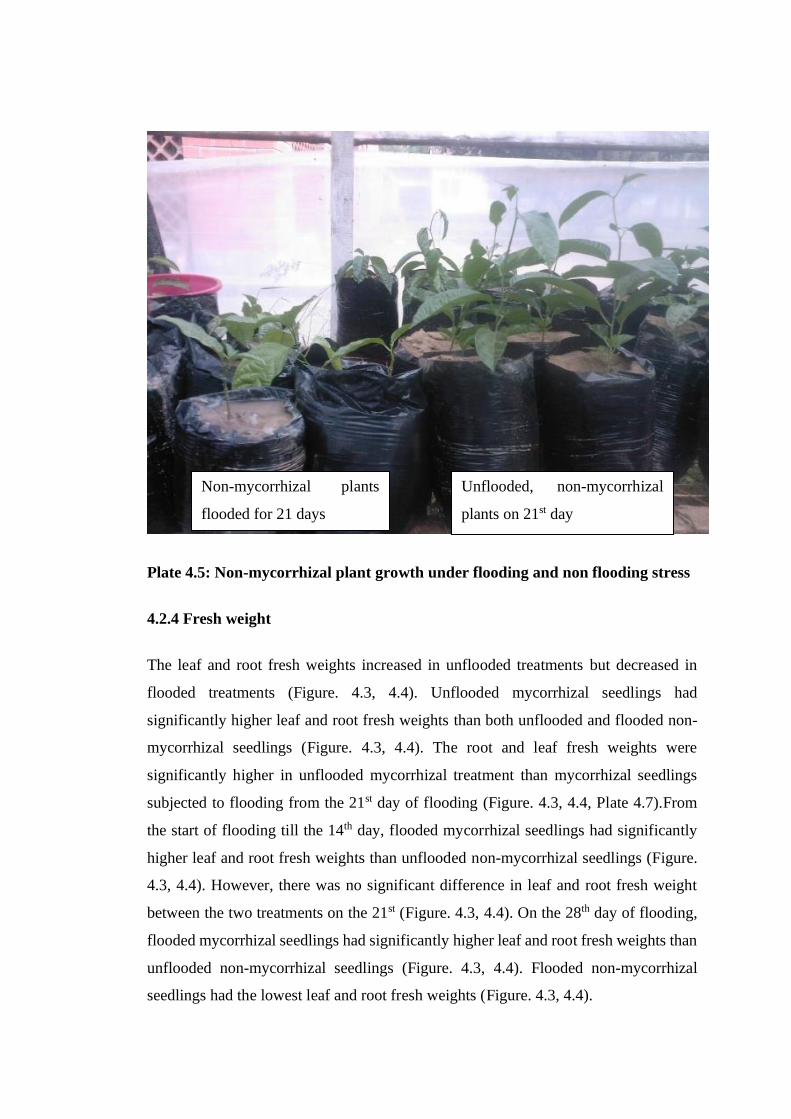
Plate 4.5: Non-mycorrhizal plant growth under flooding and non flooding stress ... 55
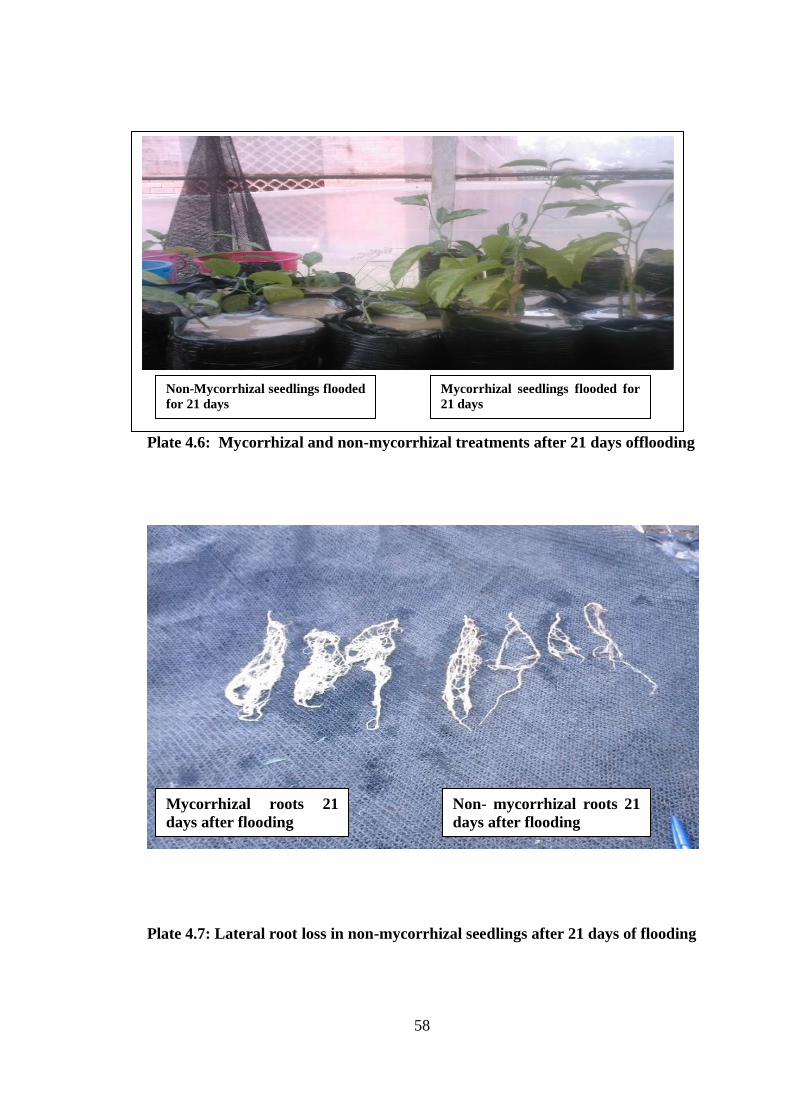
Plate 4.6: Mycorrhizal and non-mycorrhizal treatments after 21 days offlooding .. 58
Page 17
xvi
Plate 4.7: Lateral root loss in non-mycorrhizal seedlings after 21 days of flooding. 58
Plate 4.8: Root appearance of mycorrhizal (+AM) and non mycorrhizal (-AM) mango
seedlings with (+ED) and without endosperm (-ED) attachment ........... 76
Page 18
xvii
LIST OF APPENDICES
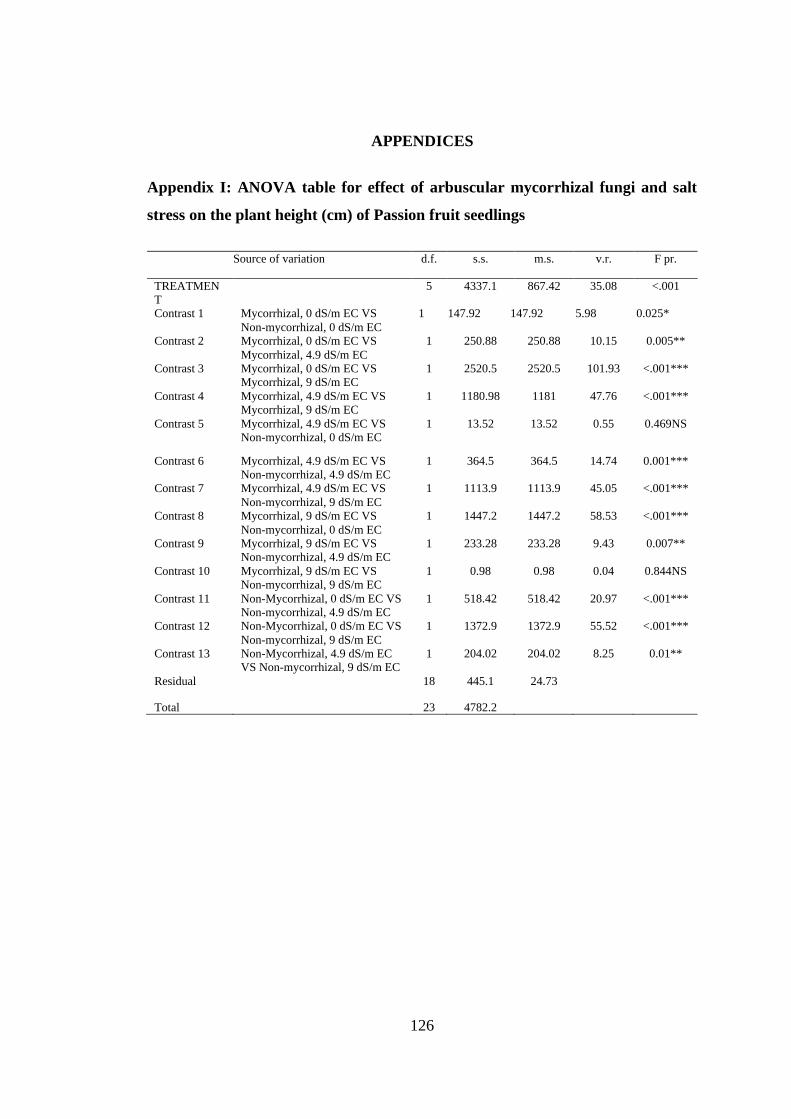
Appendix I: ANOVA table for effect of arbuscular mycorrhizal fungi and salt stress
on the plant height (cm) of Passion fruit seedlings .......................... 126
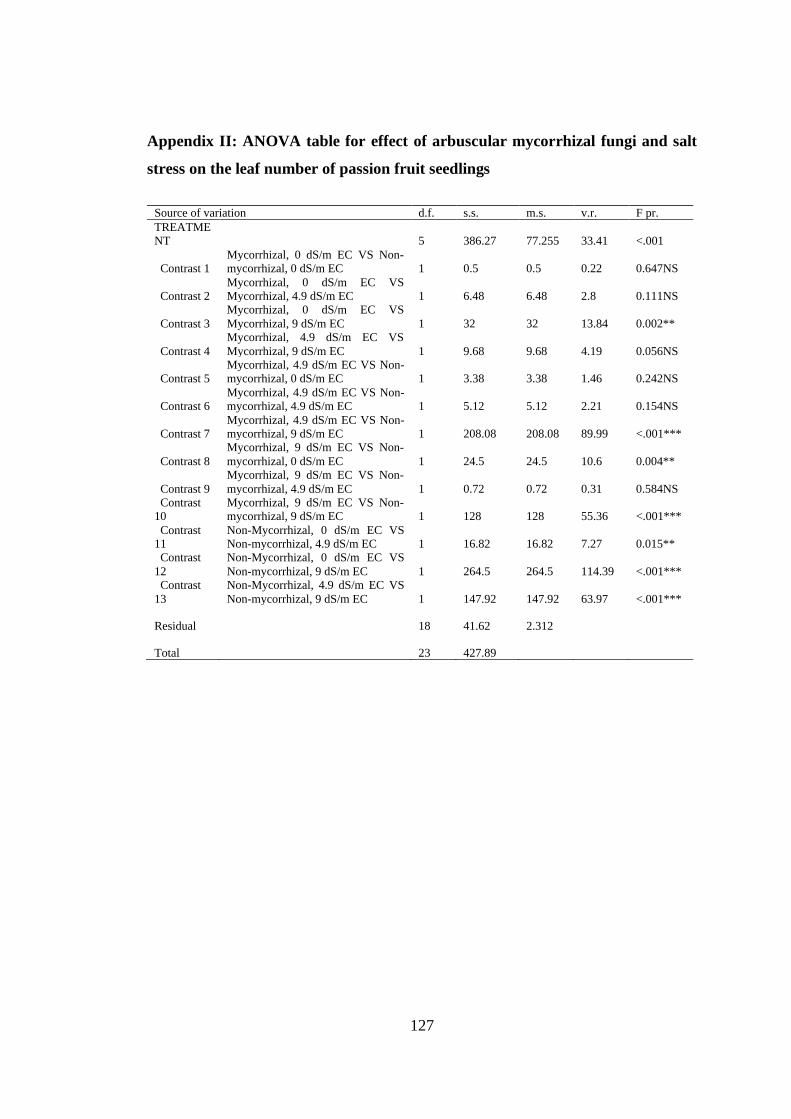
Appendix II: ANOVA table for effect of arbuscular mycorrhizal fungi and salt stress
on the leaf number of passion fruit seedlings ................................... 127
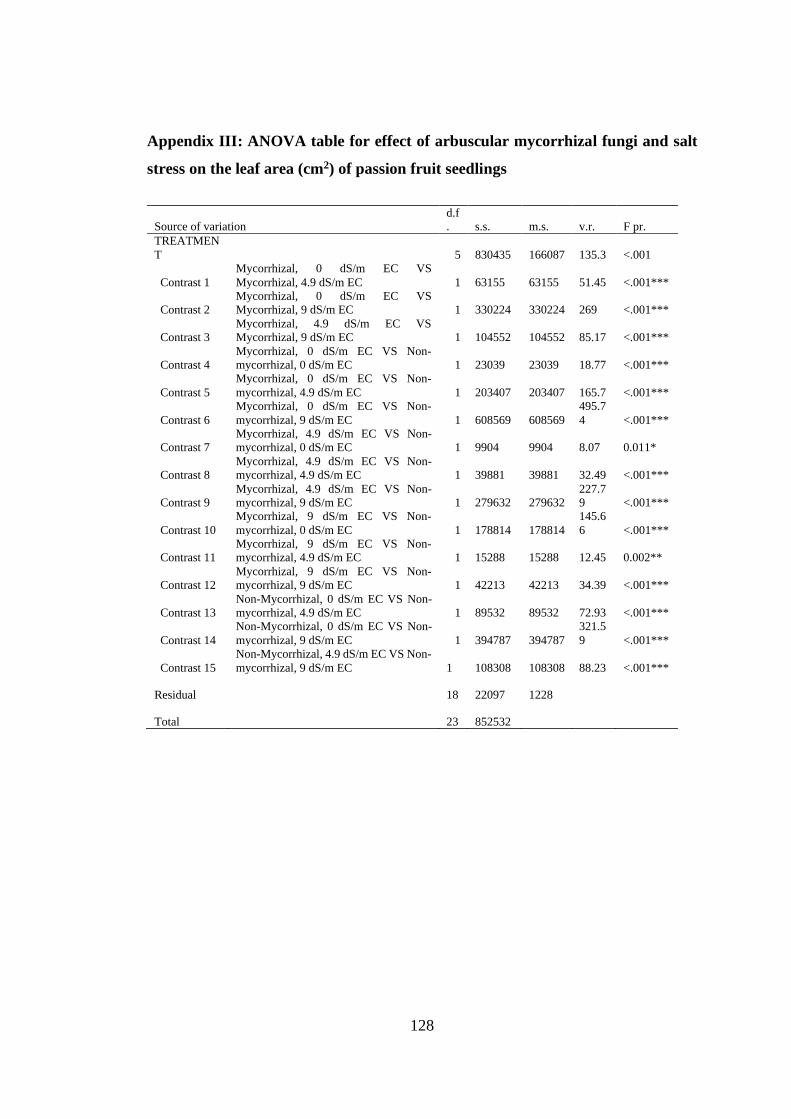
Appendix III: ANOVA table for effect of arbuscular mycorrhizal fungi and salt stress
on the leaf area (cm2) of passion fruit seedlings............................... 128
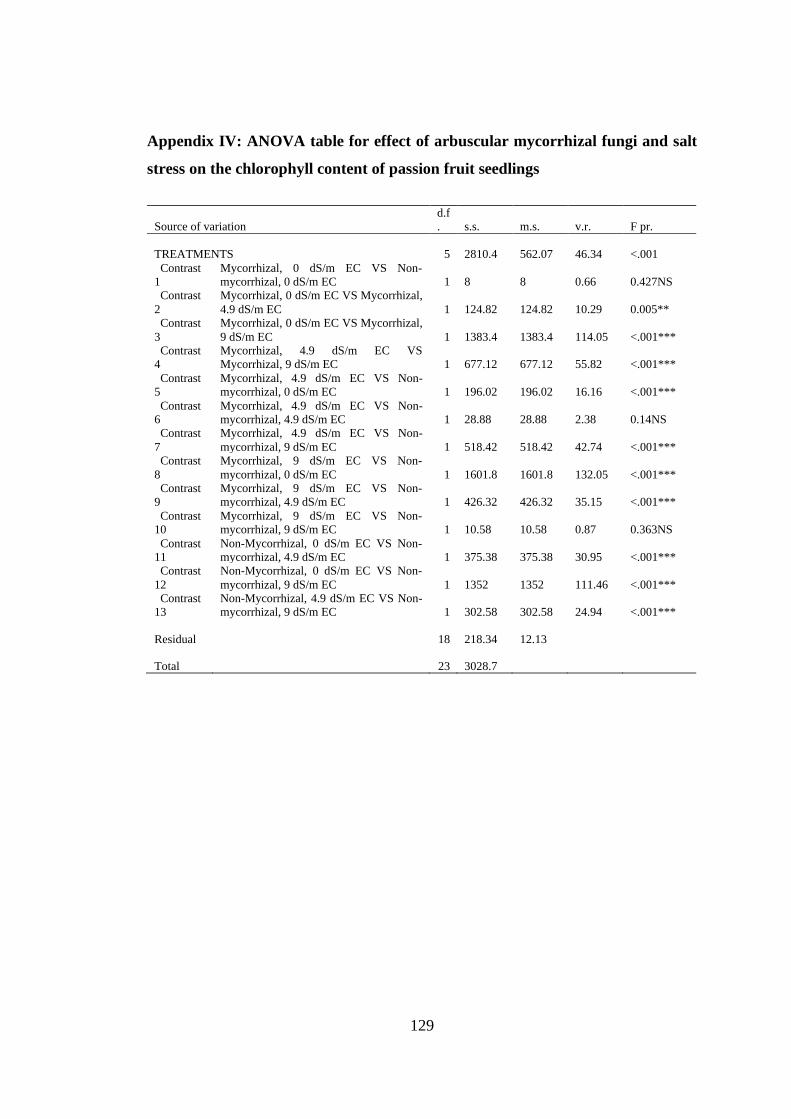
Appendix IV: ANOVA table for effect of arbuscular mycorrhizal fungi and salt stress
on the chlorophyll content of passion fruit seedlings ....................... 129
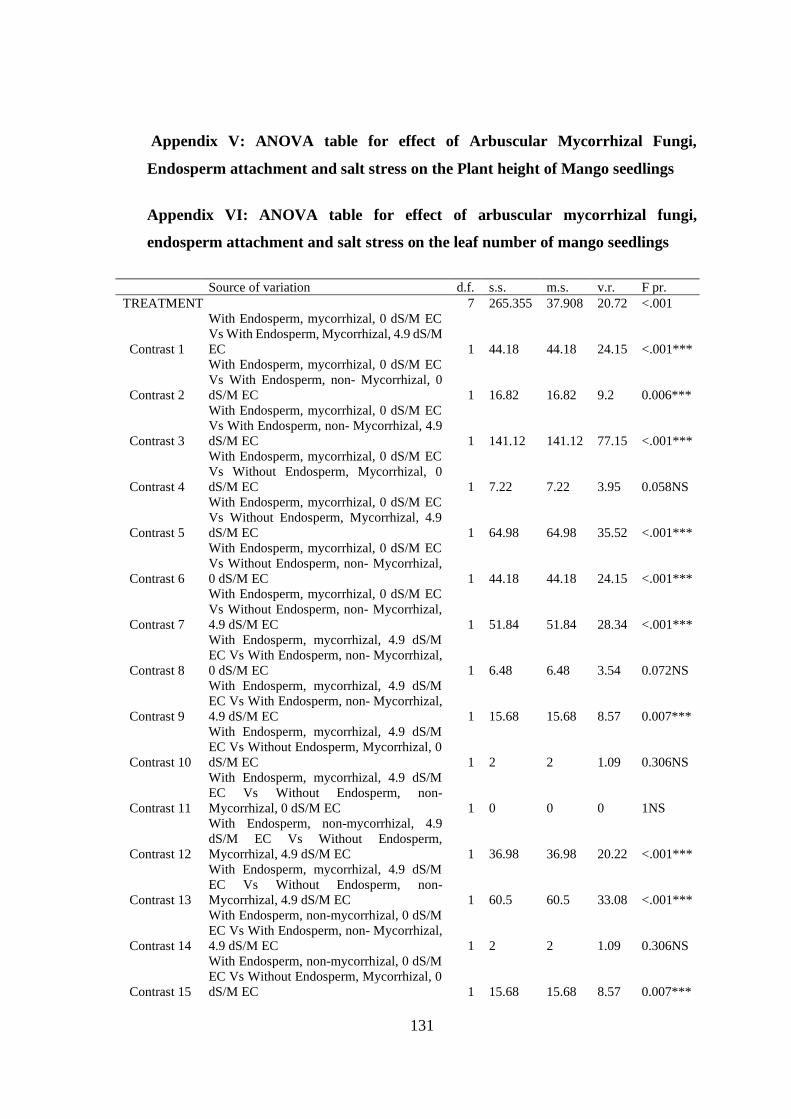
Appendix V: ANOVA table for effect of Arbuscular Mycorrhizal Fungi, Endosperm
attachment and salt stress on the Plant height of Mango seedlings .. 131
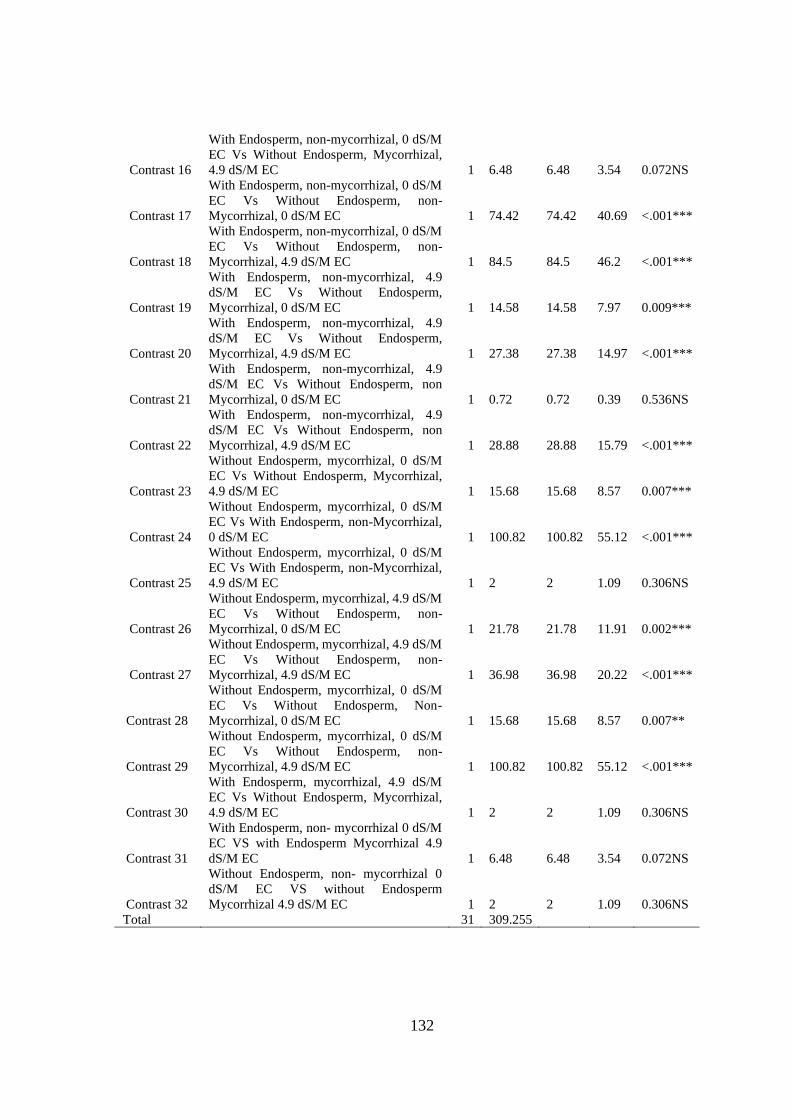
Appendix VI: ANOVA table for effect of arbuscular mycorrhizal fungi, endosperm
attachment and salt stress on the leaf number of mango seedlings .. 131
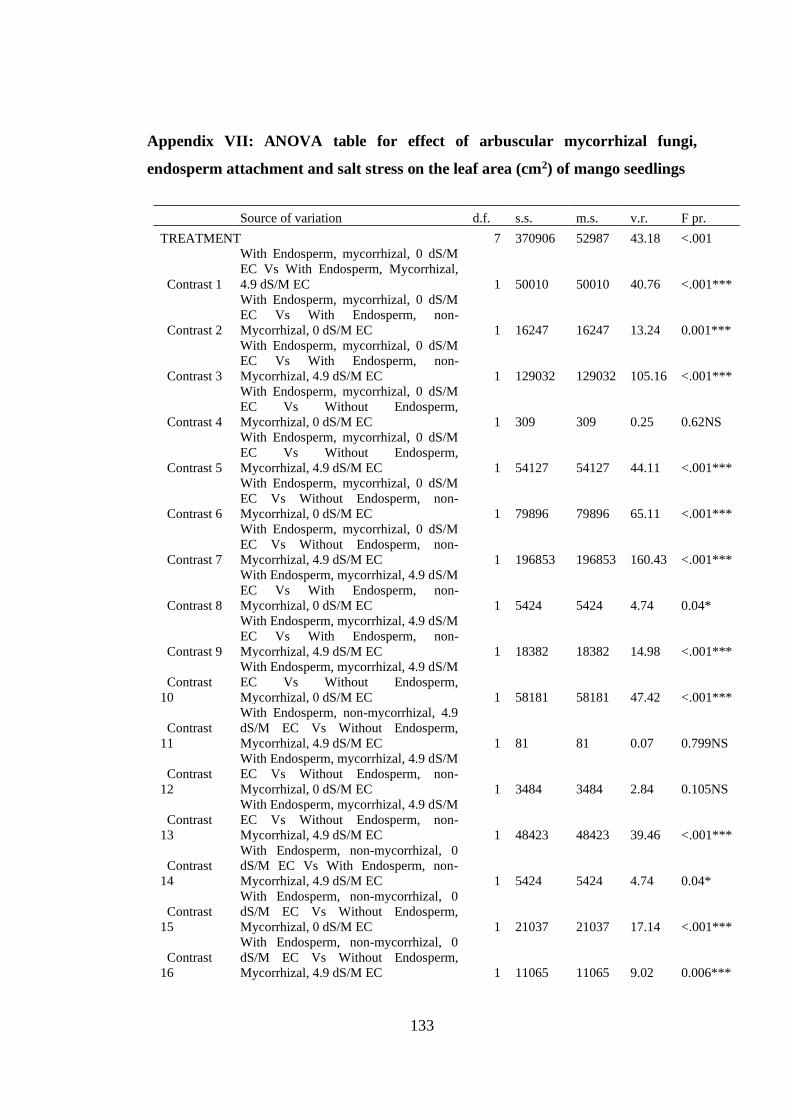
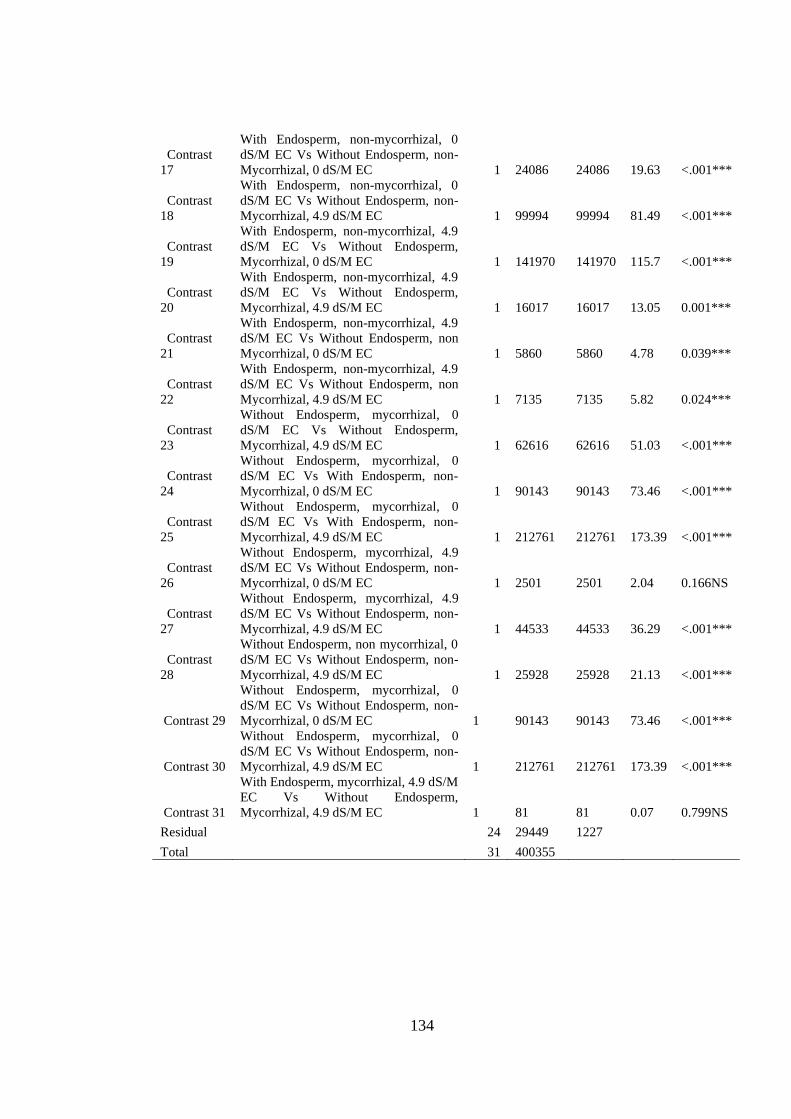
Appendix VII: ANOVA table for effect of arbuscular mycorrhizal fungi, endosperm
attachment and salt stress on the leaf area (cm2) of mango seedlings
.......................................................................................................... 133
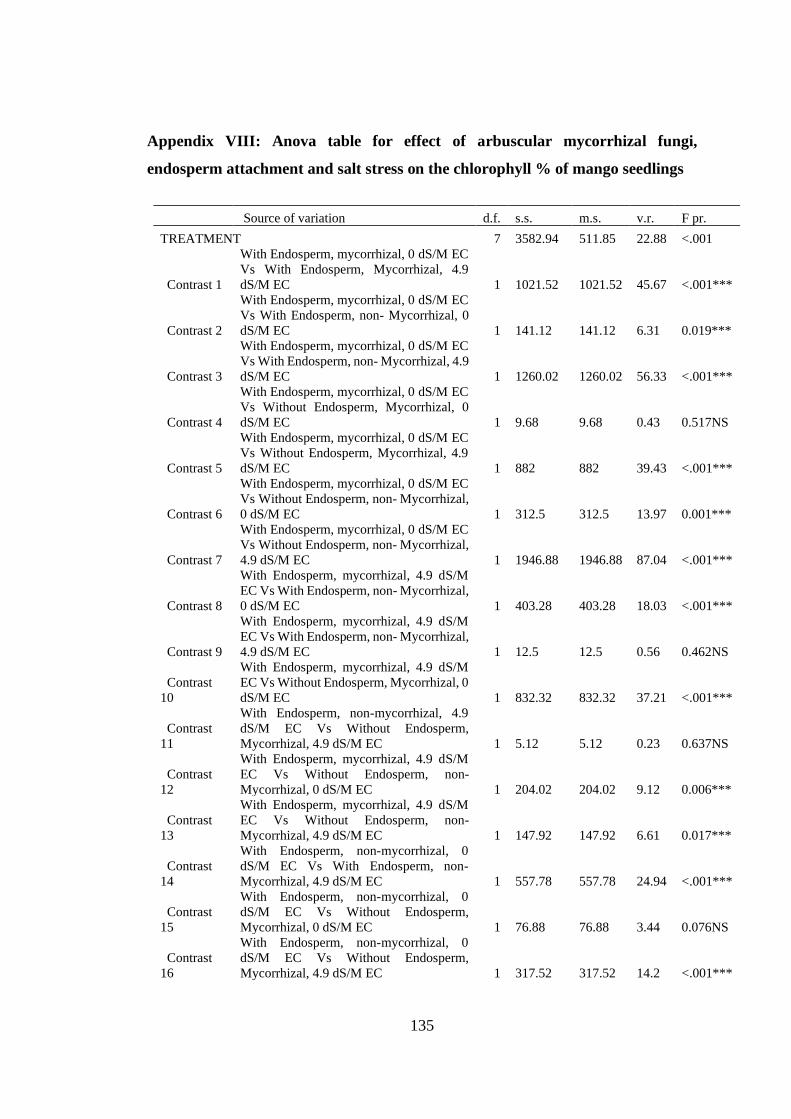
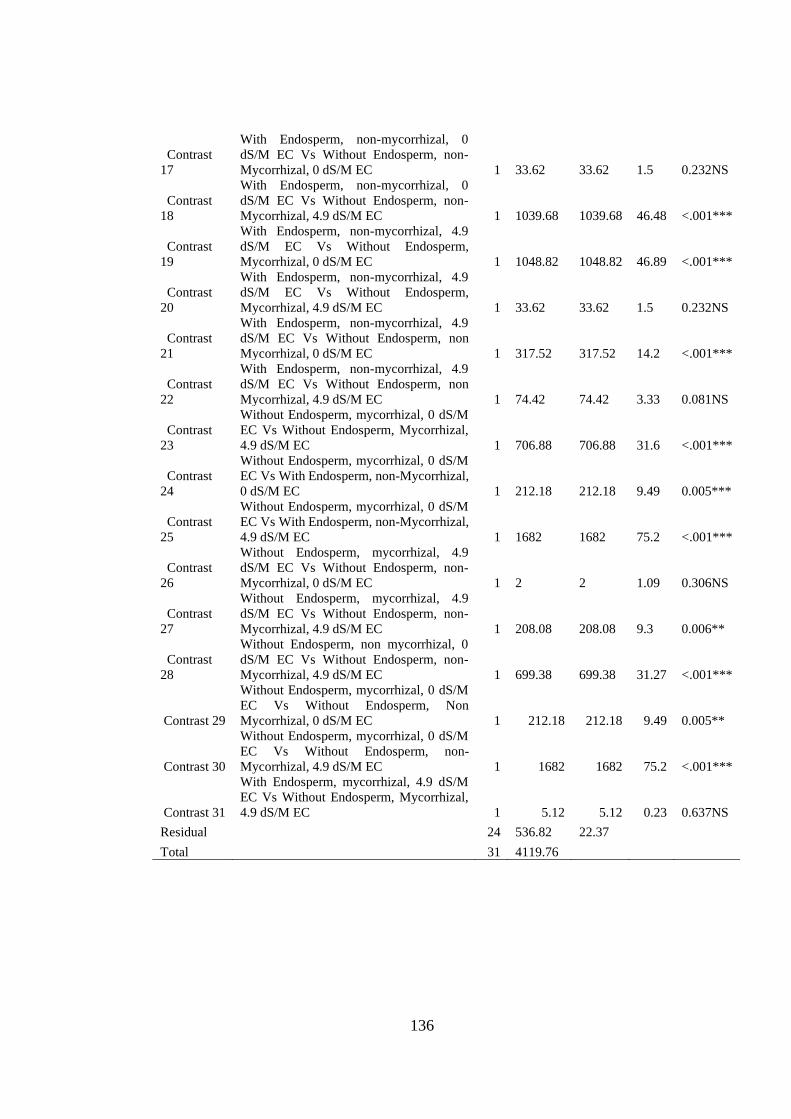
Appendix VIII: Anova table for effect of arbuscular mycorrhizal fungi, endosperm
attachment and salt stress on the chlorophyll % of mango seedlings
.......................................................................................................... 135
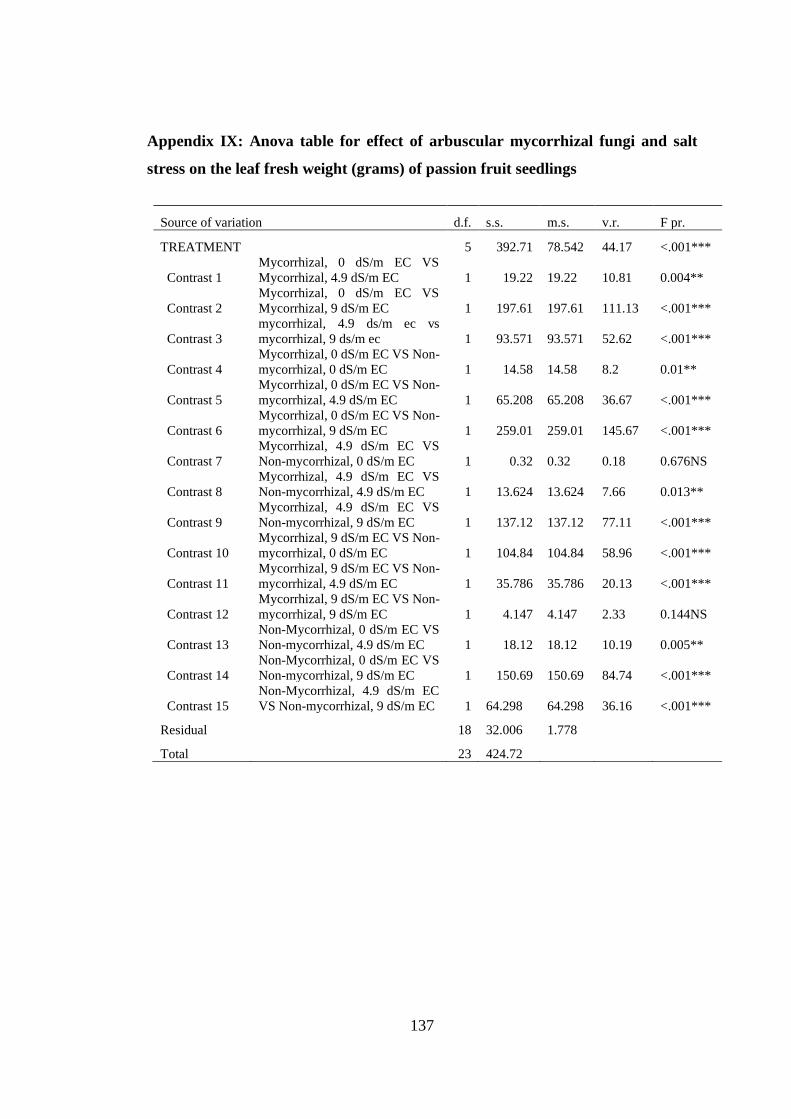
Appendix IX: Anova table for effect of arbuscular mycorrhizal fungi and salt stress
on the leaf fresh weight (grams) of passion fruit seedlings .............. 137
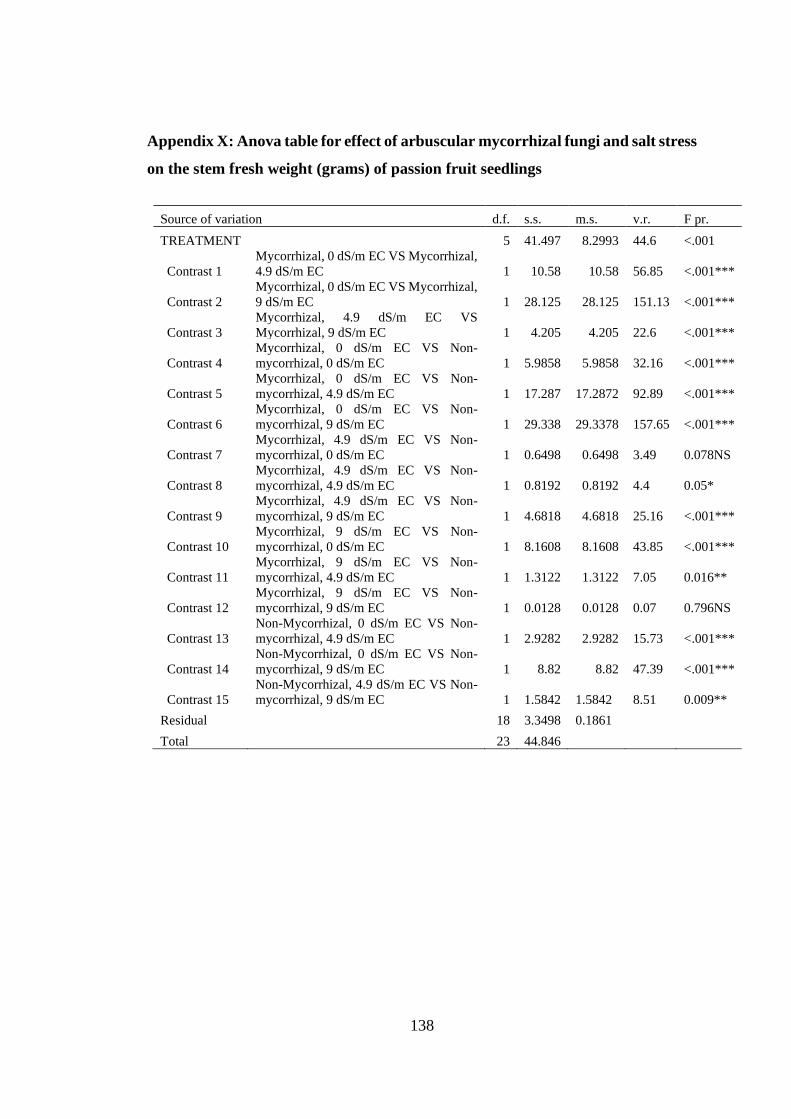
Appendix X: Anova table for effect of arbuscular mycorrhizal fungi and salt stress on
the stem fresh weight (grams) of passion fruit seedlings ................. 138
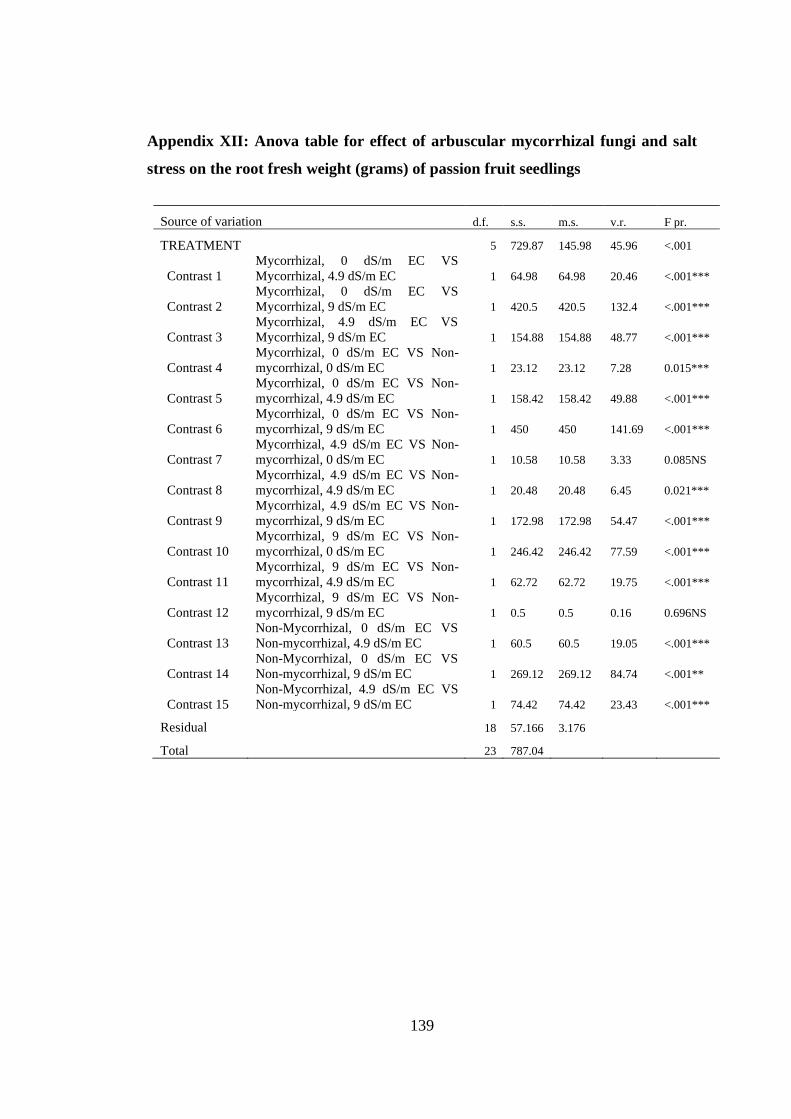
Appendix XII: Anova table for effect of arbuscular mycorrhizal fungi and salt stress
on the root fresh weight (grams) of passion fruit seedlings ............. 139
Page 19
xviii
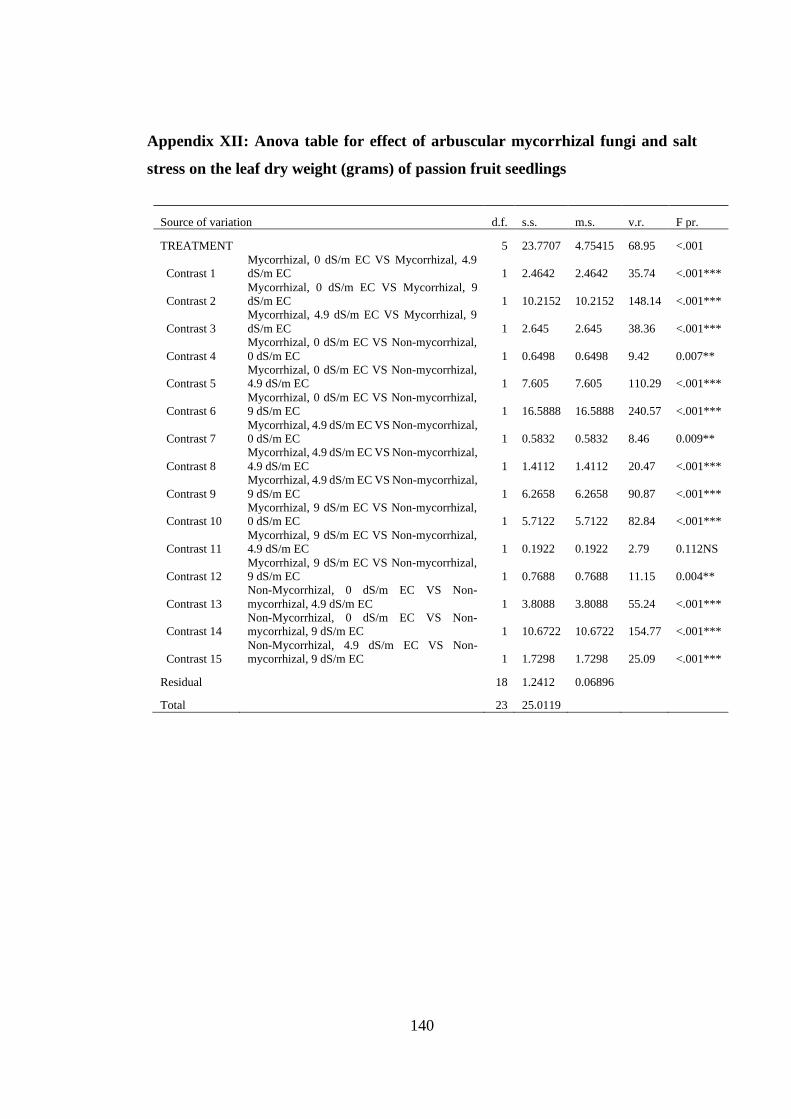
Appendix XII: Anova table for effect of arbuscular mycorrhizal fungi and salt stress
on the leaf dry weight (grams) of passion fruit seedlings ................ 140
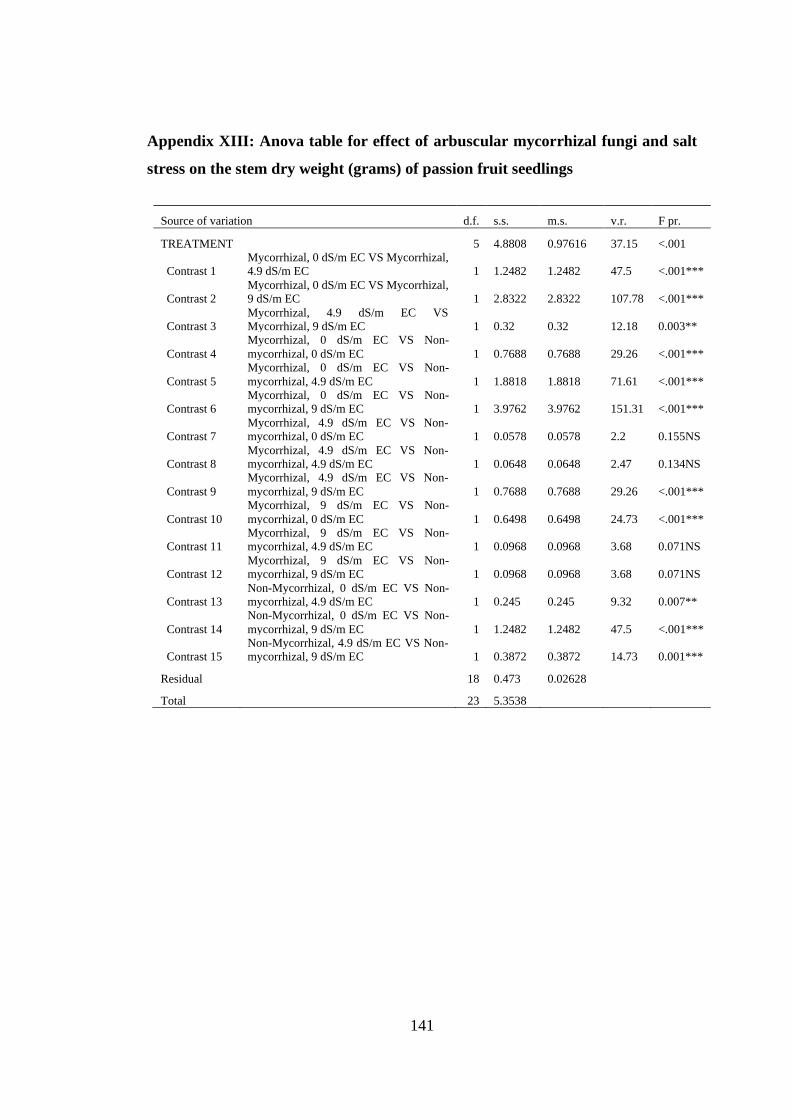
Appendix XIII: Anova table for effect of arbuscular mycorrhizal fungi and salt stress
on the stem dry weight (grams) of passion fruit seedlings ............... 141
Appendix XIV: Anova table for effect of arbuscular mycorrhizal fungi and salt stress
on the root dry weight (grams) of passion fruit seedlings ................ 142
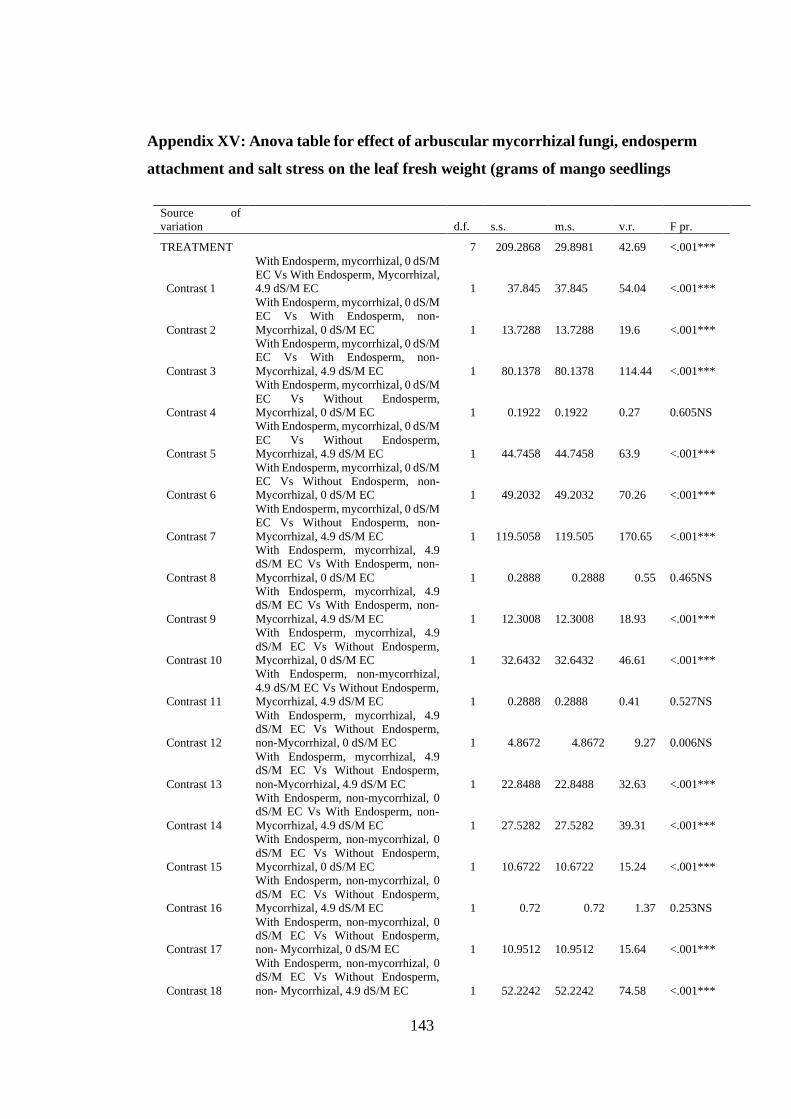
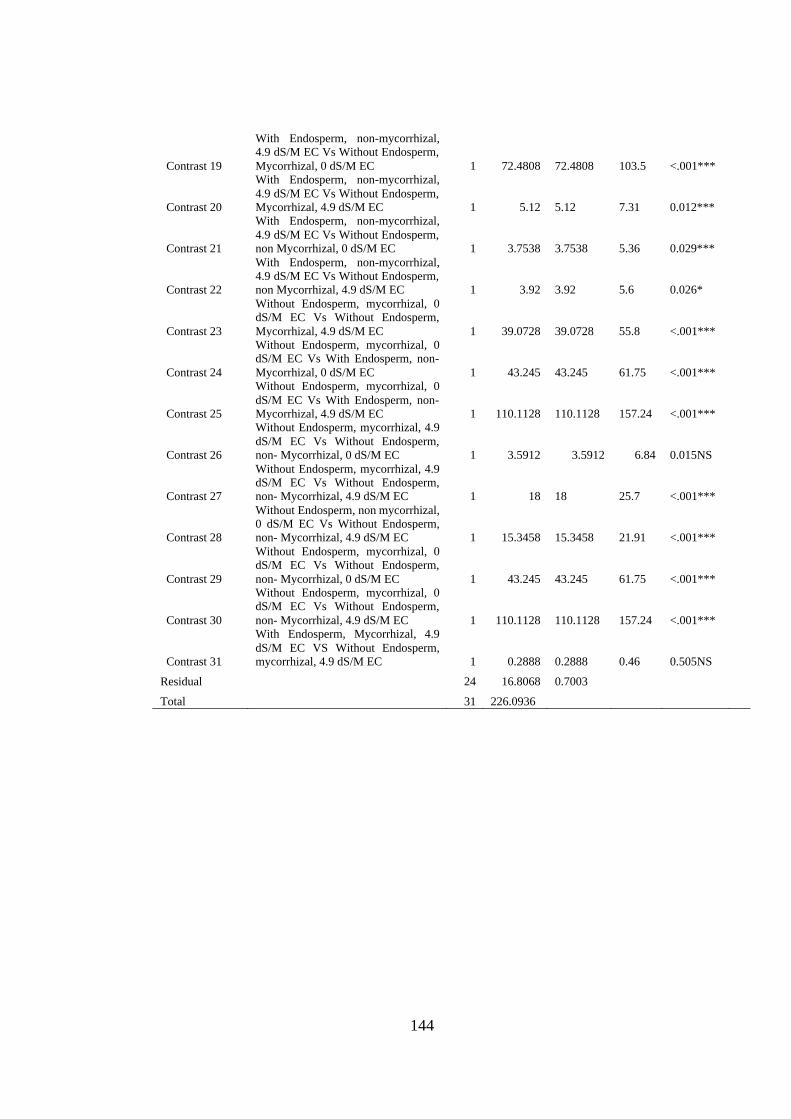
Appendix XV: Anova table for effect of arbuscular mycorrhizal fungi, endosperm
attachment and salt stress on the leaf fresh weight (grams of mango
seedlings ........................................................................................... 143
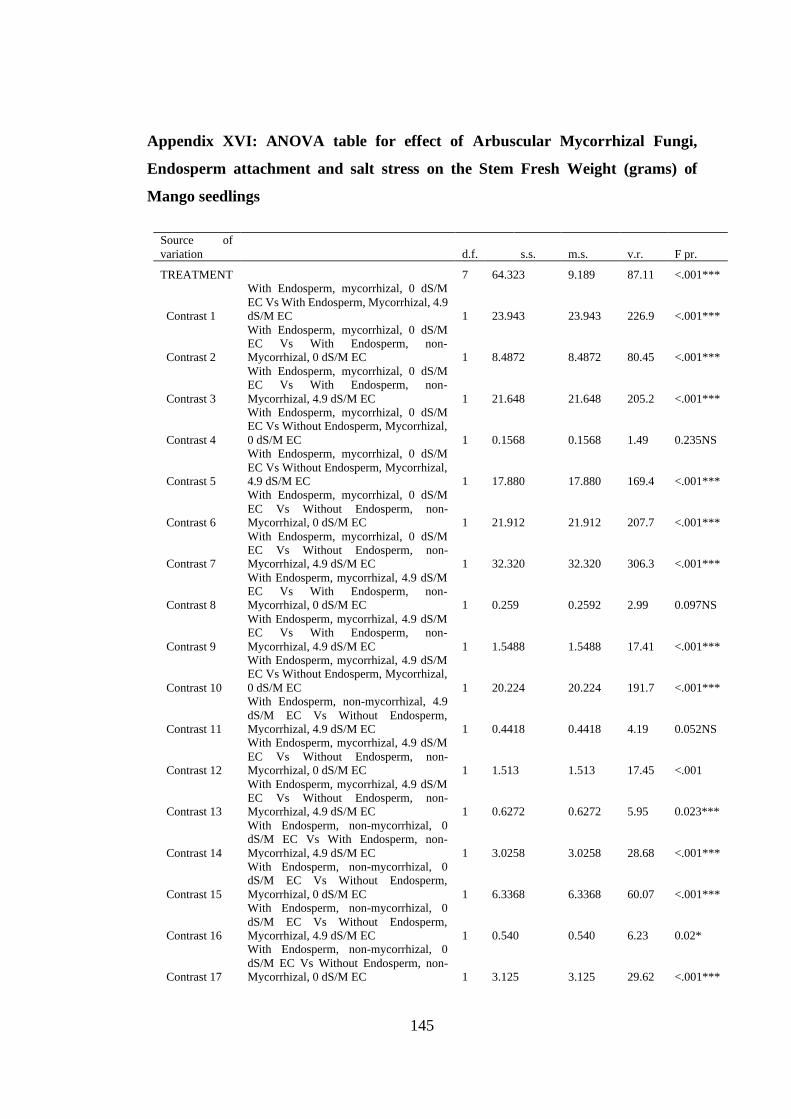
Appendix XVI: ANOVA table for effect of Arbuscular Mycorrhizal Fungi,
Endosperm attachment and salt stress on the Stem Fresh Weight
(grams) of Mango seedlings ............................................................. 145
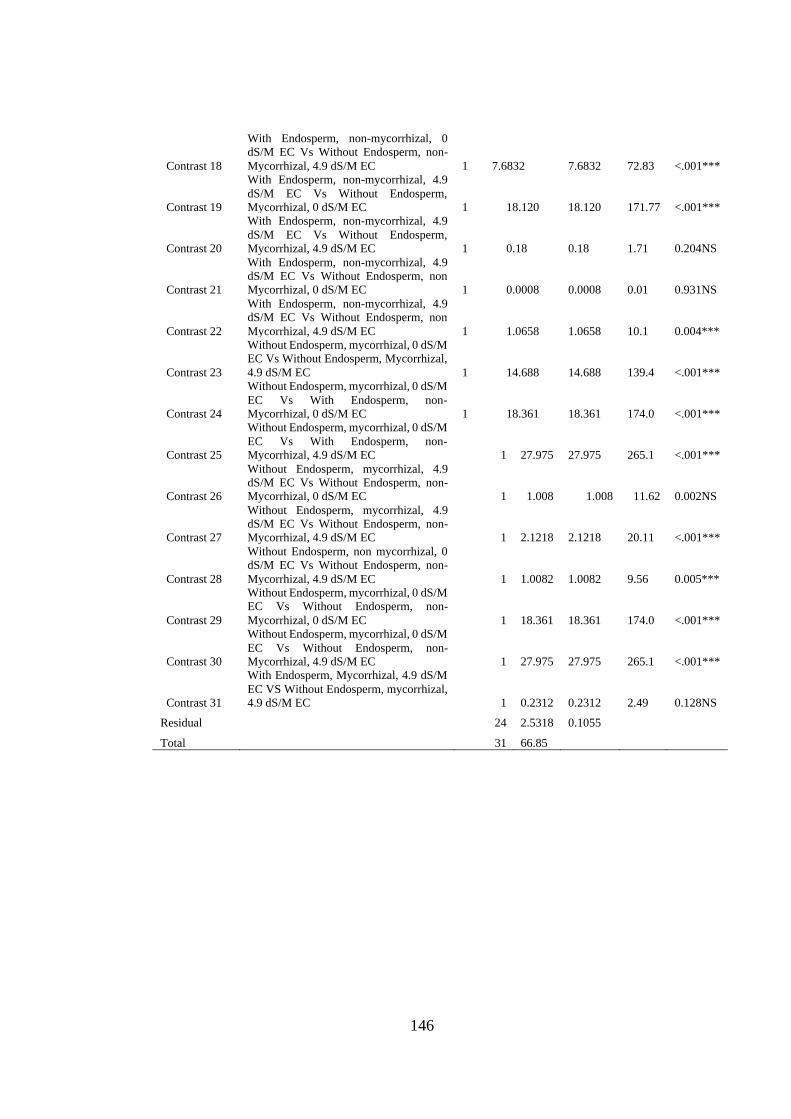
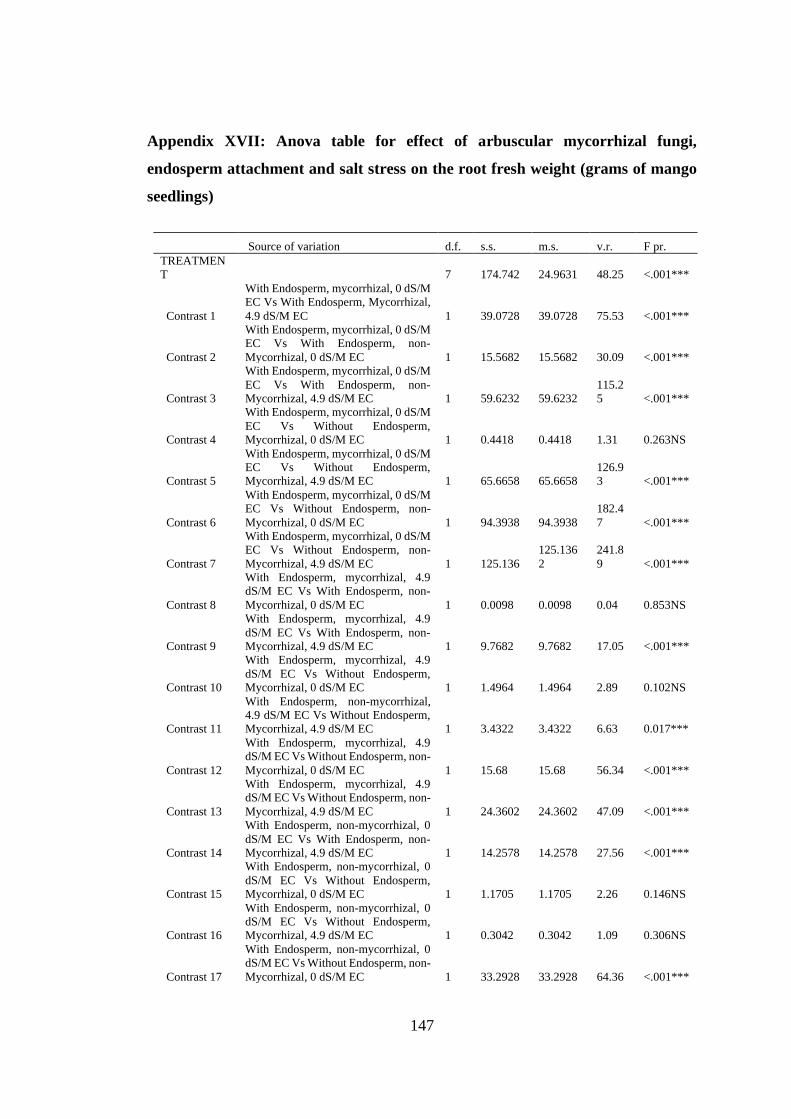
Appendix XVII: Anova table for effect of arbuscular mycorrhizal fungi, endosperm
attachment and salt stress on the root fresh weight (grams of mango
seedlings) .......................................................................................... 147
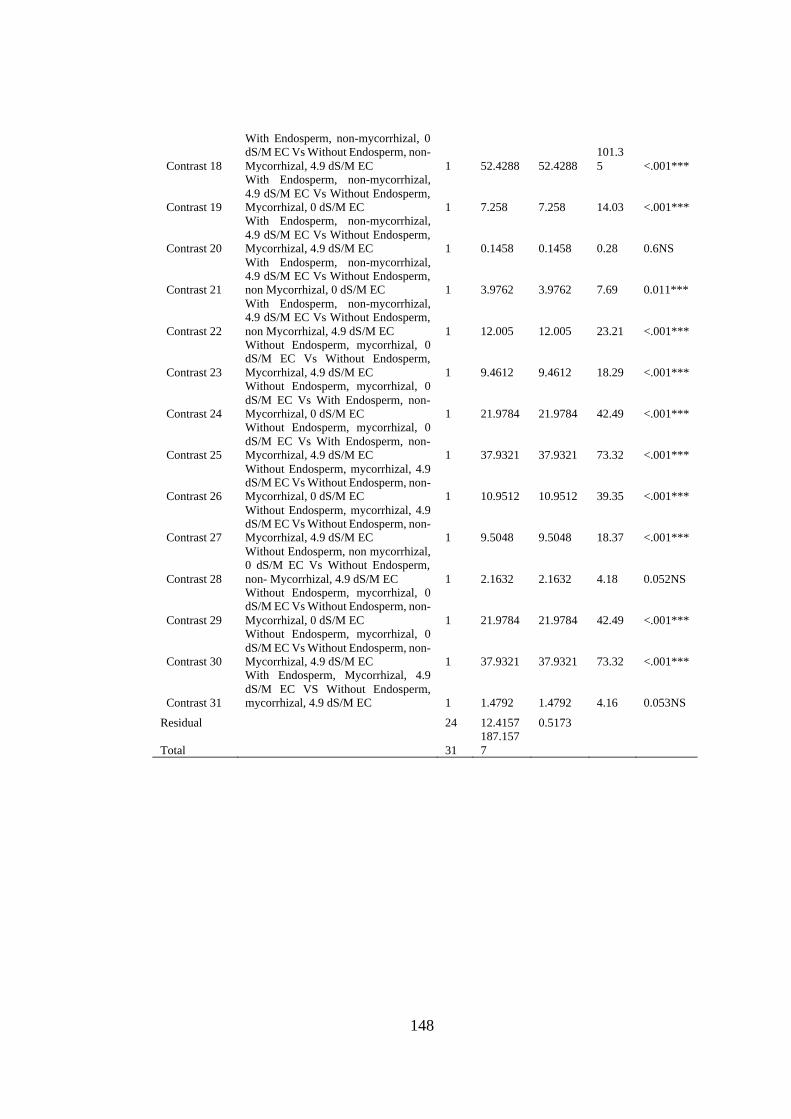
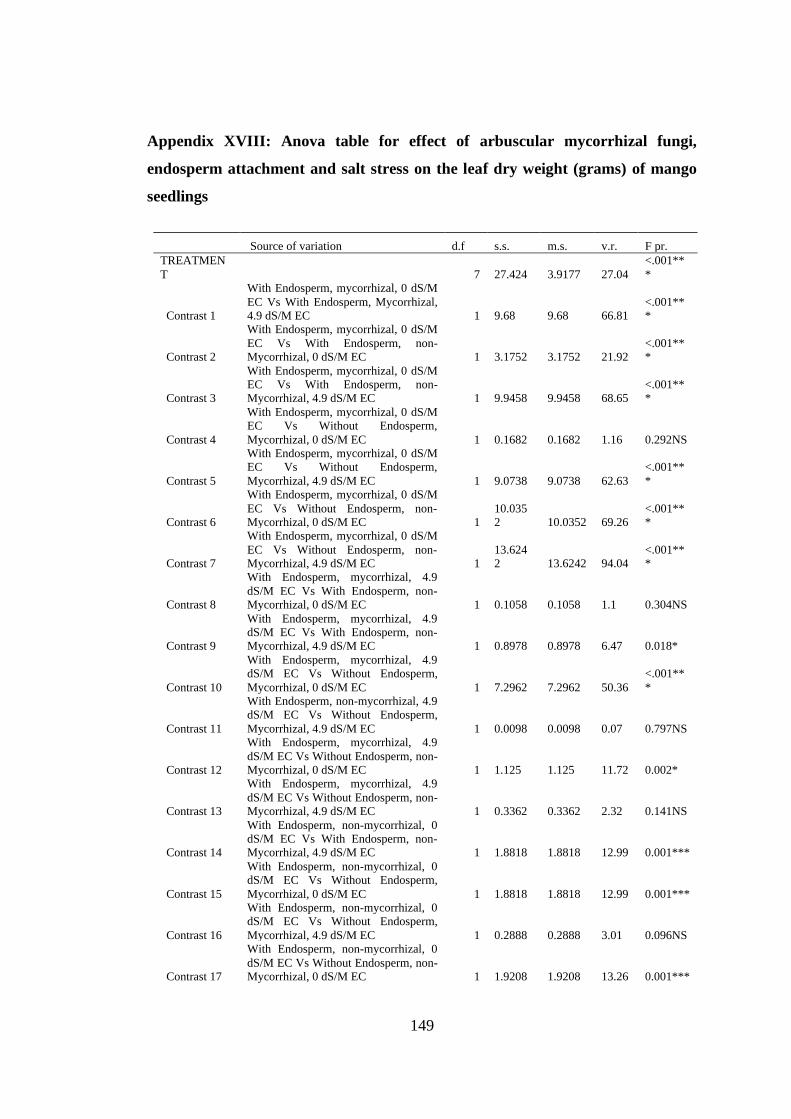
Appendix XVIII: Anova table for effect of arbuscular mycorrhizal fungi, endosperm
attachment and salt stress on the leaf dry weight (grams) of mango
seedlings ........................................................................................... 149
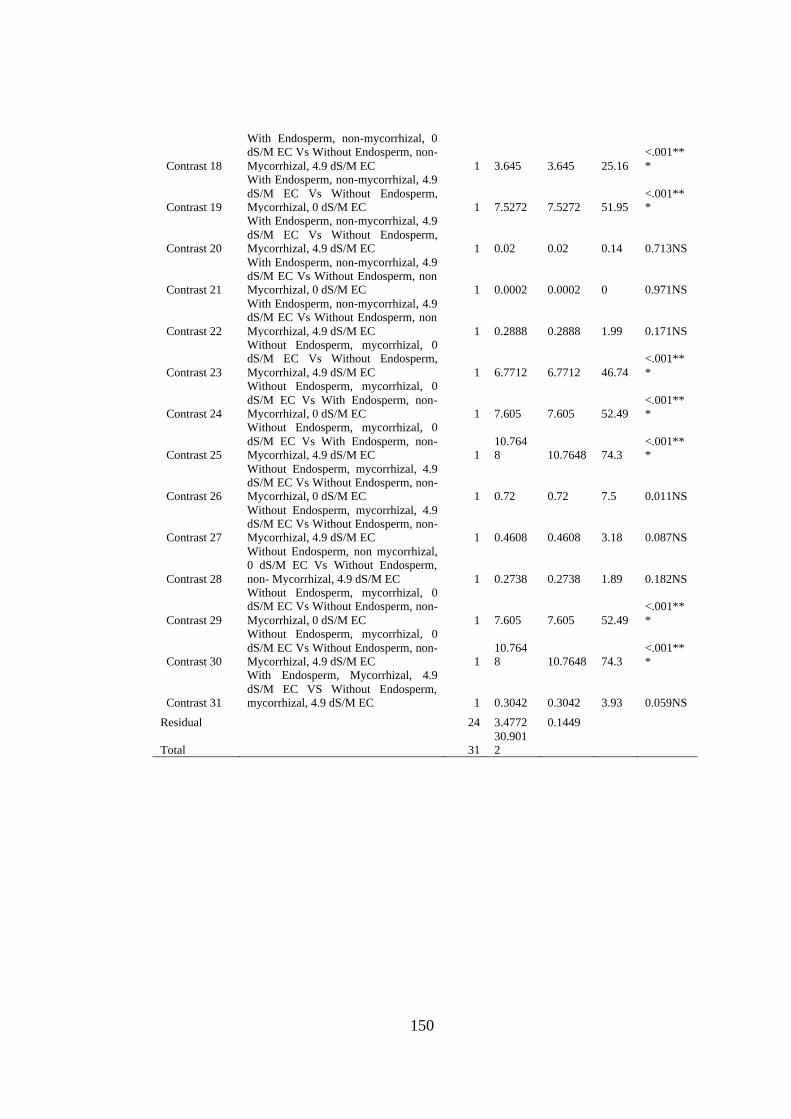
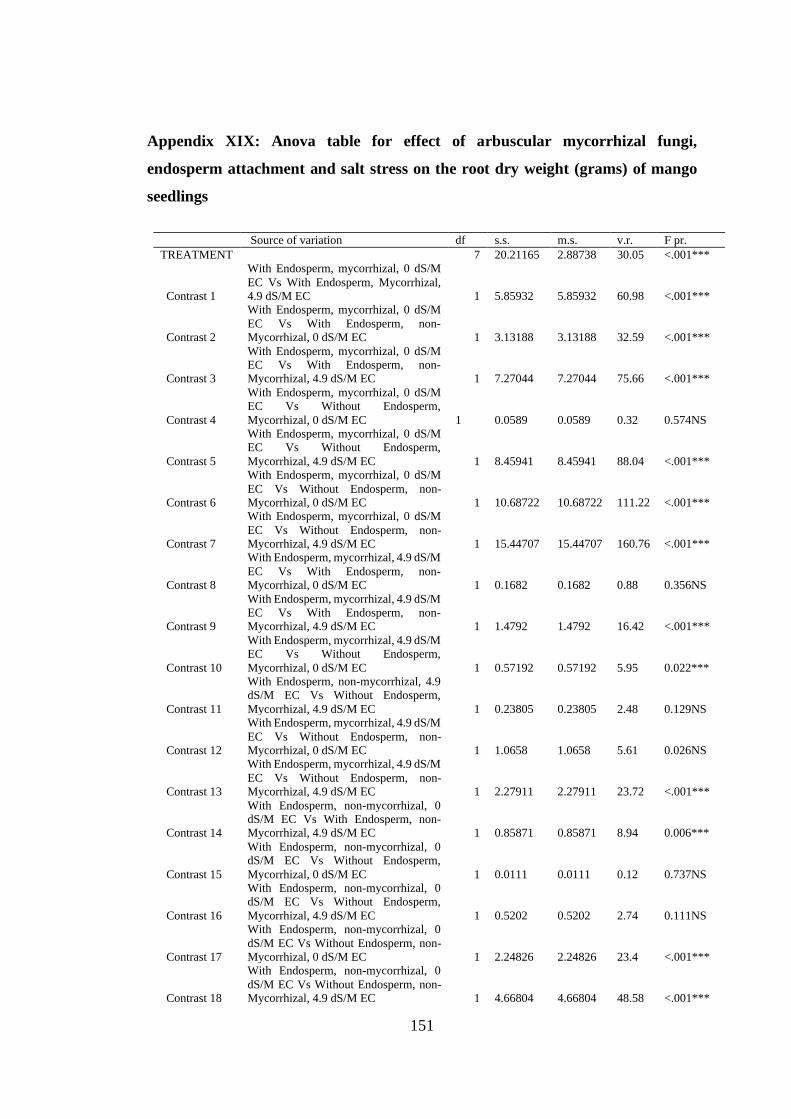
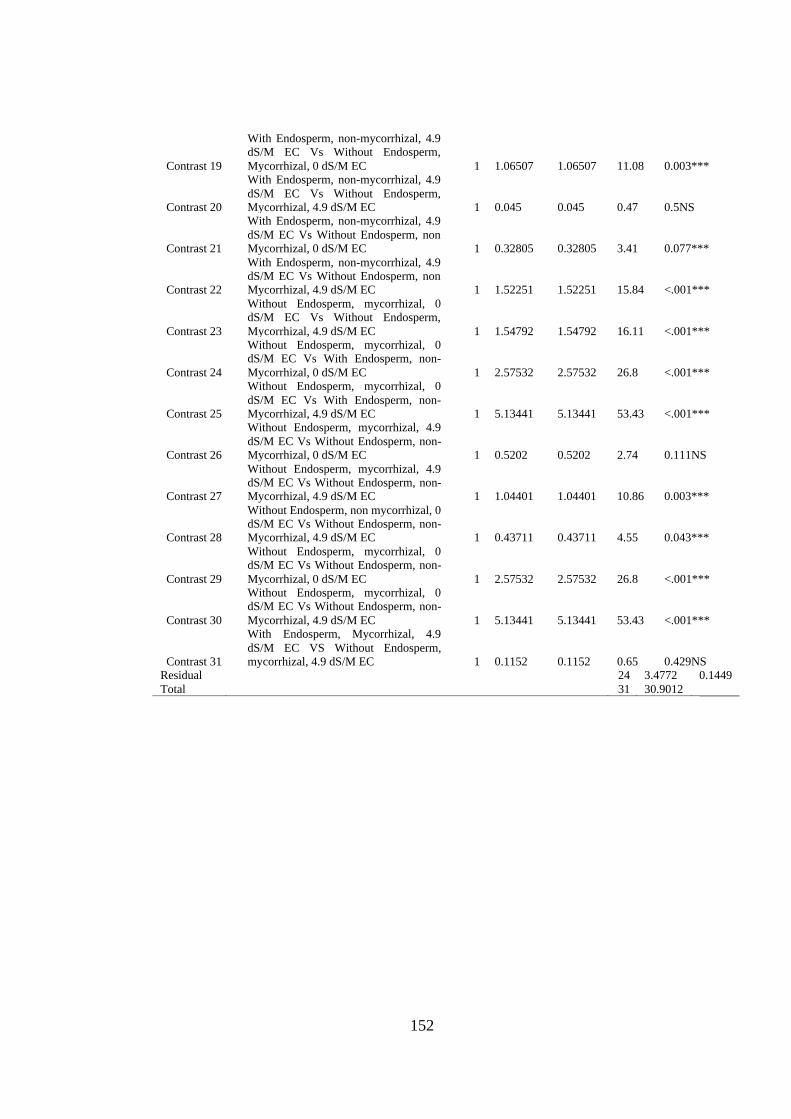
Appendix XIX: Anova table for effect of arbuscular mycorrhizal fungi, endosperm
attachment and salt stress on the root dry weight (grams) of mango
seedlings ........................................................................................... 151
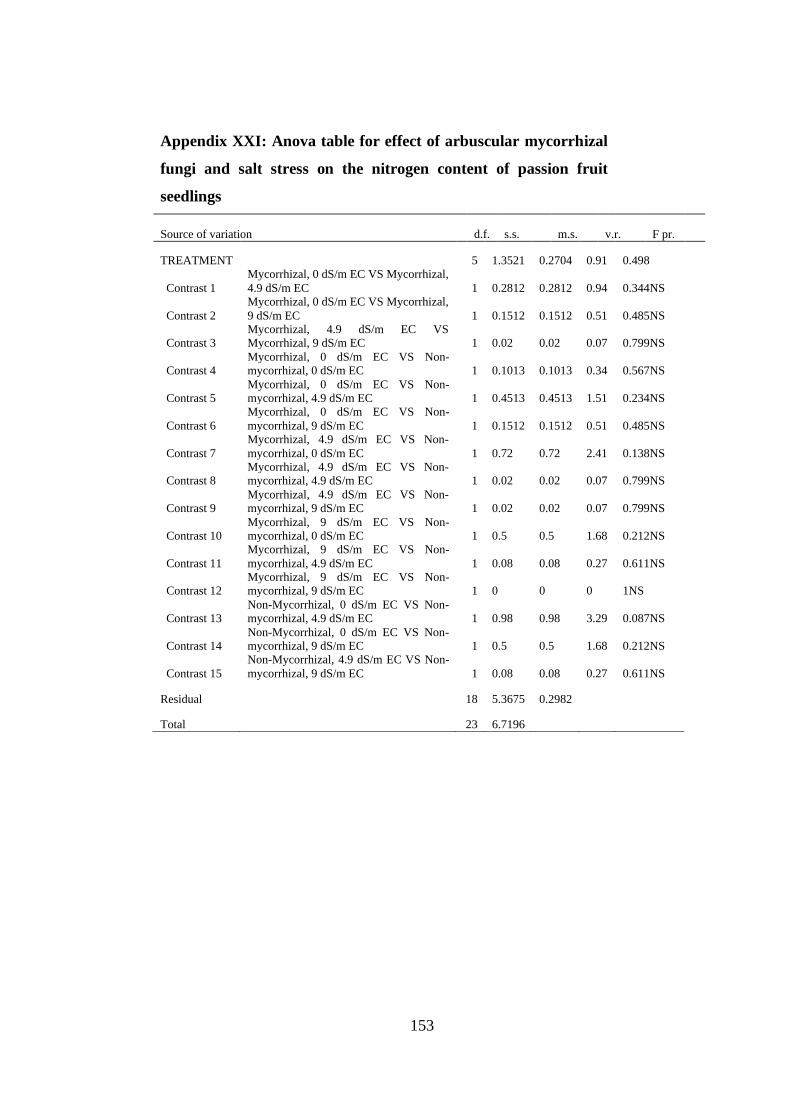
Appendix XXI: Anova table for effect of arbuscular mycorrhizal fungi and salt stress
on the nitrogen content of passion fruit seedlings ............................ 153
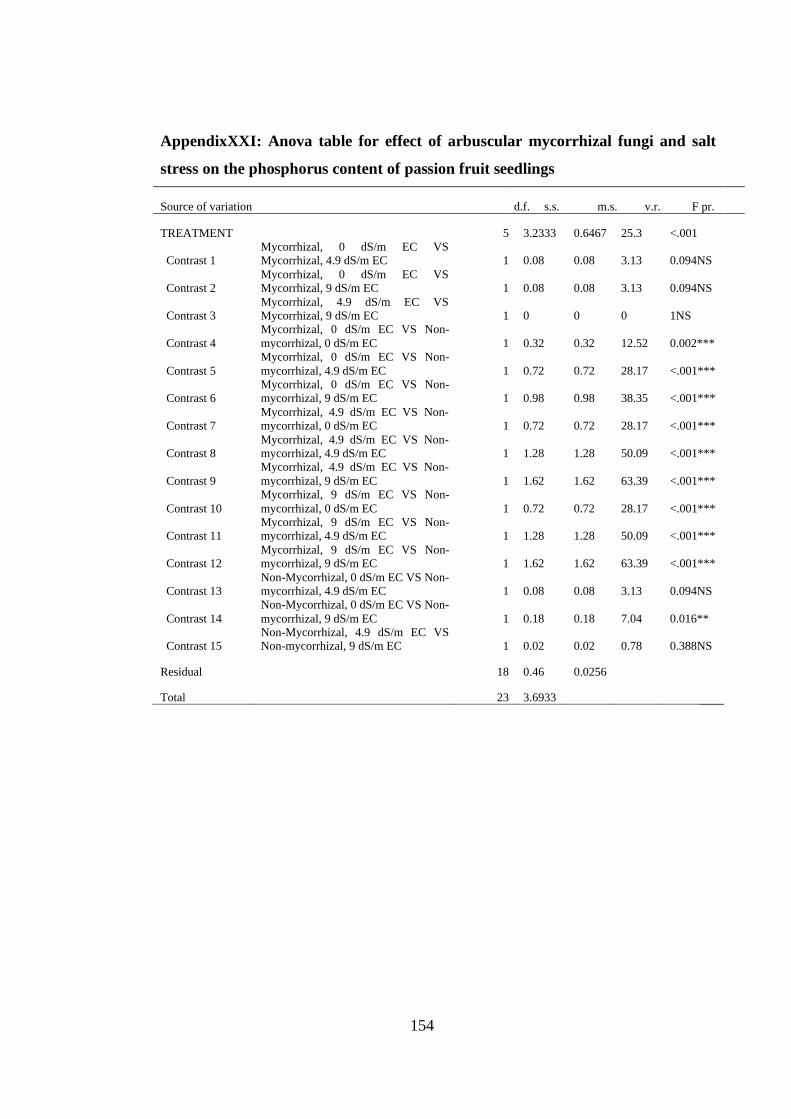
AppendixXXI: Anova table for effect of arbuscular mycorrhizal fungi and salt stress
on the phosphorus content of passion fruit seedlings ....................... 154
Page 20
xix
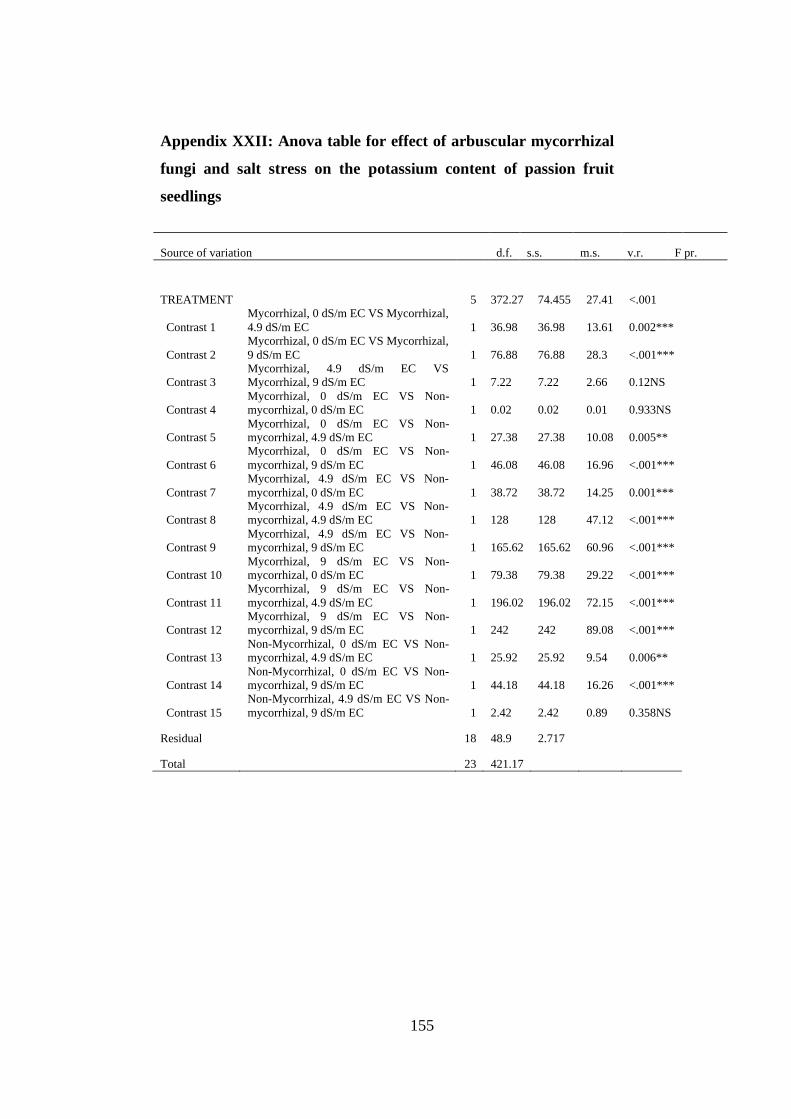
Appendix XXII: Anova table for effect of arbuscular mycorrhizal fungi and salt stress
on the potassium content of passion fruit seedlings ......................... 155
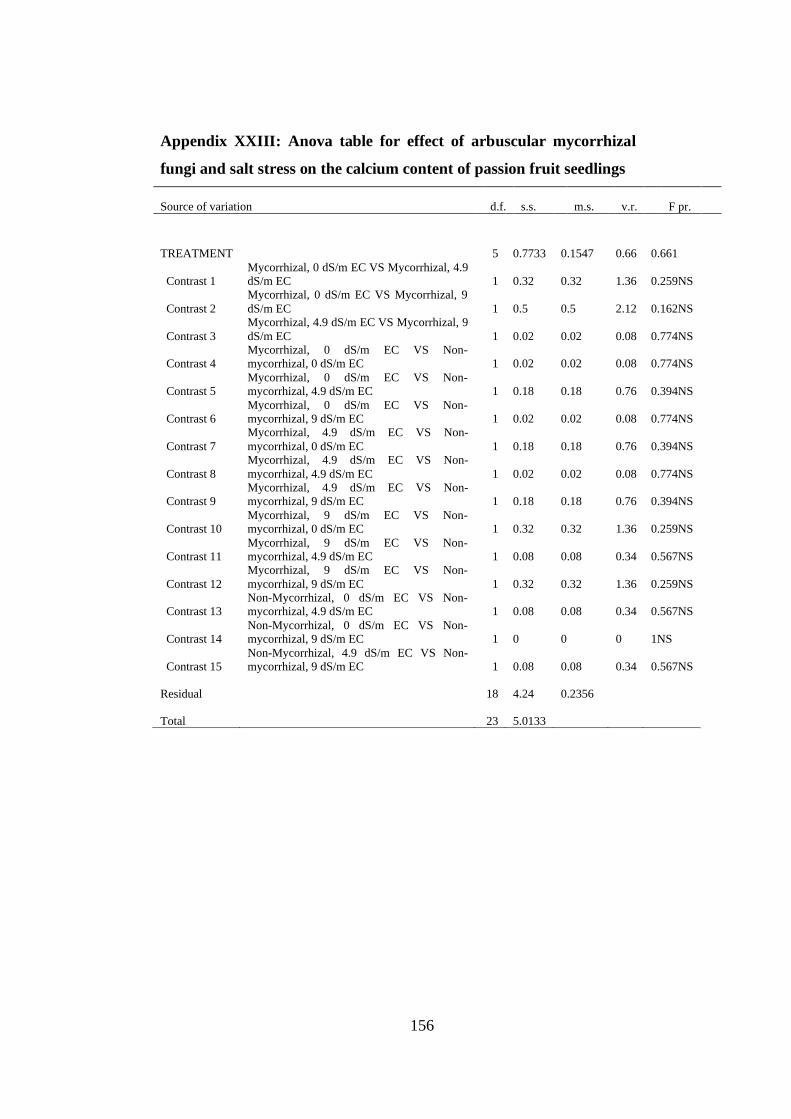
Appendix XXIII: Anova table for effect of arbuscular mycorrhizal fungi and salt
stress on the calcium content of passion fruit seedlings ................... 156
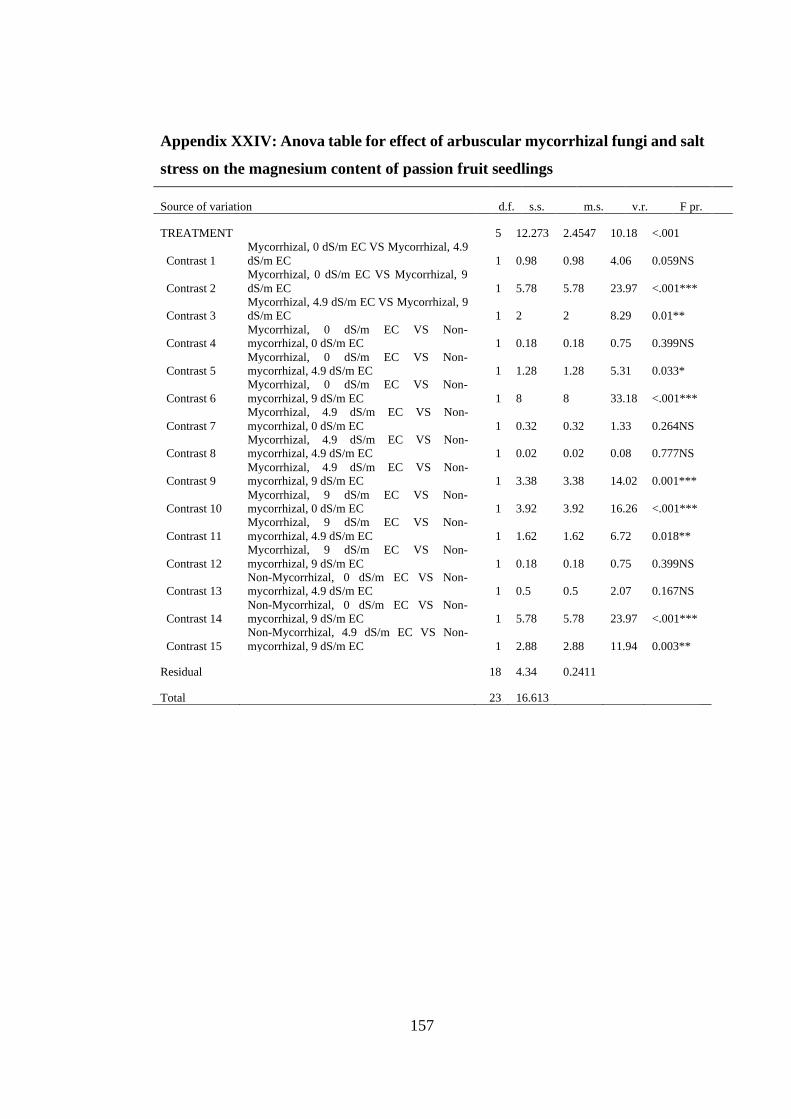
Appendix XXIV: Anova table for effect of arbuscular mycorrhizal fungi and salt
stress on the magnesium content of passion fruit seedlings ............. 157
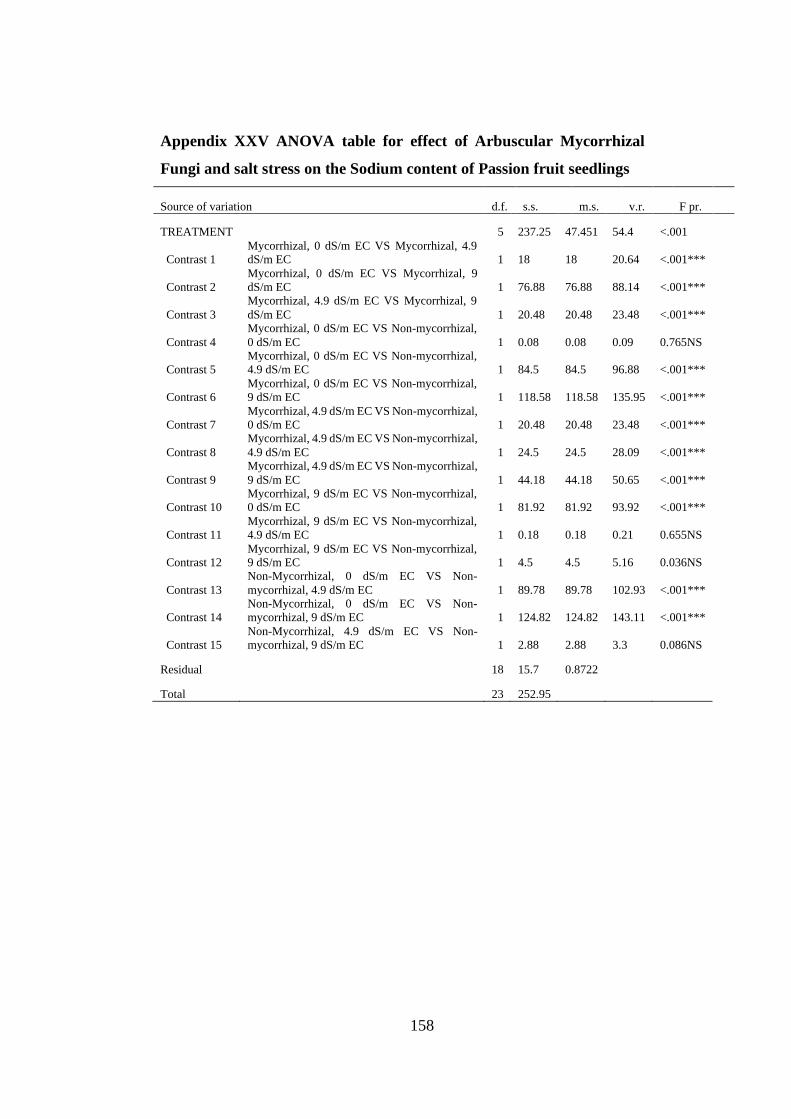
Appendix XXV: ANOVA table for effect of Arbuscular Mycorrhizal Fungi and salt
stress on the Sodium content of Passion fruit seedlings ................... 158
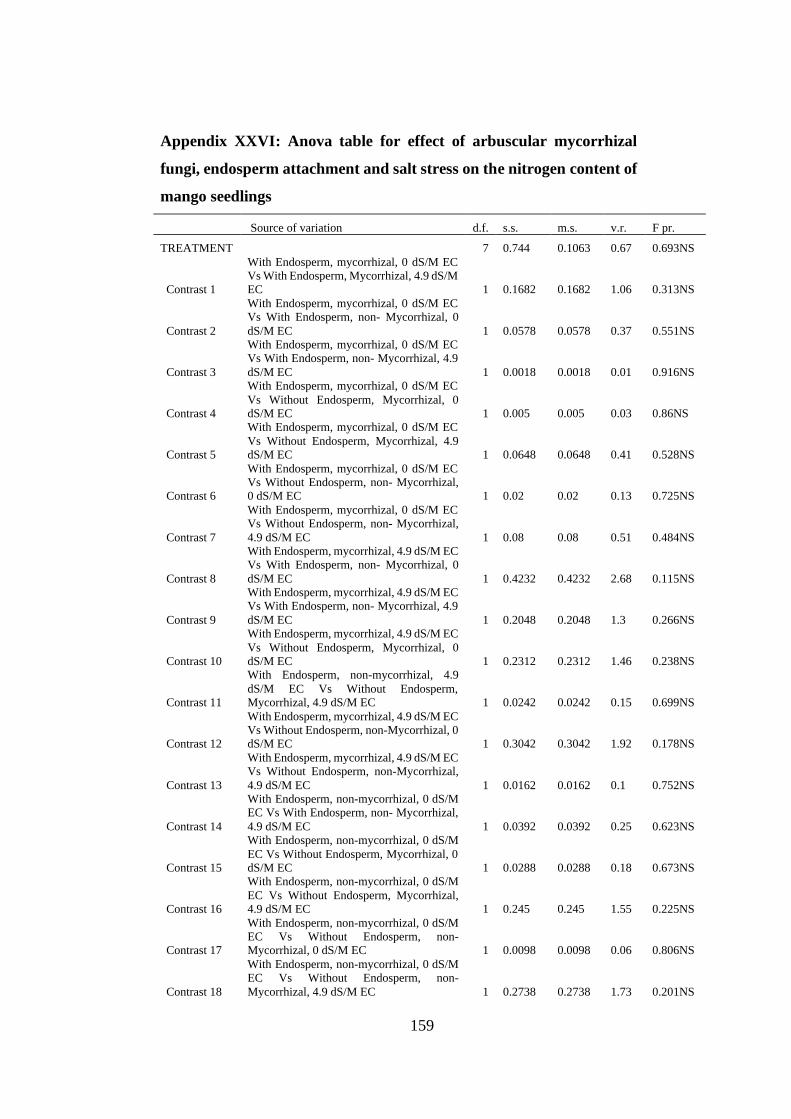
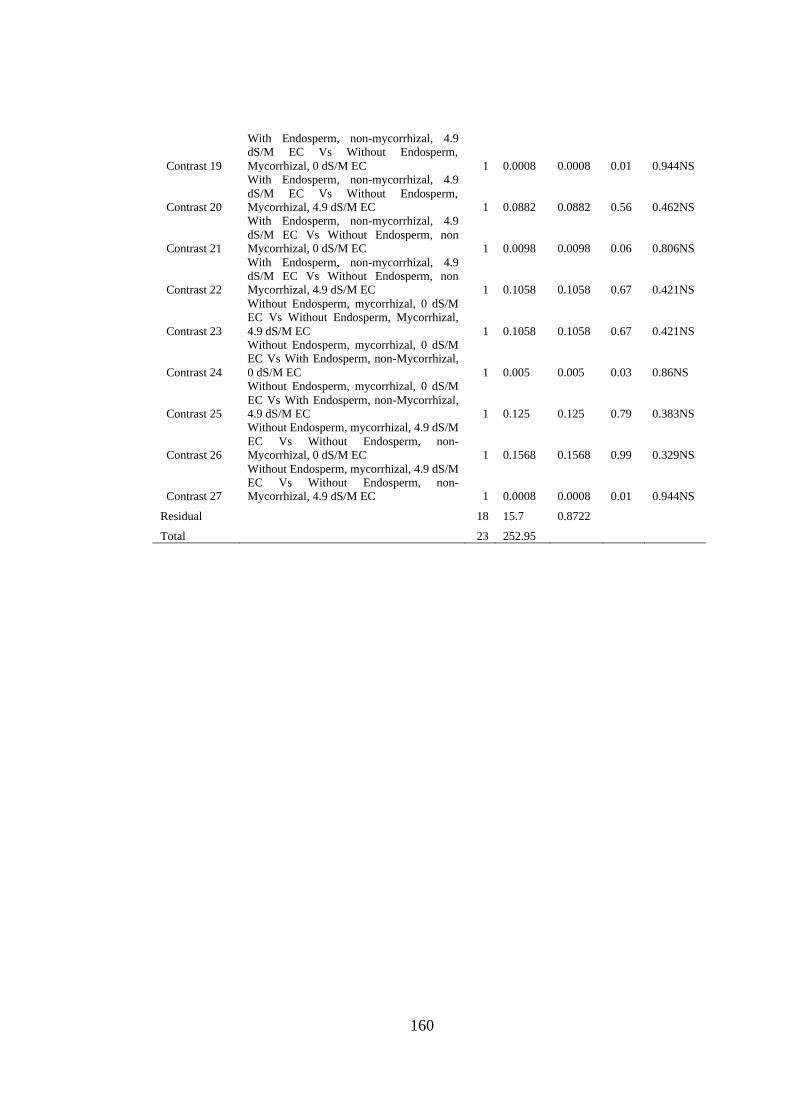
Appendix XXVI: Anova table for effect of arbuscular mycorrhizal fungi, endosperm
attachment and salt stress on the nitrogen content of mango seedlings
.......................................................................................................... 159
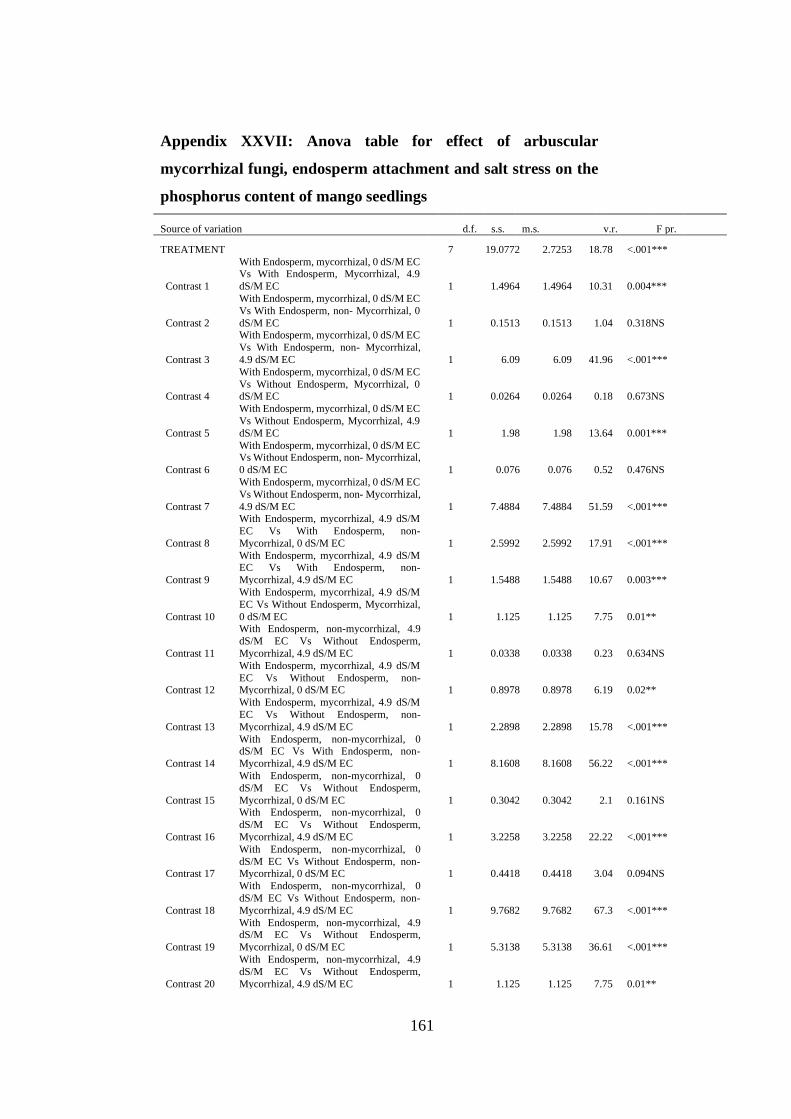
Appendix XXVII: Anova table for effect of arbuscular mycorrhizal fungi, endosperm
attachment and salt stress on the phosphorus content of mango
seedlings ........................................................................................... 161
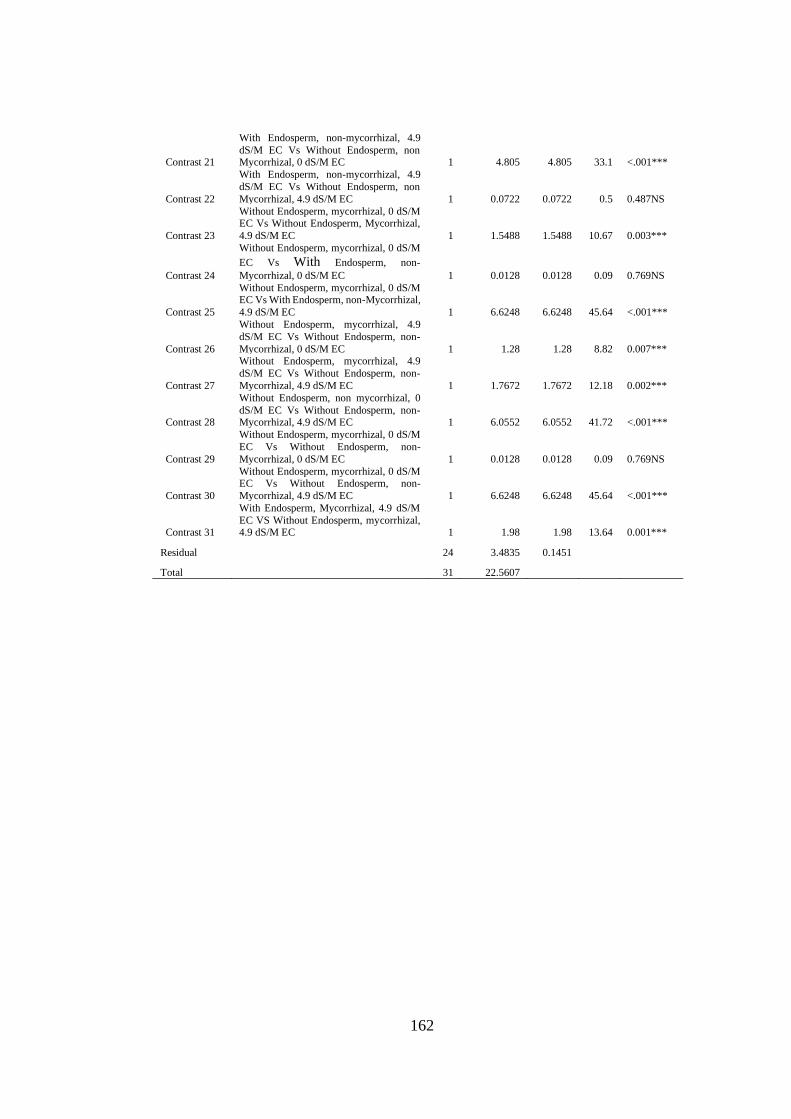
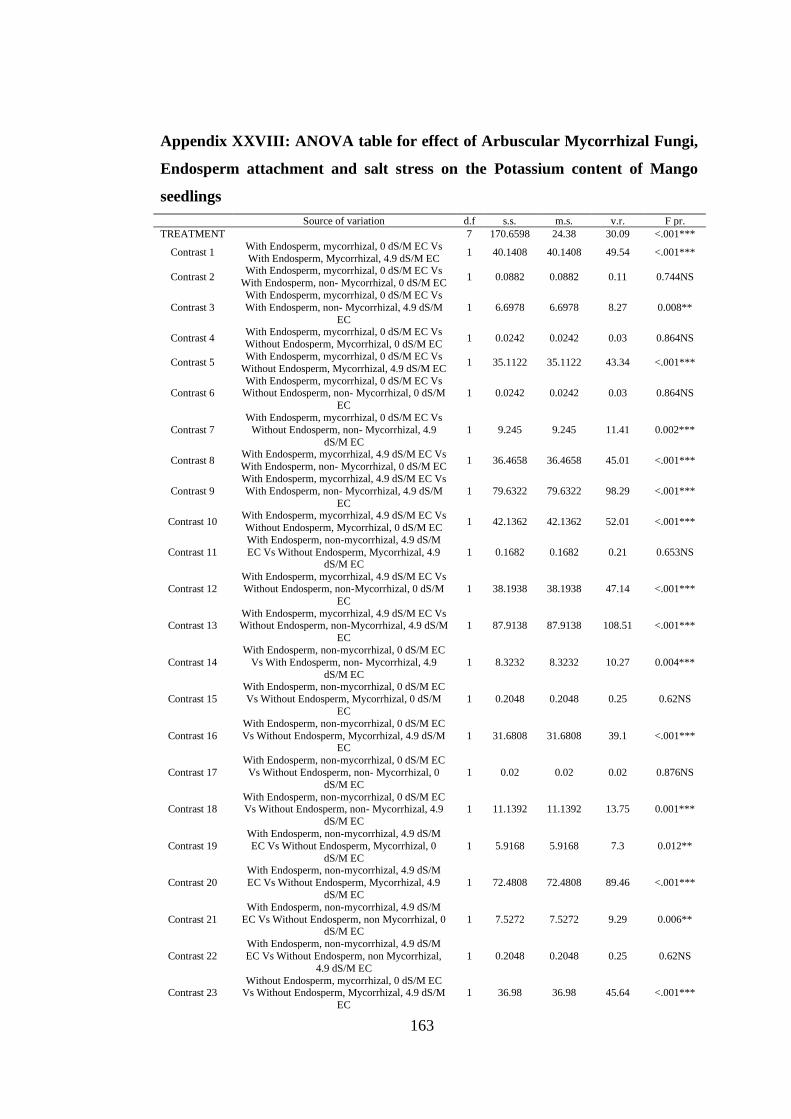
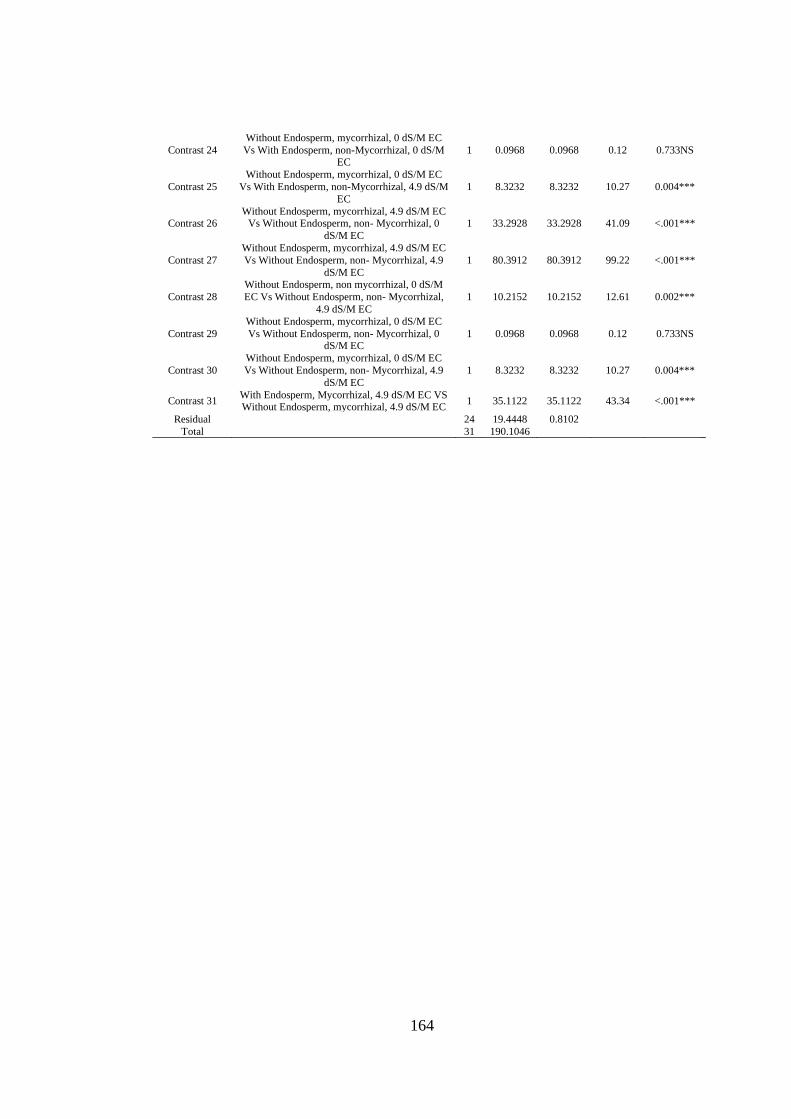
Appendix XXVIII: ANOVA table for effect of Arbuscular Mycorrhizal Fungi,
Endosperm attachment and salt stress on the Potassium content of
Mango seedlings ............................................................................... 163
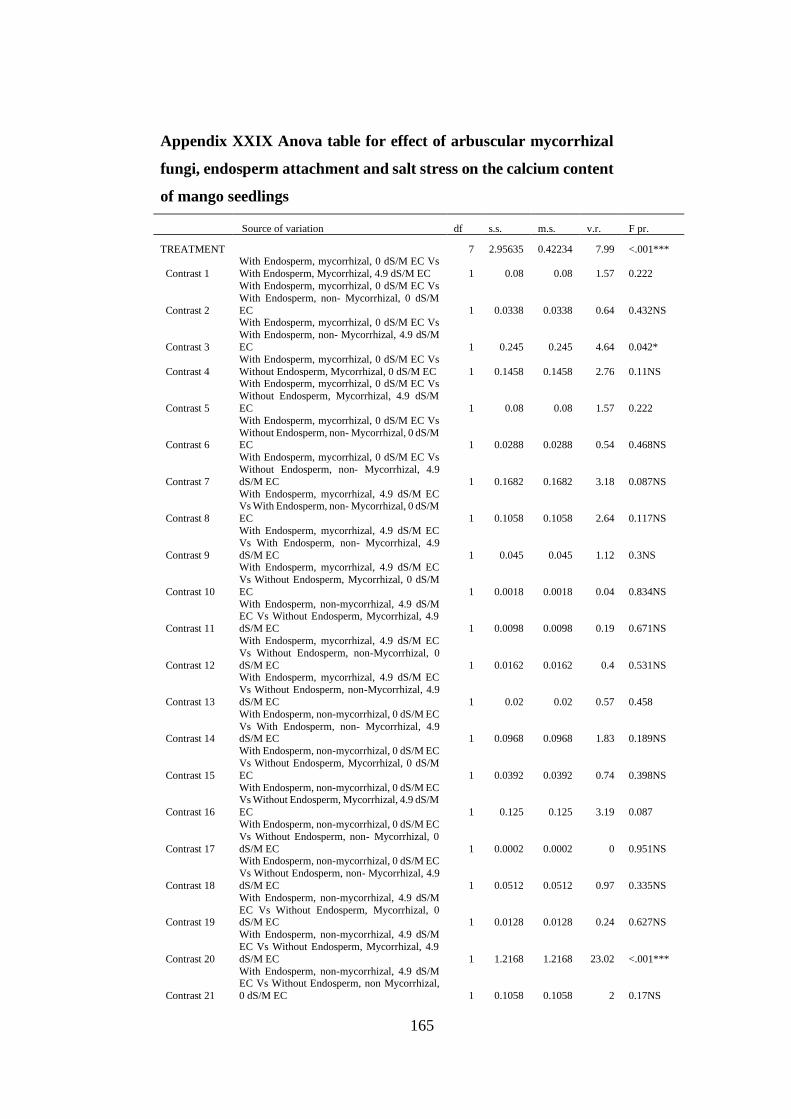
Appendix XXIX: Anova table for effect of arbuscular mycorrhizal fungi, endosperm
attachment and salt stress on the calcium content of mango seedlings
.......................................................................................................... 165
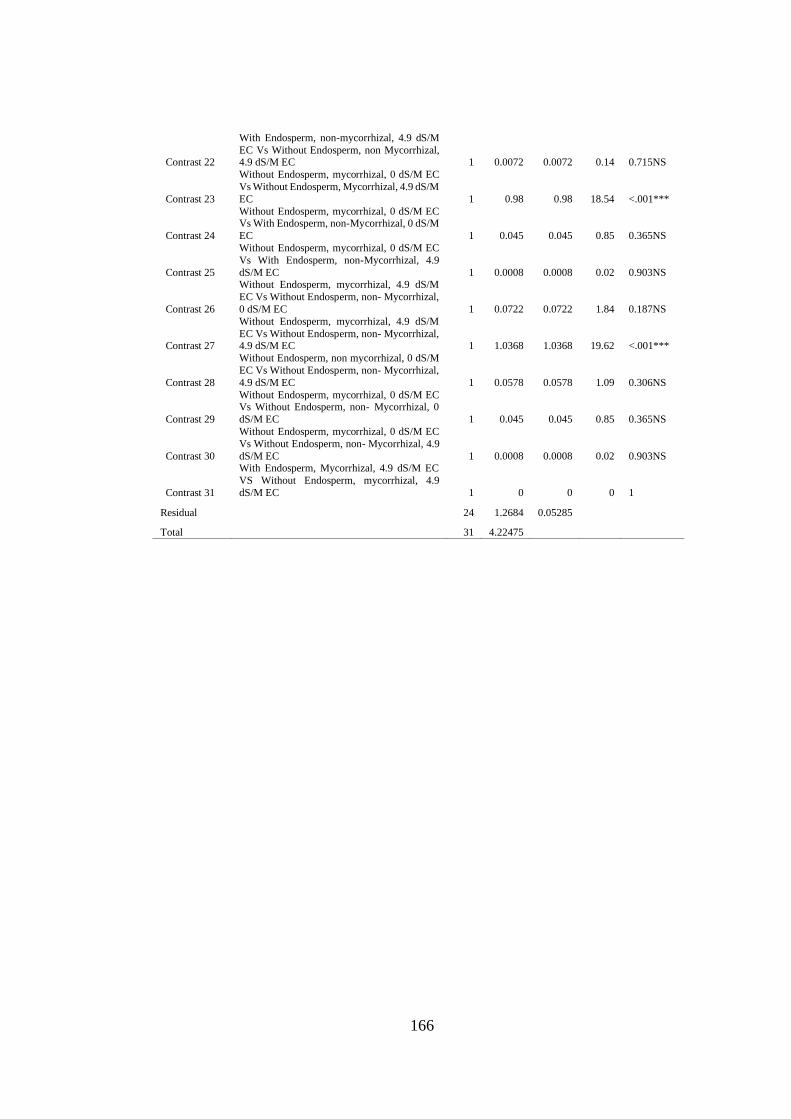
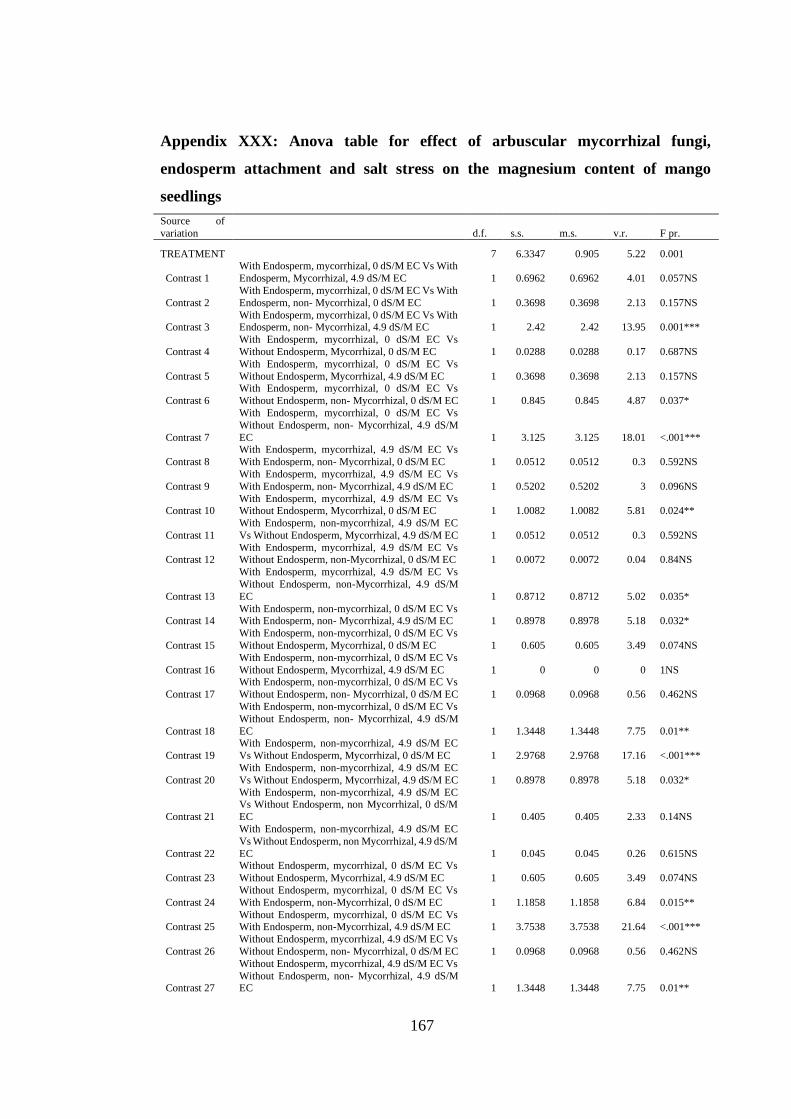
Appendix XXX: Anova table for effect of arbuscular mycorrhizal fungi, endosperm
attachment and salt stress on the magnesium content of mango
seedlings ........................................................................................... 167
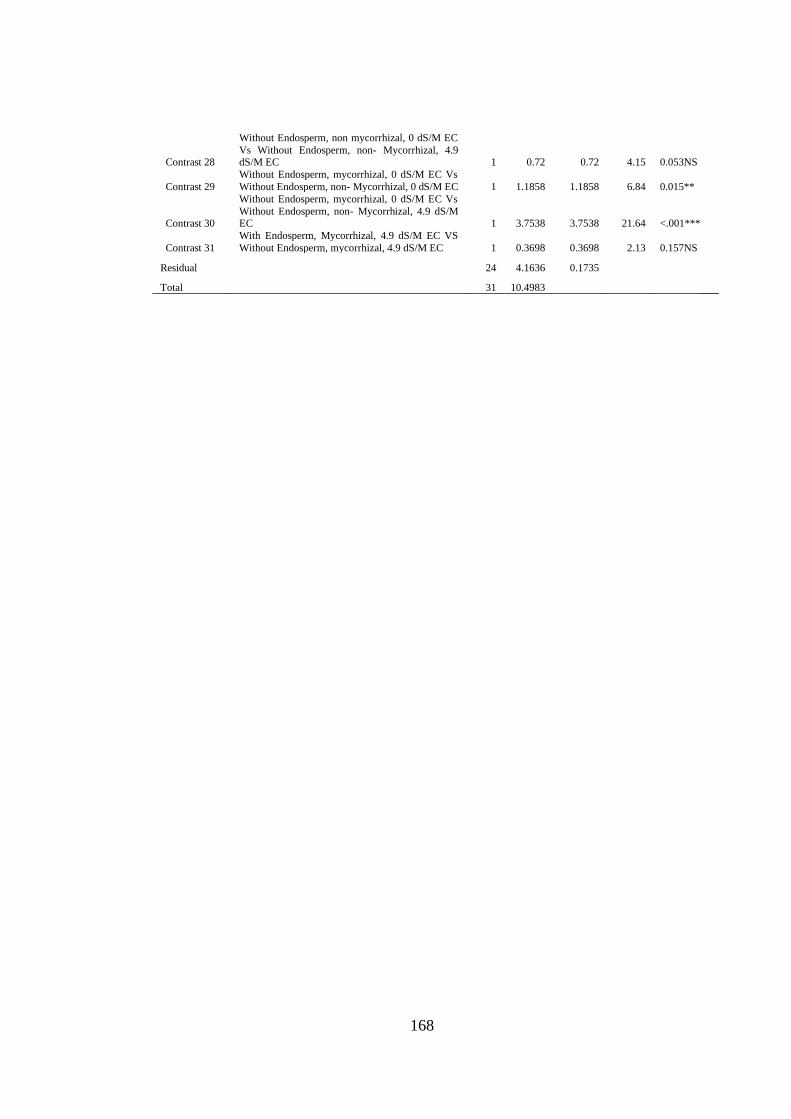
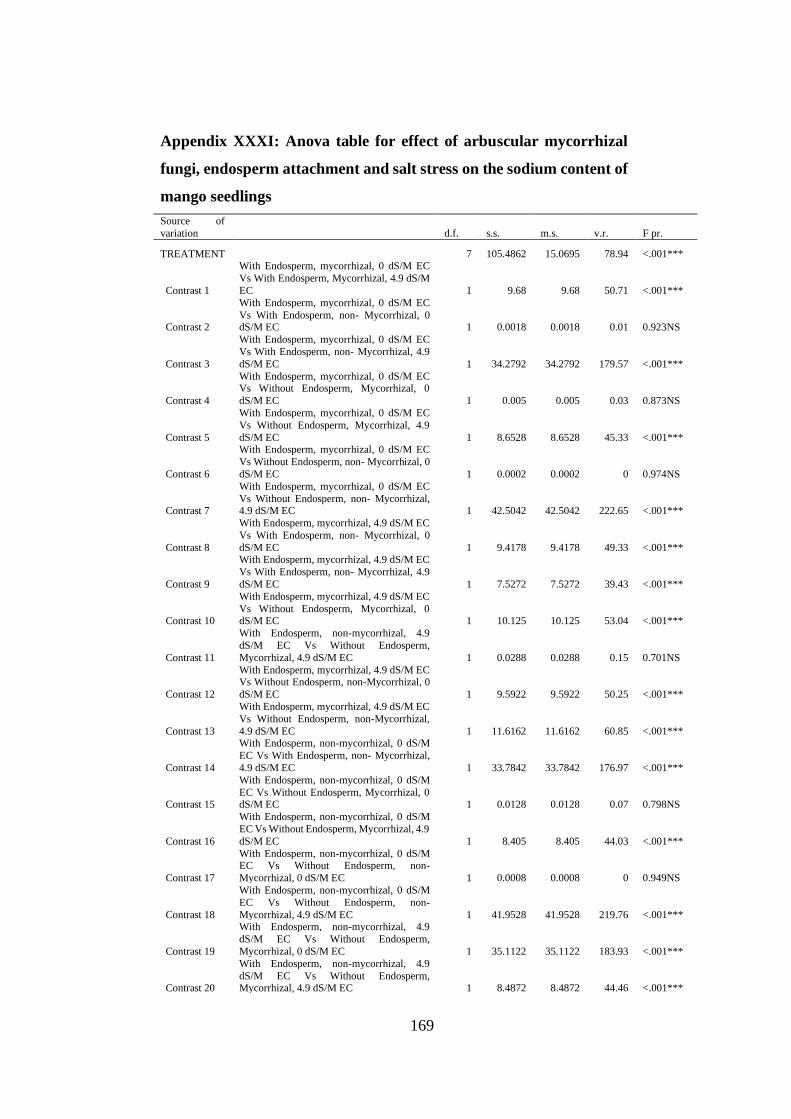
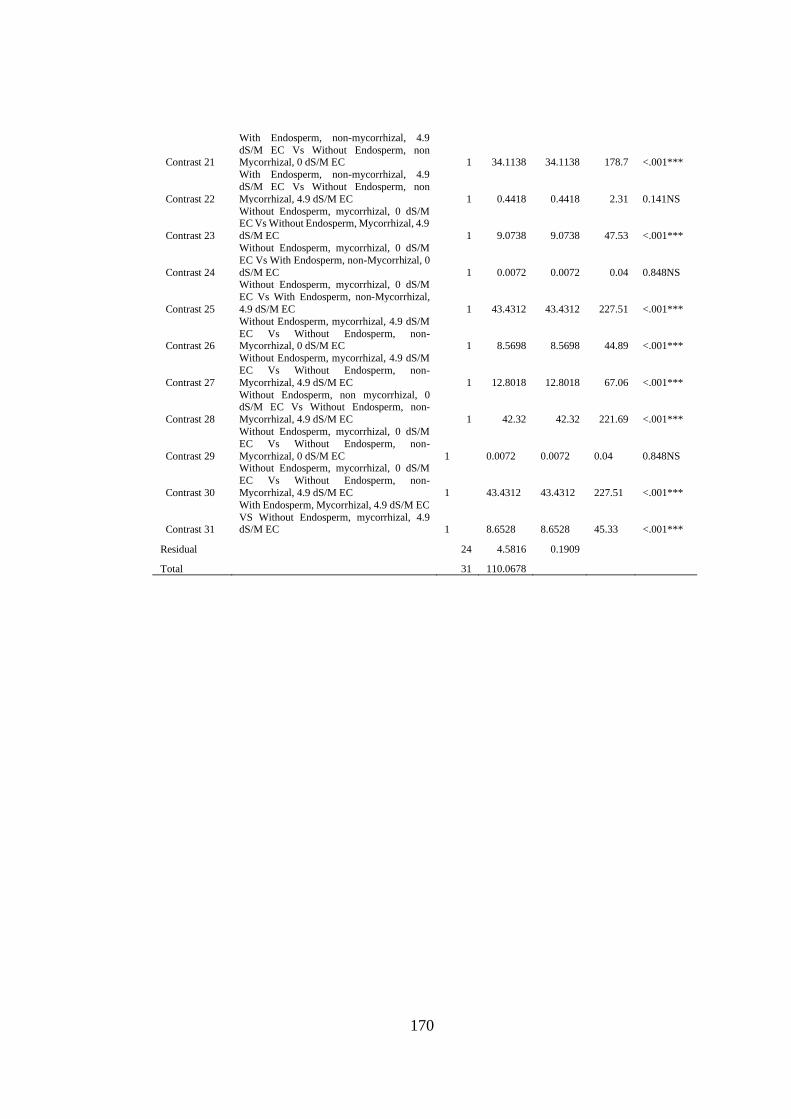
Appendix XXXI: Anova table for effect of arbuscular mycorrhizal fungi, endosperm
attachment and salt stress on the sodium content of mango seedlings
.......................................................................................................... 169
Page 21
xx
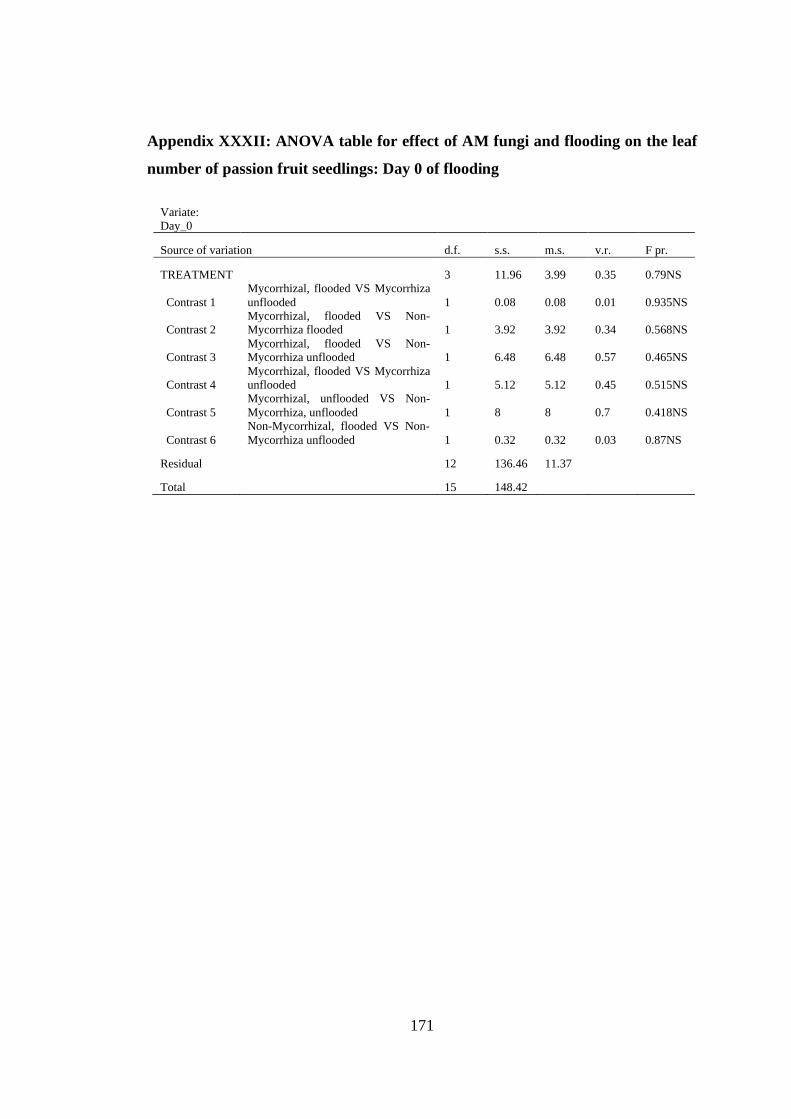
Appendix XXXII: ANOVA table for effect of AM fungi and flooding on the leaf
number of passion fruit seedlings: Day 0 of flooding ...................... 171
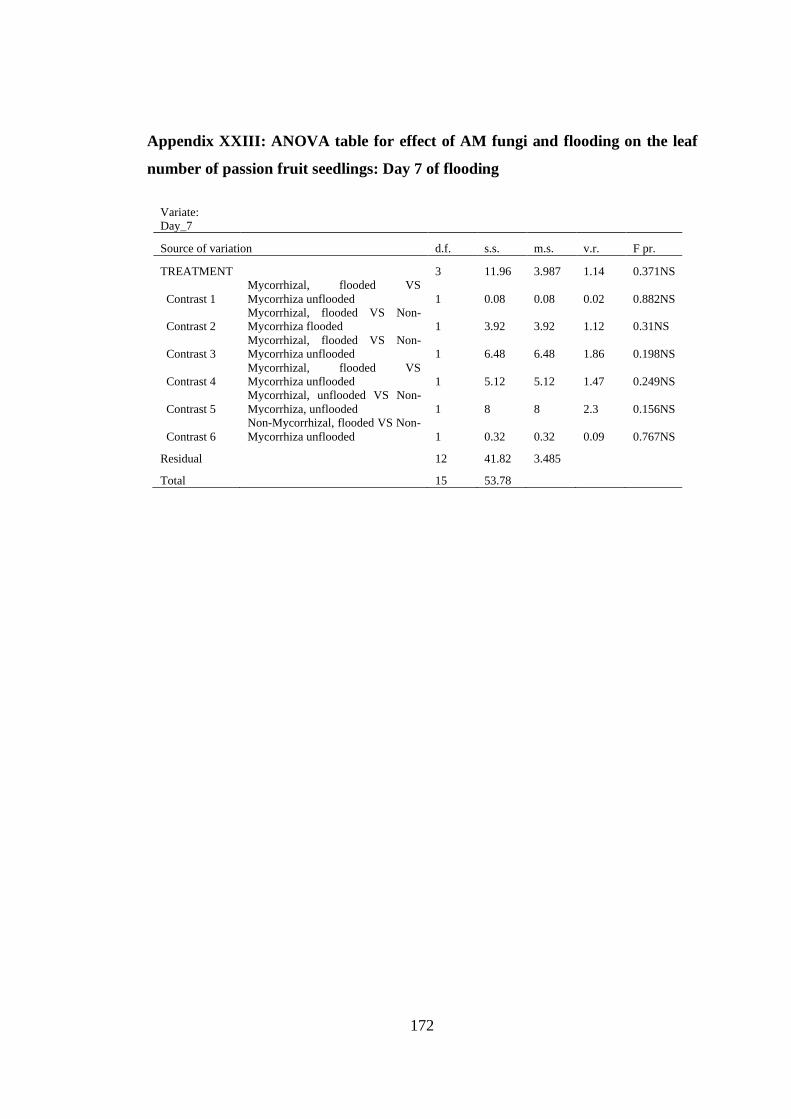
Appendix XXIII: ANOVA table for effect of AM fungi and flooding on the leaf
number of passion fruit seedlings: Day 7 of flooding ...................... 172
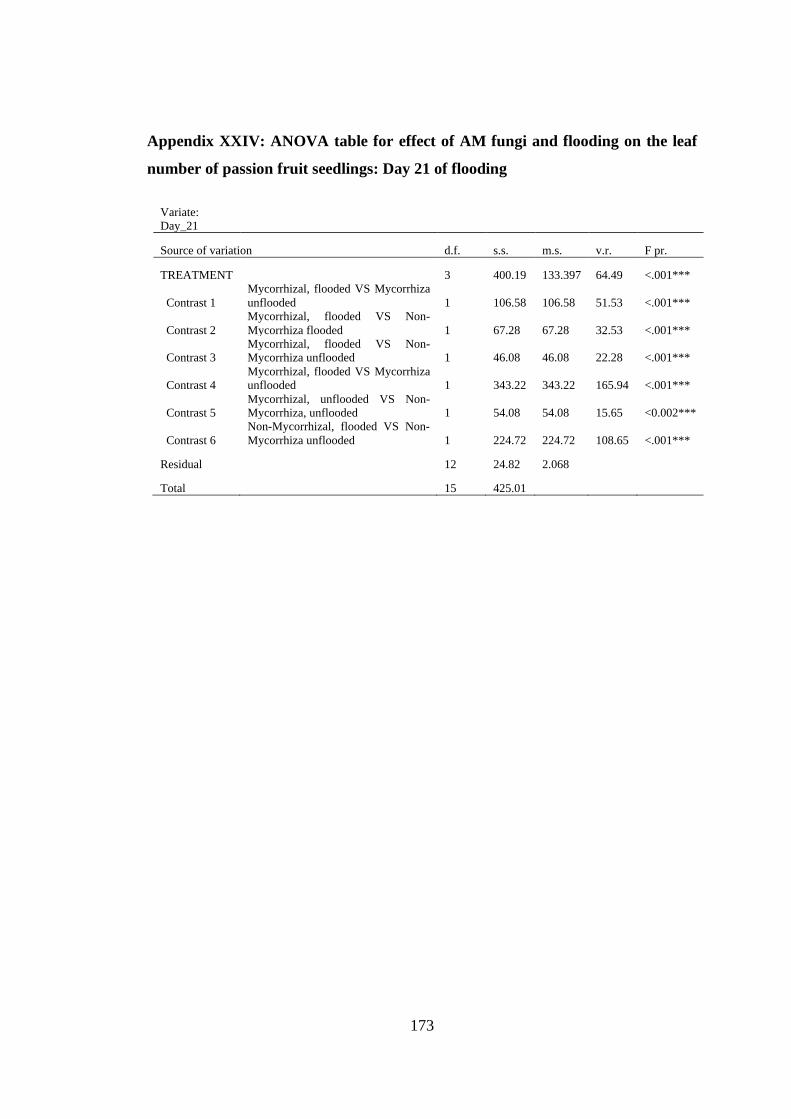
Appendix XXIV: ANOVA table for effect of AM fungi and flooding on the leaf
number of passion fruit seedlings: Day 21 of flooding .................... 173
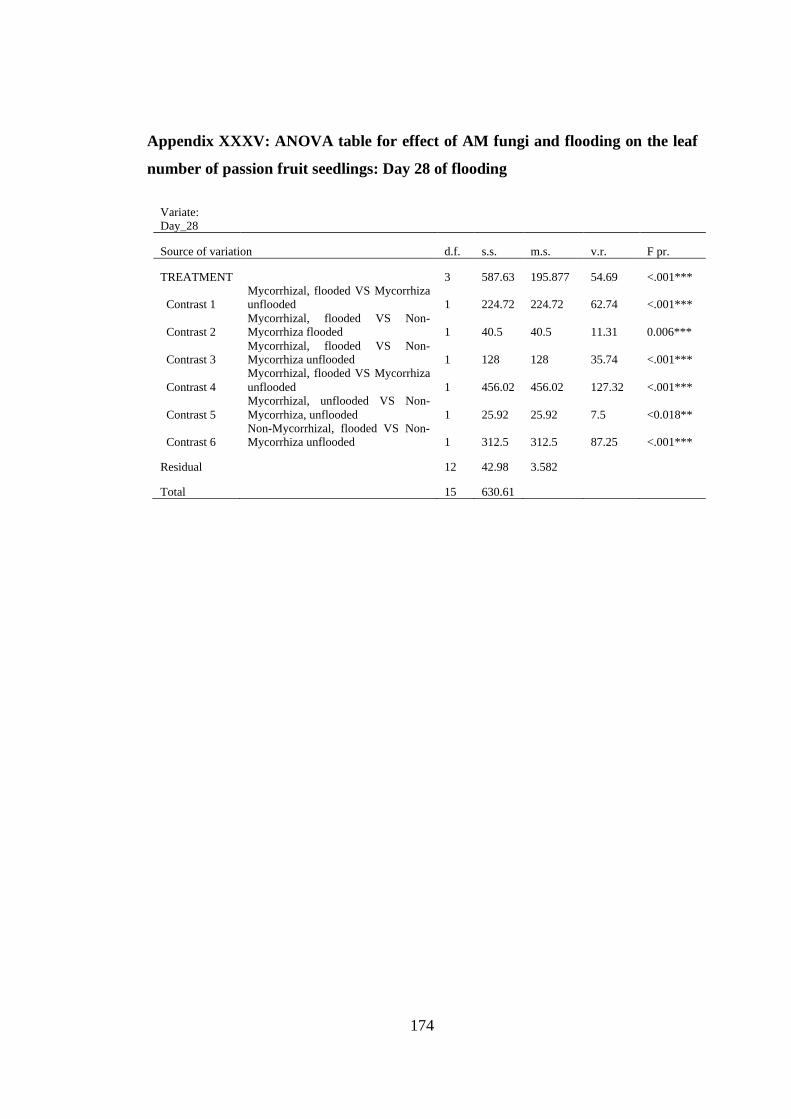
Appendix XXXV: ANOVA table for effect of AM fungi and flooding on the leaf
number of passion fruit seedlings: Day 28 of flooding .................... 174
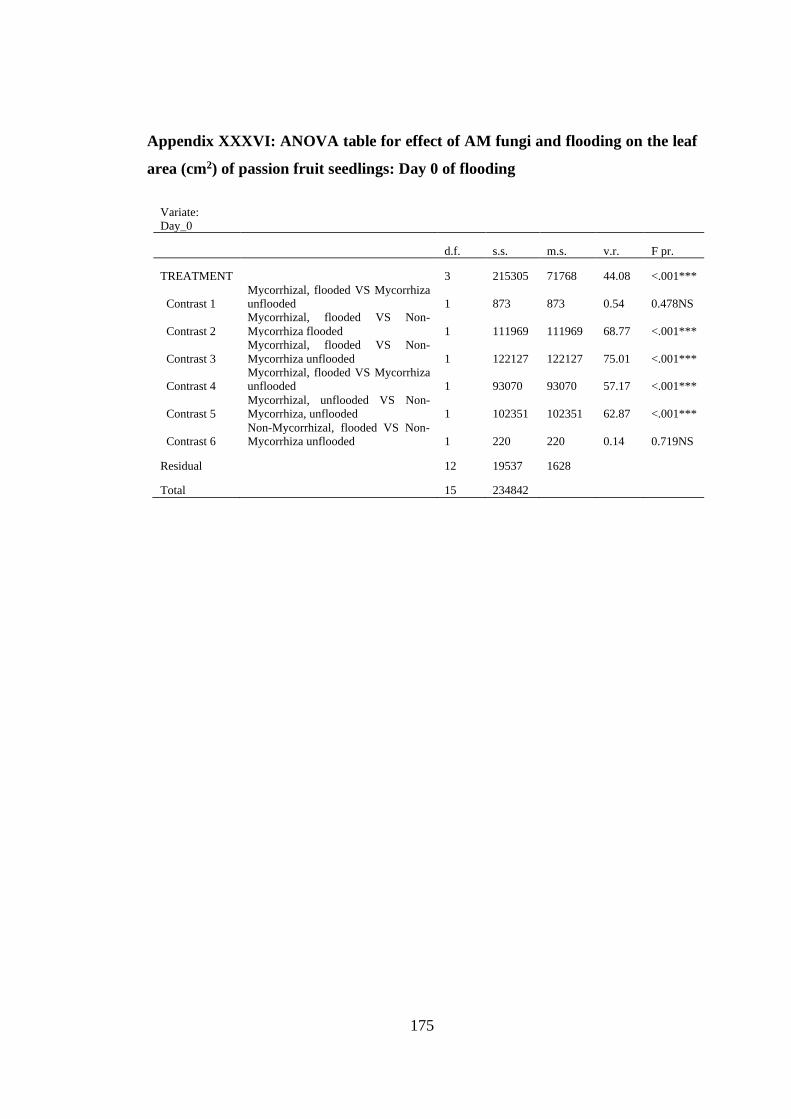
Appendix XXXVI: ANOVA table for effect of AM fungi and flooding on the leaf
area (cm2) of passion fruit seedlings: Day 0 of flooding .................. 175
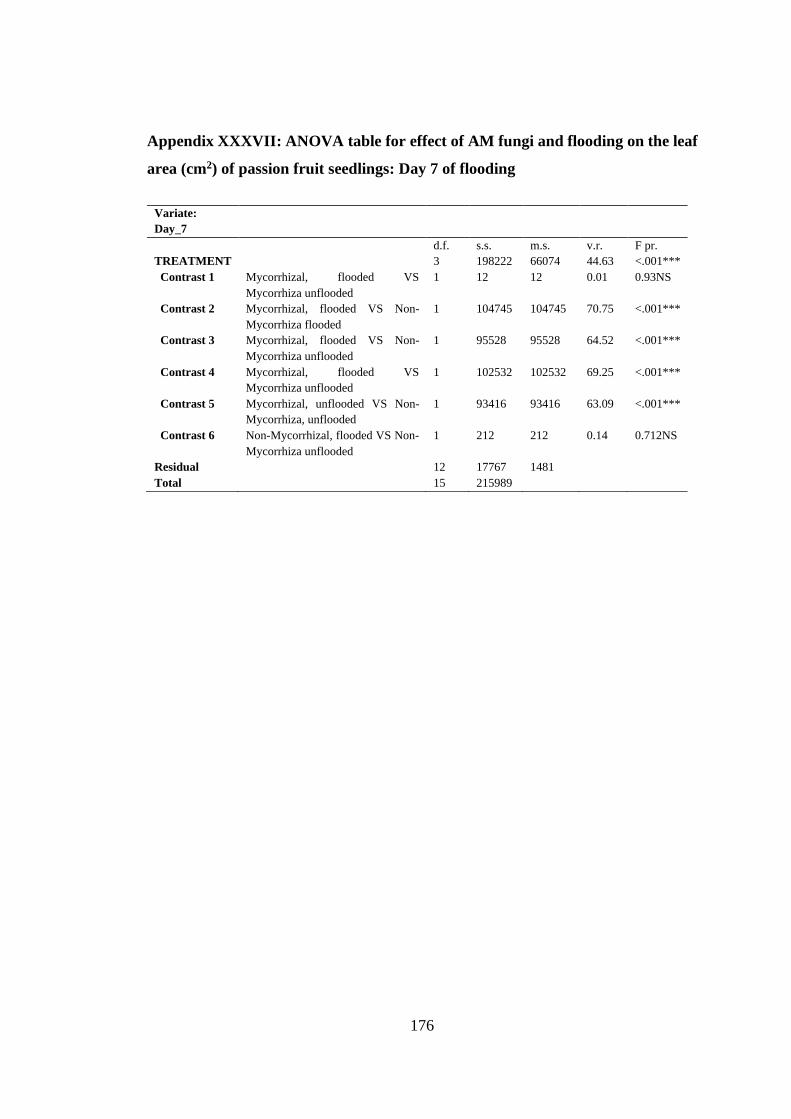
Appendix XXXVII: ANOVA table for effect of AM fungi and flooding on the leaf
area (cm2) of passion fruit seedlings: Day 7 of flooding .................. 176
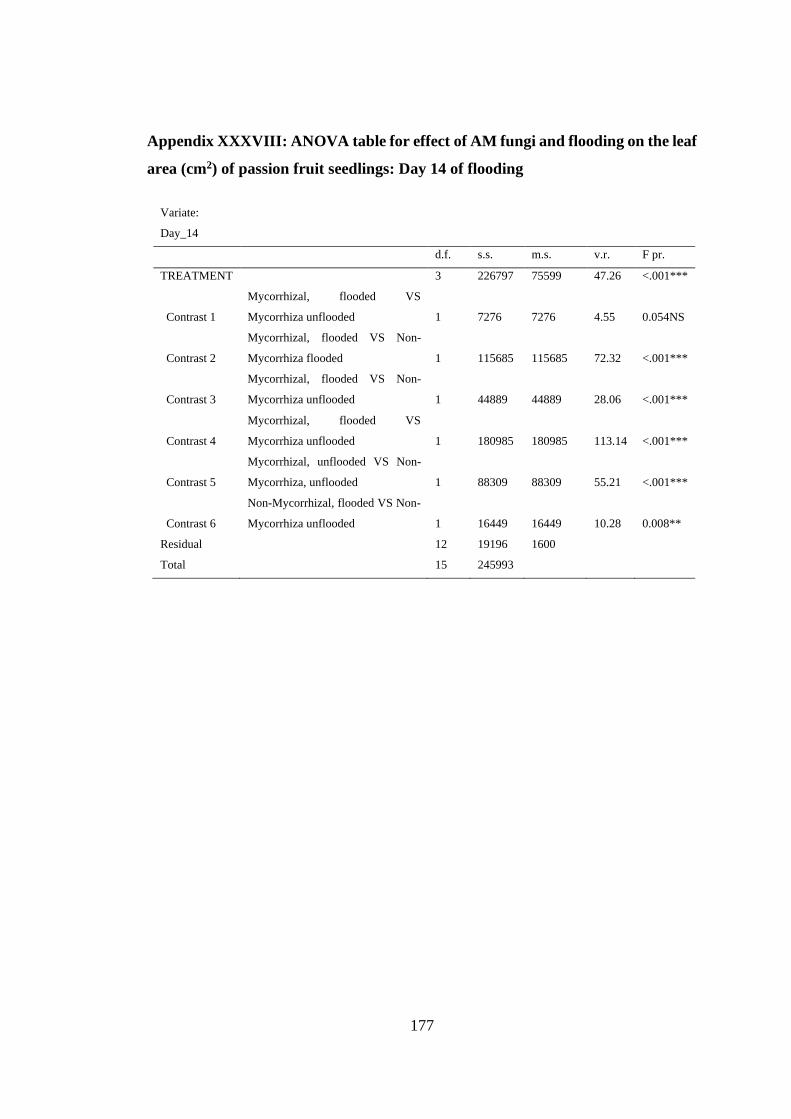
Appendix XXXVIII: ANOVA table for effect of AM fungi and flooding on the leaf
area (cm2) of passion fruit seedlings: Day 14 of flooding ................ 177
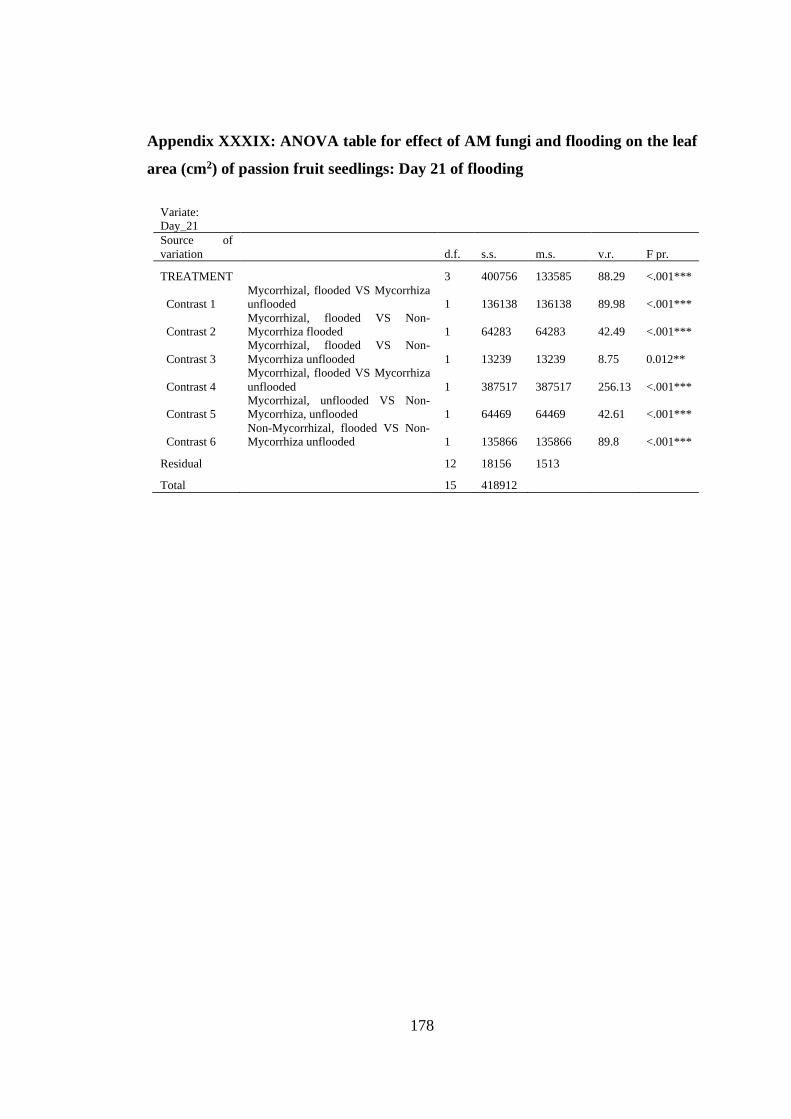
Appendix XXXIX: ANOVA table for effect of AM fungi and flooding on the leaf
area (cm2) of passion fruit seedlings: Day 21 of flooding ................ 178
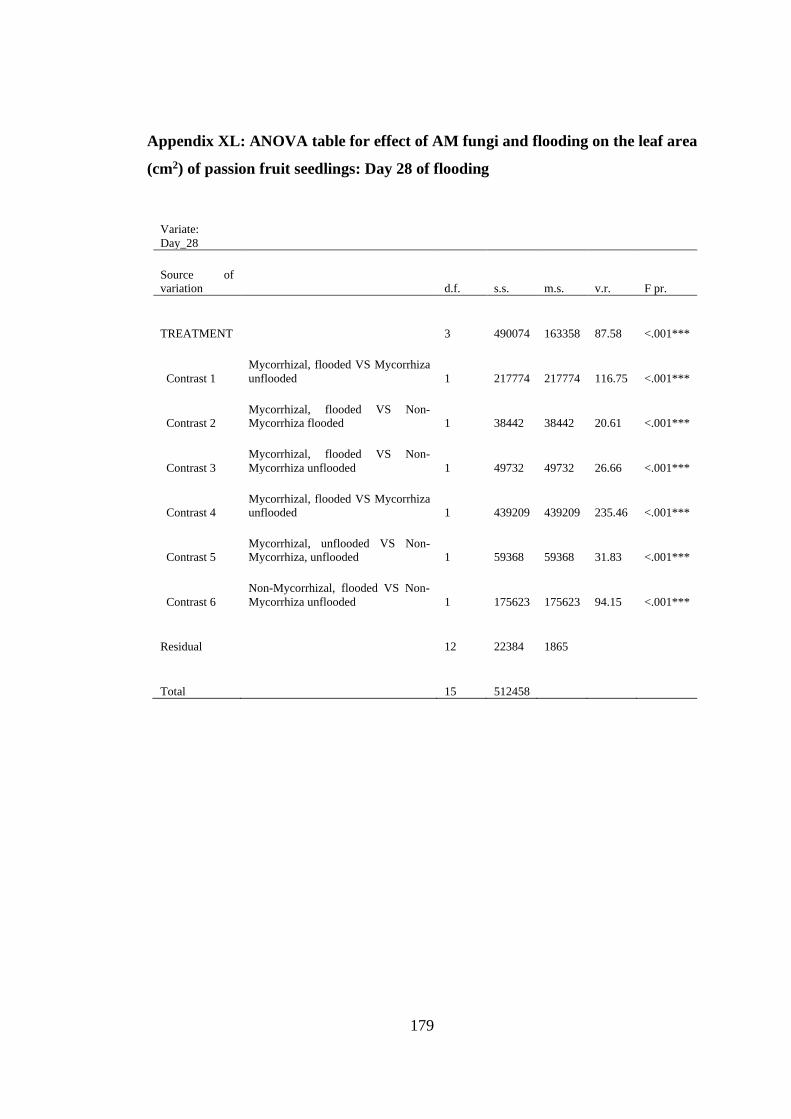
Appendix XL: ANOVA table for effect of AM fungi and flooding on the leaf area
(cm2) of passion fruit seedlings: Day 28 of flooding ....................... 179
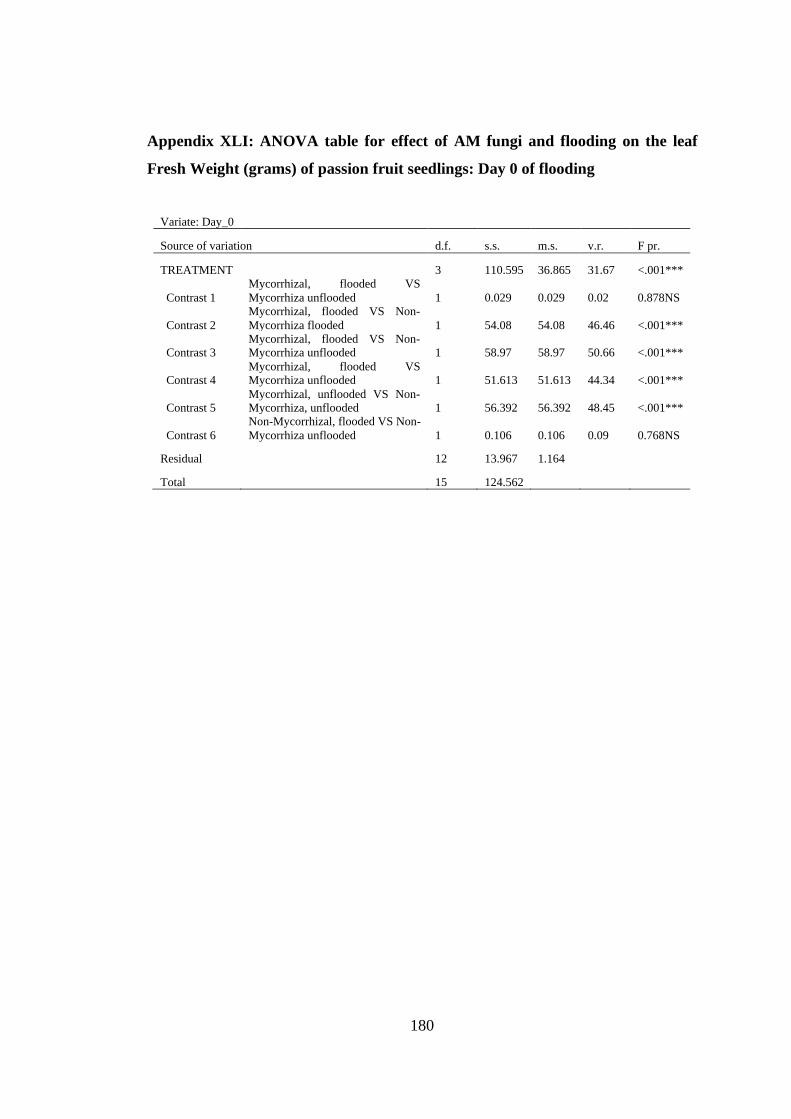
Appendix XLI: ANOVA table for effect of AM fungi and flooding on the leaf Fresh
Weight (grams) of passion fruit seedlings: Day 0 of flooding ......... 180
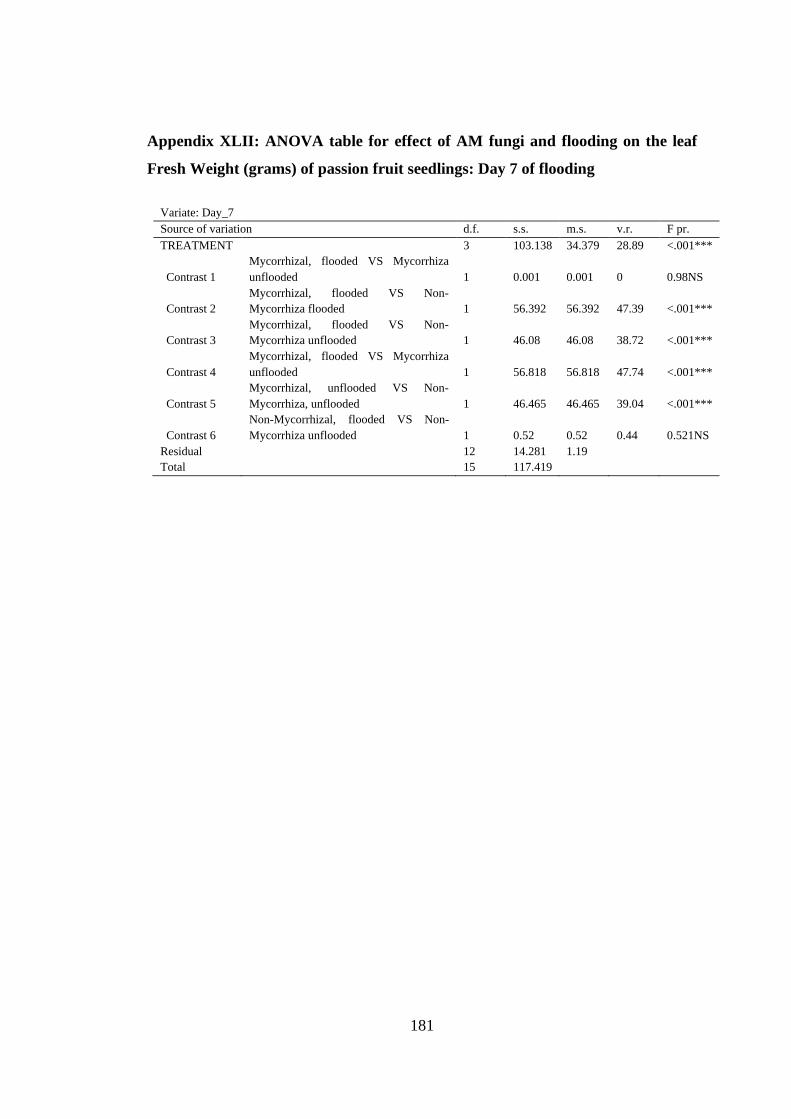
Appendix XLII: ANOVA table for effect of AM fungi and flooding on the leaf Fresh
Weight (grams) of passion fruit seedlings: Day 7 of flooding ......... 181
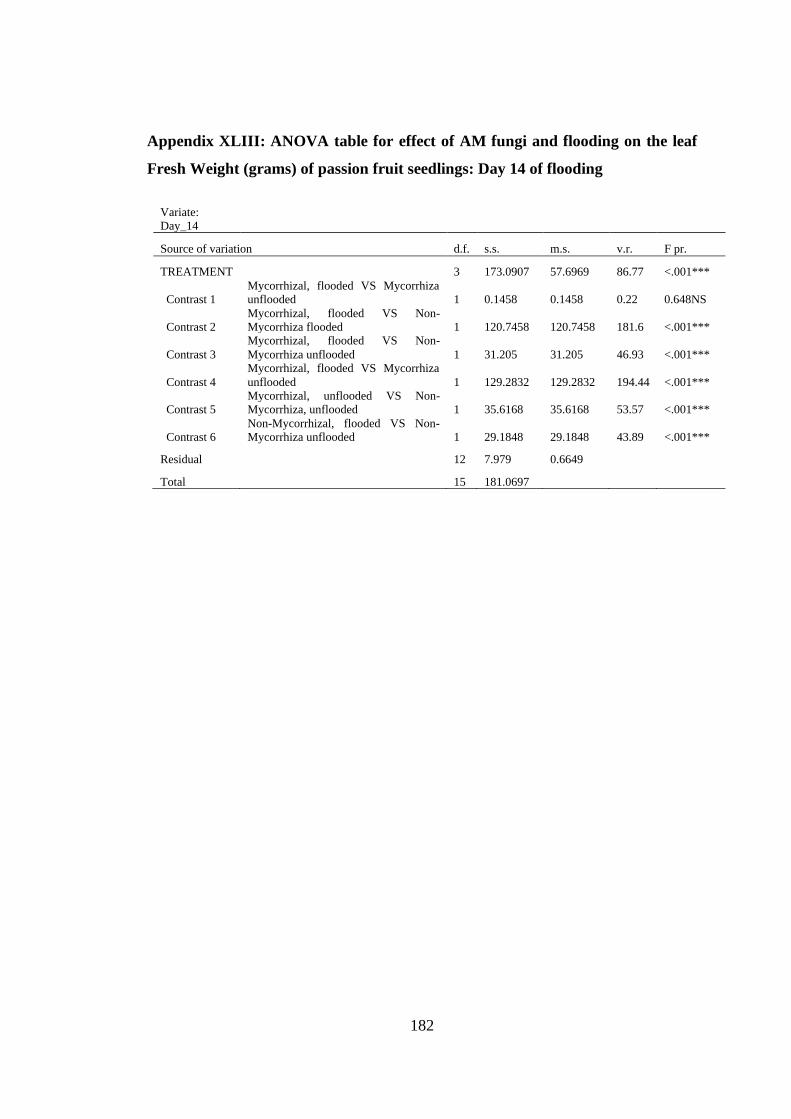
Appendix XLIII: ANOVA table for effect of AM fungi and flooding on the leaf Fresh
Weight (grams) of passion fruit seedlings: Day 14 of flooding ....... 182
Page 22
xxi
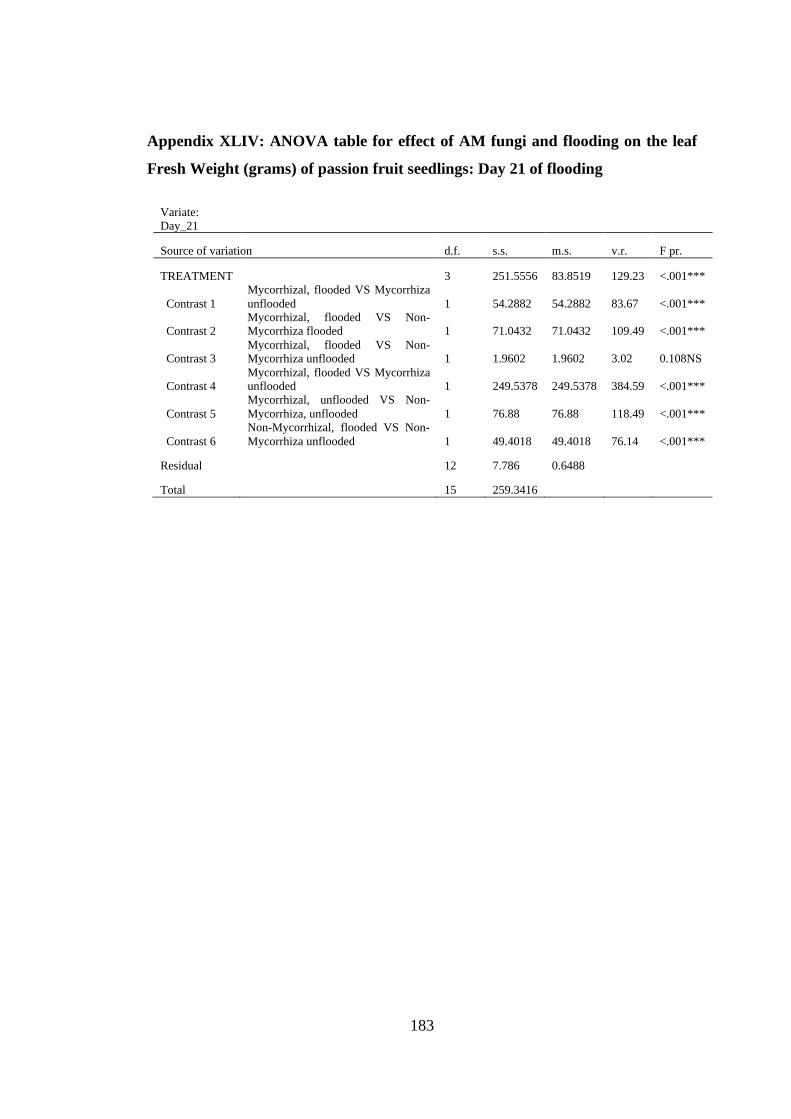
Appendix XLIV: ANOVA table for effect of AM fungi and flooding on the leaf Fresh
Weight (grams) of passion fruit seedlings: Day 21 of flooding ....... 183
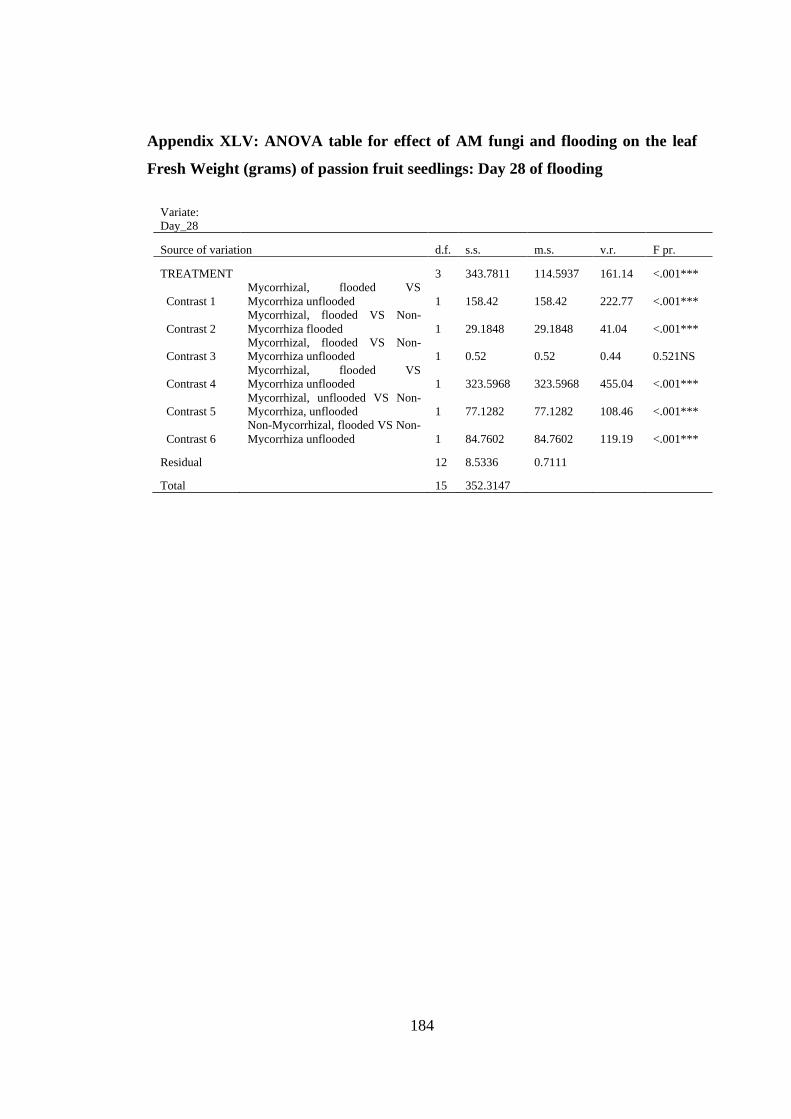
Appendix XLV: ANOVA table for effect of AM fungi and flooding on the leaf Fresh
Weight (grams) of passion fruit seedlings: Day 28 of flooding ....... 184
Appendix XLVI: ANOVA table for effect of AM fungi and flooding on the root Fresh
Weight (grams) of passion fruit seedlings: Day 0 of flooding ......... 185
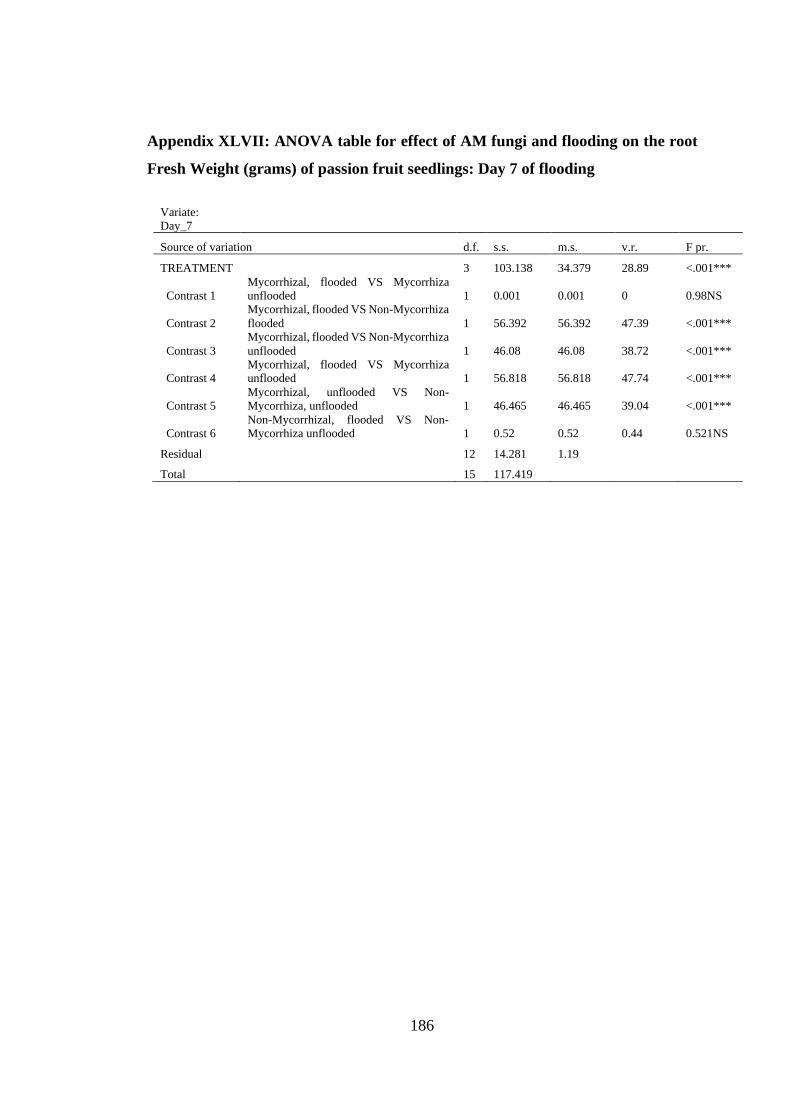
Appendix XLVII: ANOVA table for effect of AM fungi and flooding on the root
Fresh Weight (grams) of passion fruit seedlings: Day 7 of flooding 186
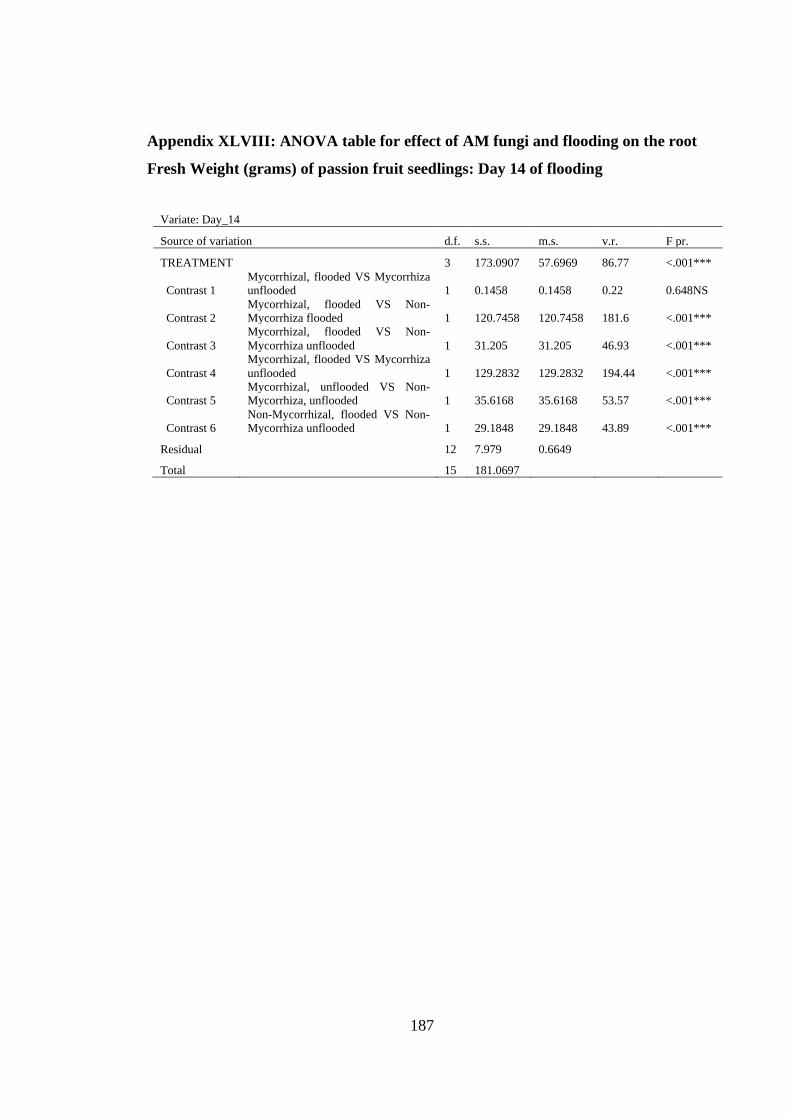
Appendix XLVIII: ANOVA table for effect of AM fungi and flooding on the root
Fresh Weight (grams) of passion fruit seedlings: Day 14 of flooding
.......................................................................................................... 187
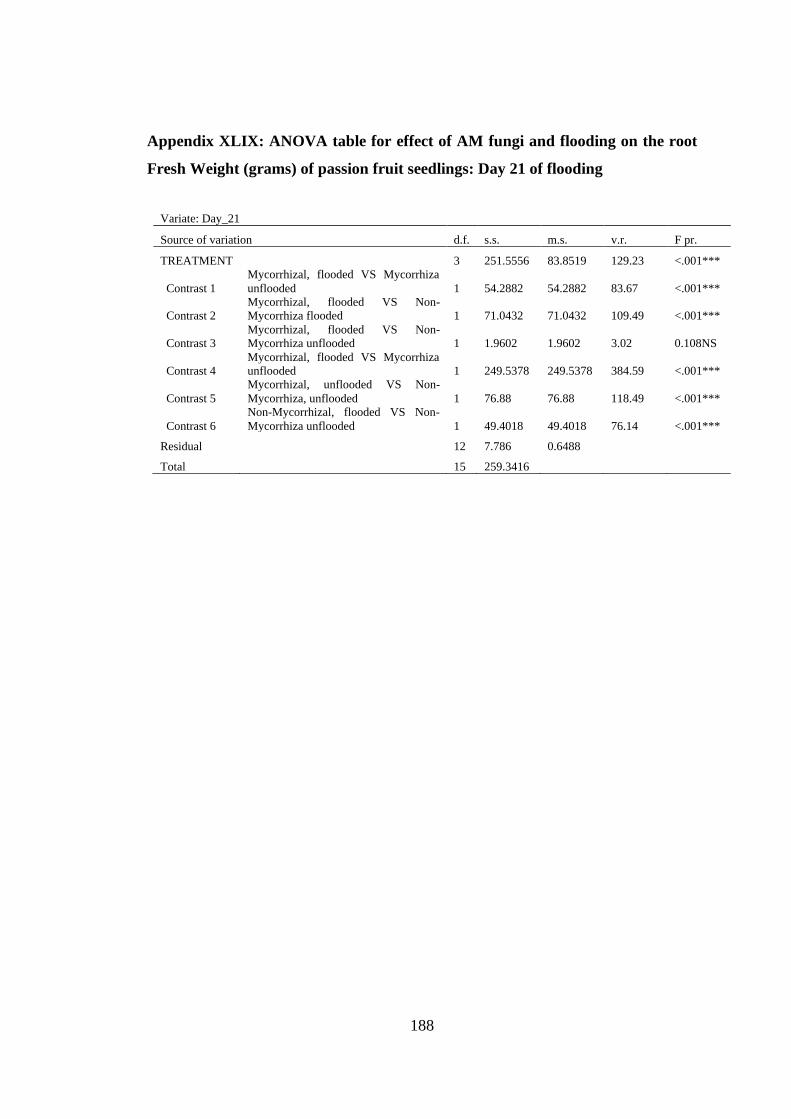
Appendix XLIX: ANOVA table for effect of AM fungi and flooding on the root Fresh
Weight (grams) of passion fruit seedlings: Day 21 of flooding ....... 188
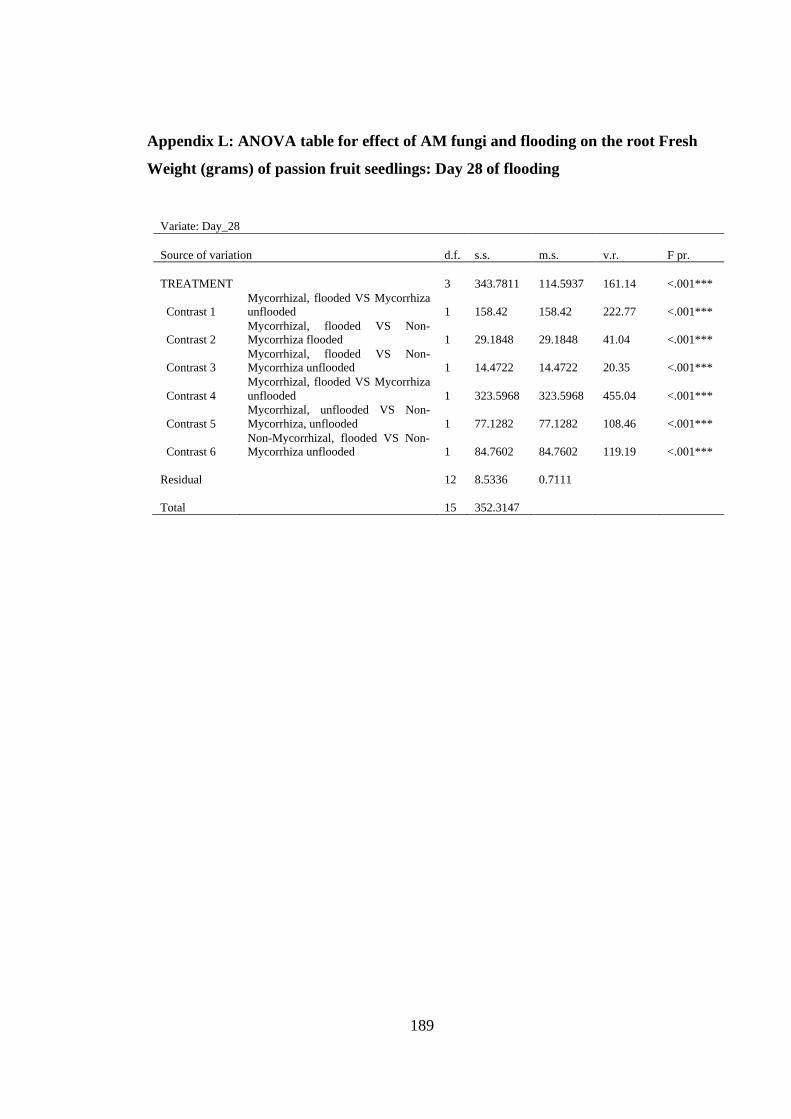
Appendix L: ANOVA table for effect of AM fungi and flooding on the root Fresh
Weight (grams) of passion fruit seedlings: Day 28 of flooding ....... 189
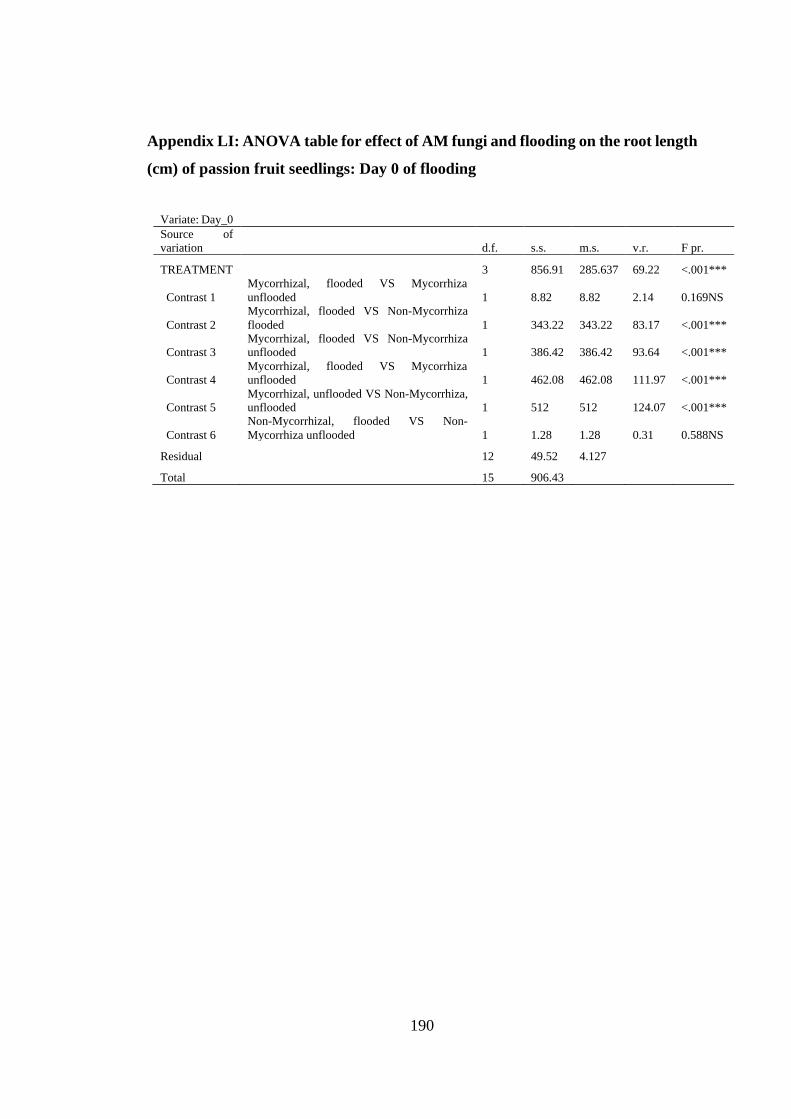
Appendix LI: ANOVA table for effect of AM fungi and flooding on the root length
(cm) of passion fruit seedlings: Day 0 of flooding ........................... 190
Appendix LII: ANOVA table for effect of AM fungi and flooding on the root length
(cm) of passion fruit seedlings: Day 7 of flooding ........................... 191
Appendix LII: ANOVA table for effect of AM fungi and flooding on the root length
(cm) of passion fruit seedlings: Day 14 of flooding ......................... 192
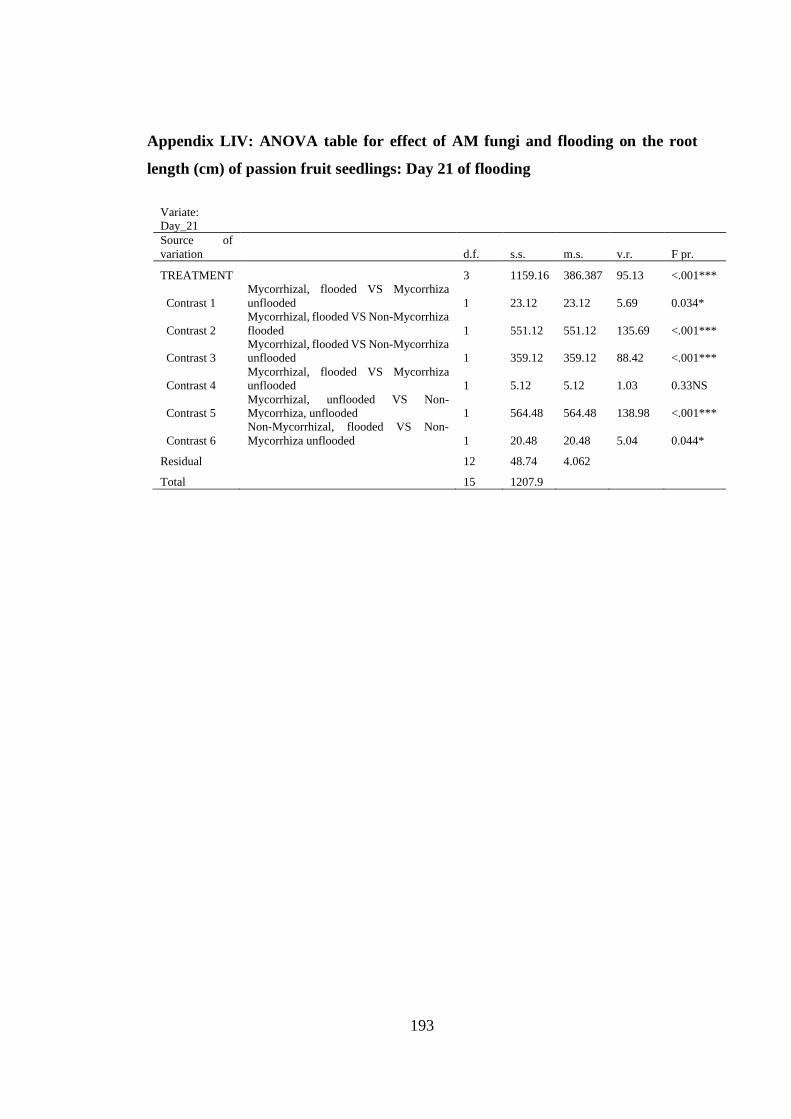
Appendix LIV: ANOVA table for effect of AM fungi and flooding on the root length
(cm) of passion fruit seedlings: Day 21 of flooding ......................... 193
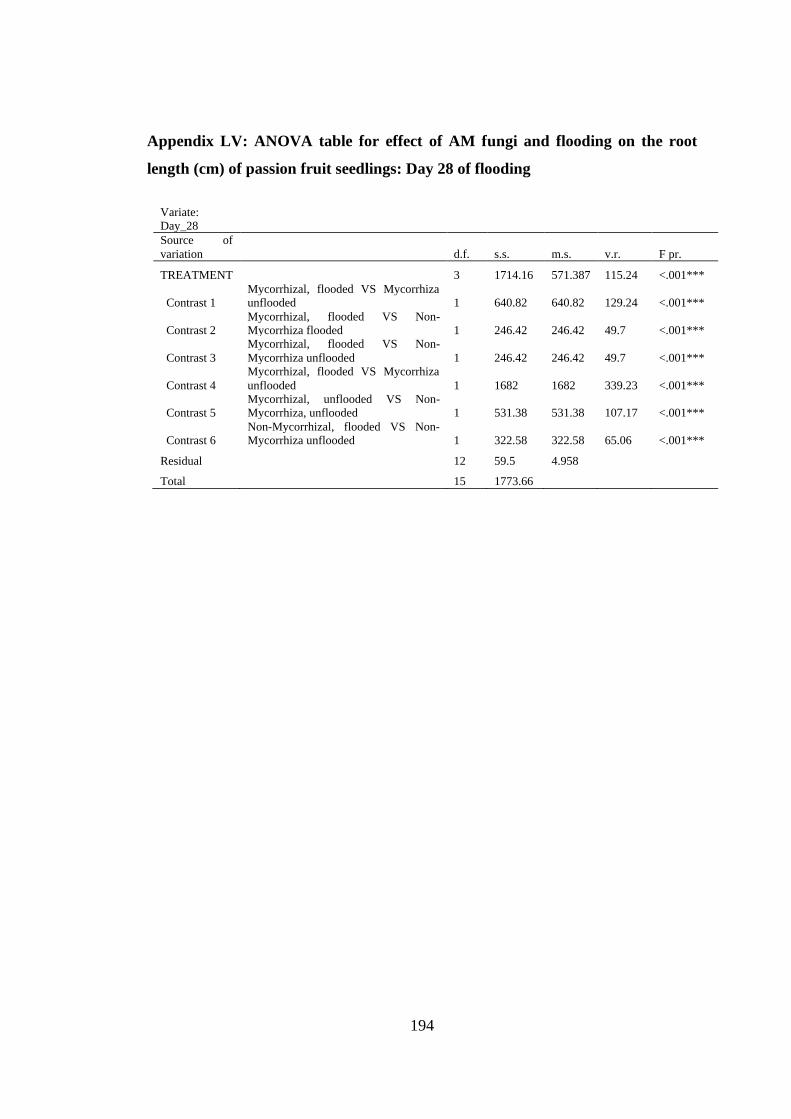
Appendix LV: ANOVA table for effect of AM fungi and flooding on the root length
(cm) of passion fruit seedlings: Day 28 of flooding ......................... 194
Page 23
xxii
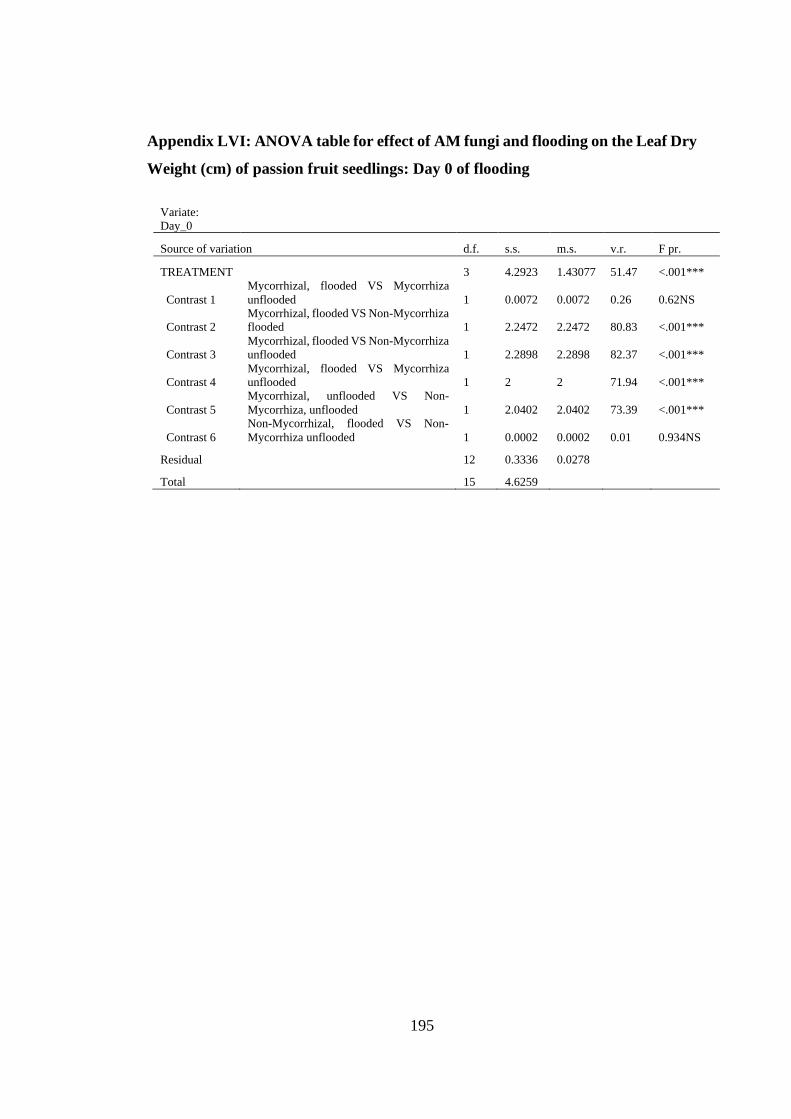
Appendix LVI: ANOVA table for effect of AM fungi and flooding on the Leaf Dry
Weight (cm) of passion fruit seedlings: Day 0 of flooding .............. 195
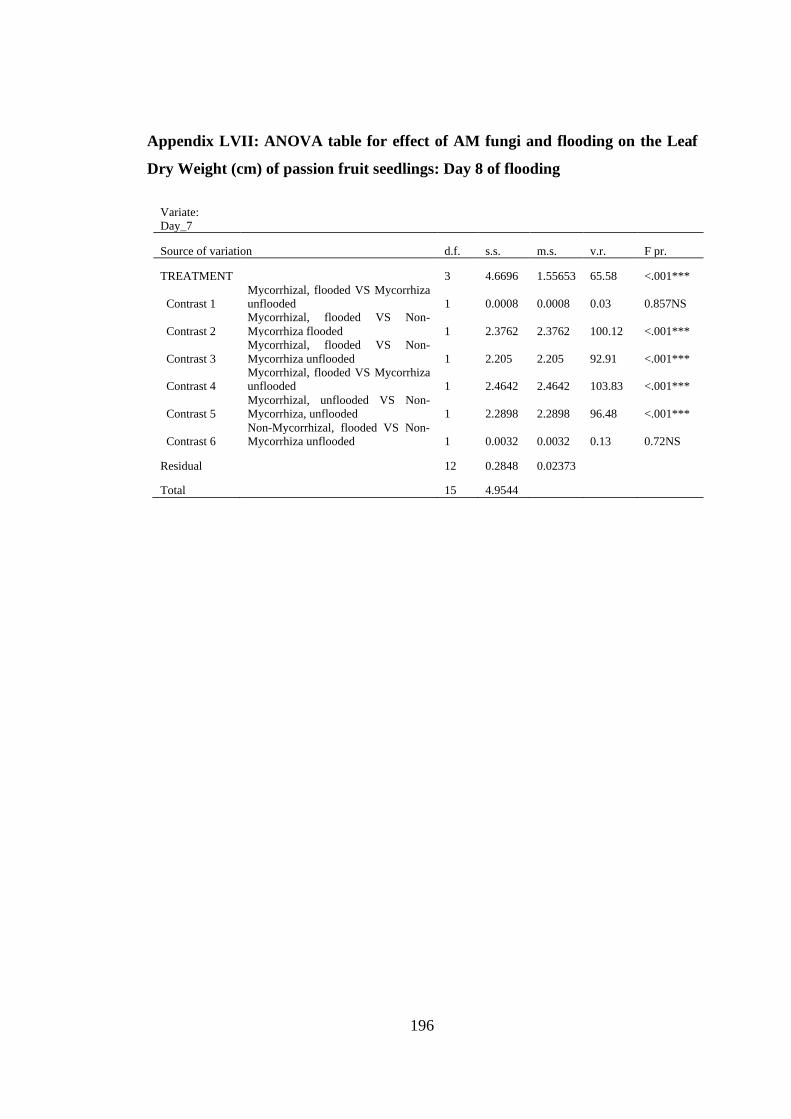
Appendix LVII: ANOVA table for effect of AM fungi and flooding on the Leaf Dry
Weight (cm) of passion fruit seedlings: Day 8 of flooding .............. 196
Appendix LVIII: ANOVA table for effect of AM fungi and flooding on the Leaf Dry
Weight (cm) of passion fruit seedlings: Day 14 of flooding ............ 197
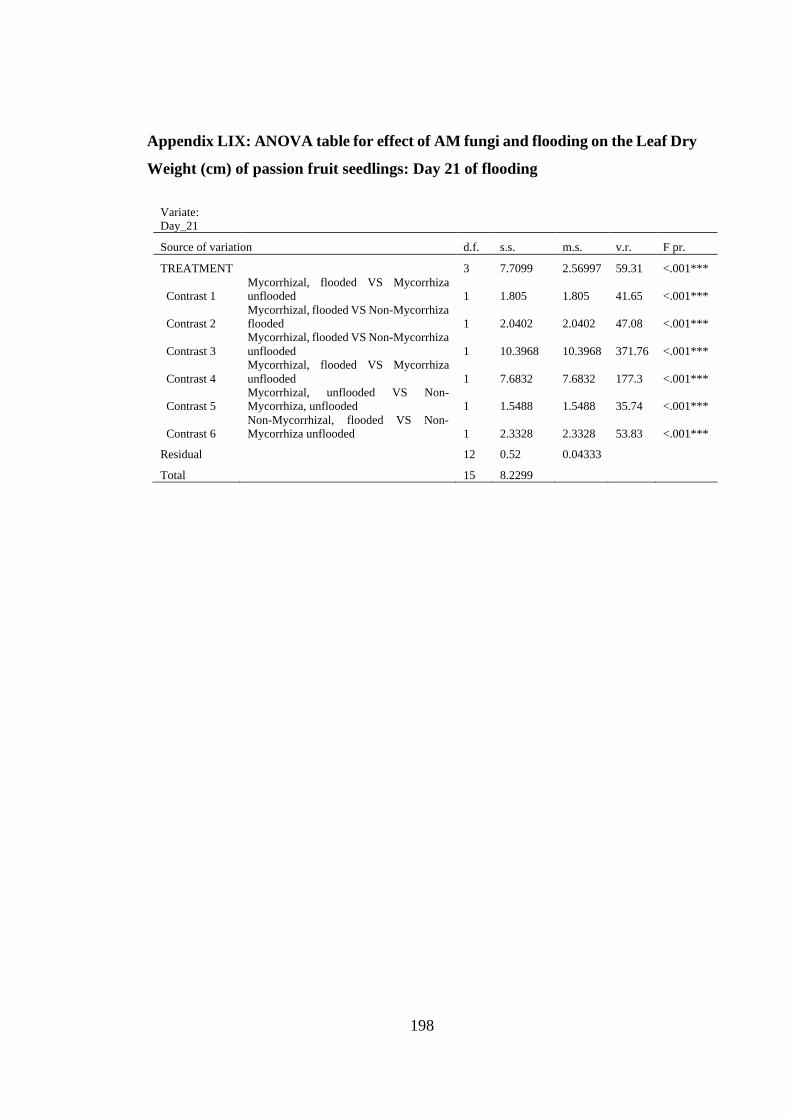
Appendix LIX: ANOVA table for effect of AM fungi and flooding on the Leaf Dry
Weight (cm) of passion fruit seedlings: Day 21 of flooding ............ 198
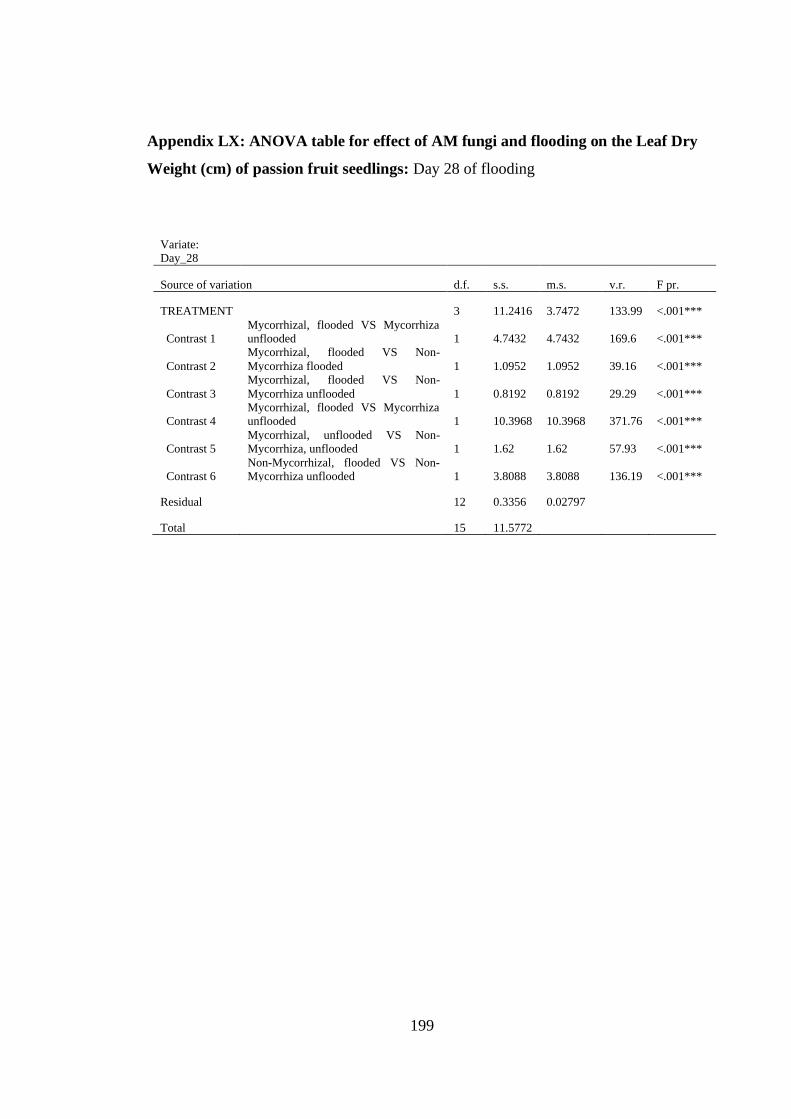
Appendix LX: ANOVA table for effect of AM fungi and flooding on the Leaf Dry
Weight (cm) of passion fruit seedlings: Day 28 of flooding ............ 199
Page 24
xxiii
ABSTRACT
Researchers continue to demonstrate the contribution of Arbuscular Mycorrhiza fungi
on crop productivity, especially under adverse soil conditions. In sub Saharan Africa,
mycorrhizal studies on major fruit crop seedlings have received little attention. Salt
stress experiment was undertaken in mycorrhizal and non mycorrhizal passion fruit
and mango seedlings subjected to moderate and high salt stress. Data was collected on
root colonisation, growth, biomass and nutrient uptake. The study found out that
mycorrhizal colonization reduced under salt stress conditions. Plant height, leaf
number, chlorophyll content, root, stem and leaf fresh and dry weights was greater in
mycorrhiza-inoculated than in un-inoculated seedlings under salt stress conditions.
Total leaf accumulation of P and K was higher in mycorrhizal than in non-mycorrhizal
plants while Na concentrations were lower under both control and medium salt stress
conditions. This study found that a reduction in Na uptake, with a concomitant increase
in P and K absorption and high leaf chlorophyll content play a role in alleviating salt
stress in plants growing in mycorrhizal passion fruit and mango seedlings growing in
saline soils. To investigate the role of mycorrhiza on flooding stress, data was collected
on proline, chlorophyll and carotenoid content, total soluble sugars, mycorrhizal root
colonization and nutrient uptake in passion fruit subjected to root-zone flooding for 7,
14, 21 and 28 days. The seedlings were grown in sterilized sand under low phosphorus
regime for 12 weeks before flooding was initiated. Mycorrhizal inoculation induced
greater root, stem and leaf fresh and dry weights, and maintained greater leaf area as
opposed to leaf abscission that occurred more rapidly in non-mycorrhizal seedlings
under flooding. Chlorophyll a,b and total chlorophyll declined, while carotenoids
increased rapid in non-mycorrhizal seedlings under flooding. A rapid increase in leaf
proline and a slow decline in total soluble sugars was observed in mycorrhizal
seedlings under flooding. Flooding induced a reduction but did not completely inhibit
mycorrhizal root colonization. The leaf nitrogen and phosphorus contents declined
under flooding, with the decline occurring more rapidly in non-mycorrhizal seedlings.
This study found out that increased production of proline, maintenance of optimum
nutrient supply in the leaves and delay in degradation of leaf chlorophyll aids
mycorrhizal passion fruit seedlings to delay the adverse effects of flooding. The effect
of Arbuscular mycorrhiza fungi on growth, nutrient uptake and root infectivity was
also determined in passion fruit, rough lemon, papaya, mango and avocado seedlings
raised under four phosphorus levels in sand culture and also in low nutrient sterilized
and unsterilized media. Arbuscular mycorrhiza increased the leaf area and the root,
leaf and stem fresh and dry weights and also induced an increase in the uptake of
phosphorus, nitrogen and potassium in the leaf tissues. This study indicated that AM
fungi improved the capacity of tropical fruit seedlings to absorb and utilize plant
nutrients possibly by increasing the effective root surface area from which available
form of nutrients are absorbed and also by increasing access of roots by bridging the
depletion zones. Inoculating seedlings with arbuscular mycorrhizal fungi helps to
alleviate the adverse effects of global warming and climate change. As a low cost
technology, arbuscular mycorrhizal inoculation is recommended as part of the regular
practise for incorporating into nursery media used for tropical fruit seedling
propagation in Kenya.
Page 25
1
CHAPTER ONE
INTRODUCTION
1.1 Background Information
Agriculture is the mainstay of Kenya’s economy, contributing over 29.3% of Kenya’s
GrossDomestic Product (GDP) and another 27% of GDP indirectly through linkages
with other sectors (HCD, 2017). Horticulture is the largest subsector in agriculture,
contributing 33% of the agricultural GDP and 38% of export earnings (KNBS, 2014).
Large scale horticultural production in Kenya started during World War II to supply
food to the Allied Forces stationed in East Africa. The sector has recorded steady
growth since 1967 when horticultural crops were declared ‘special’ for the purpose of
Agricultural Act Cap 318 under legal notice no. 229 pf 1967 by the Government of
Kenya (HCDA, 2012). In 1968, 1500 metric tons of horticultural produce were
exported (Jaffee, 1995). This rose to 163,223 metric tons valued at Ksh. 43.1 billion
shillings in 2006 and 261,107 tons valued at Ksh. 101.5 Billion in 2016 (HCD, 2017).
The domestic consumption of horticultural crops has not been accurately quantified but
it is estimated that it accounts for 90% of total horticultural production. Over 80% of
production is from smallholder farmers, many of whom are not involved in the export
business but produce for the domestic markets (Ongeri, 2014). The horticulture sector
is seen as a viable solution for Kenya’s needs of cash crop diversification, enhancing
food nutrition, income generation, employment creation and foreign exchange
earnings, in addition to providing raw materials for the agro processing industries
(Ministry of Agriculture, 2012).
The fruit sub-sector is an important component of the horticulture sector in Kenya. In
2016, total fruit crops (both domestic and export) earned Ksh. 57 Billion from an area
of 172,527 Ha. and volume of 3.2 million tons. Fruits accounted for 26.7% of all
horticultural crops while vegetables accounted for 31.7% and cut flowers 32.7%.
However, in export terms, 48,667 tons of fruits valued at Ksh. 7.317 Billion were
exported in 2016, accounting for 18.63% in volume and 7.2% in value of all
Page 26
2
horticultural exports. This made fruit exports lag behind cut flowers (51.19% volume
and 69.8% value) and vegetables (30.18% volume and 23% value) exports in 2016
(HCD, 2017).
Fruit crops therefore offer tremendous opportunities for enhancing the income of small-
scale farmers in Kenya, and for improving the nutrition of the poor who currently suffer
from deficiencies in vitamins, minerals and other micronutrients as a consequence of
low consumption of fruits (Mbora et al. 2008).
In terms of overall production, the most important fruit crops in Kenya are bananas,
mangoes, pineapples, avocados, pawpaws, oranges and passion fruits. However, based
on foreign exchange earnings, avocados, mangoes, raspberries and passion fruits are leading (HCD,
2017).The domestic market is the largest source of demand for Kenyan avocados
accounting for over 80% of the total production and the rest are exported as fresh fruits
or processed and exported as crude oil (Oduol et al. 2013).Kenya is ranked 12th in citrus
fruit production with a world share of 0.8%. One hundred thousand tons of citrus fruits
were harvested from 13,000 Hactares of land (FAO, 2012). The main citrus fruits
produced in Kenya are sweet orange, lemons, tangerines and grapefruits (HCD, 2014).
By global standards, Kenyais a minor producer of passion fruits (FAO, 2012).
However, Kenya still has significant exports of fresh passion fruits to Europe and
strong sales to regional markets (HCDA, 2012). According to HCD (2017), passion
fruit export volumes in 2016 were 42,210 tons valued at Ksh. 1.64 billion. Uganda
accounted for 76 percent of passion fruit exports in 2012, followed by the EU and
Middle East at 17 percent and 5 percent, respectively (HCDA, 2012).
The fruit sub sector in Kenya faces a number of challenges that hamper its growth.
These challenges occur at the farm, market centre, export and processing points. At the
farm level, there are numerous pest and disease challenges, low soil fertility (Mwangi,
2006) and soil salinity (Mugai, 2004). Unavailability of clean planting materials is also
a major cause of low crop production (HCD, 2017). There is also lack of technological
packages in terms of training and extension leafletsthat can help farmers increase their
production (Pole et al. 2012). Consequently, the yields of fruit crops in Kenya are low.
Page 27
3
For example, the average yield of passion fruits is 8 tons/ha compared to about 18.9
tons/ha in South Africa (Njuguna et al., 2005).
On the marketing stage, challenges include poorly developed transport infrastructure
leading to high transport and shipping costs. There is also lack of information on
alternative marketing possibilities and alternative product use, such as drying and value
addition (KHCP, 2012). Export challenges include inadequate post harvest and
husbandry management, inappropriate varieties, inadequate sea freight facilities and
high air freight costs are among the major constraints (HCDA, 2012). The smallholder
farmers’ situation has been exacerbated by the introduction of stringent new rules and
market standards following increasing consumer concern about food safety, as well as
social and environmental aspects of the food supply chain including poor compliance
with EUREPGAP and traceability standards (USAID, 2008). Furthermore, the cost of
compliance makes it economically infeasible for the smallholder farmers, particularly
to women because of small pieces of land or lack of access to and control over such
resources (Mwangi, 2006). Other constraints include price instability in international
markets and stiff competition from other countries such as India, Pakistan, Brazil,
Mexico and Costa Rica. These competitors offer higher quality varieties at lower
prices, mainly due to lower shipping costs (HCDA, 2012).
1.2 Problem Statement
A major problem that faces fruit as well as other agricultural sectors in Kenya is the
gradual and adverse change in the soil biological, physical and chemical characteristics.
Major soil factors that constraint crop production include high soil salinity (Mugai,
2004), soil moisture stress, low nutrient capital, soil erosion and degradation, low pH
with aluminum toxicity, high phosphorus fixation, low levels of organic matter and loss
of soil biodiversity. Other adverse changes that have occurred include increased natural
resource degradation and a build-up of harmful microbes and pests paralleled by a
reduction of beneficial soil organisms.Land degradation and soil fertility depletion are
considered the major threats to food security and natural resource conservation in sub-
Saharan Africa (Cardoso & Kuyper, 2006).
Page 28
4
In Kenya, by 2004, the area covered by saline soils (Solonchaks) of electrical
conductivity above 4 dS m-1 was estimated to be about 18.0 million ha, accounting for
40% of the arid and semi-arid soils of Kenya (Mugai, 2004).The Exploratory Soil and
Agro-Climatic Zone Maps of Kenya showed that most saline soils of Kenya were
located in agroecological zones VI-VII, except for some saline soils around the soda
lakes of the Southern Rift Valley (aez V) and Coastal area (aez III-IV) (Sombroek et
al. 1982).
In Southern Rift Valley saline soils, the predominant cation was sodium derived from
the weathering of sodium rich minerals (feldspathoids). The predominant anions were
chlorides and carbonates/bicarbonates. Salinity in Southern Rift Valley regions was
also attributed to lack of drainage of the landscapes and the high solubility of the salts
that ensures their presence in the topsoil layers. In Northern Kenya, most of the salinity
was due to long-term mineral weathering under conditions of evaporation exceeding
precipitation. Sodium chloride was the predominant salt because it is most soluble and
rises to the upper soil layers by capillarity under the prevailing arid climatic conditions.
In the Coastal area, salinity is mainly derived from in situ salt accumulation and
lacustrine influence because the parent materials of these soils are Sub-Miocene and
Cretaceous erosion products which were deposited at shallow embayments of the
Indian ocean. Salinity in the area was also very high as a result of the high aridity in
inland areas and frequent addition of salts from the inundating seawater in
swamps(Njue 2004).
The increasing demand in food production is constantly pushing agricultural fields to
areas where water and soils have naturally high salt levels.The increase in salinity stress
problem in Kenya can also beattributed to man-made factors such as poor irrigation
practices, excessive application of chemical fertilizers, use of brackish irrigation water
and poor irrigation uniformity (Araus et al., 2007).
High soil salinity increases the osmotic pressure of soil solution causing water to
diffuse out of the plant leading to wilting and plant death as extreme salinity occurs.
Excessive uptake of Na+ induces ion competition which diminishes the uptake,
transport and internal distribution of nutritional elements such as K, Mg, Ca, P and
Page 29
5
N.Salt injury symptoms such as marginal chlorosis and necrosis of leaves, growth
reduction, twig and branch dieback, loss of vigour, wilting and death (Evelin et al.,
2009).High concentration of Na+ also causes soil compaction, increases the soil pH,
deflocculates humid colloids and disperses clay particles. This destroys the soil
structure impairing drainage and root growth (Yuang et al., 2007).
Flooding is one of the weather phenomena that affect many regions of the world. On a
world scale, the land area exposed to flooding is > 17 million km2, equal to twice the
size of the USA (Perata et al. 2011). Future rainfall projections for Kenya up to the
year 2030 broadly indicate that there will be increase in annual rainfall, with the highest
amounts expected in Western parts of Kenya around Mount Elgon, Elgeyo Escarpment
and Cherangani Hills (GoK, 2010).
Climatic changes, including rising temperatures and increasingly variable rainfall
patterns, have resulted in increased frequency of extreme weather events such as floods
and droughts. For example, it has been reported that the last two decades have recorded
six years with the warmest temperatures and rainfall variability in subSaharan Africa.
Decreases in rainfall have been recorded in the Sahel region and increases in the East
and Central African region. Consequently climate-related disasters such as floods and
droughts have doubled in these regions within the last quarter century and
Mozambique, Malawi, Kenya, Madagascar and Ethiopia are examples of Sub Saharan
countries likely to experience unexpected extreme climatic events (Opondo, 2013).
Plants develop a variety of responses in order to deal with partial submergence imposed
by flooding. The most common anatomical response is the generation of aerenchyma
in tissues, which facilitates the transport of oxygen from shoots to roots (Colmer and
Voesenek, 2009). At physiological level, flooding modifies water relations and plants
carbon fixation, causes the closing of stomata, reduction of transpiration and inhibition
of photosynthesis (Mollard et al., 2010). At morphological level, responses to flooding
include formation of adventitious roots and increase in plant height (Heydarian et al.,
2010). Prolonged flooding inhibits root formation and branching, reduces growth of
existing roots, induces root decay and decreases the root/shoot ratio (Ashraf and Harris,
2004).
Page 30
6
To overcome these constraints hampering crop production, use of pesticides, synthetic
fertilizers and high yielding crop varieties were undertaken in the last century as part
of the green revolution package (Dalgaard et al., 2003). Although this technology has
been found to increase the global food supply, reduce hunger and improve nutrition,
millions of rural communities in the tropics and subtropics are persistently affected by
a decline in household food production and have no food security (Stocking, 2003).
These raise questions about the sustainability of the current agricultural practices
(Dalgaard et al., 2003).
Various researchers throughout the world continue to demonstrate the contribution of
Arbuscular Mycorrhiza fungi on crop productivity and quality, especially under
adverse biotic and abiotic conditions. However, in sub Saharan Africa, many of these
studies appear to be focused on field and vegetable crops, while the role of arbuscular
mycorrhizae in important tropical fruit crops have so far received little attention
(Guissou, 2009).The fruitseedling industry in Kenya is not well developed. There are
few institutional fruit seedlings who supply good quality fruit seedlings to farmers in
Kenya. These institutions are however located far from the farmers who require these
services. Many Kenyan farmers therefore purchase seedlings from roadside
nurserymen located in many rural and urban townships in Kenya. Many of these
nurserymen are poorly equipped to supply good quality seedlings to farmers.
Tropical soils have low level of native mycorrhizae. Mycorrhizal colonization appears
to be especially low in fruit orchards and nurseries. Soil samples collected from 103
orchards in 25 locations in Kenya, representing 13 soil types and 4 regions (high rainfall
lowlands, highlands, arid and semi-arid lands and coastal lowlands) show the number
of VAM spores in 25-gram soil samples to be 200 or below. Particularly, in more that
60% of these orchards, the number of spores are less than 50 in 25-gram soil sample
(Wamocho, 1998). This is in contrast to Japan where the number of VAM spores is
over 1000 in spite of use of large amounts of chemical fertilizers and agrochemicals.
The root infection by citrus roots in Japan is also reported to be on average 70% (Ishii
et al., 1992).
Mycorrhizal colonisation is also low in fruit seedlings. Studies in fruit nurseries in
Ethiopia and Somalia indicate that naturally-occurring mycorrhiza formation is sparse,
Page 31
7
even in unsterilized soils. This means that poorly performing seedlings are being being
transplanted (Michelson, 1992). There is therefore need to undertake studies on the
role of arbuscular mycorrhiza fungi on soil chemical properties such as salinity,
flooding and nutrient uptake. There is also need to provide guidelines on how to
undertake mycorrhiza fungal inoculation into the fruit seedlings planting media. This
will enable the benefits of mycorrhization on flooding, salinity and nutrient uptake to
be transferred from the seedlings into the fruits growing in the field, thereby improving
their productivity.
1.3 Justification for the Study
Among abiotic stresses, soil salinization is probably one of the most important in the
world (Zhu 2003). Statistics indicate that 7% of the earth’s land surface is affected by
soil salinity (Evelin et al. 2009). Soil salinity is increasing in a fast rate. By 2050, it is
predicted that 50% of all arable lands in the world will be affected by salinity (Porcel
et al., 2012). To counteract this salinity problem, many strategies have been proposed.
These include searching for new salt-tolerant crops, genetic engineering, removing
excessive salt accumulation in groundwater and desalinizing water for irrigation.
Although these strategies appear efficient, they are costly and out of reach for
developing countries that are the most affected (Ashraf & Harris 2004).
Arbuscular mycorrhiza symbiosis has been reported to counteract the effect of salinity
on crop productivity (Huang et al. 2013, Younesi and Moradi, 2014). However, no
studies have been undertaken to determine the effect of Arbuscular mycorrhiza fungi
on passion fruits and mango seedlings under Kenya conditions. One of the research
goals was aimed at addressing this knowledge gap.
Kenya was ranked among the 16 worst affected tropical countries by the 1997/98 El
Niño event which resulted in severe floods after major rivers in the country attained
record peaks causing havoc and destroying livelihoods (Gichere et al., 2013). The
impact of flooding in Kenya is are often exacerbated by anthropogenic factors like
forest degradation and poor land use practices that disrupt watershed areas, drainage
basins and flood plains (Opondo, 2013).
Page 32
8
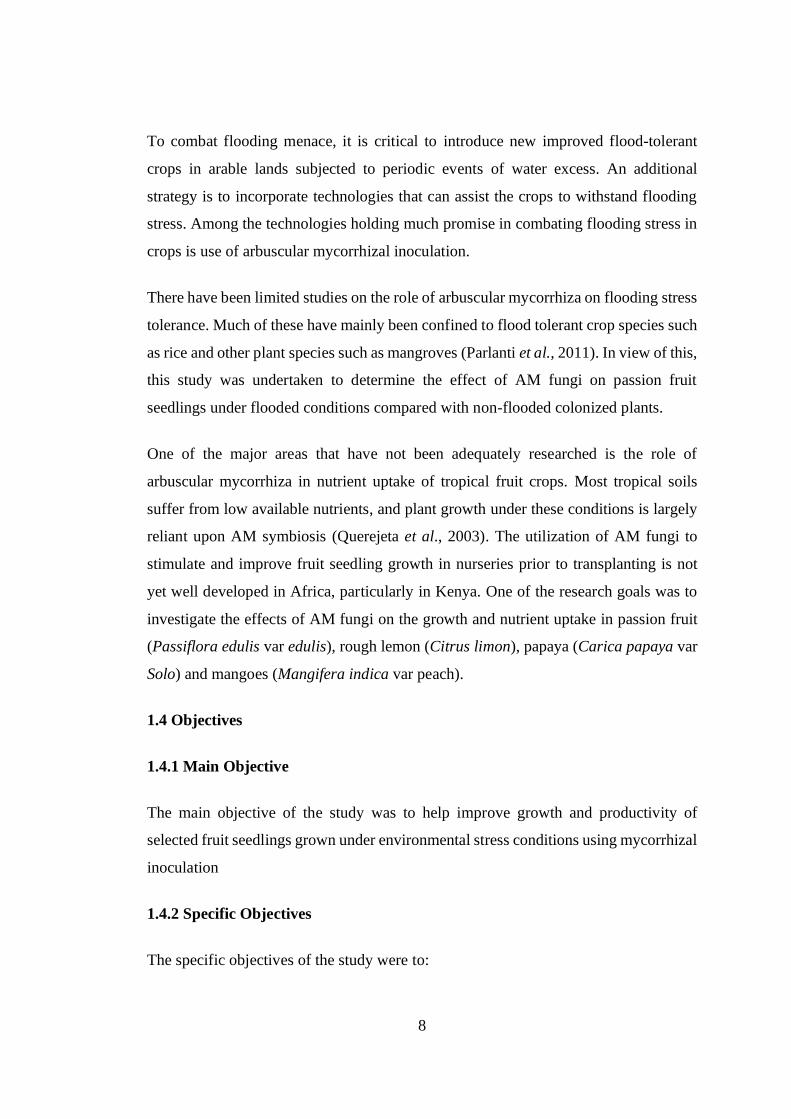
To combat flooding menace, it is critical to introduce new improved flood-tolerant
crops in arable lands subjected to periodic events of water excess. An additional
strategy is to incorporate technologies that can assist the crops to withstand flooding
stress. Among the technologies holding much promise in combating flooding stress in
crops is use of arbuscular mycorrhizal inoculation.
There have been limited studies on the role of arbuscular mycorrhiza on flooding stress
tolerance. Much of these have mainly been confined to flood tolerant crop species such
as rice and other plant species such as mangroves (Parlanti et al., 2011). In view of this,
this study was undertaken to determine the effect of AM fungi on passion fruit
seedlings under flooded conditions compared with non-flooded colonized plants.
One of the major areas that have not been adequately researched is the role of
arbuscular mycorrhiza in nutrient uptake of tropical fruit crops. Most tropical soils
suffer from low available nutrients, and plant growth under these conditions is largely
reliant upon AM symbiosis (Querejeta et al., 2003). The utilization of AM fungi to
stimulate and improve fruit seedling growth in nurseries prior to transplanting is not
yet well developed in Africa, particularly in Kenya. One of the research goals was to
investigate the effects of AM fungi on the growth and nutrient uptake in passion fruit
(Passiflora edulis var edulis), rough lemon (Citrus limon), papaya (Carica papaya var
Solo) and mangoes (Mangifera indica var peach).
1.4 Objectives
1.4.1 Main Objective
The main objective of the study was to help improve growth and productivity of
selected fruit seedlings grown under environmental stress conditions using mycorrhizal
inoculation
1.4.2 Specific Objectives
The specific objectives of the study were to:
Page 33
9
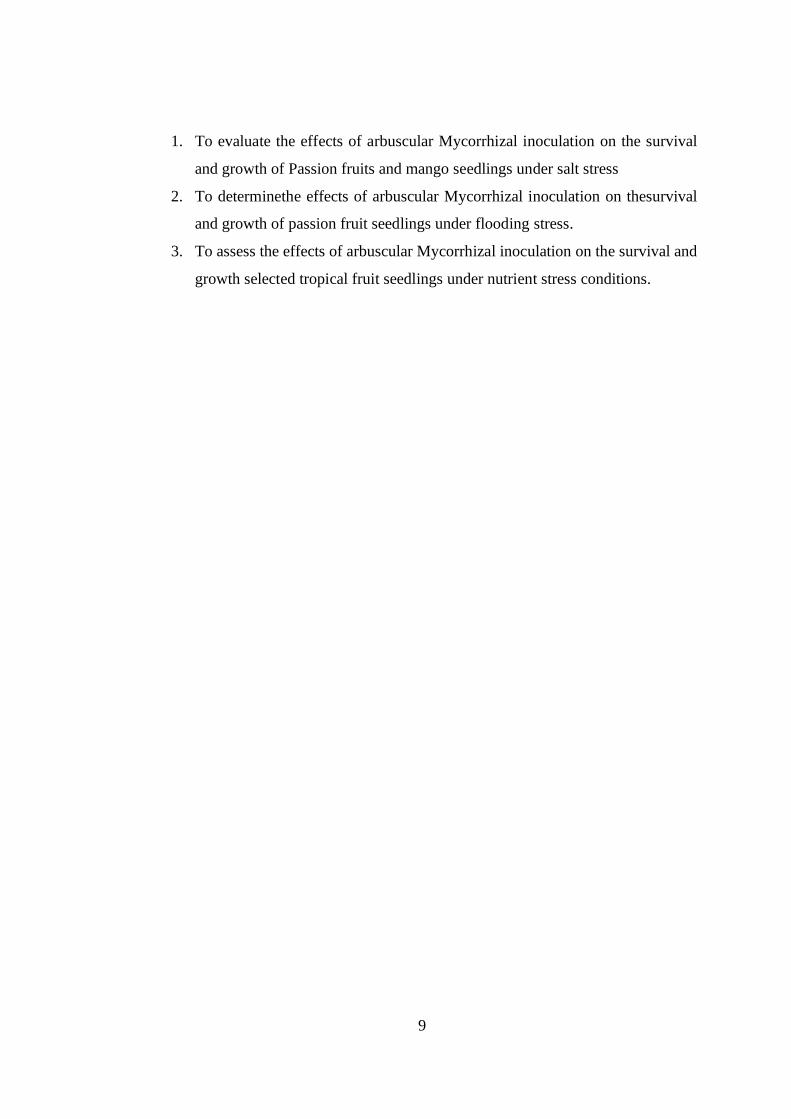
1. To evaluate the effects of arbuscular Mycorrhizal inoculation on the survival
and growth of Passion fruits and mango seedlings under salt stress
2. To determinethe effects of arbuscular Mycorrhizal inoculation on thesurvival
and growth of passion fruit seedlings under flooding stress.
3. To assess the effects of arbuscular Mycorrhizal inoculation on the survival and
growth selected tropical fruit seedlings under nutrient stress conditions.
Page 34
10
CHAPTER TWO
LITERATURE REVIEW
2.1 General introduction to Mycorrhiza Fungi
Mycorrhiza fungi are specialized organisms that live on plant roots in relationship that
is mutually beneficial.The host plant supplies the fungus with carbohydrates produced
during photosynthesis. In return, the fungi use their extensive network of hyphae in the
soil to transfer water and nutrients to the roots (Le Tacon et al., 2013).
The word mycorrhiza was first used by a German researcher A. B. Frank in 1885, and
originate from the Greek word mycos meaning ‘fungus’ and rhiza meaning ‘root.
Mycorrhiza fungi are among the most important fungi in the soil and can compose 70%
of the mass of the soil fungi. They can also be found in all ecosystems in the world. At
least seven different types of mycorrhizal associations have been found, involving
different groups of fungi and host plants and distinct morphological patterns. These
include ectomycorrhizae, arbutoid mycorrhizae, orchid mycorrhizae and arbuscular
mycorrhizae (Smith & Smith, 2011).
Arbuscular mycorrhiza, also called vesicular arbuscular mycorrhiza (VAM) or
endomycorrhizae is the most ancient type of mycorrhiza (Smith & Smith, 2011).
Paleobotanical and molecular sequence data suggest that the first land plants formed
associations with Glomalean fungi from the Glomeromycota about 460 million years
ago (Bonfante & Genre, 2008). This is estimated to be about 400 million years before
the appearance of root nodule symbioses with nitrogen-fixing bacteria (Redecker et al.,
2000). It is estimated that arbuscular mycorrhizal (AM) symbioses can be formed with
over 250,000 plant species, accounting for probably 90% of terrestrial plant species
including gymnosperms and pteridophytes (Feddermann et al., 2010). They also occur
in some mosses, lycopods and psilotales (Smith & Smith, 2011).
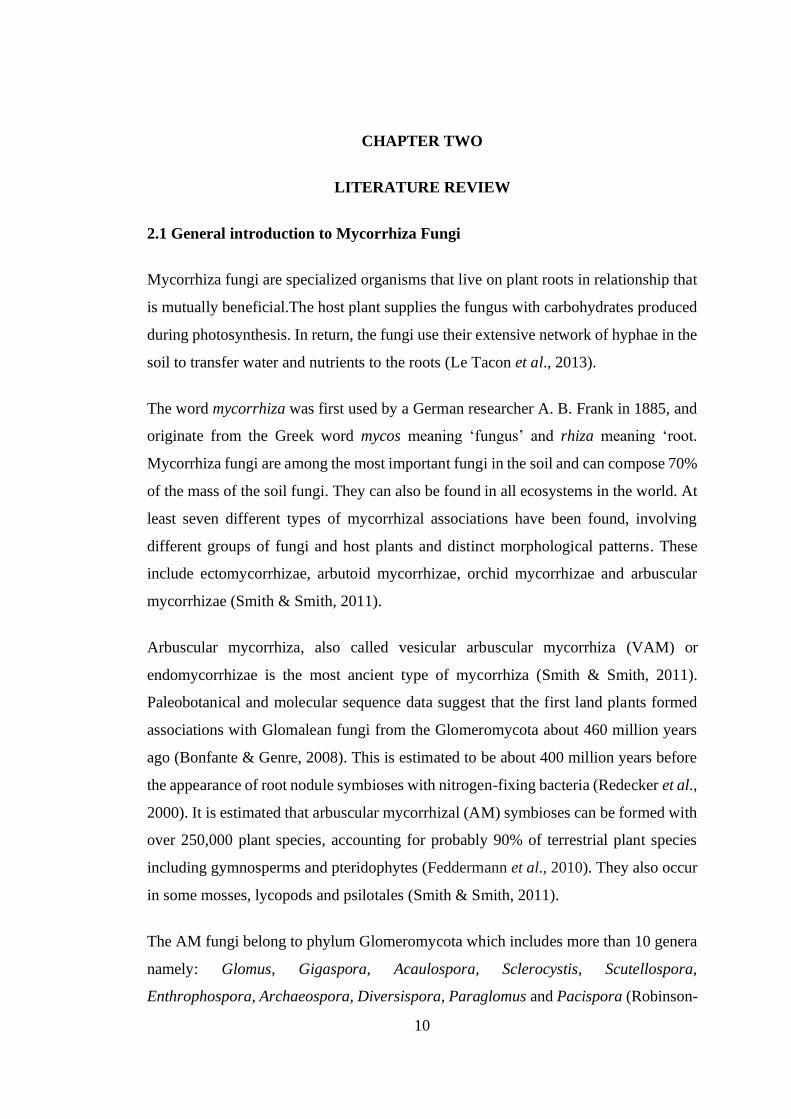
The AM fungi belong to phylum Glomeromycota which includes more than 10 genera
namely: Glomus, Gigaspora, Acaulospora, Sclerocystis, Scutellospora,
Enthrophospora, Archaeospora, Diversispora, Paraglomus and Pacispora (Robinson-
Page 35
11
Boyer et al., 2009). From these genera, 150 - 200 species of AM fungi have so far been
distinguished on the basis of morphology (Smith & Read, 2008). However, DNA-based
studies havesuggested that the true diversity of these symbionts may be much higher
(Santos-Gonzales et al., 2007).
A study in north and north-west China found 33 AM fungal species of seven genera,
with Glomus etunicatum, G. mosseae and G. intraradices beingthe dominant species
(Gai et al., 2010). Glomus was also the most abundant genus in the rhizosphere of
soybean and mung bean (Hindumathi & Reddy, 2011), grapes and apples (Binet et al.,
2011). When inoculated with Glomus intraradices, these crops showed a high
percentage of total root length colonization of upto 97%. Plant species with low to
moderate percentage of root length colonized by G. intraradices included weeds such
as Alopecurus myosuroides, Apera spica-venti, Poa annua and Trifolium repens (Veiga
et al., 2011).
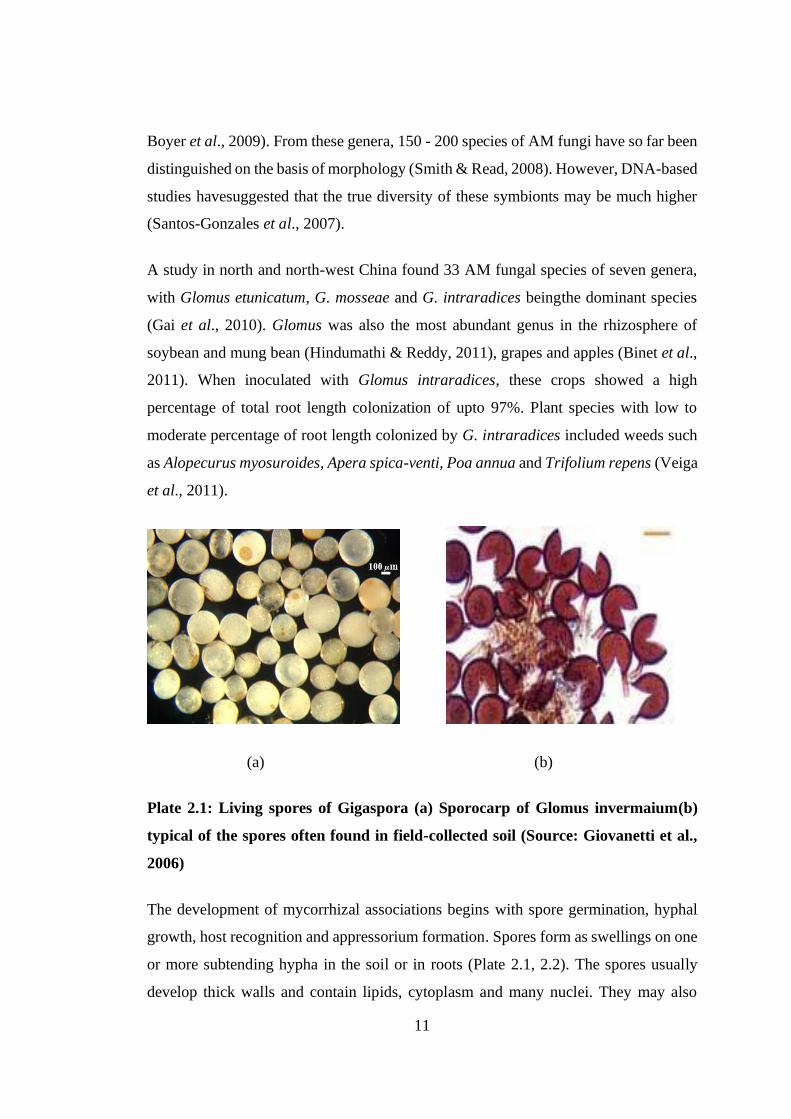
(a) (b)
Plate 2.1: Living spores of Gigaspora (a) Sporocarp of Glomus invermaium(b)
typical of the spores often found in field-collected soil (Source: Giovanetti et al.,
2006)
The development of mycorrhizal associations begins with spore germination, hyphal
growth, host recognition and appressorium formation. Spores form as swellings on one
or more subtending hypha in the soil or in roots (Plate 2.1, 2.2). The spores usually
develop thick walls and contain lipids, cytoplasm and many nuclei. They may also
Page 36
12
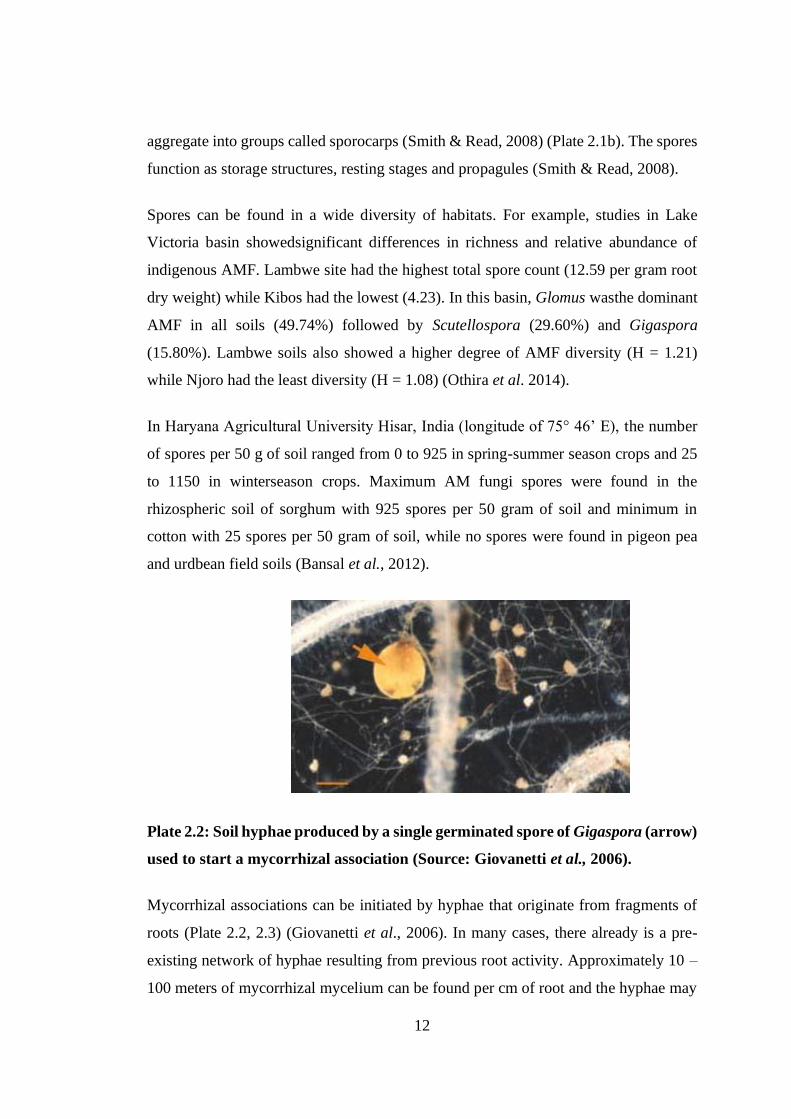
aggregate into groups called sporocarps (Smith & Read, 2008) (Plate 2.1b). The spores
function as storage structures, resting stages and propagules (Smith & Read, 2008).
Spores can be found in a wide diversity of habitats. For example, studies in Lake
Victoria basin showedsignificant differences in richness and relative abundance of
indigenous AMF. Lambwe site had the highest total spore count (12.59 per gram root
dry weight) while Kibos had the lowest (4.23). In this basin, Glomus wasthe dominant
AMF in all soils (49.74%) followed by Scutellospora (29.60%) and Gigaspora
(15.80%). Lambwe soils also showed a higher degree of AMF diversity (H = 1.21)
while Njoro had the least diversity (H = 1.08) (Othira et al. 2014).
In Haryana Agricultural University Hisar, India (longitude of 75° 46’ E), the number
of spores per 50 g of soil ranged from 0 to 925 in spring-summer season crops and 25
to 1150 in winterseason crops. Maximum AM fungi spores were found in the
rhizospheric soil of sorghum with 925 spores per 50 gram of soil and minimum in
cotton with 25 spores per 50 gram of soil, while no spores were found in pigeon pea
and urdbean field soils (Bansal et al., 2012).
Plate 2.2: Soil hyphae produced by a single germinated spore of Gigaspora (arrow)
used to start a mycorrhizal association (Source: Giovanetti et al., 2006).
Mycorrhizal associations can be initiated by hyphae that originate from fragments of
roots (Plate 2.2, 2.3) (Giovanetti et al., 2006). In many cases, there already is a pre-
existing network of hyphae resulting from previous root activity. Approximately 10 –
100 meters of mycorrhizal mycelium can be found per cm of root and the hyphae may
Page 37
13
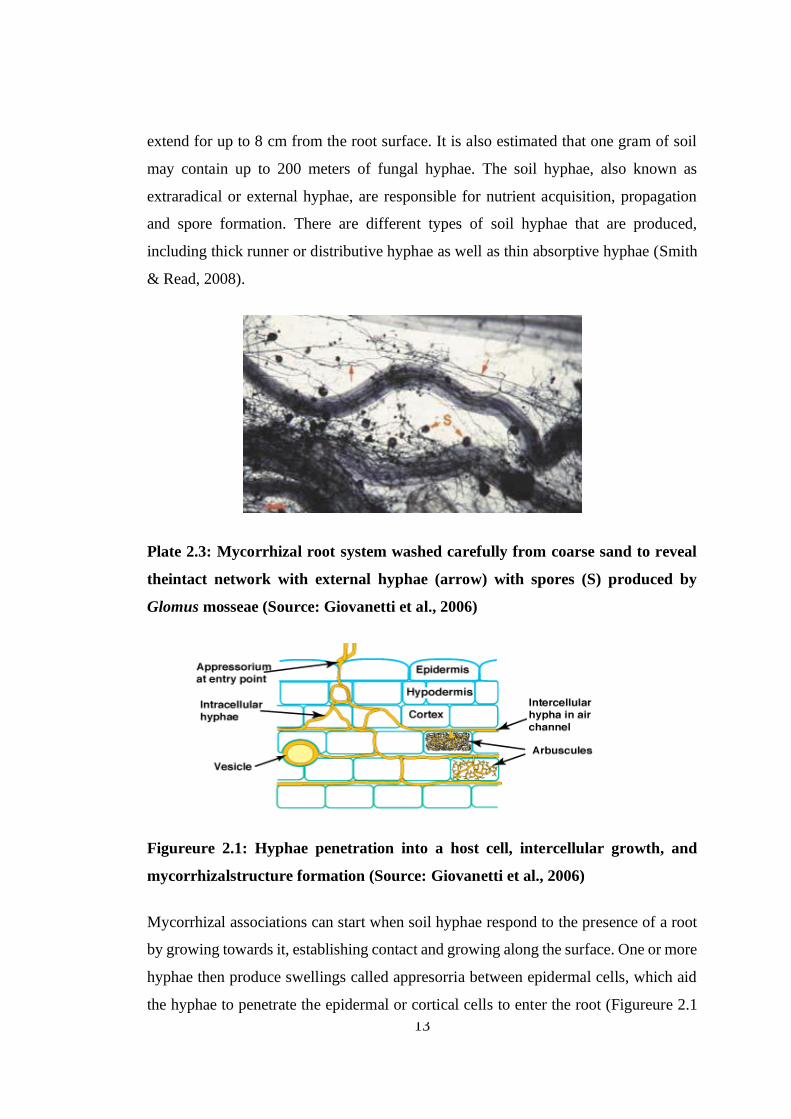
extend for up to 8 cm from the root surface. It is also estimated that one gram of soil
may contain up to 200 meters of fungal hyphae. The soil hyphae, also known as
extraradical or external hyphae, are responsible for nutrient acquisition, propagation
and spore formation. There are different types of soil hyphae that are produced,
including thick runner or distributive hyphae as well as thin absorptive hyphae (Smith
& Read, 2008).
Plate 2.3: Mycorrhizal root system washed carefully from coarse sand to reveal
theintact network with external hyphae (arrow) with spores (S) produced by
Glomus mosseae (Source: Giovanetti et al., 2006)
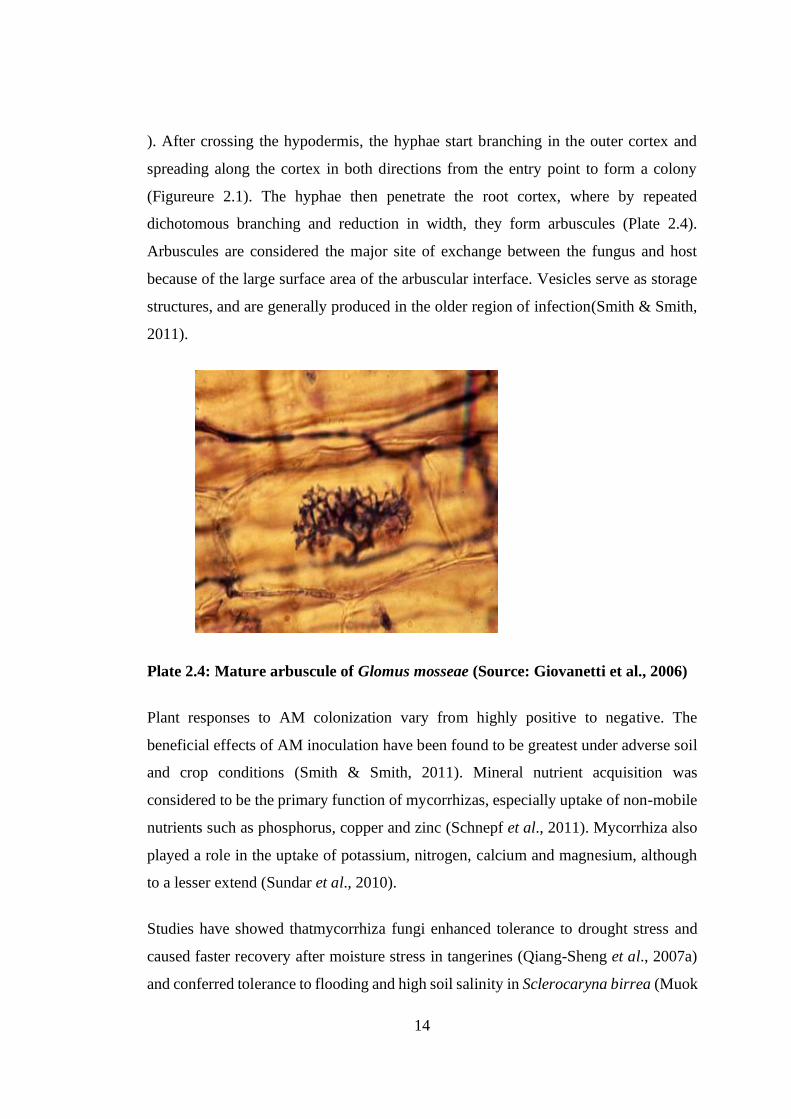
Figureure 2.1: Hyphae penetration into a host cell, intercellular growth, and
mycorrhizalstructure formation (Source: Giovanetti et al., 2006)
Mycorrhizal associations can start when soil hyphae respond to the presence of a root
by growing towards it, establishing contact and growing along the surface. One or more
hyphae then produce swellings called appresorria between epidermal cells, which aid
the hyphae to penetrate the epidermal or cortical cells to enter the root (Figureure 2.1
Page 38
14
). After crossing the hypodermis, the hyphae start branching in the outer cortex and
spreading along the cortex in both directions from the entry point to form a colony
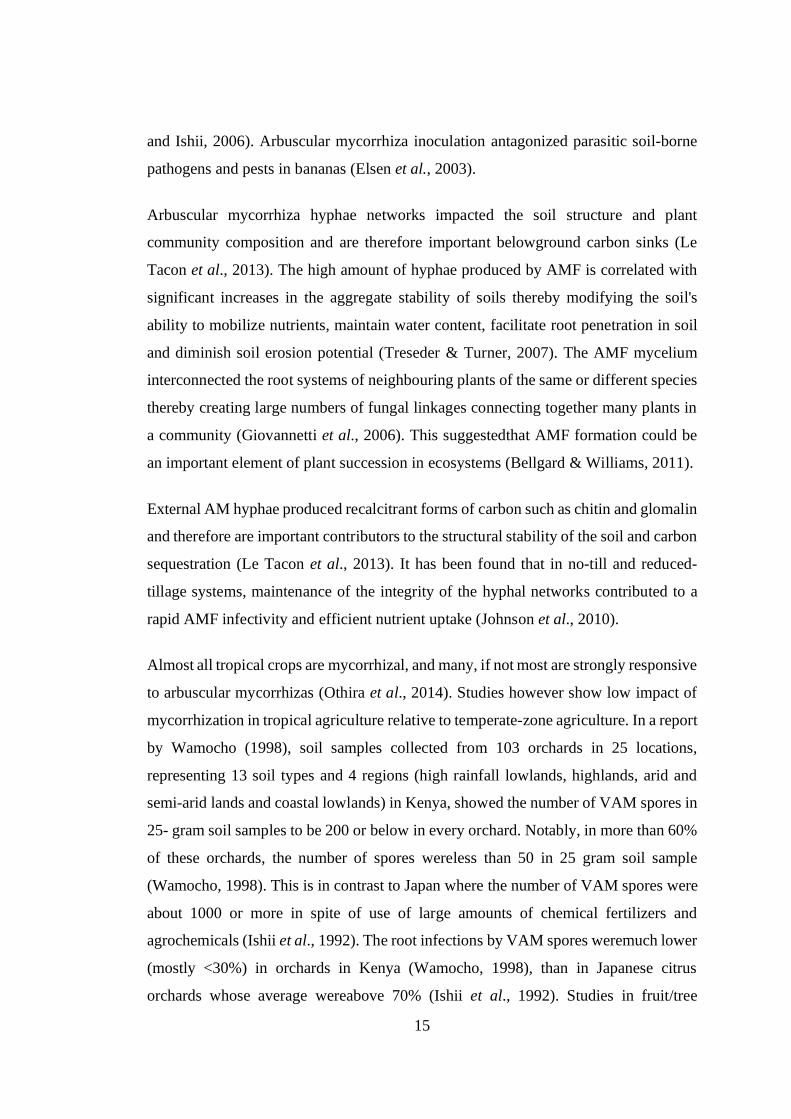
(Figureure 2.1). The hyphae then penetrate the root cortex, where by repeated
dichotomous branching and reduction in width, they form arbuscules (Plate 2.4).
Arbuscules are considered the major site of exchange between the fungus and host
because of the large surface area of the arbuscular interface. Vesicles serve as storage
structures, and are generally produced in the older region of infection(Smith & Smith,
2011).
Plate 2.4: Mature arbuscule of Glomus mosseae (Source: Giovanetti et al., 2006)
Plant responses to AM colonization vary from highly positive to negative. The
beneficial effects of AM inoculation have been found to be greatest under adverse soil
and crop conditions (Smith & Smith, 2011). Mineral nutrient acquisition was
considered to be the primary function of mycorrhizas, especially uptake of non-mobile
nutrients such as phosphorus, copper and zinc (Schnepf et al., 2011). Mycorrhiza also
played a role in the uptake of potassium, nitrogen, calcium and magnesium, although
to a lesser extend (Sundar et al., 2010).
Studies have showed thatmycorrhiza fungi enhanced tolerance to drought stress and
caused faster recovery after moisture stress in tangerines (Qiang-Sheng et al., 2007a)
and conferred tolerance to flooding and high soil salinity in Sclerocaryna birrea (Muok
Page 39
15
and Ishii, 2006). Arbuscular mycorrhiza inoculation antagonized parasitic soil-borne
pathogens and pests in bananas (Elsen et al., 2003).
Arbuscular mycorrhiza hyphae networks impacted the soil structure and plant
community composition and are therefore important belowground carbon sinks (Le
Tacon et al., 2013). The high amount of hyphae produced by AMF is correlated with
significant increases in the aggregate stability of soils thereby modifying the soil's
ability to mobilize nutrients, maintain water content, facilitate root penetration in soil
and diminish soil erosion potential (Treseder & Turner, 2007). The AMF mycelium
interconnected the root systems of neighbouring plants of the same or different species
thereby creating large numbers of fungal linkages connecting together many plants in
a community (Giovannetti et al., 2006). This suggestedthat AMF formation could be
an important element of plant succession in ecosystems (Bellgard & Williams, 2011).
External AM hyphae produced recalcitrant forms of carbon such as chitin and glomalin
and therefore are important contributors to the structural stability of the soil and carbon
sequestration (Le Tacon et al., 2013). It has been found that in no-till and reduced-
tillage systems, maintenance of the integrity of the hyphal networks contributed to a
rapid AMF infectivity and efficient nutrient uptake (Johnson et al., 2010).
Almost all tropical crops are mycorrhizal, and many, if not most are strongly responsive
to arbuscular mycorrhizas (Othira et al., 2014). Studies however show low impact of
mycorrhization in tropical agriculture relative to temperate-zone agriculture. In a report
by Wamocho (1998), soil samples collected from 103 orchards in 25 locations,
representing 13 soil types and 4 regions (high rainfall lowlands, highlands, arid and
semi-arid lands and coastal lowlands) in Kenya, showed the number of VAM spores in
25- gram soil samples to be 200 or below in every orchard. Notably, in more than 60%
of these orchards, the number of spores wereless than 50 in 25 gram soil sample
(Wamocho, 1998). This is in contrast to Japan where the number of VAM spores were
about 1000 or more in spite of use of large amounts of chemical fertilizers and
agrochemicals (Ishii et al., 1992). The root infections by VAM spores weremuch lower
(mostly <30%) in orchards in Kenya (Wamocho, 1998), than in Japanese citrus
orchards whose average wereabove 70% (Ishii et al., 1992). Studies in fruit/tree
Page 40
16
nurseries in Ethiopia and Somalia indicated that naturally-occurring mycorrhiza
formation were sparse, even in unsterilized soils, leading to poorly performing
seedlings being transplanted (Michelson, 1992).
Various reasons account for the low level of mycorrhization in tropical soils and the
subsequent poor infection levels in the roots of tropical crops. Among them is poor soil
management. Soils in the tropics are widely degraded.Among the factors responsible
for degradation is agricultural tillage. A study carried out in various sites around the
Lake Victoria basin indicated that mycorrhizal spore densities werehighest in Lambwe
Valley because the soils have experienced less tillage over the years (Othira et al.,
2014). In Mediterranean cropping systems, greater AM colonization rates
wereobserved in maize and soybean plants grown in undisturbed soil relative to plants
from soils disturbed by three or four cycles of plant establishment. This is reflected in
better growth of the host crop in undisturbed soil (Antunes et al., 2006). In wheat,
differences in plant dry weight between disturbed and undisturbed soils wereconsistent
with a differential AM colonization rate between the two treatments, with greater
colonization taking place in the undisturbed soil. No-till system wasan important
management technique as it keeps the extraradical mycelium intact and allows the next
crop to benefit from the mycelium developed by the previous crop in the rotation.
Conversely, tillage reducedthe AM inoculation potential of the soil and the efficacy of
mycorrhiza by disrupting the extraradicle hyphal network and reducing the surface area
spanned by the hyphae, thus rendering them ineffective (Brito et al., 2011).
Related to the issue of bare ground is overgrazing by livestock. Yang et al (2013)
indicated that grazing of pasture grasses affected the proportion of root length infected
by decreasing root length per unit volume of soil. Herbivore grazing altered the leaf
photosynthetic rates and the above-ground production and the carbon allocation below
ground by altering soil nutrient status through direct inputs of N and P in dung and
urine deposition (Van Der Waal, 2011).
Page 41
17
2.2 Effect of Arbuscular Mycorrhizal Inoculation on the Survival and Growth of
Tropical Fruit Seedlings under Salt Stress
2.2.1 Introduction on Salt Stress
Salt stress has become one of the major limitations on crop productivity and quality in
the world. Statistics on salinity (2009) indicated that 7% of the earth’s land surface was
affected by soil salinity (Elevin et al., 2009). It is predicted that by 2050, 50% of all
arable lands in the world will be affected by salinity (Porcel et al., 2012).In Kenya, by
2004, the area covered by saline soils (Solonchaks) of electrical conductivity above 4
dS m-1 was estimated to be about 18.0 million ha, accounting for 40% of the arid and
semi-arid soils of Kenya (Mugai, 2004).
The increase in salinity stress problem is attributed toman-made factors such as poor
irrigation practices, excessive application of chemical fertilizers, use of brackish
irrigation water and poor irrigation uniformity.The increasing demand in food
production is constantly pushing agricultural fields to areas where water and soils have
naturally high salt levels (Araus et al., 2007).
Historical records indicate that several societies relying on irrigation collapsed due to
salinization. For example, in Mesopotamia,increased soil salinity caused a decline in
wheat productivity and necessitated a crop change to barley, which was thought to be
salt tolerant. However, this strategy failed because the barley yields decreased over
time due to salinization and this ultimately led to relocation and decline of population
of Mesopotamia (Araus et al., 2007).
Salinity is a major soil problem in arid and semi arid climates (Koca et al., 2007).
Solubility of most salts is temperature-dependent. Solubility is greater in warm dry
season when there is a net upward water flux from the groundwater table to the surface
soil, than in the cooler wet season when salts are leached from the surface soil by
surplus rainfall. Overall, this change between rapid influx of salts in the soil and slow
discharge is conducive to net accumulation of salts and development of a saline soil
horizon in seasonally dry regions (Singh et al., 2011).
Page 42
18
2.2.2 Effect of Salt Stress on Crop Productivity
Salt stress entails both osmotic and ionic stresses. High concentration of salt ions (Na+,
Ca+, Cl-, SO42-) increases the osmotic pressure of soil solution causing water to diffuse
out of the plant leading to wilting and plant death as extreme salinity occurs. Excessive
uptake of Na+ and Cl- affects cell membrane functioning and cell metabolism by
reducing enzymatic activities and inhibits protein synthesis. It induces ion competition
which diminishes the uptake, transport and internal distribution of nutritional elements
such as K, Mg, Ca, P and N.Salinity may cause physiological stresses such as disruption
of membranes, lowers photosynthesis and respiration rates.These osmotic and ionic
stresses result in salt injury symptoms such as marginal chlorosis and necrosis of
leaves, growth reduction, twig and branch dieback, loss of vigour, wilting and death
(Evelin et al., 2009).
Excessive salinity canadversely affect the physical and chemical properties of soil,
microbial processes and plant growth. High concentration of Na+ causes soil dispersion,
increases the soil pH, deflocculates humid colloids and disperses clay particles. This
destroys the soil structure impairing drainage and root growth (Njue, 2004; Yuang et
al., 2007).
2.2.3 Effect of Arbuscular Mycorrhiza Fungi on Growth of Plants under salt stress
The shoot fresh weight, and shoot and root dry weights weresignificantly higher in
AMF-treated Tomato variety TCAV10 subjected to salt stress, when compared with
control treatment. Inoculation with AMFfurther caused a significant increase (~30%)
in the fruit yield of TCAV10 tomato particularly under 2% saline stress (Huang et al.,
2013). LikewiseNzanza et al., (2012) showed that under saline conditions, Glomus
mosseae improved growth, fruit yield and quality of tomatoes compared to un-
inoculated tomatoes.When irrigated with saline water, tomato plants inoculated with
AMF showed greater shoot and root dry matter accumulation than non mycorrhizal
plants (Debouba et al., 2006).In beans grown in Iran, mycorrhizal inoculation increased
the shoot biomass under moderate salinity (Younesi & Moradi, 2014).The AMF
Page 43
19
symbiosisimproved the dry weights and alleviated salt stress in lettuce (Lactuca sativa
L.) and maize (Zea mays L.) (Aroca et al., 2013; Estrada et al., 2013).
The salt tolerance of banana plantlets as measured by leaf number and plant height also
increased considerably in the presence of Glomus isolates (Yano-Melo et al., 1999).
Inoculating Acacia acuricuformis with Glomus fasciculatum and G. macrocarpum also
significantly increased the root and shoot weights (Giri et al., 2005). The shoot biomass
of mycorrhizal zucchini plants was higher than those of non-mycorrhizal plants under
saline conditions (Colla et al., 2008). Soybean plants inoculated with AM fungus and
grown under NaCl concentrations of 0, 50, 100, 150 and 200mM had significantly
higher fresh and dry weight compared to the non inoculated plants (Sharifi et al.,
2007).In wheat, mycorrhizal inoculation increased the shoot and root fresh and dry
weights, stem length and leaf area (El-Amri et al., 2013).
Soil salinity caused the chlorophyll content in Sesbania grandiflora to
decreased(Dhanapackiam and Muhammad, 2010). Studies in Sesbania aegyptiaca and
S. grandiflora indicated that the chlorophyll content wasgreater in leaves of seedlings
inoculated with Glomus macrocarpumthan in uninoculated seedlings under saline soil
conditions (Giri et al., 2005). Likewise, Lotus glaber plants colonized by G.
intraradiceshad higher chlorophyll content than non-mycorrhizal plants under salt
stress (Sannazzaroet al., 2005). Salt stress was also reported to suppress synthesis of
chlorophyll in wheat. However, the chlorophyll content increased when
mycorrhizaewere inoculated on host plants under both stress and non-stress conditions
(El-Amri et al., 2013). The highest chlorophyll content was found in mycorrhizaewheat
plants as compared to non-inoculated plants (Borde et al., 2010).However, Faycal
(2011) reportedthat the concentrations of both chlorophylls a and b in
tomatoesremained constant with time and there was no effect of AM or salt treatment.
There was also no significant difference in chlorophyll content between mycorrhizal
and non-mycorrhizal citrus plants under saline conditions (Murkute et al., 2006).
Increase in salinity stress caused a corresponding rise in proline concentration (Garg
and Manchanda, 2009). Mycorrhizal wheat plants exhibited increased proline levels
compared to uninoculated controls (El-Amriet al., 2013). It has been reported that
Page 44
20
application of mycorrhizae improved tolerance of wheat genotypes to salt stress by
maintaining osmotic balance and reducing the free radicals damage induced by osmotic
stress (Garg & Manchanda, 2009). Under salinity stress, AMF application increased
the accumulation of proline in soybean (Sharifi et al., 2007). However, there was no
significant difference in the proline levels between mycorrhizal and non-mycorrhizal
bean plants subjected to salt stress (Younesi & Moradi, 2014). Conversely, Rabie and
Almadini (2005) and Bhosala and Shinde (2011) reported that non-AMF pigeon peas
and Ginger plants accumulated more proline than AMF plants under salinity stress.
There was a significant increase in electrolyte permeability in the root plasma
membranes when the tomato plants were treated with salt and AMF (Huang et al.,
2013).Arbuscular mycorrhiza fungi was reported to have a regulatory and stimulatory
influence on protein, sucrose, glucose and glycine-betaine (GB) synthesis which play
a role in osmotic adjustment that helps plant to perform normally under salinity (Evelin
et al., 2009).
2.2.4 Effect of Salt Stress on Arbuscular Mycorrhizal Colonization
Conflicting reports have been made on the role of salinity in mycorrhizal hyphal
colonization.Soil salinity slowedmycorrhizal root colonization, spore germination and
hyphal growth. Salinity was reported to delay early stages of symbiosis of AM fungi
rather than inhibiting the symbiosis (Juniper & Abbott, 2006).
Other studies however have not shown a reduction in AM colonization under salinity
stress and some even reported an increase in sporulation and colonization. The
colonization percentage of tomato was found to be three times higher in salt than non-
salt treated plants after eight weeks of growth, and two times higher after ten weeksof
growth. There was a significant effect of time on hyphal, vesicular and arbuscular
density. The AMF colonization ratios werehigher in tomatoes inoculated with AMF
under saline condition compared with non-inoculated treatments (Huang et al.,
2013).In non-salinised bean plants, mycorrhizal inoculation produced active
colonisation. The level of colonisation in roots of mycorrhizal plants decreased
significantly with increasing NaCl concentration (Younesi & Moradi, 2014).
Page 45
21
2.2.5 Effect of Salt Stress and Arbuscular Mycorrhizal Inoculation on the Nutrient
Uptake of Seedlings
As can be expected, salt stress increases the sodium content in both the roots and shoots
of plants. However, mycorrhizal inoculation reduces the accumulation of sodium under
saline conditions. In a study in China, both tomato varieties TSS7 and TCAV10 grown
under saline stress coupled with AMF-2 inoculation showed diminished Na content in
their shoots, fruits and roots when compared with the non-inoculated hybrid cultivars
(Huang et al., 2013). In common beanstudy in Egypt, sodium content was higher in
non-mycorrhizal than mycorrhizal plants (Younesi & Moradi, 2014).Lower sodium
content by mycorrhizal plants under salinity stress was been reported by Sharifi et al.,
(2007),Colla et al., (2008), Evelin (2009) and El-Amri et al., (2013).
The foliar calcium content in common beans decreased with increasing
salinity.However,mycorrhizal plants showed higher calcium than non-mycorrhizal
plants (Younesi & Moradi, 2014). The calcium content in the shoots of mycorrhizal
tomato plants was higher than in non mycorrhizal plants (Faycal, 2011). Similarly, in
wheat, lettuce and onions, the calcium concentration was higher in mycorrhizal plants
under salinity stress, and corresponded to increased mycorrhizal colonization and
sporulation (El-Amri et al., 2013). However, Huang et al.,(2013) reported that the shoot
calcium concentration was unaffected by either salinity or mycorrhhizal treatments.
The potassium content in common beans declined as salinity increased with
mycorrhizal plants having higher potassium content than non-mycorrhizal plants
(Younesi & Moradi, 2014). Similarly, mycorrhizal wheat plants had higher potassium
than non-mycorrhizal plants under salt stress (El-Amri et al., 2013). The potassium
content of non mycorrhizal tomato plants declinedafterfour and eight weeks salinity
stress while that of mycorrhizal plants remained unchanged (Faycal, 2011). This is in
contrast to findings in tomatoes by Huang et al., (2013) that the potassium content was
not affected by salinity in non-mycorrhizal plantsbut declined in mycorrhizal plants.
The magnesium content of tomato roots was increased by salinity treatment with
mycorrhizal plants accumulating more magnesium in the roots compared to non-
Page 46
22
mycorrhizal plants (Huang et al., 2013). A similar observation was made by Faycal
(2011) who found that mycorrhizal plants had higher magnesium content in contrast to
non mycorrhizal plants under salinity stress. However, in tomato shoots, Huang et al.
(2013) found that the Mg concentration was similar among the treatments.
In common beans, the phosphorus content declined under saline conditions.However,
the highest concentration of phosphorus was observed in plants inoculated with G.
mosseae (Younesi & Moradi, 2014).In wheat, the phosphorus content declined with
increased salinity in non-mycorrhizal treatments but in mycorrhizal treatments, the
levels remained unchanged (El-Amri et al., 2013). Similarly, mycorrhizal tomato
varieties TSS7 and TCAV10 showedenhanced P content in their shoots (24.0 and
47.6%, respectively), fruits (47.4 and 21.2%, respectively) and roots (<1.0 and 9.1%),
respectively, when compared to non-mycorrhizal plants subjected to salinity treatment
(Huang et al,. 2013). Faycal (2011) showed the P concentrationto be higher in AM than
non-AM salt treated roots.These results are consistent with findings by Muok and Ishii
(2006); Rabie and Almadini (2005).
In common beans, 22.38% and 47.55% reduction in foliar N concentration was caused
by medium and severe salinity levels as compared with the control (non-salt stress).
Mycorrhizal inoculation was the most effective treatment for increasing the foliar N
concentration (Younesi & Moradi, 2014). In tomato study in China, mycorrhizal plants
had higher nitrogen content in relation to non-mycorrhizal plants, irrespective of
whether they were raised under saline or non saline conditions (Huang et al., 2013).
2.3 Effect of Arbuscular Mycorrhizal Inoculation on the Survival and Growth of
Tropical Fruit Seedlings under Flooding Stress
2.3.1 Introduction on Flooding Stress
Flooding sets in motion a variety of physical, chemical and biological processes that
alter the capacity of soils to support plant growth. Shortly after the soil is flooded, the
remnant oxygen is depleted by the respiration of roots and micro-organisms and the
environment becomes hypoxic (i.e. oxygen levels limiting respiration) and later anoxic
(i.e. respiration is completely inhibited) (Wegner, 2010). As flooding time increases,
Page 47
23
progressive decrease in the soil reduction-oxidation potential (redox potential) occurs.
This allows potentially toxic compounds such as sulfides, CO2, soluble Fe and Mn,
ethanol, lactic acid, acetaldehyde, acetic and formic acid to accumulate in the soil and
rhizosphere (Fiedler et al., 2007).
Plants develop a variety of anatomical, morphological and physiological responses in
order to deal with partial submergence imposed by flooding. The most common
anatomical response is the generation of aerenchyma in tissues, which facilitates the
transport of oxygen from shoots to roots (Colmer & Voesenek, 2009). The mechanisms
responsible for aerenchyma have not yet been fully elucidated although it is known to
involve ethylene, which accumulates in submerged organs. In hypoxic roots of maize,
exogenous ethylene induced aerenchyma formation while ethylene inhibitors repressed
its development. In addition, both 1-aminocyclopropane-1-carboxylate (ACC)
synthase activity and ACC concentrations have been found to be high in hypoxic maize
roots (Geisler-Lee et al., 2010). In rice stems, Parlanti et al., (2011) demonstrated that
aerenchyma formed in response to ethylene and H2O2.
At physiological level, flooding modifies water relations and plants carbon fixation.
Closing of stomata, with or without leaf dehydration, reduction of transpiration and
inhibition of photosynthesis are responses that can occur within hours or days,
depending on the tolerance to flooding of each plant species (Mollard et al., 2010).
Flooding causes a reduction in water uptake by plant roots. In flood sensitive species
like Solanum lycopersicum, Pisum sativum, Helianthus annuus and Nicotiana
tabacum, a few hours after the soil becomes flooded, the water uptake by roots declined
due to a reduction of the root hydraulic conductivity (Islam & McDonald, 2004).
At morphological level, responses to flooding include formation of adventitious roots.
These adventitious roots, which have high porosity, help plants to continue with water
and nutrient uptake under flooding conditions (Colmer & Voesenek, 2009). In soya
beans subjected to flooding, adventitious roots comprised about 90% of the total root
length (Hattori et al., 2013). As a morphological adaptation to flooding, the rapid
emergence of adventitious roots has been reported in Sesbania andPterocarpus
officinalis Jacq. (Shiba and Daimon, 2003) and azuki beans (Komori et al., 2010).
Page 48
24
Another morphological change is the increase in plant height. Rumex palustris was
reported to be taller than its non-flooded counterparts as a result of increase in the
insertion angles and length of their aerial organs (Heydarian et al., 2010). In Paspalum
dilatatum, the first morphological response to flooding was the increase in the tiller
insertion angle followed by the elongation of the leaf sheaths, and lastly elongation of
leaf blades (Mollard et al., 2010).
Prolonged flooding reduced the rate of stem thickening in most flood-intolerant species
but increased thickening in flood-tolerant plants. The promotion of shoot elongation by
submergence occurred in wetland and amphibious species over a wide taxonomic range
in China e.g. Rumex palustris, Ranunculus sceleratus, Nymphoides peltata,
Potamogeton pectinatus and P. distinctus (Mommer & Visser, 2005). Elongation has
been reported in the internodes of rice under submergence. Soya bean study in Japan
indicated that flooding reduced stem growth, inhibited leaf elongation, led to leaf
yellowing, lowered photosynthesis, reduced root growth and ultimately, lowered
nutrient uptake (Hattori et al., 2013).
Soil inundation inhibited root formation and branching, reduced growth of existing
roots, induced root decay and decreased the root/shoot ratio. In maize, short term
reduction in root and leaf growth rates began within 1.12 hours of flooding. Almost
immediately, leaf elongation ceased and N, P, and K concentration in leaves decreased,
but in roots N, P and K concentrations increased. Flooding resulted in loss of nitrogen
through denitrification and leaching. Oxygen deficiency decreased the rate at which
ammonium and nitrate are supplied to plants resulting in nitrogen deficiency in
waterlogged soils (Ashraf & Harris, 2004).
2.3.2 Effect of Flooding Stress on Arbuscular Mycorrhizal Colonization
Arbuscular mycorrhiza fungi were historically thought to be rare in wetland ecosystems
because the soils of wetlands are often saturated and subsequently lack available
oxygen for aerobic soil microorganisms (Dolinar & Gaberˇsˇcik, 2010). As a result,
little attention was given to research on mycorrhiza fungi in aquatic and wetland
habitats (Stevens et al., 2011). However, an increasing number of studies have revealed
Page 49
25
that AM fungi exist in wetland habitats (Stevens et al., 2010). Many of these studies
indicate that flooded conditions reduce, but do not completely inhibit mycorrhizal
colonization. For example, a rice study in Iran showed that root colonization by AMF
is decreased by flooding conditions from 43% to 27% (Hajiboland et al., 2009).
Similarly, in six aerobic rice genotypes, relatively high colonization of roots (28-57%)
were observed (Gao et al., 2007). Several wetland plant species that were thought to be
nonmycorrhizal have been found to have high levels of AM fungi colonization. For
example, 23 AMF phylotypes were detected in samples of 27 roots from three
mangrove speciesin China (Wang et al., 2011).
Flooding has been shown to inhibit AM fungal root colonization in purple nutsedge
(Muthukumar et al., 1997). In snap beans, percent root colonization was not affected
by flooding (Sah et al., 2006). This observation is consistent with wetland studies by
Miller and Sharitz (2000) who reported that flooding inhibited initial root colonization
in semiaquatic grass but once mycorrhizae were established, flooding had no effect.
In Ullapara, Bangladesh, abundant AM spores were observed in flooded farmers’
fields. Heavy colonization was subsequently observed in onion roots grown after the
flood water subsided. The spore population subsequently increased in the rhizosphere
soils of onion (Khanam, 2008).In soya beans, the AM colonization ratio reduced from
12.5% (in the primary and lateral roots) and 14.5% (in the adventitious roots) in
unflooded treatments to 0.8% and 7.5 % in flooded treatments, respectively (Hattori et
al., 2013).
2.3.3 Effect of Arbuscular Mycorrhizal on Growth and Nutrient Uptake of
Seedlings under Flooding Stress
The leaf chlorophyll content of both mycorrhizal and non-mycorrhizal rice plants was
significantly reduced when roots were subjected to flooding stress. Despite this,
mycorrhizal plants had higher chlorophyll content in relation to non-mycorrhizal plants
under flooding stress. In snap beans, two periodic short-term flooding events
significantly reduced root length below that of non flooded plants. Mycorrhizae-treated
plants had the greatest height, biomass and leaf area in relation to nonflooded plants
Page 50
26
(Sah, et al., 2006).In rice, mycorrhizal colonization significantly contributedto uptake
of P and K in flooded but not in non-flooded plants (Hajiboland et al., 2009). Under
flooded conditions, Gao et al., (2007) reportedthat mycorrhizal inoculation increased
Zn uptake.
2.4 Effect of Arbuscular Mycorrhizal Inoculation on Growth and Nutrient Uptake
of Tropical Fruit Seedlings
2.4.1 Role of Arbuscular Mycorrhiza on Physical Growth of Plants
Mycorrhiza inoculation increased the plant height, stem diameter, leaf number, flag
leafwidth, number of grains per plant, 100-seed weight and protein percent values of
sweet corn in USA (Tas, 2014). Similar observations in corn were made by Qiao et al.,
(2011) in pigeon peas, Al-Karaki (2013) in sour oranges and Suri and Choudhary
(2013) in soybeans.
In sweet basil (Ocimum basilicum) research in Iran, AMF inoculation significantly
increased plant height, fresh and dry matter, oil content and oil yield as compared to
non-inoculated plants. The shoot fresh weight was significantly increased by all three
mycorrhiza fungi species, but only inoculation with G. intraradices and G.
fasciculatum increased root dry weight. Additionally, oil composition, linalool and
methyl chavicol content was improved by AMF inoculation (Zolfaghari et al., 2013).
Likewise, Rasouli-Sadaghiani et al., (2010) showed that mycorrhizal basil plants had
significantly higher shoot and root dry weight and plant height.
In linseed (L. usitatissimum) study in India, the fresh and dry weights of shoots and
roots, the chlorophyll content and the root lengths were significantly increased after
120 days of Glomus mosseae and Acaulospora laevis inoculation (Neetu et al., 2012).
Studies showed that cotton plant biomass increased significantly when the plants were
inoculated with AM fungi (Sridevi & Ramakrishnan, 2010).
In a study in tea in India, Tomanr et al. (2012) reported that plants inoculated with AM
fungi had increased caffeine and catechin content. Similarly, AM fungi-treated tea
plants showed increased total polyphenols than non-inoculated plants. 31% and 100%
Page 51
27
increase in amino acids and total protein content were observed in mycorrhizal plants
over non-mycorrhizal control. Maximum increase in total polyphenols (15%) and
caffeine content (34%) were found in mycorrhizal plants over non-mycorrhizal controls
(Singh et al., 2010). Several fold increase in caffeine content in plants inoculated by
AM fungal spores have been reported (Gogoi & Singh, 2011).
Plum trees inoculated by mycorrhizal fungi had greater trunk cross-sectional-area than
the control (Świerczyński & Stachowiak, 2010). In Schefflera cuttings, using
mycorrhizal fungi in the rooting substrate increased root initiation, number of rooted
cuttings, total root length and number of roots per cutting compared to non-mycorrhizal
controls (Fatemeh & Zaynab, 2014). Endomycorrhiza enhanced adventitious root
formation and facilitated root initiation and root development of cuttings. Combination
of mycorrhiza and auxins are reported to stimulate better root formation in difficult to
root plant species. AMF increased the length and fresh weight of geranium roots
(Nowak & Nowak, 2013).
Arbuscular mycorrhizal inoculation has been reported to improve the yield and quality
of soybeans (Suri & Choudhary, 2013), chick peas (Yaseen et al., 2012), pigeon peas
(Qiao et al., 2011), sour oranges (Al-Karaki, 2013), Jew’s mallow (Nwangburuka et
al., 2012), sunflower (Vaseghmanesh et al., 2014) and temulawak (Samanhudi et al,
2014).
2.4.2 Role of Arbuscular Mycorrhiza on Nutrient Uptake of seedlings
2.4.2.1 Role of arbuscular mycorrhiza in the Uptake of Phosphorus
Phosphorus is one of the most critical elements required for plant growth, making up
about 0.2% of dry weight of plant tissues. Although in soil it may be present in
relatively large quantities, it is one of the most difficult nutrients for plants to acquire
(Smith & Smith, 2011). This is because a huge proportion of soil phosphorus is
unavailable or poorly available because of the very low solubility of phosphates of iron,
aluminum and calcium, leading to soil solution concentrations of 10 μm or less.
Phosphorus has very low mobility (Schachtman et al., 2008). Frequently, direct uptake
of orthophosphate (Pi) by root epidermal cells through the direct pathway is not
Page 52
28
matched by its replacement leading to the development of phosphorus depletion zones
in the rhizosphere. The concentration of orthophosphate (Pi) ions is about 1,000-fold
higher in root cells than in the soil solution, further compounding the challenge and
making uptake more difficult (Bucher, 2007).
Plants have evolved strategies to increase either phosphorus uptake or availability in
the soil. One of these strategies is the mycorrhizal uptake pathway. In this pathway,
orthophosphate Pi is taken up into AM fungal hyphae by fungal transporters located
several centimeters from the root. It is then translocated to intracellular fungal
structures (arbuscules and hyphal coils) in root cortical cells containing specialized AM
fungus-plant interfaces. Release of Pi and uptake by the host plant takes place in these
interfaces. AM-inducible plant PiT genes, which are different from those in the direct
pathway, are expressed, sometimes exclusively, in the colonized cortical cells. These
PiT genes are involved in the uptake of Pi released by the fungi and have been shown
to occur in all potentially AM plants investigated, regardless of their responsiveness to
AM fungal colonization (Bucher, 2007).
The major advantage of the AM symbiosis for plants in acquiring P is that AM fungi
provide a very effective pathway by which P is scavenged from large volumes of soil
and rapidly delivered to cortical cells within the root (Smith & Smith, 2011). This is
because individual fungal hyphae have much smaller diameters than roots, therefore
allowing access to narrower soil pores and increasing the soil volume explored (Smith
& Read, 2008; Schnepf et al., 2011). However, the extent to which an AM plant grows
better than a nonmycorrhizal counterpart depends in part on the size of its root system,
including numbers and extent of root hairs (Smith & Smith, 2011). Plants with low
root-shoot biomass ratios, slow root growth rates, and/or poor development of root
hairs show relatively larger growth increases with mycorrhizal inoculation (Smith &
Read, 2008).
Inoculating soil with AM fungi and different levels of superphosphate improved P
content in Linseed (Linum usitatissimum) roots and shoots (Neetu et al., 2012). A
significant increase in shoot P concentration was observed when L. usitatissimum was
inoculated with G. mosseae or G. intraradices and their combination (Rydlová et al.,
Page 53
29
2011). Symbiosis between mycorrhizal fungi and Zea mays roots caused better
phosphorous absorption by extending hyphae into the soils (Ghorbanian et al., 2011).
In addition to increasing absorption surface in mycorrhizal root systems, mycorrhizal
plants increased uptake of P from poorly soluble P sources, such as iron and aluminum
phosphates and rock phosphate. Solubilization of soil P is achieved by rhizospheric
modifications through the release of organic acids, phosphatase enzymes and some
specialized metabolites like siderophores (Shenoy & Kalagudi, 2005).
Despite the advantages of AM on phosphorus acquisition, growth differences between
mycorrhizal and nonmycorrhizal plants tend to disappear as available soil P in the soil
increases (Smith & Read, 2008). Research in sunflower in Iran indicated that the
highest seed yield, biological yield, seed hollowness and 1000-seed weight occured
with application of 0 kg P/ha and mycorrhiza treatment. Treatment combinations of
mycorrhiza and 200 kg P/ha and nonmycorrhizal 200 kg P/ha combination did not show
significant difference in terms of seed yield of sunflower(Vaseghmaneshet al., 2014).
Very high P application alters root colonization (particularly reducing arbuscule
development) and decrease AM fungal biomass per plant, including both biomass in
roots and in soil (Smith & Read, 2008). Reduction in appressorium formation was
reported in pea (Pisum sativum) roots at high P (Balzergue et al., 2011). High P levels
in the soil can reduce spore germination and hyphal growth from the germinated spores
and inhibit early colonization of the roots and growth of the extraradical mycelium
(Smith & Smith, 2011). Similarly, Graham and Eissenstat (1998) reported that in high
P fertility regime, mycorrhizae act as a carbon drain on citrus and therefore becoming
parasitic to the host plant. The expression of genes encoding high-affinity Pi
transporters (PiTs) in cells were reduced by high P supply (Smith & Smith, 2011).
2.4.2.2 Role of arbuscular mycorrhiza in the uptake of nitrogen
Like in the case of phosphorus, the major benefit of mycorrhiza in increasing uptake of
N to plants is by availing greater soil exploration and supply to host roots (Sundar et
al., 2010). Nitrogen uptake was significantly increased in mycorrhizal chickpea plants
in Pakistan (Yaseen et al., 2012). However, there is information on the negative effects
Page 54
30
of nitrogen fertilization on mycorrhizal formation. High level of nitrogen fertilization
in wheat decreased spore numbers and colonization by mycorrhizal fungi (Smith &
Read, 2008). Similarly, a study across North American grasslands showed that nitrogen
fertilization reduces AM hyphal densities in phosphorus rich soil, but increases AM
hyphal densities when phosphorus is in limited supply (Johnson et al., 2010).
2.4.2.3 Role of arbuscular mycorrhiza in the uptake of Ca, K and Mg
Calcium and magnesium uptake were significantly increased in mycorrhizal chickpea
plants (Yaseen et al., 2012). This was attributed to greater soil exploration and
increased uptake of K, Mg and Ca and supply to the host roots (Sundar et al., 2010).
Uptake of K was increased by AMF inoculation in cowpea and sorghum (Bagayoko et
al., 2000), decreased in millet (Bagayoko et al., 2000) and was unchanged in barley
(Mohammad et al., 2003).
Page 55
31
CHAPTER THREE
MATERIALS AND METHODS
3.1 Study Sites
The study sites were in Jomo Kenyatta University of Agriculture and Technology
(JKUAT), Juja in Kiambu County (1255 m asl, 1.03°S, 37.01°E) and University of
Eldoret (UoE), Uasin Gishu County (2073 m asl, 0.5°N, 35.3E°).
3.2 Seed Germination
Passion fruit (Passiflora edulis var edulis (purple)), mango (Mangifera indica var
kent), rough lemon (Citrus jambhiri) and papaya (Carica papaya var Mountain) seeds
were germinated in sterile sand.Uniform seedlings were then selected and transferred
to the holding media in 5 liter polythene pots (20 cm in diameter and 25 cm depth) and
raised inside a polyethylene-covered greenhouse.
3.3 Mycorrhizal Inoculum Content
Plate 3.1: Inoculum substrate containing approximately 200 spores of arbuscular
mycorrhiza fungi
Page 56
32
At transplanting, seedlings were inoculated with 50g of AM inoculum
containingapproximately 200 spores of a mixture of Glomus caledonium, G.
etunicatum, Gigaspora magarita and Scutellospora sp(supplied by Dudutech,
Naivasha, Kenya) (Plate 3.1).
3.4 Treatments and Experimental Design for Salinity Stress Experiment
The experiment was set up in sterilized low nutrient sand and red soil media (1:1
vol/vol) using passion fruit and mango seedlings. The passion fruit experiment was laid
out in Completely Randomized Design consisting of treatment combinations of AM
inoculation and un-inoculated, no salinity and salinity at two levels 4.9 and 9 dS/m
respectively, (corresponding to 3 and 9 grams NaCl per litre of irrigation water,
respectively) with four replications per treatment. In mangoes, the treatment
combinations were AM inoculation and un-inoculated, no salinity and salinity at two
levels 4.9 and 9 dS/m and two seed conditions (with endosperm and endosperm
removed) with four replicates per treatment. The salinity effect was achieved by adding
NaCl solution to the potting media starting 4 weeks after mycorrhizal inoculation.
Three hundred mls of NaCl dissolved in water and made to the respective
concentrations was applied weekly.The experiment was terminated and biomass
harvested when severe symptoms of salt stress (> 50% burned leaf surface and/or leaf
abscission) was observed.
3.5 Treatment and Experimental Design for Flooding Stress Experiment
The experiment was set up in sterile sand using passion fruit seedlings. The seedlings
were raised in unflooded conditions for twelve weeks before flooding was initiated.
The flooding experiment was set up as a Completely Randomized Design for flooding
periods of 7, 14, 21 and 28 days, for both mycorrhizal and non mycorrhizal treatments
using ten replicates per treatment. Mycorrhizal and non-mycorrhizal seedlings were
also held in unflooded conditions for similar experiment period to act as the controls.
The flooding experiment was set up by placing the potted seedlings in wide, non-
perforated wooden structures supported by polythene to hold the water (Plate 3.2).
Water was regularly piped into the structure so that the pots were covered by water to
Page 57
33
about 2 cm above the surface. This water level was maintained throughout the flooding
period.
3.6 Treatments and Experimental Design for Nutrient Stress Experiment
The experiment was set up in sterile sand using passion fruits, mangoes, avocado,
lemons and papaya seedlings. The experiments were laid out as a Completely
Randomized Design consisting of two kinds of AM inoculation (AM inoculated and
un-inoculated) and four phosphorus concentrations (0, 0.44, 0.88 and 1.68 mg/ml) with
six replicates per treatment. The plants were watered once a week with 300 mls of half
strength Hoagland’s nutrient solution (Millner and Kitt, 1992) modified to the
respective P concentrations (Table 3-1).
Plate 3.2: Flooding initiated by placing the pots in wooden beds lined with
polythene to hold water
An experiment was also laid out in low nutrient soil and sand media (1:1 vol/vol)
consisting of two kinds of AM inoculation (AM inoculated and un-inoculated) and two
media conditions (sterile and non-sterile) with six replicates per treatment (Table 3-2).
Page 58
34
3.7 Plant Growth Measurements
Weekly measurements were taken on plant height and leaf number, starting two weeks
after inoculation till termination of experiments (16 weeks for flooding and salinity and
20 weeks and 18-32 weeks for nutrient stress experiments). At seedling harvest,
measurements were taken on leaf area, chlorophyll content and leaf, stem and root fresh
and dry weights. The chlorophyll estimation was done by using only tender leaves
using a leaf chlorophyll meter.
3.8 Nutrient Analysis Determinations
Table 3.1: Composition of the liquid fertilizer (Hoagland’s nutrient solution) used
in the experiments to study the effect of root-zone flooding and nutrient stress
onmycorrhizal and non-mycorrhizal seedlings
Mineral element g/500 ml deionised water Final
concentration (µM)
Ca(NO3)2.4H2O 118.10 5000
KNO3 50.55 5000
MgSO4 124.24 2000
KH2PO4 6.81 20
NaFeEDTA 1.84 100
Na2MoO4.2H2O 0.24 0.4
H2BO3 3.09 20
NiSO4.6H2O 0.26 0.4
ZnSO4.7H2O 1.44 1
MnCl2.4H2O 1.98 2
CuSO4.5H2O 0.62 1
CoCl2.6H2O 0.24 0.4
Page 59
35
Oven-dried shoots were ground with a mortar and pestle and 1 gram from each seedling
weighed and dry-ashed by heating for 5 hours at 550ºC in a muffle furnace. The ash
was taken up in 20% HCl and the solution made up to 20 mls with distilled deionised
water. Two hundred microliter aliquots from these solutions were further diluted to 10
mls before analyzing for Ca, Mg, Na and K by atomic absorption spectrophotometry.
Phosphorus, as molybdate-reactive P was measured by blue colorimetry at 730 nm
using a spectrophotometer. The nitrogen estimation was done by micro Kjeldahl
method.
Table 3.2: Nutrient analysis results for soil: sand mixture
PARAMETER METHOD RESULT UNITS
pH pH meter 6.18
Conductivity EC meter 0.17 mmhos/cm
Organic Matter ICARDA 2.21 %
Total N Macro Kjeldahl 0.64 %
Phosphorus as P UV-VIS Spectrometry 9.48 mg/kg
Sodium Flame emission spectrometry 272.67 mg/kg
Potassium Flame emission spectrometry 263.81 mg/kg
Calcium Flame emission spectrometry 1179.48 mg/kg
Magnesium UV-VIS Spectrometry 240.71 mg/kg
Aluminium Flame emission spectrometry 943.54 mg/kg
Iron Atomic Absorption Spectrometry 97.48 mg/kg
Manganese UV-VIS Spectrometry 193.33 mg/kg
Copper Atomic Absorption Spectrometry 5.13 mg/kg
Boron Atomic Absorption Spectrometry 0.56 mg/kg
Zinc Atomic Absorption Spectrometry 4.73 mg/kg
CEC Calculated 9.81 me/100g
Ca:Mg Calculated 4.9
3.9 Evaluation of Mycorrhizal Root Infection Levels
At seedling harvest, root tips (1 ± 0.2 cm) were excised and cleared by autoclaving in
10% KOH followed by staining in 0.05% tryphan blue, glycerol and lactic acid (1:1:1)
Page 60
36
solution. The frequency of mycorrhizal infection was noted per field (10 grids) for 10
fields, using the grid intersect method (Giovannetti and Mosse, 1980). To convert the
data into percent infection, the frequency of infection as a fraction of the total number
of grids observed was multiplied by 100.
3.10 Determination of the Soil Mycorrhizal Colonization
The isolation of AM fungal spores was carried out by the wet-sieving and decanting
method of Gerdemann and Nicolson (1963). 25 g of soil were mixed with 500 ml of
water in a beaker and stirred with a glass rod to make a uniform suspension. The
suspension was left for five minutes to allow the mycorrhizal debris to float to the top.
The suspension was then passed through different sieves (500, 300, 250, 125, 105 and
45 µ mesh sizes). This process was repeated 8-9 times to trap all spores of AM fungi.
The population of AM fungi was then determined by the grid intersect method. A piece
of paper was cut according to the diameter of the Petri dish and 1 cm2 grids were made
on it. The spores present per cm2 were counted under compound microscope (100-
1000X).
3.11 Determination of Chlorophyll and Carotenoids Content
The chlorophyll a and b were determined according to the methods of Arnon (1949)
and carotenoids according to Davies (1976). The fresh leaves were cut to 0.5cm
segments and extracted overnight in 80% acetone at -10°C. The extract was centrifuged
at 14000 x g for 5 minutes and the absorbance of the supernatant was read at 480, 645
and 663 nm using a spectrophotometer. The chlorophyll a, b and the total chlorophyll
and carotenoids were calculated using the formula below:
Chl a = [12.7 (OD 63 – 2.69 (od 645)] x V/1000 x W
Chl b = [22.9 (OD 645 – 4.68 (od 663)] x V/1000 x W
V = volume of the extract (mls)
W = weight of the fresh leaf tissue (grams)
Page 61
37
Carotenoids gml-1 = Acar/Em x 100
Where Acar = OD 480 + 0.14 (od 663) – 0.638 (OD 645)
E100%cm = 2500
3.12 Determination of Proline and Total Soluble Sugars:
Free proline and total solublesugars were extracted from 1 g of fresh roots and leaves
(Blighand Dyer, 1959). Proline was estimated by spectrophotometricanalysis at 515
nm of the ninhydrin reaction, according to Bateset al. (1973). Soluble sugars were
analyzed by 0.1 ml of thealcoholic extract reacting with 3 ml freshly prepared
anthrone(200 mg anthrone + 100 ml 72% (w:w) H2SO4) and placed in a boilingwater
bath for 10 min according to Irigoyen et al. (1992). Aftercooling, the absorbance at 620
nm was determined in a spectrophotometer. The calibration curve was made
usingglucose in the range of 20–400 µg ml–1.
3.13 Statistical analysis
The data obtained was subjected to Analysis of Variance using Genstat software. All
treatment means were tested for Least Significant Difference (LSD) and the means
separated by Duncan’s Multiple Range (Little and Hills, 1978) at 95% and 99% level
of significance.
Page 62
38
CHAPTER FOUR
RESULTS
4.1 Effect of Arbuscular Mycorrhizal Fungi on Salt Stress of Passion Fruits and
Mango Seedlings
The following are results of studies on the influence of AM fungi on salinity stress of
passion fruits and mango seedlings. Results are presented on mycorrhizal root
colonisation, plant height, leaf area, leaf number, chlorophyll content, fresh and dry
weights and leaf macronutrient contents.
Table 4.1: Effect of arbuscular mycorrhizal fungi and salinity stress on
mycorrhizal root colonisation, plant height, leaf number and chlorophyll content
of passion fruit seedlings
TREATMENTS Root Plant Leaf Leaf Chlorophyll
colonisation
%
Height
(cm) No.
Area
(cm2) (%)
Mycorrhizal, 0 dS/m EC 52.6 ± 5.4 59.0az 16.0a 642a 41.3a
Non-mycorrhizal, 0 dS/m
EC 0.0 50.4b 15.5ab 534.7b 43.3a
Mycorrhizal, 4.9 dS/m
EC 23± 3.1 47.8b 12.6c 464.3c 33.4b
Non-mycorrhizal, 4.9
dS/m EC 0.0 34.3c 14.2bc 323.2d 29.6b
Mycorrhizal, 9 dS/m EC 16 ± 1.6 23.5d 12.4c 235.7e 15.0c
Non-Mycorrhizal, 9 dS/m
EC 0.0 24.2d 4.0d 90.5f 17.3c
GRAND MEAN 39.9 12.4 381.7 30.0
LSD (p≤0.05) 7.4 2.3 52.1 5.2
CV (%) 12.5 12.3 9.2 11.6
zColumn values followed by different letters are significantly different at p<0.05 n=6)
KEY: dS/M = deciSiemens/metre, EC = Electrical Conductivity
Page 63
39
4.1.1 Mycorrhizal Root Colonisation Levels
Mycorrhizal root colonisation occurred in only the inoculated treatments (Table 4.1,
4.3). The unstressed mycorrhizal seedlings recorded higher colonisation compared to
salt stressed seedlings (Table 4.1, 4.3).
4.1.2 Plant Height (cm), Leaf Number, Leaf Area (cm2) and Chlorophyll Content
(%)
4.1.2.1 Passion Fruit Seedlings
In passion fruits, unstressed mycorrhizal plants (0 dS/M EC) had significantly higher
plant height and leaf area compared to unstressed non-mycorrhizal plants (0 dS/M EC)
(Table 4.1, Plate 4.1). However, there was no significant difference between the
unstressed treatments in leaf number and chlorophyll content (Table 4.1). Unstressed
mycorrhizal plants also had higher plant heights, leaf number, leaf area and chlorophyll
content compared to non-mycorrhizal plants subjected to both 4.9 and 9.0 dS/M EC
salt stress (Table 4.1,Plate 4.1). Unstressed mycorrhizal plants had significantly higher
plant height, leaf area and chlorophyll content compared to mycorrhizal plants
subjected to 4.9dS/M salt-stressed (Table 4.1, Plate 4.1). However, there was no
significant difference between the two treatments in leaf number (Table 4.1).
Unstressed mycorrhizal plants had significantly higher plant height, leaf number, leaf
area and chlorophyll content compared to mycorrhizal plants subjected to 9.0 dS/M EC
salt stress (Table 4.1). Mycorrhizal plants subjected to 4.9 dS/M EC salt stress had
significantly higher plant height, leaf area and chlorophyll content compared to
mycorrhizal plants subjected to 9 dS/M EC (Table 4.1). However, there was no
significant difference between the two treatments in leaf number (Table 4.1)
Mycorrhizal plants subjected to 4.9 dS/M EC salt stress had significantly higher plant
height and leaf area compared to non-mycorrhizal plants subjected to the same salt
stress treatment (Table 4.1). However, there was no significant difference in leaf
number and chlorophyll content between both mycorrhizal and non-mycorrhizal plants
subjected to 4.9 dS/M EC salt stress (Table 4.1). Mycorrhizal plants subjected to 4.9
dS/M EC salt stress had significantly higher plant height, leaf number, leaf area and
Page 64
40
chlorophyll content than non-mycorrhizal plants subjected to 9 dS/M salt stress (Table
4.1). Mycorrhizal plants subjected to 9 dS/M EC salt stress had significantly higher leaf
number and leaf area than non-mycorrhizal plants subjected to 9 dS/M salt stress (Table
4.1). However, there was no significant difference between the two treatments in plant
height and chlorophyll content (Table 4.1). Unstressed, non- mycorrhizal plants had
significantly higher leaf area and chlorophyll content than mycorrhizal plants subjected
to 4.9 dS/M salt stress (Table 4.1). However, there was no significant difference
between the two treatments in plant height and leaf number (Table 4.1). Unstressed,
non-mycorrhizal plants also had significantly higher plant height, leaf number, leaf area
and chlorophyll content than to mycorrhizal plants subjected to 9 dS/M salt stress, and
also compared to non-mycorrhizal plants subjected to both 4.9 and 9 dS/M salt stress
(Table 4.1).
Plate 4.1: Effect of arbuscular mycorrhiza fungi and salt stress in passion fruit
seedlings
KEY: dS/M = deciSiemens/metre, EC = Electrical Conductivity
-AM, 9
dS/M
EC
+AM,
4.9
dS/M
EC
+AM, 0
dS/M EC
Page 65
41
4.1.2.2 Mango Seedlings
In mangoes, unstressed mycorrhizal seedlings containing an intact endosperm had
significantly higher plant height, leaf number, leaf area and chlorophyll compared to
both non-mycorrhizal seedlings that were not subjected to salt stress and those
subjected to 4.9dS/M salt stress with and without the endosperm (Table 4.2, Plate 4.2).
Similarly, unstressed mycorrhizal seedlings which had the endosperm removed had
significantly higher plant height, leaf number, leaf area and chlorophyll compared to
both non-mycorrhizal seedlings that were not subjected to salt stress and those
subjected to 4.9 dS/M salt stress with or without the endosperm (Table 4.2).
Table 4.2: Effect of arbuscular mycorrhizal fungi, endosperm and salt stress on
the plant height, leaf number, leaf chlorophyll and root colonisation of mango
seedlings
Plant Leaf Leaf Chloro Root
Ht
(cm)
No. Area
(cm2)
phyll
(%)
Colonisation
%
Endosperm attached,
mycorrhizal, 0 dS/M
36.4az 14.7a 395a 51.5a 48.2 ± 3.4
Endosperm attached,
mycorrhizal, 4.9 dS/M
23.7bc 10.0cd 252.8c 28.9d 31.2 ± 3.2
Endosperm attached, non-
mycorrhizal, 0 dS/M
27.0b 11.8bc 304.8
b
43.1b 0.0
Endosperm attached, non-
mycorrhizal 4.9
18.2d 6.3e 141e 26.4de 0.0
Endosperm removed,
mycorrhizal, 0 dS/M
34.5a 12.8ab 407.4a 49.3ab 51.5 ± 2.3
Endosperm removed,
mycorrhizal 4.9 dS/M
20.8cd 9.0d 230.5c
d
30.5d 27.2 ± 4.7
Endosperm removed, non-
mycorrhizal 0 dS/M
20.1cd 10.0cd 195.1
d
39.0c 0.0
Endosperm removed, non-
mycorrhizal, 4.9
16.5d 5.7e 81.3f 20.3e 0.0
GRAND MEAN 24.9 10.0 249.0 36.1
LSD(p≤0.05) 5.4 2.0 51.1 6.9
CV (%) 14.9 13.5 14.1 13.1
zColumn values followed by different letters are significantly different at p<0.05 n=6)
KEY: * = dS/M = deciSiemens/metre, EC = Electrical Conductivity
Page 66
42
Under 4.9 dS/M salt stress, mycorrhizal mango seedlings containing an endosperm had
significantly higher plant height, leaf number and leaf area compared to non-
mycorrhizal seedlings subjected to 4.9dS/M salt stress with or without the endosperm,
but there was no significant difference in leaf chlorophyll content between the two
treatments (Table 4.2, Plate 4.2). Similarly, under 4.9dS/M salt stress, mycorrhizal
seedlings without the endosperm had significantly higher leaf number, leaf area and
chlorophyll compared to non-mycorrhizal seedlings without the endosperm subjected
to 4.9dS/M salt stress, but there was no significant difference in plant height between
the treatments (Table 4.2).Under both non salt-stress and 4.9dS/M salt stress, there was
no significant difference in plant height, leaf number, leaf area and chlorophyll content
between mycorrhizal plants with and without an endosperm attachment (Table 4.2,
Plate 4.2).
Plate 4.3 Effect of AM fungi and salinity on the growth of mango seedlings
Plate 4.2: Effect of arbuscular mycorrhizal fungi and salt stress on mango
seedlings
KEY: * dS/M = deciSiemens/metre, EC = Electrical Conductivity
+AM, +ED,
0 dS/M EC -AM, -ED,
0 dS/M EC
+AM, +ED,
4.9dS/M EC
-AM, -ED,
4.9 dS/M EC
Page 67
43
Under non salt-stress conditions, mycorrhizal seedlings that contained an endosperm
and those without the endosperm had significantly higher plant height, leaf number,
leaf area and chlorophyll than mycorrhizal seedlings with and without the endosperm
subjected to 4.9 dS/M salt stress (Table 4.2). With endosperm attached, there was no
significant difference in plant height and leaf number between mycorrhizal plants
subjected to 4.9dS/M salt stress and unstressed, non-mycorrhizal plants (Table 4.2).
However, the unstressed non-mycorrhizal plants had significantly higher leaf area and
chlorophyll content than mycorrhizal plants subjected to 4.9dS/M salt stress when both
had endosperms (Table 4.2).
4.1.3 Fresh and Dry Weights
Under salt stress, non-mycorrhizal seedlings with endosperm had significantly higher
leaf number and leaf area than non-mycorrhizal seedlings without endosperm, although
there was no significant differences in plant height and chlorophyll content between
the two treatments (Table 4.2).
4.1.3.1 Fresh and dry weight of passion fruit seedlings
In passion fruits, AM inoculation increased the fresh and dry weights of the leaves,
stems and roots compared to non-mycorrhizal seedlings under both non-salt stress and
salt stress conditions (Table 4.3). Arbuscular Mycorrhizal inoculation increased the
fresh and dry weights of the leaves, stems and roots under non-stress soil conditions
compared to mycorrhizal seedlings subjected to 4.9dS/M and 9dS/M salt stress
conditions (Table 4.3). Similarly, mycorrhizal seedlings subjected to 4.9dS/M salt
stress had significantly higher fresh and dry weights compared to mycorrhizal seedlings
subjected to 9dS/M salt stress (Table 4.3).
Page 68
44
Table 4.3: Effect of arbuscular mycorrhizal fungi and saltstress on the fresh and
dry weights (g) of passion fruit seedlings
TREATMENTS Fresh weight (g)
Dry weight (g)
Leaves Stem Roots Leaves Stem Roots
Mycorrhizal, 0 dS/m EC 13.6az 5.4a 20.2a 3.4a 1.7a 6.4a
Non-mycorrhizal, 0 dS/m
EC 10.9b 3.7b 16.8b 2.8b 1.1bc 2.2b
Mycorrhizal, 4.9 dS/m EC 10.5b 3.1bc 14.5b 2.3c 0.9cd 1.6c
Non-mycorrhizal, 4.9 dS/m 7.9c 2.5c 11.3d 1.4d 0.8d 1.0d
Mycorrhizal, 9 dS/m EC 3.7d 1.7d 5.7e 1.1d 0.5e 0.7d
Non-Mycorrhizal, 9 dS/m
EC 2.2d 1.6d 5.2e 0.5f 0.3e 0.5d
GRAND MEAN 8.1 3.0 12.3 1.9 0.9 2.1
LSD(p≤0.05) 2.0 0.6 2.7 0.4 0.2 0.5
CV (%) 16.4 14.5 14.5 13.7 18 15.9
zColumn values followed by different letters are significantly different at p<0.05 n=6)
KEY: * = dS/M = deciSiemens/metre, EC = Electrical Conductivity
There was no significant difference in leaf, stem and root fresh weights, and stem dry
weights between unstressed non-mycorrhizal seedlings, and mycorrhizal seedlings
subjected to 4.9dS/M salt stress (Table 4.3). However, unstressed mycorrhizal
seedlings had significantly greater leaf and root dry weights, compared to mycorrhizal
seedlings subjected to 4.9dS/M salt stress (Table 4.3). Unstressed mycorrhizal
seedlings had significantly greater fresh and dry weights compared to mycorrhizal
seedlings subjected to 9 dS/M salt stress (Table 4.3). Mycorrhizal seedlings subjected
to 4.9dS/M salt stress had greater fresh and dry weights compared to non-mycorrhizal
seedlings subjected to 4.9dS/M and 9dS/M salt stress (Table 4.3). However, there was
no significant difference between seedlings subjected to 9dS/M salt stress, whether
mycorrhizal or non-mycorrhizal (Table 4.3).
4.1.3.2 Fresh and dry weight of mango seedlings
Page 69
45
In mangoes, arbuscular mycorrhizal inoculation of seedlings containing or without an
endosperm increased the leaf, stem and roots fresh and dry weights compared to non-
mycorrhizal seedlings with or without an endosperm under both non-stress and salt-
stress conditions (Table 4.4). Unstressed mycorrhizal seedlings containing and without
the endosperm had significantly higher fresh and dry weights in relation to mycorrhizal
seedlings subjected to 4.9dS/M salt stress (Table 4.4).There was no significant
difference between unstressed mycorrhizal plants, whether they contained an
endosperm or without the endosperm (Table 4.4). There was no significant difference
between 4.9dS/M-salt-stressed mycorrhizal plants, whether they contained an
endosperm or without the endosperm (Table 4.4).
Table 4.4: Effect of arbuscular mycorrhizal fungi, endosperm and salt stress on
the fresh and dry weights (g) of mango seedlings
Fresh weight (g) Dry weight (g)
Leaves Stems Roots Roots Leaves
Endosperm attached, mycorrhizal, 0
dS/M EC 9.1a 4.4a 10.7a 3.8a 3.2a
Endosperm attached, mycorrhizal, 4.9
dS/M EC 5.7b 2.0b 6.6b 2.2b 1.7b
Endosperm attached, non- mycorrhizal,
0 dS/M 6.1b 2.3b 6.6b 2.5b 1.9b
Endosperm attached, non-mycorrhizal,
4.9 dS/M 2.7d 1.0c 5.2c 1.4d 0.6d
Endosperm removed, mycorrhizal, 0
dS/M EC 8.8a 4.1a 10.2a 3.6a 2.9a
Endosperm removed, mycorrhizal, 4.9
dS/M EC 5.5b 1.8b 6.2b 2.0bc 1.5bc
Endosperm removed, non-mycorrhizal,
0 dS/M 4.1c 1.1c 3.8d 1.5cd 0.9cd
Endosperm removed, non-mycorrhizal,
4.9 dS/M 1.3e 0.4d 2.8d 1.0d 0.6d
GRAND MEAN 5.2 2.0 6.1 2.1 1.6
LSD(p≤0.05) 0.6 0.5 1.1 0.5 0.6
CV (%) 16.1 16.5 11.8 14.6 24.6 zColumn values followed by different letters are significantly different at p<0.05 n=6)
KEY: * = dS/M = deciSiemens/metre, EC = Electrical Conductivity
There was no significant difference in fresh and dry weights between unstressed non-
mycorrhizal plants and mycorrhizal plants containing or lacking an endosperm, but
Page 70
46
subjected to 4.9dS/M salt stress (Table 4.4). However, under 4.9dS/M salt stress,
mycorrhizal plants had significantly higher fresh and dry weights compared to
unstressed non-mycorrhizal that lacked the endosperm (Table 4.4). Under salt stress,
mycorrhizal seedlings had significantly higher fresh and dry weights compared to non-
mycorrhizal seedlings, where both either contained or lacked the endosperm (Table
4.4).
Under unstressed conditions, non-mycorrhizal seedlings containing an endosperm had
significantly higher fresh and dry weights compared to unstressed non-mycorrhizal
seedlings lacking an endosperm (Table 4.4).Under salt-stress, non-mycorrhizal
seedlings with an endosperm had significantly higher stem and root fresh weights and
root dry weights compared to non-mycorrhizal seedlings without an endosperm, but
there was no significant difference in leaf fresh and dry weights between the two
treatments (Table 4.4).
4.1.4 Leaf Nutrient Results
4.1.4.1 Leaf Nutrient of Passion FruitSeedlings
In mycorrhizal passion fruit seedlings, increase in salinity caused an increase in the
levels of Na and K, caused a reduction in the levels of Mg but did not affect the levels
of N, P and Ca (Table 4.5). There was no significant difference in the levels of N, P,
Ca and Mg between unstressed mycorrhizal plants and mycorrhizal plants subjected to
4.9dS/M salt stress (Table 4.5). There was no significant difference in the N, P and Ca
content between unstressed mycorrhizal seedlings and seedlings subjected to 9dS/M
salt stress ((Table 4.5). However, 9dS/M salt stressed mycorrhizal seedlings had
significantly higher K and Na content than unstressed mycorrhizal seedlings although
it had lower Mg content (Table 4.5). There was no significant difference in the N, P, K
and Ca content between mycorrhizal plants subjected to 4.9dS/M salt stress than those
subjected to 9dS/M salt stress (Table 4.5). However, mycorrhizal plants subjected to
4.9dS/M salt stress had increased Magnesium content while those subjected to 9dS/M
had significantly higher sodium content (Table 4.5). In non-mycorrhizal seedlings,
there was no significant difference in N, P, Ca and Mg between unstressed seedlings
Page 71
47
than seedlings subjected to 4.9dS/M salt stress (Table 4.5). However, unstressed
seedlings had higher K content, while seedlings subjected to 4.9dS/M had higher Na
content (Table 4.5). There was no significant difference in N and Ca content between
unstressed non-mycorrhizal seedlings and those subjected to 9 dS/M salt stress (Table
4.5). However, unstressed seedlings had significantly higher P, K and Mg content,
while seedlings subjected to 9dS/M salt stress had significantly higher Na content
(Table 4.5). There was no significant difference in N, P, K, Ca and Na content between
non-mycorrhizal plants subjected to 4.9dS/M salt stress than non-mycorrhizal plants
subjected to 9dS/M salt stress (Table 4.5). However, non-mycorrhizal seedlings
subjected to 4.9dS/M salt stress had significantly higher Mg content than non-
mycorrhizal plants subjected to 9dS/M salt stress (Table 4.5).
Table 4.5: Effect of arbuscular mycorrhizal fungi and salt stress on the leaf
nutrient content of passion fruit seedlings
N P K Ca Mg Na
Non-mycorrhizal, 0 dS/m EC 5.7az 0.5b 8.4b 2.3a 4.8ab 2d
Non-mycorrhizal, 4.9 dS/m
EC 5.0a 0.3bc 4.8c 2.5a 4.3b 8.7ab
Non-Mycorrhizal, 9 dS/m EC 5.2a 0.2c 3.7c 2.3a 3.1c 9.9a
Mycorrhizal, 0 dS/m EC 5.5a 0.9a 8.5b 2.2a 5.1a 2.2d
Mycorrhizal, 4.9 dS/m EC 5.1a 1.1a 12.8a 2.6a 4.4ab 5.2c
Mycorrhizal, 9 dS/m EC 5.2a 1.1a 14.7a 2.7a 3.4c 8.4b
GRAND MEAN 5.3 0.7 8.8 2.4 4.2 6.1
LSD(p≤0.05) 0.8 0.2 2.4 0.7 0.7 1.4
CV (%) 10.3 23.4 18.7 19.9 11.7 15.4
zColumn values followed by different letters are significantly different at p<0.05 n=6)
Under non-stress conditions, mycorrhizal seedlings had significantly higher P content
than non-mycorrhizal seedlings, while there was no significant difference between the
two treatments in N, K, Ca, Mg and Na levels (Table 4.5). There was no significant
difference in N and Ca content between unstressed, mycorrhizal seedlings and non-
mycorrhizal seedlings subjected to 4.9dS/M and 9dS/M salt stress (Table 4.5).
Unstressed, mycorrhizal seedlings had significantly higher P, K and Mg content, while
non-mycorrhizal seedlings subjected to 4.9dS/M and 9 dS/M salt stress had
Page 72
48
significantly higher Na content (Table 4.5). Mycorrhizal seedlings subjected to
4.9dS/M salt stress had significantly higher P, K and Na content than unstressed, non-
mycorrhizal seedlings (Table 4.5). However, there was no significant difference in N,
Ca and Mg between the two treatments (Table 4.5). Mycorrhizal seedlings subjected to
9dS/M had significantly higher P, K and Na, lower Mg content but no significant
difference in N and Ca content than unstressed, non-mycorrhizal treatment (Table 4.5).
Mycorrhizal seedlings subjected to 9dS/M salt stress had significantly higher P and K
content, and lower Mg content than non-mycorrhizal seedlings subjected to 4.9dS/M
salt stress (Table 4.5). However, there were no significant differences between the two
treatments in N, Ca and Na content (Table 4.5). Similarly, Mycorrhizal seedlings
subjected to 9dS/M salt stress had significantly higher P and K content than non-
mycorrhizal seedlings subjected to 9dS/M salt stress (Table 4.5). However, there were
no significant differences between the two treatments in N, Ca, Mg and Na content
(Table 4.5).
4.1.4.2 Leaf Nutrient Content of Mango Seedlings
In mangoes, there was no significant difference in N, P, K, Ca, Mg and Na levels
between unstressed mycorrhizal plants with an endosperm than unstressed mycorrhizal
plants without the endosperm attachment (Table 4.6). There was no significant
difference in all the nutrients between mycorrhizal plants subjected to 4.9dS/M salt
stress and containing the endosperm, and mycorrhizal plants subjected to 4.9 dS/M salt
stress, but without the endosperm (Table 4.6).Unstressed mycorrhizal plants containing
an endosperm had significantly higher P content compared to unstressed non-
mycorrhizal plants that contained an endosperm (Table 4.6). However, there were no
significant differences in the levels of N, K, Ca, Mg and Na between the two treatments
(Table 4.6).
Table 4.6: Effect of arbuscular mycorrhizal fungi, endosperm and salt stress on
the leaf nutrient content of mango seedlings
N P K Ca Mg Na
Endosperm attached,
mycorrhizal, 0 dS/M EC
4.2az 0.6a 4.7b 1.5a 3.4ab 1.2c
Page 73
49
Endosperm attached,
mycorrhizal, 4.9 dS/M EC 3.9a 0.8a 9.2a 1.6a 2.8bc 3.4b
Endosperm attached non-
mycorrhizal 0 dS/M EC 3.9a
0.4
b 4.9b 1.5a 2.9bc 1.2c
Endosperm attached, non-
mycorrhizal, 4.9 dS/M EC 3.5a
0.2
b 2.8c 1.5a 2.3cd 5.4a
Endosperm removed,
mycorrhizal, 0 dS/M EC 4.1a 0.6a 4.6b 1.6a 3.5a 1.2b
Endosperm removed,
mycorrhizal, 4.9 dS/M EC 4.0a 0.7a 8.9a 1.7a 2.9bc 3.3b
Endosperm removed, non-
mycorrhizal, 0 dS/M EC 3.3a
0.3
b 4.8b 1.5a 2.7cd 1.2c
Endosperm removed, non-mycorrhizal, 4.9 dS/M EC 3.0a
0.3b 2.5c 1.4a 2.1d 5.8a
GRAND MEAN 2.7 0.5 5.3 1.5 2.8 2.8
LSD(p≤0.05) 0.6 0.2 1.3 0.4 0.6 0.6
CV (%) 9.7 23.9 17.0 15.6 14.8 15.4
zColumn values followed by different letters are significantly different at p<0.05 n=6)
KEY: * = dS/M = deciSiemens/metre, EC = Electrical Conductivity
Compared to unstressed non mycorrhizal seedlings that did not have an endosperm,
unstressed mycorrhizal plants had significantly higher N, P and Mg, while there was
no significant difference between the two treatments in K, Ca and Na (Table 4.6).
Mycorrhizal plants subjected to 4.9dS/M salt stress with or without endosperm had
significantly higher K and Na levels than unstressed mycorrhizal plants (Table 4.6).
However, there was no significant difference between the two treatments in N, P, Ca
and Mg content (Table 4.6). Unstressed mycorrhizal plants had significantly higher N,
P, K, Ca and Mg than non-mycorrhizal plants subjected to 4.9dS/M salt stress, whether
with or without endosperm (Table 4.6). Mycorrhizal plants subjected to 4.9dS/M salt
stress with and without endosperm had significantly higher P, K and Na than unstressed
non-mycorrhizal plants containing an endosperm (Table 4.6). However, there were no
significant differences between the treatments in N, Ca and Mg content (Table
4.6).Mycorrhizal plants subjected to 4.9dS/M salt stress with and without endosperm
had significantly higher N, P, K and Na than unstressed non-mycorrhizal plants
containing an endosperm (Table 4.6). However, there were no significant differences
between the treatments in Ca and Mg content (Table 4.6).Mycorrhizal plants subjected
to 4.9dS/M salt stress with and without endosperm had significantly higher N, P and K
compared to non-mycorrhizal plants subjected to similar salt stress, with or without an
Page 74
50
endosperm but had significantly lower Na content (Table 4.6). However, there were no
significant differences between the treatments in Ca and Mg content (Table 4.6).
4.2 Results of Effects of Arbuscular Mycorrhizal Fungi on Flooding Stress of
Passion Fruit Seedlings
The following are results of studies on the influence of AM fungi on flooding stress of
passion fruits seedlings. Results are presented on mycorrhizal root colonisation, plant
height, leaf area, leaf number, fresh and dry weights, proline, soluble sugars,
chlorophyll and carotenoid content and leaf macronutrient contents.
4.2.1 Effect on Plant Height
There was a significant increase in plant height in mycorrhizal treatments starting from
the 8th week (Figureure 4.1, Plate 4.3, 4.4, 4.5). During the flooding period, plant
growth (as measured by increase in height) ceased in both mycorrhizal and non-
mycorrhizal seedlings, but growth continued in the unflooded controls (Figureure. 4.1,
Plate 4.3, 4.4, 4.5).
Page 75
51
Figure 4.1: Effect of arbuscular mycorrhiza fungi and flooding stress on plant
height (cm) of passion fruit seedlings
* Dotted line shows time when flooding was initiated
Plate 4.3: Passion fruit seedlings at the start of the flooding period (12th week).
Mycorrhizal seedlings were significantly taller than non-mycorrhizal plants
4.2.2 Leaf Number
Passion fruit treatments that were not subjected to flooding continued to increase in
leaf number while the flooded seedlings experienced a decrease over the flooding
period (Table 4.7, 4.8, Figure 4.2).The leaf numbers of flooded mycorrhizal and non
mycorrhizal seedlings were significantly reduced after day 14 of flooding compared to
the leaf number of unflooded mycorrhizal seedlings (Table 4.7, Figure 4.2). Under
flooding, there was a reduction in the leaf number, starting from the 14th day in non-
mycorrhizal seedlings, while mycorrhizal treatments showed a reduction in the leaf
number from the 21st day of flooding (Table 4.7, Figure 4.2). Mycorrhizal seedlings
Mycorrhizal plants
Week 12
Non- mycorrhizal plants
Week 12
Page 76
52
had significantly higher leaf number compared to non-mycorrhizal seedlings from the
14th day of flooding (Table 4.7, Figure 4.2).
Table 4.7: Effect of arbuscular mycorrhiza fungi and flooding stress on the leaf
number ofpassion fruit seedlings
Days of flooding
Treatments Day 0 Day 7 Day 14 Day 21 Day 28
Mycorrhizal, unflooded 14.8az 14.8a 15.2a 15.8a 16.3a
Non-Mycorrhiza unflooded 12.8a 12.8a 13.4a 13.3a 13.7b
Mycorrhizal, flooded 14.6a 14.6a 13.8a 8.5b 5.7c
Non-Mycorrhizal, flooded 13.2a 13.2a 8.2b 2.7c 1.2d
GRAND MEAN 13.9 13.8 12.2 10.1 9.2
LSD(p≤0.05) 5.2 2.9 2.9 2.2 2.4
CV (%) 24.3 13.5 15.3 14.3 20.5
zColumn values followed by different letters are significantly different at p<0.05 n=6)
4.2.3 Leaf Area
At the start of the flooding experiment, mycorrhizal plants had higher leaf area than
non-mycorrhizal plants (Table 4.8, Plate 4.6). Unflooded mycorrhizal plants had
significantly higher leaf area throughout the experiment period than non-mycorrhizal
plants that were either subjected to flooding or not subjected to flooding (Table 4.8,
Plate 4.6). Comparison of mycorrhizal plants subjected to flooding and those held
unflooded show that those subjected to flooding had reduced leaf area from the 21st day
of flooding (Table 4.8). When non-mycorrhizal plants are compared, the unflooded
seedlings had significantly higher leaf area from the 14th day, compared to the seedlings
subjected to flooding (Table 4.8).
Page 77
53
Figure 4.2: Effect of arbuscular mycorrhizafungi and flooding stress on the leaf
number of passion fruit seedlings
Page 78
54
Table 4.8: Effect of arbuscular mycorrhiza fungi and flooding stress on the leaf
area (cm2) of passion fruit seedlings
Days of flooding
Treatments Day 0 Day 7 Day 14 Day 21 Day 28
Mycorrhizal, flooded 468.5az 456.1a 413.5a 237.1c 178.6c
Mycorrhizal, unflooded 447.4a 453.5a 473.7a 498.8a 508.3a
Non-Mycorrhizal, flooded 232.1b 227.1b 172.9c 57.9d 39.6d
Non-Mycorrhiza unflooded 221.7b 237.5b 263.6b 318.6b 335.4b
GRAND MEAN 342.4 343.6 330.9 278.1 265.5
LSD(p≤0.05) (%) 62.2 59.3 61.6 59.9 66.5
CV 11.8 11.2 12.1 14.0 16.3
zColumn values followed by different letters are significantly different at p<0.05 n=6)
Plate 4.4: Mycorrhiza Plant Growth under Flooding and Non Flooding Stress
Controls
Page 79
55
Plate 4.5: Non-mycorrhizal plant growth under flooding and non flooding stress
4.2.4 Fresh weight
The leaf and root fresh weights increased in unflooded treatments but decreased in
flooded treatments (Figure. 4.3, 4.4). Unflooded mycorrhizal seedlings had
significantly higher leaf and root fresh weights than both unflooded and flooded non-
mycorrhizal seedlings (Figure. 4.3, 4.4). The root and leaf fresh weights were
significantly higher in unflooded mycorrhizal treatment than mycorrhizal seedlings
subjected to flooding from the 21st day of flooding (Figure. 4.3, 4.4, Plate 4.7).From
the start of flooding till the 14th day, flooded mycorrhizal seedlings had significantly
higher leaf and root fresh weights than unflooded non-mycorrhizal seedlings (Figure.
4.3, 4.4). However, there was no significant difference in leaf and root fresh weight
between the two treatments on the 21st (Figure. 4.3, 4.4). On the 28th day of flooding,
flooded mycorrhizal seedlings had significantly higher leaf and root fresh weights than
unflooded non-mycorrhizal seedlings (Figure. 4.3, 4.4). Flooded non-mycorrhizal
seedlings had the lowest leaf and root fresh weights (Figure. 4.3, 4.4).
Non-mycorrhizal plants
flooded for 21 days
Unflooded, non-mycorrhizal
plants on 21st day
Page 80
56
Figure 4.3: Effect of arbuscular mycorrhiza fungi and flooding stress on the leaf
fresh weight of passion fruit seedlings
Figure 4.4: Effect of arbuscular mycorrhiza fungi and flooding stress on the root
fresh weight (g) of passion fruit seedlings
Page 81
57
Figure 4.5: Effect of arbuscular mycorrhiza fungi and flooding stress on the root
length (cm) of passion fruit seedlings
4.2.5 Root Length
Root length increased under unflooded conditions but decreased from the 7th day in
flooded treatments (Figure. 4.5). Mycorrhizal plants had significantly longer roots than
non-mycorrhizal plants under both flooded and unflooded conditions (Figure. 4.5).
Page 82
58
Plate 4.6: Mycorrhizal and non-mycorrhizal treatments after 21 days offlooding
Plate 4.7: Lateral root loss in non-mycorrhizal seedlings after 21 days of flooding
Non- mycorrhizal roots 21
days after flooding
Mycorrhizal roots 21
days after flooding
Non-Mycorrhizal seedlings flooded
for 21 days
Mycorrhizal seedlings flooded for
21 days
Page 83
59
Figure 4.6: Effect of arbuscular mycorrhiza fungi and flooding stress on the leaf
dry weight (g) of passion fruit seedlings
Figure 4.7: Effect of arbuscular mycorrhiza fungi and flooding stress on the root
dry weight (g) of passion fruit seedlings
Page 84
60
4.2.6 Dry Weight
At the start of the flooding experiment, mycorrhizal seedlings had higher root and leaf
dry weights (Figure. 4.6, 4.7). The dry weights were unchanged for 14 days but
increased in unflooded treatments while reducing in flooded treatments (Figure. 4.6,
4.7). Mycorrhizal treatments had significantly higher dry weights under flooding, than
non-mycorrhizal seedlings under flooding (Figure. 4.6, 4.7).
4.2.7 Proline Concentration
Figure 4.8: Effect of arbuscular mycorrhiza fungi and flooding stress on the
proline level (ppm) of passion fruit seedlings
The proline concentration was low at the start of flooding and remained constantly low
in unflooded treatments (Figure. 4.8). It increased in flooded treatments from the 7th
day, but decreased to the unflooded levels by the 28th day (Figure. 4.8). The highest
proline concentration was achieved by flooded, mycorrhizal seedlings (Figure. 4.8).
The proline concentration peaked in flooded mycorrhizal seedlings just after the 14th
Page 85
61
day, while in flooded non-mycorrhizal seedlings, the peak occurred just before the 21st
day (Figure. 4.8).
4.2.8 Chlorophyll and Carotenoids content
The total chlorophyll and the chlorophyll a and b content were similar at the start of
flooding for all treatments (Figure. 4.9, 4.10). The chlorophyll content remained
unchanged in unflooded treatments but declined under flooding (Figure. 4.9, 4.10). The
total chlorophyll, Chlorophyll a and b levels were significantly lower under 7, 14 and
21 days of flooding in non-mycorrhizal treatments compared to flooded mycorrhizal
treatments but by the 28th day, there was no significant difference in the levels between
the two treatments (Figure. 4.9, 4.10).
Figure 4.9: Effect of arbuscular mycorrhiza fungi and flooding on the chlorophyll
a, b of passion fruit seedlings
Page 86
62
Figure 4.10: Effect of arbuscular mycorrhiza fungi and flooding on the total
chlorophyll of passion fruit seedlings
Figure 4.11: Effect of arbuscular mycorrhiza fungi and flooding on the
carotenoids content of passion fruit seedlings
Page 87
63
The unflooded treatments maintained low carotenoids content while the levels
increased under flooding (Figure. 4.11). Under 14 and 21 day of flooding, the
carotenoid level was significantly higher in non-mycorrhizal seedlings compared to
mycorrhizal seedlings but the levels were similar after 28 days of flooding (Figure.
4.11).
4.2.9 Mycorrhizal Root Colonization
Mycorrhizal root colonization remained constant under unflooded conditions (Table
4.17). Under flooding, the colonization declined after the 14th day, but was not
completely inhibited (Table 4.9).
Table 4.9: Effect of arbuscular mycorrhiza fungi and flooding on the mycorrhizal
colonization of the roots of passionfruit seedlings
Mycorrhizal colonization/ Days of Flooding
Treatments 0 7 14 21 28
Mycorrhizal, unflooded
32.7±2.
2
31.2±3.
3
34.2±4.
1
33.8±5.
4
35.1±3.
9
Non-mycorrhizal, unflooded 0 0 0 0 0
Mycorrhizal, flooded
34.1±4.
3 32±4.4
32.5±4.
4
13.7±4.
4
14.6±5.
3
Non-mycorrhizal, flooded 0 0 0 0 0
4.2.10 Soluble Sugar Content
The leaf and root soluble sugar content remained constant in unflooded treatments
(Figure. 4.12 and 4.13). Under flooding, the total soluble sugars increased sharply and
then dropped to the control levels (Figure. 4.12 and 4.13).
Page 88
64
4.2.11 Leaf Nitrogen Content
Unflooded treatments constantly retained high leaf N content in the course of the
flooding period while flooded treatments had reduced N rate starting after the 7th day
in both non-mycorrhizal and 14th day in mycorrhizal treatments (Figure.4.14). Flooded
mycorrhizal treatments had significantly higher N on the 7th, 14th and 21st day of
flooding than flooded non-mycorrhizal seedlings (Figure.4.14).
Figure 4.12: Effect of arbuscular mycorrhiza fungi and flooding stress on total
soluble sugars of passion fruit leaves
Page 89
65
Figure 4.13: Effect of arbuscular mycorrhiza fungi and flooding stress on total
soluble sugars of passion fruit roots
Figure 4.14: Effect of arbuscular mycorrhiza fungi and flooding stress on leaf
nitrogen content (%) of passion fruit seedlings
Page 90
66
Figure 4.15: Effect of arbuscular mycorrhiza fungi and flooding on leaf
phosphorus content (%) of passion fruit seedlings
4.2.12 Leaf phosphorus content
Mycorrhizal treatments had higher phosphorus content at the start of flooding (Figure.
4.15). The leaf phosphorus content remained relatively constant over the next 28 days
in unflooded treatments (Figure. 4.15). Flooding caused a reduction in the phosphorus
content with significant differences observed on the 14th day. Mycorrhizal treatments
maintained significantly higher phosphorus for the first 14 days under flooding stress
compared to non-mycorrhizal seedlings under similar flooded conditions (Figure.
4.15). However, there was no significant difference between the flooded treatments on
the 28th day of flooding (Figure. 4.15).
4.3 Effect of Arbuscular Mycorrhiza Fungi on Growth and Nutrient Uptake of
Seedlings under Modified PhosphorousMedia and Low Nutrient Sand: Soil Media
4.3.1 Plant Height
4.3.1.1 Effect of arbuscular mycorrhiza fungi on plant height of passion fruits and
rough lemon seedlings raised under half strength hoagland solution with modified
phosphorous rates
Page 91
67
There was no significant difference in plant height in passion fruits seedlings subjected
to varied phosphorus concentrations in the first 9weeks from transplanting (Figure.
4.16). On the 12th and 15th week, mycorrhizal passion fruit seedlings subjected to
1.68ppm P had the highest plant height (Figure. 4.16). On the 18th week, mycorrhizal
seedlings subjected to 0.44, 0.88 and 1.68 ppm P had the highest plant height while on
the 21st week, mycorrhizal seedlings subjected to 0.44 and 0.88 ppm P had the highest
plant height (Figure. 4.16).
Figure 4.16: Effect of arbuscular mycorrhiza fungi and p on the plant height (cm)
of passion fruits (passiflora edulis var edulis) seedlings
In rough lemons, there was no significant difference in plant height in seedlings
subjected to varied phosphorus concentrations in the first 12 weeks from transplanting
(Figure. 4.17). On 16th, 20th and 24th week after transplanting, mycorrhizal lemon
seedlings subjected to 0.44, 0.88ppm and 1.68 ppm P had the highest plant height but
plant height increase waned in mycorrhizal, 1.68 ppm P such that from 28th to 32nd
week, mycorrhizal seedlings subjected to 0.44 and 0.88 ppm P had the highest plant
height (Figure. 4.17). There was no significant difference in plant height between
mycorrhizal plants that were not supplied with P (0 ppm P) and non mycorrhizal plants
Page 92
68
subjected to 0.44, 0.88 and 1.68 ppm P in both lemons and passion fruits (Figure. 4.16,
4.17). Non-mycorrhizal plants that were not supplied with P (0 ppm P) had the lowest
plant height in both passion fruits and lemons (Figure. 4.16, 4.17).
Figure 4.17: Effect of arbuscular mycorrhiza fungi and P on the plant height (cm)
of rough lemon (Citrus jambhiri) seedlings
4.3.1.2 Plant Height Results of Papaya and Lemon Seedlings raised under Low
nutrient Sand: soil Sterilized and Non-sterilized Media
In low nutrient sand: soil media, arbuscular mycorrhizal lemon and papaya seedlings
had higher plant height than to non-mycorrhizal seedlings in both sterilized and
unsterilized media (Figure 4.18, 4.19). There was no significant difference in plant
height between the mycorrhizal treatments, whether in sterilized or un-sterilized media
(Figure 4.18, 4.19). Non-mycorrhizal seedlings raised in sterilized media had
significantly higher plant height than non-mycorrhizal seedlings raised in unsterilized
media in papaya and lemon seedlings (Figure 4.18, 4.19).
Page 93
69
Figure 4.18: Effect of arbuscular mycorrhizafungi and media condition on plant
height (cm) of papaya (Carica papaya var mountain) seedlings
Page 94
70
Figure 4.19: Effect of arbuscular mycorrhiza fungi and media condition on plant
height (cm) of roughlemon (Citrus jambhiri) seedlings
In mangoes, mycorrhizal plants with both intact endosperms and those with endosperm
removed had significantly higher plant height compared to non mycorrhizal plants with
and without intact endosperm (Figure. 4.20). There was no significant difference in
plant height between mycorrhizal plants with intact endosperm and those with the
endosperm removed (Figure 4.20). There was also no significant difference in plant
height between non-mycorrhizal plants with intact endosperm and those with the
endosperm removed (Figure 4.20).
Figure 4.20: Effect of arbuscular mycorrhiza fungi and endosperm condition on
the plant height of mango (Mangifera indica var peach) seedlings
4.3.1.4 Effect of Arbuscular mycorrhiza fungi on plant height of avocado seedlings
with endosperm attached or removed at transplanting time
Page 95
71
Mycorrhizal and non mycorrhizal avocado seedlings both containing an endosperm
attached had significantly higher plant height compared to both mycorrhizal and non-
mycorrhizal plants which had the endosperm removed at the beginning of the
experiment (Figure 4.21). Mycorrhizal seedlings without an endosperm had
significantly higher plant height compared to non mycorrhizal seedlings without the
endosperm (Figure. 4.21).
Figure 4.21: Effect of arbuscular mycorrhiza fungi and endosperm condition on
the plant height of avocado (Persea americana) seedlings
4.3.2 Results on Leaf Number, Leaf Area, Stem Girth and Fresh and Dry Weights
Page 96
72
4.3.2.1 Passion fruits and lemon seedlings raised under half strength Hoagland
Solution with modified P rates
Table 4.10: Effect of arbuscular mycorrhiza fungi and phosphorus rates on the
leaf number, stem girth leaf, stem and root fresh and dry weights and leaf area of
passion fruits (Passiflora edulis var edulis) seedlings
Treatment Leaf no. Fresh weight (g) Dry weight (g) Leaf area
Leaf Stem Root Leaf Stem Root (cm2)
0 PPM P, -AM 11.2cz 6.0c 1.8c 13.5d 2.1d 0.3a 3.5d 292.1d
0.44 PPM P, -AM 12.7b 7.9b 2.2ab 19.0c 2.3cd 0.4a 4.8c 360.0bc
0.88 PPM P, -AM 12.6bc 8.7b 2.2ab 21.5bc 2.5bcd 0.5a 4.6c 348.6bcd
1.68 PPM P, -AM 13.2ab 8.7b 2.1bc 17.7cd 2.5bcd 0.3a 4.5c 346.7bcd
0 PPM P, +AM 13.3ab 8.3b 2.3ab 18.8c 2.3cd 0.4a 4.3cd 338.0cd
0.44 PPM P, +AM 14.2a 10.7a 2.5a 29.3a 3.1a 0.5a 8.9a 402.8ab
0.88 PPM P, +AM 14.6a 10.6a 2.4ab 30.5a 2.9ab 0.4a 9.2a 418.8a
1.68 PPM P, +AM 13.6ab 8.7b 2.3ab 26.2ab 2.6bc 0.6a 6.8b 377.7abc
LSD (p≤0.05) 1.4 1.6 0.3 4.9 0.4 0.3 0.8 57.1
CV (%) 16.3 17.4 14.3 12.6 14.3 9.8 10.7 12.7
Column values followed by different letters are significantly different at p<0.05 (n=6).
There was no significant difference in stem dry weight between all treatments in
passion fruits (Table 4.10). In lemons, there was no significant difference in stem girth
and stem fresh and dry weights between all treatments (Table 4.11). Mycorrhizal
passion fruits and lemons seedlings supplied with 0.44, 0.88 and 1.68ppm P had the
highest leaf and root fresh and dry weights, leaf number and leaf area (Table 4.10, 4.11)
compared with non mycorrhizal plants supplied with 0.44, 0.88 and 1.68 ppm P in both
passion fruits and lemons (Table 4.10, 4.11). Mycorrhizal plants supplied with 1.68
ppm P had significantly higher leaf and root fresh and dry weights compared to
mycorrhizal plants that did not receive P (0 ppm P) but there were no significantly
differences between the two treatments in leaf number, stem girth, stem fresh and dry
weights and leaf area. Non-mycorrhizal plants which did not have P supply (0 ppm P)
Page 97
73
had the lowest leaf number, leaf and root fresh and dry weights and leaf area in both
lemons and passion fruits (Table 4.10, 4.11).
Table 4.11: Effect of arbuscular mycorrhiza fungi and p on the leaf number, stem
girth, leaf, stem and root fresh and dry weights and leaf area of rough lemon
(Citrus jambhiri) seedlings
Treatment Leaf no. Stem Fresh weight (g) Dry weight (g) Leaf area (cm2)
Girth Leaf Stem Root Leaf Stem Root
0 PPM P, -AM 38.2dz 1.0a 4.5d 5.8a 10.5e 0.6d 1.3a 2.4d 230.2d
0.44 PPM P, -AM 42.7cd 1.0a 5.3c 5.9a 13.0cd 0.8cd 1.5a 3.9bc 281.4bcd
0.88 PPM P, -AM 42.6cd 1.0a 5.7c 5.9a 13.5bcd 1.1b 1.5a 3.5c 290.7bcd
1.68 PPM P, -AM 45.2bc 1.1a 5.6c 5.9a 12.7d 1.0bc 1.2a 3.6bc 258.6cd
0 PPM P, +AM 43.3bcd 1.0a 5.5c 5.8a 12.8d 0.8cd 1.4a 3.3c 275.1bcd
0.44 PPM P +AM 54.2a 1.1a 6.7ab 6.3a 15.3a 1.6a 1.6a 4.8a 320.8ab
0.88 PPM P +AM 58.6a 1.1a 7.0a 6.2a 15.2ab 1.4a 1.5a 4.7a 362.7a
1.6 PPM P +AM 48.6b 1.0a 6.5b 5.9a 14.5bc 1.1b 1.4a 4.3ab 300.0bc
LSD (p≤0.05) 5.4 0.2 0.4 0.49 1.7 0.2 0.4 0.7 62.1
CV (%) 16.3 8.9 7.4 7.8 12.6 14.3 9.8 10.7 12.7
zColumn values followed by different letters are significantly different at p<0.05 n=6)
Mycorrhizal rough lemon seedlings raised in both sterilized and unsterilized media had
significantly higher leaf number, leaf and root fresh and dry weights and leaf area than
non-mycorrhizal plants under both sterilized and unsterilized media (Table 4.12). There
was no significant difference between all lemon treatments in stem girth and stem fresh
weights (Table 4.12). There was no significant difference in all parameters between
mycorrhizal plants raised in either sterilized or unsterilized media (Table 4.12). Non
mycorrhizal plants raised in sterilized media had significantly higher leaf and root fresh
weight compared to non-mycorrhizal plants raised in unsterilized media (Table 4.12).
Page 98
74
4.3.2.2 Results on Rough Lemon Seedlings raised under low Nutrient Sand: Soil
Sterilized and Non-Sterilized Media
Table 4.12: Effect of arbuscular mycorrhiza fungi and media condition on the leaf
number, stem girth, biomass and leaf area of rough lemon (Citrus jambhiri)
seedlings
Treatment Leaf Stem Fresh weight (g) Dry weight (g) Leaf area (cm2)
no. Girth (cm) Leaf Stem Root Leaf Stem Root
-AM, -ST 26.5bz 0.9a 4.5c 6.7a 11.8c 1.1b 1.3b 1.7b 217.4b
-AM,+ ST 29.6b 1.0a 4.8b 7.1a 12.4b 1.3b 1.4ab 2.3b 260.3b
+AM, -ST 35.3a 1.0a 5.1a 7.2a 15.2a 1.8a 1.5a 3.1a 326.0a
+AM,+ST 39.0a 0.9a 5.2a 7.2a 15.5a 1.8a 1.4ab 3.4a 344.4a
LSD (p≤0.05) 5.3 0.2 0.2 0.6 0.4 0.3 0.1 0.5 44.8
CV% 10.0 7.5 14.4 9.7 11.5 10.8 7.4 7.8 9.1
zColumn values followed by different letters are significantly different at p<0.05n=6)
4.3.2.3 Results on Papaya Seedlings raised under Low Nutrient Sand:
SoilSterilized and Non-sterilized Media
Mycorrhizal papaya seedlings raised in both sterilized and unsterilized media had
significantly higher stem and root fresh weight, root dry weight and leaf area than non-
mycorrhizal plants under both sterilized and unsterilized media (Table 4.13). There was
no significant difference between all papaya treatments in leaf number, leaf fresh and
dry weight and stem dry weight (Table 4.13). There was no significant difference in all
parameters between mycorrhizal plants raised in either sterilized or unsterilized media
(Table 4.13). Non mycorrhizal plants raised in sterilized media had significantly higher
root fresh and dry weight and leaf area compared to non-mycorrhizal plants raised in
unsterilized media (Table 4.13).
Page 99
75
Table 4.13: Effect of arbuscular mycorrhiza fungi and media condition on the leaf
number, fresh and dry weight and leaf area of papaya (Carica papaya
varmountain) seedlings
Treatments Leaf dry weight (g) Dry Weight (g) Leaf
No. Leaf Stem Root Leaf Stem Root Area
(cm2)
Non mycorrhizal, unsterilised 7.8a 5.5a 7.3b 13.6c 1.2a 0.8a 4.2c 117.4c
Non mycorrhizal, sterilized 8a 5.6a 7.3b 15.4b 1.3a 0.8a 4.7b 160.3b
Mycorrhizal, unsterilised 7.6a 5.8a 7.9a 19.9a 1.2a 0.8a 6.2a 226.1a
Mycorrhizal, sterilised 7.8a 5.7a 8.2a 20.5a 1.3a 0.8a 6.0a 244.3a
LSD (p≤0.05) 0.5 0.4 0.5 1.4 0.2 0.2 0.4 34.8
CV (%) 10 14.4 9.7 11.5 10.8 14.4 7.8 9.1
zColumn values followed by different letters are significantly different at p<0.05 (n=6)
4.3.2.4 Results on Mango Seedlings with Endosperm Attached or Removed at
Transplanting time
Mycorrhizal mango plants with and without endosperm had significantly higher leaf
number, leaf area and leaf, stem and roots fresh weight, leaf and root dry weights than
non mycorrhizal plants with and without endosperm attached (Table 4.14, Plate 4.8).
There was no significant difference between mycorrhizal and non mycorrhizal plants
in stem girth and in stem dry weights (Table 4.14). There was no significant difference
in all parameters between mycorrhizal plants with and without endosperm attachment
(Table 4.14). There was also no significant difference in all parameters between non-
mycorrhizal plants with and without endosperm attachment (Table 4.14).
Page 100
76
Table 4.14: Effect of arbuscular mycorrhiza fungi and endosperm condition on
the leaf number, stem girth, fresh and dry weights and leaf area of mango
(Mangiferaindica var Peach) seedlings
Treatment Leaf Stem Fresh weight (g) Dry weight (g)
Leaf
area
no.
Girth Leaf Stem Root Leaf Stem Root (cm2)
+ED, +AM 16.8a 1.3a 18.5a 16.1a 23.2a 4.4a 5.2a 4.2a 377.3a
-ED, +AM 16.6a 1.2a 18.8a 15.8a 22.4a 4.6a 5.0a 3.8a 385.8a
+ED, -AM 14.0b 1.2a 17.9b 15.4b 20.5b 3.8b 4.7a 3.3b 341.7b
-ED, -AM 13.4b 1.1a 17.4b 15.1b 19.8b 3.6b 4.7a 2.9b 329.7b
LSD(p≤0.05) 0.8 0.3 0.7 0.3 1.0 0.4 0.7 0.4 27.4
CV 12.7 10.6 9.5 8.4 12.5 14.9 8.9 12.8 17.8 zColumn values followed by different letters are significantly different at p<0.05 (
n=6)
+ED, +AM +ED, -AM -ED, + AM -ED, -AM
Plate 4.8: Root appearance of mycorrhizal (+AM) and non mycorrhizal (-AM) mango
seedlings with (+ED) and without endosperm (-ED) attachment
4.3.2.5 Results on Avocado Seedlings with Endosperm Attached or Removed at
Transplanting Time
Mycorrhizal and non-mycorrhizal avocado seedlings with endosperm attached had
significantly higher leaf number, leaf area and leaf and roots fresh and dry weights
than both mycorrhizal and non mycorrhizal plants without endosperm attached (Table
Remains of endosperm
Page 101
77
4.15). There was no significant difference between all treatments in stem girth and in
stem fresh and dry weights (Table 4.15). There was also no significant difference in
all parameters between mycorrhizal and non mycorrhizal plants with endosperm
attachment (Table 4.15). Mycorrhizal plants without endosperm attachment had
significantly higher leaf numbers, leaf and root fresh and dry weights and leaf area
(Table 4.15).
Table 4.15: Effect of arbuscular mycorrhiza fungi and endosperm detachment
on the leaf number, stem girth, fresh and dry weight and leaf area of avocado
(Persea americana) seedlings
Treatment Leaf Stem Fresh weight (g) Dry weight (g) Leaf area
no.
Girth Leaf Stem Root Leaf Stem (cm2)
+ED, +AM 58.6a 1.4a 30.6a 15.7a 105.8a 7.4a 3.4a 856.6a
+ED, -AM 56.9a 1.5a 29.7a 15.7a 112.4a 7.6a 3.7a 873.5a
-ED, + AM 52.2b 1.5a 27.7b 14.8a 39.9b 6.8b 3.7a 747.8b
-ED, -AM 47.7c 1.3a 25.1c 15.0a 27.8c 5.6b 3.5a 643.4c
LSD(p≤0.05) 3.8 0.2 2.4 1.2 9.4 0.5 0.3 97.5
CV 11.5 8.4 15.4 10.3 12.7 9.2 7.8 13.5
zColumn values followed by different letters are significantly different at p<0.05 (n=6)
4.3.3 MycorrhizalRoot Colonisation
Mycorrhizal seedlings had significantly higher root colonisation than non-
mycorrhizalseedlings (Table 4.16). There was no significant difference in % root
colonisation between mycorrhizal seedlings held in both sterilized and non-sterilized
media (Table 4.16). Non-mycorrhizal plants held in unsterilized media had low
mycorrhizal colonisation % while that held in sterilized media did not have any root
colonisation (Table 4.16).
Page 102
78
Table 4.16: Effect of arbuscular mycorrhizafungi and planting media on the
mycorrhizal root colonisation (%) of rough lemon (Citrus jambhiri) and papaya
(Carica papaya var mountain) seedlings raised in sterilized and unsterilized media
Treatment Rough lemons Papaya
-AM, -ST 7.1 ± 4.5 8.7 ± 3.2
-AM, + ST 0 0
+AM, -ST 51.1 ± 2.9 43.2 ± 3.9
+AM, +ST 55.3 ± 2.4 45.3 ± 1.5
zMeans ±SE (N=6)
4.3.4 MycorrhizaSpore Numbers in Sterilized and Unsterilized Media
At the start of the experiment, sterilized media did not have any mycorrhizal spores
while unsterilized media had a low spore count (Table 4.17). At the end of the
experiment period, mycorrhizal inoculation caused a significantly higher spore count
in both sterilized and unsterilized media (Table 4.17).
Table 4.17: Effect of media sterilization on mycorrhiza spore number at the
beginning and at the end of the experiment period
Spores per 25 gram soil sample
Beginning End
Papaya Lemons
+AM, +ST 0 676 ± 29 898 ± 48
+AM, -ST 68 ± 8z 777 ± 36 856 ± 39
-AM, +ST 0 0 0
-AM, -ST 57 ± 17 158 ± 16 183 ± 31
zMeans ±SE (N=6)
4.3.5 Leaf Nutrient content in Sterilized and Unsterilized Media
4.3.5.1 Results on Rough Lemon Seedlings
Page 103
79
Mycorrhizal seedlings had significantly higher N, P and K% compared to non
mycorrhizal seedlings (Table 4.18). There was no significant difference in Ca and Mg
content between all treatments (Table 4.18).
Table 4.18: Effect ofarbuscular mycorrhiza fungi and planting media on the %
leaf nutrient content of rough lemon (Citrus jambhiri) seedlings
N (%) P (%) K (%) Ca (%) Mg (%)
-AM-ST 2.0 ± 0.1z 0.2 ± 0.05 2.1 ± 0.2 2.8 ± 0.1 1.6 ± 0.1
-AM+ST 2.0 ± 0.1 0.3 ± 0.07 1.9 ± 0.2 3.1 ± 0.2 1.7 ± 0.2
+AM-ST 2.3 ± 0.1 0.4 ± 0.05 2.6 ± 0.1 3.0 ± 0.1 1.6 ± 0.1
+AM+ST 2.3 ± 0.2 0.4 ± 0.04 2.6 ± 0.1 3.1 ± 0.1 1.6 ± 0.2
zMeans ±SE (N=6)
4.3.5.2 Results on Papaya Seedlings
Table 4.19: Effect of arbuscular mycorrhiza fungi and planting media on the %
leaf nutrient content of papaya seedlings
N (%) P (%) K (%) Ca (%) Mg (%)
-AM-ST 1.9±0.1z 0.2 ± 0.1 2.3 ± 0.1 1.9 ± 0.2 0.8 ± 0.1
-AM+ST 1.9±0.1 0.2 ± 0.1 2.2 ± 0.2 2.1 ± 0.1 0.9 ± 0.1
+AM-ST 2.0±0.1 0.4 ± 0.1 2.9 ± 0.1 2.0 ± 0.2 0.9 ± 0.1
+AM+ST 2.0±0.1 0.4 ± 0.1 2.9 ± 0.2 2.1 ± 0.1 0.8 ± 0.1
zMeans ±SE (N=6)
Mycorrhizal seedlings had significantly higher P and K% compared to non mycorrhizal
seedlings (Table 4.19). There was no significant difference in N, Ca and Mg% between
all treatments (Table 4.19).
Page 104
80
4.3.6 Leaf Nutrient % in Mango and Avocado Seedlings with and without
Endosperm Attachment
4.3.6.1 Results on Mango Seedlings
Mycorrhizal seedlings with and without endosperm attached had significantly higher P
and K% compared to non mycorrhizal seedlings (Table 4.20). There was no significant
difference in N, Ca and Mg content between all treatments (Table 4.20).
Table 4.20: Effect of arbuscular mycorrhiza fungi and endosperm condition on
the % leaf nutrient content of mango (Mangifera indica) seedlings
N (%) P (%) K (%) Ca (%) Mg (%)
+ED,
+AM 2.3 ± 0.2 z 0.5 ± 0.1 2.4 ± 0.2 2.7 ± 0.2 1.7 ± 0.1
-ED, +AM 2.3 ± 0.1 0.5 ± 0.1 2.4 ± 0.1 2.9 ± 0.2 1.6 ± 0.1
+ED, -AM 2.3 ± 0.1z 0.2 ± 0.1 2.0 ± 0.2 2.8 ± 0.1 1.5 ± 0.1
-ED, -AM 2.3 ± 0.3 0.2 ± 0.1 1.9 ± 0.1 2.8 ± 0.2 1.6 ± 0.1
zMeans ±SE (N=6)
4.3.6.2 Results on Avocado Seedlings
Mycorrhizal seedlings with and without endosperm attached had significantly higher
P% compared to non mycorrhizal seedlings (Table 4.21). There was no significant
difference in N, K, Ca and Mg% between all treatments (Table 4.21).
Page 105
81
Table 4.21: Effect of arbuscular mycorrhiza fungi and endosperm condition on
the % leaf nutrient contentof avocado (Persea americana) seedlings
N (%) P (%) K (%) Ca (%) Mg (%)
+ED,
+AM 3.0 ± 0.2 0.6 ± 0.1 2.3 ± 0.1 3.1 ± 0.1 1.6 ± 0.1
-ED, +AM 2.9 ± 0.2 0.6 ± 0.1 2.3 ± 0.2 3.0 ± 0.1 1.5 ± 0.2
+ED, -AM 3.0 ± 0.2z 0.3 ± 0.1 1.8 ± 0.1 2.9 ± 0.2 1.4 ± 0.1
-ED, -AM 2.8 ± 0.1 0.3 ± 0.1 1.9 ± 0.2 2.9 ± 0.1 1.4 ± 0.2
zMeans ±SE (N=6)
Page 106
82
CHAPTER FIVE
DISCUSSION
5.1 Effect of arbuscular mycorrhizal inoculation on the survival and growth of
tropical fruit seedlings under salt stress
In this study, mycorrhizal root colonisation occurred in only the inoculated
treatments.Unstressed mycorrhizal seedlings recorded higher colonisation than their
respective seedlings subjected to salt stress. This finding is consistent with research
done in beans in Iran that indicated that mycorrhizal inoculation produced active
colonisation in non-saline stressed seedlings. The level of colonisation in roots of
mycorrhizal plants decreased as the NaCl concentration increased (Younesi & Moradi,
2014). Studies with citrus in India showed that increasing salt stress significantly
decreased mycorrhizal root infection from 66.8% to 31.3% in Karna Khatta (Citrus
karna) and from 62.4% to 39.7% in Troyer Citrange (Murkute et al., 2006). In Sesbania
aegyptiaca and S. grandiflora study in India, mycorrhizal root colonisation and
sporulation was significantly higher in AM-inoculated than in uninoculated plants
under salt-stressed soil (Giri and Mukerji, 2004). Similar results were reported in Vicia
faba study in Egypt by Rabie & Almadini, 2005).
The decline in colonization could be caused by adverse conditions for sporulation and
development of spores under unfavorable rhizosphere conditions induced by salt stress.
However, despite mycorrhizal colonization being reduced at high salinity levels, it was
not completely inhibited. This accounts for the improved performance of the inoculated
plants in relation to non-mycorrhizal plants under salt stress.
In this study, a decline in plant height and leaf number occurred under salt stress.
Despite this, mycorrhizal passion fruit plants had higher plant height and leaf number
under both normal and moderate salt stress. Under extreme salt stress, there was no
significant difference in plant height between mycorrhizal and non-mycorrhizal
passion fruit seedlings. However, mycorrhizal passion fruits had higher leaf number
than non-mycorrhizal plants even under extreme salt stress. This was due to less leaf
abscission in mycorrhizal plants subjected to extreme salt stress, than non-mycorrhizal
Page 107
83
plants subjected to similar extreme stress. This result is consistent with research in
bananas undertaken in Brazil (Yano-Melo et al., 1999).
In this study, the leaf chlorophyll content declined under salt stress. The leaf
chlorophyll content was however significantly higher in mycorrhizal seedlings under
both normal and moderate salt-stress. This result is consistent with studies in Sesbania
aegyptiaca and S. grandiflora in India which indicated that the chlorophyll content was
greater in leaves of seedlings inoculated with Glomus macrocarpum as compared to
un-inoculated seedlings under saline soil conditions (Giri & Mukerji, 2004).
Mycorrhizal seedlings also had higher chlorophyll content in Lotus glaber (Sannazzaro
et al., 2005), peppers in Turkey (Çekic et al., 2012) and in trifoliate orange in China
(Wu & Zou, 2012).
Like other growth parameters, leaf area and the fresh and dry weights of leaves, stems
and roots declined under salt stress in both passion fruit and mango seedlings. The
severity of decline increased as salt stress increased. Under extreme salt stress, AM
inoculation had no effect on the leaf, stem and root fresh weights and the root dry
weight. Research by Huang et al. (2013) in Taiwan indicated that the shoot fresh, and
shoots and roots dry weights were significantly higher in AMF-treated Tomato variety
TCAV10 subjected to salt stress, when compared with non-mycorrhizal control. In
Egypt, Debouba et al. (2006) reported that tomato plants inoculated with AMF showed
greater shoot and root dry matter accumulation when irrigated with saline water. In
beans grown in Iran, mycorrhizal inoculation increased the shoot biomass under
moderate salinity (Younesi & Moradi, 2014).The AMF symbiosis in studies done in
Spain also improved dry weights and alleviated salt stress in maize (Zea mays L.)
(Estrada et al., 2013).
In this study, the phosphorus level was significantly higher in mycorrhizal plants than
in non-mycorrhizal plants under both non stress and salt-stress conditions. This result
indicates that the improvement of phosphorus uptake by AM fungi constitutes one of
the mechanisms for increasing plant tolerance to salinity. The result is consistent with
findings in bean study in Iran which showed the highest foliar concentration of
phosphorus under salinity conditions was observed in plants inoculated with G.
Page 108
84
mosseae (Younesi & Moradi, 2014). Similarly, wheat research in Saudi Arabia showed
that the phosphorus content declined under increased salinity in non-mycorrhizal
treatments but in mycorrhizal treatments, the levels remained unchanged (El-Amri et
al., 2013). These results are also consistent with findings on Sclerocarya birrea
research in Kitui Kenya by Muok and Ishii (2006) and Vicia faba research in Egypt by
Rabie & Almadini (2005).
One of the roles played by phosphorus in plants is facilitation of photosynthesis. It can
be concluded that AM fungi promoted phosphorus uptake, which in turn facilitated
photosynthesis, resulting in better performance of inoculated plants. This improved
well being is observed in increased plant height, leaf number, leaf area and the fresh
and dry weights observed in inoculated plants, compared to non-inoculated plants.
In this study, increase in salinity caused an increase in the the sodium level in passion
fruit and mango seedlings. The increase was however higher in non-mycorrhizal plants
than in mycorrhizal plants. Lower sodium content in mycorrhizal plants under salinity
stress was also reported in Sesbania aegyptiaca and S. grandiflora in India by Giri and
Mukerji (2004), in Soybeans in Iran by Sharifi et al. (2007), lettuce in New Zealand by
Zuccarini (2007), Zuchini in Italy by Colla et al. (2008) and wheat in Saudi Arabia by
El-Amri et al., (2013) suggesting that AM fungi protect plants from Na toxicity. Rabie
and Almadini (2005) proposed that arbuscular mycorrhiza fungi protected Vicia faba
plants in Egypt against Na toxicity either by regulating Na uptake from the soil or by
accumulating it in roots, thereby delaying its translocation onto the shoot system.
While the Na level increased as salinity increased, the potassium level reduced in non-
mycorrhizal plants but increased in mycorrhizal plants. The calcium levels however
remained unchanged. This result is consistent with bean study in Iran that showed that
the potassium content declined as salinity increased with mycorrhizal plants having
higher potassium than non-mycorrhizal plants (Younesi & Moradi 2014). Reduction in
K was also observed by Colla et al. (2008) in Zuchini in Italy; Sharifi et al. (2007) in
Soybeans in Iran, Muok and Ishii (2006) in Scleronchyma birrea in Kenya and Rabie
and Almadini (2005) in Vicia faba in Egypt. These authors reported that high sodium
Page 109
85
uptake competed with the uptake of other nutrient ions, especially K, leading to K and
other cations’ deficiency.
In this study, it noted that mycorrhizal plants had increased K content with salinity
treatment, while non-mycorrhizal plants had reduced K content. This indicates that
mycorrhizal plants were able to uptake K inspite of the high Na levels. Other studies
indicate that plants maintain high concentrations of K and low concentrations of Na in
the cytosol under salt stress (Parida & Das, 2005). They do this by regulating the
expression and activity of K and Na transporters and of H+ pumps that generate the
driving force for transport (Parida & Das, 2005). It is therefore possible that AM fungi
regulated the expression and activated K and Na transporters and H+ pumps that
generate the driving force for transport. This possibility however requires further
investigation to support it.
In this study, the level of magnesium declined with increased salinity in all passion
fruit and mango seedlings. However, the decline in non-mycorrhizal plants was greater
than in mycorrhizal plants under moderate salinity. Magnesium is a component of the
chlorophyll molecule (Salisbury & Ross, 1991). In this study, reduced uptake of
magnesium may explain the low chlorophyll content observed in non-mycorrhizal
treatments under salt stress. This observation is consistent with findings that a reduction
in Na uptake and a concomitant increase in Mg absorption and high chlorophyll content
in mycorrhizal Sesbania aegyptiaca and S. grandiflora plants was an important salt-
alleviating mechanism for plants growing in saline soil (Giri & Mukerji, 2004).
In this study, there was no significant difference in performance between the
mycorrhizal treatments with/without the endosperm. However, non-mycorrhizal plants
with the endosperm performed better than non-mycorrhizal plants without the
endosperm. Presence of an endosperm provides a good start to the seedling after
germination, by helping to nourish the seedling before it attains the photosynthetic
ability. This allowed the seedlings containing the endosperm to have a good start,
compared to those without, as happened in the non-mycorrhizal seedlings. However,
in the mycorrhizal seedlings, the disadvantage of the absence of endosperm seemed to
Page 110
86
have been compensated by the mycorrhizal inoculation, thereby allowing both the
mycorrhizal plants with/without the endosperm to perform equally.
This study indicates that mycorrhizal inoculation improves growth and performance of
mango and passion fruit seedlings under salt stress, as measured by growth parameters
of plant height, leaf number and chlorophyll content, and biomass parameters of shoot,
stem and root fresh and dry weights and leaf area. This is by enhancing the uptake of
P, K and Mg, while reducing the detrimental effects of Na toxicity on seedling growth.
5.2 Effect of arbuscular mycorrhizal inoculation on the survival and growth of
tropical fruit seedlings under flooding stress
In this study, an increase in plant height was observed in mycorrhizal treatments prior
to the start of flooding stress (starting from the 8th week). Likewise, the leaf area and
fresh and dry weights were higher in mycorrhizal treatments at the start of flooding.
These benefits could be attributed to the beneficial effect of mycorrhization on plant
growth. Arbuscular mycorrhizal inoculation have also been reported to improve the
growth, fresh and dry weight, yield and quality of soybeans in India (Suri and
Choudhary, 2013), chick peas in Pakistan (Yaseen et al., 2012), pigeon peas in China
(Qiao et al., 2011), sour oranges in Jordan (Al-Karaki, 2013), Jews mallow in Nigeria
(Nwangburuka et al., 2012) and sunflower (Vaseghmanesh et al., 2014) and temulawak
in India (Samanhudi et al., 2014).
Under flooding, plant growth (as measured by increase in height) ceased in both
mycorrhizal and non-mycorrhizal treatments but continued under unflooded
conditions. Mycorrhizal plants had higher plant heights compared to non-mycorrhizal
plants, under both flooded and unflooded conditions. This is consistent with findings
in rice seedlings in Iran which showed that plant height and chlorophyll content were
positively affected by AMF inoculation in flooded but not in non-flooded plants
(Hajiboland et al., 2009). In a study of peach seedlings in Japan, the plant height
declined under flooded conditions with non-mycorrhizal showing greater decline
(Kipkoriony et al., 2002).
Page 111
87
Leaf growth (as measured by leaf number) continued under unflooded conditions but
reduced under flooding. The reduction in leaf number under flooding could be
attributed to leaf abscission that began 14 days after flooding. Leaf abscission also
accounted for reduced leaf area observed under flooding. Leaf abscission occurred only
in the non-mycorrhizal seedlings subjected to flooding. This observation is similar to
that of peach study in Italy that showed the symptoms of flooding to be desiccation of
the shoot apex, strong reddening of leaves followed by appearance of necrotic areas
and senescence of almost all leaves (Lacona et al., 2013). In Prunus spp. study in Italy,
symptoms of flooding susceptibility included severe leaf damage and early plant
mortality (Pimentel et al., 2014).
In this experiment, there was a reduction in the fresh weight starting from the 14th day
of flooding. The reduction in leaf fresh weight under flooding could be as a result of
leaf abscission which reduced the leaf number. Reduction in root fresh weight could
also be attributed to decay and death of roots that occur during flooding. In this study,
reduction in lateral root formation and reduction in root length was observed in flooded,
non-mycorrhizal treatments after 14 days and also in mycorrhizal seedlings after 21
days after flooding. Studies in Betula platyphylla (Tang & Koslowski, 1984), Platanus
occidentalis (Tsukahara & Kozloswki, 1985) and Acer platanoides (Yamamoto &
Koslowski, 1987) showed that flooding caused a loss of extent, reach and health of the
roots resulting in decline, death and decay of roots over time. Generally under flooded
conditions, the woody roots survive and non-woody roots die.
Mycorrhizal treatments had significantly higher root, stem and leaf dry weights
compared to non-mycorrhizal seedlings under both flooded and unflooded conditions.
Mycorrhizal inoculation was reported to enhance shoot and root dry weight in flooded
rice in Iran (Hajiboland et al., 2009) and snap beans in USA (Sah et al., 2006).
In this study, the proline concentration was low at the start of flooding and remained
constantly low in unflooded treatments. The proline concentration then increased under
14 and 21 days of flooding before falling back to the levels in unflooded treatments.
This result is similar to a study in India of free proline accumulation in two maize
genotypes that were subjected to waterlogging for three weeks at the knee high stage
Page 112
88
(Singh & Singh, 1981). The results of this maize study indicated that the initial content
of leaf free proline was similar in both genotypes but increased when the plants were
subjected to waterlogging. Flooding also increased the proline content in sugar cane
crop in India (Bajpai & Chandra, 2015) and in barley in Bulgaria (Yordanova & Popova
2001).
In this study, flooded mycorrhizal seedlings accumulated higher proline than non-
mycorrhizal seedlings. This was also reported in Aster tripolium study in Portugal by
Neto et al. (2006) who attributed the better tolerance to flooding by AM plants to
improvement of osmotic adjustment promoted by proline. It can therefore be postulated
from this study that proline concentration increased as a coping mechanism against
flooding stress as reported by Ruiz-Lozano et al. (1995) and Neto et al. (2006).
Mycorrhizal plants were able to accumulate higher proline, which improved the
osmotic adjustment and maintained the membrane integrity among other physiological
effects, thereby ensuring that the mycorrhizal plants coped better under flooding stress
than non mycorrhizal plants.
In this study, the total chlorophyll and the chlorophyll a and b content remained
constant or slightly increased in unflooded conditions. However, the chlorophyll
content decreased under flooding. This is consistent with findings in sweet orange
study in Poland in which continuous flooding reduced chlorophyll concentration of
seedlings grafted onto rough lemon and sour orange rootstocks by 38% and 18%,
respectively (Vu & Yelenosky, 2006). Reduction in total chlorophyll content as a result
of flooding was also reported in wheat in USA (Collaku and Harrison, 2002), maize in
India (Prasad et al., 2004), sesame in Ghana (Mensah et al., 2006) and onion in China
(Yiu et al., 2008).
In this study, the chlorophyll a content was higher than chlorophyll b content under
both flooded and unflooded conditions. In maize study in Iran, chlorophyll b was more
susceptible to water logging than chlorophyll a (Pourabdal et al., 2008). In maize study
in India, reduction in chlorophyll a compared to b occurred, and was attributed to the
sensitivity of chlorophyll b against flooding which was more than that of chlorophyll a
(Zaidi et al., 2010).
Page 113
89
The total chlorophyll and chlorophyll a and b levels were significantly lower under 7,
14 and 21 days of flooding in non-mycorrhizal treatments compared to flooded
mycorrhizal treatments. This indicated that mycorrhization delayed the breakdown of
chlorophyll under flooding. In a study in rice in Iran, chlorophyll content was increased
by AMF inoculation in flooded but not in non-flooded plants (Hajiboland et al., 2009).
In this study, there was a reduction in the leaf nitrogen content in non-mycorrhizal
seedlings, compared to mycorrhizal seedlings subjected to flooding. The reduction in
chlorophyll content observed in this study in non-mycorrhizal plants under flooding
could be linked to the reduction of leaf nitrogen levels observed in non mycorrhizal
seedlings. Similarly, the decrease in maize leaf chlorophyll contents under water-
logging stress was identified as as being related to nitrogen deficiency caused by
leaching and denitrification of the soil nitrogen (Rathore et al., 1996).
The carotenoid content was similar between treatments at the start of flooding. The
unflooded treatments maintained low carotenoid content while the levels increased
under flooding. This result was also reported in sugar cane (Bajpai & Chandra, 2015).
The increase in carotenoid content paralleled the reduction in the chlorophyll content.
Studies have indicated that degradation of chlorophyll unmasks the carotenoids,
resulting in higher carotenoid expression (Salisbury & Ross, 1991). Under 7, 14 and
21 day of flooding, the carotenoid level was significantly higher in non-mycorrhizal
seedlings compared to mycorrhizal seedlings. This may have been related to the delay
in chlorophyll breakdown observed in mycorrhizal seedlings.
Mycorrhizal root colonization of unflooded treatments remained unchangedover the
experiment period. Under flooding, almost 50% decline in colonization was observed,
21 days after flooding. This finding is similar to reports in rice in Mexico which
indicated that plants readily formed mycorrhizal associations under rainfed conditions,
but under submerged conditions infection was rare due to the anoxic environment (Ilag
et al., 2007). However Purakayastha and Chhonkar (2001) in rice studies in India
reported that AMF could survive in waterlogged conditions, and that Glomus
etunicatum showed fairly high colonization and best survival under submerged
Page 114
90
conditions. Similarly, a study in rice in Japan indicated that mycorrhizal colonization
declined under continous flooding to 32% from 48% observed in upland rice. The
colonization was significantly higher when the rice was flooded and then unflooded 30
days to maturity, compared with those that were continuously flooded upto maturity
(Solaiman & Hirata (1995).
Adequate soil moisture favoured AM development but when soil moisture became too
high or low, it suppressed colonization (Entry et al., 2002). This is because arbuscular
mycorrhiza fungi are obligate aerobes (Smith & Smith, 2011). Accordingly, a low
colonization rate of roots under flooded conditions could be the result of lower oxygen
availability to the fungi. However, in this study, the low colonization under flooding
still conferred significant benefit to the passion fruit seedlings.
In this study, the leaf and root soluble sugar content remained constant in non-
mycorrhizal or slightly increased in mycorrhizal seedlings in unflooded treatments.
Under flooding, the total soluble sugars increased sharply and then dropped to the
control level. Under flooding, non-mycorrhizal sugar content in both leaves and roots
peaked in 7 days of flooding while in mycorrhizal seedlings, the peak occurred in the
14th day. These findings agree with studies in maize in Iran which indicated that the
amount of soluble sugars increased 1.5-2 times when compared with the controls
during the early stage of flooding. However, increasing flooding period decreased this
ratio and the amount of sugars gradually decreased and finally reached a level similar
to the controls (Pourabdal et al., 2008).
Various reasons are given to account for the increased sugar content in leaves under
flooding. Increased sugars accumulation in the leaves could be attributed to reduced
carbohydrate translocation to the roots as was reported in studies in alfalfa and Lotus
corniculatus in USA (Barta, 1987). This reduction of photosynthate translocation to
roots under flooding stress might also have been due to the reduction of carbohydrate
utilization in roots as was reported in sunflowers in USA study (Wample and Davis,
1983) or to depression of the photosynthate transport system as reported in Pine in USA
(Topa & Cheeseman, 1992).
Page 115
91
In this study, the total soluble sugar content under flooding increased in mycorrhizal
seedlings. The effect of AM inoculation on carbohydrate accumulation under flooding
has not been widely studied in plants. However, Neto et al. (2006) in a study of Aster
tripolium in Portugal showed that mycorrhizal plants had better tolerance to flooding
that was mediated through improvement of the osmotic adjustment of the plant tissues
via production of higher concentrations of soluble sugars.
In this study, mycorrhizal inoculation delayed peak soluble sugar increase under
flooding. Whereas soluble sugars peaked in non-mycorrhizal treatments in 7 days of
flooding, the peak occurred after 14 days of flooding in mycorrhizal seedlings. This
may have been due to mycorrhizal inoculation facilitating translocation of
photosynthates to the roots and/or preventing accumulation of photosynthates in the
leaf tissues.
In this study, the leaf nitrogen content remained constant under unflooded conditions.
Flooding however caused a reduction in the leaf nitrogen content. The total nitrogen
content in plant tissue has been widely reported to decrease under flooding stress in
various crop species, including apple (Olien, 1989) and pijuayo palms (Carvalho &
Ishida, 2002).
The low nitrogen content can be attributed to inhibition of nitrogen uptake due to root
damage under flooding. In general, substrate flooding causes disability in the
absorption of macronutrients (Kozlowski & Pallardy, 1984).
Despite nitrogen reduction under flooding, mycorrhizal treatments maintained higher
nitrogen content during the first 14 days in relation to non-mycorrhizal seedlings. This
may be related to the greater root mass and greater root health observed in mycorrhizal
seedlings under flooding. The better root health promoted by mycorrhization therefore
facilitated uptake of nutrients, including nitrogen, and ensured higher nitrogen content
in the leaves.
Page 116
92
5.3 Effect of arbuscular mycorrhizal inoculation on growth and nutrient uptake
of tropical fruit seedlings
Results from this study indicate that AM fungal inoculation improves growth of
lemons, passion fruits, papaya, mango and avocado seedlings. The improvement
occurred through increase in plant height, leaf number and leaf area, increased biomass
accumulation (fresh and dry weights) and improved nutrient uptake.
Many researchers have also reported the benefits of arbuscular mycorrhiza on growth
and biomass accumulation in plants.Mycorrhiza inoculation was found to increase the
plant height, stem diameter and leaf number of sweet corn in USA (Tas, 2014). The
shoot fresh weight was significantly increased by all three mycorrhiza fungi species,
but only inoculation with Glommusintraradices and G. fasciculatum increased root dry
weight. Rasouli-Sadaghiani et al., (2010) also showed that mycorrhizal basil plants had
significantly higher shoot and root dry weight and plant height. Similar observations
were made by Qiao et al., (2011) in pigeon peas, Al-Karaki (2013) in sour oranges and
Suri & Choudhary (2013) in soybeans.
The improved performance of mycorrhizal seedlings can be attributed to improved
efficiency of phosphorus uptake as evidenced by increased phosphorus accumulation
in the leaves. In papaya study in India, leaf petiole of mycorrhizal plants recorded
higher total phosphorus (0.42 – 0.63%) as compared to control (0.35%) plants (Kadhe
& Rodrigues, 2009). A significant increase in shoot P concentration was also observed
when L. usitatissimum was inoculated with Glommusmosseae or G. intraradices and
their combination (Rydlová et al., 2011). Sukhada (1992) also reported two fold
increase in leaf phosphorus concentration in papaya inoculated with Glomus mosseae
and Glomus fasiculatum at lower levels of soil P (0g and 4.6g of triple super
phosphate).Reports of improved phosphorus supply in low nutrient soils by
mycorrhizal inoculation were also reported by Ishii et al (1996), Wamocho (1998),
Cruz et al., (2000), Fidelibus et al., (2001), Kipkoriony et al. (2002); Muok and Ishii
(2006) among other researchers.
Page 117
93
The experiments were set up in either sand or a mixture composed of sand and nitrosol
(1:1 vol/vol), both of which had low nutrient content. Research shows that under such
conditions, AM fungi provides a very effective pathway by which P can be scavenged
from large volumes of soil and rapidly being delivered to cortical cells within the root
(Smith & Smith, 2011). This was attributed to individual fungal hyphae having much
smaller diameters than roots, therefore allowing access to narrower soil pores and
increasing the soil volume explored (Smith & Read, 2008; Schnepf et al., 2011).
In this study, mycorrhizal seedlings had greater root mass compared to un-inoculated
seedlings, as indicated by greater root fresh weight. Likewise, the extent of mycorrhizal
root infection was significantly greater in inoculated seedlings than in un-inoculated
seedlings. It is expected that this greater mass of mycorrhizal roots corresponded to
greater absorptive surface area for nutrients and water.
In experiments undertaken in sand culture under various P levels, mycorrhizal
inoculation combined with moderate amount of P provided the highest growth
response. Mycorrhizal plants subjected to high P content (1.68 ppm) initially had the
highest increase in plant height. However, there was a reduction in plant height in the
high P experiment at the end of the experiment period. At the end, there was no
significant difference between the myorrhizal plants that received high P and the non-
mycorrhizal plants that received similar high P or slightly lower P amount (0.44 and
0.88 ppm P). This indicates that the high phosphorus content in the presence of
arbuscular mycorrhiza became deleterious to plant growth. A study in sunflower also
found that treatment combination of mycorrhiza and 200 kg P/ha and nonmycorrhizal
200 kg P/ha combination did not show significant difference in terms of seed yield of
sunflower (Vaseghmaneshet al., 2014).
Various reasons have been given for the adverse effect of high P on plant growth in the
presence of mycorrhiza. Very high P application was found to alter root colonization
(particularly reducing arbuscule development) and decrease AM fungal biomass per
plant, including both biomass in roots and in soil (Smith & Read, 2008). Balzergue et
al. (2011) also reported reduction in appressorium formation on pea (Pisum sativum)
roots at high P. High P levels in the soil also reduced spore germination and hyphal
Page 118
94
growth from the germinated spores and inhibited early colonization of the roots and
growth of the extraradical mycelium (Smith & Smith, 2011).
In this study mycorrhizal inoculation increased the leaf nitrogen content in rough lemon
seedlings. Nitrogen uptake was also significantly increased in mycorrhizal chickpea
plants in Pakistan (Yaseen et al., 2012). Like in the case of phosphorus, the major
benefit of mycorrhiza in increasing uptake of N to plants was by availing greater soil
exploration and supply to host roots (Sundar et al., 2010).
In this study potassium uptake was increased in lemon, papaya and avocado seedlings.
This is consistent with pawpaw study in India which showed that total potassium
content of leaf petiole was higher in mycorrhizal plants and ranged from 2.68 - 4.39%
as compared to non-mycorrhizal plants (2.26%) (Kadhe and Rodrigues, (2009). Uptake
of K was also increased by AMF inoculation in cowpea and sorghum (Bagayoko et al.,
2000) and in finger millet by Rao et al., (1983).
This can be attributed to greater soil exploration and increasing supply to host roots.
Further increased K levels in mycorrhizal plants may be attributed to the fact that AM
fungi binding soil particles to each other and to the roots, which is beneficial for the
nutrient uptake (Estrada-Luna et al., 2000).
In the study in sand: nitrosol media, mycorrhizal plants did not differ significantly, in
all measured parameters, whether in sterilized or unsterilized media. This indicates that
mycorrhizal inoculation played a greater role in the observed plant performance than
media sterilization.Un-inoculated seedlings in this study performed poorly in both
sterilized and un-sterilized media. However, un-inoculated seedlings held in sterilized
media performed better that those held in unsterilized media. This could be attributed
to elimination of all organisms in the media by sterilization. This can be an advantage
through elimination of harmful micro-organisms in the media and could have
contributed to the improved performance of un-inoculated seedlings in sterilized
media.
On the other hand, lack of media sterilization can be an advantage because beneficial
micro-organisms are not eliminated. In the un-sterilized seedlings, a small percentage
Page 119
95
of mycorrhizal root infection was observed. This was expected to have proved
beneficial by antagonizing against harmful microbes in the media as reported by Elsen
et al., (2003).
The presence of mycorrhizal infection in the roots of un-inoculated seedlings raised in
un-sterilized media suggests the availability of AM fungi in native soils in the tropics.
In this study, unsterilized media had a small quantity of mycorrhizal spores at the
beginning of the experiment. This is an indication of the low level of mycorrhization
of native soils in Kenya and explains why non mycorrhizal seedlings performed poorly
This confirms the report by Wamocho (1998) that in fruit orchards in Kenya, AM
fungal spores and the mycorrhizal infection of fruit tree roots are low. Likewise,
evidence from a survey of 41 tree species in five nurseries in Ethiopia and Somalia
suggest that naturally mycorrhizal formation, even in unsterilized soils can be sparse
(Michelson, 1992).
Mycorrhizal inoculation in mango seedlings proved to be beneficial in the absence or
presence of endosperm in the seed. This shows that in mango seedlings, mycorrhizal
fungi played a more important role than endosperm presence. This can be attributed to
the faster deterioration of the endosperm in mangoes, allowing the mycorrhiza to play
a greater role in availing nutrients to the seedlings.
Unlike in mangoes, in avocados, mycorrhizal inoculation was not beneficial as
compared to the endosperm condition. In avocados, the seedlings containing an
endosperm performed better than those without, inspite of the mycorrhizal condition.
In avocado seedlings, the endosperm was still intact at the time of termination of the
experiment unlike in mangoes where the endosperm was exhausted. This explains why
the mycorrhizal effect was not noticed in avocados, because the seedling could still
obtain nourishment from the endosperm. In the absence of endosperm, mycorrhizal
inoculation was beneficial in avocados, because the mycorrhizal seedlings without an
endosperm performed better than the non-mycorrhizal seedlings without endosperm.
Page 120
96
CHAPTER SIX
CONCLUSIONS AND RECOMMENDATIONS
This study indicated that mycorrhizal inoculation improved growth and performance
of mango and passion fruit seedlings raised under salt stress conditions, as measured
by growth parameters of plant height, leaf number and chlorophyll content, and
biomass parameters of shoot, stem and root fresh and dry weights and leaf area. This is
by enhancing the uptake of P, K and Mg, while reducing the detrimental effects of Na
toxicity on seedling growth. As a low cost technology, arbuscular mycorrhizal
technology is recommended for use to alleviate salinity stress in tropical fruit seedlings.
To build up on this study on salinity stress, it is recommemded that field study of the
effect of arbuscular arbuscular mycorrhizal inoculation on the survival and growth of
tropical fruit seedlings under salt stress conditions be undertaken. In particular, field
studies should target fruit crops grown in salinity prone areas eg coconuts, cashew and
mangoes.These studies by use of of native arbuscular mycorrhizal inocula found in the
soils in ASAL areas where salinity is prevalent.
It is also recommended that studies targeting salinity induced by sodium carbonates
and bicarbonates be undertaken both at field and greenhouse conditions. This is
important because studies by Njue (2004) showed that salinity in Kenya’s ASAL areas
is not just due to sodium chloride, but also due to sodium carbonates and bicarbonates.
In addition, studies should be undertaken to determine the interaction between
arbuscular mycorrhizal fungi and calcium sulphates and carbonates in influencing
NaCl-induced salinity. Studies have shown that calcium sulphates alleviate NaCl
toxicity, while calcium carbonates exacerbates it (Njue, 2004).
This study indicated that under flooding stress, mycorrhizal inoculation improved
growth and performance of passion fruit seedlings as measured by root, stem and leaf
fresh and dry weights, leaf area. Under flooding conditions, AM fungi also slowed the
decline in chlorophyll a,b concentration and total chlorophyll, and also delayed the
onset of carotenoid rise in the leaves of flooded passion fruits. The beneficial effects of
arbuscular mycorrhizal fungi in alleviating flooding stress is by inducing an increase
Page 121
97
in the leaf proline concentration,stabilising soluble sugar levels in leaf tissues and
facilitating uptake of phosphorus and nitrogen both in leaf and root tissues.
As a low cost technology, arbuscular mycorrhizal technology is recommended for use
to alleviate flooding stress in tropical fruit seedlings. To build up on this study on
flooding stress, it is recommended that field study be undertaken on the effect of
arbuscular arbuscular mycorrhizal inoculation on the survival and growth of tropical
fruit seedlings under flooding stress conditions. These studies should be taken by use
of native arbuscular mycorrhizal inocula found in the soils in ASAL areas where
flooding is prevalent in Kenya.
It is recommended that greenhouse studies on effect of arbuscular mycorrhizal fungi
on flooding stress on other tropical fruit seedlings of economic importance. This is
because this particular study focused only on passion fruit seedlings. It is important to
determine if other fruit seedlings will be affected in a similar manner as passion fruits.
For laboratory studies, it is recommended that the following aspects should be
determined: measures on potentially toxic compounds such as sulfides, CO2, soluble Fe
and Mn, ethanol, lactic acid, acetaldehyde, acetic and formic acid on both flooded and
unflooded soils and and rhizosphere. This will help fill the gap left as these parameters
could not be determined in the present study due to unavailability of equipments.
This study found out that arbuscular mycorrhizal fungi alleviated nutrient stress of
lemons, passion fruits, papaya, mango and avocado seedlings as measured by plant
height, leaf number and stem girth of seedlings.The alleviation occurred in experiments
undertaken both in mycorrhizal treatments both in sterile and un-sterile sand/soil media
and also in sand culture under low phosphorus regimes. Arbuscular mycorrhizal
inoculation also increased the leaf area and the root, leaf and stem fresh and dry weights
and induced an increase in the uptake of phosphorus, nitrogen and potassium in the leaf
tissues of lemons, passion fruits, papaya, mango and avocado seedlings. As a result,
AM fungi improved the capacity of tropical fruit to absorb and utilize plant nutrients
possibly by increasing the effective root surface area from which available form of
nutrients are absorbed and also by increasing access of roots by bridging the depletion
zones.
Page 122
98
In addition to the recommendations already presented, this study recommends the
adoption of arbuscular mycorrhizal fungi as a regular practise in the nursery
propagation of tropical fruit seedlings. This will help in the transfer of mycorrhizal
seedlings into orchards at transplanting time. A suggestion for further study is to on
incorporation of arbuscular mycorrhizae spores into the planting hole at transplanting
time and/or introduction into fruit orchards as a regular practise, to replace those that
are lost via tillage practices, soil erosion and fungicidal sprays.This is a regular practise
in Japan were orchards are regularly introduced via sprinkler irrigation. In Kenya, the
possibility of introducing AM spores into below plant canopy by use of a watering can
should be investigated.
To bridge the knowledge gap, it is recommended that the government facilitates
training of smallholder farmers, agro-dealers, fruit seedling propagators, extension
service workers and policy makers on the beneficial aspects of arbuscular mycorrhizal
technology. The training should include aspects of isolation, identification,
examination and selection of improved strains having greater crop diversification and
survival during transport, storage and after soil application. There should especially be
emphasis on on-farm production of inoculum from locally isolated adapted species.
These may turn out to be more effective than introduced ones which may not be locally
adapted to the local environmental conditions. Training on on-farm production of
mycorrhizal inoculum to avoids some of production and transportation costs. This will
allow technology transfer and also solve the problem of expensive inoculum prices,
poor delivery mechanisms and the resultant reduction in quality.
The government should also promote measures to address soil erosion problems in
ASAL areas which lead to reduction of native arbuscular mycorrhizal inocula in the
soil. There should also be promotion of flood control measures especially in areas that
currently experience increased flooding. Better land management/conservation
farming using improved methods of land husbandry to better conserve soil, water, and
the integrity of natural and managed ecosystems is needed.
In addition to the research areas already recommended, there is need to carry out
research on arbuscular mycorrhizal influence using single species instead of mized
Page 123
99
inoculums that was used in this study. In addition, there is need to determine the effects
of arbuscular mycorrhizal fungi and trichoderma interaction especially on alleviation
of soil-borne diseases. Other studies that could be undertaken include to determine the
effect of AM fungi on growt of tropical fruit seedlings in acidic, calcerous and alkaline
soils in Kenya.
Page 124
100
REFERENCES
Al-Karaki, G.N. (2013). The effect of arbuscular mycorrhizal fungi on the
establishment of sour orange (Citrus aurantium) under different levels of
phosphorus. VII. International symposium on mineral nutrition of fruit
crops book series. Acta Horticulturae, 984, 103-108.
Antunes, P.M., de Varennes, A., Rajcan, I. & Goss, M.J. (2006). Accumulation of
specific flavonoids in soybean (Glycine max (L.) Merr.) as a function of
the early tripartite symbiosis with arbuscular mycorrhizal fungi and
Bradyrhizobium japonicum (Kirchner) Jordan. Soil Biology &
Biochemistry, 38, 1234–1242.
Araus, J.L., Ferrio, JP. Buxó, R & Voltas, J. (2007). The historical perspective of dry
land agriculture: lessons learned from 10000 years of wheat cultivation.
Journal of Experimental Botany, 58, 131.145.
Ardestani, N.K., Zare-Maivan, H. & Ghanati, F. (2011). Effect of different
concentrations of potassium and magnesium on mycorrhizal colonization
of maize in pot culture. African Journal of Biotechnology, 10(73), 16548-
16550.
Arnon, D.I. (1949). Copper enzymes in isolated chloroplasts. Polyphenoloxidase in
Beta vulgaris. Plant physiology, 24(1), 1-16.
Aroca, R., Ruiz-Lozano, J.M., Zamarreño, A.M., Paz, A. García-Mina, FM., Pozo, MJ.
& López-Ráez, JA. (2013). Arbuscular mycorrhizal symbiosis influences
strigolactone production under salinity and alleviates salt stress in lettuce
plants. Journal of Plant Physiology, 170, 47–55.
Ashraf, M. &. Harris, PJC. (2004). Potential biochemical indicators of salinity
tolerance in plants. Plant Science, 166, 3-16.
Bagayoko, M., George, E. Römheld, V. & Buerkert, A. (2000). Effects of mycorrhizae
and phosphorus on growth and nutrient uptake of millet, cowpea and
Page 125
101
sorghum on a West African soil. Journal of Agricultural Science, 135, 399-
407
Bajpai, S. & Chandra, R. (2015). Effect of Waterlogging Stress on Growth
Characteristics and Sod Gene Expression in Sugarcane.International
Journal of Scientific and Research Publications, 5(1), 1-8.
Balzergue, C., Puech-Pagès, V. Bécard, G. & Rochange, SF. (2011). The regulation of
arbuscular mycorrhizal symbiosis by phosphate in pea involves early and
systemic signalling events.Journal of Experimental Botany, 62, 1049–
1060.
Bansal, M., Kukreja, K. & Dudeja, SS. (2012). Diversity of Arbuscular mycorrhizal
fungi, prevalent in rhizosphere of different crops grown in the university
farm. African Journal of Microbiology Research, 6(21), 4557-4566.
Barta, A. (1987). Supply and partitioning of assimilates to roots of Medicago sativa
and Lotus corniculatus under hypoxia. Plant Cell Environment, 10, 151-
156.
Barta, A. L. & Sulc, RM. (2002). Interaction between Waterlogging Injury and
Irradiance Level in Alfalfa Crop Science, 42, 1529-1534.
Bates L.S., Waldren, RP. & Teare, I.D. (1973). Rapid determination of free proline
forwater stress studies. Plant and Soil, 39, 205–207.
Bellgard, S.E. &. Williams, SE. (2011). Response of Mycorrhizal Diversity toCurrent
Climatic Changes.Diversity, 3, 8-90.
Bhosala, K.S. & Shinde, BP. (2011). Influence of arbuscular mycorrhizal Fungi fungi
on proline and chlorophyll content in Zingiber Officinale Rose grown under
water stress. Indian Journal of Fundamental and Applied Life Science, 1,
172-176.
Page 126
102
Binet, M.N., Van Tuinen, D. Deprêtre, N. Koszela, N. Chambon, C. & Gianinazzi, S.
(2011). Arbuscular mycorrhizal fungi associated with Artemisia
umbelliformis Lam, an endangered aromatic species in Southern French
Alps. Mycorrhiza, 21, 523–535.
Bligh E.G. & Dyer, WJ. (1959). A rapid method of total lipid extraction and
purification Canadian Journal of Biochemistry and Physiology, 37, 911–
917.
Bonfante, P. & Genre, A. (2008). Plants and arbuscular mycorrhizal fungi: An
evolutionary developmental perspective. Trends in Plant Science, 13, 492-
498.
Borde M., Dudhane, M. & Jite, PK. (2010). AM Fungi fungi Influences the
photosynthetic activity, growth and antioxidant enzymes in Allium sativum
L. under salinity condition. Notingham Science and Biology, 2, 64-71.
Botelho, M.R. & Vanden Heuvel, JE. (2005). High dissolved oxygen concentration of
floodwater reduces carbohydrate concentration of cranberry uprights
during flooding HortScience, 40(3), 569-573.
Brito1, I., De Carvalho, M. & Goss, MJ. (2011). Summer survival of arbuscular
mycorrhiza extraradical mycelium and the potential for its management
through tillage options in Mediterranean cropping systems. Soil Use and
Management, 27, 350–356.
Bucher, M. (2007). Functional biology of plant phosphate uptake at root and
mycorrhiza interfaces. New Phytologist, 173, 11–26.
Cardoso, I.M. & Kuyper, TW. (2006). Mycorrhizas and tropical soil fertility: nutrient
management in tropical agroecosystems. Agriculture Ecosystem
Environment, 116, 72-84.
Page 127
103
Carmo, R.B.; Almeida de, A.F, Mielke, M.S. & Gomes, F.P. (2009). Effects of
substrate flooding on growth and chemical composition of Theobroma
cacao L. clonal genotypes. Review Brasilica Fruticosa, 31(3), 805-815.
Carvalho, C.J.R. De & Ishida, F.Y. (2002). Responses of young pijuayo plants (Bactris
gasipaes Kunth) to flooding.Pesq. agropec. bras. 37, 1231-1238.
Çekic, F.O., Unyayar S & Ortas, I. (2012). Effects of arbuscular mycorrhizal
inoculation on biochemical parameters in Capsicum annuum grown under
long term salt stress. Turkish Journal of Botany, 36, 63–72.
Chen, B.D., Zhu, YG. Duan, J. Xiao, XY. &. Smith, SE. (2007). Effects of the
arbuscularmycorrhizal fungus Glomus mosseae on growth and metal
uptake by four plant species in copper mine tailings. Environmental
Bulletin 147, 374 - 380.
Collaku A. & Harrison, SA. (2002). Losses in wheat due to waterlogging. Crop
Science42:444–450
Colla, G., Rouphael, Y. Cardarelli, M. Tullio, M. Rivera, CM. & Rea, E. (2008).
Alleviation of salt stress by arbuscular mycorrhizal in zucchini plants
grown at low and high phosphorus concentration. Biology and Fertility of
Soils, 44, 501-509.
Colmer T.D. & Voesenek, LACJ. (2009). Flooding tolerance: suites of plant traits in
variable environments Functional Plant Biology, 36, 665–681.
Cruz, A.F., Ishii, T. & Kadoya, K. (2000). Effect of arbuscular mycorrhizal fungi on
tree growth, leaf water potential and levels of 1-aminocyclopropane-1-
carboxylic acid andethylene in the roots of papaya under water stress
conditions. Mycorrhiza, 10, 121-123.
Dalgaard, T., Hutchings, N.J., & Porter, JR. (2003). Agroecology, scaling and
interdisciplinarity. Agriculture Ecosystem Environment, 100, 39-51.
Page 128
104
Davies, B.H. (1976). Carotenoids. In Chemistry and Biochemistry of plant pigments
vol. 2, T.W. Goodwin (ed) pp. 38-165. London: Academic Press.
Debouba, M., Gouia, H. Suzuki, a. & Ghorbel, MH. (2006). NaCl stress effects on
enzymes involved in nitrogen assimilation pathway in tomato
“Lycopersicon esculentum” seedlingsJournalof Plant Physiology, 163,
1247–1258.
Dhanapackiam, S. & Muhammad, MH. (2010). Effect of salinity on chlorophyll and
carbohydrate contents of Sesbania grandiflora seedlings. Indian Journal of
Science and Technology, 3, 64-66.
Dolinar, N. & Gaberˇsˇcik, A. (2010). Mycorrhizal colonization and growth of
Phragmites australis in an intermittent wetland. Aquatic Botany, 93(2), 93–
98.
Ebrahimzade, H. (2001). Plant physiology, Subject of nutrition and absorption. IN
Ardestani N.K., H. Zare-Maivan and F. Ghanati 2011. Effect of different
concentrations of potassium and magnesium on mycorrhizal colonization
of maize in pot culture. African Journal of Biotechnology, 10(73), 16548-
16550.
El-Amri, S.M., Al-Whaibi, MH. Abdel-Fattah, GM. & Siddiqui, MH. (2013). Role of
mycorrhizal fungi in tolerance of wheat genotypes to salt stress African
Journal of Microbiology Research, 7(14), 1286-1295.
Elsen, A., Baimey, H. Swennen, R. De Waele, D. (2003). Relative mycorrhizal
dependency and mycorrhiza–nematode interaction in banana cultivars
(Musa spp) differing in nematode susceptibility. Plant and Soil, 256, 303–
313.
Entry, I.A., Rygiewicz, PT. Watrud, LS. & Donnelly, PK. (2002). Influences of adverse
soil conditions on the formation and function of arbuscular mycorrhizas.
Advanced Environment Research, 7, 123-138.
Page 129
105
Estrada, B.E., Aroca, R. Barea, JM. & Ruiz-Lozano, JM. (2013). Native arbuscular
mycorrhizal fungi isolated from a saline habitat improved maize
antioxidant systems and plant tolerance to salinity. Plant Science, 201, 43–
51.
Estrada-Luna, A. A., Davies, Jr. F. T. & Egilla, J. N. (2000). Mycorrhizal fungi
enhancement of growth and gas exchange of micro-propagated guava
plantlets (Psidium guajava L.) during ex vitro acclimatization and plant
establishment. Mycorrhiza, 10, 1-8.
Evelin, H., Kapoor, R. & Giri, B. (2009). Arbuscular mycorrhizal fungi in alleviation
of salt stress: a review. Annals of Botany, 104, 1263–1280.
Facelli, E., Smith, SE. & Smith, MS. (2009). Mycorrhizal symbiosis overview and new
insights into roles of arbuscular mycorrhizas in agro- and natural
ecosystems. Australian Plant Pathology, 38(4), 338-344.
Fatemeh B. and M. Zaynab (2014). Enhanced Rooting of Leaf Bud Cuttings of
Schefflera arboricolaUsing Mycorrhizal Fungi Annual Research & Review
in Biology, 4(18), 2892-2900.
Faycal, B. (2011). Mycorrhizal colonization and growth characteristics of salt stressed
Solanum lycopersicum L. Unpublished MSc Thesis, Canada: University of
Ottawa.
Feddermann, N, Finlay, R.R & Elfstrand, BT. (2010). Functional diversity in
arbuscular mycorrhiza the role of gene expression, phosphorous nutrition
and symbiotic efficiency. Fungal Ecology, 3, 1–8.
Fidelibus, M.W., Martin, C.A. & Stutz, J.C. (2001). Geographic isolates of Glomus
increase root growth and whole-plant transpiration of Citrus seedlings
grown with high phosphorus.Mycorrhiza, 10, 231.236.
Fiedler, S., Vepraskas, MJ. & Richardson, JL. (2007). Soil redox potential: importance,
field measurements and observations. Advances in Agronomy, 94, 2–56.
Page 130
106
Gai, J.P., Zhang, JL. Feng, G. & Li, XL. (2010). Arbuscular Mycorrhizal Fungi
Diversity and Contribution to Crop Growth in Agricultural Fields. JIFS, 7,
41-45.
Gao, X., Kuyper, TW. Zou, C. Zhang, F. &. Hoffland, E. (2007). Mycorrhizal
responsiveness of aerobic rice genotypes is negatively correlated with their
zinc uptake when nonmycorrhizal. Plant and Soil, 290, 283-291.
Garg, N. & Manchanda, G. (2009). Role of arbuscular Mycorrhizae in the alleviation
of ionic, osmotic and oxidative stresses induced by salinity in Cajanus
cajan (L.) Millsp. (pigeonpea). Journal of Agronomy and Crop Science,
195, 110–123.
Gerdemann, J.W. & Nicolson, T.H. (1963). Spores of mycorrhizal endogone species
extracted from soil by wet-sieving and decanting. Transactions of the
British Mycological Society, 1963, 235-244.
Geisler-Lee, J., Caldwell, C. & Gallie, D.R. (2010). Expression of the ethylene
biosynthetic machinery in maize roots is regulated in response to hypoxia.
Journal of Experimental Botany, 61, 857–871.
Ghorbanian, D., Harutyunyan, S. Mazaheri, D. & Rejali, E. (2011). Effects of
mycorrhizal symbiosis and different levels of phosphorus on yield, macro
and micro elements of Zea mays L. under water stress condition. African
Journal of Agricultural Research, 6, 5481-5489.
Gichere, S.K., Olado, G. Anyona, DN. Matano, A. Dida, G.O. Abuom, PO. Amayi, J.
& Ofulla, AVO. (2013). Effects of Drought and Floods on Crop and
Animal Losses and Socio-economic Status of Households in the Lake
Victoria Basin of Kenya. Journal of Emerging Trends in Economics and
Management Sciences (JETEMS), 4(1), 31- 41.
Page 131
107
Giovannetti, M., Avio, L. Fortuna, P. Pellegrino, E. Sbrana, C. & Strani, P. (2006). At
the root of the wood wide web self recognition and non-selfincompatibility
in mycorrhizal networks. Plant Signaling & Behavior, 1, 1-5.
Giovannetti, M. & Mosse, B. (1980). An evaluation of techniques for measuring
vesicular–arbuscular infection in roots. New Phytology, 84, 489-500.
Giri, B., Kapoor, R. & Mukerji, KG. (2005). Improved tolerance of Acacia nilotica to
salt stress by arbuscular mycorrhiza. New Forests, 29(1), 63-73.
Giri, B. & Mukerji, KG. (2004). Mycorrhiza inoculants alleviates salt stress in Sesbania
aegyptiaca and Sesbania grandiflora under field conditions: evidence for
reduced sodium and improved magnesium uptake. Mycorrhiza 14, 307-
312.
Gogoi, P. & Singh, RK. (2011). Differential effect of some arbuscular mycorrhizal
fungi on growth of Piper longum L. lndianJournal of Science and
Technology 4(2), 119-125.
Government of Kenya (GoK) (2010). National Climate Change Response Strategy.
Nairobi: Ministry of Environment and Mineral resources.
Graham, J.H. & Eissenstat, DM. (1998). Field evidence for the carbon cost of citrus
mycorrhizas. New Phytologist, 140, 103-110.
Guissou, T. (2009). Contribution of arbuscular mycorrhizal fungi to growthand nutrient
uptake by jujube and tamarind seedlings in a phosphate (P)-deficient soil.
African Journalof Microbiology Research, 3, 297-304.
Hajiboland, R.N., Aliasgharzad, N. & Barzeghar, R. (2009). Phosphorus mobilization
and uptake in mycorrhizal rice plants under flooded and non-flooded
conditions Acta Agriculturae Slovenica, 93(2), 153-161.
Page 132
108
Hattori, R., A. Matsumura, K. Yamawaki, A. Tarui and H. Daimon (2013). Effects of
flooding on arbuscular mycorrhizal colonization and root-nodule formation
in different roots of soybeans Agricultural Sciences 4(12), 40845.
Heydarian, Z., Sasidharan, R., Cox, M.C.H. Pierik, R. Voesenek, L.A.C.J. & Peeters,
AJM. (2010). A kinetic analysis of hyponastic growth and petiole
elongation upon ethylene exposure in Rumex palustris. Annals of Botany,
106, 429–435.
Hindumathi, A. & Reddy, BN. (2011). Occurrence and distribution of arbuscular
mycorrhizal fungi and microbial flora in the rhizosphere soils of mungbean
[Vigna radiata (L.) wilczek] and soybean [Glycine max (L.) Merr.] from
Adilabad, Nizamabad and Karimnagar districts of Andhra Pradesh state,
India. Advanced Bioscienceand Biotechnology, 2, 275-286.
Horticultural Crop Directorate (2017). Horticultural crops production validated
annual report. (pp 8-22) Nairobi, HCD.
Horticultural Crop Development Authority (2014). Horticultural crops production
validated annual report (pp 6-19). Nairobi: HCD.
Horticultural Crop Development Authority (2012). Horticultural crops production
validated annual report (pp 6-19) Nairobi: HCD.
Horticultural Crop Development Authority (2008). Horticultural crops production
validated annual report (pp 15-23) Nairobi: HCD.
Hsu, Y.M., Tseng, MJ. & Lin, CH. (1999). The fluctuation of carbohydrates and
nitrogen compounds in flooded wax-apple trees. Botanical Bulletin of
Academia Sinica (Taipei), 40, 193–198.
Huang, J.C., Lai, WA. Singh, S. Hameed, A. & Young, CC. (2013). Response of
mycorrhizal hybrid tomato cultivars under saline stress. Journal of Soil
Science and Plant Nutrition, 13(2), 469-484.
Page 133
109
Ilag, L.L., Rosales, AM. Elazegvi, VW. & Mew, TW. (1987). Changes in the
population of infective endomycorrhizal fungi in a rice based cropping
system. Plant and Soil, 103, 67-73.
Irigoyen, J.J., Emerich, WD. & Sanchez-Diaz, D. (1992). Water stress-induced changes
in concentration of proline and total soluble sugars in nodulated alfalfa
plants. Physiologia Plantarum, 84, 55-60.
Ishii, T., Shreshta, YH. & Kadoya, KH. (1992). VA mycorrhizal fungi in citrus soils
and the relationship between soil factors and number of spores. Journal of
Japan Societyof Horticultural Science, 61, 166-167
Islam, M.A. & Macdonald, SE. (2004). Ecophysiological adaptations of black spruce
(Piceamariana) and tamarack (Larix laricina) seedlings to flooding. Trees
18, 35–42.
Jackson, M.B. & Drew, MC. (1984). Effects of flooding on growth and metabolism of
herbaceous plants. In (Kozlowski, T., Ed.)Flooding and Plant Growth (pp
47-128), New York: Academic Press.
Jaffee, S. (1995). The many faces of success: The Development of Kenya’s
Horticultural Exports. In S. Jaffee and J. Morton (eds), Marketing Africa’s
High Value Foods. Washington DC: World Bank
Johnson, N.C., Wilson, G.W.T. Bowker, M.A. Wilson, JA. & Miller, RA. (2010).
Resource limitation is a driver of local adaptation in mycorrhizal
symbioses. PNAS, 107, 2093-2098.
Jordan, N. & Huerd, S. (2008). Effects of soil fungi on weed communities in a corn-
soybean rotation. Renewable Agriculture Food System, 23, 108–117.
Juniper, S. & Abbott, LK. (2006). Soil salinity delays germination and limits growth
of hyphae from propagules of arbuscular mycorrhiza fungi.Mycorrhiza, 16,
371-379.
Page 134
110
Kenya Horticulture Competitive Project (KHCP) (2012). Kenya’s Competitive Position
in Horticulture. Retrieved from: http://www.hortinews.co.ke/.
/GCS_summary
Kenya Horticultural Council (2015). Overview of Kenya’s Horticultural Industry
Retrieved from: http://www.fpeak.org/khc.html
Kenya National Bureau of Statistics (2014). Kenya Facts and Figure. Retrieved from:
http://www.knbs.or.ke/index.php
Khade S.W and B. F. Rodrigues (2009).Studies on Effects of Arbuscular Mycorrhizal
(Am.) Fungi on Mineral Nutrition of Carica papaya L. Notingham
Botanicaland Horticulture Agrobot. Cluj, 37(1), 183-186.
Khanam, D. (2008). Influence of Flooding on the Survival of Arbuscular Mycorrhiza.
Bangladesh Journal Microbiology, 25(2), 111-114.
Kipkoriony L.R., F. Mizutani and K. Kadoya (2002). Effect of root-zone flooding on
mycorrhizal and non-mycorrhizal peach (Prunus persica Batsch) seedlings.
Scientia Horticulturae, 94(3), 285-295.
Kishor, P.B., Hong, z. Miao, GH. Hu, CA. & Verma, DPS. (1995). Overexpression of
D1-pyrroline-5-carboxylate synthetase increases proline production and
confers osmotolerance in transgenic plants. Plant Physiology, 108, 1387–
1394.
Koca, H., Bor, M. Özdemir, F. & Turkan, I (2007). The effect of salt stress on lipid
peroxidation, antioxidative enzymes and proline content of sesame
cultivars. Environmental Experimental Botany 60, 344–351.
Komori, F., Ohashi, Y. & Daimon, H. (2010). Effect of waterlogging on adventitious
root formation of adzuki bean (Vigna angularis (Willd.) Ohwi & Ohashi)
seedling grown in paddy soil. Root Research, 19, 43-48.
Page 135
111
Kozlowski, T.T. &Pallardy, S.G. (1984). Effects of flooding on water, carbohydrate
and mineral relations. In: Kozlowski TT (ed). Flooding and plant growth.
pp 165–193, Orlando: Academic Press.
Lacona, C., Cirilli, M. Zega, A. Frioni, E. Silvestri, C. & Muleo, E. (2013). A
somaclonal myrobalam rootstock increases water logging tolerance to
peach cultivar in controlled conditions. Scientia Horticulturae, 156, 1 – 8.
Larher, F., Leport, L. Petrivalsky, M & Chappart, M. (1993). Effectors for the
osmoinduced proline response in higher plants. Plant Physiologyand
Biochemistry, 31, 911–922.
Le Tacon F., Zeller, B. Plain, C. Hossann, C. Bréchet, C. & Robin, C. (2013). Carbon
transfer from the host to tuber melanosporum mycorrhizas and ascocarps
followed using a 13C pulse-labeling technique. PLoS ONE, 8, e64626.
Liao, C.T. & Lin, HC. (2001). Effect of flooding stress on photosynthetic activities of
Momordica charantia. Plant Physiology and Biochemistry, 32, 1-5.
Little, T.M. & Hills, LJ. (1978). Agricultural Experimentation: Design and Analysis,
New Jersey: John Wiley.
Mäkelä, P. Kärkkäinen, J. & Somersalo, S. (2000). Effect of glycinebetaine on
chloroplast ultrastructure, chlorophyll and protein content, and RuBPCO
activities in tomato grown under drought or salinity. In Biologia Plantarum
43(3), 471–475.
Mbora, A., Jamnadass, R. & Lillesø, J.P.B. (2008). Growing high priority fruits and
nuts in Kenya: Uses and management. (61 pp). Nairobi: The World
Agroforestry Centre.
Mensah, J.K., Obadoni, BO. Eruotor PG. & Onome-Irieguna, F. (2006). Simulated
flooding and drought effects on germination, growth, and yield parameters
of sesame (Sesamumu indicum L.) African Journalof Biotechnology, 5,
1249–1253.
Page 136
112
Michelson, A (1992). Mycorrhiza and root nodulation in tree seedlings from five
nurseries in Ethiopia and Somalia. Forest Ecological Managent, 48, 335-
348.
Miller, S.P. & Sharitz, RR. (2000). Manipulation of flooding and arbuscular
mycorrhizal formation influences growth and nutrition of two semi-aquatic
species. Functional Ecology, 14, 738-748.
Millner, P. D. & Kitt, D. G. (1992). The Beltsville method for soilless production of
vesicular-arbuscular mycorrhizal fungi. Mycorrhiza, 2, 9-15.
Ministry of Agriculture (2012). Production and export statistics for fresh horticultural
Produce for the year 2001. (pp 10-20). Nairobi: Ministry of Agriculture,
Horticulture Division.
Mohammad, M.J., Malkawi, HI. & Shibli, R. (2003). Effects of arbuscular mycorrhizal
fungi and phosphorus fertilization on growth and nutrient uptake of barley
grown on soils with different levels of salts. Journal of Plant Nutrition, 26,
125-137.
Mollard, F.P.O., Striker, GG. Ploschuk, LE. & Insausti, P. (2010). Subtle topographical
differences along a floodplain promote different plant strategies among
Paspalum dilatatum subspecies and populations. Austral Ecology, 35, 189–
196.
Mommer, L. & Visser, EWJ. (2005). Underwater photosynthesis in flooded terrestrial
plants: a matter of leaf plasticity. Annals of Botany, 96, 581–589.
Mugai, E.N. (2004). Salinity Characterization of the Kenyan Saline Soils. Soil
Scienceand Plant Nutrition, 50(2), 181 -188.
Muok, O.B. & Ishii, T. (2006). Effect of arbuscular mycorrhiza fungi on tree growth
and nutrient uptake of Sclerocarya birrea under water stress, salt stress and
flooding. Journal of Japan Societyof Horticultural Science, 75, 26-31.
Page 137
113
Murkute, A.A., Sharma, S. & Singh, S.K. (2006). Studies on salt stress tolerance of
citrus rootstock genotypes with arbuscular mycorrhizal fungi. Horticulture
Science (Prague) 33(2), 70–76.
Muthukumar, T., Udaiyan, K. Karthikeyan, A. & Marian, S. (1997). Influence of native
endomycorrhiza, soil flooding and nurse plant on mycorrhizal status and
growth of purple nutsedge (Cyperus rolundus) AgricultureEcosystem
Environment, 61, 51--58.
Muthuraj, K., Prasad, VJ. & Nagarajan, N. (2014). Arbuscular Mycorrhizal fungal
diversity and root colonization of some medicinal plants rhizosphere soil
of Madayipara Hills, Kannur, Western Ghats Kerala. World Journal of
Pharmacy and Pharmaceutical Sciences, 3, 1114 – 1122.
Mwangi, B. (2006). Using value chain financing to make money grow on trees.
Retrieved from:
www.valuechains.org/.../551/KenyaNationalEventReport.pdf
Nedorost, L. & Pokluda, R. (2012). Effect of arbuscular mycorrhizal fungi on tomato
yield and nutrient uptake under different fertilization levels. Acta Univ.
Agric. Et Silvic. 8, 181–186.
Neetu, N., Aggarwal, A. Tanwar, A. & Alpa, A. (2012). Influence of arbuscular
mycorrhizal fungi and Pseudomonas fluorescens at different
superphosphate levels on linseed (linum usitatissimum l.) growth response.
Chilean Journal of Agricultural Research, 72(2), 237-243.
Neto, D., Carvalho, LM. Cruz, C & Martins-Loucao, MA. (2006). How do mycorrhizas
affect C and N relationships in flooded Aster tripolium plants? Iberian
Symposium on Plant Mineral Nutrition, 279, 51- 63.
Nichols, K.A. & Wright, SF. (2004). Contributions of soil fungi to organic matter in
agricultural soils. In: Magdoff, F. and Weil, R., Eds., Functions and
Page 138
114
Management of Soil Organic Matter in Agro-ecosystems (pp179-198)
Washington, DC: CRC.
Njuguna, J.K., Ndungu, BW. Mbaka JN. & Chege, PK. (2005). Diagnostic survey
report on Passion fruit (pp 45-70) Kenya Agricultural Research Institute
Annual Report, Nairobi, KARI.
Nowak, J. & Nowak, SJ. (2013). CO2 enrichment and mycorrhizal effects on cutting
growth and some physiological traits of cuttings during rooting. Acta
Science 12(6), 67-75.
Nwangburuka, C.C., Olawuyi, OJ. Oyekale, K. Ogunwenmo, KO. Denton, OA &
Nwankwo, E. (2012). Growth and yield response of Corchorus olitorius in
the treatment of Arbuscular mycorrhizae (AM), Poultry manure (PM),
Combination of AM-PM and Inorganic Fertilizer (NPK). Advances in
Applied Science Research, 3, 1466-1471.
Nzanza, B., Marais, D. & Soundy, P. (2012). Responseof tomato (Solanum
lycopersicum L.) to nurseryinoculation with Trichoderma harzianumand
arbuscular mycorrhizal fungi under fieldconditions. Acta Agricutura
Scandinavia, 62, 209–215.
Oduol J., Place, F. Mithöfer, D. Olwande, J. Kirimi, L. & Mathenge, M. (2013).
Improving participation in agricultural commodity markets for
smallholder avocado farmers in Kenya: assessing growth opportunities for
women in Kandara and Marani districts. Tegemeo Institute of Agricultural
Policy and Development, Egerton University Report. Retrieved from:
http://www.tegemeo.org
Ongeri, B. O. (2014). Small Scale Horticultural farming along the Kenyan Highways
and Local economic development: Exploring the effect of factor prices.
International Review of Research in Emerging Markets and the Global
Economy (IRREM), 1(3), 102-119.
Page 139
115
Opondo, D.O. (2013). Loss and damage from flooding in Budalangi District, Western
Kenya. Loss and Damage in Vulnerable Countries Initiative, Bonn,
Germany: United Nations University.
Othira, J.O., Omolo, JO. Kiruki, S. Onek LA. & Wachira, WC. (2014). Molecular
diversity of arbuscular mycorrhizal fungi (AMF) in Lake Victoria Basin of
Kenya. Journal of Ecology and Natural Environment, 6(4), 145-152
Padma, R. T. M. & Kandaswamy, D. (1990). Effect of interactions between VA-
mycorrhizae and graded levels of phosphorus on growth of papaya (Carica
papaya). In: Current Trends in Mycorrhizal Research (B. L. Jalai and H.
Chand Eds.) p.133-134, Hisar, India: Haryana Agricultural University.
Parida, A.K. & Das, AB. (2005). Salt tolerance and salinity effects on plants: a review.
Ecotoxicology Environment Saf, 60, 324.349.
Parlanti, S., Kudahettige, NP. Lombardi, L. Mensuali-Sodi, A. Alpi, A. Perata, P. &
Pucciariello, C. (2011). Distinct mechanisms for aerenchyma formation in
leaf sheaths of rice genotypes displaying a quiescence or escape strategy
for flooding tolerance. Annals of Botany, 107, 1335–1343.
Perata, P., Armstrong, PM. Laurentius, A. & Voesenek, CJ. (2011). Plants and flooding
stress. New Phytologist, 190, 269–273.
Pimentel, P., Almada, RD. Salvatierra, A. Toro, G. Arismendi, M.J. Pino, MT. Sacredo,
B. & pinto, M. (2014). Physiological and morphological responses of
Prunus spp. with different degree of tolerance to long-term root hypoxia
Scientia Horticulturae, 180, 14.23.
Polavarapu, B., Kishor, K. & Sreenivasulu, N. (2014). Is proline accumulation per se
correlated with stress tolerance or is proline homeostasis a more critical
issue? Plant, Cell and Environment, 37(2), 300-311.
Pole, F.N., Ndung’u, J.M. Kimani, J.M. & Kagunu, E. (2012). Citrus farming in Kwale
district: a case study of Lukore location. Proceedings of the 12th KARI
Page 140
116
Biennial Scientific Conference. Retrieved from:
http://www.kari.org/biennialconference/conference12/docs/CITRUS%20
FARMING%20IN%20KWALE%20DISTRICT%20A%20CASE%20ST
UDY%20OF%20LUKORE%20LOCATION.pdf
Porcel, R., Aroca, R. & Ruiz-Lozano, JM. (2012). Salinity stress alleviation using
arbuscular mycorrhizal fungi. A review of Agronomic Sustainable
Development. 32, 181–200.
Pourabdal, L., Heidary, R & Farboodnia, T. (2008). Effects of different flooding
periods on some histochemicals of Zea mays seedlings. Plant Science
Research, 1(1), 8-12.
Prasad, S., Ram, PC & Uma, S. (2004). Effect of waterlogging duration on chlorophyll
content, nitrate reductase activity, soluble sugars and grain yield of maize.
Annalsof Plant Physiology, 18, 1–5.
Purakayastha, T.J. & Chhonkar, PK. (2001). Influence of vesicular-arbuscular
mycorrhizal fungi (Glomus etunicatum L.) on mobilization of Zn in
wetland rice (Oryza sativa L.). Biology and Fertility of Soils, 3(3), 323-
327.
Qiang-Sheng, W., Ren-Xue, Z. &Ying-Ning, Z. (2007). Osmotic solute responses of
mycorrhizal citrus (Poncirus trifoliata) seedlings to drought stress. Acta
Physiologia Plantarum, 29, 543-549.
Qiao, G., Wen, XP. Yu, LF & Ji, XB. (2011). The enhancement of drought tolerance
for pigeon peas inoculated by arbuscular mycorrhizae fungi. Plant Soil
Environment, 57, 541-546.
Querejeta, J.I., Barea, JM. Allen, MF. Caravac, F. & Roldan, A. (2003). Differential
response of a C13 and water use efficiency to arbuscular mycorrhizal
infection in two arid land woody plant species. Oecology, 135, 510-515.
Page 141
117
Rabie, G. H. & Almadini, AM. (2005). Role of bioinoculants in development of salt-
tolerance of Vicia faba plants under salinity stress. African Journal of
Biotechnology, 4, 210-222.
Rao, G.Y.S., Bagyaraj, D. S. & Rai, PV. (1983). Selection of efficient VA mycorrhizal
fungus for finger millet. Zbl. Mikrobiology, 138, 409-413.
Rasouli-Sadaghiani, M.H., Hassani, A. Mohsen Barin, M. Rezaee Danesh, Y &.
Sefidkon, F. (2010). Effects of arbuscular mycorrhizal (AM) fungi on
growth, essential oil production and nutrients uptake in basil. Journal of
Medicinal Plants Research, 4(21), 2222-2228.
Rathore, T.R., Warsi, M.Z.K., Lothrop, JE. & Singh, NN. (1996). Production of maize
under excess soil moisture (water-logging) conditions. pp. 56-63. In: 1st
Asian Regional Maize Workshop, 10-12 Feb 1996 P.A.U., Ludhiana.
Robinson-Boyer, L., Grzyb, I. & Jeffries, P. (2009). Shifting the balance from
qualitative to quantitative analysis of arbuscular mycorrhizal communities
in field soils. Fungal Ecology, 2, 1–9.
Ruiz-Lozano, J. M., Azcon, R. & Gomez, M. (1995). Effects of Arbuscular-
Mycorrhizal Glomus Species on Drought Tolerance: Physiological and
Nutritional Plant Responses. Applied and Environmental Microbiology,
61(2), 456–460.
Rydlová, J., Püschel, D. Sudová, R. Gryndler, M. Mikanová, O & Vosátka, M. (2011).
Interaction of arbuscular mycorrhizal fungi and rhizobia: Effects on flax
yield in spoil-bank clay. Journal of Plant Nutrition and Soil Science, 174,
128-134.
Sah, S., Reed, S. Jayachandran, K. Dunn, C. & Fisher, JB. (2006). The Effect of
Repeated Short-term Flooding on Mycorrhizal Survival in Snap Bean
Roots.Hortscience, 41(3), 598-602.
Page 142
118
Salisbury, F.B. & Ross, C.W. (1991). Plant Physiology (pp540) Belmont USA:
Wadsworth Publishing Company.
Samanhudi, A. Yunus, B. Pujiasmanto B. & Rahayu, M. (2014). Application of
Organic Manure and Mycorrhizal for Improving Plant Growth and Yield
of Temulawak (Curcuma xanthorrhiza Roxb.). Scientific Research Journal,
2(5), 11-16.
Sannazzaro, A.I, Alberto, E. Ruiz OA & Menendez, B. (2005). Influence of arbuscular
mycorrhiza fungi Glomus intraradices on the saline stress physiology of
Lotus glaberLotusnewsletter, 35, 29-30.
Santos-González, J.C., Finlay, R.D. & Tehler, A. (2007). Seasonal dynamics of
arbuscular mycorrhizal root colonization in a semi-natural grassland.
Applied and Environmental Microbiology, 73, 5613-5623.
Schachtman, D.P., Reid RJ. & Ayling, SM. (2008). Phosphorus uptake by plants: from
soil to cell. Plant Physiology, 116, 447–453
Schnepf, A., Leitner, D. Klepsch, S. Pellerin S. & Mollier, A. (2011). Modelling
phosphorus dynamics in the soil-plant system. In Bünemann EK, Obserson
A, Frossard E, eds, Phosphorus in Action: Biological Processes in Soil
Phosphorus Cycling. pp 113–133, Heidelberg: Springer.
Sharifi, M., Ghorbanli M. & Ebrahimzadeh, H. (2007). Improved growth of salinity-
stressed soybean after inoculation with salt pre-treated mycorrhizal fungi.
Journal of Plant Physiology, 164, 1144–1151.
Sharma, M. P. & Adholey, A. (2004). Effect of AM fungi and P fertilization on the
micro propagated strawberry grown in a sandy loam soil. Canadian
Journal of Botany, 82, 322-328.
Shenoy, V.V. & Kalagudi, GM. (2005). Enhancing plant phosphorus use efficiency for
sustainable cropping. Biotechnological Advances, 23, 501-513.
Page 143
119
Shiba, H. & Daimon, H. (2003). Histological observation of secondary aerenchyma
formed immediately after flooding in Sesbania cannabina and S. rostrata.
Plant and Soil, 253, 209-215.
Siddiqui, Z.A. & Pichtel, J. (2008). Mycorrhizae: an overview. In: Siddiqui ZA, Akhtar
MS, Futai K (eds.) Mycorrhizae: Sustainable Agriculture andForestry.
New Delhi: Springer.
Singh, S., Pandey, A. Kumar, B &. Palni, LMS. (2010). Enhancement in growth and
quality parameters of tea (Camellia sinensis (L.) O. Kuntze] through
inoculation with arbuscular mycorrhizal fungi in an acid soil. BioI. Fertil.
Soils, 46(5), 427-433.
Singh, S., Rekha, PD. Arun, AB. Huang, YM. Shen, TF & Young, CC. (2011).
Wastewater from monosodium glutamate industry as a low cost fertilizer
source for corn (Zea mays L.) Biomass Bioenergy, 35, 4001–4007.
Singh, M. & Singh, TA. (1981). Free proline accumulation in mai.ze subjected to
prolonged water-logging . Plant and Soil, 59(2), 349-351
Smith, S.E. & Read, DJ. (eds.) (2008). Mycorrhizal Symbiosis. New York: Elsevier.
Smith, S.E. & Smith, F.A. (2011). Roles of arbuscular mycorrhizas in plant nutrition
and growth: new paradigms from cellular to ecosystems scales. Annual
Reviewof Plant Biology, 63, 227–250.
Solaiman, M.Z. & Hirata, H. (1995). Effectiveness of arbuscular mycorrhizal
colonization at nursery-stage on growth and nutrition in wetland rice
(Oryza sativa L.) after transplanting under different soil fertility and water
regime. Soil Science and Plant Nutrition, 42(3), 561.57
Sombroek, W.G., Braun, I.M. & Van Der Pouw, B.J.Aa (1982). Exploratory Soil Map
and Agro-Climatic Zone Map of Kenya. Kenya Soil Survey, Nairobi:
Ministry of Agriculture.
Page 144
120
Song, F, Song, G. Dong, A & Kong, X. (2011). Regulatory mechanisms of host plant
defense responses to arbuscular mycorrhiza. Acta Ecologica Sinica 31,
322–327.
Sridevi, S. & Ramakrishnan, K. (2010). The effect of NPK fertilizer and AM fungi on
the growth and yield of cotton (Gossypium hirsutum L.) var. LRA 5166.
Recent Research in Science and Technology, 2(10), 39-41.
Stevens, K.J., Wall, CB &. Janssen, JA. (2011). Effects of arbuscular mycorrhizal fungi
on seedling growth and development of two wetland plants Bidens
frondosa L. and Eclipta prostrata L. grown under three levels of water
availability. Mycorrhiza, 21(4), 279–288
Stevens, K.J., Wellner, MR & Acevedo, MF. (2010). Dark septate endophyte and
arbuscular mycorrhizal status of vegetation colonizing a bottomland
hardwood forest after a 100 year flood. Aquatic Botany, 9(2), 105–111.
Su, P.H., Wu, TH. & Lin, C.H (1998). Root sugar level in flooded luffa and bitter melon
is not referential to flooding tolerance. Botanical Bulletin Academic. Sin.
39, 175-179.
Sukhada, M. (1992). Effect of VAM inoculation on plant growth, nutrient level and
root phosphatase activity in papaya (Carica papaya C. V. Coorg Honey
Dew). Fertilizer Research, 31, 263-267.
Sundar, S.K., Palavesam, A. & Parthipan, B. (2010). Effect of native dominant AM
fungus and PGPRs on growth and biochemical characteristics of
medicinally important Indigofera aspalathoides Vahl.ex. DC. International
Journal Biology and Biotechnology, 7, 59–67.
Suri, V.K & Choudhary, A.K. (2013). Effects of vesicular arbuscular mycorrhizae and
applied phosphorus through targeted yield precision model on root
morphology, productivity, and nutrient dynamics in soybean in an acid
alfisol. Comm Soil Science Plant Analysis, 17, 2587-2604.
Page 145
121
Świerczyńskia, S. & Stachowiak, A. (2010). The influence of Mycorrhizal Fungi on
the growth and yielding of plum and sour cherry trees. Journal of Fruit and
Ornamental Plant Research, 18(2), 71-77.
Tang, Z.C. & Kozlowski, TT. (1984). Physiological, morphological, and growth
responses of Platanus occidentalis seedlings to flooding. Plant Soil, 66,
243-255.
Tas, B. (2014). Effect of the Mycorrhiza Application on the Agronomical Properties of
Sweet Corn Varieties. Journal of Agriculture and Allied Sciences, 3(2),
41.47.
Tomanr, L.P., Bhuyan, S. Sabhapondit, S. Sarmah, R. Borthakur, BK. & Jha, DK.
(2012). Impact of inoculated arbuscular mycorrhizal (AM) fungi on
metabolism of flavanols (catechins) and caffeine in tea shoots (Camellia
sinensis) (L) O. Kuntze] Two and a Bud, 59(2), 106-111.
Topa, M.A. & Cheeseman, JM. (1992). Effects of root hypoxia and a low P supply on
relative growth, carbon dioxide exchange rates and carbon partitioning in
Pinus serotina seedlings. Physiologia Plantarum, 86, 136-144.
Treseder K.K. & Turner, KM. (2007). Glomalin in Ecosystems. American Society of
Soil Science, 71, 1257-1266.
Tsukahara, H. & Kozlowski, TT. (1985). Importance of adventitious roots to growth of
flooded Platanus occidentalis seedlings. Plant Soil, 88, 123--132.
USAID (2008). Impacts of the KBDS and KHDP projects in the tree fruit value chain
of Kenya. Micro-report No.129. Retrieved from:
http://pdf.usaid.gov/pdf_docs /PDACN958.pdf
Van der Waal, C. (2011). Large herbivores may alter vegetation structure of semi-arid
savannas through soil nutrient mediation. Oecologia, 165, 1095-1107.
Page 146
122
Van Rensburg, L., Krüger, G.H.L. & Krüger, H. (1993). Proline accumulation as
drought tolerance criterion: its relationship to membrane integrity and
chloroplast ultrastructure in Nicotiana tabacum L. Journal of Plant
Physiology, 141, 188–194
Vartapetian, B.B. (1991). Flood-sensitive plants under primary and secondary anoxia:
ultrastructural and metabolic responses. In: Plant Life under Oxygen
Deprivation, pp. 201.216 (Jackson, M.B., D.D. Davies and H. Lambers
Eds.),. Hague, Netherlands: SPB Acadmeic Publ.
Vaseghmanesh, T., Kordlaghari, KP. Neia, M. & Kelidari, A. (2014). The response of
yield components of sunflower to mycorrhiza inoculation and phosphorus
fertilizer Annals of Biological Research, 4(3), 101-104.
Veiga, R.S.L., Jansa, J. Frossard, E. & Van der Heijden, M.G.A. (2011). Can
Arbuscular Mycorrhizal Fungi Reduce the Growth of Agricultural Weeds?
PLoS ONE, 6(12), e27825.
Venekamp, J.H. (1989). Regulation of cytosol acidity in plants under conditions of
drought. Physiologia Plantarum, 76, 112–117.
Vu J.C.V. & Yelenosky, G. (2006). Photosynthetic responses of citrus trees to soil
flooding. Physiologia Plantarum, 81 7-14.
Wamocho, L.S. (1998). Studies on the use of vesicular arbuscular mycorrhizal fungi
for Fruit production in Kenya. Unpublished PhD thesis, Juja: Jomo
Kenyatta University of Agriculture and Technology.
Wample, R.L. & Davis, RW. (1983). Effect of flooding on starch accumulation in
chloroplasts of sunflower (Helianthus annuus L.). Plant Physiology, 73,
195-198.
Wang, Y., Huang, Y. Qiu, Q. Xin, G. Yang, Z. & Shi, S. (2011). Flooding greatly
affects the diversity of arbuscular mycorrhizal fungi communities in the
roots of wetland plants. PLoS ONE, 6(9), e24512.
Page 147
123
Webb, J.A. & Fletcher, RA. (1996). Paclobutrazol protects wheat seedlings from injury
due to waterlogging. Plant Growth Regulators, 18, 201.206.
Wegner, L.H. (2010). Oxygen transport in waterlogged plants. In S Mancuso & S
Shabala (eds). Waterlogging Signalling and Tolerance in Plants (pp. 3–
22)., Heidelberg: Springer–Verlag Berlin.
World Bank (2009). Making Development Climate Resilient: A World Bank strategy
for Sub-Saharan Africa, (Report number 46947) Washington, DC: WB.
Wu, Q.S. & Zou, YN. (2012). Evaluating Effectiveness of Four Inoculation Methods
with Arbuscular Mycorrhizal Fungi on Trifoliate Orange Seedlings.
International Journalof Agricultural Biology, 14, 266–270.
Yamamoto, F. & Kozlowski, T.T. (1987). Effects of flooding, tilting of stems, and
ethrel application on growth, stem anatomy, and ethylene production of
Acer platanoides seedlings Scandinavian Journal Forest Research, 2, 141-
-156.
Yang, W., Zheng, Y. Gao, C. He, X. Ding, Q. Kim, Y. Rui, Y. Wang, S. & Guo, L.
(2013). The arbuscular mycorrhizal fungal community response to
warming and grazing differs between soil and roots on the Qinghai- Tibetan
Plateau. PLOS ONE, 8, 1-11.
Yano-Melo, A.M., Saggin Jnr, OJ. Maia, LC. & Melo, NL. (1999). Effect of arbuscular
mycorrhiza fungi on the acclimatization of micropropagated banana
plantlets. Mycorrhiza, 9, 119-123.
Yaseen, T., Burni, T. & Hussain, F. (2012). Effect of Arbuscular Mycorrhizal
inoculation on nutrient uptake, growth and Productivity of chickpea (Cicer
arietinum) varieties. International Journal of Agronomy and Plant
Production 3(9), 334.345.
Younesi, O.& Moradi, A. (2014). Effects of plant growth-promoting rhizobacterium
(PGPR) and arbuscular mycorrhizal fungus (AMF) on antioxidant enzyme
Page 148
124
activities in salt-stressed bean (Phaseolus vulgaris L.) Agriculture
(Poľnohospodárstvo), 60, 1–21.
Yiu, JC, Liu, CW, Kuo, CT, Tseng, MJ, Lai, YS, & Lai, WJ. (2008).Changes in
antioxidant properties and their relationship to paclobutrazol-indued
flooding tolerane in Welsh Onion. Journalof Science Food Agriculture, 88,
1222–1230.
Yordanova, R.Y. & Popova, LP. (2001). Photosynthetic Response of Barley Plants to Soil
Flooding Photosynthetica, 39(4), 515-520.
Yuang B., Li, Z. Liu, H. Gao, H. & Zhang, Y. (2007). Microbial biomass and activity
in salt affected soils under arid conditionsApplied Soil Ecology, 35, 319–
328.
Zaidi, P.H., Maniselvan, P. Srivastava, A. Yadav, P. & Singh, RP. (2010). Genetic
analysis of water-logging tolerance In tropical maize (Zea mays l.) Maydica
55, 17-26.
Zhou, M.X., Hongbin, L. Neville, M. & Salter, S. (2004). Inheritance of water-logging
tolerance of barley (Hordeum vulgare L.). In Proceedingsof 4th
International. Crop Science Congress, 26 September – 1 October 2004,
Brisbane, Queensland.
Zhu, J. (2003). Regulation of ion homeostasis under salt stress. Current Opinion in
Plant Biology, 6, 441.445.
Zolfaghari, M., Nazeri, V. Sefidkon, F & Rejali, F. (2013). Effect of arbuscular
mycorrhizal fungi on plant growth and essential oil content and
composition of Ocimum basilicum L. Iranian Journal of Plant Physiology,
3(2), 643-650.
Page 149
125
Zuccarini, P (2007). Mycorrhizal infection ameliorates chlorophyll content and
nutrieuptake of lettuce exposed to saline irrigation. Plant Soil Environment,
53, 283–289.
Page 150
126
APPENDICES
Appendix I: ANOVA table for effect of arbuscular mycorrhizal fungi and salt
stress on the plant height (cm) of Passion fruit seedlings
Source of variation d.f. s.s. m.s. v.r. F pr.
TREATMEN
T
5 4337.1 867.42 35.08 <.001
Contrast 1 Mycorrhizal, 0 dS/m EC VS
Non-mycorrhizal, 0 dS/m EC
1 147.92 147.92 5.98 0.025*
Contrast 2 Mycorrhizal, 0 dS/m EC VS
Mycorrhizal, 4.9 dS/m EC
1 250.88 250.88 10.15 0.005**
Contrast 3 Mycorrhizal, 0 dS/m EC VS
Mycorrhizal, 9 dS/m EC
1 2520.5 2520.5 101.93 <.001***
Contrast 4 Mycorrhizal, 4.9 dS/m EC VS
Mycorrhizal, 9 dS/m EC
1 1180.98 1181 47.76 <.001***
Contrast 5 Mycorrhizal, 4.9 dS/m EC VS
Non-mycorrhizal, 0 dS/m EC
1 13.52 13.52 0.55 0.469NS
Contrast 6 Mycorrhizal, 4.9 dS/m EC VS
Non-mycorrhizal, 4.9 dS/m EC
1 364.5 364.5 14.74 0.001***
Contrast 7 Mycorrhizal, 4.9 dS/m EC VS
Non-mycorrhizal, 9 dS/m EC
1 1113.9 1113.9 45.05 <.001***
Contrast 8 Mycorrhizal, 9 dS/m EC VS
Non-mycorrhizal, 0 dS/m EC
1 1447.2 1447.2 58.53 <.001***
Contrast 9 Mycorrhizal, 9 dS/m EC VS
Non-mycorrhizal, 4.9 dS/m EC
1 233.28 233.28 9.43 0.007**
Contrast 10 Mycorrhizal, 9 dS/m EC VS
Non-mycorrhizal, 9 dS/m EC
1 0.98 0.98 0.04 0.844NS
Contrast 11 Non-Mycorrhizal, 0 dS/m EC VS
Non-mycorrhizal, 4.9 dS/m EC
1 518.42 518.42 20.97 <.001***
Contrast 12 Non-Mycorrhizal, 0 dS/m EC VS
Non-mycorrhizal, 9 dS/m EC
1 1372.9 1372.9 55.52 <.001***
Contrast 13 Non-Mycorrhizal, 4.9 dS/m EC
VS Non-mycorrhizal, 9 dS/m EC
1 204.02 204.02 8.25 0.01**
Residual
18 445.1 24.73
Total
23 4782.2
Page 151
127
Appendix II: ANOVA table for effect of arbuscular mycorrhizal fungi and salt
stress on the leaf number of passion fruit seedlings
Source of variation d.f. s.s. m.s. v.r. F pr.
TREATME
NT 5 386.27 77.255 33.41 <.001
Contrast 1
Mycorrhizal, 0 dS/m EC VS Non-
mycorrhizal, 0 dS/m EC 1 0.5 0.5 0.22 0.647NS
Contrast 2
Mycorrhizal, 0 dS/m EC VS
Mycorrhizal, 4.9 dS/m EC 1 6.48 6.48 2.8 0.111NS
Contrast 3
Mycorrhizal, 0 dS/m EC VS
Mycorrhizal, 9 dS/m EC 1 32 32 13.84 0.002**
Contrast 4
Mycorrhizal, 4.9 dS/m EC VS
Mycorrhizal, 9 dS/m EC 1 9.68 9.68 4.19 0.056NS
Contrast 5
Mycorrhizal, 4.9 dS/m EC VS Non-
mycorrhizal, 0 dS/m EC 1 3.38 3.38 1.46 0.242NS
Contrast 6
Mycorrhizal, 4.9 dS/m EC VS Non-
mycorrhizal, 4.9 dS/m EC 1 5.12 5.12 2.21 0.154NS
Contrast 7
Mycorrhizal, 4.9 dS/m EC VS Non-
mycorrhizal, 9 dS/m EC 1 208.08 208.08 89.99 <.001***
Contrast 8
Mycorrhizal, 9 dS/m EC VS Non-
mycorrhizal, 0 dS/m EC 1 24.5 24.5 10.6 0.004**
Contrast 9
Mycorrhizal, 9 dS/m EC VS Non-
mycorrhizal, 4.9 dS/m EC 1 0.72 0.72 0.31 0.584NS
Contrast
10
Mycorrhizal, 9 dS/m EC VS Non-
mycorrhizal, 9 dS/m EC 1 128 128 55.36 <.001***
Contrast
11
Non-Mycorrhizal, 0 dS/m EC VS
Non-mycorrhizal, 4.9 dS/m EC 1 16.82 16.82 7.27 0.015**
Contrast
12
Non-Mycorrhizal, 0 dS/m EC VS
Non-mycorrhizal, 9 dS/m EC 1 264.5 264.5 114.39 <.001***
Contrast
13
Non-Mycorrhizal, 4.9 dS/m EC VS
Non-mycorrhizal, 9 dS/m EC 1 147.92 147.92 63.97 <.001***
Residual 18 41.62 2.312
Total 23 427.89
Page 152
128
Appendix III: ANOVA table for effect of arbuscular mycorrhizal fungi and salt
stress on the leaf area (cm2) of passion fruit seedlings
Source of variation
d.f
. s.s. m.s. v.r. F pr.
TREATMEN
T 5 830435 166087 135.3 <.001
Contrast 1
Mycorrhizal, 0 dS/m EC VS
Mycorrhizal, 4.9 dS/m EC 1 63155 63155 51.45 <.001***
Contrast 2
Mycorrhizal, 0 dS/m EC VS
Mycorrhizal, 9 dS/m EC 1 330224 330224 269 <.001***
Contrast 3
Mycorrhizal, 4.9 dS/m EC VS
Mycorrhizal, 9 dS/m EC 1 104552 104552 85.17 <.001***
Contrast 4
Mycorrhizal, 0 dS/m EC VS Non-
mycorrhizal, 0 dS/m EC 1 23039 23039 18.77 <.001***
Contrast 5
Mycorrhizal, 0 dS/m EC VS Non-
mycorrhizal, 4.9 dS/m EC 1 203407 203407 165.7 <.001***
Contrast 6
Mycorrhizal, 0 dS/m EC VS Non-
mycorrhizal, 9 dS/m EC 1 608569 608569
495.7
4 <.001***
Contrast 7
Mycorrhizal, 4.9 dS/m EC VS Non-
mycorrhizal, 0 dS/m EC 1 9904 9904 8.07 0.011*
Contrast 8
Mycorrhizal, 4.9 dS/m EC VS Non-
mycorrhizal, 4.9 dS/m EC 1 39881 39881 32.49 <.001***
Contrast 9
Mycorrhizal, 4.9 dS/m EC VS Non-
mycorrhizal, 9 dS/m EC 1 279632 279632
227.7
9 <.001***
Contrast 10
Mycorrhizal, 9 dS/m EC VS Non-
mycorrhizal, 0 dS/m EC 1 178814 178814
145.6
6 <.001***
Contrast 11
Mycorrhizal, 9 dS/m EC VS Non-
mycorrhizal, 4.9 dS/m EC 1 15288 15288 12.45 0.002**
Contrast 12
Mycorrhizal, 9 dS/m EC VS Non-
mycorrhizal, 9 dS/m EC 1 42213 42213 34.39 <.001***
Contrast 13
Non-Mycorrhizal, 0 dS/m EC VS Non-
mycorrhizal, 4.9 dS/m EC 1 89532 89532 72.93 <.001***
Contrast 14
Non-Mycorrhizal, 0 dS/m EC VS Non-
mycorrhizal, 9 dS/m EC 1 394787 394787
321.5
9 <.001***
Contrast 15
Non-Mycorrhizal, 4.9 dS/m EC VS Non-
mycorrhizal, 9 dS/m EC 1 108308 108308 88.23 <.001***
Residual 18 22097 1228
Total 23 852532
Page 153
129
Appendix IV: ANOVA table for effect of arbuscular mycorrhizal fungi and salt
stress on the chlorophyll content of passion fruit seedlings
Source of variation
d.f
. s.s. m.s. v.r. F pr.
TREATMENTS 5 2810.4 562.07 46.34 <.001
Contrast
1
Mycorrhizal, 0 dS/m EC VS Non-
mycorrhizal, 0 dS/m EC 1 8 8 0.66 0.427NS
Contrast
2
Mycorrhizal, 0 dS/m EC VS Mycorrhizal,
4.9 dS/m EC 1 124.82 124.82 10.29 0.005**
Contrast
3
Mycorrhizal, 0 dS/m EC VS Mycorrhizal,
9 dS/m EC 1 1383.4 1383.4 114.05 <.001***
Contrast
4
Mycorrhizal, 4.9 dS/m EC VS
Mycorrhizal, 9 dS/m EC 1 677.12 677.12 55.82 <.001***
Contrast
5
Mycorrhizal, 4.9 dS/m EC VS Non-
mycorrhizal, 0 dS/m EC 1 196.02 196.02 16.16 <.001***
Contrast
6
Mycorrhizal, 4.9 dS/m EC VS Non-
mycorrhizal, 4.9 dS/m EC 1 28.88 28.88 2.38 0.14NS
Contrast
7
Mycorrhizal, 4.9 dS/m EC VS Non-
mycorrhizal, 9 dS/m EC 1 518.42 518.42 42.74 <.001***
Contrast
8
Mycorrhizal, 9 dS/m EC VS Non-
mycorrhizal, 0 dS/m EC 1 1601.8 1601.8 132.05 <.001***
Contrast
9
Mycorrhizal, 9 dS/m EC VS Non-
mycorrhizal, 4.9 dS/m EC 1 426.32 426.32 35.15 <.001***
Contrast
10
Mycorrhizal, 9 dS/m EC VS Non-
mycorrhizal, 9 dS/m EC 1 10.58 10.58 0.87 0.363NS
Contrast
11
Non-Mycorrhizal, 0 dS/m EC VS Non-
mycorrhizal, 4.9 dS/m EC 1 375.38 375.38 30.95 <.001***
Contrast
12
Non-Mycorrhizal, 0 dS/m EC VS Non-
mycorrhizal, 9 dS/m EC 1 1352 1352 111.46 <.001***
Contrast
13
Non-Mycorrhizal, 4.9 dS/m EC VS Non-
mycorrhizal, 9 dS/m EC 1 302.58 302.58 24.94 <.001***
Residual 18 218.34 12.13
Total 23 3028.7
Page 154
130
Source of variation d.f. s.s. m.s. v.r. F pr.
TREATMENT 7 1451.04 207.29 15.08 <.001
Contrast 1
With Endosperm, mycorrhizal, 0 dS/M EC Vs With
Endosperm, Mycorrhizal, 4.9 dS/M EC 1 322.58 322.58 23.46 <.001***
Contrast 2
With Endosperm, mycorrhizal, 0 dS/M EC Vs With
Endosperm, non- Mycorrhizal, 0 dS/M EC 1 176.72 176.72 12.85 0.001***
Contrast 3 With Endosperm, mycorrhizal, 0 dS/M EC Vs With Endosperm, non- Mycorrhizal, 4.9 dS/M EC 1 524.88 524.88 38.17 <.001***
Contrast 4
With Endosperm, mycorrhizal, 0 dS/M EC Vs Without
Endosperm, Mycorrhizal, 0 dS/M EC 1 7.22 7.22 0.53 0.476NS
Contrast 5
With Endosperm, mycorrhizal, 0 dS/M EC Vs Without
Endosperm, Mycorrhizal, 4.9 dS/M EC 1 486.72 486.72 35.4 <.001***
Contrast 6
With Endosperm, mycorrhizal, 0 dS/M EC Vs Without
Endosperm, non- Mycorrhizal, 0 dS/M EC 1 531.38 531.38 38.65 <.001***
Contrast 7
With Endosperm, mycorrhizal, 0 dS/M EC Vs Without
Endosperm, non- Mycorrhizal, 4.9 dS/M EC 1 792.02 792.02 57.6 <.001***
Contrast 8 With Endosperm, mycorrhizal, 4.9 dS/M EC Vs With Endosperm, non- Mycorrhizal, 0 dS/M EC 1 21.78 21.78 1.58 0.22NS
Contrast 9
With Endosperm, mycorrhizal, 4.9 dS/M EC Vs With
Endosperm, non- Mycorrhizal, 4.9 dS/M EC 1 59.95 59.95 4.73 0.04*
Contrast 10
With Endosperm, mycorrhizal, 4.9 dS/M EC Vs Without
Endosperm, Mycorrhizal, 0 dS/M EC 1 233.28 233.28 16.97 <.001***
Contrast 11
With Endosperm, non-mycorrhizal, 4.9 dS/M EC Vs
Without Endosperm, Mycorrhizal, 4.9 dS/M EC 1 16.82 16.82 1.22 0.28NS
Contrast 12
With Endosperm, mycorrhizal, 4.9 dS/M EC Vs Without
Endosperm, non-Mycorrhizal, 0 dS/M EC 1 25.92 25.92 1.89 0.182NS
Contrast 13 With Endosperm, mycorrhizal, 4.9 dS/M EC Vs Without Endosperm, non-Mycorrhizal, 4.9 dS/M EC 1 103.68 103.68 7.54 0.011**
Contrast 14
With Endosperm, non-mycorrhizal, 0 dS/M EC Vs With
Endosperm, non- Mycorrhizal, 4.9 dS/M EC 1 92.48 92.48 6.73 0.016*
Contrast 15
With Endosperm, non-mycorrhizal, 0 dS/M EC Vs
Without Endosperm, Mycorrhizal, 0 dS/M EC 1 112.5 112.5 8.18 0.009**
Contrast 16
With Endosperm, non-mycorrhizal, 0 dS/M EC Vs
Without Endosperm, Mycorrhizal, 4.9 dS/M EC 1 76.88 76.88 5.59 0.026**
Contrast 17
With Endosperm, non-mycorrhizal, 0 dS/M EC Vs
Without Endosperm, non- Mycorrhizal, 0 dS/M EC 1 95.22 95.22 6.93 0.015**
Contrast 18
With Endosperm, non-mycorrhizal, 0 dS/M EC Vs
Without Endosperm, non- Mycorrhizal, 4.9 dS/M EC 1 220.5 220.5 16.04 <.001***
Contrast 19
With Endosperm, non-mycorrhizal, 4.9 dS/M EC Vs
Without Endosperm, Mycorrhizal, 0 dS/M EC 1 408.98 408.98 29.74 <.001***
Contrast 20 With Endosperm, non-mycorrhizal, 4.9 dS/M EC Vs Without Endosperm, Mycorrhizal, 4.9 dS/M EC 1 0.72 0.72 0.05 0.821NS
Contrast 21
With Endosperm, non-mycorrhizal, 4.9 dS/M EC Vs
Without Endosperm, non Mycorrhizal, 0 dS/M EC 1 0.02 0.02 0 0.97NS
Contrast 22
With Endosperm, non-mycorrhizal, 4.9 dS/M EC Vs
Without Endosperm, non Mycorrhizal, 4.9 dS/M EC 1 27.38 27.38 1.99 0.171NS
Contrast 23
Without Endosperm, mycorrhizal, 0 dS/M EC Vs
Without Endosperm, Mycorrhizal, 4.9 dS/M EC 1 375.38 375.38 27.3 <.001***
Contrast 24
Without Endosperm, mycorrhizal, 0 dS/M EC Vs With
Endosperm, non-Mycorrhizal, 0 dS/M EC 1 414.72 414.72 30.16 <.001***
Contrast 25 Without Endosperm, mycorrhizal, 0 dS/M EC Vs With Endosperm, non-Mycorrhizal, 4.9 dS/M EC 1 648 648 47.13 <.001***
Contrast 26
Without Endosperm, mycorrhizal, 4.9 dS/M EC Vs
Without Endosperm, non- Mycorrhizal, 0 dS/M EC 1 0.98 0.98 0.07 0.792NS
Contrast 27
Without Endosperm, mycorrhizal, 4.9 dS/M EC Vs
Without Endosperm, non- Mycorrhizal, 4.9 dS/M EC 1 36.98 36.98 2.69 0.114NS
Contrast 28
Without Endosperm, non mycorrhizal, 0 dS/M EC Vs
Without Endosperm, non- Mycorrhizal, 4.9 dS/M EC 1 25.92 25.92 1.89 0.182NS
Residual 24 330 13.75
Total 31 1781.04
Page 155
131
Appendix V: ANOVA table for effect of Arbuscular Mycorrhizal Fungi,
Endosperm attachment and salt stress on the Plant height of Mango seedlings
Appendix VI: ANOVA table for effect of arbuscular mycorrhizal fungi,
endosperm attachment and salt stress on the leaf number of mango seedlings
Source of variation d.f. s.s. m.s. v.r. F pr.
TREATMENT 7 265.355 37.908 20.72 <.001
Contrast 1
With Endosperm, mycorrhizal, 0 dS/M EC
Vs With Endosperm, Mycorrhizal, 4.9 dS/M
EC 1 44.18 44.18 24.15 <.001***
Contrast 2
With Endosperm, mycorrhizal, 0 dS/M EC
Vs With Endosperm, non- Mycorrhizal, 0
dS/M EC 1 16.82 16.82 9.2 0.006***
Contrast 3
With Endosperm, mycorrhizal, 0 dS/M EC
Vs With Endosperm, non- Mycorrhizal, 4.9
dS/M EC 1 141.12 141.12 77.15 <.001***
Contrast 4
With Endosperm, mycorrhizal, 0 dS/M EC
Vs Without Endosperm, Mycorrhizal, 0
dS/M EC 1 7.22 7.22 3.95 0.058NS
Contrast 5
With Endosperm, mycorrhizal, 0 dS/M EC
Vs Without Endosperm, Mycorrhizal, 4.9
dS/M EC 1 64.98 64.98 35.52 <.001***
Contrast 6
With Endosperm, mycorrhizal, 0 dS/M EC
Vs Without Endosperm, non- Mycorrhizal,
0 dS/M EC 1 44.18 44.18 24.15 <.001***
Contrast 7
With Endosperm, mycorrhizal, 0 dS/M EC
Vs Without Endosperm, non- Mycorrhizal,
4.9 dS/M EC 1 51.84 51.84 28.34 <.001***
Contrast 8
With Endosperm, mycorrhizal, 4.9 dS/M
EC Vs With Endosperm, non- Mycorrhizal,
0 dS/M EC 1 6.48 6.48 3.54 0.072NS
Contrast 9
With Endosperm, mycorrhizal, 4.9 dS/M
EC Vs With Endosperm, non- Mycorrhizal,
4.9 dS/M EC 1 15.68 15.68 8.57 0.007***
Contrast 10
With Endosperm, mycorrhizal, 4.9 dS/M
EC Vs Without Endosperm, Mycorrhizal, 0
dS/M EC 1 2 2 1.09 0.306NS
Contrast 11
With Endosperm, mycorrhizal, 4.9 dS/M
EC Vs Without Endosperm, non-
Mycorrhizal, 0 dS/M EC 1 0 0 0 1NS
Contrast 12
With Endosperm, non-mycorrhizal, 4.9
dS/M EC Vs Without Endosperm,
Mycorrhizal, 4.9 dS/M EC 1 36.98 36.98 20.22 <.001***
Contrast 13
With Endosperm, mycorrhizal, 4.9 dS/M
EC Vs Without Endosperm, non-
Mycorrhizal, 4.9 dS/M EC 1 60.5 60.5 33.08 <.001***
Contrast 14
With Endosperm, non-mycorrhizal, 0 dS/M
EC Vs With Endosperm, non- Mycorrhizal,
4.9 dS/M EC 1 2 2 1.09 0.306NS
Contrast 15
With Endosperm, non-mycorrhizal, 0 dS/M
EC Vs Without Endosperm, Mycorrhizal, 0
dS/M EC 1 15.68 15.68 8.57 0.007***
Page 156
132
Contrast 16
With Endosperm, non-mycorrhizal, 0 dS/M
EC Vs Without Endosperm, Mycorrhizal,
4.9 dS/M EC 1 6.48 6.48 3.54 0.072NS
Contrast 17
With Endosperm, non-mycorrhizal, 0 dS/M
EC Vs Without Endosperm, non-
Mycorrhizal, 0 dS/M EC 1 74.42 74.42 40.69 <.001***
Contrast 18
With Endosperm, non-mycorrhizal, 0 dS/M
EC Vs Without Endosperm, non-
Mycorrhizal, 4.9 dS/M EC 1 84.5 84.5 46.2 <.001***
Contrast 19
With Endosperm, non-mycorrhizal, 4.9
dS/M EC Vs Without Endosperm,
Mycorrhizal, 0 dS/M EC 1 14.58 14.58 7.97 0.009***
Contrast 20
With Endosperm, non-mycorrhizal, 4.9
dS/M EC Vs Without Endosperm,
Mycorrhizal, 4.9 dS/M EC 1 27.38 27.38 14.97 <.001***
Contrast 21
With Endosperm, non-mycorrhizal, 4.9
dS/M EC Vs Without Endosperm, non
Mycorrhizal, 0 dS/M EC 1 0.72 0.72 0.39 0.536NS
Contrast 22
With Endosperm, non-mycorrhizal, 4.9
dS/M EC Vs Without Endosperm, non
Mycorrhizal, 4.9 dS/M EC 1 28.88 28.88 15.79 <.001***
Contrast 23
Without Endosperm, mycorrhizal, 0 dS/M
EC Vs Without Endosperm, Mycorrhizal,
4.9 dS/M EC 1 15.68 15.68 8.57 0.007***
Contrast 24
Without Endosperm, mycorrhizal, 0 dS/M
EC Vs With Endosperm, non-Mycorrhizal,
0 dS/M EC 1 100.82 100.82 55.12 <.001***
Contrast 25
Without Endosperm, mycorrhizal, 0 dS/M
EC Vs With Endosperm, non-Mycorrhizal,
4.9 dS/M EC 1 2 2 1.09 0.306NS
Contrast 26
Without Endosperm, mycorrhizal, 4.9 dS/M
EC Vs Without Endosperm, non-
Mycorrhizal, 0 dS/M EC 1 21.78 21.78 11.91 0.002***
Contrast 27
Without Endosperm, mycorrhizal, 4.9 dS/M
EC Vs Without Endosperm, non-
Mycorrhizal, 4.9 dS/M EC 1 36.98 36.98 20.22 <.001***
Contrast 28
Without Endosperm, mycorrhizal, 0 dS/M
EC Vs Without Endosperm, Non-
Mycorrhizal, 0 dS/M EC 1 15.68 15.68 8.57 0.007**
Contrast 29
Without Endosperm, mycorrhizal, 0 dS/M
EC Vs Without Endosperm, non-
Mycorrhizal, 4.9 dS/M EC 1 100.82 100.82 55.12 <.001***
Contrast 30
With Endosperm, mycorrhizal, 4.9 dS/M
EC Vs Without Endosperm, Mycorrhizal,
4.9 dS/M EC 1 2 2 1.09 0.306NS
Contrast 31
With Endosperm, non- mycorrhizal 0 dS/M
EC VS with Endosperm Mycorrhizal 4.9
dS/M EC 1 6.48 6.48 3.54 0.072NS
Contrast 32
Without Endosperm, non- mycorrhizal 0
dS/M EC VS without Endosperm
Mycorrhizal 4.9 dS/M EC 1 2 2 1.09 0.306NS
Total 31 309.255
Page 157
133
Appendix VII: ANOVA table for effect of arbuscular mycorrhizal fungi,
endosperm attachment and salt stress on the leaf area (cm2) of mango seedlings
Source of variation d.f. s.s. m.s. v.r. F pr.
TREATMENT 7 370906 52987 43.18 <.001
Contrast 1
With Endosperm, mycorrhizal, 0 dS/M
EC Vs With Endosperm, Mycorrhizal,
4.9 dS/M EC 1 50010 50010 40.76 <.001***
Contrast 2
With Endosperm, mycorrhizal, 0 dS/M
EC Vs With Endosperm, non-
Mycorrhizal, 0 dS/M EC 1 16247 16247 13.24 0.001***
Contrast 3
With Endosperm, mycorrhizal, 0 dS/M
EC Vs With Endosperm, non-
Mycorrhizal, 4.9 dS/M EC 1 129032 129032 105.16 <.001***
Contrast 4
With Endosperm, mycorrhizal, 0 dS/M
EC Vs Without Endosperm,
Mycorrhizal, 0 dS/M EC 1 309 309 0.25 0.62NS
Contrast 5
With Endosperm, mycorrhizal, 0 dS/M
EC Vs Without Endosperm,
Mycorrhizal, 4.9 dS/M EC 1 54127 54127 44.11 <.001***
Contrast 6
With Endosperm, mycorrhizal, 0 dS/M
EC Vs Without Endosperm, non-
Mycorrhizal, 0 dS/M EC 1 79896 79896 65.11 <.001***
Contrast 7
With Endosperm, mycorrhizal, 0 dS/M
EC Vs Without Endosperm, non-
Mycorrhizal, 4.9 dS/M EC 1 196853 196853 160.43 <.001***
Contrast 8
With Endosperm, mycorrhizal, 4.9 dS/M
EC Vs With Endosperm, non-
Mycorrhizal, 0 dS/M EC 1 5424 5424 4.74 0.04*
Contrast 9
With Endosperm, mycorrhizal, 4.9 dS/M
EC Vs With Endosperm, non-
Mycorrhizal, 4.9 dS/M EC 1 18382 18382 14.98 <.001***
Contrast
10
With Endosperm, mycorrhizal, 4.9 dS/M
EC Vs Without Endosperm,
Mycorrhizal, 0 dS/M EC 1 58181 58181 47.42 <.001***
Contrast
11
With Endosperm, non-mycorrhizal, 4.9
dS/M EC Vs Without Endosperm,
Mycorrhizal, 4.9 dS/M EC 1 81 81 0.07 0.799NS
Contrast
12
With Endosperm, mycorrhizal, 4.9 dS/M
EC Vs Without Endosperm, non-
Mycorrhizal, 0 dS/M EC 1 3484 3484 2.84 0.105NS
Contrast
13
With Endosperm, mycorrhizal, 4.9 dS/M
EC Vs Without Endosperm, non-
Mycorrhizal, 4.9 dS/M EC 1 48423 48423 39.46 <.001***
Contrast
14
With Endosperm, non-mycorrhizal, 0
dS/M EC Vs With Endosperm, non-
Mycorrhizal, 4.9 dS/M EC 1 5424 5424 4.74 0.04*
Contrast
15
With Endosperm, non-mycorrhizal, 0
dS/M EC Vs Without Endosperm,
Mycorrhizal, 0 dS/M EC 1 21037 21037 17.14 <.001***
Contrast
16
With Endosperm, non-mycorrhizal, 0
dS/M EC Vs Without Endosperm,
Mycorrhizal, 4.9 dS/M EC 1 11065 11065 9.02 0.006***
Page 158
134
Contrast
17
With Endosperm, non-mycorrhizal, 0
dS/M EC Vs Without Endosperm, non-
Mycorrhizal, 0 dS/M EC 1 24086 24086 19.63 <.001***
Contrast
18
With Endosperm, non-mycorrhizal, 0
dS/M EC Vs Without Endosperm, non-
Mycorrhizal, 4.9 dS/M EC 1 99994 99994 81.49 <.001***
Contrast
19
With Endosperm, non-mycorrhizal, 4.9
dS/M EC Vs Without Endosperm,
Mycorrhizal, 0 dS/M EC 1 141970 141970 115.7 <.001***
Contrast
20
With Endosperm, non-mycorrhizal, 4.9
dS/M EC Vs Without Endosperm,
Mycorrhizal, 4.9 dS/M EC 1 16017 16017 13.05 0.001***
Contrast
21
With Endosperm, non-mycorrhizal, 4.9
dS/M EC Vs Without Endosperm, non
Mycorrhizal, 0 dS/M EC 1 5860 5860 4.78 0.039***
Contrast
22
With Endosperm, non-mycorrhizal, 4.9
dS/M EC Vs Without Endosperm, non
Mycorrhizal, 4.9 dS/M EC 1 7135 7135 5.82 0.024***
Contrast
23
Without Endosperm, mycorrhizal, 0
dS/M EC Vs Without Endosperm,
Mycorrhizal, 4.9 dS/M EC 1 62616 62616 51.03 <.001***
Contrast
24
Without Endosperm, mycorrhizal, 0
dS/M EC Vs With Endosperm, non-
Mycorrhizal, 0 dS/M EC 1 90143 90143 73.46 <.001***
Contrast
25
Without Endosperm, mycorrhizal, 0
dS/M EC Vs With Endosperm, non-
Mycorrhizal, 4.9 dS/M EC 1 212761 212761 173.39 <.001***
Contrast
26
Without Endosperm, mycorrhizal, 4.9
dS/M EC Vs Without Endosperm, non-
Mycorrhizal, 0 dS/M EC 1 2501 2501 2.04 0.166NS
Contrast
27
Without Endosperm, mycorrhizal, 4.9
dS/M EC Vs Without Endosperm, non-
Mycorrhizal, 4.9 dS/M EC 1 44533 44533 36.29 <.001***
Contrast
28
Without Endosperm, non mycorrhizal, 0
dS/M EC Vs Without Endosperm, non-
Mycorrhizal, 4.9 dS/M EC 1 25928 25928 21.13 <.001***
Contrast 29
Without Endosperm, mycorrhizal, 0
dS/M EC Vs Without Endosperm, non-
Mycorrhizal, 0 dS/M EC 1 90143 90143 73.46 <.001***
Contrast 30
Without Endosperm, mycorrhizal, 0
dS/M EC Vs Without Endosperm, non-
Mycorrhizal, 4.9 dS/M EC 1 212761 212761 173.39 <.001***
Contrast 31
With Endosperm, mycorrhizal, 4.9 dS/M
EC Vs Without Endosperm,
Mycorrhizal, 4.9 dS/M EC 1 81 81 0.07 0.799NS
Residual 24 29449 1227
Total 31 400355
Page 159
135
Appendix VIII: Anova table for effect of arbuscular mycorrhizal fungi,
endosperm attachment and salt stress on the chlorophyll % of mango seedlings
Source of variation d.f. s.s. m.s. v.r. F pr.
TREATMENT 7 3582.94 511.85 22.88 <.001
Contrast 1
With Endosperm, mycorrhizal, 0 dS/M EC
Vs With Endosperm, Mycorrhizal, 4.9
dS/M EC 1 1021.52 1021.52 45.67 <.001***
Contrast 2
With Endosperm, mycorrhizal, 0 dS/M EC
Vs With Endosperm, non- Mycorrhizal, 0
dS/M EC 1 141.12 141.12 6.31 0.019***
Contrast 3
With Endosperm, mycorrhizal, 0 dS/M EC
Vs With Endosperm, non- Mycorrhizal, 4.9
dS/M EC 1 1260.02 1260.02 56.33 <.001***
Contrast 4
With Endosperm, mycorrhizal, 0 dS/M EC
Vs Without Endosperm, Mycorrhizal, 0
dS/M EC 1 9.68 9.68 0.43 0.517NS
Contrast 5
With Endosperm, mycorrhizal, 0 dS/M EC
Vs Without Endosperm, Mycorrhizal, 4.9
dS/M EC 1 882 882 39.43 <.001***
Contrast 6
With Endosperm, mycorrhizal, 0 dS/M EC
Vs Without Endosperm, non- Mycorrhizal,
0 dS/M EC 1 312.5 312.5 13.97 0.001***
Contrast 7
With Endosperm, mycorrhizal, 0 dS/M EC
Vs Without Endosperm, non- Mycorrhizal,
4.9 dS/M EC 1 1946.88 1946.88 87.04 <.001***
Contrast 8
With Endosperm, mycorrhizal, 4.9 dS/M
EC Vs With Endosperm, non- Mycorrhizal,
0 dS/M EC 1 403.28 403.28 18.03 <.001***
Contrast 9
With Endosperm, mycorrhizal, 4.9 dS/M
EC Vs With Endosperm, non- Mycorrhizal,
4.9 dS/M EC 1 12.5 12.5 0.56 0.462NS
Contrast
10
With Endosperm, mycorrhizal, 4.9 dS/M
EC Vs Without Endosperm, Mycorrhizal, 0
dS/M EC 1 832.32 832.32 37.21 <.001***
Contrast
11
With Endosperm, non-mycorrhizal, 4.9
dS/M EC Vs Without Endosperm,
Mycorrhizal, 4.9 dS/M EC 1 5.12 5.12 0.23 0.637NS
Contrast
12
With Endosperm, mycorrhizal, 4.9 dS/M
EC Vs Without Endosperm, non-
Mycorrhizal, 0 dS/M EC 1 204.02 204.02 9.12 0.006***
Contrast
13
With Endosperm, mycorrhizal, 4.9 dS/M
EC Vs Without Endosperm, non-
Mycorrhizal, 4.9 dS/M EC 1 147.92 147.92 6.61 0.017***
Contrast
14
With Endosperm, non-mycorrhizal, 0
dS/M EC Vs With Endosperm, non-
Mycorrhizal, 4.9 dS/M EC 1 557.78 557.78 24.94 <.001***
Contrast
15
With Endosperm, non-mycorrhizal, 0
dS/M EC Vs Without Endosperm,
Mycorrhizal, 0 dS/M EC 1 76.88 76.88 3.44 0.076NS
Contrast
16
With Endosperm, non-mycorrhizal, 0
dS/M EC Vs Without Endosperm,
Mycorrhizal, 4.9 dS/M EC 1 317.52 317.52 14.2 <.001***
Page 160
136
Contrast
17
With Endosperm, non-mycorrhizal, 0
dS/M EC Vs Without Endosperm, non-
Mycorrhizal, 0 dS/M EC 1 33.62 33.62 1.5 0.232NS
Contrast
18
With Endosperm, non-mycorrhizal, 0
dS/M EC Vs Without Endosperm, non-
Mycorrhizal, 4.9 dS/M EC 1 1039.68 1039.68 46.48 <.001***
Contrast
19
With Endosperm, non-mycorrhizal, 4.9
dS/M EC Vs Without Endosperm,
Mycorrhizal, 0 dS/M EC 1 1048.82 1048.82 46.89 <.001***
Contrast
20
With Endosperm, non-mycorrhizal, 4.9
dS/M EC Vs Without Endosperm,
Mycorrhizal, 4.9 dS/M EC 1 33.62 33.62 1.5 0.232NS
Contrast
21
With Endosperm, non-mycorrhizal, 4.9
dS/M EC Vs Without Endosperm, non
Mycorrhizal, 0 dS/M EC 1 317.52 317.52 14.2 <.001***
Contrast
22
With Endosperm, non-mycorrhizal, 4.9
dS/M EC Vs Without Endosperm, non
Mycorrhizal, 4.9 dS/M EC 1 74.42 74.42 3.33 0.081NS
Contrast
23
Without Endosperm, mycorrhizal, 0 dS/M
EC Vs Without Endosperm, Mycorrhizal,
4.9 dS/M EC 1 706.88 706.88 31.6 <.001***
Contrast
24
Without Endosperm, mycorrhizal, 0 dS/M
EC Vs With Endosperm, non-Mycorrhizal,
0 dS/M EC 1 212.18 212.18 9.49 0.005***
Contrast
25
Without Endosperm, mycorrhizal, 0 dS/M
EC Vs With Endosperm, non-Mycorrhizal,
4.9 dS/M EC 1 1682 1682 75.2 <.001***
Contrast
26
Without Endosperm, mycorrhizal, 4.9
dS/M EC Vs Without Endosperm, non-
Mycorrhizal, 0 dS/M EC 1 2 2 1.09 0.306NS
Contrast
27
Without Endosperm, mycorrhizal, 4.9
dS/M EC Vs Without Endosperm, non-
Mycorrhizal, 4.9 dS/M EC 1 208.08 208.08 9.3 0.006**
Contrast
28
Without Endosperm, non mycorrhizal, 0
dS/M EC Vs Without Endosperm, non-
Mycorrhizal, 4.9 dS/M EC 1 699.38 699.38 31.27 <.001***
Contrast 29
Without Endosperm, mycorrhizal, 0 dS/M
EC Vs Without Endosperm, Non
Mycorrhizal, 0 dS/M EC 1 212.18 212.18 9.49 0.005**
Contrast 30
Without Endosperm, mycorrhizal, 0 dS/M
EC Vs Without Endosperm, non-
Mycorrhizal, 4.9 dS/M EC 1 1682 1682 75.2 <.001***
Contrast 31
With Endosperm, mycorrhizal, 4.9 dS/M
EC Vs Without Endosperm, Mycorrhizal,
4.9 dS/M EC 1 5.12 5.12 0.23 0.637NS
Residual 24 536.82 22.37
Total 31 4119.76
Page 161
137
Appendix IX: Anova table for effect of arbuscular mycorrhizal fungi and salt
stress on the leaf fresh weight (grams) of passion fruit seedlings
Source of variation d.f. s.s. m.s. v.r. F pr.
TREATMENT 5 392.71 78.542 44.17 <.001***
Contrast 1
Mycorrhizal, 0 dS/m EC VS
Mycorrhizal, 4.9 dS/m EC 1 19.22 19.22 10.81 0.004**
Contrast 2
Mycorrhizal, 0 dS/m EC VS
Mycorrhizal, 9 dS/m EC 1 197.61 197.61 111.13 <.001***
Contrast 3
mycorrhizal, 4.9 ds/m ec vs
mycorrhizal, 9 ds/m ec 1 93.571 93.571 52.62 <.001***
Contrast 4
Mycorrhizal, 0 dS/m EC VS Non-
mycorrhizal, 0 dS/m EC 1 14.58 14.58 8.2 0.01**
Contrast 5
Mycorrhizal, 0 dS/m EC VS Non-
mycorrhizal, 4.9 dS/m EC 1 65.208 65.208 36.67 <.001***
Contrast 6
Mycorrhizal, 0 dS/m EC VS Non-
mycorrhizal, 9 dS/m EC 1 259.01 259.01 145.67 <.001***
Contrast 7
Mycorrhizal, 4.9 dS/m EC VS
Non-mycorrhizal, 0 dS/m EC 1 0.32 0.32 0.18 0.676NS
Contrast 8
Mycorrhizal, 4.9 dS/m EC VS
Non-mycorrhizal, 4.9 dS/m EC 1 13.624 13.624 7.66 0.013**
Contrast 9
Mycorrhizal, 4.9 dS/m EC VS
Non-mycorrhizal, 9 dS/m EC 1 137.12 137.12 77.11 <.001***
Contrast 10
Mycorrhizal, 9 dS/m EC VS Non-
mycorrhizal, 0 dS/m EC 1 104.84 104.84 58.96 <.001***
Contrast 11
Mycorrhizal, 9 dS/m EC VS Non-
mycorrhizal, 4.9 dS/m EC 1 35.786 35.786 20.13 <.001***
Contrast 12
Mycorrhizal, 9 dS/m EC VS Non-
mycorrhizal, 9 dS/m EC 1 4.147 4.147 2.33 0.144NS
Contrast 13
Non-Mycorrhizal, 0 dS/m EC VS
Non-mycorrhizal, 4.9 dS/m EC 1 18.12 18.12 10.19 0.005**
Contrast 14
Non-Mycorrhizal, 0 dS/m EC VS
Non-mycorrhizal, 9 dS/m EC 1 150.69 150.69 84.74 <.001***
Contrast 15
Non-Mycorrhizal, 4.9 dS/m EC
VS Non-mycorrhizal, 9 dS/m EC 1 64.298 64.298 36.16 <.001***
Residual 18 32.006 1.778
Total 23 424.72
Page 162
138
Appendix X: Anova table for effect of arbuscular mycorrhizal fungi and salt stress
on the stem fresh weight (grams) of passion fruit seedlings
Source of variation d.f. s.s. m.s. v.r. F pr.
TREATMENT 5 41.497 8.2993 44.6 <.001
Contrast 1
Mycorrhizal, 0 dS/m EC VS Mycorrhizal,
4.9 dS/m EC 1 10.58 10.58 56.85 <.001***
Contrast 2
Mycorrhizal, 0 dS/m EC VS Mycorrhizal,
9 dS/m EC 1 28.125 28.125 151.13 <.001***
Contrast 3
Mycorrhizal, 4.9 dS/m EC VS
Mycorrhizal, 9 dS/m EC 1 4.205 4.205 22.6 <.001***
Contrast 4
Mycorrhizal, 0 dS/m EC VS Non-
mycorrhizal, 0 dS/m EC 1 5.9858 5.9858 32.16 <.001***
Contrast 5
Mycorrhizal, 0 dS/m EC VS Non-
mycorrhizal, 4.9 dS/m EC 1 17.287 17.2872 92.89 <.001***
Contrast 6
Mycorrhizal, 0 dS/m EC VS Non-
mycorrhizal, 9 dS/m EC 1 29.338 29.3378 157.65 <.001***
Contrast 7
Mycorrhizal, 4.9 dS/m EC VS Non-
mycorrhizal, 0 dS/m EC 1 0.6498 0.6498 3.49 0.078NS
Contrast 8
Mycorrhizal, 4.9 dS/m EC VS Non-
mycorrhizal, 4.9 dS/m EC 1 0.8192 0.8192 4.4 0.05*
Contrast 9
Mycorrhizal, 4.9 dS/m EC VS Non-
mycorrhizal, 9 dS/m EC 1 4.6818 4.6818 25.16 <.001***
Contrast 10
Mycorrhizal, 9 dS/m EC VS Non-
mycorrhizal, 0 dS/m EC 1 8.1608 8.1608 43.85 <.001***
Contrast 11
Mycorrhizal, 9 dS/m EC VS Non-
mycorrhizal, 4.9 dS/m EC 1 1.3122 1.3122 7.05 0.016**
Contrast 12
Mycorrhizal, 9 dS/m EC VS Non-
mycorrhizal, 9 dS/m EC 1 0.0128 0.0128 0.07 0.796NS
Contrast 13
Non-Mycorrhizal, 0 dS/m EC VS Non-
mycorrhizal, 4.9 dS/m EC 1 2.9282 2.9282 15.73 <.001***
Contrast 14
Non-Mycorrhizal, 0 dS/m EC VS Non-
mycorrhizal, 9 dS/m EC 1 8.82 8.82 47.39 <.001***
Contrast 15
Non-Mycorrhizal, 4.9 dS/m EC VS Non-
mycorrhizal, 9 dS/m EC 1 1.5842 1.5842 8.51 0.009**
Residual 18 3.3498 0.1861
Total 23 44.846
Page 163
139
Appendix XII: Anova table for effect of arbuscular mycorrhizal fungi and salt
stress on the root fresh weight (grams) of passion fruit seedlings
Source of variation d.f. s.s. m.s. v.r. F pr.
TREATMENT 5 729.87 145.98 45.96 <.001
Contrast 1
Mycorrhizal, 0 dS/m EC VS
Mycorrhizal, 4.9 dS/m EC 1 64.98 64.98 20.46 <.001***
Contrast 2
Mycorrhizal, 0 dS/m EC VS
Mycorrhizal, 9 dS/m EC 1 420.5 420.5 132.4 <.001***
Contrast 3
Mycorrhizal, 4.9 dS/m EC VS
Mycorrhizal, 9 dS/m EC 1 154.88 154.88 48.77 <.001***
Contrast 4
Mycorrhizal, 0 dS/m EC VS Non-
mycorrhizal, 0 dS/m EC 1 23.12 23.12 7.28 0.015***
Contrast 5
Mycorrhizal, 0 dS/m EC VS Non-
mycorrhizal, 4.9 dS/m EC 1 158.42 158.42 49.88 <.001***
Contrast 6
Mycorrhizal, 0 dS/m EC VS Non-
mycorrhizal, 9 dS/m EC 1 450 450 141.69 <.001***
Contrast 7
Mycorrhizal, 4.9 dS/m EC VS Non-
mycorrhizal, 0 dS/m EC 1 10.58 10.58 3.33 0.085NS
Contrast 8
Mycorrhizal, 4.9 dS/m EC VS Non-
mycorrhizal, 4.9 dS/m EC 1 20.48 20.48 6.45 0.021***
Contrast 9
Mycorrhizal, 4.9 dS/m EC VS Non-
mycorrhizal, 9 dS/m EC 1 172.98 172.98 54.47 <.001***
Contrast 10
Mycorrhizal, 9 dS/m EC VS Non-
mycorrhizal, 0 dS/m EC 1 246.42 246.42 77.59 <.001***
Contrast 11
Mycorrhizal, 9 dS/m EC VS Non-
mycorrhizal, 4.9 dS/m EC 1 62.72 62.72 19.75 <.001***
Contrast 12
Mycorrhizal, 9 dS/m EC VS Non-
mycorrhizal, 9 dS/m EC 1 0.5 0.5 0.16 0.696NS
Contrast 13
Non-Mycorrhizal, 0 dS/m EC VS
Non-mycorrhizal, 4.9 dS/m EC 1 60.5 60.5 19.05 <.001***
Contrast 14
Non-Mycorrhizal, 0 dS/m EC VS
Non-mycorrhizal, 9 dS/m EC 1 269.12 269.12 84.74 <.001**
Contrast 15
Non-Mycorrhizal, 4.9 dS/m EC VS
Non-mycorrhizal, 9 dS/m EC 1 74.42 74.42 23.43 <.001***
Residual 18 57.166 3.176
Total 23 787.04
Page 164
140
Appendix XII: Anova table for effect of arbuscular mycorrhizal fungi and salt
stress on the leaf dry weight (grams) of passion fruit seedlings
Source of variation d.f. s.s. m.s. v.r. F pr.
TREATMENT 5 23.7707 4.75415 68.95 <.001
Contrast 1
Mycorrhizal, 0 dS/m EC VS Mycorrhizal, 4.9
dS/m EC 1 2.4642 2.4642 35.74 <.001***
Contrast 2
Mycorrhizal, 0 dS/m EC VS Mycorrhizal, 9
dS/m EC 1 10.2152 10.2152 148.14 <.001***
Contrast 3
Mycorrhizal, 4.9 dS/m EC VS Mycorrhizal, 9
dS/m EC 1 2.645 2.645 38.36 <.001***
Contrast 4
Mycorrhizal, 0 dS/m EC VS Non-mycorrhizal,
0 dS/m EC 1 0.6498 0.6498 9.42 0.007**
Contrast 5
Mycorrhizal, 0 dS/m EC VS Non-mycorrhizal,
4.9 dS/m EC 1 7.605 7.605 110.29 <.001***
Contrast 6
Mycorrhizal, 0 dS/m EC VS Non-mycorrhizal,
9 dS/m EC 1 16.5888 16.5888 240.57 <.001***
Contrast 7
Mycorrhizal, 4.9 dS/m EC VS Non-mycorrhizal,
0 dS/m EC 1 0.5832 0.5832 8.46 0.009**
Contrast 8
Mycorrhizal, 4.9 dS/m EC VS Non-mycorrhizal,
4.9 dS/m EC 1 1.4112 1.4112 20.47 <.001***
Contrast 9
Mycorrhizal, 4.9 dS/m EC VS Non-mycorrhizal,
9 dS/m EC 1 6.2658 6.2658 90.87 <.001***
Contrast 10
Mycorrhizal, 9 dS/m EC VS Non-mycorrhizal,
0 dS/m EC 1 5.7122 5.7122 82.84 <.001***
Contrast 11
Mycorrhizal, 9 dS/m EC VS Non-mycorrhizal,
4.9 dS/m EC 1 0.1922 0.1922 2.79 0.112NS
Contrast 12
Mycorrhizal, 9 dS/m EC VS Non-mycorrhizal,
9 dS/m EC 1 0.7688 0.7688 11.15 0.004**
Contrast 13
Non-Mycorrhizal, 0 dS/m EC VS Non-
mycorrhizal, 4.9 dS/m EC 1 3.8088 3.8088 55.24 <.001***
Contrast 14
Non-Mycorrhizal, 0 dS/m EC VS Non-
mycorrhizal, 9 dS/m EC 1 10.6722 10.6722 154.77 <.001***
Contrast 15
Non-Mycorrhizal, 4.9 dS/m EC VS Non-
mycorrhizal, 9 dS/m EC 1 1.7298 1.7298 25.09 <.001***
Residual 18 1.2412 0.06896
Total 23 25.0119
Page 165
141
Appendix XIII: Anova table for effect of arbuscular mycorrhizal fungi and salt
stress on the stem dry weight (grams) of passion fruit seedlings
Source of variation d.f. s.s. m.s. v.r. F pr.
TREATMENT 5 4.8808 0.97616 37.15 <.001
Contrast 1
Mycorrhizal, 0 dS/m EC VS Mycorrhizal,
4.9 dS/m EC 1 1.2482 1.2482 47.5 <.001***
Contrast 2
Mycorrhizal, 0 dS/m EC VS Mycorrhizal,
9 dS/m EC 1 2.8322 2.8322 107.78 <.001***
Contrast 3
Mycorrhizal, 4.9 dS/m EC VS
Mycorrhizal, 9 dS/m EC 1 0.32 0.32 12.18 0.003**
Contrast 4
Mycorrhizal, 0 dS/m EC VS Non-
mycorrhizal, 0 dS/m EC 1 0.7688 0.7688 29.26 <.001***
Contrast 5
Mycorrhizal, 0 dS/m EC VS Non-
mycorrhizal, 4.9 dS/m EC 1 1.8818 1.8818 71.61 <.001***
Contrast 6
Mycorrhizal, 0 dS/m EC VS Non-
mycorrhizal, 9 dS/m EC 1 3.9762 3.9762 151.31 <.001***
Contrast 7
Mycorrhizal, 4.9 dS/m EC VS Non-
mycorrhizal, 0 dS/m EC 1 0.0578 0.0578 2.2 0.155NS
Contrast 8
Mycorrhizal, 4.9 dS/m EC VS Non-
mycorrhizal, 4.9 dS/m EC 1 0.0648 0.0648 2.47 0.134NS
Contrast 9
Mycorrhizal, 4.9 dS/m EC VS Non-
mycorrhizal, 9 dS/m EC 1 0.7688 0.7688 29.26 <.001***
Contrast 10
Mycorrhizal, 9 dS/m EC VS Non-
mycorrhizal, 0 dS/m EC 1 0.6498 0.6498 24.73 <.001***
Contrast 11
Mycorrhizal, 9 dS/m EC VS Non-
mycorrhizal, 4.9 dS/m EC 1 0.0968 0.0968 3.68 0.071NS
Contrast 12
Mycorrhizal, 9 dS/m EC VS Non-
mycorrhizal, 9 dS/m EC 1 0.0968 0.0968 3.68 0.071NS
Contrast 13
Non-Mycorrhizal, 0 dS/m EC VS Non-
mycorrhizal, 4.9 dS/m EC 1 0.245 0.245 9.32 0.007**
Contrast 14
Non-Mycorrhizal, 0 dS/m EC VS Non-
mycorrhizal, 9 dS/m EC 1 1.2482 1.2482 47.5 <.001***
Contrast 15
Non-Mycorrhizal, 4.9 dS/m EC VS Non-
mycorrhizal, 9 dS/m EC 1 0.3872 0.3872 14.73 0.001***
Residual 18 0.473 0.02628
Total 23 5.3538
Page 166
142
Appendix XIV: Anova table for effect of arbuscular mycorrhizal fungi and salt
stress on the root dry weight (grams) of passion fruit seedlings
Source of variation d.f. s.s. m.s. v.r. F pr.
TREATMENT 5 97.784 19.557 181.06 <.001
Contrast 1
Mycorrhizal, 0 dS/m EC VS Mycorrhizal,
4.9 dS/m EC 1 45.506 45.506 421.31 <.001***
Contrast 2
Mycorrhizal, 0 dS/m EC VS Mycorrhizal, 9
dS/m EC 1 64.98 64.98 601.6 <.001***
Contrast 3
Mycorrhizal, 4.9 dS/m EC VS Mycorrhizal,
9 dS/m EC 1 1.7298 1.7298 16.02 <.001***
Contrast 4
Mycorrhizal, 0 dS/m EC VS Non-
mycorrhizal, 0 dS/m EC 1 35.28 35.28 326.63 <.001***
Contrast 5
Mycorrhizal, 0 dS/m EC VS Non-
mycorrhizal, 4.9 dS/m EC 1 58.32 58.32 539.94 <.001***
Contrast 6
Mycorrhizal, 0 dS/m EC VS Non-
mycorrhizal, 9 dS/m EC 1 69.62 69.62 644.56 <.001***
Contrast 7
Mycorrhizal, 4.9 dS/m EC VS Non-
mycorrhizal, 0 dS/m EC 1 0.6498 0.6498 6.02 0.025*
Contrast 8
Mycorrhizal, 4.9 dS/m EC VS Non-
mycorrhizal, 4.9 dS/m EC 1 0.7938 0.7938 7.35 0.014*
Contrast 9
Mycorrhizal, 4.9 dS/m EC VS Non-
mycorrhizal, 9 dS/m EC 1 2.5538 2.5538 23.64 <.001***
Contrast 10
Mycorrhizal, 9 dS/m EC VS Non-
mycorrhizal, 0 dS/m EC 1 4.5 4.5 41.66 <.001***
Contrast 11
Mycorrhizal, 9 dS/m EC VS Non-
mycorrhizal, 4.9 dS/m EC 1 0.18 0.18 1.67 0.213NS
Contrast 12
Mycorrhizal, 9 dS/m EC VS Non-
mycorrhizal, 9 dS/m EC 1 0.08 0.08 0.74 0.401NS
Contrast 13
Non-Mycorrhizal, 0 dS/m EC VS Non-
mycorrhizal, 4.9 dS/m EC 1 2.88 2.88 26.66 <.001***
Contrast 14
Non-Mycorrhizal, 0 dS/m EC VS Non-
mycorrhizal, 9 dS/m EC 1 5.78 5.78 53.51 <.001***
Contrast 15
Non-Mycorrhizal, 4.9 dS/m EC VS Non-
mycorrhizal, 9 dS/m EC 1 0.5 0.5 4.63 0.045*
Residual 18 1.9442 0.108
Total 23 99.729
Page 167
143
Appendix XV: Anova table for effect of arbuscular mycorrhizal fungi, endosperm
attachment and salt stress on the leaf fresh weight (grams of mango seedlings
Source of
variation d.f. s.s. m.s. v.r. F pr.
TREATMENT 7 209.2868 29.8981 42.69 <.001***
Contrast 1
With Endosperm, mycorrhizal, 0 dS/M
EC Vs With Endosperm, Mycorrhizal,
4.9 dS/M EC 1 37.845 37.845 54.04 <.001***
Contrast 2
With Endosperm, mycorrhizal, 0 dS/M
EC Vs With Endosperm, non-
Mycorrhizal, 0 dS/M EC 1 13.7288 13.7288 19.6 <.001***
Contrast 3
With Endosperm, mycorrhizal, 0 dS/M
EC Vs With Endosperm, non-
Mycorrhizal, 4.9 dS/M EC 1 80.1378 80.1378 114.44 <.001***
Contrast 4
With Endosperm, mycorrhizal, 0 dS/M
EC Vs Without Endosperm,
Mycorrhizal, 0 dS/M EC 1 0.1922 0.1922 0.27 0.605NS
Contrast 5
With Endosperm, mycorrhizal, 0 dS/M
EC Vs Without Endosperm,
Mycorrhizal, 4.9 dS/M EC 1 44.7458 44.7458 63.9 <.001***
Contrast 6
With Endosperm, mycorrhizal, 0 dS/M
EC Vs Without Endosperm, non-
Mycorrhizal, 0 dS/M EC 1 49.2032 49.2032 70.26 <.001***
Contrast 7
With Endosperm, mycorrhizal, 0 dS/M
EC Vs Without Endosperm, non-
Mycorrhizal, 4.9 dS/M EC 1 119.5058 119.505 170.65 <.001***
Contrast 8
With Endosperm, mycorrhizal, 4.9
dS/M EC Vs With Endosperm, non-
Mycorrhizal, 0 dS/M EC 1 0.2888 0.2888 0.55 0.465NS
Contrast 9
With Endosperm, mycorrhizal, 4.9
dS/M EC Vs With Endosperm, non-
Mycorrhizal, 4.9 dS/M EC 1 12.3008 12.3008 18.93 <.001***
Contrast 10
With Endosperm, mycorrhizal, 4.9
dS/M EC Vs Without Endosperm,
Mycorrhizal, 0 dS/M EC 1 32.6432 32.6432 46.61 <.001***
Contrast 11
With Endosperm, non-mycorrhizal,
4.9 dS/M EC Vs Without Endosperm,
Mycorrhizal, 4.9 dS/M EC 1 0.2888 0.2888 0.41 0.527NS
Contrast 12
With Endosperm, mycorrhizal, 4.9
dS/M EC Vs Without Endosperm,
non-Mycorrhizal, 0 dS/M EC 1 4.8672 4.8672 9.27 0.006NS
Contrast 13
With Endosperm, mycorrhizal, 4.9
dS/M EC Vs Without Endosperm,
non-Mycorrhizal, 4.9 dS/M EC 1 22.8488 22.8488 32.63 <.001***
Contrast 14
With Endosperm, non-mycorrhizal, 0
dS/M EC Vs With Endosperm, non-
Mycorrhizal, 4.9 dS/M EC 1 27.5282 27.5282 39.31 <.001***
Contrast 15
With Endosperm, non-mycorrhizal, 0
dS/M EC Vs Without Endosperm,
Mycorrhizal, 0 dS/M EC 1 10.6722 10.6722 15.24 <.001***
Contrast 16
With Endosperm, non-mycorrhizal, 0
dS/M EC Vs Without Endosperm,
Mycorrhizal, 4.9 dS/M EC 1 0.72 0.72 1.37 0.253NS
Contrast 17
With Endosperm, non-mycorrhizal, 0
dS/M EC Vs Without Endosperm,
non- Mycorrhizal, 0 dS/M EC 1 10.9512 10.9512 15.64 <.001***
Contrast 18
With Endosperm, non-mycorrhizal, 0
dS/M EC Vs Without Endosperm,
non- Mycorrhizal, 4.9 dS/M EC 1 52.2242 52.2242 74.58 <.001***
Page 168
144
Contrast 19
With Endosperm, non-mycorrhizal,
4.9 dS/M EC Vs Without Endosperm,
Mycorrhizal, 0 dS/M EC 1 72.4808 72.4808 103.5 <.001***
Contrast 20
With Endosperm, non-mycorrhizal,
4.9 dS/M EC Vs Without Endosperm,
Mycorrhizal, 4.9 dS/M EC 1 5.12 5.12 7.31 0.012***
Contrast 21
With Endosperm, non-mycorrhizal,
4.9 dS/M EC Vs Without Endosperm,
non Mycorrhizal, 0 dS/M EC 1 3.7538 3.7538 5.36 0.029***
Contrast 22
With Endosperm, non-mycorrhizal,
4.9 dS/M EC Vs Without Endosperm,
non Mycorrhizal, 4.9 dS/M EC 1 3.92 3.92 5.6 0.026*
Contrast 23
Without Endosperm, mycorrhizal, 0
dS/M EC Vs Without Endosperm,
Mycorrhizal, 4.9 dS/M EC 1 39.0728 39.0728 55.8 <.001***
Contrast 24
Without Endosperm, mycorrhizal, 0
dS/M EC Vs With Endosperm, non-
Mycorrhizal, 0 dS/M EC 1 43.245 43.245 61.75 <.001***
Contrast 25
Without Endosperm, mycorrhizal, 0
dS/M EC Vs With Endosperm, non-
Mycorrhizal, 4.9 dS/M EC 1 110.1128 110.1128 157.24 <.001***
Contrast 26
Without Endosperm, mycorrhizal, 4.9
dS/M EC Vs Without Endosperm,
non- Mycorrhizal, 0 dS/M EC 1 3.5912 3.5912 6.84 0.015NS
Contrast 27
Without Endosperm, mycorrhizal, 4.9
dS/M EC Vs Without Endosperm,
non- Mycorrhizal, 4.9 dS/M EC 1 18 18 25.7 <.001***
Contrast 28
Without Endosperm, non mycorrhizal,
0 dS/M EC Vs Without Endosperm,
non- Mycorrhizal, 4.9 dS/M EC 1 15.3458 15.3458 21.91 <.001***
Contrast 29
Without Endosperm, mycorrhizal, 0
dS/M EC Vs Without Endosperm,
non- Mycorrhizal, 0 dS/M EC 1 43.245 43.245 61.75 <.001***
Contrast 30
Without Endosperm, mycorrhizal, 0
dS/M EC Vs Without Endosperm,
non- Mycorrhizal, 4.9 dS/M EC 1 110.1128 110.1128 157.24 <.001***
Contrast 31
With Endosperm, Mycorrhizal, 4.9
dS/M EC VS Without Endosperm,
mycorrhizal, 4.9 dS/M EC 1 0.2888 0.2888 0.46 0.505NS
Residual 24 16.8068 0.7003
Total 31 226.0936
Page 169
145
Appendix XVI: ANOVA table for effect of Arbuscular Mycorrhizal Fungi,
Endosperm attachment and salt stress on the Stem Fresh Weight (grams) of
Mango seedlings
Source of
variation d.f. s.s. m.s. v.r. F pr.
TREATMENT 7 64.323 9.189 87.11 <.001***
Contrast 1
With Endosperm, mycorrhizal, 0 dS/M
EC Vs With Endosperm, Mycorrhizal, 4.9
dS/M EC 1 23.943 23.943 226.9 <.001***
Contrast 2
With Endosperm, mycorrhizal, 0 dS/M
EC Vs With Endosperm, non-
Mycorrhizal, 0 dS/M EC 1 8.4872 8.4872 80.45 <.001***
Contrast 3
With Endosperm, mycorrhizal, 0 dS/M
EC Vs With Endosperm, non-
Mycorrhizal, 4.9 dS/M EC 1 21.648 21.648 205.2 <.001***
Contrast 4
With Endosperm, mycorrhizal, 0 dS/M
EC Vs Without Endosperm, Mycorrhizal,
0 dS/M EC 1 0.1568 0.1568 1.49 0.235NS
Contrast 5
With Endosperm, mycorrhizal, 0 dS/M
EC Vs Without Endosperm, Mycorrhizal,
4.9 dS/M EC 1 17.880 17.880 169.4 <.001***
Contrast 6
With Endosperm, mycorrhizal, 0 dS/M
EC Vs Without Endosperm, non-
Mycorrhizal, 0 dS/M EC 1 21.912 21.912 207.7 <.001***
Contrast 7
With Endosperm, mycorrhizal, 0 dS/M
EC Vs Without Endosperm, non-
Mycorrhizal, 4.9 dS/M EC 1 32.320 32.320 306.3 <.001***
Contrast 8
With Endosperm, mycorrhizal, 4.9 dS/M
EC Vs With Endosperm, non-
Mycorrhizal, 0 dS/M EC 1 0.259 0.2592 2.99 0.097NS
Contrast 9
With Endosperm, mycorrhizal, 4.9 dS/M
EC Vs With Endosperm, non-
Mycorrhizal, 4.9 dS/M EC 1 1.5488 1.5488 17.41 <.001***
Contrast 10
With Endosperm, mycorrhizal, 4.9 dS/M
EC Vs Without Endosperm, Mycorrhizal,
0 dS/M EC 1 20.224 20.224 191.7 <.001***
Contrast 11
With Endosperm, non-mycorrhizal, 4.9
dS/M EC Vs Without Endosperm,
Mycorrhizal, 4.9 dS/M EC 1 0.4418 0.4418 4.19 0.052NS
Contrast 12
With Endosperm, mycorrhizal, 4.9 dS/M
EC Vs Without Endosperm, non-
Mycorrhizal, 0 dS/M EC 1 1.513 1.513 17.45 <.001
Contrast 13
With Endosperm, mycorrhizal, 4.9 dS/M
EC Vs Without Endosperm, non-
Mycorrhizal, 4.9 dS/M EC 1 0.6272 0.6272 5.95 0.023***
Contrast 14
With Endosperm, non-mycorrhizal, 0
dS/M EC Vs With Endosperm, non-
Mycorrhizal, 4.9 dS/M EC 1 3.0258 3.0258 28.68 <.001***
Contrast 15
With Endosperm, non-mycorrhizal, 0
dS/M EC Vs Without Endosperm,
Mycorrhizal, 0 dS/M EC 1 6.3368 6.3368 60.07 <.001***
Contrast 16
With Endosperm, non-mycorrhizal, 0
dS/M EC Vs Without Endosperm,
Mycorrhizal, 4.9 dS/M EC 1 0.540 0.540 6.23 0.02*
Contrast 17
With Endosperm, non-mycorrhizal, 0
dS/M EC Vs Without Endosperm, non-
Mycorrhizal, 0 dS/M EC 1 3.125 3.125 29.62 <.001***
Page 170
146
Contrast 18
With Endosperm, non-mycorrhizal, 0
dS/M EC Vs Without Endosperm, non-
Mycorrhizal, 4.9 dS/M EC 1 7.6832 7.6832 72.83 <.001***
Contrast 19
With Endosperm, non-mycorrhizal, 4.9
dS/M EC Vs Without Endosperm,
Mycorrhizal, 0 dS/M EC 1 18.120 18.120 171.77 <.001***
Contrast 20
With Endosperm, non-mycorrhizal, 4.9
dS/M EC Vs Without Endosperm,
Mycorrhizal, 4.9 dS/M EC 1 0.18 0.18 1.71 0.204NS
Contrast 21
With Endosperm, non-mycorrhizal, 4.9
dS/M EC Vs Without Endosperm, non
Mycorrhizal, 0 dS/M EC 1 0.0008 0.0008 0.01 0.931NS
Contrast 22
With Endosperm, non-mycorrhizal, 4.9
dS/M EC Vs Without Endosperm, non
Mycorrhizal, 4.9 dS/M EC 1 1.0658 1.0658 10.1 0.004***
Contrast 23
Without Endosperm, mycorrhizal, 0 dS/M
EC Vs Without Endosperm, Mycorrhizal,
4.9 dS/M EC 1 14.688 14.688 139.4 <.001***
Contrast 24
Without Endosperm, mycorrhizal, 0 dS/M
EC Vs With Endosperm, non-
Mycorrhizal, 0 dS/M EC 1 18.361 18.361 174.0 <.001***
Contrast 25
Without Endosperm, mycorrhizal, 0 dS/M
EC Vs With Endosperm, non-
Mycorrhizal, 4.9 dS/M EC 1 27.975 27.975 265.1 <.001***
Contrast 26
Without Endosperm, mycorrhizal, 4.9
dS/M EC Vs Without Endosperm, non-
Mycorrhizal, 0 dS/M EC 1 1.008 1.008 11.62 0.002NS
Contrast 27
Without Endosperm, mycorrhizal, 4.9
dS/M EC Vs Without Endosperm, non-
Mycorrhizal, 4.9 dS/M EC 1 2.1218 2.1218 20.11 <.001***
Contrast 28
Without Endosperm, non mycorrhizal, 0
dS/M EC Vs Without Endosperm, non-
Mycorrhizal, 4.9 dS/M EC 1 1.0082 1.0082 9.56 0.005***
Contrast 29
Without Endosperm, mycorrhizal, 0 dS/M
EC Vs Without Endosperm, non-
Mycorrhizal, 0 dS/M EC 1 18.361 18.361 174.0 <.001***
Contrast 30
Without Endosperm, mycorrhizal, 0 dS/M
EC Vs Without Endosperm, non-
Mycorrhizal, 4.9 dS/M EC 1 27.975 27.975 265.1 <.001***
Contrast 31
With Endosperm, Mycorrhizal, 4.9 dS/M
EC VS Without Endosperm, mycorrhizal,
4.9 dS/M EC 1 0.2312 0.2312 2.49 0.128NS
Residual 24 2.5318 0.1055
Total 31 66.85
Page 171
147
Appendix XVII: Anova table for effect of arbuscular mycorrhizal fungi,
endosperm attachment and salt stress on the root fresh weight (grams of mango
seedlings)
Source of variation d.f. s.s. m.s. v.r. F pr.
TREATMEN
T 7 174.742 24.9631 48.25 <.001***
Contrast 1
With Endosperm, mycorrhizal, 0 dS/M
EC Vs With Endosperm, Mycorrhizal,
4.9 dS/M EC 1 39.0728 39.0728 75.53 <.001***
Contrast 2
With Endosperm, mycorrhizal, 0 dS/M
EC Vs With Endosperm, non-
Mycorrhizal, 0 dS/M EC 1 15.5682 15.5682 30.09 <.001***
Contrast 3
With Endosperm, mycorrhizal, 0 dS/M
EC Vs With Endosperm, non-
Mycorrhizal, 4.9 dS/M EC 1 59.6232 59.6232
115.2
5 <.001***
Contrast 4
With Endosperm, mycorrhizal, 0 dS/M
EC Vs Without Endosperm,
Mycorrhizal, 0 dS/M EC 1 0.4418 0.4418 1.31 0.263NS
Contrast 5
With Endosperm, mycorrhizal, 0 dS/M
EC Vs Without Endosperm,
Mycorrhizal, 4.9 dS/M EC 1 65.6658 65.6658
126.9
3 <.001***
Contrast 6
With Endosperm, mycorrhizal, 0 dS/M
EC Vs Without Endosperm, non-
Mycorrhizal, 0 dS/M EC 1 94.3938 94.3938
182.4
7 <.001***
Contrast 7
With Endosperm, mycorrhizal, 0 dS/M
EC Vs Without Endosperm, non-
Mycorrhizal, 4.9 dS/M EC 1 125.136
125.136
2
241.8
9 <.001***
Contrast 8
With Endosperm, mycorrhizal, 4.9
dS/M EC Vs With Endosperm, non-
Mycorrhizal, 0 dS/M EC 1 0.0098 0.0098 0.04 0.853NS
Contrast 9
With Endosperm, mycorrhizal, 4.9
dS/M EC Vs With Endosperm, non-
Mycorrhizal, 4.9 dS/M EC 1 9.7682 9.7682 17.05 <.001***
Contrast 10
With Endosperm, mycorrhizal, 4.9
dS/M EC Vs Without Endosperm,
Mycorrhizal, 0 dS/M EC 1 1.4964 1.4964 2.89 0.102NS
Contrast 11
With Endosperm, non-mycorrhizal,
4.9 dS/M EC Vs Without Endosperm,
Mycorrhizal, 4.9 dS/M EC 1 3.4322 3.4322 6.63 0.017***
Contrast 12
With Endosperm, mycorrhizal, 4.9
dS/M EC Vs Without Endosperm, non-
Mycorrhizal, 0 dS/M EC 1 15.68 15.68 56.34 <.001***
Contrast 13
With Endosperm, mycorrhizal, 4.9
dS/M EC Vs Without Endosperm, non-
Mycorrhizal, 4.9 dS/M EC 1 24.3602 24.3602 47.09 <.001***
Contrast 14
With Endosperm, non-mycorrhizal, 0
dS/M EC Vs With Endosperm, non-
Mycorrhizal, 4.9 dS/M EC 1 14.2578 14.2578 27.56 <.001***
Contrast 15
With Endosperm, non-mycorrhizal, 0
dS/M EC Vs Without Endosperm,
Mycorrhizal, 0 dS/M EC 1 1.1705 1.1705 2.26 0.146NS
Contrast 16
With Endosperm, non-mycorrhizal, 0
dS/M EC Vs Without Endosperm,
Mycorrhizal, 4.9 dS/M EC 1 0.3042 0.3042 1.09 0.306NS
Contrast 17
With Endosperm, non-mycorrhizal, 0
dS/M EC Vs Without Endosperm, non-
Mycorrhizal, 0 dS/M EC 1 33.2928 33.2928 64.36 <.001***
Page 172
148
Contrast 18
With Endosperm, non-mycorrhizal, 0
dS/M EC Vs Without Endosperm, non-
Mycorrhizal, 4.9 dS/M EC 1 52.4288 52.4288
101.3
5 <.001***
Contrast 19
With Endosperm, non-mycorrhizal,
4.9 dS/M EC Vs Without Endosperm,
Mycorrhizal, 0 dS/M EC 1 7.258 7.258 14.03 <.001***
Contrast 20
With Endosperm, non-mycorrhizal,
4.9 dS/M EC Vs Without Endosperm,
Mycorrhizal, 4.9 dS/M EC 1 0.1458 0.1458 0.28 0.6NS
Contrast 21
With Endosperm, non-mycorrhizal,
4.9 dS/M EC Vs Without Endosperm,
non Mycorrhizal, 0 dS/M EC 1 3.9762 3.9762 7.69 0.011***
Contrast 22
With Endosperm, non-mycorrhizal,
4.9 dS/M EC Vs Without Endosperm,
non Mycorrhizal, 4.9 dS/M EC 1 12.005 12.005 23.21 <.001***
Contrast 23
Without Endosperm, mycorrhizal, 0
dS/M EC Vs Without Endosperm,
Mycorrhizal, 4.9 dS/M EC 1 9.4612 9.4612 18.29 <.001***
Contrast 24
Without Endosperm, mycorrhizal, 0
dS/M EC Vs With Endosperm, non-
Mycorrhizal, 0 dS/M EC 1 21.9784 21.9784 42.49 <.001***
Contrast 25
Without Endosperm, mycorrhizal, 0
dS/M EC Vs With Endosperm, non-
Mycorrhizal, 4.9 dS/M EC 1 37.9321 37.9321 73.32 <.001***
Contrast 26
Without Endosperm, mycorrhizal, 4.9
dS/M EC Vs Without Endosperm, non-
Mycorrhizal, 0 dS/M EC 1 10.9512 10.9512 39.35 <.001***
Contrast 27
Without Endosperm, mycorrhizal, 4.9
dS/M EC Vs Without Endosperm, non-
Mycorrhizal, 4.9 dS/M EC 1 9.5048 9.5048 18.37 <.001***
Contrast 28
Without Endosperm, non mycorrhizal,
0 dS/M EC Vs Without Endosperm,
non- Mycorrhizal, 4.9 dS/M EC 1 2.1632 2.1632 4.18 0.052NS
Contrast 29
Without Endosperm, mycorrhizal, 0
dS/M EC Vs Without Endosperm, non-
Mycorrhizal, 0 dS/M EC 1 21.9784 21.9784 42.49 <.001***
Contrast 30
Without Endosperm, mycorrhizal, 0
dS/M EC Vs Without Endosperm, non-
Mycorrhizal, 4.9 dS/M EC 1 37.9321 37.9321 73.32 <.001***
Contrast 31
With Endosperm, Mycorrhizal, 4.9
dS/M EC VS Without Endosperm,
mycorrhizal, 4.9 dS/M EC 1 1.4792 1.4792 4.16 0.053NS
Residual 24 12.4157 0.5173
Total 31
187.157
7
Page 173
149
Appendix XVIII: Anova table for effect of arbuscular mycorrhizal fungi,
endosperm attachment and salt stress on the leaf dry weight (grams) of mango
seedlings
Source of variation d.f s.s. m.s. v.r. F pr.
TREATMEN
T 7 27.424 3.9177 27.04
<.001**
*
Contrast 1
With Endosperm, mycorrhizal, 0 dS/M
EC Vs With Endosperm, Mycorrhizal,
4.9 dS/M EC 1 9.68 9.68 66.81
<.001**
*
Contrast 2
With Endosperm, mycorrhizal, 0 dS/M
EC Vs With Endosperm, non-
Mycorrhizal, 0 dS/M EC 1 3.1752 3.1752 21.92
<.001**
*
Contrast 3
With Endosperm, mycorrhizal, 0 dS/M
EC Vs With Endosperm, non-
Mycorrhizal, 4.9 dS/M EC 1 9.9458 9.9458 68.65
<.001**
*
Contrast 4
With Endosperm, mycorrhizal, 0 dS/M
EC Vs Without Endosperm,
Mycorrhizal, 0 dS/M EC 1 0.1682 0.1682 1.16 0.292NS
Contrast 5
With Endosperm, mycorrhizal, 0 dS/M
EC Vs Without Endosperm,
Mycorrhizal, 4.9 dS/M EC 1 9.0738 9.0738 62.63
<.001**
*
Contrast 6
With Endosperm, mycorrhizal, 0 dS/M
EC Vs Without Endosperm, non-
Mycorrhizal, 0 dS/M EC 1
10.035
2 10.0352 69.26
<.001**
*
Contrast 7
With Endosperm, mycorrhizal, 0 dS/M
EC Vs Without Endosperm, non-
Mycorrhizal, 4.9 dS/M EC 1
13.624
2 13.6242 94.04
<.001**
*
Contrast 8
With Endosperm, mycorrhizal, 4.9
dS/M EC Vs With Endosperm, non-
Mycorrhizal, 0 dS/M EC 1 0.1058 0.1058 1.1 0.304NS
Contrast 9
With Endosperm, mycorrhizal, 4.9
dS/M EC Vs With Endosperm, non-
Mycorrhizal, 4.9 dS/M EC 1 0.8978 0.8978 6.47 0.018*
Contrast 10
With Endosperm, mycorrhizal, 4.9
dS/M EC Vs Without Endosperm,
Mycorrhizal, 0 dS/M EC 1 7.2962 7.2962 50.36
<.001**
*
Contrast 11
With Endosperm, non-mycorrhizal, 4.9
dS/M EC Vs Without Endosperm,
Mycorrhizal, 4.9 dS/M EC 1 0.0098 0.0098 0.07 0.797NS
Contrast 12
With Endosperm, mycorrhizal, 4.9
dS/M EC Vs Without Endosperm, non-
Mycorrhizal, 0 dS/M EC 1 1.125 1.125 11.72 0.002*
Contrast 13
With Endosperm, mycorrhizal, 4.9
dS/M EC Vs Without Endosperm, non-
Mycorrhizal, 4.9 dS/M EC 1 0.3362 0.3362 2.32 0.141NS
Contrast 14
With Endosperm, non-mycorrhizal, 0
dS/M EC Vs With Endosperm, non-
Mycorrhizal, 4.9 dS/M EC 1 1.8818 1.8818 12.99 0.001***
Contrast 15
With Endosperm, non-mycorrhizal, 0
dS/M EC Vs Without Endosperm,
Mycorrhizal, 0 dS/M EC 1 1.8818 1.8818 12.99 0.001***
Contrast 16
With Endosperm, non-mycorrhizal, 0
dS/M EC Vs Without Endosperm,
Mycorrhizal, 4.9 dS/M EC 1 0.2888 0.2888 3.01 0.096NS
Contrast 17
With Endosperm, non-mycorrhizal, 0
dS/M EC Vs Without Endosperm, non-
Mycorrhizal, 0 dS/M EC 1 1.9208 1.9208 13.26 0.001***
Page 174
150
Contrast 18
With Endosperm, non-mycorrhizal, 0
dS/M EC Vs Without Endosperm, non-
Mycorrhizal, 4.9 dS/M EC 1 3.645 3.645 25.16
<.001**
*
Contrast 19
With Endosperm, non-mycorrhizal, 4.9
dS/M EC Vs Without Endosperm,
Mycorrhizal, 0 dS/M EC 1 7.5272 7.5272 51.95
<.001**
*
Contrast 20
With Endosperm, non-mycorrhizal, 4.9
dS/M EC Vs Without Endosperm,
Mycorrhizal, 4.9 dS/M EC 1 0.02 0.02 0.14 0.713NS
Contrast 21
With Endosperm, non-mycorrhizal, 4.9
dS/M EC Vs Without Endosperm, non
Mycorrhizal, 0 dS/M EC 1 0.0002 0.0002 0 0.971NS
Contrast 22
With Endosperm, non-mycorrhizal, 4.9
dS/M EC Vs Without Endosperm, non
Mycorrhizal, 4.9 dS/M EC 1 0.2888 0.2888 1.99 0.171NS
Contrast 23
Without Endosperm, mycorrhizal, 0
dS/M EC Vs Without Endosperm,
Mycorrhizal, 4.9 dS/M EC 1 6.7712 6.7712 46.74
<.001**
*
Contrast 24
Without Endosperm, mycorrhizal, 0
dS/M EC Vs With Endosperm, non-
Mycorrhizal, 0 dS/M EC 1 7.605 7.605 52.49
<.001**
*
Contrast 25
Without Endosperm, mycorrhizal, 0
dS/M EC Vs With Endosperm, non-
Mycorrhizal, 4.9 dS/M EC 1
10.764
8 10.7648 74.3
<.001**
*
Contrast 26
Without Endosperm, mycorrhizal, 4.9
dS/M EC Vs Without Endosperm, non-
Mycorrhizal, 0 dS/M EC 1 0.72 0.72 7.5 0.011NS
Contrast 27
Without Endosperm, mycorrhizal, 4.9
dS/M EC Vs Without Endosperm, non-
Mycorrhizal, 4.9 dS/M EC 1 0.4608 0.4608 3.18 0.087NS
Contrast 28
Without Endosperm, non mycorrhizal,
0 dS/M EC Vs Without Endosperm,
non- Mycorrhizal, 4.9 dS/M EC 1 0.2738 0.2738 1.89 0.182NS
Contrast 29
Without Endosperm, mycorrhizal, 0
dS/M EC Vs Without Endosperm, non-
Mycorrhizal, 0 dS/M EC 1 7.605 7.605 52.49
<.001**
*
Contrast 30
Without Endosperm, mycorrhizal, 0
dS/M EC Vs Without Endosperm, non-
Mycorrhizal, 4.9 dS/M EC 1
10.764
8 10.7648 74.3
<.001**
*
Contrast 31
With Endosperm, Mycorrhizal, 4.9
dS/M EC VS Without Endosperm,
mycorrhizal, 4.9 dS/M EC 1 0.3042 0.3042 3.93 0.059NS
Residual 24 3.4772 0.1449
Total 31
30.901
2
Page 175
151
Appendix XIX: Anova table for effect of arbuscular mycorrhizal fungi,
endosperm attachment and salt stress on the root dry weight (grams) of mango
seedlings
Source of variation df s.s. m.s. v.r. F pr.
TREATMENT 7 20.21165 2.88738 30.05 <.001***
Contrast 1
With Endosperm, mycorrhizal, 0 dS/M
EC Vs With Endosperm, Mycorrhizal,
4.9 dS/M EC 1 5.85932 5.85932 60.98 <.001***
Contrast 2
With Endosperm, mycorrhizal, 0 dS/M
EC Vs With Endosperm, non-
Mycorrhizal, 0 dS/M EC 1 3.13188 3.13188 32.59 <.001***
Contrast 3
With Endosperm, mycorrhizal, 0 dS/M
EC Vs With Endosperm, non-
Mycorrhizal, 4.9 dS/M EC 1 7.27044 7.27044 75.66 <.001***
Contrast 4
With Endosperm, mycorrhizal, 0 dS/M
EC Vs Without Endosperm,
Mycorrhizal, 0 dS/M EC 1 0.0589 0.0589 0.32 0.574NS
Contrast 5
With Endosperm, mycorrhizal, 0 dS/M
EC Vs Without Endosperm,
Mycorrhizal, 4.9 dS/M EC 1 8.45941 8.45941 88.04 <.001***
Contrast 6
With Endosperm, mycorrhizal, 0 dS/M
EC Vs Without Endosperm, non-
Mycorrhizal, 0 dS/M EC 1 10.68722 10.68722 111.22 <.001***
Contrast 7
With Endosperm, mycorrhizal, 0 dS/M
EC Vs Without Endosperm, non-
Mycorrhizal, 4.9 dS/M EC 1 15.44707 15.44707 160.76 <.001***
Contrast 8
With Endosperm, mycorrhizal, 4.9 dS/M
EC Vs With Endosperm, non-
Mycorrhizal, 0 dS/M EC 1 0.1682 0.1682 0.88 0.356NS
Contrast 9
With Endosperm, mycorrhizal, 4.9 dS/M
EC Vs With Endosperm, non-
Mycorrhizal, 4.9 dS/M EC 1 1.4792 1.4792 16.42 <.001***
Contrast 10
With Endosperm, mycorrhizal, 4.9 dS/M
EC Vs Without Endosperm,
Mycorrhizal, 0 dS/M EC 1 0.57192 0.57192 5.95 0.022***
Contrast 11
With Endosperm, non-mycorrhizal, 4.9
dS/M EC Vs Without Endosperm,
Mycorrhizal, 4.9 dS/M EC 1 0.23805 0.23805 2.48 0.129NS
Contrast 12
With Endosperm, mycorrhizal, 4.9 dS/M
EC Vs Without Endosperm, non-
Mycorrhizal, 0 dS/M EC 1 1.0658 1.0658 5.61 0.026NS
Contrast 13
With Endosperm, mycorrhizal, 4.9 dS/M
EC Vs Without Endosperm, non-
Mycorrhizal, 4.9 dS/M EC 1 2.27911 2.27911 23.72 <.001***
Contrast 14
With Endosperm, non-mycorrhizal, 0
dS/M EC Vs With Endosperm, non-
Mycorrhizal, 4.9 dS/M EC 1 0.85871 0.85871 8.94 0.006***
Contrast 15
With Endosperm, non-mycorrhizal, 0
dS/M EC Vs Without Endosperm,
Mycorrhizal, 0 dS/M EC 1 0.0111 0.0111 0.12 0.737NS
Contrast 16
With Endosperm, non-mycorrhizal, 0
dS/M EC Vs Without Endosperm,
Mycorrhizal, 4.9 dS/M EC 1 0.5202 0.5202 2.74 0.111NS
Contrast 17
With Endosperm, non-mycorrhizal, 0
dS/M EC Vs Without Endosperm, non-
Mycorrhizal, 0 dS/M EC 1 2.24826 2.24826 23.4 <.001***
Contrast 18
With Endosperm, non-mycorrhizal, 0
dS/M EC Vs Without Endosperm, non-
Mycorrhizal, 4.9 dS/M EC 1 4.66804 4.66804 48.58 <.001***
Page 176
152
Contrast 19
With Endosperm, non-mycorrhizal, 4.9
dS/M EC Vs Without Endosperm,
Mycorrhizal, 0 dS/M EC 1 1.06507 1.06507 11.08 0.003***
Contrast 20
With Endosperm, non-mycorrhizal, 4.9
dS/M EC Vs Without Endosperm,
Mycorrhizal, 4.9 dS/M EC 1 0.045 0.045 0.47 0.5NS
Contrast 21
With Endosperm, non-mycorrhizal, 4.9
dS/M EC Vs Without Endosperm, non
Mycorrhizal, 0 dS/M EC 1 0.32805 0.32805 3.41 0.077***
Contrast 22
With Endosperm, non-mycorrhizal, 4.9
dS/M EC Vs Without Endosperm, non
Mycorrhizal, 4.9 dS/M EC 1 1.52251 1.52251 15.84 <.001***
Contrast 23
Without Endosperm, mycorrhizal, 0
dS/M EC Vs Without Endosperm,
Mycorrhizal, 4.9 dS/M EC 1 1.54792 1.54792 16.11 <.001***
Contrast 24
Without Endosperm, mycorrhizal, 0
dS/M EC Vs With Endosperm, non-
Mycorrhizal, 0 dS/M EC 1 2.57532 2.57532 26.8 <.001***
Contrast 25
Without Endosperm, mycorrhizal, 0
dS/M EC Vs With Endosperm, non-
Mycorrhizal, 4.9 dS/M EC 1 5.13441 5.13441 53.43 <.001***
Contrast 26
Without Endosperm, mycorrhizal, 4.9
dS/M EC Vs Without Endosperm, non-
Mycorrhizal, 0 dS/M EC 1 0.5202 0.5202 2.74 0.111NS
Contrast 27
Without Endosperm, mycorrhizal, 4.9
dS/M EC Vs Without Endosperm, non-
Mycorrhizal, 4.9 dS/M EC 1 1.04401 1.04401 10.86 0.003***
Contrast 28
Without Endosperm, non mycorrhizal, 0
dS/M EC Vs Without Endosperm, non-
Mycorrhizal, 4.9 dS/M EC 1 0.43711 0.43711 4.55 0.043***
Contrast 29
Without Endosperm, mycorrhizal, 0
dS/M EC Vs Without Endosperm, non-
Mycorrhizal, 0 dS/M EC 1 2.57532 2.57532 26.8 <.001***
Contrast 30
Without Endosperm, mycorrhizal, 0
dS/M EC Vs Without Endosperm, non-
Mycorrhizal, 4.9 dS/M EC 1 5.13441 5.13441 53.43 <.001***
Contrast 31
With Endosperm, Mycorrhizal, 4.9
dS/M EC VS Without Endosperm,
mycorrhizal, 4.9 dS/M EC 1 0.1152 0.1152 0.65 0.429NS
Residual 24 3.4772 0.1449
Total 31 30.9012
Page 177
153
Appendix XXI: Anova table for effect of arbuscular mycorrhizal
fungi and salt stress on the nitrogen content of passion fruit
seedlings
Source of variation d.f. s.s. m.s. v.r. F pr.
TREATMENT 5 1.3521 0.2704 0.91 0.498
Contrast 1
Mycorrhizal, 0 dS/m EC VS Mycorrhizal,
4.9 dS/m EC 1 0.2812 0.2812 0.94 0.344NS
Contrast 2
Mycorrhizal, 0 dS/m EC VS Mycorrhizal,
9 dS/m EC 1 0.1512 0.1512 0.51 0.485NS
Contrast 3
Mycorrhizal, 4.9 dS/m EC VS
Mycorrhizal, 9 dS/m EC 1 0.02 0.02 0.07 0.799NS
Contrast 4
Mycorrhizal, 0 dS/m EC VS Non-
mycorrhizal, 0 dS/m EC 1 0.1013 0.1013 0.34 0.567NS
Contrast 5
Mycorrhizal, 0 dS/m EC VS Non-
mycorrhizal, 4.9 dS/m EC 1 0.4513 0.4513 1.51 0.234NS
Contrast 6
Mycorrhizal, 0 dS/m EC VS Non-
mycorrhizal, 9 dS/m EC 1 0.1512 0.1512 0.51 0.485NS
Contrast 7
Mycorrhizal, 4.9 dS/m EC VS Non-
mycorrhizal, 0 dS/m EC 1 0.72 0.72 2.41 0.138NS
Contrast 8
Mycorrhizal, 4.9 dS/m EC VS Non-
mycorrhizal, 4.9 dS/m EC 1 0.02 0.02 0.07 0.799NS
Contrast 9
Mycorrhizal, 4.9 dS/m EC VS Non-
mycorrhizal, 9 dS/m EC 1 0.02 0.02 0.07 0.799NS
Contrast 10
Mycorrhizal, 9 dS/m EC VS Non-
mycorrhizal, 0 dS/m EC 1 0.5 0.5 1.68 0.212NS
Contrast 11
Mycorrhizal, 9 dS/m EC VS Non-
mycorrhizal, 4.9 dS/m EC 1 0.08 0.08 0.27 0.611NS
Contrast 12
Mycorrhizal, 9 dS/m EC VS Non-
mycorrhizal, 9 dS/m EC 1 0 0 0 1NS
Contrast 13
Non-Mycorrhizal, 0 dS/m EC VS Non-
mycorrhizal, 4.9 dS/m EC 1 0.98 0.98 3.29 0.087NS
Contrast 14
Non-Mycorrhizal, 0 dS/m EC VS Non-
mycorrhizal, 9 dS/m EC 1 0.5 0.5 1.68 0.212NS
Contrast 15
Non-Mycorrhizal, 4.9 dS/m EC VS Non-
mycorrhizal, 9 dS/m EC 1 0.08 0.08 0.27 0.611NS
Residual 18 5.3675 0.2982
Total 23 6.7196
Page 178
154
AppendixXXI: Anova table for effect of arbuscular mycorrhizal fungi and salt
stress on the phosphorus content of passion fruit seedlings
Source of variation d.f. s.s. m.s. v.r. F pr.
TREATMENT 5 3.2333 0.6467 25.3 <.001
Contrast 1
Mycorrhizal, 0 dS/m EC VS
Mycorrhizal, 4.9 dS/m EC 1 0.08 0.08 3.13 0.094NS
Contrast 2
Mycorrhizal, 0 dS/m EC VS
Mycorrhizal, 9 dS/m EC 1 0.08 0.08 3.13 0.094NS
Contrast 3
Mycorrhizal, 4.9 dS/m EC VS
Mycorrhizal, 9 dS/m EC 1 0 0 0 1NS
Contrast 4
Mycorrhizal, 0 dS/m EC VS Non-
mycorrhizal, 0 dS/m EC 1 0.32 0.32 12.52 0.002***
Contrast 5
Mycorrhizal, 0 dS/m EC VS Non-
mycorrhizal, 4.9 dS/m EC 1 0.72 0.72 28.17 <.001***
Contrast 6
Mycorrhizal, 0 dS/m EC VS Non-
mycorrhizal, 9 dS/m EC 1 0.98 0.98 38.35 <.001***
Contrast 7
Mycorrhizal, 4.9 dS/m EC VS Non-
mycorrhizal, 0 dS/m EC 1 0.72 0.72 28.17 <.001***
Contrast 8
Mycorrhizal, 4.9 dS/m EC VS Non-
mycorrhizal, 4.9 dS/m EC 1 1.28 1.28 50.09 <.001***
Contrast 9
Mycorrhizal, 4.9 dS/m EC VS Non-
mycorrhizal, 9 dS/m EC 1 1.62 1.62 63.39 <.001***
Contrast 10
Mycorrhizal, 9 dS/m EC VS Non-
mycorrhizal, 0 dS/m EC 1 0.72 0.72 28.17 <.001***
Contrast 11
Mycorrhizal, 9 dS/m EC VS Non-
mycorrhizal, 4.9 dS/m EC 1 1.28 1.28 50.09 <.001***
Contrast 12
Mycorrhizal, 9 dS/m EC VS Non-
mycorrhizal, 9 dS/m EC 1 1.62 1.62 63.39 <.001***
Contrast 13
Non-Mycorrhizal, 0 dS/m EC VS Non-
mycorrhizal, 4.9 dS/m EC 1 0.08 0.08 3.13 0.094NS
Contrast 14
Non-Mycorrhizal, 0 dS/m EC VS Non-
mycorrhizal, 9 dS/m EC 1 0.18 0.18 7.04 0.016**
Contrast 15
Non-Mycorrhizal, 4.9 dS/m EC VS
Non-mycorrhizal, 9 dS/m EC 1 0.02 0.02 0.78 0.388NS
Residual 18 0.46 0.0256
Total 23 3.6933
Page 179
155
Appendix XXII: Anova table for effect of arbuscular mycorrhizal
fungi and salt stress on the potassium content of passion fruit
seedlings
Source of variation d.f. s.s. m.s. v.r. F pr.
TREATMENT 5 372.27 74.455 27.41 <.001
Contrast 1
Mycorrhizal, 0 dS/m EC VS Mycorrhizal,
4.9 dS/m EC 1 36.98 36.98 13.61 0.002***
Contrast 2
Mycorrhizal, 0 dS/m EC VS Mycorrhizal,
9 dS/m EC 1 76.88 76.88 28.3 <.001***
Contrast 3
Mycorrhizal, 4.9 dS/m EC VS
Mycorrhizal, 9 dS/m EC 1 7.22 7.22 2.66 0.12NS
Contrast 4
Mycorrhizal, 0 dS/m EC VS Non-
mycorrhizal, 0 dS/m EC 1 0.02 0.02 0.01 0.933NS
Contrast 5
Mycorrhizal, 0 dS/m EC VS Non-
mycorrhizal, 4.9 dS/m EC 1 27.38 27.38 10.08 0.005**
Contrast 6
Mycorrhizal, 0 dS/m EC VS Non-
mycorrhizal, 9 dS/m EC 1 46.08 46.08 16.96 <.001***
Contrast 7
Mycorrhizal, 4.9 dS/m EC VS Non-
mycorrhizal, 0 dS/m EC 1 38.72 38.72 14.25 0.001***
Contrast 8
Mycorrhizal, 4.9 dS/m EC VS Non-
mycorrhizal, 4.9 dS/m EC 1 128 128 47.12 <.001***
Contrast 9
Mycorrhizal, 4.9 dS/m EC VS Non-
mycorrhizal, 9 dS/m EC 1 165.62 165.62 60.96 <.001***
Contrast 10
Mycorrhizal, 9 dS/m EC VS Non-
mycorrhizal, 0 dS/m EC 1 79.38 79.38 29.22 <.001***
Contrast 11
Mycorrhizal, 9 dS/m EC VS Non-
mycorrhizal, 4.9 dS/m EC 1 196.02 196.02 72.15 <.001***
Contrast 12
Mycorrhizal, 9 dS/m EC VS Non-
mycorrhizal, 9 dS/m EC 1 242 242 89.08 <.001***
Contrast 13
Non-Mycorrhizal, 0 dS/m EC VS Non-
mycorrhizal, 4.9 dS/m EC 1 25.92 25.92 9.54 0.006**
Contrast 14
Non-Mycorrhizal, 0 dS/m EC VS Non-
mycorrhizal, 9 dS/m EC 1 44.18 44.18 16.26 <.001***
Contrast 15
Non-Mycorrhizal, 4.9 dS/m EC VS Non-
mycorrhizal, 9 dS/m EC 1 2.42 2.42 0.89 0.358NS
Residual 18 48.9 2.717
Total 23 421.17
Page 180
156
Appendix XXIII: Anova table for effect of arbuscular mycorrhizal
fungi and salt stress on the calcium content of passion fruit seedlings
Source of variation d.f. s.s. m.s. v.r. F pr.
TREATMENT 5 0.7733 0.1547 0.66 0.661
Contrast 1
Mycorrhizal, 0 dS/m EC VS Mycorrhizal, 4.9
dS/m EC 1 0.32 0.32 1.36 0.259NS
Contrast 2
Mycorrhizal, 0 dS/m EC VS Mycorrhizal, 9
dS/m EC 1 0.5 0.5 2.12 0.162NS
Contrast 3
Mycorrhizal, 4.9 dS/m EC VS Mycorrhizal, 9
dS/m EC 1 0.02 0.02 0.08 0.774NS
Contrast 4
Mycorrhizal, 0 dS/m EC VS Non-
mycorrhizal, 0 dS/m EC 1 0.02 0.02 0.08 0.774NS
Contrast 5
Mycorrhizal, 0 dS/m EC VS Non-
mycorrhizal, 4.9 dS/m EC 1 0.18 0.18 0.76 0.394NS
Contrast 6
Mycorrhizal, 0 dS/m EC VS Non-
mycorrhizal, 9 dS/m EC 1 0.02 0.02 0.08 0.774NS
Contrast 7
Mycorrhizal, 4.9 dS/m EC VS Non-
mycorrhizal, 0 dS/m EC 1 0.18 0.18 0.76 0.394NS
Contrast 8
Mycorrhizal, 4.9 dS/m EC VS Non-
mycorrhizal, 4.9 dS/m EC 1 0.02 0.02 0.08 0.774NS
Contrast 9
Mycorrhizal, 4.9 dS/m EC VS Non-
mycorrhizal, 9 dS/m EC 1 0.18 0.18 0.76 0.394NS
Contrast 10
Mycorrhizal, 9 dS/m EC VS Non-
mycorrhizal, 0 dS/m EC 1 0.32 0.32 1.36 0.259NS
Contrast 11
Mycorrhizal, 9 dS/m EC VS Non-
mycorrhizal, 4.9 dS/m EC 1 0.08 0.08 0.34 0.567NS
Contrast 12
Mycorrhizal, 9 dS/m EC VS Non-
mycorrhizal, 9 dS/m EC 1 0.32 0.32 1.36 0.259NS
Contrast 13
Non-Mycorrhizal, 0 dS/m EC VS Non-
mycorrhizal, 4.9 dS/m EC 1 0.08 0.08 0.34 0.567NS
Contrast 14
Non-Mycorrhizal, 0 dS/m EC VS Non-
mycorrhizal, 9 dS/m EC 1 0 0 0 1NS
Contrast 15
Non-Mycorrhizal, 4.9 dS/m EC VS Non-
mycorrhizal, 9 dS/m EC 1 0.08 0.08 0.34 0.567NS
Residual 18 4.24 0.2356
Total 23 5.0133
Page 181
157
Appendix XXIV: Anova table for effect of arbuscular mycorrhizal fungi and salt
stress on the magnesium content of passion fruit seedlings
Source of variation d.f. s.s. m.s. v.r. F pr.
TREATMENT 5 12.273 2.4547 10.18 <.001
Contrast 1
Mycorrhizal, 0 dS/m EC VS Mycorrhizal, 4.9
dS/m EC 1 0.98 0.98 4.06 0.059NS
Contrast 2
Mycorrhizal, 0 dS/m EC VS Mycorrhizal, 9
dS/m EC 1 5.78 5.78 23.97 <.001***
Contrast 3
Mycorrhizal, 4.9 dS/m EC VS Mycorrhizal, 9
dS/m EC 1 2 2 8.29 0.01**
Contrast 4
Mycorrhizal, 0 dS/m EC VS Non-
mycorrhizal, 0 dS/m EC 1 0.18 0.18 0.75 0.399NS
Contrast 5
Mycorrhizal, 0 dS/m EC VS Non-
mycorrhizal, 4.9 dS/m EC 1 1.28 1.28 5.31 0.033*
Contrast 6
Mycorrhizal, 0 dS/m EC VS Non-
mycorrhizal, 9 dS/m EC 1 8 8 33.18 <.001***
Contrast 7
Mycorrhizal, 4.9 dS/m EC VS Non-
mycorrhizal, 0 dS/m EC 1 0.32 0.32 1.33 0.264NS
Contrast 8
Mycorrhizal, 4.9 dS/m EC VS Non-
mycorrhizal, 4.9 dS/m EC 1 0.02 0.02 0.08 0.777NS
Contrast 9
Mycorrhizal, 4.9 dS/m EC VS Non-
mycorrhizal, 9 dS/m EC 1 3.38 3.38 14.02 0.001***
Contrast 10
Mycorrhizal, 9 dS/m EC VS Non-
mycorrhizal, 0 dS/m EC 1 3.92 3.92 16.26 <.001***
Contrast 11
Mycorrhizal, 9 dS/m EC VS Non-
mycorrhizal, 4.9 dS/m EC 1 1.62 1.62 6.72 0.018**
Contrast 12
Mycorrhizal, 9 dS/m EC VS Non-
mycorrhizal, 9 dS/m EC 1 0.18 0.18 0.75 0.399NS
Contrast 13
Non-Mycorrhizal, 0 dS/m EC VS Non-
mycorrhizal, 4.9 dS/m EC 1 0.5 0.5 2.07 0.167NS
Contrast 14
Non-Mycorrhizal, 0 dS/m EC VS Non-
mycorrhizal, 9 dS/m EC 1 5.78 5.78 23.97 <.001***
Contrast 15
Non-Mycorrhizal, 4.9 dS/m EC VS Non-
mycorrhizal, 9 dS/m EC 1 2.88 2.88 11.94 0.003**
Residual 18 4.34 0.2411
Total 23 16.613
Page 182
158
Appendix XXV ANOVA table for effect of Arbuscular Mycorrhizal
Fungi and salt stress on the Sodium content of Passion fruit seedlings
Source of variation d.f. s.s. m.s. v.r. F pr.
TREATMENT 5 237.25 47.451 54.4 <.001
Contrast 1
Mycorrhizal, 0 dS/m EC VS Mycorrhizal, 4.9
dS/m EC 1 18 18 20.64 <.001***
Contrast 2
Mycorrhizal, 0 dS/m EC VS Mycorrhizal, 9
dS/m EC 1 76.88 76.88 88.14 <.001***
Contrast 3
Mycorrhizal, 4.9 dS/m EC VS Mycorrhizal, 9
dS/m EC 1 20.48 20.48 23.48 <.001***
Contrast 4
Mycorrhizal, 0 dS/m EC VS Non-mycorrhizal,
0 dS/m EC 1 0.08 0.08 0.09 0.765NS
Contrast 5
Mycorrhizal, 0 dS/m EC VS Non-mycorrhizal,
4.9 dS/m EC 1 84.5 84.5 96.88 <.001***
Contrast 6
Mycorrhizal, 0 dS/m EC VS Non-mycorrhizal,
9 dS/m EC 1 118.58 118.58 135.95 <.001***
Contrast 7
Mycorrhizal, 4.9 dS/m EC VS Non-mycorrhizal,
0 dS/m EC 1 20.48 20.48 23.48 <.001***
Contrast 8
Mycorrhizal, 4.9 dS/m EC VS Non-mycorrhizal,
4.9 dS/m EC 1 24.5 24.5 28.09 <.001***
Contrast 9
Mycorrhizal, 4.9 dS/m EC VS Non-mycorrhizal,
9 dS/m EC 1 44.18 44.18 50.65 <.001***
Contrast 10
Mycorrhizal, 9 dS/m EC VS Non-mycorrhizal,
0 dS/m EC 1 81.92 81.92 93.92 <.001***
Contrast 11
Mycorrhizal, 9 dS/m EC VS Non-mycorrhizal,
4.9 dS/m EC 1 0.18 0.18 0.21 0.655NS
Contrast 12
Mycorrhizal, 9 dS/m EC VS Non-mycorrhizal,
9 dS/m EC 1 4.5 4.5 5.16 0.036NS
Contrast 13
Non-Mycorrhizal, 0 dS/m EC VS Non-
mycorrhizal, 4.9 dS/m EC 1 89.78 89.78 102.93 <.001***
Contrast 14
Non-Mycorrhizal, 0 dS/m EC VS Non-
mycorrhizal, 9 dS/m EC 1 124.82 124.82 143.11 <.001***
Contrast 15
Non-Mycorrhizal, 4.9 dS/m EC VS Non-
mycorrhizal, 9 dS/m EC 1 2.88 2.88 3.3 0.086NS
Residual 18 15.7 0.8722
Total 23 252.95
Page 183
159
Appendix XXVI: Anova table for effect of arbuscular mycorrhizal
fungi, endosperm attachment and salt stress on the nitrogen content of
mango seedlings
Source of variation d.f. s.s. m.s. v.r. F pr.
TREATMENT 7 0.744 0.1063 0.67 0.693NS
Contrast 1
With Endosperm, mycorrhizal, 0 dS/M EC
Vs With Endosperm, Mycorrhizal, 4.9 dS/M
EC 1 0.1682 0.1682 1.06 0.313NS
Contrast 2
With Endosperm, mycorrhizal, 0 dS/M EC
Vs With Endosperm, non- Mycorrhizal, 0
dS/M EC 1 0.0578 0.0578 0.37 0.551NS
Contrast 3
With Endosperm, mycorrhizal, 0 dS/M EC
Vs With Endosperm, non- Mycorrhizal, 4.9
dS/M EC 1 0.0018 0.0018 0.01 0.916NS
Contrast 4
With Endosperm, mycorrhizal, 0 dS/M EC
Vs Without Endosperm, Mycorrhizal, 0
dS/M EC 1 0.005 0.005 0.03 0.86NS
Contrast 5
With Endosperm, mycorrhizal, 0 dS/M EC
Vs Without Endosperm, Mycorrhizal, 4.9
dS/M EC 1 0.0648 0.0648 0.41 0.528NS
Contrast 6
With Endosperm, mycorrhizal, 0 dS/M EC
Vs Without Endosperm, non- Mycorrhizal,
0 dS/M EC 1 0.02 0.02 0.13 0.725NS
Contrast 7
With Endosperm, mycorrhizal, 0 dS/M EC
Vs Without Endosperm, non- Mycorrhizal,
4.9 dS/M EC 1 0.08 0.08 0.51 0.484NS
Contrast 8
With Endosperm, mycorrhizal, 4.9 dS/M EC
Vs With Endosperm, non- Mycorrhizal, 0
dS/M EC 1 0.4232 0.4232 2.68 0.115NS
Contrast 9
With Endosperm, mycorrhizal, 4.9 dS/M EC
Vs With Endosperm, non- Mycorrhizal, 4.9
dS/M EC 1 0.2048 0.2048 1.3 0.266NS
Contrast 10
With Endosperm, mycorrhizal, 4.9 dS/M EC
Vs Without Endosperm, Mycorrhizal, 0
dS/M EC 1 0.2312 0.2312 1.46 0.238NS
Contrast 11
With Endosperm, non-mycorrhizal, 4.9
dS/M EC Vs Without Endosperm,
Mycorrhizal, 4.9 dS/M EC 1 0.0242 0.0242 0.15 0.699NS
Contrast 12
With Endosperm, mycorrhizal, 4.9 dS/M EC
Vs Without Endosperm, non-Mycorrhizal, 0
dS/M EC 1 0.3042 0.3042 1.92 0.178NS
Contrast 13
With Endosperm, mycorrhizal, 4.9 dS/M EC
Vs Without Endosperm, non-Mycorrhizal,
4.9 dS/M EC 1 0.0162 0.0162 0.1 0.752NS
Contrast 14
With Endosperm, non-mycorrhizal, 0 dS/M
EC Vs With Endosperm, non- Mycorrhizal,
4.9 dS/M EC 1 0.0392 0.0392 0.25 0.623NS
Contrast 15
With Endosperm, non-mycorrhizal, 0 dS/M
EC Vs Without Endosperm, Mycorrhizal, 0
dS/M EC 1 0.0288 0.0288 0.18 0.673NS
Contrast 16
With Endosperm, non-mycorrhizal, 0 dS/M
EC Vs Without Endosperm, Mycorrhizal,
4.9 dS/M EC 1 0.245 0.245 1.55 0.225NS
Contrast 17
With Endosperm, non-mycorrhizal, 0 dS/M
EC Vs Without Endosperm, non-
Mycorrhizal, 0 dS/M EC 1 0.0098 0.0098 0.06 0.806NS
Contrast 18
With Endosperm, non-mycorrhizal, 0 dS/M
EC Vs Without Endosperm, non-
Mycorrhizal, 4.9 dS/M EC 1 0.2738 0.2738 1.73 0.201NS
Page 184
160
Contrast 19
With Endosperm, non-mycorrhizal, 4.9
dS/M EC Vs Without Endosperm,
Mycorrhizal, 0 dS/M EC 1 0.0008 0.0008 0.01 0.944NS
Contrast 20
With Endosperm, non-mycorrhizal, 4.9
dS/M EC Vs Without Endosperm,
Mycorrhizal, 4.9 dS/M EC 1 0.0882 0.0882 0.56 0.462NS
Contrast 21
With Endosperm, non-mycorrhizal, 4.9
dS/M EC Vs Without Endosperm, non
Mycorrhizal, 0 dS/M EC 1 0.0098 0.0098 0.06 0.806NS
Contrast 22
With Endosperm, non-mycorrhizal, 4.9
dS/M EC Vs Without Endosperm, non
Mycorrhizal, 4.9 dS/M EC 1 0.1058 0.1058 0.67 0.421NS
Contrast 23
Without Endosperm, mycorrhizal, 0 dS/M
EC Vs Without Endosperm, Mycorrhizal,
4.9 dS/M EC 1 0.1058 0.1058 0.67 0.421NS
Contrast 24
Without Endosperm, mycorrhizal, 0 dS/M
EC Vs With Endosperm, non-Mycorrhizal,
0 dS/M EC 1 0.005 0.005 0.03 0.86NS
Contrast 25
Without Endosperm, mycorrhizal, 0 dS/M
EC Vs With Endosperm, non-Mycorrhizal,
4.9 dS/M EC 1 0.125 0.125 0.79 0.383NS
Contrast 26
Without Endosperm, mycorrhizal, 4.9 dS/M
EC Vs Without Endosperm, non-
Mycorrhizal, 0 dS/M EC 1 0.1568 0.1568 0.99 0.329NS
Contrast 27
Without Endosperm, mycorrhizal, 4.9 dS/M
EC Vs Without Endosperm, non-
Mycorrhizal, 4.9 dS/M EC 1 0.0008 0.0008 0.01 0.944NS
Residual 18 15.7 0.8722
Total 23 252.95
Page 185
161
Appendix XXVII: Anova table for effect of arbuscular
mycorrhizal fungi, endosperm attachment and salt stress on the
phosphorus content of mango seedlings
Source of variation d.f. s.s. m.s. v.r. F pr.
TREATMENT 7 19.0772 2.7253 18.78 <.001***
Contrast 1
With Endosperm, mycorrhizal, 0 dS/M EC Vs With Endosperm, Mycorrhizal, 4.9
dS/M EC 1 1.4964 1.4964 10.31 0.004***
Contrast 2
With Endosperm, mycorrhizal, 0 dS/M EC
Vs With Endosperm, non- Mycorrhizal, 0
dS/M EC 1 0.1513 0.1513 1.04 0.318NS
Contrast 3
With Endosperm, mycorrhizal, 0 dS/M EC
Vs With Endosperm, non- Mycorrhizal,
4.9 dS/M EC 1 6.09 6.09 41.96 <.001***
Contrast 4
With Endosperm, mycorrhizal, 0 dS/M EC
Vs Without Endosperm, Mycorrhizal, 0 dS/M EC 1 0.0264 0.0264 0.18 0.673NS
Contrast 5
With Endosperm, mycorrhizal, 0 dS/M EC
Vs Without Endosperm, Mycorrhizal, 4.9
dS/M EC 1 1.98 1.98 13.64 0.001***
Contrast 6
With Endosperm, mycorrhizal, 0 dS/M EC Vs Without Endosperm, non- Mycorrhizal,
0 dS/M EC 1 0.076 0.076 0.52 0.476NS
Contrast 7
With Endosperm, mycorrhizal, 0 dS/M EC
Vs Without Endosperm, non- Mycorrhizal,
4.9 dS/M EC 1 7.4884 7.4884 51.59 <.001***
Contrast 8
With Endosperm, mycorrhizal, 4.9 dS/M
EC Vs With Endosperm, non-
Mycorrhizal, 0 dS/M EC 1 2.5992 2.5992 17.91 <.001***
Contrast 9
With Endosperm, mycorrhizal, 4.9 dS/M EC Vs With Endosperm, non-
Mycorrhizal, 4.9 dS/M EC 1 1.5488 1.5488 10.67 0.003***
Contrast 10
With Endosperm, mycorrhizal, 4.9 dS/M
EC Vs Without Endosperm, Mycorrhizal,
0 dS/M EC 1 1.125 1.125 7.75 0.01**
Contrast 11
With Endosperm, non-mycorrhizal, 4.9
dS/M EC Vs Without Endosperm,
Mycorrhizal, 4.9 dS/M EC 1 0.0338 0.0338 0.23 0.634NS
Contrast 12
With Endosperm, mycorrhizal, 4.9 dS/M
EC Vs Without Endosperm, non-Mycorrhizal, 0 dS/M EC 1 0.8978 0.8978 6.19 0.02**
Contrast 13
With Endosperm, mycorrhizal, 4.9 dS/M
EC Vs Without Endosperm, non-
Mycorrhizal, 4.9 dS/M EC 1 2.2898 2.2898 15.78 <.001***
Contrast 14
With Endosperm, non-mycorrhizal, 0 dS/M EC Vs With Endosperm, non-
Mycorrhizal, 4.9 dS/M EC 1 8.1608 8.1608 56.22 <.001***
Contrast 15
With Endosperm, non-mycorrhizal, 0
dS/M EC Vs Without Endosperm,
Mycorrhizal, 0 dS/M EC 1 0.3042 0.3042 2.1 0.161NS
Contrast 16
With Endosperm, non-mycorrhizal, 0
dS/M EC Vs Without Endosperm,
Mycorrhizal, 4.9 dS/M EC 1 3.2258 3.2258 22.22 <.001***
Contrast 17
With Endosperm, non-mycorrhizal, 0
dS/M EC Vs Without Endosperm, non- Mycorrhizal, 0 dS/M EC 1 0.4418 0.4418 3.04 0.094NS
Contrast 18
With Endosperm, non-mycorrhizal, 0
dS/M EC Vs Without Endosperm, non-
Mycorrhizal, 4.9 dS/M EC 1 9.7682 9.7682 67.3 <.001***
Contrast 19
With Endosperm, non-mycorrhizal, 4.9 dS/M EC Vs Without Endosperm,
Mycorrhizal, 0 dS/M EC 1 5.3138 5.3138 36.61 <.001***
Contrast 20
With Endosperm, non-mycorrhizal, 4.9
dS/M EC Vs Without Endosperm,
Mycorrhizal, 4.9 dS/M EC 1 1.125 1.125 7.75 0.01**
Page 186
162
Contrast 21
With Endosperm, non-mycorrhizal, 4.9
dS/M EC Vs Without Endosperm, non Mycorrhizal, 0 dS/M EC 1 4.805 4.805 33.1 <.001***
Contrast 22
With Endosperm, non-mycorrhizal, 4.9
dS/M EC Vs Without Endosperm, non
Mycorrhizal, 4.9 dS/M EC 1 0.0722 0.0722 0.5 0.487NS
Contrast 23
Without Endosperm, mycorrhizal, 0 dS/M EC Vs Without Endosperm, Mycorrhizal,
4.9 dS/M EC 1 1.5488 1.5488 10.67 0.003***
Contrast 24
Without Endosperm, mycorrhizal, 0 dS/M
EC Vs With Endosperm, non-
Mycorrhizal, 0 dS/M EC 1 0.0128 0.0128 0.09 0.769NS
Contrast 25
Without Endosperm, mycorrhizal, 0 dS/M EC Vs With Endosperm, non-Mycorrhizal,
4.9 dS/M EC 1 6.6248 6.6248 45.64 <.001***
Contrast 26
Without Endosperm, mycorrhizal, 4.9
dS/M EC Vs Without Endosperm, non-
Mycorrhizal, 0 dS/M EC 1 1.28 1.28 8.82 0.007***
Contrast 27
Without Endosperm, mycorrhizal, 4.9
dS/M EC Vs Without Endosperm, non-
Mycorrhizal, 4.9 dS/M EC 1 1.7672 1.7672 12.18 0.002***
Contrast 28
Without Endosperm, non mycorrhizal, 0
dS/M EC Vs Without Endosperm, non- Mycorrhizal, 4.9 dS/M EC 1 6.0552 6.0552 41.72 <.001***
Contrast 29
Without Endosperm, mycorrhizal, 0 dS/M
EC Vs Without Endosperm, non-
Mycorrhizal, 0 dS/M EC 1 0.0128 0.0128 0.09 0.769NS
Contrast 30
Without Endosperm, mycorrhizal, 0 dS/M EC Vs Without Endosperm, non-
Mycorrhizal, 4.9 dS/M EC 1 6.6248 6.6248 45.64 <.001***
Contrast 31
With Endosperm, Mycorrhizal, 4.9 dS/M
EC VS Without Endosperm, mycorrhizal, 4.9 dS/M EC 1 1.98 1.98 13.64 0.001***
Residual 24 3.4835 0.1451
Total 31 22.5607
Page 187
163
Appendix XXVIII: ANOVA table for effect of Arbuscular Mycorrhizal Fungi,
Endosperm attachment and salt stress on the Potassium content of Mango
seedlings
Source of variation d.f s.s. m.s. v.r. F pr.
TREATMENT 7 170.6598 24.38 30.09 <.001***
Contrast 1 With Endosperm, mycorrhizal, 0 dS/M EC Vs
With Endosperm, Mycorrhizal, 4.9 dS/M EC 1 40.1408 40.1408 49.54 <.001***
Contrast 2 With Endosperm, mycorrhizal, 0 dS/M EC Vs
With Endosperm, non- Mycorrhizal, 0 dS/M EC 1 0.0882 0.0882 0.11 0.744NS
Contrast 3
With Endosperm, mycorrhizal, 0 dS/M EC Vs
With Endosperm, non- Mycorrhizal, 4.9 dS/M
EC
1 6.6978 6.6978 8.27 0.008**
Contrast 4 With Endosperm, mycorrhizal, 0 dS/M EC Vs
Without Endosperm, Mycorrhizal, 0 dS/M EC 1 0.0242 0.0242 0.03 0.864NS
Contrast 5 With Endosperm, mycorrhizal, 0 dS/M EC Vs
Without Endosperm, Mycorrhizal, 4.9 dS/M EC 1 35.1122 35.1122 43.34 <.001***
Contrast 6 With Endosperm, mycorrhizal, 0 dS/M EC Vs
Without Endosperm, non- Mycorrhizal, 0 dS/M
EC
1 0.0242 0.0242 0.03 0.864NS
Contrast 7
With Endosperm, mycorrhizal, 0 dS/M EC Vs
Without Endosperm, non- Mycorrhizal, 4.9
dS/M EC
1 9.245 9.245 11.41 0.002***
Contrast 8 With Endosperm, mycorrhizal, 4.9 dS/M EC Vs
With Endosperm, non- Mycorrhizal, 0 dS/M EC 1 36.4658 36.4658 45.01 <.001***
Contrast 9
With Endosperm, mycorrhizal, 4.9 dS/M EC Vs
With Endosperm, non- Mycorrhizal, 4.9 dS/M
EC
1 79.6322 79.6322 98.29 <.001***
Contrast 10 With Endosperm, mycorrhizal, 4.9 dS/M EC Vs
Without Endosperm, Mycorrhizal, 0 dS/M EC 1 42.1362 42.1362 52.01 <.001***
Contrast 11
With Endosperm, non-mycorrhizal, 4.9 dS/M
EC Vs Without Endosperm, Mycorrhizal, 4.9 dS/M EC
1 0.1682 0.1682 0.21 0.653NS
Contrast 12
With Endosperm, mycorrhizal, 4.9 dS/M EC Vs
Without Endosperm, non-Mycorrhizal, 0 dS/M
EC
1 38.1938 38.1938 47.14 <.001***
Contrast 13 With Endosperm, mycorrhizal, 4.9 dS/M EC Vs Without Endosperm, non-Mycorrhizal, 4.9 dS/M
EC
1 87.9138 87.9138 108.51 <.001***
Contrast 14
With Endosperm, non-mycorrhizal, 0 dS/M EC
Vs With Endosperm, non- Mycorrhizal, 4.9
dS/M EC
1 8.3232 8.3232 10.27 0.004***
Contrast 15
With Endosperm, non-mycorrhizal, 0 dS/M EC
Vs Without Endosperm, Mycorrhizal, 0 dS/M
EC
1 0.2048 0.2048 0.25 0.62NS
Contrast 16
With Endosperm, non-mycorrhizal, 0 dS/M EC
Vs Without Endosperm, Mycorrhizal, 4.9 dS/M EC
1 31.6808 31.6808 39.1 <.001***
Contrast 17
With Endosperm, non-mycorrhizal, 0 dS/M EC
Vs Without Endosperm, non- Mycorrhizal, 0
dS/M EC
1 0.02 0.02 0.02 0.876NS
Contrast 18 With Endosperm, non-mycorrhizal, 0 dS/M EC Vs Without Endosperm, non- Mycorrhizal, 4.9
dS/M EC
1 11.1392 11.1392 13.75 0.001***
Contrast 19
With Endosperm, non-mycorrhizal, 4.9 dS/M
EC Vs Without Endosperm, Mycorrhizal, 0
dS/M EC
1 5.9168 5.9168 7.3 0.012**
Contrast 20
With Endosperm, non-mycorrhizal, 4.9 dS/M
EC Vs Without Endosperm, Mycorrhizal, 4.9
dS/M EC
1 72.4808 72.4808 89.46 <.001***
Contrast 21
With Endosperm, non-mycorrhizal, 4.9 dS/M
EC Vs Without Endosperm, non Mycorrhizal, 0 dS/M EC
1 7.5272 7.5272 9.29 0.006**
Contrast 22
With Endosperm, non-mycorrhizal, 4.9 dS/M
EC Vs Without Endosperm, non Mycorrhizal,
4.9 dS/M EC
1 0.2048 0.2048 0.25 0.62NS
Contrast 23 Without Endosperm, mycorrhizal, 0 dS/M EC
Vs Without Endosperm, Mycorrhizal, 4.9 dS/M
EC
1 36.98 36.98 45.64 <.001***
Page 188
164
Contrast 24
Without Endosperm, mycorrhizal, 0 dS/M EC
Vs With Endosperm, non-Mycorrhizal, 0 dS/M EC
1 0.0968 0.0968 0.12 0.733NS
Contrast 25
Without Endosperm, mycorrhizal, 0 dS/M EC
Vs With Endosperm, non-Mycorrhizal, 4.9 dS/M
EC
1 8.3232 8.3232 10.27 0.004***
Contrast 26 Without Endosperm, mycorrhizal, 4.9 dS/M EC
Vs Without Endosperm, non- Mycorrhizal, 0
dS/M EC
1 33.2928 33.2928 41.09 <.001***
Contrast 27
Without Endosperm, mycorrhizal, 4.9 dS/M EC
Vs Without Endosperm, non- Mycorrhizal, 4.9
dS/M EC
1 80.3912 80.3912 99.22 <.001***
Contrast 28
Without Endosperm, non mycorrhizal, 0 dS/M
EC Vs Without Endosperm, non- Mycorrhizal,
4.9 dS/M EC
1 10.2152 10.2152 12.61 0.002***
Contrast 29
Without Endosperm, mycorrhizal, 0 dS/M EC
Vs Without Endosperm, non- Mycorrhizal, 0 dS/M EC
1 0.0968 0.0968 0.12 0.733NS
Contrast 30
Without Endosperm, mycorrhizal, 0 dS/M EC
Vs Without Endosperm, non- Mycorrhizal, 4.9
dS/M EC
1 8.3232 8.3232 10.27 0.004***
Contrast 31 With Endosperm, Mycorrhizal, 4.9 dS/M EC VS Without Endosperm, mycorrhizal, 4.9 dS/M EC
1 35.1122 35.1122 43.34 <.001***
Residual 24 19.4448 0.8102
Total 31 190.1046
Page 189
165
Appendix XXIX Anova table for effect of arbuscular mycorrhizal
fungi, endosperm attachment and salt stress on the calcium content
of mango seedlings
Source of variation df s.s. m.s. v.r. F pr.
TREATMENT 7 2.95635 0.42234 7.99 <.001***
Contrast 1
With Endosperm, mycorrhizal, 0 dS/M EC Vs
With Endosperm, Mycorrhizal, 4.9 dS/M EC 1 0.08 0.08 1.57 0.222
Contrast 2
With Endosperm, mycorrhizal, 0 dS/M EC Vs
With Endosperm, non- Mycorrhizal, 0 dS/M
EC 1 0.0338 0.0338 0.64 0.432NS
Contrast 3
With Endosperm, mycorrhizal, 0 dS/M EC Vs
With Endosperm, non- Mycorrhizal, 4.9 dS/M
EC 1 0.245 0.245 4.64 0.042*
Contrast 4
With Endosperm, mycorrhizal, 0 dS/M EC Vs
Without Endosperm, Mycorrhizal, 0 dS/M EC 1 0.1458 0.1458 2.76 0.11NS
Contrast 5
With Endosperm, mycorrhizal, 0 dS/M EC Vs
Without Endosperm, Mycorrhizal, 4.9 dS/M
EC 1 0.08 0.08 1.57 0.222
Contrast 6
With Endosperm, mycorrhizal, 0 dS/M EC Vs
Without Endosperm, non- Mycorrhizal, 0 dS/M EC 1 0.0288 0.0288 0.54 0.468NS
Contrast 7
With Endosperm, mycorrhizal, 0 dS/M EC Vs
Without Endosperm, non- Mycorrhizal, 4.9
dS/M EC 1 0.1682 0.1682 3.18 0.087NS
Contrast 8
With Endosperm, mycorrhizal, 4.9 dS/M EC Vs With Endosperm, non- Mycorrhizal, 0 dS/M
EC 1 0.1058 0.1058 2.64 0.117NS
Contrast 9
With Endosperm, mycorrhizal, 4.9 dS/M EC
Vs With Endosperm, non- Mycorrhizal, 4.9
dS/M EC 1 0.045 0.045 1.12 0.3NS
Contrast 10
With Endosperm, mycorrhizal, 4.9 dS/M EC
Vs Without Endosperm, Mycorrhizal, 0 dS/M
EC 1 0.0018 0.0018 0.04 0.834NS
Contrast 11
With Endosperm, non-mycorrhizal, 4.9 dS/M EC Vs Without Endosperm, Mycorrhizal, 4.9
dS/M EC 1 0.0098 0.0098 0.19 0.671NS
Contrast 12
With Endosperm, mycorrhizal, 4.9 dS/M EC
Vs Without Endosperm, non-Mycorrhizal, 0
dS/M EC 1 0.0162 0.0162 0.4 0.531NS
Contrast 13
With Endosperm, mycorrhizal, 4.9 dS/M EC
Vs Without Endosperm, non-Mycorrhizal, 4.9
dS/M EC 1 0.02 0.02 0.57 0.458
Contrast 14
With Endosperm, non-mycorrhizal, 0 dS/M EC
Vs With Endosperm, non- Mycorrhizal, 4.9 dS/M EC 1 0.0968 0.0968 1.83 0.189NS
Contrast 15
With Endosperm, non-mycorrhizal, 0 dS/M EC
Vs Without Endosperm, Mycorrhizal, 0 dS/M
EC 1 0.0392 0.0392 0.74 0.398NS
Contrast 16
With Endosperm, non-mycorrhizal, 0 dS/M EC Vs Without Endosperm, Mycorrhizal, 4.9 dS/M
EC 1 0.125 0.125 3.19 0.087
Contrast 17
With Endosperm, non-mycorrhizal, 0 dS/M EC
Vs Without Endosperm, non- Mycorrhizal, 0
dS/M EC 1 0.0002 0.0002 0 0.951NS
Contrast 18
With Endosperm, non-mycorrhizal, 0 dS/M EC
Vs Without Endosperm, non- Mycorrhizal, 4.9
dS/M EC 1 0.0512 0.0512 0.97 0.335NS
Contrast 19
With Endosperm, non-mycorrhizal, 4.9 dS/M
EC Vs Without Endosperm, Mycorrhizal, 0 dS/M EC 1 0.0128 0.0128 0.24 0.627NS
Contrast 20
With Endosperm, non-mycorrhizal, 4.9 dS/M
EC Vs Without Endosperm, Mycorrhizal, 4.9
dS/M EC 1 1.2168 1.2168 23.02 <.001***
Contrast 21
With Endosperm, non-mycorrhizal, 4.9 dS/M EC Vs Without Endosperm, non Mycorrhizal,
0 dS/M EC 1 0.1058 0.1058 2 0.17NS
Page 190
166
Contrast 22
With Endosperm, non-mycorrhizal, 4.9 dS/M
EC Vs Without Endosperm, non Mycorrhizal, 4.9 dS/M EC 1 0.0072 0.0072 0.14 0.715NS
Contrast 23
Without Endosperm, mycorrhizal, 0 dS/M EC
Vs Without Endosperm, Mycorrhizal, 4.9 dS/M
EC 1 0.98 0.98 18.54 <.001***
Contrast 24
Without Endosperm, mycorrhizal, 0 dS/M EC Vs With Endosperm, non-Mycorrhizal, 0 dS/M
EC 1 0.045 0.045 0.85 0.365NS
Contrast 25
Without Endosperm, mycorrhizal, 0 dS/M EC
Vs With Endosperm, non-Mycorrhizal, 4.9
dS/M EC 1 0.0008 0.0008 0.02 0.903NS
Contrast 26
Without Endosperm, mycorrhizal, 4.9 dS/M
EC Vs Without Endosperm, non- Mycorrhizal,
0 dS/M EC 1 0.0722 0.0722 1.84 0.187NS
Contrast 27
Without Endosperm, mycorrhizal, 4.9 dS/M
EC Vs Without Endosperm, non- Mycorrhizal, 4.9 dS/M EC 1 1.0368 1.0368 19.62 <.001***
Contrast 28
Without Endosperm, non mycorrhizal, 0 dS/M
EC Vs Without Endosperm, non- Mycorrhizal,
4.9 dS/M EC 1 0.0578 0.0578 1.09 0.306NS
Contrast 29
Without Endosperm, mycorrhizal, 0 dS/M EC Vs Without Endosperm, non- Mycorrhizal, 0
dS/M EC 1 0.045 0.045 0.85 0.365NS
Contrast 30
Without Endosperm, mycorrhizal, 0 dS/M EC
Vs Without Endosperm, non- Mycorrhizal, 4.9
dS/M EC 1 0.0008 0.0008 0.02 0.903NS
Contrast 31
With Endosperm, Mycorrhizal, 4.9 dS/M EC
VS Without Endosperm, mycorrhizal, 4.9
dS/M EC 1 0 0 0 1
Residual 24 1.2684 0.05285
Total 31 4.22475
Page 191
167
Appendix XXX: Anova table for effect of arbuscular mycorrhizal fungi,
endosperm attachment and salt stress on the magnesium content of mango
seedlings
Source of
variation d.f. s.s. m.s. v.r. F pr.
TREATMENT 7 6.3347 0.905 5.22 0.001
Contrast 1
With Endosperm, mycorrhizal, 0 dS/M EC Vs With
Endosperm, Mycorrhizal, 4.9 dS/M EC 1 0.6962 0.6962 4.01 0.057NS
Contrast 2
With Endosperm, mycorrhizal, 0 dS/M EC Vs With
Endosperm, non- Mycorrhizal, 0 dS/M EC 1 0.3698 0.3698 2.13 0.157NS
Contrast 3 With Endosperm, mycorrhizal, 0 dS/M EC Vs With Endosperm, non- Mycorrhizal, 4.9 dS/M EC 1 2.42 2.42 13.95 0.001***
Contrast 4
With Endosperm, mycorrhizal, 0 dS/M EC Vs
Without Endosperm, Mycorrhizal, 0 dS/M EC 1 0.0288 0.0288 0.17 0.687NS
Contrast 5
With Endosperm, mycorrhizal, 0 dS/M EC Vs
Without Endosperm, Mycorrhizal, 4.9 dS/M EC 1 0.3698 0.3698 2.13 0.157NS
Contrast 6
With Endosperm, mycorrhizal, 0 dS/M EC Vs
Without Endosperm, non- Mycorrhizal, 0 dS/M EC 1 0.845 0.845 4.87 0.037*
Contrast 7
With Endosperm, mycorrhizal, 0 dS/M EC Vs
Without Endosperm, non- Mycorrhizal, 4.9 dS/M
EC 1 3.125 3.125 18.01 <.001***
Contrast 8
With Endosperm, mycorrhizal, 4.9 dS/M EC Vs
With Endosperm, non- Mycorrhizal, 0 dS/M EC 1 0.0512 0.0512 0.3 0.592NS
Contrast 9
With Endosperm, mycorrhizal, 4.9 dS/M EC Vs
With Endosperm, non- Mycorrhizal, 4.9 dS/M EC 1 0.5202 0.5202 3 0.096NS
Contrast 10 With Endosperm, mycorrhizal, 4.9 dS/M EC Vs Without Endosperm, Mycorrhizal, 0 dS/M EC 1 1.0082 1.0082 5.81 0.024**
Contrast 11
With Endosperm, non-mycorrhizal, 4.9 dS/M EC
Vs Without Endosperm, Mycorrhizal, 4.9 dS/M EC 1 0.0512 0.0512 0.3 0.592NS
Contrast 12 With Endosperm, mycorrhizal, 4.9 dS/M EC Vs Without Endosperm, non-Mycorrhizal, 0 dS/M EC 1 0.0072 0.0072 0.04 0.84NS
Contrast 13
With Endosperm, mycorrhizal, 4.9 dS/M EC Vs
Without Endosperm, non-Mycorrhizal, 4.9 dS/M
EC 1 0.8712 0.8712 5.02 0.035*
Contrast 14 With Endosperm, non-mycorrhizal, 0 dS/M EC Vs With Endosperm, non- Mycorrhizal, 4.9 dS/M EC 1 0.8978 0.8978 5.18 0.032*
Contrast 15
With Endosperm, non-mycorrhizal, 0 dS/M EC Vs
Without Endosperm, Mycorrhizal, 0 dS/M EC 1 0.605 0.605 3.49 0.074NS
Contrast 16
With Endosperm, non-mycorrhizal, 0 dS/M EC Vs
Without Endosperm, Mycorrhizal, 4.9 dS/M EC 1 0 0 0 1NS
Contrast 17
With Endosperm, non-mycorrhizal, 0 dS/M EC Vs
Without Endosperm, non- Mycorrhizal, 0 dS/M EC 1 0.0968 0.0968 0.56 0.462NS
Contrast 18
With Endosperm, non-mycorrhizal, 0 dS/M EC Vs
Without Endosperm, non- Mycorrhizal, 4.9 dS/M
EC 1 1.3448 1.3448 7.75 0.01**
Contrast 19
With Endosperm, non-mycorrhizal, 4.9 dS/M EC
Vs Without Endosperm, Mycorrhizal, 0 dS/M EC 1 2.9768 2.9768 17.16 <.001***
Contrast 20
With Endosperm, non-mycorrhizal, 4.9 dS/M EC
Vs Without Endosperm, Mycorrhizal, 4.9 dS/M EC 1 0.8978 0.8978 5.18 0.032*
Contrast 21
With Endosperm, non-mycorrhizal, 4.9 dS/M EC Vs Without Endosperm, non Mycorrhizal, 0 dS/M
EC 1 0.405 0.405 2.33 0.14NS
Contrast 22
With Endosperm, non-mycorrhizal, 4.9 dS/M EC
Vs Without Endosperm, non Mycorrhizal, 4.9 dS/M
EC 1 0.045 0.045 0.26 0.615NS
Contrast 23
Without Endosperm, mycorrhizal, 0 dS/M EC Vs
Without Endosperm, Mycorrhizal, 4.9 dS/M EC 1 0.605 0.605 3.49 0.074NS
Contrast 24
Without Endosperm, mycorrhizal, 0 dS/M EC Vs
With Endosperm, non-Mycorrhizal, 0 dS/M EC 1 1.1858 1.1858 6.84 0.015**
Contrast 25 Without Endosperm, mycorrhizal, 0 dS/M EC Vs With Endosperm, non-Mycorrhizal, 4.9 dS/M EC 1 3.7538 3.7538 21.64 <.001***
Contrast 26
Without Endosperm, mycorrhizal, 4.9 dS/M EC Vs
Without Endosperm, non- Mycorrhizal, 0 dS/M EC 1 0.0968 0.0968 0.56 0.462NS
Contrast 27
Without Endosperm, mycorrhizal, 4.9 dS/M EC Vs
Without Endosperm, non- Mycorrhizal, 4.9 dS/M EC 1 1.3448 1.3448 7.75 0.01**
Page 192
168
Contrast 28
Without Endosperm, non mycorrhizal, 0 dS/M EC
Vs Without Endosperm, non- Mycorrhizal, 4.9 dS/M EC 1 0.72 0.72 4.15 0.053NS
Contrast 29
Without Endosperm, mycorrhizal, 0 dS/M EC Vs
Without Endosperm, non- Mycorrhizal, 0 dS/M EC 1 1.1858 1.1858 6.84 0.015**
Contrast 30
Without Endosperm, mycorrhizal, 0 dS/M EC Vs
Without Endosperm, non- Mycorrhizal, 4.9 dS/M EC 1 3.7538 3.7538 21.64 <.001***
Contrast 31
With Endosperm, Mycorrhizal, 4.9 dS/M EC VS
Without Endosperm, mycorrhizal, 4.9 dS/M EC 1 0.3698 0.3698 2.13 0.157NS
Residual 24 4.1636 0.1735
Total 31 10.4983
Page 193
169
Appendix XXXI: Anova table for effect of arbuscular mycorrhizal
fungi, endosperm attachment and salt stress on the sodium content of
mango seedlings
Source of
variation d.f. s.s. m.s. v.r. F pr.
TREATMENT 7 105.4862 15.0695 78.94 <.001***
Contrast 1
With Endosperm, mycorrhizal, 0 dS/M EC
Vs With Endosperm, Mycorrhizal, 4.9 dS/M
EC 1 9.68 9.68 50.71 <.001***
Contrast 2
With Endosperm, mycorrhizal, 0 dS/M EC
Vs With Endosperm, non- Mycorrhizal, 0 dS/M EC 1 0.0018 0.0018 0.01 0.923NS
Contrast 3
With Endosperm, mycorrhizal, 0 dS/M EC
Vs With Endosperm, non- Mycorrhizal, 4.9
dS/M EC 1 34.2792 34.2792 179.57 <.001***
Contrast 4
With Endosperm, mycorrhizal, 0 dS/M EC Vs Without Endosperm, Mycorrhizal, 0
dS/M EC 1 0.005 0.005 0.03 0.873NS
Contrast 5
With Endosperm, mycorrhizal, 0 dS/M EC
Vs Without Endosperm, Mycorrhizal, 4.9
dS/M EC 1 8.6528 8.6528 45.33 <.001***
Contrast 6
With Endosperm, mycorrhizal, 0 dS/M EC
Vs Without Endosperm, non- Mycorrhizal, 0
dS/M EC 1 0.0002 0.0002 0 0.974NS
Contrast 7
With Endosperm, mycorrhizal, 0 dS/M EC
Vs Without Endosperm, non- Mycorrhizal, 4.9 dS/M EC 1 42.5042 42.5042 222.65 <.001***
Contrast 8
With Endosperm, mycorrhizal, 4.9 dS/M EC
Vs With Endosperm, non- Mycorrhizal, 0
dS/M EC 1 9.4178 9.4178 49.33 <.001***
Contrast 9
With Endosperm, mycorrhizal, 4.9 dS/M EC
Vs With Endosperm, non- Mycorrhizal, 4.9
dS/M EC 1 7.5272 7.5272 39.43 <.001***
Contrast 10
With Endosperm, mycorrhizal, 4.9 dS/M EC
Vs Without Endosperm, Mycorrhizal, 0 dS/M EC 1 10.125 10.125 53.04 <.001***
Contrast 11
With Endosperm, non-mycorrhizal, 4.9
dS/M EC Vs Without Endosperm,
Mycorrhizal, 4.9 dS/M EC 1 0.0288 0.0288 0.15 0.701NS
Contrast 12
With Endosperm, mycorrhizal, 4.9 dS/M EC Vs Without Endosperm, non-Mycorrhizal, 0
dS/M EC 1 9.5922 9.5922 50.25 <.001***
Contrast 13
With Endosperm, mycorrhizal, 4.9 dS/M EC
Vs Without Endosperm, non-Mycorrhizal,
4.9 dS/M EC 1 11.6162 11.6162 60.85 <.001***
Contrast 14
With Endosperm, non-mycorrhizal, 0 dS/M
EC Vs With Endosperm, non- Mycorrhizal,
4.9 dS/M EC 1 33.7842 33.7842 176.97 <.001***
Contrast 15
With Endosperm, non-mycorrhizal, 0 dS/M
EC Vs Without Endosperm, Mycorrhizal, 0 dS/M EC 1 0.0128 0.0128 0.07 0.798NS
Contrast 16
With Endosperm, non-mycorrhizal, 0 dS/M
EC Vs Without Endosperm, Mycorrhizal, 4.9
dS/M EC 1 8.405 8.405 44.03 <.001***
Contrast 17
With Endosperm, non-mycorrhizal, 0 dS/M EC Vs Without Endosperm, non-
Mycorrhizal, 0 dS/M EC 1 0.0008 0.0008 0 0.949NS
Contrast 18
With Endosperm, non-mycorrhizal, 0 dS/M
EC Vs Without Endosperm, non-
Mycorrhizal, 4.9 dS/M EC 1 41.9528 41.9528 219.76 <.001***
Contrast 19
With Endosperm, non-mycorrhizal, 4.9
dS/M EC Vs Without Endosperm,
Mycorrhizal, 0 dS/M EC 1 35.1122 35.1122 183.93 <.001***
Contrast 20
With Endosperm, non-mycorrhizal, 4.9
dS/M EC Vs Without Endosperm, Mycorrhizal, 4.9 dS/M EC 1 8.4872 8.4872 44.46 <.001***
Page 194
170
Contrast 21
With Endosperm, non-mycorrhizal, 4.9
dS/M EC Vs Without Endosperm, non Mycorrhizal, 0 dS/M EC 1 34.1138 34.1138 178.7 <.001***
Contrast 22
With Endosperm, non-mycorrhizal, 4.9
dS/M EC Vs Without Endosperm, non
Mycorrhizal, 4.9 dS/M EC 1 0.4418 0.4418 2.31 0.141NS
Contrast 23
Without Endosperm, mycorrhizal, 0 dS/M EC Vs Without Endosperm, Mycorrhizal, 4.9
dS/M EC 1 9.0738 9.0738 47.53 <.001***
Contrast 24
Without Endosperm, mycorrhizal, 0 dS/M
EC Vs With Endosperm, non-Mycorrhizal, 0
dS/M EC 1 0.0072 0.0072 0.04 0.848NS
Contrast 25
Without Endosperm, mycorrhizal, 0 dS/M
EC Vs With Endosperm, non-Mycorrhizal,
4.9 dS/M EC 1 43.4312 43.4312 227.51 <.001***
Contrast 26
Without Endosperm, mycorrhizal, 4.9 dS/M
EC Vs Without Endosperm, non- Mycorrhizal, 0 dS/M EC 1 8.5698 8.5698 44.89 <.001***
Contrast 27
Without Endosperm, mycorrhizal, 4.9 dS/M
EC Vs Without Endosperm, non-
Mycorrhizal, 4.9 dS/M EC 1 12.8018 12.8018 67.06 <.001***
Contrast 28
Without Endosperm, non mycorrhizal, 0 dS/M EC Vs Without Endosperm, non-
Mycorrhizal, 4.9 dS/M EC 1 42.32 42.32 221.69 <.001***
Contrast 29
Without Endosperm, mycorrhizal, 0 dS/M
EC Vs Without Endosperm, non-
Mycorrhizal, 0 dS/M EC 1 0.0072 0.0072 0.04 0.848NS
Contrast 30
Without Endosperm, mycorrhizal, 0 dS/M
EC Vs Without Endosperm, non-
Mycorrhizal, 4.9 dS/M EC 1 43.4312 43.4312 227.51 <.001***
Contrast 31
With Endosperm, Mycorrhizal, 4.9 dS/M EC
VS Without Endosperm, mycorrhizal, 4.9 dS/M EC 1 8.6528 8.6528 45.33 <.001***
Residual 24 4.5816 0.1909
Total 31 110.0678
Page 195
171
Appendix XXXII: ANOVA table for effect of AM fungi and flooding on the leaf
number of passion fruit seedlings: Day 0 of flooding
Variate:
Day_0
Source of variation d.f. s.s. m.s. v.r. F pr.
TREATMENT 3 11.96 3.99 0.35 0.79NS
Contrast 1
Mycorrhizal, flooded VS Mycorrhiza
unflooded 1 0.08 0.08 0.01 0.935NS
Contrast 2
Mycorrhizal, flooded VS Non-
Mycorrhiza flooded 1 3.92 3.92 0.34 0.568NS
Contrast 3
Mycorrhizal, flooded VS Non-
Mycorrhiza unflooded 1 6.48 6.48 0.57 0.465NS
Contrast 4
Mycorrhizal, flooded VS Mycorrhiza
unflooded 1 5.12 5.12 0.45 0.515NS
Contrast 5
Mycorrhizal, unflooded VS Non-
Mycorrhiza, unflooded 1 8 8 0.7 0.418NS
Contrast 6
Non-Mycorrhizal, flooded VS Non-
Mycorrhiza unflooded 1 0.32 0.32 0.03 0.87NS
Residual 12 136.46 11.37
Total 15 148.42
Page 196
172
Appendix XXIII: ANOVA table for effect of AM fungi and flooding on the leaf
number of passion fruit seedlings: Day 7 of flooding
Variate:
Day_7
Source of variation d.f. s.s. m.s. v.r. F pr.
TREATMENT 3 11.96 3.987 1.14 0.371NS
Contrast 1
Mycorrhizal, flooded VS
Mycorrhiza unflooded 1 0.08 0.08 0.02 0.882NS
Contrast 2
Mycorrhizal, flooded VS Non-
Mycorrhiza flooded 1 3.92 3.92 1.12 0.31NS
Contrast 3
Mycorrhizal, flooded VS Non-
Mycorrhiza unflooded 1 6.48 6.48 1.86 0.198NS
Contrast 4
Mycorrhizal, flooded VS
Mycorrhiza unflooded 1 5.12 5.12 1.47 0.249NS
Contrast 5
Mycorrhizal, unflooded VS Non-
Mycorrhiza, unflooded 1 8 8 2.3 0.156NS
Contrast 6
Non-Mycorrhizal, flooded VS Non-
Mycorrhiza unflooded 1 0.32 0.32 0.09 0.767NS
Residual 12 41.82 3.485
Total 15 53.78
Page 197
173
Appendix XXIV: ANOVA table for effect of AM fungi and flooding on the leaf
number of passion fruit seedlings: Day 21 of flooding
Variate:
Day_21
Source of variation d.f. s.s. m.s. v.r. F pr.
TREATMENT 3 400.19 133.397 64.49 <.001***
Contrast 1
Mycorrhizal, flooded VS Mycorrhiza
unflooded 1 106.58 106.58 51.53 <.001***
Contrast 2
Mycorrhizal, flooded VS Non-
Mycorrhiza flooded 1 67.28 67.28 32.53 <.001***
Contrast 3
Mycorrhizal, flooded VS Non-
Mycorrhiza unflooded 1 46.08 46.08 22.28 <.001***
Contrast 4
Mycorrhizal, flooded VS Mycorrhiza
unflooded 1 343.22 343.22 165.94 <.001***
Contrast 5
Mycorrhizal, unflooded VS Non-
Mycorrhiza, unflooded 1 54.08 54.08 15.65 <0.002***
Contrast 6
Non-Mycorrhizal, flooded VS Non-
Mycorrhiza unflooded 1 224.72 224.72 108.65 <.001***
Residual 12 24.82 2.068
Total 15 425.01
Page 198
174
Appendix XXXV: ANOVA table for effect of AM fungi and flooding on the leaf
number of passion fruit seedlings: Day 28 of flooding
Variate:
Day_28
Source of variation d.f. s.s. m.s. v.r. F pr.
TREATMENT 3 587.63 195.877 54.69 <.001***
Contrast 1
Mycorrhizal, flooded VS Mycorrhiza
unflooded 1 224.72 224.72 62.74 <.001***
Contrast 2
Mycorrhizal, flooded VS Non-
Mycorrhiza flooded 1 40.5 40.5 11.31 0.006***
Contrast 3
Mycorrhizal, flooded VS Non-
Mycorrhiza unflooded 1 128 128 35.74 <.001***
Contrast 4
Mycorrhizal, flooded VS Mycorrhiza
unflooded 1 456.02 456.02 127.32 <.001***
Contrast 5
Mycorrhizal, unflooded VS Non-
Mycorrhiza, unflooded 1 25.92 25.92 7.5 <0.018**
Contrast 6
Non-Mycorrhizal, flooded VS Non-
Mycorrhiza unflooded 1 312.5 312.5 87.25 <.001***
Residual 12 42.98 3.582
Total 15 630.61
Page 199
175
Appendix XXXVI: ANOVA table for effect of AM fungi and flooding on the leaf
area (cm2) of passion fruit seedlings: Day 0 of flooding
Variate:
Day_0
d.f. s.s. m.s. v.r. F pr.
TREATMENT 3 215305 71768 44.08 <.001***
Contrast 1
Mycorrhizal, flooded VS Mycorrhiza
unflooded 1 873 873 0.54 0.478NS
Contrast 2
Mycorrhizal, flooded VS Non-
Mycorrhiza flooded 1 111969 111969 68.77 <.001***
Contrast 3
Mycorrhizal, flooded VS Non-
Mycorrhiza unflooded 1 122127 122127 75.01 <.001***
Contrast 4
Mycorrhizal, flooded VS Mycorrhiza
unflooded 1 93070 93070 57.17 <.001***
Contrast 5
Mycorrhizal, unflooded VS Non-
Mycorrhiza, unflooded 1 102351 102351 62.87 <.001***
Contrast 6
Non-Mycorrhizal, flooded VS Non-
Mycorrhiza unflooded 1 220 220 0.14 0.719NS
Residual 12 19537 1628
Total 15 234842
Page 200
176
Appendix XXXVII: ANOVA table for effect of AM fungi and flooding on the leaf
area (cm2) of passion fruit seedlings: Day 7 of flooding
Variate:
Day_7
d.f. s.s. m.s. v.r. F pr.
TREATMENT 3 198222 66074 44.63 <.001***
Contrast 1 Mycorrhizal, flooded VS
Mycorrhiza unflooded
1 12 12 0.01 0.93NS
Contrast 2 Mycorrhizal, flooded VS Non-
Mycorrhiza flooded
1 104745 104745 70.75 <.001***
Contrast 3 Mycorrhizal, flooded VS Non-
Mycorrhiza unflooded
1 95528 95528 64.52 <.001***
Contrast 4 Mycorrhizal, flooded VS
Mycorrhiza unflooded
1 102532 102532 69.25 <.001***
Contrast 5 Mycorrhizal, unflooded VS Non-
Mycorrhiza, unflooded
1 93416 93416 63.09 <.001***
Contrast 6 Non-Mycorrhizal, flooded VS Non-
Mycorrhiza unflooded
1 212 212 0.14 0.712NS
Residual 12 17767 1481
Total 15 215989
Page 201
177
Appendix XXXVIII: ANOVA table for effect of AM fungi and flooding on the leaf
area (cm2) of passion fruit seedlings: Day 14 of flooding
Variate:
Day_14
d.f. s.s. m.s. v.r. F pr.
TREATMENT 3 226797 75599 47.26 <.001***
Contrast 1
Mycorrhizal, flooded VS
Mycorrhiza unflooded 1 7276 7276 4.55 0.054NS
Contrast 2
Mycorrhizal, flooded VS Non-
Mycorrhiza flooded 1 115685 115685 72.32 <.001***
Contrast 3
Mycorrhizal, flooded VS Non-
Mycorrhiza unflooded 1 44889 44889 28.06 <.001***
Contrast 4
Mycorrhizal, flooded VS
Mycorrhiza unflooded 1 180985 180985 113.14 <.001***
Contrast 5
Mycorrhizal, unflooded VS Non-
Mycorrhiza, unflooded 1 88309 88309 55.21 <.001***
Contrast 6
Non-Mycorrhizal, flooded VS Non-
Mycorrhiza unflooded 1 16449 16449 10.28 0.008**
Residual 12 19196 1600
Total 15 245993
Page 202
178
Appendix XXXIX: ANOVA table for effect of AM fungi and flooding on the leaf
area (cm2) of passion fruit seedlings: Day 21 of flooding
Variate:
Day_21
Source of
variation d.f. s.s. m.s. v.r. F pr.
TREATMENT 3 400756 133585 88.29 <.001***
Contrast 1
Mycorrhizal, flooded VS Mycorrhiza
unflooded 1 136138 136138 89.98 <.001***
Contrast 2
Mycorrhizal, flooded VS Non-
Mycorrhiza flooded 1 64283 64283 42.49 <.001***
Contrast 3
Mycorrhizal, flooded VS Non-
Mycorrhiza unflooded 1 13239 13239 8.75 0.012**
Contrast 4
Mycorrhizal, flooded VS Mycorrhiza
unflooded 1 387517 387517 256.13 <.001***
Contrast 5
Mycorrhizal, unflooded VS Non-
Mycorrhiza, unflooded 1 64469 64469 42.61 <.001***
Contrast 6
Non-Mycorrhizal, flooded VS Non-
Mycorrhiza unflooded 1 135866 135866 89.8 <.001***
Residual 12 18156 1513
Total 15 418912
Page 203
179
Appendix XL: ANOVA table for effect of AM fungi and flooding on the leaf area
(cm2) of passion fruit seedlings: Day 28 of flooding
Variate:
Day_28
Source of
variation d.f. s.s. m.s. v.r. F pr.
TREATMENT 3 490074 163358 87.58 <.001***
Contrast 1
Mycorrhizal, flooded VS Mycorrhiza
unflooded 1 217774 217774 116.75 <.001***
Contrast 2
Mycorrhizal, flooded VS Non-
Mycorrhiza flooded 1 38442 38442 20.61 <.001***
Contrast 3
Mycorrhizal, flooded VS Non-
Mycorrhiza unflooded 1 49732 49732 26.66 <.001***
Contrast 4
Mycorrhizal, flooded VS Mycorrhiza
unflooded 1 439209 439209 235.46 <.001***
Contrast 5
Mycorrhizal, unflooded VS Non-
Mycorrhiza, unflooded 1 59368 59368 31.83 <.001***
Contrast 6
Non-Mycorrhizal, flooded VS Non-
Mycorrhiza unflooded 1 175623 175623 94.15 <.001***
Residual 12 22384 1865
Total 15 512458
Page 204
180
Appendix XLI: ANOVA table for effect of AM fungi and flooding on the leaf
Fresh Weight (grams) of passion fruit seedlings: Day 0 of flooding
Variate: Day_0
Source of variation d.f. s.s. m.s. v.r. F pr.
TREATMENT 3 110.595 36.865 31.67 <.001***
Contrast 1
Mycorrhizal, flooded VS
Mycorrhiza unflooded 1 0.029 0.029 0.02 0.878NS
Contrast 2
Mycorrhizal, flooded VS Non-
Mycorrhiza flooded 1 54.08 54.08 46.46 <.001***
Contrast 3
Mycorrhizal, flooded VS Non-
Mycorrhiza unflooded 1 58.97 58.97 50.66 <.001***
Contrast 4
Mycorrhizal, flooded VS
Mycorrhiza unflooded 1 51.613 51.613 44.34 <.001***
Contrast 5
Mycorrhizal, unflooded VS Non-
Mycorrhiza, unflooded 1 56.392 56.392 48.45 <.001***
Contrast 6
Non-Mycorrhizal, flooded VS Non-
Mycorrhiza unflooded 1 0.106 0.106 0.09 0.768NS
Residual 12 13.967 1.164
Total 15 124.562
Page 205
181
Appendix XLII: ANOVA table for effect of AM fungi and flooding on the leaf
Fresh Weight (grams) of passion fruit seedlings: Day 7 of flooding
Variate: Day_7
Source of variation d.f. s.s. m.s. v.r. F pr.
TREATMENT 3 103.138 34.379 28.89 <.001***
Contrast 1
Mycorrhizal, flooded VS Mycorrhiza
unflooded 1 0.001 0.001 0 0.98NS
Contrast 2
Mycorrhizal, flooded VS Non-
Mycorrhiza flooded 1 56.392 56.392 47.39 <.001***
Contrast 3
Mycorrhizal, flooded VS Non-
Mycorrhiza unflooded 1 46.08 46.08 38.72 <.001***
Contrast 4
Mycorrhizal, flooded VS Mycorrhiza
unflooded 1 56.818 56.818 47.74 <.001***
Contrast 5
Mycorrhizal, unflooded VS Non-
Mycorrhiza, unflooded 1 46.465 46.465 39.04 <.001***
Contrast 6
Non-Mycorrhizal, flooded VS Non-
Mycorrhiza unflooded 1 0.52 0.52 0.44 0.521NS
Residual 12 14.281 1.19 Total 15 117.419
Page 206
182
Appendix XLIII: ANOVA table for effect of AM fungi and flooding on the leaf
Fresh Weight (grams) of passion fruit seedlings: Day 14 of flooding
Variate:
Day_14
Source of variation d.f. s.s. m.s. v.r. F pr.
TREATMENT 3 173.0907 57.6969 86.77 <.001***
Contrast 1
Mycorrhizal, flooded VS Mycorrhiza
unflooded 1 0.1458 0.1458 0.22 0.648NS
Contrast 2
Mycorrhizal, flooded VS Non-
Mycorrhiza flooded 1 120.7458 120.7458 181.6 <.001***
Contrast 3
Mycorrhizal, flooded VS Non-
Mycorrhiza unflooded 1 31.205 31.205 46.93 <.001***
Contrast 4
Mycorrhizal, flooded VS Mycorrhiza
unflooded 1 129.2832 129.2832 194.44 <.001***
Contrast 5
Mycorrhizal, unflooded VS Non-
Mycorrhiza, unflooded 1 35.6168 35.6168 53.57 <.001***
Contrast 6
Non-Mycorrhizal, flooded VS Non-
Mycorrhiza unflooded 1 29.1848 29.1848 43.89 <.001***
Residual 12 7.979 0.6649
Total 15 181.0697
Page 207
183
Appendix XLIV: ANOVA table for effect of AM fungi and flooding on the leaf
Fresh Weight (grams) of passion fruit seedlings: Day 21 of flooding
Variate:
Day_21
Source of variation d.f. s.s. m.s. v.r. F pr.
TREATMENT 3 251.5556 83.8519 129.23 <.001***
Contrast 1
Mycorrhizal, flooded VS Mycorrhiza
unflooded 1 54.2882 54.2882 83.67 <.001***
Contrast 2
Mycorrhizal, flooded VS Non-
Mycorrhiza flooded 1 71.0432 71.0432 109.49 <.001***
Contrast 3
Mycorrhizal, flooded VS Non-
Mycorrhiza unflooded 1 1.9602 1.9602 3.02 0.108NS
Contrast 4
Mycorrhizal, flooded VS Mycorrhiza
unflooded 1 249.5378 249.5378 384.59 <.001***
Contrast 5
Mycorrhizal, unflooded VS Non-
Mycorrhiza, unflooded 1 76.88 76.88 118.49 <.001***
Contrast 6
Non-Mycorrhizal, flooded VS Non-
Mycorrhiza unflooded 1 49.4018 49.4018 76.14 <.001***
Residual 12 7.786 0.6488
Total 15 259.3416
Page 208
184
Appendix XLV: ANOVA table for effect of AM fungi and flooding on the leaf
Fresh Weight (grams) of passion fruit seedlings: Day 28 of flooding
Variate:
Day_28
Source of variation d.f. s.s. m.s. v.r. F pr.
TREATMENT 3 343.7811 114.5937 161.14 <.001***
Contrast 1
Mycorrhizal, flooded VS
Mycorrhiza unflooded 1 158.42 158.42 222.77 <.001***
Contrast 2
Mycorrhizal, flooded VS Non-
Mycorrhiza flooded 1 29.1848 29.1848 41.04 <.001***
Contrast 3
Mycorrhizal, flooded VS Non-
Mycorrhiza unflooded 1 0.52 0.52 0.44 0.521NS
Contrast 4
Mycorrhizal, flooded VS
Mycorrhiza unflooded 1 323.5968 323.5968 455.04 <.001***
Contrast 5
Mycorrhizal, unflooded VS Non-
Mycorrhiza, unflooded 1 77.1282 77.1282 108.46 <.001***
Contrast 6
Non-Mycorrhizal, flooded VS Non-
Mycorrhiza unflooded 1 84.7602 84.7602 119.19 <.001***
Residual 12 8.5336 0.7111
Total 15 352.3147
Page 209
185
Appendix XLVI: ANOVA table for effect of AM fungi and flooding on the root
Fresh Weight (grams) of passion fruit seedlings: Day 0 of flooding
Variate:
Day_0
Source of variation d.f. s.s. m.s. v.r. F pr.
TREATMENT 3 110.595 36.865 31.67 <.001***
Contrast 1
Mycorrhizal, flooded VS
Mycorrhiza unflooded 1 0.029 0.029 0.02 0.878NS
Contrast 2
Mycorrhizal, flooded VS Non-
Mycorrhiza flooded 1 54.08 54.08 46.46 <.001***
Contrast 3
Mycorrhizal, flooded VS Non-
Mycorrhiza unflooded 1 58.97 58.97 50.66 <.001***
Contrast 4
Mycorrhizal, flooded VS
Mycorrhiza unflooded 1 51.613 51.613 44.34 <.001***
Contrast 5
Mycorrhizal, unflooded VS Non-
Mycorrhiza, unflooded 1 56.392 56.392 48.45 <.001***
Contrast 6
Non-Mycorrhizal, flooded VS Non-
Mycorrhiza unflooded 1 0.106 0.106 0.09 0.768NS
Residual 12 13.967 1.164
Total 15 124.562
Page 210
186
Appendix XLVII: ANOVA table for effect of AM fungi and flooding on the root
Fresh Weight (grams) of passion fruit seedlings: Day 7 of flooding
Variate:
Day_7
Source of variation d.f. s.s. m.s. v.r. F pr.
TREATMENT 3 103.138 34.379 28.89 <.001***
Contrast 1
Mycorrhizal, flooded VS Mycorrhiza
unflooded 1 0.001 0.001 0 0.98NS
Contrast 2
Mycorrhizal, flooded VS Non-Mycorrhiza
flooded 1 56.392 56.392 47.39 <.001***
Contrast 3
Mycorrhizal, flooded VS Non-Mycorrhiza
unflooded 1 46.08 46.08 38.72 <.001***
Contrast 4
Mycorrhizal, flooded VS Mycorrhiza
unflooded 1 56.818 56.818 47.74 <.001***
Contrast 5
Mycorrhizal, unflooded VS Non-
Mycorrhiza, unflooded 1 46.465 46.465 39.04 <.001***
Contrast 6
Non-Mycorrhizal, flooded VS Non-
Mycorrhiza unflooded 1 0.52 0.52 0.44 0.521NS
Residual 12 14.281 1.19
Total 15 117.419
Page 211
187
Appendix XLVIII: ANOVA table for effect of AM fungi and flooding on the root
Fresh Weight (grams) of passion fruit seedlings: Day 14 of flooding
Variate: Day_14
Source of variation d.f. s.s. m.s. v.r. F pr.
TREATMENT 3 173.0907 57.6969 86.77 <.001***
Contrast 1
Mycorrhizal, flooded VS Mycorrhiza
unflooded 1 0.1458 0.1458 0.22 0.648NS
Contrast 2
Mycorrhizal, flooded VS Non-
Mycorrhiza flooded 1 120.7458 120.7458 181.6 <.001***
Contrast 3
Mycorrhizal, flooded VS Non-
Mycorrhiza unflooded 1 31.205 31.205 46.93 <.001***
Contrast 4
Mycorrhizal, flooded VS Mycorrhiza
unflooded 1 129.2832 129.2832 194.44 <.001***
Contrast 5
Mycorrhizal, unflooded VS Non-
Mycorrhiza, unflooded 1 35.6168 35.6168 53.57 <.001***
Contrast 6
Non-Mycorrhizal, flooded VS Non-
Mycorrhiza unflooded 1 29.1848 29.1848 43.89 <.001***
Residual 12 7.979 0.6649
Total 15 181.0697
Page 212
188
Appendix XLIX: ANOVA table for effect of AM fungi and flooding on the root
Fresh Weight (grams) of passion fruit seedlings: Day 21 of flooding
Variate: Day_21
Source of variation d.f. s.s. m.s. v.r. F pr.
TREATMENT 3 251.5556 83.8519 129.23 <.001***
Contrast 1
Mycorrhizal, flooded VS Mycorrhiza
unflooded 1 54.2882 54.2882 83.67 <.001***
Contrast 2
Mycorrhizal, flooded VS Non-
Mycorrhiza flooded 1 71.0432 71.0432 109.49 <.001***
Contrast 3
Mycorrhizal, flooded VS Non-
Mycorrhiza unflooded 1 1.9602 1.9602 3.02 0.108NS
Contrast 4
Mycorrhizal, flooded VS Mycorrhiza
unflooded 1 249.5378 249.5378 384.59 <.001***
Contrast 5
Mycorrhizal, unflooded VS Non-
Mycorrhiza, unflooded 1 76.88 76.88 118.49 <.001***
Contrast 6
Non-Mycorrhizal, flooded VS Non-
Mycorrhiza unflooded 1 49.4018 49.4018 76.14 <.001***
Residual 12 7.786 0.6488
Total 15 259.3416
Page 213
189
Appendix L: ANOVA table for effect of AM fungi and flooding on the root Fresh
Weight (grams) of passion fruit seedlings: Day 28 of flooding
Variate: Day_28
Source of variation d.f. s.s. m.s. v.r. F pr.
TREATMENT 3 343.7811 114.5937 161.14 <.001***
Contrast 1
Mycorrhizal, flooded VS Mycorrhiza
unflooded 1 158.42 158.42 222.77 <.001***
Contrast 2
Mycorrhizal, flooded VS Non-
Mycorrhiza flooded 1 29.1848 29.1848 41.04 <.001***
Contrast 3
Mycorrhizal, flooded VS Non-
Mycorrhiza unflooded 1 14.4722 14.4722 20.35 <.001***
Contrast 4
Mycorrhizal, flooded VS Mycorrhiza
unflooded 1 323.5968 323.5968 455.04 <.001***
Contrast 5
Mycorrhizal, unflooded VS Non-
Mycorrhiza, unflooded 1 77.1282 77.1282 108.46 <.001***
Contrast 6
Non-Mycorrhizal, flooded VS Non-
Mycorrhiza unflooded 1 84.7602 84.7602 119.19 <.001***
Residual 12 8.5336 0.7111
Total 15 352.3147
Page 214
190
Appendix LI: ANOVA table for effect of AM fungi and flooding on the root length
(cm) of passion fruit seedlings: Day 0 of flooding
Variate: Day_0
Source of
variation d.f. s.s. m.s. v.r. F pr.
TREATMENT 3 856.91 285.637 69.22 <.001***
Contrast 1
Mycorrhizal, flooded VS Mycorrhiza
unflooded 1 8.82 8.82 2.14 0.169NS
Contrast 2
Mycorrhizal, flooded VS Non-Mycorrhiza
flooded 1 343.22 343.22 83.17 <.001***
Contrast 3
Mycorrhizal, flooded VS Non-Mycorrhiza
unflooded 1 386.42 386.42 93.64 <.001***
Contrast 4
Mycorrhizal, flooded VS Mycorrhiza
unflooded 1 462.08 462.08 111.97 <.001***
Contrast 5
Mycorrhizal, unflooded VS Non-Mycorrhiza,
unflooded 1 512 512 124.07 <.001***
Contrast 6
Non-Mycorrhizal, flooded VS Non-
Mycorrhiza unflooded 1 1.28 1.28 0.31 0.588NS
Residual 12 49.52 4.127
Total 15 906.43
Page 215
191
Appendix LII: ANOVA table for effect of AM fungi and flooding on the root
length (cm) of passion fruit seedlings: Day 7 of flooding
Variate:
Day_7
Source of
variation d.f. s.s. m.s. v.r. F pr.
TREATMENT 3 783.07 261.023 91.69 <.001***
Contrast 1
Mycorrhizal, flooded VS Mycorrhiza
unflooded 1 3.38 3.38 1.19 0.297NS
Contrast 2
Mycorrhizal, flooded VS Non-
Mycorrhiza flooded 1 332.82 332.82 116.92 <.001***
Contrast 3
Mycorrhizal, flooded VS Non-
Mycorrhiza unflooded 1 375.38 375.38 131.87 <.001***
Contrast 4
Mycorrhizal, flooded VS Mycorrhiza
unflooded 1 403.28 403.28 141.67 <.001***
Contrast 5
Mycorrhizal, unflooded VS Non-
Mycorrhiza, unflooded 1 450 450 158.08 <.001***
Contrast 6
Non-Mycorrhizal, flooded VS Non-
Mycorrhiza unflooded 1 1.28 1.28 0.45 0.515NS
Residual 12 34.16 2.847
Total 15 817.23
Page 216
192
Appendix LII: ANOVA table for effect of AM fungi and flooding on the root
length (cm) of passion fruit seedlings: Day 14 of flooding
Variate:
Day_14
Source of
variation d.f. s.s. m.s. v.r. F pr.
TREATMENT 3 1159.16 386.387 95.13 <.001***
Contrast 1
Mycorrhizal, flooded VS Mycorrhiza
unflooded 1 23.12 23.12 5.69 0.034*
Contrast 2
Mycorrhizal, flooded VS Non-
Mycorrhiza flooded 1 551.12 551.12 135.69 <.001***
Contrast 3
Mycorrhizal, flooded VS Non-
Mycorrhiza unflooded 1 359.12 359.12 88.42 <.001***
Contrast 4
Mycorrhizal, flooded VS Mycorrhiza
unflooded 1 800 800 196.96 <.001***
Contrast 5
Mycorrhizal, unflooded VS Non-
Mycorrhiza, unflooded 1 564.48 564.48 138.98 <.001***
Contrast 6
Non-Mycorrhizal, flooded VS Non-
Mycorrhiza unflooded 1 20.48 20.48 5.04 0.044*
Residual 12 48.74 4.062
Total 15 1207.9
Page 217
193
Appendix LIV: ANOVA table for effect of AM fungi and flooding on the root
length (cm) of passion fruit seedlings: Day 21 of flooding
Variate:
Day_21
Source of
variation d.f. s.s. m.s. v.r. F pr.
TREATMENT 3 1159.16 386.387 95.13 <.001***
Contrast 1
Mycorrhizal, flooded VS Mycorrhiza
unflooded 1 23.12 23.12 5.69 0.034*
Contrast 2
Mycorrhizal, flooded VS Non-Mycorrhiza
flooded 1 551.12 551.12 135.69 <.001***
Contrast 3
Mycorrhizal, flooded VS Non-Mycorrhiza
unflooded 1 359.12 359.12 88.42 <.001***
Contrast 4
Mycorrhizal, flooded VS Mycorrhiza
unflooded 1 5.12 5.12 1.03 0.33NS
Contrast 5
Mycorrhizal, unflooded VS Non-
Mycorrhiza, unflooded 1 564.48 564.48 138.98 <.001***
Contrast 6
Non-Mycorrhizal, flooded VS Non-
Mycorrhiza unflooded 1 20.48 20.48 5.04 0.044*
Residual 12 48.74 4.062
Total 15 1207.9
Page 218
194
Appendix LV: ANOVA table for effect of AM fungi and flooding on the root
length (cm) of passion fruit seedlings: Day 28 of flooding
Variate:
Day_28
Source of
variation d.f. s.s. m.s. v.r. F pr.
TREATMENT 3 1714.16 571.387 115.24 <.001***
Contrast 1
Mycorrhizal, flooded VS Mycorrhiza
unflooded 1 640.82 640.82 129.24 <.001***
Contrast 2
Mycorrhizal, flooded VS Non-
Mycorrhiza flooded 1 246.42 246.42 49.7 <.001***
Contrast 3
Mycorrhizal, flooded VS Non-
Mycorrhiza unflooded 1 246.42 246.42 49.7 <.001***
Contrast 4
Mycorrhizal, flooded VS Mycorrhiza
unflooded 1 1682 1682 339.23 <.001***
Contrast 5
Mycorrhizal, unflooded VS Non-
Mycorrhiza, unflooded 1 531.38 531.38 107.17 <.001***
Contrast 6
Non-Mycorrhizal, flooded VS Non-
Mycorrhiza unflooded 1 322.58 322.58 65.06 <.001***
Residual 12 59.5 4.958
Total 15 1773.66
Page 219
195
Appendix LVI: ANOVA table for effect of AM fungi and flooding on the Leaf Dry
Weight (cm) of passion fruit seedlings: Day 0 of flooding
Variate:
Day_0
Source of variation d.f. s.s. m.s. v.r. F pr.
TREATMENT 3 4.2923 1.43077 51.47 <.001***
Contrast 1
Mycorrhizal, flooded VS Mycorrhiza
unflooded 1 0.0072 0.0072 0.26 0.62NS
Contrast 2
Mycorrhizal, flooded VS Non-Mycorrhiza
flooded 1 2.2472 2.2472 80.83 <.001***
Contrast 3
Mycorrhizal, flooded VS Non-Mycorrhiza
unflooded 1 2.2898 2.2898 82.37 <.001***
Contrast 4
Mycorrhizal, flooded VS Mycorrhiza
unflooded 1 2 2 71.94 <.001***
Contrast 5
Mycorrhizal, unflooded VS Non-
Mycorrhiza, unflooded 1 2.0402 2.0402 73.39 <.001***
Contrast 6
Non-Mycorrhizal, flooded VS Non-
Mycorrhiza unflooded 1 0.0002 0.0002 0.01 0.934NS
Residual 12 0.3336 0.0278
Total 15 4.6259
Page 220
196
Appendix LVII: ANOVA table for effect of AM fungi and flooding on the Leaf
Dry Weight (cm) of passion fruit seedlings: Day 8 of flooding
Variate:
Day_7
Source of variation d.f. s.s. m.s. v.r. F pr.
TREATMENT 3 4.6696 1.55653 65.58 <.001***
Contrast 1
Mycorrhizal, flooded VS Mycorrhiza
unflooded 1 0.0008 0.0008 0.03 0.857NS
Contrast 2
Mycorrhizal, flooded VS Non-
Mycorrhiza flooded 1 2.3762 2.3762 100.12 <.001***
Contrast 3
Mycorrhizal, flooded VS Non-
Mycorrhiza unflooded 1 2.205 2.205 92.91 <.001***
Contrast 4
Mycorrhizal, flooded VS Mycorrhiza
unflooded 1 2.4642 2.4642 103.83 <.001***
Contrast 5
Mycorrhizal, unflooded VS Non-
Mycorrhiza, unflooded 1 2.2898 2.2898 96.48 <.001***
Contrast 6
Non-Mycorrhizal, flooded VS Non-
Mycorrhiza unflooded 1 0.0032 0.0032 0.13 0.72NS
Residual 12 0.2848 0.02373
Total 15 4.9544
Page 221
197
Appendix LVIII: ANOVA table for effect of AM fungi and flooding on the Leaf
Dry Weight (cm) of passion fruit seedlings: Day 14 of flooding
Variate:
Day_14
Source of variation d.f. s.s. m.s. v.r. F pr.
TREATMENT 3 2.5083 0.8361 23.13 <.001***
Contrast 1
Mycorrhizal, flooded VS Mycorrhiza
unflooded 1 10.3968 10.3968 371.76 <.001***
Contrast 2
Mycorrhizal, flooded VS Non-
Mycorrhiza flooded 1 1.3122 1.3122 36.3 <.001***
Contrast 3
Mycorrhizal, flooded VS Non-
Mycorrhiza unflooded 1 0.405 0.405 11.2 0.006**
Contrast 4
Mycorrhizal, flooded VS Mycorrhiza
unflooded 1 2.0808 2.0808 57.56 <.001***
Contrast 5
Mycorrhizal, unflooded VS Non-
Mycorrhiza, unflooded 1 0.8712 0.8712 24.1 <.001***
Contrast 6
Non-Mycorrhizal, flooded VS Non-
Mycorrhiza unflooded 1 0.2592 0.2592 7.17 0.02**
Residual 12 0.4338 0.03615
Total 15 2.9421
Page 222
198
Appendix LIX: ANOVA table for effect of AM fungi and flooding on the Leaf Dry
Weight (cm) of passion fruit seedlings: Day 21 of flooding
Variate:
Day_21
Source of variation d.f. s.s. m.s. v.r. F pr.
TREATMENT 3 7.7099 2.56997 59.31 <.001***
Contrast 1
Mycorrhizal, flooded VS Mycorrhiza
unflooded 1 1.805 1.805 41.65 <.001***
Contrast 2
Mycorrhizal, flooded VS Non-Mycorrhiza
flooded 1 2.0402 2.0402 47.08 <.001***
Contrast 3
Mycorrhizal, flooded VS Non-Mycorrhiza
unflooded 1 10.3968 10.3968 371.76 <.001***
Contrast 4
Mycorrhizal, flooded VS Mycorrhiza
unflooded 1 7.6832 7.6832 177.3 <.001***
Contrast 5
Mycorrhizal, unflooded VS Non-
Mycorrhiza, unflooded 1 1.5488 1.5488 35.74 <.001***
Contrast 6
Non-Mycorrhizal, flooded VS Non-
Mycorrhiza unflooded 1 2.3328 2.3328 53.83 <.001***
Residual 12 0.52 0.04333
Total 15 8.2299
Page 223
199
Appendix LX: ANOVA table for effect of AM fungi and flooding on the Leaf Dry
Weight (cm) of passion fruit seedlings: Day 28 of flooding
Variate:
Day_28
Source of variation d.f. s.s. m.s. v.r. F pr.
TREATMENT 3 11.2416 3.7472 133.99 <.001***
Contrast 1
Mycorrhizal, flooded VS Mycorrhiza
unflooded 1 4.7432 4.7432 169.6 <.001***
Contrast 2
Mycorrhizal, flooded VS Non-
Mycorrhiza flooded 1 1.0952 1.0952 39.16 <.001***
Contrast 3
Mycorrhizal, flooded VS Non-
Mycorrhiza unflooded 1 0.8192 0.8192 29.29 <.001***
Contrast 4
Mycorrhizal, flooded VS Mycorrhiza
unflooded 1 10.3968 10.3968 371.76 <.001***
Contrast 5
Mycorrhizal, unflooded VS Non-
Mycorrhiza, unflooded 1 1.62 1.62 57.93 <.001***
Contrast 6
Non-Mycorrhizal, flooded VS Non-
Mycorrhiza unflooded 1 3.8088 3.8088 136.19 <.001***
Residual 12 0.3356 0.02797
Total 15 11.5772