J. Membrane Biol. 19, 141-162 (1974) by Springer-Verlag New York Inc. 1974 Ionophoric Material Derived From Eel Membrane Preparations II. Electrical Characteristics Robert Blumenthal and Adil E. Shamoo Laboratory of Theoretical Biology, National Cancer Institute, National Institutes of Health, Bethesda, Maryland 20014 and Department of Radiation Biology and Biophysics, University of Rochester, School of Medicine and Dentistry, Rochester, New York 14642 Received 29 October 1973; revised 1 July 1974 Summary. Ionophoric material isolated by tryptic digestion of (Na++ K+)-ATPase containing electroplax membranes shows fluctuating discrete current levels in oxidized cholesterol membranes with conductance amplitudes ranging from 10-I~ to 10 -9 mhos, suggesting pore formation. The rate of pore formation is dependent on the imposed voltage. If the voltage is maintained for a short time (5 to 10 sec), pore formation is reversible, whereas permanent pores are formed when the voltage is maintained for more than 10 sec. At pH =7 the permeability ratio for sodium versus chloride is 5 and for potassium versus sodium, 1.7. The permeability of the ionophoric material is dependent on pH. At pH = 6 a conversion takes place from more cation-permeable to more anion- permeable pores, suggesting that histidine plays a role in the permeation mechanism. A model is proposed to account for the observed ionophoric properties. The initial stage of the conductance change induced in oxidized cho- lesterol bilayer membranes by a one-hour tryptic digest of (Na++ K+) - ATPase containing electroplax membranes was voltage dependent (Shamoo & Albers, 1973) and showed properties similar to the properties of ala- methicin-doped bilayer membranes (Mueller & Rudin, 1968). A 24-hour tryptic digest of the electroplax preparation provided active ionophoric material in greater yield and with properties similar to those of the one- hour tryptic digest with the notable exception that with the 24-hour tryptic digest the sodium dependent incorporation character was lost (Shamoo, Myers, Blumenthal & Albers, 1974). In this paper we carry out further studies on the electrical properties of the 24-hour tryptic digest. We studied the kinetics of the voltage-depend- ent conductance change, ion selectivities and the mechanism of ion perme- ation by observing discrete fluctuations in current levels for a given voltage.
Transcript
J. Membrane Biol. 19, 141-162 (1974) �9 by Springer-Verlag New York Inc. 1974
Ionophoric Material Derived From Eel Membrane Preparations
II. Electrical Characteristics
Robert Blumenthal and Adil E. Shamoo
Laboratory of Theoretical Biology, National Cancer Institute, National Institutes of Health, Bethesda, Maryland 20014 and Department
of Radiation Biology and Biophysics, University of Rochester, School of Medicine and Dentistry, Rochester, New York 14642
Received 29 October 1973; revised 1 July 1974
Summary. Ionophoric material isolated by tryptic digestion of (Na++ K+)-ATPase containing electroplax membranes shows fluctuating discrete current levels in oxidized cholesterol membranes with conductance amplitudes ranging from 10 -I~ to 10 -9 mhos, suggesting pore formation. The rate of pore formation is dependent on the imposed voltage. If the voltage is maintained for a short time (5 to 10 sec), pore formation is reversible, whereas permanent pores are formed when the voltage is maintained for more than 10 sec. At pH =7 the permeability ratio for sodium versus chloride is 5 and for potassium versus sodium, 1.7. The permeability of the ionophoric material is dependent on pH. At pH = 6 a conversion takes place from more cation-permeable to more anion- permeable pores, suggesting that histidine plays a role in the permeation mechanism. A model is proposed to account for the observed ionophoric properties.
The initial stage of the conductance change induced in oxidized cho-
lesterol bilayer membranes by a one-hour tryptic digest of (Na++ K+) -
ATPase containing electroplax membranes was voltage dependent (Shamoo
& Albers, 1973) and showed properties similar to the properties of ala-
methicin-doped bilayer membranes (Mueller & Rudin, 1968). A 24-hour
tryptic digest of the electroplax preparation provided active ionophoric
material in greater yield and with properties similar to those of the one-
hour tryptic digest with the notable exception that with the 24-hour tryptic digest the sodium dependent incorporation character was lost (Shamoo,
Myers, Blumenthal & Albers, 1974).
In this paper we carry out further studies on the electrical properties
of the 24-hour tryptic digest. We studied the kinetics of the voltage-depend-
ent conductance change, ion selectivities and the mechanism of ion perme-
ation by observing discrete fluctuations in current levels for a given voltage.
142 R. Blumenthal and A. E. Shamoo
Previous studies with antibiot ic ionophores establ ished pore f o r m a t i o n on
the basis of discrete f luctuat ing current levels in the range of 10 - ~ to
10 -9 m h o for salt concent ra t ions in the hundred mi l l imolar range in the
case of excitabil i ty-inducing mater ia l (E IM) (Bean, Shepard, Chan & Eich-
ner, 1969; Ehrenstein, Lecar & Nossal , 1970), gramicidin (H ladky & H a y -
don, 1970) and a lamethic in ( G o r d o n & H a y d o n , 1972; Eisenberg, Hal l &
Mead, 1973). The ampl i tude of those conduc tance levels was considered
too large to be accounted for by a carr ier diffusing back and fo r th across
the m e m b r a n e . This considera t ion com bi ned with the behav io r of conduct -
ance levels as a funct ion of voltage, salt concentra t ion , solut ion viscosity
and m e m b r a n e thickness led to the conclusion tha t the above-ment ioned
ionophores induce pores in the m e m b r a n e and tha t the opening of those
pores gives rise to the conductance .
The da ta presented in this pape r on discrete current f luctuat ions, the
kinetics of vo l tage-dependent conduc tance change and ion selectivity to-
gether with the da ta presented by S h a m o o and Albers (1973), S h a m o o et al.
(1974) and S h a m o o and Myers (1974) on dose-response rela t ionships and
ol igomeriza t ion led us to establish a mode l for the conduc tance induced
by the ionophor ic mater ia l in oxidized cholesterol bi layer membranes .
Materials and Methods
We used the 24-hour tryptic digest preparation, oxidized cholesterol and apparatus described by Shamoo et al. (1974). We added to the electronic circuit a wave form/sweep generator (Data Royal Model F230A) to generate voltage pulses and ramps and a Tek- tronix oscilloscope to measure the membrane time constant. Tbe value of the membrane time constant was used to measure the membrane capacitance. Membrane thickness was derived from the capacitance, area (approximately 1 mm 2) and estimated dielectric constant (Fettiplace, Andrews & Haydon, 1971).
For the measurements of diffusion and biionic potentials a Teflon cup-hereafter referred to as inside chamber-was inserted into a plastic container--hereafter referred to as outside chamber. An outline of the top view of the outer chamber is that of two slightly overlapping equally sized circles with inner diameters equal to the outer diameter of the Teflon cup. The same solution volume of 3 ml added to the inside and outside chambers then produced equal levels of fluid in the two chambers.
The voltage source was switched to open circuit and the potential difference was measured with a Keithley electrometer. Two different procedures were applied: (1) The membranes are initially formed in a buffered solution with equal concentrations of K (or Na)C1 and subsequently small aliquots of 3 M Na (or K)NO 3 were added to one compartment. The potential was measured with Ag/AgCI electrodes. The advantage of this method is that there are no liquid junction potentials and that any initial potential difference due to asymmetry in the system can be detected from the start (Szabo, Eisen- man & Ciani, 1969). (2) The membranes are initially formed in a buffer solution and sub- sequently small aliquots of potassium and sodium chloride, nitrate, sulfate or isethionate are added to the two different compartments. Calomel electrodes were used to measure
Ionophores From Eel Membranes, II 143
the potential. Fewer points are required to obtain the relevant parameters and measure- ments can be made in complete absence of chloride ion (Latorre, Ehrenstein & Lecar, 1972).
To avoid possible contributions of the ionophore concentration ~adient to the diffusion potential, the ionophoric material was added to both solutions in those ex- periments. This is in contrast to the electrokinetic experiments (Fig. 1) where the iono- phore was added to only one side. The parameters (Pc~/P~,) and (P~/P~a) are obtained by fitting the data to Eq. (3) by means of MLAB, an interactive computer (PDP-10) modeling system developed by the Division of Computer Research and Technology at the National Institutes of Health in Bethesda, Maryland.
Results
Current- Voltage Curves
We consider a positive current to be one in which cations flow from
the inside to the outside chamber, and a positive voltage to be one where
the potential of the inside chamber is more positive than that of the outside
chamber.
When the ionophoric material is added to the inside chamber a con-
ductance increase is observed only when the volltage is positive (Shamoo &
Albers, 1973); with negative polarity a conductance increase will only be
observed at higher concentrations of the ionophoric material and after
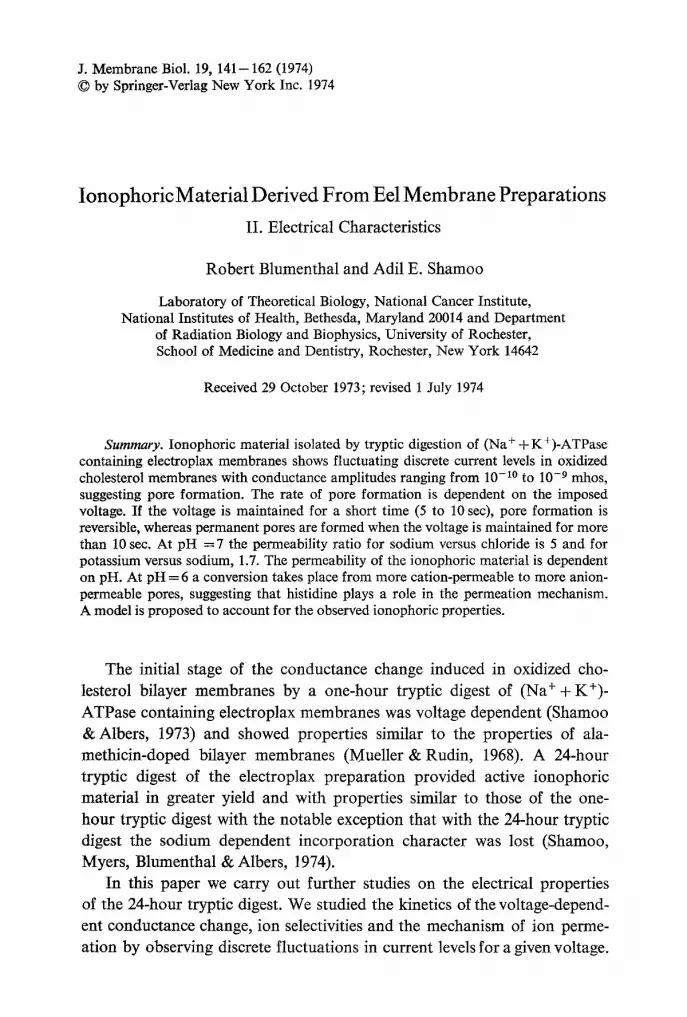
longer times. Fig. 1 a shows a typical current-votage curve measured at a
voltage sweep rate of 6.2 mV/sec. The separation of the traces in the two different directions (indicated by arrows) is due to the capacitive charging
current and is given by ic = C(dV/d t ) . Conductance below about 20 mV
is indistinguishable from that of the black lipid without additive (bare membrane conductance is 4.0 x 10 -8 mho/cm2). The tryptic digest concen-
tration in the inside chamber is 6.7 x 10 -7 g / m l . The first leg of the sweep
(starting from V = 0 going to the right in Fig. 1) is very similar to the I -V characteristic of alamethicin added to one side of a bilayer membrane (Mueller & Rudin, 1968; Eisenberg et al., 1973).
The big difference between the current-voltage characteristic of ata-
methicin and that of the tryptic digest is that in the case of the tryptic digest the conductance does not return to baseline when the voltage is returned
to zero. We see a hysteresis phenomenon: On the subsequent legs of the sweep the conductance is maintained at 10 - 9 m h o . ~ A subsequent positive sweep will increase the conductance further until a steady-state conductance
1 We shall hereafter give conductance values in mho's rather than in the conventional mho/cm 2, because we are relating conductance changes to pore formation. The conduct- ance per square centimeter can be obtained by dividing by the area of the membrane (0.01 cm2).
-0.6
o
0.6 z ~ 0.4
0.z o
I ! .~
~ -0.4
1 0 -
-0.8 '--
f 2O 40 VOLTAGE (mV)
8
o
6 o
T O v--
t O .r
• O r
E t -
ILl O Z
o c) s z 0 o
0.8
I
Fig. 1. (a) Voltage-current curve in symmetric 0.1 M NaCI with 6.7 x 10 -7 g/ml of 24-hour tryptic digest added to the inside chamber. The arrows indicate the direction of the sweep (dV/dt = 6.2 mV/sec). (b) Conductance of the first leg of the sweep in Fig. 1 a plotted on a semi-logarithmic scale to show the exponential dependence of conductance on voltage
1 I i b 0 20 40 60
VOLTAGE (mV)
Ionophores From Eel Membranes, II
a b
145
r
m
50mv
. . . - - - - -
50mv
~ 2
l lOnA 5nA
60mv 60mv
f
65my 70mv
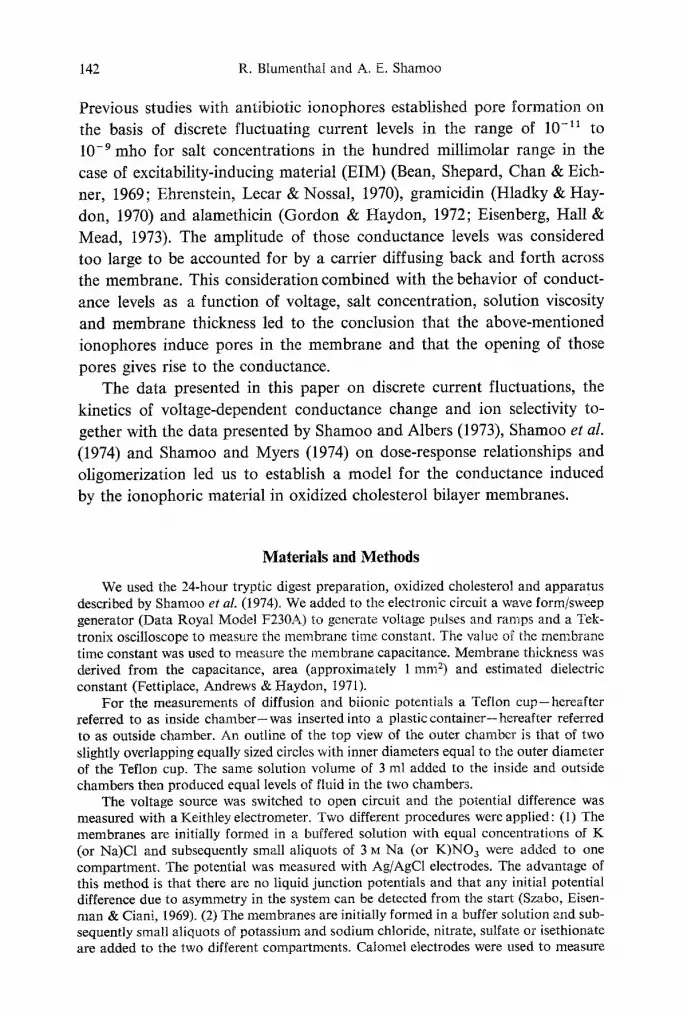
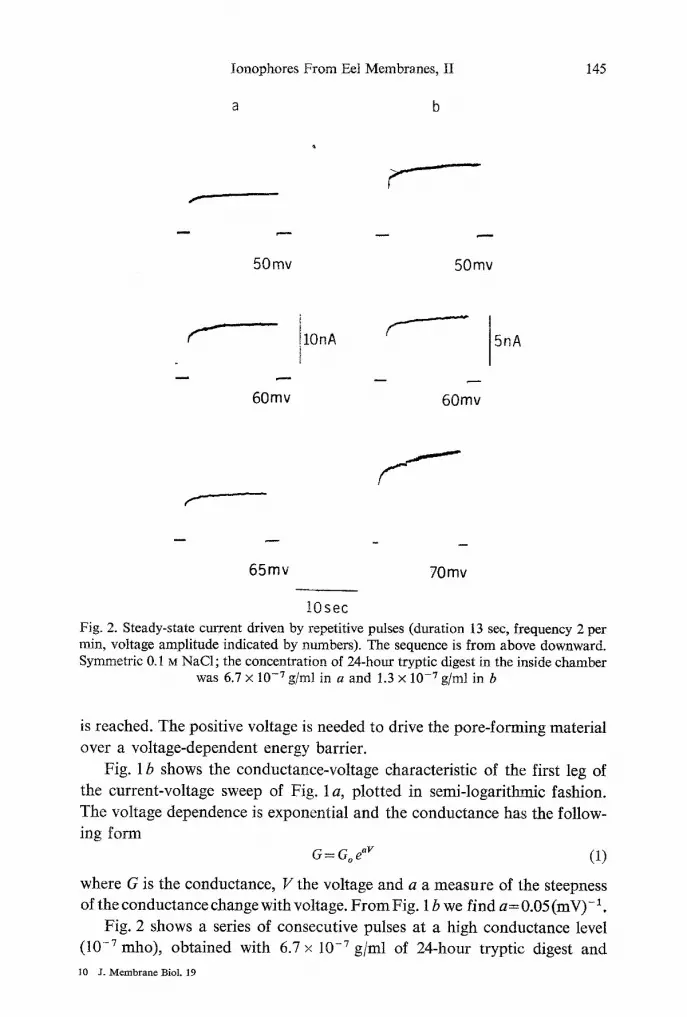
10see Fig. 2. Steady-state current driven by repetitive pulses (duration 13 sec, frequency 2 per min, voltage amplitude indicated by numbers). The sequence is from above downward. Symmetric 0.1 M NaC1; the concentration of 24-hour tryptic digest in the inside chamber
was 6.7 x 10 -7 g/ml in a and 1.3 x 10 .7 g/ml in b
is reached. The positive voltage is needed to drive the pore-forming material
over a voltage-dependent energy barrier.
Fig. 1 b shows the conductance-voltage characteristic of the first leg of
the current-voltage sweep of Fig. 1 a, plotted in semi-logarittkmic fashion.
The voltage dependence is exponential and the conductance has the follow- ing form
G - - G O e " v (1)
where G is the conductance, V the voltage and a a measure of the steepness of the conductance change with voltage. From Fig. 1 b we find a= 0.05 (mV) - 1
Fig. 2 shows a series of consecutive pulses at a high conductance level (10 -7 mho), obtained with 6.7 x 10 .7 g/ml of 24-hour tryptic digest and
10 J. Membrane Biol. 19
6.
I 4.
( n A m p s )
2.
! I I I ,9
146 R. Blumenthal and A. E. Shamoo
-6,
I I I I 20 4 0 60 80
V(mv)
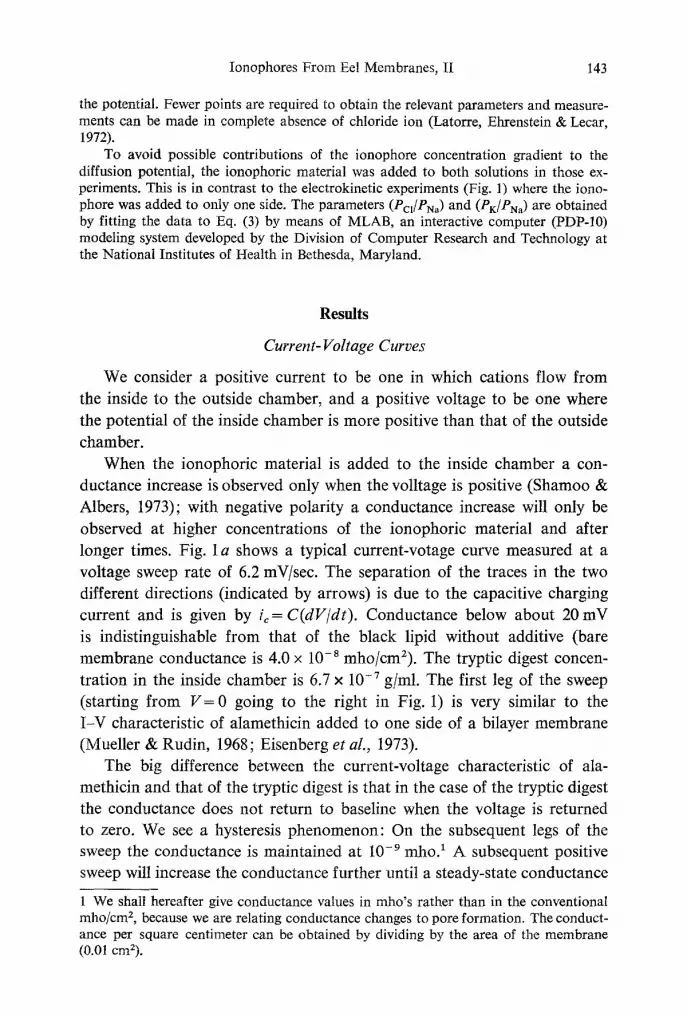
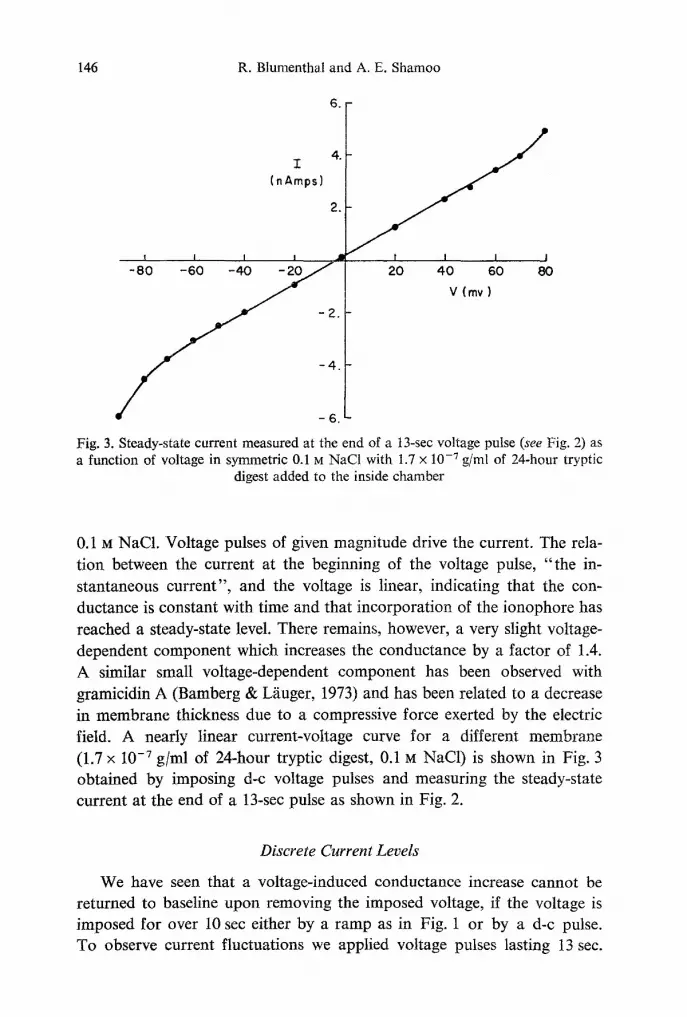
Fig. 3. Steady-state current measured at the end of a 13-sec voltage pulse (see Fig. 2) as a function of voltage in symmetric 0.1 M NaC1 with 1.7 x 10 .7 g/ml of 24-hour tryptic
digest added to the inside chamber
0.1 M NaCl. Voltage pulses of given magnitude drive the current. The rela- tion between the current at the beginning of the voltage pulse, " the in- stantaneous current", and the voltage is linear, indicating that the con- ductance is constant with time and that incorporation of the ionophore has reached a steady-state level. There remains, however, a very slight voltage- dependent component which increases the conductance by a factor of 1.4. A similar small voltage-dependent component has been observed with gramicidin A (Bamberg & Lfiuger, 1973) and has been related to a decrease in membrane thickness due to a compressive force exerted by the electric field. A nearly linear current-voltage curve for a different membrane (1.7 x 10 -7 g/ml of 24-hour tryptic digest, 0.1 M NaC1) is shown in Fig. 3 obtained by imposing d-c voltage pulses and measuring the steady-state current at the end of a 13-sec pulse as shown in Fig. 2.
Discrete Current Levels
We have seen that a voltage-induced conductance increase cannot be returned to baseline upon removing the imposed voltage, if the voltage is imposed for over 10 sec either by a ramp as in Fig. 1 or by a d-c pulse. To observe current fluctuations we applied voltage pulses lasting 13 sec.
Ionophores From Eel Membranes, II
a b
30my
, - , . ~
40my
147
m
I 40 mv
.lnA
40mv
m
40mv 50mv
10sec
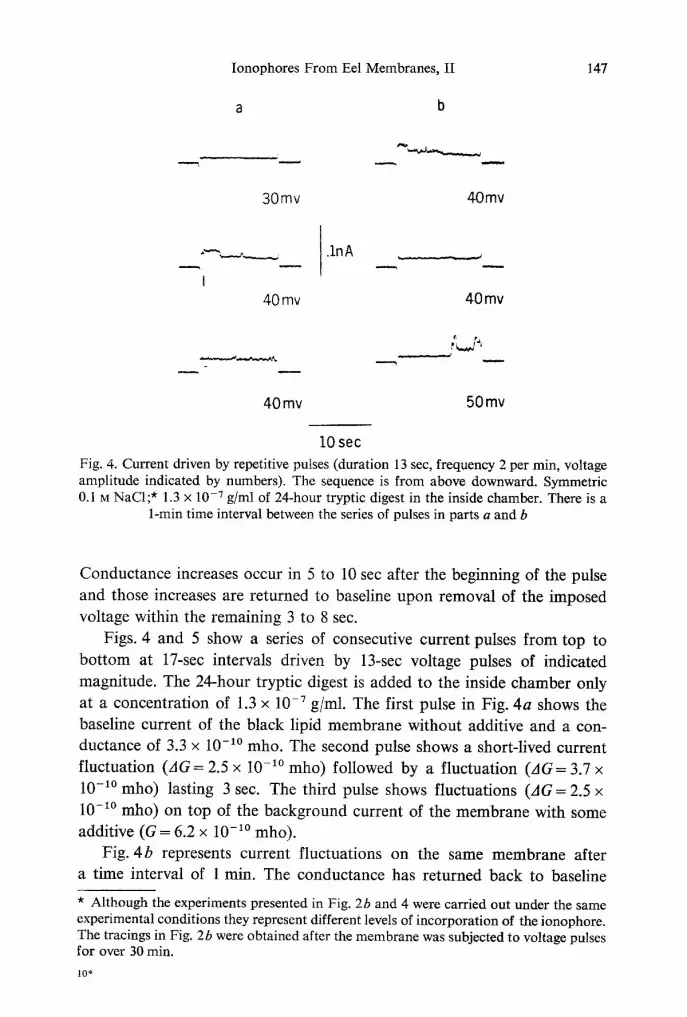
Fig. 4. Current driven by repetitive putses (duration 13 sec, frequency 2 per min, voltage amplitude indicated by numbers). The sequence is from above downward. Symmetric 0.1 M NaC1;* 1.3 x 10 -7 g/ml of 24-hour tryptic digest in the inside chamber. There is a
1-min time interval between the series of pulses in parts a and b
Conduc tance increases occur in 5 to 10 sec after the beginning of the pulse
and those increases are re turned to baseline upon removal of the imposed
voltage within the remaining 3 to 8 sec.
Figs. 4 and 5 show a series of consecutive current pulses f rom top to
b o t t o m at 17-sec intervals driven by 13-sec voltage pulses of indicated
magnitude. The 24-hour t rypt ic digest is added to the inside chamber only
at a concent ra t ion of 1.3 x 10 -7 g/ml. The first pulse in Fig. 4 a shows the
baseline current of the black lipid membrane wi thout additive and a con-
ductance of 3.3 x 10 -1~ mho. The second pulse shows a short-lived current
f luctuat ion (AG= 2.5 x 10 -1~ mho) fol lowed by a f luctuat ion (AG= 3.7 x
10 -1~ mho) lasting 3 sec. The third pulse shows f luctuat ions (AG = 2.5 x
10 -1~ mho) on top of the background current of the m em b ran e with some
addit ive (G = 6.2 x 10 -1~ mho) .
Fig. 4b represents current f luctuat ions on the same m em b ran e after
a t ime interval of 1 rain. The conduc tance has re turned back to baseline
* Although the experiments presented in Fig. 2b and 4 were carried out under the same experimental conditions they represent different levels of incorporation of the ionophore. The tracings in Fig. 2b were obtained after the membrane was subjected to voltage pulses for over 30 rain.
10"
148 R. Blumenthal and A. E. Shamoo
a b
60mv -60my
m
- -~ - - - - ' - - J ,-- 50 rnv
30 mv +60 mv
10sec
60mv l lnA __ ,__
60mv
5nA
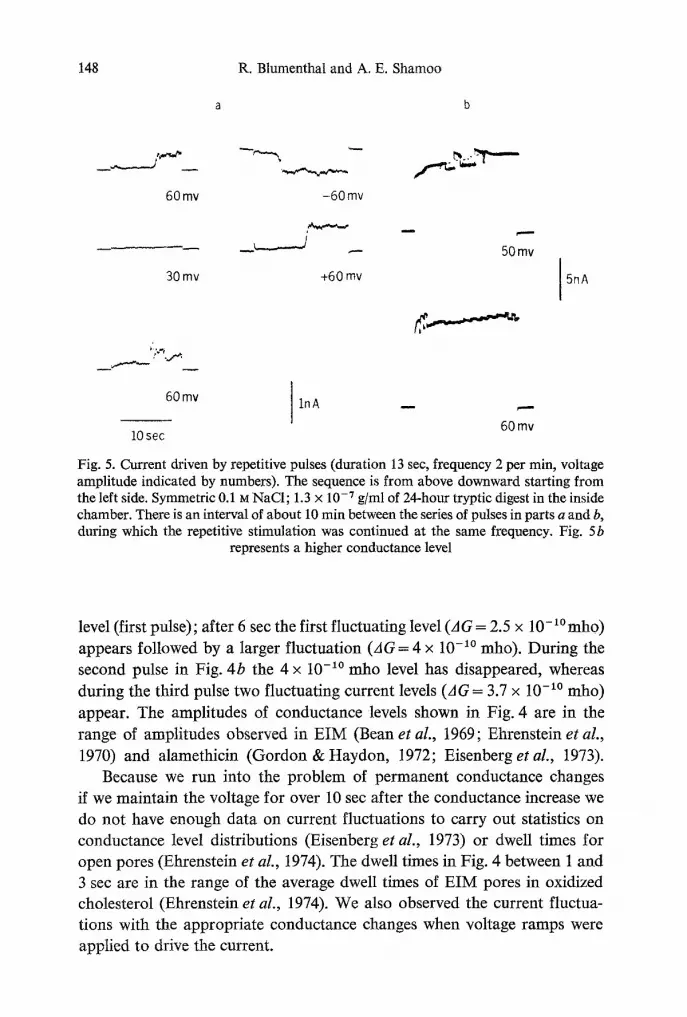
Fig. 5. Current driven by repetitive pulses (duration 13 sec, frequency 2 per min, voltage amplitude indicated by numbers). The sequence is from above downward starting from the left side. Symmetric 0.1 ~ NaCI; 1.3 x 10 -7 g/ml of 24-hour tryptic digest in the inside chamber. There is an interval of about 10 min between the series of pulses in parts a and b, during which the repetitive stimulation was continued at the same frequency. Fig. 5b
represents a higher conductance level
level (first pulse); after 6 sec the first fluctuating level (A G = 2.5 x 10-lo mho) appears followed by a larger fluctuation (AG = 4 x 10 -~~ mho). During the second pulse in Fig. 4b the 4 x 10 -~~ mho level has disappeared, whereas during the third pulse two fluctuating current levels (AG = 3.7 x 10 -1~ mho) appear. The amplitudes of conductance levels shown in Fig. 4 are in the range of amplitudes observed in EIM (Bean et aL, 1969; Ehrenstein et aL, 1970) and alamethicin (Gordon & Haydon, 1972; Eisenberg etal., 1973).
Because we run into the problem of permanent conductance changes if we maintain the voltage for over 10 sec after the conductance increase we do not have enough data on current fluctuations to carry out statistics on conductance level distributions (Eisenberg et al., 1973) or dwell times for open pores (Ehrenstein et aL, 1974). The dwell times in Fig. 4 between 1 and 3 see are in the range of the average dwell times of EIM pores in oxidized cholesterol (Ehrenstein et al., 1974). We also observed the current fluctua- tions with the appropriate conductance changes when voltage ramps were applied to drive the current.
Ionophores From Eel Membranes, II 149
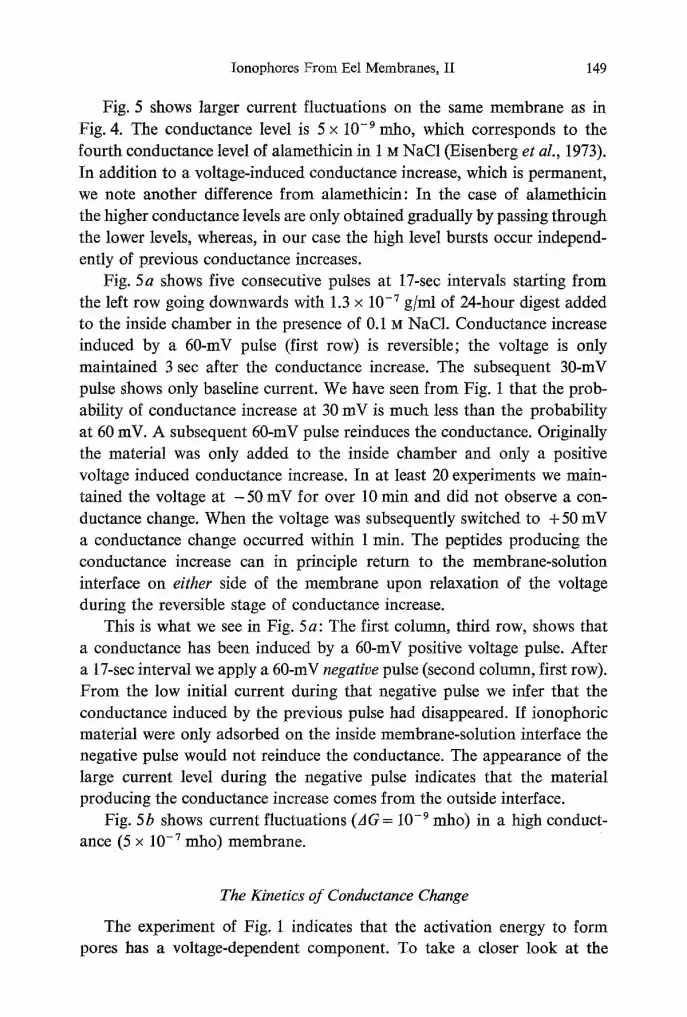
Fig. 5 shows larger current fluctuations on the same membrane as in Fig. 4. The conductance level is 5 x 10 -9 m_ho, which corresponds to the fourth conductance level of alamethicin in 1 ~ NaC1 (Eisenberg et al., 1973). In addition to a voltage-induced conductance increase, which is permanent, we note another difference from alamethicin: In the case of alamethicin the higher conductance levels are only obtained gradually by passing through the lower levels, whereas, in our case the high level bursts occur independ- ently of previous conductance increases.
Fig. 5a shows five consecutive pulses at 17-sec intervals starting from the left row going downwards with 1.3 • 10 -7 g/ml of 24-hour digest added to the inside chamber in the presence of 0.1 M NaC1. Conductance increase induced by a 60-mV pulse (first row) is reversible; the voltage is only maintained 3 sec after the conductance increase. The subsequent 30-mV pulse shows only baseline current. We have seen from Fig. 1 that the prob- ability of conductance increase at 30 mV is much less than the probability at 60 inV. A subsequent 60-mV pulse reinduces the conductance. Originally the material was only added to the inside chamber and only a positive voltage induced conductance increase. In at least 20 experiments we main- tained the voltage at - 5 0 mV for over 10 min and did not observe a con- ductance change. When the voltage was subsequently switched to + 50 mV a conductance change occurred within 1 min. The peptides producing the conductance increase can in principle return to the membrane-solution interface on either side of the membrane upon relaxation of the voltage during the reversible stage of conductance increase.
This is what we see in Fig. 5a: The first column, third row, shows that a conductance has been induced by a 60-mV positive voltage pulse. After a 17-sec interval we apply a 60-mV negative pulse (second column, first row). From the low initial current during that negative pulse we infer that the conductance induced by the previous pulse had disappeared. If ionophoric material were only adsorbed on the inside membrane-solution interface the negative pulse would not reinduce the conductance. The appearance of the large current level during the negative pulse indicates that the material producing the conductance increase comes from the outside interface.
Fig. 5b shows current fluctuations (AG = 10 -9 mho) in a high conduct- ance (5 x 10 -7 mho) membrane.
The Kinetics of Conductance Change
The experiment of Fig. 1 indicates that the activation energy to form pores has a voltage-dependent component. To take a closer look at the
2o s 15 0
r
LLI o z 10
o a z 0 5 o
�9 �9 �9 �9 �9 Q /
100
50
At (rain)
10
I I ! I
O0 1 2 3 4 5
TIME (Minutes)
b L 0 10 20 30 40 50 60 70
V (mV)
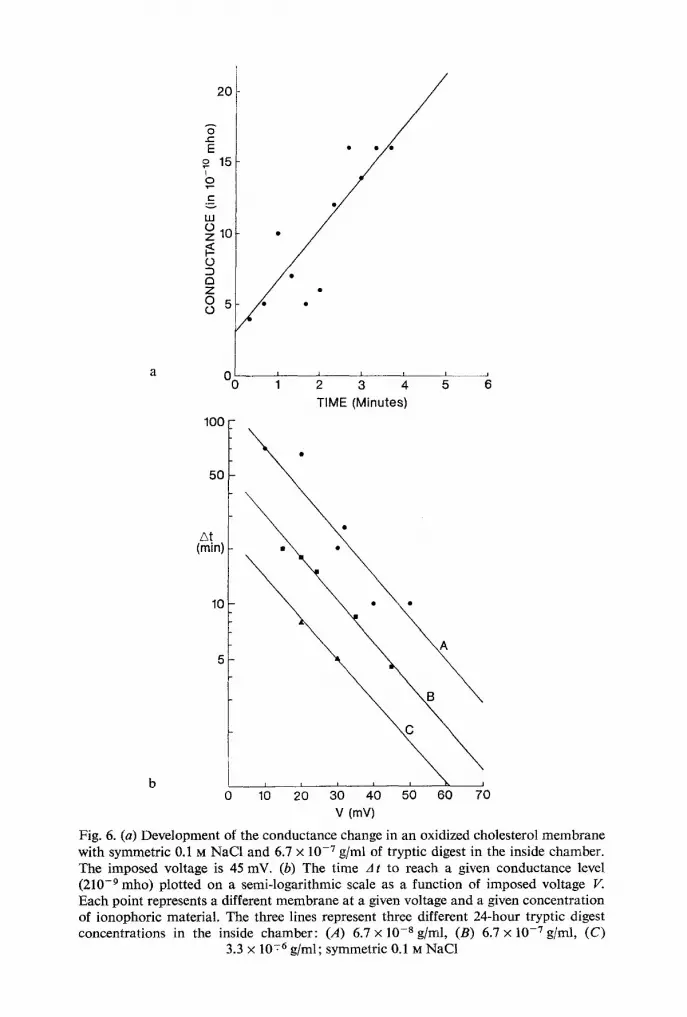
Fig. 6. (a) Development of the conductance change in an oxidized cholesterol membrane with symmetric 0.1 ra NaCI and 6.7 • 10 -7 g/ml of tryptic digest in the inside chamber. The imposed voltage is 45 inV. (b) The time A t to reach a given conductance level (210 -9 mho) plotted on a semi-logarithmic scale as a function of imposed voltage V. Each point represents a different membrane at a given voltage and a given concentration of ionophoric material. The three lines represent three different 24-hour tryptic digest concentrations in the inside chamber: (,4) 6.7 • 10 -8 g/ml, (B) 6.7 • 10 -7 g/ml, (C)
3.3 • 10 -76 g/ml; symmetric 0.1 M NaC1
Ionophores From Eel Membranes, II 151
voltage dependence, we measured the time required to establish a given
conductance level as a function of the voltage. The implicit assumption is that initially G is a linear function of time. In Fig. 6a we replotted G as a function of time from the original record-monitored by a pen recorder- at V= 45 mV with 1.3 x 10 -7 mg/ml of 24-hour digest in the inside chamber and 0.1 M NaC1 on both sides. The spread in the points in Fig. 6a is a manifestation of formation of bumps as shown in Figs. 4 and 5. On the average, however, the conductance increases linearly with time as indicated by the solid line.
For experiments with much slower time courses of the conductance change we did not monitor the time course but took the time interval A t for which the conductance had reached a given value of G = 2 x 10 -9 mho.
The latter value is about 10 times the bare membrane conductance, but far below the steady-state conductance (G = 10 .7 to 10 .6 mho) for the tryptic
digest concentration used in the kinetic experiments. We therefore were confident that we were carrying out our At measurements in the linear range of G versus time.
Fig. 6 b shows the results for three different 24-hour tryptic digest con- centrations where At is plotted in a semilogarithmic fashion as a function
of imposed voltage. The voltage dependence is exponential and has the following form:
A t = A t o e -"v. (2)
In Eq. (2), a is a measure of the steepness of the rate o f conductance change
with voltage. We find a = 0.05/mV, the same value for a as found by the ramp experiment in Fig. 1. This finding does not surprise us because with the voltage sweep we are also measuring the rate of conductance change.
Ion Selectivities
In Figs. 7 and 9 diffusion and biionic potentials are plotted against the logarithm of cation concentration ratios. The data are fitted to the Gold- man-Hodgkin-Katz equation (see Hodgkin & Katz, 1949):
R T V= - ~ - - In ((Na, + (PK/P'~) K, + (Pc,/PN.) Clo)/(Na o + (PK/P'~a) Ko
+ (Pc,/t'N.) C13) (3)
where Na, K, C1 and PNa, PK and Pc~ are, respectively, the concentrations and permeability constants of sodium, potassium and chloride. The sub-
152 R. Blumenthal and A. E. Shamoo
E
2o I-- Z 111 I.- 0 r,
3 0 -
10 - - t l
/ 1 I , I
2 4 6 coNcENTRATION RATIO [Na]o/[Na.] i
I . . . . . l
8 I0
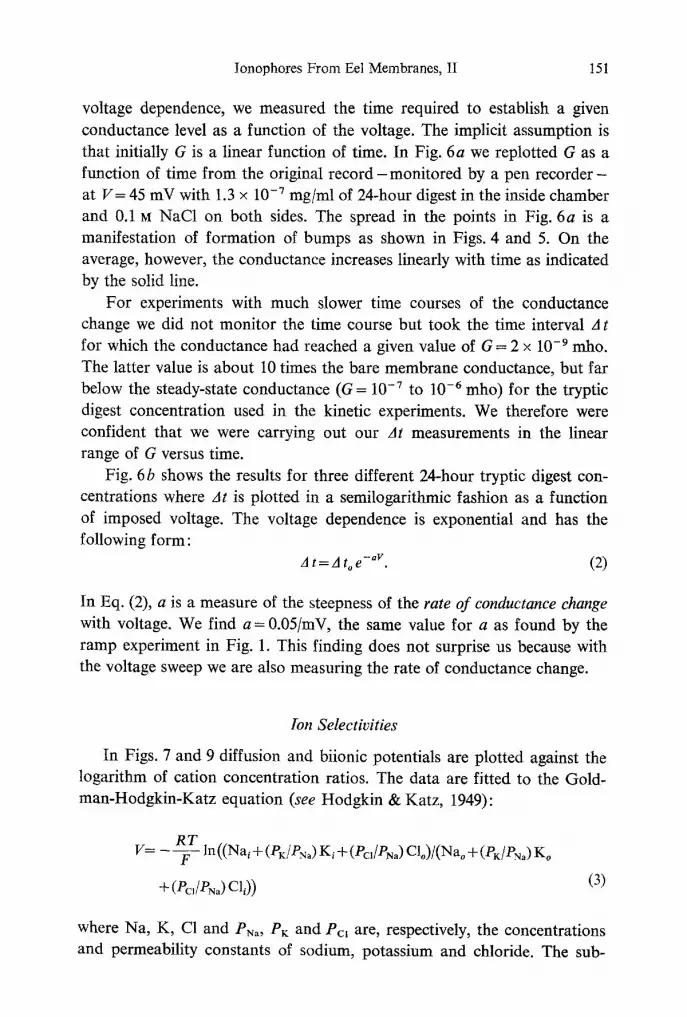
Fig. 7. The diffusion potential plotted as a logarithmic function of the ratio of con- centrations of sodium chloride in the outside and inside chambers. The concentration of 24-hour tryptic digest in both chambers was 6.7 x 10 -8 g/ml, at pH = 7 and membrane conductance 2 x 10 .9 mho. The points represent data and the solid line is calculated
from Eq. (3) with Pcl /PNa = O. 1
scripts i and o refer to the inner and outer chamber, respectively. R, T and F
are, respectively, the gas constant, temperature and the Faraday constant.
With Ag/AgC1 electrodes, nitrate is the abundant anion (see Materials and
Methods); in that case the NO~ permeability is assumed to equal C1-
permeability. Curve fitting of the data presented in Fig. 7 to Eq. (3) yields Pcl/PNa = O. 1.
At pH = 7 we find that Pcl/PN, runs between 0.1 and 0.8 for 20 tryptic digest
batches with low and high conductance membranes. In other words, at pH = 7.0 the tryptic digest-doped membrane is more permeable to mono-
valent cations than to monovalent anions. This seems paradoxical because the voltage-dependent incorporation data indicate a positive charge on the ionophore. A similar situation was obtained by Cass, Finkelstein and
Krespi (1970) in the case of positively charged polyene antibiotics, by Muller and Finkelstein (1973) in the case of monazomycin, and by Eisenberg et al.
(1973) in the case of alamethicin. To obtain a situation in which the iono- phore totally excludes anions we measured diffusion potentials using sodium
sulfate.
Ionophores From Eel Membranes, II
10. o
153
5.
O
cs >- 1. I - J
.< IL l ~ . 5 EZ !JJ G...
.2
o
I ,j" / /D / ,
14 6 8 10
PH
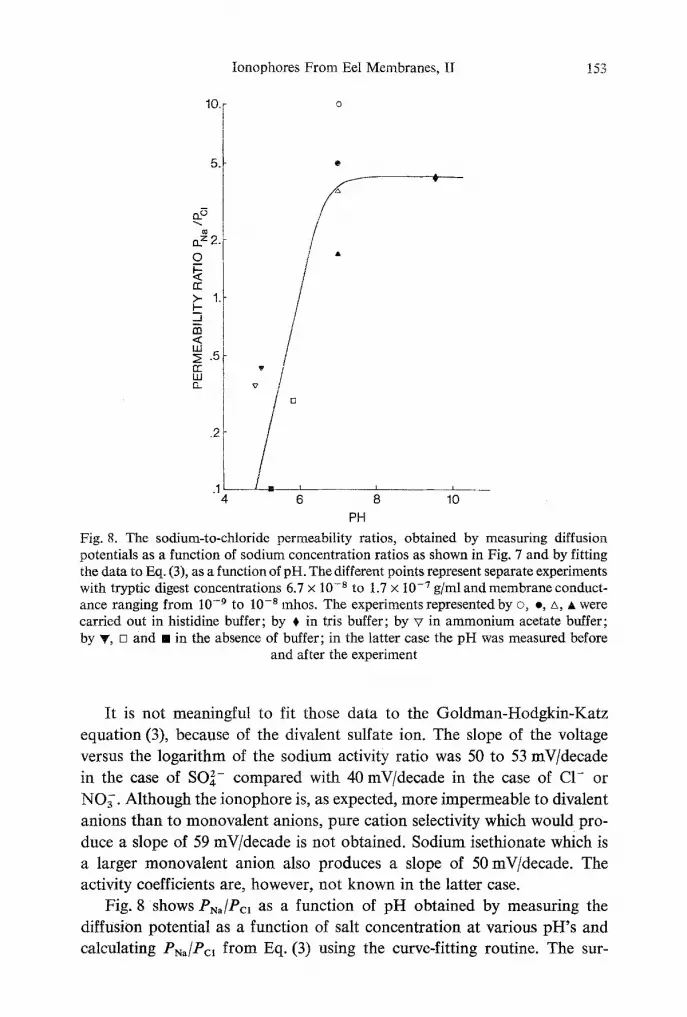
Fig. 8. The sodium-to-chloride permeability ratios, obtained by measuring diffusion potentials as a function of sodium concentration ratios as shown in Fig. 7 and by fitting the data to Eq. (3), as a function of pH. The different points represent separate experiments with tryptic digest concentrations 6.7 x 10 .8 to 1.7 x 10 .7 g/ml and membrane conduct- ance ranging from 10 .9 to 10 -8 mhos. The experiments represented by �9 e, zx, • were carried out in histidine buffer; by ~ in tris buffer; by v in ammonium acetate buffer; by ~, [] and [] in the absence of buffer; in the latter case the pH was measured before
and after the experiment
It is not meaningful to fit those data to the Goldman-Hodgkin-Katz equation (3), because of the divalent sulfate ion. The slope of the voltage versus the logarithm of the sodium activity ratio was 50 to 53 mV/decade in the case of SO/ . compared with 40 mV/decade in the case of C1- or NO~. Although the ionophore is, as expected, more impermeable to divalent anions than to monovalent anions, pure cation selectivity which would pro- duce a slope of 59 mV/decade is not obtained. Sodium isethionate which is a larger monovalent anion also produces a slope of 50 mV/decade. The activity coefficients are, however, not known in the latter case.
Fig. 8 shows PN~/Pc, as a function of pH obtained by measuring the diffusion potential as a function of salt concentration at various pH's and calculating PNa/Pc, from Eq. (3) using the curve-fitting routine. The sur-
154 R. Blumenthal and A. E. Shamoo
,8t 1 5 -
> E
..2~2 - b.- Z
0 D..
0 T I [ I I I I I I 1 I I ,2 .4 .6 .8 1 2 4 6 8 I0
CONCENTRATION RATIO [ K ] o / [ N o ] i
Fig. 9a
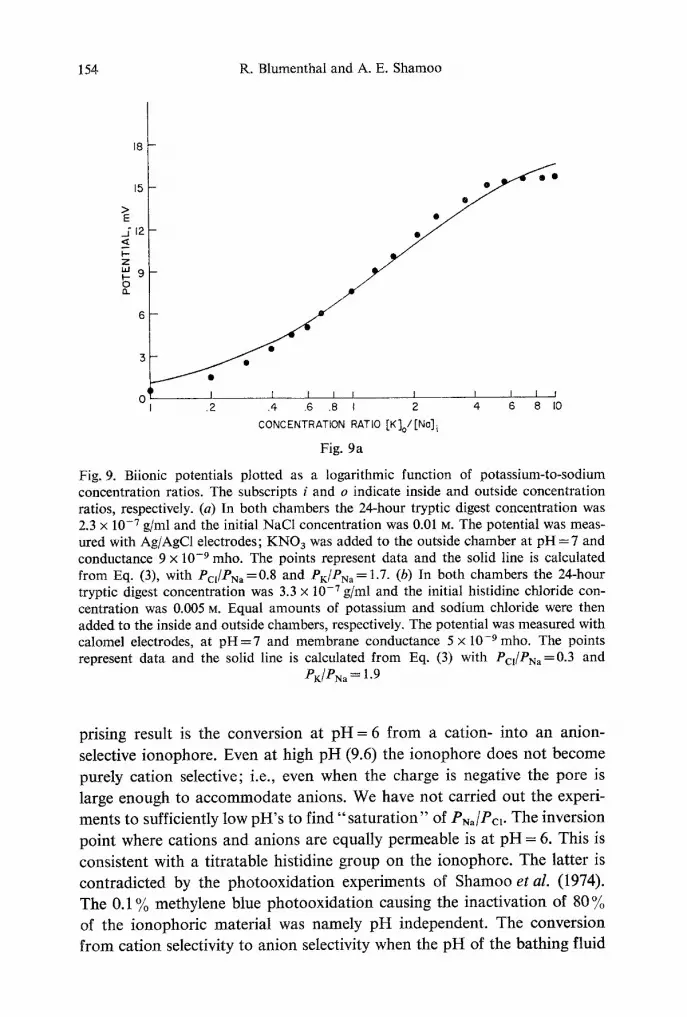
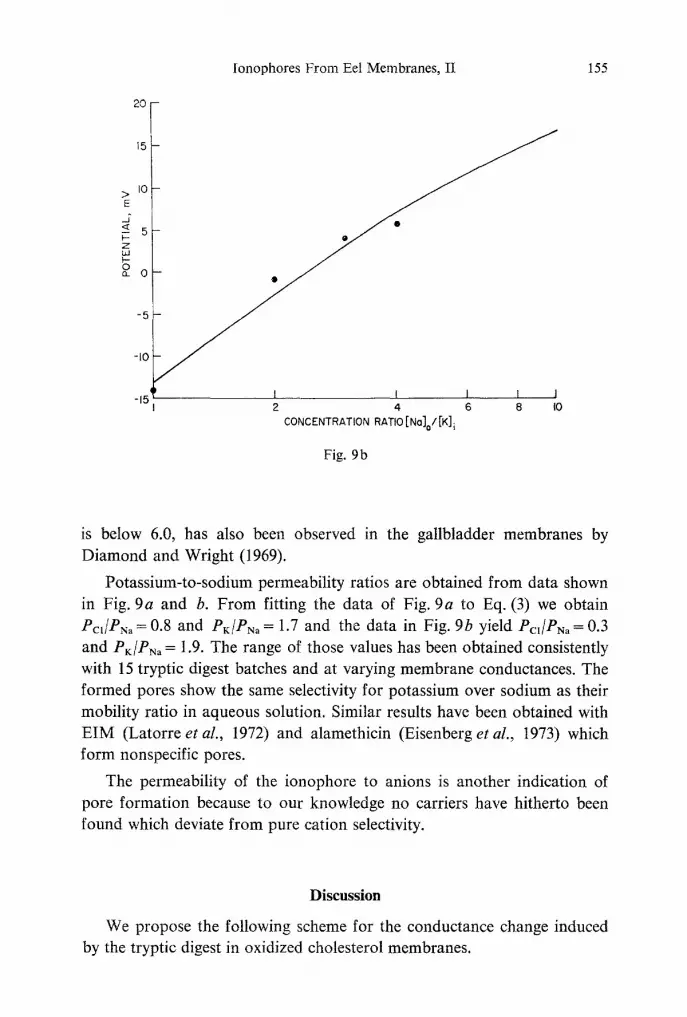
Fig. 9. Biionic potentials plotted as a logarithmic function of potassium-to-sodium concentration ratios. The subscripts i and o indicate inside and outside concentration ratios, respectively. (a) In both chambers the 24-hour tryptic digest concentration was 2.3 x 10 -7 g/ml and the initial NaC1 concentration was 0.01 M. The potential was meas- ured with Ag/AgC1 electrodes; KNO s was added to the outside chamber at pH = 7 and conductance 9 x 10 -9 mho. The points represent data and the solid line is calculated from Eq. (3), with Pcl/PNa =0.8 and PK/PNa= 1.7. (b) In both chambers the 24-hour tryptic digest concentration was 3.3 x 10 -7 g/ml and the initial histidine chloride con- centration was 0.005 M. Equal amounts of potassium and sodium chloride were then added to the inside and outside chambers, respectively. The potential was measured with calomel electrodes, at p H = 7 and membrane conductance 5 x 10 -9 mho. The points represent data and the solid line is calculated from Eq. (3) with Pcj/PNa=0.3 and
PK/PNa = 1.9
prising result is the convers ion at p H = 6 f r o m a cat ion- into an anion-
selective ionophore . Even at high p H (9.6) the i o n o p h o r e does no t b e c o m e
pure ly cat ion selective; i.e., even when the charge is negat ive the pore is
large enough to a c c o m m o d a t e anions. We have not carr ied out the experi-
ments to sufficiently low p H ' s to find " s a t u r a t i o n " of PN,/Pc~. The inversion
poin t where cat ions and anions are equally pe rmeab le is at p H = 6. This is
consis tent with a t i t ra table histidine g roup on the ionophore . The lat ter is
cont radic ted by the pho toox ida t ion exper iments of S h a m o o et al. (1974).
The 0 .1% methylene blue pho toox ida t ion causing the inac t iva t ion of 80 %
of the ionophor i c mater ia l was namely p H independent . The convers ion
f r o m cat ion selectivity to an ion selectivity when the p H of the ba th ing fluid
Ionophores From Eel Membranes, II 155
2 0 -
1 5 -
I 0 - - >
E .a"
--< 5 Z b.I F.- 0 a. 0
-5
- I0
-15 I I I I J 2 4 6 8 I0
CONCENTRATION RATIO [No]o/ [K] i
Fig. 9b
is below 6.0, has also been observed in the gallbladder membranes by Diamond and Wright (1969).
Potassium-to-sodium permeability ratios are obtained from data shown in Fig. 9a and b. From fitting the data of Fig. 9a to Eq. (3) we obtain Pc~/PN, = 0.8 and PK/PN, = 1.7 and the data in Fig. 9b yield Pc~/P~, = 0.3 and PK/PN, = 1.9. The range of those values has been obtained consistently with 15 tryptic digest batches and at varying membrane conductances. The formed pores show the same selectivity for potassium over sodium as their mobility ratio in aqueous solution. Similar results have been obtained with EIM (Latorre et al., 1972) and alamethicin (Eisenberg et al., 1973) which form nonspecific pores.
The permeability of the ionophore to anions is another indication of pore formation because to our knowledge no carriers have hitherto been found which deviate from pure cation selectivity.
Discussion
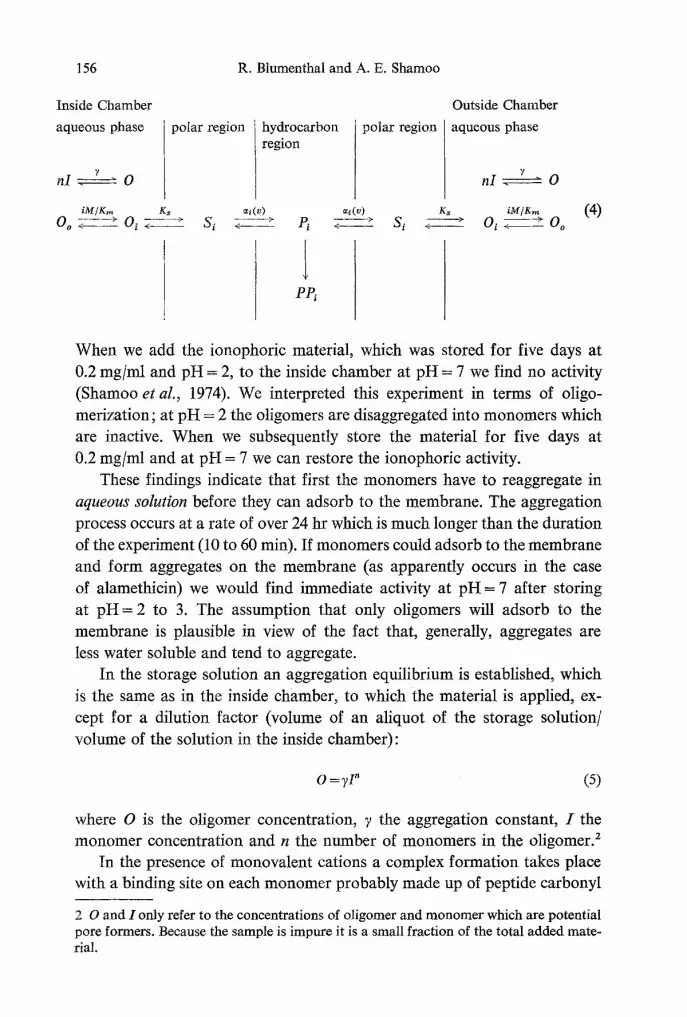
We propose the following scheme for the conductance change induced by the tryptic digest in oxidized cholesterol membranes.
156 R. Blumenthal and A. E. Shamoo
Inside Chamber Outside Chamber
aqueous phase aqueous phase
n I . " 0
polar region hydrocarbon polar region region
n I . " 0
i~t/K~ Ks ~,(~) ~(~) ~c, IM/K,, (4) 0o ~ 0~ ( ~ St ~ > ~ > St ~ " Oi ~ 0o P,
PC,
When we add the ionophoric material, which was stored for five days at 0.2 mg/mi and pH = 2, to the inside chamber at pH = 7 we find no activity
(Shamoo e t a l . , 1974). We interpreted this experiment in terms of oligo-
merization; at pH = 2 the oligomers are disaggregated into monomers which are inactive. When we subsequently store the material for five days at
0.2 mg/ml and at pH = 7 we can restore the ionophoric activity.
These findings indicate that first the monomers have to reaggregate in
a q u e o u s s o l u t i o n before they can adsorb to the membrane. The aggregation
process occurs at a rate of over 24 hr which is much longer than the duration
of the experiment (10 to 60 min). If monomers could adsorb to the membrane
and form aggregates on the membrane (as apparently occurs in the case
of alamethicin) we would find immediate activity at pH = 7 after storing
at pH = 2 to 3. The assumption that only oligomers will adsorb to the
membrane is plausible in view of the fact that, generally, aggregates are
less water soluble and tend to aggregate. In the storage solution an aggregation equilibrium is established, which
is the same as in the inside chamber, to which the material is applied, ex-
cept for a dilution factor (volume of an aliquot of the storage solution/
volume of the solution in the inside chamber):
o = ~ r (5)
where O is the oligomer concentration, 7 the aggregation constant, I the monomer concentration and n the number of monomers in the oligomer, z
In the presence of monovalent cations a complex formation takes place with a binding site on each monomer probably made up of peptide carbonyl
2 0 and I only refer to the concentrations of oligomer and monomer which are potential pore formers. Because the sample is impure it is a small fraction of the total added mate- rial.
Ionophores From Eel Membranes, II 157
groups. In the case of the one-hour tryptic digest the dissociation constant for sodium is much lower than for the other monovalent cations (Shamoo & Albers, 1973). Generally, complex formation rates of monovalent cations to ionophores are very fast: 10 .9 sec in the case of monactin (Eigen & DeMaeyer, 1971). The concentration of oligomer in the inside chamber with i ions bound (see the section on linked functions in Wyman, 1948) is given by:
o,= \ / i
where M represents monovalent cation concentration, K,~ the dissociation constant of the complexed binding site and O the total concentration of oligomer, which equals the amount of oligomer initially added to the inside chamber. For simplicity we assume no interaction between binding sites (they all have the same K,~) and the number of binding sites n equals the number of monomers per oligomer.
The absorption equilibrium to the polar region is determined by the constant Ks, and Si is the concentration of oligomer complexed with i cat- ions at the interface. Ion binding may also occur at the interface; we assume the same dissociation constant for the adsorbed complex (Si), as for the complex in solution (O~). The time constant for adsorption from solution to the bilayer interface is 2.9 rain in the case of alamethicin (Eisenberg et al., 1973).
The voltage-dependent transition S~ ~ P~ leads to the formation of ion- conducting pores with voltage-dependent formation rate constant e~(v). We assume this step to be rate-limiting; for V--45 mV the time constant is certainly larger than 10 min.
We see a considerable heterogeneity of single conductance events ranging from 10 -~~ to 10 -9 mho. We assume that the heterogeneity is a reflection of different pore sizes determined by the number of charges i on the pore.
The step Pi-+ PPi, where PP~ indicates permanent pore with charge i has a time constant of 5 to 10 sec according to the experiments presented in Figs. 1 and 4. If the voltage is maintained for less than 5 sec the pore will disappear after removal of the voltage, causing a P, ~ S, transition either to the inside or outside surface of the bilayer (see Fig. 5). After maintaining the voltage, however, for a longer period the pore cannot be removed by relaxing the voltage. Steady-state conductance (which is independent of voltage) will be reached when all the oligomer in solution is used up and converted to permanent pore. It is essentially a quasi steady state because upon removal of oligomer from solution further aggregation of monomers
158 R. Blumenthal and A. E. Shamoo
into oligomers will take place. The time constant for that process (24 hr) is, however, much larger than the duration of an experiment (10 to 60 min) so that we can neglect aggregation during the experiment. The steady-state
conductance is given by
G = ~ gi PPi (7) i = 1
where g, is the conductance of a pore with charge i. We assume g, to be the same for a reversible or permanent pore; the magnitude is determined by the charge on the oligomer. The total amount of permanent pore with charge i at steady state is given by
PP~ = vAOi (8)
where v is the volume of the chamber and A the avogadros number.
Substituting for PPi according to Eq. (8) and for Oi according to Eqs. (5) and (6) into Eq. (7) yields
G = vA ? I" V ~ , i ,, g,(J 4/K,,,) /( t + M/K~) . (9) i = O
Eq. (9) accounts for the higher order dependence of the conductance on concentration of the ionophoric material as shown by Shamoo and Albers 0973) and for the dependence on monovalent ion concentration as shwon by Shamoo et al. (1974).
We can illustrate, by a numerical example, the range of oligomer con- centration and consequently the amount of permanent pores in the mem- brane at steady state. Making use of Eqs. (8) and (fi) we derive the total amount of permanent pore at steady state
n
PPt = ~ PPI= vA ~, Oi= v A O = v A ? I ". / = I i = 1
(10)
If we t a k e / t = 10-7 mole, n = 6 and y = 1025/(mole) "-1 we obtain from Eq. (5) O = 10 -17 mole. The total amount of material added to the inside chamber then equals I + O ~ L From Eq. (10) we obtain PPt = 103 permanent pores. With an average permanent pore conductance of 5 x 10 -9 mho, we arrive at a total membrane conductance of 5 x 10 -6 mho.
The initial rate of conductance change is determined by the rate-limiting step Si ~ P~ in Eq. (4) and given by
dO & dPi x-, d t -i=12" gi ~ = 2_,i gi ~i(V) Si. (11)
Ionophores From Eel Membranes, II 159
The rate constant e~(V) is determined by an activation energy between the
peptides absorbed on the membrane and the peptides forming the pore. The activation energy has a voltage-dependent component and therefore the rate constant can be decomposed according to (Mueller & Rudin, 1968; Eisenberg et al., 1973; Muller & Finkelstein, 1973; Ehrenstein et al., 1974):
~, (v) = ~, (o) e ~ v (12)
where ~i(O) is the rate constant in the absence of an imposed voltage and a~ the steepness of the voltage-dependent rate constant for the formation of an i th level pore. We define an average steepness a by
• gi ~i(o) Si e ~ ~ V i = l (dG/dt)
h
~ g~ei(o)S~ (dG/dt)v=~ = I
(13)
We replace the differential in Eq. (13) by the difference (dG/dt = AG/A t), because we consider the linear range of conductance change with time. We then eliminate AG in Eq. (13), because we consider the time required to obtain a given conductance change (AG= (AG)v=o= 2 x 10 -9 mhos) as a function of voltage. Eq. (13) then reduces to Eq. (2).
Two types of physical interpretations have been invoked for the param- eter a (Ehrenstein et al., 1974): (l) When a charge is moved by the field across the membrane, the peptides form a pore. One can deduce how many charges have to be moved. From the value we measured (a= 0.05 mV -1) we derive an average of one charge. (2) A change in dipole moment be- tween the adsorbed peptides and the pore peptides occurs during pore formation. From the value of a, we obtain a change in dipole moment of
300 debye. We believe that permanent pore formation occurs because the peptides
that form a bridge across the membrane interact with peptides that have formed a "bridge head" on the other side of the membrane. The complex of the "bridge" and the "bridge head" cannot be removed upon relaxation of the voltage. If the voltage is only maintained for 5 to 10 sec there is not enough time for the "bridge" and "bridge head" to form a stable complex. This idea is consistent with the observation that the rate pore formation is much faster when the same amount of material is applied to both sides of the membrane: In the latter case the "bridge heads" do not have to be transported across the membrane prior to forming the stable complexes because they are already present on both sides. Our observation (Shamoo
160 R. Blumenthal and A. E. Shamoo
et al., 1974) that by application of the ionophoric material to both sides of the membrane, the same steady-state conductance level can be attained with a 50- to 200-fold reduction in the amount of added material, is explained by assuming that only 0.5 to 2% of the "bridge heads" are permeable through the membrane.
Conclusion
We have described the properties of a very interesting ionophore (or ionophores) released by a tryptic digest from electroplax membranes. We have studied the ionophore as if it were any other of the known antibiotic ionophores without relating it to any physiological function.
The question as to why the ionophoric material does not produce con- ductance changes in lipid bilayer membranes made up of lecithin, lipid extracts from electric organ or even mixtures of brain phospholipids and cholesterol still need elaboration.
The electroplax membrane is rich in ionophores necessary for synaptic function, spike electrogenesis and for maintaining the ionic (K § Na § concentration gradients (Changeux, Podleski, Kasai & Blumenthal, 1970). The synaptic ionophores are associated with the acetylcholine receptor; the spike-generating mechanism is made up of voltage-dependent sodium and potassium channels; and the ionic balance is maintained by the (Na§ K+)-ATPase active transport system. We can estimate the relative abundance of (Na++ K§ and other channels in the electroplax membrane preparations. Albers, Koval and Siegel (1968) measured 1000 nmoles (Na§ K§ protein on the basis of 32p incorpora- tion, whereas Changeux and his co-workers (Changeux, Kasai & Lee, 1970; Olsen, Meunier & Changeux, 1972) measured 1 nmole acetylcholine re- ceptor/g protein in electroplax membrane preparation on the basis of radio- active labeled a-bungarotoxin binding. Conductance measurements on the isolated electroplax cell (Ruiz-Manresa & Grundfest, 1971) show that the amount of synaptic (acetylcholine receptor) channels is about the same as electrically excitable channels. The latter will then also be in the 1 nmole/g protein range. If we therefore subject the membrane preparations to a tryptic digestion the chances are 1000 to 1 that the released ionophoric material is derived from (Na § + K+)-ATPase.
To prove that contention, we are carrying out further studies on the purification of the active ionophore and on the possible reconstitution of permeability gating with ATP.
Ionophores From Eel Membranes, II 161
It is a pleasure to acknowledge our debt to Dr. William T. Adelman, Jr. for gener- ously providing the facilities at the Laboratory of Biophysics, NINDS, NIH, where the biophysical measurements were carried out; to Dr. R. Wayne Albers for generously providing the facilities at the Laboratory of Neurochemistry, NINDS, NIH, where the samples of the tryptic digest of eel electroplax were prepared; to Marjory Myers for preparation of the samples; and to Dr. Harold Lecar for his valuable comments through- out the course of this work.
This paper was based on work partially performed under contract with the U.S. Atomic Energy Commission at the University of Rochester Atomic Energy Project and has been assigned Report No. UR-3490-407. The work was also supported in part by NSF Grant No. GB-40657.
References
Albers, R. W., Koval, G.J., Siegel, G.J. 1968. Studies on the interaction of ouabain and other cardioactive steriods with sodium-potassium-activated adenosine triphos- phatase. Mol. Parmacol. 4:324
Bamberg, E., LS.uger, P. 1973. Channel formation kinetics of gramicidin A in lipid bilayer membranes. J. Membrane Biol. 11:177
Bean, R.C., Shepherd, W.C., Chan, H., Eichner, J.T. 1969. Discrete conductance fluctuations in lipid bilayer protein membranes. J. Gen. Physiol. 53:741
Cass, A., Finkelstein, A., Krespi, V. 1970. The ion permeability in thin lipid membranes by the polyene antibiotics nystatin and amphotericin. J. Gen. Physiol. 56:100
Changeux, J.-P., Kasai, M., Lee, Ch-Y. 1970. Use of a snake venom toxin to characterize the cholinergic receptor protein. Proc. Nat. Acad. Sci. 67:1241
Changeux, J.-P., Podleski, T., Kasai, M., Blumenthal, R. 1970. Some molecular aspects of membrane excitation studied with eel electroplax. In: Excitatory Synaptic Mech- anisms. P. Anderson and J. J. Jensen, editors, p. 123. University Press, Oslo
Diamond, J. M., Wright, E. M. 1969. Biological membranes: The physical basis of ion and nonelectrolyte selectivity. Annu. Rev. Physiol. 31"581
Ehrenstein, G., Blumenthal, R., Latorre, R., Lecar, H. 1974. The kinetics of the opening and closing of individual EIM channels in a lipid bilayer. J. Gen. Physiol. 63:707
Ehrenstein, G., Lecar, H., Nossal, R. 1970. The nature of the negative resistance in bimolecular lipid membranes containing excitability-inducing material. Y. Gen. Physiol. 55:119
Eigen, M., DeMaeyer, L. 1971. Carriers and specificity in membranes. Neurosci. Res. Prog. Bull. 9: 300
Eisenberg, M., Hall, J. E., Mead, C. A. 1973. The nature of the voltage-dependent con- ductance induced by alamethicin in black lipid membranes. J. Membrane Biol. 14:143
Fettiplace, R., Andrews, D. M., Haydon, D. A. 1971. The thickness, composition and structure of some lipid bilayers and natural membranes. J. Membrane Biol. 5:277
Gordon, L. G. M., Haydon, D. A. 1972. The unit conductance channel of alamethicin. Biochim. Biophys. Acta 255:1014
Hladky, S. B., Haydon, D. A. 1970. Discreteness of conductance change in bimolecular lipid membranes in the presence of certain antibiotics. Nature 255:451
Hodgkin, A. L., Katz, B. 1949. The effect of sodium ions on the electrical activity of the gaint axon of the squid. J. Physiol. 108:37
Latorre, R., Ehrenstein, G., Lecar, H. 1972. Ion transport through excitability-inducing material (EIM) channels in lipid bilayer membranes. J. Gen. PhysioL 60:72
Mueller, P., Rudin, D. O. 1968. Action potentials induced in bimolecular lipid membranes. Nature 217: 713
11 J. Membrane Biol. 19
162 R. Blumenthal and A. E. Shamoo: Ionophores From Eel Membranes, II
Muller, R.U., Finkelstein, A. 1973. Voltage-dependent conductance induced in thin lipid membranes by monazomycin. J. Gen. Physiol. 60:263
Olsen, R. W., Meunier, J.-C., Changeux, J.-P. 1972. Progress in the purification of the cholinergic receptor protein from electrophorus electricus by affinity chromato- graphy. FEBS Letters 28: 96
Ruiz-Manresa, F., Grundfest, H. 1971. Synaptic electrogenesis in eel electroplaques. J. Gen. Physiol. 57:71
Shamoo, A.E., Albers, R.W. 1973. Na+-selective ionophoric material derived from electric organ and kidney membranes. Proc. Nat. Acad. Sci. 70:1191
Shamoo, A. E., Myers, M. 1974. Na+-dependent ionophore as part of the small poly- peptide of the (Na + +K+)-ATPase from eel electroplax membrane. J. Membrane BioL 19:163
Shamoo, A. E., Myers, M., Blumenthal, R., Albers, R.W. 1974. Ionophoric material derived from eel membrane preparation. I. Chemical Characteristics. J. Membrane BioL 19:129
Szabo, G., Eisenman, G., Ciani, S. 1969. The effects of the macrotetralide actin anti- biotics on the electrical properties of phospholipid bilayer membranes. J. Membrane BioL 1: 346
Wyman, J. 1948. Heme proteins. Advanc. Protein Chem. 4:407