Published: August 12, 2011 r2011 American Chemical Society 10239 dx.doi.org/10.1021/jf200788p | J. Agric. Food Chem. 2011, 59, 10239–10246 ARTICLE pubs.acs.org/JAFC Isotopes as Tracers of the Hawaiian Coffee-Producing Regions Carla Rodrigues,* ,†,‡ Marion Brunner, § Shawn Steiman, # Gabriel J. Bowen, ^ Jos e M. F. Nogueira, ‡ Loren Gautz, X Thomas Prohaska, § and Cristina Maguas † † Stable Isotopes and Instrumental Analysis Facility (SIIAF), Center for Environmental Biology, Faculty of Sciences, Ed. C2, Room 2.1.16, University of Lisbon, Campo Grande, 1749-016 Lisbon, Portugal ‡ Chemistry and Biochemistry Department and Centre of Chemistry and Biochemistry, Chromatography and Capillary Electrophoresis Laboratory, Faculty of Sciences, Ed. C8, University of Lisbon, Campo Grande, 1749-016 Lisbon, Portugal § Department of Chemistry Research group of Analytical Chemistry, VIRIS Laboratory, University of Natural Resources and Life Sciences (BOKU-UFT), Konrad Lorenz Strasse 24, A-3430 Tulln, Austria # Coffea Consulting, 1418 Mokuna Place, Honolulu, Hawaii 96816, United States ^ Department of Earth and Atmospheric Sciences, Purdue Climate Change Research Center, Purdue University, 550 Stadium Mall Drive, West Lafayette, Indiana 47907, United States X Department of Molecular Biosciences and Biosystems Engineering, University of Hawaii, 1955 EastWest Road, Honolulu, Hawaii 96822, United States b S Supporting Information ABSTRACT: Green coffee bean isotopes have been used to trace the effects of different climatic and geological characteristics associated with the Hawaii islands. Isotope ratio mass spectrometry (IRMS) and inductively coupled plasma mass spectrometry ((MC)-ICP-SFMS and ICP-QMS) were applied to determine the isotopic composition of carbon (δ 13 C), nitrogen (δ 15 N), sulfur (δ 34 S), and oxygen (δ 18 O), the isotope abundance of strontium ( 87 Sr/ 86 Sr), and the concentrations of 30 different elements in 47 green coffees. The coffees were produced in five Hawaii regions: Hawaii, Kauai, Maui, Molokai, and Oahu. Results indicate that coffee plant seed isotopes reflect interactions between the coffee plant and the local environment. Accordingly, the obtained analytical fingerprinting could be used to discriminate between the different Hawaii regions studied. KEYWORDS: isotopes, coffee, multielement analysis, IRMS, ICP-MS ’ INTRODUCTION Several studies have shown that green coffee beans from different geographical origins have different elemental and iso- topic compositions. 1,2 Krivan and collaborators 1 demonstrated the potential of measuring elemental fingerprints of coffee beans to discriminate between different origins. This study was com- plemented by Serra and coauthors 2 with the determination of the isotopic composition of carbon, nitrogen, and boron in green coffees from 19 different countries, showing that the isotopic composition of these three elements is a good indicator of geographical-dependent parameters and, therefore, a useful tool to infer the region of production of green coffee. However, the study of the relationships between isotopes of the coffee plant seed and environmental factors is still recent. 3 Rodrigues and coauthors 3 have determined isotope ratios of carbon, nitrogen, oxygen, and strontium of green coffee beans and have searched for relationships between the measured isotope ratios and available information on environmental factors. Such studies are important to the understanding of how the seed integrates isotope fractionations occurring during its development, asso- ciated with change of local climate and geology. This may ultimately lead to the discrimination of coffee-producing regions. Currently, stable isotope analysis is a powerful tool in ecological studies to trace, record, source, and integrate ecological parameters of interest and has been extensively used in food authentication studies. 4 The H, C, N, O, S, and Sr isotopes are the elements that vary the most on Earth, that constitute the bulk of all living matter, and that are used most effectively to track changes in the Earth’s biogeochemical cycles. With regard to carbon isotopes, the basis for much of the observed variation in δ 13 C of organic samples derives from two metabolic processes, photosynthesis and respiration. 5 Also, as the environment changes, a wide range of δ 13 C values within biological materials suggests multiple and very different processes leading to this observation, such as stomatal control. 6 In relation to oxygen, meteoric waters can vary in their δ 2 H and δ 18 O as they move through the hydro- logical cycle. 7 Many important factors influence the δ 2 H and δ 18 O of meteoric waters, for example, seasonality and therefore the changes in condensation temperatures of precipitation, latitude, altitude, and orographic barriers. 8 Once water is taken up by plants, the δ 2 H and δ 18 O of “body/source” water and biosynthetic compounds that incorporate H or O may or may not also have associated fractionations that are “recorded” in the organic molecules that contain these elements. 9,10 As the pro- cesses involved in these fractionations become better understood, Received: February 25, 2011 Revised: August 11, 2011 Accepted: August 12, 2011
Transcript
Published: August 12, 2011
r 2011 American Chemical Society 10239 dx.doi.org/10.1021/jf200788p | J. Agric. Food Chem. 2011, 59, 10239–10246
ARTICLE
pubs.acs.org/JAFC
Isotopes as Tracers of the Hawaiian Coffee-Producing RegionsCarla Rodrigues,*,†,‡ Marion Brunner,§ Shawn Steiman,# Gabriel J. Bowen,^ Jos�e M. F. Nogueira,‡
Loren Gautz,X Thomas Prohaska,§ and Cristina M�aguas†
†Stable Isotopes and Instrumental Analysis Facility (SIIAF), Center for Environmental Biology, Faculty of Sciences, Ed. C2,Room 2.1.16, University of Lisbon, Campo Grande, 1749-016 Lisbon, Portugal‡Chemistry and Biochemistry Department and Centre of Chemistry and Biochemistry, Chromatography and Capillary ElectrophoresisLaboratory, Faculty of Sciences, Ed. C8, University of Lisbon, Campo Grande, 1749-016 Lisbon, Portugal§Department of Chemistry Research group of Analytical Chemistry, VIRIS Laboratory, University of Natural Resources and LifeSciences (BOKU-UFT), Konrad Lorenz Strasse 24, A-3430 Tulln, Austria
#Coffea Consulting, 1418 Mokuna Place, Honolulu, Hawaii 96816, United States^Department of Earth and Atmospheric Sciences, Purdue Climate Change Research Center, Purdue University, 550 StadiumMall Drive,West Lafayette, Indiana 47907, United States
XDepartment of Molecular Biosciences and Biosystems Engineering, University of Hawaii, 1955 EastWest Road, Honolulu,Hawaii 96822, United States
bS Supporting Information
ABSTRACT: Green coffee bean isotopes have been used to trace the effects of different climatic and geological characteristicsassociated with the Hawaii islands. Isotope ratio mass spectrometry (IRMS) and inductively coupled plasma mass spectrometry((MC)-ICP-SFMS and ICP-QMS) were applied to determine the isotopic composition of carbon (δ13C), nitrogen (δ15N), sulfur(δ34S), and oxygen (δ18O), the isotope abundance of strontium (87Sr/86Sr), and the concentrations of 30 different elements in 47 greencoffees. The coffees were produced in five Hawaii regions: Hawaii, Kauai, Maui, Molokai, and Oahu. Results indicate that coffee plantseed isotopes reflect interactions between the coffee plant and the local environment. Accordingly, the obtained analytical fingerprintingcould be used to discriminate between the different Hawaii regions studied.
Several studies have shown that green coffee beans fromdifferent geographical origins have different elemental and iso-topic compositions.1,2 Krivan and collaborators1 demonstratedthe potential of measuring elemental fingerprints of coffee beansto discriminate between different origins. This study was com-plemented by Serra and coauthors2 with the determination of theisotopic composition of carbon, nitrogen, and boron in greencoffees from 19 different countries, showing that the isotopiccomposition of these three elements is a good indicator ofgeographical-dependent parameters and, therefore, a useful toolto infer the region of production of green coffee. However, thestudy of the relationships between isotopes of the coffee plantseed and environmental factors is still recent.3 Rodrigues andcoauthors3 have determined isotope ratios of carbon, nitrogen,oxygen, and strontium of green coffee beans and have searchedfor relationships between the measured isotope ratios andavailable information on environmental factors. Such studiesare important to the understanding of how the seed integratesisotope fractionations occurring during its development, asso-ciated with change of local climate and geology. This mayultimately lead to the discrimination of coffee-producing regions.Currently, stable isotope analysis is a powerful tool in ecologicalstudies to trace, record, source, and integrate ecological parametersof interest and has been extensively used in food authentication
studies.4 The H, C, N, O, S, and Sr isotopes are the elements thatvary the most on Earth, that constitute the bulk of all livingmatter, and that are used most effectively to track changes in theEarth’s biogeochemical cycles. With regard to carbon isotopes,the basis for much of the observed variation in δ13C of organicsamples derives from two metabolic processes, photosynthesisand respiration.5 Also, as the environment changes, a wide rangeof δ13C values within biological materials suggests multiple andvery different processes leading to this observation, such asstomatal control.6 In relation to oxygen, meteoric waters canvary in their δ2H and δ18O as they move through the hydro-logical cycle.7 Many important factors influence the δ2H andδ18O of meteoric waters, for example, seasonality and thereforethe changes in condensation temperatures of precipitation,latitude, altitude, and orographic barriers.8 Once water is takenup by plants, the δ2H and δ18O of “body/source” water andbiosynthetic compounds that incorporateH orOmay ormay notalso have associated fractionations that are “recorded” in theorganic molecules that contain these elements.9,10 As the pro-cesses involved in these fractionations become better understood,
Received: February 25, 2011Revised: August 11, 2011Accepted: August 12, 2011
Journal of Agricultural and Food Chemistry ARTICLE
plant materials present themselves as valuable “biomarkers” ofecological processes because when tissues are formed, they areknown to record temperatures, water sources, and levels ofrelative humidity prevailing at that time.11 In the case of nitrogen,variation in the δ15N in its cycle processes has been increasinglystudied. Knowledge of how the isotopes of N fractionate duringcatabolic reactions in soils and in plants in relation to N utili-zation, transformation, and fixation elucidate the pathways andinteractions that many times result from land-use and agriculturalpractices.12 In addition, it has become apparent that the use ofboth sulfur (S) and strontium (Sr) isotopes holds great promisefor detecting and therefore understanding the nature and mag-nitude of ecological change. Sulfur stable isotopes have beenuseful in pollution studies.13,14 For all Sr isotope research, it isimportant to understand that the 87Sr/86Sr ratio depends onwhat the parent�daughter rubidium (Rb) to strontium ratio(specifically, 87Rb/86Sr) in the source is and how long ago in timeit fractionated. Although isotope fractionation in seeds (e.g.,coffee beans) is yet poorly understood, previous work suggeststhat the coffee bean may be a valuable indicator of ecologicalprocesses and geology.3 Nonetheless, a solid interpretation ofisotope abundance in the green coffee bean is complicated by thecombination of environmental, climatic, and physiological pro-cesses. The results obtained so far suggest that there is not aunique interpretation for the distribution of isotopic composi-tion of green coffee beans at global scale. Seasonal variations inhumidity, temperature, and precipitation, as well as geology, andexperimental or human impacts influence the isotopic signatures(ratios) of elements in coffee. These effects make data inter-pretation more challenging but may enable the discrimination ofeasily delineated small regions. For this reason, a scale-down wasdone in this study of coffees produced in the state of Hawaii, thegourmet quality of which is known worldwide.
The goal of this work was tomeasure the isotopic composition(C, N, O, S, and Sr) and multielemental concentrations in greencoffees to differentiate between Hawaiian coffee-producing re-gions. To interpret isotope variations in the Hawaiian greencoffee beans, relationships between results obtained and availableinformation on altitude, volcanic activity, and annual mean δ18Ovalues of precipitation were also addressed.
’MATERIALS AND METHODS
Samples and Climate. Green Arabica coffee beans (47 samples)from five different Hawaii coffee-producing regions were provided byCoffea Consulting and the University of Hawaii. The Hawaii stateregions included in this study were Hawaii, Kauai, Maui, Molokai, andOahu (Figure 1). Hawaii was the only region where it was possible tocollect samples from two different harvest years, 2007 and 2008. Allother green coffee bean samples included in this study dated from 2007.The samples fromHawaii were obtained from three districts: Kau, Puna,and Kona (Figure 1), where farms are characterized for being just a fewsquare meters. The harvest period in the Hawaii region starts in June/August (depending on altitude) and extends until February/March, themiddle point being September/October. Each sample from the Kaudistrict was collected at a different farm. The 13 coffee samples from theKona district were obtained from eight farms. In five of these eight farms,it was possible to obtain one sample from 2007 and one from 2008. Thetwo samples from Puna were obtained from two different farms, duringthe harvest period of 2007. Samples from Eleele at Kauai (Figure 1)originated from a single estate farm considered to be the largest inHawaii state, with more than 12000 m2 of coffee in production. One
sample was obtained also at this region but from another farm at Kapahi.In Kauai, the coffee harvest period is shorter compared to the otherregions, beginning in late August and ending in late November. In thecase of Maui, Molokai, and Oahu, coffee is harvested from July/Augustuntil February. Samples fromMaui were obtained from a farm located inKaanapali and from another farm in Kula (Figure 1). The two samplesfrom the Molokai region were produced from the same farm. In theOahu region, samples were collected from a farm at Waialua and fromfarms at Waiahole and Kunia (Figure 1). Each green coffee bean sampleconsisted of 100 g of green coffee beans. The samples were packed undervacuum and transferred to the laboratory for further analysis. Wheneverpossible, latitude and longitude data were obtained with Google Earthsoftware, version 5.0,15, and annual mean δ18Oprec was acquired fromthe Online Isotopes in Precipitation Calculator (OIPC 2.2).16 Informa-tion on temperature (daily mean values for each geographical location)was acquired from the Hawaii Natural Resource Information System(HNRIS). 17
Isotope Ratio Mass Spectrometry (IRMS). Sample Prepara-tion. Each green coffee bean sample (100 g) was ground in a mill (TypeMM2, Retsch, Germany), three times for 5 min each time, to obtainparticle sizes of <1 mm to achieve a homogeneous sample. After grinding,samples were dried overnight at 45 �C and then weighed in tin capsulesthat were then folded close. Moreover, from one of the samples (chosenrandomly), 30 green coffee beans were separated and ground individually.The goal was to analyze the 30 green coffee beans separately for C, N, S,and O isotopic composition to have an indication of the standard devia-tion of the isotopic composition of each element within each coffee.
Combustion (EA-C) mode. Carbon stable isotope ratio was deter-mined on a SIRA II (VG Isogas, U.K.) stable isotope ratio mass spectrom-eter coupled to an elemental analyzer (EuroVector, Italy) for samplepreparation by combustion�reduction. Nitrogen and sulfur stable iso-tope ratios were determined on an Isoprime (Micromass, U.K.) isotoperatio mass spectrometer coupled to an elemental analyzer (EuroVector).Coupling of the elemental analyzers and isotope ratio mass spectro-meters was via open split. Sulfur isotope ratios were determined byDumas combustion/reduction at 1025 �C on a quartz reactor withtungsten oxide on alumina as oxidation catalyst and pure reduced copperwires as reduction agent for removal of excess oxygen. Water resultingfrom combustion was removed with a magnesium perchlorate trap,and gas separation was achieved on a gas chromatography column forS (EuroVector), maintained at 95 �C. Isotope ratios were calibratedagainst international standards, namely, IAEA CH6 (sucrose) and IAEACH7 (polyethylene) for carbon isotope ratio, IAEA N1 (ammoniumsulfate) for nitrogen isotope ratio, and IAEA S1 (silver sulfide) and
Figure 1. Different Hawaii regions and corresponding districts (darkrectangles; approximate location) fromwhere green coffee bean sampleswere obtained.
Journal of Agricultural and Food Chemistry ARTICLE
NBS 127 (barium sulfate) for sulfur isotope ratio. Analytical perfor-mance, stability and drift, was checked by inserting laboratory standardsbetween samples, that is, sorghum flour standard OAS (B2158, Ele-mental Microanalysis) for carbon and nitrogen and ground green coffeebean for sulfur. Correction was made when necessary. Precision(standard deviation of the set of standards analyzed in each batch,n = 6) was 0.06% for carbon, 0.08% for nitrogen, and 0.3% for sulfurisotope ratio determinations. Carbon, nitrogen, and sulfur isotopic com-positions of 30 individual coffee beans from a single site were deter-mined to estimate the possible variation of δ13C, δ15N, and δ34S withineach coffee sample. The standard deviations obtained for δ13C, δ15N,and δ34S of the 30 individual beans were 1.4, 0.8, and 0.5%, respectively.The histograms of the results obtained for the determination of δ13C,δ15N, and δ34S of the 30 individual coffee beans of the same coffee areshown in Figure S1 of the Supporting Information.Pyrolysis (EA-P) Mode.Oxygen isotope ratios were determined on an
Isoprime isotope ratio mass spectrometer coupled to an elementalanalyzer (EuroVector) by high-temperature pyrolysis. Pyrolysis wasaccomplished at 1300 �C on a glassy carbon reactor with glassy carbonchips and nickel-plated carbon as catalysts, mounted coaxially on aceramic tube. Coupling of the elemental analyzer and isotope ratio massspectrometer was performed via open split. The isotope ratio data werecorrected against international standards (IAEA 601 and IAEA 602).Analytical performance, stability and drift, was checked by insertinglaboratory standards between samples. Correction was made whennecessary. Precision was 0.14%. Oxygen isotopic composition of 30individual coffee beans yielded a standard deviation for δ18O of 0.4%.Strontium Isotope Ratio Measurement by Multicollector
(Merck, Darmstadt, Germany) was subboiled doubly in an ultrapurequartz apparatus (MLS DuoPur, MLS, Leutkirch im Allg€au, Germany).Deionized water (18 MΩ cm; SG, Wasseraufbereitung and Regenier-station GmbH, Barsbuttel, Germany) was subboiled prior to usage aswell. Subboiled HNO3 and 31%H2O2 (p.a. grade, Merck) were used formicrowave-assisted digestion. Polyethylene flasks and cartridges as wellas polypropylene tubes and lids were cleaned sequentially with HNO3
(10% (v/v)) and HNO3 (1% (v/v)) and rinsed with deionized waterbefore use. Dilution of standards and samples was performed gravime-trically with HNO3 (1% (v/v)), prepared from subboiled water anddoubly subboiled HNO3. A 20 ng g�1 solution of SRM 987 SrCO3
(NIST, Gaithersburg, MD) was used for quality control of the Sr isotoperatio measurements. The certified 87Sr/86Sr ratio is 0.71034( 0.00026,whereas a generally “accepted value” of the 87Sr/86Sr ratio for thisreference material is reported in the literature as 0.710263 ( 0.000016(the error represents a range of 2 standard deviations determined fromthe external reproducibility).18
Sample Preparation. Four to six beans (amounting to about 1.0 g)were ground in a Retsch mill typeMM2, three times for 5 min each time,to obtain particle sizes of <1 mm. Approximately 0.5 g of the groundmaterial was directly weighed into Teflon bombs for subsequentmicrowave-assisted digestion (MLS 1200mega, MLS). Concentrateddouble-subboiled HNO3 (6 mL) and H2O2 (1 mL) were used asdigestion reagents. Details are presented elsewhere.19 The samples werefinally transferred into 50 mL flasks, filled with HNO3 (1% v/v to 20 g,filtered using a 5 mL syringe through 0.45 μm filters (Minisart RC 25)and stored at room temperature for future analysis. A digestion blankwas prepared with each digestion batch.Strontium/Matrix Separation. The obtained digestion solutions of
green coffee bean samples were separated according to the method ofSwoboda and coauthors,19 using Eichrom Sr resin (Eichrom Industries,Darien, IL). The solutions were diluted after separation to a final Srconcentration of about 20 ng g�1 to obtain optimum signal intensities of88Sr from 3 to 5 V. The fractionation effect of the column extraction
procedure on the Sr isotopic ratio was checked according to the sameauthors19 and proved to be insignificant.Instrumentation. Screening of the solutions for Rb and Sr prior
to and after separation was performed by using a quadrupole-basedinductively coupled plasma mass spectrometer ICP-MS (Elan DRCe,Perkin-Elmer, Waltham,MA). Sr isotope ratio measurements of the finalsolutions were accomplished using a double-focusing multicollectorinductively coupled plasma mass spectrometer (MC-ICP-MS) (NuPlasma HR, Nu Instruments Ltd., Wrexham, U.K.) coupled to amembrane desolvating system (DSN 100, Nu Instruments Ltd.). TheDSN 100 instrument was equipped with a PFA nebulizer (MicroFlownebulizer, Elemental Scientific, Omaha, NE) and a spray chamber withadditional hot gas flow to eliminate condensation and droplet formation.The multicollector inductively coupled plasma mass spectrometer isequipped with a collector configuration consisting of 12 Faraday cupsand 3 ion counters. The latter were not used throughout this study. Allisotopes in this work (82Kr, 83Kr, 84Sr, 85Rb, 86Sr, 87Sr, and 88Sr) weremeasured simultaneously using Faraday cups. Experimental parametersof the MC-ICP-MS including nebulizer gas, rf power, and ion transferlens potentials were optimized to achieve the maximum ion intensity for88Sr, using NIST SRM 987 solution at a concentration of 20 ng g�1. Theoperation parameters are described in detail in the Supporting Informa-tion (Table S1). Blank correction and mass bias correction wereperformed according to previous measurements.19
Multielement Analysis by ICP-MS. All digestion solutionsobtained for Sr isotope analysis were screened for different elements,and their total concentration was calculated through external calibrationperformed with a multielement standard solution VI (Merck KGaA).Nine calibration levels were prepared with concentrations of 0.05, 0.1,0.5, 1, 5, 10, 25, 50, and 100 ng g�1, respectively. For internal normal-ization, an indium standard was added to a final content of 10 ng g�1.HNO3 (1% (v/v)) was used for blank correction. The blank correctedconcentrations of the different isotopes in each sample were calculatedby the instrumental software through external calibration, based onlinear regression and/or weighted regression and internal normalizationafter blank subtraction. The determination of the element concentra-tions was accomplished with a quadrupole mass spectrometer ELANDRC-e (PerkinElmer, Ontario, Canada) and, in the case of rare earthelements (REE), with a high-resolution sector field mass spectrometerELEMENT 2 (Thermo Scientific, Bremen, Germany) under the opera-tional conditions described in Table S2 of the Supporting Information.The concentrations of the elements B, Na, Mg, Al, Cr, Mn, Fe, Co, Ni,Cu, Zn, Ga, Rb, Sr, Mo, Ba, Pb, Bi, Y, La, Ce, Pr, Sm, Nd, Eu, Dy, Th, Sc,Ho, and Gd were determined in all green coffee bean samples. Theuncertainty of the multielement measurements was calculated usingGUMWorkbench Pro (version 1.2, Metrodata GmbH, Germany). TheGuide to the Expression of Uncertainty in Measurement (GUM) waspublished by ISO and establishes the general rules for evaluating andexpressing uncertainty.20 The limit of detection (LOD) was calculatedaccording to the method of Thomsen and coauthors.21
Statistical Analysis. Multivariate statistics for the classification ofcoffee samples of various origins was performed in SPSS version 15.0. Acanonical discriminant analysis including a leave-one-out classification(Umethod) was performed, and the classification score was re-examinedvia cross-validation. The variance expressed in the eigenvalue was set tobe >1 for both methods. One-way ANOVA analysis was used to evaluatesignificant differences among coffee-producing regions with regard toeach element analyzed in this study and was performed with theStatistica software (version 9.0) (Statsoft, Tulsa, OK).
’RESULTS AND DISCUSSION
Coffee Bean Oxygen Isotopic Composition. The oxygenisotopic composition of the green coffee beans samples varied
Journal of Agricultural and Food Chemistry ARTICLE
by 7%. The δ18O values of the different coffees varied from25.9% (Hawaii) to 32.5% (Oahu; Table 1). The analysis of 30individual coffee beans from the same coffee sample showed astandard deviation of 0.4%. This value was assumed as indicativeof the variation of the isotopic composition of oxygen within eachcoffee sample. The values measured for each individual greencoffee bean sample included in this study are shown in Table S3of the Supporting Information. Higher values of mean δ18Owereobtained for coffees produced at lower altitude. All coffees withδ18O >29% were produced at altitudes of <300 m (Figure 2).Coffees from Eleele and Kapahi (Kauai), from Kunia, Waialua,and Waiahole (Oahu), from Kualapuu (Molokai), and fromKaanapali (Maui), produced at altitudes of <250 m, had a meanδ18O value from 29 to 32.5% (Table 1). In comparison to thesesites, coffees from theHawaii region, and Kula inMaui, had lowermean δ18O values, ranging from 25.9 to 28.9% (Table 1). Themean δ18O values per region, and respective standard deviations,are shown in Figure 3a. This allowed the separation of twogroups: Hawaii and other regions. For each coffee, known valuesof latitude, longitude, and altitude allowed predicted values ofδ18O of local precipitation to be obtained with the OIPC (TheOnline Isotopes in Precipitation Calculator).16 A positive corre-lation was obtained between the δ18O of the coffee beans andof local precipitation (r = 0.56; p < 0.05). These results indi-cate that the isotopic composition of oxygen of the Hawaiiancoffees studied varies according to the altitude at which they are
produced, a parameter that is known to influence the isotopiccomposition of local precipitation (due to changes in tempera-ture). Although the isotope fractionation processes occurringduring the coffee plant fruit and seed development are stillpoorly understood, the isotopic composition of the coffee beanis expected to be the result of the fractionations associatedwith several metabolic pathways of the plant, occurring duringthe seed development period (8 months on average in the case of
Table 1. Origin, Daily Mean Temperature, Annual Mean δ18O of Precipitation, and Isotopic Composition of C, N, O, S, and Srof Hawaiian Green Coffees (Whenever n g 3, Average and Standard Deviation Are Shown)
Kuna 80 (n = 1) � �2.6 32.5 14.4 0.7056 �27.5 1.2a Latitude and longitude values are not shown to maintain grower or farm anonymous. b From HNRIS.17 c From OIPC.16 dData are unavailable for theselected location.
Figure 2. δ18O of the green coffee beans in relation to altitude.
Journal of Agricultural and Food Chemistry ARTICLE
Coffea arabica). Several authors have shown that the δ18O ofwater in plants changes as a result of variations in δ18O of watertaken up by the plants and leaf water enrichment of 18O duringtranspiration, the latter of which is dependent on atmosphericconditions (relative humidity and δ18O of water vapor in theatmosphere), of stomatal regulation of water loss, and of the
variation in δ18O of water in cells forming organic material.6,22
This supports the results observed in this work and the relation-ship between the δ18O values of the green coffee beans and oflocal precipitation, with variations possibly associated with eachregion's characteristic climate and plant ecophysiology. Coffeesfrom the Hawaii region are produced at higher altitudes inrelation to the other regions, which, in turn, can be associatedwith more depleted δ18O of precipitation (Table 1). On thisisland, higher values of coffee bean δ18O were observed only atlow altitude, where higher δ18O of precipitation is expected.However, some of the more depleted coffee δ18O values comefrom lower altitude, as in the case of the coffees from the Konaregion (Table 1). This area receives rainfall from storm systemsunrelated to trade winds, which can be accentuated by frontalsystems and “Kona storms”.23 As a consequence, more depletedδ18O values of rainfall have been observed. This difference in theδ18O of storm precipitation coincides with the results observedfor δ18O values measured in the Kona and Puna coffees, despitethe lower altitude.Coffee Bean Sulfur Isotopic Composition. The variation
observed in the sulfur isotopic composition of the different coffeeswas 20%. Values of δ34S of the green coffee bean samples rangedfrom �1.5 to 21.3% (Table 1). The standard deviation of δ34Sdetermined for 30 individual coffee beans from the same coffeesample was 0.5%. Coffees from the Hawaii region had δ34Svalues from �1.5 to 7.7%, with the exceptions of a sample fromKona (11.9%) and one from Puna (12.7%) (Table 1). The δ34Svalues of Hawaii coffees were lower than those from Kauai,especially in the case of Eleele, which showed a δ34S average of18( 1.8% (Table 1). Also in Kauai in Kapahi, the observed δ34Svalue was 10.5%. Coffees from Maui showed δ34S of 16.8 (3.8% in Kaanapali (Table 1). In the case ofMolokai, the observedδ34S values of the two coffee bean samples were 9.8 and 9.7%(Table 1). In Oahu, δ34S varied from an average of 10.4( 2.7%(Waialua) to values of 14.4 and 15.2% at Kuna and Waiahole,respectively (Table 1). Despite the wide range of coffee δ34Svalues observed, it is possible to differentiate coffees from theHawaii region from those produced on other islands (Figure 3b).The higher δ34S values (>15%) were observed at altitudes of<200 m, in locations closer to the ocean, which in most casescorrespond to regions other than Hawaii (Table 1). For mostplants, the normal source of sulfur is the sulfate taken up by thesoil fine roots. The plant’s assimilatory sulfate reduction thatprovides “organic sulfur” from sulfate proceeds without importantsulfur isotope fractionations.24 In general, bulk plant sulfur isdepleted by only 1�2% relative to its primary sources, soil andsea spray sulfates or SO2 from the atmosphere.24 Althoughthe details of sulfur isotope biochemistry in coffee plant seeds areunknown, it is not unreasonable to hypothesize that green coffeebeans record the isotopic signature of the sulfur source(s).One possibility could be the use of fertilizers, which also influenceδ34S of sulfates in soil and plants. Several coffees included in thisstudy were produced with organic fertilizers, whereas others weregrown with the application of synthetic fertilizers. However, dif-ferences between organic and synthetically fertilized coffees withregard to coffee bean δ34S have not been observed. The presenceof active volcanos in some of the regions included in this studyis also expected to influence the δ34S values of the coffee beansamples. In the Hawaiian islands, δ34S values of sulfates fromvolcanic ash and basalt-derived soils ranging from 6.3 to 18% havebeen reported.25 Most importantly, the more enriched of thosevalues correspond to shorter distances to the sea.25 Our results
Figure 3. δ18O (a), δ34S (b), and 87Sr/86Sr (c) mean ( SD values ofgreen coffee bean samples from Hawaii (n = 24), Kauai (n = 9), Maui(n = 7), and Oahu (n = 6). (Molokai was not included as n = 2.)
Journal of Agricultural and Food Chemistry ARTICLE
show a similar trend, withmore depletedδ34S values of coffee beanmeasured in altitude coffees (longer distance to the sea). A highermarine influence may be responsible for the differences observedin δ34S values of coffee beans from different regions, for example,higher values of δ34S in coffees from Kauai, Maui, and Oahu incomparison to Hawaii, where a greater influence from volcanicactivity is expected (Table 1; Figure 3b). Volcanos Kilauea andMauna Loa located on the island of Hawaii are active, with recenteruptions. Depleted δ34S values of 0.8�0.9% are reported forvolcanic sulfur gases (predominantly SO2) from the Kilaueavolcano.26 This volcanic influencemay explain themore depletedδ34S values of coffee beans produced in the Hawaii region.Nonetheless, monitoring atmospheric, volcanic ash, soil, andprecipitation sulfate isotopes will be important to understandhow sulfur isotopes of coffee beans reflect these importantenvironmental impacts.Coffee Bean Strontium Isotopic Composition. The
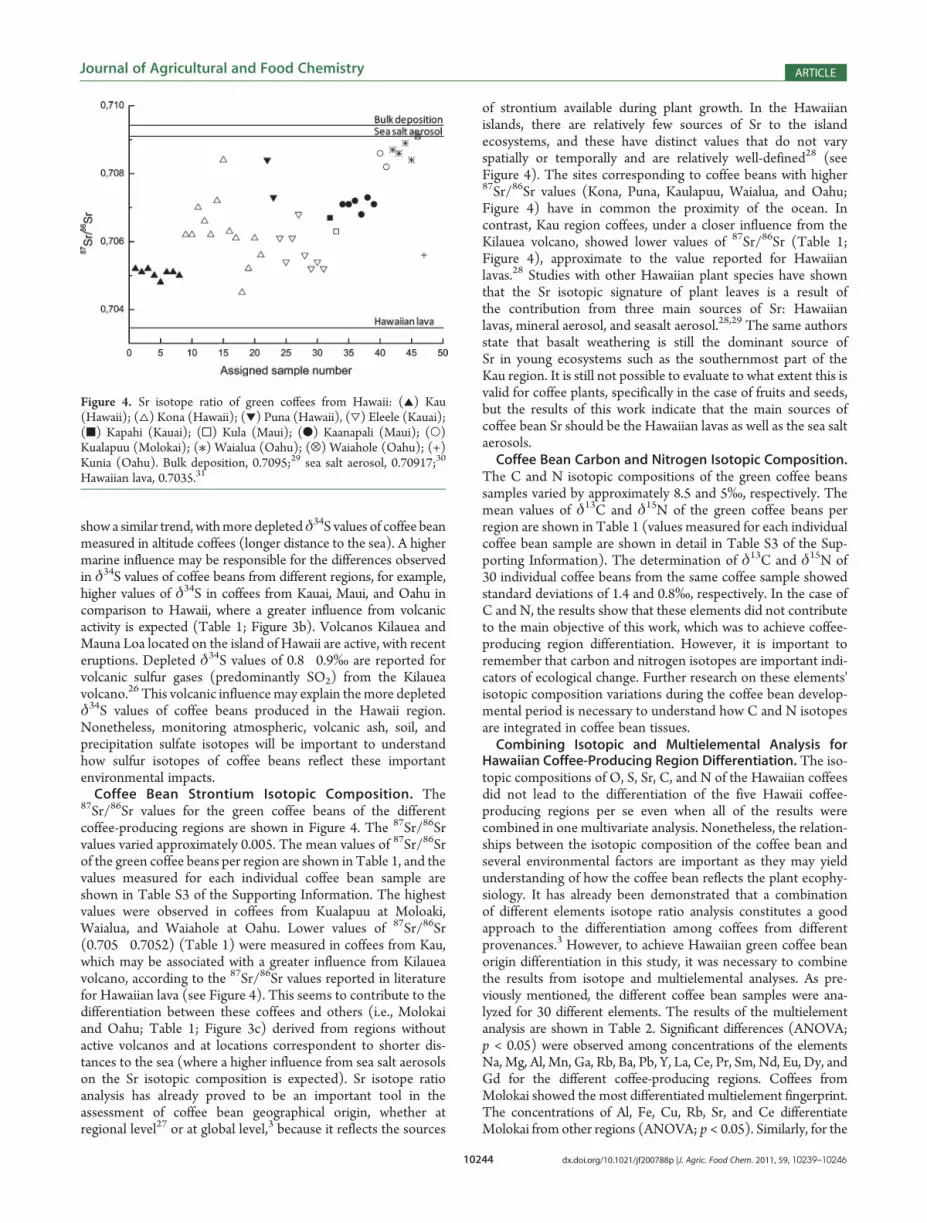
87Sr/86Sr values for the green coffee beans of the differentcoffee-producing regions are shown in Figure 4. The 87Sr/86Srvalues varied approximately 0.005. The mean values of 87Sr/86Srof the green coffee beans per region are shown in Table 1, and thevalues measured for each individual coffee bean sample areshown in Table S3 of the Supporting Information. The highestvalues were observed in coffees from Kualapuu at Moloaki,Waialua, and Waiahole at Oahu. Lower values of 87Sr/86Sr(0.705�0.7052) (Table 1) were measured in coffees from Kau,which may be associated with a greater influence from Kilaueavolcano, according to the 87Sr/86Sr values reported in literaturefor Hawaiian lava (see Figure 4). This seems to contribute to thedifferentiation between these coffees and others (i.e., Molokaiand Oahu; Table 1; Figure 3c) derived from regions withoutactive volcanos and at locations correspondent to shorter dis-tances to the sea (where a higher influence from sea salt aerosolson the Sr isotopic composition is expected). Sr isotope ratioanalysis has already proved to be an important tool in theassessment of coffee bean geographical origin, whether atregional level27 or at global level,3 because it reflects the sources
of strontium available during plant growth. In the Hawaiianislands, there are relatively few sources of Sr to the islandecosystems, and these have distinct values that do not varyspatially or temporally and are relatively well-defined28 (seeFigure 4). The sites corresponding to coffee beans with higher87Sr/86Sr values (Kona, Puna, Kaulapuu, Waialua, and Oahu;Figure 4) have in common the proximity of the ocean. Incontrast, Kau region coffees, under a closer influence from theKilauea volcano, showed lower values of 87Sr/86Sr (Table 1;Figure 4), approximate to the value reported for Hawaiianlavas.28 Studies with other Hawaiian plant species have shownthat the Sr isotopic signature of plant leaves is a result ofthe contribution from three main sources of Sr: Hawaiianlavas, mineral aerosol, and seasalt aerosol.28,29 The same authorsstate that basalt weathering is still the dominant source ofSr in young ecosystems such as the southernmost part of theKau region. It is still not possible to evaluate to what extent this isvalid for coffee plants, specifically in the case of fruits and seeds,but the results of this work indicate that the main sources ofcoffee bean Sr should be the Hawaiian lavas as well as the sea saltaerosols.Coffee Bean Carbon and Nitrogen Isotopic Composition.
The C and N isotopic compositions of the green coffee beanssamples varied by approximately 8.5 and 5%, respectively. Themean values of δ13C and δ15N of the green coffee beans perregion are shown in Table 1 (values measured for each individualcoffee bean sample are shown in detail in Table S3 of the Sup-porting Information). The determination of δ13C and δ15N of30 individual coffee beans from the same coffee sample showedstandard deviations of 1.4 and 0.8%, respectively. In the case ofC and N, the results show that these elements did not contributeto the main objective of this work, which was to achieve coffee-producing region differentiation. However, it is important toremember that carbon and nitrogen isotopes are important indi-cators of ecological change. Further research on these elements'isotopic composition variations during the coffee bean develop-mental period is necessary to understand how C and N isotopesare integrated in coffee bean tissues.Combining Isotopic and Multielemental Analysis for
Hawaiian Coffee-Producing Region Differentiation. The iso-topic compositions of O, S, Sr, C, and N of the Hawaiian coffeesdid not lead to the differentiation of the five Hawaii coffee-producing regions per se even when all of the results werecombined in one multivariate analysis. Nonetheless, the relation-ships between the isotopic composition of the coffee bean andseveral environmental factors are important as they may yieldunderstanding of how the coffee bean reflects the plant ecophy-siology. It has already been demonstrated that a combinationof different elements isotope ratio analysis constitutes a goodapproach to the differentiation among coffees from differentprovenances.3 However, to achieve Hawaiian green coffee beanorigin differentiation in this study, it was necessary to combinethe results from isotope and multielemental analyses. As pre-viously mentioned, the different coffee bean samples were ana-lyzed for 30 different elements. The results of the multielementanalysis are shown in Table 2. Significant differences (ANOVA;p < 0.05) were observed among concentrations of the elementsNa, Mg, Al, Mn, Ga, Rb, Ba, Pb, Y, La, Ce, Pr, Sm, Nd, Eu, Dy, andGd for the different coffee-producing regions. Coffees fromMolokai showed the most differentiated multielement fingerprint.The concentrations of Al, Fe, Cu, Rb, Sr, and Ce differentiateMolokai from other regions (ANOVA; p < 0.05). Similarly, for the
Figure 4. Sr isotope ratio of green coffees from Hawaii: (2) Kau(Hawaii); (4) Kona (Hawaii); (1) Puna (Hawaii), (3) Eleele (Kauai);(9) Kapahi (Kauai); (0) Kula (Maui); (b) Kaanapali (Maui); (O)Kualapuu (Molokai); (/) Waialua (Oahu); (X) Waiahole (Oahu); (+)Kunia (Oahu). Bulk deposition, 0.7095;29 sea salt aerosol, 0.70917;30
Journal of Agricultural and Food Chemistry ARTICLE
Kaui region, Ba, Na, and Ga concentrations were significant forthe differentiation from other regions. Oahu coffees were differentwith regard to the Ni concentration, and Hawaii showed similarresults except for Nd, La, Y, Co, and Mn (Table 2). Nonetheless,high standard deviations in the different element concentrationsper region were observed. Combining all of the results obtained bycanonical discriminant analysis allowed the differentiation of thedifferent Hawaiian coffee-producing regions (Figure 5). Threecanonical components were obtained with coefficients >0.9 (p <0.05). It is, however, important to state that the significant groupdifferentiation obtained in this study must be interpreted withcaution. As with all multivariate analyses, the ratio of samples tovariables should be high. Few samples were available in someof thegroups. Because the data analysis was based on more variablesthan groups in the current data set, new data may not be correctlyclassified into the groups because of differences not reflected inthe current data set. In addition, this study does not include dataaddressing multiyear variation. The most important next step is tobuild a model using many more samples including multiple yearsof harvest. Despite these limitations, our work demonstrates thatmultielement and isotope analyses can reveal robust patterns ofvariation among coffees grown in the Hawaiian Islands. Moreover,the characterization of discriminating patterns, elements, and typeof analysis in this study presents researchers with information onhow the chemistry of the coffee plant responds to specific changes inthe environment. Ultimately, this can help illustrate the physiologi-cal responses of the coffee plant and seed to agronomic conditions.In short, it was shown that the combination of S, O, C, N,
and Sr isotope analyses with multielement analysis allowed the
differentiation of the Hawaiian coffee-producing regions. Theresults indicate relationships between environmental variablesand the green coffee bean isotopic composition. Although addi-tional work is needed to clarify the mechanisms underlying manyof these relationships, the results suggest that the isotopic com-position of coffees from different regions may to some degree bepredictable. If so, this would support the use of stable isotopes as atool for the verification of coffee origin. In addition, the coffeeplant seeds’ isotopes may contribute to tracing environmentalimpacts occurring in Hawaii, in particular if related with volcanicactivity, distance to the ocean, and altitude.
Table 2. 30 Elements Determined (Mean ( SD) in Hawaiian Green Coffees
mean (ng g�1, ww)
island where grown B Na Mg Al Cr Mn Fe Co Ni Cu Zn Ga Rb Sr Mo
Hawaii (n = 23) mean 7009 25276 1904396 1617 10315 26319 83391 106 1241 15099 8412 56 10684 4263 127
Journal of Agricultural and Food Chemistry ARTICLE
’ASSOCIATED CONTENT
bS Supporting Information. Further details on the opera-tional conditions for the measurement of Sr isotopic and multielement compositions of the green coffee beans are provided inTables S1 and S2, respectively; experimental results obtained foreach individual coffee bean sample included in this study areshown in Table S3; histograms of the results obtained for thedetermination of δ13C, δ15N, and δ34S of 30 individual coffeebeans of the same sample are shown in Figure S1. This material isavailable free of charge via the Internet at http://pubs.acs.org.
Funding SourcesC.R. thanks the Fundac-~ao para a Ciencia e a Tecnologia for agrant (SFRH/BD/28354/2006) and the Stable Isotopes inBiosphere-Atmospheric-Earth System Research (SIBAE) pro-gram (COSTAction ES0806) for a Short-term ScientificMission(STSM) grant. We gratefully acknowledge financial supportby the Austrian Science Foundation (FWF START Grant 267N11). This work was financed by the project “Pursuing GreenCoffee Geographic Origin Discrimination through Relationsbetween Isotopes and Environmental Factors (IsoGeoCoffee)”from the Portuguese Science Foundation (PTDC/AGR-AAM/104357/2008).
’ACKNOWLEDGMENT
We acknowledge the technical support provided by RodrigoMaia, Johanna Irrgeher, Magdalena Lang, Pedro Pinho, and AliceNunes. We thank James P. Kauahikaua, Andrew J. Sutton, andJanet Babb from USGS Hawaiian Volcano Observatory (HVO)for their support in accessing Hawaii environmental and geo-logical information.
’REFERENCES
(1) Krivan, V.; Barth, P.; Morales, A. F. Multielement analysis ofgreen coffee and its possible use for the determination of origin.Mikrochim. Acta 1993, 110, 217–236.(2) Serra, F.; Guillou, C. G.; Reniero, F.; Ballarin, L.; Cantagallo,
M. I.; Wieser, M.; Iyer, S. S.; H�eberger, K.; Vanhaecke, F. Determinationof the geographical origin of green coffee by principal componentanalysis of carbon, nitrogen and boron stable isotope ratios. RapidCommun. Mass Spectrom. 2005, 19, 2111–2115.(3) Rodrigues, C.; M�aguas, C.; Prohaska, T. Strontium and oxygen
isotope fingerprinting of green coffee beans and its potential to proofauthentication of coffee. Eur. Food Res. Technol. 2011, 232, 361–373.(4) West, J. B.; Bowen, G. J.; Cerling, T. E.; Ehleringer, J. R. Stable
isotopes as one of nature’s ecological recorders. Trends Ecol. Evol. 2006,21, 408–414.(5) Farquhar, G. D.; Ehleringer, J. R.; Hubik, K. T. Carbon isotope
discrimination and photosynthesis. Annu. Rev. Plant Physiol. Plant Mol.Biol. 1989, 40, 503–537.(6) Scheidegger, Y.; Sauer, M.; Bahn, M.; Siegwolf, R. T. W. Linking
stable oxygen and carbon isotopes with stomatal conductance and photo-synthetic capacity: a conceptual model. Oecologia 2000, 125, 350–357.(7) Bowen, G. J.; Wassenar, I. I.; Hobson, K. A. Global application of
stable hydrogen and oxygen isotopes to wildlife forensics. Oecologia2005, 143, 337–348.
(8) Craig, H. Isotopic variation in meteoric waters. Science 1961,133, 1702–1703.
(9) Barbour, M. M. Stable oxygen isotope composition of planttissues: a review. Funct. Plant Biol. 2007, 34, 83–94.
(10) Schmidt, H.-L.; Werner, R. A.; Rossman, A. 18O pattern andbiosynthesis of natural plant products. Phytochemistry 2001, 58, 9–32.
(11) Anderson, W. T.; Bernasconi, S. M.; Mckenzie, J. A.; Sauer, M.;Schweingruber, F. Model evaluation for reconstructing the oxygenisotopic composition in precipitation from three ring cellulose overthe last century. Chem. Geol. 2002, 182, 121–137.
(12) Evans, R. D. Physiological mechanisms influencing plant nitro-gen isotope composition. Trends Plant Sci. 2001, 6, 121–126.
(13) Trust, B. A.; Fry, B. Stable sulphur isotopes in plants: a review.Plant Cell Environ. 1992, 15, 1105–1110.
(14) Wadleigh, M. A. Lichens and atmospheric sulphur: what stableisotopes reveal. Environ. Pollut. 2003, 126, 345–351.
(15) Google Earth, version 5.0, accessed Nov 2010.(16) Bowen, G. J. The Online Isotopes in Precipitation Calculator,
version 2.2, 2011 (http://www.waterisotopes.org).(17) Meng,Q.; Liang, T.HNRIS (Hawaii Natural Resource Information
System) for Windows, University of Hawaii at Manoa, Honolulu, HI, 2007.(18) Schultheis, G. Analysis of Isotope Ratios in Anthropological and
Archaeological Samples by High Resolution Inductively Coupled PlasmaMass Spectrometry (HR-ICP-MS); Universit€at f€ur Bodenkultur amInstitut f€ur Chemie (BOKU): Vienna, Austria, 2003.
(19) Swoboda, S.; Brunner, M.; Boulyga, S. F.; Galler, P.; Horacek,M.; Prohaska, T. Identification of Marchfeld asparagus using Sr isotoperatio measurements by MC-ICP-MS. Anal. Bioanal. Chem. 2008, 390,487–494.
(20) Barwick, V. J.; Ellison, S. L. R.; Lucking, C. L.; Burn, M. J.Experimental studies of uncertainties associated with chromatographictechniques. J. Chromatogr., A 2001, 918, 267–276.
(21) Thomsen, V.; Schatzlein, D.; Mercuro, D. Limits of detection inspectroscopy. Spectroscopy 2003, 18, 112–114.
(22) Barbour, M. M.; Cernusak, L. A.; Farquhar, G. D. Factorsaffecting the oxygen isotope ratio of plant organic material. In Physio-logical Ecology: A Series of Monographs, Texts and Treatises; Flanagan,L. B., Ehleringer, J. R., Pataki, D. E., Eds.; Elsevier: Oxford, U.K., 2005.
(23) Scholl, M. A.; Ingebritsen, S. E.; Janik, C. J.; Kauahikaua, J. P.Use of precipitation and groundwater isotopes to interpret regionalhydrology on a tropical volcanic island: Kilauea volcano area. WaterResour. Res. 1996, 32, 3525–3537.
(24) Tanz, N.; Schmidt, H.-L. δ34S-value measurements in foodorigin assignments and sulphur isotope fractionations in plants andanimals. J. Agric. Food Chem. 2010, 58, 3139–3146.
(25) Mizota, C.; Sasaki, A. Sulfur isotope composition of soils andfertilizers: differences between Northern and Southern Hemispheres.Geoderma 1996, 71, 77–93.
(26) Sakai, H.; Casadevall, T. J.; Moore, J. J. Chemistry and isotoperatios of sulfur in basalts and volcanic gases at Kilauea volcano, Hawaii.Geochim. Cosmochim. Acta 1982, 46, 729–738.
(27) Techer, I.; Lancelot, J.; Descroix, F.; Guyot, B. About Srisotopes in coffee ‘Bourbon Pointu’ of the R�eunion Island. Food Chem.2011, 126, 718–724.
(28) Chadwick, O. A.; Derry, L. A.; Bern, C. R.; Vitousek, P. M.Changing sources of strontium to soils and ecosystems accross theHawaiian Islands. Chem. Geol. 2009, 267, 64–76.
(29) Kennedy, M. J.; Chadwick, O. A.; Vitousek, P. M.; Derry, L. A.;Hendricks, D. M. Replacement of weathering with atmospheric sourcesof base cations during ecosystem development, Hawaiian Islands.Geology 1998, 26, 1015–1018.
(30) Capo, R. C.; Stewart, B. W.; Chadwick, O. A. Strontiumisotopes as tracers of ecosystem processes: theory and methods.Geoderma 1998, 82, 197–225.
(31) Whipkey, C. E.; Capo, R. C.; Chadwick, O. A.; Stewart, B. W.The importance of sea spray to the caption budget of a coastal Hawaiiansoil: a strontium isotope approach. Chem. Geol. 2000, 168, 37–48.