16
KAREN BURNS Interim CFO and VP of Finance | Annual Investor Day 2013
KAREN BURNS Interim CFO and VP of Finance | Annual Investor Day 2013

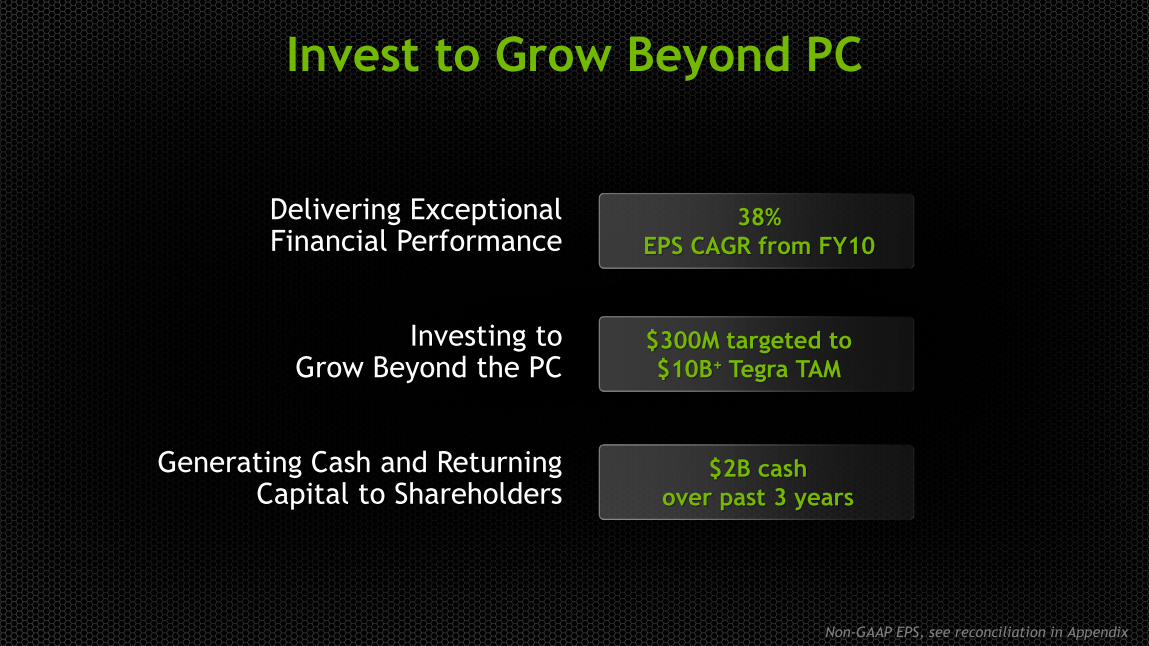
Delivering Exceptional Financial Performance
Investing to Grow Beyond the PC
Generating Cash and Returning Capital to Shareholders
38%
EPS CAGR from FY10
$300M targeted to
$10B+ Tegra TAM
$2B cash
over past 3 years
Non-GAAP EPS, see reconciliation in Appendix
Invest to Grow Beyond PC
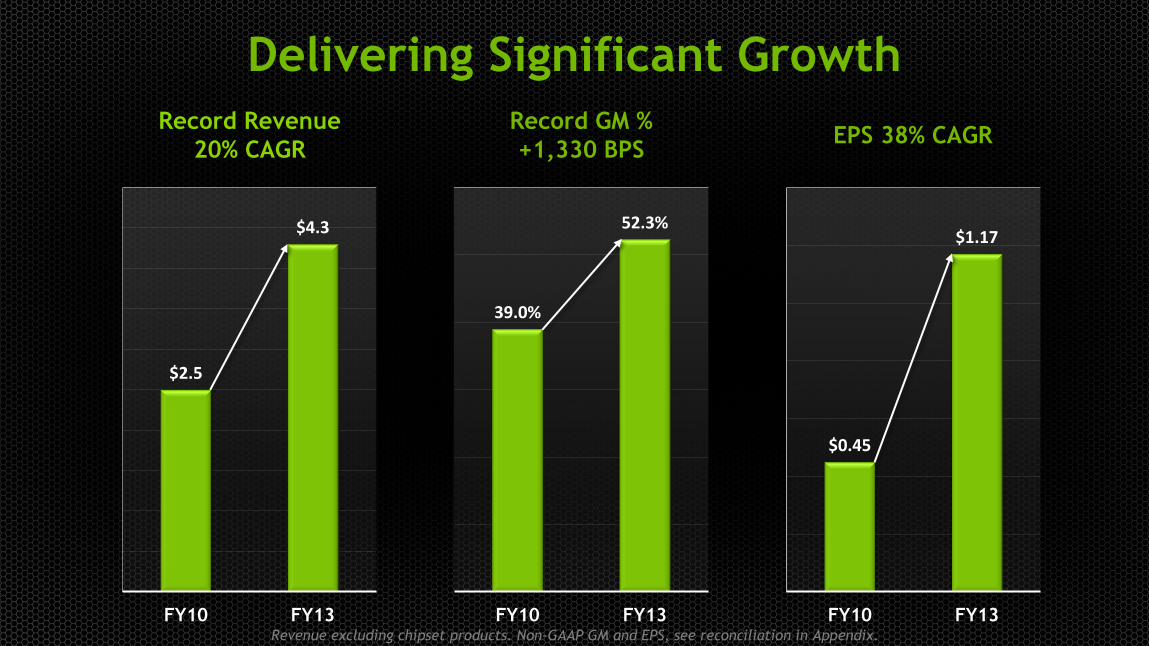
$2.5
$4.3
FY10 FY13
$0.45
$1.17
FY10 FY13
39.0%
52.3%
FY10 FY13
Delivering Significant Growth
Record Revenue
20% CAGR
Record GM %
+1,330 BPS EPS 38% CAGR
Revenue excluding chipset products. Non-GAAP GM and EPS, see reconciliation in Appendix.
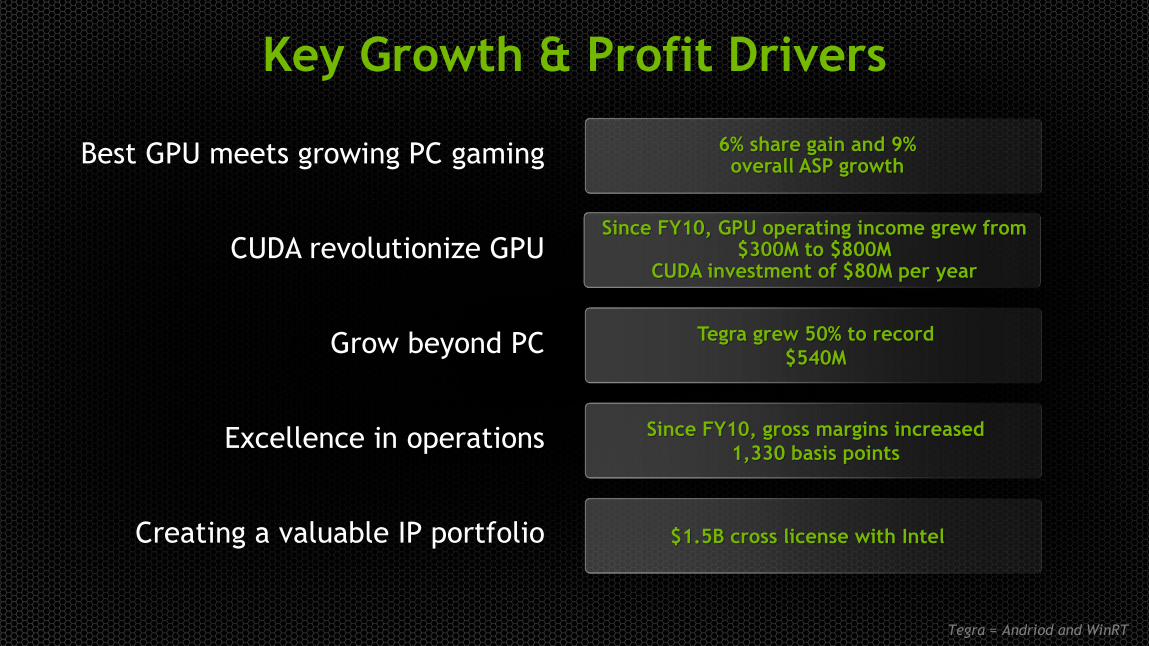
Key Growth & Profit Drivers
Best GPU meets growing PC gaming
CUDA revolutionize GPU
Grow beyond PC
Excellence in operations
Creating a valuable IP portfolio
6% share gain and 9% overall ASP growth
Since FY10, GPU operating income grew from $300M to $800M
CUDA investment of $80M per year
Tegra grew 50% to record
$540M
Since FY10, gross margins increased
1,330 basis points
$1.5B cross license with Intel
Tegra = Andriod and WinRT
FY10 FY13
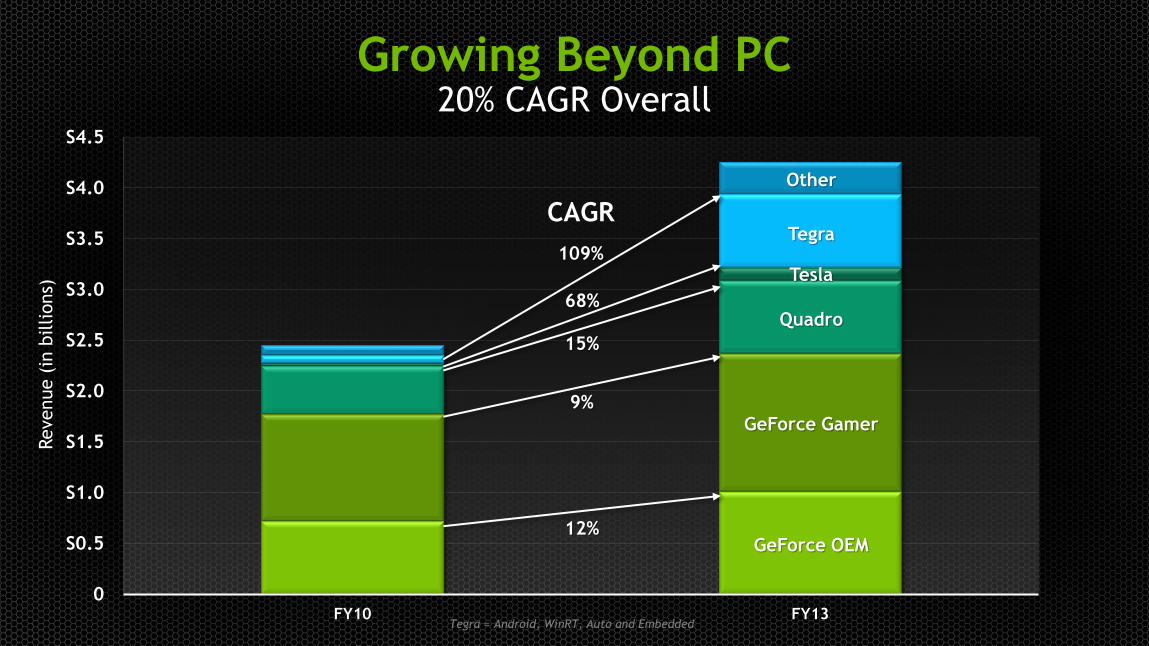
Growing Beyond PC 20% CAGR Overall
S4.5
S4.0
S3.5
S3.0
S2.5
S2.0
S1.5
S1.0
S0.5
0
Revenue (
in b
illions)
GeForce Gamer
GeForce OEM
Quadro
Tesla
Tegra
Other
68%
109%
12%
9%
CAGR
15%
Tegra = Android, WinRT, Auto and Embedded
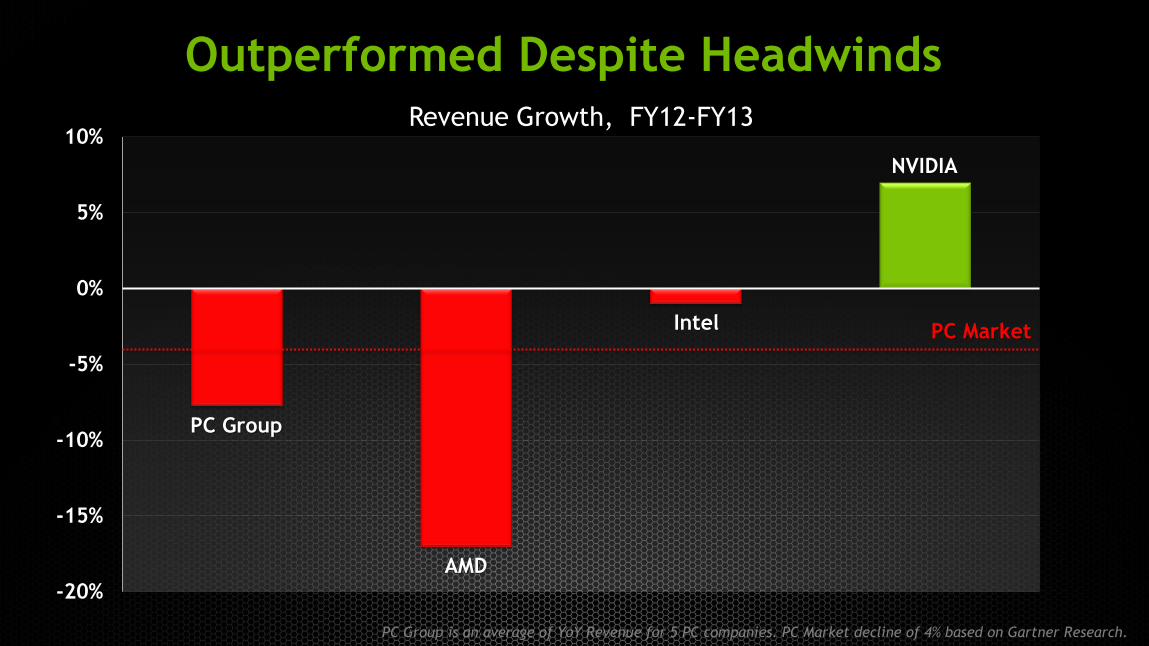
-20%
-15%
-10%
-5%
0%
5%
10%
Outperformed Despite Headwinds
AMD
Intel
NVIDIA
PC Group
Revenue Growth, FY12-FY13
PC Market
PC Group is an average of YoY Revenue for 5 PC companies. PC Market decline of 4% based on Gartner Research.
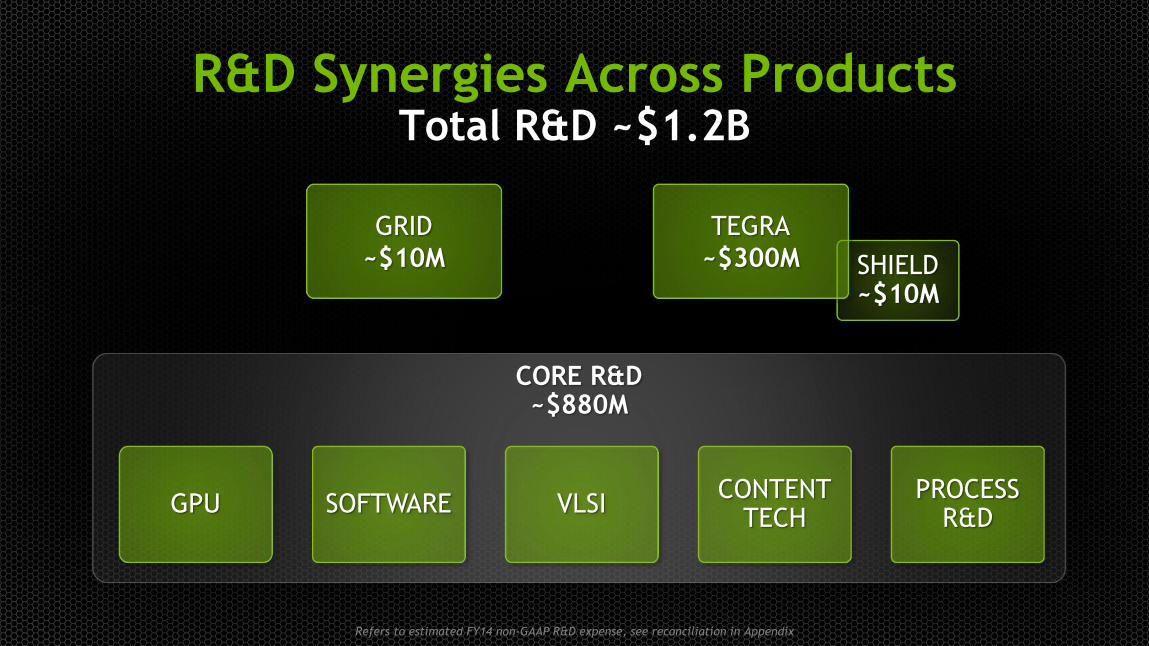
R&D Synergies Across Products Total R&D ~$1.2B
SHIELD ~$10M
TEGRA
~$300M
GRID
~$10M
CORE R&D ~$880M
GPU SOFTWARE VLSI CONTENT
TECH PROCESS
R&D
Refers to estimated FY14 non-GAAP R&D expense, see reconciliation in Appendix
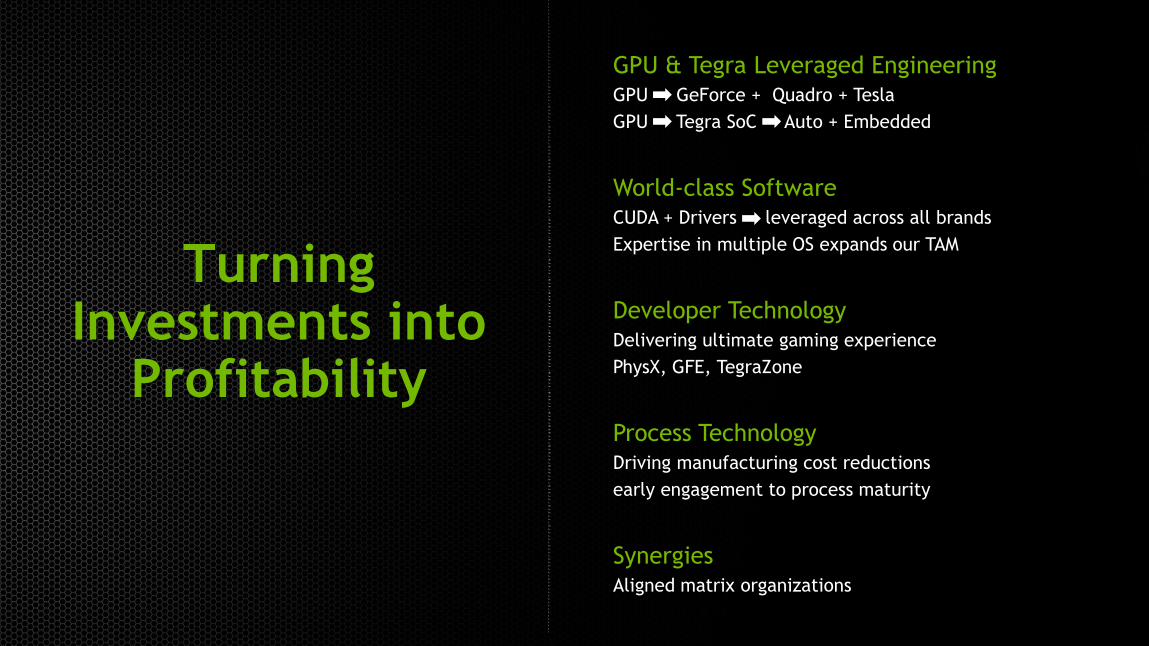
Turning Investments into
Profitability
GPU & Tegra Leveraged Engineering GPU GeForce + Quadro + Tesla
GPU Tegra SoC Auto + Embedded
World-class Software CUDA + Drivers leveraged across all brands
Expertise in multiple OS expands our TAM
Developer Technology Delivering ultimate gaming experience
PhysX, GFE, TegraZone
Process Technology Driving manufacturing cost reductions
early engagement to process maturity
Synergies Aligned matrix organizations
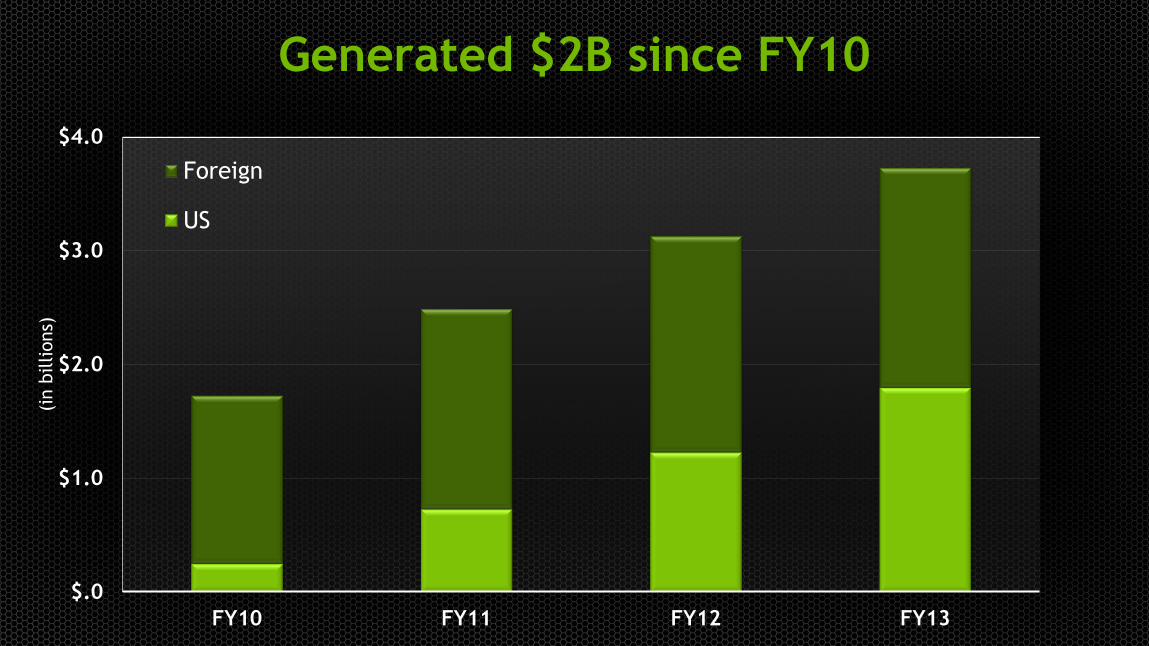
$.0
$1.0
$2.0
$3.0
$4.0
FY13FY12FY11FY10
Foreign
US
Generated $2B since FY10 (i
n b
illions)
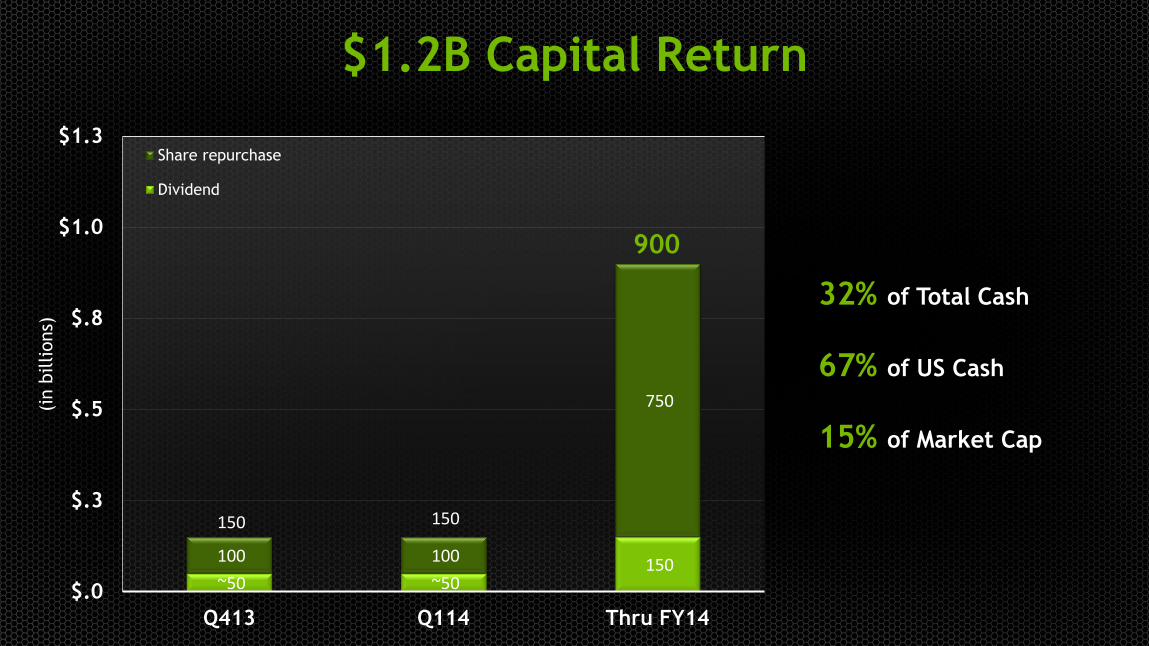
150 ~50 ~50
750
100 100
150 150
$.0
$.3
$.5
$.8
$1.0
$1.3
Thru FY14Q114Q413
Share repurchase
Dividend
$1.2B Capital Return (i
n b
illions)
32% of Total Cash
67% of US Cash
15% of Market Cap
900
Delivering Exceptional Financial Performance
Investing to Grow Beyond the PC
Generating Cash and Returning Capital to Shareholders
38%
EPS CAGR from FY10
$300M targeted to
$10B+ Tegra TAM
$2B cash
over past 3 years
Non-GAAP EPS, see reconciliation in Appendix
Invest to Grow Beyond PC
Appendix
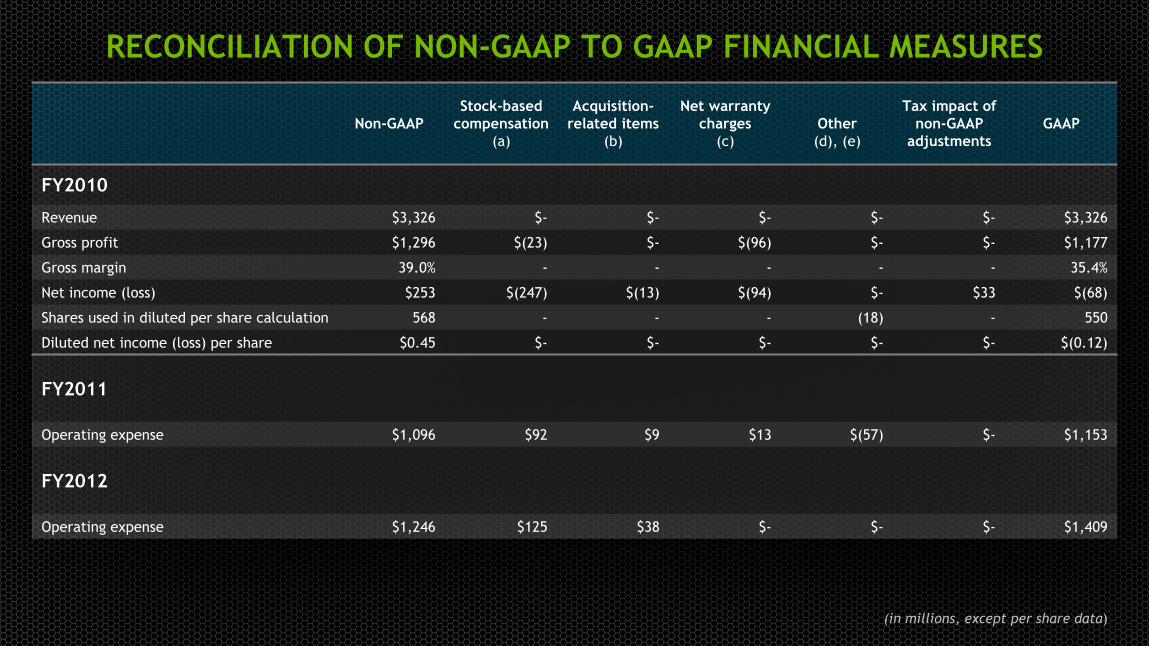
RECONCILIATION OF NON-GAAP TO GAAP FINANCIAL MEASURES
Non-GAAP
Stock-based
compensation
(a)
Acquisition-
related items
(b)
Net warranty
charges
(c)
Other
(d), (e)
Tax impact of
non-GAAP
adjustments
GAAP
FY2010
Revenue $3,326 $- $- $- $- $- $3,326
Gross profit $1,296 $(23) $- $(96) $- $- $1,177
Gross margin 39.0% - - - - - 35.4%
Net income (loss) $253 $(247) $(13) $(94) $- $33 $(68)
Shares used in diluted per share calculation 568 - - - (18) - 550
Diluted net income (loss) per share $0.45 $- $- $- $- $- $(0.12)
FY2011
Operating expense $1,096 $92 $9 $13 $(57) $- $1,153
FY2012
Operating expense $1,246 $125 $38 $- $- $- $1,409
(in millions, except per share data)
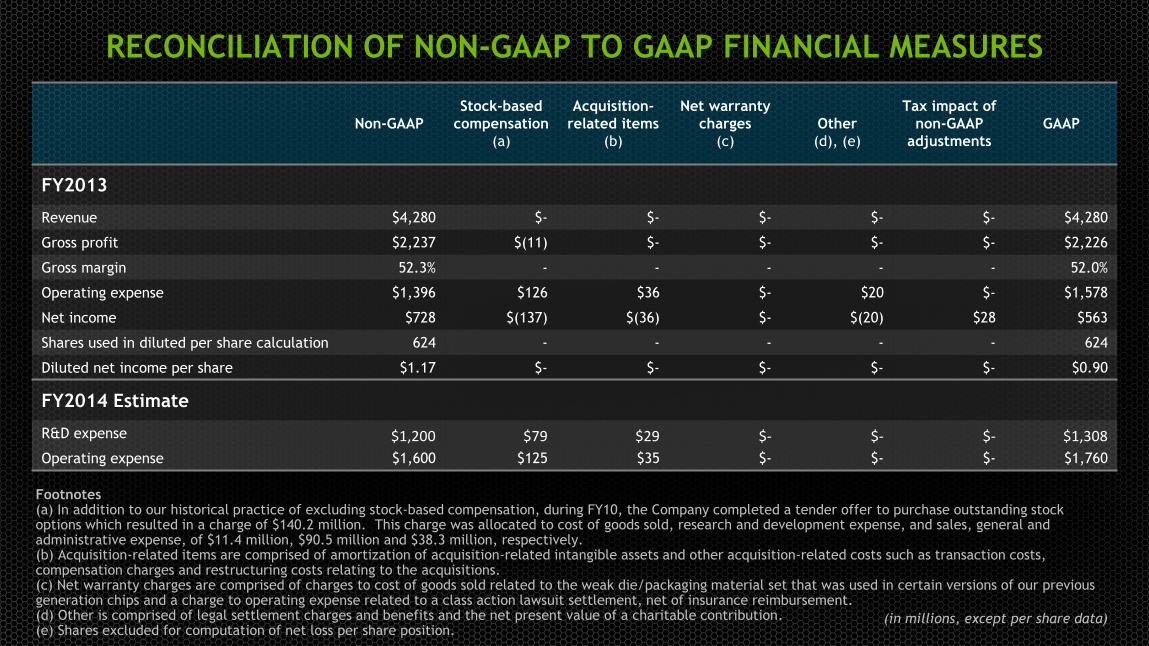
RECONCILIATION OF NON-GAAP TO GAAP FINANCIAL MEASURES
Non-GAAP
Stock-based
compensation
(a)
Acquisition-
related items
(b)
Net warranty
charges
(c)
Other
(d), (e)
Tax impact of
non-GAAP
adjustments
GAAP
FY2013
Revenue $4,280 $- $- $- $- $- $4,280
Gross profit $2,237 $(11) $- $- $- $- $2,226
Gross margin 52.3% - - - - - 52.0%
Operating expense $1,396 $126 $36 $- $20 $- $1,578
Net income $728 $(137) $(36) $- $(20) $28 $563
Shares used in diluted per share calculation 624 - - - - - 624
Diluted net income per share $1.17 $- $- $- $- $- $0.90
FY2014 Estimate
R&D expense $1,200 $79 $29 $- $- $- $1,308
Operating expense $1,600 $125 $35 $- $- $- $1,760
(in millions, except per share data)
Footnotes (a) In addition to our historical practice of excluding stock-based compensation, during FY10, the Company completed a tender offer to purchase outstanding stock options which resulted in a charge of $140.2 million. This charge was allocated to cost of goods sold, research and development expense, and sales, general and administrative expense, of $11.4 million, $90.5 million and $38.3 million, respectively. (b) Acquisition-related items are comprised of amortization of acquisition-related intangible assets and other acquisition-related costs such as transaction costs, compensation charges and restructuring costs relating to the acquisitions. (c) Net warranty charges are comprised of charges to cost of goods sold related to the weak die/packaging material set that was used in certain versions of our previous generation chips and a charge to operating expense related to a class action lawsuit settlement, net of insurance reimbursement. (d) Other is comprised of legal settlement charges and benefits and the net present value of a charitable contribution. (e) Shares excluded for computation of net loss per share position.
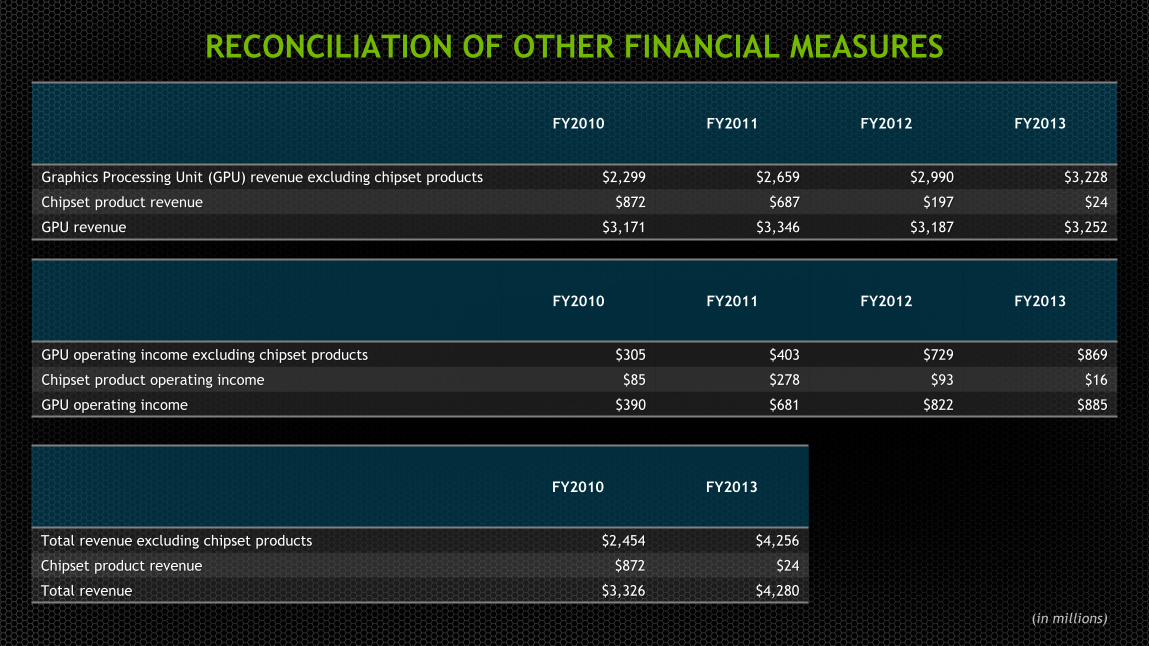
RECONCILIATION OF OTHER FINANCIAL MEASURES
FY2010 FY2011 FY2012 FY2013
Graphics Processing Unit (GPU) revenue excluding chipset products $2,299 $2,659 $2,990 $3,228
Chipset product revenue $872 $687 $197 $24
GPU revenue $3,171 $3,346 $3,187 $3,252
FY2010 FY2011 FY2012 FY2013
GPU operating income excluding chipset products $305 $403 $729 $869
Chipset product operating income $85 $278 $93 $16
GPU operating income $390 $681 $822 $885
(in millions)
FY2010 FY2013
Total revenue excluding chipset products $2,454 $4,256
Chipset product revenue $872 $24
Total revenue $3,326 $4,280


