1995 by Humana Press Inc. All rights of any nature whatsoever reserved. 0273-2289/95/5001 --0079506.80 Kinetics of Batch Production of Single-Cell Protein from Cheese Whey A. E. GHALY* AND R. M. BEN-HASSAN Department of Agricultural Engineering, Technical University of Nova Scotia, PO Box 1000, Halifax, Nova Scotia, Canada B3J 2X4 Received January 24, 1994; Accepted April 29, 1994 ABSTRACT A kinetic model for single-cell protein batch fermentation was developed using the numerical simultaneous integration approach of the fourth-order Runge-Kutta method. The model takes into account the effect of substrate inhibtion, maintenance energy, and cell death on the cell growth and substrate utilization during the fermentation process. The theoretical results obtained from the model compared well with the experimental data. The model was used to study the ef- fect of the initial substrate concentration on the lag period, fermenta- tion time, specific growth rate, population size, and cell productivity of batch fermentation. Increasing the initial substrate concentration increased the lag period and fermentation time and decreased the specific growth rate and cell yield. The growth limiting substrate con- centration was 2.9 g/L, whereas the growth inhibiting substrate con- centration was 69.0 g/L. Increasing the initial substrate concentration above 150 g/L significantly decreased the yeast population size. Index Entries: Cheese whey; batch fermentation; kinetic; cell growth; substrate. INTRODUCTION The yeast Kluyveromycesfragilis have been used extensively for the production of single cell protein (SCP) from cheese whey (1-5). Cheese whey is a greenish yellow liquid produced as a byproduct of the cheese- making industry. It contains approx 5% lactose, 1% nitrogenous com- pounds, 0.8% minerals, and a small amount of vitamins. The aerobic *Author to whom all correspondence and reprint requests should be addressed. Applied Biochemistry and Biotechnology 79 Vol. 50, 1995
Transcript
�9 1995 by Humana Press Inc. All rights of any nature whatsoever reserved. 0273-2289/95/5001 --0079506.80
Kinetics of Batch Production of Single-Cell Protein from Cheese Whey
A. E. GHALY* AND R. M. BEN-HASSAN
Department of Agricultural Engineering, Technical University of Nova Scotia,
PO Box 1000, Halifax, Nova Scotia, Canada B3J 2X4
Received January 24, 1994; Accepted April 29, 1994
ABSTRACT
A kinetic model for single-cell protein batch fermentation was developed using the numerical simultaneous integration approach of the fourth-order Runge-Kutta method. The model takes into account the effect of substrate inhibtion, maintenance energy, and cell death on the cell growth and substrate utilization during the fermentation process. The theoretical results obtained from the model compared well with the experimental data. The model was used to study the ef- fect of the initial substrate concentration on the lag period, fermenta- tion time, specific growth rate, population size, and cell productivity of batch fermentation. Increasing the initial substrate concentration increased the lag period and fermentation time and decreased the specific growth rate and cell yield. The growth limiting substrate con- centration was 2.9 g/L, whereas the growth inhibiting substrate con- centration was 69.0 g/L. Increasing the initial substrate concentration above 150 g/L significantly decreased the yeast population size.
Index Entries: Cheese whey; batch fermentation; kinetic; cell growth; substrate.
INTRODUCTION
The yeast Kluyveromyces fragilis have been used extensively for the production of single cell protein (SCP) from cheese whey (1-5). Cheese whey is a greenish yellow liquid produced as a byproduct of the cheese- making industry. It contains approx 5% lactose, 1% nitrogenous com- pounds, 0.8% minerals, and a small amount of vitamins. The aerobic
*Author to whom all co r respondence and reprint requests should be addressed .
Applied Biochemistry and Biotechnology 79 Vol. 50, 1995
80 Uhaly and Ben.Hassan
decomposition of lactose by K. fragilis is a process that provides energy for growth and supplies nutrients for synthesis of new microbial proto- plasm. The net reaction is as follows:
12CO2 70H20 24H + Carbon Dioxide + Water + Hydrogen + Energy (1)
Several models have been used to describe the behavior of micro- organisms under different physical or chemical conditions, such as oxygen, temperature, pH, and water activity (6-8). Most of the mathematical models of microbial cell growth are based on the Mond equation (analogous to the Michaelis-Menton equation for enzymatic reactions). However, the Mond equation is not capable of calculating the exact cell concentration in batch and continuous reactors for several reasons:
1. It does not express exactly the characteristics of microbial growth, since each of the metabolic processes in the microbial cell has a different kinetic reaction that affects the overall growth;
2. The yield of cell mass based on limiting substrate is not con- stant; and
3. It does not take into consideration the substrate inhibition.
The aim of this study was to develop a mathematical model capable of predicting changes in cell and substrate concentrations during batch fer- mentation of cheese whey by the yeast K. fragilis and to test the validity of the model using experimental data.
MICROBIAL GROWTH
Microbial growth is the orderly increase in the quantity of all com- ponen ts of the microbial cells. After a microbial cell has almost doubled in size and the amount of each of its components, it divides into two daughter cells. The time required for one cell to grow and divide into two cells is referred to as the doubling time, which depends on the cell growth characteristics. Consequently, the growth of microorganisms is measured in terms of an increase in the number of cells (or cell mass) rather than the increase in the size of a single organism. The rate of growth is propor- tional to the cell mass and can be defined as follows:
d X / a t = (2)
Applied Biochemistry and Biotechnology Vol. 50, 1995
Single Cell Protein 81
where:
dX / dt is the cell growth rate (g/L/h) /~ is the specific cell growth rate (h -1) X is the cell concentration (g/L)
In a batch culture fermentation, if one of the essential nutrients required for growth is in a limited concentration, it would be depleted first and, thus, growth would cease. The relationship between the specific cell growth rate (/~) and the limiting substrate (S) has been described by the following Michaelis-Menten Eq. (9):
# = #mS/(Ks + S) (3)
where:
/~m is the maximum specific cell growth rate (h -1) Ks is the saturation constant defined as the substrate
concentration at 1/2 the maximum specific cell growth rate (g/L)
S is the substrate concentration (g/L)
Equations (2) and (3) can only be used to describe cell growth under optimum conditions. However, an appropriate model should account for the substrate inhibition as well as product inhibition (if any). According to Ghaly et al. (10), cell growth can be inhibited by high concentrations of medium constituents. High substrate concentration may inhibit cell growth owing to the effect of osmotic pressure. A substrate inhibition (Sinh) term can be defined as follows:
where:
S,nh = ~ / (IG + S) (4)
Ks is the inhibition substrate concentration (g/L) Sinh is the substrate inhibition term at which growth is
totally inhibition (g/L)
Under aerobic condition, the yeast utilize the substrate to produce more cells, CO2 and H20 (Eq. (1), none of which is toxic to the yeast. From Eqs. (2), (3), and (4), the growth rate can, thus, be expressed as follows:
dX / dt = [X I~ S / (Ks + S)] [~ / (~ + S)] (5)
KINETICS
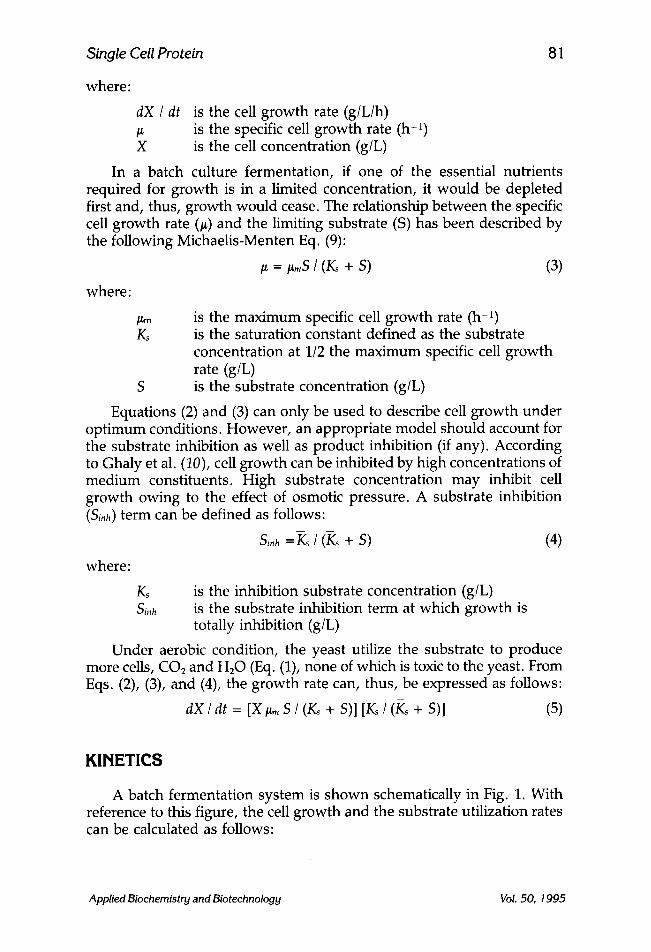
A batch fermentation system is shown schematically in Fig. 1. With reference to this figure, the cell growth and the substrate utilization rates can be calculated as follows:
Applied Biochemistry and Biotechnology Vol. 50, 1995
82 Ghaly and B e n . H a s s a n
Fig. 1. Schematic of aerobic fermentation system.
Cell Growth
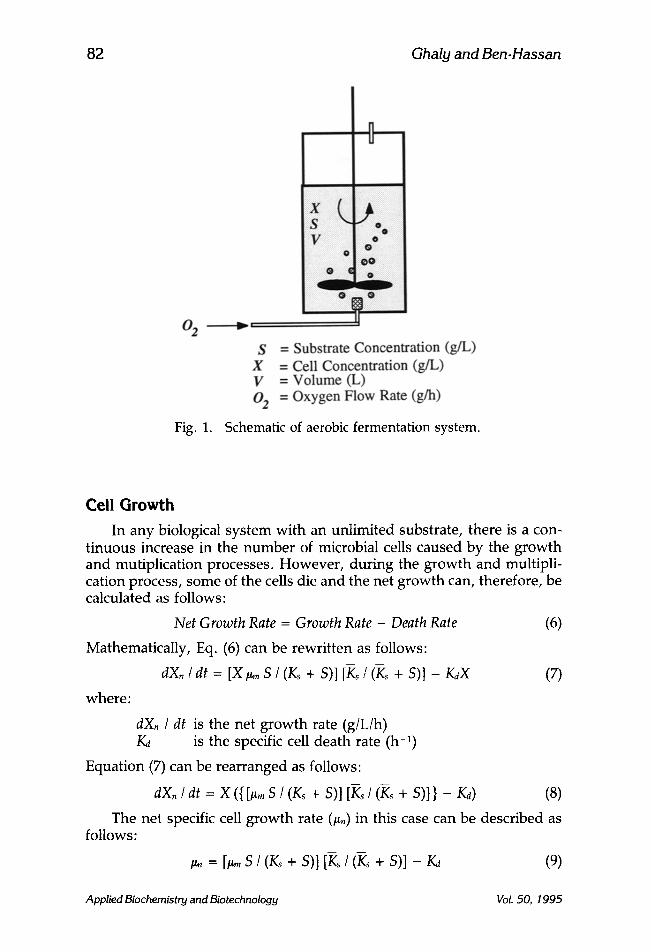
In any biological system with an unlimited substrate, there is a con- t inuous increase in the number of microbial cells caused by the growth and mutiplication processes. However, during the growth and multipli- cation process, some of the cells die and the net growth can, therefore, be calculated as follows:
Net Growth Rate = Growth Rate - Death Rate (6)
Mathematically, Eq. (6) can be rewritten as follows:
dX, / at = IX ~m S / (Ks + S)] [Ks / (K,~ + S)] - K~X (7)
where:
dXn / dt is the net growth rate (g/L/h) /G is the specific cell death rate (h -1)
The net specific cell growth rate (~,) in this case can be described as follows:
#. = [/~ S / (Ks + S)] [ ~ / ( ~ + S)] - Kd (9)
Applied Biochemistry and Biotechnology VoL 50, 1995
Single Cell Protein 83
where:
#n is the net specific growth rate (h)
8ubstrate Utilization
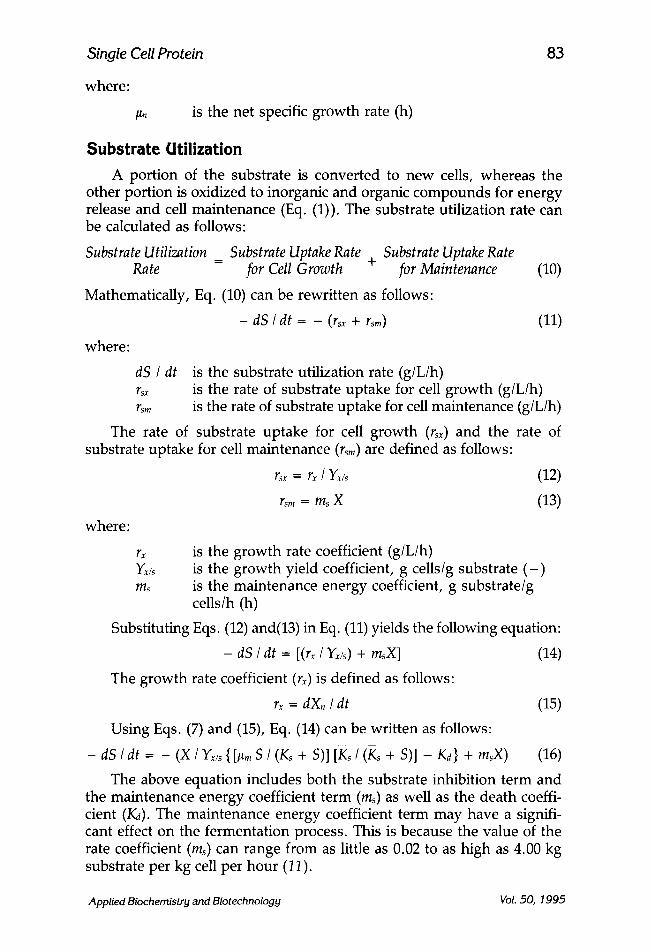
A portion of the substrate is converted to new cells, whereas the other portion is oxidized to inorganic and organic compounds for energy release and cell maintenance (Eq. (1)). The substrate utilization rate can be calculated as follows:
Substrate Utilization = Substrate Uptake Rate + Substrate Uptake Rate Rate for Cell Growth for Maintenance (10)
Mathematically, Eq. (10) can be rewritten as follows:
where:
- dS / dt = - (rsx + rsm) (11)
dS / dt rsx
rsm
The rate of substrate uptake for cell growth (rs~) and the rate of substrate uptake for cell maintenance (rsm) are defined as follows:
rsx = rx / Yx/s (12)
rs~ = ms X (13)
rx Yx/s ms
is the substrate utilization rate (g/L/h) is the rate of substrate uptake for cell growth (g/L/h) is the rate of substrate uptake for cell maintenance (g/L/h)
where:
is the growth rate coefficient (g/L/h) is the growth yield coefficient, g cells/g substrate ( - ) is the maintenance energy coefficient, g substrate/g cells/h (h)
Substituting Eqs. (12) and(13) in Eq. (11) yields the following equation:
- dS / dt = [(r~ / Yx/s) + msX] (14)
The growth rate coefficient (rx) is defined as follows:
rx = dXn / dt (15)
Using Eqs. (7) and (15), Eq. (14) can be written as follows:
- d S / d t = - ( X / Y K / s { [ I ~ m S / ( K s + S)][F , s / (Ks+ S ) ] - K ~ } + m s X ) (16)
The above equation includes both the substrate inhibition term and the maintenance energy coefficient term (ms) as well as the death coeffi- cient (/G). The maintenance energy coefficient term may have a signifi- cant effect on the fermentation process. This is because the value of the rate coefficient (ms) can range from as little as 0.02 to as high as 4.00 kg substrate per kg cell per hour (11).
Applied Biochemistry and Biotechnology Vol. 50, 1995
84 Ghaly and Ben.Hassan
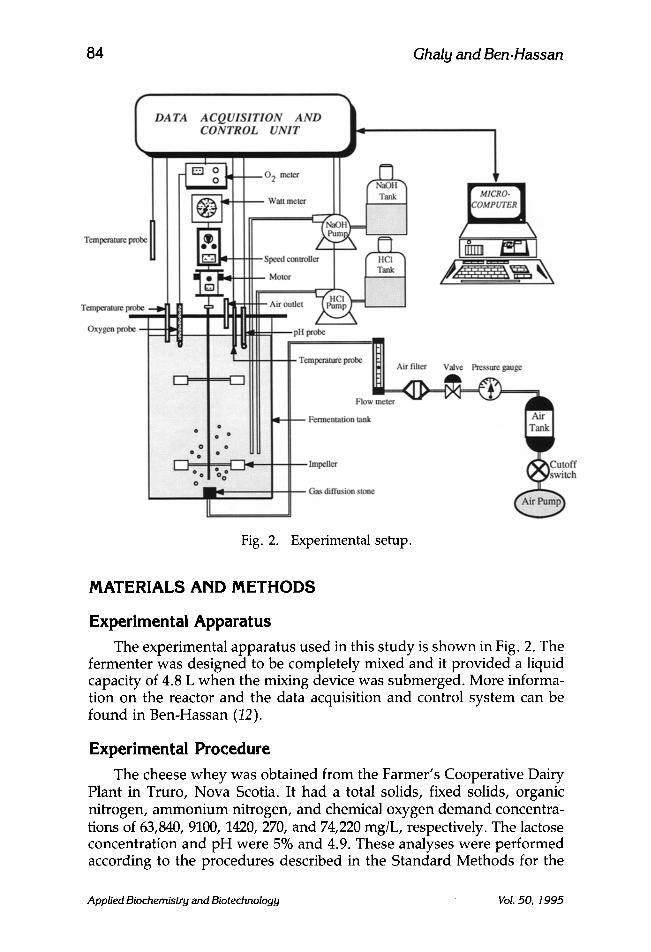
Fig. 2. Experimental setup.
MATERIALS AND METHODS
Experimental Apparatus The experimental apparatus used in this study is shown in Fig. 2. The
fermenter was designed to be completely mixed and it provided a liquid capacity of 4.8 L when the mixing device was submerged. More informa- tion on the reactor and the data acquisition and control system can be found in Ben-Hassan (12).
Experimental Procedure The cheese whey was obtained from the Farmer's Cooperative Dairy
Plant in Truro, Nova Scotia. It had a total solids, fixed solids, organic nitrogen, ammonium nitrogen, and chemical oxygen demand concentra- tions of 63,840, 9100, 1420, 270, and 74,220 mg/L, respectively. The lactose concentration and pH were 5% and 4.9. These analyses were performed according to the procedures described in the Standard Methods for the
Applied Biochemistry and Biotechnology Vol. 50, 1995
o �9 o 4
= 3 o G~
o 2
85
Fig. 3.
I I I I I I
0 4 8 12 16 20 24
Time (h)
Single Cell Protein
- 1 0 0 0
,.a . 8 0 0
G~
. 6 0 0 o o M
o M
.400 "~
o
,.o �9 200 t~
Z
-0
28
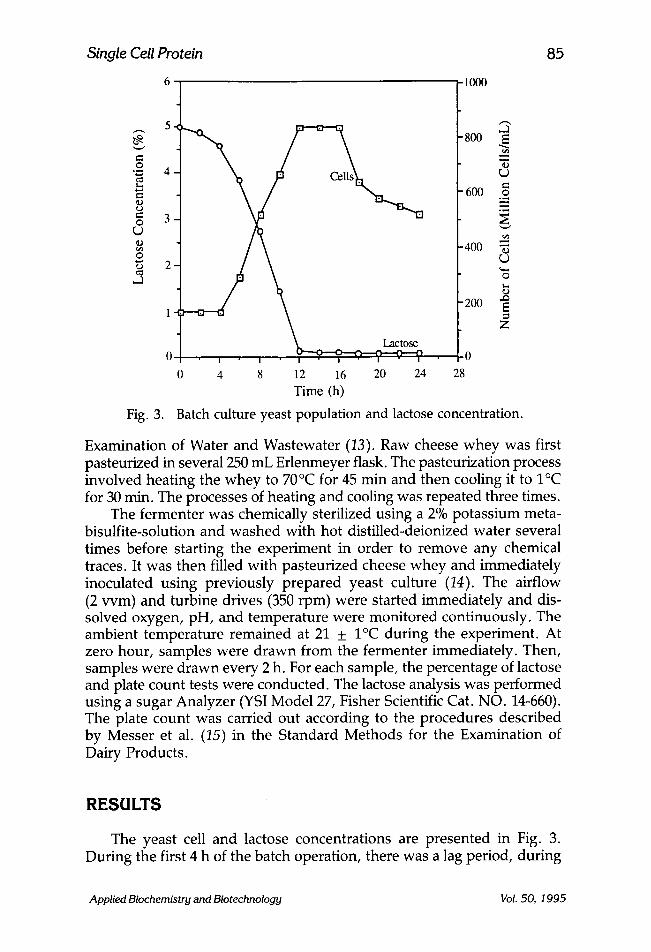
Batch culture yeast population and lactose concentration.
Examination of Water and Wastewater (13). Raw cheese whey was first pasteurized in several 250 mL Erlenmeyer flask. The pasteurization process involved heating the whey to 70 ~ for 45 min and then cooling it to 1~ for 30 min. The processes of heating and cooling was repeated three times.
The fermenter was chemically sterilized using a 2% potassium meta- bisulfite-solution and washed with hot distilled-deionized water several times before starting the experiment in order to remove any chemical traces. It was then filled with pasteurized cheese whey and immediately inoculated using previously prepared yeast culture (14). The airflow (2 vvm) and turbine drives (350 rpm) were started immediately and dis- solved oxygen, pH, and temperature were monitored continuously. The ambient temperature remained at 21 + 1~ during the experiment. At zero hour, samples were drawn from the fermenter immediately. Then, samples were drawn every 2 h. For each sample, the percentage of lactose and plate count tests were conducted. The lactose analysis was performed using a sugar Analyzer (YSI Model 27, Fisher Scientific Cat. NO. 14-660). The plate count was carried out according to the procedures described by Messer et al. (15) in the Standard Methods for the Examination of Dairy Products.
RESULTS
The yeast cell and lactose concentrations are presented in Fig. 3. During the first 4 h of the batch operation, there was a lag period, during
Applied Biochemistry and Biotechnology Vol. 50, 1995
86
Z ~
l
2.00
1.75
1.50
1.25
1.00
0.75
0.50
0.25
0.00
Fig. 4.
Ghaly and Ben-Hassan
0 14
fR 2 =0.96 l "~ / . =o.2 .- / / N t = No. of cells at any time] / �9
~No = Initial No. of cells 1
2 4 6 8 10 12
Time (h)
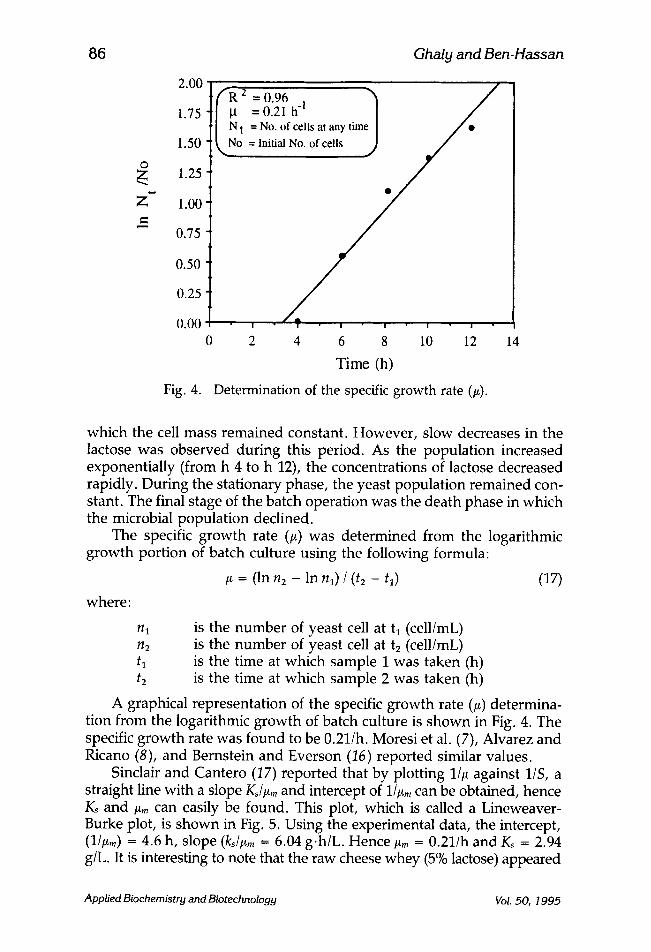
Determination of the specific growth rate (#).
which the cell mass remained constant. However, slow decreases in the lactose was observed during this period. As the population increased exponentially (from h 4 to h 12), the concentrations of lactose decreased rapidly. During the stationary phase, the yeast population remained con- stant. The final stage of the batch operation was the death phase in which the microbial population declined.
The specific growth rate (#) was determined from the logarithmic growth portion of batch culture using the following formula:
/~ = (ln n2 - In nl) / (t2 - tO (17)
where:
nl is the number of yeast cell at tl (cell/mL) n2 is the number of yeast cell at t2 (cell/mL) t~ is the time at which sample 1 was taken (h) t2 is the time at which sample 2 was taken (h)
A graphical representation of the specific growth rate (/~) determina- tion from the logarithmic growth of batch culture is shown in Fig. 4. The specific growth rate was found to be 0.21/h. Moresi et al. (7), Alvarez and Ricano (8), and Bernstein and Everson (16) reported similar values.
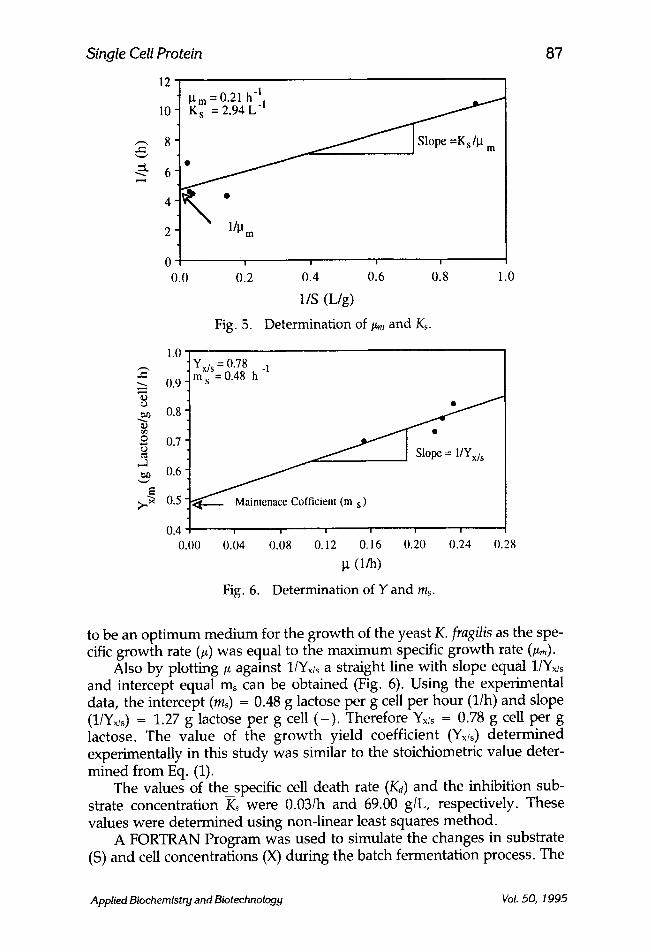
Sinclair and Cantero (17) reported that by plotting 11# against 1/S, a straight line with a slope Kd#m and intercept of 1/~m can be obtained, hence Ks and/~m can easily be found. This plot, which is called a Lineweaver- Burke plot, is shown in Fig. 5. Using the experimental data, the intercept, (libra) = 4.6 h, slope (ks/l~,~ -- 6.04 g.h/L. Hence ~m = 0.211h and Ks = 2.94 g/L. It is interesting to note that the raw cheese whey (5% lactose) appeared
Applied Biochemistry and Biotechnology Vol. 50, 1995
Single Cell Protein 87
12
10
,-- 8 e-
= 0.21 h 4. PKs =2.94L 1
4
2
0 , ' 0.0 0.2
Fig. 5.
0.4 0.6 0.8
1/S (L/g)
Determination of #m and Ks.
1.0
(..1
s
.-3
E
1.0 Yx/s = 0.78 -1 m" s = 0.48 h 0.9
0.8
0.7
0.6
0.5
0.4 0.00
~ f i c i e n t (m s)
i i i I i
0.04 0.08 0.12 0.16 0.20
(I/h)
Fig. 6. Determination of Y and ms.
I
0.24 0.28
to be an optimum medium for the growth of the yeast K. fragilis as the spe- cific growth rate (#) was equal to the maximum specific growth rate (/xm).
Also by plotting/x against l/Yx/s a straight line with slope equal 1/Yx/s and intercept equal ms can be obtained (Fig. 6). Using the experimental data, the intercept (ms) = 0.48 g lactose per g cell per hour (l/h) and slope (l/Y• = 1.27 g lactose per g cell ( - ) . Therefore Y• = 0.78 g cell per g lactose. The value of the growth yield coefficient (Y• determined experimentally in this study was similar to the stoichiometric value deter- mined from Eq. (1).
The values of the specific cell death rate (Ke) and the inhibition sub- strate concentration K~ were 0.03Ih and 69.00 g/L, respectively. These values were determined using non-linear least squares method.
A FORTRAN Program was used to simulate the changes in substrate (S) and cell concentrations (X) during the batch fermentation process. The
Applied Biochemistry and Biotechnology Vol. 50, 1995
88 Ghaly and Ben.Hassan
Fig. 7.
24 [ �9 Mea.surcd ] �9 �9 "60 ,~,
2 .o ~ 16 ~ 4(}--~.
,~ 8 2(1 N u g
4 �9 10 ~ =
0 v .
0 4 8 12 16 20 Time (h)
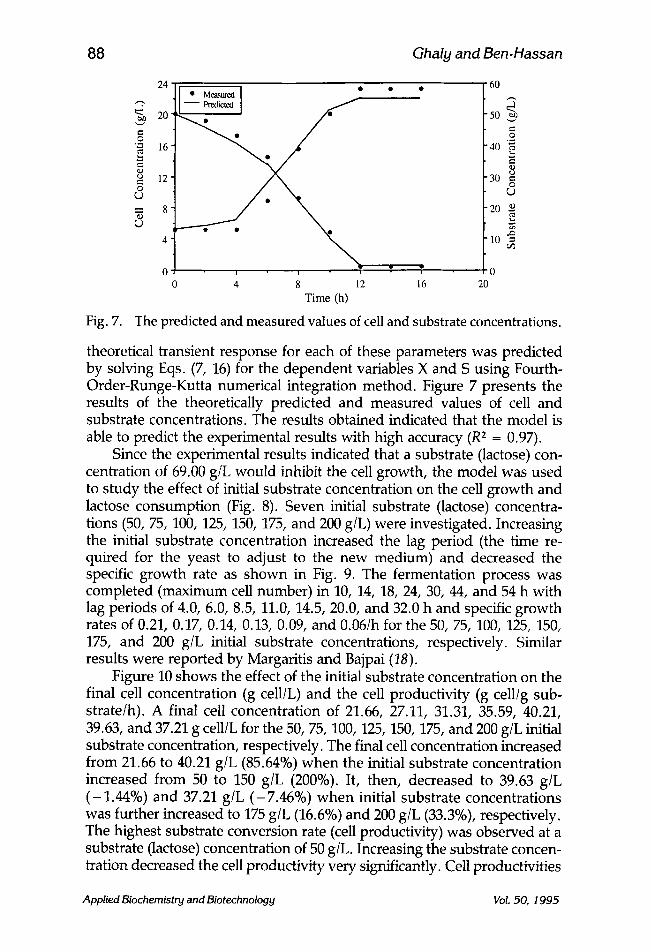
The predicted and measured values of cell and substrate concentrations.
theoretical transient response for each of these parameters was predicted by solving Eqs. (7, 16) for the dependent variables X and S using Fourth- Order-Runge-Kutta numerical integration method. Figure 7 presents the results of the theoretically predicted and measured values of cell and substrate concentrations. The results obtained indicated that the model is able to predict the experimental results with high accuracy (R 2 = 0.97).
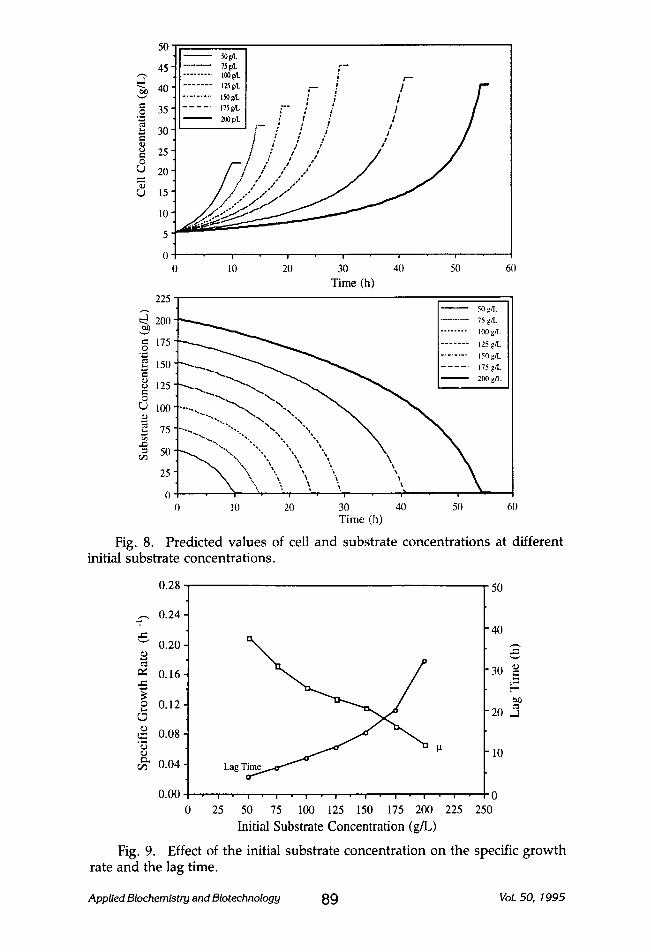
Since the experimental results indicated that a substrate (lactose) con- centration of 69.00 glL would inhibit the cell growth, the model was used to study the effect of initial substrate concentration on the cell growth and lactose consumption (Fig. 8). Seven initial substrate (lactose) concentra- tions (50, 75, 100, 125, 150, 175, and 200 g/L) were investigated. Increasing the initial substrate concentration increased the lag period (the time re- quired for the yeast to adjust to the new medium) and decreased the specific growth rate as shown in Fig. 9. The fermentation process was completed (maximum cell number) in 10, 14, 18, 24, 30, 44, and 54 h with lag periods of 4.0, 6.0, 8.5, 11.0, 14.5, 20.0, and 32.0 h and specific growth rates of 0.21, 0.17, 0.14, 0.13, 0.09, and 0.06/h for the 50, 75, 100, 125, 150, 175, and 200 g/L initial substrate concentrations, respectively. Similar results were reported by Margaritis and Bajpai (18).
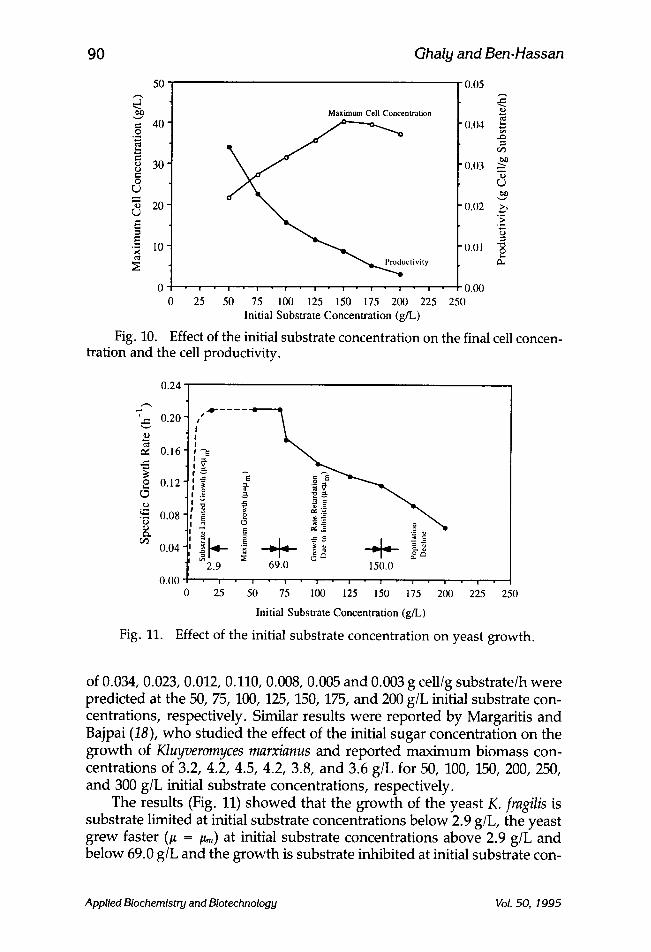
Figure 10 shows the effect of the initial substrate concentration on the final cell concentration (g cell/L) and the cell productivity (g cell/g sub- strate/h). A final cell concentration of 21.66, 27.11, 31.31, 35.59, 40.21, 39.63, and 37.21 g cell/L for the 50, 75, 100, 125, 150, 175, and 200 g/L initial substrate concentration, respectively. The final cell concentration increased from 21.66 to 40.21 g/L (85.64%) when the initial substrate concentration increased from 50 to 150 g/L (200%). It, then, decreased to 39.63 g/L (-1.44%) and 37.21 g/L (-7.46%) when initial substrate concentrations was further increased to 175 g/L (16.6%) and 200 g/L (33.3%), respectively. The highest substrate conversion rate (cell productivity) was observed at a substrate (lactose) concentration of 50 g/L. Increasing the substrate concen- tration decreased the cell productivity very significantly. Cell productivities
Applied Biochemistry and Biotechnology Vol. 50, 1995
50
45 , . , . . ,
,-1 "~ 40
o 35 " ,~ ,
~ 3o
~ 25 0
r,.) 20
~ 15
10
50ut . . . . . . . 7s~ ~--
I . . . . . . . . . 1oo~ i , -
I . . . . . . . ,~vt , - I / r" I . . . . . . . . . t ~ u t / i / / i . . . . . ,7.~ ~. '-" �9 i # / / 2oo~ / l / / t - r - . , .. / / ~ - / / / /
Effect of the initial substrate concentration on the final cell concen- tration and the cell productivity.
0.24
'~,~, 0.20 [
r
0.16 ~ =~ e.-,
0 .12
0.08
0.04'
0.00
Fig. 11.
_E ~'-=
, 4 . . o ~ ~.~
2.9 69.(I 150.0
i ! i | i i i i
0 25 50 75 100 125 150 175 200 225 250
Initial Substrate Concentration (g/L)
Effect of the initial substrate concentration on yeast growth.
of 0.034, 0.023, 0.012, 0.110, 0.008, 0.005 and 0.003 g cell/g substrate/h were predicted at the 50, 75, 100, 125, 150, 175, and 200 g/L initial substrate con- centrations, respectively. Similar results were reported by Margaritis and Bajpai (18), who studied the effect of the initial sugar concentration on the growth of Kluyveromyces marxianus and reported maximum biomass con- centrations of 3.2, 4.2, 4.5, 4.2, 3.8, and 3.6 g/L for 50, 100, 150, 200, 250, and 300 g/L initial substrate concentrations, respectively.
The results (Fig. 11) showed that the growth of the yeast K. fragilis is substrate limited at initial substrate concentrations below 2.9 g/L, the yeast grew faster (# -- /~) at initial substrate concentrations above 2.9 g/L and below 69.0 g/L and the growth is substrate inhibited at initial substrate con-
Applied Biochemistry and Biotechnology Vol. 50, 1995
Single Cell Protein 91
centrations above 69.0 g/L. At substrate concentrations above 69.0 and below 150 g/L, the growth rate is retarded (i.e., /~ < ~ ) but the final population size increases with increases in the substrate concentration. Mulchandani and Luong (19) reported that when the substrate concentra- tion is below a given threshold limit, the specific growth rate is propor- tional to the increase in the substrate level and approaches a maximum value at the threshold limit. Subsequent increases in the substrate concen- tration will ultimately lead to a decrease in the specific growth rate as a result of inhibition. In this study, at initial substrate concentrations above 150 g/L, not only the growth rate is retarded but the final population size decreases with further increases in the substrate concentration. D'Amore and Stewart (20) reported that high substrate concentrations inhibit the yeast growth as a result of high osmotic pressure and low water activity. Mulchandani and Luong (19) reported that from a biological viewpoint, an increase in the substrate concentration could cause an alteration in the cell metabolism such that an overproduction of a molecule by one pathway results in a feedback inhibition of a growth related pathway.
CONCLUSIONS
A kinetic model for single cell protein batch fermentation was developed using the numerical simultaneous integration approach of the fourth-order Runge-Kutta Method. The model takes into account the ef- fect of substrate inhibition, maintenance energy and cell death on the cell growth and substrate utilization during the fermentation process. The model was used to study the effect of initial substrate concentration on the lag period, fermentation time, specific growth rate, population size, and cell yield. Increasing the substrate concentration increased the lag period and the total fermentation time and decreased the specific growth rate. The growth limiting substrate concentration was 2.9 g/L whereas the growth inhibiting substrate concentration was 69.0 g/L. The maximum cell concentration occurred at about 150 g/L initial substrate concentration. Increasing the substrate inhibition above 150 g/L resulted in a population decline. This can easily affect the economics of the fermentation process.
REFERENCES
1. Bernstein, S., Tzeng, C. H., and Sisson, D. (1977), Biotechnol. Bioeng. Syrup. 7, 1-9.
2. Meiering, A. G., Azi, F. A., and Gregory, K. F. (1978), Trans. ASAE 21(3), 586-593.
3. Wasserman, A. E. (1960), Dairy Eng. 77, 374-379. 4. Vananuvat, P. and Kinsella, J. E. (1975), J. Food Sci. 40(2), 336-341, 823-825. 5. Ghaly, A. E. and Singh, R. K. (1989), Appl. Biochem. Biotechnol. 22(3), 181-203.
Applied Biochemistry and Biotechnology Vot. 50, 1995
92 Ghaly and Ben.Hassan
6. Zwietering, M. H., Jongenburger, I., Rombouts, F. M., and Van Riet, K. (1990), Appl. Environ. Microb. 56(6), 1875-1881.
7. Moresi, M., Truufio, A., and Parente, E. (1990), ]. Chem. Technol. Biotechnol. 49, 205-222.
8. Alvarez, J. and Ricano, J. (1979), Biotechnol. Bioeng. Syrup. 9:149, 154. 9. Fogler, H. S. (1986), Elements of Chemical Reaction Engineering. Prentice-Hall,
Englewood Cliffs, NJ. 10. Ghaly, A. E., Kok, R., and Ingrahm, J. M. (1989), Appl. Biochem. Biotechnol.
22, 59. 11. Bailey, J. E. and Ollis, D. F. (1986), Biochemical Engineering Fundamental, 2nd
ed. McGraw-Hill, New York. 12. Ben-Hassan, R. M., Ghaly, A. E., and Ben-Abdallah, N. (1992), Appl.
Biochem. Biotechnol. J. 33(2), 302-344. 13. APHA (1985), The Standard Methods for Examination of Water and Waste-
water. American Public Health Association, New York. 14. Ben-Hassan, R. M. (1991), Cheese whey fermentation for single cell protein
production and pollution potential reduction. Unpublished Ph.D. Thesis. Technical University of Nova Scotia, Halifax, Nova Scotia.
15. Messer, J. W., Behney, H. M., and Leudecke, L. O. (1985), Microbiological count methods, in Standard Methods for the Examination of Dairy Products, 15th ed. Richardson, G. H., ed., American Public Health Association, Washington, DC.
16. Bernstein, S. and Everson, T. C. (1973), Protein production from acid whey via fermentation. Proceedings of the National Symposium on Food Process Waste, 4th Environmental Protection Agency Technology Series, No. EPA66012-73-031, College Park, MD.
17. Sinclair, C. G. and Cantero, X. X. (1990), Fermentation modelling, in Fermentation: A Practical Approach. McNeil, B. and Harvey, L. M. (eds.), IRL, Oxford.
18. Margaritis, A. and Bajpai, P. (1983), Appl. Environ. Microbiol. 45(2), 723-725. 19. Mulchandani, A. and Luong, J. H. T. (1989), Enzyme Microb. Technol. 11,
66-73. 20. D'Amore, T. and Stewart, G. G. (1987), Enzyme Microb. Technol. 9, 322-330.
Applied Biochemistry and Biotechnology Vol. 50, 1995