Report No.12793-LV Latvia Public Expenditure Review July 12, 1994 Europe and Central AsiaRegion FOR OFFICIAL USE ONLY MICROGRAPHICS Report No: 12793 LV Type: ECo Document of the World Bank This document has a restricted distribution andmay be used by recipients only in theperformance of theirofficialduties. Its contents may nototherwise be disclosed withoutWorldBank authorization Public Disclosure Authorized Public Disclosure Authorized Public Disclosure Authorized Public Disclosure Authorized Public Disclosure Authorized Public Disclosure Authorized Public Disclosure Authorized Public Disclosure Authorized
Transcript
Report No. 12793-LV
LatviaPublic Expenditure ReviewJuly 12, 1994
Europe and Central Asia Region
FOR OFFICIAL USE ONLY
MICROGRAPHICS
Report No: 12793 LVType: ECo
Document of the World Bank
This document has a restricted distribution and may be used by recipientsonly in the performance of their official duties. Its contents may not otherwisebe disclosed without World Bank authorization
Pub
lic D
iscl
osur
e A
utho
rized
Pub
lic D
iscl
osur
e A
utho
rized
Pub
lic D
iscl
osur
e A
utho
rized
Pub
lic D
iscl
osur
e A
utho
rized
Pub
lic D
iscl
osur
e A
utho
rized
Pub
lic D
iscl
osur
e A
utho
rized
Pub
lic D
iscl
osur
e A
utho
rized
Pub
lic D
iscl
osur
e A
utho
rized
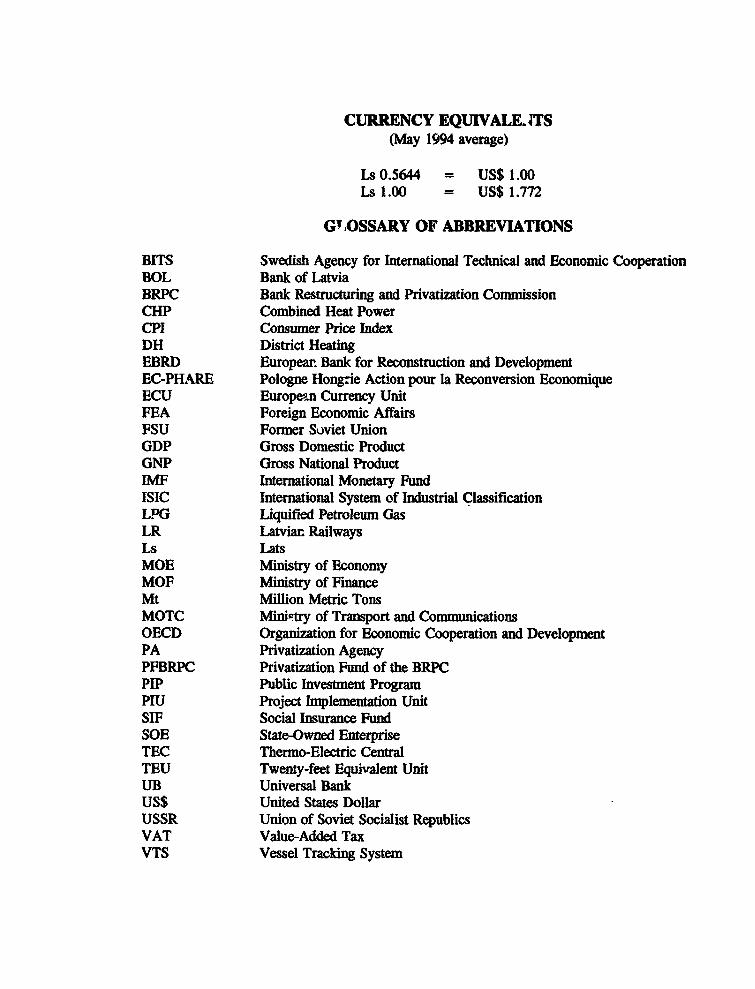
CURRENCY EQUIVALE. ̂TS(May 1994 average)
Ls 0.5644 = US$ 1.00Ls 1.00 = US$ 1.772
G'OSSARY OF ABBREVIATIONS
BITS Swedish Agency for International Technical and Economic CooperationBOL Bank of LatviaBRPC Bank Restructuring and Privatization CommissionCHP Combined Heat PowerCPI Consumer Price IndexDH District HeatingEBRI) European Bank for Reconstruction and DevelopmentEC-PHARE Pologne Hongrie Action pour la Reconversion EconomiqueECU European Currency UnitFEA Foreign Economic AffairsFSU Former Soviet UnionGDP Gross Domestic ProductGNP Gross National ProductDaF International Monetary FundISIC Intemational System of Industrial ClassificationLPG Liquified Petroleum GasLR Latviar. RailwaysLS LatsMOE Ministry of EconomyMOP Ministry of FinanceMt Million Metric TonsMOTC Mini-try of Transport and CommunicationsOECD Organization for Economic Cooperation and DevelopmentPA Privatization AgencyPFBRPC Privatization Fund of the BRPCPIP Public Investment ProgramPIU Project Implementation UnitSIF Social Insurance FundSOE State-Owned EnterpriseTEC Thermo-Electric CentralTEU Twenty-feet Equivalent UnitUB Universal BankUS$ United States DollarUSSR Union of Soviet Socialist RepublicsVAT Value-Added TaxVTS Vessel Tracking System
FOR OFFICIAL USE ONLY
PREFACE
Tbis report was produced by the World Bank public expenditure review mission thatvisited Latvia in November 1993. Members included Mansour Farsad (mission leader), Friedrich Kahnert(public investment), Hendrik Koppen (investment planning), Anthony Richards (resource framework andannual budgeting), and Klaus Schmidt-Hebbel (extraordinary expenditures and fiscal policy).
The report benefitted from the contributions of Aaron Adiv, Coco Amana, EustaciusBetubiza, Lloyd Briggs, Kristin Gilbertson, Egon Jonsson, Hoonae Kim, Mark Lundell, Roy Pepper andMichal Rutkowski. Carlos Hinayon assisted with the macroeconomic projections and in collaborationwith Ibrahim Akoum prepared the tables and graphs. Betty Narain and Soohie Warlop with the assis anceof Margarita Ortiz were responsible for document preparation.
The review was carried out under the overall direction of Adil Kanaan, Division Chiefand Basil Kavalsky, Director, Country Department IV, Europe and Central Asia Region. The missionteam wishes to thank the Latvian authorities for their excellent support and cooperation and the usefildiscussions and comments on an earlier draft of the report.
This docent has a t d aisadion snd may be usod bym *ec oely u tls pxf=m uof theolciakw lels.i atoooel may not ot_a%nbe discloesd wittt Wod aksthoiaio
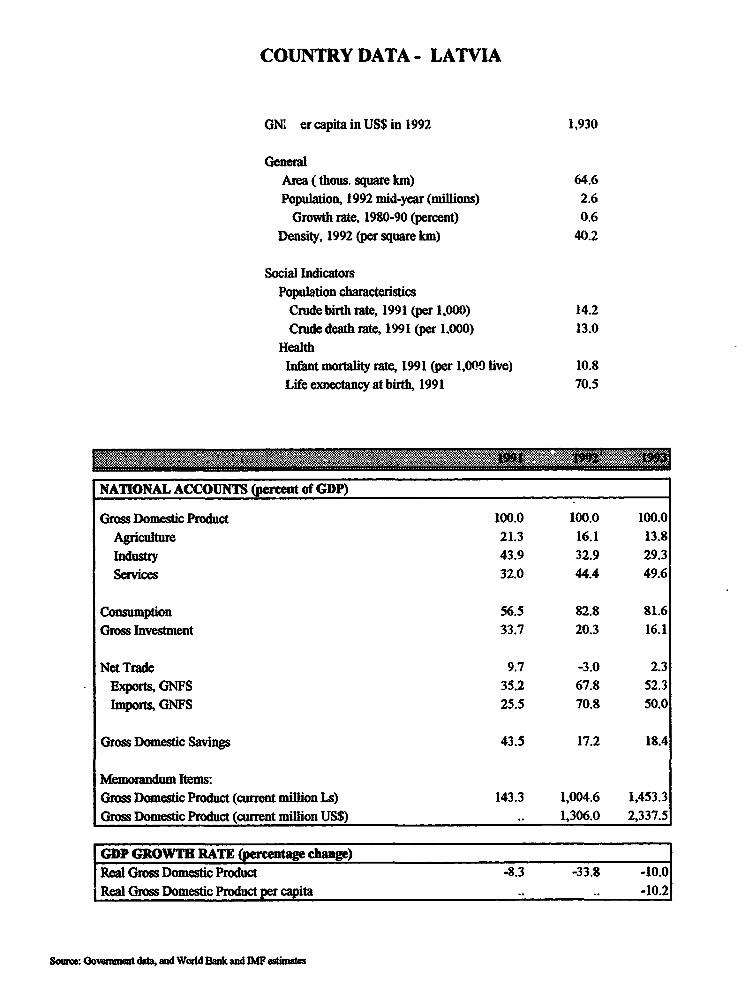
COUNTRY DATA - LATVIA
GM, er capita in US$ in 1992 1,930
GeneralArea ( thous. square km) 64.6Population, 1992 mid-year (millions) 2.6
Growth rate, 1980-90 (percent) 0.6Density, 1992 (per square km) 40.2
A. Introducton .............................................. 1B. Public Expenditure Franework ............................... .,. 2
Macroeconomic Background ............................... 2Fiscal Stance and Pattem of Expenditures ............................ 3
C. Fbial Poicy, Expndue Priorities, and Reuired Refoms ....... ........ 8Policy Options and Tradeoffs During the Transition ...................... 8Public Expenditure Priorities .................... 9Improving the Efficiency of Ordinary Exenditur e. . 10Providing for Tranition Expenditu ............................. 16Rationalizin Transfers to Local Governments .. 20Reforming the Tax System .. 22
D. Medium-Term Fiscal Oudook ....................... ............. . 25E. Defiit Fin)icing, Resource Flows, and Macroeconomic SAlty ............ 28
Chapter 2. Public Investnent Progran ........................... . 32
le.el and Sectoral Composition ................................. 32Quality of the Ongoing Program and Project Portfolio ................... 36Costs to Completion, Implementation Periods, and
Overhang of Unfnished Projects .............................. 38C. ThePublicInventPn gain t he Mfian Tenm .....ed.. ................. 40
The Need to Formulate a Strategy ........... .. .................. 40Investment Priorities .................. ...................... 41Elements of a Public Investment Program ........................... 45
D. Fnandng of Public hvesment and Availabilty of Resources ........ ..... 51Resource Needs of Public Enterprises ............................. 52Resource Needs of Local Goverments ............................. 53
E. Major Is In Pub e Investment and ...........Recom..... 54
Chapter 3. Sectoral E diture Issues . .......................... . 56
Major Issues ............................................. 57Investment Progrm .......................................... 57
- v -
C. Energ ............................... ...... ............ 63Major Issues . 63Investment Program . 64
D. Agriculture.... ...... ..................... 67Major Issues .67Investment Progran .69
E. EdAucadon ................... ......................... 72Major Issues .72Expenditure Progr-m ......... 73
F. Health Car ....................... 76Major Issues .. 76Expenditure Program .. 77
G. Mwncipal Services .............................. 80Major Issues .. 80Investment Program .. 81
Major Issues .. 85Investnent Program .. 87
Chapter 4. Public Expenditure Planningand Managenent .................. 89
.^. Intrdlucicon ........................ 89B. PreFaring, ForwIating, and Implent An eg.Annua..Budgets.. .. 89
Formmlation and Preparation .. 89Budget Implementation, Treasury Operations, and Cash Flow Management .. 91Monitoring and Performance Review .. 92Recommendations and Plan of Action .. 93
C. Dedgning a Public Inveuhnent Progra System ....................... 94Current Practice .95Role, Coverage, and Format of a Public Investment Program . 96Determining the Investment Budget ............ . 98Developing a Project Portfolio ..... 100Screening Projects for the PIP .101Intgrating the Public Investment Program into the Budget .104The Role of Executive Agencies in Public Investment Management .106Plan of Action for the hmmediate Future .107Technical Assisance Requirements .108Conclusion .109
Annexes
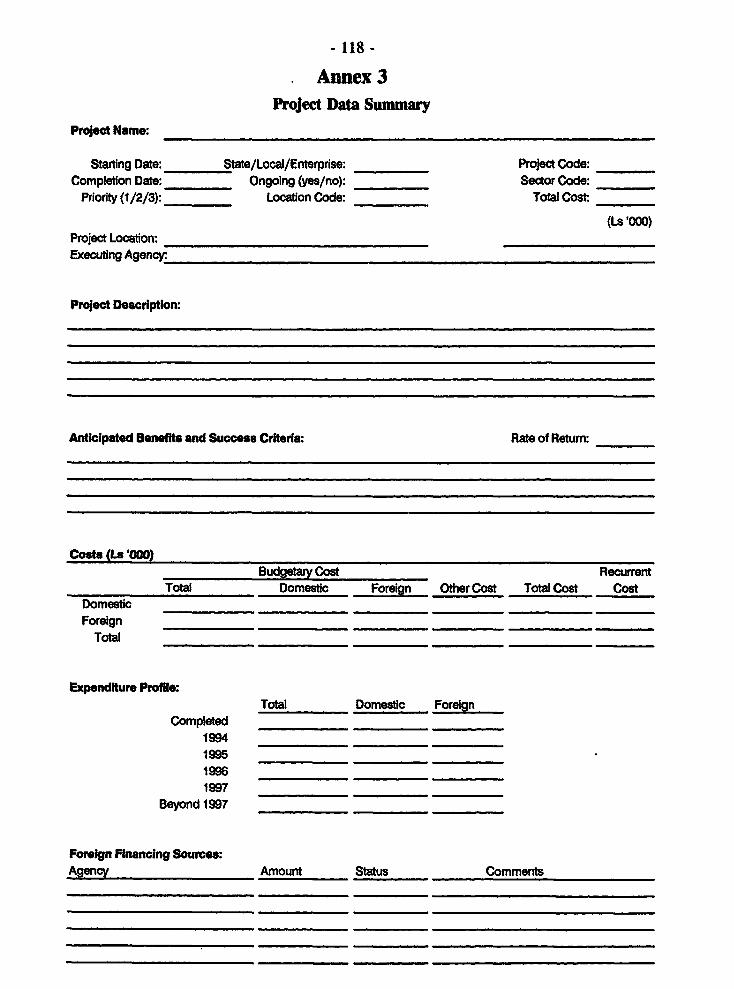
Annex 1. Fiscal Costs of Replacing the Banking Sector's Nonperforming Debt .110Annex 2. Government Debt Paths and Macroeconomic Stability .114Annex 3. Project Data Sumnary .118
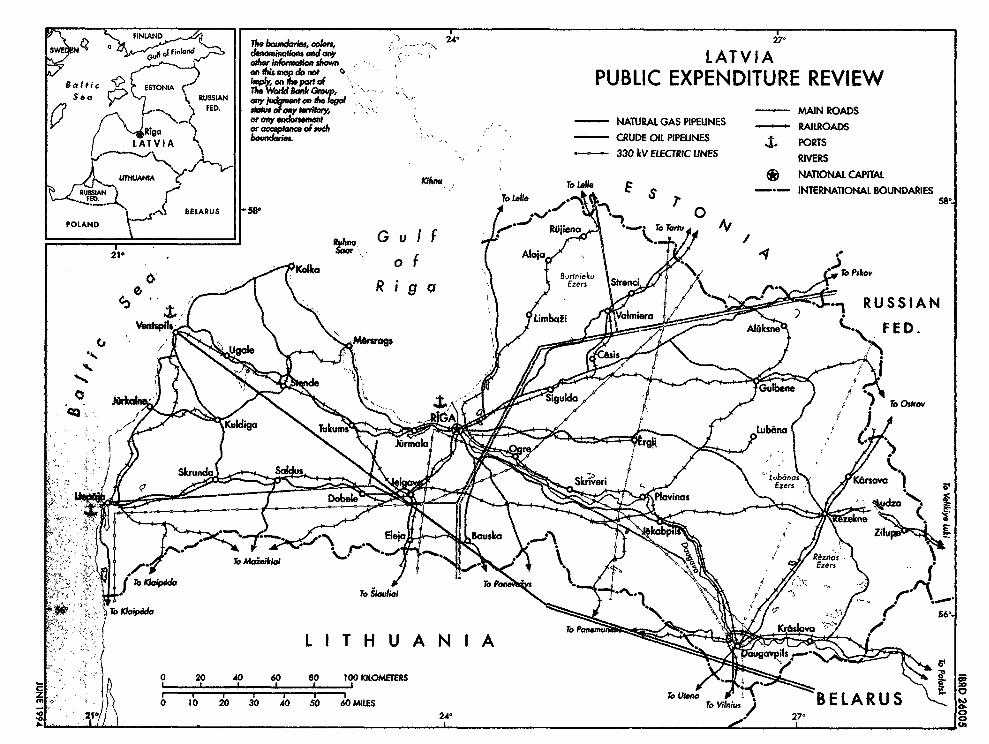
Map IBRD 26005
- vi -
Text Tables
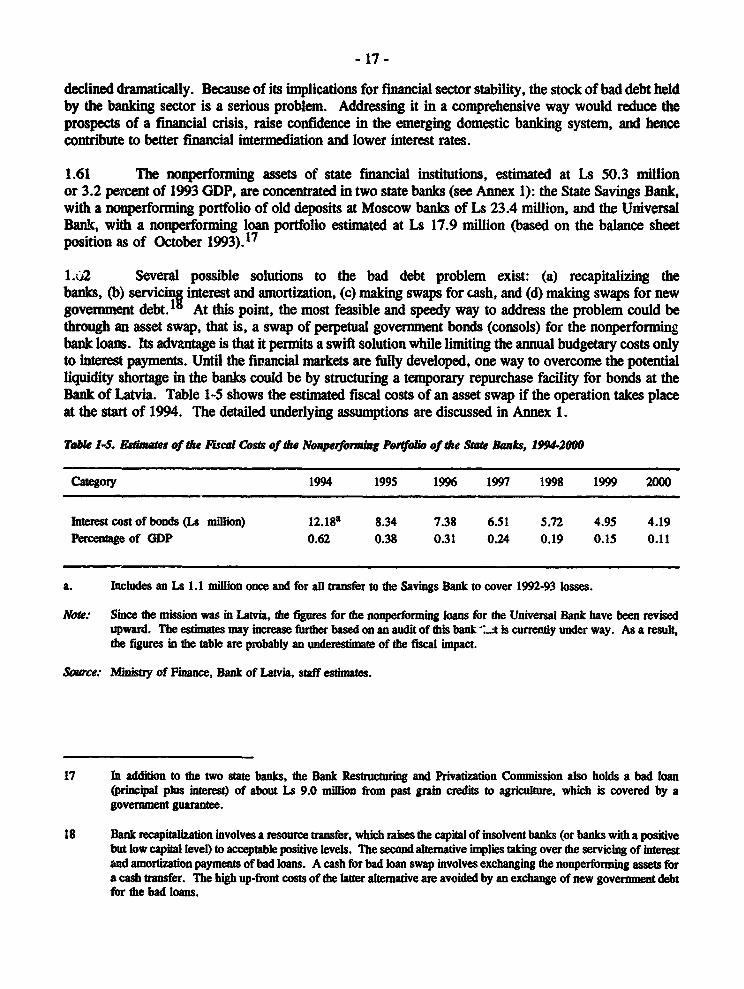
1-1. Selected Economic Indicators, 1991-93 ................................. 21-2. General Governn-ent Budget, 1991-94 .................................. 31-3. Consolidated Expenditures, 1991-93 ................................... 61-4. A Comparison of Central Government Expenditure by Type and Region .... ........ 71-5. Estimates of the Fiscal Costs of the Nonperforming Portfolio of the State
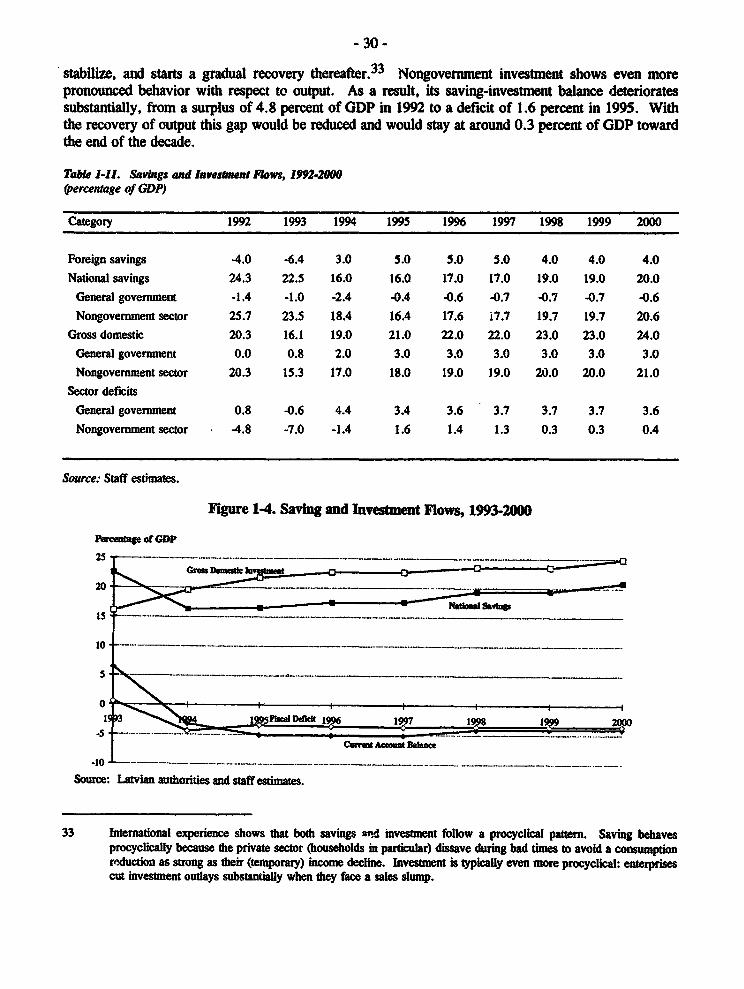
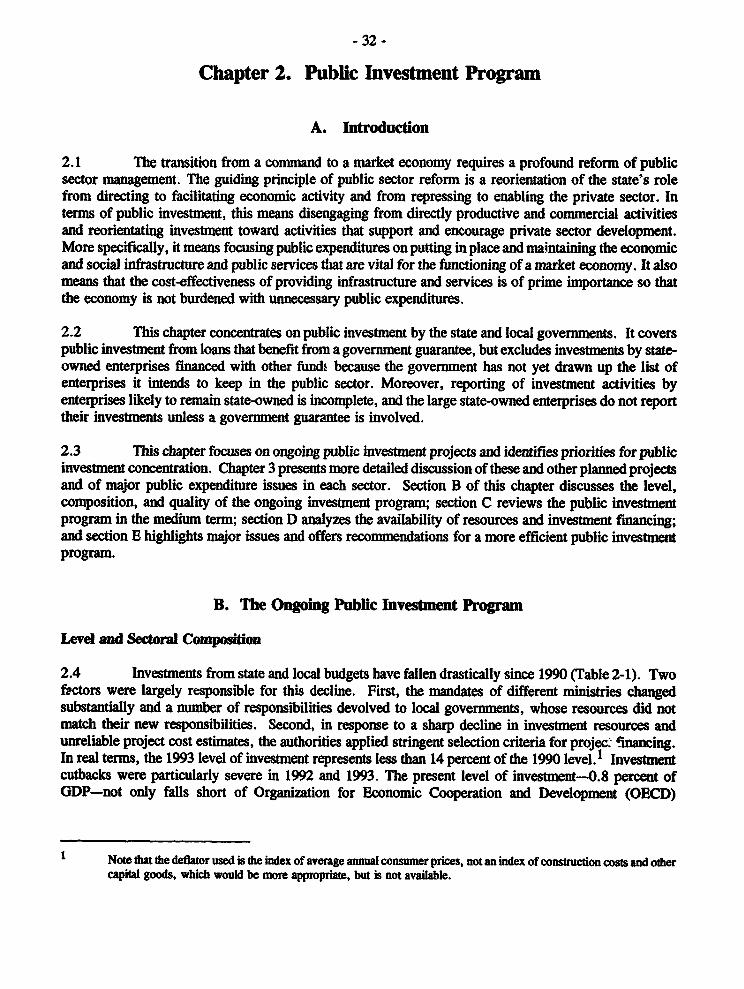
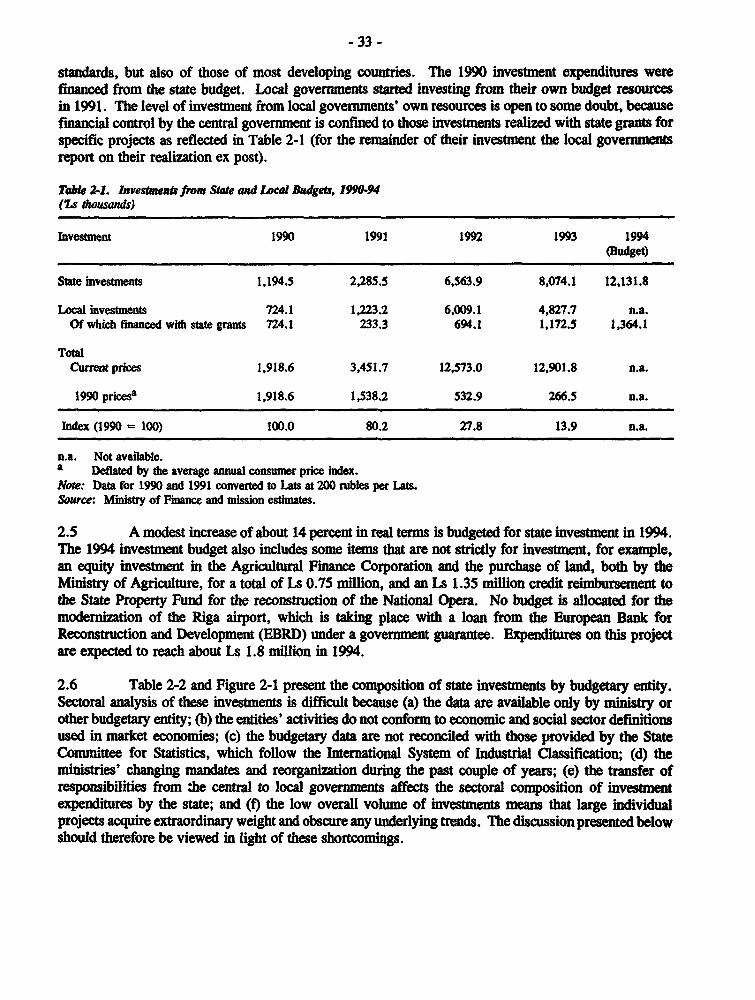
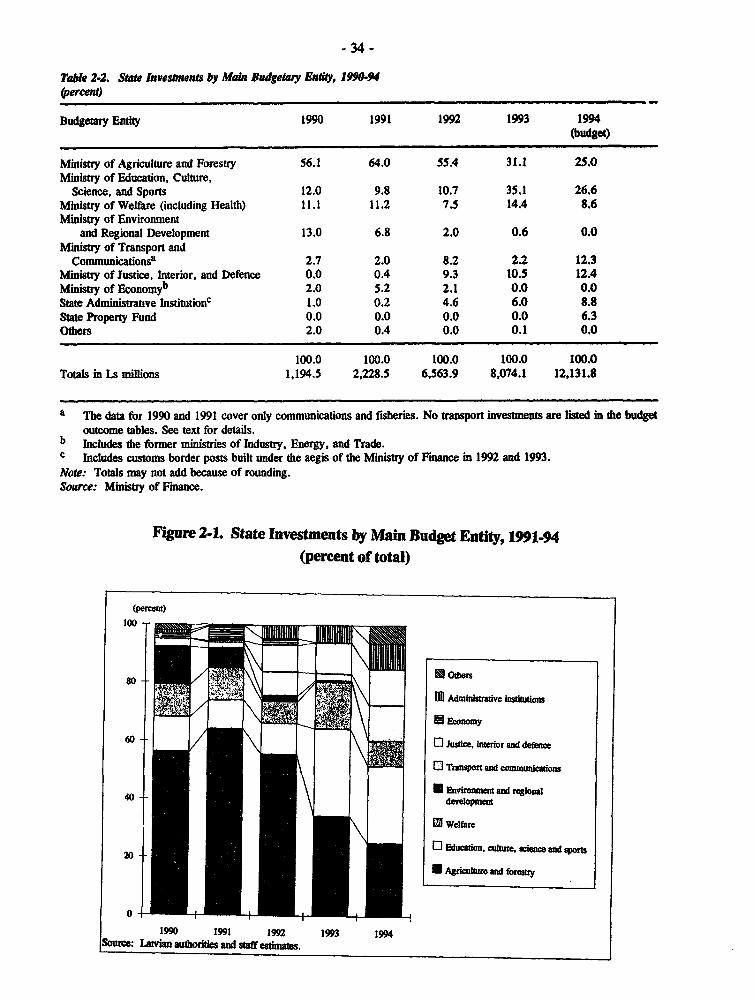
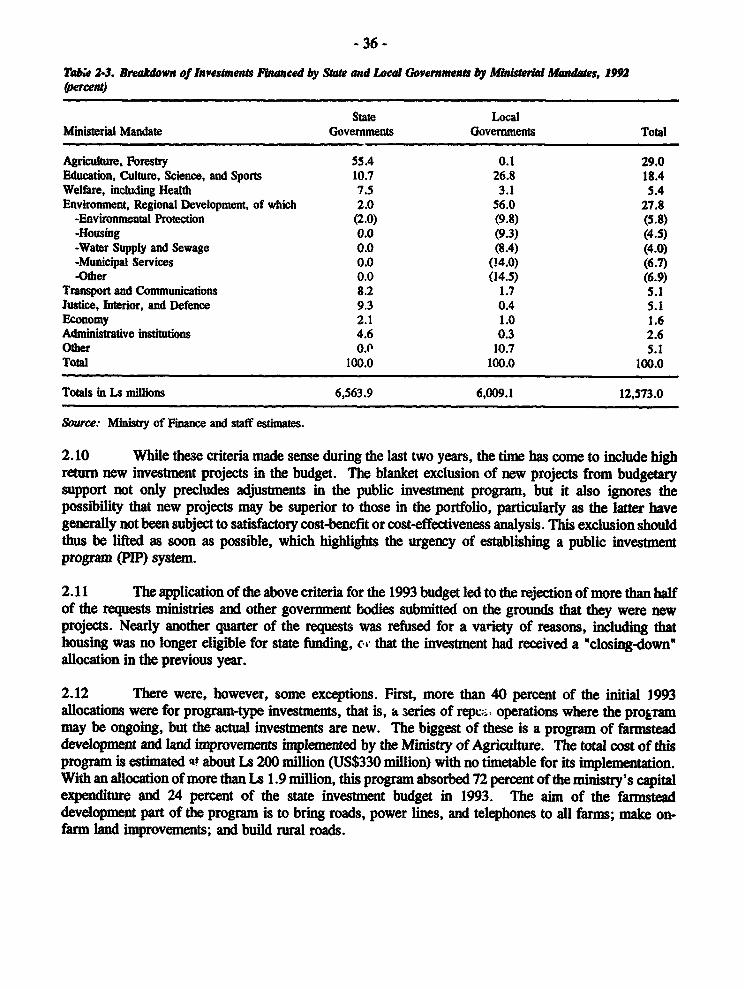
Banks, 1994-2000 .......................................... 171-6. Central and Local Government Expenditures, 1991-93 . . 211-7. Local Governments' Revenue Sources and Expenditures, 1993 .221-8. Basic Macroeconomic Indicators, 1993-97 and 2004 ........................ 251-9. Projection of General Government Operations, 1993-97 ...................... 261-10. Sustainable Fiscal Deficit and its Financing, 1993-97 and 2000 ............... I . 291-11. Savings and Investment Flows, 1992-2000 ............... .............. 302-1. Investments from State and Local Budgets, 1990-94 ........................ 332-2. State Investments by Main Budgetary Entity, 1990-94 ....................... 342-3. Breakdown of Investments Financed by State and Local Governments
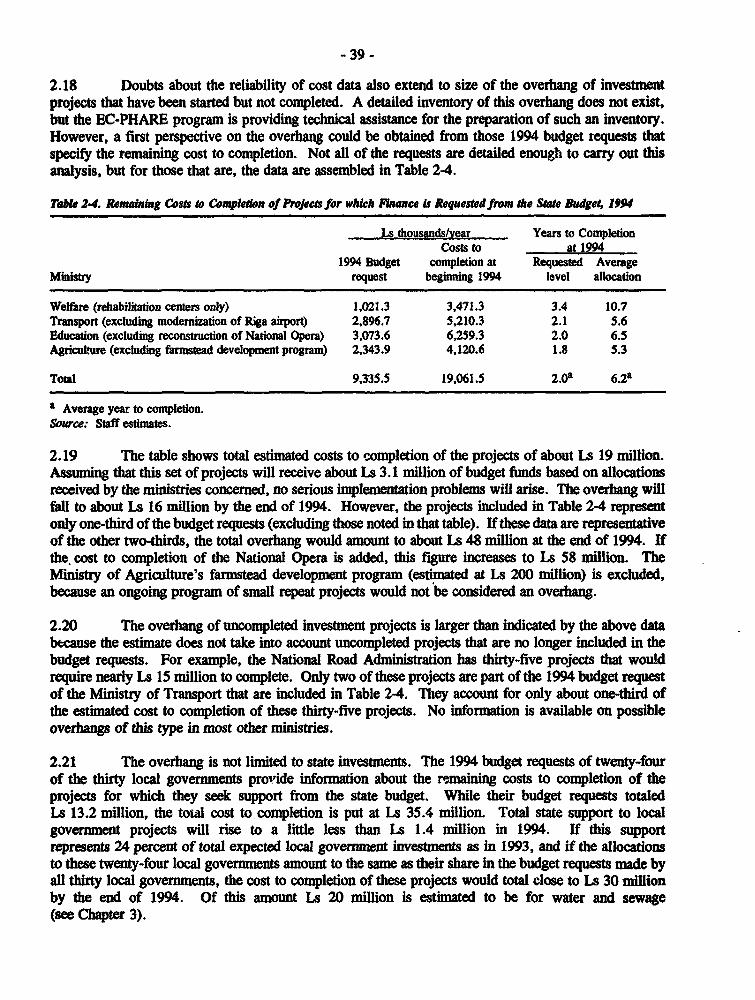
by Ministerial Mandates, 1992 ........... 362-4. Remaining Costs to Completion of Projects for which Finance is Requested
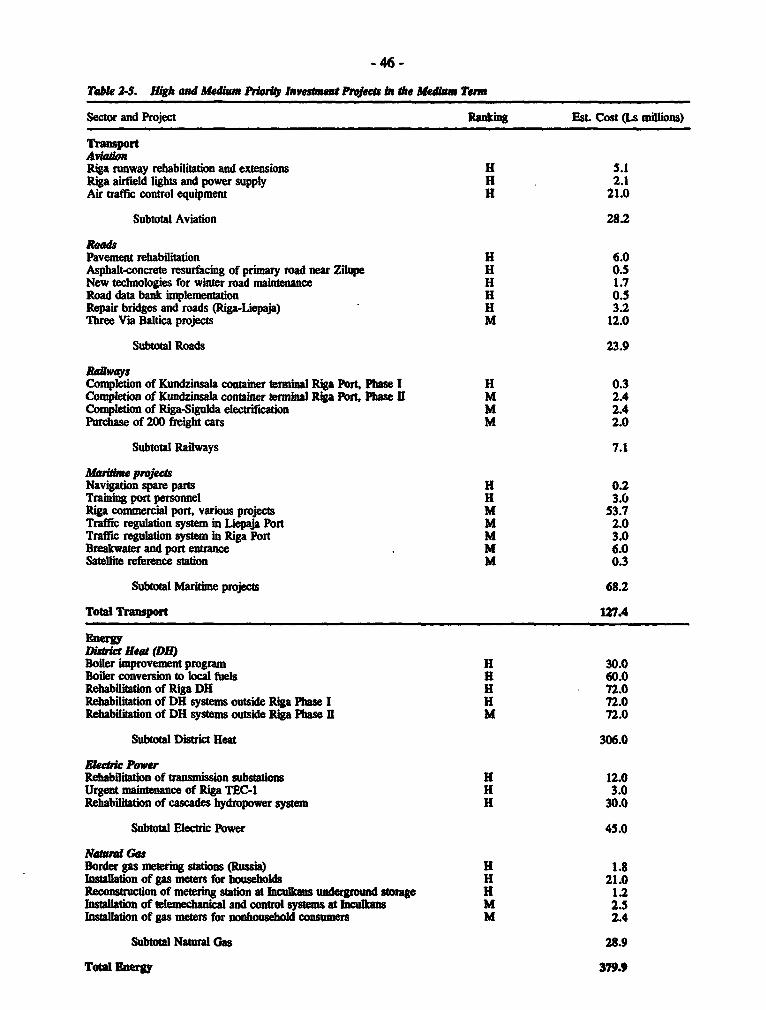
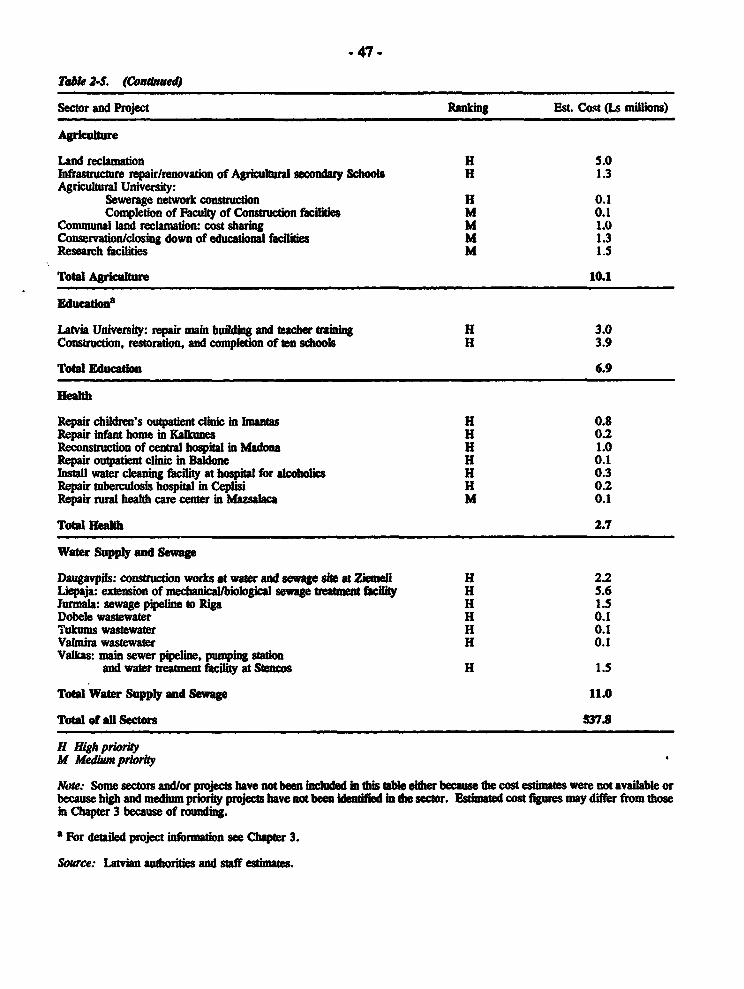
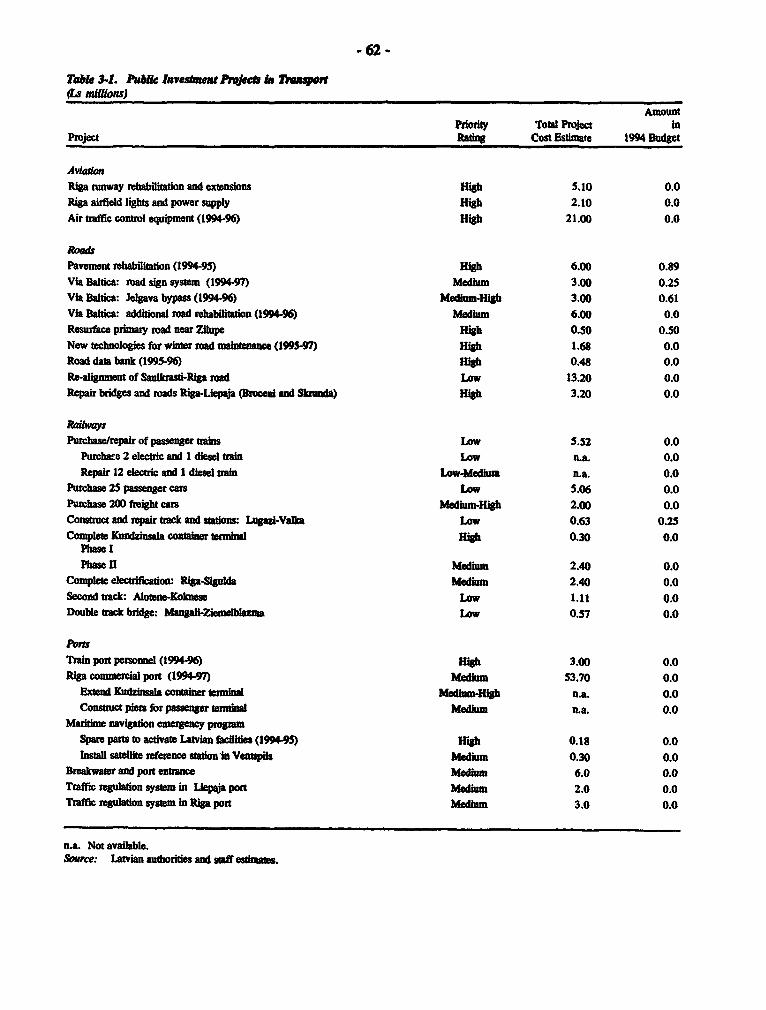
from the State Budget, 1994 ................................... 392-5. High and Medium Priority Investment Projects in the Medium Term .............. 462-6. Public Investm3nt and Available Resources, 1995-97 ........................ 513-1. Public Investment Projects in Transport ................................ 623-2. Public Investment Projects in Energy .................................. 663-3. Public Investment Projects in Agriculture ................................ 713-4. Budget Allocations for Education and Training in Latvia and
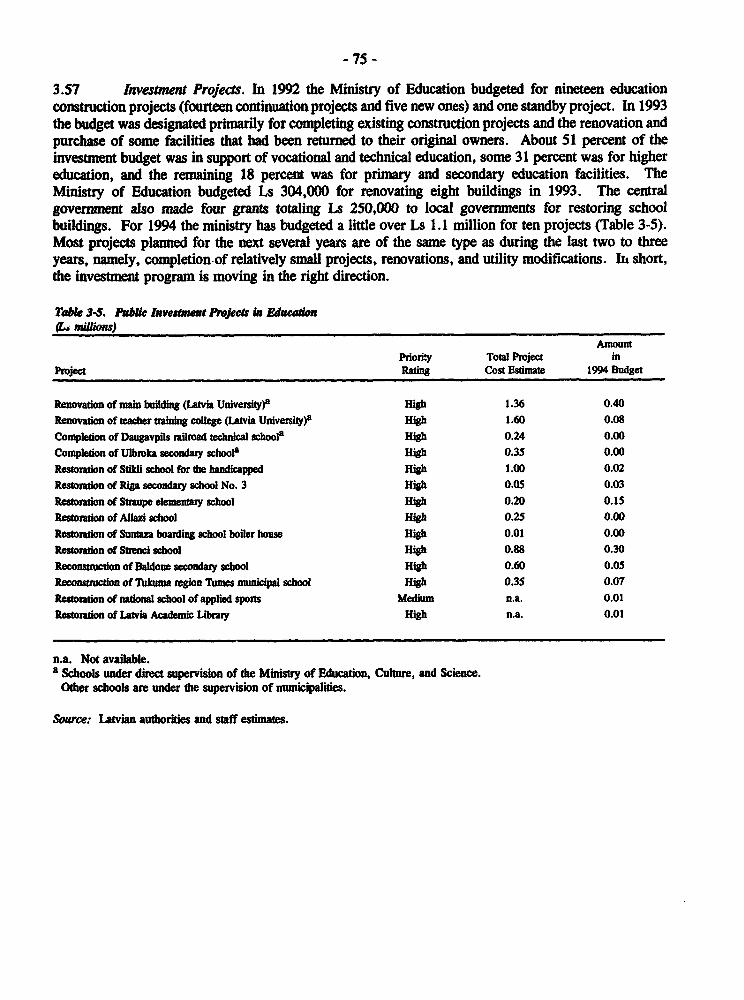
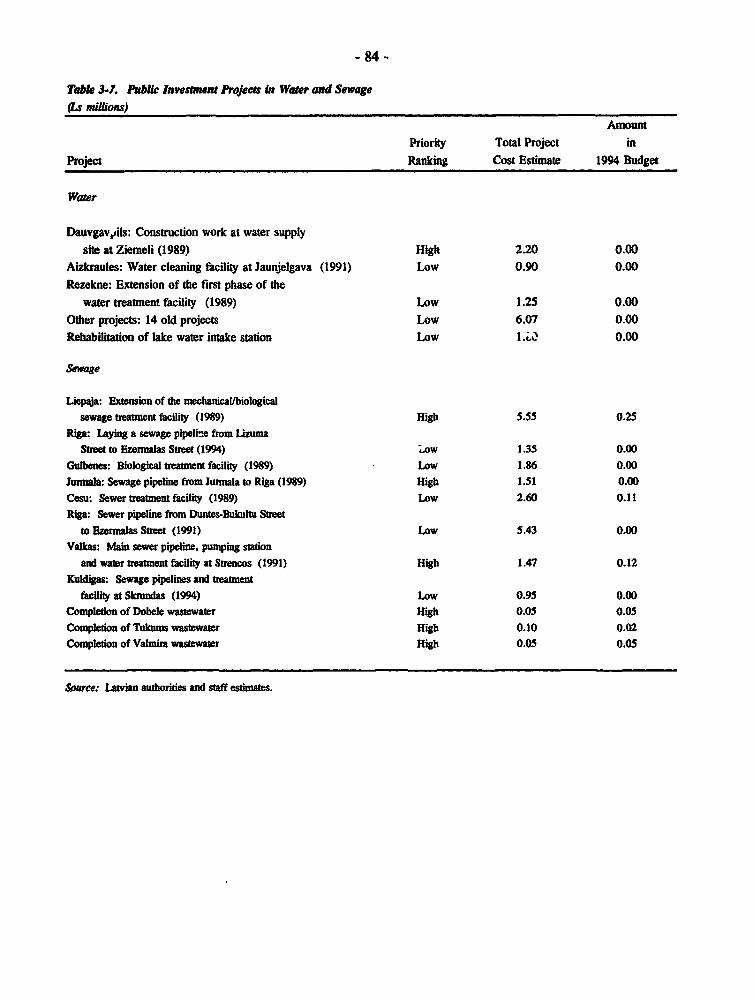
Selected OECD Countries, 1993 ................................. 723-5. Public Investment Projects in Education ................................ 753-6. Public Investment Projects in Health .................................. 783-7. Public Investment Projects in Water and Sewage .......................... 84
Annex Tables
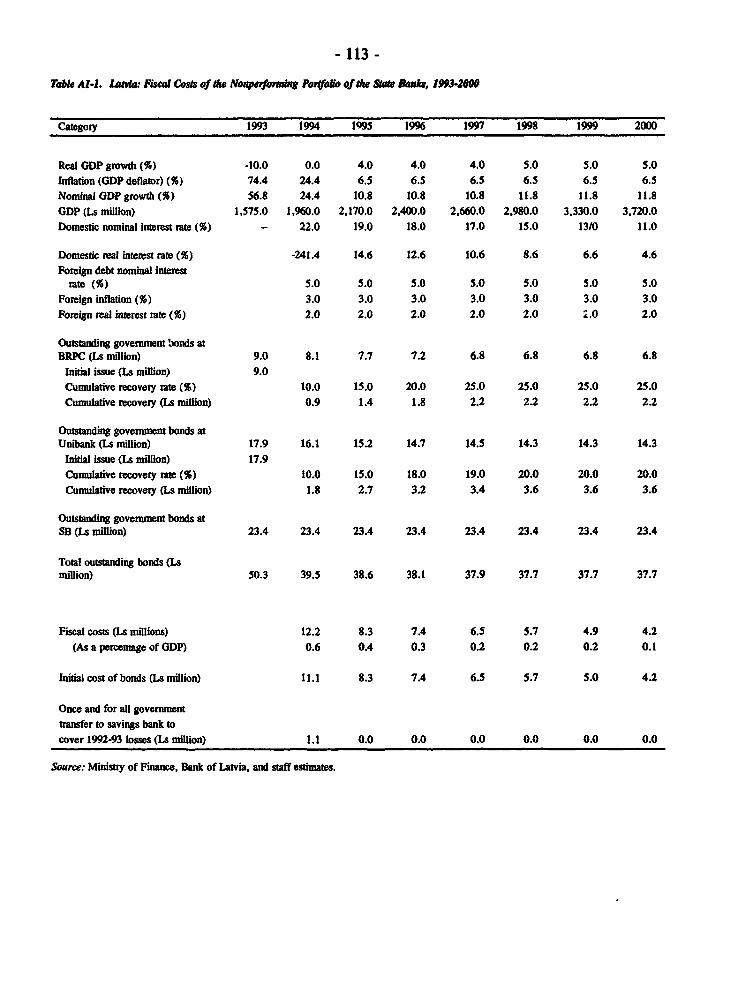
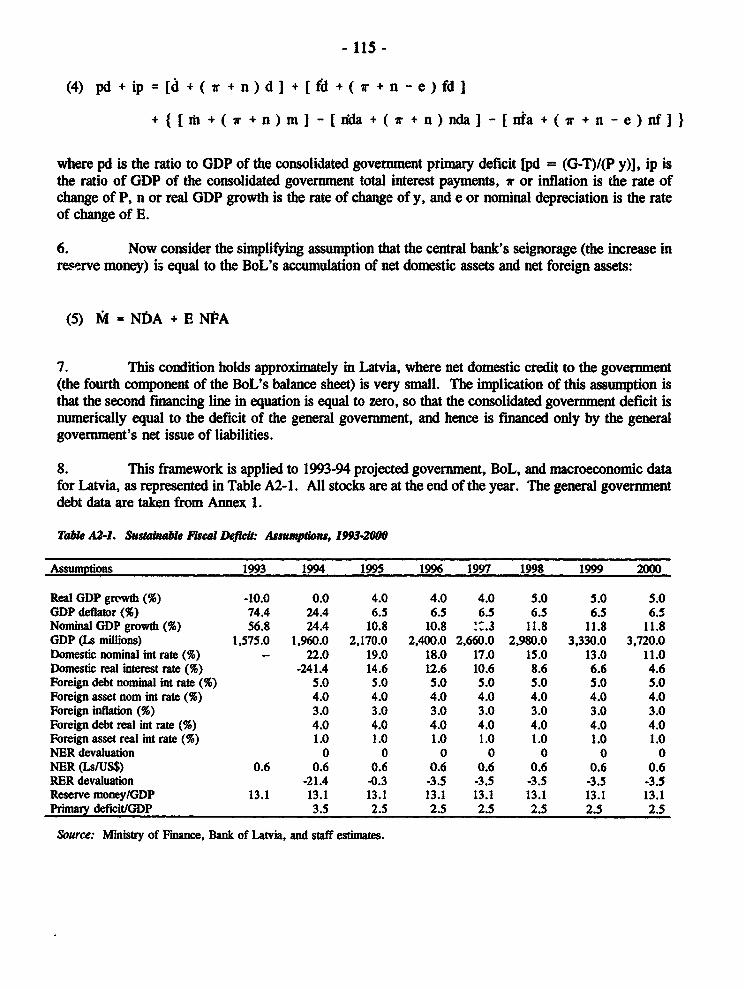
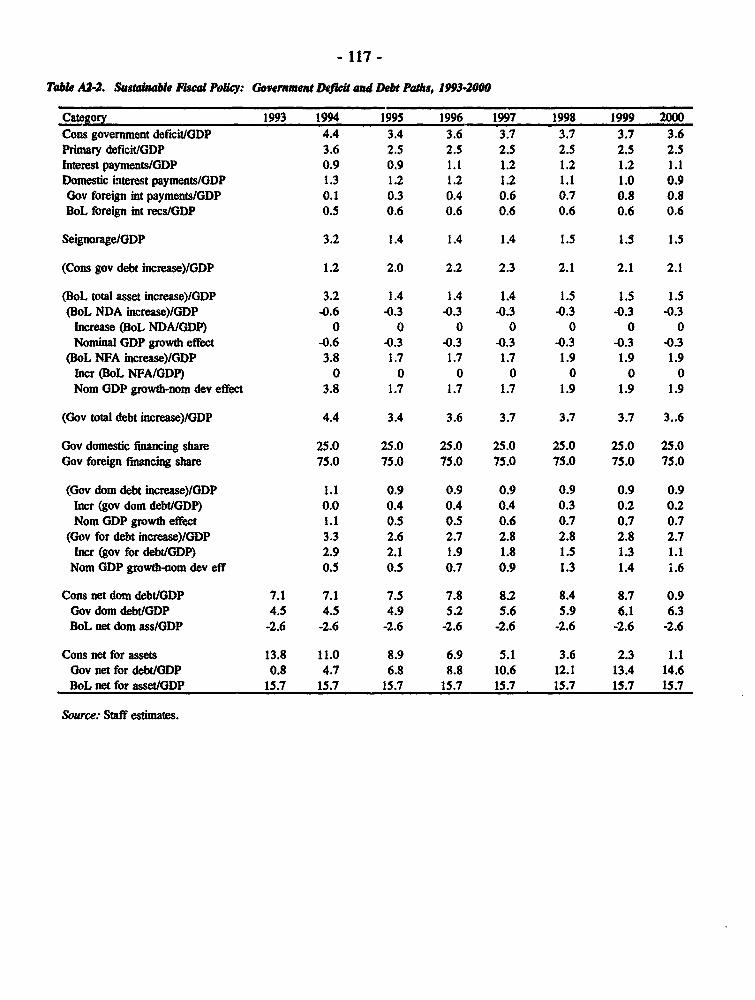
Al-1. Latvia: Fiscal Costs of the Nonperforming Portfolio of the State Banks, 1993-2000 ... 113A2-1. Sustainable Fiscal Deficit: Assumptions, 1993-2000 ....................... 115A2-2. Sustainable Fiscal Policy: Government Deficit and Debt Paths, 1993-2009 .... ..... 117
Text Figures
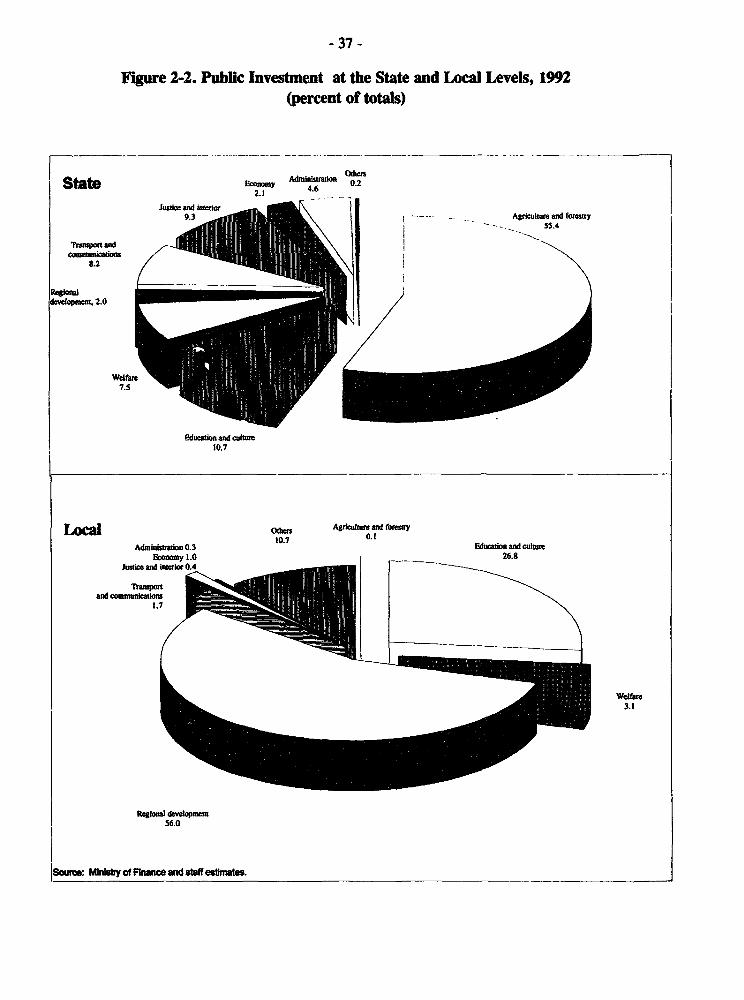
1-1. Transfers to Individuals, 1990-94 .101-2. Composition of Expenditures, 1993 and 2000 .271-3. Financing of the Fiscal Deficit, 1993-98 ......... ...................... 281-4. Savings and Investment Flows, 1993-2000 .302-1. State Investments by Main Budgetary Entity, 1990-94 .342-2. Public Investment at the State and Local Levels, 1992 ....................... 37
- vii -
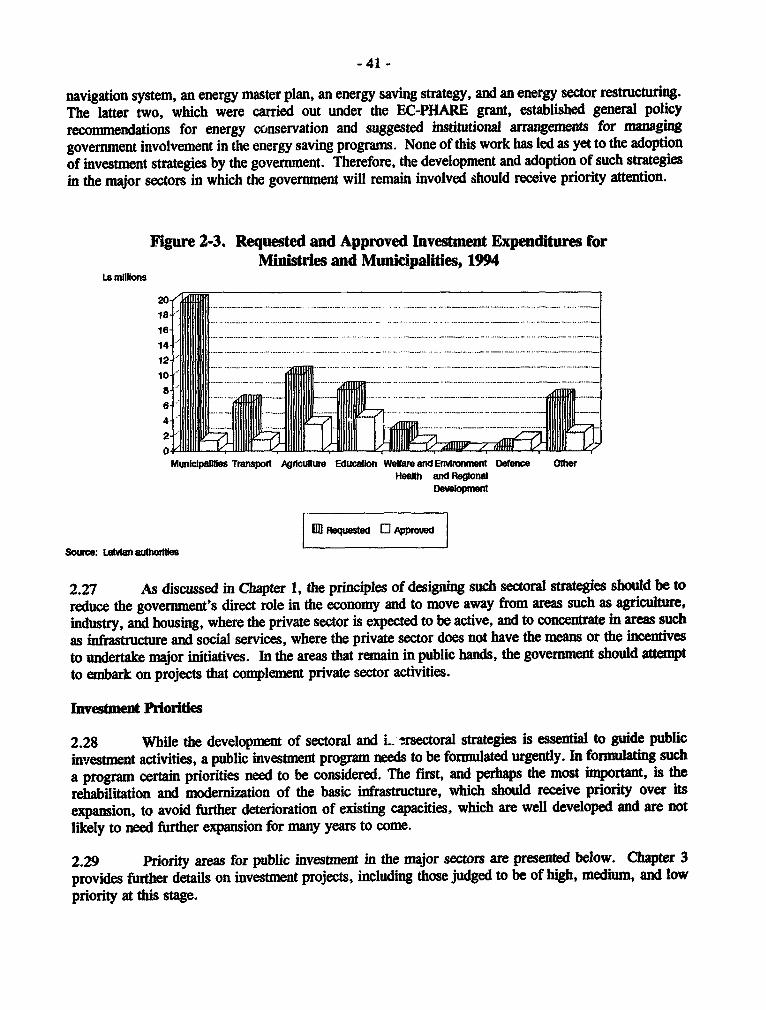
2-3. Requested and Approved Investment Expenditures for Ministies andMunicipalities, 1994 ........................................ 41
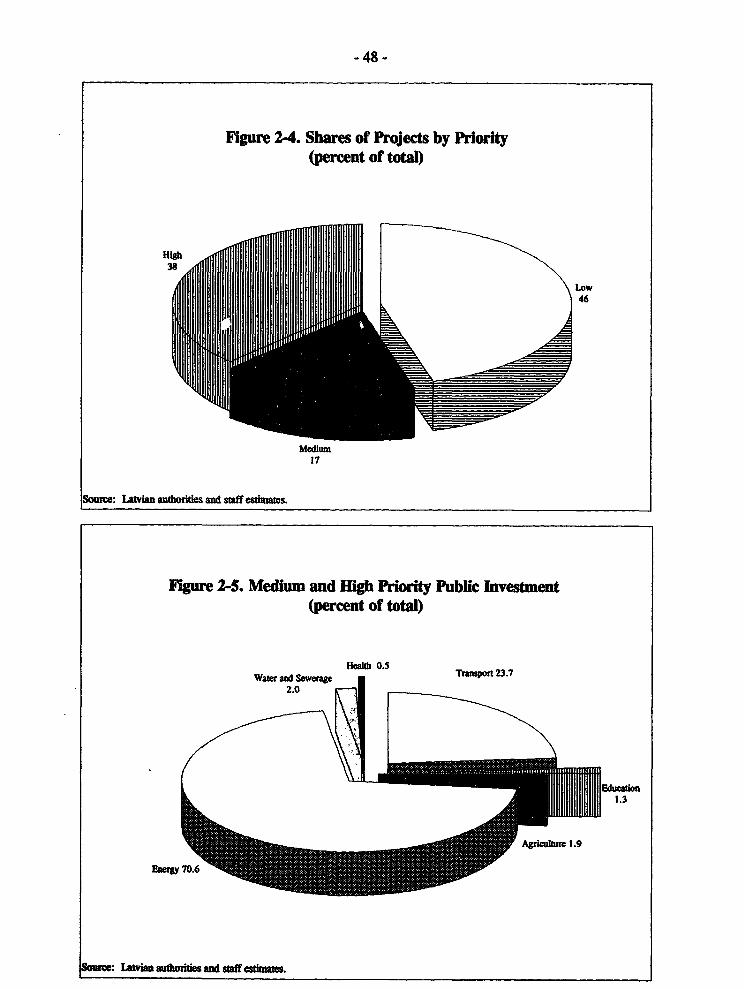
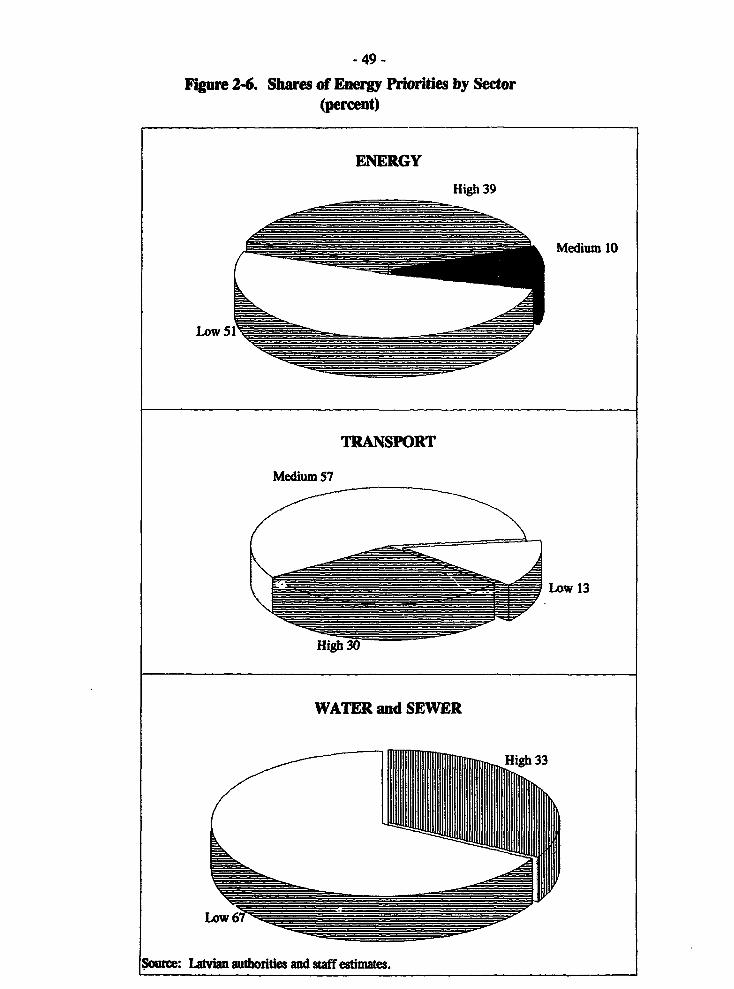
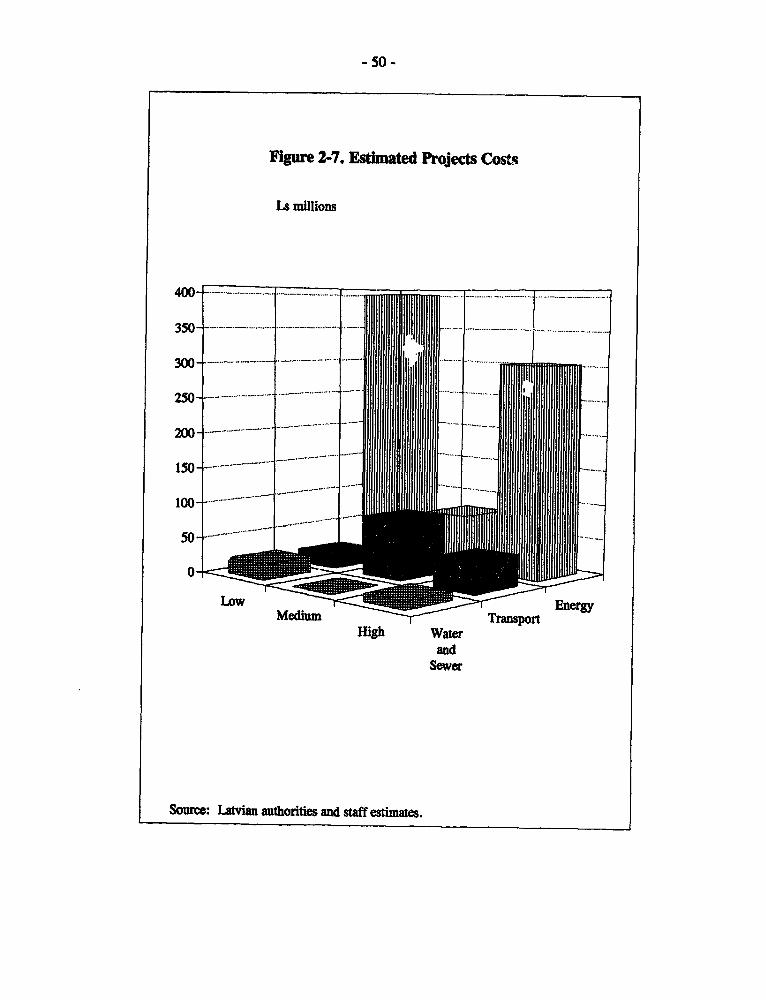
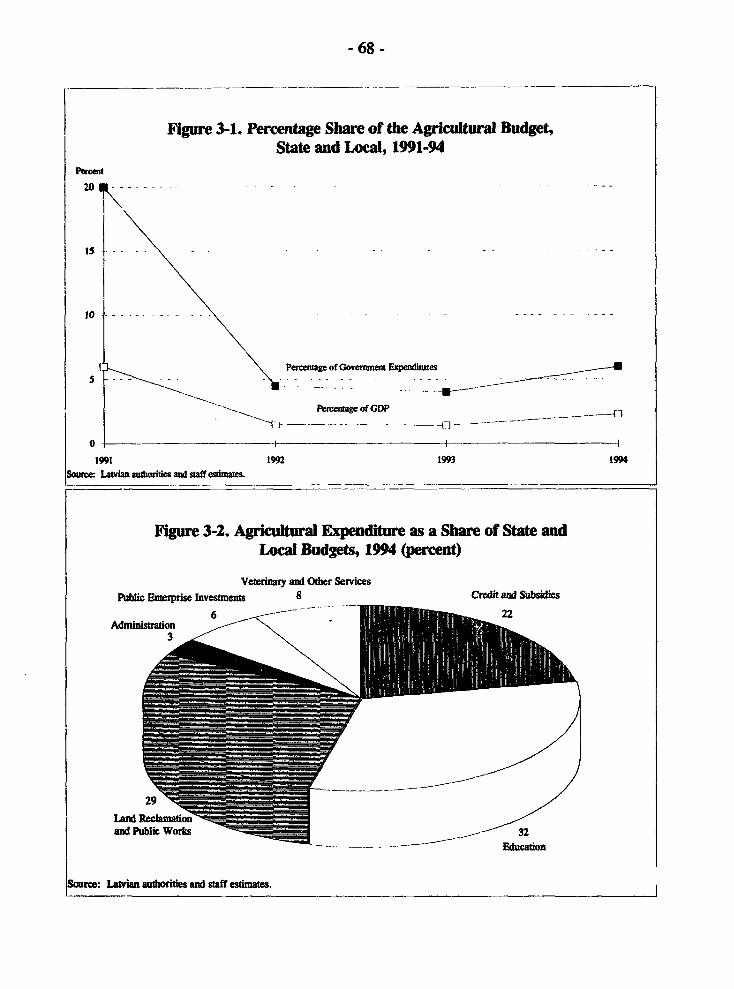
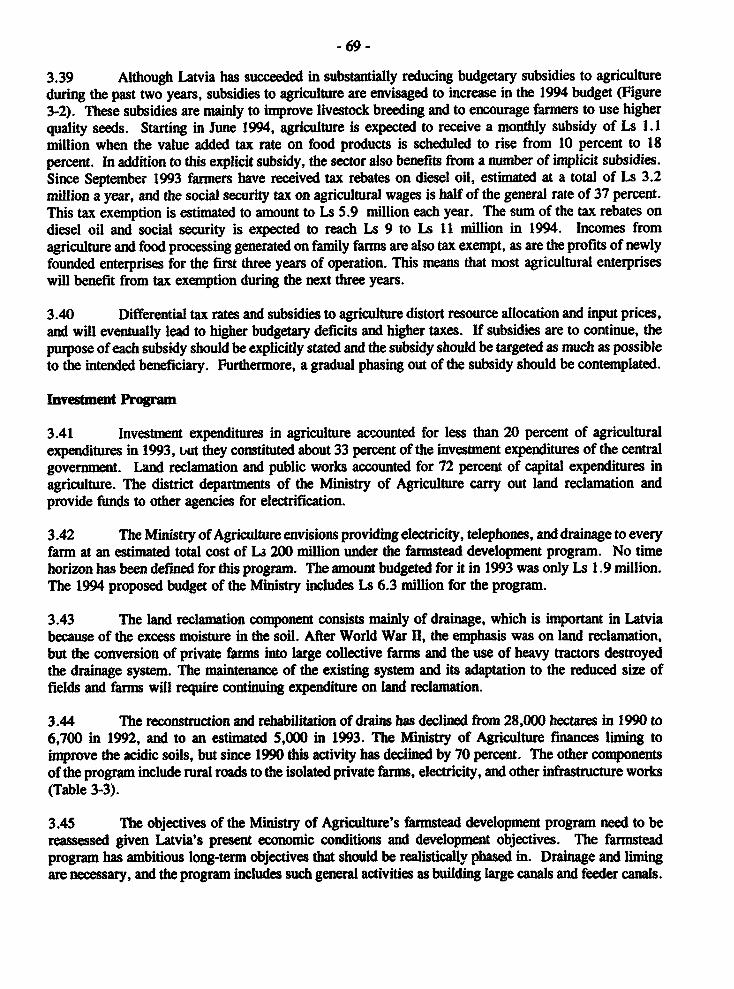
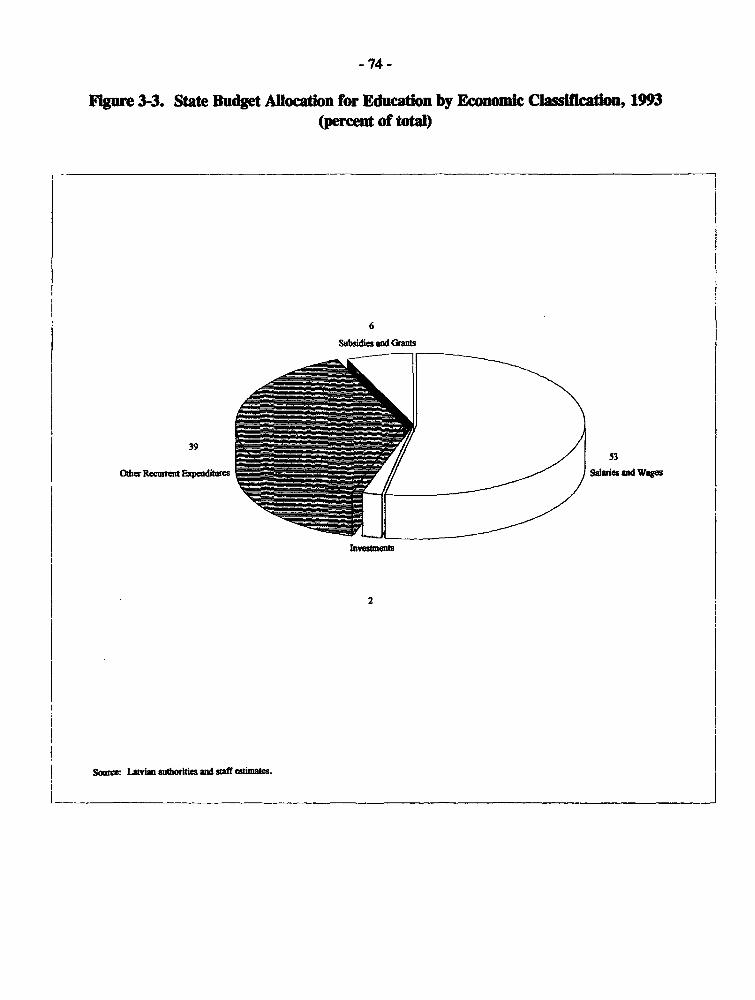
2-4. Shares of Projects by Priority ...................................... 482-S. Medium and High Priority Public Investment ............................ 482-6. Shares of Priority Projects by Sector .492-7. Estimated Project Costs ......................................... 503-1. Percentage Share of the Agricultural Budget (State and Local), 1991-94 .... ........ 683-2. Agricultural Expenditure as a Share of State and Local Budgets ................. 683-3. State Budget Allocation for Education by Economic Classification, 1993 .... ....... 743-4. Public Health Care Expenditure by the State and Local Governments, 1992-94 .... ... 793-5. Capital Investments in Health Care, 1992-94 ............................. 79
Text Boxes
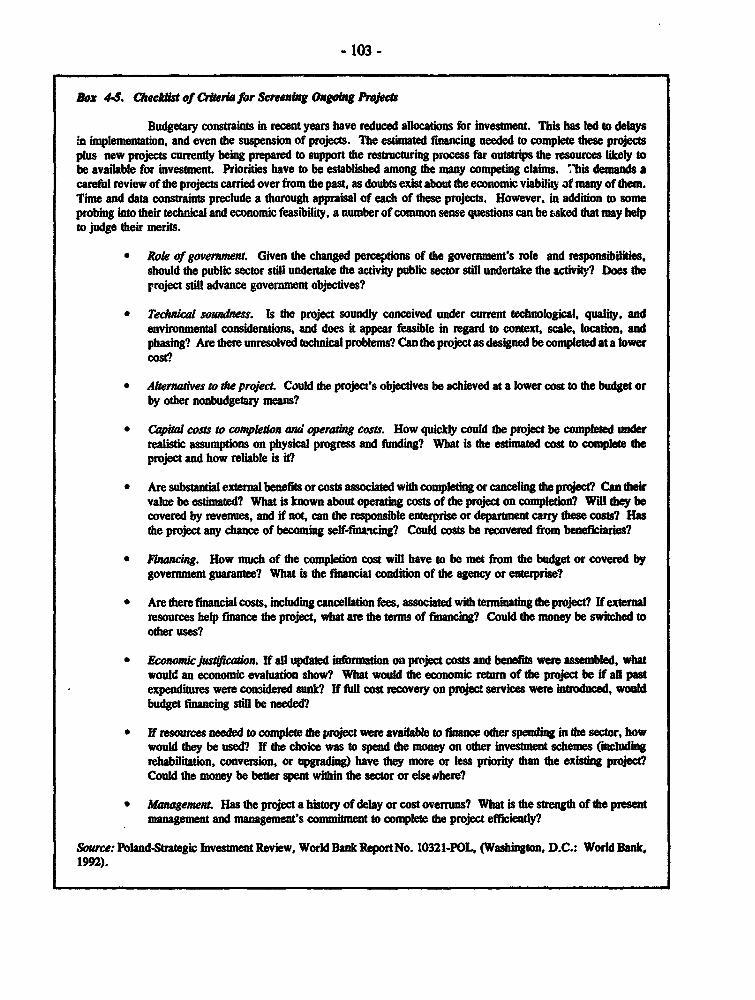
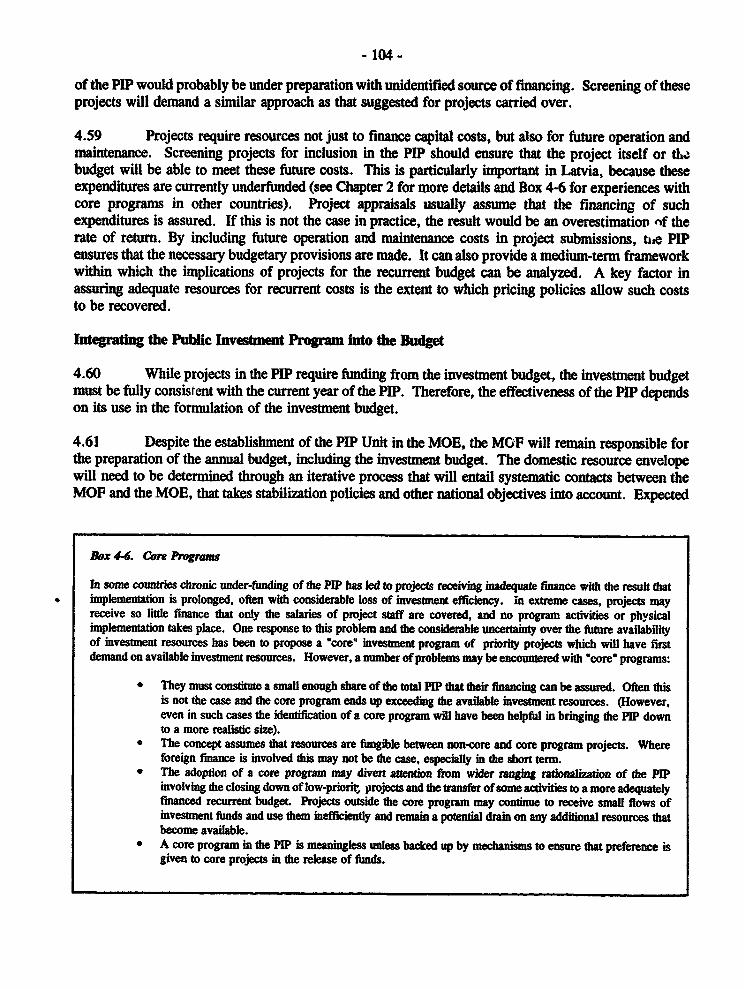
1-1. The Role of Government in a Market Economy .11-2. Extrabudgety Funds. 41-3. Latvia's Tax System .244-1. External Support for Preparing a PIP .954-2. Example of a Format for Preparing a Project Profle .994-3. Overloading and Overprogramming .1004-4. Project Identification .1014-5. Checklist of Criteria for Screening Ongoing Projects. 134-6. Core Programs .04
Executive Summary
i. Economies in transition typically experience a deterioration in government finances duringthe early phase of transition that stems both from strong declines in tax revenues and rising demands forexpenditures to cover the costs of the transition. The effect of these changes is often accompanied bysignificant government deficits, leading to inflation and overall macroeconomic instability. Latvia hassuccessfully avoided this path so far and has experieiiced near-balanced budgets since regainingindependence in 1991 and a dramatic decrease in inflation after an initial tenfold increase in prices in1992. This has been essentialy the result of the tight fiscal, monetary, and incomes policiz:. that Latviahas pursued during this period.
Challnges Ahead
ii. Latvia now faces the twin challenge of pursuing a course of fiscal prudence consistent withmacroeconomic stability while satisfying substantial demands on budgetary resources. The budgetaryresources are needed to cover an expanding level of current expenditures and to finance the temporary,but nevertheless, substantial costs of a more rapid structural transformation. Moreover, public investmeLmust grow. The present levvl of public investment-0.8 percent of GDP-not only falls short ofOrganization for Economic Cooperation and Development (OECD) standards, but also those of mostdeveloping countries.
iii. The economy's medium-term outlook indicates that the prospects for output recovery aregood. Provided stmctural reforms continue, Latvia should be able to manage moderate fiscal deficitswithout jeopardizing its macroeconomic stability. Based on the macroeconomic projections developedfor this review, public investment could increase to about 2 percent of GDP in 1994 and to 3 percent in1995 and thereafter. With such a projected increase in public investment and the likely increases in bothordinary and extraordinary transitional expenditures, th_ fiscal deficit would reach 4.4 percent of GDPin 1994 and around 3.5 percent in the second half of the decade.
iv. The projected fiscal deficits would have to be financed mainly by foreign borrowing, and toa small extent borrowing from domestic financial markets. Total govemment domestic and foreign debtis projected to rise to about 20 percent of GDP by the end of the decade. These borrowing levels areconsstent with maitining a sustainable average yearly growth of GDP of 4 to 5 percent. With Latvia'scurrent low levels of debt, a reliance on a rising amount of debt would not end-anger the country'screditwordtiness and would finance resource needs during a period of structural transformation and slowlyrising output. An important consideration, however, is to ensure that the local cost portions of the loansare included in the budget, as foreign credits typically finance foreign exchange costs of projects. Oncethe output recovery accelerates and becomes sustainable, the budgetary deficit would be reduced and thelevel of debt would start falling with respect to GDP.
v. The projections also indicate that further tax reform measures are needed to contain additionalincreases in fiscal deficits. Such measures should focus on eliminating tax concessions to special groups,unifying tax rates, and simplifying the tax system in general. They should also help to di-tnbute the taxburden, which currenty falls heavily on labor, in a more balanced manner. In addition, the authoritiesneed to explore the scope for introducing some form of presumptive taxation (such as a minimumpayment requirem on the estdmated value of assets or income) on the emerging private sector, whichcurrently goes largely untaxed. Such a tax, which other countries have used successfully, would be easyto administer and could provide a simple way to reach the private sector until a more effective taxadministration is put in place.
- ix -
vi. The most important challenge the government faces, however, is to contain expenditures toavoid high fiscal deficits and unsustainable levels of domestic and external borrowing. This reportaddresses this and other related issues. It focuses on those areas where measures are needed to formulateand successfully implement a coherent public expenditure policy and program in the medium term. Thereport is divided into the following chapters:
* Chapter I examines public expenditure policies and priorities during Latvia's transition to amarket economy. The chapter discusses ways to improve the efficiency of expenditures andidentifies high priority expenditure needs during the transition. It also assesses thesustainability of fiscal policy and the availability of fiscal resources to finance publicexpenditures in the .nedium term in the context of a consistent macroeconomic framework.
* Ghapter 2 focuses on ongoing public investment programs and projects and identifiespriorities for public investment concentration. In the absence of a detailed public investmentprogram in Latvia at this time, the chapter makes a preliminary attempt to rank investmentprojects tnat have beep proposed in key sectors and to suggest the feasible level ofinvestment, taking into account the available resources projected in Chapter 1.
* Chapter 3 examines sectoral expenditure issues and gives preliminary views on additionalprojects that have not yet been incorporated into a coherent investment program at thegovernment level. Together with Chapter 2 it helps to identify important projects forinclusion in a rolling three-year public investment program as it evolves.
* Chapter 4 focuses on the process of public expenditure planning and managemnent with a viewto strengthening the budget formulation process and to designing a system to guide publicinvestment over the medium term.
The main findings and recommendations of these chapters are summarized below.
Public Expenditure Policies and Porities
vii. Setting Expenditure Priorities. In reviewing and deciding on public expenditure priorities,consideration should be given to whether (i) the mix and scope of public sector expenditures isappropriate, and has been brought in line with reduced budgetary resources; (ii) public sector activitiesare being undertaken at minimum cost; (iii) the public expenditures complemmat private sector activities;and (iv) the expenditures deepen structural reforms.
viii. The guiding principle for allocating expenditures across sectors should be a gradual phasingout of the public sector from those activities that the private sector can fully carry out, or participate inat a significant level. Goods or services that the private sector can produce, such as in agriculture andindustry, should be transferred to the private sector unless compelling reasons exist for temporarilycontinmng with public provision. Likewise, the private sector could engage in activities such as trade,tourism, finance, and housing and could also be involved in providing some transport andtelecommunications services. Public expenditure should focus mainly on basic infrastructure and socialservices. International experience suggests that public investment in infrastructure is highlycomplementary with private sector investment and is needed for a vigorous private sector response.
- x -
ix. Priority should also be accorded to extraordinary expenditures related to structural reforms.A speedy solution to the non-performing loan portfolio of the state banks is urgent, as is the privatizationand restructuring of state-owned enterprises. The government also needs to increase unemployment-relatedexpenditures as it pursues large-scale privatization more vigorously. Adequate expenditures are neededto improve the delivery of social services and to provide social benefits targeted at those who are hit thehardest by the short-term consequences of structural transformation. In addition, and this is a majortheme of this review, the government needs to set aside sufficient resources to finance an expanded publicinvestment program. In formulating such a program, it should give priority to the rehabilitation andmodernization of basic infrastructure over its expansion, at least for the time being.
x. Improving the Effiiency of Resource Use. Reforming public expenditures calls forrationalizing such expenditures as transfers to individuals, subsidies of various kinds, and localgovernment expenditures. The significant budgetary savings that would result from these measures, aswell as complementary tax reforms, would allow the government to reorient resources towardrestructuring needs and public investment.
xi. The composition and allocation of current expenditures need to change to improve efficiencyand free resources for public investment. Transfers to indi;,dul (pension payments, family benefits,social assistance transfers) account for the largest share of current expenditures and need a thoroughreview. A comprehensive pension reform with particular reference to its fiscal consequences is essential.The benefit formula, which links the value of pensions to the average wage will need to be changedbecause it will lead to an excessive drain on the budget as the population ages. In the meantime, raisingthe retirement age from its currently low level is the most immediate way to contain costs. Rationalizingthe current structure of family benefits requirc3 three steps. First, the cost of delivering such benefitsshould be minimized by consolidating the different existing programs. Second, the number of recipientsshould be reduced by targeting the beneficiaries through means testing. Third, income levels andeligibility for benefits need to be verified to prevent fraudulent claims. The current systen of socwialassistance which provides cash and coupons for food and clothing, is also inappropriate because itsdisbursement is lowest in those areas where needs are the greatest. The government should allow localauthorities to deliver such services based on stipulated minimum levels of benefits and ensure that themunicipalities have the financial resources to provide these services.
xii. Adminstrative exp -itures are growing fas. and public sector wages and employment policiesneed to be reassessed. Public wages should be based on skills and qualifications. Employment policyshould aim at reducing over-staffing in certain ministries-particularly in areas where responsibilities areto be transferred to the private sector-and at increasing employment in selected areas experiencingshortages. A number of measures in the education and health sectors are needed to contain budgetarycosts. In health the composition of expenditures needs to change from inpatient care to primary healthcare. In the education sector, consolidation of schools and programs is needed to improve facilityutilization rates and to allow better maintenance of facilities. Also, in both sectors efforts are neededto introduce cost-recovery measures and stimulate private participation.
xiii. Subsides still account for a large share of public resources. Agriculture is budgeted toreceive substantial explicit subsidies, and along with other sectors it benefits from numerous implicitsubsidies in the form of tax concessions, exemptions, and debt write-offs, all of which contribute tohigher deficits, and ultimately to higher tax rates. Significant indirect subsidies also exist at the localgovernment level for housing, transport, and district heating and other utilities. This calls for the
- xl -
introduction of cost-based tariffs for public services that have so far remained underpriced. Cost recoverywould not only help reduce subsidies, but would also contribute to better resource allocation.
xiv. There is also need to adopt a number of measures to improve the efficiency and orientationof state and local government expenditures. A careful assessment of the appropriate assignment ofexpenditure and revenue responsibilities between the state and local governnents is reconmnended toensure the financial viability of municipalities while providing efficient municipal services. A substantialdecentralization of authority has occurred in Latvia since independence andn major expenditureresponsibilities have been shifted to the local level: local governments are currently responsible forhousing, municipal services, and social programs (education, health, and social assistance). However,progress in developing of a transparent and predictable system for revenue assignment and sharing hasbeen slow. Transfers from the state budget are inadequate, and all capital investment, spare parts, andsome operating expenses are covered out of local government budgets without an adequate revenue base.Moreover, state-mandated fee exemptions and low user charges place further stress on local budgets.Although legislation is currently being drafted to clarify expenditure and revenue assignments further,a special effort to assess the adequacy of proposed budget allocations is still needed.
xv. Meeting Transition Expenditures. To support economic growth in a transforming marketeconomy that would be led by the private sector, a comprehensive and simultaneous reform of thefinancial and enterprise sectors is needed. This reform requires restructuring the banking system andimplementing a vigorous privatization program. Postponing such reforms would lead to the snowballingof bad debts and raise the future fiscal costs of structural adjustment. The banking system suffers froma significant portfolio of non-performing loans to the state-owned enterprises. These enterprises have alsoaccumulated substantial arrears to the government, to their workers, and among themselves. Because ofits implications for fmancial sector stability, the banking system's stock of non-performing loans is aserious problem. Addressing it in a comprehensive way would reduce the likelihood of a financial crisisand would contribute to better fmancial intermediation. There are several possible solutions to theproblem of bad debts. One appropriate option could be to swap perpetual government bonds for thenon-perfomiung bank loans, which would permit a swift solution while limiting the annual budgetary costsof interest payments. Rapid privatization of large enterprises would also help to enforce hard budgetconstraints and would reduce the portfolio problems and the further accunulation of bad debt in thebanking system.
xvi. Reform and restructuring of the enterprise sector could leaji to significant creases inunemployment. Compared with other transitional economies in Eastern Europe, unemployment in Latviahas so far remained low, at about 6 percent. However. significantly higher unemployment is likely, atleast initially, when the government pursues privatization more vigorously. With the expected rise inunemployment, its fiscal cost would also rise. This cost includes (i) the decline in social contributionsas workers become unemployed, (ii) the increase in unemployment compensation, and (iii) the increasein social assistance payments. Taking into account the current structure of taxes and of unemploymentand social assistance benefits, for every one percentage point increase in the average unemployment rate,the fiscal cost of unemployment could increase by 0.3 percent of GDP. The combined fiscal costs ofrising unemployment and recapitalization of the state banks are estimated at about 2.5 percent of GDPin 1994 and about 3.7 percent of GDP in 1995. This would be equivalent to about 8 percent and 12percent of the estimated general government revenues for 1994 and 1995, respectively.
- xii -
Publc Investment Progm
xvii. Deigaing a Stategy for Public Investment. The financing of restructuring must becomplemented by increased financing of public investment to promote sustainable growth. Direct publicinvestment from the state and local government budgets has declined dramatically in real terms since1990, although a modest increase is budgeted for 1994. Two factors were largely responsible for thisdecline. First, the mandates of different ministries changed substantially and a number of responsibilitiesdevolved to local governments. Second, in response to the Miarp decline in investment resources and theunreliable project costs estimates, the authorities applied stringent selection criteria for project financing.In principle, new projects were not eligible for financing and priority was given to projects that wereclose to completion. This led to the rejection of more than half of the financing requests submitted tothe budget.
xviii. Fortunately, new investments for capacity expansion are not imnediately necessary. Latviaalready has a stock of well-developed infrastructure. The roads, railways, ports, power generationfacilities, and many hospitals and educational facilities operate well below capacity and can meetreasonable increases in demand for their services for some time to come. However, in many cases, thephysical assets associated in particular with roads, railways, and ports, are deteriorating rapidly.Rehabilitation investments will be needed soon to prevent much higher costs later on. It is thereforeessential to budget for adequate maintenance of the existing infrastructure (reflected in higher currentexpenditures), and to assure enough capital expenditures to cover at least depreciation and replacementinvestments.
xix. In fonnulating its strategy for public investment, the government needs to address the backlogof uncompleted projects, estimated at about Ls 90 million. To deal with this o.rerhang, the governmentmay wish to require that projects that did not receive any budgetary funding after 1992 be resubmittedwith acceptable cost and benefit analysis. These projects would then have to compete with new projectson their merits. Such an approach would require setting a timetable beyond which projects that were notresubmitted would be dropped, and adopting an appropriate procedure for disposing of the leftover assets.This approach would also promote the spread of adequate project analysis throughout the economy. Suchanalysis is currenly confined to projects seeking foreign finar.cing.
xx. The government also needs to develop sectoral strategies to define its new role in each sectorand to review and evaluate a number of costly ongoing programs in some key sectors. These strategiesshould also guide the new public investment that is needed to support a sustained rate of growth and toencourage the takeoff of private investment. However, the gestation of sound investment projects takestime. Therefore, it is important to (i) remove the blanket exclusion of new projects from budgetingsupport, (ii) move rapidly to establish institutional mechanisms to help the sectoral ministries p. -pare andevaluate new projects based on economic criteria and methodology, and (iii) strengthen the recentlyinitiated process of public investment programming.
xxi. Defining Sectoral Investment Needs. In the transport sector, beyond immediate mntenanceand rehabilitation, investment in freight transit (ports and supporting railways and roads) is a priority.Development of air transport, especially airport and navigation equipment, is also important and aprerequisite for establishing a modern international conmerce industry. The next priority is rail linesand equipment serving the ports and the freight transit industry. However, investment should becontingent on using market-oriented costing and on operating the system on a commercial basis. As far
- xiii -
as passenger transport is concerned, both the urban and intercity systems are in dire need of rehabilitationor, in some cases, of new equipment. Investment in urban transport should probably take precedenceover investment for intercity transport because of the high dependence of a substantial part of thepopulation on the urban transport system. The private sector could undertake many port projects that thegovernment is currently considering, such as constructing additional oil storage facilities, ferries, andgeneral cargo terminals, if they were deemed profitable.
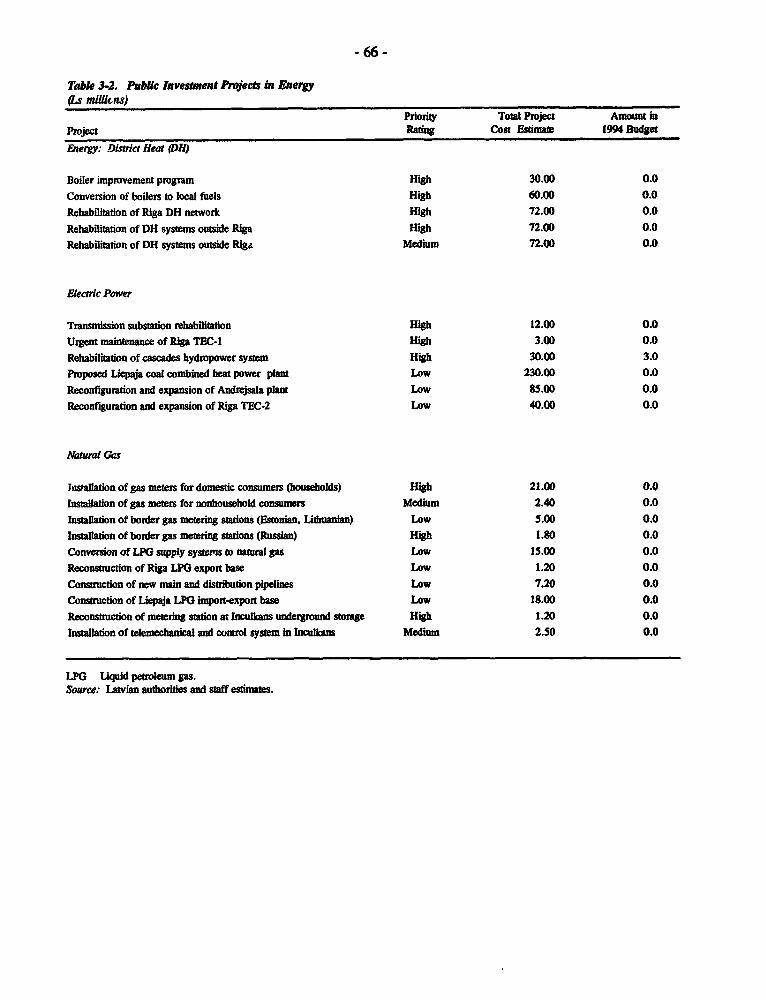
xxii. In the energy sector, where the government is taking steps to privatize or resuresubsectors such as oil products, elecricity, and natural gas monopolies, the investment program needsto fos on rehabilitating of existing facilities rather than on expanding capacities. Inprovements inenergy conservation also deserve special attention. The economy is particularly energy intensive using35 percent more energy per dollar of GNP than comparable countries at similar income levels. Successfulenergy conservation will help postpone the need for large investments in domestic power generationcapacity. Increasing the use of domestic energy resources, essentially hydropower, peat, and wood,should also receive priority. Existing energy networks have sufficient capacity and could meet Latvia'sdemand for some time to come. In the meantime, one issue facing the energy utilities is how to maintainsuch large systems. Efforts are needed to improve the efficien v of district heating and electricalsubstations. Organizational and price reforms are also reconmended to enhance the management capacityof energy enterprises and put them on a sound financial footing.
xxiii. In agriculture the government needs to confine its direct involvement to improving supportservices, such as extension and research, and basic infrastructure. The maintenance and rehabilitationof the existing system of land reclamation and the adaptation of the drainage system to new private farmsis likely to require contimning public investment. It is recommended that the government reassess thefarmstead development program. Either the farmers themselves or the relevant line ministries andagencies could undertake many of the projects under this program. Further public investment inagro-processing is recommended to be limited to those facilities near completion that can be privatizedsoon. No new investments in the processing industry are recommended for support by the budget.Likewise, investment in building agricultural machinery and in other commercial activities can be carriedout by tht private sector.
xxiv. Public investment in education and health is moving in the right direction. Most current andplanned education projects for the next several years are to renovate school facilities. More than two-thirds of the capital investment in health during the past two years has been for outpatient institutions,and no investment is planned for new inpatient facilities except for a few infant homes.
xxv. In water supply and sewage the major challenge facing the country is the low level of watertreatment and the overload of existing sewage treatment plants in large cities. Water tariffs, which localgovernments set, are low and do not cover operating costs, which have risen because of the increase inthe prices of energy and other inputs. Cost recovery through higher user charges is therefore needed.In solid waste disposal priority should be given to improving landfill sites and preparing new sanitarylandfills while the threat of groundwater contamination is imminent.
xxvi. Little progress has been made in privatizing publicly-owned housing. Most buildings sufferfrom excessive heat loss and low maintenance. Rents are low and onlv cover a fraction of the cost ofmaintenance and capital repairs. It is recommended that programs for new housing be transferred to theprivate sector, and that in the meantime, public investment concenta on retro-fitting houses for energy
- xiv -
efficiency. Rents should continue to be raised until they reflect depreciation, maintenance costs, andmajor repairs and renovations.
xxvii. Finally, in industry the government needs to limit its role to providing an enablingenvironment for private sector investment while concentrating on restructuring state-owned enterprisesto facilitate their eventual privatization where viable, or else their liquidation.
xxviii. Resolving Major IssuEs In Publc Investmt. In developing the public investmentprogram during the medium term, a number of issues need to be resolved in the interest of a morefocused and more efficient program. Adequate maintenance is currently Latvia's major problem. Neglectof proper maintenance will lead to increased investment needs for rehabilitating deteriorated assets. Therehabilitation requirements of the country's otherwise adequate infrastrucure are already large. They willrise rapidly unless the maintenance effort is strengthened substantially and is given priority over newinvestments.
xxix. As for the construction of buildings and purchase of equipment, their recurrent costexpenditures need to be identified and integrated into the budget so that these public assets can beoperated and maintained efficiently and the expected social and economic benefits of the investments canbe fully realized. The government's decision to include operation and maintenance expenditures in aUinvestment projects financed from the state budget is correct. It is recommended that such an obligationbe extended to projects that local governments finance from their own funds.
XXx. Adequate allowances for the depreciation of assets is another issue that is closely linked tomainteance. Present accounting practices do not make adequate provision for replacing assets. Thisinhibits correct cost calculations and reduces the generation of investment funds for asset replacement.This is especially problematic in areas undergoing rapid technological development, where technologicalobsolescence may occur long before the physical lifetime of assets comes to an end. It is r dthat a specific training effort be undertaken to make the appropriate accounting practices universal.
xxxi. Cost-benefit and cost-effiency anaysis need to be applied universally throughout theeconomy. At present, such analysis is confined essentially to projects being prepared for foreignfinancing. This analysis should be done for all large projects financed from state and local budgets.Technical assistance will have to be obtained to implement the necessary training programs.
xxxii. Local authorities already play a significant role in public expenditure programs, includingpublic investment, and their involvement may increase further. However, their exact roles need to bedefined and their scale of participation needs to be better related to their resource base. The govementplans to review the sharing of functions between the state and local governments, as well as the minimumresources the local governments must have to discharge their responsibilities. This is only part, albeitan important one, of the systematic revew of central and local interactions that seems necessary. Overtime local goverments will need help not only to establish adequate project appraisal procedures, but alsoto identify and implement better cost recovery levels and procedures for the services they perform, thatis, they will need help to formulate their tariff policies and their systems for collecting user charges.
xxxiii. A public investment program cannot be properly formulated in the absence of a clear viewof its objectives. Therefore, as mentioned above, the development and adoption of a coherent set ofsectoral strategies is a top priority. This will provide an opportunity to address the three key issues for
- xv -
the public investment program: the scope and pace of privatization, the scope of joint activities betweenLatvia and its neighbors, and the resolution of the ownership of public assets at different levels ofgovernment.
xxxiv. Concerning pnvatization, the government has already eliminated budgetary finance forinvestment in the more obvious cases for privatization, such as manufacturing, commercial activities, andhousing. However, other activities that the investment budget still supports could also be candidates forprivatization. These include, for example, on-farm investments in land improvements, agriculturalmachinery and agricultural processing enterprises, port superstructures, and some of the services providedat the municipal level. Contracting out the management of such services could also be an attractive optionfor encouraging private initiative and reducing the commitment of public funds for investment, operation,and maintenance. Speeding up the privatization of existing housing through sales might also provideadditional resources for public investment.
xxxv. Joint investments orjoint exploitation of eiastngfacilities with Lithuania and Estonia as wellas other neighboring counries could significantly reduce public investment reqwl nents. The potentialfor such joint activities exists in a numm ber of areas, for example, establishing a Baltic air traffic controlsystem, and of equipment pools for road and rail mainnce, icebreaking, and port-dredging. Thepotential for savings of public resources through inter-state cooperation is substantial.
xxxvi. Gonfictng ownership claims by local governments and the state need to be resolved as theyhave resulted in the suspension of investment in some activides such as the Riga heating system and themodernization of the Riga port. Some investments in the transport sector have also been suspended, oreven paralyzed, by uncertainty about ownership. Resolution of this problem is urgent.
xxxvii. Matcng Invaenent Needs with the Avaiabilty of Rsorces. A preliminary rankingof high and medium priority projects in the sectors mentioned above indicates that their total cost wouldexceed Is 530 million during 1995-97. On the other hand, the financial resources likely to be availablefor public investment during 1995-97 are esdmated at about Ls 220 million, which is less than half ofthe cost estimate of the high and medium priority investments, let alone the other proposals. Thisprojected resource envelope is consistent with the projected increase in public investment to 3 percent ofGDP in 1995 and thereafter. The envelope includes domestic and external resources likely to be availableto Latvia, and provides the framework within which the public investment program could take place inline with sustained macroeconomic stability, a resumption of growth, and creditworthiness considerations.Closing the large gap between investment needs and available resources requires limiting financing to arestricted range of priority projects. This would involve a careful process during which projects areevaluated and prioritized. Some projects may have to be eliminated, while others may have to bepostponed or scaled down. This process could best be guided by a well-designed public investmentprogram.
Public Expenur Pinning and Management
xxxviii. Desgning a Public Investment Program. The introduction of a rolling three-year publicinvestment program (PIP) is an important measure to strengthen the management of public investment.With the forthcoming 1995 budget cycle, this imposes an extremely tight timetable for formulatingLatvia's first public investment program for 1995 through 1997. For the PIP to be effective requiresclose coordination between the two key ministries of Economy and Finance and the sectoral ministries
- xvi -
to esuwre that available investment resources are within the budget's overall resource envelope and thatthe investment budget finances only projects that have been properly screened. Effective managementof the PIP also requires monitoring its implementation. Therefore, a comprehensive annual review ofthe PIP is needed to evaluate project implementation performance and to make appropriate adjustments.Given hat foreign resources are expected to play a significant role in funding the PIP, strengthening debtmanagement and debt policy formulation skills will also become an important task. Technical assistancewikl support the development of these skills.
xxxix. Introduction of the PIP is also a first step toward introducing mediun-term fiscal planningin Latvia. Fiscal planning would allow early warning of budgetary pressures and permit better decision-making in times of fiscal stress. It also captures the fiscal iniplications of structural reform measures andinvestment decisions that last beyond the annual budget horizon. Moreover, it prevents ad hocexpenditure decisions that are inappropriate and often costly.
xl. Formulating and Implementng Annual Budgets. Medium-term fiscal planning would alsoguide the entire budgetary process as the measures taken in one budget year typically affect subsequentyears. Currently, the budgetary process is essentially based on short-term considerations and theresponsibility for preparing the investment budget is spiit. In addition, the screening process fordetermining the economic merit and cost-efficiency of projects needs to be strengthened; investmentstrategy and clearly defined investment priorities need to be developed; and, most important, institutionalarrangements to match investment decisions with long-term development objectives need to be put inplace.
xli. Along with other reforms the current budgetary process needs to be improved. Budgetpreparation should begin at an earlier stage than at present and should be based on a set oe projectionsfor all key economic variables. Moreover, expenditure requests by mmistries should be subject toextensive analysis and discussion between the Ministry of Finance and the relevant ministry. Theemphasis should be on identifying those areas where funds are being used efficiently and in line with thegovernment's economic priorities and those where spending cuts are appropriate. The implementation ofthe budget is likely to improve as the Treasury Department takes shape and as Treasury bills can beissued to meet seasonal liquidity shortages. Information from the new Treasury Department will allowmore detailed analysis of revenues and expenditures and a shift from short-term resource shuffling toexpenditure review and medium-term fiscal planning.
Chapter 1. Public Expenditure Policies and Priorities:A Medium-Term Framework
A. Introduction
1.1 Since regaining independence in 1991, Latvia's fiscal policy and budgetary process haveundergone substantial changes: a market-based tax system has replaced the Soviet tax structure; new taxeson profit and personal income and a value added tax (VAT) have beet introduced; transfers to enterpriseshave been eliminated; and direct subsidies to conswners have been reduced. While these changes haverelieved pressures on the budget, most economic activity still lies in the public domain and the publicsector accounts for about 80 percent of domestic production.
1.2 The government's main objective is to encourage private initiative and significantly lower itsown involvement in the economy. In market economies, government involvement in the economy isgenerally directed at specific objectives, namely, (a) providing resources for infrast and basicsocial services, (b) designing policies for proper functioning of markets and for faster development ofprivate activities, and (c) improving the overall management of the economy (Box 1-1). These objectivesrequire a careful allocation of public sector resources among different expenditure categories. They alsopose a challenge to the authorities to enhance the efficiency of public sector expenditures and give agreater role to public expenditure planning and management.
Box 1-1. The Role of GovetnmeW in a Market Economy
The role of government in national economic activity has long been a major issue over which economic theoristsNd practitioners have debated relentlessly. Even proponents of market-based economies still argue about the extent towhich government intervention is required to ensure economic efficiency and social justice. Thus, there as no standardprescription thatcan be appliedfor different countris with varied developmentobjectives and unique economic situations.Nevertheless, economists do agree that government has an important role to play in the following areas:
0 Providing goods and services that market forces cannot provide in a sufficient and efficient manner to benefitall, (for example, defence and law and order) or where there is no incentive for the private sector to operate. Forexample, in the social sector, government involvement is warranted for at least two reasons:
- Fairness: social programs are often defined as ones to which society wishes to assure equal accessirrespective of ability to pay;
- Market failure: because of positive externalities of many social services, social sector programs havesocial benefits over and above their private benefits, and the private market alone may not provide enoughof the program or service from society's point of view. In addition, other market failures may justifyparticular government interventions. The problms of adverse selection and moral hazard dictate aregulatory role for governments in health and other insurance.
* Ensuring an equitable distnbution of income through making provisions for a social safety net system for thepurpose of economic and political stability.
* Establishing a legal, regulatory, and macroeconomic environment conducive to private sector activ. Therole of government as a promoter and facilitator of private economic activity is a crucial one. It needs to establish anappropriate and stable economic environment to encourage private investment and to promote sustained economic growth.
1.3 This chapter examines medium-term public expenditure policies and priorities in Latvia'stransition to a market economy: section B analyzes the macroeconomic background and public expenditurepolicies since independence, section C discusses high priority expenditure needs during the period oftransition and the required reforms, section D reviews the fiscal outlook, and section E assesses thesustainability of the fiscal policy and the availability of fiscal resources during the 1990s.
B. Public Expenditure Framework
Macroeconomic Background
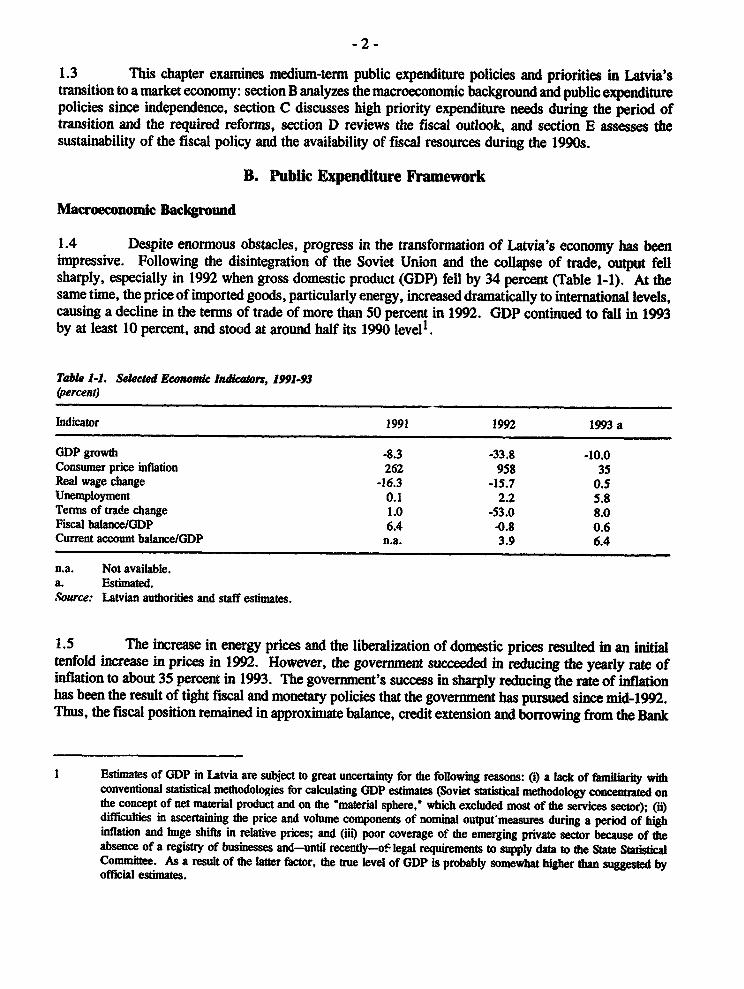
1.4 Despite enormous obstacles, progress in the transformation of Latvia's economy has beenimpressive. Following the disintegration of the Soviet Union and the collapse of trade, output fellsharply, especially in 1992 when gross domestic product (GDP) fell by 34 percent (Table 1-1). At thesame time, the price of imported goods, particularly energy, increased dramatically to international levels,causing a decline in the terms of trade of more than 50 percent in 1992. GDP continued to fall in 1993by at least 10 percent, and stood at around half its 1990 levell.
n.a. Not available.a. Estimated.Nource: Latvian authorities and staff estimates.
1.5 The increase in energy prices and the liberalization of domestic prices resulted in an initialtenfold increase in prices in 1992. However, the government succeeded in reducing the yearly rate ofinflation to about 35 percent in 1993. The government's success in sharply reducing the rate of inflationhas been the result of tight fiscal and monetary policies that the govenunent has pursued since mid-1992.Thus, the fiscal position remained in approximate balance, credit extension and borrowing from the Bank
I Estimates of GDP in Latvia are subject to great uncertainty for the following reasons: (i) a lack of familiarity withconventional statistical methodologies for calculating GDP estimates (Soviet statistical methodology concentrated onthe concept of net material product and on the 'material sphere.' which excluded most of the services sector); (i)difficulties in ascertaining the price and volume components of nominal output measures during a period of highinflation and huge shifls in relative prices; and (iii) poor coverage of the emerging private sector because of theabsence of a registry of businesses and-until recently-of- legal requirements to supply data to the State StatisticalCommittee. As a result of the latter factor, the true level of GDP is probably somewhat higher than suggested byofficial estimates.
of Latvia was strictly limited, and growth in wages was restrained. These policies also set the stage forthe introduction of an interim currency-the Latvian ruble-in July 1992, and a permanent currency-thelats-in March 1993. Since its introduction, the lats has appreciated significantly against convertiblecurrencies.2
1.6 Monthly inflation picked up strongly in late 1993. This was essentially because of an increasein the VAT rate, increases in pensions and in public sector wages, and the effects of the real appreciationof the ruble. The monthly inflation rate has started to decline again, falling from 3.8 percent in January1994 to 0.2 percent in May 1994.
1.7 The government has also made significant progress in restructuring the Latvian economy sinceindependence: price liberalization was virtually complete by late 1992, the trade regime was liberalized,progress in small enterprise privatization was considerable, and most conumercial branches of the Bankof Latvia were privatized. Nevertheless, major challenges remain: the privatization of large enterprisesis progressing very slowly, nominal and real interest rates are still quite high, interenterprise arrearsremain substantial, and many enterprises are in poor financial condition. Moreover, unemployment isexpected to increase significantly in the near future, placing an extra burden on the budget. A significantamount of investment is also needed to bring about the necessary change in the capital stock and tosupport a sustained rate of growth. The implications for expenditure policy are that the government willhave to devote a larger share of public resources to meet these challenges.
@sa Stn and Patter of Expenditures
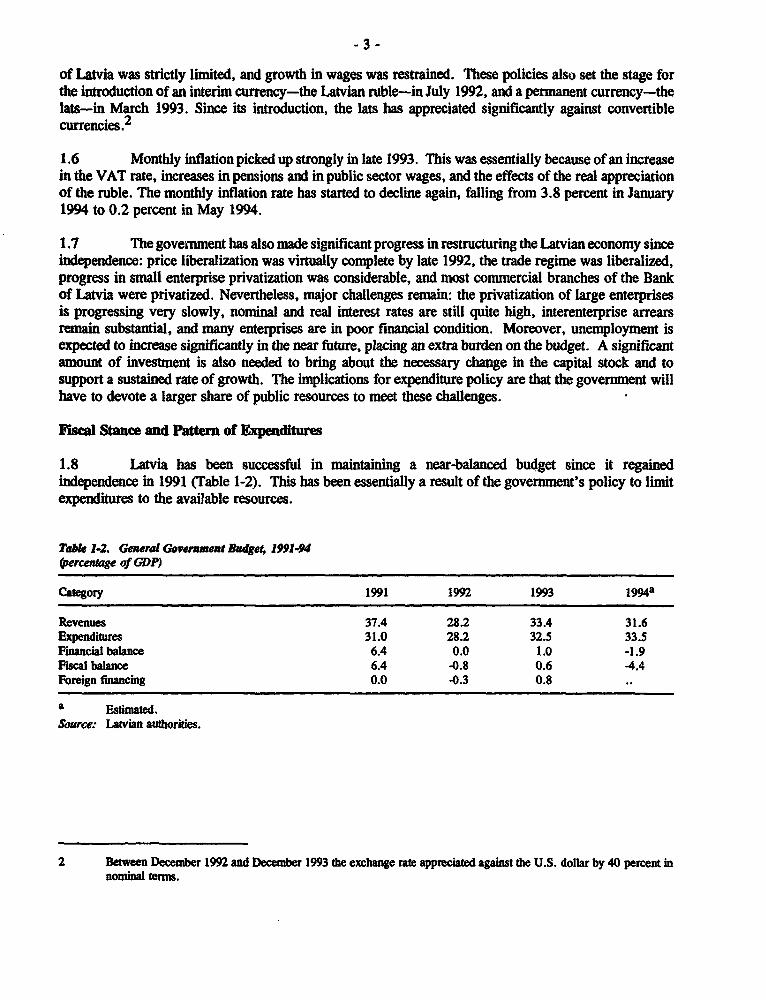
1.8 Latvia has been successful in maintaining a near-balanced budget since it regainedindependence in 1991 (Table 1-2). This has been essentially a result of the government's policy to limitexpenditures to the available resources.
Tabk 1.2. General Governuent Budget, 1991-94(percentage of GDP)
2 Between December 1992 and December 1993 the exchange rate appreciated against the U.S. dollar by 40 percent innominal terms.
-4-
1.9 The 199) and 1992 Budgets. With Latvia's independence, the ratios of general governuentrevenues and expenditures to GDP fell significantly.3 Under the Soviet system these ratios were about50 percent, reflecting the high transfers and subsidies in that system. With the collapse of output andactivities in recent years, the ratio of general government revenues to GDP fell to about 37.0 percent in1991, although a budgetary surplus of 6.4 percent of GDP was recorded.4 As activity fell sharply in1992, the ratio of revenues to GDP fell further to about 28 percent, reflecting mainly a weakness in taxreceipts. There were particularly large declines in receipts from the profit tax and from taxes on goodsand services, where the old turnover tax was replaced by a VAT with widespread exemptions.
Box 1-2. ERnbudgetary Fund
While there are a number of extrabudgetary funds in Latvia, they are not of great economic significance forthe public expenditure process. In particular, there is no large social security fund, as social security activities areconducted within the regular budgetary process.
The central government Privatization Fund was established to manage the revenues from the privatizationof state-owned enterprises and other assets. Revenues to date have been small, and as of September 1993 the balanceof the fund stood at only Ls 730,713. The activities of the Privatization Fund should increase, however, as theprivatization of large enterprises accelerates in 1994. Legislation regarding privatization-especially the establishmentof the Privatization Agency and the State Property Fund-was approved in early 1994. The Ministry of Economy,especially the Privatization Agency, would be responsible for managing the resources of the Privadzation Fund. Thepurposes for which these resources could be used are defined in the legislation for the Privatization Agency.
Other small extrabudgetary funds have included the Environmental Protecton Fund and the privatizatonfunds of local governments. The now inactive Environmental Protecton Fund was intended to be used to financeprojects that reduced pollution and protected the environment. It was fiwnced by a natural resource tax and finesfrom enterprises causing pollutidon. Local government privatization funds are funded by receipts from the sale ofproperty and businesses owned by local governments and from the share of large-scale privatization revenues thataccrues to local governments.
3 The general government includes the central govemment (including the social security fund), the twenty-six districtsand seven cities in Latvia, and the extrabudgetaty funds. Further details on the extrabudgetary funds are provided inBox 1-2.
4 The surplus reflected (a) the eliminadon of transfers to the All-Union budget; (b) the reduction of subsidies andtransfers to enterprises; (c) tight expenditure controls, including the lagged adjustment of nominal expenditures toincreased inflation; (d) the introduction of new taxes, including the personal income tax; and (e) the buoyant profittax revenues, which were boosted by the effect of high inflaton in the context of historic cost accounting.
- 5 -
1.10 The decline in real budget revenues in 1992 prompted tight control of expenditures, especiallyon maintenance and investment. In addition, excise tax rates were increased and the VAT tax rate rosefrom 10 percent to 12 percent. Overall, the budget position moved from a large surplus in 1991 toapproximate balance and a deficit of 0.8 percent of GDP in 1992, if net lending by the government isincluded.5
1.11 The 1993 Budget. The 1993 budget envisaged a financial deficit of 1.8 percent of GDP,which was to be offset by repayments of earlier lending by the government. A supplementary budget wasenacted in October 1993 that adopted a number of measures to keep the deficit near the projected level.These measures included (a) an increase in the standard VAT rate from 12 percent to 18 percent and anincrease in the VAT rate on food from 6 percent to 10 percent (with a further increase to 18 percentschedu!ed for June 1994); (b) new excise taxes on gasoline, diesel, and automobiles; (c) an increase inpensions by an average of around 50 percent to help compensate for losses in purchasing power; and (d)an increase in public sector wages.
1.12 The 1993 revenues were significandy stronger than projected in the budget, mainly becauseof unexpectedly buoyant profit taxes related in part to profits from re-exports of goods imported fromRussia. However, overall expenditures were in line with budget projections, with higher than budgetedpension and salary payments being offset by lower expenditures on unemployment benefits, supplies andmaintenance, and investment expenditures. On the whole, the financial balance, which excludes netlending, showed a surplus of 1.0 percent of GDP and the fiscal balance, which includes net lending,showed a surplus of 0.6 percent of GDP.
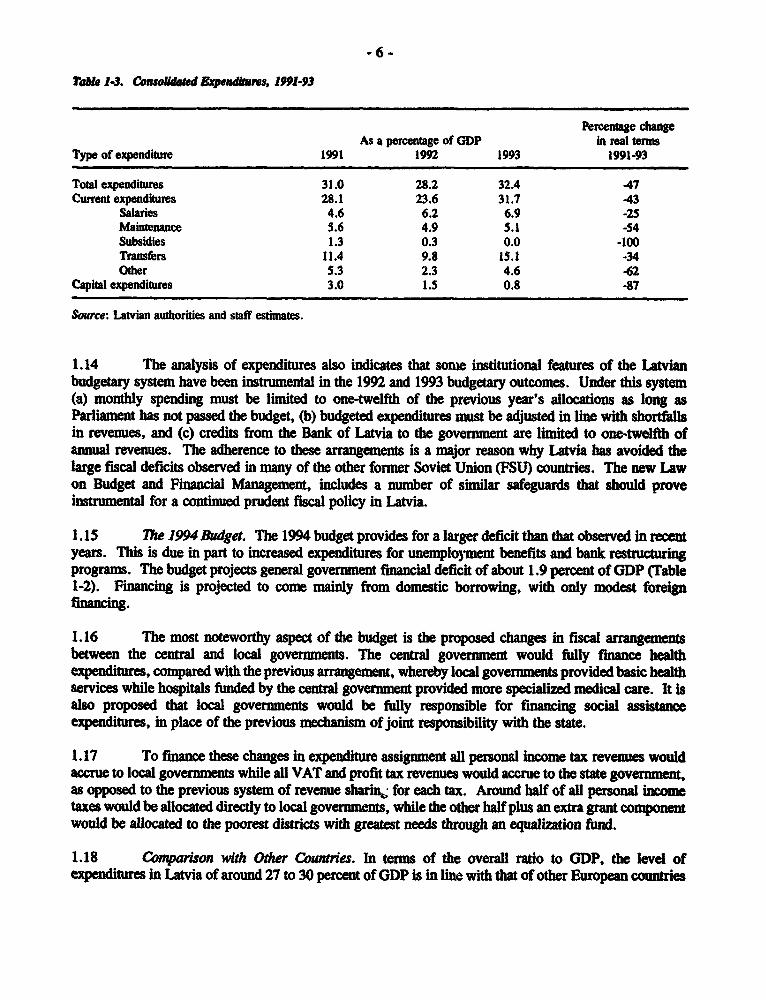
1.13 Structure and Patern of Erpenditures. The analysis of general government expendituresindicates that total expenditures as a percentage of nominal GDP changed slightly between 1991 and1993, but declined by about 47 percent in real terms (Table 1_3).6 This decline has been accompaniedby a change in the mix of current and capital expenditures as well as by a change in the structure ofcurrent expenditures. In particular, budgetary transfers to enterpnses and subsidies have effectively beeneliminated and wages and salaries and social expenditures have been given relatively more priority thanexpenditures on supplies and maintenance. While this spending pattern is understandable as a short-termresponse during the transition, it certainly is not a viable expenditure policy in the long term because,for examle, hospital personnel cannot operate effectively without adequate supplies and roaddeterioration will eventually cause problems in both the public and private sectors.
S Net lending consists of lending operations by the general government to the nongovermment sector, minus repayments.These operations are included in the budget 'above the line' because they are fiscal operations by which thegovernment affects the economy and that contribute to the overaU government deficit (or surplus), and must thereforebe financed. They are typically included in the budget either under expenditures or as a separate item contributingto the overall fiscal balance. In the tables shown in this report, the financial balance is defined as the balance on thenormal operations of the general government, while the fiscal balance is a broader measure of the government's fiscalposition that includes its net lending.
6 The comparison is made between 1991 and 1993-omitting 1992-to highlight the total response to fiscal stress duringthis period and to avoid problems with the allocation of expendiures through the foreign currency budget in 1992.Changes in expenditures have been calculated in relative terms betveen 1991 and 1993 by deflating expenditures bythe average consumer price index for 1991 and 1993, respectively.
-6-
Table 1-3. CoslWated wxpendks, 1991-93
Percentage changeAs a percentage of GDP i real terms
1.14 The analysis of expenditures also indicates that sone institutional features of the Latvianbudgetary system have been instrumental m the 1992 and 1993 budgetary outcomes. Under this system(a) monthly spending must be limited to one-twelfth of the previous year's allocations as long asParliament has not passed the budget, (b) budgeted expenditures must be adjusted in line with shortfalsin revenues, and (c) credits from the Bank of Latvia to the government are limited to one-twelfth ofannual revenues. The adherence to these arrangements is a major reason why Latvia has avoided thelge fiscal deficits observed in many of the other former Soviet Union (FSU) countries. The new Lawon Budget and Financial Management, includes a number of similar safeguards that should proveinstrumental for a continued prudent fiscal policy in Latvia.
I.15 lhe 1994 Budget. The 1994 budget provides for a larger deficit than that observed in recentyears. This is due in part to increased expenditures for unemployment benefits and bank restucringprograms. The budget projects general government final deficit of about 1.9 percent of GDP (Table1-2). Financing is projected to come mainy from domestic borrowing, with only modest foreignfinancing.
1.16 The most noteworthy aspect of the budget is the proposed changes in fiscal arrangementsbetween the cental and local governments. The central govermment would fully finance healthexpenditures, compared with the previous aangement, whereby local goverments provided basic healthservices while hospitals funded by the central government provided more specialized medical care. It isalso proposed that local governments would be fully responsible for financing social assistanceexpenditures, in place of the previous mechaism of joint responsibility with the state.
1.17 To finance these changes in expenditure assignment all personal income tax revemnes wouldaccrue to local governments while all VAT and profit tax revenues would accrue to the state government,as opposed to the previous system of revenue sharing for each tax. Around half of all personal incometaxes would be allocated directy to local governments, while the other half plus an extra grant componentwould be allocated to the poorest distrcts with greatest needs through an equalization fumd.
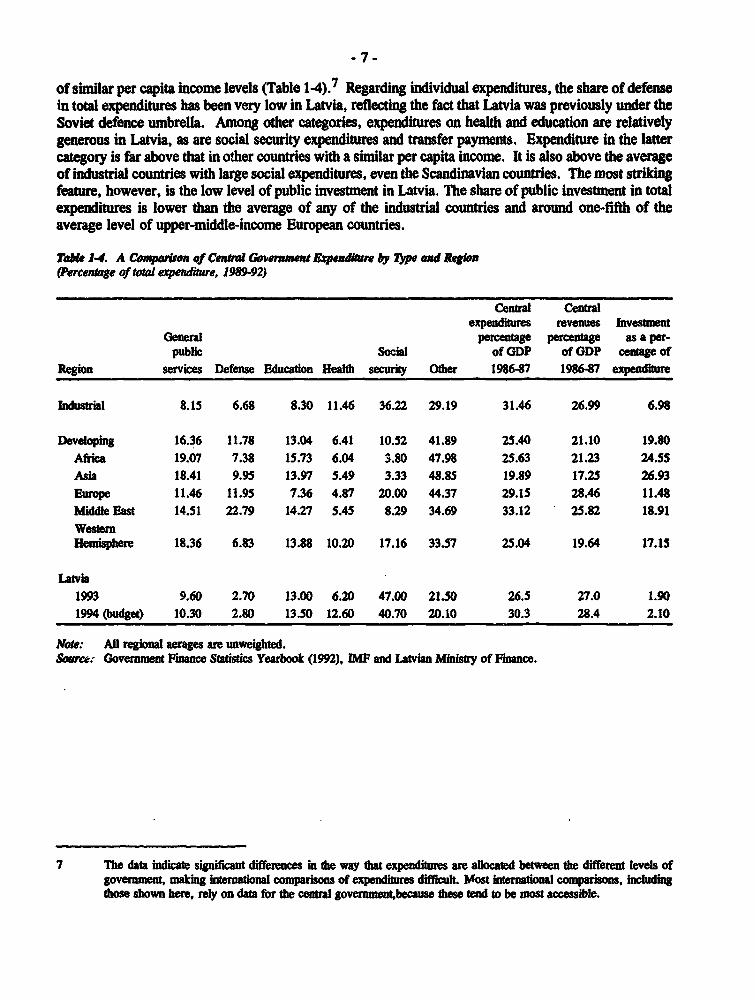
1.18 Comparison with Other Countries. In terms of the overall ratio to GDP, the level ofexpenditures in Latvia of around 27 to 30 percent of GDP is in line with that of other European countries
of similar per capita income levels (Table 1-4).7 Regarding individual expenditures, the share of defenseIn total expenditures has been very low in Latvia, reflecting the fact that Latvia was previously under theSoviet defence umbrella. Among other categories, expenditures on health and education are relativelygenerous in Latvia, as are social security expenditures and transfer payments. Expenditure in the lattercategory is far above that in other countries with a similar per capita income. It is also above the averageof indus countries with large social expenditumes, even the Scandinavian countries. The most strikingfeaur, however, is the low level of public investment in Latvia. The share of public investment in totalexpenditures is lower than the average of any of the industrial countries and around one-fifth of theaverage level of upper-middle-income European countries.
ble 1-.4 A Compm6on of Cenal G0.erament ExpendWw by Type ad RegSion(Percentage of total expenditure, 1989-92)
Central Centialexpenditus revenues Investment
General percage percentage as a per-public Social of GDP of GDP cenge of
Region services Defense Education Health security Other 198647 1986-87 expendhiue
Note: All regin alrages are unweighted.Sourc.* Government Finance Staistics Yearbook (1992), IMP and Latvian Ministry of Fiace.
7 The data indicate sigiit difeences in the way that expenditues are allocated between the different levels ofgovernmet, making international comparisons of expenditures difful Most internat comparison, includingthose shown here, rely on data for the central government,because tee tend to be most accessible.
- 8-
C. Fiscal Policy, Expenditure Priorities, and Required Reforms
Policy Options and Tradeoffs During the Transition
1.19 The structural adjustment that accompanies a transition to a market economy tends to raisethe fiscal deficit for a number of reasons, including declines in tax bases, slow introduction and collectionof new taxes, transfer of social services from state enterprises to the government, increase inunemployment-related expenditures, the retraining of labor, and the need for extraordinary expendituresresulting from enterprise and banking sector restructuring. To finance these deficits policymn3kersnormally face a combination of four possible choices: inflationary fuiance, debt finance, raising taxes,or reducing expenditure.
1.20 Inflationary finance generally leads to macroeconomic instability and further output losses (asin Russia or Ukraine). Moreover, it is only a temporary means of financing that lasts as long as inflationexpectations lag behind actual inflation.8 Debt financing also has limitations and depe.ads to a largeextent on the availability of foreign financing and the existence of a developed domestic market forgovernment debt. Reliance on taxation faces the tradeoff between fiscal stability and output recoverywhen taxation relies heavily on profits from the newly emerging private sector. As a result, transitioneconomies generally rely more on payroll and indirect taxation (for example, VAT and trade taxes) thanon corporate taxation.
1.21 A number of transitional economies have succeeded in reducing budgetary deficits andachieving fiscal balance through expenditure cuts. They have done so by liberalizing prices andhardening budget constraints, thereby reducing or eliminating subsidies and transfer payments toenterprises. Although traditionally tiese countries have been less successful in reducing such expendituresas the wage bill, they have typically cut investment and capital maintenance expenditures to the bone.As a result, the public capital stock, which is necessary to stimulate a strong production response,particularly from the private sector, suffers. Furthermore, they have generally failed to allocate sufficientresources to the urgently needed restructuring expenditures related to the banking system and enterprisesand the unemployment benefits and retraining support to displaced labor. Thus, in most countries thetransformation process has been slower than would be desirable, output loss has been more severe, andthe private sector response has been less favorable than expected.
1.22 This experience suggests that the conflicts between macroeconomic stability and the fiscalneeds of structural reform and investment can best be avoided through noninflationary debt financing,particularly in economies such as Latvia, where initial debt levels are low. Controlling currentexpenditures, although necessary, cannot by itself provide sufficient resources to finance publicinvestment and to stimulate growth, therefore more borrowing is needed. Relying on moderately largeramounts of domestic and external debt financing would not jeopardize macroeconomic stability and wouldfacilitate a more vigorous structural transformation, enterprise privatization, and labor reabsorption inLatvia.
8 As inflation rises people avoid domestic money holdings ad switch to altnaive assts such as foreign currency.
-9 -
Public Expenditure Priorities
1.23 Significant budgetary demands will start to emerge in 1994 to finance an expanding level ofordinary expenditures; a faster structural transformation; and a growing need for public investment, whichcurrenly stands at a depressed level of 0.8 percent of GDP. To meet these competing demands, thecurrent crisis response to expenditure allocation must be replaced by a system that is more systematic andsustainable in the long term. This would entail (a) identifying a detailed set of priorities for expendituresbased on economic and social goals to ensure that expenditures for key activities receive greater priorityfor funding, (b) making adjustment in the composition and allocation of expenditures to improve theefficiency of resource use, and (c) adopting a budgetary system that allows the achievement of thesegoals.
1.24 A significant decline in real budgetary resources has accompanied the fall in output in recentyears. Therefore, in reviewing and deciding on expenditure priorities, the authorities should considerwhether (a) an activity or a program that seemed appropriate when budgetary resources were moreplentiful must be changed in scope or scale now that these resources have become scarce, (I,) the mix ofpublic sector activities is appropriate and these activities are being undertaken at minimum cost, (c) theexpenditures complement private sector activities, and (d) the expenditures benefit certain interest groupsor the country as a whole.
1.25 The guiding principles for allocating expenditures across sectors should be to allow goods orservices that the private sector can produce, such as agricultural and industrial goods and services, to beprovided by that sector unless compelling reasons exist for leaving them for public provision beforephasing them out. Likewise, the private sector should be the one to undertake such activities as trade,tourism, finance, and housing. The private sector could also be involved in transport andtelecommunications activities. Public investment should focus mainly on infrastructure (transport, basicutilities) and support services (extension services) that would enhance the operations of the private sector.International experience suggests that public investment in infrastructure is highly complementary withprivate sector investment and leads to a vigorous private sector response.
1.26 Priority should also be accorded to extraordinary expenditures related to structral reforms.Addressing the nonperforming loan portfolio of the state banking system once and for all is a priority taskwith high payoffs and moderate costs. Enterprise restructuring costs before privatization should be keptto a minimun. Cutting wasteful current expenditure could also open the door to an expanded socialbenefit targeted at those segments of the population who are the hardest hit by the short-termconsequences of structural adjustment.
1.27 There is also an urgent need to formulate a public investment program and expand thedepressed level of public investment. The present level of public investment not only falls short ofOrganization for Economic Cooperation and Development (OECD) standards, but also of the standardsof most developing countries, which on average devote more than 3 percent of their GDP to publicinfrastructure investment. In formulating the public investment program, the authorities should considera munber of priorities. The first, and perhaps the most important, is the rehabilitation and modernizationof the basic infrastructure, which should receive priority over its expansion (see Chapter 2). Adequateexpenditures are also needed to improve the delivery of social services, such as basic health care, to theneediest segments of the population.
- 10-
1.28 Reforming public expenditures requires adopting a number of measures to improve theefficiency and orientation of state and local government expenditures. It also requires the rationalizationof current expenditures such as subsidies of various kinds and redistributive expenditures, for example,pensions, benefits, and social assistance. The significant budgetary savings that would result from thesemeasures as well as complementary efforts needed to reform the tax system would enable the govertnentto reorient resources to restructuring requirements and the economy's public investment needs. Thefollowing sections analyze the policy actions and measures recommended.
Improving the Efficiency of Ordinary Expendit s
Transfers to IndiWduals
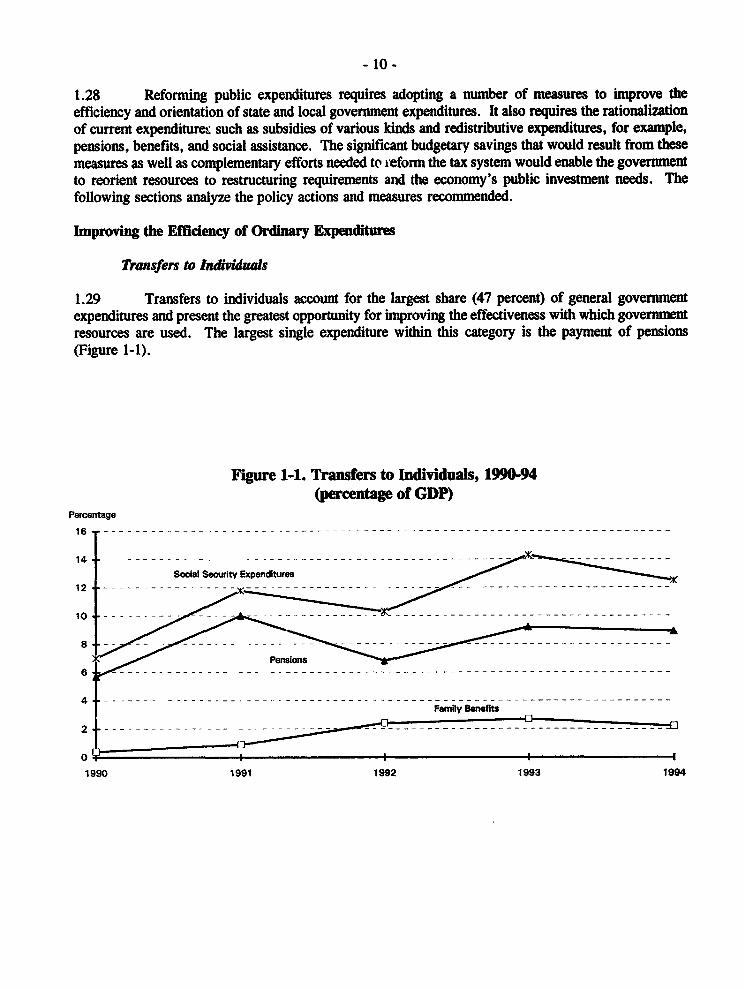
1.29 Transfers to individuals account for the largest share (47 percent) of general govermnentexpenditures and present the greatest opportunity for inproving the effectiveness with which govermnentresources are used. The largest single expenditure within this category is the payment of pensions(Figure 1-1).
Fgure 1-1. Transfers to Individuals, 1990-94(percentage of GDP)
1.30 Pensions. In 1993 expenditures on pensions accounted for around 26 percent of generalgovernment expenditures. Pensions continued to be paid at a flat rate, although in November 1993variations to pension levels based on length of service were introduced. The net effect of the change willincrease the monthly average pension from Ls 15 to Ls 22. While the increase in nominal pensions wasnecessary given the decline in the real value of pensions since last year, the formula that the governmenthas adopted, which links the value of pensions to the average wage plus the aging of the population, willlead to an excessive drain on the budget. Increasing the pension age from the current low levels andequalizing it for men and women would be the most rational solution to contain costs. Short of thismeasure, the government should reduce pension payments to working pensioners and should strengtheneligibility requirements for disability pensions.
1.31 A comprehensive pension reform requires a careful and detailed study of its fiscal andfinancial consequences. In particular, the Idea of starting a conventional state run, pay-as-you-go schemewith weak links between contributions and benefits should be weighted against a proposal to establish asystem that combines a redistributive program for the poor and a fully capitalized pension fund for thenonpoor. Although establishing a fully funded, possibly privately managed, pension scheme for thenonpoor is consistent with a worldwide trend, it should await the establishment of certain preconditions,including a financing program for the substantial transition deficits; a regulatory framework for theoperation of the pension funds and their supervision by a specialized government agency; and well-tunctioning financial, capital, and annuities markets for the investment of the pension funds.
1.32 Famiuy Benefits. The majority of other transfers to individuals comprises sickness, maternity,and universal family benefits. These constitute around 11 percent of total general governmentexpenditures.9 Most of these benefits are not means-tested (except for unemployment benefits, whichare discussed later), and therefore requires close scrutiny at a time of fiscal austerity. Family benefitsare still paid through the social insurance system and benefit rates are calculated at the local level.
1.33 Three measures are recommended to rationalize the current structure of benefits. First, thedelivery cost of such benefits should be mi imized where possible by consolidating the differentprograms. Second, the number of recipients should be reduced by means testing. Third, income levelsand eligibility for benefits should be verified to prevent fraudulent claims.
1.34 The system of social insurance and cash benefits changed little during 1993. Starting inJanuary 1994, changes to the tax legislation have related tax privileges to family size. This would permitthe government to abolish the family allowance and allocate a small part of the saving to the socialassistance budget for distribution to families at thu poverty level. However, tax allowances are not theright c&'nnel for targeting assistance to poor families and family allowances are better than tax relief atachieving this objective. This is because family allowances can be better targeted, while tax allowanceshelp the better off more than the poor.
1.35 SocialAssistance. The decline in output and employmnent has necessitated greater expenditureson social assistance. Real wages declined by 16 percent in 1992, but stabilized in 1993. At the same
9 The budget of the Social Insurance Fund,which became part of the central budget in November 1992, covers all themain social benefits except social assistance benefits operated at local level. The Fund is financed from social securitycontributions from employers (37 percent) and employees (I percent), with different rates for some workers and theself-employed.
- 12 -
time income distribution has become more unequal and poverty has risen. Estimates indicate that thepoverty rate in Latvia rose from 4 to 5 percent of the population in 1980 to about 35 percent in 1993.10Moreover, available data indicate that the income of the poorest segment of the population has declinedby almost three times as much as the national average.
1.36 The current system of social assistance (cash and coupons for food and clothing) is clearlyinappropriate because the disbursement of social assistance is lowest in the areas where r.eeds are thegreatest. In addition, while local authorities would be in a better position to identify beneficiaries anddeliver benefits, the poorest localities may not have the resources to fimd them. The solution to this issuedepends on the resolution of the problem of transfers from the central to the local governments. Onepossible solution would be for the central government to allow local authorities to deliver services andbenefits according to certain levels of minimum benefits and to ensure that they have the financialresources to provide those services. Information on the neediest segments of the population should beobtained from a household survey.
1.37 The current crisis minimum basket for social assistance is inappropriate because it impliesassistance that is expensive. A more realistic minimum assistance level should be set that limits assistanceto the truly vulnerable, for example, those whose unemployment benefits have expired or who arehandicapped. The crisis minimum basket could be made equal to 75 percent of the food component ofthe basket (or about Ls 13.5 at October 1993 prices). The proposed minimum size should also bedifferentiated according to family size and location (rural versus urban). Preliminary calculations showthat between 9 and 10 percent of the population would qualify for such benefits. If the proportion wereincreased to 15 percent, the cost of cash assistance would amount to 0.5 to 0.6 percent of the GDP,which would be twice the actual expenditures on cash assistance in the first half of 1993.
Serices ad Adnisoadon
1.38 Services and administration expenditures constitute about 22 percent of total expendiures.This level is close to that in the major industrial countries of the OECD. Income policies pursued during1992 and 1993 resulted in a substantial decline in real wages in government agencies and ste enterprisesand may have widened the gap between average wages in the public and the private sect'rs.' 1 As aresult, retaining skilled labor in some areas of the public sector has become difficult, and in someimportant ministries, for example, the ministries of Finance and the Economy, there is a shortage ofskilled personnel. Available information also indicates that salaries in the government sector lag behindthose in state-owned enterprises, particularly since the termination of the tax-based incomes policy in mid-1993.
1.39 Public sector wages and employment policies should be reassessed. To attract staff that havethe skills required by a modem administration in a market economy, the govenmment may have to
10 The calculations are based on an absolute yardstick and ignore differences in the availability of goods.
11 For instance, in the third quarter of 1993 the average wage in the economy rose by 12.0 percent, whereas forgovernment employees it rose by 4.0 percent, for health sector employees by 0.4 percent, and for education sectoremployees by 6.5 percent.
- 13 -
increase wages based on skill and educational levels. 12 There is also a need to introduce salary- andwage-settng mechanisms to reward efficiency, penalize inefficiency, and encourage better management.Reform of public sector wages should, however, be accompanied by a systematic review of publicemployment policy, which should aim at increasing the productivity of labor without increasing thenwnber of people employed in the government. Increasing employment in those areas that experienceshortages will require making offsetting reductions in employment in others, particularly in sectors wherethe private sector is to take over public sector responsibilities.13 This could be complemented by someretrenichment policies by not filling vacancies from natural labor turnover (for example, retirement,voluntary separation) so that on a net basis, public employment would be reduced significantly over time.
1.40 The Ministry of Agriculture provides an example of where staff reductions might be feasible.The 1993 budget allowed for the employment of some 10,222 employees in this ministry, whichcorresponded to around 0.8 percent of Latvia's total working population. Some of these employees werecarrying out functions such as road building, flood control, and veterinary services that could carry outthe private sector, and some 6,622 employees were involved in various educational activities that shouldnormally fall under the domain of the Ministry of Education.
1.41 This illustrates the need for close coordination between the various ministries that performclosely related functions. Efficient use of resources requi that staff working on similar activities bepart of the same ministry, and that funds be allocated according to overall needs and interdependenciesin spending to ensure that the mix of expenditures (for example, on primary, secondary, vocational, anduniversity education) is appropriate.
1.42 The Ministry of State Reform is working on a new scheme for civil servants that addressessome of the issues mentioned. In particular, it introduces a probationary period and a comprehensiveexamination for civil servants. Salaries will be based on twelve categories (from the most to the leastcomplex work) and fifteen grades (seniority); however, the proposed scheme compresses the currentsalary scales further to about 1:4.
Infrwtrrcture Maintenance
1.43 Infrastructure maintenance expenditures, which constituted around 15 percent of totalexpenditures in 1993, have been reduced more than most other current expenditures in the past twoyears.14 Increases in these expenditures will be necessary in the immediate futumre to avoid highreplacement costs (see Chapter 2).
12 Since November 1992 there has been a unified salary scale for govemment employees consisting of twenty grades.The differentil between the lowes and highest grade decreased from about 1:10 in mid-1992 to about 1:4 in mid-1993. The August 1993 modifications increased this differentation to about 1:6.
13 When reducing ministerial staff, the issue of productive efficiy must be considered, for example, in health servicesthere is generally a desirabl range for the rado of doctors to other personnel, and staff reductions that fall too heavilyon one group could imply a suboptmal use of resources.
14 In the consolidated budget, expenditures on infrstructure mainance are included as part of supplies andmai nt enanse .
- 14-
1.44 International experience has shown that higher rates of economic growth may depend as muchon reducing inefficiency in the use of existing capital stock as they do on making new investment. Poorlymaintained and unreliable infrastructure and service delivery systems hamper both public and privatesector activities. In addition, proper maintenance and more efficient operation would increase outputfrom existing facilities and therefore limit or eliminate the need for new investments. Moreover, adequateexpenditures on operations and maintenance and improvements in the delivery of social services woulddirectly benefit the neediest members of society.
Basic Social Servies
1.45 Expenditures on basic social services such as education and health were generally good underthe Soviet system. With the decline in resources to finance both personnel costs and operations andmaintenance, the quality of basic health services has deteriorated. Expenditures for health care are nownearly equally shared by the state and local budgets. These expenditures amounted to about 7 percentof the state budget and 30 to 50 percent of local govermnent budgets in 1993. In 1993 most (45 percent)health expenditures went to cover wages. Between 70 and 80 percent of health care expenditures wasfor inpatient care, while expenditures for prevention and health promotion were small. In 1994 the shareof health expenditure in the central government budget is expected to reach 12.6 percent, which comparesfavorably with the OECD average of 13.0 percent. The private health sector, however, is still small, andwill grow in the medium term.
1.46 Expenditures for education account for a large share of the budget: 13.6 percent in 1993,compared with 12.0 percent for the OECD countries. About 85 percent of expenditures was allocatedto primary and secondary education, which was relatively high compared to the average of 73 percentfor the OECD countries. About 58 percent of the education budget is for wage payments, which is belowthe OECD level of 71 percent. The higher proportion of nonsalary costs is due pardally to relatively lowteachers' salaries, higher utility costs, and the provision of books and supplies to students.
1.47 The delivery of these services could be unproved significantly by better management ofexisting resources. In some areas, setting output targets would be desirable-say in terms of students perteacher-and using budget allocations to encourage local governments and ministries to work towardthem. Smaller staff numbers imply higher productivity and would enable qualified staff to receive higherwages.
1.48 An example of innovative redesign of the provision of a basic social service is seen in therecent changes in health care. These reforms have included changes in the way that budget financing tohospitals is provided from a rigid per bed and per staff basis to a system that reflects regional healthneeds and allows flexibility in the way that hospitals provide care. The Ministry of Finance shouldexamine such initiatives for possible extension to other areas such as education.
Interest Payments
1.49 Up to now interest payments have formed a very small part of the budget, reflecting the smallamounts of outstanding domestic and foreign debt. This situation may change in 1994, when thegovernment is expected to increase its borrowing from abroad and could start issuing domestic bonds tofinance part of the budget deficit, and possibly to swap domestic debt for the nonperforming loans of statebanking institutions. Interest payments will therefore nse with the growth in debt.
- 15 -
1.50 The level of domestic interest rates will also influence the size of budgetary interest payments,and Latvia currently faces a significant macroeconomic problem related to its high domestic interest rates.Annual rates on short-term dollar deposits are 18 percent in Latvia (compared to 3 percent in internationalmarkets), while rates on short-term dollar loans hover around 80 percent (compared to 10 percentabroad). Rates on domestic currency deposits and loans are even higher. Neither sustained growth norfinancial stability are consistent with such levels and intermediation spreads.
1.51 Several reasons account for the high interest rates in Latvia, including the financial system'sweakness and riskiness, the high intermediation cost caused by the inadequate legal framework, and theshort-term speculative trade. The continuation of high interest rates has negative implications for thebudget for two reasons. First, the interest rates the government pays on its bonds will have to have somerelationship to those offered by the banks. Second, high interest rates on loans inhibit private sectorinvestment, and hence reduce the tax base. Therefore, policy measures that will help to reduce theserates are essential. The measures could include undertalkng banking and enterprise restrccturing andprivatization more quickly, introducing more effective banking supervision, reinstating ownership rightson land and real estate, and strengthening the legal framework and judiciary system to enforce loanrecovery in the case of default. These measures could help reduce some risk premiums, and therefore thespread margins; however, they would not address the concentration of credit on short-term credittansactions in Lamvia, which is driven in large part by highly profitable trading opportunities.
Subsidies
1.52 Subsidies still account for a large share of public resources. In 1994 explicit subsidies,mainly to agriculture for improvi'g breeding stocks and providing better quality seed, are expectd toshow a considerable increase based on the tax package adopted in October 1993. This includes both theproposed payment of Ls 6.6 million based on the higher VAT rate on food, as well as the estimatedrefund of Ls 4.8 million related to the excise tax paid on diesel and gasoline.15
1.53 In addition, the tax system still provides many other subsidies to agriculture and some othersectors (see Section D). The level of subsidies to agriculture from various tax exemptions is esfimatedat Ls 6.4 million in 1994. Revenue losses such as these should be estimated every year and be clearlypresented in the budget document as is done in, for example, France and Spain. Moreover, theauthorities should consider gradually phasing out subsidies through cost recovery policies and thecommercialization of activities. If subsidies are to continue, the purpose of the subsidy should beexplicitly stated, and the subsidy should be targeted as much as possible to the intended beneficiary.
1.54 The recent proposal that Latvenergo and other energy companies should act as nonprofitorganizations could result in new subsidies and could imply budgetary costs from (a) reduced profit taxpayments, (b) reduced dividends to the government, and (c) cash injections by the government if costcalculations do not allow adequate allowances for replacement investment. All three effects would
15 As part of the tax package Parliaent adopted in October 1993, it was agreed at subsidies of Ls 1.1 million permonth would be paid to the agricultual sector from June 1, 1994, at which time the VAT rate on food products is torise from 10 percentto the stndard rate of 18 percent. On November 1, 1993, the standard VAT rate was increasedfrom 12 percent to 18 percent while the rate on food products rose from 6 percent to 10 percent. In addition, fromNovember 1, 1993, farmers were to be reimbursed for the inrease in excise tax rates on gasoline (Ls 0.04 per liter)and diesel (Ls 0.02 per liter).
- 16-
represent subsidies to consumers, and as with agriculture, their full cost should be shown in the budgetif this plan is carried out.
1.55 Substantial indirect subsidies also exist at the local government level for housing, transport,and heating and other utilities. These subsidies are estimated to amount to over Ls 40 million in 1994(urban transport Ls 1.3 million, housing rents Ls 1.4 million, heating Ls 37.8 million). Apart from thebudgetary costs, these subsidies impose indirect costs on the economy. For example, ,bsidies forheating or electricity encourage their excessive consumption and require the construction of more capacityand the purchase of more imported inputs. The solution to this problem requires setting energy pricesat a level that reflects their full cost and encourages conservation. Moreover, as soon as possible utilitycompanies should install meters to measure the amount of energy consumed by all users, includinghouseholds. Given the future savings that can be expected from such actions, the use of foreign resourcesto purchase the equipment needed seems fully justified.
1.56 A side effect of housing subsidies is that they obstruct the developn.-nt of a properlyfunctioning private market for housing construction and rent. Since July 1993, however, housing rentshave increased substantially and now cover approximately 60 percent of the expenditures on maintenanceand repairs. Local budgets cover the remaining amounts, which make up about 3 percent of localexpenditures. The planned 1994 rent increase is expected to cover much of this gap.
1.57 In general, local governments should be urged to show allocations for all subsidies in theirbudgets, including those for housing, transport, and utilities. In addition, as local government subsidiesrequire equivalent transfers from the state budget, the state govermment should also record such transfersin a transparent fashion with a view to curtailing them over time. A pre-announced target date for the endof such subsidies would signal that the prices for subsidized services will be brought up to market levels.
Providing for Traon Esxpeditures
1.58 To support economic growth based increasingly on the private sector, a comprehensive andsimultaneous reform of the financial and enterprise sectors is needed. This reform requires therestructuring of the banking system and the start of a vigorous large-scale privatization program.Postponig such actions would lead to a snowballing of bad debts, thereby raising the future fiscal costsof stuctural change and postponing the benefits of reforms.
Bank P'ivalzaion and Pnanal Restuctuing
1.59 Privatization of Latvia's banking system has progressed relatively rapidly since 1993: abouthalf of the former commercial branches of the Bank of Latvia have been privatized and the remainderhave been merged in the newly established Universal Bank. 16 The intention is to privatize this bank onceit has established its viability.
1.60 Latvia's banking system suffers from a large portfolio of nonperforming loans to enterprises.These enterprises have also accumWulated substantial arrears to the govermment, to the workers, and amongthemselves. While enterprise arrears to the banking sector are not growing, there is evidence ofincreasing interenterprise arrears and unpaid wages in state-owned enterprise (SOEs) whose sales have
16 Revenue from the pnvatization of the former commercial banches is estmated at only Ls 2.9 million.
- 17-
declined dramatically. Because of its implications for financial sector stability, the stock of bad debt heldby the banking sector is a serious problem. Addressing it in a comprehensive way would reduce theprospects of a financial crisis, raise confidence in the emerging domestic banking system, and hencecontribute to better financial intermediation and lower interest rates.
1.61 The nonperforming assets of state financial institutions, estimated at Ls 50.3 millionor 3.2 percent of 1993 GDP, are concentrated in two state banks (see Annex 1): the State Savings Bank,with a nonperforming portfolio of old deposits at Moscow banks of Ls 23.4 million, and the UniversalBank, with a nonperforming loan portfolio estimated at Ls 17.9 million (based on the balance sheetposition as of October 1993).17
l.u2 Several possible solutions to the bad debt problem exist: (a) recapitalizing thebanks, (b) servicin interest and amortization, (c) making swaps for cash, and (d) making swaps for newgovernment debt.I At this point, the most feasible and speedy way to address the problem could bethrough an asset swap, that is, a swap of perpetual government bonds (consols) for the nonperformingbank loans. Its advantage is that it permits a swift solution while limiting the annual budgetary costs onlyto interest payments. Until the financial markets are fully developed, one way to overcome the potentialliquidity shortage in the banks could be by stmcturing a temporary repurchase facility for bonds at theBank of Latvia. Table 1-5 shows the estimated fiscal costs of an asset swap if the operation takes placeat the start of 1994. The detailed underlying assumptions are discussed in Annex 1.
TaNle 1-S. &stemas of the Fisca Costs of the Nonperforng Porfoffo of the Swte Banks, 1994-2000
Category 1994 1995 1996 1997 1998 1999 2000
Intest cost of bonds (La million) 12.18a 8.34 7.38 6.51 5.72 4.95 4.19Percenge of GDP 0.62 0.38 0.31 0.24 0.19 0.15 0.11
a. Inchdes an Ls 1.1 million once and for all transfer to the Savings Bank to cover 1992-93 losses.
Note: Since the mission was in Latvia, the figures for the nonperformmg loans for the Universal Bank have been revisedupward. The estimates may increase further based on an audit of this bank :.t is currently under way. As a result,the figures in the table are probably an underestmate of the fiscal impact.
So&rce: Misry of Finance. Bank of Latvia, staff estimates.
17 In addition to the two state banks, the Bank Resucturing and Privatization Commission also holds a bad loan(principal plus interest) of about Ls 9.0 million from past grain credits to agriculture, which is covered by agovernment guarantee.
18 Bank recapitalization involves a resource transfer, which raises the capital of insolvent banks (or banks with a positivebut low capital level) to acceptable positive levels. The second alternative implies taking over the servicing of interestand amortization payments of bad loans. A cash for bad loan swap involves exchanging the nonperforming assets fora cash transfer. The high up-front costs of the latter alternative are avoided by an exchange of new government debtfor the bad loans.
- 18-
1.63 The dimension of the bad debt problem in Latvia is modest compared with that in some othercountries. The estimated total fiscal costs of replacing the nonperforming assets of the banking systemare relatively low: Ls 12.2 million or 0.06 percent of GDP, in 1994 falling to 0.24 percent of GDP by1997.19 A speedy solution to cleaning the state banks' balance sheets would allow for their fastprivatization. Furthermore, if this process were publicized as an exceptional operation it would providea signal that the government will not engage in future operations of this type. To be credible, however,this operation has to be complemented by a significant strengthening of banking system supervision.
Enterprise Restructuring and Privatiation
1.64 Rapid privatization of large enterprises and the effective introduction of unambiguousownership rights would help enforce a hard budget constraint and would probably reduce portfolioproblems and further accumulation of bad debt in the banking system. However, Latvia's privatizationof large enterprises is still in its early stages. Manufacturing is heavily dominated by medium and largeenterprises under central government control. The state sector produced 81 perc -nt of industrial outputand employed 76 percent of manufacturing workers in 1993. Almost all eniterprises in transport,communications, energy, and infrastructure are still state owned. The central government controls thelarger ones while local utilities and infrastructure are in the hands of municipalities. Approximately 1,200enterprises (excluding those controlled by the Ministry of Agriculture20) are controlled by thegovernment, of which only 19 had been privatized by October 1993 for a total sales revenue ofapproximately Ls 9 million, or US$15 million.21
1.65 The government plans to accelerate the privatization of large enterprises in 1994. A law thatcentazes privatization in the hands of the Privatization Agency (PA), located in the Ministry of theEconomy, was recently approved. The PA is a joint stock company responsible for evaluating,preparing, and enacting privatization transactions. A complementary law "entralizes control of all SOEsin the State Property Fund (SPF), which owns state-owned enterprises and is responsible for theircorporatization and supervision before privatization.
1.66 The creation of the PA and SPF is an attempt to address enterprise privatization andrestructuring in Latvia in an integrated manner. The SPF plans to be involved in restructuring optionsfor three groups of enterprises: (a) public utilities, where the SPF would facilitate efficiencyinmrovements and cost-cutting programs; (b) large, strategic enterprises not scheduled for privatizationin the near future, where the SPF would develop skills to guide and monitor performance throughsupervisory boards; and (c) enterprises set for privadzation, where the SPF would support the creationof a competitive environment and enforce a hard budget constraint to oblige enterprises to engage in self-restructuring. The PA would take over control of the enterprises once their privatization is decided upon.
19 These figures assume a projected decline in nominal interest rates and the partial recovery of loans (see Annex 1 fordetails).
20 The Ministry of Agricultre holds 1,082 units, ranging from small shops to large state farms and agriculture servicefirms, of which only 82 had been privatized by October 1993.
21 This figure should not be extrapolated to estimate privadzation proceeds from the remaining state-owned enterprisesbecause of the small sample involved and the fact that it comprises finns in high demand by private bidders.
- 19 -
The government anticipates that once the SPF and PA start operations, 50 to 100 enterprises could beprivatized during the first year and 150 to 200 enterprises a year in subsequent years.22
1.67 The above process would require budgetary expenditures to: (a) establish and put intooperation a regulatory framework for public utilities, (b) prepare and execute privatization transactions,(c) pay a substantial amount in severance, and (d) possibly write off some bad debt during theprivatization of viable selected enterprises. However, the privatization and restructuring of enterpriseswould increase tax revenues and bring in budgetary revenues from the sale or lease of enterprises. Inthe absence of individual firm audits anticipating the proceeds that could result from privatization incoming years is difficult. However, it would not be prudent to count on sizeable revenue flows from thesales of enterprises whose financial condition and net worth are rapidly deteriorating. Althoughprivatization revenues may not be high because of the poor state of industrial enterprises, they should notbe spent on conventional current expenditures, but rather they should be used to finance public investmentor exceptional needs arising from restructuring, which is also a form of investment.
Unemployment Benefits
1.68 Reform and restructuring of the enterprise sector will require shedding labor, which couldstart before privatization when SOE managers decide to engage in restructuring efforts, as observed insome large Latvian state enterprises. The transition experience in Eastern Europe suggests that for each1 percent decline in GDP the unemployment rate increases by 0.5 percent for the first two to three yearsof transition, implying an average unemployment/output loss ratio of 0.5.23 For Latvia the correspondingratio has been 0.1 until recently: GDP fell by nearly 50 percent between 1990 and 1993, while officialunemployment had been about 5 percent.24 However, significantly higher unemployment is expectedwhen privatization is pursued more vigorously. Estimates suggest that unemployment rates could reach11 percent in 1994 and could peak at around 16 percent in 1995 and 1996.
1.69 Since January 1992 the government has provided unemployment benefits for six months afterthe termination of employment at a flat rate below the min_ium wage. Unemployment compensation isfinanced out of an earmarked portion of the Social Insurance Fund. The government also pays asupplement to the unemployment benefit depending on the family's income. It is recommended that thissupplement increase the level of unemployment benefits to 140 percent of the minimum wage and betransferred to the social assistance program, where its allocation could be better targeted.
22 The dominant privazation method is expected to be auctioning enterprises to workers and management, which couldmake up 88 to 90 percent of privatized shares. The rest would be dtrough voucher privatization.
23 This is the average ratio observed in Bulgaria, Czechoslovakia, Hungary, and Poland during 1988-92 according to C.Cavalcant, Bridging the Poverty Gap in the Former Soviet Union, Transition and Macro-Adjustment Unit, ResearchPaper Series No. 4. (Washington, D.C.: World Bank, 1993).
24 Unemployment reached 6 percent in January 1994. Several reasons account for Latvia's relatively low unemploymentrate: the emigration of unemployed workers to other FSU countries, particularly Russia; the nonwage benefitsperceived by unpaid workers remaining on SOB wage bills; and the lack of vigorous restructuring efforts involvingmassive layoffs by SOEs. In some areas, particularly in eastern Latvia, registered unemployment is more than twicethe national average.
- 20 -
1.70 With the expected rise in unemployment, the fiscal cost of unenployment will also increase.The fiscal cost includes: (a) the decline in social security contributions as workers become unemployed,(b) the unemployment allowances are given for six months, and (c) the social assistance benefit payments.Taking into consideration Latvia's current structure of unemployment benefits, social assistance benefits,and taxes, it is estimated that a 1 percentage point increase in the average unemployment rate could raisenet budgetary expenditure by an estimated 0.3 percent of GDP.25 This implies that if the projectedunemployment rate of 16.0 percent materializes, the fiscal costs of unemployment could grow by 1.8percent of GDP in 1994 and an additional 1.5 percent of GDP in 1995 (hence a total of 3.3 percent ofGDP in 1995). This would be equivalent to 5.6 percent and 10.0 percent of the estimated generalgovernment revenues for 1994 and 1995, respectively.
1.71 The rising fiscal costs of unemployment in 1994 and beyond will put the budget under furtherstrain.2 6 This necessitates addressing soon the shortcomings of those social benefits that are eitheruniversal (like family benefits) or insufficiently means-tested (social assistance). This will allow a betterfocus on the poor and save resources to help finance the higher unemployment costs.
Rationallizng Transfers to Local Goverinents
1.72 There has been substantial decentralization of authority in Latvia since independence. Localgovermnents, which consist of twenty-six districts and seven major cities, are now largely responsiblefor (a) housing; (b) municipal services (including water, sewage, solid waste disposal, district heating,urban transport, road maintenance, street lighting, and police); and (c) social programs (education, healthcare, and social security).
1.73 Local govermnments formulate their own budgets independently, levying land and propertytaxes, and receive a certain share of tax resources from the central government from the VAT, profit tax,and personal income taxes. They receive additional funds from the central govermnent for socialprograms (particularly social security, education, and health) and for specific investment projects thatcannot be financed solely out of available local fUnds.27
1.74 Despite the development of relatively transparent procedures for revenue allocation to localgovermments, expenditure responsibilities have not been clear and some municipalities are facingenormous budgetary pressures because (a) transfers are inadequate for some services and nonpayment isa problem, (b) most municipalities can finance only basic operating expenditures and have insufficientfunds for mintce and equipment, and (c) no credit facility exists for financing investments at thelocal level. However, a number of new laws are currently under preparation with the objective of
25 This coefficient reflets the total budgelary implications of net additional fiscal expenditure (combining higherunemployment benefits, higher social assistance payments, lower payroll tax revenue, and slightly higher corporateprofit tax revenie) when unemnployment grows.
26 Expenditures on active labor market programs in 1994 are expected to amount to 12 percent of total employment fundexpenditures (compared to 7 percent in 1993).
27 New laws are being drafted on intergovernmental fiscal relations that will formalize the process allocating tax revenuesbetween the state and local governments and allow for some degree of revenue equalization among municipalities.
- 21-
addressing these issues and establishing a clear expenditure responsibility and correspondent procedurefor assigning revenues.
1.75 Expenditfres and Financing Sources. The distribution of expenditures and revenues betweenthe central and local governments indicates that the central government accounted for about 77 percentof all expenditures in 1993 (Table 1-6). Revenues from the personal income, profit and value added taxescollected at local levels were divided between the central government and the local government accordingto a schedule that was intended to meet the needs of each local government. In some cases where theallocation of revenues from taxes did not cover a local government's needs (eleven of the thirty-threedistricts and cities), transfers from the central government financed the fiscal gap. In addition, the centralgovernment also contributed to special purpose subsidies and grants to local governments.
Table 1-6. Centrl and Loca Government ExpenAtures, 1991-93(percentage of GDP)
Category 1991 1992 1993
Central governmentRevenues 31.5 23.7 27.0Expenditures 26.3 23.8 26.7
Balance 5.3 .0.9 0.3
Local governmntsRevenues 8.2 7.8 8.0Expenditures 7.1 7.2 7.8
Balance 1.0 0.6 0.2
Source: Latvmn authorities and staff estinates.
1.76 On the whole, excluding the tax sharing arrangements, these transfers from the centralgovernment to local governments amounted to around 1.7 percent of GDP. This system was notparticularly transparent and is now being revised. Local governments are expected to receive the incometax, with cities retaining 40 percent (except Ventspils) and districts retaining 80 percent. The remainingproceeds will go to the Equalization Fund to smooth out differences in resources among districts and toensure a minimum level of service provision according to norms established by a law on equalization ofrevenues.
1.77 The data for per capita collections of state taxes are an indicator of the tax base and thewealth of each area (Table 1-7). They suggest large wealth divergences among the different areas. Forexample, the average per capita state tax revenues collected in the seven cities were approximately threetimes larger than those collected in the twenty-six districts.28 At the same time per capita expenditureneeds were higher in the districts. As a result of this imbalance, districts were to receive both largerbudget transfers and a much higher proportion of state taxes collected in their area.
28 Note, however, that the difference in income levels may not be as large as implied by these data because (a) it isdifficult to tax small-scale agriculture; and (b) tax rates on income from agricultre are generally lower than on otheractivities.
- 22 -
Table J-7. Local Governments' Revenue Sources and Expeniures, 1993aL per capita)
State State TaxLocal Tax Tax Revenue Revenues Budget
1.78 In 1993, local governments paid for social assistance expenditures, although the centralgovernment reimbursed 50 percent of the cost. In some poorer regions, local governments made fewsuch payments because they were unable to afford their share of the payments. This suggests the needfor a new system for revenue sharing between the state and local governments. Instead of the currentsystem of essentially negotiated transfers, the government should introduce a system of transfersdetermined by a set of quantitative indicators that reflect acual need (such as population size,demographic and geographic characteristics, prionty of regional investments from a nation?' perspective,and unemployment rates) and potential revenue capacity at the local level. However, before such asystem can be put in place, the responsibilities between the two levels of government should beclarified.29 The government should conduct a general assessment of the appropriate revenue andexpenditure assignment between the state and local governments to set priorities for municipalexpenditures and to define their relationship to the state budget.30
Reformn the Tax System
1.79 In contrast to the pressing demands on the budget posed by social expenditures and systemicreforms, economies in transition typically experience a strong decline in tax revenues. Latvia has beenno exception: tax revenues fell from 41 percent of GDP in 1989 to 33 percent in 1993. Two factorsbrought this about. First, the output collapse and the loosening of the ties between the government andenterprises have reduced the base for enterprise taxes. Second, the revenue yield from the tax systemreforms introduced in 1991 and 1992 has not yet materialized, partly because of the slow develop ntof an adequate tax administration. Therefore, the collection of tax revenues needs to receive a highpriority, because in the near fture the tax resources required for restrucrg and public investment willhave to come essentially from the improved tax administration rather than from the increase in tax rates.
29 For example, putting such a system in place while changes-like the shift of health expenditures to the stategovernment and all social assistance expenditures to the local governments-are still in progress would not semnappropriate.
30 In this regard, the relative efficiency of differet government levels in terms of collecting revenue and providing goodsand services should be taken into account Revenues should be collected at the level of government where they canbe collected most efficiently. Goods and services should be provided at the level that can provide them mostefficiently, considering productivity and the optimal amount and nmix to be provided. The World Bank is planmig toconduct a study of municipal finance in Latvia.
- 23 -
1.80 The creation of the new State Revenue Service in place of the old Customs Department andState Fiiance Inspection Board will contribute to this effort. Nevertheless, enforcing tax compliance bysradl, uewly emerging enterprises is difficult as accounting standards are not yet well established andexperience in tax administration is limited. However, an assessment should be made for inroducing atransitory revenue raising mechanism for these enterprises, such as a minimum payment requirement onthe estimated value of assets or income. Such measures, which other countries have used successfully,would be easy to administer and could provide a simple way to reach the private sector until an effectivetax administration system is put in place. If revenue collection falls and the government continues tomaintain its expenditure plans, it would have to enact new tax measures. Box 1-3 provides an overviewof the existing tax system in Latvia.
1.81 The scope for higher tax rates is, however, limited. Taxes on labor are already highconsidering the total impact of the social security tax and personal income tax. When the social securitytax is included, the basic marginal personal income tax rate of 25 percent corresponds to an effective taxrate on labor of 46 percent. By international standards this is too high, implying that any extra revenuefrom this source should come only from improving collection efficiency or reducing exemptions.
1.82 Tax exemptions are currently widespread. For example, income from agriculture is exemptfrom the profit tax, property tax is not paid on agricultural land, income from private farming is exemptfrom the income tax, and social security taxes in agriculture are half the regular rate of 37 percent. Othersectors or groups also benefit from lower tax rates, for example, there are generous reductions on profittax payable by enterprises with foreign ownership.
1.83 Differentiated tax rates such as these can have powerful effects on resource allocation. Forexample, the tax concessions to agriculture could lead to an artificial fragmentation of farm land and standin the way of a dynamic agricultural sector composed of farms that capture the benefits of economiesof scale. More importantly, these reduced tax rates represent revenues that are not collected, causinghigher deficits or higher tax rates for other taxpayers.
1.84 There is probably some scope for an increase in the VAT rate over the medium term. FromJune 1994 the rate will be a uniform 18 percent, which is still somewhat below other northern Europeancountries and the 23 percent rate in Russia. However, higher rates may wenl stimnulate evasion and henceraise little revenue, so the emphasis should initially be on better collection techniques and the possibleelimnation of exemptions for utilities. As with the price subsidies for utilities, exempting utilities fromthe VAT does little to encourage conservation to reduce dependence on imported energy.
1.85 Scope also exists for an increase in revenues from customs duties, for example, ')y imposinga low minimum tariff on all imports. As wih most other taxes, the emphasis should be on setting therate at a level that does not lead to widespread evasion and that is simple to administer.
1.86 The authorities should also attempt to increase revenues by adopting cost-based tanffs onpublic services (utilities, transport, and so on), which remain underpriced. Cost-based tariffs and userfees for public services not only help reduce subsidies, but also contnbute to the maintenance,rehabilitation, and replacement of equipment and facilities.
- 24 -
Box 1-3. LatvIa's Tax System
Most taxes are levied by the central government. Explicit arrangements existed in 1993 for sharing the revenues fromprofit, value added, and personal income taxes between the central and local governments. These arrangements are beingchanged in 1994.Persondl Income Tax:* The personal income tax is payable on wages, salaries, and other forms of labor income. Capital income and socialbenefits are not taxed. Labor income from agriculture and some related activities are also not taxed. Tax payments arewithheld at source.* A new law on income tax took effect on January 1, 1994. The new standard tax rate is 25 percent, with a nontaxableallowance equal to Ls 25 per month and an allowance of Ls 20 per dependent. A surcharge of an additional 10 percentwill apply to higher income levels.Social Secur*y Tax:* The social security tax is levied on salaries, wages, and other labor incomes. The general rate is 38 percent, leviedmainly on the employer (37 percent) rather than the employee (I percent). Self-employed people pay the tax directly.The tax rate is reduced for certain groups (agricultural workers and firms employing mainly handicapped workers) andhigher for those working in dangerous or unhealthy conditions. Social benefits are not related in any way to previouspayments by or on behalf of employees.Prouflt Tax:* This tax is levied on the net profits of enterprises and the self-employed (although the self-employed may choose topay the income tax instead). Tax rates are currently being revised. Under the old system, standard rates of 45, 35, and25 percent applied, respectively, to banking, insurance, and trade; state enterprises; and other businesses. However, anumber of special arrangements applied. Income derived from gambling was subject to a tax rate of 65 percent;enterprises with significant foreign investment were governed by the Law on Foreign Investment, and received taxholidays of up to three years and subsequent reduced rates for up to five years; and a number of other preferentialarrangements existed, including an exemption from tax for income from agriculture.Tax on ReAiied Earm#gs of State Enerprises:* This tax is intended to be equivalent to a dividend or return on investment paid by state-owned enterprises to thegovernment The tax is levied at rates between zero and 25 percent, and actual payments are negotiated with enterprises'brch ministries.Value Added Tax:* The value added tax, which uses the credit system, is levied on goods and certain services at the mamfctringlim port,wholesale, and retail stages. Taxes paid on capital goods are fuDly refimded. Local governments may levy surchargesof up to 2 percent on the standard rate, but few districts have levied such taxes.* The standard tax rate was increased from 12 percent to 18 percent on November 1, 1993. The rate on food productswas increased from 6 percent to 10 percent on November 1, 1993, and will be increased to 18 percent on June 1, 1994.By international standards there are relatively few exemptions, which include some services, including rent and utilities.Excise Tax:o Excise taxes are levied on the production or importation of gasoline and diesel, various alcoholic beverages, tobacco,precious metals and jewelry, and luxury perfumes. Excise taxes paid on gasoline and diesel used in agriculure arerefunded to farmers.Customs Duties:* Duties on imports and exports are currently under review. An interim law on tariffs took effect on January 1, 1994,but is scheduled to be replaced later in 1994.* A general import duty of 15 percent applies to imports from countries with trade agreements with Latvia, while a 20percent rate applies to other countries. However, raw materials, spare parts, and equipment are subject to a much lowerbasic rate, while higher rates apply to many agricultural goods. Export duties are levied on a small number of goods,including products of wood, metal, and leather.Land and Proper" Taxes:* These taxes are pakJ directly to local government. The land tax is levied on land at rates based on its location and use.The property tax is levd at graduated rates between 0.5 percent and 4.0 percent on the value of fixed assets used forcommercial purposes. A number of exemptions apply, including for property used for agriculture and for health,educational, cr cultural activities.
- 25 -
1.87 In general, revenues should be enhanced mainly by reducing exemptions and improving taxcollection rather than by increasing basic tax rates. The move toward computerization and use oftaxpayer identification numbers should assist in this regard. The target should be a system with rates thatare high enough to justify the costs of administration of each tax, but low enough to avoid widespreadevasion. A comparison of the actual yield of each tax with the potential yield (based on the tax base)would be useful in indicating those taxes that are not currently effective.
D. Medium-Term Fiscal Outlook
1.88 To examine the fiscal outlook for the next few years, some illustrative projections have beenprepared based on the current tax system and the fiscal changes that are scheduled for 1994 (Tables 1-8and 1-9). Despite the current economic difficulties, prospects for output recovery and sustained growthare good. Preliminary figures for late 1993 and early 1994 indicate that the decline in GDP may havecome to an end. On that basis it is projected that GDP would remain unchanged in 1994, and wouldachieve positive rates of growth from 1995. An increase in exports and private sector activities isexpected to lead growth during the remainder of the decade.
Table 1-8. Basic Macroeeonomic ndicaors, 1993-97 and 2004
Current account balance (percentage of GDP) 6.4 -3.0 -5.0 -5.0 -5.0 -1.1Reserves as months of impo.ts 4.9 3.7 3.2 3.0 3.0 3.0Debt service ratio 0.3 2.4 2.5 3.2 4.9 9.5Debt/GDP ratio 13.2 13.1 15.0 17.3 20.2 20.1Government external debt as a percentage of total 5.7 30.5 40.8 47.4 50.4 64.3Government external debt as a percentage of GDP 0.8 4.7 6.8 8.8 10.6 12.7Government interest payments as a percentage of revemne 2.2 0.8 1.8 2.5 3.0 4.2
a Goods and non-factor services.Source: Staff estimates.
- 26 -
Tabk 1-9. Projection of Genera Govenunent Operaions, 1993-97(percentage of GDP)
Category 1993 1994 199S 1996 1997
Revenue, of which 33.4 31.6 31.8 32.1 32.0Profit tax 7.4 5.6 5.6 5.7 5.9Income and social tax 15.0 11.2 10.5 10.5 10.2Taxes on goods and services 10.7 11.7 12.6 12.8 12.8
Expenditure, of which 32.5 33.5 35.? 35.8 35.6Wages and salaries 6.9 6.6 6.4 6.3 6.1Supplies and maintenance 5.1 5.0 5.1 5.2 5.3Transfer to households 15.1 15.7 16.6 16.7 16.1Investment 0.8 2.0 3.0 3.0 3.0
Composition of fiscal balance 0.6 -4.4 -3.4 -3.6 -3.6Central government and social security 0.3 -4.7 -3.4 -3.6 -3.6Local governments 0.2 0.3 0.0 0.0 0.0Extrabudgetary funds 0.1 0.0 0.0 0.0 0.0
Sources: Latvian authorities and staff estimates.
1.89 On the revenue side, GDP growth would stimulate tax receipts. Total revenues are projectedto increase by 10 percent a year between 1994 and 1997. By the turn of the century Latvia's total taxand nontax revenues with respect to GDP would be a little below the ratios observed in the OECDcountries today.
1.90 On the expenditure side, the growth in GDP is assumed to call for only a modest annualincrease in the real value of transfer payments and the public sector wage bill. This would be consistentwith the projected 2 percent yearly increase in real wages, particularly if public sector employment isreduced. As far as unemployment benefits are concerned, a significant increase in the unemployment rateis projected starting in 1994, with the rate peaking at an average of 16 percent in 1995 and 1996. Asconcerns other expenditures, real growth in social benefit payments is assumed to be 2 percent a year.It is also assumed that government bonds would be issued to replace the nonperforming assets of the statebanks. The nominal interest rate on government debt is assumed to be 22 percent in 1994, fallinggradually to 17 percent in 1997. Provided that efforts at economic stabilization continue, inflation isprojected to increase at single-digit levels starting in 1995. Figure 1-2 illustrates the projected changesin the composition of expenditure.
1.91 The general govermnent current balance (that is, excluding investment expenditures and netlending) is projected to worsen gradually and to show a deficit of around 0.7 percent of GDP by 1997.A current deficit of this order would net be imprudent and is in line with the high transition costs(unemployment benefits and bank restructuring) that the economy is facing.
- 27 -
Figure 1-2. Composition of Expenditures(percentage of totals)
1993 Capital expendituresOther current 2.5
expenditures 14.0 Wages and salaries21.2
Transfers to housholdsmanenc46.6 15.7
200.Capital expendituires Wp Wslre
Transfers to households40.3
- 28 -
1.92 The projections further assume that public investment would amount to 2 percent of GDP in1994 and 3 percent of GDP thereafter. Based on international comparisons, this level of investmentwould be necessary to increase the economy's productive capacity. Assuming that the extrabudgetaryfunds are self-financing, this level of public investment would yield a deficit of nearly 2.0 percent of GDPfor the general government financial balance-excluding net lending-in 1994, and a deficit of about 3.5percent in 1995 (Table 1-9). The financial deficit is projected to peak to around 3.7 percent of GDP in1996 and 1997 and to fall thereafter. The broader fiscal deficit, which includes net lending, will, bycontrast, peak at about 4.4 percent of GDP in 1994. The higher deficit in 1994 reflects (a) the projectedincrease in investment expenditures, (b) the higher spending on unemployment-related benefit paymens,and (c) the decreased income and social security tax receipts. In subsequent years, as net lending by thegovernment is curtailed, the fiscal deficit is expected to fall to around 3.6 percent of GDP.
E. Deficit Financing, Resource Flows, and Macroeconomic Stabilty
1.93 The fiscal deficits projected in the last section are assumed to be financed predominantly byforeign loans (Figure 1-3), reflecting the limited potential to borrow from the domestic capital market.3This section evaluates the medium-term sustainability and the macroeconomic implications of financingthese deficit levels. To demonstrate the sustainability of the projected fiscal deficits in the context af aconsistent and stable macroeconomic framework a quantitative simulation is provided for the govermentdeficit and the path of domestic and external debt levels (for a discussion of the underlying frameworkand its assumptions see Annex 2).
Figure 1-3. Fiancing of the Fiscal DeficitPercenlage of Total Peen of GDP
250.0 3.5200.0 3.0
150.0 2.0100.0 1.550.0 1.00.0 0.5
-50.0 1994 199S 1996 1997 1998 -0.°S-0.5
-100.0 t I .,/1 , -1.0-150.0 -1.5
- Domesiic L [ Exwenwal -- - Domestic - Extl(percentage of (percentge of (percentage of (prcentge ofTotal) Total) GDP) GDP)
31 Seignorage is one possible way to finance Ie deficit of the consolidated government comprised by both the generalgovernment and the Bank of Latvia (BOT ). But seignorage is ruled out as an indirect financing source of the generalgovernment in Latvia: the very low level of the Bank of LAtvia's net domestic credit to the government is assmedto reman unchanged. This implies that seignorage is exacdy equal to the bank's increase in nongovernment assets(3.2 percent of GDP in 1994, 1.4 to 1.5 percent of GDP thereafter). Therefore, the general government can only befinanced (direcdy and indirectly) by issuing debt to domestic holders other than the bank and to foreign crediors.
- 29 -
1.94 These quantitative results, which are summarized in Table 1-10, indicate that domestic debt,including the debt issued to swap the nonperforming loans of the state banks, starts at 4.5 percent of GDPin 1993 and rises to 6.3 percent in 2000.32 Such a level of domestic financing would be quite feasiblegiven the low level of initial debt. Foreign debt starts at almost I percent of GDP in 1993, but growsto 14.6 percent by 2000 as it finances the major share of the deficit each year. The projected foreigndebt is also consistent with maintaining a current account deficit of about 3.0 percent of GDP in 1994and an average of 4.5 percent a year for the second half of this decade. While domestic financing wouldbe provided largely by the sale of Treasury bills, foreign financing would come from internationalfinancial institutions and bilateral sources. Most public investment expenditures are projected to befinanced externally. Therefore, the domestic financing requirement is projected to amount to around 1percent of GDP throughout the projection period.
Table 1-10. Susinable Rical Defidt and is Financig, 1993-97 and 2000(percentage of GDP)
Deficit and Debt 1993 1994 1995 1996 1997 2000
Government deficit -0.6 4.4 3.4 3.6 3.7 3.6
Government domestic debt 4.5 4.5 4.9 5.2 5.6 6.3
Government foreign debt 0.8 4.7 6.8 8.8 10.6 14.6
Source: Staff estimates.
1.95 Total government domestic and external debt peaks around 19 to 20 percent of GDP in thelater part of the decade and declines thereafter. Such a path of rising debt would finance expenditreneeds during a period of structural transformation and slowly increasing output during which externalfmancing is particularly necessary. It would also remain within the overall availability of external fundsto Latvia. An important consideration, however, is that the local costs portions of the loans are includedin the budget as foreign credits typically finance the foreign exchange costs of projects. Rising foreigndebt during this exceptional period does not imply a continuous rise in externl (and domestic) debtlevels. Once the output recovery accelerates and becomes sustainable, the government deficit would bereduced and the level of debt would start falling with respect to GDP.
1.96 The projected path of the government deficit and debt levels are consistent with Latvia'soverall macroeconomic stability and the overall saving and investment flows, as shown in Table 1-11 andFigure 14. These projections indicate slightly negative government savings during the projection period.Nongovernment savings (that is, saving by public enterprises, private enterprises, and households) followa pattern similar to that of output: it declines substantially in 1993-95, when output is projected to
32 These projections are based on the information available to the Bank mission in November 1993. To the extent thatthe actual outcome for 1993 has been slightly better than assumed in the projections, the level of debt in subsequentyears will be slightly lower than shown in the projections.
- 30-
stabilize, and starts a gradual recovery thereafter.33 Nongovernment investment shows even morepronounced behavior with respect to output. As a result, its saving-investment balance deterioratessubstantially, from a surplus of 4.8 percent of GDP in 1992 to a deficit of 1.6 percent in 1995. Withthe recovery of output this gap would be reduced and would stay at around 0.3 percent of GDP towardthe end of the decade.
Table 1-11. Savings nd Investnent 17ows, 1992-2000percentage of GDP)
33 It experience shows that both savings awid investment follow a procyclical pattern..Saving.behaves
Source: instm eanutlyes ans staff eswmen.
33 International experience shows dmat both savings aid mvestment follow a procyclkal patter. Saving behavesprocyclically because the private sector (households in particulr) dissave durnog bad times to avoid a consxumptionreduction as strong as their (ftemporary) inconie decline. Investment a typically even more procyclica: enterprisecut investmet oudays substally when they face a sales slump.
- 31 -
1.97 The gap between domestic investment and national savings would require increased externalfinancing flows. With the currendy low level of external debt and a sound fiscal and monetary policy,Latvia should be able to increase its access to foreign financial markets and investment flows, particularlyif viable investment projects are identified. As mentioned earlier, the corresponding accumulation offoreign debt during the remauning years of this decade would be compatible with maintaining adequatelevels of creditworthiness. Total external debt is projected to peak at around 23 percent of GDP by theturn of the cetury and then decline to aroumd 20 percent in the early part of the next decade. Debtservice payments would remain moderate and amount to 4 to 6 percent of total exports in the late 1990s.
- 32 -
Chapter 2. Public Investment Program
A. Introduction
2.1 The transition from a command to a market economy requires a profound reform of publicsector management. The guiding principle of public sector reform is a reorientation of the state's rolefrom directing to facilitating economic activity and from repressing to enabling the private sector. Interms of public investment, this means disengaging from directly productive and commercial activitiesand reorientating investment toward activities that support and encourage private sector development.More specifically, it means focusing public expenditures on putting in place and maintaining the economicand social infrastructure and public services that are vital for the functioning of a market economy. It alsomeans that the cost-effectiveness of providing infrastructure and services is of prime importance so thatthe economy is not burdened with unnecessary public expenditures.
2.2 This chapter concentrates on public investment by the state and local governments. It coverspublic investment from loans that benefit from a government guarantee, but excludes investments by state-owned enterprises financed with other funds because the government has not yet drawn up the list ofenterprises it intends to keep in the public sector. Moreover, reporting of investment activities byenterprises likely to remain state-owned is incomplete, and the large state-owned enterprises do not reporttheir investments unless a government guarantee is involved.
2.3 This chapter focuses on ongoing public investment projects and identifies prorities for publicinvestment concentration. Chapter 3 presents more detailed discussion of these and other planned projectsand of major public expenditure issues in each sector. Section B of this chapter discusses the level,composition, and quality of the ongoing investment program; section C reviews the public investmentprogram in the medium term; section D analyzes the availability of resources and investment financing;and section E highlights major issues and offers recommendations for a more efficient public investmentprogram.
B. The Ongoing Public Investment Program
Level and Sectord Compoion
2.4 Investments from state and local budgets bave fallen drastically since 1990 (Table 2-1). Twofactors were largely responsible for this decline. First, the mandates of different ministries changedsubstantially and a number of responsibilities devolved to local governments, whose resources did notmatch their new responsibilities. Second, in response to a sharp decline in investment resources andunreliable project cost estimates, the authorities applied stringent selection criteria for projec. financing.In real terms, the 1993 level of investment represents less than 14 percent of the 1990 level.1 Investmentcutbacks were particularly severe in 1992 and 1993. The present level of investment-0.8 percent ofGDP-not only falls short of Organization for Economic Cooperation and Development (OECD)
1 Note that the deflator used is the index of average annual consumer prices, not an index of constucion costs and othercapital goods, which would be more appropriate, but is not available.
- 33 -
standards, but also of those of most developing countries. The 1990 investment expenditures werefinanced from the state budget. Local governments started investing from their own budget resourcesin 1991. The level of investment from local governments' own resources is open to some doubt, becausefinancial control by the central government is confined to those investments realized with state grants forspecific projects as reflected in Table 2-1 (for the remainder of their investment the local governmentsreport on their realization ex post).
Table 2-1. Investments from State and Locad Budgets, 1990-94(Ls tOwsands)
Investment 1990 1991 1992 1993 1994(Budget)
State investments 1,194.5 2,285.5 6,563.9 8,074.1 12,131.8
Local investments 724.1 1,223.2 6,009.1 4,827.7 n.a.Of which fianced with state grants 724.1 233.3 694.1 1,172.5 1,364.1
n.a. Not available.a Deflated by the average annual consumer price mdex.Note: D)ata for 1990 and 1991 converted to Lats at 200 rubles per Lats.Source: Ministry of Pinance and mission esdmates.
2.5 A modest increase of about 14 percent in real terms is budgeted for state investment in 1994.The 1994 investment budget also includes some items that are not strictly for investment, for example,an equity investment in the Agricultural Finance Corporation and the purchase of land, both by theMinistry of Agriculture, for a total of Ls 0.75 million, and an Ls 1.35 million credit reimbursement tothe State Property Fund for the reconstruction of the National Opera. No budget is allocated for themodernization of the Riga airport, which is taldng place with a loan from the European Bank forReconstruction and Development (EBRD) under a government guarantee. Expendirs on this projectare expected to reach about Ls 1.8 million in 1994.
2.6 Table 2-2 and Figure 2-1 present the composition of state investments by budgetary entity.Sectoral analysis of these investments is difficult because (a) the data are available only by ministry orother budgetary entity; (b) the entities' activities do not conform to economic and social sector definitionsused in market economies; (c) the budgetary data are not reconciled with those provided by the StateCommittee for Statistics, which follow the International System of Industrial Classification; (d) theministries' changing mandates and reorganization during the past couple of years; (e) the transfer ofresponsibilities from :he central to local governments affects the sectoral composition of investmentexpenditures by the state; and (f) the low overall volume of investments means that large individualprojects acquire extraordinary weight and obscure any underlying trends. The discussion presented belowshould therefore be viewed in light of these shortcomings.
- 34-
Table 2.2. Sae Invesbaents by Main Budgetay Entiy, 1990-94(percent)
Budgetary Entit 1990 1991 1992 1993 1994(budget)
Ministry of Agriculture and Forestry 56.1 64.0 55.4 31.1 25.0Ministry of Education. Culture.
Science, and Sports 12.0 9.8 10.7 35.1 26.6Ministry of Welfare (including Health) 11.1 11.2 7.5 14.4 8.6Mioistry of Enviromnent
and Regional Development 13.0 6.8 2.0 0.6 0.0Ministry of Transport and
100.0 100.0 100.0 100.0 100.0Totals in Ls milions 1,194.5 2,228.5 6,563.9 8,074.1 12,131.8
a The data for 1990 and 1991 cover only communications and fisheries. No transport investments are listed in the budgetoutcome tables. See text for details.
b Includes the former ministries of Industry. Energy, and Trade.c Includes customs border posts built under the aegis of the Ministry of Finance in 1992 and 1993.Note: Totals may not add because of rounding.Source: Ministry of Finance.
Figur 2-1. State Investments by Main Budget Entity, 1991-94(percent of total)
100-__
so ~~ ~~~~~~~~~~~~~~~~ Ot\ *rs
60 -- Justiae, intrior an defn
C Tronspr Vnd comsnunjadons
40- Envroand regrqion
20 ~~~~~~~~~~~~~~~~~~~CEducatin, cultur, -ienc ad sprt
*~~~~ *Agrclue ad fret
1990 1991 1992 1993 1994Soue: Latnv audhon and staff esmats.
- 35 -
2.7 Table 2-2 illustrates the major shifts in budgetary allocations that have occurred among theministries. The share of the Ministry of Agriculture has declined substantially from its peak in 1991.2The decline coincides with a sharp rise in the shares of the Ministry of Education, Culture, Science, andSports in 1993 and 1994 because of heavy spending on the reconstruction of the National Opera. Thisis the largest investment project in the portfolio, accounting for about 56.0 percent of that ministry'sallocation and 14.5 percent of the total state investment budget in 1994. Other 1993 allocations to theMinistry of Education were for the completion of nearly finished ongoing projects, as was the case forthe Ministry of Welfare, where thirteen of the ministry's sixteen projects were in this position, andexplain the relatively high allocations for that ministry in 1993. Sharp rises are also recorded in theshares of the Ministry of Defence for the construction of barracks and other facilities for the defenceforces and under the entry for state administrative institutions for the construction of customs posts atLatvia's reestablished international borders. The allocations for the Ministry of Transport wereunderstated in 1990 and 1991 because they include investments only in communications and fisheries,because the transport investments were made from a budget line that also included maintenanceexpenditures.3 The division between maintenance and investment is very indistinct in a ministry that hasits own construction work force. The sharp rise in the share of this ministry in 1994 largely reflectsexpected disbursements under an EBRD loan. Finally, the decline in 1993 allocations for the Ministryof the Environment and Regional Development and their elimination in 1994 is due to the transfer ofresponsibilities to local governments.
2.8 Table 2-3 compares budgetary investment by state and local governments.4 This comparisonshows that local govermments have no agriculture and forestry activities, but their activities under themandate of the Ministry of Education are significant, representing more than a quarter of theirinvestments (Figure 2-2). By far the largest share, more than half their investment spending, is in thearea covered by the Ministry of the Environment. This includes housing, water supply, sewage, andmunicipal services, areas in which the central government no longer plans to invest.
Quality of the Ongoing Program and Project Portfolio
2.9 The quality of ongoing programs and projects should be assessed in light of the relevance andadequacy of these investments and the resumption of economic growth and social development in Latvia.The drastic decline in budgetary resources imposed stringent criteria for selecting projects and programsin the past two years. The allocation criteria for the 1993 state budget were (a) new projects would notreceive funding; (b) projects 80 to 90 percent completed would receive preference; and (c) housinginvestments would not receive funds, nor would 'privatizable' activities. The same criteria have, inprinciple, been applied in the formulation of the 1994 program.
2 This ministry now also includes forestry, but not fisheries, which were merged into the Ministry of Transport andCommunications when that ministry took over the Ministry of Maritime Affairs.
3 Expenditures on this line totaled Ls 366,000 and Ls 1,184,000 in 1990 and 1991, respectively.
4 Caution must again be expressed about local government investments and their sectoral implications; some maycontain recurrent expenditures.
- 36 -
Thb;e 2-3. Breakdown of Investments Fianced by State and Load Governments by Mhsterla Mandates, 1992(percent)
State LocalMinisterial Mandate Govemnments Govermments Total
Agriculture. Forestry 55.4 0.1 29.0Education, Culture, Science, and Sports 10.7 26.8 18.4Welfmre, including Health 7.5 3.1 5.4Enviroment, Regional Development, of which 2.0 56.0 27.8
Transport and Communications 8.2 1.7 5.1Justice, Interior, and Defence 9.3 0.4 5.1Economy 2.1 1.0 1.6Administrative institutions 4.6 0.3 2.6Other 0.0 10.7 5.1Total 100.0 100.0 100.0
Totals in Ls millions 6,563.9 6,009.1 12,573.0
Source: Miistry of Finance and staff estimates.
2.10 While these criteria made sense during the last two years, the time has come to include highreturn new investment projects in the budget. The blanket exclusion of new projects from budgetarysupport not only precludes adjustments in the public investment program, but it also ignores thepossibility that new projects may be superior to those in the portfolio, particularly as the latter havegenerally not been subject to satisfactory cost-benefit or cost-effectiveness analysis. This exclusion shouldthus be lifted as soon as possible, which highlights the urgency of establishing a public investmentprogram (PIP) system.
2.11 The application of the above criteria for the 1993 budget led to the rejection of more than halfof the requests ministries and other government bodies submitted on the grounds that they were newprojects. Nearly another quarter of the requests was refused for a variety of reasons, including thathousing was no longer eligible for state funding, co. that the investment had received a "closing-down"allocation in the previous year.
2.12 There were, however, some exceptions. First, more than 40 percent of the inital 1993allocations were for program-type investments, that is, a series of repcz., operations where the programmay be ongoing, but the actual investments are new. The biggest of these is a program of farmsteaddevelopment and land improvements implemented by the Ministry of Agriculture. The total cost of thisprogram is estimated a about Ls 200 million (US$330 million) with no timetable for its implementation.With an allocation of more than Ls 1.9 million, this program absorbed 72 percent of the ministry's capitalexpenditure and 24 percent of the state investment budget in 1993. The aim of the farmsteaddevelopment part of the program is to bring roads, power lines, and telephones to all farms; make on-farm land improvements; and build rural roads.
- 37 -
Figure 2-2. Public Investment at the State and Local Levels, 1992(percent of totals)
State Economy 4.6 ton
9.3 ~~~~~~~~~~~~~~~~~~~~~~Agdkultur and forestryS5.4
Transport VWd
&vCMeWM 2.0
Welfare7.5
Education and cuais10.7
LOCalOie Agr ud and fiseny
10. 0.
Administration- 0 3 10.7 o. iEducadon and cture
Economy 1=04 26.8justie and aflterir 0.4
31
Iioa development56.0
ISoure: Mii of Fnane and sWftieats.
- 38 -
2.13 This program requires thorough review and evaluation. Not only is the economic justificationfor blanket coverage of farms with such investments doubtful, the number of farm units covered willprobably have to decrease over time. Moreover, farmers should initiate on-farm land improvements andshould at least cofince them, if not fully fund them. Similarly, the relevant utilities should provideelectrical connections and telephones, not the Ministry of Agriculture. Indeed, as far as telephones areconcerned, the recently awarded contracts for the partial privatization, modernization, and managementof Laueiekom includes the development of a rural telephone system. As for rural roads, localgovermnents are responsible for maintaining them. Investments should only be undertaken if localgovernments are able to ensure proper maintenance. There is no evidence that this has been ascertained.About Ls 1.8 million are still allocated for this program in the 1994 budget.
2.14 Another Ministry of Agriculture program, the development of regional engineering, a machinebuilding program, is a privatizable activity. So are the four individual projects in agricultural processingplants. The 1994 budget continues to make an allocation for regional engineering (Ls 125,000) and stillincludes allocations for one agriculture processing project. Although these investments are relativelysmall, the principle of having the private sector take such activities should be inculcated early on duringthe transition.
2.15 The other two investment programs of any financial consequence in the 1994 budget concernthe construction of customs checkpoints by the Ministry of Finance (allocation of Ls 485,000) and theconstruction of frontier guard posts and barracks by the Ministry of Defence (allocation of Ls 800,000).These facilities are obviously needed, but constuction standards for them must not be excessive.
2.16 The largest project in the portfolio is the reconstruction of the National Opera. The decisionto go ahead with this project no doubt went beyond economic considerations. Excluding this project aswell as the programs already mentioned, the average allocation for the remaining eighty-eight projectsin the portfolio is less than Ls 37,000, with forty-three projects each attracting Ls 10,000 or less. Frommother perspective, twenty-four projects are described as reconstruction projects, forty-one receivedallocations for completion (with some appearing both under reconstruction and completion), and sevenmore for closing down. Whether these will aUl be completed or closed down is not clear. In the requestsfor 1993 budget allocations, a number of projects reappeared that had received funds for completion orclosing down in 1992.
Costs to Completion, Impementation Periods, and Overang of Unfinished Projects
2.17 The reapeance of projects in budget requests that have received funds for completion orclosing down casts doubts on the soundness of the cost estimates that underlie requests for budget support,or indeed on total project costs and completion percentages for ongoing projects. These doubts arestrongly supported by an examination of 1994 budget requests. The Ministry of Finance required budgetrequests to contain information on total costs and remaining costs to completion both in 1984 and in 1994prices. To examine the quality of cost data for budget requests, the inflation factor that was implicit inthese two cost estimates was compared for the four ministries that showed this information. The resultsindicate that the implicit inflation factor differs sharply among ministries and, in three of them, amongdifferent projects in the same ministry. The Ministry of Education was the only one that applied onefactor, that is, 1994 price-) were eighty times higher than 1984 prices. The factors differed between 9and 69 times in the Ministry of Welfare, 9 and 161 times in the Ministry of Transport, and 23 and 162tmes in the Ministry of Agriculture. Similar variations were observed in the 1994 budget requests bylocal governments. This problem occurred partly because mioistries were not given any guidance on theinflation rates they should use in prepaing the budget requests.
- 39 -
2.18 Doubts about the reliability of cost data also extend to size of the overhang of investnentprojects that have been started but not completed. A detailed inventory of this overhang does not exist,but the EC-PHARE program is providing technical assistance for the preparation of such an inventory.However, a first perspective on the overhang could be obtained from those 1994 budget requests thatspecify the remaining cost to completion. Not all of the requests are detailed enough to carry out thisanalysis, but for those that are, the data are assembled in Table 24.
Table 2-4. Remaining Costs to Completion of Projects for which Pinwnce &i Requested from the State Budget, 1994
Ls thousands/vear Years to CompletionCosts to at 1994
Welfire (rehabilitation centers only) 1,021.3 3,471.3 3.4 10.7Transport (excluding modemization of Riga airport) 2,896.7 5,210.3 2.1 5.6Education (excluding reconstruction of National Opera) 3,073.6 6,259.3 2.0 6.5Agriculture (excluding rantstead development program) 2,343.9 4,120.6 1.8 5.3
Total 9,335.5 19,061.5 2.Oa 6.2a
a Average year to completion.Source: Staff esfimates.
2.19 The table shows total estated costs to completion of the projects of about Ls 19 million.Assuming that this set of projects will receive about Ls 3.1 million of budget funds based on allocationsreceived by the ministries concerned, no serious implementation problems will arise. The overhang willfall to about Ls 16 million by the end of 1994. However, the projects included in Table 24 representonly one-third of the budget requests (excluding those noted in that table). If these data are reprentteof the other two-thirds, the total overhang would amount to about Ls 48 million at the end of 1994. Ifthe. cost to completion of the National Opera is added, this figure increases to Ls 58 million. TheMinistry of Agriculture's farmstead development program (estimated at Ls 200 million) is excluded,because an ongoing program of small repeat projects would not be considered an overhang.
2.20 The overhang of uncompleted investment projects is larger than indicated by the above databecause the estimate does not take into account uncompleted projects that are no longer included in thebudget requests. For example, the National Road Administration has thirty-five projects that wouldrequire nearly Ls 15 million to complete. Only two of these projects are part of the 1994 budget requestof the Ministry of Transport that are included in Table 24. They account for only about one-third ofthe estimated cost to completion of these thirty-five projects. No information is available on possibleoverhangs of this type in most other ministries.
2.21 The overhang is not limited to state investments. The 1994 budget requests of twenty-fourof the thirty local govermments provide information about the remaining costs to completion of theprojects for which they seek support from the state budget. While their budget requests totaledLs 13.2 million, the total cost to completion is put at Ls 35.4 million. Total state support to localgovernent projects will rise to a little less than Ls 1.4 million in 1994. If this supportrepresents 24 percent of total expected local govemment invesutents as in 1993, and if the allocationsto these twenty-four local govermnents amount to the same as their share in the budget requests made byatl thirty local governments, the cost to completion of these projects would total close to Ls 30 millionby the end of 1994. Of this amount Ls 20 million is estimated to be for water and sewage(see Chapter 3).
-40 -
2.22 The backlog of unfinished investment projects, though unspecified, is sizeable. This hasattracted a good deal of attention and has led to the suggestion that a specific effort should be undertaken,perhaps with external technical assistance, to review the backlog and decide on the eventual fate of theseprojects. A less costly and less time-consuming approach would simply be to require that any projectin the portfolio that has not received funding, say after 1992, and for which new funding is being soughtmust be resubmitted like a new project with proper cost-benefit or cost-efficiency analysis and a solidestimate of costs to completion. These projects would then have to compete for limited public funds ontheir merits. Such a requirement could be enforced in the framework of the public investment ptogramin good time for the 1995 budget. This would imply setting a deadline after which projects that were notresubmitted would be dropped and adopting an appropriate procedures for disposing of the leftover assets.
2.23 Table 2-4 also provides some information on implementation periods. At the 1994 budgetrequest level, an average implementation period of two years does not appear excessive because manyof these projects are already in advanced stages of implementation. However, at currently available levelsof budgetary funding, the average implementation period would increase to more than six years, meaningthat this set of projects might only be completed by the end of the century. A similar calculation forinvestment projects by local governments would put the average completion period at close to eight years.This is even likely to be an understatement, as these governments are also responsible for investmentsthat the state budget no longer supports (for example, housing and municipal services), and they mustdevote some of their investment resources to these purposes. These implementation periods are clearlyexcessive, and every effort must be made to concentrate resources on high priority projects.
2.24 The situation becomes worse if the availability of funds falls short of allocations, as happenedin 1993. By the end of the third quarter of 1993 monthly transfers of investment funds to the executingagencies were 85 to 90 percent of what they should have been. The shortage of funds for disbursementcombined with the absence of contingency allocations to cover price increases could lead to paymentdelays, which would stretch implementation periods even further.
C. The Public Investment Program in the Meedium Term
The Need to Formulate a Strategy
2.25 The 1994 requests for investment budget both from the ministries and from the localgovernments exceed the investment resources by a wide margin. Requests by the ministries amount tomore than Ls 34 million. Local governments requested another Ls 16.5 million, for a total of more thanLs 50.0 million. Allocations for state investments together with special purpose grants to localgovernments amount to about Ls 13.4 million. Total requests are, therefore, nearly four times as highas the allocations;. Excluding the Riga airport modernization and upgrading, which makes no claim ondomestic resources, new projects account for less than 10 percent of the total requested. The investmentprogram mostly includes projects that are partially implemented without being properly screened for theircost-effectiveness or their relevance to the transformation of the economy. Figure 2-3 compares requestedand approved expenditures for ministries and municipalities in 1994.
2.26 To permit screening, overall and sectoral strategies for public investment need to beformulited. The govermnent has not yet formulated such strategies because of the need to deal withimmediate problems and to put in place the legal and institutional framework required to guide thecountry during the transition. Nevertheless, some basic sectoral or subsectoral strategy work is beingdone or planned, including a railway sector survey, a port master study, a master plan for an air
- 41 -
navigation system, an energy master plan, an energy saving strategy, and an energy sector restructring.The latter two, which were carried out under the EC-PHARE grant, established general policyrecommendations for energy conservation and suggested institutional arrangements for managinggovernment involvement in the energy saving programs. None of this work has led as yet to the adoptionof investment strategies by the government. Therefore, the development and adoption of such strategiesin the major sectors in which the government will remain involved should receive priority attention.
Figure 2-3. Requested and Approved Investment Expenditures forMinistries and Municipalites, 1994
La milkon
20-18 .f i
14-12-10.
.... .. .. ........ .. .- - --
64.2
munticpalte Trn vf gicultur Educamion weluar and EtwrPAMonmt Defence OtherHealth and Region
IM ReqUeSted [OApProVed
Soure: Latvan authtw
2.27 As discussed in Chapter 1, the principles of designing such sectoral strategies should be toreduce the government's direct role in the economy and to move away from areas such as agriculture,industry, and housing, where the private sector is expected to be active, and to concentrate in areas suchas infrastructure and social services, where the private sector does not have the means or the incentivesto undertake major initiatives. In the areas that remain in public hands, the government should attemptto embark on projects that complement private sector activities.
bwestment Prorities
2.28 While the development of sectoral and L-ersectoral strategies is essential to guide publicinrvestment activities, a public investment program needs to be formulated urgently. In formulating sucha program certain priorities need to be considered. The first, and perhaps the most important, is therehabilitation and modernization of the basic infrastructure, which should receive priority over itsexpansion, to avoid further deterioration of existing capacities, which are well developed and are notlikely to need further expansion for many years to come.
2.29 Priority areas for public investment in the major sectors are presented below. Chapter 3provides further details on investment projects, including those judged to be of high, medium, and lowpriority at this stage.
- 42 -
Transport Infrastructure
2.30 All ports, the railway system, and the national road network currently have excess capacitybecause of the decline in production in general, and in transit trade in particular. In ports, for example,more than three-quarters of the volume was previously in transit traffic. Unless this volume of transitcan be recaptured, the main question is not what to expand, but what to scale down, an issue that the portmaster plan is addressing. Competition for transit trade from neighboring countries is expected toincrease. This puts a premium on improvements in the operation and services not only of the ports, butalso of the entire multimodal system (roads, railways, and ports), particularly the links to Russia.
2.31 Rehabilitation and better organization and management of the transport system are expectedto produce high payoffs. The railways, which operate a network of approximately 2,400 kilometers,replaced only 40 kilometers of track in 1992, which at this pace implies a sixty-year replacement cycle.The rolling stock suffers from a lack of spare part and maintenance, and some terminals and buildingsneed refurbishment and preventive maintenance. Right-of-way and track deterioration are expected toincrease rapidly. The Riga port aeso suffcrs from maintenance deficiencies. Expenditures on itsrehabilitation (US$ 175,000 in 1993) are judged inadequate given the age of the facilities. Maintenanceallocations in 1992 and 1993 for the national road network amounted to Ls 5.8 and Ls 4.5 million,respectively, which amounted to only 10 to 15 percent of the amounts needed to meet the maintenancestandards of the former Soviet Union.
2.32 While inadequate maintenance of the road network, for example, may be temporarilytolerable, the moment is fast approaching where large rehabilitation investments will become inevitable.The National Road Administration is preparing projects to bring down the cost of the crucial wintermaintenance requirements, and to address rehabilitation needs in the most seriously deteriorated roadsegments. Allocations for maintenance, repair, and construction of state roads are also expected to beincreased substantially in 1994. This will alleviate, but not solve, the problems in the state network ofabout 20,600 kilometers. Nothing similar appears to be planned for the large portion of the roadinfrastructure for which local governments are responsible (about 38,500 kilometers). In view of the needfor better maintenance of existing facilities, the pavement rehabilitation projects, the data bank projectfor road maintenance, and the new technology for winter road maintenance are considered high priorityprojects for this sector. Of the three planned investment projects, related to the Via Baltica, completionof the Jelgava bypass is considered a high priority. Given Latvia's somewhat unfavorable road safetyrecord, investments in road safety must also be considered a priority.5
2.33 Investment in railway and ports beyond basic maintenance and rehabilitation should receivemedium to low priority. These include projects for provision of equipment for passenger trains and newpassenger and freight cars, construction of tracks and stations, and extension of a container terminal inRiga port. However, the maritime navigation emergency project and satellite reference station projectare considered to be of high priority in this subsector. Many of the port projects, such as oil storagefacilities and construction of ferries and general cargo terminals, that the government is considering couldbe undertaken by the private sector.
2.34 In aviation, a beginning is being made in addressing priority requirements with the impendingstart of work on the rehabilitation and upgrading of Riga airport. Other high priority projects in this areainclude the rehabilitation and extension of the runway, installation of a new lighting and power supply,and upgrading of the air traffic control equipment. The government should also decide which of thecountry's other twenty airfields should be maintained in operational condition.
An expert group is working on road signs and safety standards and is expected to submit its report by mid-1994.A cost estimate will be developed subsequendy.
- 43 -
2.35 Fisheries are still part of the Ministry of Transport. They are a special case in that maritimefisheries and related port and processing facilities are overdimensioned in light of the decline in theresource they were designed to exploit. Downsizing of these facilities should be seriously considered andprivate sector involvement in this area strongly encouraged.
Energy
2.36 Top priority should be attached to investments in conserving energy; rehabilitating existinginfrastructure; and boosting the use of domestic primary energy resources, mnainly hydropower, peat, andwood. Natural gas (imported from Russia) accounts for 60 percent of Latvia's total energy needs, whileelectricity (imported from Estonia and Lithuania) accounts for 30 percent and domestic sources accountfor the rest. The economy is highly energy-intensive, not because Latvia has energy-intensive activities,but because the economy wastes energy.
2.37 The production and delivery of heat and hot water deserves special attention. Energyconsumption for these purposes is two to three times as high in Latvia as in comparable marketeconomies. This is a reflection of the inadequate design, operation, and maintenance of these systems.Estimates put the energy savings that could result from modest investments at some 30 to 40 percent.Further improvements would require costly investments in renovation. Investment priorities shouldtherefore focus on a number of projects to improve efficiency, particularly in the district heating network,the combined heat and power plant, and the municipality-owned boilers. In this regard, the four projectsplanned for dirca heating are considered to be of high priority. These projects are for improving theboilers, converting boilers to local fuel, and rehabilitating the heating system in and around Riga. Asfor natural gas, projects to install gas meters for domestic consumers are considered to be of highpriority.
2.38 Successful energy conservation will help postpone the time when a large investment may haveto be made to increase domestic power generation capacity. Latvia is a net importer of electrical power,mostly from Estonia. This power is currently so much cheaper than domestically produced electricity,probably as low as half the costs of domestic thermal power production, that Latvia should take fulladvantage of this source. While doing so, Latvia has reduced the utilization of domestic plants well belowtheir capacity. In general, the capacity of various energy supply systems is sufficient to meet foreseeabledemand, which even under optimistic demand growth assumptions will not reach 1990 levels until theyear 2000, particularly if energy conservation efforts succeed.
2.39 This provides enough breathing space to consider fully all possible alternatives for eventuallyincreasing generating capacity, including the expansion of power plants which is considered of lowpriority at present. For the immediate future, projects that are considered to be of high priority includerehabilitating the hydropower station and overhauling electrical substations, with an emphasis onmodifying technology to modernize spare parts for all substations. In the long term, the possibility ofjoint operation with neighboring countries and the exploitation of Latvia's substantial geothermal potentialshould be considered.
- 44 -
2.40 Measures are also needed to improve the economic and financial viability of investments inhydropower plants. Current power prices in Latvia are only based on operational costs, without adequateallowances for rehabilitation or new investment. As a result, Latvenergo does not have internal resourcesto undertake investment or to start the rehabilitation of the hydropower plants that has been on hold sinceindependence.6
Agli
2.41 A thorough review of the investment program in agriculture is needed. In general, activitiesin this sector should be left to private initiative. The government should limit its own involvement tothose key investment projects that are nearing completion, with the intention of privatizing them as soonas possible. The blanket coverage of farms with the type of investment carried out under the farmsteaddevelopment program has little economic justification. Farmers should initiate and finance landimprovement, and the relevant utlities should provide eleical connections and telephones. Rural roadsshould only be constructed if their cost and benefit calculations show favorable results and localgovernments can ensure their maintenance.
e-he Social Sectors
2.42 Some public investment will continue to be required in the social sectors (education andhealth) in the immediate future, although investments for expanding facilities are not a priority. Atpresent the existing facilities are generally adequate to meet the population's needs, and in some casesmay even be oversized. Total population, which is the main determinant of the size of required facilities,is growing slowly.
2.43 The education investment program is concentrated on nine projects to complete and renovateschool buildings. The government also provides grants to local governments for restoring schoolbuildings.
2.44 The majority (about 70 percent) of capital investment in health is concentrated on outpatientinstitutions. Priority projects include improving outpatient facilities and repairing new hospitals.ilowever, public investment requirements will be more clearly identified during the course of the worknow under way in the Ministry of Welfare for long-term reform of the health system. The private sectoris not yet active in health care. However, the new system introduced in 1993 and practiced at the locallevel includes several features (such as adjusting the price of health services, or permitting patients tochoose a health provider) that have the potential of stimulating private practice.
Municipal Servies and Housing
2.45 Health concerns require giving top priority to a safe water supply. Therefore, the one areawhere new investment should be considered is that of safe water supply and waste disposal. Currently,both the release of untreated sewage into water bodies and possible leakage from waste dumps into thegroundwater table produce serious health hazards. Major areas of large cities are not connected totreatment facilities. In Riga, for instance, about 45 percent of water comes from surface water, includingthe Daugava River, which is highly polluted from raw sewage dumped in it upstream. The main Rigasewage treatment plant has limited design capacity and the city frequently suffers from shortages of water
6 In anticipation of these and other reforms the government, with the assistance of external agencies, has strted aaumber of energy studies, including a master plan. The energy masr plan focuses on the power subsector andprovides - for investment. However, this plan suffers from a number of deficiencies that areelaborated on in Chapter 3.
- 45 -
purification chemicals. The installation and improvement of sewage treatment plants as well as thedevelopment of safe solid waste disposal must thus be considered of high priority in this sector. Moredtan half the local governments' requests for state special purpose grants in 1994 concern water supplyand sewage projects. Only a few of the projects in this category have received financing.
2.46 Urban transport systems are another area where investments in rehabilitation are a priority.Without investment for improvements in maintenance and spare parts dilapidated fleets are in danger offurther decline or collapse. The situation is particularly critical in Riga.
2.47 What is needed in the housing sector is limited public investment in repairs and maintenanceuntil the public housing units are privatized and the government's involvement is phased out. This shouldbe combined with developing a short-term strategy for housing the poor and others that need assistancethrough social safety net programs. The government should also develop a strategy for retrofitting thepublic housing stock in the important area of heat efficiency and should test technical solutions throughpilot projects. The government could also help establish a housing finance system that would facilitatethe renovation of privatized units as well as the construction of new ones.
Elements of a Public Investment Program
2.48 In the absence of a detailed public investment program in Latvia, a preliminary attempt hasbeen made to rank investment programs and projects in some of the sectors (Table 2-5). This ranking,which is based on budget requests for 1994 and the analysis of different sectors done for this review, isprovisional and subject to modification and revision pending more in-depth analysis of the sectors.
2.49 In line with the investment priorities outlined in this section, projects for improving energyefficiency and repairing existing assets are given high priority. Figures 24 to 2-7 show the relativeamnounts and shares of these projects. The total of medium and high priority projects, excluding theongoing farmstead development program in the Ministry of Agriculture, is estimated at more than Ls 530million. These include seven agriculture projects, thirteen energy projects, twenty-two transport projects,seven water supply and sewage projects, twelve education projects, and seven health projects.7 If allnonhydropower generation projects (at an estimated cost of Ls 400 million), the farmstead developmentprogram, and other low priority projects were added in, the total would exceed Ls 1.2 billion. This againis an underestimate as it excludes the backlog of uncompleted projects that are no longer included inbudget requests.
2.50 Chapter 3 provides further information on the high and medium priority projects, and alsoshows projects currently judged to be of low priority. The disbursement profiles for the projects listedin Table 2-5 are not known and neither is their state of readiness for financing. Thus establishing howmuch of this total might actually be implemented during 1995-97 and how this compares with theavailability of investment resources during this period is not possible. What is clear is that most of theprojects will require foreign financing. Moreover, while a significant part of the total is in the form ofdirect public investment, certain amounts may require a government guarantee or may attract privatefinancing.
Numbers include only projects for which cost estimates are available.
- 46 -
Table 2-5. High and Medim Phio.My lnvesaxut Projecis in the Medium Tem
Sector and Project Ranking Est. Coat (LA m1llions)
TransportAviaionRiga runway rehabilitation and extensions H 5.1Rigp airfield lights and power supply H 2.1Air traffic control equipment H 21.0
Subtotal Aviation 28.2
ReadsPavement rehabilitation H 6.0Asphalt-concrete resurfacing of primary road near Ziupe H 0.5New technologies for winter road mainenance H 1.7Road data bank implementation H 0.5Repair bridges and roads (Riga-Liepaja) H 3.2Three Via Baltica projects M 12.0
Subtotal Roads 23.9
Jbi98Completion of Kundzinsala container terminal Rigp Port, Phase I H 0.3Completion of Kundzinsala continer terninal Riga Pon, Phase 11 M 2.4Completion of Riga-Sigulda electrification M 2.4Purchase of 200 freight cars M 2.0
Subtotal Railways 7.1
Ma. ibue projectsNavigation spare parts H 0.2Training port personnel H 3.0Riga commercial port, various projects M 53.7Traffic regulation system in Liepaja Port M 2.0Traffic reguladton system in Riga Port M 3.0Breakwater and port entrance . M 6.0SateDite reference station M 0.3
Subtotal Maritime projects 68.2
Totlo Transport 1274
EnergyDislict Heat (DB)Boiler improvement program H 30.0Boiler conversion to local fuels H 60.0Rehabiliation of Rigp DH H 72.0Rehabilitation of DH systems outside Riga Phase I H 72.0ReBhabilitation of DH systems outside Riga Pbase n M 72.0
Subtol District Heat 306.0
keeibc PowerRehabilitation of transmission substations H 12.0Urgent maintenance of Riga TEC-1 H 3.0Rehabilitation of cascades hydropower system H 30.0
Subtotal Electric Power 45.0
Nal GasBorder gas meering statons (Russia) H 1.8Intllaton of gas meters for households H 21.0Reconuction of metering staion at Inculkans udround stoage H 1.2Instlaion of telemechanical and control ems at nculkans M 2.5Instlation of gas meters for nonhousehold conmers M 2.4
Subtotal Natual Gas 28.9
Total Eneq 379.9
.47-
Tabk 2-S. (Conmbaed)
Sector and Project Ranking Est. Cost (Ls mittions)
Land reclamation H 5.0fasuctu repair/rn:ovation of Agricual secnay Schools H 1.3
Agricutural University:Sewerage network constuction H 0.1Completion of Faculty of Co nsction faciies M 0.1
Comnal land reclamation: cost sbaring M 1.0Conservation/closing down of eduational fates M 1.3Research facilities M 1.5
Toal Arulte 10.1
Fducatione
lahia University: repair main building and teacber training H 3.0Construction, restration, ad compledon of ten schools H 3.9
Total Educatin 6.9
Beal
Repair children's outatent clinic in Imantas H 0.8Repair infamt home in alknmes H 0.2Reconstuction of central hospital in Madona H 1.0Repair outpatient clinic in Bakdn H 0.1Isll water ckanig facility at hospital for alcoholics H 0.3Repair tuberculosis hospial in Ceplisi H 0.2Repair rural health care center in Masalaca M 0.1
Total Health 2.7
Water Supply and Sewage
Daugavpils: construon works at water and sewage site at Zinnei H 2.2Liepaja: extension of mehnical/biogical sewage tatment flty H 5.6Jurmala: sewage pipeline to Riga H 1.5Dobele wastewater H 0.1Lukums wastewater H 0.1Valmira wasewaer H 0.1VaLkas: maion sewer pipeline, pumping sation
and water treatment facity at Stecos H 1.5
Total Water Supply and Sewage 11.0
Total of all Sectors S37.8
H High priorityM Medium proriym
Nve: Some sectors and/or projects have not been iled in table either because the co estmtes were not available orbecause high and medium prioriy projects have not been Idented in the sector. 1stmated cost figures may differ from thosein Chapter 3 because of rounding.
a For detaled project informaon see Chapter 3.
Source: Ltvn audorities and staff estinms.
-48 -
Figure 2-4. Shares of Projects by Priority(percent of total)
46
Mcdiun17
Source: Luvian Aurios and stmffesrmas.
Figure 2-5. Medium and High Priorty Public Investment(percent of total)
Healdi 0.5 rt23.7Wate sod Sewerae
.' S~~~~~~~~~~~~.
1.3
Source: _atvian _uthoddw and staff cadms..9
Ettes3 70.6 __ I
iSouse: Lavandhorites md sff esdomm.
- 49 -
Figure 2-6. Shares of Energy Priorities by Sector(percent)
ENERGY
TRANSPORT
Medium 57
WATER and SEWER
Hiugehi gui s t
LowS]L,_
$ource: Latvin authorities and staff esdnnws.~~~~~~~~~~~~~
D. Financing of Public Investment and Availability of Resources
2.51 The financial resources available for public investment are estimated at a total of Ls220 million (about US$ 370 million), or 3 percent of GDP for 1995-97 (see Table 2-6 below and Chapter1 for details of assumptions and discussion). This resource envelope is the framework within which thepublic investment program could take place in line with sustained macroeconomic stability and thecountry's creditworthiness. It therefore consists of all domestic and external resources, includingpotential borrowing from the domestic financial market and from international institutions, bilateraldonors, and commercial sources. The projected resource envelope is consistent with the increase inpublic investnent from less than 1 percent of GDP cunrently to 3 percent of GDP in 1995 and thereafter.Investments financed from enterprises' and municipalities' own resources are not included in theseestimates, but are included in the overall level of investment, which is projected to support a sustainablegrowth rate of 4 to 5 percent in the medium term.
2.52 The total cost of projects identified as being of high and medium priority in Table 2-5 is morethan Ls 530 million (about US$ 900 million), which is well above the amount projected in the resourceenvelope. These cost estimates, however, are not stricdy comparable with the available resourcesmentioned above. For instance, the resource envelope is based on constant 1994 prices, whereas mostof the cost estimates are based on different price assumptions. In addition, how much of the time phasingof cost estimates goes beyond 1995-97 is not clear. Regardless of their exact magnitude, however, costsare likely to remain higher than the available resources. Closing the large gap between investment needsand available resources requires limiting resources to a narrow range of priority projects. This involvesa delicate and time-consuming process during which projects are evaluated and prioritized. Some projectsmight have to be eliminated while others were postponed or scaled down to match the likely availabilityof resources. This could best be done in the context of a well-established public investment program, theelements of which are outlined in Chapter 4. Such a program should begin with up-to-date and correctestimates of projects' costs and time phasing. It should also take projects' economic and financial viabilityinto consideration as well as the government's reduced role in the production and distribution process.
Table 2-6 Public Invesatent and Avakle Resomrces, 1995-97
2.53 The projected resource envelope implicitly assumes that the financial markets will continueto develop and that enterprises' and the private sector's long-term investment needs will be either self-financed or financed through private financial intermediaries. So far, the government has been providingmost of these resources through direct lending or on-lending through the banking system. Therefore, theelimination of direct financial investment by the government is anticipated. In 1994, however, it isassumed that part of this private investment would be financed through on-lending by the governmentfrom foreign loans. If the financial markets fail to develop and the government continues to providefinancial investment to enterprises, then it would need to borrow more for direct public investment.
2.54 Latvia's ability to obtain additional foreign funding for valid projects should not be aconstraint for the time being, given its progress in policy reforms and its low level of debt. So far,foreign funds for investments have been used only for the reconstruction of the National Opera. Thatpicture will change in 1994: the foreign-financed modernization and upgrading of the Riga airport willbegin and an EBRD energy emergency loan of about US$ 36.7 million will be disbursed. Disbursementsare also expected from a recently approved World Bank agriculture project for a total of US$ 25 millionand for an EBRD loan in the transport sector. However, foreign financing is available only forexpenditures in foreign exchange and requires complementary domestic resources for expenditures in localcurrency. In the absence of a contingency allocation for these purposes in the budget, the governmentmay have to enact supplementary budgets as foreign-financed projects are approved. A shortage ofdomestic resources could hamper the renewed growth of public iuvestment and could have the undesirableconsequence of biasing project selection toward those with the highest foreign exchange content.
2.55 Extrabudgetary funds could also provide potential sources of funding for public investment,the largest of which would be the proceeds of privatization. However, assuming a large amount fromthis source is not sensible given the deteriorating condition of enterprises and their assets. Revenues willalso accrue to the State Property Fund. Its revenues, which will consist of dividends and fees paid bythe enterprises under its jurisdiction, now accrue to the budget. In the 1994 budget such receipts areexpected to finance about Ls 3.7 to Ls 3.8 million of the reconstruction of the National Opera and RigaCastle. Nevertheless, experience of the other countries indicates that extrabudgetary funds could lead toexcessive fragmentation and a lack of transparency in the budget. Therefore, the number of these fundsshould be minimized as they tend to weaken the ability of the government to use fiscal policy effectivelyand to exercise budgetary controls.
Resource Needs of Public Enterprises
2.56 The government plans to set up the enterprises that remain in public hands as independentlymanaged companies with their own sources of financing.8 Most of these enterprises are anticipated toencounter problems in generating funds for their needed investments. The most serious problem is theprovision for adequate depreciation allowances, which are not yet part of standard accounting practices.
8 A commission has been assigned to draw up a list of these enterprises that will remain in the public domain for thetime being. These include the railways, the postal service, and the energy companies (Latvenergo, Latvias Gaze, andLatvias Nafta). Lattelekom is not included in this list, even though telecommunications inw/estments are frequently largeusers of public funds, and this is one infrastructure area where modernization and expansion are urgently needed. Thegovernment has, however, decided to approve a joint venture with a foreign partner, who will obtain a 49 percentequity share in Lattelekom, and will in turn finance modernization and expansion costing approximately US$ 600million over ten years. The partner will manage the system under contractual perfbrmance criteria, and no governmentfinance or loan guarantees will be needed.
- 53 -
This problem obscures the level of tariffs at which cost recovery occurs and would affect enterprises'ability to generate sufficient funds for replacing of equipment or for carrying out rehabilitation andexpansion activities.
2.57 The problemn is aggravated by the recent decision that Latvenergo, Latvias Gaze (except forits gas storage operations), and the Riga district heating system should operate on a cost recovery ornonprofit basis. Economnically correct power pricing requires setting tariffs at long-run marginal cost.Moreover, the cost calculations must include correct allowances for maintenance and for replacementinvestnents, for a return on capital invested, and for debt service payments for any necessaryrehabilitation or expansion. Latvenergo's ability to raise investment funds is also affected by an arrearsproblem in its district heating operations. Latvenergo produces heat that it sells to the municipalities,which are now responsible for the distribution systems and for revenue collection. These collectioncharges have fallen short by 30 to 40 percent because the municipalities have charged the final customersat prices below cost and have accumulated substantial arrears to Latvenergo.
2.58 Railway enterprises suffer from a separate problem. Nearly one-third of the population travelfree or at substantially reduced fares on the railways and on urban transport facilities. These revenuelosses9 damage the ability of railway enterprises to maintain their equipment adequately and self-financeits replacement. To avoid this situation, the fare discounts should be eliminated or the enterprises shouldreceive compensation. The present situation also precludes any chance of privatization. Even if therailways will not be privatized, they should be induced to commercialize their operations. Moreover, anycross-subsidization of passenger fares by freight charges should be avoided so as not to damage therailway's competitiveness in the important transit trade.
Resource Needs of Local Governments
2.59 Local governments' activities are affected by the same problems as those of the state utilityenterprises: inadequate maintenance, inadequate accounting for depreciation, inadequate cost recovery,and insufficient generation of investment funds. Moreover, as discussed in Chapter 1, a significanttransfer of responsibilities to local govermnents has taken place for which they were not fully prepared.Local governments are now responsible not only for public utilities, such as most public urban transport,water supply, liquid and solid waste collection and disposal, and district heating systems, but also forroads, housing, and most aspects of health and education provision.
2.60 This transfer took place in parallel with some increase in local governmens' resource base.However, this was done without assessing the minimum resources that the local governments would needto discharge their responsibilities efficiently. Moreover, no assessment was made of the localgovernments' ability to maintain and operate these assets and to ensure replacement, and possiblyinvestments for expansion. As part of their resources, local governments would receive 80 percent ofthe proceeds from housing privatization, with 20 percent going to the state budget. So far, housingprivatization has essentially consisted of leasing. The current legislation does not allow the privatizationof apartnent buildings owned by the state and municipalities built after World War II. Therefore,housing sales are not expected to make a significant contribution to local governments' resources for sometime to come.
9 The Ministry of Transport estimates that revenue losses suffered by urban transport enterprises, which are undersimilar social obligations as the railways, are Ls 3 million.
- 54 -
E. Major Issues in Public Investment and Recommendations
2.61 In developing the public investment program over the medium term a number of issues needto be resolved in the interest of a focused and efficient program. The preceding sections have touchedon some of these, and Chapter 3 addresses other, more specific, sectoral problems and suggestions.Chapter 4 looks more closely at the public investment management process and the institutional set-upfor developing a public investment program.
2.62 Adequate maintenance is the major problem for public investment in Latvia at present.Neglect of proper maintenance will lead to increased investment needs to rehabilitate deteriorated assets.The rehabilitation requirements of Latvia's otherwise .'-' uate infrastructure are already large. They willrise rapidly unless the maintenance effort is strengt a substantially and is given priority over newinvestments.
2.63 As for the construction of buildings and purchase of equipment, their recurrent costexpenditures need to be identified and integrated into the budget so that these public assets can beoperated and maintained efficiently and the expected social and economic benefits of the investments arefully realized. The government has taken the correct decision that the operation and maintenanceexpenditures for all investment projects financed from the state budget must be clearly shown. Such anobligation should also be extended to projects that local governments finance from their own funds.
2.64 Adequate allowances for depreciation of assets is another issue that is closely linked tomaintenance. Present accounting practices do not make adequate provision for replacing assets. Thisinhibits correct cost calculations and reduces the generation of investment funds for asset replacement.This is especially problematic in areas in which technology is developing rapidly, where technologicalobsolescence may occur long before the physical lifetime of assets comes to an end. A specific trainingeffort should be undertaken to introduce appropriate accounting practices across the country.
2.65 Cost-benfit and cost-efficiency analysis should also be applied universally throughout theeconomy. At present, such analysis is confined essentially to projects that are being prepared for foreignfinancing, but should spread to all large projects financed from the state and local budgets. Technicalassistance will have to be obtained to implement the necessary training program. The recommendationmade in section B that all projects that have not received any budgetary financing since 1992 must beresubmitted with acceptable cost calculations and benefit analyses could provide important on-the-jobtraining in such analysis. An appropriate training program could be implemented early enough to produceits first results in the preparation of the 1995 budget.
2.66 Local authorities already play an important role in public expenditure in general, and in thepublic investment program in particular, and their weight may increase further. However, their exactroles need to be defined and better related to their resource base. The Ministry of Finance plans toreview the sharing of functions between the state and local governments, as well as the minimumresources the local governments must have to discharge their responsibilites. This is only part, albeitan important part, of the systematic review of central and local interacions that seems necessary. Overtime local govermnents will need help not only to establish adequate project appraisal procedures (asmentioned above), but also to identify and implement better cost recovery procedures for the services theyperform, that is, to formulate their tariff policies and collection systems for user charges. Section C has
- 55 -
noted some of the present shortcomings in these areas. A more meaningful and up-to-date reportingsystem on local governments' investment activities and performance is also important.
2.67 A public investment program cannot be properly formulated in the absence of a clear viewof its objectives. Therefore, the development and adoption of a coherent set of sectoral strategies shouldbe given top priority. This will provide an opportunity to address the three key issues for the publicinvestment program: the scope and pace of privatization, the scope of joint activities between Latvia andits neighbors, and the resolution of the ownership of public assets at different levels of government.
2.68 Concerning privatization, the government has already eliminated budgetary finance forinvestment in the more obvious cases for privatization, such as manufacturing and commercial activitiesand housing. However, other activities that the investment budget still supports could be candidates forprivatization. These include, for example, on-farm investments in land improvements, agriculturalmachinery and agricultural processing enterprises, port superstructure, and some of the services providedat the municipal level. Contracting out the management of such services could also be attractive optionsfor encouraging private initiative and reducing the commitment of public funds. Speeding up theprivatization of existing housing through sales could also provide additional resources for publicinvestment.
2.69 Joint investments or,joint exploitation of existing faclities with the other Baltic states couldsignificantly reduce public investment requirements. The potential for such joint activities exists in anuber of areas, and proposals to this effect exist in such diverse areas as establishing a Baltic air trafficcontrol system and forming equipment pools for heavy road and rail mainenance, ice breaking, and portdredging. The potential for saving public resources through interstate cooperation is substantial.
2.70 Conflicting claims to ownership by local governments and the state need to be resolved asthey have resulted in the suspension of investments in some sectors like the Riga heating system or themodernization of the Riga port. Some investments in the transport sector have also been suspended, oreven paralyzed, by uncertainty over ownership. Resolution of this problem is urgent.
- 56 -
Chapter 3. Sectoral Expenditure Issues
A. Introduction
3.1 Transition to a market economy requires a dramatic shift in the structure of publicexpenditures and a gradual phasing out of public sector activities from the areas that the private sectorcan either carry out fully or participate in at a significant level. As discussed in Chapter 1, the publicexpenditure program should concentrate on critical areas of public goods provision. The analysis ofsectoral expenditure policies in this chapter is in line with such a devolution. The strategy for publicinvestment and the areas of concentration are discussed in Chapter 2. The investment program in eachsector is discussed below. The two together would help identify important projects for inclusion in thepublic investment programn, elemnents of which are discussed in Chapter 4.
B. Transport
3.2 Latvia inherited from the former Soviet Union a developed transport system in all subsectors:maritime, railways, roads, and aviation. The transport transit industry is centered around three largeports: Riga, Ventspils, and to a lesser extent, Liepaja. For dry cargo the ports are served largely by anextensive railway network that is connected to the railways of the former Soviet Union. Ventspils, whichis the largest port for oil exports in the Baltic Sea, with an estimated capacity 38 million tons per year,is connected to Russia by two pipelines, one for crude oil and the other for heavy fuel oil. The roadnetwork is also developed and includes approximately 1,800 kilometers of 'main roads."
3.3 While some structural changes in this sector have started, the system as a whole has not yetresolved some basic issues concerning the laws ani regulations that define lines of responsibility,authority, and accountability in the management of the transport system and its enterprises. For example,the Port of Riga still suffers from an ambiguous legal framework and ownership rights. As a result,development activities are postponed, while competitors in other Baltic ports are taking advantage of newbusiness opportunities and increasing their market share.
3.4 The responsibility for providing and financing urban public transport has been shifted to thelocal governments, while intercity rail remains a state responsibility. However, Latvia has not yetestablished a mechanism to provide appropriate revenue sources for the urban transport systems. Urbanpublic transport and intercity rail passenger services are heavily subsidized. Rail passenger fares areestimated to cover only 50 percent of operating costs, and the rest is covered by cross-subsidies from railfreight services.
3.5 In the 1994 budget, about 43 percent of the budget of the Ministry of Transport andCommunications (MOTC) is allocated to road maintenance and rehabilitation. The government is in theprocess of discussing with the European Bank for Reconstruction and Development (EBRD) a US$ 10million loan for rehabilitation of 185 kilometers of pavement (which might be increased to300 kilometers). The only other major public investments planned for 1994 are the rehabilitation of therunway and lighting at Riga airport. Other relatively large items in the MOTC's budget are Ls 1.0million for a new building for the meteorological services, and approximately Ls 0.5 million for thepurchase of hydrographic equipment from the departing Russian Navy. Table 3-1 presents the priorityranking of the proposed investments.
- 57 -
Major Issues
3.6 Immediate Needs. The maintenance and rehabilitation of existing infrastructure to avoid muchlarger investments in the future are the immediate needs in the transport sector.
3.7 Freight Transit Industry. Beyond the immediate maintenance and rehabilitation needs, thepriority for public investment should be the freight transit industry (ports and the supporting railways androads) as it creates employment opportunities and generates foreign exchange. The development of airtransport (airport and navigation equipment) is also a priority and a prerequisite for establishing a modeminternational commerce industry.
3.8 Ports. The seaports are the focal points of the transit industry in Latvia: more than90 percent of traffic through Latvian ports is in transit. However, the existence of three major portswithin such a small country poses a challenge in terms of investment selection and the amounts that needto be invested in each port. The problem is compounded by Russia's continued use of Liepaja as amilitary port, and the government considers that rebuilding it as a civilian Latvian port is essential forpolitical reasons.
3.9 Railways. The second tier in the transit industry is the railways, where about 50 percent oftraffic is transit traffic. Hence, the next priority for investment is rail lines and equipment serving theports and the freight transit industry. However, investrnent should be contingent on the use of market-oriented costing and on operating the system on a commnercial basis.
3.10 Passenger Transport. Both the urban and intercity systems are in dire need of rehabilitationor new equipment. However, investment in urban transport is of higher priority for several reasons.Latvia is largely (about 70 percent) urban, with a high dependence on public transport: more than80 percent of all trips in urban areas are by public transport (light rail, buses, and trolley buses). Incontrast, only a small fraction of the population uses intercity transport, which is mainly by rail.Moreover, freight services cross-subsidize about 50 percent of the costs of rail passenger service. Theresponsibility for providing urban passenger services has been transferred to the local governments.However, an appropriate arrangement should be made to finance urban transport adequately.
3.11 Roads. Road traffic is expected to increase in the near future. The major proposedinvestment is in the Via Baltica, which connects Helsinki with Warsaw via the Baltic republics. Theproject is sound; however, investment should be handled with caution as at present major bottlenecks arenot physical, but in border crossings.
Inve_tment Program
Avkiaon
3.12 Riga airport has a 2.5 kilometer runway that can accommodate aircraft up to 180 tons.However, its Category I status can be retained only if the runway is resurfaced. The rehabilitation planalso calls for installing new lighting and a new power supply. The EBRD is proposing to finance thishigh priority project (US$ 8.5 million for the runway and US$ 3.5 million for the lighting), which isexpected to be implemented in 1994-95. The terminal buildings are in poor conditicn and will requiremajor rehabilitation or replacement within the next five years. Meanwhile, the buildings are operationaland are being renovated from internal funds.
- 58 -
3.13 Investment plans for the Latvian Civil Aviation Authority are based on a series of studies bya subsidiary of the Swedish Civil Aviation Authority. These studies projected an annual growth of 4 to5 percent in traffic over Latvian airspace because of Western airlines' requirements for more direct routesover the Baltic Sea. The radar at Riga air traffic control center is more than ten years old and needsreplacemnent. The estimated cost of purchasing primary and secondary radar equipment is approximatelyUS$ 24 million. Other instruments, communication systems, and buildings are estimated to cost up toanother US $10 million. Replacement equipment includes a VOR/DME beacon in Liepaja and anotherin east Latvia (one beacon is already operatihg at Riga airport).
Roads
3.14 The Latvian road system consists of 1,800 kilometers of fully paved primary roads, 8,000kilometers of first-class roads (5,000 to 6,000 kilometers paved), and about 12,000 kilometers of second-class rural roads (gravel and crushed stone). Normal maintenance of state roads (every five to eightyears) requires about Ls 40 to Ls 45 million per year. Rural roads, which were maintained by ruralcooperatives during the Soviet period, and municipal roads, which are not funded by the MOTC, eachrequire about Ls 7 to Ls 8 million a year. Latvia expects to receive a US$ 10 million loan from theEBRD in early 1994 for a high priority project to rehabilitate pavement along 185 kilometers of primaryroads.
3.15 The largest proposed road investment project in the future is the Via Baltica, a north-southroad connecting Finland, the three Baltic states, Poland, and Central and Westem Europe. Within Latviathe main route of the Via Baltica runs from Ainazi on the border with Estonia, via Riga and Bauska toPanevezys in Lithuania, and a western branch runs via Jelgava to Kaliningrad. The total length of roaddesignated as the Via Baltica in Latvia is approximately 200 kilometers.
3.16 Future investment plans for the Latvian portion of the Via Baltica include
* A ma.ter plan for road signs plus the production of signs for the Via Baltica at an estimatedcost of about US$ 4 to US$ 5 million during 1994-96.
* Completion of the Jelgava bypass during 1994-96. This bypass, which was started duringthe Soviet era, is about 30 percent complete and is part of the Via Baltica's western branchto Kaliningrad.
* Road and bridge rehabilitation in 1995-96 at a cost of about US$ 10 million.
3.17 Other road investments plans include
* Resurfacing of a section of road near Zilupe, the Russian border crossing, at a cost of US$0.8 million million in 1994. This is a high priority project for the road transit industry.
* Introducing new technologies for winter road maintenance at a cost of US$ 1.1 million in1995-96. The road organization received several used spreaders as a gift from the Dutchgovernment and used them to shift from using salt and sand to using liquid salt technologyfor de-icing roads, which reduced the cost of fuel for spreaders to a tenth of its former level.Currently it has a tender for additional equipment. This is a high priority item given theseverity of the winter and the large potential for saving fuel.
- 59 -
* Developing a data bank for monitoring roads and for applying financial analysis at a cost ofUS$ 0.8 million in 1995-96.
* Realigning about 20 kilometers of the Saulkrasti-Riga road in an environmentally sensitivetourist area at a cost of approximately US$ 22 million. This investment does not seemurgent at this time.
Railways
3.18 Latvian Railways (LR) operates a network of approximately 2,400 kilometers, of which onlyabout 13 percent (near Riga) is a double track route and 1 percent is electrified (suburban links to Riga).In general, LR continues to operate under the statutes inherited from the Soviet era, as do railways inother neighboring countries. The major operational problems LR faces include lack of autonomy for LRmanagement, outdated costing and accounting procedures, and cross-subsidization of passenger transportby freight services.
3.19 LR has prepared a tentative list of several investment projects that are not supported by anyanalyses or studies. Although some may have economic merit, they should not be considered forf ancing before rigorous economic and financial analysis has been carried out. The proposed projectsare
* Purchasing two electric trains and one diesel train and repairing twelve electric trains forpassenger service (US$ 8.8 million). Some of the electric trains are expected to be used onthe electrified Riga-Sigulda line. LR has forty-seven electric trains, more than one-third ofwhich are obsolete. Purchasing passenger trains may be unnecessary at this stage for tworeasons. First, rail passenger services are operating at a loss and have shown a continuousdecline in patronage. Second, the equipment could be rehabilitated at a lower cost.
e Purchasing twenty-five new passenger cars (US$ 8.6 million). This investment may beunnecessary at this stage if existing equipment could be rehabilitated.
* Purchasing 200 freight cars (US$ 3.2 million). This purchase seems justified given thatthese are flat cars for containers that need to be used in conjunction with the containerterminal at Riga Port.
* Constructing and repairing tracks and stations on the Lugazi-Valka line near the Estonianborder (US$ 0.9 million).
* Completing rail access to the Kundzinsala container terminal at Riga Port, phase I (US$ 0.5million with total completion cost of about US$ 4 million).
* Completing electrification of the Riga-Sigulda line (US$ 4 million). About 20 kilometers ofthe 43 Iclometers line are already electrified. LR estmates that the project will save Ls 4million per year in energy costs, implying a one-year payback period.
* Making the Manali-Ziemelblaxma bridge link double-track (US$ 0.9 million).
* Laying a second track along the Alotene-Koknese line (US$ 1.7 million).
- 60 -
Ponts
3.20 Riga is Latvia's main commercial port. Ventspils is the largest oil port in the Baltic sea.Liepaja has just started to handle civilian cargo. Ventspils is the major Latvian port in terms of tonnagehandled. In 1992 Riga handled approximately 4.0 million tons, while Ventspils handled 17.5 milliontons, of which about 13.5 million tons were oil. Nevertheless, both ports operate well below capacity.At present Liepaja plays a relatively minor role as a civilian port, although it is an ice-free port and issignificantly closer to the West.
3.21 These ports are the hub of the transit industry and the investment program should focus onthem. However, at present the regulatory framework for the ports is incomplete. A consultant studyrecommends that urgent maintenance and rehabilitation be undertaken within the next five years, and thatlonger-term investment be realized during the years 2000 to 2015. In general, the study recommends thatonly essential rehabilitation of civil works be considered in the next five years, because of theoverabundance of equipment and port facilities to handle present traffic, which is significantly below1990-91 levels. According to this study, total rehabilitation costs for the three Latvian ports are estimatedat about US$ 32 million, excluding training. 1
3.22 An alternative investment strategy calls for new investment beyond essential rehabilitation,particularly in Riga. It foresees investment in all three ports, with private investment in Ventspils andLiepaja, and public investment in Riga. The total investment costs, which would be concaed in RigaPort, are estimated at between US$ 50 million and US$ 75 million. They include
• Rehabilitating breakwaters (US$ 15 to US$ 20 million). The breakwaters are about 100 yearsold and need rehabilitation to allow safe entrance to the port. About fifteen days per yearare lost because of bad weather.
* Installing a vessel tracking system. Riga has no vessel tracking system, and therefore noships are allowed to enter or leave the port at night. About thirty days per year are lostbecause of ships' inability to enter the port in misty weather.
3 Building a passenger terminal. Two berths are operated by a Latvian-Swedish joint ventureferry to Stockholm, Kiel, and Copenhagen.
* Building a container terminal, including rail access, road access, tracking system, gates, anda consolidation shed. The terminal handled 40,000 twenty foot equivalent units in 1992.Container cranes have a high down time, and there is no efficient tracking system. Railaccess is long as it passes through the entire port, and road access is also difficult. Stuffingof containers in the port is extensive, as most cargo arrives in bulk form. Constuction ofa consolidation shed for this purpose has started, but has not yet been completed.
1 The rehabilitation program includes (all in millions US$): 5.8 for Riga Commercial Port, 4.0 for Riga Fishing Pors.0.7 for Riga Voleri Port (river port), and 4.2 for the Riga Port Authority; 6.5 for Ventspils Commecial Port; ad 10.8for the Liepaja Port Authority.
-61 -
* Rehabilitating berths and storage areas.
* Rehabilitating buildings in the commnercial port.
3.23 On the whole, despite Latvia's well-developed transport system, rehabilitation andmaintenance are needed in all subsectors: aviation, roads, railways, and ports. Beyond this immxeiateneed, the priority for investment should be on the freight transit industry as it creates employmentopportunities and generates foreign exchange. The development of air transport is also a priority and aprerequisite for establishing a modem international commerce industry. The next priorities for investmentare rail lines and equipment serving the ports and the freight transit industry. However, such investmentshould be contingent on using market-oriented costing and on operating the system on a commercial basis.
3.24 As far as passenger transport is concerned, both the urban and intercity systems are in direneed of rehabilitation or new equipment. Investment in urban transport, however, is of higher prioritythan investment in intercity transport because of the high dependence of cities and their economies on theurban transport system. Investment in port infrastructure such as breakwaters, berths, and road and railaccess requires public financing, while the private sector should provide superstructure, for example,termials. The private sector should also be the main actor in the development of Liepaja as a civilianport. As far as Ventspils is concemed, it generates sufficient resources from its commercial operationsto finance its future investment needs.
-62-
Table 3-1. Public Invesaznat P*jcb hi hTA=40gLs milions)
AmountPiorty Tota Poject in
Project Rating Cost Estimate 1994 Budget
AviationRiga tunway rehaiatdon and extensions High 5.10 0.0Riga airfield lights and power supply High 2.10 0.0
Air traffic control equipment (1994-96) Higb 21.00 0.0
RoadsPavement rnabiaon (1994-95) High 6.00 0.89
Via Baltica: road sign system (199497) Medium 3.00 0.25
Via Baltica: Jelgava bypass (1994-96) Mediu 4b-Hih 3.00 0.61Via Baltica: addidonal road rehabilitaton (1994-96) Medium 6.00 0.0
Resurface pimay road near Zilupe High 0.50 0.50
New technologies for winter road mainnce (199-97) Hi8h 1.68 0.0
Road data bank (1995.96) Higb 0.48 0.0
Re-algnen of Saulitrs-Riga road Low 13.20 0.0
Repair bridges and wads Riga-Liepaja (Bnoc and Saunda) High 3.20 0.0
Purchserepair of passenger trins Low 5.52 0.0Purchabe 2 electric and I diesel truin Low n.a. 0.0
Repair 12 electric and I diesel ain Low-MedAim n.a. 0.0
Purchase 25 passeger cars Low 5.06 0.0
Purchase 200 freight cars Medium-High 2.00 0.0
Construct and repair track and stAon: LugAi-Valka Low 0.63 0.25
Complete Kundinsala coiner temidl High 0.30 0.0phase lPase Medium 2.40 0.0
Compete electfiai: RiSigulda Medium 2.40 0.0
Second track: Alotene-Kolmese LOW 1.11 0.0
Double tmrck brdge: MangaliLOelbl Low 0.57 0.0
ortTmin port personnel (1994-96) High 3.00 0.0
Riga commercial port (1994-97) Medium 53.70 0.0
Extend Kudainsala contair terminal Med-H4i n.a. 0.0Constuct pies for passengertermind Medium a. 0.0
Marime naviation emency prgramSpare parts to activate LaVian cilfties (1994- High 0.18 0.0
Instalt sellite refence station in Venaph Medum 0.30 0.0Breakwar and por trance Medium 6.0 0.0
Trafficrion systmin iepja port Medium 2.0 0.0Traffic regulaion systm in Riga port Medium 3.0 0.0
n.a. Not available.Soce: Ltvian authorides and staff estimtes.
-63 -
C. Energy
3.25 The energy sector comprises four main subsectors: electricity, district heating, natural gas,and oil products. The sector has been hit hard by the fiscal retrenchment of the last few years. Evenroutine maintenance has dropped to unprecedented low levels because of the financial difficulties ofenterprises in the sector. Periodic overhauls have been largely neglected and the inability to obtainSoviet-made spare parts has left the energy infrastructure in a state of disrepair, particularly in the districtheating subsector, where maintenance work is required on an amual basis.
3.26 Despite these difficulties, the government has taken a number of steps to restructure thesector to respond better to the needs of a market economy by decentralizing district heating services,privatizing the oil subsector, commercializing the electricity and natural gas monopolies, and phasing outdirect subsidies. The sector still suffers from: (a) a deficiency of primary energy resources, (b) rapidincreases in production costs, (c) rapid deterioration of infrastructure, (d) low efficiency of energyfacilities, and (e) institutional and organizational constraints and financially bankrupt enterprises.
Major Issues
3.27 The Latvian economy is extremely energy-intewsive. A cross-country comparison of energyconsumption indicates that L-tvia uses 35 percent more energy per dollar of GNP than comparablecountries at similar income levels. However, because of the overall drop in economic activity during thelast few years, the consumpdon of energy has declined considerably: (a) electricity consumption is nowat a level equivalent to 60 percent of the highest consumption registered in 1988, (b) natural gasconsumption is about 68 percent of peak consumpdon in 1991, and (c) district heating in the areassupplied by Latvenergo declined by 17 percent in 1993 compared to 1992. Overall energy consumpdon,estimated at 6.2 million tons of oil equivalent in 1992, dropped by almost one-third, from 9.0 milliontons of oil equivalent in 1990. The failure to adjust domestic energy prices to reflect increased importcosts fully, coupled with customer delinquency in payments, has left almost all enterprises in the sectortechnically bankrupt.
3.28 The government has taken a number of steps to restructure the sector. The oil subsector isbeing privatized. The electricity and natural gas monopolies (Latvenergo and Latvijas Gaze) are in theprocess of being restructured to operate on commercial principles. In addition, ownership of the districtheating system has been transferred to local governments. In preparation for the restructuring efforts,the Latvian government conmmissioned a number of energy sector studies with the assistance of externalagencies. The energy sector restructuring study and energy savings strategy study, both financed by theEC-PHARE program began the process of defining legal and regulatory frameworks for the energysector. Prefeasibility studies funded by the U.S. Trade and Development Administration have also beenprepared for Liepaja TEC, Riga TEC, and Andrejsala TEC. The Swedish Board for Investment andTechnical Support has also provided assistance for feasibility studies of the district heating and boilerconversion program, as has the Danish Energy Agency for a geothermal study.
3.29 An energy master plan, prepared with assistance from Vattenfall of Sweden and hnatronVoima Oy of Finland, has made recommendations for investments in the power subsector with only acursory treatment of the other subsectors. The master plan focuses primarily on how to create newelectricity generation capacity and fails to address comprehensively the more pressing need to increase
-64 -
the efficiency of district heating and reduce the cost of production, distribution, and end use. The masterplan suffers from a number of deficiencies, namely:
* It assesses specific projects on the assumption that some 80 to 85 percent of electricityconsumption should be met by domestic production, although this is not necessarily theeconomically optimal situation.
* It lacks a clearly articulated sectoral strategy and an overall framework for analysis, and doesnot deal with the inter-relationships among subsectors, such as district heating and electricitygeneration. As a result, improvements in energy efficiency, one of the highest priorities inthe sector, does not receive proper attention, while large investments in new electricitygeneration capacity are recommended.
* It does not assess the economic tradeoffs between producing electricity within Latvia o'importing it from neighboring countries.
Investment Progam
3.30 The drastic decrease in ptlic investment has had a ne.ative impact on the energy sectorbecause of the sector's extensive infrastructure networks. Investment in new facilities has not taken placesince independence, and even routine maintenance has dropped to unprecedented low levels because ofthe poor financial situation of the enterprises in this sector. The investment program in the energy sectortherefore needs to focus on the rehabilitation of existing infrastructure instead of on investment in newcapacity (Table 3-2). It should also concentrate on imnproving the efficiency of the existing facilities,especially in district heating, industry, and housing. The technology used for district heating results inpipe corrosion, which means that pipes have to be replaced every year. Since 1991 enterprises have nothad the financial resources to carry out such maintenance, resulting in water leakage and energy wastage.Organizational and price reforms are also needed to enhance the nanagement capabilities of the newenterprises and to put them on a sound financial fc-ting.
3.31 Specifically, investment priorities should be for the following kinds of rehabilitation andefficiency improvements:
* Reducing wastage aad loss within district heating networks by means of leakage abatementprograms, insulation improvements, and the installation of new substations.
* Adopting a phased approach to overhauling electrical substations, with an emphasis onmodifying technology to install modern spare parts. A least-cost approach would be to installthe most essential spares for all substations first rather than attempting a pilot project toconvert one substation fully to modern spare parts.
* Improving the efficiency of small to medium-size boilers, including conversion to local fuels,after the completion of the Swedish Board for Investment and Technical Support-financedenvironmental assessment study and the EC-PHARE-financed wood chips harvesting studies.
- 65 -
Installing meters at the points of heat production, the interface between transmission anddistribution systems, and the interface between distribution systems and end users in districtheating systems and for domestic users of natural gas.
3.32 The lack of a clear definition of the roles and responsibilities er the institutions within thesector, combined with the delay in establishing an appropriate regulatory framework, have contributedto declining financial discipline in this sector. Areas of high priority for institutional reformn and capacityenhancements include
* Forming an autonomous regulatory body vested with enough power to oversee the sector'sactivities, especially in such essential areas as tariff arbitration for district heating services,electricity, and natural gas.
* Pricing energy based on commercial principles and with an emphasis on the strucure andlevel of tariffs. Provisions for depreciation and interest charges, which are currently grosslyunderestimated, should be adjusted appropriately.
* Ensuring coordination and strategy formulation within the sector in such essential areas asinvestment planning, sector regulaton, and enterprise resucturing.
* Enacting a comprehensive energy law that emphasizes open access, especially as concernstransmission, storage, and transportation of energy products.
* Enhancing the technical and managerial capacity of the newly formed enterprises andinstitutions in the sector, especially in financial nmagement and control and economicanalysis.
3.33 In short, the investment program needs to focus on rehabilitating existing faciities.Improvements in energy conservation also deserve special attention. Energy networks have sufficientcapacity and can meet Latvia's demand for some time to come. Efforts are needed to improve theefficiency of district heating and electrical substations and reduce energy-intensity and waste.Organizational and price reforms are also needed to enhance the management capacity of energyenterprises and put them on a sound financial footing. Increasing the use of domestic energy resources,essentially hydropower, peat, and wood should also receive priority.
- 66-
Table 3-2. PubUl Invesbaent Projects hI EneryaL mins)
Priority Total Project Amount inProject Rating Cost Estimate 1994 Budget
Energy: Distria Heat (DR)
Boiler improvement program High 30.00 0.0
Conversion of boilers to local fuels High 60.00 0.0Rehabiitation of Riga DH network High 72.00 0.0
Rehabilitation of DH systems outside Riga High 72.00 0.0Rehabilitation of DH systems outside Rigs Medium 72.00 O.0
Eltic Power
Transmission substation rebabilitation High 12.00 0.0Urgent mainteance of Riga TEC-1 High 3.00 0.0Rehabiitation of cascades hydropower system High 30.00 3.0
Proposed lepaja coal combined heat power plm Low 230.00 0.0Reconfiguration and expansion of Andreisala plant Low 85.00 0.0Reconfiguration and expansion of Riga TEC-2 Low 40.00 0.0
N atul Gas
Jnstlation of gas meters for domestic consumers (households) Hi8h 21.00 0.0Installation of gas meters for nonhousehold consumers Medium 2.40 0.0Installation of border gas metering stations (Estonian, Lithuanian) Low 5.00 0.0Installtion of border gas meteing statons (Russian) High 1.80 0.0Converson of LPG supply systs to naurWl gas Low 15.00 0.0
Reconstruction of Riga LPG export base Low 1.20 0.0
Construction of new main and distnbution pipelines Low 7.20 0.0Construction of Liepaja LPG impont-export base Low 18.00 0.0
Reconstmrtion of meering station at Inculan underground storage High 1.20 0.0Instaltion of tlemechanical and contol system in nkan Medium 2.50 0.0
LPG Uquid petroleum gas.Source: Latvian authorties and staff estimates.
- 67 -
D. Agriculture
3.34 Agriculture has been the second largest sector in Latvia's economy, accounting for nearly aquarter of GDP and employing about 17 percent of the labor force. The future strength of agriculturewill require a significant reorientation of the government's role in the lard reform, privatization, and theprovision of support services. Public expenditure in the agricultural sector should focus on improvingand expanding public infrastructure and human capital. The main institution building tasks includeestablishing functioning land markets and improving the flow of agronomic and market information tofarmers. The main infrastructural and human capital goals are: (a) supporting the demonopolization ofmarketing; (b) improving transportation and distribution systems; (c) expanding agricultural research andextension; and (d) reorienting and developing training and education in management, marketing. zndinvestment analysis.
Major Issues
3.35 Public expenditures in agriculture fell sharply from 6 percent of GDP in 1991 to 1 percentin 1993. In real terms, the decrease (using the Consumer Price Index as a deflator) was about 90percent. This decrease was caused mainly by the elimination of subsidies, which in 1991 amounted toabout 4.5 percent of GDP. The remaining public expenditures in agriculture, which were mainly oneducation and land reclamation, have also been affected and their share of GDP decreased by 30 percentduring 1991-93. These reductions represent steps in the right direction, as subsidies resulted in massivedistortions in resource allocation to this sector.
3.36 The reductions in education and land reclamation expenditures have also been warrantedbecause the former have been unusually large and the latter poorly targeted. In 1993 education absorbedalmost half of the agricultural budget and accounted for more than 60 percent of the Ministry ofAgricultures employees. The downsizing and reorienting of agricultural education to one-quarter of its1993 level by closing and reorganizing most of agricultural technical schools and institutes isrecommended. This would still leave the level of agricultural education expenditures at 0.15 percent ofGDP (Figure 3-1), well above levels in market economies with agricultural sectors of similar size.
3.37 In 1993, education expenditures accounted for 47 percent of the ministry's budget. Aftereducation, the ministry's main activity was land reclamation, which along with soil improvement(including liming), soil research, and land conservation, accounted for about 40 percent of the 1993budget. Given the extensive need for draining and timing of the soil in Latvia, these levels of expenditureon land reclamation are not excessive, but they should not be financed entirely from the state budget.As a larger share of Latvian agricultural land and production move into the private sector. landreclamation and liming should be paid for mostly by private farmers.
3.38 Other activities of the Ministry of Agriculture concerning infrastructure, such as the executionof rural public works, would best be accomplished by placing these projects with the relevant sectoralministres. The mix of veterinary services within agricultural extension is unbalanced, given the
$I restructuring of the agricultural sector away from livestock and toward crop rotations. Reduced livestockherds and greater dispersion of small farms, which have resulted from the privatization of agriculture,indicate that he demand for veternary services will decrease and will become more specialized. Thusthe budget for such services can be cut significantly, with most of the funds being diverted intoagricultural extension.
- 68 -
Figure 3-1. Percentage Share of the Agricultural Budget,State and Local, 1991-94
20 1 k.
10 -TX
Pe -e1g of Goverrmert Expenditr
| - -- ____n
0 -1991 1992 1993 1994
Source: Latvian authriies and staff esh_ates.
Fiure 2. Agricultural Expenditure as a Share of State andLocal Budgets, 1994 (percent)
Veterinary and Other Servicesublic Enerprise Investments 8 Credit and Subsidies
and Pbi ok
Education
[ Source: Latvian authorities ami staff esimaftes.
- 69 -
3.39 Although Latvia has succeeded in substantially reducing budgetary subsidies to agricultureduring the past two years, subsidies to agriculture are envisaged to increase in the 1994 budget (Figure3-2). These subsidies are mainly to improve livestock breeding and to encourage farmers to use higherquality seeds. Starting in June 1994, agriculture is expected to receive a monthly subsidy of Ls 1.1million when the value added tax rate on food products is scheduled to rise from 10 percent to 18percent. In addition to this explicit subsidy, the sector also benefits from a number of implicit subsidies.Since September 1993 farmers have received tax rebates on diesel oil, estimated at a total of Ls 3.2million a year, and the social security tax on agricultural wages is half of the general rate of 37 percent.This tax exemption is estimated to amount to Ls 5.9 million each year. The sum of the tax rebates ondiesel oil and social security is expected to reach Ls 9 to Ls 11 million in 1994. Incomes fromagriculture and food processing generated on family farms are also tax exempt, as are the profits of newlyfounded enterprises for the first three years of operation. This means that most agricultural enterpriseswill benefit from tax exempton during the next three years.
3.40 Differential tax rates and subsidies to agriculture distort resource allocation and input prices,and will eventually lead to higher budgetary deficits and higher taxes. If subsidies are to continue, thepurpose of each subsidy should be explicitly stated and the subsidy should be targeted as much as possibleto the intended beneficiary. Furthermore, a gradual phasing out of the subsidy should be contemplated.
Investment Program
3.41 Investment expenditures in agriculture accounted for less than 20 percent of agriculturalexpenditures in 1993, but they consttuted about 33 percent of the investment expenditures of the centralgovernment. Land reclamation and public works accounted for 72 percent of capital expenditures inagriculture. The district departnents of the Ministry of Agriculture carry out land reclamation andprovide funds to other agencies for electrification.
3.42 The Ministry of Agriculture envisions providing electricity, telephones, and drainage to everyfarm at an estimated total cost of U 200 million under the farmstead development program. No timehorizon has been defined for this program. The amount budgeted for it in 1993 was only Ls 1.9 million.The 1994 proposed budget of the Ministry includes Ls 6.3 million for the program.
3.43 The land reclamation component consists mainly of drainage, which is important in Latviabecause of the excess moisture in the soil. After World War II, the emphasis was on land reclamation,but the conversion of private fanns into large collective fanrs and the use of heavy trators destroyedthe drainage system. The maintenance of the existing system and its adaptation to the reduced size offields and farms will require continuing expenditure on land reclamation.
3.44 The reconstruction and rehabilitation of drains has declined from 28,000 hectares in 1990 to6,700 in 1992, and to an estimated 5,000 in 1993. The Ministry of Agriculture finances liming toimprove the acidic soils, but since 1990 this activity has declined by 70 percent. The other componentsof the program include rural roads to the isolated private farms, electricity, and other infrastructure works(Table 3-3).
3.45 The objectives of the Ministry of Agriculture's farmstead development program need to bereassessed given Latvia's present economic conditions and development objectives. The farmsteadprogram has ambitious long-term objectives that should be realistically phased in. Drainage and limingare necessary, and the program includes such general activities as building large canals and feeder canals.
- 70 -
It also concerns strictly private activities, like draining fields or laying pipes. While the budget couldsupport the maintenance of the main canals, the farmers should undertake drainage of the fields. Theprogram of land reclamation should initially focus mainly on mantining the existing system, with theconstruction of new facilities being restricted to local feeder canals.
3.46 Electrification and building rural roads is important for the development of agriculture, butthese activities are more rural development than agricultural activities. Infrastructure development couldbe transferred to the local governments. A cost sharing system could be agreed upon to financeelectrification. Pormming of the activities must not be limited to the allocation of annual budget fundsand must include project selection and monitonng systems.
3.47 The other investment activity of the Ministry of Agriculture, which relates to agricultualmachinery, should also be transferred to the private sector. The 1993 budget of the ministry includedtwenty-nine projects for rural education, which is concerned mainly with constmcting civil works, at atotal investment of Ls 340,000. In 1994 the Ministry of Agriculture plans to invest Ls 460,000 in thevocational education subsector for Agriculture. These include: twelve ongoing projects, of which elevenwould be completed in 1994; four new projects; the closing of two projects; and the purchase ofequipment for technical schools.
3.48 In 1994 the Ministry plans to invest Ls 1.5 million in six food processing enterprises. Theman investments involve the reconstruction of boiler houses in dairy factories, a thermoelectric station,and a water circulation system in sugar factories. Given the stated objective of privatizing the processingindustries, these investments should not be undertaken and the food processing industries should betansferred to the private sector. New projects and projects just begiining to be implemented should bediscontined as public activities. Given these criteria, the Cesvains dairy factory, Jekabpils sugar factory,and Preilu flax processing projects should be discontinued.
3.49 In general, the goveunmnt should condine its direct involvement in this sector to improvingsupport services, such as extension and research, and basic infrastructure. The maintenance andrehabilitation of the existng system and the adaptation of the drainage system to new private farms wouldrequire continuing public investment in land reclamation. Furtier public investment in agroprocessingshould be limited to projects near completion that can be privatized soon. The budget should not supportany new investment projects in the processing industry. Likewise investment in building agricultualmachnery and other commercial activities should be transferred to the private sector.
- 71 -
Tabl 3-3. PIc Investaeat Projects in Ag,*allar mUiou)
AmountPriority Total Project in
Project Rating Cost Estimate 1994 Budget
Agricultural secondary schoolsbdnasruce repair/renovation of 22 schools High 1.26 0.21
Agricultural universityCastle reconstrction Low 0.50 0.12Sewage network construction High 0.03 0.01Completion of faculty of construction facilities Medium 0.08 0.05
Famstead development programLand reclamation High 5.00 0.79Rural roadsa Low n.a. 0.38Electricity Low n.a. 0.59Telephones and othera Low n.a. 0.00
Communal land reclamation: cost sharing Medium 0.98 0.20Regional engineering Low 0.42 0.12Educational facilities
New projects (1994) Low 0.18 0.16Ongoing constuction Low 1.25 0.18Conservation/closing down Medium 1.26 0.08Equipment (permanent program) Low n.a. 0.04
Research facilities Medium 1.50 0.24Privatization of agricultural processing plants
a To be provided by the concerned misties and agencies.SOW: Latvithorics and staff estmats.
- 72 -
E. Education
3.50 The education, training, and research sector perfonned relatively well in meeting the needsof the previous economic system. However, the sector needs to be updated to provide the kinds andlevels of initid training and the rapid re-training required for a market-based economic system. Abouttwo-thirds of employees in education are engaged in primary and secondary education, about 19 percentwork in research institutes, 9 percent in vocational tramining, and 7 percent in universities. Occupationalskills being developed under the present system are not, in many cases, consistent with future needs.Curricular activities must therefore be reviewed and adjusted to the new demands of the emerging marketeconomy.
3.51 A large share of budgetary allocations goes for education and training, which is consistentwith patterns in other countries (Table 3-4). For example, in 1993 the education sector received13.6 percent of the general budget compared with an average of 12 percent for the OECD countries.2The 1993 budget allocation was 6.5 percent of GDP, compared with an average of 4.8 percent for theOECD countries.
T'abke 3-4. Budge: AlIao&ns for Education and Travabeg in L&fvia and Selected OECD CoiunWres, 1993
Country Percentage of Budget Percenage of GDP
Denmark 11.6 6.8
Ireland 11.5 5.8
Latvia 13.6 6.5
Norway 12A 6.6
OECD average 12.0 4.8
Source: OECD publications, Latvian authorities.
Major Issues
3.52 The enrollment rate, which has traditionally been high in Latvia, has declined substantiallyin recent years. During 1990-93 enrollment declined between 18 and 25 percent in secondary, vocational,and higher education levels. This sharp drop, caused partly by the emigration of non-Latvians, hasresulted in a decline in the facility utilization rate. The number of students per school dropped from anaverage of 109 in 1990 to 88 in 1993. This has left schools and institutions operating at levelsconsiderably below capacity. The student teacher ratio is quite low, 10:1 for secondary schools and 9:1for vocational and higher education, compared to the OECD average of 15:1 for secondary schools and12:1 for higher education.
3.53 Teachers' salaries are low and need to be increased over time through cost saving measuresin other budgetary items. These measures could include decreasing the total number of teachers andincreasing class size, and expanding the number oi hours in the teachers' work week (with appropriate
2 Part of the 1993 allocation was extra transfers from the state budget for teachers' salaries and benefits at lcallevels, which were not paid through the local government budgets because of the lack of funds.
- 73 -
remuneration), again resulting in a need for fewer teachers. Increasing student teacher ratios to some15:1 would free up close to 30 percent of the present wage bill for partial redistribution as salaryincreases. Increasing teachers' work load from twenty hours per week to twenty-five would free up about20 percent of the wage bill for redistribution as needed. The needed reduction in the teaching force couldbe accomplished by phasing out some teachers through imposing early retirement, retraining somneteachers for other occupations, and enforcing retirement at the normal retirement age and through normalattrition. Because of the substantial decrease in enrollments, a review of space utilization is needed forthe entire system and some schools and programs need to be consolidated or phased out to cutmaintenance and utility costs and to improve efficiency.
3.54 Special efforts should be made to involve the private sector in education and training throughdirect financial support and through contributions of space, equipment, and specialized teaching staff.This would apply both to general education at all levels and to training of a technical or job-relatednature. In general, the major areas for cost savings appear to be in improved student teacher ratios. Thiscould be achieved by tightening up teacher loads and schedules and strengthening enforcement ofretirement regulations. Some additional funding could also be obtained through a number of costrecovery methods, such as university tuition fees, laboratory fees, and the sale of university services(research, training, and studies).
Exrhw Prm
3.55 Conmposition of Expenditures. The distribution of the 1993 budget allocations within thesector was heavily biased toward prinary and secondary education, especially when compared with othercountries. Budgetary allocations for these two levels, including kindergarten, vocational, and secondarytechnical education, were about 85 percent of the total. About 12 percent was allocated to highereducation and some 3 percent to other activities, such as retraining. This compared with averages of73 percent, 22 percent, and 5 percent, respectively, in the OECD countries.
3.56 Of the total 1993 budget, 92 percent was allocated to recurrent costs, 6 percent to subsidiesand grants, and 2 percent to investment expenditures (Figure 3-3). This is comparable to the situationin OECD countries. Of the recurrent cost allocations, 53 percent went toward salaries and wages and39 percent toward other recurrent expenditures. The high proportion of recurrent costs for nonsalaryitems was partially because of the relatively low teacher salaries, but also because of schools' high utilitycosts and because of the free provision of most textbooks, supplies, and materials to studients. However,this proportion should change. Expenditures on materials and textbooks over the next ttree to five yearsshould increase only marginally in real terms, with more substantial increases to be made in teachersalaries, all to be covered by expected cost savings from consolidating and/or phasing out some programsand facilities and from re-programming teacher assignments.
- 74 -
igure 3-3. State Budget Allocation for Education by Economic ClaIfication, 1993(percent of total)
6
SWsies and ans
3953
odw Pjxuffad ~~~~~~~~~~~~~~~~~~~~~~~Saaries and Wage
3.57 Investment Projects. In 1992 the Ministry of Education budgeted for nineteen educationconstruction projects (fourteen contimnation projects and five new ones) and one standby project. In 1993the budget was designated primarily for completing existing construction projects and the renovation andpurchase of some facilities that had been returned to their original owners. About 51 percent of theinvestment budget was in support of vocational and technical education, some 31 percent was for highereducation, and the remaining 18 percent was for primary and secondary education facilities. TheMinistry of Education budgeted Ls 304,000 for renovating eight buildings in 1993. The centralgovernment also made four grants totaling Ls 250,000 to local govenmments for restoring schoolbuildings. For 1994 the ministry has budgeted a little over Ls 1.1 million for ten projects (Table 3-5).Most projects planned for the next several years are of the same type as during the last two to threeyears, namely, completion-of relatively small projects, renovations, and utility modifications. It short,the investment program is moving in the right direction.
Tabe 3-5. Pbflc Invesatnext Phjeck in EducaiontL. moons)
AmntPriority Tota Project in
Project RatiDg Cost Estimate 1994 Budget
Renovation of main building (atVi UniveTy) High 1.36 0.40Renovatin of teacher tg college (laA Universiy)a High 1.60 0.08Completion of Daugavpils railroad tenical schoola High 0.24 0.00Completon of Ulbroka secondary schoola High 0.35 0.00Restoration of Stildi school for the handiapped High 1.00 0.02Re _oton of Riga secondary school No. 3 High 0.05 0.03Resorfaio of Sue ele ny school High 0.20 0.15Restoraon of Allazi school High 0.25 0.00Restoration of Suntan boardng school boiler house High 0.01 0.00Restoratn of Sri school High 0.88 0.30Reosuct of Baldone secondwry school Higb 0.60 0.05Reconsucton of TWtm region Tmes municipl school High 0.35 0.07Restation of national school of applied spots Medium n.a. 0.01Restontion of Latvia Academic Library High n.a. 0.01
n.a. Not available.a Schools under direct supervision of the Ministry of Education, Culure, and Science.
Other schools are under the supervision of municipalides.
Source: Lavian audtorities and staff estmates.
-76 -
F. Health Care
3.58 In Latvia both the state and local governments provide health care. The state is responsiblefor providing specialized services, while local governments provide routine medical care. The localgovernments have gradually become independent from the Ministry of Welfare, which is responsible forhealth care services at the state level and supervises the quality of care countrywide. Despite the closingof some facilities, Latvia still has too many hospitals, beds, physicians, and specialists for a populationof its size. The country has about 340 outpatient clinics, 170 hospitals, 33,000 beds, 10,000 physicians(38 per 10,000 population), and 54,000 nurses and other health personnel. Therefore, bed occupancyrates are extremely low, the average stay is long, and the number of physician visits per person is highcompared to levels in other countries. Many hospitals and outpatient clinics are in great need ofmaintnance and repair. Malfunctioning equipment and an inadequate supply of medical devices iswidespread.
3.59 The government is working on reform of the health services. Primary health care is seenas the core of a system in which health centers would care for most chronic illnesses and for diseases notrequiring specialized or inpatient care. New legislation on health care has been drafted that defines healthcare responsibilities for the state and for local governments, provides for the training of health personnelin public health and management, provides a defined package of basic health services to all inhabitantsfrom local budgets, f-nances ten national health care priorities from the state budget, and provides for thecertification of physicians based on their ability to practice independently.
Major Issues
3.60 The excessive number of hospitals in the country means that available resources for healthcare are not optimally dispersed, because they are committed for low volumes of activity. The issue ofexcess hospitals is also a matter of concem for the quality of care and correct clinical decisionmaking,given that under present economic ciumstances, equipping all the hospitals with the technologynecessary to provide adequate inpatient care is extremely difricult.
3.61 The health services currently operate on a tight budget that is barely large enough to coveroperating costs. This situation would improve if the budget were used to provide a more appropriatevolume of inpatient services. However, not many incentives exist for downsizing hospital care, as closingfacilities and reducing the number of beds and personnel are accompanied by concomitant cuts in thehealth budget.
3.62 The new system of paying for operating expenditures introduced in 1993 is now practiced atthe local level, which covers 1.5 million of Latvia's 2.6 million inhabitants. It includes several features,namely: (a) payment is based on predetermined prices for services provided, (b) prices of health servicesare adjusted periodically, (c) patients have a choice of health providers, and (d) management of healthcare is decentralized. The system also has the potenial for stimulating pr.vate practice and developinginto a model for a reformed system of financing health care. Such a system, as it becomes efficient,would resolve a munber of problems facing health services, in particular, the oversupply of professionalproviders and hospital resources.
- 77 -
3.63 For improved health and elective health services in Latvia, the present policy initiatives torestructure health services toward primary health care and prevention, and the new payment mechanismfor services provided, should be supported by the following:
* Improvements in primary health care and prevention, including maternal and child healthcare.
* Conitinued efforts to reduce the volume of inpatient services to concentrate capital investmentson maintenance and basic medical technology in the remaining facilities.
* Technical assistance for (a) the development and implementation of the new foundations forhealth care, (b) the provision of information technology and the assessment and refinementof the new payment system, and (c) study tours and training in payment systems.
Expend Program
3.64 Composition of Expenditures. Traditionally, the budget has been allocated on the basis of thenumber of beds and health personnel. This has created a rigidly structured system favoring large,overstaffed, and specialized institutions, and fostered an attitude with little or no regard for efficiency andpatients' needs. However, beginning in 1993, the budgets of the state and local governments have begunto be allocated on a pe; capita basis corrected for the age and sex structure of the population.
3.65 During the past few years budget requests have always been significantly higher than theapproved budgets, particularly for state institutions. Their demands on the overall budget have been threeto four times more than what could be provided. However, such information as epidemiological studiesis not available to judge whether the demands for budgetary resources reflect the needs of the population.
3.66 Public expenditures for health care are nearly equally shared by state institutions and localgovernments, 48.5 percent and 51.5 percent, respectively in 1993 (Figure 34). Health expendituresaccount for about 5 percent of the total state budget, while the share of local governments varies from25 to 50 percent. The programs for more highly specialized and expensive care procedures amount tonearly 40 percent of the state budget.
3.67 In 1993, state and local governments' expenditures for health care amounted to about Ls 61million (equivalent to US$ 35 per capita). Expenditures for 1994 are expected to increase to Ls 71million (US$ 40 per capita), mainly because of increases in wages. In general, there are no special healthcare subsidies from the national budget, except for some targeted ones, like need to deal with the suddenoutbreak of tuberculosis in 1992.
- 78 -
3.68 Wages comprise the major part (45 percent) of public expenditures for health care.3 Whileexpenditures for prevention are small, those for inpatient care are large. In 1993 capital investmentaccounted for an estimated 2.5 percent of public expenditures on health care, and is expected to decreasefurther in 1994 (Figure 3-5). The majority of capital investment (about 70 percent), during the past twoyears has been for state and outpatient institutions. No capital investments are budgeted for new inpatientfacilities, except for a few infant homes (Table 3-6).
Table 3-6. Public Investment Projects ur Health(Ls millions)
AmountPriority Total Project in
Project Rafng Cost Estimate 1994 Budget
Reconstruction of central hospital in Kuldiga started in 1988 Low 1.60 0.12Reconstruction of children's outpatient clinic in Imamtas started in 1990 High 0.80 0.30Reconsudction of infant home in Kalkunes stuted in 1988 High 0.18 0.09Reconstruction of outpadent dinic in Ventspils started in 1988 Low 1.20 0.00Reconstruction of water cleaning facility at hospital for alcoholics High 0.27 0.13
started in 1991Reconstruction of outpatient clinic in Riga started in 1990 High n.a. 0.01Reconstruction of maternity home in Riga started in 1987 High n.a. 0.01Reconstruction of department of ifectious diseas in Kraslava started High n.a. 0.16
in 1990Reconstruction of rehabiltation Center, Vaivari Low n.a. 0.00Reconstruction f cennal hospital in Ludzas Low n.a. 0.00Reconstruction of central hospital in Madona started in 1991 High 1.00 0.00Reconstruction of outpadent clinic in Gulbene stared in 1991 Low n.a. O.Q0Reconstruction of outpatient clinic in Baldone High 0.10 0.10Reconstruction of inpatient and outpaent facility in Zelgava High n.a. 0.00Reconstruction of delivery departent at Jelgava regional hospital High n.a. 0.00Reconstruction of tuberculosis hospital in Ceplisi High 0.20 0.00Reconstruction of rural healdth care center in Mslaca . Medum 0.05 0.00
n.a. Not available.Source: Latvian authorities and staff esthnates.
3 Another important expenditre is electricity and heating because of the rapid increase in energy prices. Other majorexpenditures are for pharmaceuical (10 percen) and food (10 percent). Expenditure for medical devices andma_ntenance account for a small fraction of total costs (1.5 percent).
FIN* r
- 79 -
Figure 3.4. Public Health Care Expeuditure by the State and LocalGovernme, 1992-94
LS moon~~~~~~~~~~~~~~~~~~~~~~~~~~~~~~~ tt
40-/_l
LH~~~~19 so) 119
Source: Latv-a--authorit-es and staff est-mates.
4~~~Fgr 3 5. Capital Investments in Health Calre, 1992-94
1.8- / , ___________________________-_
1- ,'/-- - - - - - - - - - - - - - -
1-~~~~~~~~~~~~~~~~~~~~~~~I Equpmet Loc al_
0.6- ,' _ ___ ~~~~~~~~~~~~~~~~~~* CoBmtncionState
1992 1993 1994
Source: Lavian authori.es and staff est nates.
- 80-
G. Mwncdpal Services
3.69 Responsibility for mnicipal services has been passed to local governments as part of theprocess of decentralization. Municipal enterprises now provide water and sewage services, solid wastemanagement, and urban transport.4 (District heating is a special -ase and is discussed under energy.)Tariffs are set by the municipal councils. Although they have been increased substantially, tariff levelsare still inadequate to cover the full cost of service provision, incliding maintenance and investment.Substantial new investment is required to rehabilitate existing facilities.
Major Issues
3.70 Water ant ..ewage. About 92 percent of Latvian housing receives piped water, although insome rural conmunities this ratio is as low as 60 percent. Roughly two-thirds of water discharge istreated. Approximately half of the municipal discharge is from industries, and only 10 percent of thisis pretreated, even though industries discharge large loads of heavy metals into the sewage systems.Many of the exisdng sewage treatment plants are moderately to severely overloaded, resulting in portionsof their flow being discharged untreated.
3.71 In several Latvian cities, per capita water consumption is estimated at well over 200 liters perday, compared to 150 to 175 liters per day in most other countries. This high consumption is probablya result of the absence of metering and of severe leakages in the water distribution system. Treatmentof surface water is often iadequate, with the resut that drinng water is not safe in some communities.GrouAwater sources are safe, but have high levels of iron, which clogs pipes, reduces pipe diameters,and iterferes with system operation. In general, most water and sewage enterprises cover their operatingexpenses, but investment and maintenance costs are financed by transfers from local govermment budgets.For example, Riga's Water Supply and Sewerage Enterprise collected approximately LS 7.2 million in1993 from water and sewage tariffs and received a subsidy of Ls 0.5 million from the city. In 1994 asubsidy of Ls 1.5 million is expected.
3.72 In Riga tariffs are higher than in other large cities and higher for industries than for domesticuse. In Daugavpils tariffs are much lower than in Riga, and although the city's water and sewageenterprise claims to cover all its operating expenses from tariff collections, it has a serious arrearsproblem, particularly from industial customers. Liepaja has an even lower industrial tariff, and its waterand sewage authority faces a serious default problem, which it estimates at 40 percent of the billedamount.
3.7P Solid Waste Managmen. Most existing solid waste disposal sites are not adequatelyprepared and there is strong potential for groundwater contamination. Groundwater con ation hasalready been documented in the case of the Riga landfill, and concem exists that similar contaminationwill be found in other cities. Management of existing sites could be substantally improved to limitfunther conamination, but in some cases existng facilities should be closed. The issue of hazardous
In Riga a pmvatized company collects solid waste on a contract basis. Tariffs are negotated wihh the municipalcouncil.
8l
waste should be addressed, but on a national ratlier thani a municipal level. T ariff issues are similar aswith water, that is, most operating costs are covered, but no provision is made for investment ormaintenance.
3.74 Urban Transport. The average age of the urban transport fleet is more than eight years.Virtually no new equipment has been purchased since independence. Spare parts are largely unaffordableand prior maintenance was poor. As z result, the system is operating at full capacity with very littlemargin. Unlike other municipal services, tariffs cover only about 80 percent of * erating costs becauseof a series of nationally mandated exemptions and discounts for children, pensioners, invalids, internees,and others.
invbtment Program
3.7S Riga Water. In Riga, about 45 percent of the water supply comes from surface water,including the Daugava River. The city frequently suffers from shortages of water purification chemicals;the possibility of using ozone to improve the water purification process is being examined. The city alsosuffers from an iadequate distribution system and insufficient water pumping static ,, resulting in lowpressure and shortages in high rise apartment buildings. As a result, some projects have been initiatedto improve the water pressure, including constructing a water tower and replacing some equipment inexistng pumping stations.5
3.76 Riga Sewage. Although most of Riga is connected to sewage treatment plants, two areas ofthe city sdtl drain untreat sewage into the Daugava River and Lake Kisezers. The city center on thenght bank of the Daugava River produces a dry weather flow of some 90,000 cubic meters per day thatis dumped into the Daugava River, and the Ciekurkalns area discharges its dry weather flow of 34,000CDbic meters per day into the lake. The remaining part of the city is almost entirely connected to thesewage treatment system. Apart from the city center, most of the right bank area pumps its sewageaross the river, and it is then pumped to the treatment plant. These pipes often burst, and new pipesto double the capacity of the line from two to four pressure pipes were delivered four years ago, but havenot yet been -nstalled.
3.77 The city has three sewage treatment plants. The main plant, which is located in Daugavgriva,was commissioned in 1991 and has a design capacity of 350,000 cubic meters per day and an actual loadof 220,000 to 250,000 cubic meters per day. The effluent is pumped into the Baltic Sea. The city alsowants to extend the capacity of its main sewage treatment plant. Initial construction started two yearsago, but little work has been done.
3.78 The Swedish government and the Stockholm Water Company have recently initiated afeasibility study to identify priority investment needs for both water and wastewater treamnent in Riga.
3.79 Riga Landfill. With more than one-third of the nation's population, Riga presents the mostcritical problems in the area of solid waste management. The present landfill site was not properly
The Swiss governmen has offered a grant of US$ 3 million to rehabiltate the lake water itake station; to purchasenew laboratory equipment, valves, pipes, and meters; and to study the potential for using ozone in the waterpurf o plant.
- 82 -
prepared and there has been substantial contamination of the groundwater, which could eventually flowinto the Daugava River. Danish consultants working with the city have recommended closing ine existinglandfill and preparing a new site in accordance with accepted modem stand. rds.
3.80 Riga Urban Transport. Riga's urban transport system is in urgent need of investments tostreamline maintenance operations, fiance spare parts, and replace the city's fleet of buses and tramsover timne.
3.81 Liepaja Landfill. The Liepaja iandfill is poorly designed and maintained and will eventuallyneed to be closed. Although the extent of groundwater and surface water contamination is not yet clear,at a minimum some investment in compactors and other equipment is necessary to enable continued safeoperation of the site.
3.82 Liepaja Urban Transport. Extension of bus and 'or tramn service is required to connect some15,000 residents in one of the city's newer residential developments.
3.83 Liepaja Water. The city's water supply system covers 80 percent of the population and isreported to be safe and generally available without interruption. However, there is substantial leakagefrom the distribution network in the range of 30 to 40 percent of production, which is attributed to agingpipes, poor materials, and decades of neglect. The city's water and sewage authority wants to take overservices in the "Military Area," an area formerly occupied by the Russian armed forces. Incorporatingthis extensive area into the network is expected to add to maintenance and repair costs.
3.84 Liepaja Sewerage. Liepaja's sewage systemn of about fifteen pumping stations serves half ofthe city's inhabitants. The city's system also serves a nmber of industries. The city has four dischargepoints: two dumping untreated sewerage into Lake Liepaja and two into the canal connecting Lake Liepajawith the Baltic Sea through which mechanically treated sewage is dumped into the Baltic Sea.
3.85 Daugavpils Water. Daugavpils is the second lrgest city in Latvia, with a population of125,000. The water supply network has a production capacity of 51,000 cubic meters per day (including12,000 cubic meters per day from underground sources), but currently pumps 46,000 cubic meters perday to 64 percent of the city's inhabitants, with the rest of the water coming from individual wells. Thesystem is plagued with leaks, which city officials estimate waste about 17 to 19 percent of production.The equipment at the city's treatment plants does not permit easy control of chemical dosages andpressure in the network, resulting in excessive chemical and energy consumption. Water from theDaugava River is believed to be heavily polluted with raw sewage, industrial effluent, and heavy metalsdumped in it upstream. Groundwater supplies a limited proportion of the city's needs and is believed tobe of good quality, although it has to be stripped of its high levels of iron.
3.86 Daugavpils Wastewater. The Daugavpils wastewater system consists of a 150 kilometersnetwork, 16 puniping stations, and a mechanical treatment plant. The treatment plant is in relatively goodcondition, but lacks a biological or chemical purification unit. As a result, the partially treatedwastewater is discharged into the Daugava River, which has a negative effect on the quality of Riga'swater supply system downstream.
- 83 -
3.87 Jurmala Water. Jurmala, which is close to Riga, stretches some 35 kilometers along the coastand has 60,000 inhabitants. The city's water, obtained from some twenty wells, has a high iron content.The Swedish government is providing some assistance to improve the city's water quality.
3.88 Jurmala Sewage. Jurmala is split into two main sections, an eastern section with 30 percentof the population, and a western section where the rest of the population lives. Sewage from the westernsection is treated at a local paper mill wastewater plant. Sewage from the eastem section flows to atreatment plant that comprises a sand trap and a number of lagoons with concreted embankments. Thecity's Water Supply and Sewage Department intends to divert about one-third of its sewage to Riga'streatment plant.
3.89 Cesis Sewage. Construction on a sewage plant in Cesis was started in 1989. The buildingis complete, but equipment is still needed.
3.90 All the suspended water and sewage projects in Latvia require an ertimated Ls 20 million forcompletion. However, because of financial difficulties only a few of these projects are expected to befinanced in 1994 (Table 3-7). These include
3 Completion of Liepaja wastewater treatmentD Reconstruction of the Dobele water treatment system in Bene* Completion of the water treatment system in Tukums3 Completion of the water treatment system in Valkas* Completion of the water treatment system in Valmiera.
The estimated figure does not include wholesale rehabilitation of the Riga and Daugavpils water andwastewater systems, the Riga and Liepaja landfill remediation, or any expenditure for rehabilitating urbantransport systems.
3.91 In short, substantial investment is called for to rehabilitate or replace existing facilities andequipment. The efficiency and effectiveness of water and sewage treatment systems should be improvedto safeguard the quality of drinking water and to protect the enviroment. The improvement of existinglandfills and investment in the development of new sanitary landfill sites are necessary to protect againstfiurther groundwater contamination. Present tariff levels and reserves are inadequate to support theneeded level of investment and are too low to support all but the most critical maintenance expenditures.Although municipalities have already ii?creased tariff levels substantially they must take measures to movetoward full cost recovery and to put municipal services on a sounder financial footing.
- 84 -
Tabe 3-7. Ptblc Investnent Projects ui Water and Sewage(Li millions)
AmountPriority Total Project in
Project Ranking Cost Estimate 1994 Budget
Water
Dauvgavo,ils: Construction work at water supplysite at Ziemeli (1989) High 2.20 0.00
Aizkraules: Water cleaning facility at Jaunjelgava (1991) Low 0.90 0.00Rezekne: Extension of the first phase of the
water treatment facility (1989) Low 1.25 0.00Other projects: 14 old projects Low 6.07 0.00Rehabilitation of lake water intake staton Low 1.- 0.00
Seage
Liepaja: Extension of the mechanicaiologicalsewage tmeatment facility (1989) High 5.55 0.25
Rip: Laying a sewage pipeline ftom LizumaSteet to Ezennalas Street (1994) 4Low 1.35 0.00
Gulbenes: Biological tratment facility (1989) Low 1.86 0.00Jumrla: Sewage pipeline from Jurmala to Riga (1989) High 1.51 0.00Casu: Sewer ament facility (1989) Low 2.60 0.11Riga: Sewer pipeline from Dunt-Bukultu Street
to Ezernaas Stet (1991) Low 5.43 0.00Valks: Main sewer pipeline, pumping station
ad water treatment facility at Strencos (1991) High 1.47 0.12Kudigas: Sewage pipeines and tratment
faciity at Sknndas (1994) Low 0.95 0.00Completion of Dobele wastwater High 0.05 0.05Completion of Tukums wastewater High 0.10 0.02Completon of Valmira wastwater High 0.05 0.05
Swrce: Latvian authorities and staff esmates.
- 85 -
H. Housing
3.92 During the Soviet period the public sector dominated housing finance, production, andoperation and rents were highly subsidized. Since independence, an effort has been under way to changethis situation. Restitution of housing has started, but little progress has beetn made in privatizing largeapartment complexes.
Major Issues
3.93 Resatution. A law for the restitution of pre-1940 housing was passed in 1991, and claimantshave until October 1994 to claim ownership of their property. However, restitution has been movingslowly, with less than half the affected housing restituted as of early 1994 because of delays in thecertification process. Existing tenants have the right to rent the restituted property for seven years undergovernment tenancy terms. Laws are needed to govem tenancy relationships, particularly after the seven-year expiration arrangement.
3.94 Privatization. About 60 percent of Latvia's 52 million square meters of housing stock is inthe public rental sector (mainly large block buildings). The privatizadon of public rental complexes hasnot yet started. A privatization law related to these complexes is e xpected to be passed in 1994 that willallow the purchase of these housing units under a combined voucher and cash system. The law for theissuance of vouchers was passed in November 1992, and provides for vouchers to be issued to eligibleresidents based on leng of residence in Latvia. The law provides for the use of vouchers for housingprivatization as well as for the purchase of other assets in the country's privatization program.However, the procedures have not been worked out yet. Acccrding to the original timetable,privatization accounts were to have been opened in one of the two sta. -owned banks by December 31,1993, but as of September 1993, only 85,000 people (3 percent of the tota! population) had receivedvouchers. Therefore, rapid progress in the privatization of housing complexes may take some time.7
3.95 The government has made little progress in the development of a condominium law thatwould establish the legal framework for the distbution of maintenance and repair costs for the jointly-owned space and facilities (for exanmle, roofs) of multi-unit dwellings after they have been privatized.This issue needs urgent attention, given the difficulty that other countries in the region, such as Lithuania,are facing in setting up such condominium associations after privatization has taken place. At the sametime, financing mechanisms to enable newly created condominium associations to undertake urgentstructural repairs and other building improvements must be developed.
3.96 Energy Efficiency. High heat loss is a general problem in Latvian housing construction. Thiscondition is particularly severe in post-World War H structures that were built according to Sovietstandards, which were based on the availability of cheap fuel. Rehabilitation of these buildings needs
6 The value of one voucher is established as the equivalent of the average cost of constructing of 0.5 square meters ofIn Ing space in an apartment, the monetary value of which is to be deternined by the goverMent on a quarterly basis.For example, in the second quarter of 1993, its value was Ls 28 (about US$ 42).
Currenty, cooperative tenant are given the nght to purchase their aparments by taking over responsibilty for theoutstanding portion of the cooperative's debt at original interest rates that were as low as 0.5 percen
- 86 -
priority attention to reJuce energy usage. Attention to this problem could also help to stimulate thedevelopment of local capacity to produce the construction materials needed to increase the energyefficiency of both new and existing buildings, such as thermal insulation materials and high qualitywindows. Considerable attention is also being directed toward studies on improving energy efficiencyin housing through bilateral efforts.
3.97 Housing Maintenance and Repair. Public rental housing is now the responsibility ofmunicipalities. For each municipality, residential housing and conmmercial property is administered bythe different districts under municipal jurisdiction. As no central office that aggregates the amount of rentcollected or of capital repairs performed exists, making an ac-,urate assessment of the level ofmaintenance and repair work performed annmally and its cost is difficult.
3.98 Rent. Latvia has already taken steps toward rent reform. In November 1991 municipalitiesbecame responsible for setting rents for properties under their jurisdiction, although the government setsthe ceiling. Rents now cover approximately 60 percent of the currtnt expenditure oi maintenance andcapital repairs. However, a significant amount of needed maintenance and repairs is being deferred. Oneproblem is that rent and uti:ities are billed together, and recent sharp increases in energy costs, whichin some communities makes up 80 percent of the total bill, have 'cld to substantial defaults, includingdefaults on house rental payments. In some districts in Riga the default rate is around 30 percent, andis thought to be even more in poorer regions of the country.
3.99 Subsidies. To alleviate the burden of rent and utilities on poor households mnd decrease thelevel of defaults, the authorities are considering subsidizing the housing costs of families that are unableto pay their rent and ueility bills. This would replace the 1993 policy, under which local authorities andthe central government were each paying 50 percent of the rent and utilities subsidy. The proposal is thatin 1994, regions enjoying budget surpluses would pay 80 percent of the subsidy, while those with deficitswould be liable for 20 percent. Under this policy, each household is allowed a subsistence of Ls 12.90per person per month (US$ 20), and only income in excess of this amount can be applied to rent andutilities.9
3.100 Considering that housing rent is still less than 10 percent of total rent and utility payments,the share of subsidy represening housing rent alone is estimated at around Ls 1.4 million (US$ 2.3million). The government is also planning to transfer Ls 2.9 million (US$ 4.6 million) to local authoritiesin 1994 for maienance and capital repairs of housing.10
8 The curent rent ceiling is Ls 0.075 per square meter of toDa space. Rents have increased gradually from the originalLs 0.0005 per square meter of living space to an average of Ls 0.045 (US$ 0.07) per square meter of total space.
9 For example, a household of four is allowed Ls 51.60. Assuming at this housebold earns Ls 60.00, it would berequired to apply Ls 8.40 to rent and utilities. The unpaid balance would be split between the local and centalgovernments (20 percent local government and 80 percent central government for a poor region, or 80 percent localgovernment and 20 percent central government for a rich region).
10 Tbus, of the national govermment's US$ 32 million share of the expected 1994 housing subsidius, about US$ 7 mllion
would cover subsidies of rent and US$ 25 million would cover utilities, for a total of more than 4 percent of thebudget.
- 87 -
3.101 Long-Term Financng. Lack of long-terrm mortgage financing is a major factor constraininghousing construction and renovation that is probably slowing down the pace of housing privatization, asfamilies generally do not have the resources to carry out necessary renovations, and may therefore bereluctant to acquire housing under the proposed privatization program.
uveatment Proga
3.102 Capital Repairs. The cost of urgently needed repairs of the national housing stock is notknown, nor is the extent to which further rent reforms could generate er.ough funds for the repairsneeded While separate billing of rent and utilities might increase administrative costs, these could beoffset by increases in revenues collected, resulting in ant overall higher collection rate. However, as mostlocal authorities do not keep separate aecoun s to determine now much maintenance and repair is coveredfrom rent, the potential benefits of separate billing cannot be estimated.
3.103 In addition to separating rent from utility payments and more accurate accounting of repaircosts, a technical inventory of buildings is needed to deternine their condition and the level of repairsneeded. This information could guide cost recovery strategies and help to refine subsidy policies. Withregard to funds required to complete unfinished residential construction, a major problem in estimatingthe number of unfinished buildings is that such records are only available at the district level. Riga hassix such districts. How much unfinished housing there is in the country is therefore not clear.
3.104 Heat Effidency. Because of major losses on the national level, retrofiting structures toimprove energy efficiency deserves priority attention. However, it is very costly and most houseboldscannot afford to undertake their share of the cost. A range of potential technical approaches is available,and numerous studies hav,S been carried out that address the energy problems of Soviet-style large-panelbuildings. These approaches require testing through pilot projects to determine an optimal stategy.Study data need to be consolidated to establish more accurate cost estimates, avoid redundancy, andassure that a full range of solutions is considered.
3.105 New Housing. Assessing the level of need for new housing in Latvia is difficult, althoughper capita floor space and the level of crowding do suggest some degree of need. Latvia's floor areaaverage of about 19 square meters per person is considered to be worse than in other countries at similarlevels of development and with similar incomes. An indicator of the level of crowding is the number ofindividuals or households that live in communal dwellings or in hostels. In Latvia the share ofhouseholds living in such accommodation is estimated to range from 11 to 18 percent for the country asa whole. In Riga, the share is thought to be as high as 23 percent. Such levels of crowding are h,gh andindicate a demand backlog that needs to be addressed. An investment of about US$ 400 to US$ 500million would be required to reduce this backlog to 5 percent.
3.106 About 6 percent of all households have less than 5 square meters of living space per person.Nearly 24 percent of households living in hostels and 13 percent of households living in commmual flatsalso have less than 5 square meters of living space per person. By contrast, more than 37 percent of thehouseholds in private housing have more than 16 square meters per person. While the situation seemsto be worse than in most countries in Eastem Europe, it is similar to that in the rest of the formerrepublics of the Soviet Union.
- 88 -
3.107 When privadzation of publicly-owned housing accelerates, sharing of units is expected todecrease, necessitatiag new housing. As mar. is 30,000 to 40,000 housirg units could be needed, oreven more, costing as much as US$ 300 to US$ 400 million. Similarly, although most of the restitutedmultifamily houses will likely remain as rental units, many households will have to find alternativeaccommodation. In restituted housing, tenant security lapses after the statutory seven-year period, andan increase in demand might therefore be expected toward the end of the century.
3.108 The private sector should satisfy the need for wore housing, although this is not possible atpresent because of limited household savings and the lack of long-term financing. Although the need fornew housing is evident, the need for capital rehabilitation of neglected structures and retrofitting of theexisting housing stock to improve heat efficiency is more pressing, and should be accorded greaterpriority.
3.109 Govermnent action in the housing sector should, in the short term, concentrate on (a)continuing to raise rents until they reflect the value of land, depreciation, and the costs of maintenance,wrajor repairs, and renovations; (b) targeting social welfare proposals for rent allowances to those in needof assistance; and (c) speeding up work on housing privatization, including passage of appropriatelegislation, such as a law on condominium associations, to facilitate housing maintenance and upgradingafter privatization. Longer-term action should include the formulation of policies designed to sharplyaccelerate private sector developmrent of new housing and enable the establishment of a housing financesystem to facilitate the renovation of privatized units, as well as the construction of new ones. Policyshould include instituting measures to assure the security of private property rights and the developmentof appropriate standards, codes, and procedures for building design and constuction.
- 89-
Chapter 4. Public Expenditure Planning and Management
A. Introduction
4.1 The balanced fiscal position that Latvia has observed since regaining independence indicatesthat the existing budget process has served Latvia well until now. In particular, it has been sufficientlyrobust to avoid the large deficits observed in other countries that faced much smaller energy price shocksfollowing the break-up of the U.S.S.R. Key ingredients in this success were the early and completeseverance of budgetary ties with Moscow and the decision to leave the ruble area and introduce anindependent currency supported by prudent monetary and fiscal policy. Nonetheless, many of theprocedures that served the country well during the fiscal stress of the last two years will need to evolveas the transition to a market economy is being completed. Therefore, along with other reforms thecurrmnt budgetary and expenditure planning process must be improved.
B. Preparing, Formulang, and lmplementing Annual Budgets
Formulation and Preparation
4.2 Recent experience serves to highlight problems in the preparation of the annual budget.Because of legislative delays, the 1993 budget was not approved until March 1993, several months intothe budget year. Serious work on the 1994 budget did not begin until October 1993, because of the latepassage of the supplementary budget for 1993. By severely limiting the input from ministries, theMinistry of Finance (MOF) was nevertheless able to submit a budget to Parliament in Decembor !993,although Parliament did not pass it until February 1994.
4.3 The late passage of annual budgets has not created any major problems so far. Indeed,becase monthly expenditures must be limited in these circumnces to one-twelfth of the total allocatedexpenditures for the previous year, the delayed budget has served to restrain any tendencies towardbudget deficits. However, fiscal policy must aim to achieve much more than simply balancing thebudget, and a good budget process is paramount in achieviag other goals. The areas that needinprovement, based on international norms, are discussed below.
4.4 Revenue Projections. The first step L preparing a budget should be the preparation of revenueprojections. These require yearly and quarterly projections of relevant macroeconomic variables, suf Aas the rate of inflation of prices and wages, the rate of growth of real and nominal GDP, and theanticipated unemployment rate. Aggregate zevenue forecasts should be prepared as the sum of theforecasts of each of the major revenue categories, which should be based on forecasts of the particularfactors thought to determine each revenue item. For example, income tax revenues might be forecastbased on (a) the current level of revenues; (b) the projected average wage growth in the economy; (c)the projected change in the number of people employed or paying income tax; and (d) the changes, ifany, to the income tax rate or in the effectiveness of revenue collection.
4.S Work- on preparing forecasts has only just begun in the MOF's Macroeconomic Analysis andForecasting Department. The Ministry of Economy (MOE), also prepares economic forecasts, but notyet on a quarterly basis. While competition in this area is healthy, the shortage of sklfled personnelmakes cooperation imperative. It is recommended that the MOF's Budget Department should also make
- 90-
use of the MOE's forecasts, and that meetings between the two forecasting units should be held on aregular basis to exchange information.
4.6 Expenditure Requests. After the preparation of preliminary revenue projections based on theeconomic outlook and the tax structure assumed for the period ahead, the Budget Department should askline ministries to aubmit expenditute requests. These should include detailed information in a standardizedformat on the current year's budget allocation, total expenditure for the year to date, projectedexpenditure to the end of the year; and projected expenditure in the budget year. If new projects areplanned, the requests should include annual projections of all costs required for completion and forsubsequent operation.
4.7 The expenditure requests should include written comments explaining recent developmentsin expenditures, and should account for the projections, defending the design, extent, and purpose of thePmin programs for which fmancing is being sought. The Budget Department of the MOF should reviewrequests and ask for resubmissions if they art unsatisfactory. The objective is to (a) prevent automaticupward adjustment of the previous year's allocations, (b) identify cases where expendcture increases arereally necessary and areas where reduction or elimination is desirable, and (c) encourage analysis of waysthat ministries might improve se-rvice delivery or reduce costs. To this end, where relevant, ministriesshould provide information in a format that enables measurement of efficiency, fer example, in terms ofunits of output per each input variable. The submissions should be combined in a format that the imnisterof finance and then the cabinet can review.
4.8 The process for submitting requests is iterative and analytical, and therefore must be startedaround five months before the beginning of the fiscal year. For example, the draft budget law wouldrequire that a budget proposal should be submitted to the Cabinet of Ministers and then to Parliamentby October 1 of the year preceding the budget year. Effective execution of these tasks also requires thatMOF officials maintain contact with line ministries throughout the year, to improve the MOF'sassessment capabilities and its ability to factor medium-term considerations into the budget process.
4.9 With regard to the presentation of information in the budget, three specific issues should beaddressed under the current circumstances. The first is the extensive use of the tax system to provideextra budgetary subsidies to particular industries or groups by means of differentiated tax rates. Forexample, the reduced profit, property, and personal income tax rates for agriculture were discussed inChapter 1. In this regard note that the dispersion of tax rates is significantly greater than is normal inmarket economies. Furthermore, to maintain tax revenues, reduced taxes for one group must be offsetby higher taxes on cther groups. This may lead to greater tax evasion by the latter groups, especiallyas enterprises move from public to private ownership. Accordingly, fiscal policy should aim atsignificantly reducing tax exemptions. Best practice in other countries is to include exemptions in thebudget as both a revenue item and an expenditure item. Since these exemptions or "tax expenditures"entail a cost to the budget, the most costly cases should be identified and explicitly recorded in a moretransparent way in the budget.
4.10 A second issue is the government's involvement in the on-lending of foreign loans to domesticenterprises. Such net lending should be included in the budget in a similar way to an expenditure item,even in instances where it may be negative because of repayments. These loans will have no eftxct onthe financing ruiremen as long as enterprises service them. However, given the potential budgetarycost of default, the MOF must monitor the aggregate amount of net lending closely.
- 91 -
4.11 The third issue is government guarantees on enterprise debt. These and other contingentliabilities do not technically appear in the budget, but clearly represent a potential future budgetaryexpenditure. Apparently, ministries sametimes guarantee loans without informing the MOF. The MOPshould begin collecting data on sui'h contingent liabilities from all budge.ary organizations. In aJdition,if the government is to continue providing such guarantees, because the commercial banking system isreluctant to provide long-term funds, the government should formulate a specific policy for the conditionsunder which it will guarantee enterprise debt.
4.12 Parliament recently approved the Law on Budget and Financial Management. This i3wprovides for a budget and financial management process that meets all the requirements of an open,systematic, and rational process; however, the old budget law remains in force during the 1994 fiscalyear. It is recommended that the MOF should attempt to adhere to the provisions of the new law andsatisfy all its requirements immediately.
4.13 Fiscal Planning. While Latvia currently has virtually no medium-term fiscal planning, severalaspects of the budget law would encourage such planning; for example, it requires projections forrevenues, expenditure, and financing in the three subsequent years. These projections should be used toexamine thie future financial implications of existing policies and to provide advance notice of likelyresource shortages. Other important medium-term data that would be in'uded in the budget areprojections of levels of debt, guarantees, and other contingent liabilities for the current year and the nextthree to five years.
4.14 More generally, however, attention to medium-term issues would include a consideration ofthe likely trends in all components of the budget. In the context of investment expenditures, for example,this would include a consideration of the likely domestic expenditures associated with projects financedby foreign resources, and the likely operating costs after project completion. Regarding currentexpenditures, an example would be a consideration of demographic trends and their effects on pensionand education expenditures.1
4.15 Finally, it is important to realize that measures taken in one budget year typically affectsubsequent years. Thus, when considering revenue ehancing measures or expenditure cuts to clo'e adeficit in one year, the Budget Department should consider whether the measures are sufficient to closeemerging deficits in subsequent years. Such analysis should account for the likely effects of policychanges, for example, tax changes, on economic behavior. Scenario analysis may be useful to quantifythe uncertainty surrounding the effects of policy changes.
Budget plemeon s Operations, and Cash Flow M a_t
4.16 Implemenman. Procedures for implementing the budget are currently undergoing significantchange as the Treasury Department is established in the MOF. This is an important area that hasencountered significant problems in the recent past. In particular, because of fiscal constraints, funds
1 A rough example of a medium-term scenario on unemployment related expenditures, though wilh minmal use of suchdemographic information, was provided in Chapter 1.
-92 -
have not always been available in time to implement the budget. Some budgetary expenditures, such asinvestment and other 'discretionary" items, including supplies ard maintenance, have effectively becomeresidual items, and have not been treated on their merits.
4.17 The uncertainty about when funds are received can have impornt implications for theeffectiveness with which budgetary objectives are met. Ministries are faced with the choice of incurringarrears or not carrying out budgeted expenditures. In addition, rather than thinking about importantmedium-term issues, staff within the MOF are preoccupied with managing cash flows and shufflingresources.
4.18 Treasury and Cash Managemens. The problems involved in budget execution should bereduced significantly as the Treasury Departnent takes shape and Treasury bills are issued both to finanreannual deficits and to cover the short-term resource shortages that result from seasonal patterns inrevenues and expenditures. The Treasury Department has made good progress: it has been set up anda number of units are now operational and processing payment orders. Cooperation between the Bankof Latvia and the Treasury has miproved banking transactions and cash management. Expenditureprocessing is now computerized, allowing better reporting of bank accounts by both spending units andthe Treasury. A revised classification of expenditures on v :onomic and functional lines in line with theInternational Monetary Fund's Government Financial Statistics has been prepared and wi1l beimplemented in part for the 1994 budget. Finally, the issuance of book-entry Treasury bills has begun,with the first issue of around Ls 2 million of twenty-eight-day bills on December 15, 1993.
4.19 Nonetheless, significant work remains to be done, including (a) establishing revemne accountsin the Treasury system to better provide contxal over transfers between the state budget and local budgetaccounts; (b) developing a comprehensive accounting framework for govermnent finances, including assetand liability accounts; (c) improving the integration of transactions involving foreign debt into Treasurycash management through strengthened arrangements between the Deparm of Foreign EconomicAffairs and the Treasury; (d) improving cash flow forecasting; (e) consolidating government banidngaccourts further to reduce idle cash balances in individual accounts; (f) including extra-budgetay accountsin the Treasury system; and (g) incorporating the Treasury system in the budget preparation system. Itis important that progress in these areas continues.
4.20 The ability to issi:-. Treasury bills, assuming that the govenment continues with its prudenteconomic management, and Lcrae its ability to run modest deficits, will enable the MOF to ensure thatfunds allocated in the budget can be provided when they are needed, and will allow greater certainty inplanning at the MOF and local government levels. This factor, in addition to the completion of theTreasury Departnent, implies that the authorities will have both the cash management control andimproved information flows to enable them to take into consideration the quaty of public expendiurand other mediumn-term issues.
Monitoring and Performance Review
4.21 The best formulated budget would mean little without close monitoring of its execution. Inthis crucial area, coordination between the MOF and the sectoral agencies concermug the execution ofcurrent expenditures and the MOF and MOE concerning the execution of investment expenditures isneeded. Specific mechanisms and interagency incentives need to be put in place in the immediate futureto ensure not only that expenditures have not exceeded budgetary allocations, but that they have beenspent on the intended programs.
- 93 -
4.22 In addition to monitoring budget execution, the inspector general should conduct annualaudits. Such. audits should be carried out independently of the MOF to ensure that the legal requiementsof the budget process have been met.
4.23 Performance review could also be developed to evaluate the costs (especially the opportuitycosts) of particular programs and to assess how to minimize these. Factors that need to be taken intoconsideration include: (a) the rationale for programs, (b) the technical efficiency of the organization,(c) the progress and impact of programs, (d) the areas in which programs have succeeded and failed,and (e) the lessons learned. Objectives should be specific, disaggregated, and measurable. The indicatorsused should be a bridge between the organization's objectives, inputs and outputs and indicators shouldtake account of the constraints facing the organization, including the nature of the demand for itsservices.2 A system of performance indicators should be designed in such a manner that agencymanagers can use them to plan their activities, to set targets, and to ensure a more efficient allocation ofall inputs into the productive process.
4.24 The extent to which the MOF undertakes performance reviews of particular areas will dependon the likely costs and benefits of such reviews. This would suggest a focus on the more imnportantfunctions of the larger units and those that are known to be inefficient or poorly focused on the finalobjectives of policy. Regardless of where these reviews are carried out, there should be some centalizedanalytical capability to provide hard analysis of expenditures, independently of the ministies beingreviewed, and which in any case, may not have the trained staff necessary for detailed financial analysis.
Rec_mmendations and Plan of Action
4.25 In light of the above observations on the budgetary process, a suggested plan of action hasbeen formulated. It is, of course, not intended that all these steps should be taken at once. The speedwith which they are implemented must take institutional constraints and the need to continue regularoperations into account.
4.26 The role of the Budget Department within the MOF should be strengthened. As theestablishment of the Treasury system is completed, the Budget Department will be less concerned withthe compilation of data and the day-to-day control of expenditures, as these functions will be carried outin the Treasury Department. The Budget Department will receive better and more timely informationon the pattern of expenditure and revenues, and will be able to devote more time to analysis. This willrequire the recruitment of new staff with the appropriate skills.
In the short term, priorities should be to
* Continue work on the Treasury Department with the aim of improving control over budgetaryresources in the implementation of the annual budget and improving information flows toallow infonned decisions to be made on all aspects of revenues and expenditures.
* Begin implementing all requirements of the new Budget Law.
2 For example in private organizaos performance indicators for an organizaton might mcude throughput or volume,such as the number of cases handled; productivity, such as the average output per unit of input; cost, such as theaverage cost per unit of output; and time targets, for example, time taken to complete a task.
- 94 -
* Institute regular meetings between staff in the Macroeconomi Analysis and ForecastingDepartment and the Ministry of Economy to discuss economic forecasts and exchangeinformation for budget projection purposes.
* Establish a frmnework for the regular updadtig of budget forecasts in the current and nextbudget year. The aim is to maintain an ongoing set of forecasts to be able. to provideestimnates of the effect of any proposed fiscal changes.
In the medium term, pr.orities should be to
* Establish a group of staff within the MOF responsible for medium-term fiscal planning,especially as regards the effect of demographic trends on the medium-term fiscal situation.
* Undertake performance review of major expenditure areas to help ministries strengthen theirfinancial management capability to compile costs, formulate estimates and contingency plans,reformulate spending priorities when confronted with revenue shortfalls, and use resourcesefficiently.
- Calculate the effect of all significant tax exemptions or reduced tax rates on budget revenueswith a view to reducing their use and strengthening the revenue position. It is important tonote that the MOP can use the budget document for educatonal purposes, for example, toshow the budgetary costs of policies that benefit certain sectors.
- Begin collecting data on all govermment guaranteed debt and other contingent liabilities witha view to calculating future budgetary expenditure and formulating a specific policygoverning conditions under which guarantees will be provided. The World Bnk hasprovided technical assistance on external debt management (see Section C).
4.27 Finally, for structural reform measures or any significant fiscal change it is crucial thatcalculations be made to show the full budgetary implications, not only in the current year, but also in anysubsequent years in which the fiscal position is affected.
4.28 In short, the budget process must aim at achieving more than simply balancing the budget.Budget preparation should begin at an earlier stage than is done currenly and expenditure requests bythe ministries should be subject to extensive analysis and discussion between the Ministry of Finance andthe concemed ministry. Information from the new Treasury Department will allow more detailed analysisof revenues and expenditures and a shift from short-term resource shuffling to expenditure - view andmedium-term fiscal planning, which are needed to guide the entire budget process. Because the structuralreform measures need to be implemented over several years, it is important to adopt medium-term fiscalplanning to capture the fiscal implications of structural reforms and investment decisions that last beyondthe annual budget horizon. Fiscal planning would allow early warmng of budgetary pressures and permitbetter decision-making in times of fiscal stress. It would also prevent ad hoc expenditure decisions thatare inappropriate and often costly, as de=onstrated by the lack of maintenance of public assets in Latvia.
C. Deigning a Public Investment Program System
4.29 In the area of public investment, the absence of a longer-term perspective has been quiteevident in Latvia. Investment decisions typically involve financial commitments beyond the amnal budgetand need a realistic assessment of resources likely to bc available in the future. The government's recentdecision to introduce a three-year rolling public investment program (PIP) is an important measure in
- 95 -
strengthening the management of public investment and is a first step toward developing medium-termfiscal planning, which is needed to guide the entire budget process.
Box 4-1. Extenaul Support for Preparbg a PIP
External agencies can provide SUpport to the preparation of a PIP in a number of ways, for example:
* Working out a realistic timetable for the different stages in preparation.* Providing background macroeconomic and sector analyses either directly or through Technical
Assistance arrangements,* Providing Technical Assistance to help the responsible ministry prepare a PIP,* As4isting the government to devise formats for project briefs and PIP summary tables,* Providing economic and technical advice on specific large projects and programs,* Reviewing progress with the government at critical stages to ensure that the exercise remains on track.
Once the PIP has been prepared, external agencies can use it as the basis for selecting and phasing the projects theyfnance.
Current Practce
4.30 Under the Soviet system, public investment was centrally planned and controlled. The StatePlanning Commission was responsible for directing the government's investment effort and, to a largeextent, that of the state enterprises. This picture has changed substantially since independence as fundingfrom the state budget for investment has dropped sharply and state enterprises have become autonomousin making investment decisions. The physical targets set by cental planners, however, have not yet beenreplaced by other means of guiding investment decisions. Thus, the investment budget, has beenprepared with much uncertainty about resource availability, overall sectoral development strategies, andthe economic merits of the many uncompleted projects carried over from the past.
4.31 Investment Budget. The MOF has primary responsibility for determining both the level andcomposition of investment expenditures for the anmnal budget. With regard to investment by localgovernments, which have the same budget cycle as the central government, the MOP's role is limited toapproving the overall level of investment expenditure. The MOF reviews individual projects by localauthorities only if they receive a financial contribution from the state budget.
4.32 The review process is different depending on whether projects are funded from domestic orforeign sources. The Department of National Economy in the MOF makes allocations from the budgetto individual projects in collaboration with sectoral ministries and within the resource envelope providedby the Budget Department. Investment requests usually exceed available resources by a large margin,and the allocation process focuses on the backlog of uncompleted projects. The Foreign EconomicRelations Department of the MOP screens projects attracting foreign financing separately beforesubmitting them to the Finance and Economic Committee of the Council of Ministers for approval andsubsequent inclusion in the budget.
4.33 The present system for preparing the investment budget has several weaknesses. First, theresponsibility for preparing the investment budget is split between three departments in the MOF: theNational Economy Department, the Foreign Economic Relations Department, and the Budget Department.Second, no proper screening process is in place to determine projects' economic and social merits andtheir cost efficiency. Third, the time horizon is short and does not capture the fiscal implications of
- 96 -
investment decisions beyond the annual budget. Fourth, a clear investment strategy and we'l-establishedinvestment priorities are lacking. Finally, until recently, institutional arrangements to match investmentdecisions and long-term development objectives were not in place.
4.34 Public Investment Program. Recognizing the importance of strengthening public investmentmanagement, the government has decided to prepare a first rolling three-year Public Investment Program(PIP) for 1995-97. Responsibility for the PIP has been assigned to th. 'JOE, with technical assistanceand training expected to be provided by the EC-PHARE program.3 If the PIP is to serve as a basis forpreparing the 1995 investment budget it needs to be ready before September-ctober 1994. This situationimposes an extremely tight timetable on the MOE in view of the substantial amount of work that isrequired to prepare a first PIP, namely, (a) establishing a PIP unit and recruiting its staff, (b) designingthe process and procedures for preparing an investment program, (c) training the staff in the coreeconomic and sector ministries in project evaluation and appraisal, (d) deciding how to handle the backlogof uncompleted projects, and (e) screening the new investment projects for inclusion in the PIP. Closecooperation with sector ministries as well as with the MOF will be essential for the program to beeffective. The following sections elaborate on the concept of a PIP and highlight the next steps that needto be taken to launch the work for establishing a PIP in Latvia successfully.
Role, Coverage, and Fonnat of a Public Investment Program
4.35 Role and Coverage of the PIP. The establishment of a PIP can improve the management ofpublic investment in a number of ways, including: (a) establishing a link between public investment andthe government's development objectives, (b) presenting financing for priority investments matched byexpected domestic and foreign financial resources, (c) formulating the annual investment budget, and (d)atting foreign filming for the proposed investment projects. The PIP performs these functions bytrying to match investment needs and resources; by prioritizing the many requests for funding; by takinginto account the government's new responsibilities and goals in a market economy; and by establishingstrict criteria for project preparation, evaluation, and selection.
4.36 The PIP usually covers all investment by agencies in the public sector, including central andlocal governments and state enterprises, whatever the source of financing. Coverage of a PIP usuallydepends on its objectives and functions either as a tool to guide preparation of the investment budget oras a mechanism to atac foreign financing for all public investment including those of the state-ownedenterprises (SOEs). In general, the PIP should include all projects that involve a direct claim, or apotential claim on govermment resources. The rationale behind this concept is that such projects createa liability for the government, and thus need to be carefully scrutinized and meet strict selection criteria.This means that the PIP would include all projects, including investments by the SOEs, that receive adirect transfer or loan from the central government budget, or that are funded through a governmentguaranteed loan (see Box 4-1 on external support for preparing a PIP). For example, external loans tofinance investments by Latvenergo are expected either to pass through the budget through on-lending offoreign loans or to require a government guarantee. Therefore these investments will be included in thePIP. By contrast, Lattelekom's joint venture project with foreign partners to modernize of the telephonenetwork will not appear in the PIP because it does not involve a governmnt guarantee.
3 In additon, an ongoing grant from the World Bank's Initil Development Fund has fianced work by the UniedNations Development Programme, Office of Project Services, to advise on the MOE's overall functions including thePIP.
- 97 -
4.37 The PIP should include all local governments' investments.4 However, given the autonomylocal authorites in Latvia enjoy, invef tents financed entirely from their own resources would not besubject to central government approval. However, investment projects that depend on contributions fromthe central government budget should be screened for inclusion iii the PIP. Borrowing for investmentby local autherities requires central government approval. Because default on borrowing would be aliability of the central government, investments financed by local governments should pass the PIPscreening criteria. Thus, the only projects that would be excluded from the PIP are those completelyfinanced from local governmens' own resources. However, the local governments are strongly urgedto use PIP selection criteria for those projects, and their staff should be included in the training programsfor the PIP.
4.38 In the past, most SOE investments were dependent on capital transfers from the budget. Theprivatization of state-owned enterprises and the financial autonomy of those that will remain in the publicsector necessitates securing investment sources other than the budget. To the extent that the governmentremains involved n SOE investment, the nature of its involvement is shifting fromn direct capital transfersto providing loans through on-lending of foreign credits and to guaranteeing' -eign loans extendeddirecdy to SOEs. The fact that the fiuding of SOE investments is moving off-budget in Latvia explainspardy the drop in the relative size of the investment budget during the past two years.
4.39 Format of the PIP. The PIP document should provide at least three types of information.First, it should discuss the macroeconomic setting for public investment and show that the proposednvestment program is consistent with macroeconomic projections and broad sectoral priorities. It shouldalso be realistic in terms of its assumptions about resource availability.
4.40 Second, a set of tables should be prepared summarzing the planned investment expendituresby sector and by project, phased over a three-year period. For each project the tables should show totalCost, the amount aiready spent, expected outlay in each of the three years, and the remaning cost tocomplete the project. A separate table should summarize projects incremental recurrent costs. For thecurrent year full financing details should be provided, but for subsequent years indications of likelyfinancing would be sufficient. The sources of fmancing should be identified, dinui betweendirect transfers from the budget, govermment lending, for example, or-lending of foreign credits), SOEborrowing with government guarantee, SOE owned and borrowed funds (without guarantee), foreigngrants, and other funds. While, as noted, all disburements for the current year of the program shouldhave assured financing, projects starting later should also be considered for funding. One of the purposesof a PIP is to show these financing needs as a basis for discussions with the donors community.
4.41 Third is the preparation of a set of project brief (profiles). These briefs, which are used toprepare summary tables, serve as a source of information on individual projects both for those involvedin approving the PIP and for potental donors. The briefs would be preceded by a brief disussion ofgovernment involvement in the various sectors and sectoral development objectives, strategies, andinvestment priorities. This provides the setting and justification for the sectoral investment programs.The sectoral ministries usually prepare the project briefs which comprise: (a) a succinct description ofthe project (objectives, justification, activities, expected benefits); (b) a presentation of project costs(phased, with a breakdown between local and foreign costs, and including an estfimate of future recurrent
4 Local governments in Latvia account for around half of the total investment budget, and furdter transfer of expendituresponsibilites from the central to local goverments is expecteu.
- 98 -
cost implications); (c) an indication of the status of the project; and (d) a breakdown of project financing(anount secured, remaining gap). The project brief should be kept short because more detailedinformation will normally be available in other documents, such as feasibility studies. Box 4-2 providesan example of a format for preparing a project profile.
Drtermining the Investment Budget
4.42 Realistic assumptions about the availability of financing from various sources are a criticalelement of the PIP. Medium-term revenue projections by the Budget Department and the assumptionson the share to be allocated to investment will provide the first indication of the contribution toinvestment, apart from domestic borrowing. For projections of the expected inflow of external financingfor investment, the PIP Unit will need to liaise closely with the Foreign Economic Relations Departmentin the MOF. The MOF needs to develop the capacity to make medium-term fiscal projections as a keyinput for the MOE, which prepares a medium-term macroeconomic framework.
4.43 Provided that economic stability and the reform process continue, Latvia can count on a majorinflow of external finance for investment. A number of infrastructure projects in the energy andinfrastructure sectors are under discussion, and sector studies and master plans currently underpreparation are expected to identify more projects for possible external funding. Some of these loans,however, are to be provided directly to SOEs (for example, Lattelekom) even without a governmentguarantee. Once the capacity of spending agencies to prepare and evaluate investment projects has beenstrengthened and priorities for investments have been identified in the PIP, external financing can bemobilized even more effectively.
4.44 As mentioned before, projects financed with guaranteed credits should be incluaed in the PIP.The MOF's Foreign Economic Relations Department currently reviews requests for guarantees. Thegovernment is currently imposing an anmmal ceiling on guarantees and is considering charging a fee. Bothmeasures deserve support.
4.45 Foreign credits typically finance the foreign exchange costs of projects while the budget orSOEs' own resources will need provisions for financing local costs. SOE's access to foreign loans willdepend on appropriate pricing policies that reflect economic costs and allow thiem to generate sufficientresources to finance their own share in investment as well as to service the loan.
4.46 Proceeds from privatization are a potential source of funding for public investment, althoughthe net magnitude of the proceeds should not be exaggerated, and cauld even be negative in some cases.Currently, the proceeds go into the Privatization Fund in the case of the state or into the MunicipalPrivatization Fund in the case of municipal property. A draft law specifies how these resources are tobe used. Among the possible uses are rehabilitation of SOEs and support for development of the privatesector. Any investments financed from these proceeds should pass the PIP screening process.
4.47 The PIP process is interactive and iterative. At an early stage the PIP should provide thesector ministries with an overall indication of the investment funds available, and they should be requiredto submit realistic initial requests. The current practice of submitting requests for a muldple of what canbe financed would overload the PIP (see Box 4-3).
- 99 -
Box 4-2. Example of a Fonnat for Prqpaing a Project Profie
I. Summary Information
Sector and Subsector: Within which the project falls.Project Code: Denoting sector and project number within that sector. This remains
the same throughout the life of the project.Project Title: Short, but informative.Project Duration: Estimated start and completion dates.Total Project Cost: Estimated for the complete lifetime of the project (in constant prices,
indicate base year).Previous Expenditure: For a new project this would be zero.Total Planned Expenditures: For the duration of the coming PIP period.iotal Funds Secured: For a new project this would often be zero.Punding Gap: The difference between total expenditures and funds secured.Executing/Implementing Agency: The ministry, department, or parastatal responsible for implementing
the project.Date of Preparation: Of the latest revision.
IIL Description
Project Objectives: Long-term and immediate objectives of the project. Long-termobjectives should refer to overal sector policy objectives.
Background: The problems to be tackled by the project.Project Rationale: How implementation will lead to realizadion of project objectives.Project Components: Brief description of the main project components. Include appropriate
physical targets.Implementation Arrangements: Institutional framework for project implementation and the expected
timing of the project.Current Status: For ongoing projects a brief statement of the current status of
implementation should be given. This should identify problems andconstraints as well as issues that need to be addressed.
Project Impact: Expected long-term changes, including environmental effects, resultingfrom the project.
Documentation: List available documentation on the project: detalled project proposal,appraisal report, project agreement, studies and project reviewdocuments.
m. Tables
Capital Costs: Show capital costs in constant prices for each fiscal year. Whereappropriate show aid agency and government components; divide theaid agency component into capital and technical assistance costs.
Recurrent Costs Arising: Show net recurrent costs (incremental over previous year) arising fromimplementation of the project.
Manpower Requirements: In some cases it may be helpful to show estimated incremental staffrequirements for each year of project implementation broken down intoprofessional and technical staff and labor.
- 100-
Box 4-3. Ovedaaing and Overprogrwmwag
In many countries the PIP is seriously overloaded. In other words, it contains projects far in excess of the government'sability to finance or implement them. this puts pressure on the annual budget process, which responds by cuttingallocations to all projects. The results are loss of focus on priority projects, delayed implementation, and higher costs. Italso transforms the PIP into a rigid and unchanging instrument. Because projects take so long to complete, there is littleor no headroom in the PIP to accommodate new investment requirements or shifting priorities. Overlading occurs whenscreening mechanisms are weak, and projects are submitted for inclusion in the PIP on the basis of unrealistically lowtotal cost esimates, or if the PIP is seen as a means to attract aid rather than a tovol of financial management. Thisresults in aid-driven PIPs. a surrender of priority setting to donor agencies, and is ultimately self-defeating. In this sense,of course, the PIP would not be a program, but a wish list.
A distinction, however, may be made between overloading and overprogramming. The latter is the deliberate inclusion ofslightly more projects in the PIP than can be fluanced to compensate for unanticipated slippage for project rather thanprogram reasons (for example, a technical rather than a counterpart funding delay). If the government's aim is tomaintin a target level of real public investment, limited overprogrmaming may be needed to achieve this. However,deliberate overprogramming is a double-edge sword. It can easily degenerate into overlading, and should be attemptedonly If the standard of individual project costing and phasing is high and the core ministry has access to reliable projectand program imnplementation information in the course of the financial year. In any event, good projects for whichfnancing on favorable terms is available should not be ruled out of consideration because the initial sectoral envelope isexceeded.
4.48 Sectoral investment priorities will have to be established with considerable flexibility. Pastlevels of imvestment are of limited use to guide the new investments in a changing economy. Otherfactors should be taken into consideration, including the lumpiness of some of the new investments, theexistence of many ongoing projects with uncertain completion costs and viability, the differences in theability of different agencies to put together investment proposals, and the quality of project proposals.
Developing a Project Portfolio
4.49 Project Preparation. The PIP is a tool for strengthening public expenditure managementthrough good financial planning and project selection. The PIP Unit will not be formally involved in thevarious stages of the project cycle, although its advice may be sought, as these are primarily theresponsibility of the sector ministries and the SOEs. The quality of public investment will depend on thecapacity of these agencies to submit good projects for inclusion in the PIP (see Box 4-4). Currently,however, project analysis and preparation skills are extremely scarce in Latvia. Many of the requiredskills are new to staff of the ministries, and little project preparation activity has taken place in recentyears through which they could gain experience. The recently reorganized Ministry of Transport has anew Strategic Planning Department with units for transport policy and for investment, but is short ofqualified people to staff these units.
- 101 -
Box 44. Project Iden*cadon
New projects may be identified for inclusion in the PIP in a number of ways:
* From sector studies that identify new or complementary areas for investnent;* From political demands arising from a government-initiated policy objective or directive;* From obvious deficiencies in the levels of service or infrastructure, such as requirements for te
rehabilitadon of schools, hospitals, research stations, roads, and railways;* From a local need, such as where a community lobbies for a new hospital or for the construction of an
irrigation scheme;* From dialogue with a foreign fnancing agency that identifies activities that can be supported and developed
through a project, such as where an agency is willing to support a project drawn from a wider nationalprogram;
* From demographic requiements to expand social services.
4.50 Project Evaluion. Once the new PIP Unit is established in the MOE, one of its first tasksshould be to issue guidelines to all agencies and ministries on project preparation, evaluation, andpresentation to ensure that a common methodology and format is used for all projects. For projectpreparation, these guidelines should establish: (a) standard procedures for calculating project costs(capital and recurrent); (b) the phasing of expenditures; (c) project fumding; and (d) an agreed format forproject submission, including a project brief that summarizes the key elements of the project.
4.51 Guidelines on project evaluation should cover the broad methodology for calculating theeconomic rate of return, the approach for meeting the sector's development objectives, the projectimplementation capacity; the costs of future operations and maintenance, and the financing of these costs.Mamals on project preparation and evaluation are readily available and the PIP Unit should distributethem widely.
Sceening Projects for the PIP
4.52 The task of preparing the first PIP is a particularly difficult one because most existing projectsbeyond a certain size that need to be included in the program will have to be reviewed. In the future,only new projects will have to be screened during the annual updating of the PIP. In addition, staff inthe PIP Unit and sector ministries have to become acquainted with new responsibilities and procedures.Two further factors complicate the initial tasks of the PIP Unit: first, the lack of agreed objectives andstrategies for most sectors; and second, the projects that need to be reviewed (particularly the unfinishedprojects carried over from the past) have not been subject to a rigorous economic and financial evaluation.
4.53 Overhang of Ongoing Projects. An immediate problem that the PIP Unit faces is how to dealwith the serious imbalance between the financing requested for uncompleted projects and the availableresources (the 1993 budget included provisions for only 40 percent of the projects that were submitted).The PIP Unit lacks appropriate data on ongoing projects and their financing needs to be able to establishpriorities among the many competing claims for resources. Some projects are probably not submittedto the budget because of perceived difficulties in obtaining financing, while cost estimates for others maybe underestimated because they are based on original project costs that are no longer valid because of
- 102-
implementation delay and other factors. An eveen greater obstacle is the uncenty about the viabilityof the projects carried over from the past, which were conceived in a very different economicenvironment, and often without appropriate economic and financial analysis.
4.54 Preparation of a database on the overhang of uncompleted projects should conte with theEC-PHARE assistance. All ministries should be asked to submit a list of unfinished projects togetherwith updated estimates of the cost to complete them in those cases in which they wish to contiaue withthe project.
4.55 A specific proposal for dealing with the uncompleted projects is presented in Chapter 2.Briefly, the uncompleted projects that have not received fimding after 1992 should be resubmitted as newprojects if they want budgetary support. The PIP Unit needs to review these projects, of total cost ofabove say $1 million and those with low completion rates (e.g. below 50 percent), to assess which ofthese projects should go ahead and to what exent their fmancing is economically justified and to establishpriorities among them. Given the time constraint, the review should start with the largest projects andwith those least advanced. It should determi whether the project makes sense, both from a technicaland economic perspective, given the changed economic ciumstances. Ongoing or completed sectorstudies could give some insight into sector priorities. Also, external financiers who have been involvedin sector or project work could be helpful in identing priorities. However, the unit is unlikely to belly staffed immediately, and time will be taken up initially with training new staff. In order to complete
the review by mid-94, even for the principal projects, the PIP Unit will need expertise assistance fromexteral sources.
4.56 In addition to the overall costs and benefits of completing projects, the PIP Unit must alsoconsider such factors as the project's design, the need for government involvement in the project, theavailability and sources of fundig, future recurrent costs implications, and the overall resource enve!opefor the PIP (see Chapter 2 for an estimate of the resource envelope for the public investment programduring 1995-97). Box 4-5 presents criteria for screening unfinished projects.
4.57 The capacity of sector ministries to screen and prepare investment projects must be increased.For the time being, however, the identification and preparation of new projects will have to dependheavily on technical assistance provided through sector and feasibility studies, as well as through projectimplemntation units like those in the agriculture, transport, and energy sectors supported by the EC-PHARE program. A viSiting team of highly qualified analysts could also be established within the PIPunit to provide ad hoc assistance to sector ministries.5 The team would comprise a small mnmber ofhighly qualified, newly trained local analysts and an experienced external advisor and would provideassistance to sector ministries at the right points in the PIP cycle by sending a viSiting team to theministry for a brief period. The demonstation effect of this approach would, over tume, help the sectorminisries to build up their own internal capacity for project preparation and evaluation.
4.58 New Invemm. With regard to proposed new investments, the 1995-97 PIP wiUl includeprojects at various stages of preparation. While the status of projects that are expected to start in 1995should be well advanced with proper financing arrangements, those startng in the second or third year
For fArtder elaboron of Ihis and other public sector isses ian Latvia see World Bank, 'Public Sector in Latvia:Selected Lssues and a Coordintd Asista Approach' (Washinton, D.C.: World Bak, 1993).
- 103-
Rex 45. Checkl of C*eria for Scgenig Ongong Projectr
Budgetuy constraints in recent yeas have reduced allocations for invesument. This has led to delaysin implementation, and even the suspension of projects. The estimated financig needed to compete these projectsplus new projects curmey being prepared to support the etacring process far outips the resources likely tobe available for investment. Priorities have to be established among the many competing claims. This demands acareful review of the projects carried over from the pastL as doubts exist about the economic viability of many of them.Time and data constraints preclude a thorough apprisal of each of these projects. However, in addition to someprobing into their techical and economic feasibiliy, a number of common sense questions can be asked that may helpto judge their merits.
* Roke of government. Given the changed perceptions of the government's role and responsibilities.should the public sector sti undertake the activity public sector stll undertake the activity? oes theproject still advance government objectives?
* Tedccal souness. ts the project soundly conceived under current technological, qualihty, andenvionmental considerations, and does it appear feasible in regard to context, scale, blation. andphasing? Are there unresolved technical problms? Can the project as designed be completed at a lowercost?
* Alternatives to dwe project. Cowd the project's objectives be achieved at a lower cost to the budget orby other nonbudgetary means?
* Capital cost to coamption and operadng costs. How quickdy could the project be completed underrealistic assumpbons on physical progress and funding? Wbat is the estimated cost to complte theproject and how reliable is it?
* Are substantdal external benefits or costs associated with completing or canceling the project? Can theirvahue be estimated? What is known about operating costs of the project on completon? Wil they becovered by revenues, and if not, can the responsibe enterprse or department carry these costs? Hasthe project any chance of beconug self-fin&.¶cing? Could costs be recovered from beneficiaries?
* Fawncing. How much of the competion cost will have to be met from the budget or covered bygovernment guantee? What is the financial condition of the agency or enterprise?
* Are there fmancial costs, including cancellation fees, associated with termnating the project? If extenalresources help finance the project, what are the terms of fmancing? Could the money be swithed toother uses?
* Economic jus*caion. If all updated information on project costs and benefits were assembled, whatwould an economic evalation show? What would the economic return of the project be if atl pastexpendiures were considered sunk? If f1D cost recovery on project services were intoduced, wouldbudget fiancing still be needed?
* if resources needed to complete the project were available to finance other spending in the sector, mowwould they be used? If the choice was to spend the money on other investment schemes (icludingrehabilitation, conversion, or upgrding) have they more or less priority than the existing project?Could the money be better spent within the sector or else Ahere?
* Management. Has the project a history of delay or cost overruns? What is the strength of the presentmanagement and management's commitm to compete the project efficiendy?
Source: PolandSategic Investment Review, World Bank Report No. 10321-POL, (Washingo, D.C.: World Bank,1992).
- 104-
of the PIP would probably be under preparation with unidentified source of financing. Screening of theseprojects will demand a similar approach as that suggested for projects carried over.
4.59 Projects require resources not just to finance capital costs, but also for future operation andmaintenance. Screening projects for inclusion in the PIP should ensure that the project itself or thzbudget will be able to meet these future costs. This is particularly important in Latvia, because theseexpenditures are currently underfunded (see Chapter 2 for more details and Box 4-6 for experiences withcore programs in other countries). Project appraisals usually assume that the financing of suchexpenditures is assured. If this is not the case in practice, the result would be an overestimation nf therate of return. By including future operaton and maintenance costs in project submissions, tite PIPensures that the necessary budgetary provisions are made. It can also provide a medium-term frameworkwithin which the implications of projects for the recurrent budget can be analyzed. A key factor inassuring adequate resources for recurrent costs is the extent to which pricing policies allow such coststo be recovered.
In te the Public Investment Program into the Budget
4.60 While projects in the PIP require funding from the investment budget, the investment budgetmust be fully consistent with the current year of the PIP. Therefore, the effectiveness of the PIP dependson its use in the fornulation of the investment budget.
4.61 Despite the establishment of the PIP Unit in the MOE, the MCiF will remain responsible forthe preparation of the annual budget, including the investment budget. The domestic resource envelopewill need to be determined through an iterative process that will entail systematic contacts between theMOF and the MOE, that takes stabilization policies and other national objectives into account. Expected
Box"6. Core Prgrs
In some counries chronc under-fmng of the PIP has led to projects receiving inadequate finance with the result thatimplementation is prolonged, often with considerable loss of investment efficiency. in extreme cases, projects mayreceive so litde fmance that only the salaries of project staff are covered, and no program activities or physicalimplementation takes place. One response to this problem and the considerable uncertainty over the future availabilityof investment resources has been to propose a 'core' invesunent program of priority projects which wil have firstdemand on available mvestment resources. However, a number of problems may be encountered with 'core' programs:
* They must constiute a small enough share of the total PIP that their financing can be assured. Ofken thisis not the case and the core program ends up exceeding the available investment resources. (However,even in such cases the identification of a core program will have been helpful in bringing the PIP downto a more realistic size).
* The concept assumes that resources are fungible between non-core and core program projects. Whereforeign fmance is involved this may not be the case, especially in the short term.
* The adoption of a core program may divet atention from wider ranging rationalizadon of the PIPinvolving the closing down of low-priorit, projects and the transfer of some acdvities to a more adequatelyfinanced recurrent budget. Projects outside the core program may continue to receive small flows ofinvestment funds and use them inefficiently and remain a potental drain on any additional resources thatbecome available.
* A core program in the PIP is meaningess unless backed up by mechanisms to ensure that preference isgiven to core projects in the relase of funds.
- 105-
disbursements from foreign credits, as estimated by the MOF's Foreign Economic Relations Department,are also incorporated into the investment budget. The PIP serves as a guide to the Budget Departnentin tliis process. The allocations from the investment budget must be restricted to disbursements for thecurrent year under projects included in the PIP.
4.62 Investment expenditure in the budget will be normally less than the annual slice of the PIP,as the latter also includes investment expenditures financed through other sources than the budget, suchas government-guaranteed loans. The MOF should include a list of all approved guarantees in the budgetdocumentt Such a list is not currently prepared. A condition for the issue of govermnent a guaranteeshould be that the project is included in the PIP (once the PIP process is firmly in place). In manycountries, this is done by annexing the PIP to the draft budget law, thereby giving the PIP legal sanctionwhen the budget law is approved and permitting verification and consistency between the PIP and theannual investment budget.
4.63 For the PIP to be effective, it should be closely linked with the budget. In this regard, it isnecessary to
* Require that the investment budget only finance projects that are included in the PIP.Approval by the Council of Ministers could strengthen the authority of the PIP.
* Ensure that the PIP uses realistic assumptions about the availability of resources, especiallydomestic budgetary resources, and specifies financing foi the current year in full detai!.Guidance on this should be given by the MOF, which aiso needs to strengthen the quality ofthe fiscal projections.
* Link the preparation of the PIP to the annual budget cycle.
* Ensure systematic coordination between the MOF and the MOE.
4.64 Given that foreign resources play an appreciable role in funding the PIP, their managementis an important task of the MOF, in particular of the Foreign Economic Relations Department. Thisdepartment will have to become more active than it is at present in mobilizing external resources andmatching them with specific projects in the PIP. Sometimes several donors may fund a single project,or one large loan may finance components of different projects. Technical assistance also p! ys a keyrole in all stages of the project cycle in Latvia, from identification to implementation. Sector re- - s,master plans, and feasibility studies often pave the way for subsequent financial aid. These two form-of assistance thus need to be well coordinated.
4.65 The PIP Unit, in collaboration with sector ministries should monitor the execution of overallpublic investment and keep track of the progress of the investment expenditures. Although informationon investment expenditures financed from the budget is available though the State Committee forStatistics, the PIP Unit needs direct access to this information through the spending agencies formonitoring of the project expenditures and for the annual updating of the PIP. Monitoring the physicalprogress of individual projects is the responsibility of sector ministries, some of whom have set up projectimplementation units for this purpose. The MOF should monitor thefnancil execuion of the investment
- 106 -
budget. To perform this function properly, the MOF needs to make the necessary organizationalarrangements and strengthen its staffing. Moreover, cooperation between the MOF and MOE is asimportant in the monitoring stage as it is in the investment budget formulation stage.
The Role of Executive Agendes In Public Investment Mangement
4.66 As noted the introduction of a three-year rolling PIP requires close cooperatioi and interactionamong several government agencies in Latvia. The main agencies involved in the process of preparingthe PIP are the MOE and the MOF, as well as the spending agencies in charge of executing theinvestment program. Preparing a three-year rolling plan requires close coordination and cooperationamong these agencies to screen the projects efficiendy and to match investment priorities with availableresources. This may also require some redefinition of their present responsibilities. These newresponsibilities need to be clarified by the Council of Ministers and issued in a government decree. Theinteractions and responsibilities of the various agencies are summarized in the following paragraphs:
MOF
The Budget Department is responsiale for preparing the annual budget, including the investmentbudget. In close consultation with the PIP Unit, it needs to decide on the share of total resourcesrequired for the investment budget and on the projects that should be excluded from the budget if theresource envelope becomes smaller. The Budget Department also prepares revenue projections incollaboration with the Macroeconomic Analysis and Projections Department in the MOE provides thePIP Unit with an estimate of the domestic resource envelope during the three-year PIP period, andprepares the annual investment budget in consultation with the PIP unit. The Foreign EconomicRelations Deparwment seeks external funding for projects included in the PIP provides estimates oflikely inflows of external resources, and monitors foreign loan disbursements. This department alsoneeds to coordinate its activities closely with those of the Foreign Loan Coordination Committee,which oversees and approves foreign loans and guarantees.
PIP Unit
The PIP Unit should have overall responsibility for public investment programming and management.Its tasks include screening project proposals, providing guidelines to spending agencies on projectpreparation and evaluation, setting sectoral investment ceilings, providing sector ministries withproject-related guidelines (for example, price assumptions) for preparing the PIP, preparing the three-year PIP in line with available domestic and foreign financing, and updating and monitoringimplementation of the PIP. The screening of foreign-financed projects currently undertaken by theForeign Econonuc Relations Departm in the MOF should become the responsibility of the PIPUnit. The quality of the PIP will depend, to a large extent, on the inputs it receives, both from thesector ministries (through well-prepared projects) and from the MOF (in terms of a realistic resourceenvelope for investment).
- 107 -
MOE
TheMacroeconomncAnalysis andForecastingDepartmentprovides the medium-term macroeconomicoutlook for the Latvian economy, in close contact with the MOF's Macroeconomic AnalysisDepartment, which prepares short-term forecasts.
Spending Agencies
The spending agencies elaborate sectoral objectives and priorities; identify, prepare, and evaluateinvestment projects; prepare the three-year sectoral investment program for submission to the PIPUnit; submit requests to the Budget Department, both for investment and for projects' recurrent costs;and monitor project implementation.
Local Authorities
The local authorities formulate medium-term investment priorities at the local level; identify, prepare,and evaluate investment projects; submit projects requiring central government financial support(including foreig credits) to the PIP Unit for inclusion in the investment program; and submitrequests for project funding from the investment budget to the MOF.
Plan of Action for the Immediate Future
4.67 As mentioned earlier, the three-year rolling PIP is an important instrument for strengtheningpublic expenditure management and mobilizg exteral fundig for investment projects. It wouldtherefore be desirable if the PIP were ready in time for the preparation of the 1995 budget. This requiresa speedy completion of a mmber of actions during the next two to three months as sunmarized below.6Dates in parentheses refer to the time when actions need to be completed.
Mnstry of Economy
* Establish the PIP Unit (March 1994). The PIP Unit should be established and the head ofthe Unit appointed. The unit should report direcdy to the state secretary.
* Recruit staff for the PIP Unit (March/April 1994). The PIP Unit will require a staff ofprofessionals, preferably economists with working experience in a sector. Incentives maybe needed to attract qualified staff to prepare the first PIP against a tight deadline.
* Issue a govermnent decree on the PIP (March 1994). The decree should spell out the roleof the PIP, the responsibilities of the PIP Unit in relation to other government agencies, therequirement that the investment budget should only finance projects included in the PIP, andthe procedures to be followed for approval of the PIP by the Council of Ministers.
6 Should it prove not possible to adhere to this proposed timetable, the work would sdill be needad to prepare a PIP forthe 1996-98 period.
- 108 -
* Prepare a database on carny over projects (May 1994). The MOE should ask all spendingagencies to submit information on uncompleted projects for review, including, wherepossiblc an updated estimate of the cost to completion; this request should go out at thesame time as the establishment of the PIP Unit.
* Formulate sector development strategies (July 1994). Request the principal sector ministriesto formulate and submit objectives and strategies for the development of their sectors.
Miist of Fince
* Prepare medium-term projections (April 1994, update August 1994). Prepare revenue andexpenditure projections in collaboration with the Department of Macroeconomic Analysis inthe MOE, and agree with the PIP Unit on the resource envelope for 1995-97, distnguishingbetween domestic and foreign sources of funding.
* Aid management (April 1994). Redefine the role of Uth Foreign Economic RelationsDepartment in coordinng and managing foreign financial assistance, strengthen thedepartment where necessary, and ensure close coordination with the management of technicalassistance.
Extenal Support
- Foreign advisorfor the PIP Unit (March 1994). A long-term foreign advisor, to be financedby the EC-PHARE program, should begin work.
• Database on foreign aid activities (May 1994). Establishment of a database is a necessaryinput for the PIP Unit as well as for other agencies. The lack of a central source ofinformation on donor activities in Latvia makes aid coordination difficult.
- Training (1994-95). A training program in project analysis needs to be organized, startingin March 1994 for PIP Unit staff, followed by courses for selected staff in sector ministriesand local government officials.
Technical Assstane Requirements
4.68 The areas where technical assistance is needed for strengthening public investmentmanagement are the preparation of a first PIP, project analysis and evaluation, and medium-term fiscaland macroeconomic projections. The EC-PHARE program is expected to provide support in these areasin the form of training in project analysis, hardware and software, and some advisory services. Projectpreparation and evaluation skills are also needed in the sector ministries. As mentioned before, whilea medium-term training program should be designed for this purpose, arrangements should be made inthe short term for a visiting team of experts, located in the PIP Unit, to visit the sector ministries and tohelp them put together projects for the investment program. In addition, the PIP Unit will requireexpertise to help review uncompleted projects.
4.69 To improve macroeconomic projections, a short-term advisor could be assigned for thispurpose. Funding could be provided through a proposed United Nations Development Programme projectfor capacity building in the MOE. To strengthen the capacity for medium-term fiscal planning one or
-109-
two advisors are needed for the MOF. Support in this area could be provided through the EC-PHAREprogram. The Foreign Economic Relations Department also needs to strengthen its management ofexternal assistance. At present Latvia has only basic technical expertise in debt management and debtpolicy formulation. The World Bank, through the Regional Technical Assistance Project for DebtManagement for the Baltic countries, which is funded by some bilateral sources, has started to provideadvice to Latvia on the management of new borrowing and external debt. The objective is to strengthenLatvia's capacity to develop borrowing strategies consistent with sound macroeconomic policies.
Conclusion
4.70 The recent decision to introduce a rolling three-year public investment program (PIP) is a firststep toward strengthening the management of public investment in Latvia. Currendy a proper screeningprocess for determining the economic iierit and cost-efficiency of projects is lacking; no investmentstrategy or clearly defined investment priorities exist; and, most importantly, mechanisms to matchinvestment decisions with long-term development objectives are not in place. With the 1995 budget cyclecoming up, this situation imposes an extremely tight timetable for the authorities to formulate the firstpublic investment program for 1995-97. During the next two to three months, a substantial amount ofwork is required to prepare a resource framework for the PIP, provide guidance to the sectoral ministrieson project preparation and evaluation, decide how to handle the overhang of uncompleted projects, andscreen new projects for inclusion in the PIP.
4.71 To be effective, the PIP requires close coordination between the two key ministries ofEconomy and Finance as weil as close links with the formulation of the annual budget. This is to ersurethat the available investment resources are within the overall resource envelope for the budget and thatthe investment budget finances only projects that have been properly screened. Effective managementof the PIP also requires monitoring its implementation. Therefore, a comprehensive anmual review ofthe PIP is needed to evaluate project implementation and to make appropriate adjustments for the nextcycle of the operation. Given that foreign resources are expected to play a major role in funding the PIP,stegthening debt management and debt policy formulation skills will also become an important task thatwill need to be supported through technical assistance.
- 110-
Annex 1
Fiscal Costs of Replacing the Banking Sectors Nonperforming Debt
1. This annex discusses an estimate of total government liabilities and of the fiscal costsderived from taking over the banking sector's portfolio of nonperforming assets.
Bad Debts In the Banikog Sector
2. Nonperforming bank assets are concentrated in three institutions: the Bank Restructuringand Privatization Commission (BRPC), the State Savings Bank (SB), and the recently created UniversalBank (UB). The outstanding bad loans and the corresponding government commitments to back themare reviewed below.
3. The October 31, 1993, balance sheet of the Bank of Latvia (BoL) shows outstandingcredits to the Privatization Fund of the BRPC on amounts of Ls 7.84 million (from past grain credits)and Ls 0.96 million (from bad loans of privatized branches). The latter figures underestimates the totalamount of bad loans in the Privatization Fund of the BRPC by Ls 1.0 million according to the BRPC'sbalance sheet of November 5, 1993.
4. On the liability side of the BoL, an amount of Ls 1.91 million is shown as deposits ofthe BRPC. The latter figure could grow by Ls 0.9 million because of the privatization of the twenty-seventh branch of the old BoL during December 1993.
5. On the asset side of the BRPC a government guarantee on the principal of the graincredits (Ls 7.84 million) and cumulative interest (Ls 1.2 million), frozen at their August 1, 1993, totalvalue of Ls 9.04 million, was issued on August 12, 1993, and expires on July 1, 1994. The governmenthas not yet taken an explicit stance on how it will treat this debt when the government guarantee expires.Once the work of the BRPC ceases, its outstanding assets and liabilities could be taken over by the Bankof Latvia (which then requires a substitution of new government bonds for the atove mentionedgovernment guarantee) or directly by the government.
6. The SB's bad assets are the result of nonperforminn old ruble deposits at MoscowGosbank that amounted to Ls 23.4 million in October 1993, equivalent to 43 percent of the SB's totalassets.
7. The UB's bad loans are estimated at Ls 17.9 million as of September 1993.
Government Assets and Liabflities with the Bank of Latvia
8. According to the October 31, 1993, balance sheet of the BoL, the outstanding line ofcredit to the government was Ls 4.5 million. Other credit to the government on account of governmentpayments was Ls 73.4 million, which almost matched corresponding government deposits of Ls 73.5million.
- 111 -
Other Government Debt
9. The remaining outstanding govermnent debt was domestic government bonds (Ls 16.0million) and foreign debt (Ls 29.5 million).
Consolidated Balance Sheets of Government and Bank of Latvia
10. The following esdmate of total domestic government liabilides as of October 1993includes both existing debt and esimates of new debt resulting from government commitments to takeover bad loans in the banking sector. The government's assets and liabilities at the BoL other than theline of credit are excluded as they are roughly in balance.
Total government domestic !iabilities (Ls millions) 100.3
1. Foreign debt 29.5
2. Domestic debt 70.8Explicit debt 20.5Bonds outstanding 16.0BoL line of credit 4.5
New debt from bad loans 50.3Grain credits (guarantee to BRPC) 9.0SB bad loans 23.4UB bad loans 17.9
I1. The following is an esdmate of the BoL's balance sheet as of December 31, 1993 (Lsinillions):
I. Reserve money 206.82. Net foreign assets 247.43. Net domestic assets -40.6
12. Combining the government's and the BoL's balance sheets, the following asset and liabilityposition for the consolidated government comprised by these two institutions is estimated as follows asof I ember 31, 1993 (Ls millions):
1. Reserve money 206.82. Net foreign assets 217.93. Net domestic debt 111.4
Fiscal Coss of Taking Over Bad Debts from the Banking Sector
13. Taking over the bad debt of the state banking sector can be done in different ways, includingbank capitalization, interest and amorizaton servicing, swaps for cash, and swaps for new governmentdebt. The latter alternative is assumed in the calculations below, as it seems to be the alternative thegovernment is considering, and at the same time offers the advantage of both cleaning up the banks'balance sheets as well as deferring the fiscal cost of taking over the bad debt over time. Hence existingbad loans are swapped for perpetual government bonds that pay a variable interest rate.
- 112 -
14. The estimation also assumes that the asset exchange took place on December 31. 1993. Banksare provided with incentives to collect bad debt. Cumulative recovery of bad loans under the incentivecontract attains 25 percent of outstanding BRPC bad loans (half the recovery rate estimated by the BRPC)and 20 percent of outstanding Universal Bank bad loans. The resources raised by the banks from loanrecovery are used to retire government debt. Nominal interest rates paid by the government to the banks(which can be considered net of commissions of recovered loans) start at an annual nominal 22 percentin 1994, a figure that exceeds the value anticipated by the Ministry of Finance, but is below the rateestimated as that required by the marketing of goverunent debt paper started during December 1993.In subsequent years nominal interest rates are projected to fall with both declining dornestic inflation andreal interest rates. In addition to interest costs, a once and for all payment to the SB is included toaccount for 1992-93 losses. Table Al-1 presents the results of the estimation.
15. The total fiscal costs of taking over the banking system's nonperforming assets are moderatein 1994: Ls 12.2 million or 0.6 percent of GDP. This figure is projected to decline over time as interestrates fall and some of the loans are recovered. By 1997, for instance, nominal fiscal costs have beenalmost halved and correspond to only 0.24 percent of GDP.
- 113 -
Tabl. Al-l. Utia Fiscal Coats of the Nonpefonldug Poitfoo of t ae Bankt, 1993-2000
Once and for all governmenttransfer to savings bank tocover 1992-93 losses (Ls million) 1.1 0.0 0.0 0.0 0.0 0.0 0.0
Source: Ministry of Finance. Bank of Latvia, and staff estimates.
- 114 -
Annex 2
Government Debt Paths and Macreconomic Stabilit
1. This annex discusses the flow of funds framework used to assess the sustainability of fiscalpolicy and its implications for the overall macroeconomic equilibrium. The accounting framework linksthe general government and central bank budget constaints into a consolidated ge .nment budgetconstraint and relates the latter to the economy's overall resource constraint. While a complete flow offunds (or RMSM-X) model offers the advantage of cross-sector consistency, this set-up offerstransparency and simplicity to assess the sustainability of fiscal policy and the economy's overall outlook.
2. The general government issues three liabilities: BoL domestic credit, other net domestic debt(D), and foreign debt (FD) in foreign currency units. Its budget constraint is given by:
(1) G - T - BTR + iDC DC + iD D + E iFDD = DC + D + E ilD
where G is total government expenditure, T is total government revenue (other than BIR), BTR is current-ransfers (profits) from the BoL, E is the nominal exchange rate (domestic currency per foreign currencyunit), and the subindexed i is the corresponding nominal interest rates. Dots over variables denotechanges per period.
3. The BoL has a four-item balance sheet that, in addition to DC, includes reserve money (M),net domestic assets other than DC (NDA), and net foreign assets (NFA). Its budget constraint is thefollowing:
(2) BTR - iDC DC - iNDA NDA - E iNFA NFA
= M - DC - NIbA - E NPA
4. The budget constraint for the consolidated government is obtained by adding equations (1)and (2), after which every item is scaled to GDP (the product of the GDP deflator, P, and real GDP, y):
G-T + i D i NDA + E iFD FD E iNFANFAPy Py Py Py Py
_ + E FD + M NDA E NFAPy Py Py Py Py
5. This equation can be rewritten by using lower-case letters for the corresponding variablesscaled to GDP and substituting the ratios between asset or liability changes and GDP by the sum of thechange in the asset or liability ratio and the increase in assets or liabilities required to maintain the ratiosto GDP constant. This implies the following version of equation (3):
- 115 -
(4) pd + ip = [d + ( X + n ) d + [ fd + ( ir + n - e ) fd I
+ { [th + ( ir + n) m ] - 1inda + ( r + n) nda 1 - [nf a + (-r + n - e) nf 1
where pd is the ratio to GDP of the consolidated government primary deficit [pd = (G-T)/(P y)l, ip isthe ratio of GDP of the consolidated government total interest payments, ir or inflation is the rate ofchange of P, n or real GDP growth is the rate of change of y, and e or nominal depreciation is the rateof change of E.
6. Now consider the simplifying assumption that the central bank's seignorage (the increase inreserve money) is equal to the BoL's accumulation of net domestic assets and net foreign assets:
(5) M- NlA + E NFA
7. This condition holds approximately in Latvia, where net domestic credit to the government(the fourth component of the BoL's balance sheet) is very small. The implication of this assumption isthat the second financing line in equation is equal to zero, so that the consolidated goverment deficit isnumerically equal to the deficit of the general goverunent, and hence is financed only by the generalgovernment's net issue of liabilities.
8. This framework is applied to 1993-94 projected government, BoL, and macroeconomic datafor Latvia, as represented in Table A2-1. All stocks are at the end of the year. The general governmentdebt data are taken from Annex 1.
Source: Ministry of Finance, Bank of Latvia, and staff estimates.
Jib
9. The macroeconomic assumptions in l:able A2-1 reflect a stabilization of GDP in 1994 andmoderate growth starting in 1995. Inflation (as measured by the GDP deflator) declines from 24.0 percentin 1994 to 6.5 percent in subsequent years. The average domestic nominal interest rate paid on bothgovernment debt and BoL net domestic assets starts at 22 percent in 1994, declining consistently thereafteras real interest rates come down. The U.S. dollar interest rates on govenmment foreign debt is a flat7 percent and on BoL foreign assets a flat 4 percent, inplying low real values for both variables as foreign(U.S.) inflation stands at a flat 3 percent. A constant nominal exchange rate of 0.6 lats per U.S. dollarimplies a real exchange rate appreciation that would still be substantial in 1994.
10. Other assunptions are constant ratios to GDP of reserve money, the BoL's net foreign assets,and hence (reflecting equation 5) the BoL's net domestic assets. The primary deficit of the govermnentattains 3.5 percent of GDP in 1994, but subsequently falls to a flat level of 2.5 percent of GDP.
11. The results of the simulation for the overall deficit and the government's debt paths are reportedin Table A2-2.
12. As a next step, the implications of this government deficit profile for overall macroeconomicresource availability are drawn. For this purpose, the economy's resource constraint linking grossinvestment and saving by sectors is used:
(6) ( IG - SG ) + ( ING - SNG ) - SF
where I is gross investment, S is saving, and the subindexes denote the corresponding sectors (G isgoverment; NG is the nongovernment sector comprising all enterprises, including state-owned firms, andhouseholds; and F is the external sector).