Lawrence Berkeley National Laboratory Lawrence Berkeley National Laboratory Title PROCEEDINGS OF THE SYMPOSIUM COMMEMORATING THE 25th ANNIVERSARY OF ELEMENTS 97 and 98 HELD ON JAN. 20, 1975 Permalink https://escholarship.org/uc/item/24p9d6qf Author Seaborg, Glenn T. Publication Date 1976-07-01 eScholarship.org Powered by the California Digital Library University of California
Transcript
Lawrence Berkeley National LaboratoryLawrence Berkeley National Laboratory
TitlePROCEEDINGS OF THE SYMPOSIUM COMMEMORATING THE 25th ANNIVERSARY OF ELEMENTS 97 and 98 HELD ON JAN. 20, 1975
Lawrence Berkeley Laboratory University of California
Berkeley, California 94720
LBL-4366 UC-34c
TID 4500-R64
-ii-
Dedicated to
Stanley G. Thompson (1912-1976)
Chief Architect for
Berkelium and Californium I.,' ~
o u
-iii-
TABLE OF CONTENTS
Preface ................................. iv
Introductory Remarks Glenn T. Seaborg, Lawrence Berkeley Laboratory 1
Reminiscences Stanley G. Thompson, Lawrence Berkeley Laboratory. . . . . . . . . .. 7
Reminiscences Albert Ghiorso, Lawrence Berkeley Laboratory . . . . . . . . . . . . . 8
Reminiscences Kenneth Street, Jr., Lawrence Livermore Laboratory . ......... 10
Nuclear Properties of Berkelium and Californium Paul R. Fields, Argonne National Laboratory . ............. 11
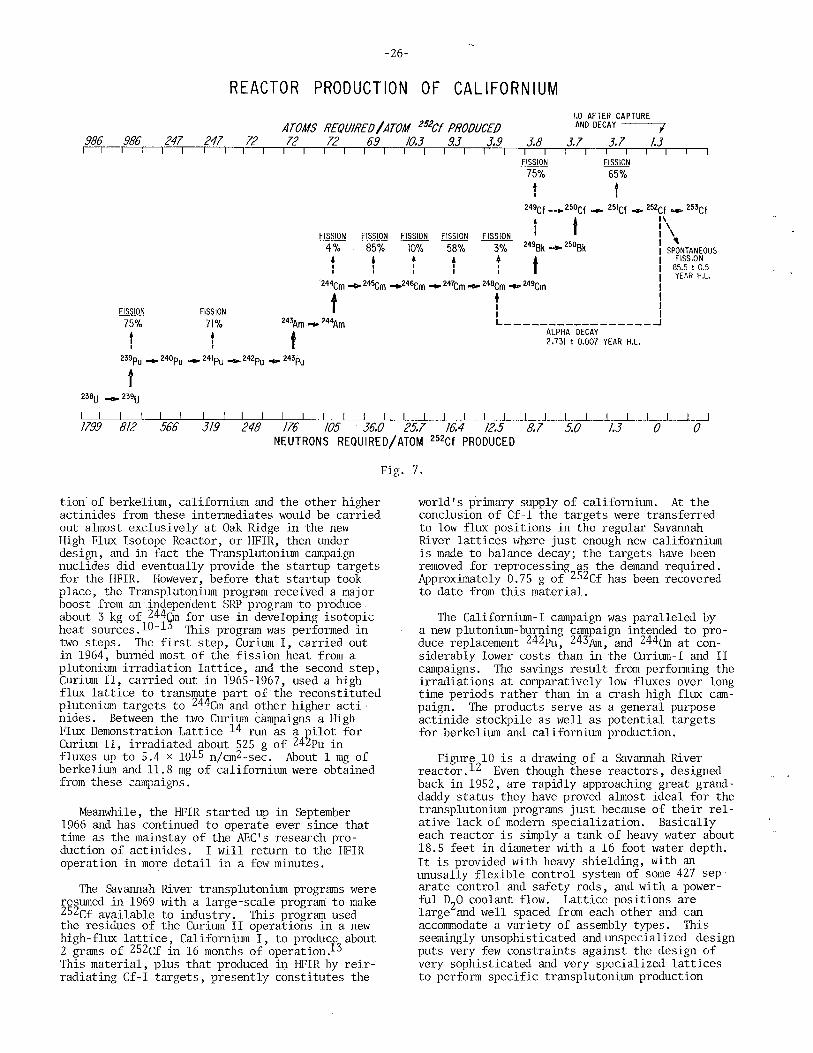
Production of Berkelium and Californium John L. Crandall, Savannah River Laboratory . ............. 22
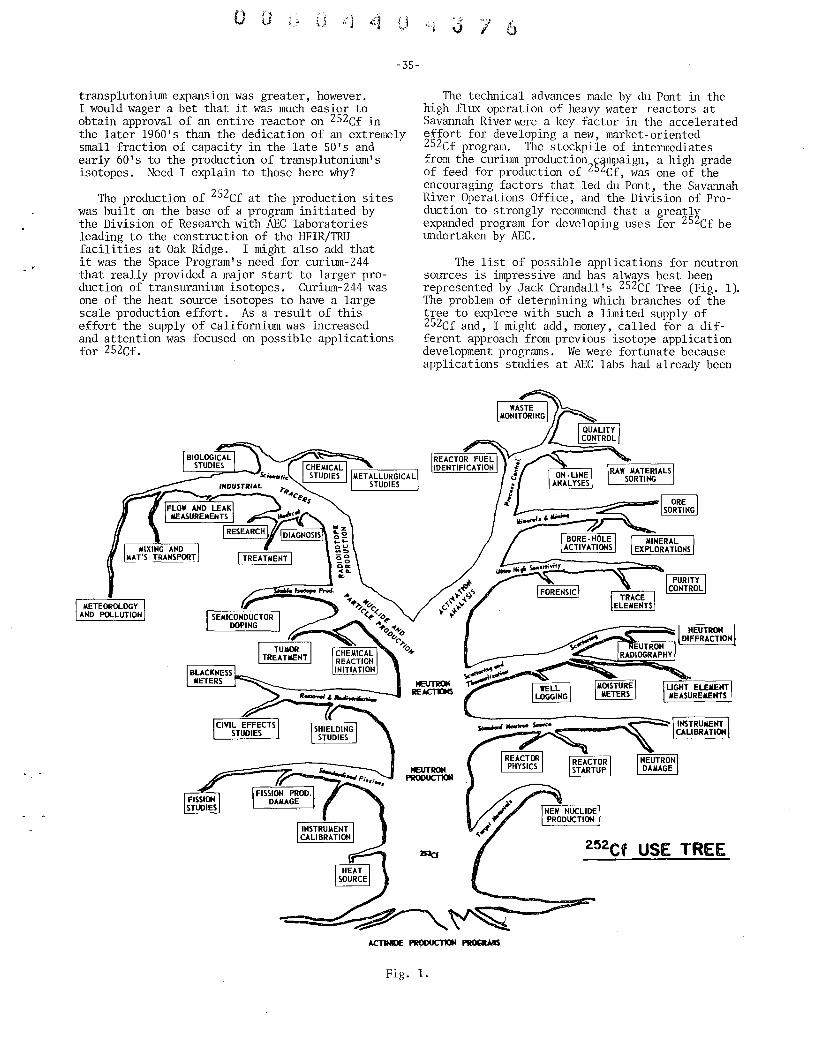
Status Report on 252Cf Frank P. Baranowski, U.S. Atomic Energy Commission . . . . . . . . . . 34
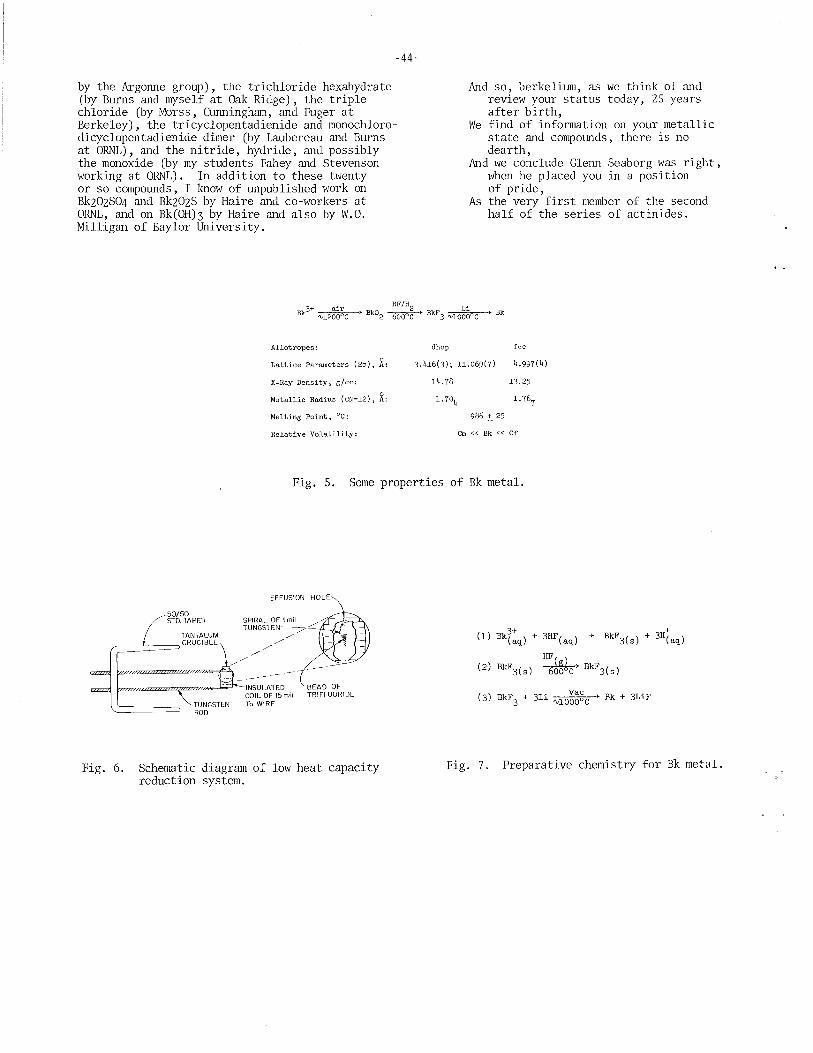
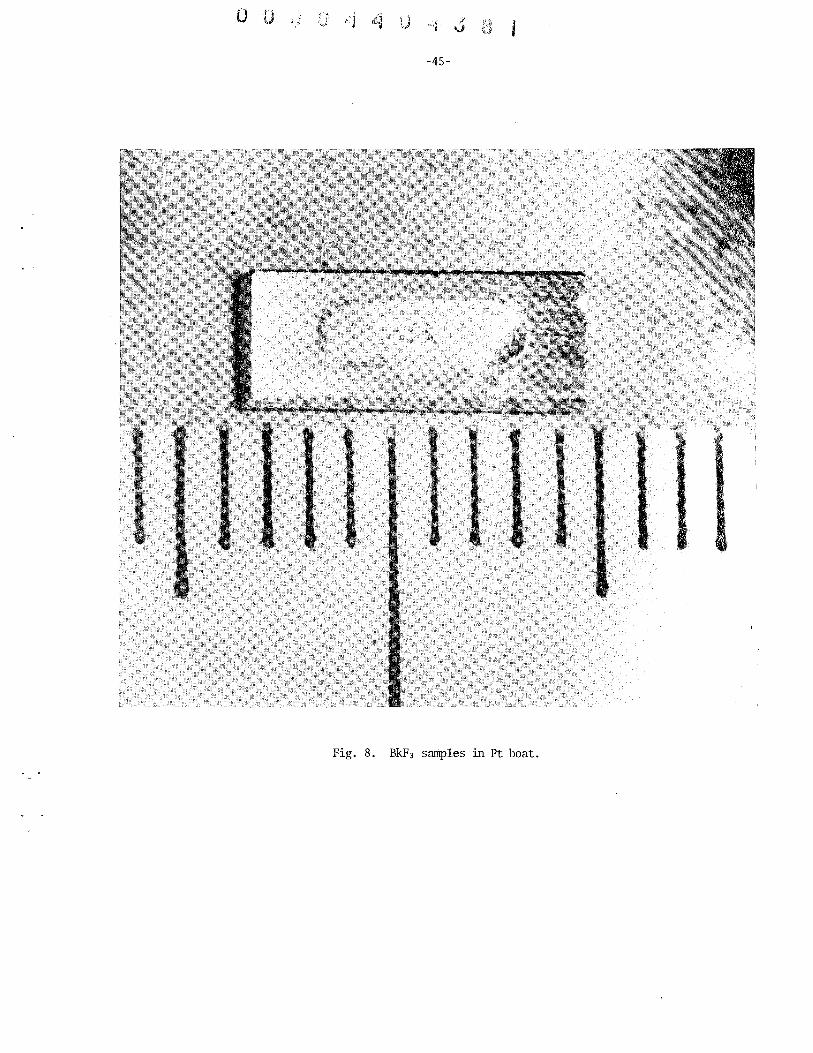
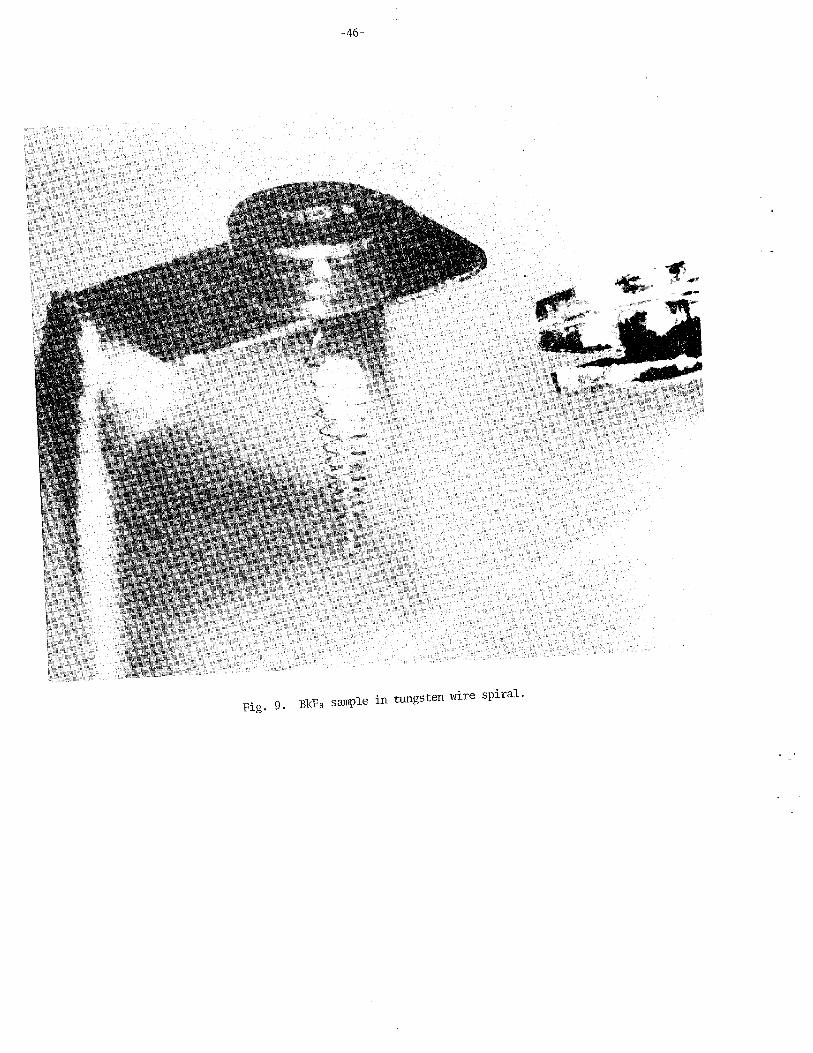
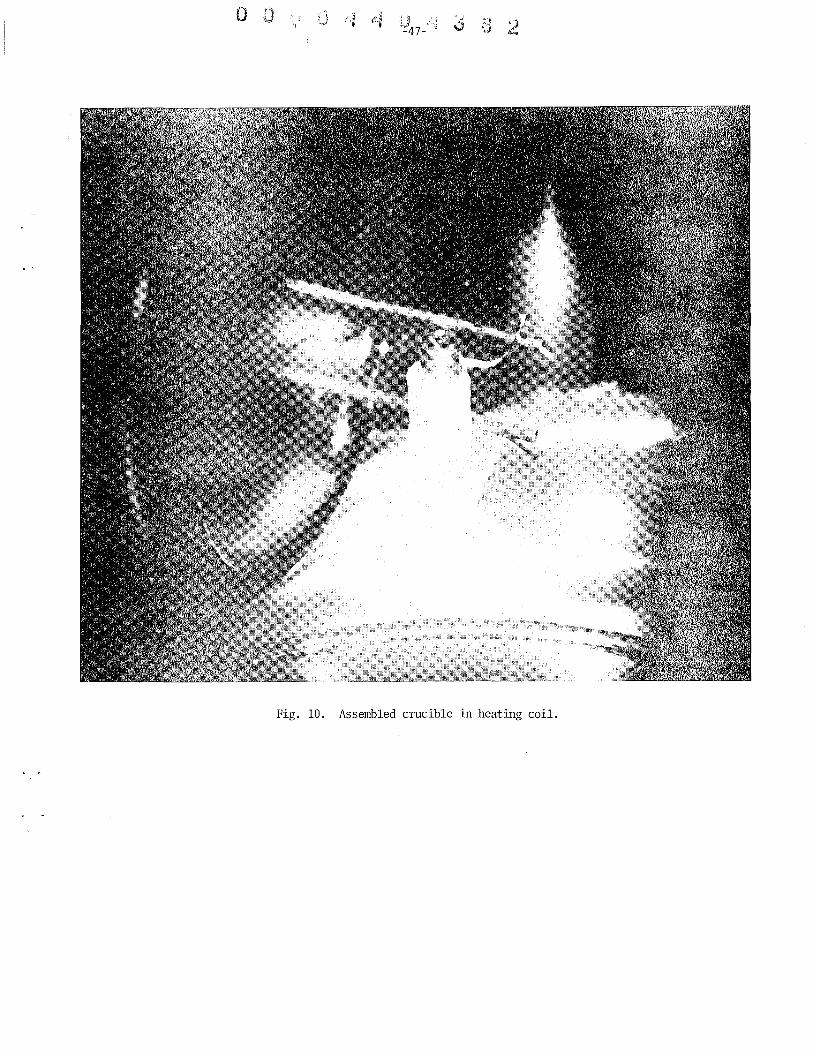
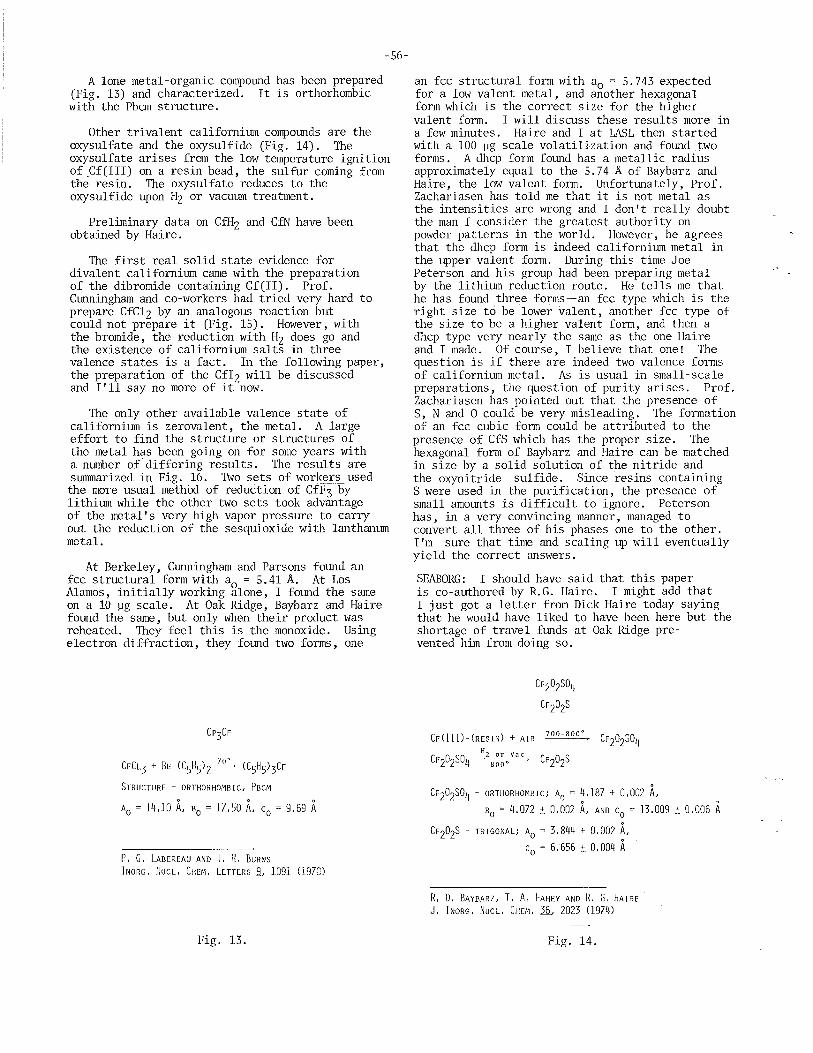
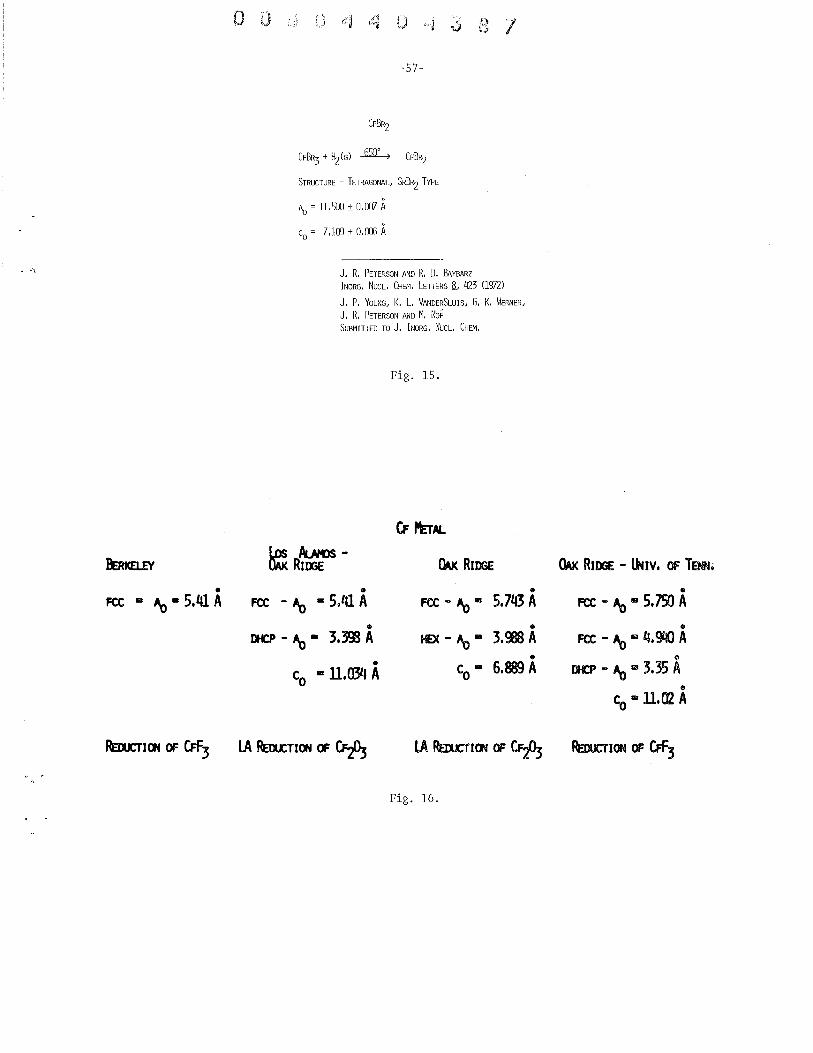
Synthesis and Properties of Berkelium Metal and Compounds Joseph R. Peterson, Oak Ridge National Laboratory . ..
Synthesis and Properties of Californium Metal and Compounds
....... 39
L. B. Asprey (with R. G. Haire), Los Alamos Scientific Laboratory . .. 52
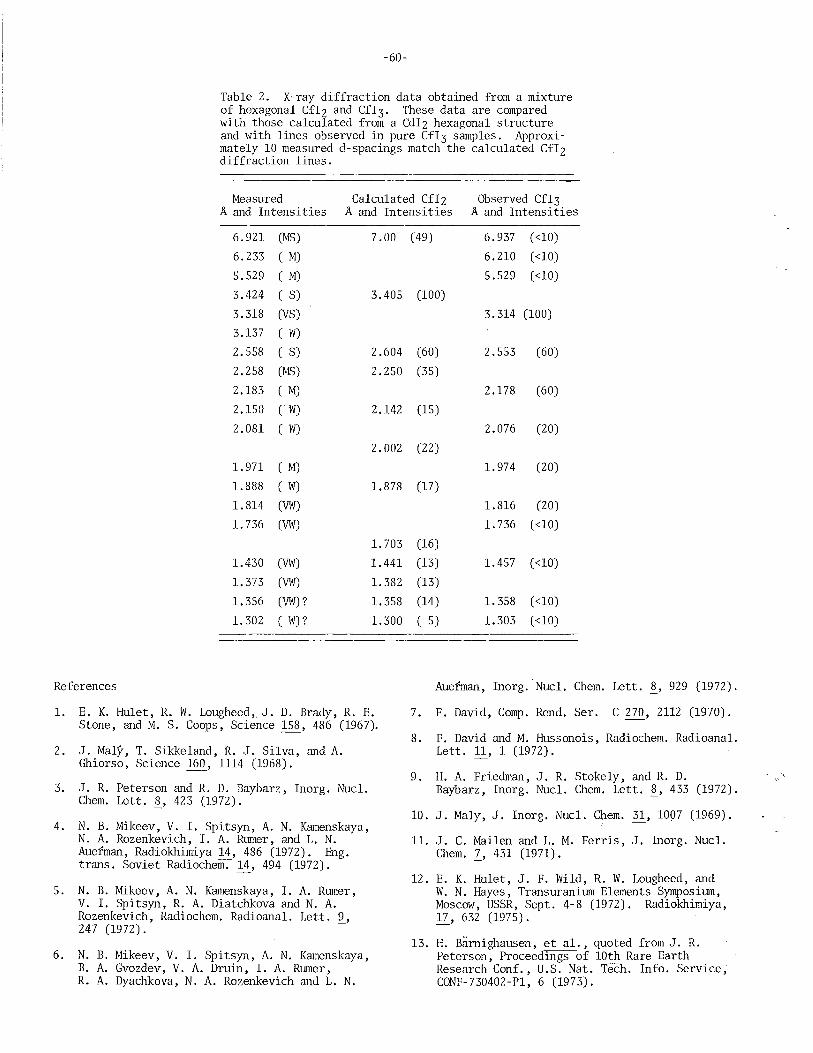
Preparation of Californium Di-iodide E. Kenneth Hulet (with J. F. Wild, R. W. Lougheed and W. N. Hayes), Lawrence Livermore Laboratory. . . . . . . . . . . . . . . . . . 58
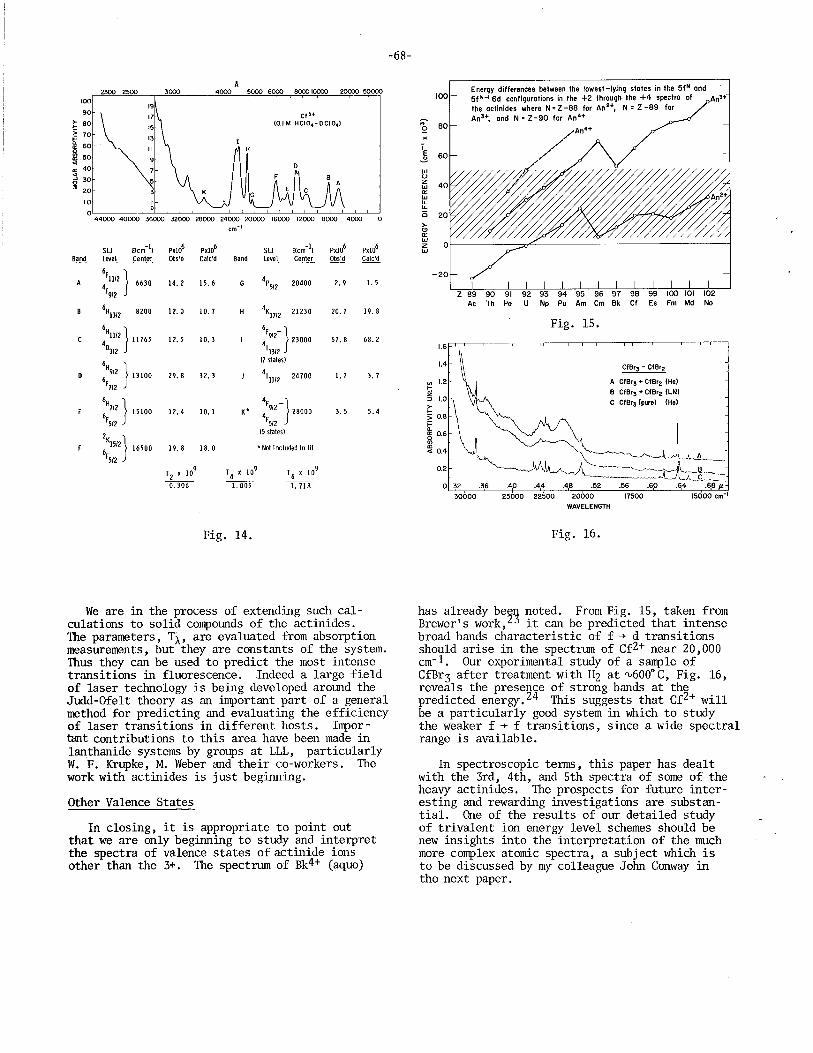
. 3+ 3+ Spectroscopic Propertles of Bk and Cf William R. Carnall (with S. Fried), Argonne National Laboratory . ... 61
Spectroscopic Properties of Cf(I) and Cf(lI) and of Bk(I) and Bk(II) John G. Conway, Lawrence Berkeley Laboratory . . . . . . . . . . . . . 70
Magnetic Properties of Berkelium and Californium and Their Compounds Norman Edelstein, Lawrence Berkeley Laboratory . . . . . . . . . . . . 75
o "j)
k-:; I
-v-
PREFACE
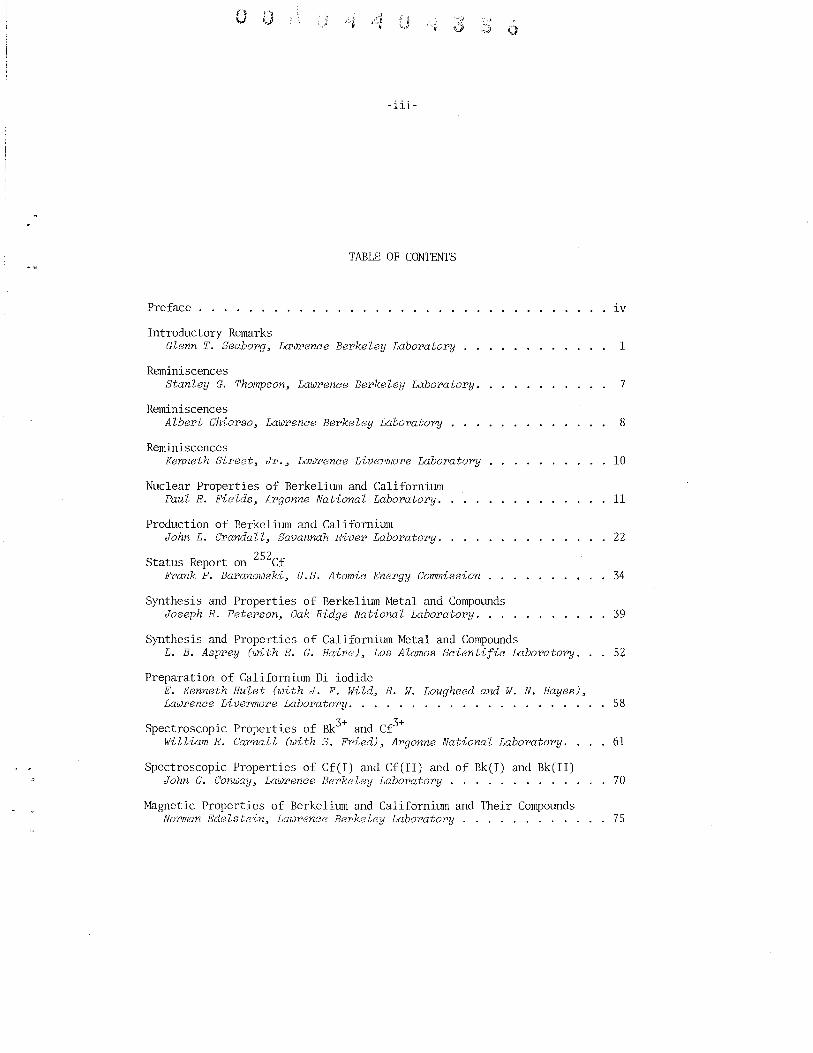
This volume includes the talks given on January 20, 1975, at a symposium in Berkeley on the occasion of the celebration of the 25th anniversary of the discovery of berkelium and californium. Talks were given at this symposium by the four people involved in the discovery of these elements and by a number of people who have made significant con-
tributions in the intervening years to the investigation of their nuclear and chemical properties. The papers are being published here, without editing, in the form in which they were submitted by the authors in the months following the anniversary symposium, and they reflect rather faithfully the remarks made on that occasion.
Stanley Thompson and Glenn Seaborg in 1948 when the work on the discovery of elements 97 and 98 was in progress.
-vi-
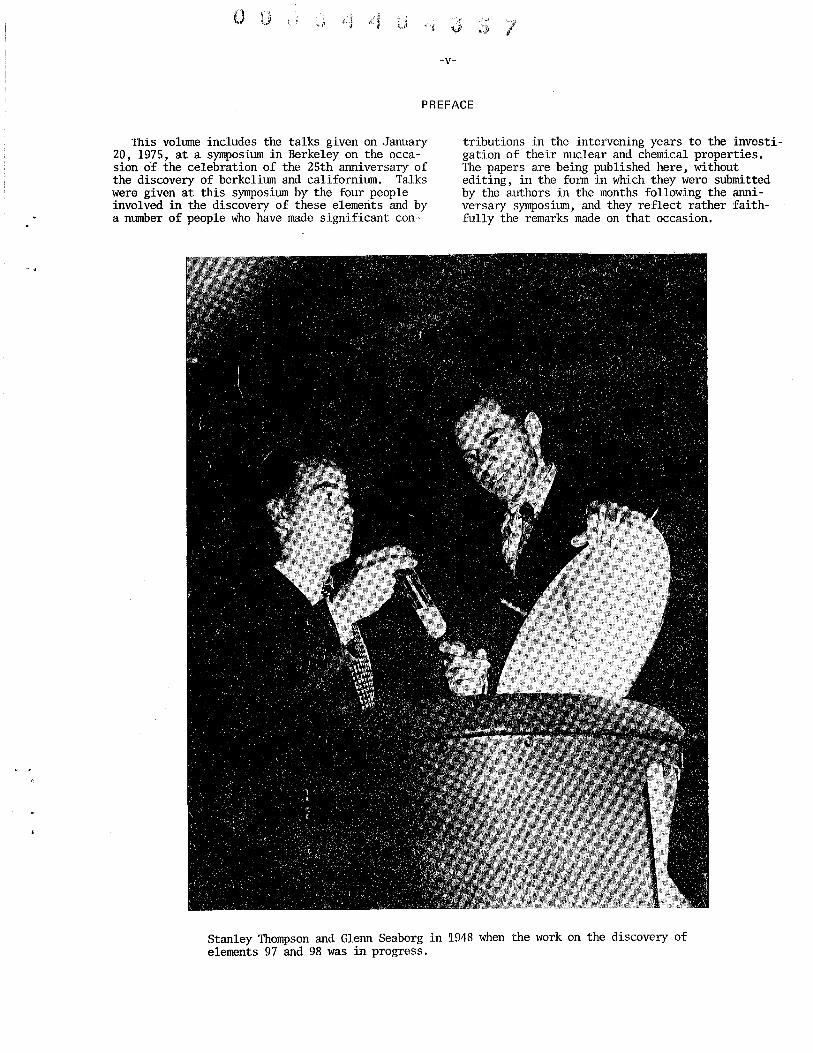
Albert Ghiorso inserts a sample into the equipment used in the discovery of berkelium and californium.
n t.J ~:'J u ~ci ",,) ~)
e~ ~I
-vii-
Kenneth Street, 1950.
-viii-
11
j ~
I . J
J JI .~
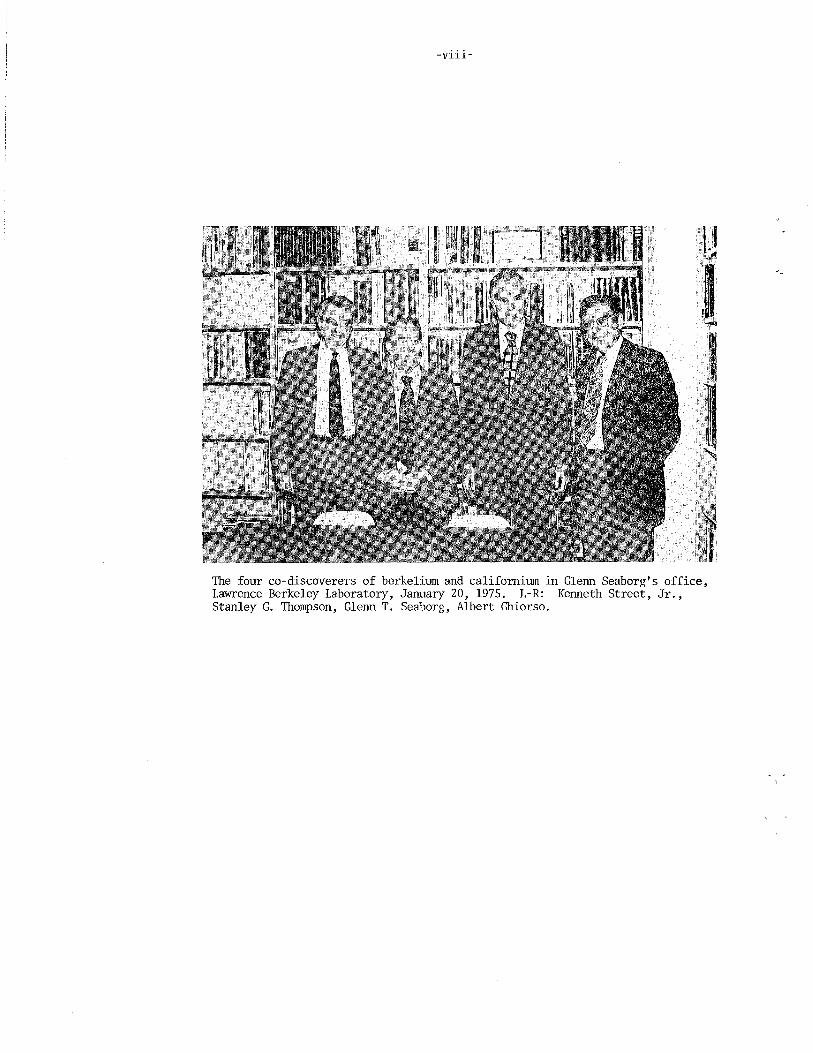
The four co-discoverers of berkelium and californium in Glenn Seaborg's office, Lawrence Berkeley Laboratory, January 20, 1975. L-R: Kenneth Street, Jr., Stanley G. Thompson, Glenn T. Seaborg, Albert Ghiorso.
o u -1-
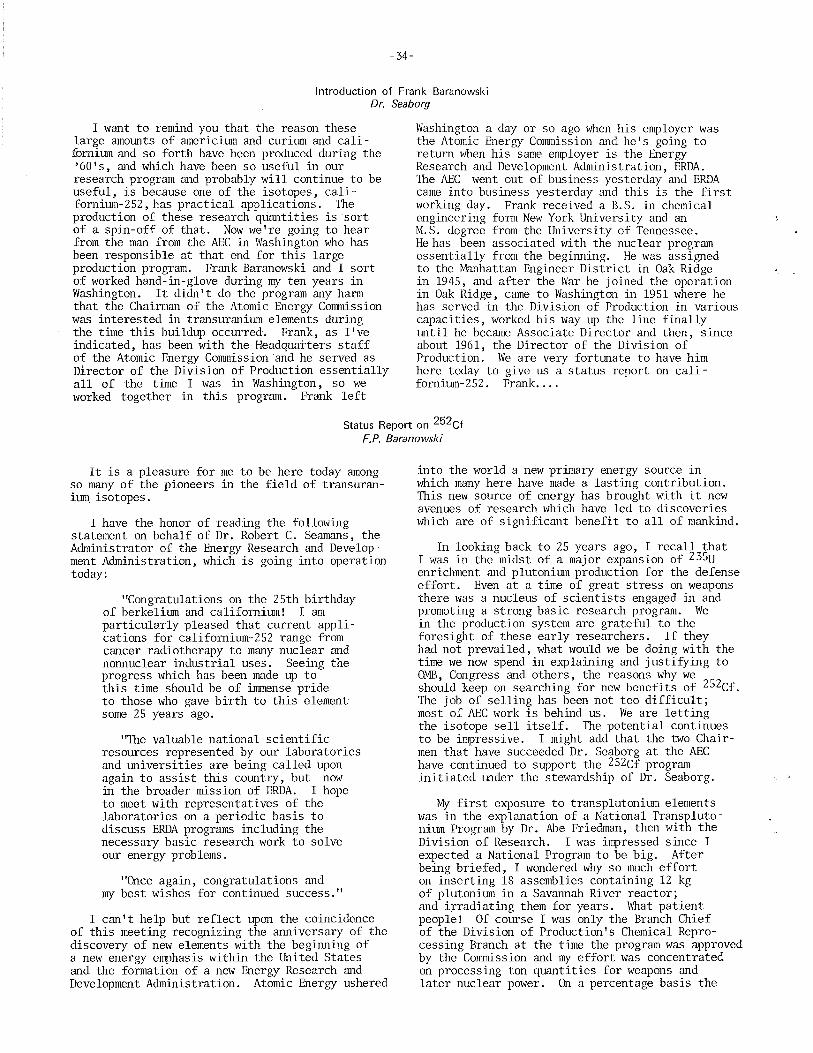
I ntroductory Remarks Dr. Seaborg
Welcome to the 25th birthday celebration of berkelium and californium. I'm gratified that so many people have thought it might be interesting enough to corne and be with us today. Actually, I think it's going to be a little bit more than an exercise in nostalgia; there are going to be some scientific considerations along with the reminis-
cences so I think you'll find it worthwhile. Actually, January 20, 1975, is an appropriate date for the 25th anniversary since the definitive chemical experiments that were performed on the discovery of berkelium were done on December 19. 1949, and on californium on February 9, 1950, so January 20, 1975, is a good midpoint for the 25th anniversary.
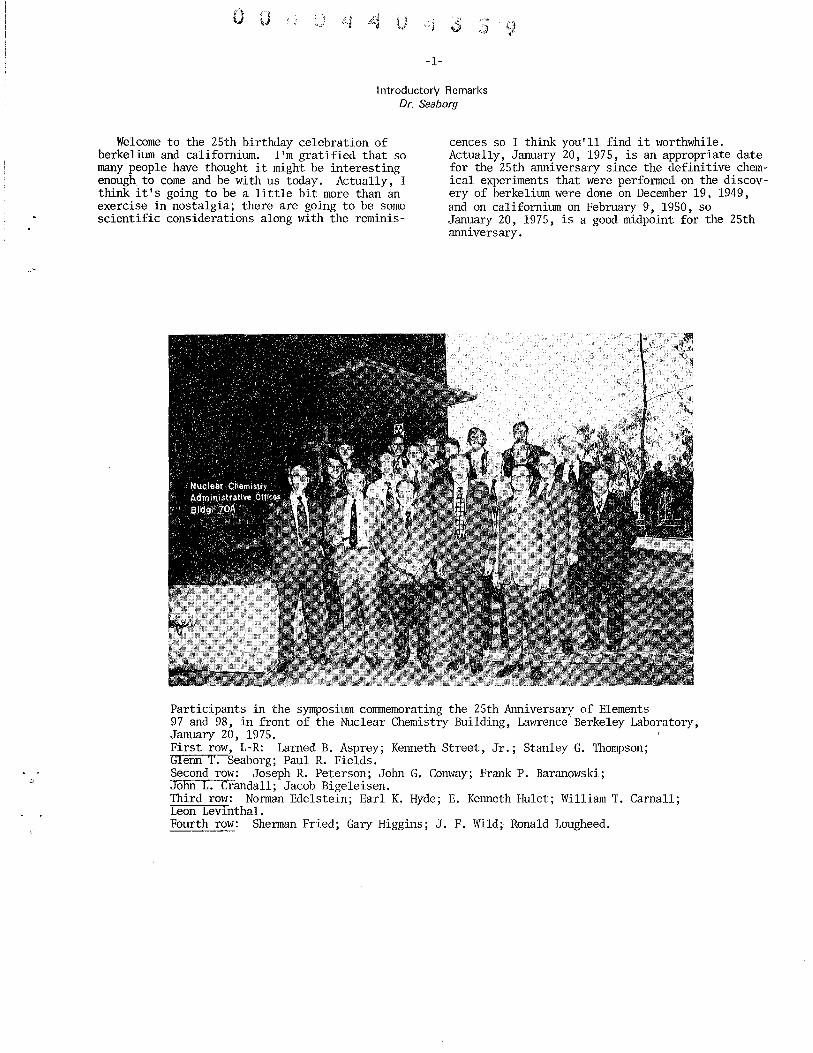
Participants in the symposium commemorating the 25th Anniversary of Elements 97 and 98, in front of the Nuclear Chemistry Building, Lawrence Berkeley Laboratory, January 20, 1975. First row, L-R: Larned B. Asprey; Kenneth Street, Jr.; Stanley G. Thompson; Glenn T. Seaborg; Paul R. Fields. Second row: Joseph R. Peterson; John G. Conway; Frank P. Baranowski; Johll L. Crandall; Jacob Bigeleisen. Third row: Norman Edelstein; Earl K. Hyde; E. Kenneth Hulet; William T. Carnall; Leon Levmthal. Fourth row: Sherman Fried; Gary Higgins; J. F. Wild; Ronald Lougheed.
-2-
Reminiscences on the Discovery of Berkelium and Californium
Glenn T. Seaborg
The discovery experiments were performed up in old Building 5, which still exists but is much changed today and hardly recognizable to those of us who remember its layout a quarter of a century ago. The space was cramped, the equipment, by today's standards, was crude, but I think we never enjoyed the scientific quest more than we did those days.
Fortunately, we have all of the discoverers with us today. However, in talking to Stan Thompson, Al Ghiorso and Ken Street, with the hope of going through their old notebooks with them in preparation for today, I found they have lost them. All of their notebooks, or scraps of paper with data on them, or whatever, have disappeared. And they can't find any of the equipment used for these historic experiments. What a sense of history! But of course in those days the experiment of the day was paramount, then on to the next experiment with its new equipment and new ideas. Why worry about the past?
Actually, the situation isn't as bad as I have depicted it. We have good notes covering our research meetings, much better than those we keep today (when we don't keep any), and the journal publications describing this work are unusually detailed and informative. And we have our memories, which have not failed yet--at least not completely. Preparing for today's session has been, for me, a pleasant, nostalgic journey into the past.
I recall that we began planning for the possible synthesis and identification of transuranium elements as soon as, or even before, we returned to Berkeley from the Chicago Metallurgical Laboratory; i.e., in late 1945 and in 1946. I thought that this would be a good Ph.D. thesis problem for Stml Thompson and it was, of course, natural that Al Ghiorso would participate on the radiation detection end of the problem as he had in the discovery of americium and curium in Chicago a year or two earlier.
On the basis of our confidence in the actinide concept we felt we could make the chemical identification, although we knew we would have to develop better chemical separation methods than were then available to us. And it seemed clear that we would use helium ion bombardments of americium and curium for our production reactions once these elements became available in sufficient quantity through production by prolonged neutron bombardment of plutonium, and we learned how to handle safely their intense reaioactivity.
We knew these things but we didn't anticipate how long it would take to solve these simple problems. Actually, three years went by before we found ourselves ready to make our first realistic experiment. Stan, who couldn't wait so long, went on and finished his Ph.D. thesis on another problem. The three years were consumed in arranging and waiting for the production of the quantities
of americium and curium needed for use as target material, developing the required extremely efficient chemical separation methods based on ion exchange and the required methods for safe handling of the intensely radioactive target material.
During the fall of 1949 we made a number of bombardments of americium with helimll ions in the 60-inch cyclotron, with emphasis on looking for alpha-particle emitting isotopes of element 97, all with negative results. It was becoming clear that we should look for electron capture decay by detecting the accompanying conversion electrons and X-rays, so Ghiorso worked to improve the detection efficiency for such radiations.
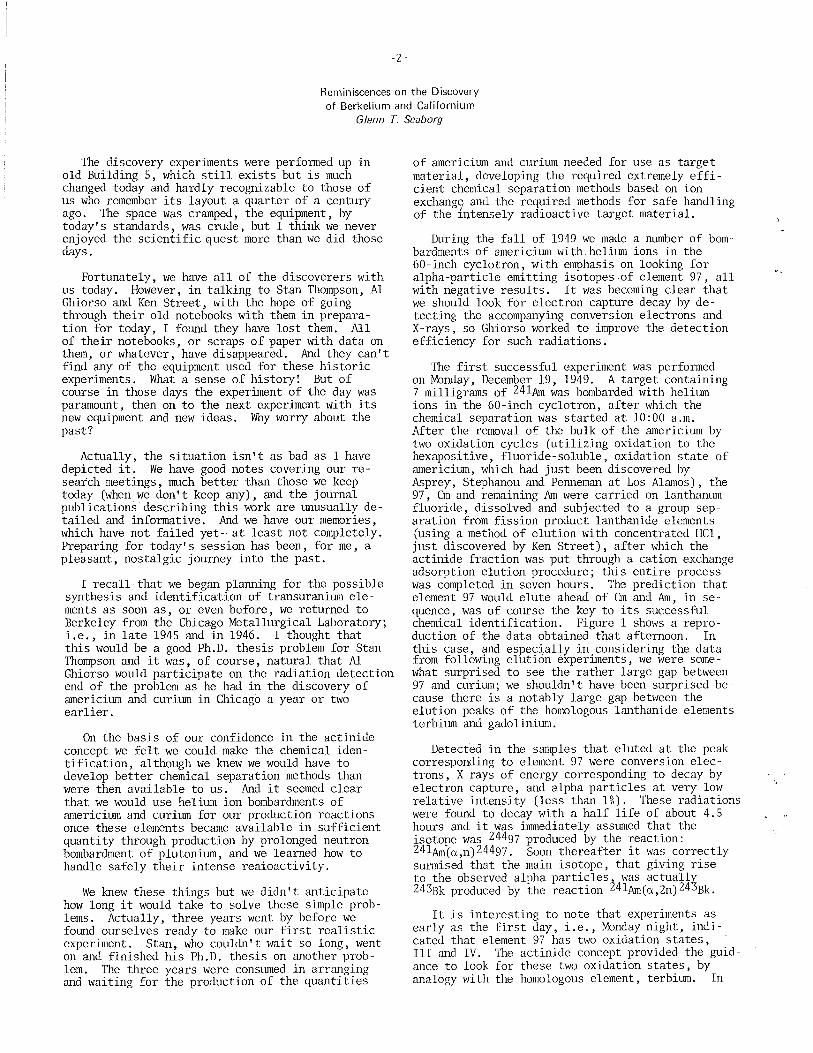
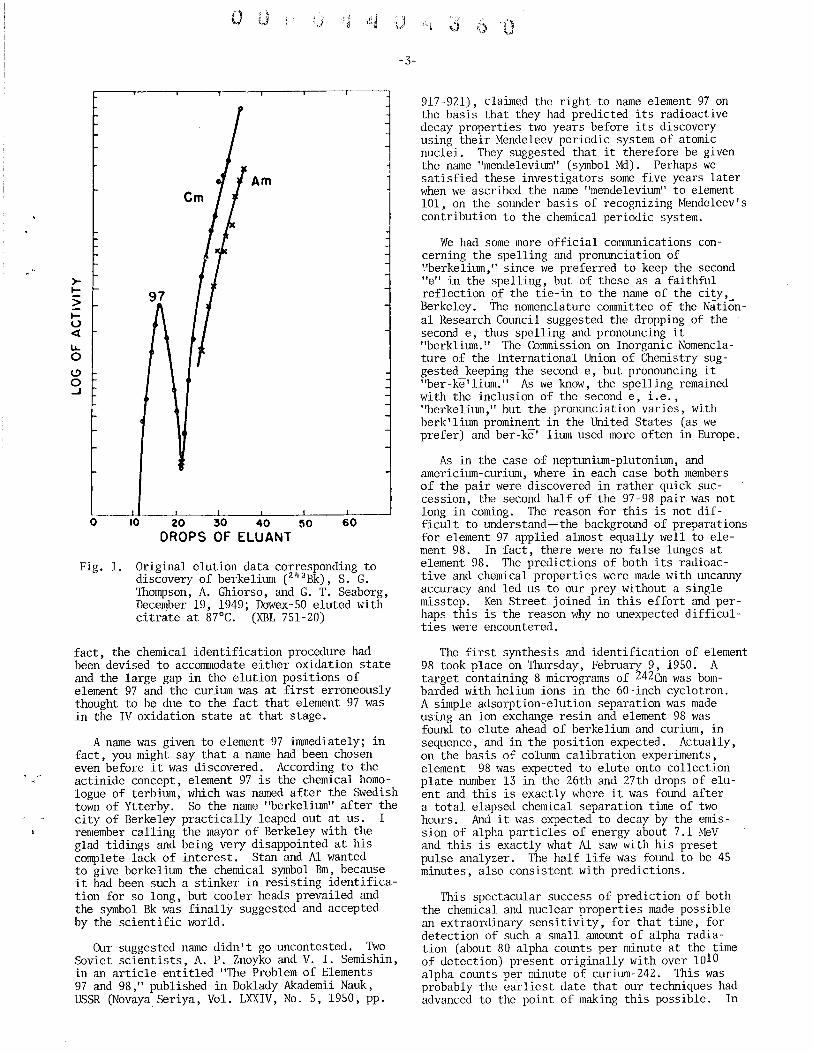
The first successful experiment was performed on Monday, December 19, 1949. A target containing 7 milligrams of 24lAm was bombarded with helium ions in the 60-inch cyclotron, after which the chemical separation was started at 10:00 a.m. After the removal of the bulk of the americium by two oxidation cycles (utilizing oxidation to the hexapositive, fluoride-soluble, oxidation state of americium, which had just been discovered by Asprey, Stephanou and Penneman at Los Alamos), the 97, an and remaining Am were carried on lanthanum fluoride, dissolved and subjected to a group separation from fission product lanthanide elements (using a method of elution with concentrated HCl, just discovered by Ken Street), after which the actinide fraction was put through a cation exchange adsorption-elution procedure; this entire process was completed in seven hours. The prediction that element 97 would elute ahead of an and Am, in sequence, was of course the key to its successful chemical identificatioll. Figure 1 shows a reproduction of the data obtained that afternoon. In this case, and especially in considering the data from following elution experiments, we were somewhat surprised to see the rather large gap between 97 and curium; we shouldn't have been surprised because there is a notably large gap between the elution peaks of the homologous lanthanide elements terbium and gadolinium.
Detected in the samples that eluted at the peak corresponding to element 97 were conversion electrons, X-rays of energy corresponding to decay by electron capture, and alpha particles at very low relative intensity (less than 1%). These radiations were found to decay with a half life of about 4.5 hours and it was immediately assumed that the isotope was 24497 produced by the reaction: 24lAm(a,n) 24497. Soon thereafter it was correctly surmised that the main isotope, that giving rise to the observed alpha particles was actuall~ 243Bk produced by the reaction 24lAm(a,2n)24 Bk.
It is interesting to note that experiments as early as the first day, i.e., Monday night, indicated that element 97 has two oxidation states, I I I and IV. The actinide concept provided the guidance to look for these two oxidation states, by analogy with the homologous element, terbium. In
o u ;) ! l~oj :J
>-~
> ~ U <l u.. 0 ~ 0 ..J
,----T-----.-----.,--·-,..---,---,-----,
Am
97
O-----tO~--~2~O---3~O~---4LO----5LO----~6~O~-~
DROPS OF ELUANT
Fig. 1. Original elution data corresponding to discovery of berkelium (243 Bk), S. G. Thompson, A. Ghiorso, and G. T. Seaborg, December 19, 1949; Dowex-50 eluted with citrate at 87°C. (XBL 751-20)
fact, the chemical identification procedure had been devised to accommodate either oxidation state and the large gap in the elution positions of element 97 and the curium was at first erroneously thought to be due to the fact that element 97 was in the IV oxidation state at that stage.
A name was given to element 97 immediately; in fact, you might say that a name had been chosen even before it was discovered. According to the actinide concept, element 97 is the chemical homologue of terbium, which was named after the Swedish town of Ytterby. So the name "berkelium" after the city of Berkeley practically leaped out at us. I remember calling the mayor of Berkeley with the glad tidings and being very disappointed at his complete lack of interest. Stan and A1 wanted to give berkelium the chemical symbol Em, because it had been such a stinker in resisting identification for so long, but cooler heads prevailed and the symbol Bk was finally suggested and accepted by the scientific world.
Our suggested name didn't go uncontested. Two Soviet scientists, A. P. Znoyko and V. I. Semishin, in an article entitled "The Problem of Elements 97 and 98," published in Doklady Akademii Nauk, USSR (Novaya Seriya, Vol. LXXIV, No.5, 1950, pp.
-3-
"\ .j .(,
0 r<\l <.>
917-921), claimed the right to name element 97 on the basis that they had predicted its radioactive decay properties two years before its discovery using their Mendeleev periodic system of atomic nuclei. They suggested that it therefore be given the name "mendelevium" (symbol Md). Perhaps we satisfied these investigators some five years later when we ascribed the name "mendelevium" to element 101, on the sOlUlder basis of recognizing Mendeleev's contribution to the chemical periodic system.
We had some more official commlUlications concerning the spelling and pronlUlciation of "berkelium," since we preferred to keep the second "e" in the spelling, but of these as a faithful reflection of the tie-in to the name of the city, Berkeley. The nomenclature committee of the National Research COlUlcil suggested the dropping of the second e, thus spelling and pronolUlcing it "berklium." The Commission on Inorganic Nomenclature of the International Union of Chemistry suggested keeping the second e, but pronolUlcing it "ber-ke'lium." As we know, the spelling remained with the inclusion of the second e, i.e., "berkelium," but the pronlUlciation varies, with berk'lium prominent in the United States (as we prefer) and ber-ke'-lium used more often in Europe.
As in the case of neptunium-plutonium, and americium-curium, where in each case both members of the pair were discovered in rather quick succession, the second half of the 97-98 pair was not long in coming. The reason for this is not difficult to understand--the backgrolUld of preparations for element 97 applied almost equally well to element 98. In fact, there were no false llUlges at element 98. The predictions of both its radioactive and chemical properties were made with lUlcanny accuracy and led us to our prey without a single misstep. Ken Street joined in this effort and perhaps this is the reason why no lUlexpected difficulties were encolUltered.
The first synthesis and identification of element 98 took place on Thursday, February 9, 1950. A target containing 8 micrograms of 242em was bombarded with helium ions in the 60-inch cyclotron. A simple adsorption-elution separation was made using an ion exchange resin and element 98 was found to elute ahead of berkelium and curium, in sequence, and in the position expected. Actually, on the basis of column calibration experiments, element 98 was expected to elute onto collection plate number 13 in the 26th and 27th drops of eluent and this is exactly where it was fOlUld after a total elapsed chemical separation time of two hours. And it was expected to decay by the emission of alpha particles of energy about 7.1 MeV and this is exactly what A1 saw with his preset pulse analyzer. The half life was fOlUld to be 45 minutes, also consistent with predictions.
This spectacular success of prediction of both the chemical and nuclear properties made possible an extraordinary sensitivity, for that time, for detection of such a small amolUlt of alpha radiation (about 80 alpha counts per minute at the time of detection) present originally with over 1010 alpha COlUltS per minute of curium-242. This was probably the earliest date that our techniques had advanced to the point of making this possible. In
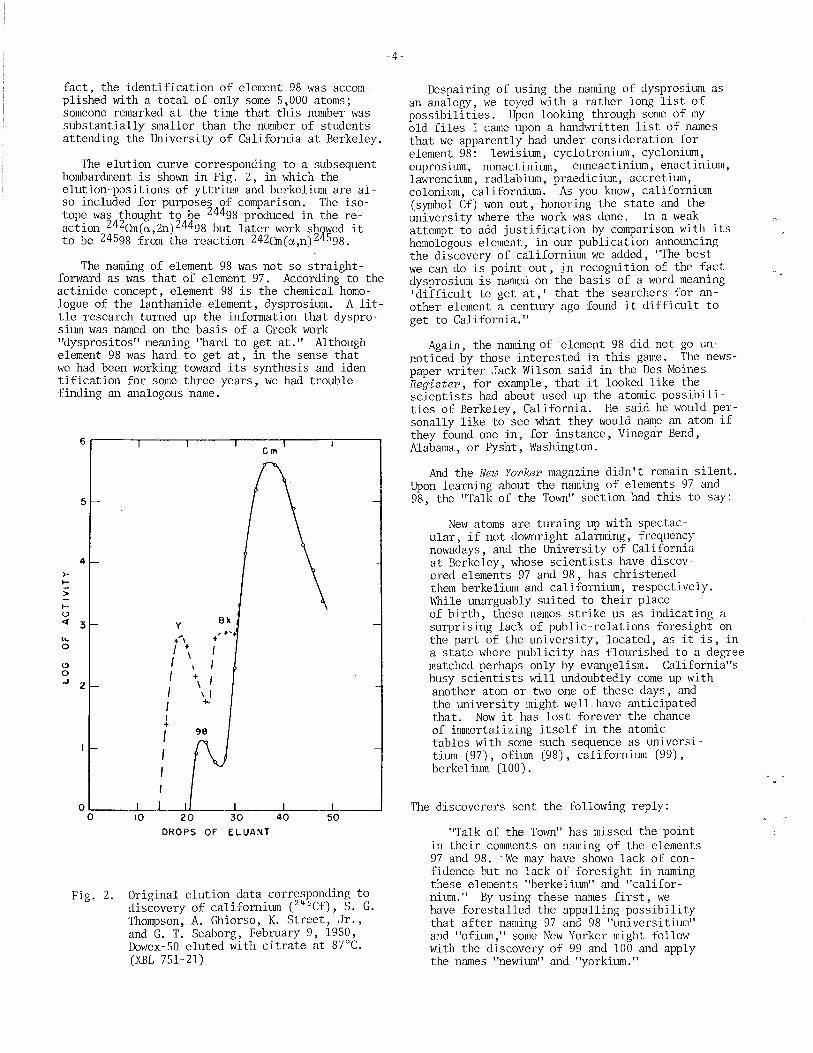
fact, the identification of element 98 was accomplished with a total of only some 5,000 atoms; someone remarked at the time that this number was substantially smaller than the number of students attending the University of California at Berkeley.
The elution curve corresponding to a subsequent bombardment is shown in Fig. 2, in which the elution-positions of yttrium and berkelium are also included for purposes of comparison. The isotope was thought to be 24498 produced in the reaction 242Cm(a,2n) 24498 but later work shswed it to be 24598 from the reaction 242Cm(a,n)2 598.
The naming of element 98 was not so straightforward as was that of element 97. According to the actinide concept, element 98 is the chemical homologue of the lanthanide element, dysprosium. A little research turned up the information that dysprosium was named on the basis of a Greek work "dysprositos" meaning "hard to get at." Although element 98 was hard to get at, in the sense that we had been working towar@ its synthesis and identification for some three years, we had trouble finding an analogous name.
>-I-
> I-<.> « LL 0
~ 0 ..J
6.-----.-----,-----,-----,-----,-----, em
5
4
:3 V Bk
+,", d'-
+ I + I I \
\ I I + I 2 \ I \ I I ....
98
OL-____ L-~ __ ll-____ L-____ ~ ____ ~ __ ~
o
Fig. 2.
DROPS OF ELUANT
Original elution data corresponding to discovery of californium (245 Cf), S. G. Thompson, A. Ghiorso, K. Street, Jr., and G. T. Seaborg, Pebruary 9, 1950, Dowex-50 eluted with citrate at 87°C. (XBL 751-21)
-4-
Despairing of using the naming of dysprosium as an analogy, we toyed with a rather long list of possibilities. Upon looking through some of my old files I came upon a handwritten list of names that we apparently had under consideration ~or element 98: lewisium, cyclotronium, cyclon1um, euprosium nonactinium enneactinium, enactinium, lawrenci~ radlabium, praedicium, accretium, colonium, ~alifornium. As you know, californium (symbol Cf) won out, honoring the state and the university where the work was done. In a we~ . attempt to add justification by. cOll1I?arison W1 t~ lts homologous element, in our publ1cat10n announc1ng the discovery of californium we added, "The best we can do is point out, in recognition of the fact dysprosium is named on the basis of a word meaning 'difficult to get at,' that the searchers for another element a century ago found it difficult to get to California."
Again, the naming of element 98 did not go unnoticed by those interested in this game. ~e newspaper writer Jack Wilson said in the Des M01nes Register, for example, that it looked. like t~e .. scientists had about used up the atom1C poss1b1l1-ties of Berkeley, California. He said he would p~rsonally like to see what they would name an atom 1f they found one in, for instance, Vinegar Bend, Alabama, or Pysht, Washington.
And the New Yorker magazine didn't remain silent. Upon learning about the naming of elements 97 and 98, the "Talk of the Town" section had this to say:
New atoms are turning up with spectacular if not downright alarming, frequency nowadays, and the University of Cali~ornia at Berkeley, whose scientists have d1SCOVered elements 97 and 98, has christened them berkelium and californium, respectively. While unarguably suited to their place of birth, these names strike us as indicating a surprising lack of public-relations foresight on the part of the university, located, as it is, in a state 'where publicity has flourished to a degree matched perhaps only by evangelism. California"s busy scientists will undoubtedly come up with another atom or two one of these days, and the university might well have anticipated that. Now it has lost forever the chance of immortalizing itself in the atomic tables with some such sequence as universi-tium (97), ofium (98), californium (99), berkelium (100).
The discoverers sent the following reply:
"Talk of the Town" has missed the point in their comments on naming of the elements 97 and 98. 'We may have shown lack of confidence but no lack of foresight in naming these elements "berkelium" and "californium. " By using these names first, we have forestalled the appalling possibility that after naming 97 and 98 "universitium" and "ofium," some New Yorker might follow with the discovery of 99 and 100 and apply the names "newium" and "yorkium."
i) ~, ( .~ •
The answer from the New Yorker staff was brief:
We are already-at work in our office laboratories on "newium" and "yorkium." So far we just have the names.
Before going on, I want to acknowledge the help of Burris Curmingham, Ken Hulet, and Gary Higgins in these experiments and in the preparation for them. Also critical to the success of the program were the contributions of Joe Hamilton, Bernie Rossi, Tom Putnam and M. T. Webb in operating the 60-inch cyclotron-in Crocker Laboratory, and of Nelson Garden, Bill Ruehle, C. M. Gordon and J. M. Davis for providing and supervising the use of the excellent protective equipment for handling in a safe manner the high levels of radioactivity involved.
The discovery and early subsequent investigation of a synthetic chemical element, of course, involves work with tracer amounts. The second most important milestone in an element's life, after its -discovery, is its first isolation in ponderable, i.e., macroscopic--usually visible or weighable-quantity. We had to wait until 1958 for this to happen to both berkelium and californium. In that year Burris Cunningham and Stan Thompson succeeded in isolating for the first time compounds of berkelium, as the isotope berkelium-249, and californium, as a mixture of the isotopes californium-249, -250, -251 and -252. These had been synthesized in the intervening years by the long-term irradia-
tion of plutonium-239 and its transmutation products with neutrons in the Materials Testing Reactor at the National Reactor Testing Station in Idaho.
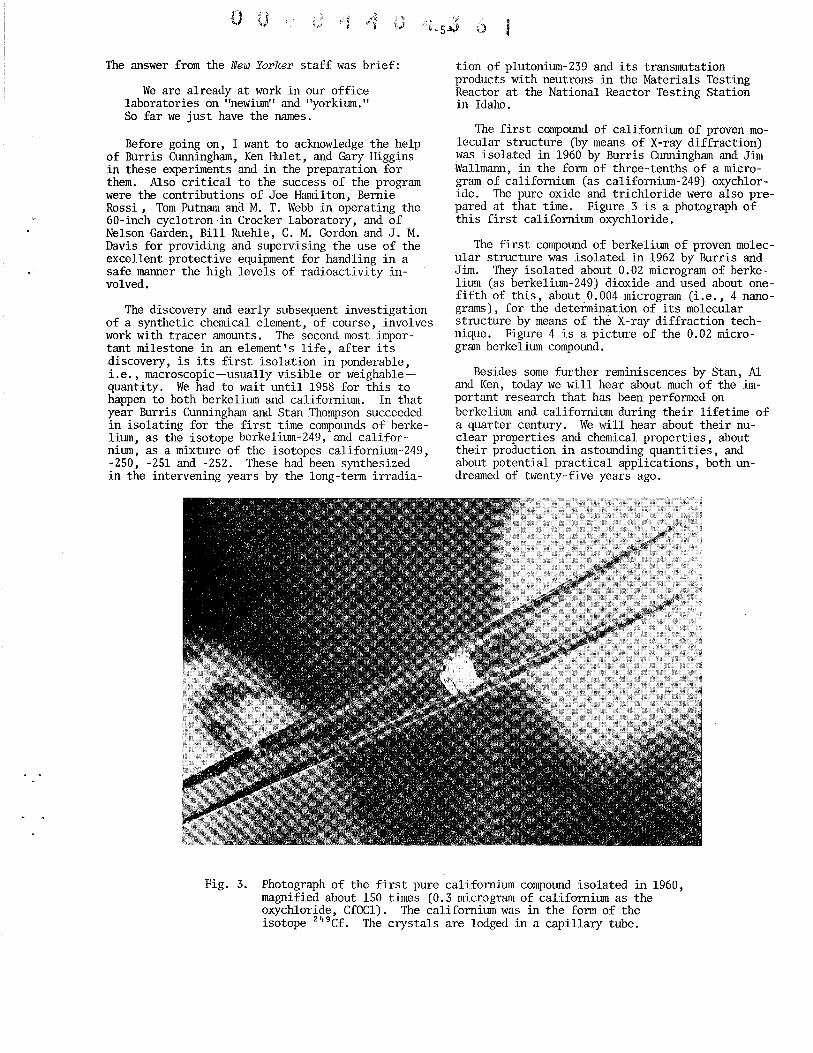
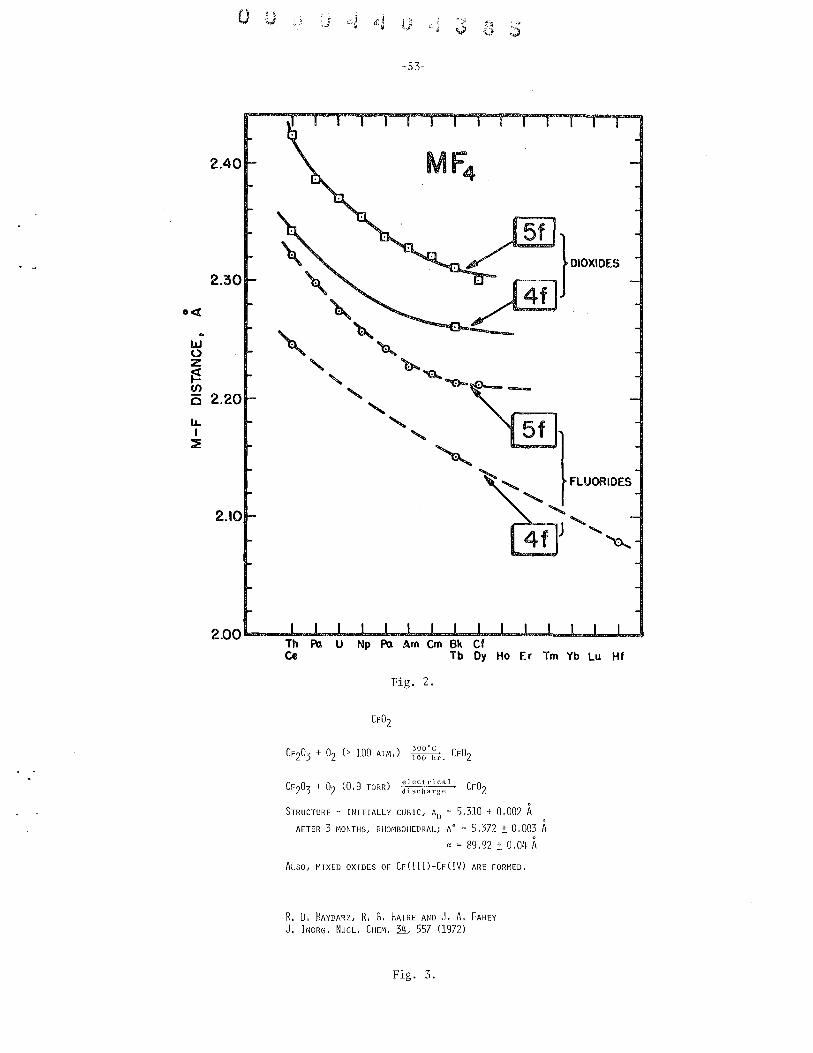
The first compound of californium of proven molecular structure (by means of X-ray diffraction) was isolated in 1960 by Burris Cunningham and Jim Wallmann, in the form of three-tenths of a microgram of californium (as californium-249) oxychloride. The pure oxide and trichloride were also prepared at that time. Figure 3 is a photograph of this first californium oxychloride.
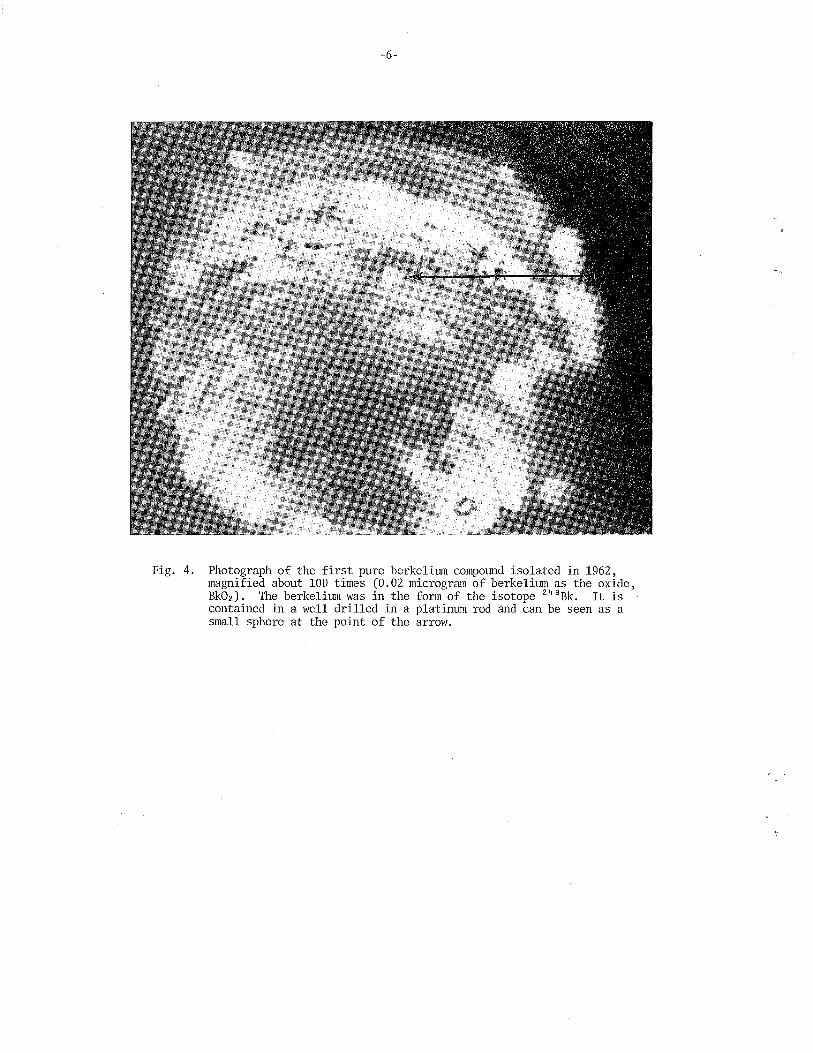
The first compound of berkelium of proven molecular structure was isolated in 1962 by Burris and Jim. They isolated about 0.02 microgram of berkelium (as berkelium-249) dioxide and used about onefifth of this, about.0.004 microgram (i.e., 4 nanograms), for the determination of its molecular structure by means of the X-ray diffraction technique. Figure 4 is a picture of the 0.02 microgram berkelium compound.
Besides some further reminiscences by Stan, Al and Ken, today we will hear about much of the important research that has been performed on berkelium and californium during their lifetime of a quarter century. We will hear about their nuclear properties and chemical properties, about their production in astounding quantities, and about potential practical applications, both undreamed of twenty-five years ago.
Fig. 3. Photograph of the first pure californium compound isolated in 1960, magnified about 150 times (0.3 microgram of californium as the oxychloride, CfOCl). The californium was in the form of the isotope 249Cf. The crystals are lodged in a capillary tube.
-6-
Fig. 4. Photograph of the first pure berkelium compound isolated in 1962, magnified about 100 times (0.02 microgram of berkelium as the oxide, Bk02). The berkelium was in the form of the isotope 249Bk. It is contained in a well drilled in a platinum rod and can be seen as a small sphere at the point of the arrow.
o 0 u -7-
Introduction of Stanley Thompson Dr. Seaborg
So with that I'll go next to the first of the following reminiscers, Stan Thompson. I'd like to say a few words about Stan before I ask him to come up here. I don't know whether I should admit this or not, but Stan and I have been friends about 50 years--it'll be 50 years this fall since we met each other as freshmen at a high school in the Watts district of Los Angeles. Stan got his A.B. in chemistry from UCLA in 1934 and came up to the Bay Area and worked at the Standard Oil Company in Richmond until 1942 when he joined me as a part of my Chemistry Section at the Metallurgical Laboratory where he worked until just after the end of the war. By the way, he was there
responsible for the conception of the process that was used for the isolation of plutonium in the Hanford production plant--the Bismuth Phosphate Process. Here at Berkeley he's the co-discoverer of the elements with the atomic numbers 97 through 101--berkelium, californium, einsteinium, fermium and mendelevium. He participated, as I said, in the first isolation of microgram quantities of berkelium and californium. He has done extensive work on fission and most recently he is carrying on research at the SuperHlLAC on heavy ion reaction mechanisms. He was awarded the American Chemical Society's Award for Nuclear Applications in Chemistry in 1965. And with that, I'd,like to ask Stan to come up to the lectern.
Reminiscences Stanlev G. Thompson
Well, I see a lot of old friends here today, people who were with us at the time of the early experiments we did when we first came to Berkeley. I see Herman Robinson, and Rosemary Barrett, and a number of other people. But, as Glenn said, a lot of work went into the discovery of these elements. I think the beginnings took place at the Metallurgical Laboratory in Chicago in 1945. As you may remember, the War was over in August 1945 and even by that time we had started to do experiments in preparation for the attempt to produce berkelium. In fact, the first experiments were done near Christmas time 1945.
Some other things we managed to accomplish at the ''Met'' Lab in Chicago were to arrange to get samples of americium and plutonium in the Hanford reactor for neutron irradiation to make isotopes that were useful later in the experiments we did at Berkeley. Of course, we also had a lot of experience in separating actinides from other elements and fission products, etc., as a result o£ our work on the Hanford separations process. We actually did the first ion exchange separations at Chicago--although they were rather crude compared with the separations developed later. We also had some notions about how to handle radioactivity, which were put into effect later when we came to Berkeley.
Well, when we got to Berkeley the cupboard was bare, more or less. We had to start from scratch and build up a lot of equipment. And as Glenn said, we had a lot of help from people like Nels Garden, Red Gordon, John Gifford, Bill Ruehle and others in designing and constructing equipment to handle radioactivity. We were successful in getting the gloved boxes, which are even used today; also what we called "junior" caves in which we made the separations behind a moderate amount of shielding and handled the radioactive material with tongs. We designed and obtained a thickwalled lead cave in order to do the really high level separations. We worked over the top of this cave with tongs and attempted to see what we were doing with mirrors overhead.
Extensive work was also done to improve ion exchange separations. I think Ken Street and Gary Higgins did a tremendous amount of work on that, finally making it possible for us to do the separations of the individual actinides using cation columns operating at elevated temperatures. Of course Ken also had great success in developing concentrated HCl cation column separations of the lanthanides and the actinides which were absolutely essential in our work on berkelium. Ken Hulet gave us very valuable help with the separations, especially at the time of the discovery experiments.
In addition a considerable amount of work was done in trying to predict the properties of the isotopes we attempted to discover. We worked on closed cycles and calculated masses, energies and half-lives. We used systematics, alpha half-life energy relationships for isotopes of the different elements, and even developed some rather crude electron capture systematics. In fact, the measured half-lives of the isotopes we finally discovered were not too far from the predicted values.
So, little by little during that four-year period, we were able to develop the tools for doing the final successful experiments. I could tell a lot of funny stories--in a few years like those when you work with people in a group such as ours with the people we had supporting us and helping with the experiments, a lot of amusing things are bound to happen. As one example, in the early days, about 1947, we attempted an experiment in which Burris Cunningham was working with us. Burris later on decided to drop out of the work on the new elements because of an extremely heavy load of other work. But, to return to the story, in those early days we attempted to take advantage of the expected +4 state of berkelium. We thought berkelium would have a +4 state about like cerium does, and we hoped to carry it in this state away from the americium target material using carriers like zirconium phosphate, bismuth phosphate and ceric iodate. Well, actually as
it turned out, these separations were too slow and too inefficient. In this particular experiment Burris and I worked about 36 hours straight doing these cycles and trying to get something out we could identify but without success. We were extremely tired--then we went to look outdoors and see what the weather was like. It was dark, it was cold, it was raining and windy, so I went to look for my coat and Burris helped me look. We searched for a long time and still we couldn't find my coat. Finally I happened to take a look
-8-
at Burris and discovered that he was wearing my coat.
Well, all of these things together--and I would say it was a great team effort--resulted in the final experiments that were successful. i\hen we did them, with the help of a good many excellent people, it didn't take us more than a few minutes to be rather sure that we had climbed the mountain, so to speak. Those days in fact were very exciting and I, for one, wouldn't mind having them back again.
Introduction of Albert Ghiorso Dr. Seaborg
Now I'd like to calIon Albert Ghiorso after a few words of introduction. Al graduated from Berkeley with a B.S. in electrical engineering in 1937. During the following years, he more or less contributed his services working for a manufacturer of geiger counters in the area, the firm that supplied us with some of our geiger counters at that time. After I'd gone to the Metallurgical Laboratory in the spring of 1942 I got a letter from Albert asking whether I would be willing to recommend him for some kind of a job in the Navy-I don't remember just what it was--but I knew enough about Al to realize that probably wasn't the place for him. Actually, I didn't know Al very well. This is one of those cases where our wives took over. My wife Helen, who had worked in the Laboratory here, as Ernest Lawrence's secretary, was a very good friend of Al's wife, Wilma, who was working here in the Laboratory as Donald Cooksey's secretary. When the letter came, Helen told me, "You hire this guy." So I wrote a letter back, enclosing a letter of recommendation
for the Navy, but telling him that I would like very much if he would come and work for us. He wasn't easy to convince; he was afraid that all had in mind was for him to continue building geiger counters. I assured him that that wasn't the case, that I had in mind a research position, although he still claims that the first six months or a year or so he spent a lot of time building geiger counters. Anyway, he worked for the four years or so that we were at the Metallurgical Laboratory, participated, as you know, in the discovery of americium and curium (elements 95 and 96) there, and then returned with a group of us to the Radiation Laboratory at Berkeley in the spring of 1946, where he has been ever since. Al has been awarded an honorary Doctor of Science degree from Gustavus Adolphus College in 1966; he's a recipient of the ACS Award for Nuclear Applications in Chemistry in 1973; and he is the co-discoverer of the transuranium elements with atomic numbers 95 through 106. I won't try to name them, I'd probably get mixed up. Al, would you come forward ....
Reminiscences Albert Ghiorso
The trouble with the 25th anniversary is that as our colleagues grow up we know that we don't really change. You look at one another and year by year things are pretty much the same and then someone comes up like Rosemary Barrett and shows us a picture of what we looked like 25 years ago-there was a time warp of some kind, I'm afraid.
I don't have any particular prepared remarks. I wanted to listen to what Glenn and Stan had to say and perhaps fill in a few gaps. One of the things that's obvious looking at this early work is the relative crudity of the equipment that we used, which was simply because it hadn't been developed yet and we were learning how to use it.
In the early experiments where Burris participated, for instance, Burris and Stan would work
. very, very hard with a tremendous number of separations, very difficult procedures, and end up with small samples. And they would hand it over to me and say, here, we're tired, you find out what's in it. And usually there would be a few alpha counts of something. One in particular, I remember, where we had 8-10 counts per minute of
what looked like curium-242 from an alpha pulse analysis but our accuracy wasn't that great, so I followed decay on it and sure enough at first we were very excited to find that the points indicated a half-life different than that of curium-242. And we kept on counting it and then ... you know the answer, of course, it was curium-242.
After some months it became obvious that we had to have detection of secondary electrons, Auger electrons from electron capture, and so I had to work on thin-window counters which were a bit unstable in those days; we worked on them but we were never really sure what we had. I could always accuse Stan and Ken of not having a clean sample so we had a lot of false alarms; then it turned out that we had one that really wasn't false, it was real .
And we worked on an Eck and Krebs, which is a commercial geiger tube, filled with xenon, to look at L x rays. We actually did show the difference between 96 and 95 x rays, in other words L x rays from the decay of 97 which were curium-characteristic x rays. We actually showed that these were
o , ~ c~ "I ~,J' <"~
curium x rays in our first paper, which was very nice.
Then we worked on gridded chambers to observe alpha particles. Now we knew by this time that alpha particles were really the thing to go after, and they are still my favorites because an alpha particle is so distinctive, it's almost like giving an atom a name. There aren't too many overlaps and we are able then, by being very careful, to get half-life and energies in relationships one to another to pinpoint atoms very carefully. Our early work starting in 1946, when a number of us came back from Chicago, was pretty much devoted to exploiting what you can do with the l84-inch cyclotron. It was working very well, and we would bombard targets of thorium and uranium and make a lot of spallation reactions and we came up with a whole new series of isotopes, families, and got to be pretty good at it. Even though our methods were crude, we were able to show the difference from one series to another, and it amounted to working on perhaps 30 to 40 different alpha-emitting nuclides. So we became fairly familiar with a technique that got to be pretty powerful.
The name of the game, however, was to do it at a very low level with very high sensitivity against no background. Well, in those days things were somewhat crude so you couldn't do the nice experiments that one can do now where you can look at literally one alpha particle that decays perhaps in months and be sure that you're not making a mistake. At that time we weren't really confident all the time, but we worked at it and of course the techniques became very valuable. I remember the particular day when we say the three alpha peaks of the decay which is characteristic of berkelium-243--they stood out loud and clear. For a while we thoUQht we had two different isotopes.
But these three peaks which we say--an intensity of some counts per minute--you could just take a look at them and glory that these mWlts were there.
Now the instrument that we used was a 48-channel instrument, 48 whole channels of pulse analysis. That was the biggest in the world and it was kind of crude. It was developed originally in Chicago by Herman Robinson and some other people and we had reproduced an advanced copy here at Berkeley. So here we had these 48 channels; each one of the channels drove a mechanical register directly. There were no scalers, so the counting rate was limited, but the counting rates we had were never very high so it was not any great problem. Here we had these dial-like instruments, arranged in rows on a rack one after the other; at first we used to set these by hand. It was quite
;J
-9-
a job to use your fingers and set them all back to zero--you got to be pretty skillful. So we got pretty tired of that and Herman thought, well, let's have a little bit of advanced technology and so he had the registers changed Slightly and devised circuitry to set them back mechanically. We just
.. J 'y , {) .j
drove them at 60 Hertz till we came to this mechanical stop. After we were through with our spectra we would press the button and these would all go whizzing back--it was quite a spectacle-until they stopped at zero. And the power supply was up here, great big thyratron power with the power supply right in the open, about 440 volts pulsating D.C. going into these 48 registers. It was a lot of power.
Well, that worked well, but a few years later this got even with me, I'm afraid. Something went wrong as I stood on a stool, like this, and I was up here and somehow I was holding onto the rack and my other hand hit that cap, like this--I violated my rule, and everyone else's rule, never to use more than one hand in any place where you might have a problem--and I was frozen in place, and the hell of it was I knew I was frozen, I couldn't get off. I could see myself being electrocuted. Fortunately Herman had thought ahead. Right up here there was an "off" button and an "on" button. I slumped on this stool, actually I was in front here, I slumped and my breast hit the off button and I fell to the floor. History would have been a little different if that button hadn't been there, I assure you, because I was well on my way to being electrocuted. I'll never, never forget that the rest of my life, because it had a real effect. This happened a few years later, just about the time we were doing the experiment on element 101.
[A round of applause for Herman.]
The work was difficult and it was primarily a chemical accomplishment. The counting was sort of anti-climactic, the real work had to go into separating these small targets, these small amounts of samples from these horrible bombardments. This was the time when chemistry really paid off, and I think Stan and Ken deserve the plaudits for their tremendous accomplishment because it really was a chemical achievement at that time. As we proceeded to higher elements it became a more and more physical thing until today we can't even do chemistry. That becomes something we hope to do in the later stages.
Well, this reminds me of the fact that this is another anniversary. Twenty-five years ago we started doing heavy ion work at the 60-inch cyclotron. There weren't any heavy ions up to that time. I remember going down there once a week, working with Bernie Rossi, to develop ion sources. We made bombardments and discovered how to make exotic ions as heavy as oxygen--as high as we ever got. That led to plans eventually where Luis Alvarez proposed a Hilac, which led to the SuperHILAC--actually through the omnitron to the SuperHILAC. So to me it's been a relatively short period. It doesn't seem like twentyfive years and yet obviously it has been, and it's been a very rewarding period for me.
-10-
Introduction of Kenneth Street Dr. Seaborg
Ken Street holds the unusual distinction of being a native Berkeley, California. He was born in Berkeley and he got his B.S. in chemistry here at the University in 1943, then he went into the Marine Corps, came back to the University and did his research, his Ph.D. work, here in the Radiation Laboratory. Actually, he was one of my students. I'm very proud to say that he got his Ph.D. under me. That doesn't mean I taught him anything. When you have a man like Ken Street, he teaches you more than you ever teach him. He joined the faculty; of course we recognized that we had a good man and we immediately tried to persuade him, and succeeded, to become a member of the faculty at Berkeley in the Chemistry Department. And he
was a member of the faculty until about 1952 or so when he began an association with the Livermore Laboratory, now the Lawrence Livermore Laboratory; he served in various capacities there as Chemistry Division director, and so forth, on up the line, until 1958-59 when he was the Deputy Director of the Livermore Laboratory. Then he returned to Berkeley as a full Professor of Chemistry in 1959, and at all times while he was at Berkeley he did his work in the Radiation Laboratory, intimately connected with the Berkeley campus. In 1974 Ken went back to the Lawrence Livermore Laboratory as Associate Director for Energy and Resource Programs. His research interests have been in nuclear chemistry, molecular spectroscopy and geochemistry. Ken ....
Reminiscences Kenneth Street, Jr.
I must say, a few weeks ago when Glenn called me and told me he was planning a little session on reminiscences to celebrate the discovery of berkelium and californium, I had more in mind a few of us gathering around a fire with a beer or two, telling a few dirty stories and recounting some of the minor felonies we committed in the course of getting the job done. I'm confronted with microphones and cameras--my instinct of preservation says I should give my name, rank and serial number and sit down. Actually, I regard myself as being very fortunate to be here and to have been a part of this work. I was not a member of the Chicago Mafia that came west after the war and had been working on these things and continued for a long time afterwards. I am sort of a transient in the transuranium business--I was in it for only a period of about four years and have been doing other things since.
Glenn asked me to say a little bit about the development of some of the ion exchange chemistry that went into the final solution of the problem of getting berkelium and californium out in a form in which we could identify them. I started in this business as a graduate student when I came to work for Glenn in 1946. As with most of us in those days, lowe a great debt to Burris Cunningham, too, for pointing me in this direction to solve a number of the problems that we had at that time. We also had a lot of help later on, as Stan and Glenn have mentioned. Gary Higgins and I, Ken Hulet and Stan, all worked very closely -together in developing these techniques.
My first problem when I arrived up the Hill with Glenn was to find some way of getting a reasonable separation of americium and curium from the rare earth fission products. I was following in the footsteps of some people that some of you know, most of you probably--Ralph James and Tommy Morgan, who had been working on americium and curium isotopes with Glenn both in Chicago and back out here. They had identified most of the longer-lived alpha-emitters and my task was to carryon this work with the lighter isotopes of americium and curium. These were all expected to decay by K-electron capture to a
large extent, and we might very well be much more interested in the electromagnetic radiation than had previously been the case. So I set about to see if we could find some way to separate the actinides from the rare earths and I must admit that my start on this was mainly a matter of desperation. I had to do it one way or another and we would have settled for almost anything. The early work was directed at simply finding a way, we hoped, to move the actinides enough with respect to the rare earths so that the actinides, elements like americium which overlapped promethium on the column which was eluted with citrate ion--which was the common technique thenwould be moved at least a little bit so that by doing two ion exchange runs we could separate the actinides from the rare earths.
I'd like to be able to say we had a very carefully laid out plan based on fundamental theory and using the latest techniques and extrapolations of well known and established principles to do this work. As a matter of fact, I think our procedure much more closely paralleled a dictum that Earl Hyde has often quoted to me, "If you root around under an oak tree long enough, you stand a pretty good chance of coming up with an acorn." A number of us started rooting pretty hard and we didn't go very far looking for things to try. We used almost anything that was at hand, starting with very exotic reagents like nitric, phosphoric, sulfuric and hydrochloric acids. Fortunately things turned out much better than we had any reason to expect. We very early discovered that not only did HCl, even at concentrationS-as low as 6 M, displace the actinides-with respect to the rare earths sufficiently far that you could clearly make a separation in two ion exchange runs, using both citrate and HCl as eluants, but we also fell into very good fortune and when we kept pushing the concentration of HCl higher and higher--and as I recall we got all the way up to 13.5 M, and then started pouring in alcohol to increase the activity still further-the whole actinide group moved up and eluted well ahead of lutetium so we had a very rapid group separation of the actinides from the rare earths.
O·
U
I'd like to say that there were a number of people who contributed to this and also to the work that was done later in order to calibrate the citrate columns so that we could make the final runs in December that resulted in the identification of californium. I think,like my colleagues have alluded to previously, all these things come after a lot of people have made a lot of contributions that finally stack up enough of the blocks so that you can put the whole thing
-11-
together. I regard myself as being extremely fortunate to have been around, and as Glenn said maybe I was waiting for this--I was born in Berkeley and have been here most of my life. But I was here at the right time and the right place and so got to take part in this very exciting adventure.
SEABORG: Ken, you didn't make it very clear where you poured that alcohol.
I ntroduction of Paul Fields Dr. Seaborg
The next speaker is Paul Fields. Paul is the Director of the Chemistry Division at the Argonne National Laboratory, which was the successor to the Metallurgical Laboratory that you've heard mentioned so often today. Actually, Paul also worked in my Section at the Metallurgical Laboratory and I've been doing some research and actual writing on the history of those early days so I can tell Paul that he began to work on September 10, 1943, in the Metallurgical Laboratory. He worked first on the adsorption method of separating and isolating plutonium, and after that he worked in what we called the recovery group. I don't know whether that means much to many of you, but to anybody in those days it is very descriptive. We had a group to which everybody unloaded all of their plutonium wastes when they finished their experiments. And then Paul and his people were expected to gather these all together and concentrate them and somehow give us back pure plutonium so that the plutonium could be recycled. You know, in those days the only plutonium we had was made by the bombardment of hundreds of pounds of uranium with the neutrons
from the cyclotron and it was very precious; we never had as much as a whole milligram at any time in our Section. Before he came with us he worked with TVA. Along about the summer of 1945, he, along with a number of others, was transferred to the Mound Laboratory of the Monsanto Company in Dayton, Ohio, to work on polonium. I guess this was about as dirty a laboratory as Paul has ever worked in. The way they handled polonium in those days was very primitive indeed. He worked for about a year with the Standard Oil Company and then came back home to the Argonne National Laboratory. In 1970 he received the American Chemical Society Award for Nuclear Applications in Chemistry. So far this seems to have been almost a criterion for being a speaker on this program, but that isn't actually the case. He has a very distinguished research record doing work on the nuclear and chemical properties of the actinide elements, on nuclear structure and nuclear reactions in general, and in particular has worked on the nuclear properties of the elements that we are honoring today. His paper is appropriately entitled "The Nuclear Properties of Berkelium and Californium." Paul ....
The Nuclear Properties of Berkelium and Californium
Paul R. Fields
Glenn Seaborg asked me to recall any remInIScences associated with berkelium and californium that might come to mind, which I have done. However, most of these memories are associated with the heavier isotopes of these two elements. Since previous speakers have covered the discovery of these two elements fairly thoroughly, I will concentrate on the nuclear properties of these elements and some of the history that followed their discovery.
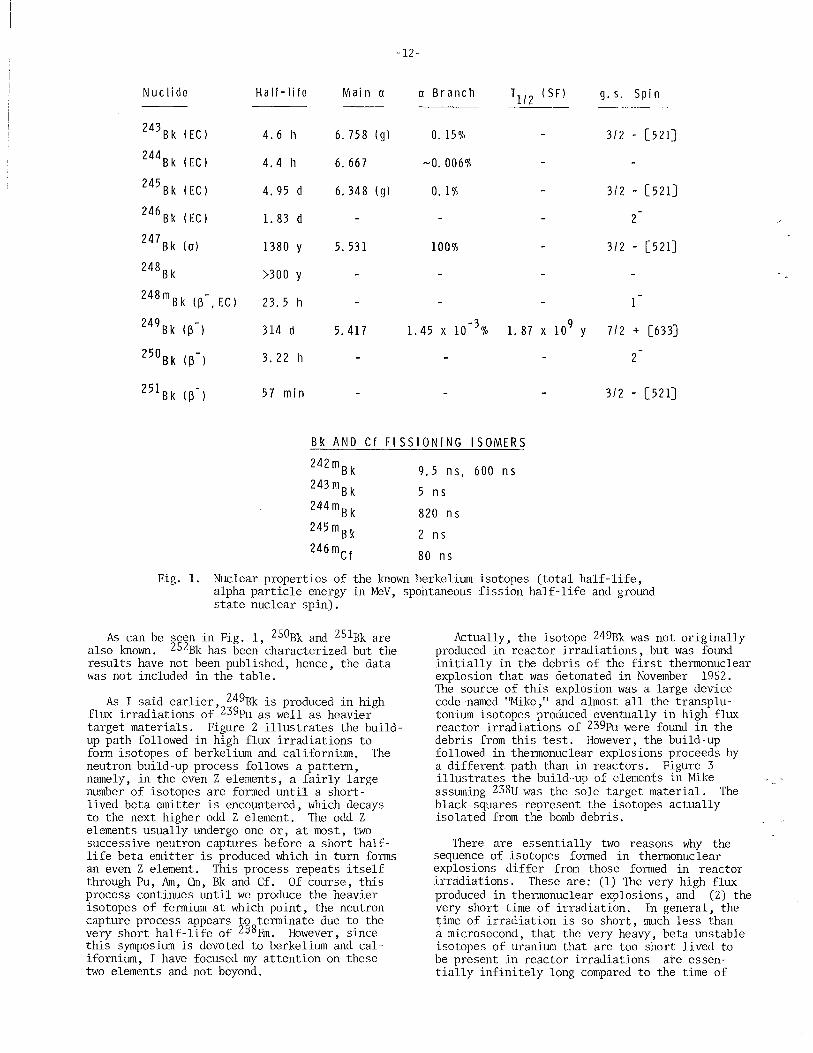
As you heard earlier, 243Bk was the first berkelium isotope to be produced and it was found to decay primarily by electron capture with a very small alpha decay branch, 0.15%, and a total half-life of 4.5 hours. Within five to six years following the discovery of element 97, the isotopes through mass 250 had been prepared and characterized. The nuclear properties of all the berkelium isotopes are summarized in Fig. 1.
244Bk, like 243Bk, was ~repared by helium ion bombardment of 24lAm and 243Am. The first person to clearly identify 244Bk was Al Chetham-Strode, although earlierdwork was done by Ken Hulet. 245, 2~6, 247 an 248Bk were all made by helium
and deuteron ion bombardments of amerICIum and curium. Examination of Fig. 1 shows that 247Bk decays by alpha particle emission with a halflife of 1380 years. It is probably the longest half-life isotope of berkelium. There is a possibility that an isomer of 248Bk may have a longer half-life. 248Bk has two isomers, the usual one, decaying by S- emission and electron capture with a half-life of 23 hours and a longer half-life isomer whose mode of decay and rate of decay have not been accurately measured. The long-lived isomer has been observed by mass spectrometric analysis of some berkelium samples and, by doing successive mass analyses, a lower limit to the total half-life has been set at greater than 300 years. A lower limit for the S- decay half-life was set at 104 years by noting the absence of 248Cf in samples of 248Bk.
The most important isotope of berkelium is 249Bk. Its importance stems from the fact that it is readily produced in relatively large amounts by neutron irradiation in a reactor of heavy element targets such as plutonium, americium and curium. Furthermore, its relatively long S- decay half-life also makes this a convenient isotope for chemical studies.
Nuclide H a If -I i Ie
243 B k (EG) 4.6 h
244Bk (EG) 4.4 h
245 Bk (EG) 4. 95 d
246 Bk (EG) 1. 83 d
247Bk (0) 1380 Y
248 B k >300 y
248 m B k (~ , EG) 23.5 h
249 B k (~-) 314 d
250Bk (~-) 3. 22 h
251Bk (~-) 57 min
Mai n 0
6.758 (g)
6. 667
6.348 (g)
5. 531
5.417
-12-
o Branch
0.15%
~o. 006%
0.1%
100%
g. s. Spin
312 - [521J
312 - [521J
2
312 - [521J
712 + [633J
2
312 - [521J
Bk AND Gf FISSIONING ISOMERS
242 m B k
243mBk
244 m B k
245mBk
246 mG f
9.5 ns, 600 ns
5 ns
820 n s
2 ns
80 ns
Fig. 1. Nuclear properties of the known berkelium isotopes (total half-life, alpha particle energy in MeV, spontaneous fission half-life and ground state nuclear spin).
As can be seen in Fig. 1, 250Bk and 25lBk are also known. 252Bk has been characterized but the results have not been published, hence, the data was not included in the table.
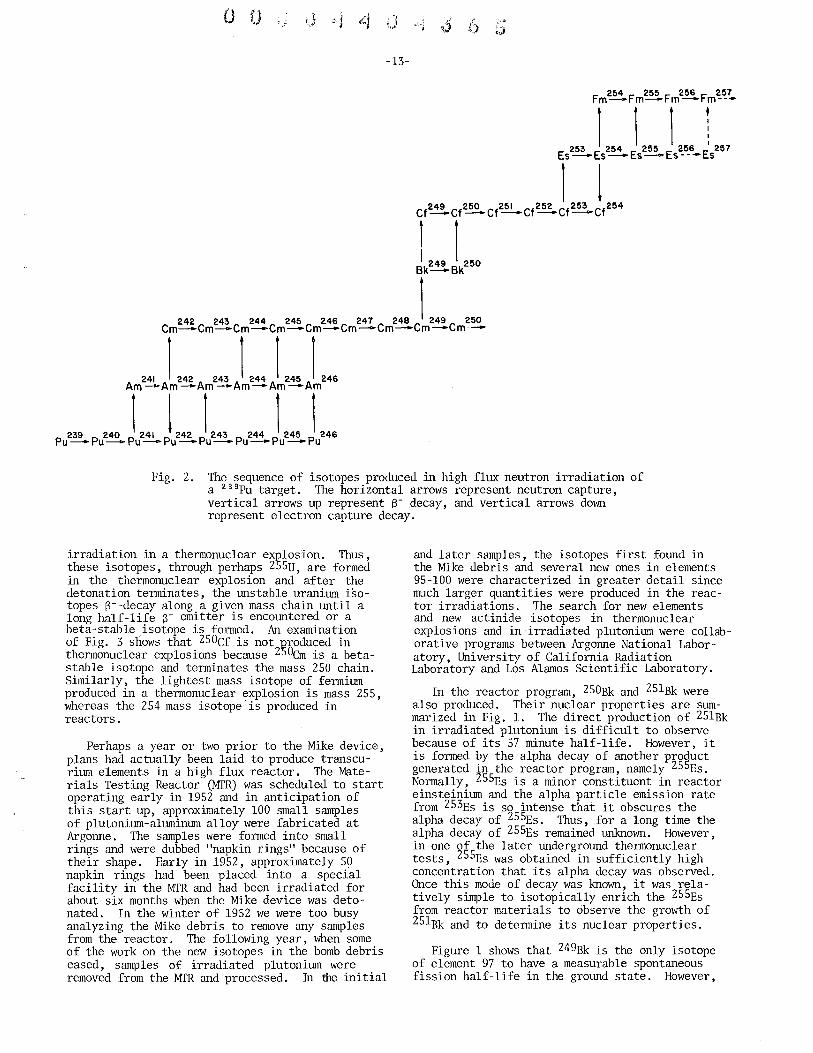
As I said earlier, 249Bk is produced in high flux irradiations of 239pu as well as heavier target materials. Figure 2 illustrates the buildup path followed in high flux irradiations to form isotopes of berkelium and californium. The neutron build-up process follows a pattern, namely, in the even Z elements, a fairly large number of isotopes are formed until a short-lived beta emitter is encountered, which decays to the next higher odd Z element. The odd Z elements usually undergo one or, at most, two successive neutron captures before a short halflife beta emitter is produced which in turn forms an even Z element. This process repeats itself through Pu, Am, Om, Bk and Cf. Of course, this process continues until we produce the heavier isotopes of fermium at which point, the neutron capture process appears t9, terminate due to the very short half-life of 2~8Rm. However, since this symposium is devoted to berkelium and californium, I have focused my attention on these two elements and not beyond.
Actually, the isotope 249Bk was not originally produced in reactor irradiations, but was found initially in the debris of the first thermonuclear explosion that was detonated in November 1952. The source of this explosion was a large device code-named "Mike," and almost all the transplutonium isotopes produced eventually in high flux reactor irradiations of 239Pu were found in the debris from this test. However, the build-up followed in thermonuclear explosions proceeds by a different path than in reactors. Figure 3 illustrates the build-up of elements in Mike assuming 238U was the sole target material. The black squares represent the isotopes actually isolated from the bomb debris.
There are essentially two reasons why the sequence of isotopes formed in thermonuclear explosions differ from those formed in reactor irradiations. These are: (1) The very high flux produced in thermonuclear explosions, and (2) the very short time of irradiation. In general, the time of irradiation is so short, much less than a microsecond, that the very heavy, beta unstable isotopes of uranium that are too short lived to be present in reactor irradiations are essentially infinitely long compared to the time of
o ~ t ~!--J Li ~.) JI 6 t,-J '.--~ V ;'J
-13-
Fig. 2. The sequence of isotopes produced in high flux neutron irradiation of a 239Pu target. The horizontal arrows represent neutron capture, vertical arrows up represent 8- decay, and vertical arrows down represent electron capture decay.
irradiation in a thermonuclear explosion. Thus, these isotopes, through perhaps 255U, are formed in the thermonuclear explosion and after the detonation terminates, the unstable uranium isotopes 8--decay along a given mass chain until a long half-life 8- emitter is encountered or a beta-stable isotope is formed. An examination of Fig. 3 snows that 250Cf is not ~roduced in thermonuclear explosions because 250em is a betastable isotope and terminates the mass 250 chain. Similarly, the lightest mass isotope of fermium produced in a thermonuclear explosion is mass 255, whereas the 254 mass isotope is produced in reactors.
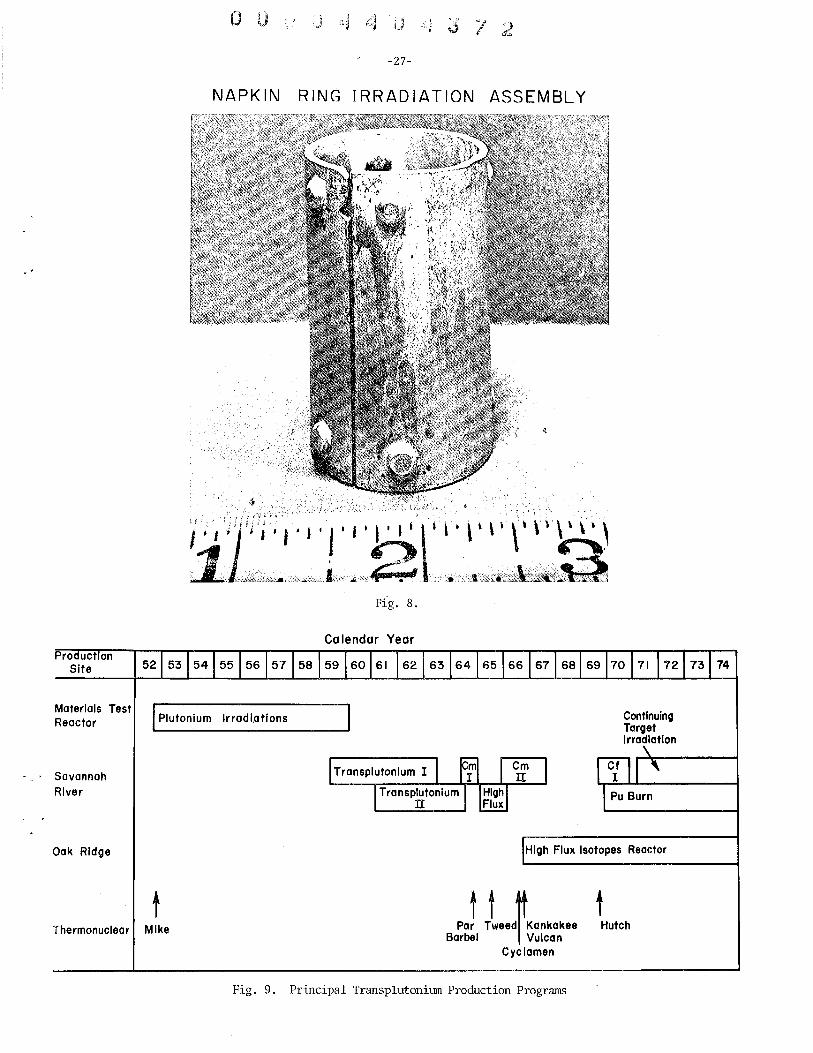
Perhaps a year or two prior to the Mike device, plans had actually been laid to produce transcurium elements in a high flux reactor. The Materials Testing Reactor CMTR) was scheduled to start operating early in 1952 and in anticipation of this start up, approximately 100 small samples of plutonium-aluminum alloy were fabricated at Argonne. The samples were formed into small rings and were dubbed "napkin rings" because of their shape. Early in 1952, approximately SO napkin rings had been placed into a special facility in the MTR and had been irradiated for about six months when the Mike device was detonated. In the winter of 1952 we were too busy analyzing the Mike debris to remove any samples from the reactor. The following year, when some of the work on the new isotopes in the bomb debris eased, samples of irradiated plutonium were removed from the MTR and processed. In "the initial
and later samples, the isotopes first found in the Mike debris and several new ones in elements 95-100 were characterized in greater detail since much larger quantities were produced in the reactor irradiations. The search for new elements and new actinide isotopes in thermonuclear explosions and in irradiated plutonium were collaborative programs between Argonne National Laboratory, University of California Radiation Laboratory and Los Alamos Scientific Laboratory.
In the reactor program, 250Bk and 25lBk were also produced. Their nuclear properties are summarized in Fig. 1. The direct production of 25lBk in irradiated plutonium is difficult to observe because of its 57 minute half-life. However, it is formed by the alpha decay of another product generated in the reactor program, namely 255Es. Normally, 255Es is a minor constituent in reactor einsteinium and the alpha particle emission rate from 253Es is so intense that it obscures the alpha decay of 255Es. Thus, for a long time the alpha decay of 255Es remained unknown. However, in one of the later underground thermonuclear tests, 255Es was obtained in sufficiently high concentration that its alpha decay was observed. Once this mode of decay was known, it was relatively simple to isotopically enrich the 255Es from reactor materials to observe the growth of 25lBk and to determine its nuclear properties.
Figure 1 shows that 249Bk is the only isotope of element 97 to have a measurable spontaneous fission half-life in the ground state. However,
high energy protons with uranium targets, undoubtedly due to the reaction of secondary carbon ions resulting from the initial proton irradiation, with the uranium target nuclei. 249Cf is formed almost exclusively by the beta decay of 249Bk. This isotope is in demand for studying the chemical properties of californium because of its long alpha decay half-life and, more important, because of its even longer spontaneous fission half-life.
High flux irradiations of plutonium, americium and curium in the~MrR llroduced 250, 251, 252, 253 and 254Cf. However, 251, 252, 253 and 254Cf were first isolated from the Mike debris. The buildup path in the thermonuclear explosion excludes 250Cf, as mentioned earlier. The first samples, filter papers of air samples from the test, showed the presence of approximately 1.5 fissions per ,min., with 90% of these fissions due to 254Cf. Even with this small sample, it was possible to outline the nuclear properties of 252, 253 and 254Cf.
Many efforts were made to obtain larger samples of californium including collecting more filter papers, rain water at various locations, and finally about one-half ton of condensed coral that was collected from a neighboring island. None of these attempts yielded a californium sample equal to the initial 1.5 fissions/min. As each larger sample was processed, the additional time involved resulted in decay of the californium isotopes which more than compensated for the increase in sample size. Fortunately, all the californium isotopes were produced later in larger amounts in the MrR program.
One of the outgrowths of studying the nuclear properties of californium isotopes generated in the Mike explosion and the MrR program was the first observation of the 152 neutron subshell which has played a prominent role in the nuclear properties of the heavier actinide elements. In general, throughout the actinide series of ele-
NEUTRON CROSS SECTIONS FOR TRANSMUTATIONS
IN HFIR IRRADIAHONS
Nuclide Capture Cross section (barns)
249 Bk (314 d) 1451
250 B k (3.22 h) 350
249Cf (352 y) 450
250 Cf (13.08 y) 1900
251 Cf (900 y) 2850
252 Cf (2,646 y) 19,8
253 Cf (17.81 d) 12.6
254 Cf (60,5 d) 50
Fission Cross sections (barns)
o
3000
1690
o
3750
32
1300
o
Fig. 7. Neutron cross sections for berkelium and californium isotopes.
-16-
ments, once we go beyond the 126 neutron shell, there is a good correlation between the decrease in the alpha decay energy and the increase in mass of a given element. An anomaly, however, was observed in the californium isotopes; the alpha decay energy of 252Cf was greater than that of 250Cf. When initially observed, this anomaly was not understood, but in light of the spontaneous fission half-lives behavior and the alpha decay of other nuclides, the hypothesis was advanced by AI Ghiorso and co-workers that 152 neutrons represented a subshell of neutrons. The unified model of deformed nuclei provided a frame-work that later accounted for the subshell at 152 neutrons.
Attempts were made to identify 255Cf in the products of thermonuclear tests, but no positive results were obtained.
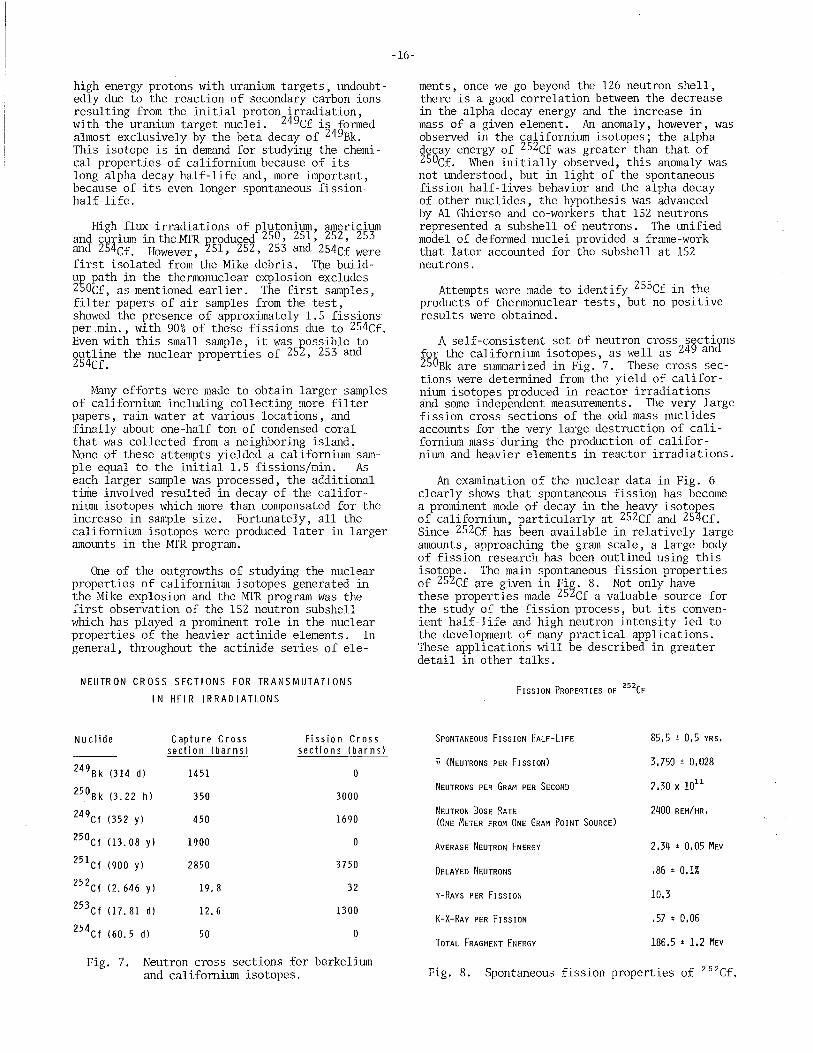
A self-consistent set of neutron cross s~ctigns for the californium isotopes, as well as 24 an 250Bk are summarized in Fig. 7. These cross sections were determined from the yield of californium isotopes produced in reactor irradiations and some independent measurements. The very large fission cross sections of the odd mass nuclides accounts for the very large destruction of californium mass'during the production of californium and heavier elements in reactor irradiations.
An examination of the nuclear data in Fig. 6 clearly shows that spontaneous fission has become a prominent mode of decay in the heavy isotopes of californium, particularly at 252C£ and 25~Cf. Since 252Cf has been available in relatively large amowlts, approaching the gram scale, a large body of fission research has been outlined using this isoto~e. The main spontaneous fission properties of 25 Cf are given in Fi~. 8. Not only have these properties made 25 Cf a valuable source for the study of the fission process, but its convenient half-life and high neutron intensity led to the development of many practical applications. These applications will be described in greater detail in other talks.
F I SS I ON PROPERTI ES OF 252CF
SPONTANEOUS FISSION HALF-LIFE 85.5 ± 0.5 YRS.
;; (NEUTRONS PER FISSION) 3.750 ± 0.028
NEUTRONS PER GRAM PER SECOND 2.30 X lOll
NEUTRON DOSE RATE 2400 REM/HR.
(ONE METER FROM ONE GRAM POINT SOURCE)
AVERAGE NEUTRON ENERGY 2.34 ± 0.05 MEV
DELAYED NEUTRONS .86 ± 0.1%
V-RAYS PER FISSION 10.3
K-X-RAY PER FISSION .57 ± 0,06
TOTAL FRAGMENT ENERGY 186.5 ± 1.2 MEV
Fig. 8. Spontaneous fission properties of 252Cf.
0 U tJ ./ ~ {,J .~) • "~'I
-17-
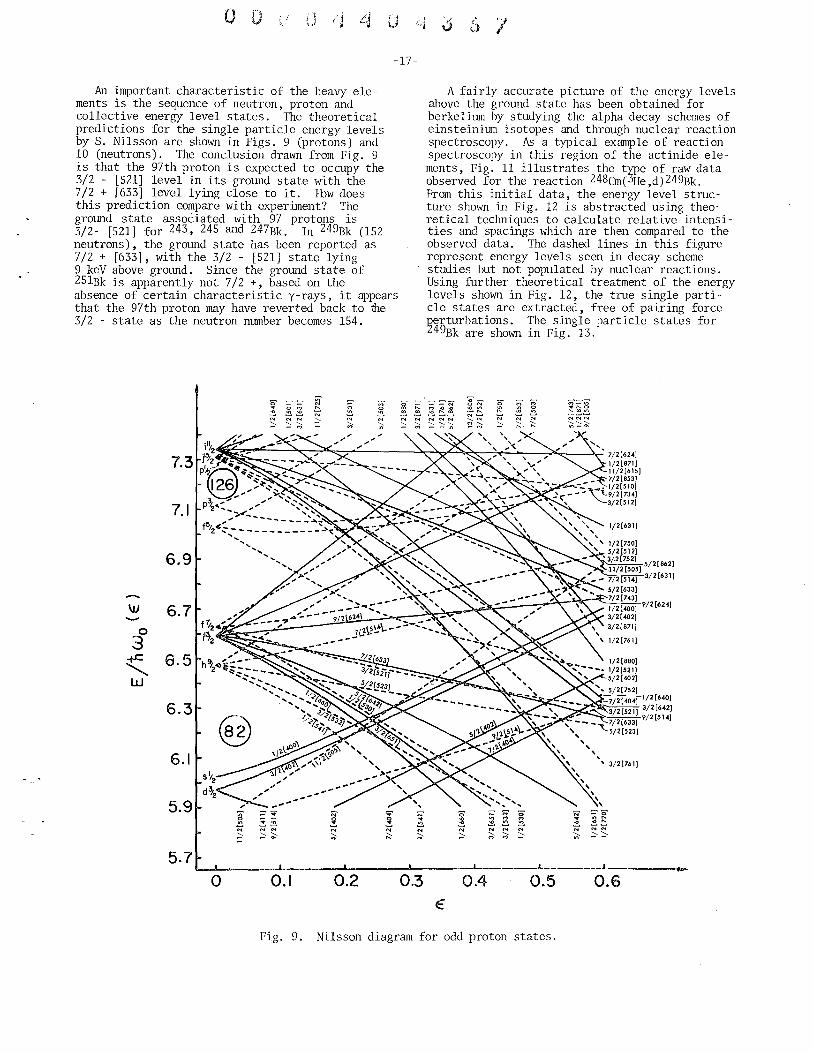
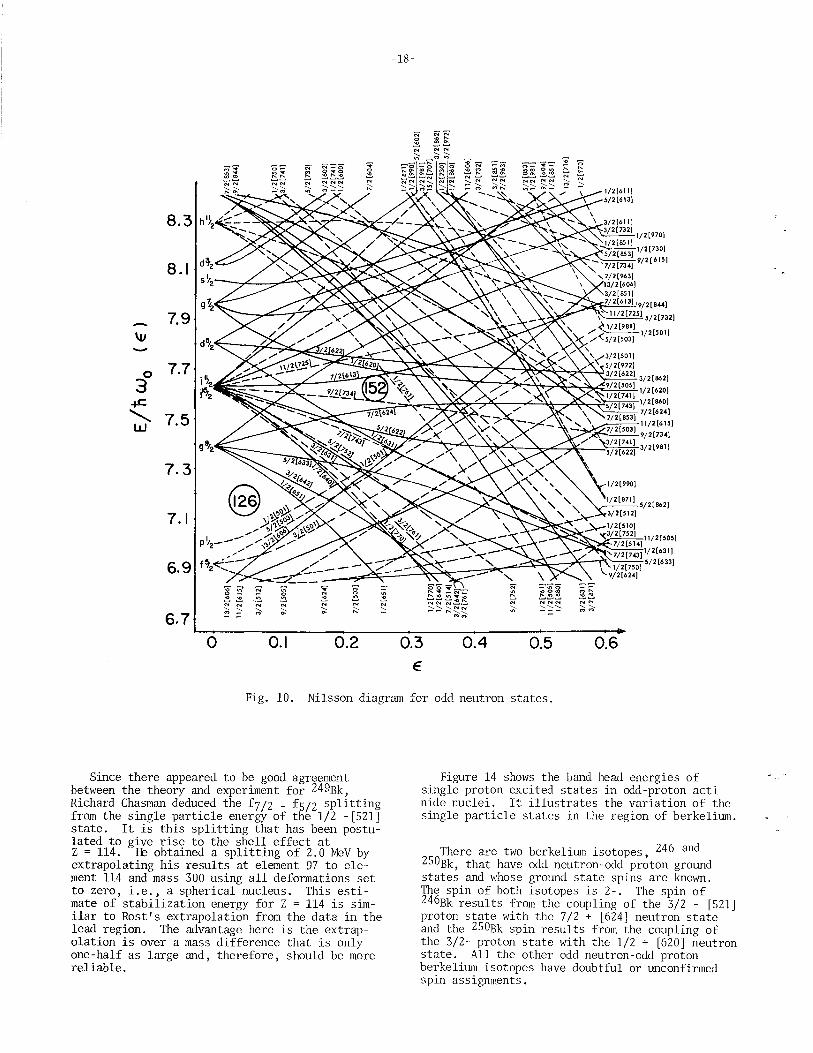
An important characteristic of the heavy elements is the sequence of neutron, proton and collective energy level states. The theoretical predictions for the single particle energy levels by S. Nilsson are shown in Figs. 9 (protons) and 10 (neutrons). The conclusion drawn from Fig. 9 is that the 97th proton is expected to occupy the 3/2 - [521] level in its ground state with the 7/2 + [633] level lying close to it. How does this prediction compare with experiment? The ground state associated with 97 protons is 3/2- [521] for 243, 245 and 247Bk. In 249Bk (152 neutrons), the ground state has been reported as 7/2 + [633], with the 3/2 - [521] state lying 9 keY above ground. Since the ground state of 25lBk is apparently not 7/2 +, based on the absence of certain characteristic y-rays, it appears that the 97th proton may have reverted back to fue 3/2 - state as the neutron number becomes 154.
0 ~ 0 M
"" OM 0
'" :!2.~ ~ ~ N
N N N " N N
" "" ;;, " - M ~
7.3
7.1
6.9
\tJ 6.7 0
3 +'= 6.5 "'-w
6.3
@ 6.1
5.9
I ~~
~ ,.,
~~ ~ N N N N
:::-~ ~ ;::-
5.7 0 0.1 0.2
! ~ N N
" ;;,
:; N
:::-
0.3
6 () "I
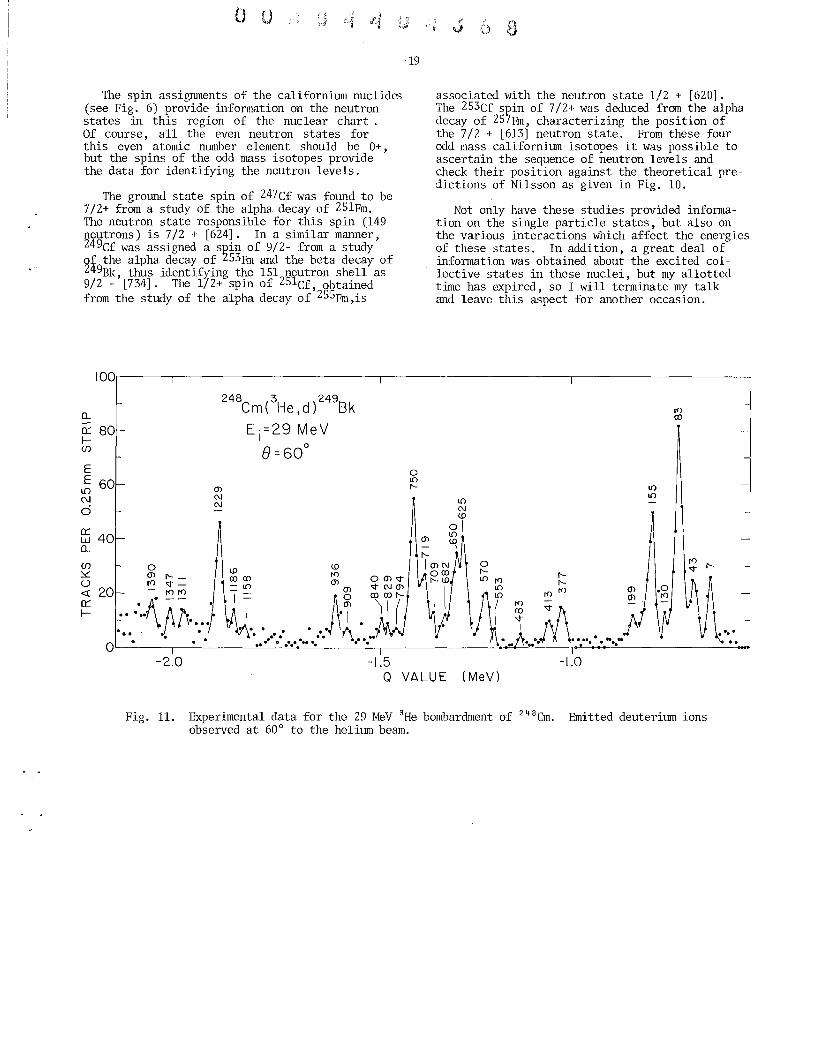
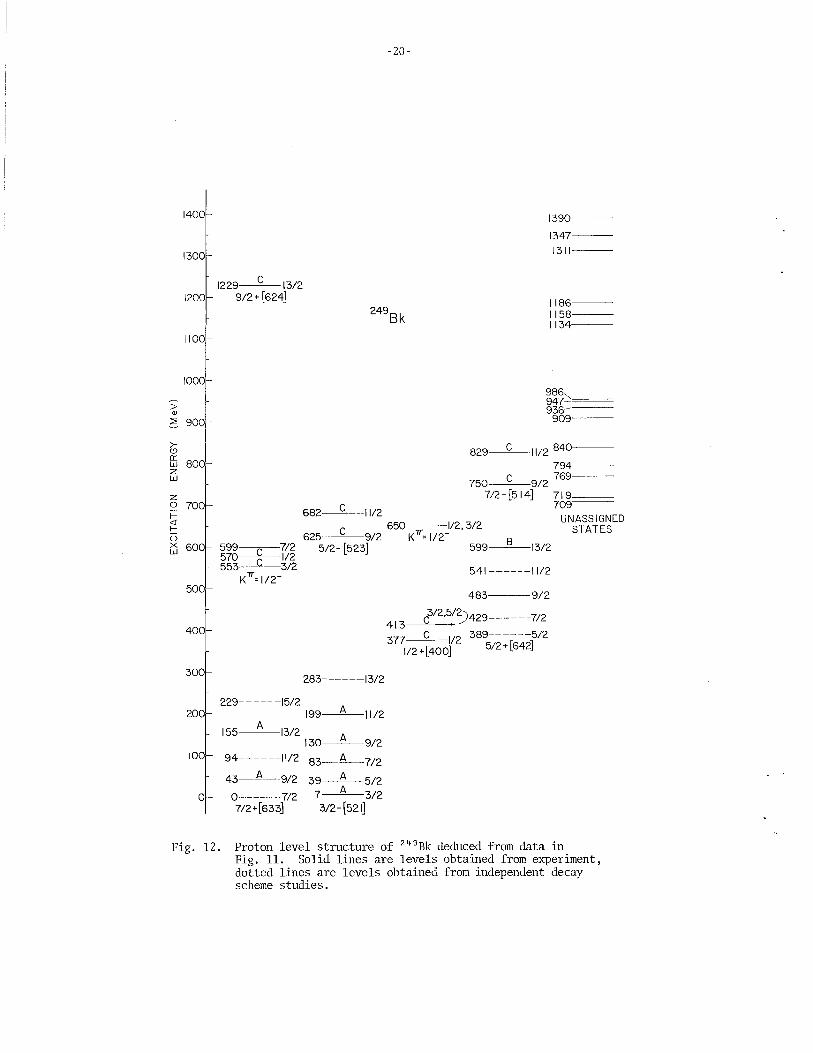
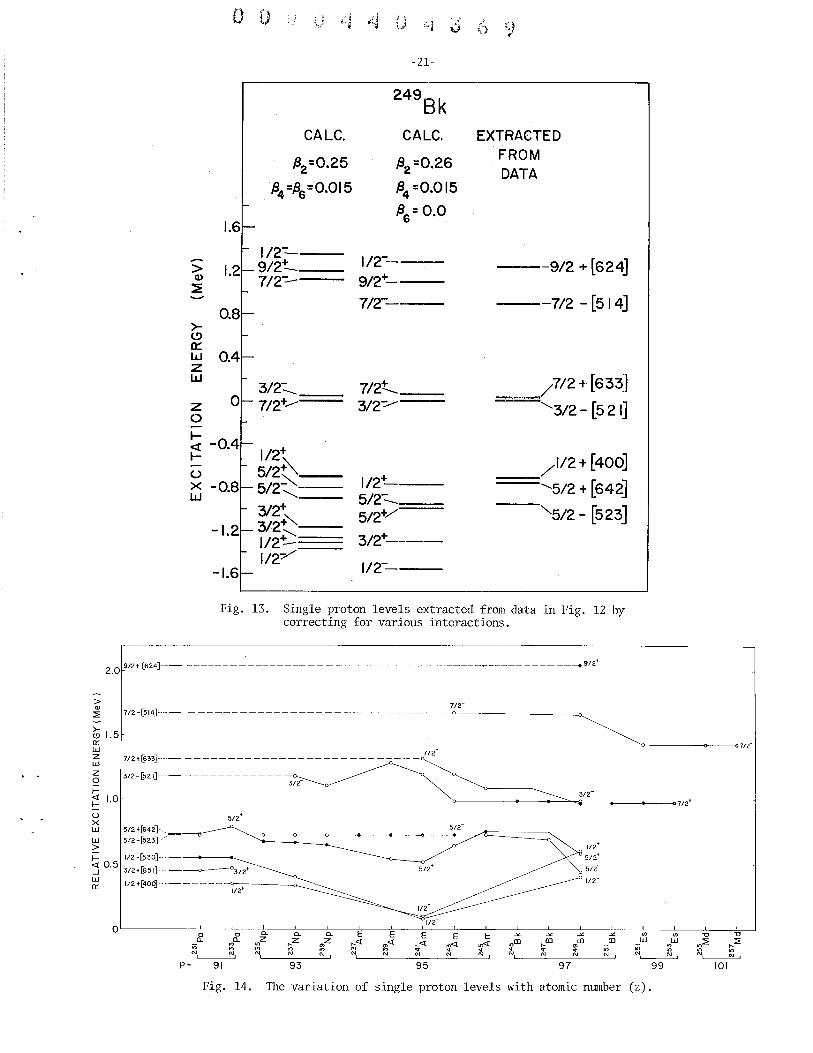
A fairly accurate picture of the energy levels above the ground state has been obtained for berkelium by studying the alpha decay schemes of einsteinium isotopes and through nuclear reaction spectroscopy. As a typical example of reaction spectroscopy in this region of the actinide elements, Fig. 11 illustrates the type of raw data observed for the reaction 248Cm(3He,d) 249Bk. From this initial data, the energy level structure shown in Fig. 12 is abstracted using theoretical techniques to calculate relative intensities and spacings which are then compared to the observed data. The dashed lines in this figure represent energy levels seen in decay scheme studies but not populated by nuclear reactions. Using further theoretical treatment of the energy levels shown in Fig. 12, the true single particle states are extracted, free of pairing force ~erturbations. The single particle states for
49Bk are shown in Fig. 13.
__ N "'- 0
~ ~~~ ON
12 ~~! "'~ 8-~~
~~~ N~
N N N
~~ N N N
:::- :::-~ " ;::- ;::- ",;)::::"0:-
0' ;:- \:i' 0 N ~o
.! ~ M .. ~ ~
'" ~ ~
~ ~~ N N N N NN
:::- ;;, ;;, " ~ :::-;:::-
.. 0.4 0.5 0.6
E
Fig. 9. Nilsson diagram for odd proton states.
-18-
0.6
Fig. 10. Nilsson diagram for odd neutron states.
Since there appeared to be good agreement between the theory and experiment for 249Bk, Richard Chasman deduced the f7/2 _ f5/2 splitting from the single particle energy of the 1/2 -[521] state. It is this splitting that has been postulated to give rise to the shell effect at Z = 114. fu obtained a splitting of 2.0 MeV by extrapolating his results at element 97 to element 114 and mass 300 using all deformations set to zero, i.e., a spherical nucleus. This estimate of stabilization energy for Z = 114 is similar to Rost's extrapolation from the data in the lead region. The advantage here is the extrapolation is over a mass difference that is only one-half as large and, therefore, should be more reliable.
Figure 14 shows the band head energies of single-proton excited states in odd-proton actinide nuclei. It illustrates the variation of the single particle states in the region of berkelium.
There are two berkelium isotopes, 246 and 250Bk, that have odd neutron-odd proton ground states and whose ground state spins are known. The spin of both isotopes is 2-. The spin of 246Bk results from the coupling of the 3/2 - [521] proton state with the 7/2 + [624] neutron state and the 250Bk spin results from the coupling of the 3/2- proton state with the 1/2 + [620] neutron state. All the other odd neutron-odd proton berkelium isotopes have doubtful or unconfirmed spin assignments.
o u
The spin assignments of the californium nuclides (see Fig. 6) provide information on the neutron states in this region of the nuclear chart. Of course, all the even neutron states for this even atomic number element should be 0+, but the spins of the odd mass isotopes provide the data for identifying the neutron levels.
The ground state spin of 247Cf was found to be 7/2+ from a study of the alpha decay of 2slFm. The neutron state responsible for this spin (149 neutrons) is 7/2 + [624]. In a similar manner, 249Cf was assigned a spin of 9/2- from a study of the alpha decay of 2s3Fm and the beta decay of 249Bk, thus identifying the 151 neutron shell as 9/2 - [734]. The 1/2+ spin of 2slCf, obtained from the study of the alpha decay of 2ssFm ,is
100
0...
248Cm (3He , d) 249Bk - E·=29 MeV 0:: 80 f- I (f) 8=60° E E 60
LO (j)
(\J N
c:i N
0:: 40 w
0...
(f) 0 lD lD ~ (j) 1'-- 0)0) ~
-19-
0 10 I'-
(j)
U «) <1"- =10 « 20 • ~ ~ I = (j) 0) 0) I'-
g: ::.: .. I\ .. rli .. ::'~ I .•••••• • .N. :11 r~ .e.1'. .... o III III III •••• III •••• e .. _. III •
-2.0 -1.5
associated with the neutron state 1/2 + [620]. The 2s3Cf spin of 7/2+ was deduced from the alpha decay of 257Fm, characterizing the position of the 7/2 + [613] neutron state. From these four odd mass californium isotopes it was possible to ascertain the sequence of neutron levels and check their position against the theoretical preiictions of Nilsson as given in Fig. 10.
Not only have these studies provided information on the single particle states, but also on the various interactions which affect the energies of these states. In addition, a great deal of information was obtained about the excited collective states in these nuclei, but my allotted time has expired, so I will terminate my talk and leave this aspect for another occasion.
«) 0)
10 10
o ~r<l ~
~~ ~ ~~ j . . .. m .......... .. .. . . . . -1.0
Q VALUE (MeV)
Fig. 11. Experimental data for the 29 MeV 3He bombardment of 248em. Emitted deuterium ions observed at 60° to the helium beam.
1400
1300
-20-
1390---
1347---1311---
1229 C 13/2 1200
1100
1000
> (l)
:;:;;: 900
>-<9 0:::
800 w z w
z o 700 I-;:: o i'j 600
500
400
300
9/2+ [624J
599 C 7/2 570 1/2 553 C 3/2
K7T= 1/2-
249Bk
1186---1158---1134---
682 C 11/2
986,,=== 947 936-909---
829--,,-C-II / 2 8401-----
794---
750 C 9/2 769
7/2-[514] 719'-=== 709-
650 1/2.3/2 625 C 9/2 K 7T= 112-
599--=-8-13/ 2
UNASSIGNED STATES
5/2- [523]
541------11/2
483 9/2
413 C3/2'~429------7/2
377 C 112 389------5/2 1/2+[400] 5/2+[642]
283------13/2
229------15/2 A 200 199--"'--11/2
100
0
Fig. 12.
1 55-.:....:A-13/2 A
130--'-'--9/2 94------11/2 83-~7/2 43 A 9/2 39 A 5/2
0 7/2 7 A 3/2 7/2+[633J 3/2-[521]
Proton level structure of 249Bk deduced from data in Fig. 11. Solid lines are levels obtained from experiment, dotted lines are levels obtained from independent decay scheme studies.
13. Single proton levels extracted from data in Fig. 12 by correcting for various interactions.
~ 1/2+8100] ---------0----;-----<>----1/2+
p= 91
Fig. 14. The variation of single proton levels with atomic number (z).
-22-
Introduction of John Crandall Dr. Seaborg
The next speaker will be John L. Crandall. Jack Crandall is Director of Advanced Operational Planning at the Savannah River Laboratory in Aiken, South Carolina, the place where these elements have been produced in such quantity. He received his professional training at MIT where he obtained a B.S. degree in chemical engineering in 1942, and he has a Ph.D. in physical chemistry which he obtained in 1948 after a tour of duty with the U.S. Army. In 1948 he joined the du Pont Company as a research chemist and in 1951, as so
many of those did it in those days, spent some time at the Metallurgical Laboratory preparatory to going down to work in the Savannah River Laboratory in Sbuth Carolina. He has been much concerned with the production of these heavy elements in quantity and he served as Research Manager of the Laboratory's Experimental Physics Division in the 1950's, but as I've indicated, he is now Director of Advanced Operational Planning in the Savannah River Laboratory. Jack Crandall will describe the production of berkelium and californium in quantity. Jack ....
Production of Berkelium and Californium
John L. Crandall
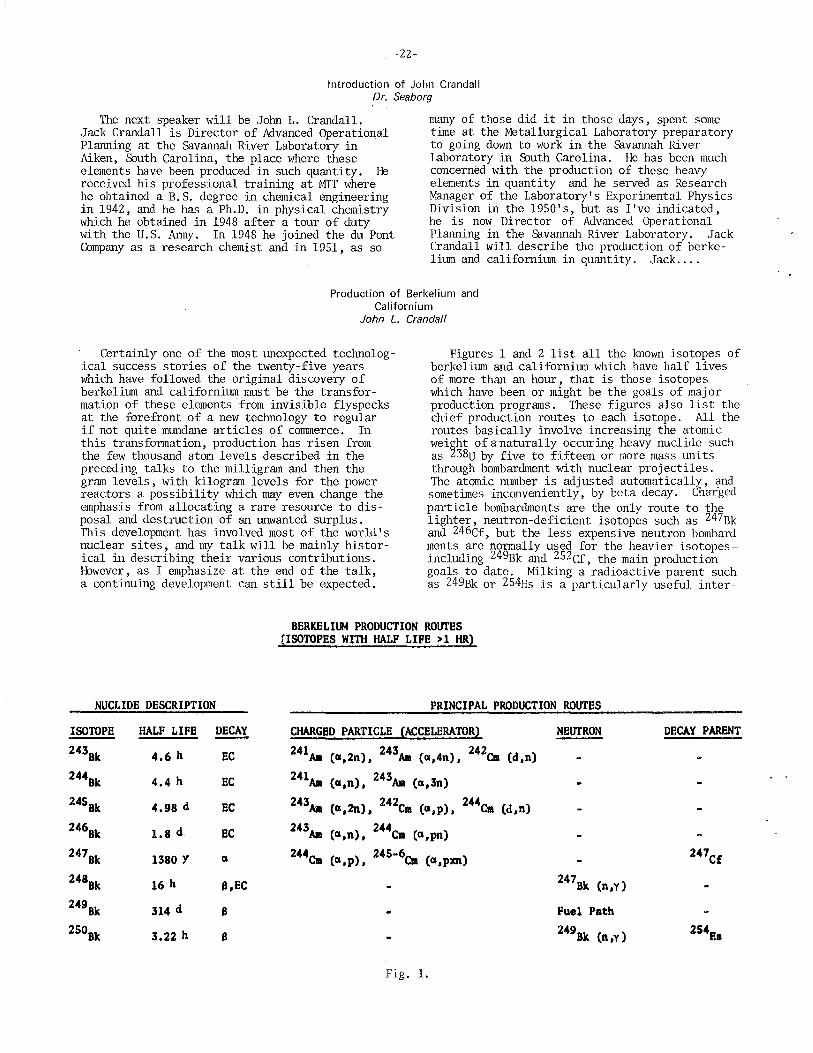
Certainly one of the most unexpected technological success stories of the twenty-five years which have followed the original discovery of berkelium and californium must be the transformation of these elements from invisible flyspecks at the forefront of a new technology to regular if not quite mundane articles of commerce. In this transformation, production has risen from the few thousand atom levels described in the preceding talks to the milligram and then the gram levels, with kilogram levels for the power reactors a possibility which may even change the emphasis from allocating a rare resource to disposal and destruction of an unwanted surplus. This development has involved most of the world's nuclear sites, and my talk will be mainly historical in describing their various contributions. However, as I emphasize at the end of the talk, a continuing development can still be expected.
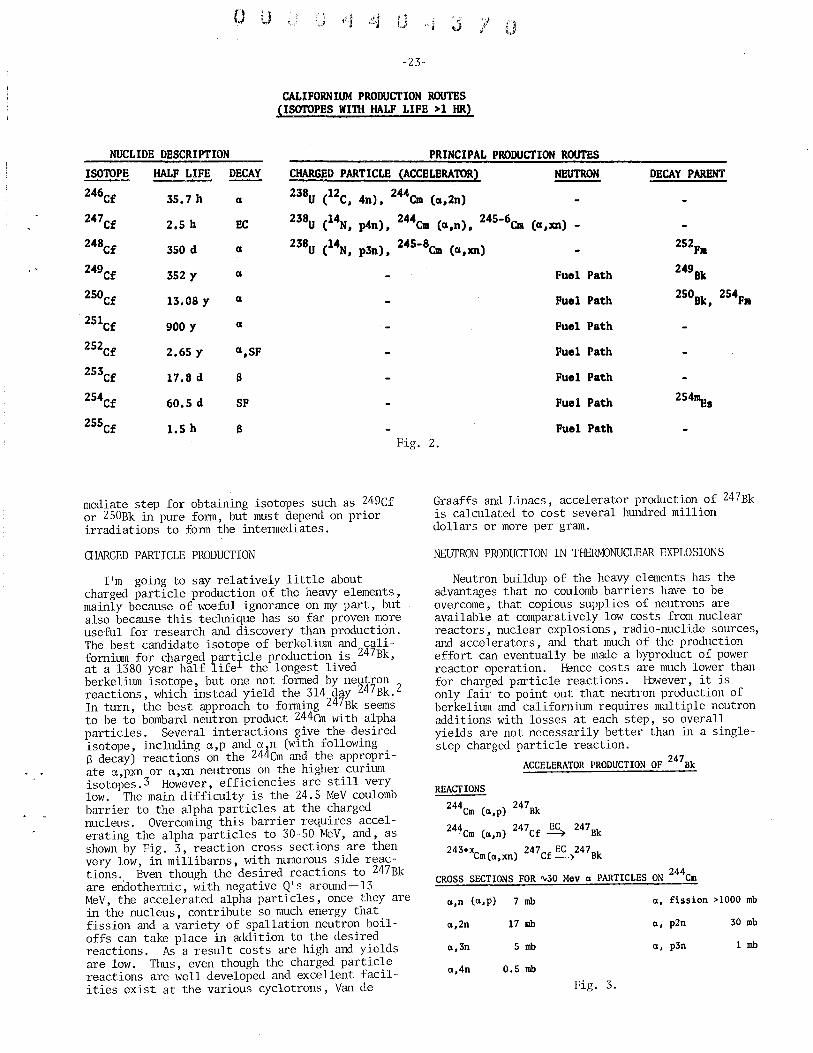
Figures 1 and 2 list all the known isotopes of berkelium and californium which nave half lives of more than an hour, that is those isotopes which have been or might be the goals of major production programs. These figures also list the chief production routes to each isotope. All the routes basically involve increasing the atomic weight of a naturally occuring heavy nuclide such as 238U by five to fifteen or more mass units through bombardment with nuclear projectiles. The atomic number is adjusted automatically, and sometimes inconveniently, by beta decay. Charged particle bombardments are the only route to the lighter, neutron-deficient isotopes such as 247Bk and 246Cf, but the less expensive neutron bombardments are normally used for the heavier isotopesincluding 249Bk and 252Cf, the main production goals to date. Milking a radioactive parent such as 249Bk or 254Es is a particularly useful inter-
BERKELIUM PRODUCTION ROUTES [ISOTOPES WITH HALF LIFE > 1 HR)
NUCLIDE DESCRIPTION
ISOTOPE HALF LIFE ~ 243Bk 4.6 h EC
244Bk 4.4 h EC
24SBk 4.98 d EC
246Bk 1.8 d. EC
247Bk 1380 Y a
248Bk 16 h B,EC 249Bk 314 d B 2S0Bk 3.22 h B
PRINCIPAL PRODUCTION ROUTES
CHARGED PARTICLE (ACCELERATOR) 243 (a,2n). AM (a.4n). 242c. (d,n)
(a,n). 243Aa (a.3n)
243A1a 242 (a,2n) , Cm (a,p). 244Cra (d,n)
243A1a (a,n) , 244C• (a,pn)
244CII1 (a ,p), 24S-6c. (a,pm)
Fig. 1.
NEUTRON
247Bk (n,y)
Fuel Path
249Bk (n,y)
DECAY PARENT
() D . ~
I .' J U ',j i'- L"~ J ;i 0
-23-
CALIFORNIUM PRODUCTION ROUTES (ISOTOPES \tIm HALF LIFE >1 HR)
NUCLIDE DESCRIPTION PRINCIPAL PRODUCTION ROUTES ISOTOPE HALF LIFE DECAY CHARGED PARTICLE (ACCELERATOR) NEUTRON DECAY PARENT 246Cf 35.7 h B 238U (12C, 4n), 244em (0,2n)
247Cf 2.5 h
248Cf 350 d
EC
0
238U (14N, p4n), 244Ca (B,n). 245-6ea (B,xn) _
238U (14N, p3n), 245-8c. (B,xn) 252Fa 249Bk 249Cf 352 Y B Fuel Path
250Cf 13.08 Y B Fuel Path 250Bk , 254Fa
251Cf 900 Y B Fuel Path
252Cf 2.65 Y B,SF Fuel Path
253Cf 17.8 d B Fuel Path
254Cf 60.5 d SF Fuel Path 254~s
255Cf 1.5 h B Fuel Path Fig. 2.
mediate step for obtaining isotopes such as 249Cf or 250Bk in pure form, but must depend on prior irradiations to form the intermediates.
ClD\RGED PARTICLE PRODUCTION
I'm going to say relatively little about charged particle production of the heavy elements, mainly because of woeful ignorance on my part, but also because this technique has so far proven more useful for research and discovery than production. The best candidate isotope of berkelium and californium for charged particle production is 247Bk, at a 1380 year half life the longest lived berkelium isotope, but one not formed by neutron reactions, which instead yield the 314 day 247Bk.2 In turn, the best approach to forming 247Bk seems to be to bombard neutron product 244em with alpha particles. Several interactions give the desired isotope, including a,p and a n (with following . S decay) reactions on the 244em and the approprlate a,pxn or a,xn neutrons on the higher curium isotopes. 3 However, efficiencies are still very low. The main difficulty is the 24.5 MeV coulomb barrier to the alpha particles at the charged nucleus. Overcoming this barrier requires accelerating the alpha particles to 30-50 MeV, and, as shown by Fig. 3, reaction cross sections are then very low, in millibarns, with numerous side reactions. Even though the desired reactions to 247Bk are endothermic, with negative Q's around--13 MeV, the accelerated alpha particles, once they are in the nucleus, contribute so much energy that fission and a variety of spallation neutron boiloffs can take place in addition to the desired reactions. As a result costs are high and yields are low. Thus, even though the charged particle reactions are well developed and excellent facilities exist at the various cyclotrons, Van de
Graaffs and Linacs, accelerator production of 247Bk is calculated to cost several hundred million dollars or more per gram.
NEUTRON PRODUCTION IN THERMONUCLEAR EXPLOSIONS
Neutron buildup of the heavy elements has the advantages that no coulomb barriers have to be overcome, that copious supplies of neutrons are available at comparatively low costs from nuclear reactors, nuclear explosions, radio-nuclide sources, and accelerators, and that much of the production effort can eventually be made a byproduct of power reactor operation. rence costs are much lower than for charged particle reactions. However, it is only fair to point out that neutron production of berkelium and californium requires multiple neutron additions with losses at each step, so overall yields are not necessarily better than in a singlestep charged particle reaction.
ACCELERATOR PRODUCTION OF 2478k
REACTIONS
244cm (a,p) 2478k
244Cm (a,n) 247Cf ~ 2478k
243+xCm (a,xn) 247Cf ~2478k
CROSS SECTIONS FOR ~30 Mev a PARTICLES ON 244Cm
a,n (a,p) 7mb a, fission >1000 mb
a,2n 17 mb a, p2n 30 mb
a,3n 5mb a, p3n 1 mb
a,4n 0.5 mb
Fig. 3.
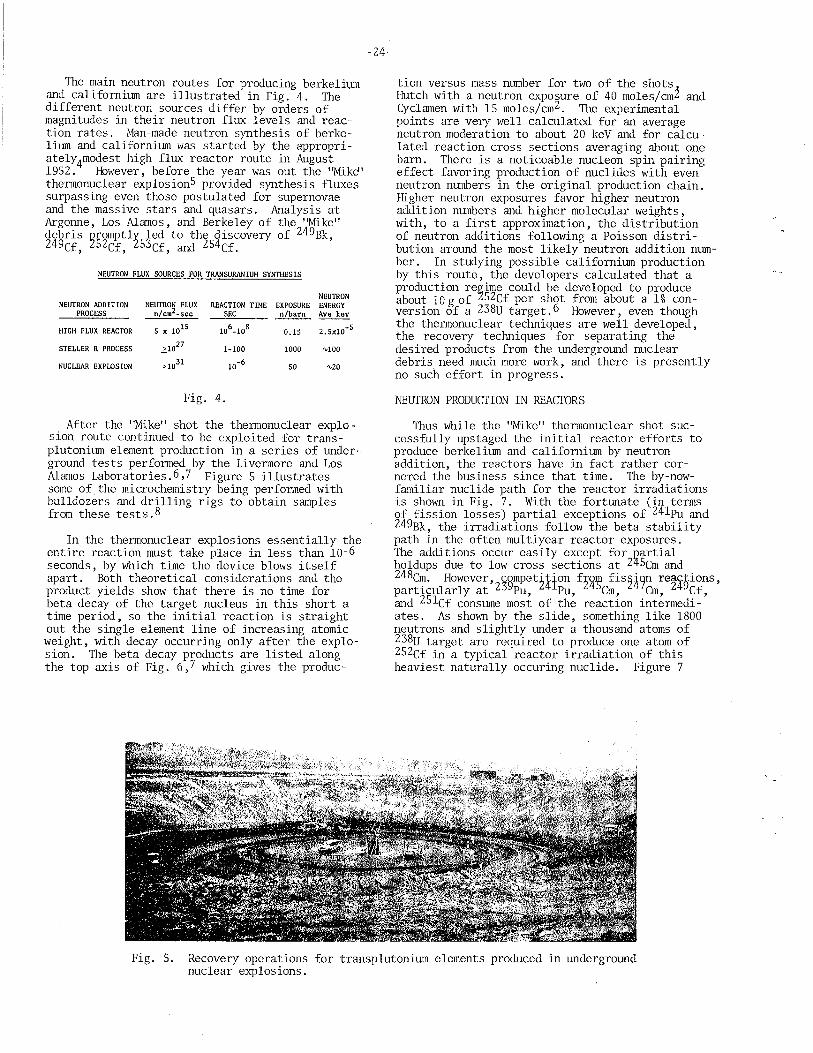
The main neutron routes for producing berkelium and californium are illustrated in Fig. 4. The different neutron sources differ by orders of magnitudes in their neutron flux levels and reaction rates. ~llin-made neutron synthesis of berkelium and californium was started by the appropriatelY4modest high flux reactor route in August 1952. However, before the year was out the 'Mike' thermonuclear explosionS provided synthesis fluxes surpassing even those postulated for supernovae and the massive stars and quasars. Analysis at Argonne, Los Alamos, and Berkeley of the "Mike" debris ~romptly led to the discovery of 249Bk, 249Cf, 252Cf, 253Cf, and 254Cf.
NEUTRON FLUX SOURCES FOR TRANSURAN IUM SYNTHES IS
NEUTRON NEUTRON ADDITION NEUTRON FLUX REACTION TIME EXPOSURE ENERGY
PROCESS n/cm2-sec SEC ~ ~ HIGH FLUX REACTOR 5 x 10¹⁵ 106 _108
0.15 2.Sxl0-S
STELLER R PROCESS 2.1027
1-100 1000 "'100
NUCLEAR EXPLOSION >1031 10-6 so "'20
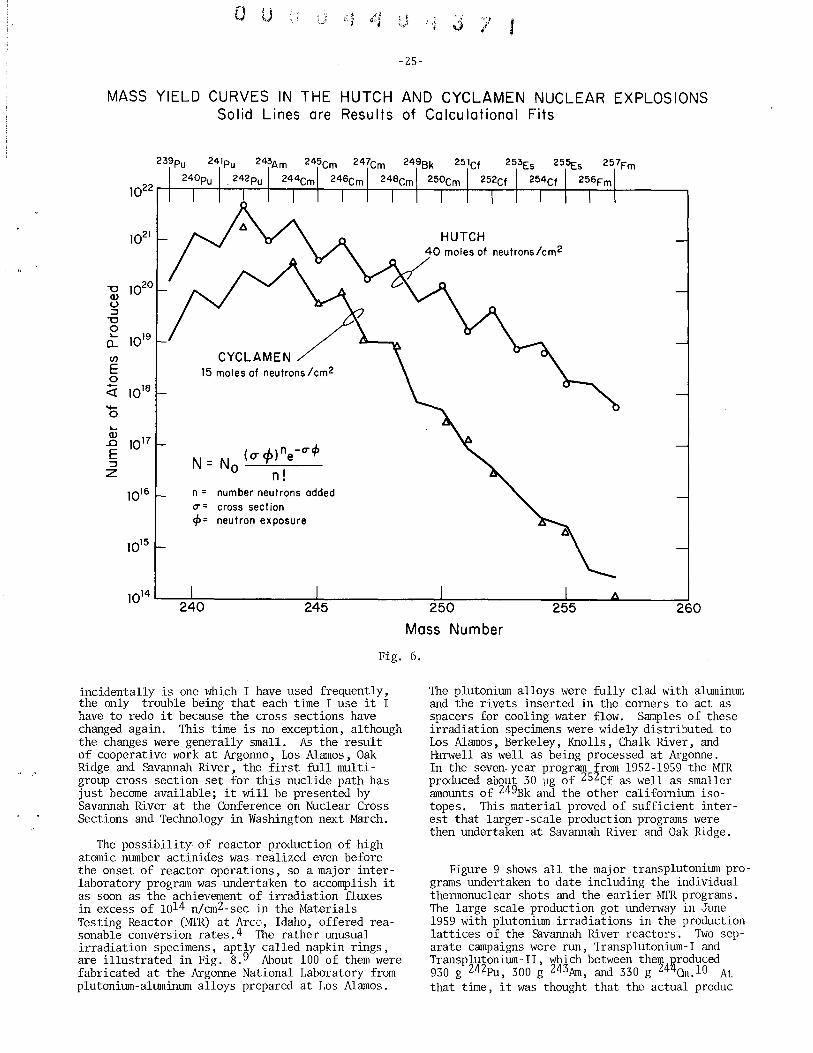
Fig. 4.
After the 'Mike" shot the thermonuclear explosion route continued to be exploited for transplutonium element production in a series of underground tests performed by the Livermore and Los Alamos Laboratories. 6 ,7 Figure 5 illustrates some of the microchemistry being performed with bulldozers and drilling rigs to obtain samples from these tests. 8
In the thermonuclear explosions essentially the entire reaction must take place in less than 10-6 seconds, by which time the device blows itself apart. Both theoretical considerations and the product yields show that there is no time for beta decay of the target nucleus in this short a time period, so the initial reaction is straight out the single element line of increasing atomic weight, with decay occurring only after the explosion. 1ne beta decay products are listed along the top axis of Fig. 6,7 which gives the produc-
-24-
tion versus mass number for two of the shots Hutch with a neutron exposure of 40 moles/cm~ and Cyclamen with IS mOles/cm2. TIle experimental points are very well calculated for an average neutron moderation to about 20 keV and for calculated reaction cross sections averaging about one barn. There is a noticeable nucleon spin pairing effect favoring production of nuclides with even neutron numbers in the original production chain. Higher neutron exposures favor higher neutron addition numbers and higher molecular weights, with, to a first approximation, the distribution of neutron additions following a Poisson distribution around the most likely neutron addition number. In studying possible californium production by this route, the developers calculated that a production regime could be developed to produce about 10 g of Z52Cf per shot from about a 1% conversion of a 238U target. 6 However, even though the thermonuclear techniques are well developed, the recovery techniques for separating the desired products from the underground nuclear debris need much more work, and there is presently no such effort in progress.
NEUTRON PRODUCTION IN REACTORS
Thus while the "Mike" thermonuclear shot successfully upstaged the initial reactor efforts to produce berkelium and californium by neutron addition, the reactors have in fact rather cornered the business since that time. The by-nowfamiliar nuclide path for the reactor irradiations is shown in Fig. 7. With the fortunate (in terms of fission losses) partial exceptions of 24lpu and 249Bk, the irradiations follow the beta stability path in the often multiyear reactor exposures. The additions occur easily except for partial holdups due to low cross sections at 2~5Cm and 248C~. However, cQmpet~tion f2~~ fis2l9n reaagions, parhcularly at 23~pu, 4 Pu, Cm, Cm, 2 Cf, and 25lCf consume most of the reaction intermediates. As shown by the slide, something like 1800 neutrons and slightly under a thousand atoms of 238U target are required to produce one atom of 252Cf in a typical reactor irradiation of this heaviest naturally occuring nuclide. Figure 7
Fig. 5. Recovery operations for transplutonium elements produced in underground nuclear explosions.
0 u , ·;,3 :.3, ~ /1 , J ''J , lk~ ~",;J , i ,r •
-25-
MASS YIELD CURVES IN THE HUTCH AND CYCLAMEN NUCLEAR EXPLOSIONS Solid Lines are Results of Calculational Fits
"0 Q) u ::l
"0 0 .... a.. en E 0
0+-
<I: -0 .... Q) .D
E ::l Z
1022
1021
ldO
1019
1018
1017
1016
1015
CYCLAMEN 15 moles of neutrons/cm2
((]"cp)ne-CT4> N = NO --'----
n! n = number neutrons added CT = cross section 4> = neutron exposure
incidentally is one which I have used frequently, the only trouble being that each time I use it I have to redo it because the cross sections have changed again. This time is no exception, although the changes were generally small. As the result of cooperative work at Argonne, Los Alamos, Oak Ridge and Savannah River, the first full multigroup cross section set for this nuclide path has just become available; it will be presented by Savannah River at the Conference on Nuclear Cross Sections and Technology in Washington next March.
The possibility of reactor production of high atomic number actinides was realized even before the onset of reactor operations, so a major interlaboratory program was undertaken to accomplish it as soon as the achievement of irradiation fluxes in excess of 1014 n/cm2-sec in the Materials Testing Reactor eMTR) at Arce·, Idaho, offered reasonable conversion rates. 4 The rather unusual irradiation specimens, aptly called napkin rings, are illustrated in Fig. 8. 9 About 100 of them were fabricated at the Argonne National Laboratory from plutonium-aluminum alloys prepared at Los Alamos.
The plutonium alloys were fully clad with aluminum and the rivets inserted in the corners to act as spacers for cooling water flow. Samples of these irradiation specimens were widely distributed to Los Alamos, Berkeley, Knolls, Chalk River, and Harwell as well as being processed at Argonne. In the seven-year program from 1952-1959 the MTR produced about 30 Vg of 252Cf as well as smaller amounts of 249Bk and the other californium isotopes. This material proved of sufficient interest that larger-scale production programs were then undertaken at Savannah River and Oak Ridge.
Figure 9 shows all the major transplutonium programs undertaken to date including the individual thermonuclear shots and the earlier ~ffR programs. The large scale production got underway in June 1959 with plutonium irradiations in the production lattices of the Savannah River reactors. Two separate campaigns were run, Transplutonium-I and Transplutonium-II, which between them p.roduced 930 g 242Pu, 300 g 243Am, and 330 g Z4~Cm.10 At that time, it was thought that the actual produc-
-26-
REACTOR PRODUCTION OF CALIFORNIUM
ATOMS REQUIREO/ATOM 252Cf PROOUCEJ) 1.0 AFTER CAPTURE AND DECAY I
1.3 986 986 247 247 72 72 72 69 10.3 9.3 3.9 3.8 3.7 3.7 I I
FISSION
4%
• , ,
FISSION
85%
• : 10%
• , ,
I I
58%
t I
FISSION
3% + 1 ,
I I FISSION
75%
I 1 1 FISSION
65%
f , 249Cf __ .. 250Cf _ 251Cf _ 252Cf _ 253Cf
t t \ I \ ,
SPONTANEOUS FISSION
85.5 ! 0.5 YEAR H.L.
'244Cm _ 245cm _ 24SCm _ 247Cm _ 248Cm _ 249Cm
FISSION FISSION t t I
75%
• I , 71% , , ,
239pU __ 240pu _ 241pU ..... 242pu _ 243pu
t 238U _ 239U
L _________________ ~
ALPHA DECAY 2.731 ! 0.007 YEAR H.L.
I I I I I I I 1 1 I I I I I I 1 1 1 I I I I 1799 812 566 319 248 176 105' 36.0 25.7 16.4 12.5 8.7 5.0 1.3 o o
NEUTRONS REQUIRED/ATOM 252Cf PRODUCED
Fig. 7.
tion' of berkelium, californium and the other higher actinides from these intermediates would be carried out almost exclusively at Oak Ridge in the new High Flux Isotope Reactor, or HFIR, then under design, and in fact the Transplutonium campaign nuclides did eventually provide the startup targets for the HFIR. However, before that startup took place, the Transplutonium program received a major boost from an 'independent SRP program to produce about 3 kg of 244~ for use in developing isotopic heat sources. lO - l This program was performed in two steps. The first step, Curium I, carried out in 1964, burned most of the fission heat from a plutonium irradiation lattice, and the second step, Curium II, carried out in i965-l967, used a high flux lattice to transmute part of the reconstituted plutonium targets to 244Cm and 9ther higher actinides. Between the two Curium campaigns a High Flux Demonstration Lattice 14 run as a pilot for Curium II, irradiated about 525 g of 242pu in fluxes up to 5.4 x 10¹⁵ n/cm2-sec. About 1 mg of berkelium and 11.8 mg of californium were obtained from these :::mnpaigns.
Meanwhile, the HFIR started up in September 1966 and has continued to operate ever since that time as the mainstay of the AEC's research production of actinides. I will return to the HFIR operation in more detail in a few minutes.
The Savannah River transplutonium programs were resumed in 1969 with a large-scale program to make 252Cf available to industry. This program used the residues of the Curium II operations in a new high-flux lattice, Californium I, to produce about 2 grams of 252Cf in 16 months of operation.13 This material, plus that produced in HFIR by reirradiating Cf-I targets, presently constitutes the
world's primary supply of californium. At the conclusion of Cf-I the targets were transferred to low flux positions in the regular Savannah River lattices where just enough new californium is made to balance decay; the targets have been removed for reprocessing as the demand required. Approximately 0.75 g of 252Cf has been recovered to date from this material.
The Californium-I campaign was paralleled by a new plutonium-burning campaign intended to produce replacement 242Pu, 243Am, and 244em at considerably lower costs than in the Curium-I and II campaigns. The savings result from performing the irradiations at comparatively low fluxes over long time periods rather than in a crash high flux campaign. The products serve as a general purpose actinide stockpile as well as potential targets for berkelium and californium production.
Figure 10 is a drawing of a Savannah River reactor. 12 Even though these reactors, designed back in 1952, are rapidly approaching great granddaddy status they have proved almost ideal for the transplutonium programs just because of their relative lack of modern specialization. Basically each reactor is simply a tank of heavy water about 18.5 feet in diameter with a 16 foot water depth. It is provided with heavy shielding, with an unusally flexible control system of some 427 separate control and safety rods, and with a powerful D20 coolant flow. Lattice positions are large and well spaced from each other and can accommodate a variety of assembly types. This seemingly unsophisticated and unspecialized design puts very few constraints against the design of very sophisticated and very specialized lattices to perform specific transplutonium production
o U ! ;' ')
-27-
NAPKIN RING IRRADIATION ASSEMBLY
Fig. 8.
Ca lendar Year
Materials Test Reactor I Plutonium Irradl.atlons Continuing
Target Irradiation
Savannah River
Oa\( Ridge
t Thermonuclear Mike
High Flux Isotopes Reactor
pa! TteedttKankakee Barbel II~ulcan
t Hutch
Cyclamen
Fig. 9. Principal Transplutonium Production Programs
-28-
Fig. 10 Savannah River Reactor
tasks. An eXrunple is the high'flux demonstration lattice illustrated in Fig. 1114 which still holds the reactor flux record of 6.1 x 10¹⁵ n/cm2-sec. In this lattice only the very center of the reactor tank is loaded with fuel and targets, and all the cooling flow is concentrated into this area so as to allow heat removal rates as high as 2.66 x 10⁶ Btu/hr-ft2. Under these conditions fuel lifp is very short_ only ~ few days, but the reactor is provided With a rapid loading and unloading system which can change over the lattice in one day or less.
The HFIR reactor, illustrated in Fig. 1216 makes an interesting contrast to the Savannah River reactors. Also a very successful design, it is intended not as a large, general purpose reactor, but as a very small, single purpose irradiator specialized to the very particular task of transplutonium isotope production and research. Fluxes of up to 5 x 10¹⁵ n/cm2-sec are achieved with a power of about 100 megawatts and a fuel loading of ,about 9.4 kg of highly enriched uranium, which
lasts for about 23 days of operation. The target area is about 5 inches in diameter and the capacity is about 300 grams of target isotopes.
CHEMICAL SEPARATIONS
HFIR's sister facility, the Transuranium Processing Plant or TRU, illustrated in Fig. 13,17 has perhaps been of even more importance than HFIR to the berkelium and californium programs, since it has been used not only to recover the HFIR production, but also the production to date from the Savannah River Cf-I lattice. Quantities of these materials recovered through 1974 are lis~e~ in Fig. 14.18 They amount to about 218 mg 4 Bk and 2017 mg 252Cf as well as the other actinides through 257Fm. About half a: gram of californium is now being produced each year, together with a tenth that quantity of berkelium.
Separations technology has been improving steadily throughout the transplutonium campaigns, and a large number of different processes have
o . " i <~J "'-.)l , •
HIGH FLUX DEMONSTRATION LATTICE IN A SAVANNAH RIVER REACTOR
Fig. 11.
Control Rods
Active Lattice (6'high 7'dia.)
020 Reflector (IS't'dia.l
U "
-29-
_.j . "j J '" I oj
ORNL HIGH FLUX ISOTOPE REACTOR
TARGET RODS (Targets O.247"D, x 20"H)
INNER CONTROL ROD
OUTER CONTROL ROD (18.6" O,D.)
Fig. 12.
INNER FUEL PLATES (5" I.D.,IO"O.D., 20" H.J
OUTER FUEL PLATES (11.5" I.D.,17"O.D., 20" H.J
FUEL CONSTRUCTION
Fig. 13. Transuranium Processing Plant (TRU) at ORNL (XBB 763-7611)
-30-
Bk AND Cf RECOVERIES IN THE TRANSURANIUM PROCESSING PLANT been used at various times at Oak Ridge and Savannah River as well as for the more specialized recovery programs at Argonne, Berkeley, Livermore, Los Alamos, and other sites. Figure IS illustrates one of the latest flow sheets, that for the completed, but as yet unused Multipurpose Processing Facili ty (MPPF) at Savannah River. Like TRU this is a manipulator facility, and is tucked into unused space behind the 5.5 foot thick concrete walls of one of the SRP process canyons. Capacity is large, up to 260 mg of 2S2Cf at each manipulator facility at anyone time. The separations are built around cation ion exchange chromatography with very finely divided resins to provide high separations factors. Pressurized c~lumns are required for reasonable flow rates. 0
YEAR 1966
1967
1968
1969
1970
1971
1972
1973
1974
249 Bk • mg 252cf• mil
0.03 0.1
1.0 5.3
1.4 7.0
3.2 22
14.3 117
50.5 403
47.4 476
62.0 586
38.0 401
217.8 2017
Fig. 14.
TRANSPLUTONIUM SEPARATIONS FLOW SHEET
TRANSFER SOLUTION FROM SRP SEPARATIONS PLANT OR MPPF DISSOLVER
If the original targets contain much plutonium, the first step is to remove this plutonium plus the nonlanthanide fission products by conventional solvent extraction. Then, after feed adjustment to the desired concentration and acidity (and the addition of NaN0Z to help complex rutheni~), the feed solution is loaded onto DOWEX 50W- X8 resin saturated with a ZnZ+ barrier ion, and elution is begun with 0.05 M DTPA buffered to pH 6 with NH40H. In the presence of the DTPA chelating agent the resin has less affinity for zinc than for the actinides and more affinity for NH4+ so the displacement development gives self-sharpening bands. Einsteinium and fermium, californium and berkelium come off in that order in the Zn band,and there is good separation between this band and the following em/Am, lanthanide, and NH4 + bands. With some recycle it is possible to obtain separate Es/Fm/Cf and Bk fractions at this time.
Final purification of the separate californium and berkelium fractions proceeds by essentially duplicate elution chromatography processes. First the DTPA is removed by conventional ion exchange, sorbing the transplutonium elements on the column, washing through the DTPA, and eluting the sorbed ions with 5 M HN03. Next the actinides are separated from the zinc barrier ion introduced in the displacement chromatography step and from similar cationic impurities by carrier precipitation with lanthanum hydroxide, which is followed by redissolution in 3 molar nitric acid. Then the solution is loaded onto the NH4+ form of DOWEX 50W-X8* and cluted with 0.4 molar a-hydroxyiso-
D .:-~
- 31-
;I .,:;; V ·;1 i l
butyrate, varying the pH stepwise from 3.4' to 5.0 to vary the effective concentration of this complexing agent. The complexed actinides are bound to the column more tightly than the NH4+ ion and are only slowly displaced by it. Four actinide fractions are obtained, Fm/Es, Cf, Bk and Om/Am, in that order. Finishing of the individual actinide fractions is accomplished by extracting them onto a resin column and then calcining the resin. In the case of californium, californium oxysulfate, CfZ02S04, is obtained by calcining at 800°C and californium oxide, Cf203, by calcining at 1250° C. 21
One of the particular features of the MPPF is the MOSES computer control system for the ion exchange operations, where MOSES is an acronym for Monitoring On-Line System for Elemental Separations. 22 It is illustrated in Fig. 16. Basically the MOSES system works by using gamma and neutron monitoring of shielded, completely contained loops from the process streams to determine the concentrations of the actinides of interest. These inputs are then fed to a PDP-9** computer for the actual process control. Three detector systems are used, BF3 counters to measure neutrons from the spontaneous fissions of 252Cf, Z50Cf, and 244em, a sodium iodide scintillationl~~tector to monitor the 1. 27 MeV gamma ray from Eu and l60Tb, and a lithium-drifted germanium detector to give specific resp'onses to the gamma photopeaks for 244em, Z43Am, l5~Eu, l60Tb, and l44Ce. Two or more detectors detect all isotopes of interest except for 243Am to which only the Ge (Li) detec-
MOSES ION-EXCHANGE ON-LINE CONTROL SYSTEM
Shielded Sample
Loop
Out-In-
High Resolution Ge(Li) or Si(Li)
Detector
Neutron (8 F3 )
Count Electronics
Gamma (NaI) Count
Electronics
Pump Control
High Count Rate Amplifier
Data Input Control Logic Interface
Fig. 16.
Digital Signal Processi ng Interface
(DSPI)
Live Time Clock
Visual, Display Audio Alarms
tor responds. The usefUlness of the system has been well demonstrated in the SRP curium programs, which included the separation of about 10 mg of californium.
FurURE PRODUCTION
Changing the perspective now from the existing production programs for berkelium and californium to possible future production programs, the primary change is in the production starting point. The original programs had quite literally to start at square one with 238U. As we saw earlier, this involved multiple processing steps and the investment of hundreds or thousands of neutrons and target atoms for each atom of berkelium or californium produced. However, as shown by Fig. 17 in making approximately 2 grams of 252Cf availabie to date we have in fact also done most of the work towards producing an additional SO grams or so of berkelium and californium by producing a high grade stockpile of curium intermediates. Expressing the irradiations in terms of gram atomic weights of neutrons required, we see the existing stockpile has already absorbed 238 moles of neutrons and only about 7 more are required to tum it into about SO grams of californium. Further, these high-grade targets are backed up by about 10 kg of americium and curium (unseparated) from a still continuing SRP irrad1ation program.
Over the still longer range the berkelium and californium will come from byproduct production in power reactor fuel cycles. Some years ago I surveyed this possibility in a paper grandiosely
SRP PRODUCTION OF ACTINIDE INTERMEDIATES
~IOLES NEUTRONS GRAMS INVESTED
SRP ACTINIDE INTERMEDIA1BS
Cf-I (A = 244.84) 2338 238
Pu BURN fA = 243.3) 9900 865
2S2pRODUCTlON
SEPARATED TO DATE 2.0 14.3
TO BE SEPARATED 1.5 10.7
FROM Cf-I INTERMEDIATES 50.0 6.5"
FROM Pu BURN INTERMEDIATES 140.0 99"
* ADDITIONAL IRRADIATION REQUIRED TO PRODUCE 2S2cf .
Fig. 17.
-32-
entitled Tons of Curium and Pounds of Californium. It turns out I was much too modest in my estimates.
As shown by Fig. 18, the AEC predicts the power reactors to generate about 1010 megawatt days of heat between now and the year 2000,23 and, even without breeder reactors, at least 0.5 gram of plutonium will be produced for each megawatt day. The total amount of plutonium produced between nmv and the year 2000 is thus predicted to be 5000 metric tons or more. It is assumed that eventually all of this plutonium will serve as reactor fuel, much of it by burnup in the same fuel element in which it is formed, the rest by chemical recovery and recycle into other reactors. However, as we saw earlier in Fig. 7, about 7% 0f this plutonium will in the process transmut to americium and curium. Again part of this transplutonium residue will be burned as it is produced and part recovered, and again it is assumed that, in order to avoid possible escape of this very long lived activity into the biosphere, it will be necessary to recycle the recovered material for neutron burnup. Thus power reactor operation between now and the year 2000 carries an eventual commitment to bum up some 360 metric tons of americium and curium. From Fig. 7, we find this process will produce 5 tons--not pounds--of berkelium and californium. While it is unlikely that more than a tiny fraction of this production can or should be recovered--after all the basic purpose of the program is to burn out the actinides--its existence means that berkelium and californium deliveries can be set entirely by demand and not capacit2 rest~ictions. These demands particularly for 25 Cf, w1ll be discussed in the next talk.
2S2Cf PRODUCTION FROM POWER REACTOR ACTINIDE BURNUP
EXPECTED NUCLEAR POWER GENERATION IN THE USA THROUGH YEAR 2000
0.8-1.4 x 10¹⁰ MEGAWATT DAYS
(FROM AEC FORECAST OF NUCLEAR POWER GROWTH, WASH-1139(74))
EXPECTED PLUTONIUM GENERATION IN THE USA THROUGH YEAR 2000
~.S x 1010g 239Pu
(BASED ON 0.5g/MEGAWATT DAY IN LWRs. COUNTS BOTH RECOVERED Pu AND THAT BURNED IN REACTOR BEFORE RECOVERY)
252Cf PRODUCTION IF REQUIRE BURNUP OF ALL ACTINIDES RATHER THAN WASTE DISPOSAL
5000 kg 2S2Cf
(FROM SLIDE 7 - 1 ATOM OF 252Cf WILL BE PRODUCED FROM EACH 986 ATOMS 239pu BURNED)
Fig. 18.
o g; .~ ~:i ~,,j ,
~
BIBLIOGRAPHY
.1. J. Mi1sted, A. M. Friedman, and C. M. Stevens, Nuc1. Phys. 71, 299 (1965).
2. J. Mi1sted, et a1., J. Inorg. Nuc1. Chern. 31, 1561 (1969)
3. A Chetham-Strode, Jr., UCRL 3322 (1956).
4. W. C. Bentley, et a1., Proc. UN Intern. Conf. Peaceful Uses Atomic Energy, 1st, Geneva, 7, 261 (1956). -
5. P. R. Fields, et a1., Phys. Rev. 102, 180 (1956).
6. G. A. Cowan, CONF-681032 (1969), p. 151.
7. S. F. Eccles, CONF-700101 (1970),Vo1. 2, p. 1269.
8. L. B. Asprey and R. A. Penneman,C & E News, 45, No. 32, p. 74 (1967). --
9. P. R. Fields, CONF-681032 (1969), p. 11.
10. W. P. Overbeck, C. H. Ice, and G. Dessauer, DP-1000 (1965).
11. H. J. Groh, et a1 Nucl. Appl. 1:., 327 (1965).
12. W. P. Overbeck, DP-1066, Vo1.1 (1966),p. 1-3.
i) '"
-33-
J '( ,- .' s·" j ~j
13. G. T. Seaborg, et a!., Proc. UN Intern. Conf. Peaceful Uses Atomic Energy, 4th, Geneva, 2, 4.6-1 (1971). -
14. J. L. Crandall (ed.), DP 999 (1965).
15. J. A. Smith, CONF-681032 (1969),p. 179.
16. F. T. Binford and E. N. Cramer, ORNL-3572 (1964 ).
17. J. E. Bigelow, CONF-681032 (1969), p. 159.
18. J. E. Bigelow, et a1., ORNL 4376, 4428, 4447, 4540, 4588, 4666, 4718, 4767, 4833, 4884, 4921 (1968-1974). Also personal communication J. E. Bigelow.
19. Kelsch, A. J. Lethco, and J. B. Mellen, stems Techno10
20. J. T. Lowe, W. H. Hale and D. F. Hallman, I & EC Pro. Desc. & Deve1opment,10, 131 (1971).
21. R. F. Bradley and G. A. Burney, DP 1307 (1972).
22. M. A. Wakat and S. F. Peterson, Nuclear Tech. 17, 49 (1973).
23. USAEC Office of Planning and Analysis, WASH-1139(74) (1974).
-34-
Introduction of Frank Baranowski Dr. Seaborg
I want to remind you that the reason these large amounts of americium and curium and califOrnium and so forth have been produced during the '60's, and which have been so useful in our research program and probably will continue to be useful, is because one of the isotopes, californium-252, has practical applications. The production of these research quantities is sort of a spin-off of that. Now we're going to hear from the man from the AEC in Washington who has been responsible at that end for this large production program. Frank Baranowski and I sort of worked hand-in-glove during my ten years in Washington. It didn't do the program any harm that the Chairman of the Atomic Energy Commission was interested in transuranium elements during the time this buildup occurred. Frank, as I've indicated, has been with the Headquarters staff of the Atomic Energy Commission and he served as Director of the Division of Production essentially all of the time I was in Washington, so we worked together in this program. Frank left
Washington a day or so ago when his employer was the Atomic Energy Commission and he's going to return when his same employer is the Energy Research and Development Administration, ERDA. The AEC went out of business yesterday and ERDA came into business yesterday and this is the first working day. Frank received a B.S. in chemical engineering form New York University and an M.S. degree from the University of Tennessee. He has been associated with the nuclear program essentially from the beginning. He was assigned to the Manhattan Engineer District in Oak Ridge in 1945, and after the War he joined the operation in Oak Ridge, came to Washington in 1951 where he has served in the Division of Production in various capacities, worked his way up the line finally until he became Associate Director and then, since about 1961, the Director of the Division of Production. We are very fortunate to have him here today to give us a status report on californium-252. Frank ....
Status Report on 252Cf F.P. Baranowski
It is a pleasure for me to be here today among so many of the pioneers in the field of transuranium, isotopes.
I have the honor of reading the following statement on behalf of Dr. Robert C. Seamans, the Administrator of the Energy Research and Development Administration, which is going into operation today:
"Congratulations on the 25th birthday of berkelium and californium! I am particularly pleased that current applications for californium-252 range from cancer radiotherapy to many nuclear and nonnuclear industrial uses. Seeing the progress which has been made up to this time should be of immense pride to those who gave birth to this element some 25 years ago.
"The valuable national scientific resources represented by our laboratories and universities are being called upon again to assist this country, but now in the broader mission of ERDA. I hope to meet with representatives of the laboratories on a periodic basis to discuss ERDA programs including the necessary basic research work to solve our energy problems.
"Once again, congratulations and my best wishes for continued success."
I can't help but reflect upon the coincidence of this meeting recognizing the anniversary of the discovery of new elements with the beginning of a new energy emphasis within the United States and the formation of a new Energy Research and Development Administration. Atomic Energy ushered
into the world a new primary energy source in which many here have made a lasting contribution. This new source of energy has brought with it new avenues of research which have led to discoveries which are of significant benefit to all of mankind.
In looking back to 25 years ago, I recall that I was in the midst of a major expansion of 235U enrichment and plutonium production for the defense effort. Even at a time of great stress on weapons there was a nucleus of scientists engaged in and promoting a strong basic research program. We in the production system are grateful to the foresight of these early researchers. If they had not prevailed, what would we be doing with the time we now spend in explaining and justifying to OMB, Congress and others, the reasons why we should keep on searching for new benefits of 252Cf. The job of selling has been not too difficult; most of AEC work is behind us. We are letting the isotope sell itself. The potential continues to be impressive. I might add that the two Chairmen that have succeeded Dr. Seaborg at the AEC have continued to support the 252Cf program initiated under the stewardship of Dr. Seaborg.
My first exposure to transplutonium elements was in the explanation of ~ National Tr~splutonium Program by Dr. Abe Fnedman, then wIth the Division of Research. I was impressed since I expected a National Program to be big. After being briefed, I wondered why so much effort on inserting 18 assemblies containing 12 kg of plutonium in a Savannah River reactor; and irradiating them for years. What patient people! Of course I was only the Branch Chief of the Division of Production's Chemical Reprocessing Branch at the time the program was approved by the Commission and my effort was concentrated on processing ton quantities for weapons and later nuclear power. On a percentage basis the
0 tJ ,. c {) f- J s~ '<i
transplutonium expansion was greater, however. I would wager a bet that it was much easier to obtain approval of an entire reactor on 252Cf in
~.J
-35-
the later 1960's than the dedication of an extremely small fraction of capacity in the late 50's and . early 60's to the production of transplutonium's isotopes. Need I explain to those here why?
The production of 252Cf at the production sites was built on the base of a program initiated by the Division of Research with AEC laboratories leading to the construction of the HFIR/TRU facilities at Oak Ridge. I might also add that it was the Space Program's need for curium-244 that really provided a major start to larger production of transuranium isotopes. Curium-244 was one of the heat source isotopes to have a large scale production effort. As a result of this effort the supply of californium was increased and attention was focused on possible applications for 252Cf.
J 'l 6
The technical advances made by du Pont in the high flux operation of heavy water reactors at Savannah River~ere a key factor in the accelerated effort for developing a new, market-oriented 252Cf program. The stockpile of intermediates from the curium production 52mpaign, a high grade of feed for production of 2 Cf, was one of the encouraging factors that led du Pont, the Savannah River Operations Office, and the Division of Production to strongly recommend that a great12 expanded program for developing uses for 25 Cf be undertaken by AEC.
The list of possible applications for neutron sources is impressive and has always best been represented by Jack Crandall's 252Cf Tree (Fig. 1). The problem of determining which branches of the tree to exp10~e with such a limited supply of 252Cf and, I might add, money, called for a different approach from previous isotope application development programs. We were fortunate because applications studies at AEC labs had already been
252Cf USE TREE
Fig. 1.
'initiated with ORNL/TPC 252Cf and had shed some light on potential applications (Fig. 2).
Perhaps the most significant potential application, cancer radiotherapy, was being studied under funding by Biology and Medicine by Dr. Harold Atkins at Brookhaven; Argonne National Laboratory was performing studies on neutron radiography with 252Cf performed by Drs. Barton and Burger; Los Alamos Scientific Laboratory was doing safeguards studies under Dr. Bob Keepin; and Savannah River Laboratory was working with the U.S. Geological Survey on mineral exploration studies. As you can see, the undertaking of a 252Cf market program, as for other new endeavors, was being built upon the contributions of others going back many yeats, all of whom were dedicated and extremely competent.
To determine industry's interest and the true market potential for 252Cf, however, we needed to get industry involved with performing development and evaluation work. The main question was:
How should we bring together a sufficient number of the appropriate investigators and the limited supply of californium for the best coverage of the total potential market and with their own funds?
-36-
The answer which we proposed was to embark on a unique loan program whereby AEC provided encapsul~ed 252Cf sources to selected industrial, _ educatlOnal, and medical participants who funded and PZrformed applications studies and evaluations with 52Cf. I might add we had no indication if there would be any favorable responses to our offer.
The Division of Production was given responsibility for the program. Selection of participants in the loan program was performed with assistance of many AEC divisions such as Research, Isotopes Development, Biology and Medicine, Nuclear Education and Training, Reactor Development, and Raw Materials. The program was administered by Savannah River Operations Office and SRL-du Pont staff. This approach proved to be an efficient means in the early stages of the urogram of utilizing limited quantities of 2~2Cf.
The 252Cf loan urogram was announced by Dr. Seaborg at a 252Cf Symposium in New York on October 22, 1968. As shown in Figs. 3-6 ,over the course of the loan program 32 industrial loans and 14 medical loans were made. At the height of this loan program in 1971 and 1972 it is estimated
that private institutions were contributing approximately $8-$10 million annually in terms of funds and facilities for 252Cf evaluation work as comgared to AEC annual investment for encapsulated 252Cf of approximately $2 million. None of the AEC funding was spent on industrial applications studies. Industry paid its own way. This level of funding exceeded the total annual budget of the AEC on isotope application development.
Quarterly reports on the studies were provided to the AEC for publication in 252Cf Progress Re~orts designed to spread new information on 25ZCf applications as quickly as possible. By loaning sources the AEC could recycle used sources. Medical sources, decayed to such levels that they were no longer suitable for applications studies, were made available to universities and the IAEA to familiarize other potential market customers with the unique properties of 252Cf. Over 50 U.S. universities are currently using these sources and we have a large supply still to give away.
Concurrent with the loan program, a high flux reactor campaign was initiated at Savannah River to increase the limited supply of 252Cf. This campaign eventually produced 2.4 grams of 252Cf. The increased availability of 252C£ made it possible to offer 252Cf for sale at $lO/flg. This should come to about $4.5 billion per pound. This price reflects the neutron allocation cost attributed to the production of 252Cf. The AEC sold the material in an unencapsulated oxide form with industry providing encapsulation services. To assist industry the AEC has developed and offers for sale unencapsulated 252Cf in a solid, palladium cermet wire form in a variety of 252Cf co~~entrations. To date, approximately 60 mg of 2 Cf have been sold.
In order to bring non-nuclear and small companies into the 252Cf program, the AEC established in 1972 252Cf Demonstration Centers in Baton Rouge at LSU and in San Diego at facilities operated by Intelcom Rad Tech, Inc. Each Cznter was provided with 100 mg of encapsulated 25 Cf sources ~ return for providing facilities and equipment free of charge to Center users. Center users can either take the sources from the Center or utilize Center facilities. Assistance from the Center operator is available at approved rates. We have been very pleased with the success of these Centers.
The Demonstration Centers have been very successful at promoting interest in 252Cf with 34
INITIAL OF-252 STUDIES
LABORATORY APPLICATION INVESTIGATOR
BROOKHAVEN NATIONAL LAB
ARGONNE NATIONAL LAB
LASL
SAVANNAH RIVER/U:S.G.S.
CANCER RADIOTHERAPY
NEUTRON RADIOTHERAPHY
SAFEUGARDS
MINERAL EXPLORATION
Fig. 2.
DR. H. L. ATKINS
DR. J. P. BARTON & H. BURGER
DR. R. KEEPIN
DR. F.E. SENFTLE
o u tJ t;,{
•
CALIFORNIUM 252 INDUSTRIAL EVALUATORS
POLLUTI ON CONTROL
• GULF ENERGY & ENVIRONMENTAL SYSTEMS, INC.
• AMERICAN SCIENCE AND ENGINEERING
INTERNATIONAL NUTRONICS
• BATELLE MEMORIAL INSTITUTE
U. S. BUREAU OF MINES
U. S. DEPARTMENT OF AGRICULTURE
ADVANCED TECHNOLOGY CENTER, INC.
• U. S. GEOLOGICAL SURVEY
• KANSAS STATE UNIVERSITY
YOUNGSTOWN STATE UNI VERS ITY
- Participants studying more than one application.
Fig. 3.
CALI FORNI UM-2S2 EVALUATORS - continued
MI NERAL EXPLORATI ON
GEOSENSORS INC. UNI VERS ITY OF GEORGIA
• U. S. GEOLOGICAL SURVEY KERR-McGEE
• UNIVERSITY OF UTAH • KENNECOTT COPPER
PETROLEUM EXPLORATION
TEXACO SCHLUMBERGER
PROCESS CONTROL
REPUBLIC STEEL CORP. COLUMBIA SCIENTIFIC INDUSTRIES GULF RESEARCH AND DEVELOPMENT CO.
• UNIVERSITY OF TEXAS • PICATINNY ARSENAL ·AMERICAN SCIENCE AND ENGINEERING • KANSAS STATE UNIVERSITY ·UNIVERSITY OF UTAH • KENNECOTT COPPER
BUREAU OF MINES, TWIN CITIES METALLURGY RESEARCH CENTER
-PartiCipants studying more than one application.
Fig. 5.
l:'} tJ -'~6
-37-
~S 7 7
CALI FORNI UM-252 EVALUATORS - continued
NEUTRON RADIOGRAPHY
GENERAL DYNAMICS • BATIELLEMEMORIAL INSTITUTE
ARGONNE NATIONAL LABORATORY • UNIVERS ITY OF TEXAS • PICATINNY ARSENAL • UNIVERS ITY OF UTAH
WATERTOWN ARSENAL
EDUCATION
GEORGIA INSTITUTE OF TECHNOLOGY • UNIVERS ITY OF UTAH • KANSAS STATE UNIVERSITY
NUCLEAR SJlFEGUARDS
• UNIVERS ITY OF TEXAS • GULF ENERGY AND HNIRONMENTAL SYSTEMS
EURATOM
ACTIVATION ANALYSIS
EASTMAN KODAK COMPANY LOUISIANA STATE UNIVERSITY NATIONAL BUREAU OF STANDARDS NATIONAL AERONAUTI CS AND SPACE ADMINISTRATION· UNIVERSITY OF PENNSYLVANIA
• Participants studying more than one application. Fig. 4.
CALIFORNIUM'252 MEDICAL EVALUATORS
CANCER RMIOTHERAPY
M. D. ANDERSON
• CHRISTIE HOSPITAL
• CHURCH I LL HOSP ITAL
UNIVERSITY OF CALIFORNIA
HOSPITAL OF UNIVERS\TYOF PENNSYLVANIA
UNIVERSITY OF CINCINNATI
SLOAN-KETTER ING INSTITUTE
BROOKHAVEN NATIONAL LABORATORY
PACIFIC NORTHWEST LA.BORATORY
AMERICAN ONCOLOGIC HOSP \TAL
V. A, EDWARD HINES JR.. HOSPITAL
KENTUCKY RESEARCH FOUNDATION
• JAPJlNESE CANCER INSTITUTE
UNIVERSITY OF CHICAGO
-Foreign Partic~ants
Fig. 6.
contracts at San Diego and 17 at LSU. Many industrial applications were initiated and developed at the Centers.
-38-
But first, before I get to industrial applications, I'd like to report on current developments in the cancer radiotherapy studies with 252Cf. Last week in Denver, the 252Cf Radiation Therapy Oncology Group of the National Cancer Institute met to discuss a protocol for proceeding, after five years of studies on patients for whom conventional radiotherapy treatment had proved ineffective, to clinic3l~ curative tests on cancerous tumors with Z5LCf. This protocol is expected to become operative in the near future. Five domestic hospitals are expected to begin clinical trials during CY 1975 and another three foreign hospitals should begin clinical trials during the next two years. I'd like to stress that in order to assure a prompt, yet safe and ethical evaluation of 252Cf's radiotherapy application, these medical evaluations have been coordinated by subgroups of the National Cancer Institute and, from their inception, administered by the AEC's Division of Biology and Medicine. Obviously, we are very pleased that the initial phase of the radiotherapy program has been successful. We are told, however, that it could take another 3 to 5 years of clinical tests for some tumors before the final verdict is in on 252Cf's medical potential. If successful, this application alone, with its tremendous potential in terms of benefits to mankind, would make all our combined efforts on 252Cf worthwhile.
Unlike the medical application, 252Cf is already in use in industry with significant, additional 252Cf systems under development. 1ne nuclear industrY, quite naturally, was the first to utilize 252Cf on a routine basis with 252Cf currently being used as a reactor startup source, in safeguards for nuclear materials assay systems, in uranium exploration, and in the fuel industry in fuel rod quality control analyzers. In addition, organizations which had previously used nuclear technology were also early users of californium. For instance, Kodak has purchased a subcritical multiplier developed by Rad Tech for the analysis of fluorine in plastics. The unit has a multiplication factor of 25 and operates at a keff of 0.99. Licensing of the unit is currently in the final stages and the unit can be operated by unlicensed technicians.
At the present time we are witnessing the introduction of californium systems into areas not previously utilizing nuclear techniques. To broaden the benefits, this is the market we are interested in penetrating. I would like to briefly describe two of the most interesting of these systems.
The first system is one we have particularly high hopes for because of its significant benefits in combating terrorism. It is a high speed 252Cf letter bomb detector. This instrument uses a complex interrogation system which includes a californium-252 source. Mail is handled at the rate of 10 pieces per second with an interrogation tlme of approximately 40 milliseconds. It is conceived that these letter bomb detectors will
operate as stand-alone instrillnents in private and government offices that are threatened with letter bombs, and also from the leading edge of a fully automated mail sorting and handling system of the future. The operation of the completed system was demonstrated in San Diego on January 9, 1975, and the system is currently installed and operating in a government installation.
The second system involves the use of 252Cf neutron radiography for aircraft maintenance inspection. Until now, the only reliable technique to detect aircraft corrosion has been visual inspection after partial or complete disassembly, particularly when the corrosion is at the interface of two structural members. During the past few years, however, the feasibility of using portable neutron radiography systems for the inspection of flight line aircraft in maintenance environments has been demonstrated. Such evaluations have clearly demonstrated to the military and commercial aircraft operators the cost and manhour savings resulting from neutron radiography. As an example, neutron radiography can perform the inspection of certain critical areas in the wing tank of a commercial aircraft in 20 hours compared to the 225 hours (10 days) it takes at the present time. The loss of revenue from grounding a large jet liner for 10 days is significant.
A program has just been completed in which a technique for the detection of adhesive defects in helicopter rotor blades has been demonstrated. This can save the government considerable amounts of money. There are rotor blades from one specific type of helicopter valued at $20 million in storage at this time because there is no satisfactory technique to assess the quality of the blades at this time.
In addition to these two systems, another system for the detection of narcotics in sealed metal containers is currently being developed. The system could be particularly useful in the screening of automobiles. Initial tests have been very successful and this is another important application of 252Cf which may be implemented in the future. The instrument was able to locate a number of different narcotics hidden in an automobile.
The increased value of equipment and immeasurable potential value of lives represented by the above systems are an indication of the important contribution californium is expected to play towards greater public safety in the future.
I think it is important that the discovery of californium here 25 years ago has made the jump from a pure research isotope to a valuable_tool in industry and, hopefully, medicine. The work by theoreticians and researchers here has provided real benefits. In addition it's also important to realize that according to market experts we are still in the early stages of marketing 252Cf. We can expect to see continued applications development and industrial acceptance in future years as the demand for new and sophisticated systems continues to grow and a broader segment of the industrial community assesses its benefits.
0 u ~) , ,d ' , J '-;·i , J Jl 13 ,..~ :,) . f
-39-
Introduction of Joseph Peterson Dr. Seaborg
As you know, it [the afternoon program] will be devoted entirely to the chemistry of these elements. Joseph R. Peterson will be the first speaker. I have known Joe Peterson for 32 years. I think you realize the significance of that remark--Joe is 32 years old. The first time I met Joe was in Chicago when his family moved there early in 1943. His father, Merlin Peterson, who had just joined the Metallurgical Laboratory, was a friend of mine who did his graduate work here at Berkeley in chemistry at about the same time as I did, give or take a year or two--maybe he was a year or two before me. Here was Joe, about this high--or maybe that high--in a playpen, and according to Mrs. Seaborg, one of the cutest little fellows that you'd ever want to see-~I would say he hasn't changed a bit. In the meantime,
somehow Joe has become Associate Professor of Chemistry at the University of Tennessee in Knoxville, with connections to the Oak Ridge National Laboratory. He received his A.B. degree in chemistry from Swarthmore College in 1964 and his Ph.D. in chemistry here at the University of California, working in the Radiation Laboratory with Burris Cunningham, in 1967, more or less 30 years after his father received his Ph.D. degree here. He joined the faculty of the University of Tennessee immediately after receiving his Ph.D. and has been working on the systematic and basic chemistry of transuranium elements, and particularly one of the elements relevant to us today, berkelium, during much of that time. It's appropriate that his discussion today should be on the "Synthesis and Properties of Berkelium Metal anc~ Compounds.' 1 Joe ....
Synthesis and Properties of Berkelium Metal and Compounds
J. R. Peterson
In harmony with this morning's reminiscences, I would like to share with you a personal anniversary commemoration. As part of my Ph.D. qualifying examination on December 13, 1965, I successfully defended a proposal for my dissertation work on the preparation and properties of berkelium (Bk) and some of its compounds. One year later I celebrated that occasion by writing a poem and presenting it to my research director, the late Professor Burris B. Cunningham. Attuned to the slang expression of that time, it was entitled "Reflections of a Graduate Student or Would You Believe - A Year Ago."
A year ago, a year to the day, I stood before five profs who heard me say, "To determine the properties of BK I will study its absorption spectroscopy and still the x-ray crystallography of several compounds will tell us in solid state how ita-bounds."
Since then I have, as I promised that day, made very great strides along the way; the absorption spectrum is now known to us, and over five compounds I've made such a fuss that there is x-ray data coming out of my ears, but I've hopes of publishing in less than two
years since that day, one long year ago, which gave such a boost to my ego, and brought me from a position,
strictly second-rate to a struggling, persevering Ph.D. candidate!
Thus, a systematic study of the chemistry of berkelium was launched and is still afloat today. The last part of that proposal dealt with the possibility of preparing berkelium metal on the submicrogram scale, in accord with the limited availability of 249Bk. Fortunately, I completed my degree without having to tackle that difficult problem. There was at that time some reluctance to tum over the world's supply of 249Bk (~30 ~g) to a graduate student for such high-risk, pos.sible-loss experimentation.
It was in August 1968 that the first attempts to prepare Bk in the elemental state were made in Cunningham's laboratory on the first floor of this building. I had returned from Tennessee to participate in some collaborative experiments on einsteiniuml (Es), and while here, about 140 ~g of 249Bk were received. After some discussion Cunningham agreed to let his Ph.D. student Dennis Fujita and me use about 1/3 of this material for our metal-making work. Prior to our receiving his approval, however, we demonstrated that we had at hand suitable microtechniques by the successful preparation of terbium (Tb) metal (the lanthanide analog of berkelium) on the ~6 ~g scale. Our microtechniques were not really new, but represented a significant scaling down of the techniques used quite successfully in the Cunningham group for the preparation of lanact metals on the milligram and submilligraJll scale. in combination with the so-called "single ion-exchange resin bead technique" developed by Cunningham and Wallmann.
Metallic berkelium was to be produced by the thermal reduction of BkF3 by barium (Ba) metal vapor. Individual ion-exchange resin beads, chosen to contain about 10 ~g of berkelium, were loaded with Bk3+ and calcined in air to form Bk02, which was then treated with an HF/H2 gas mixture at ~600°C to yield spherical BkF3 samples. Each BkF3 sample was suspended above the reductant metal in a tantalum (Ta) crucible by containment in a spiral made from 1 mil diameter tungsten (W) wire.
Three attempts were made that August (one each on the 18th, 19th, and 20th) with a lower temperature of reduction being used in each successive attempt, since the experimental results indicated that berkelium metal was being lost through volatilization. Capitalizing on the valuable experience I gained in these initial attempts at Berkeley, my first Ph.D. student at the University of Tennessee (UT), James Fahey, along with the late Russell Baybarz of the Oak
TO VACUUM ..
~-----1lIt---=-- TANTALUM WIRE
PYREX
Ir.',~"--- INDUCTION COIL
CRUCIBLE VIEWING PORT
_--TANTALUM CRUCIBLE SYSTEM
TANTALUM INDUCTION SHIELD
Berkelium Metal Reduction System.
Fig. 3. Schematic diagram of reduction system.
It was obvious from our ea~lier work that a new preparative technique was necessary to minimize loss of berkelium metal through its relatively high volatility at the temperatures necessary for its production via trifluoride reduction. James Stevenson, a University of Tennessee graduate student, and I explored a number of possibilities for new preparative techniques with a particular emphasis on a system capable of attaining thermal equilibrium rapidly. We settled on the low total heat capacity system shown schematically in Fig. 6. To minimize the mass of the system, and thus allow for rapid attainment of thermal equilibrium, we used a small tantalum crucible, 1 em in overall height and 4 mm in outside diameter with a wall thickness of <0.4 mm, and a resistance-heated coil of 15 mil diameter tantalum wire coated thinly with a hightemperature ceramic glue. The tungsten rods are for support and electrical connections. The 50/50 standard taper joint, about two inches in diameter, can be used to set the scale. The trifluoride samples were suspended in a tungsten
-42-
wire spiral hung from the crucible top which was supplied with an effusion hole for the escape of excess Li metal vapor. Shown here is the setup for bead scale work used by Jim Stevenson in his Ph.D. dissertation work on 248Cm metal. Handling of the air-sensitive reductant and product metals was made easier by placing the entire reduction apparatus inside an inert atmosphere enclosure.
Single ion-exchange resin bead techniques were not applicable to our intended berkelium work on the 1/2 mg scale, so we resorted to wet chemistry methods for the preparation of the BkF3, as outlined in Fig. 7. Dr. R. G. Haire of ORNL was largely responsible for this part of the project, as well as for the purification of the 249Bk solutions. The BkF3 was precipitated from aqueous solution with HF in individual ~1/2 "mg batches, centrifuged into the bottom of a hand-made KEL-F form, and dried in air. Then the solid BkF3 chunks were transferred to platinum (Pt) boats and treated with anhydrous HF gas at 6000 C to ensure removal of oxygen from the samples. These HF-dried samples were individually reduced to metal by Li in accord with equation (3) in the crucible system I've described (Fig. 7).
Now, in a short series of slides (Figs. 8-13), I want to share with you the thrill of producing a sample of elemental berkelium. (Fig. 8) Here are the chunks of BkF3 in a Pt boat (mm scale in background). (Fig. 9) Inside the inert atmosphere enclosure they are placed in the Pt "V-scoop" and then loaded into the 2 mil diameter tungsten wire spiral suspended from the 4 mm diameter tantalum crucible top. Now toss some lithium metal into the bottom of the crucible and put on the crucible top. (Fig. 10) Give a sigh of relief that it's all together and ready to go. (Fig. 11) Now put on the vacuum envelope and evacuate. (Fig. 12) Turn on the power; the system will be up to temperature in about 20 sec, and you can see the excess lithium metal condensing on the walls of the Pyrex envelope. Lower the power for annealing of the metal sample, then turn off the power. Either cool the sample in vacuum or admit helium to quench it. Remove the envelope, open the crucible system, and (Fig. 13) admire the nice hunk of berkelium metal adhering to, but not surrounding, the tungsten wire. Recover the sample by straightening the spiral and encapsulate it in quartz for shipment to Liege.
In all ten samples were taken to Liege, five in June 1973 and five in March 1974. A summary of the heat of solution results obtained in the June 1973 campaign is shown in the next slide (Fig. 14). Our final number, after the two campaigns, is about -138 kcal/mole, or as we are reporting it, -576 ! 25 kJ/mole.
Let me now spend a few minutes summarIZIng the situation with regard to the compounds of element 97. I'm limiting my coverage to those berkelium compounds which have been studied by x-ray diffraction methods. The first of these was Bk02, prepared by Cunningham and Wallmann in November 1962 via the single bead technique using only 4 ng 249Bk. Based on four lines observed in the x-ray powder diffraction pattern, they confirmed the expected fcc structure and Ireported a lattice parameter of 5.33(1)A.
0 i) .i oj ~~ . ~ ;J Lr~, ~ c~! {,~~ .:_j
, i:< () .. , , ';'j 0
-43-
Fig. 4. Photomicrograph of first bulk sample of Bk metal.
The next slide (Fig. 15) summarizes the preparation of the five compounds "over which I made such a fuss" in my dissertation work. This work was all done on the 200 ng scale, with often the same Bk sample being used for the successive preparation of three or four different compounds. All five compounds were characterized by their crystal structure and lattice parameters. Our dlscovery of dimorphism in BkF3 was a little added bonus.
In the last slide (Fig. 16) I've listed the presently known compounds of Bk which have been studied via diffraction methods. I will defer discussion concerning the methods of preparation
of these compounds to Dr. Larry Asprey, who will describe them for the analogous compounds of californium. In addition to the dioxide, the Bk(IV) state has been further characterized by Asprey, Penneman, Keenan, Ryan, and co-workers at the Los Alamos Scientific Laboratory (LASL) through the tetrafluoride and double fluoride, and by Morss, Cunningham, and Fuger here at Berkeley through the double chloride.
The Bk (III) state has been studied via the sesquioxide (as already mentioned), the trihalides and oxyhalides (most of them prepared by Fried, Cohen, Siegel and co-workers at the Argonne National Laboratory [ANL)) ,the sesquisulfide (also,
-44-
by the Argonne group), the trichloride hexahydrate (by Burns and myself at Oak Ridge), the triple chloride (by Morss, Cunningham, and Fuger at Berkeley), the tricyclopentadienide and monochlorodicyclopentadienide dimer (by Laubereau and Burns at ORNL) , and the nitride, hydride, and possibly the monoxide (by my students Fahey and Stevenson working at ORNL). In addition to these twenty or so compounds, I know of unpublished work on BkZOZS04 and BkZOZS by Haire and co-workers at ORNL, and on Bk(OH)3 by Haire and also by W.O. Milligan of Baylor University.
And so, berkelium, as we think of ffi1d review your status today, Z5 years after birth,
We find of information on your metallic state and compounds, there is no dearth,
And we conclude Glenn Seaborg was right, when he placed you in a position of pride,
As the very first member of the second half of the series of actinides.
V(919-615) 386.2 Slov dissolution. oxide pres'!'1t
Fig. 14. Summary of heat of solution data (June 1973) for Bk metal.
anhydrous H CII H20
air ~ Bk 0 H2(1I2atm~ Bk 0 H CI ~ Bk CI N2 carrier~ Bk 0 CI ..... 1200°C 2 600°C 2 3 520°C 3 500°C
HF/H21600oc air 16000c (2: 1 )
BkF3 Bk0 2
Fig. 15.
Bk(rv):
Bk(III):
Preparation of five Bk compounds.
* Bk02 BkF4 CS2BkC16 Na7Bk6F31
Bk2
03
BkX3 BkOX Bk2S3
BkN BkC13
06H20
CS2NaBkC16 Bk(C5
H5
)3 [Bk(c5H5)2Cl~
(x = F, Cl, Br, I)
Other: BkH2+x (BkO)
Fig. 16. Compounds of Bk.
-52-
Introduction of Larned Asprey Dr. Seaborg
The next speaker is Larned B. Asprey, who is an Associate Group Leader in the Nuclear Chemistry Division at the Los Alamos Scientific Laboratory. He received his B.S. degree from Iowa State College, as it was then known, in Ames, Iowa, in 1940, then went into the Army and joined us in February 1944 at the Metallurgical Laboratory. That's an interesting story. I don't know whether Larry knows this or not, but one Saturday afternoon shortly before that time I was given a stack of descriptive material on people in what they call the S.E.D.--I think I remember it correctly, Special Engineer Detail, or something like that. I was told that these fellows had some technical background or training in chemistry and I could choose, I've forgotten what number, eight or ten or something like that, to join our group at the Metallurgical Laboratory. I remember vividly going through this large stack and looking as I went along: Don Stewart, sure he looks good; Larry Asprey, he looks good; and so forth. It
was a small proportion out of the total, I assure you, and I don't know what criteria I used but I've become convinced that I must have used good criteria; of course, I have no way of comparing with those I kept in the stack. But I thought you might be interested, if you haven't heard this story before, that thus is a man's fate determined. I mean, from then on Larry was destined to spend the rest of his life in actinide chemistry. At the end of the War, he was among the group that came back to Berkeley. He worked under Burris Cunningham here in the Radiation Laboratory and received his Ph. D. in 1949. Then he went immediately to Los Alamos and has been on the staff of the Los Alamos Scientific Laboratory ever since. He's worked on many aspects of the chemistry of the actinide elements, has had a distinguished career, and his report today, symmetrically related to that of Joe Peterson's, is entitled "Synthesis and Properties of Californium Metal and Compounds." Larry ....
Synthesis and Properties of Californium Metal and
Compounds L.B. Asprey (with R.G. Haire)
Today, I am going to talk about the synthesis of various compounds of californium and then very briefly a bit about their structure and properties. I am deliberately omitting descriptions of the tracer work helping establish the possible valencies of californium and of the many solution studies that have been carried out. I was very surprised to find out just how much work has been done in the 25 years since the element's discovery and in the relatively few years since it has been available in macro amounts. Granted that to many, 1 ~g or so does not seem very macro but to us here today, I feel macro is the correct term. I have tried to give all of the workers proper acknowledgment. If I have omitted anyone, it is not a personal act.
The first compounds I shall discuss will be those containing tetravalent californium. The first real evidence for Cf(IV) was provided by the synthesis of the tetrafluoride (Fig. 1). A resin bead containing a few ~g of californium was treated with fluorine gas by successive additions of very small amounts of fluorine at 400°C. This procedure resulted in the formation of a small, crumbly bead, yellowish in color. the bead was gently transferred to a capillary for X-ray examination which unequivocally showed it to be the monoclinic CfF4, isostructural with all of the tetravalent actinides from thorium on.
These curves (Fig. 2) show the relationship of californium to the other Sf elements. This computation was made by Prof. Zachariasen recently. The curving near berkelium and californium may be due to radiation damage or to indexing of the complicated monoclinic powder pattern.
PREPARATION - CF (RESIN) + F2
STRUCTURE - C2/c; Z = 12
AO = 12,l12') ± 0,004; Bo = 10, lIG8 ± 0,004;
Co = 8,126 ± 0,003; SO = 126,02 ± 0,03
ABSORPTION SPECTRUM MEASURED,
L, E, ASPREY AND R, G, HAIRE INORG, Nucl, CHEM, LETTERS 2, 1121 (1973) I NORG, Nucl, CHEM, LETTERS 2, 869 (1973)
Fig. 1.
The next and only other compound of Cf(IV) to be made was the dioxide CfOZ (Fig. 3). High pressure or atomic oxygen was necessary to fonn the dioxide, reminiscent of the terbium system. As you can see, it is dimorphic, converting probably due to radiation, on standing for a few months. During the work, a number of mixed oxides (CfOx) were made where x> 1.5 but ~ 2.
During the studies I am discussing you will see again and again the names of two very prolific workers. We have lost both Prof. B. B. Cunningham and Dr. R. D. Baybarz in the last few years and I know we miss their inspiration and skills a very great deal.
o u
2.40
o~
w 0 z ~ en 0 2.20
I.L I ~
2.10
} i'_ j if~j [} • tJ1 ' -~ iJ,:V ~:)
-53-
MF4
,)]I] ~ . } OtOXIOES
" /G1J ~
" " "Q.,. , b.. "- ~~~ "'-
"-"- 5f '" ,
4f J ''0...
Ho Er Tm Yb Lu Hf
Fig. 2.
C 0 0 CO 9 ) electrical C 0 F2 3 + 2 . TORR discharge' F 2
STRUCTURE - INITIALLY CUBIC, AO = 5.310 ± 0.002 A AFTER 3 MONTHS, RHO~1BOHEDRAL; A 0 = 5.372 ± 0.003 A
a = 89.92 ± 0.04 A
ALSO, MIXED OXIDES OF CFCIII)-CFCIV) ARE FORMED.
R. D. BAYBARZ, R. G. HAIRE AND J. A. FAHEY J. iNORG. NUCL. CHEM. lll, 557 (1972)
Fig. 3.
The trivalent state of californium is the stable state with respect to oxidation or reduction and one finds a number of compounds that have been synthesized and characterized. The trifluoride (Fig. 4) has been prepared in the two forms expected by radius considerations. The synthesis uses the sesquioxide and HF; the form obtained depends upon the temperature of. the reaction.
An oxyfluoride (Fig. 5) was prepared accidentally by the obviously impossible reaction of H20
on the sesquioxide. The investigators took advantage of the mishap and showed the structure to be of the fluorite type with ao = 5.561 A.
CfC13 was obtained by treating Cf203 (from ignition of a resin bead) with anhydrous HCl (Fig. 6) at 520°C. A slight overheating caused the formation of a single crystal. X rays show the formation of two structures, both an orthorhombic and a hexagonal UC13 type structure.
By using moist HCl, it proved possible (Fig. 7) to prepare the oxychloride, CfOCl. This proves to be tetragonal of the PbFCl type.
CFF3 - ORTHORHOMBIC, YF3 TYPE
Ao = 6.653 ± 0.003 A, BO = 7.039 ± 0.001 A, c' = 4.393 ± 0.003 A
CFF3 - TRIGONAL, LAF3 TYPE
Ao = 6.91i5 ± 0.003 A, Co = 7.101 ± 0.002 A
J. R. PETERSON AND B. B, CUNNINGHAM J. INORG. NUCL. CHEM. 31L 1775 (1968)
J. R. PETERSON AND J. H. BURNS J. I NORG. NUCL. CHEM. 3.0., 2955 (1968)
B. B. CUNNINGHAM AND P. EHRLICH UCRL - 20426, P. 239 (1970)
J. N. STEVENSON AND J. R. PETERSON J. INORG. NUCL. CHEM. 25, 31181 (1973)
Fig. 4.
700' CF203 + H20 (G) ------+ CFOF (ACCIDENTAL)
STRUCTURE - FLUORITE TYPE, FM3M; A' = 5.561 ± 0.004 A
J. R. PETERSON AND J. H. BURNS J. INORG. NUCL. CHEM. 3.0., 2955 (1968)
Fig. 5.
-54-
Both CfBr3 and CfOBr (Fig. 8) have been made by analogous reactions using HEr. CfBr3 has the BkBr3 type of structure. Later work shows that both the AlC13 (high temperature) and the FeC13 type (low temperature) are formed. Both x ray studies employed single crystals. CfOBr is of the PbFCl structural type.
To finish off the halides of trivalent californium (Fig. 9) both the triiodide. and the oxyiodide were prepared in a method analogous to those used for the bromides and chlorides. CfI3 has a hexagonal, BiI3 structure type while the oxybromide has the tetragonal PbFCl form. The next paper will discuss its iodide systems.
The so-called A, B and C forms of the sesquioxide are known along with some information on transition temperatures. The high temperature hexagonal A form (Fig. 10) is unstable and hard to obtain the monoclinic B form (Fig. 11) is stable and easily made at 1200° or higher. It has been found impossible to convert the B to the C form (Fig. 12). However, the low temperature C form can be made by keeping the temperature in the 700° region during treatme~t of the oxyhalide with steam or 02.
CF2~ (RESIN) + HCL(AN) ~ CFCL3 (GOO' + SINGLE CRYSTAL)
MELTING POINT = 5'i5'C
STRUCTURE: ORTHORHOMB I C; A' 3.869 ± 0.002 Coooo. ttl. 8 CMcM, N = 4 B' 11.748 ± 0.007
PuIlR3 TYPE
~/M
c' 8.561 ± 0.004
HEXAGONAL A' 7.379 ± 0.001 eorr& ttl. 9 c' 4.0900 ± 0.005
U 3 TYPE
-,--:---- -----J. L. GREEN AND B. B. CuNN INGHAM I NORG. NucL. CHEM. LEITERS 3, 3'13 (1967)
AND
J. H. BuRNS, J. R. PETERSON, AND R. D. /il\YBARZ J. INORG. NUCL. CHEM. 35.. 1171 (1973)
Fig. 6.
CFCL3 (OR CF203) + HCL (MOIST) = CFOCL
STRUCTURE: TETRAGONAL, PBFCL TYPE
A' = 3.956 ± 0.002, c' = 6.662 ± 0.009
J. C. COPELAND AND B. B. CUNNINGHAM J. I NORG. NUCL. CHEI~. 3L 733 (1969)
Fig. 7.
o
STRUCTURE; ALCL3 lYPE - HIGH T~ERATURE FORM
MlNOCLlNIC, Aa = 7.214 A. BO = ]2.423 ,~
Co = 6.825 A B = 110·45"
FECL3 lYPE - l11t'I TE."I'ERATURE FORM
RflX>IBOHBJRAL, Aa = 7.58 A - ONE CRYSTAL
It. = 56.2·
,'1
S. FRIED., D. CoHEN, S. SIEGAL AWl Bl T~I INORG. NUCL. UlEM. lErrERS !L 4':'-> ( SGJJ
..f~ c'_ 'J
j. H. fuRNS, j. R. PETERSON AND S. N. STEVENSON j. INORG. NUCL. CHEM. - IN PRESS.
Fig. 8a.
CiilER
STRUCTlRE: T EGRAGONAL, PsFCL TYPE . AO = 3.90 A, Co = 8.]2 ,4
S. FRIED, D. CoHEN, S. SIEGEL AND B. TAN I INORG. NucL. (HEM. LEnERs !I, 495 <lSGJ)
Fig. 8b.
CF(OH)3 + HI 800· I CFI3
STRUCTURE - HEXAGONAL,BII3 TYPE
AO = 7.55 A, Co = 20.8 A
CFOI
CFI3 + HI 'H20 ~ CFOI
STRUCTURE - TETRAGONAL, PBFCL TYPE
Ao = 3.97 A, Co = 9.14 A
S. FRIED, D. COHEN, S. SIEGEL AND B. TANI INORG. NUCL. CHEM. LETTERS !I, 495 (1968)
Fig. 9.
rJ
-55-
,,' ~J 6 "i v
CF203
(A, HIGH TEf·1PERATURE FORM)
( ) 0 1800·
CF RESIN + 2 ~ CF203
STRUCTURE - HEXAGONAL; AO = 3.72 T 0.01 A, Co = 5.96 ~ 0,01 A A~1750·'B
R. D. BAYBARZ j. INORG. NUCL. CHEM. 35, 4149 (1973)
Fig. 10.
CF203
(B, MEDIUM TEMPERATURE FORM)
1200· 0 CF (RESIN) + O2 (AIR) -----+ CF2 3
STRUCTURE - MONOCLINIC SM203 TYPE
AO = 14.197 ~ 0.007 A, Bo = 3.606 ~ 0.003 A C = 8.846 ~ 0.005 A, B = 100.23 ~ 0.09· o
C~B
j. L. GREEN AND B. B. CUNNINGHAM INORG. NUCL. CHEM. LETTERS }, 343 (1967)
R. D. BAYBARZ J. INORG. NUCL. CHEM. 35, LI149 (1973)
Fig. 11.
CF203
(C, LOW TEMPERATURE FORM)
CFoF (OR CFOCL) + H20 (G) 500-600· , CF203
CFOCL + O2 (G) ~ CF203
STRUCTURE: B.C,C,; AO = 10.838 ~ 0,020
,I. C, COPELAND AND E, B. CUNNINGHAM j. !NORG. NlJC~, CHEM, ii, 7:'3 Cl%g)
R. D, BAYBARZ, R. G. HAIRE AND J. A, FAHEY J. INORG. tlUCL. CHEM. 34, 557 (1972)
R. D, BAYBARZ J. INORG, NUCL. CHEM. 32, 4149 (1973)
Fig. 12.
A lone metal-organic compound has been prepared (Fig. 13) and characterized. It is orthorhombic with the Pbcm structure.
-56-
Other trivalent californium compounds are the oxysulfate and the oxysulfide (Fig. 14). The oxysulfate arises from the low temperature ignition of _Cf(III) on a resin bead, the sulfur coming from the resin. The oxysulfate reduces to the oxysulfide upon HZ or vacuum treatment.
Preliminary data on CfHZ and CfN have been obtained by Haire.
The first real solid state evidence for divalent californium came with the preparation of the dibromide containing Cf(II). Prof. Cunningham and co-workers had tried very hard to prepare CfClZ by an analogous reaction but could not prepare it (Fig. 15). However, with the bromide, the reduction with HZ does go and the existence of californium salts in three valence states is a fact. In the following paper, the preparation of the CfIZ will be discussed and I'll say no more of it now.
The only other available valence state of californium is zerovalent, the metal. A large effort to find the structure or structures of the metal has been going on for some years with a number of-differing results. The results are slUl1lllarized in Fig. 16. Two sets of work~!~ used the more usual methOd of reduction of CfF3 by lithium while the other two sets took advantage of the metal's very high vapor pressure to carry out the reduction of the sesquioxide with lanthanum metal.
At Berkeley, Cunningham and Parsons found an fcc structural form with ao = 5.41 A. At Los Alamos, initially working alone, I found the same on a 10 Jlg scale. At Oak Ridge, Baybarz and Haire found the same, but only when their product was reheated. They feel this is the monoxide. Using electron diffraction, they found two forms, one
an fcc structural form with ao = 5.743 expected for a low valent metal, and another hexagonal form which is the correct size for the higher valent form. I will discuss these results more in a few minutes. Haire and I at UlSL then started wi th a 100 Jlg scale volatilization and found two forms. A dhcp form found has a metallic radius approximately equal to the 5.74 A of Baybarz and Haire, the low valent form. Unfortunately, Prof. Zachariasen has told me that it is not metal as the intensities are wrong and I don't really doubt the man I consider the greatest authority on powder patterns in the world. However, he agrees that the dhcp form is indeed californium lnetal in the upper valent form. During this time Joe Peterson and his group had been preparing metal by the lithium reduction route. He tells me that he has found three forms-an fcc type which is the right size to be lower valent, another fcc type of the size to be a higher valent form, and then a dhcp type very nearly the same as the one Haire and I made. Of course, I believe that one! The question is if there are indeed two valence forms of californium metal. As is usual in small-scale preparations, the question of purity arises. Prof. Zachariasen has pointed out that the presence of S, N and 0 could be very misleading. The formation of an fcc cubic form could be attributed to the presence of CfS which has the proper size. The hexagonal form of Baybarz and Haire can be matched in size by a solid solution of the nitride and the oxynitride sulfide. Since resins containing S were used in the purification, the presence of small amounts is difficult to ignore. Peterson has, in a very convincing manner, managed to convert all three of his phases one to the other. I'm sure that time and scaling up will eventually yield the correct answers.
SEABORG: I should have said that this paper is co-authored by R.G. Haire. I might add that I just got a letter from Dick Haire today saying that he would have liked to have been here but the shortage of travel funds at Oak Ridge pre-vented him from doing so.
CF202S01)
CF202S
CC202S04 - ORTHORHOMBIC; Ao = 4,187 ± 0,002 A, BO = 4,072 ± 0,002 A, AND Co = 13,009 ± 0,006 A
CF202S - TRIGONAL; Ao = 3,844 ± 0,002 A, Co = 6,6S6 ± 0,004 A
R, D, BAYBARZ, T, A, FAHEY AND R, G, HAIRE J, INORG, NUCL, CHE/1, 3£, 2023 U97LJ)
Fig. 14.
IDtca.Ev
• FCC .. Ao" 5.41 A
REW:TI~ OF CFF3 . -.
n 'to) L~ {l ,{1 U ',.J J 8 ") <.~
I
-57-
STRUCTURE - TETRAGONAL, SRI3R2 TYPE
AO ~ 11,500 ± 0,007 A
Co ~ 7.lrn ± 0,0J6 A
j, R, PETERSON AND R, D, BAYBARZ
INORG, NUCL, CHEM, linERS 8.. 423 (1972)
j, p, YOUNG, K, L, VANDERSLUIS, G, K, \jERNER,
j, R, PETERSON AND M, NOE
SUB/-lInED TO j, INORG, NUCL, CHEM,
Fig. 15.
(J: f"ETAL
~ fuIros-RUXiE (w( RIDGE
• • FCC - Ao .. 5.41 A FCC - Au" 5.743 A
• • IKP - Aa" 3.DJ A HEX - Au" 3. ~ A
• • Co" 6.889 A Co .. 11.034 A
LA REDt.crI~ OF CFtJ3 LA REDt.crI~ OF CFi!3
Fig. 16.
OAK RIDGE - LWIV. OF T~;
• FCC - Ao .. 5.~ A
• FCC - Ao ... 4.9f(l A
" IKP - Aa ... 3.35 A • Co -11.m A
Jeu:TIOO OF ()f3
-S8-
Introduction of Kenneth Hulet Dr. Seaborg
The next speaker is E. Kenneth Hulet. Ken Hulet is a Group Leader on Heavy Elements in the Nuclear and Radiochemistry Section at the Lawrence Livermore Laboratory. He obtained his B.S. in chemistry at Stanford University in 1949 and came over to Berkeley and did his graduate work here in the Nuclear Chemistry Division of the Radiation Laboratory. Actually, he nominally received his Ph.D. under me, but again I think it's one of those cases where I wasn't able to hurt him any and he worked pretty much independ-
ently and with Stan Thompson in his Ph.D. program. He then joined the staff at the Livermore Laboratory, has been working in a wide range of areas since, much of his work in actinide chemistry. Most recently he played a key role in the synthesis and identification of the latest transuranium element, the element with atomic number 106. His report today is on the preparation of californium di-iodide, which is a paper that is being presented in collaboration with his colleagues at Livermore, J. F. Wild, R. W. Lougheed and W. N. Hayes. Ken ....
Preparation of Californium Oi-iodide J.F. Wild, E.K. Hulet,
R.W. Lougheed, and W.N. Hayes
Beginning with the discovery of divalent Md in 1967,1 many chemists have displayed an exceptional interest in the lower oxidation states of the actinides. Divalency in Md apparently is not a property singular to this actinide element but fits a broader pattern of increasing stability of the Sf-electron structure upon approaching the end of tile actinide series. Evidence directly supporting this conclusion is the observation of stable Z+ in aqueous solution,Z the preparation of CfBrZ,3 and the cocrystallization of Cf,4,S Es,4,S and Fm6 dichlorides with SmC:!:z from HClethanolic solutions following reduction from the trivalent state by Mg. Indirect observations include polarographic reductions of Cf and Fm7,8 in aqueous and acetonitrile solution,9 amalgamationreduction studies of Cf, Es, Fm, and Md,lO and the distribution of Cf and Es between molten salts and liquid Bi.ll Californium, being similar to Sm3+ with a reduction potential of ~-l.S V, is more difficult to reduce from the trivalent state than is Es. This trend of easier reductions with increasing atomic number continues until the Sf shell is filled at Lr, where only the trivalent state of this element is observed.
To determine the stability and properties of divalent actinide compounds, we have performed many experiments to prepare anhydrous halides of divalent Cf and Es. Our studies have been concentrated on the reduction of trivalent Cf by the treatment of the anhydrous triiodide with HZ at high temperatures. The iodides were selected from among the halides because the freeenergy change between the di- and trivalent compounds was expected to be the least for the iodides. Our first successful preparation of CfIZ was reported earlier,lZ but in addition to the expected hexagonal crystal structure, we also obtained an unknown structure which was interpreted as belonging to nonstoichiometric Cf iodides. Further research and the discovery of a new DyIZ crystal structure13 revealed that CfIZ was being prepared with two structures (dimorphism), and thus, our earlier assignment of the unknown crystal structure to intermediate
iodide compounds was incorrect. Today's report concerns the preparation and identification of the hexagonal and rhombohedral forms of CfIZ.
We have prepared CfIZ by a series of chemical reactions carried out within a 300-vm-diam quartz capillary. The final products were sealed within this capillary for x-ray diffraction analysis of their crystal structure. Beginning with ~Zo Vg of Z49Cf in ~ZS VI of HCl, we precipitated and filtered CfZ(CZ04)3 in the quartz capillary. After carefully washing and drying the precipitate, we converted the oxalate to CfZ03 by heating to 900°C in air. The sesquioxide was reacted at SOO°C with gaseous CC14 to produce lime-green CfC13 and then with Hl(g) to form the red-orange Cf13. The Cf13 was normally sublimed after its synthesis in order to purify it from CfOI and unreacted CfC13. The reduction of Cf13 to darkvi.olet Cf1Z takes place at ~S70° C in an atmosphere of ultra -pure hydrogen . At slightly higher temperatures, CfIZ melts and begins to react with the SiOZ walls of the capillary which produces increasing amounts of CfOI. The violet CfI Z is extremely reactive and it has proven very difficult to prepare samples that are free of CfOI because of the reaction with silica.
We have identified two crystal structures from x-ray diffraction patterns. The most prevalent, a rhombohedral structure, is unusual in that it
'has not been identified in the well known lanthanide diiodides .. and was only recently determined for DyIZ by Barnighausen. Our observed and calculated crystal-plane spacings and line intensities are shown in Table 1. The calculated d-spacings and intensities are based on the CdClZ prototype structure in which the angles and cell dimensions were slightly adjusted for the best fit to CfIZ.
Upon heating rhombohedral CfIZ to 600°C in a high-temperature x-ray camera, a small amount of C£OI is made and a phase change occurs. The new phase has been identified as hexagonal CfIZ (CdIZ type) which is isostructural \-lith TmIZ and Yb~Z. This phase remained stable upon cooling
" \)
o ~ <:j E:f ' , J '1_~ ;(:1 J \) , J U 0
-59-
Table 1. Crystal-plane spacings (d) measured for the rhombohedral form of CfI2 compared with the calculated d-spacings and intensities. The calculated values are based on the Cd~2 structure (Laue group - 3m) with A= B=C= 7. 38 A and 0:,= S=y= 36° . Fourteen additional lines observed at wider angles of 8 are not listed.
and was found to be unchanged weeks after the initial transformation. In addition, the hexagonal form was prepared by partial reductions of CfI3 followed by slow cooling of the products in the capillary. In Table 2 we show the crysta1-plane spacings and line intensities determined for such a mixture of hexagonal CfI2 and CfI3' However, a weak 3.14 A line, indicating the presence of rhombohedral CfI2 was also observed. Indeed, this line, the most predominant from the rhombohedral structure, has been found in all preparations of CfI2, in sublimed CfI3, and in s~les of CfI3 heated in vacuum to greater than 550 C. Also samples of red-orange CfI3, upon
Calculated A and Intensities
6.894 (53) 3.880 (42)
3.138 (100)
2.857 (18)
2.366 (10)
2.281 (37)
2.164 ( 46)
1.966 ( 5)
1.845 (17) 1. 782 ( 4) 1. 724 ( 5) 1.698 ( 3)
1.642 ( 3) 1.619 ( 5) 1. 569 ( 9)
1.485 ( 5)
1.434 (15) 1.404 ( 3)
1. 375 (12) 1.333 ( 2)
1.317 ( 4)
1.293 (10)
heating, became violet, the color of the diiodide. These observations imply a decomposition of CfI3 to CfI2 which means that the triiodide is only narrowly more stable than the diiodide. Of course, in our experiments 12 is being removed by pumping and an equilibrium does not exist between CfI 3 and CfI2.
Our conclusions from these experiments are that the divalent state of californium is stable for weeks under vacuum and can be attained by either hydrogen reduction or thermal decomposition of the trivalent iodide and that the diiodide is dimorphic, exhibiting both rhombohedral and hexagonal crystal structures.
-60-
Table 2. X-ray diffraction data obtained from a mixture of hexagonal CfI2 and CfI3. These data are compared with those calculated from a CdI2 hexagonal structure and with lines observed in pure CfI3 samples. Approxi-mately 10 measured d-spacings match the calculated CfI2 diffraction lines.
Measured Calculated CfI2 Observed CfI3 A and Intensities A and Intensities A and Intensities
6.921 (MS) 7.00
6.233 ( M)
5.529 ( M)
3.424 ( S) 3.405
3.318 (VS) 3.137 ( W) 2.558 ( S) 2.604
2.258 (MS) 2.250
2.183 ( M) 2.150 ( W) 2.142
2.081 ( W)
2.002
1.971 ( M) 1.888 ( W) 1.878
1.814 (VW) 1. 736 (VW)
1.703
1.430 (VW) 1.441
1.373 (VW) 1. 382
1.356 (VW)? 1.358
1. 302 ( W)? 1.300
References
1. E. K. Hulet, R. W. Lougheed,. J. D. Brady, R. E. Stone, and M. S. Coops, Science 158, 486 (1967).
2. J. Ma1y, T. Sikke1and, R. J. Silva, and A. Ghiorso, Science 160, 1114 (1968).
3. J. R. Peterson and R. D. Baybarz, Inorg. Nuc1. Chern. Lett. ~, 423 (1972).
4. N. B. Mikeev, V. I. Spitsyn, A. N. Kamenskaya, N. A. Rozenkevich, I. A. Rumer, and L. N. Auerman, Radiokhimiya 14, 486 (1972). Eng. trans. Soviet Radioche~ 14, 494 (1972).
5. N. B. Mikeev, A. N. Kamenskaya, I. A. Rumer, V. I. Spitsyn, R. A. Diatchkova and N. A. Rozenkevich, Radiochem. Radioana1. Lett. 9, 247 (1972). -
6. N. B. Mikeev, V. I. Spitsyn, A. N. Kamenskaya, B. A. Gvozdev, V. A. Druin, I. A. Rumer, R. A. Dyachkova, N. A. Rozenkevich and L. N.
(49) 6.937 «10) 6.210 ( <10)
5.529 ( <10)
(100)
3.314 (100)
(60) 2.553 (60)
(35)
2.178 (60)
(15)
2.076 (20)
(22)
1.974 (20)
(17) 1.816 (20)
1. 736 ( <10)
(16)
(13) 1.457 ( <10)
(13)
(14) 1.358 ( <10)
( 5) 1.303 ( <10)
Auerman, Inorg. Nuc1. Chern. Lett. ~, 929 (1972).
7. F. David, Compo Rend. Ser. C 270, 2112 (1970).
8. F. David and M. Hussonois, Radiochem. Radioana1. Lett. 11, 1 (1972).
9. H. A. Friedman, J. R. Stokely, and R. D. Baybarz, Inorg. Nuc1. Chern. Lett. ~, 433 (1972).
10. J. Ma1y, J. Inorg. Nuc1. Chern. 31,1007 (1969).
11. J. C. Mai1en and L. M. Ferris, J. Inorg. Nuc1. Chern. Z' 431 (1971).
12. E. K. Hulet, J. F. Wild, R. W. Lougheed, and W. N. Hayes, Transuranium Elements Symposium, Moscow, USSR, Sept. 4-8 (1972). Radiokhimiya, Q, 632 (1975).
13. H. Barnighausen, et a1., quoted from J. R. Peterson, Proceedings of 10th Rare Earth Research Conf., U.S. Nat. Tech. Info. Service, CONF-730402-P1, 6 (1973).
u u j ~ \·~-a (:~,~ , , J a :(1 ',_7 • l.,.;, ..
-61-
Introduction of William Carnall Dr. Seaborg
The next speaker will be William T. Carnall. He is a member of the Heavy Elements Group at the Argonne National Laboratory. He joined the Argonne National Laboratory in 1954. He received his bachelor's degree in chemistry at Colorado State University in 1950 and did his Ph.D. thesis work at the University of Wisconsin. I have managed to find some connection with each of the speakers today. Carnall did his Ph.D. work with John Willard; John Willard was one of the mainstays of our Chemistry Section at the Metallurgical Laboratory. He played a key role there; served as Associate Sectlon Chief--actually did most of the work; is one of the few people who was working in the nuclear and radiochemistry fields even before the war. Bill Carnal 1 completed his Ph.D. work at the University of Wisconsin with John Willard in 1953. At Argonne his interests have been in chemistry and spectroscopy of the actinide elements. He's giving his paper jointly with Sherman Fried, with whom I did have a connection at the Metallurgical Laboratory. Sherman started work on October 16, 1943. I
remember the day well--how could you forget it? No, my memory isn't all that clear but I do recall that either then or almost immediately, he began to work on plutonium metal production, and I can remember those exciting first days when they came up with density measurements on plutonium. They came out way too low. We were expecting that it should be about 18 or 19 and they came up with about 13. Bearing in mind the relationship of the critical mass of the device, as we called it in those days, to the density, it was calculated that we would therefore need two Hanfords instead of one in order to produce the required amount of plutonium. That was pretty bad news indeed! But they came out--and Herman Robinson, who is present here today, helped on this too--they came out with a better value in a few months so we could go back to one Hanford, which is all really that we had time to build. Carnall and Fried have collaborated in the re~ort today on "Spectroscopic Properties of Bk3 and Cf3+ ," and the paper will be given by Bill Carnall.
Spectroscopic Properties of Bk3+ and Cf3+ W. T. Carnal! (with S. Fried)
It was Burris Cunningham and co-workers l who, at an American Chemical Society meeting in 1958, first pointed out the special significance of Bk3+ and Cf3+ to actinide spectroscopy. The limits they could place on the intensities of absorption bands in the solution spectra of Bk3+ and Cf3+ were consistent with the return to a more lanthanide-like intensity pattern in the second half of the actinide series. This made it clear that it would be important in the future to study in detail the spectroscopy of these two elements. The prospect of the return to a more lanthanide-like character becoming clearly established in Bk3+and Cf3+ suggested that an understanding of their energy-level structures could provide the key to predicting the spectroscopic properties of all of the heavier trivalent actinides. The very short half-lives associated with the heaviest members of the series essentially preclude any extensive experimental spectroscopic investigation of them.
In 1962-63 the first spectroscopic observations in the solid state were reported. Using 1 ~g quantities of the elements, the groups at Berkeley and Livermore succeeded in observing a number of lines in both the absoIPtion and fluorescence spectra of Bk3+:LaC13 2 and Cr3+:LaC13.3 Three years later in 1966, Green and Cunningham4 were able to grow a small single crystal of 249CfC13, and extend the region of observation into the near infrared.
As the heavy element production program of the AEC began to yield milligram quantities of Bk and Cf, we at Argonne undertook the first extensive
low temperature spectroscopic studies of the pure halides, BkC13 5 and CfC1 3.6 Solid state spectroscopy continues to be a very productive and exciting area for investigation. The definitive single crystal work with Bk3+:LaC13 and Cf3+:LaC13 is only now in the active planning stage. The experiments will be conducted in a joint effort involving groups at LBL and ANL. Such cooperative efforts have frequently been undertaken. In the context of the present subject our initial joint experiments grew out of a set of unique circumstances that led, in 1965-66, to the first measurements of the solution absorption spectrum of Cf3+ using macroscopic quantities of the element.
First Solution Spectra with Macro Quantities of Bk and Cf
We at ANL were sending a spectrophotometer back to a factory in California for optical modifications in the fall of 1965. The group at LBL had separated 167 ~g of californium, mainly 252Cf, and was quite amenable to a joint spectroscopic experiment if some means of making the measurement could be found. With the indicated quantity of 252Cf, all operations were of course restricted to a cave. Consequently, the "Hot Lab" group7 at ANL developed a set of remote controls for our spectrophotometer, we designed some micro spectrophotometer cells that could be loaded and handled with manipulators, and we arranged to ship our spectrophotometer to the factory via Berkeley. It was duly placed inside a cave and spectra were recorded in September 1965.
By the end of the year, more 252Cf had been separated and purified, so the now optically modified instrument was shipped back to ANL via Berkeley. Figure 1 is an example of spectra we recorded using 592 ~g of Cf3+ in a 2 cm x 2 mm diameter capillary cell of approximately 250 ~l volume. The coincidence in date with this symposium is apparent. The spectrum was recorded January 20, 1966 (pm).
The type of capillary cell used is shown in Fig. 2. There are of course a number of problems associated with such an experiment not the least of which is the decomposition of the solvent by the intense radiation. In deference to the location, we noted in our published results8 that the samples had the bubbling characteristics of fine California champagne. The increasing background shown at >9500 A in Fig. 1 was caused by bubbles accumulating and finally blocking
-62-
light from passing through the cell. The remedy was to carefully remove the cell from the spectrophotometer, shake it to dislodge the bubbles, replaae itin the spectrophotometer and quickly run another segment of the spectrum. With a good portion of the world's supply of californium involved at the time, you can be certain the operation began with extreme caution. I wish we had recorded the progress of the experiments on film because it would certainly have been
hilarious to compare the initial caution, with the increasing sense of urgency as the experiments progressed. With confidence gained, the cell was removed from the spectrophotometer, then within one minute vigorously shaken, rapidly replaced, and a new scan begun. One can judge the effort involved by the fact that individual scans never exceeded two minutes before the cell was again blocked. The operation would have been impossible without the patience and full cooperation of all involved, particularly the cave crew and the radiation monitoring group. Figure 3 shows the excellent agreement between the results reported in our 1966 publication and data taken more recently at ANL using milligram quantities of 249Cf.
The cooperative effort with californium was so successful that as multimicrogram quantities of berkelium became available we resolved to again perform a joint experiment. This time it took place at Livermore in the summer of 1966 using the same microcell techniques. Of course since 249Bk was involved, no elaborate shielding was necessary. With 45 ~g of 249Bk, enhancing the weaker bands using elaborate time-averaging techniques followed by computer processing, we obtained the first solution spectrum of Bk3+, 9 Fig. 4. These results were also in good agreement with spectra recorded later at ANL using several milligrams of berkelium.
Fig. 2.
12 z
10 0 i=
8 u z i= 6 x w a: <{
-' 0 :::;;
>-!:::
44 40
o u LJ "'i
Cf3+ (I M DC104)
(l966)
iI'.~
8 6 4
Cf 3+ro.l M HCI04-DCI04J
(/974)
Fig. 3.
4 0
We were able to oxidize Bk3+ to Bk4+ in that first experiment, but all of the bands were superimposed on a strong ultraviolet absorption. Later at ANL we repeated this work with larger quantities of berkelium and showed that even in the visible region the Bk4+ band occurred at the same energy as a prominent band in Bk3+, Fig. 5. In dilute H2S04 we could readily oxidize berkelium to Bk4+, then reduce it to Bk3+ with S02 without transferring the sample. This clearly delineated the regions of absorption as contrasted to the rather significant background. 10
, 0.9 1
0.8 ~ en ' !:::: 0.7 I
5 \...Bk3+ \.-Bk4+ >- 0.6 I ~ 0.5 : - 1
b: 0.4 \
g 0.3 \ co I \,. « 0.2 \ .
\ \. 0.1 "'" /\ \",. ,~ .. -;:"'\
ABSORPTION SPECTRA of Bk3+ and Bk 4 + in 0.4 M D2 S04
J
Fig. 5.
:i 1 ;.,'
-63-
Theoretical Treatment of the Energy Level Structures
For some of us, interest in actinide spectroscopy has centered around the development of a theoretical model which can be used as a basis for computing the entire energy level scheme for each actinide ion. Relationships between ionic structure and absorption spectra are also worthy of exploration. There is a wealth of information contained in the solution absorption spectra itself, but to exploit this, one needs a firm base upon which to build, and this requires crystalline samples where the spectroscopic states can be characterized using such experimental techniques as polarization and Zeeman effect.
'.-~ ~
>..... ;;: i=
" V
30
g:, 20 o (f) OJ <{
a: :5 10 o :::;;
,. )
o 32
0
26
Fig. 4.
Bk3+ (1M DCI) (l966)
8
Bk3+
LRL R.G. GUTMACHER EX HULET RONALD LOUGHEED
LBL J.G. CONWAY
ANL W.T. CARNALL D. COHEN
LASL lK. KEENAN
ORNL R.D. BAYBARZ
ro.1 M HCI04 - DC104) (1974)
Theoretical interpretation is a developing process. Our first work was of course with the light actinides. Since the spectra we observe in the 3+ actinides are for the most nart characteristic of transitions within the SfN-configuration, we can expect that the parameters of any model which describes these interactions should vary rather uniformly across the series. Paul Fields, Brian Wybourne and I made our first predictions of the energy level structure of Bk3+ and Cf3+ in 1964, 11 so it has been of particular interest to us to determine how and why these predictions have had to be modified as experimental data became available.
Before briefly outlining the theory, it is useful to emphasize what it is that we observe and what we are attempting to calculate. The region of the absorption spectrum of Bk3+ included in Fig. 6 shows the resolution of several LSJstates into crystal-field components at the temperature of liquid helium. Experimentally, the spectrum was obtained in transmission through a thin film of BkC13' We assume that the crystalfield splitting of any J-level can be treated as a perturbation of the free-ion structure. Thus the theoretical model is primarily concerned with accurately reproducing the free-ion structure which in this case is experimentally defined by the centers of gravity of the components identified with each J-state. Since the transitions are all within the SfN-configuration, which is well shielded from the environment, we further argue that. to a good approximation the energies of the free-ion states in BkC1 3 or CfC13 are not much different from those that would be observed in a low pressure gas of the ions. In fact there should be a strong correlation between the structure of the Cf3+(Sf9) configuration and that of the configuration Sf96s 2 in BkI.
'The principal interactions included in the free-ion Hamiltonian are outlined in Fig. 7. We can summarize by pointing out that the energy
en
0,6 0,14 I
~ 0.4 5G2 ::J
w (j z "" m '" o ~ 0.2
0_ <D
0'" " ",00 r--",,,, '" NNN
II I
"" t--____ "-_
0,0 0.41 0.42 0<\3
00 o '" N N
I
0.12 I
0.44
BkCI.
~ I
0.45JL
0,08 I
He
LN
RT
24000 23000
WAVELENGTH (em-I)
22000
Fig. 6.
level scheme calculated based solely on the interactions that are Rrimarily responsible for the structure of the fN-configuration, HE and HSO' is in poor agreement with the experimental results. This is true regardless of whether one uses Hartree-Fock methods to calculate Fk and Sf or a procedure that treats these terms as parameters to be defined by a least squares fit to the experimental data. The perturbing effects of configuration interaction must be explicitly included in the model in order to obtain a good correlation with experiment. This is done by the inclusion of effective operators that represent important classes of configuration interaction such as those indicated in Fig. 7. 12
A model that included the effects of the twobody interactions, HCI(2) , proved useful in correlating the experimental results obtained for the light actinides. Extrapolated to Cf3+, it predicted that the observed free-ion structure would be consistent with that indicated in Fig. 8 for values of F2 in the range 260-280 cm- l . 6 Notice that a number of states rather isolated in energy were to be expected. Results such as those shown in Fig. 9 for the lowest energy J = 11/2 and 9/2 states in CfC13 appeared to correlate quite well with the extrapolated energy scheme. A small adjustment in the parameters of the model based on the actual observed free-ion energies in BkC13 and CfC13 confirmed a developing regular behavior in the heavy actinides which, although the data were incomplete, appeared to account for the principal features observed in the absorption spectrum of the next heavier actinide, Es 3+ . 13
At this point there was still considerable room for improvement in the correlation between calculated and observed free-ion levels. One means of accomplishing this was to expand the theoretical model. H. M. Crosswhite, Hannah
-64-
The total energy of a system consisting of a point nucleus surrounded by N electrons can be represented by the Hamiltonian:
HO (I nvolves the kinetic energy of the electrons and their interaction with the nucleus)
6 HE (Electrostatic term) Ee ~ L f\ (k even)
k ~o
Hso (Spin-orbit interaction) ESO ~ ASO~ f
HC I (Configuration interaction)
• HCI(2) ~ aUL + 1) + flG(G2) + yG(R7)
• HCI(3) (Three-particle operators)
• HSOO (Spin-other orbit interaction)
• HSS (Spin-spin interaction)
• Hc i (Electrostatically correlated spin-orbit interaction)
HCF (Crystal-field interaction)
Fig. 7.
Crosswhite and I have recently been attempting to do this, and it has become increasingly apparent that with the inclusion of the three-body effective operators in Judd's formulation, together with several smaller magnetic and electrostatic interactions,12 we now have a model that is sufficiently detailed for present purposes. As we have been able to determine the parameters of the model, it has been found that they assume values characteristic for the whole actinide or lanthanide series.
Crystal Field Interactions
Until the experimental work on single crystals of the actinides is much more complete, we can use the theory to predict, but we can also note the correlations that are apparent from data that have been reported. Figure 10 shows the splitting of the ground state in isoelectronic lanthanides and actinides for the ions doped into single crystal LaC13. The identical ordering of the levels in terms of the crystal-field quantum numbers (~) is obvious as far as experiment has gone. All the heavier actinide trichlorides through EsC13 exhibit the same UC13-type structure that is characteristic of LaC13. It is now apparent that the correlation in ground state level ordering carries over into the heavier members of both series. In our investigation of the low temperature spectrum of BkC13, it became obvious that the absence of transitions to excited J = 0 and J = 1 states whose approximate energies could be established from the calculation constituted good evidence for a ~ = ° ground level consistent with the case of Tb3+:LaC13. Similarly in CfC13 we could infer the existence of a ~ = 3/2 ground state consistent with that of Dy3+:LaC13. All of the components of several excited J-states appeared to have been observed at 4°K. This would not be expected if values of ~ = 1/2 or 5/2 were associated with an isolated ground state in CfC13.
;;-Q
.. E
$
>-t!) Q: w Z w
t w u z
" 00 0: g 00
"
25
20
15
10
5
o 1.) ; ~ , , ,
,., .. j' .
ENERGY LEVELS of Cf 3+ os A FUNCTION of F2
11-::'~~ 5-2
;~~ 5-2,1-1
15-2 7-1 3:1~ 7-2,5-1 92 - 7-1 ~- 9-2
11-2 ----~ __ ___'''''__=:::__----II 2
~3~' 9-1 =:13-1 13-1
11-1 _~==~ 11-1
9-1
320 300 280 260 240 F2 (em-I)
Fig. 8.
____ ------~~--~He IN
1.45 1.5 1.55 1.6
6800 6600 6400 6200 6000 WAVFlENGTH (eM-I)
Fig. 9.
II u
-65-
'." J 9
Working with U3+:LaC13 we recently carried out the first complete crystal-field calculation for an actinide ion, simultaneously diagonalizing the matrices of the expanded free-ion model with the crystal-field. 14 The results confirm that the crystal-field in compounds of the 3+ actinides can be treated as a perturbation, over a wide range of energies as long as the centers of gravity of the levels are accurately reproduced. With the cooperation of N. Edelstein at LBL, this type of calculation is being expanded to heavier actinides. In preliminary calculations, we find excellent correlation with experiment for Np3+:LaC13 and Pu3+:LaC13. Within the last few weeks we have used the crystal-field parameters obtained in a preliminary fit of data for Pu3+:LaC13 together with an expanded free-ion parameterization for CfC13 to perform a preliminary crystal-field calculation for CfC13.l4 Some of the features of the Cf3+ spectrum that were difficult to understand appear to have their origin in low-lying double levels in the ground state. At this point we can predict that Cf3+:LaC13 should have extremely interesting magnetic properties with two crystal field components, ~ = 3/2 and 5/2 lying very near the zero of energy. We look forward with considerable anticipation to the projected cooperative studies of Bk3+:LaC13 and Cf3+:LaC1 3.
Crystal Spectra-structure Correlations
As our experimental studies of Bk and Cf halides have expanded, new insights into spectracrystal structure relationships have become apparent. For example, the spectra of CfC13, CfBr3' and CfI 3 at '\..4° K are shown in Fig. 11. Withln the indIcated energy range we expect transitions to excited J = 11/2 and 9/2 states. The appearance of bands in CfBr3 near 7000 cm- l is significant. It suggests that in all probability there are also higher energy bands in CfC1 3 than we have observed. The relative intensIty of the '\..6500 em-I band in CfBr3, and both the energy and intensity of the only group observed for CfI 3 in this range provide the basis for additional interpretation of the spectra.
Some of the crystal structure types characteristic of certain actinide and lanthanide halides are summarized in Fig. 12. That we would see different splittings of the same J-levels (Fig. 11) is expected since three different structure types are involved. However the intensity relationships are of particular importance.
Intensity Relationships
The intensity associated with certain transitions in the 3+ actinides and lanthanides is strongly dependent upon the host. The term hypersensitivity has been used in connection with this phenomenon. IS What is meant may be illustrated by comparing the room temperature spectra of the same ion in two different hosts, one where the enhanced intensity is observed and the other where the "usual" intensity pattern prevails. Throughout the spectrum, all the band intensities will be comparab)e on a molar absorptivity basis except for one or two transitions where in the host inducing hypersensitivity the corresponding band may show a 5-10 fold increased intensity.
3 =249 5 244
3 _123 1-115
5-0
3 _451 5 -439
3 -244 1-207
5-0
til (4115/2)
Er3+ 2/L E
1-229
1-181 3_141 5-113 I - 97 3-64 3-38
Fm3+ 2/L E
5-0 5-0
* E is energy in em-I
~ ;z => UJ U ;z <t OJ n: Sl
-66-
GROUND STATE STRUCTURE for Triva lent Lanthanides and Actinides
TRIBROMIDES 145 ORTHORHOMBIC 0 ,~ 135 PuBr3 TYPE I ~ ~
125 . I / ~/ * . . '. / //
115
175
165
155
145
RHOMBOHEDRAL FeCI3 TYPE't
TRIIODIDES
~.
I . I . . .
I .
/! HEXAGONAL I I 0
~~_... BiI3 TYPE
Fig. 12.
The transltlons that may exhibit hypersensitivity have been identified in calculations based on the Judd-Ofe1t intensity theory. 16,17
For present purposes, suffice to say that the transition to the first J = 11/2 state in Cf3+ is predicted to exhibit hypersensitivity in an appropriate host whereas that· to the first J = 9/2 state will not. Such pronounced intensity as is observed in CfBr3 near 6550 cm- 1 suggests that the crystal structure involved constitutes a hypersensitive host. The only band observed in this range in Cf13 is also consistent with a hypersensitive host. There is therefore an indication that the J = 11/2 lies generally lower than that of J = 9/2.
We first noticed that the Bi13-structure can induce hypersensitive transitions when we were investigating the spectra of the Am3+ halides. 18 At that time it was still thought that the orthorhombic PuBr3-type structure extended through Am13' Comparison of intensity patterns in Pu13 and Am13 suggested this was not the case. As we were completing our spectral studies, Asprey, Keenan, and Kruse19 published the results of an investigation of the x-ray powder patterns of the Am and em halides. They pointed out that indeed there is a structural change at Am13 with the stabilization
U
-67-
i -.. " }""1 ') V -\,:f
" (.-;~
of the 6-coordinate hexagonal stl~cture, in contrast to earlier reports. The spectroscopic results with CfI3 are consistent with the same structure. The spectroscopic results on BkBr3 show no evidence of hypersensitive transitions, nor do any of the other lighter actinide tribromides. A change is obvious in CfBr3' Burns and Peterson20 have ascribed the monoclinic AlC13 structure to CfBr3 noting that dimorphism may be involved. We have now shown experimentally that hypersensitive transitions are also observed in the heavy lanthanide trichlorides. 2l
Calculation of Transition Probabilities
The Judd-Ofelt theory has already been mentioned in connection with the prediction of hypersensitive transitions. It was derived as a basis for quantitative calculation of the intensities of bands observed in f-electron spectra. The electric dipole oscillator strength of an absorption band can be expressed as shown in Fig. 13. Judd showed that the parameters of the theory could be evaluated from the solution spectra of lanthanide ions. We at ANL confirmed the validity of the theory, performing the required calculations and eXPZrimental work for the whole lanthanide series. 2 Early attempts to extend the theory to the actinides were not very successful because we had a poor understanding of the energy level schemes. With considerable progress made in energy level correlations, we have returned to the intensity studies. The results for Cf3+ (aquo) shown in Fig. 14 confirm the validity of the method. However such results also indicate an important area for development in actinide spectroscopy.
BAND INTENSITY CALCULATIONS
- Experi mental
P ~ 4.3 x 10⁻⁹ ~ <i(o)do
where < ito) is the molar absorptivity at a
given energy o(cm -1)
- Theoretical
P ~ PM. D. + P L D.
-11 2 PM. D. " 4.0 x 10 o(I)IJii L + 2Slil)l'J') Ilf2J + 1
where the non-zero matrix elements will be
those diagonal in Sand L, and 11 is the
refractive index of the medium.
Judd-Ofelt Theory
P ~}: T \ a (f N 1)1 J II U (X ) II f N 1)1 , J ') 2 LD. X even A
We are in the process of extending such calculations to solid compounds of the actinides.
PxlO6
Calc'd
1.5
19.8
68.2
3.7
5.4
The parameters, TA, are evaluated from absorption measurements, but they are constants of the system. Thus they can be used to predict the most intense transitions in fluorescence. Indeed a large field of laser technology is being developed around the Judd-Ofelt theory as an important part of a general method for predicting and evaluating the efficiency of laser transitions in different hosts. Important contributions to this area have been made in lanthanide systems by groups at LLL, particularly W. F. Krupke, M. Weber and their co-workers. The work with actinides is just beginning.
Other Valence States
In closing, it is appropriate to point out that we are only beginning to study and interpret the spectra of valence states of actinide ions other than the 3+. The spectrum of Bk4+ (aquo)
100
'2 80
T J 60
w u z w a:: w lL lL o >(!) a::
Energy differences between the lowest-lying states in the 5f" and 5f "-I 6d configurations in the +2 through the +4 spectra of AnH the actinides where N' Z -88 for An", N = Z -89 for An 3+, and NeZ -90 for An4+
~ O~---------=~----------------------------~ w
-20
Fig. 15.
CIBr. - CIBr.
A CIBr. + CIBr. (He)
B CIBr. + CIBr. (LN)
C CIBr, (pure) (He)
A
B C
o .32 .36 .40 .44 .48 .52 .56 .60 .64 .68
30000 25000 22500 20000 17500 15000 em-I
WAVELENGTH
Fig. 16.
has already beZn noted. From Fig. 15, taken from Brewer's work, 3 it can be predicted that intense broad bands characteristic of f 7 d transitions should arise in the spectrum of CfZ+ near ZO,OOO cm- l . Our experimental study of a sample of CfBr3 after treatment with HZ at ~600°C, Fig. 16, reveals the presen~e of strong bands at the predicted energy.Z This suggests that CfZ+ will be a particularly good system in which to study the weaker f 7 f transitions, since a wide spectral range is available.
In spectroscopic terms, this paper has dealt with the 3rd, 4th, and 5th spectra of some of the heavy actinides. The prospects for future interesting and rewarding investigations are substantial. One of the results of our detailed study of trivalent ion energy level schemes should be new insights into the interpretation of the much more complex atomic spectra, a subject which is to be discussed by my colleague John Conway in the next paper.
21. W.T. Carnall, C. Aderhold, F. Wagner, Jr., (unpublished data).
22. W.T. Carnall. P.R. Fields. K. Rajnak, J. Chern. Phys. 49, 4412 (1968).
23. L. Brewer, J. Opt. Soc. Am. 61, 1666 (1971).
24. W.T. Carnall, S. Fried, F. Wagner, Jr., ANL-7996 (1973).
Bk I
40
30
20
10
o Odd Even
Fig. 4. Plot of the odd and even parity configurations of BkI. The lowest energy is the lowest level of a given configuration.
berkelium-I levels, and in the berkelium-II spectrum you are merely taking off one of the s-electrons and you have remaining a free s-electron. What this does is split the level into two. As you see, many levels are now split into two. Levels haven't been found for the upper two, but from the way the pattern is going, it's going to be very easy when we have a sufficient number of lines, particularly the weak lines, to find the rest of the multiplet. the two multiplets should follow a regular pattern into the low J region.
-72-
Figure 7 shows a different way of preparing the same information. The level and then the splitting are shown here, the levels in berkelium-Ion the left and berkelium ion on the right. The two levels blend and mix rather poorly, but we do know the J's and we have some g value information. The upper two, which we haven't been able to find in the spectra in the ion, will certainly yield to this treatment.
These two elements fit into the actinide series very well. They are shown to be good, regular elements. I've ulotted in Fig. 8 the rns2 configuration as zero. I mentioned earlier the fn- l ds2 configuration; it goes up and down in a sawtooth manner. When it falls below zero the
Cf I 40
f 10 7585 30
I E 0
'" 0
)(
20 flOsp
f9 ds2
10
o Odd Even
Fig. 5. A plot similar to Fig. 4 for CfI.
ground state is rn- lds2. In the early part of the series you see that is the ground state. Also, in curium the f7 ds2 is stabilized by 1,214 wavA numbers and then it takes off; from then on you have a very good rare earth type. In fact, in the case of the rare earths, all of these are even much lower; in a sense you can say with these particular configurations this latter half of the actinides are better rare earths than the rare earths are.
QUESTION: Are lanthanides the same way, John?
Lanthanides do the same thing, only the f 7ds 2 in gadolinium is shifted down. The f8 s 2 is at 13,000 above the f 7ds 2. And in the case of terbium, compared to berkelium, the f 8dss instead 1,000 or less in terbium. So yes, it does the same thing, only it's displaced downward.
The fnsp configuration goes along regularly and the two points of berkelium and californitnn fit in very well. We also rave a value for einsteinium. And the extrapolation to the next element should be very good. I keep needling our friends working on elements like thorium and uranium because they lack this kind of information even though these elements have been known for a very long time.
o fJ" ~,
15 r -
SKI 5f9 752
SKn 5f9 75
6H -+-
4H 'E 10 - -u -+-
r0 0
X 6H
~~~ » 0' Q:; 51--c -
W
0 ~ .1 .1 I I I 1 1 1 1 1 1 I I
2 3
J
Pig. 6.
I 4 I 5 I 6 I 7 I 8
1.. 2. II 13 15 2 2 "2 "2 "2
A plot of the BkI and BkII levels. The levels with the dots are BkI, with zero for the ground state of BkI. The BkII levels as split above and below the BkI levels.
SKn
SKI
-73-
Pigure 9 shows a similar plot for the ffi7s8s configuration. Here we have considerable information on the heavier elements, but between plutonium and radium there are no data. You can see you have part of a Rydberg series, you have the fnsZ and the ffi7s8s; you're lacking one more point, the fn7s9s, but you can make an assumption, and this is what Jack Sugar did. 4 He was able to make an assumption as to the quantum defect, and from this he's established an ionization potential, and he's quoting something like ± O. OZ e. v. of error. The berkelium value he gives is 6.Z3 e.v., and the californium is 6.30 e.v. for ionization potential. The other information--we are able to get moments and I have given you the value for the spin--we confirmed for berkelium by just counting the eight components to give a nuclear spin value of 7/Z. We have analyzed lines and get a value for the ~, nuclear moment, of 5.1 nm and a quadrupole moment of 4.7 barns. All we have been able to confirm so far for californium is the 9/Z value for the spin.
,-E u
0 0
S "'0 >-~ w
..5
<is
9/2
10 11/2
8 7H 5H
6 6F 7 F 5F
6 ~ 9/2
11/2 5
6
4
2
o
7
< Pig. 7. A different way of plotting the
same data as in Pig. 6 for BkI and BkII. The levels are grouped by 6H and the BkII levels split to form 7H and 5H. And the 6p levels of BkI split to form the 7p 5p of BkII.
12
10
,-5
0 0
S 6 "'0
>-.
'" ~ c
w
C! .OL a)
o
In the last few weeks I have been doing some calculations and I have spin-orbit values for the ffi configuration. The values run around Z ,900 em-I for berkelium and 3,100 cm- l for californium. This is rather large and this means the splitting is departing from Russell-Saunders or L.S. coupling.
Well, I'm afraid there remains more than Z5 years of work ahead of us because we do have thousands of lines and a whole set of plates to measure, but we have a feeling that a significant amount of progress has been made in the last 10-lZ' years in the analysis of spectra, and when the work on berkelium and californium achieves the status of curium or plutonium, where more than half of the lines are analyzed, you'll be able to know several more configurations. As far as chemists and metallurgists and solid state physicists are concerned, the basic information as to the ground state and some of the excited states has been analyzed. So in a sense you could almost stop here and say that these particular
20000 In sp
n-I ds
2 I
10000
E u
'" 0 Ins 2 0
,., ~ Q)
c w
-10000
Ac Th Po U Np Pu Am Cm B k Cf Es Fm Md No
Fig. 8. A plot of three configurations in the actinide series. The F1s2 is set to zero. The lowest known level of each configuration is plotted.
needs, at least in these three disciplines, have been met. But other needs are arising so we have every intention of continuing on a little further.
I will make only one more comment. There was something in the newspaper--I think it was the Oakland Tribune--the other day about this meeting. And it said something with relation to the supernovae since in the first paper on the spectra of californium I made a remark on this subj"r:t. I think I'll bring it up again. "Years ago it was thought that the supernovae were powered by californium-254, so when we ran the spectrum of californium-252 we took the lines we had and tried to Doppler-shift them every possible way to make them agree with the one piece of work that had been published on the supernovae. There was no way in which we could correlate the optical spectra at that time with those of the supernovae. Now no one's surprised about this, but the history was that the astronomers and the astrophysics people went back to find another source of energy for their supernovae. It's possible that we could do this exercise again some day with the more refined lines but I think we need to get a little better spectra of supernovae before we're able to confirm our californium information.
-74-
I E u
f{)
0
)(
>. 0> '-Q)
c w
35
30
25
Ac
Lowest level of f n 7s 8s =
( f n 7s 8s _ f n 7s 2 )
Po Np Am Bk Es Md 20~~~~~~~~~~~~--~~~
Ro Th u Pu Cm Cf Fm No
Fig. 9. The difference between the lowest level of fils 2 and tns8s is plotted for the actinides.
QUESTION: What is the best fuel for the supernova?
CONWAY: It is iron-59 which has a half life of 45 days.
SEABORG: Couldn't californium power it, californium-254 with its 60-day half life, you know that original 60-day decay, without being the main source of the emission lines? You might have many other elements in there and just have them all excited by the spontaneous fission of the californium, and californium wouldn't have to give the main emission lines. I don't believe necessarily that this is the source of power for the supernovae, but I just wonder if your test is valid.
CONWAY: Well, I don't think the test is altogether that good, either. The problem started out that the half life was measured of the supernovae and of the californium and they agreed. So everybody went back to the laboratory and started to check and they did a second experiment, which was a bad thing to do because then the half life started to depart. Then someone started to postulate that iron-59 was giving them some energy.
o [)
REFERENCES
1. R.G. Gutmacher, E.K. Hulet and R. Lougheed, J. Opt. Soc. Am. ~, 1029 (1965).
2. J.G. Conway, E.K. Hulet and R.J. Morrow,
-75-
J. Opt. Soc. Am. ~, 222 (1962).
3. E. F. Worden, R. G. Gutmacher, R. Lougheed, J.G. Conway, J. Opt. Soc. Am. 60, 1555 (1970).
4. J. Sugar, J. Chem. Phy. 60, 4103 (1974).
Introduction of Norman Edelstein Dr. Seaborg
The last speaker today is Norman Edelstein, who is the Group Leader of Lanthanide and Acti-nide Chemistry in the Lawrence Berkeley Laboratory's Nuclear Chemistry Division. Actually, I should say that Norman helped me put this symposium together, so if it's been successful and enjoy-able in any way he should share the credit for it. I can't say that I was associated with Norman during my Metallurgical Laboratory days, but he was a resident of Chicago at that time. He was six years old when we began our work there and ten years old when we left, so who's to say that he wasn't wandering around the streets of the south end of Chicago in those days or that we
didn't run into him in the Loop, or something like that. He graduated from the University of Illinois at Urbana in 1957 and did his Ph.D. work here in the Department of Chemistry where he got his degree in 1962. Then he joined the staff of the Lawrence Berkeley Laboratory, or the Radiation Laboratory as it was then called, in 1964. He has worked with Burris Cunningham since that time and until Burris' untimely death, and has established himself in the field of magnetic measurements on the actinide elements as one of the leading authorities. He will describe today the "Magnetic Properties of Berkelium and Californium and Their Compounds." Norman ....
Magnetic Properties of Berkelium and Californium and Their Compounds
Norman Edelstein
The first magnetic measurements on Bk and Cf were reported by Burris Cunningham in an article entitled "Berkelium and Californium" published in the Journal of Chemical Education in 1959. The experiments were performed in collaboration with Stan Thompson, Llad Phillips and Ray Gatti.
The object of the experiments was to confirm the actinide hypothesis under which the tripositive ion of Bk3+ would have the configuration radon core plus 5f8 and Cf3+ would have the radon core plus 5f9. In order to check this hypothesis the free ion magnetic moments of Bk3+ and Cf3+ were measured and compared with the theoretical values.
The Bk3+ and Cf3+ were available at the time in amounts on the order of l.~g. To provide a convenient way for handling the ions the Bk and Cf were absorbed respectively on a single small bead of cation exchange resin, which was then examined in a magnetic field. The bead also acted as a diamagnetic diluent for the paramagnetic materials.
A modification of the Faraday method was chosen as the way to proceed. In this method the paramagnetic sample is subjected to the force of an inhomogeneous magnetic field,
F=mXgH~~
where F is the force (dynes) m is the mass of the sample grams Xg is the gram susceptibility H is the strength of the magnetic field
~ is the field gradient
A diagram which will help explain the principles of the method is shown on the first slide (Fig. 1). A thin flexible silica fiber is suspended from a support. The sample bucket and sample hang at the end of the fiber. If H(dH/dx) = 0 the only forces on the fiber are due to gravity and the fiber is stationary and hangs vertically. If lI(clH/dx) is greater than zero then there is a force exerted in the direction of the field gradient (horizontal in practice) and the sample moves a distance d.
The sum of the moments of the forces at the fiber suspension point must equal zero at equilibrium so
Fl Lcose = F2d + F3 d/2
d deflection in the magnetic field F2 (ffihook + msamp.con. + nlbead + msamp.) g F3 (mfiber) g g acceleration due to the force of gravity
The forces F2 and F3 can be calculated, d is measured so Fl can be evaluated. From Fl the susceptibility of the sample can be measured.
In practice the apparatus is calibrated with a substance of known susceptibility, the empty sample buckets and beads are measured for their diama~1etism, and corrections are made for these effects. For the amount of material available in the late 1950's Cunningham estimated a displacement as small as 3 x 10- 3 mm would have to be detected. He used a microscope of moderate magnifica tion fitted with a filar micrometer for this measurement. The apparatus is shown on the next slide (Fig. 2).
NOTE' e IS GREATLY EXAGGERATED
1 d/2 CD
..J
MICROMETER - CONTROLLED
TRANSLATION OF FIBER
SUSPENSION POlNT BY A DISTANCE d TO RESTORE
SAMPLE TO ITS NULL POSITION.
-76-
The data obtained for Cf3+ are shown on the next slide (Fig. 3). The amount of Cf3+ used was 56 nanograms. The temperature range covered was from room temperature to liquid nitrogen temperatures. Note that data are also given for Gd3+ which was used for calibration purposes.
The deflections were linear when plotted against the reciprocal temperature. This means that in the measured temperature range Cf3+ followed the Curie-Weiss law. The next slide (Table 1) gives the empirical form of the CurieWeiss law.
Here we see that X is eqlml to a constant C divided by T +~. C is the Curie constant, T the absolute temperature and ~ is a factor which takes into account the deviation of (l/X) from 0 at T = OOK. For well behaves substances ~ is usually close to OOK; for large ~ it is indicative of interactions between paramagnetic ions.
If we assume that we are measuring the ground term which is well separated from higher lying levels, and the crystal field splittings are small compared with the temperature of the measurements, then we may calculate ~eff' the magnetic moment of the level. Empirically ~eff = 2.828 /IC. We can compare this measured value with that found theoretically
~eff (calc) = g S .I J(J+1)
PRINCIPLE OF THE MAGNETIC SUSCEPTIBiLiTY APPARATUS Here g is free ion Lande g value of the ground state and J is the value of the total angular momentum of this state. The table gives values of the ground states for various oxidation states of Cf and Bk, the g column has been corrected for the effects of intermediate coupling. Note that for each element the effective magnetic moment is Fig. 1.
Magnet:
current- oto o.7oamps.
quartz Dewar flask --~il
liquid bath-----;t-j
graded seal joint (pyrex top -quartz bottom)
magnet pole face _] (shoped to provide inhomogenous field)
optically flat quart z windows
~ ~Heinlet
V- vertical adjustment
~( ~ quartz fi ber
:::::::. vacuum pump
Da.vex 50 -4 % resin
Enlarged field of view
12 microns diameter
Mylar cone with resin bead
Diameter of bead: 0.5 mm. Cone attached to quortz fiber with polystyrene glue.
View through microscope
Magnification -75 times. Occular equipped with filar micrometer.
right angle prism microscope
Fig. 2. Magnetic susceptibility apparatus.
600
c 0
" .... u ~ -<II 0
400
200
(J lJ
Relative deflection in scale units of Gd (m) and cf(m)
Fig. 3.
u -77-
'9 7
indicative of the oxidation state of the element; except that we cannot differentiate between Cf2+ and Cf3+. The data as reported by Cunningham are shown on the next two slides (Table 2 and Fig. 4). Here he has plotted ~eff experimental for Cf3+ and Bk3+ along with the values calculated for various assumptions. The conclusion reached was "the rna etic data clearl indicate that the electronIC con Iguratlons 0 B an very probably are 5f8 and 5f9 respectIvely."
It should be mentioned that these measurements were performed on 56 ng of Cf, "-'65% of which was 252Cf. The amount of Bk used was 230 ng of isotope 249Bk.
The next reported measurements of Bk3+ and Cf3+, again on ion exchange beads, were given by Dennis Fujita who worked on this problem while he was a graduate student of Burris Cunningham'S. He again used a simiJar apparatus to the one I
-described earlier~ He used quartz sample containers as shown on the next slide (Fig. 5). His silica fiber had a hook attached at the end to which the cylindrical sample buckets, also with hooks, were attached. A not insignificant part of the graduate student training was learning to make these buckets. For use with the actinide metals these buckets are loaded in an inert atmosphere and sealed with Apiezon W wax to prevent air oxidation. Dennis Fujita's experimental results for Bk3+ are shown on the next slide (Fig. 6). Here we have (l/XE! __ vs T and the data appear to be linear on this Lype of plot. So again we see Curie-Weiss behavior with the results summarized on the next slide (Table 3). Two samples were reported of 0.5 and 1 ng with effective moments of "-'9.4 BM which agrees very well with the calculated moment of 9.40 BM. The next
Table 1
C X = T + L1
~eff 2.8 Ie
~eff(calc) = g ~B /J(J+l)
Ion Ground State (L-S coupling) ]leff (Bohr magnetons)
Bk2+ 5f9 6 H15/ 2 1.28 10.22
Bk3+ 5f8 7F 6 1. 45 9.40
Bk4+ 5f7 8 S7/2 1.93 7.66
Cf2+ 5flO 51 8 1.20 10.18
Cf3+ 5f9 6 H15/ 2 1. 28 10.22
Cf4+ 5f8 7F 6 1.45 9.40
-78-
Table 2. Bk3+ and Cf3+ on Ion Exchange Beads
(Cunningham 1959)
on c !! ., c
'" c E
10
Sample Mass
249Bk3+ 0.23 llg
249,252Cf 3+
0.056 llg
E E o .,.
lleff(BM)
8.7±O.9
9.2±O.9
T
77 0 K - 298 0 K
77 0 K - 298 0 K
Oowex AG50 x 4 ion
.t= o m
., >
u
~ ., :I..
6
4
exchange beads (l60JL diom.) soturoted with Sk(ll) or Cf(m)
slide (Table 4) summarizes the results for 249Cf3+ on ion exchange beads. Three samples were run which exhibited Curie-Weiss behavior in the measured temperature range but the measured effective moments are about 10% lower than the calculated effective moments. The reason for this discrepancy is not known.
Dennis Fujita also made some measurements on 249Bk metal which was synthesized by J. R. Peterson at ORNL.
The heavier actinide metals are very interesting because they exhibit localized magnetic behavior. That is, the magnetic susceptibility to a large degree may be explained by assuming the metal contains actinide ions which have a localized Sf shell which causes the major part of the measured susceptibility. With this model we would expect the effective magnetic moment of Bk metal to be the same as a Bk3+ or perhaps a Bk4+ ion.
By contrast the early actinides (through Pu) exhibit temperature independent magnetism which may be explained by invoking the extended nature of the Sf orbitals for these elements, which results in strong interatomic interactions. At Z = 95 Am metal has been reported to show localized behavior. The actual situation is complicated because the actinide metals are polymorphic. It was hoped that magnetic susceptibility measurements on pure metallic phases would identify the oxidation state of a particular phase of the metal which could be correlated with the ionic radii obtained from X-ray crystallography.
Dennis Fujita's results for one particular sample of Bk metal are shown on the next slide (Fig. 7). This metal sample DKF III was predominantly dhcp. The mass was 5.63 ~g and it followed the Curie law in the temperature range trom 50° K-298° K. At 35° K there appears to be an antiferromagnetic transition. The next slide (Table 5) collects all the data on the magnetic properties of Bk metal. These samples were all measured by Fujita but the results on the three samples are quite different. There are varying amounts of Z49Cf impurity in each sample and they are all different phases. These factors are likely to be the main causes of the irreproducibilities.
This past summer Dennis Fujita returned to our laboratory and performed magnetic measurements of 249Cf metal. These experiments were done in collaboration with Dr. J. R. Peterson and his group at ORNL who provided the Cf metal samples. Some of the actual data are shown on the next slide (Fig. 8). Here we have the reciprocal deflections vs temperature for each magnetic field measurement. The (l/X) vs T curve extracted from this data is shown on the next slide (Fig. 9). We see that in the temperature range covered the sample follows the Curie-Weiss law with a small value for the constant~. The tabulated data for the two samples measured are shown in the next slide (Table 6). Both samples were the expanded fcc phase and agree within 5-6%. There is some question about the assay of LI-54 which comes only from a gamma analysis. Unfortunately for the Cf case we cannot tell the difference between the dipositive and the tripositive metal from susceptibility measurements.
There has been one further measurement on Bk3+. David Karraker has measured the magnetic susceptibility of 0.624 mg Bk3+ diluted in a host of ~200 mg CS2NaLuC16. The results are shown on the next slide (Fig. 10). Here we see the susceptibility of Bk3+ is independent of temperature from 10-400 K. Now the assumption we have been using previously has broken down, the crystal field levels of Bk3+ in this host are not smaller than kT; in fact we are at the other extreme, the crystal field splitting is large with respect to kT and only one crystal field level is populated. The next slide (Fig. 11) shmvs the energy levels for Bk3+ in octahedral symmetry. The ordering of the levels depends on two crystal field parameters B4 and B6; for reasonable values the ground state will be a singlet fl with a triplet f4 next highest. The fl can be coupled to the f4 state by the Zeeman interaction. In fact it is this mechanism which is the cause of the large TIP at low temperatures. The next slide (Table 7) gives the equation for XIIP for this case. By evaluating the matrix e ement between the fl state and the f4 state Karraker evaluated the energy splitting berween these two states and found it to be 85 cm-
Dr. Karraker and I have collaborated on the measurement of 249Cf3+ in the host CS2NaLuC16. We had a polycrystalline sample containing 0.7 mg of Cf in ~100 mg of host. The electron paramagnetic resonance signal is shown on the next slide (Fig. 12). We see a 10 line spectrum which confirms the nuclear spin as 9/2. The
-80-
Table 3. Bk3+ on ion exchange beads (9 0 K - 798 0 K)
Bk3+ (9 0 K - 298 0 K)
Table 4. C£3+
C£3+ (770 K - 2980 K)
x
>f::::; iii i= Q. W () (f) ::::J (f)
Sample Mass ]Jeff(B.M. ) "'l K)
DKF III 0.546 ]Jg 9.46 9.1
DKF IV 1.012 ]Jg 9.35 12.8
]Jeff (calc) Bk3+ = 9.40 BM
on ion exchange beads (77 0 K _ 298 0 K)
Sample Mass ]Jeff(B.M. J L'I(" K)
DKF I 0.342 ]Jg 9.15 9.9
DKF II 0.806 ]Jg 9.07 2.2
DKF III 1.190 ]Jg 9.23 4.7
]Jeff (calc) C£3+ 10.22
C£2+ 10.18
..
4 6
SAMPLE BERKELIUM METAL ill
Fig. 7.
o 0 f J
;, 0'"1 \J '''/
-81-
Table 5. Bk Metal Samples
Structure
II Predom. fcc
III Predom, dhcp
V-I Poor quality fims ,'Vequal amounts
5
show on prep. fcc, dhcp; after measurements, amorphous
Mass ()lg)
1.669
5.629
1. 725
)leff(calc)
Californium-249 metal (sample #LI-48 A)
4 H=2.79 KOe H=3.50 KOe H=4.09 KOe
0 0
X If) 3 c 0 -u <iJ
'+--<iJ Ll
0 u 2 e a. u <iJ
0::
20.0 8.23
16.0
1.7
Bk2+ =
Bk3+ =
Bk4+ =
8.52
8.83
10.22
9.40
7.66
80
70
'" 8' 60
'" b x .i:' 50
..c
0. Q)
~ 40 ::>
'" E C
e;, 30 c <)
~ a. .~ 20 0::
10
H=4.89 KOe 0
0 0 100 200 300
Fig. 8.
-64.4
72.7
33.0
0
9
T ("K) range
170-350
50-298
100-298
Connnents
ferro at 1400 K due to impurities?
350 K antiferro.
100 - 1000 K
deviation from Curie-Weiss behaviour
Californium-249 metal (sample #LI-48-A)
100 200 300 Temperature (OK)
Fig. 9.
-82-
Table 6. 249Cf Metal
Sample Phase Mass l].lgJ
LI-48 fcc 8.85
LI-54 fcc 6.12*
Calculation 3+ ].leff(Cf )
2+ ].leff(Cf )
0.4
QJ
"0 E "- 0.2 ::J E ~
E ><
0 0 10 20 30 40
Temperature (OK)
Fig. 10. Magnetic susceptibility of Bk 3+ in CS2NaLuCl below 70 oK. The correction for Cf3+ impurity is negligible. Below 40 0 K the temperature-independent paramagnetic susceptibility is 192 000 x 10- 6
measured g value which we obtain from the value of the magnetic field at the center of the spectrum and the frequency of the microwave oscillator serves to identify the ground crystal field state. The next slide (Fig. 13) shows the energy level diagram for a J = 15/2 state in an octahedral crystal field. The abscissa is a function of the ratio of the crystal field parameters, B4 and B6, designated by the letter x. For this case x is negative so we are only concerned with the
,~ lower left quadrant. We see the ground state o can only, be a f6 or f7 doublet. By identifying
which state is the ground state we can set a
"
on the value of x which in turn will set a limit on the ratio of the two crystal field parameters B6 and B4' The next slide (Table 8) gives the experimental results. We measured a g value
6.273 which agrees very-well with the calculated value for g r. = 6.395. From the measured hyperfine couplin~ constant we obtained a value of the nuclear dipole moment of 249Cf
I~I = .28 ± .06 nuclear magnetons.
There is one further compound of Bk for which both magnetic resonance and magnetic susceptibility data are available. In this case Bk3+ was copxecipitated with Th(OH)4 and heated to form Bk + diluted in Th02. David Karraker
300
200
100
x 0
100
200
300
-1.0 -0.6 -0.2 0 0.2 0.6 1.0 E
Fig. 13.
(0
measured the susceptibility of this sample as shown on the next slide (Fig. 14). Here we see two regions where there are linear dependences of (l/X) vs. T. This he interpreted as having one crystal field state populated at low temperatures.
Marvin Abraham has measured the g value of Bk4+ diluted in a single crystal of Th02. The epr spectrum is shown on the next slide (Fig. 15). The results for this system are shown on the last slide (Table 9). The magnetic susceptibility data may be fit to an equation which considers two states, the lowest f6 and the next highest 1'8. Dr. Karraker has evaluated his data and finds the g value for the ground state is 5.04 and the energy of the next highest state is approximately ~80 em- 1. This measured g value is in fair agreement with the much more accurate value found by epr, g = 4.488. The epr data also set a limit on the energy of the f8 state as > 50 cm- l which is consistent with Karraker's measurements.
This concludes the summary of the magnetic measurements on Bk and Cf. These measurements are extremely difficult to make and in bulk sample measurements the principal difficulty besides the limited availability of the material is obtaining well defined pure samples, especially for Bk.
I 9/2
I gl 6.273 ± 0.010
A
gf13 (gauss) 25.7 ± 0.7
IAI -1 3 (cm x10) 7.52 ± 0.2
Calculated:
gJ - 1.279
gf -5gJ 6
-6.395
g1' 5.667gJ 7 7.248
200 100 50
0.3
.04
Fig. 14.
-84-
16 12.5 10
.06 .oB
Th02
: 249 Sk4 +
ve~9.459 GHz T-1.5 K
1100 1300 1500 1700 1900
gauss
Fig. 15. EPR spectrum of ThOz: Z49Bk4+ at -1.5K. The nuclear spin is equal to 7/2 and the spectrum is isotropic for all crystal orientations at this frequency.
Table 9. Bk4+ in Th02
x - lA + B exp(-~I/kT) + CT(l-ek¥(-~I/kT) - T 1 + 2 exp ( -~ I 7 T)