Page 1
Learning takes time: Biotic resistance by nativeherbivores increases through the invasion process.Jorge Santamaría ( [email protected] )
Centre d´Estudis Avançats de Blanes (CEAB-CSIC) https://orcid.org/0000-0003-4425-6297Raül Golo
Universitat de GironaJana Verdura
Université Côte d´AzurFiona Tomas
UIB – CSICEnric Ballesteros
Centre d'Estudis Avançats de Blanes https://orcid.org/0000-0001-5532-5337Teresa Alcoverro
CSIC https://orcid.org/0000-0002-3910-9594Rohan Arthur
Nature Conservation Foundation https://orcid.org/0000-0003-4267-9720Emma Cebrián
Centre d'Estudis Avançats de Blanes
Article
Keywords: alga-herbivore interactions, preference shift, biological invasions, herbivory, biotic resistanceincrease, Caulerpa cylindracea
Posted Date: February 1st, 2022
DOI: https://doi.org/10.21203/rs.3.rs-1295848/v1
License: This work is licensed under a Creative Commons Attribution 4.0 International License. Read Full License
Page 2
1
Learning takes time: Biotic resistance by native herbivores increases
through the invasion process.
Jorge Santamaría1,2, Raül Golo1, Jana Verdura2,3, Fiona Tomas4, Enric Ballesteros2,
Teresa Alcoverro2, Rohan Arthur2,5, Emma Cebrian1,2
1 GRMAR, Institutd’EcologiaAquàtica,UniversitatdeGirona, Girona, Spain
2 Centre d´Estudis Avançats de Blanes, Consejo Superior de Investigaciones Científicas
(CEAB-CSIC), Blanes, Spain
3 Université Côte d´Azur, CNRS, UMR. 7035 ECOSEAS, Nice, France
4 Marine Ecosystems Dynamics Group – Instituto Mediterráneo de Estudios Avanzados
(IMEDEA), Universitat de les Illes Balears (UIB) – Consejo Superior de
Investigaciones Científicas (CSIC), Esporles, Balearic Islands, Spain
5 Nature Conservation Foundation, Mysore, India
Corresponding Author:
Jorge Santamaría1
Email address: [email protected]
Abstract 1
As invasive species spread, the ability of local communities to resist invasion depends 2
on the strength of biotic interactions. Evolutionarily unused to the invader, native 3
predators or herbivores may be initially unskilled or wary of consuming newcomers, 4
allowing them to proliferate. However, these relationships may be highly dynamic, and 5
novel consumer-resource interactions could form as familiarity grows. Here, we explore 6
the development of effective biotic resistance towards a highly invasive alga in the 7
Mediterranean using multiple space-for-time approaches. We show that the principal 8
native Mediterranean herbivore learns to consume the invader species within less than a 9
decade. At recently invaded sites, the herbivore actively avoided the alga, shifting to 10
distinct preference and high consumptions at older sites, even when invader abundance 11
Page 3
2
was low. This rapid strengthening of the interaction contributed to the eventual collapse 12
of the alga after an initial dominance. Therefore, our results stress the importance of 13
conserving key native populations to allow communities to develop effective resistance 14
mechanisms against invaders with time. 15
Keywords: alga-herbivore interactions, preference shift, biological invasions, 16herbivory, biotic resistance increase, Caulerpa cylindracea 17
Introduction 18
As biological invasions spread across the globe, they are causing a reorganization of 19
community assemblages at rates not experienced in historical times. The curious 20
mélange that results brings together species that often have had little recently shared 21
evolutionary history. These actors have to establish entirely novel interactions with each 22
other, leading to communities with no modern analogs 1,2. With nothing to compare 23
these novel communities to, it is often difficult to predict exactly how they will 24
transform native systems. The invading species encounters a native community whose 25
network of interactions have been established over long ecological time scales, and how 26
this community adapts to the new entrant will determine the impact and scale of the 27
invasion. Freed from their usual suite of predators, alien species can become wildly 28
successful in the recipient area, rapidly overtaking the native community 3,4. However, 29
native communities with strong biotic interactions can show considerable biotic 30
resistance, where predation or competition by native species prevent invaders from 31
successfully establishing 5,6. 32
With rates of invasions growing rapidly over the last few decades 7, case studies 33
show that they can radically alter native ecosystems, making invasions one of the 34
leading drivers of the biodiversity crisis, together with climate change, land use and 35
pollution 8,9. Their negative impacts cascade through the ecosystem, affecting normal 36
Page 4
3
functioning, and disrupting a host of important ecosystem services 10 with consequences 37
for human health and well-being 11. Clearly then, managing current and future invasions 38
is an urgent global priority 9. 39
Central to the management of invasions is an understanding of how invasive 40
species interact with native communities, and the long-term dynamics of these 41
interactions 12,13. The strength and direction of newly formed interactions – either in the 42
form of competition or predation – is key to how successfully non-native species 43
establish within a recipient assemblage 4,5,14,15. If native predators learn quickly to 44
consume novel prey, the strength of the predator-prey interactions can significantly 45
reduce invasion success 16–20. However, very often, invasive species find themselves in 46
assemblages without natural enemies, or where potential predators have not learnt to 47
consume them. Thus, released from biotic control, invader populations soar 48
dramatically and can rapidly overwhelm native assemblages 3,4,21,22. Several factors 49
have been proposed to influence the strength and direction of consumer pressure 50
including the defense capabilities of invaders and their ability to release allelopathic 51
chemicals 23,24, the existence of predator avoidance mechanisms 25,26 or the inability of 52
predators to identify an invader as prey – native predator “naïveté” 15,27,28. 53
To date, most studies assessing novel predator-prey interactions typically 54
evaluate the impact of the invader at a particular point in time. However, the 55
relationship invasive species establish with the recipient community is a rapidly 56
evolving one. It is quite likely that the interaction will shift in strength and in character 57
as each actor adjusts to the other through the invasion process. Native predators, with 58
increased exposure to invaders, can learn their vulnerabilities and develop more 59
effective behavioral adaptations to exploit them, and feed more efficiently e.g., 29–31. Still, 60
how long it takes for a novel interaction to form and stabilize is a matter of some 61
Page 5
4
uncertainty. Several studies report increased consumption and damage on invaders with 62
increasing invasion time 16,17,32–34. Other studies in contrast, show that time since 63
invasion does not influence consumption or damage rates on invading prey 14,18,35. In 64
fact, several factors, apart from time, are likely to influence the development of such 65
novel interactions 13. Importantly, the probability of exposure is as much a function of 66
abundance as it is of time. Prey abundance is an important determinant of the strength 67
of predator-prey relationships 36,37, and predator experience of novel prey will likely 68
increase with prey density 12. Despite this, invader abundance has rarely been 69
considered when assessing the development of novel predator-prey interactions but see: 38. 70
Studies that integrate abundance and exposure time while evaluating novel 71
predator-prey interactions will help us understand the long-term dynamics of invasions. 72
Unfortunately, long-term data on most invaders are rare 39, thus, making it difficult to 73
draw strong conclusions on how predator-prey interactions develop through time 40. The 74
use of space-for-time designs or chronosequences, where populations with different 75
invasion times are studied, provides a cost-effective, viable and valid alternative to 76
long-term monitoring 41–43. These approaches can enable us to effectively assess if the 77
strength of novel consumer-prey interactions shifts throughout the invasion process in 78
relation to exposure time alone or in combination with other factors such as the invasion 79
intensity. Finally, their use could also provide critical clues that may assist in the 80
management of new and ongoing invasions. 81
In this study, we explore how a novel interaction between a native keystone fish 82
herbivore (Sarpa salpa) and a hyper-successful invasive alga (Caulerpa cylindracea) 83
develops over time. We use a space-for-time substitution together with a long-term 84
dataset to assess if the strength of the consumer-resource interaction is mediated by the 85
time since the invasion and/or by the abundance of the invader in the community. 86
Page 6
5
Preference and consumption assessments were conducted in populations with 87
contrasting exposure times and abundances of the invader, to assess if feeding 88
preference, the number of herbivores feeding on the invader and per capita 89
consumption rates of the herbivore were influenced by the temporal and numerical 90
characteristics of the invasion. Additionally, to further disentangle the influence of time 91
since invasion on the strength of the consumer-resource interaction, electivity for the 92
invader was assessed at three successive sampling times in two populations 93
characterized by their differential exposure time to the invader. 94
Results 95
Preference assessment 96
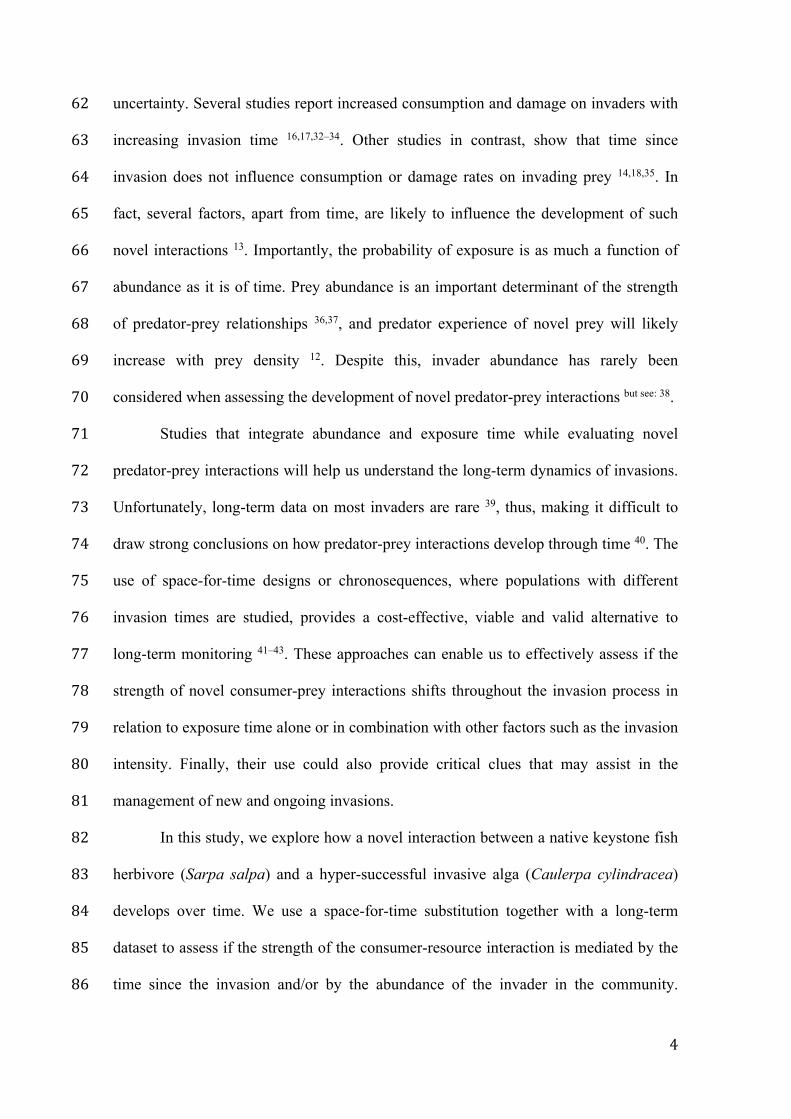
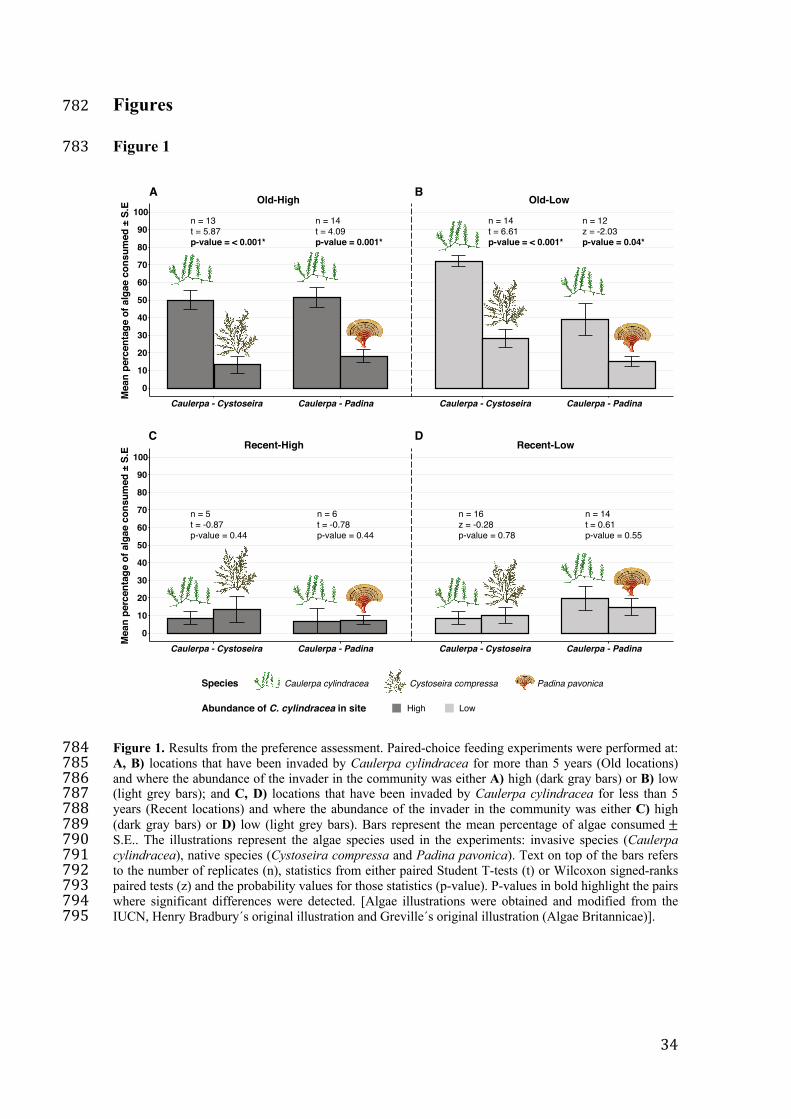
The preference of Sarpa salpa towards Caulerpa cylindracea was influenced by time 97
since invasion but not by the abundance of the invader in the community. Within five 98
years of the invasion, S. salpa developed a distinct preference for C. cylindracea, 99
regardless of the abundance of the invader (Figure 1, A-B). In fact, the native fish 100
showed an at least 2.5-fold higher preference for C. cylindracea over native species 101
(Figure 1, A-B), both in places with high and with low abundance of the invader. 102
In contrast, in recently invaded locations, S. salpa did not exhibit a preference 103
for the invader regardless of the abundance of C. cylindracea in the community (Figure 104
1, C-D). 105
Consumption assessment 106
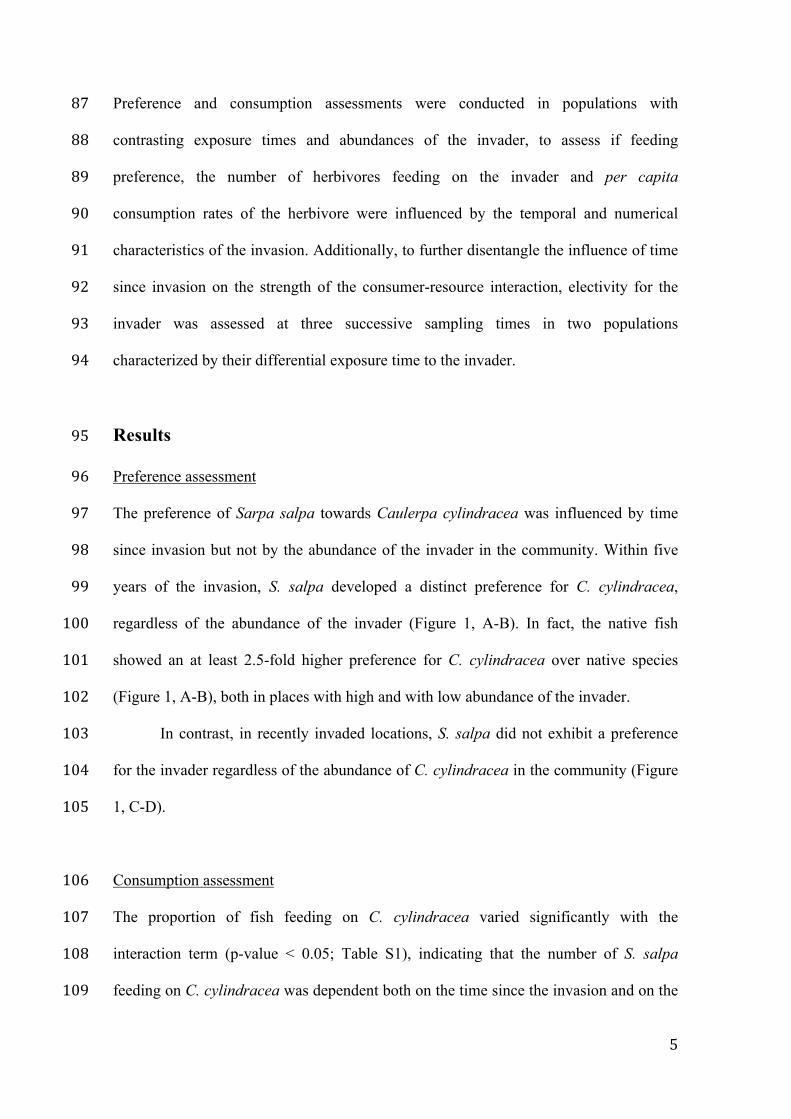
The proportion of fish feeding on C. cylindracea varied significantly with the 107
interaction term (p-value < 0.05; Table S1), indicating that the number of S. salpa 108
feeding on C. cylindracea was dependent both on the time since the invasion and on the 109
Page 7
6
abundance of the invader in the community. At each level of exposure time to the 110
invader, the number of fish eating C. cylindracea was significantly higher at high 111
invader abundance (Table S2, A), with at least 2 times more fish targeting the invader 112
than in populations where C. cylindracea abundance was low (Figure 2, A). 113
Additionally, time since invasion significantly influenced the number of fish targeting 114
the invader in locations with high abundances (Table S2, B), with twice the number of 115
fish consuming C. cylindracea in the Old-High populations than in the Recent-High 116
populations (Figure 2, A). In summary, more than 90% of S. salpa individuals 117
consumed the invasive alga in populations that had a high abundance of C. cylindracea 118
and with a long history of invasion; whereas only 21% of S. salpa individuals consumed 119
C. cylindracea in populations that were recently invaded and where the abundance of 120
the invader was low (Figure 2, A). 121
Similarly, per capita consumption rates of C. cylindracea by S. salpa were also 122
dependent on both, the time since invasion and the abundance of the invader in the 123
community (significant interaction term; Table S3). Sarpa salpa consumed significantly 124
more C. cylindracea in communities with a high invader abundance, regardless of time 125
since invasion (Figure 2, B; Table S4, A). However, a significant difference in per 126
capita consumption rates of C. cylindracea between old and recent populations was 127
only detected under high abundances of the invader (Table S4, B). In particular, in 128
communities with a high abundance of C. cylindracea, consumption of the invader was 129
almost 7 times higher in old populations than in the recent populations, whereas in 130
communities with a low abundance of C. cylindracea, consumption in old and in recent 131
populations was similarly low (Figure 2, B). 132
Page 8
7
Electivity assessment 133
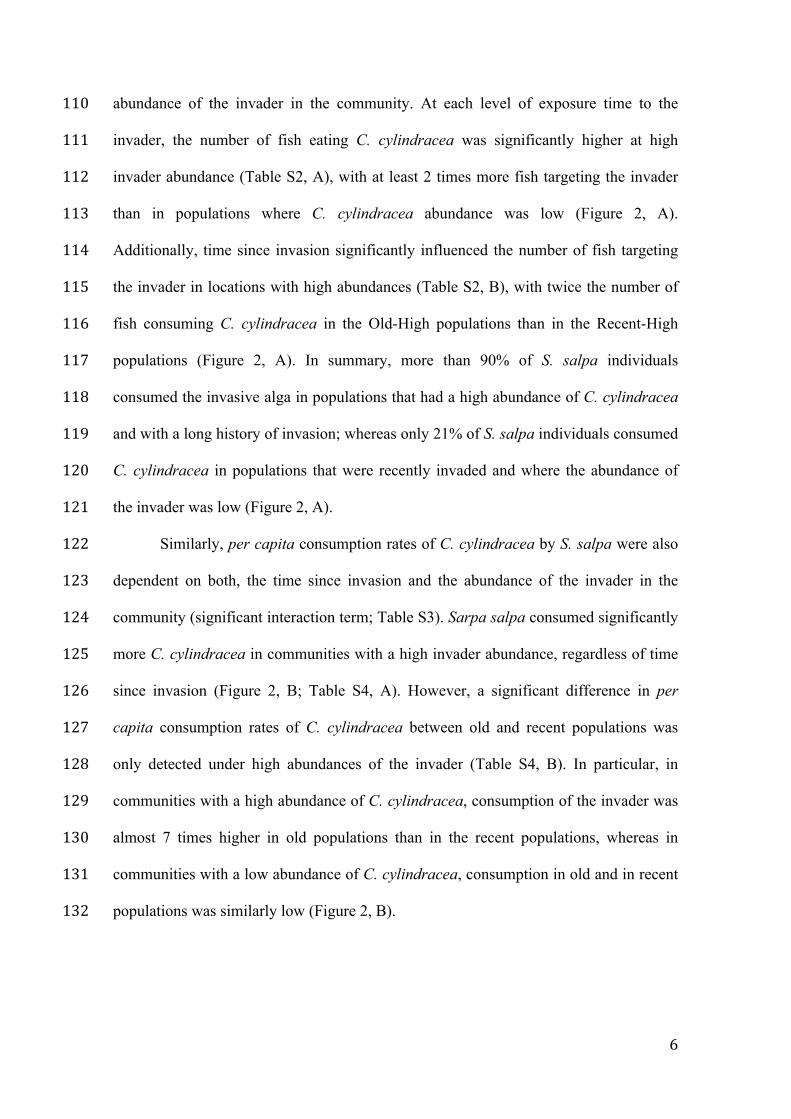
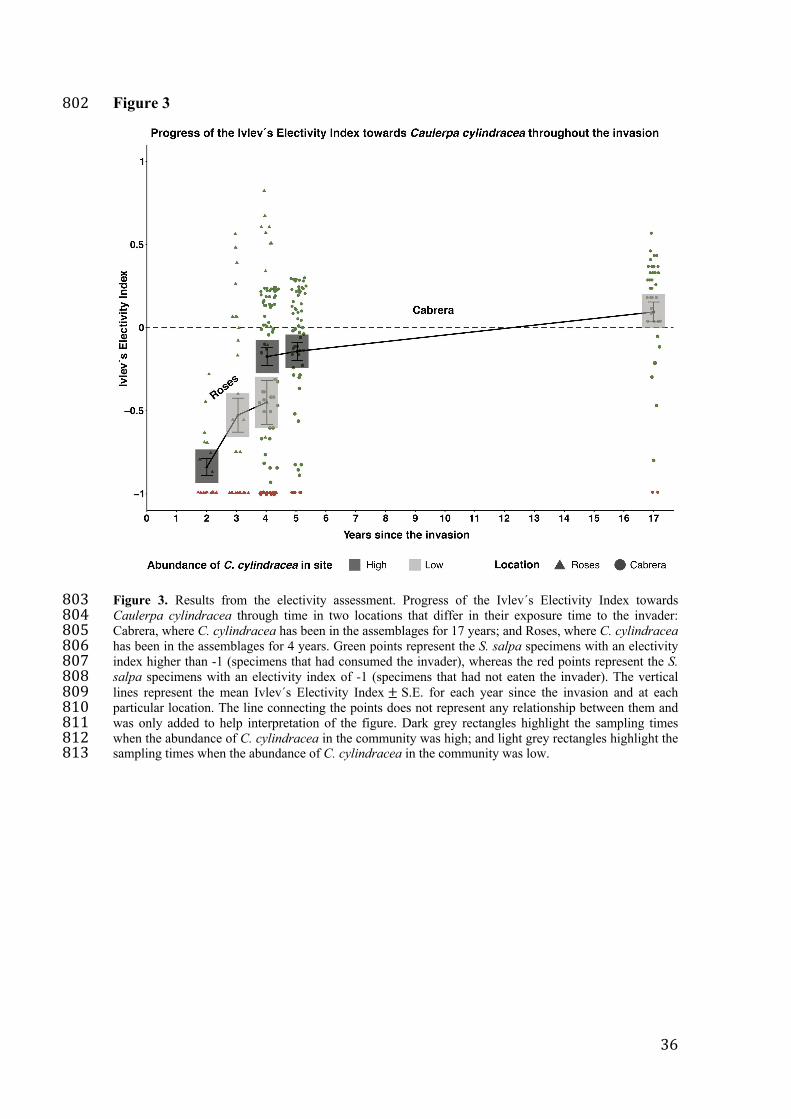
In Roses, where the invasion of C. cylindracea began very recently (first detection in 134
2016), S. salpa showed a negative electivity for C. cylindracea (Table S5), increasing 135
slightly with time (Figure 3-Roses; Table S5). Despite this, no significant differences 136
were detected in the Ivlev´s Index values between years (p-value > 0.05, Table S6). 137
In Cabrera Archipelago, where C. cylindracea has been well established for a 138
long time (~17 years), the electivity of S. salpa towards C. cylindracea increased 139
throughout the invasion; and native fish now show a clear positive electivity for the 140
invader (Figure 5-Cabrera; Table S5), confirmed by significantly different Ivlev Index 141
values (Kruskal-Wallis test, p-value < 0.05, Table S6). Post-hoc tests indicate that 142
electivity was significantly higher in 2020 than in 2007 and 2008 (p-value < 0.05, Table 143
S7). 144
Overall, we observe that independent of invader abundance, the number of fish 145
showing a total avoidance of C. cylindracea (-1 values; Figure 3 – first years of the 146
invasion) decreases through the invasion and a higher proportion of fish show a positive 147
electivity for the invader (positive values; Figure 3 – year 17 after the invasion). 148
Discussion 149
The success of exotic invaders is frequently attributed to a release from biotic control in 150
the communities in which they find themselves 3,4,21,22. With no shared evolutionary 151
history with native species, invaders often do much better in recipient communities than 152
they do in their native habitats, where they belong to assemblages that have formed over 153
long ecological time scales. While this initial unfamiliarity drives their rapid spread, 154
does it guarantee long-term success, once the novelty of the species has worn off? Our 155
results indicate that with time, as native species become increasingly familiar with the 156
Page 9
8
invader, the strength of consumer-resource interactions increases. Eventually, this may 157
serve to intensify the biotic resistance of native communities as native consumers learn 158
to handle and consume the invader, potentially leading to a control of their populations. 159
As recorded in Tomas et al. 44, we show that Sarpa salpa prefers Caulerpa 160
cylindracea to native algae, although the preference for the invasive alga takes several 161
years to develop. In the first few years of the invasion, S. salpa is much more wary of 162
the invader, and it is not until around 6 years of exposure that the herbivore starts 163
developing a clear preference for it. In populations with a more recent exposure to C. 164
cylindracea, no preference for the invader was detected. Remarkably, preference for the 165
invader in the old populations was maintained even at low abundances of C. 166
cylindracea. This is noteworthy since both Padina pavonica and Cystoseira compressa 167
are highly palatable and are commonly found in S. salpa´s diet 45,46. The fact that S. 168
salpa becomes increasingly partial to C. cylindracea may be linked to nutritive or 169
morphological traits of the invader, as has been described for other generalist herbivores 170
47–49. In fact, fast growing species like C. cylindracea 50, tend to be more palatable 171
because they allocate resources to re-growth rather than chemical or mechanical 172
defenses 51–53. In general, softer and more aqueous species such as C. cylindracea are 173
more easily removed, handled and masticated, making them prime targets for herbivores 174
54–56. 175
The probability of encounter between consumer and resource is a function of 176
time as well as abundance. In our study, the proportion of herbivorous fish feeding on 177
the invader and per capita consumption rates were influenced both by exposure time 178
and by availability of the invader in the community. There appears to be a certain 179
threshold of abundance that triggers significant increases both in the proportion of 180
individuals feeding as well as in per capita consumption rates, particularly evident at 181
Page 10
9
sites historically invaded compared with recent invaded areas. This shows that although 182
exposure time is essential for novel consumer-resource interactions to form 16,17,57, other 183
characteristics of the invasion (e.g. availability of the invader) and synergies between 184
them, strongly influence their development. However, we cannot ignore that low 185
invader abundances (< 30%) could partially mask the effect of time for the development 186
of novel consumer-resource interactions, since low encounter rates could inherently 187
reduce consumption even if fish populations were highly experienced with the invader. 188
In actual fact, the electivity of S. salpa towards C. cylindracea increased through time, 189
even when the abundance of the invader had declined considerably (Figure 3). 190
Therefore, it appears that once S. salpa has learnt that C. cylindracea is a valuable food 191
source and incorporates it in its diet, it seeks out the invader even when it becomes 192
increasingly rare. 193
On the face of it, the extraordinary preference that develops over time for C. 194
cylindracea by a native herbivore is a priori unexpected, given that the alga produces 195
caulerpenyne, a secondary metabolite with known herbivore deterrent properties 58. 196
However, C. cylindracea produces this metabolite in relatively low concentrations 59. In 197
addition, native Caulerpa prolifera, a common food-source for S. salpa 60, also 198
produces caulerpenyne, therefore, S. salpa may have developed a fair tolerance to the 199
compound, making it an ineffective deterrent. Even though invaders themselves may be 200
novel to the community, their phylogenetic affinities with resident natives may help 201
consumers adjust their behaviors and physiologies much more quickly to the invader 202
and form strong biotic interactions with them. Actually, this could well be an important 203
mechanism explaining the failure of some invasive plants to escape naïve herbivores 204
61,62. 205
Page 11
10
Mechanisms such as learning and social transmission can influence the way 206
predators adapt to novel prey at different time scales, from days to years and even 207
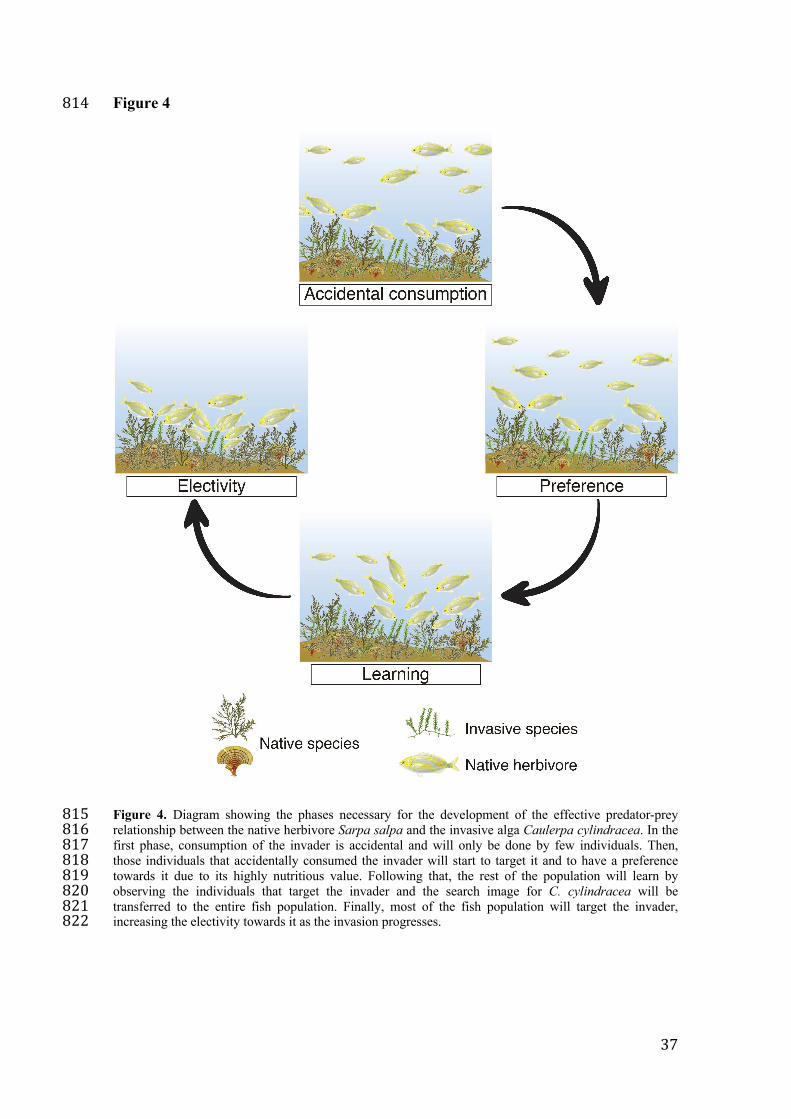
generations since they are first encountered 25,29,63. The mechanisms by which S. salpa 208
begins to consume C. cylindracea remain speculative, but they potentially follow steps 209
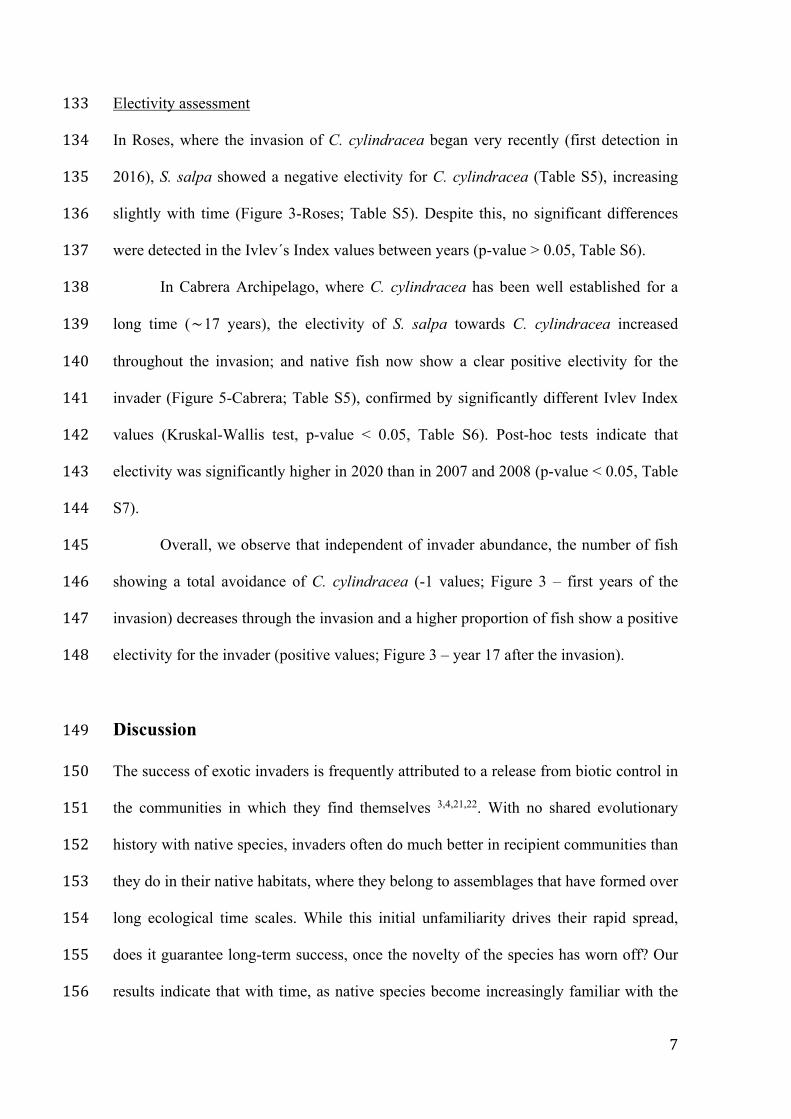
similar to the predation cycle 12 (Figure 6), which involves S. salpa identifying C. 210
cylindracea as a suitable resource and developing a taste for the newcomer. Therefore, 211
after an initial wariness because of the unfamiliarity of the invader, the first few 212
interactions may be completely accidental and involve very few individuals (low 213
proportion of individuals consume the invader in recent populations) (Figure 2-A; 214
Figure 4). However, after these individuals come to discover the high nutritional value 215
of the invader, they begin to target it, soon followed by the rest of the population when 216
it learns that the invader is safe to eat and nutritious. In non-solitary fish, social 217
learning, where individuals learn behaviors and acquire information such as what to eat 218
and what to avoid through observation, is an important foraging mechanism 64,65. This 219
may help explain the fast transmission of search images between demonstrators, those 220
that know how to feed on novel prey, and bystanders, those that observe and learn to 221
target the new prey 66. Actually, Sarpa salpa is a highly social species that feeds in large 222
cooperative shoals which show complex feeding behaviors 67. Within a population, 223
behavioral syndromes could play an important role in determining how quickly 224
consumers take to novel resources, with bolder phenotypes less reticent to try unfamiliar 225
food items than shy individuals 68, based on their past experiences 69. How rapidly this 226
learning spreads through the population could, as our results suggest, be influenced by 227
invader abundance, because the formation and transmission of search images likely 228
increases with encounter rates of novel resources 12,70. 229
Page 12
11
Our study suggests that as the invasion progresses, novel predator-prey 230
interactions can become an effective biotic resistance mechanism against an invader. 231
However, given that this resistance does not develop immediately, invaders can escape 232
biotic control at the start of the invasion, allowing them to become hyper-successful and 233
to impact native communities, as has been observed for the invasion of C. cylindracea 234
50,71,72. In fact, many invading species experience major population outbreaks when they 235
first arrive in an area, that can be linked to a release from natural enemies 40. But then, 236
as encounters increase and native communities learn to deal with the novel species, 237
invader populations could well experience a crash after a period of successful 238
dominance 17,29,40. Shifts in the strength of biotic resistance through time may be the 239
main factor in the steep declines several hyper-successful invaders have suffered with 240
time e.g., 17,19,73,74. Thus, biotic resistance against an invader is not static and changes 241
dynamically through the invasion, increasing its strength as the invasion progresses 242
17,33,34,75. For this reason, snapshot studies that only focus on a specific point in time 243
give us only a limited view of the importance of biotic resistance towards an invader 244
since the outcomes may vary greatly influenced across time. This may help explaining 245
contradictory patterns in the ability of native communities to develop effective biotic 246
resistance mechanisms towards invaders 4,13,22,27. Therefore, long-term studies or 247
chronosequences should be favored to help us understand the long-term dynamics of 248
certain invaders 40,76. In addition, given how important encounter rate is, studies need to 249
assess how these interactions develop at different densities of the invader as well. 250
Our study adds to the growing literature showing that native communities need 251
time to develop resistance mechanisms against invasive species e.g., 17,33,34,77. Studies in 252
terrestrial ecosystems refer to time exposures of decades or even centuries for effective 253
resistance mechanisms to develop through time 32–34,42,75. In our system, however, an 254
Page 13
12
exposure time of less than a decade was enough to observe an increase in the biotic 255
resistance of the native community and a decline in invader populations 74. This 256
represents roughly one generation of the herbivore S. salpa 78, indicating that a 257
population-level preference for the invader spread within the lifetime of the herbivore. 258
However, a decade is sufficient time for an initially successful invader to trigger 259
catastrophic and potentially irreversible shifts in ecosystems. As global change 260
continues to extend its reach across the world’s oceans, the swell of novel species 261
entering native waters is only going to increase. Therefore, considering that it takes time 262
for native assemblages to learn to adjust to these new entrants; in managing invasions, it 263
is imperative to ensure that native communities are maintained in as healthy a state as 264
possible until any potential biotic resistance to novel species can develop. 265
Materials and methods 266
Target species 267
Caulerpa cylindracea is a siphonaceous green alga native to the Southwestern coast of 268
Australia that is invasive in the Mediterranean Sea and in some regions in the Atlantic 269
Ocean and the Indian Ocean 71. In the Mediterranean Sea, C. cylindracea is rampantly 270
successful as it has colonized marine communities across the basin in less than 20 years 271
since its first detection 71,79. Caulerpa cylindracea is able to form dense mono-specific 272
stands that can quickly overgrow the underlying benthic assemblage, causing strong 273
negative impacts on native communities 50,71,80. The species can be considered a hyper-274
successful invader in the Mediterranean Sea 71,72 and it is ranked globally as one of the 275
most harmful marine invaders, causing widespread negative ecological impacts 276
wherever it spreads 81. The reasons for its extraordinary success are linked to its ability 277
to resist herbivores by producing deterrent metabolites, its high growth rates and its 278
Page 14
13
mechanisms of vegetative and sexual propagation. Over the last years, however, several 279
assemblages have seen steep declines in C. cylindracea abundance after an initial period 280
of successful dominance 71,74,82. Our team and others have witnessed several native 281
organisms feeding on the invader, hinting at the possibility that native communities may 282
be developing effective resistance mechanisms against C. cylindracea 44,83–85. 283
Additionally, the spread of the species is being closely tracked, and there is accurate 284
data available on the progress of C. cylindracea invasion in Mediterranean waters, 285
making it an ideal species to study how novel consumer-resource interactions evolve 286
through time and to assess whether the strength of the interaction shifts throughout the 287
course of the invasion and/or in relation to the abundance of the invader at the study 288
site. 289
The only true herbivorous fish in the study area is the bream Sarpa salpa 46,86, 290
which plays an important role in structuring seagrass and macroalgae communities 45,87. 291
This species is abundant in shallow water communities along the NW Mediterranean 292
Sea 87–89 and spends most of its time above 20 m 44,88,90, where it feeds on a wide variety 293
of species 46. Sarpa salpa has been observed to regularly consume C. cylindracea 44,83 294
and a previous study has reported that it even prefers the invasive alga over many native 295
species 44. 296
297
Study sites 298
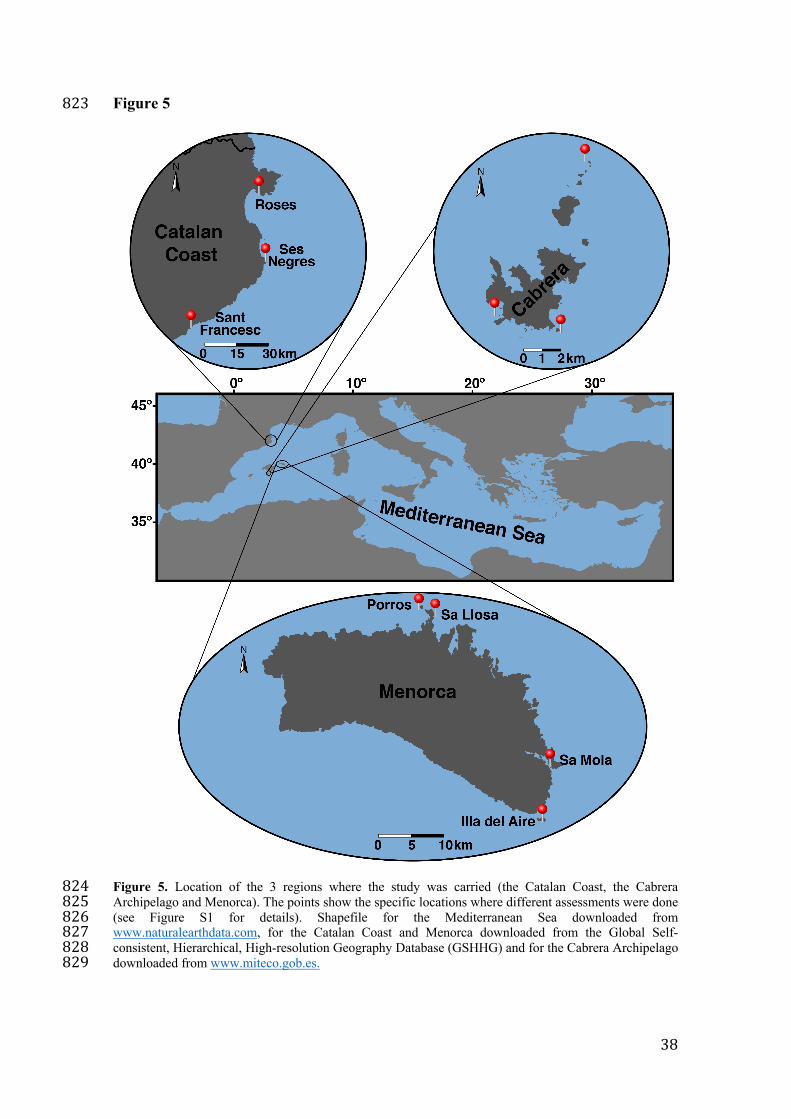
This study was conducted in 3 regions in the NW Mediterranean Sea: Cabrera 299
Archipelago, Menorca Island and the Catalan coast (Figure 5), based on the documented 300
invasion history of C. cylindracea in these regions. 301
In Cabrera Archipelago, C. cylindracea was detected in 2003 at 30 m deep 91 302
and quickly expanded across the archipelago. Nowadays, it can be found in most 303
Page 15
14
benthic habitats at depths between 0 to 65 m, where it can be the dominant species 84. 304
However, in the past few years, the abundance of the invasive alga has experienced a 305
decline in the archipelago, mainly at shallow depths 74. 306
In Menorca, C. cylindracea was first detected in 2006, in photophilic 307
assemblages (≈20 m deep) from the south of the island (Illa de l´Aire) 92, and then it 308
started shifting northwards and to shallower depths. From 2010 to date, C. cylindracea 309
can be found at many locations around the island, sometimes dominating the benthic 310
assemblages at depths between 5 to 45 m 93, although recent reports show that its 311
abundance is decreasing, predominantly in the shallow assemblages 94. 312
Along the Catalan coast, C. cylindracea was first detected in 2008 in its southern 313
waters, at depths between 20 to 50 m 95. The invasive alga maintained this restricted 314
distribution until 2013, when it was detected further north, in Blanes 82. Since then, it 315
has expanded northwards and can now be found in several locations in northern 316
Catalonia (authors’ personal observations). 317
Preference assessment 318
To assess if S. salpa´s preference for C. cylindracea changed in relation to time since 319
invasion and/or in relation to the abundance of the invader in the assemblage, paired-320
choice feeding experiments were performed at different locations in Menorca and the 321
Catalan coast. These regions were chosen to represent different times since the invasion 322
and because it was possible to find locations within them with contrasting abundances 323
of the invader. 324
To determine time since invasion at each location, long-term records of C. 325
cylindracea presence, available with the research team, were consulted. Based on year 326
since first detection, locations were classified as “Old” when C. cylindracea was first 327
Page 16
15
detected more than 5 years ago, “or “Recent” when C. cylindracea was detected less 328
than 5 years ago. The abundance of C. cylindracea at depths between 10 to 15 m was 329
assessed underwater on SCUBA. At each location, thirty 25 x 25 cm quadrats, divided 330
into 25 subquadrats of 5 x 5 cm 96 were randomly located on the benthos and the 331
number of subquadrats where C. cylindracea was present was used as a unit of 332
abundance. Mean C. cylindracea abundance was calculated for each location. Using this 333
measure, if the abundance of C. cylindracea was higher than 30%, locations were 334
classified as “High”, whereas if the abundance was lower than 30%, locations were 335
classified as “Low”. 336
A total of 8 locations were chosen for the preference assessment and were 337
classified following the previous criteria as follows: 4 locations from Menorca – Illa del 338
Aire (Old-High), Sa Mola (Old-Low), Porros (Old-High) and Sa Llosa (Recent-Low); 339
and 4 locations from the Catalan coast – Sant Francesc (Old-Low), Roses 2019 (Recent-340
Low), Roses 2018 (Recent-High) and Ses Negres (Recent-Low) (Table S8; Figure S1). 341
At each location, paired-choice feeding experiments were performed to compare 342
the relative palatability of C. cylindracea vs. two native macroalgae species: Cystoseira 343
compressa, an important habitat-forming alga that is highly palatable 45 and commonly 344
found in S. salpa´s diet 46; and Padina pavonica, a photophilic alga commonly found in 345
the sublittoral zone of warm-temperate coasts 97 and also a usual food source for S. 346
salpa 46 (Figure S1). Thus, we used 2 treatments: i) Caulerpa – Cystoseira and ii) 347
Caulerpa – Padina; and 3 controls, one per algal species. Each replicate in each 348
treatment was composed of native and invasive algal fragments held by two clothespins 349
attached to each other with zip-tie, weighted down to keep them in place underwater. 350
Controls were composed of algal fragments of each of the studied species, held by a 351
single clothespin protected from herbivores with a plastic mesh cage (0.5 cm mesh size) 352
Page 17
16
and were similarly weighted down. The clothespins were used to hold the algal 353
fragments and avoid losses due to currents. 354
A total of 7 replicates for each treatment and 5 replicates for each control were 355
deployed at each of the eight locations in patches chosen carefully to reduce 356
confounding effects. We maintained the same depth (≈10 m) for all replicates and 357
chose areas where there were no sea urchins. In addition, we ensured that the patches all 358
had similar macroalgae assemblages to guarantee that fishes were choosing between the 359
offered food choices always under the same conditions. The replicates were carefully 360
placed on the sea floor to guarantee that the clothespins were in an upright position and 361
that all algae were easily accessible to fishes. Replicate pairs were placed 1 m apart 362
from each other, whereas treatments were placed less than 20 m apart to maintain 363
constant environmental conditions between them. All the experiments were conducted 364
at the end of summer (in 2018 and in 2019), corresponding to the period of the year 365
when S. salpa feeds most intensively to accumulate reserves for winter and prepare for 366
reproduction 98. Samples were deployed in the morning and collected after 24 h; before 367
and after deployment, every algal fragment was pad-dried of excess water and wet 368
weighed to the nearest 0.01 g. In all pairs, similar initial weights for each alga were 369
offered to herbivores. 370
Biomass consumption was estimated with the formula: 371
#𝐻% 𝑥 𝐶)𝐶%* −𝐻) 372
where Hi and Hf were the initial and final wet weights of algae exposed to 373
herbivory and Ci and Cf were initial and final mean wet weights of the controls 44,99. 374
Consumption values were then standardized to a percentage of consumed algae. 375
Consumption assessment 376
Page 18
17
To assess if i) the percent of fish feeding on the invader and ii) the per capita 377
consumption rates on the invasive alga (total amount consumed), change in relation to 378
time since invasion and/or in relation to the abundance of the invader in the assemblage, 379
fish fecal pellets were collected in the field (on SCUBA) from the same locations where 380
preference assessments were done (Figure S1). At each location, the day after 381
completion of the preference experiment, we followed schools of S. salpa across their 382
depth range and collected fecal pellets from the water column in individual zip bags 383
while swimming below the fish. Between 30 and 50 pellets were collected per location. 384
The pellets were preserved in buffered 4% formaldehyde-seawater for later analysis. 385
This non-invasive method was used to diminish impacts on the study areas; and it has 386
earlier been used to reliably characterize S. salpa´s feeding patterns 44. 387
We determined the presence (% of fish feeding in the invader) and abundance 388
(per capita consumption rates) of C. cylindracea by examining fecal pellets in a 389
reticulated Petri dish under a stereomicroscope Stemi 2000-C (Carl Zeiss, Berlin, 390
Germany). Pellet content was spread uniformly on the dish and the relative abundance 391
of C. cylindracea in each pellet was estimated as the mean percentage cover that it 392
occupied in relation to the rest of the content. 393
Assessment of the electivity towards Caulerpa cylindracea throughout the invasion 394
To assess if S. salpa´s electivity towards C. cylindracea changed in relation to time 395
since invasion, the Ivlev´s Electivity Index (E) 100 was calculated in two locations: 396
Roses, at the 2nd, 3rd and 4th year after C. cylindracea invasion – first record in 2016; 397
and the Cabrera Archipelago, at the 4th, 5th and 17th year after the arrival of C. 398
cylindracea – first record in 2003 (Figure S1). 399
Page 19
18
To determine E at each location for each time period, the following formula was 400
used: 401
𝐸 = (𝑑% − 𝑎1)(𝑑% + 𝑎%) 402
where di = % of C. cylindracea in the fecal pellets of S. salpa (see the consumption 403
assessment section) and ai = % of C. cylindracea available in the environment (see the 404
preference assessment section). The values of Ivlev´s Index (E) range from -1 (complete 405
avoidance) to +1 (exclusive selection), with positive values indicating that the food item 406
is selected and eaten more than it is encountered by chance in the environment 100. 407
Statistical analysis 408
To assess if S. salpa preference changes with time since invasion and/or with the 409
abundance of C. cylindracea in the assemblage, the data from the paired-choice assays 410
was analyzed in the statistical environment R (R version 3.6.3) 101, with paired Student 411
t-tests when data was normal and homoscedastic, and with Wilcoxon signed-ranks 412
paired tests when data was not normal or was heteroscedastic. Replicates in which fish 413
did not feed on any of the algae were discarded from the statistical analyses, because 414
they do not provide any information on preference. 415
To evaluate the effect of time since invasion and abundance of the invader on 416
the proportion of fish feeding on the invader and on per capita consumption rates of C. 417
cylindracea, generalized linear models (GLMs) were fitted to fecal pellet data. In this 418
case, binomial models were used because the response variables were measured either 419
as 0-1 data (presence/absence of C. cylindracea in the pellets – % of fishes feeding on 420
the invader) or as proportions (abundance of C. cylindracea: % of the pellet content that 421
corresponded to the species – per capita consumption rates) and could be approximated 422
to a logistic distribution. Two models were fitted in R, one for the presence/absence 423
Page 20
19
data and the other for the abundance data. In both models, the factors “time since 424
invasion” and “abundance of the invader” were included and if the interaction between 425
them was significant, it was also included in the model. Tukey post hoc tests were 426
performed using the functions “pairs” and “emmeans” from the emmeans package 102 to 427
compare effects in the time since invasion factor (“recent” and “old”) at each level of 428
abundance (“high” and “low”) when the interaction between the factors was significant. 429
To assess whether there were differences in the Ivlev´s Electivity Index values 430
between years at each of the studied locations (Roses and the Cabrera Archipelago), 431
Kruskal-Wallis tests were performed due to the lack of normality in the data 103. Then, 432
to compare effects between years, Dunn´s post hoc tests 104 were performed using the 433
FSA package in R 105, correcting p-values with the Benjamini-Hochberg method 106. 434
References 435
1. Williams, J. W. & Jackson, S. T. Novel climates, no-analog communities, and 436
ecological surprises. Front. Ecol. Environ. 5, 475–482 (2007). 437
2. Hobbs, R. J. et al. Novel ecosystems: Theoretical and management aspects of the 438
new ecological world order. Glob. Ecol. Biogeogr. 15, 1–7 (2006). 439
3. Keane, R. M. & Crawley, M. J. Exotic plant invasions and the enemy release 440
hypothesis. Trends Ecol. Evol. 17, 164–170 (2002). 441
4. Colautti, R. I., Ricciardi, A., Grigorovich, I. A. & MacIsaac, H. J. Is invasion 442
success explained by the enemy release hypothesis? Ecol. Lett. 7, 721–733 443
(2004). 444
5. Levine, J. M., Adler, P. B. & Yelenik, S. G. A meta-analysis of biotic resistance 445
to exotic plant invasions. Ecol. Lett. 7, 975–989 (2004). 446
6. Theoharides, K. A. & Dukes, J. S. Plant invasion across space and time: Factors 447
Page 21
20
affecting nonindigenous species success during four stages of invasion. New 448
Phytol. 176, 256–273 (2007). 449
7. Seebens, H. et al. No saturation in the accumulation of alien species worldwide. 450
Nat. Commun. 8, 14435 (2017). 451
8. Butchart, S. H. M. et al. Global Biodiversity: Indicators of Recent Declines. 452
Science (80-. ). 328, 1164–1168 (2010). 453
9. Pyšek, P. et al. Scientists’ warning on invasive alien species. Biol. Rev. 95, 1511–454
1534 (2020). 455
10. Vilà, M. & Hulme, P. E. Impact of biological invasions on ecosystem services. 456
(Springer, 2017). 457
11. Pyšek, P. & Richardson, D. M. Invasive species, environmental change and 458
management, and health. Annu. Rev. Environ. Resour. 35, 25–55 (2010). 459
12. Saul, W. C. & Jeschke, J. M. Eco-evolutionary experience in novel species 460
interactions. Ecol. Lett. 18, 236–245 (2015). 461
13. Mitchell, C. E. et al. Biotic interactions and plant invasions. Ecol. Lett. 9, 726–462
740 (2006). 463
14. Pintor, L. M. & Byers, J. E. Do native predators benefit from non-native prey? 464
Ecol. Lett. 18, 1174–1180 (2015). 465
15. Sih, A. et al. Predator-prey naïveté, antipredator behavior, and the ecology of 466
predator invasions. Oikos 119, 610–621 (2010). 467
16. Carlsson, N. O. L. & Strayer, D. L. Intraspecific variation in the consumption of 468
exotic prey - a mechanism that increases biotic resistance against invasive 469
species? Freshw. Biol. 54, 2315–2319 (2009). 470
17. Carlsson, N. O. L., Bustamante, H., Strayer, D. L. & Pace, M. L. Biotic 471
resistance on the increase: native predators structure invasive zebra mussel 472
Page 22
21
populations. Freshw. Biol. 56, 1630–1637 (2011). 473
18. Carpenter, D. & Cappuccino, N. Herbivory, time since introduction and the 474
invasiveness of exotic plants. J. Ecol. 93, 315–321 (2005). 475
19. De Rivera, C. E., Ruiz, G. M., Hines, A. H. & Jivoff, P. Biotic resistance to 476
invasion: Native predator limits abundance and distribution of an introduced 477
crab. Ecology 86, 3364–3376 (2005). 478
20. Caselle, J. E., Davis, K. & Marks, L. M. Marine management affects the invasion 479
success of a non-native species in a temperate reef system in California, USA. 480
Ecol. Lett. 21, 43–53 (2018). 481
21. Liu, H. & Stiling, P. Testing the enemy release hypothesis: a review and meta-482
analysis. Biol. Invasions 8, 1535–1545 (2006). 483
22. Maron, J. L. & Vilà, M. When do herbivores affect plant invasion? Evidence for 484
the natural enemies and biotic resistance hypotheses. Oikos 95, 361–373 (2001). 485
23. Inderjit, Wardle, D. A., Karban, R. & Callaway, R. M. The ecosystem and 486
evolutionary contexts of allelopathy. Trends Ecol. Evol. 26, 655–662 (2011). 487
24. Mennen, G. J. & Laskowski, K. L. Defence is the best offence: Invasive prey 488
behaviour is more important than native predator behaviour. Anim. Behav. 138, 489
157–164 (2018). 490
25. Strauss, S. Y., Lau, J. A. & Carroll, S. P. Evolutionary responses of natives to 491
introduced species: What do introductions tell us about natural communities? 492
Ecol. Lett. 9, 357–374 (2006). 493
26. Ruland, F. & Jeschke, J. M. How biological invasions affect animal behaviour: A 494
global, cross-taxonomic analysis. J. Anim. Ecol. 89, 2531–2541 (2020). 495
27. Kimbro, D. L., Cheng, B. S. & Grosholz, E. D. Biotic resistance in marine 496
environments. Ecol. Lett. 16, 821–833 (2013). 497
Page 23
22
28. Verhoeven, K. J. F., Biere, A., Harvey, J. A. & Van Der Putten, W. H. Plant 498
invaders and their novel natural enemies: Who is naïve? Ecol. Lett. 12, 107–117 499
(2009). 500
29. Carlsson, N. O. L., Sarnelle, O. & Strayer, D. L. Native predators and exotic prey 501
- An acquired taste? Front. Ecol. Environ. 7, 525–532 (2009). 502
30. Phillips, B. L. & Shine, R. Adapting to an invasive species: Toxic cane toads 503
induce morphological change in Australian snakes. Proc. Natl. Acad. Sci. U. S. A. 504
101, 17150–17155 (2004). 505
31. Carroll, S. P., Klassen, S. P. & Dingle, H. Rapidly evolving adaptations to host 506
ecology and nutrition in the soapberry bug. Evol. Ecol. 12, 955–968 (1998). 507
32. Siemann, E., Rogers, W. E. & Dewalt, S. J. Rapid adaptation of insect herbivores 508
to an invasive plant. Proc. R. Soc. B Biol. Sci. 273, 2763–2769 (2006). 509
33. Stricker, K. B., Philip, F., Goss, E. M. & Flory, S. L. Emergence and 510
accumulation of novel pathogens suppress an invasive species. Ecol. Lett. 19, 511
469–477 (2016). 512
34. Diez, J. M. et al. Negative soil feedbacks accumulate over time for non-native 513
plant species. Ecol. Lett. 13, 803–809 (2010). 514
35. Harvey, K. J., Nipperess, D. A., Britton, D. R. & Hughes, L. Does time since 515
introduction influence enemy release of an invasive weed? Oecologia 173, 493–516
506 (2013). 517
36. Carbone, C., Pettorelli, N. & Stephens, P. A. The bigger they come, the harder 518
they fall: Body size and prey abundance influence predator-prey ratios. Biol. Lett. 519
7, 312–315 (2011). 520
37. Wellenreuther, M. & Connell, S. D. Response of predators to prey abundance: 521
Separating the effects of prey density and patch size. J. Exp. Mar. Bio. Ecol. 273, 522
Page 24
23
61–71 (2002). 523
38. Nelson, D. W. M., Crossland, M. R. & Shine, R. Foraging responses of predators 524
to novel toxic prey: Effects of predator learning and relative prey abundance. 525
Oikos 120, 152–158 (2011). 526
39. Strayer, D. L., Eviner, V. T., Jeschke, J. M. & Pace, M. L. Understanding the 527
long-term effects of species invasions. Trends Ecol. Evol. 21, 645–651 (2006). 528
40. Strayer, D. L. et al. Boom-bust dynamics in biological invasions: Towards an 529
improved application of the concept. Ecol. Lett. 20, 1337–1350 (2017). 530
41. Thomaz, S. M. et al. Using space-for-time substitution and time sequence 531
approaches in invasion ecology. Freshw. Biol. 57, 2401–2410 (2012). 532
42. Dostál, P., Müllerová, J., Pyšek, P., Pergl, J. & Klinerová, T. The impact of an 533
invasive plant changes over time. Ecol. Lett. 16, 1277–1284 (2013). 534
43. Gruntman, M., Segev, U., Glauser, G. & Tielbörger, K. Evolution of plant 535
defences along an invasion chronosequence: Defence is lost due to enemy release 536
– but not forever. J. Ecol. 105, 255–264 (2017). 537
44. Tomas, F., Cebrian, E. & Ballesteros, E. Differential herbivory of invasive algae 538
by native fish in the Mediterranean Sea. Estuar. Coast. Shelf Sci. 92, 27–34 539
(2011). 540
45. Vergés, A., Alcoverro, T. & Ballesteros, E. Role of fish herbivory in structuring 541
the vertical distribution of canopy algae Cystoseira spp. in the Mediterranean 542
Sea. Mar. Ecol. Prog. Ser. 375, 1–11 (2009). 543
46. Verlaque, M. Relations entre Sarpa salpa (Linnaeus, 1758) (Téléostéen, 544
Sparidae), les autres poissons broteurs et le phytobenthos algal méditerranéen. 545
Oceanol. Acta 13, 373–388 (1990). 546
47. Schädler, M., Jung, G., Auge, H. & Brandl, R. Palatability, decomposition and 547
Page 25
24
insect herbivory: Patterns in a successional old-field plant community. Oikos 548
103, 121–132 (2003). 549
48. Cronin, G. Influence of macrophyte structure, nutritive value, and chemistry on 550
the feeding choices of a generalist crayfish. in The Structuring Role of 551
Submerged Macrophytes in Lakes (eds. Jeppesen, E., Søndergaard, M., 552
Søndergaard, M. & Christoffersen, K.) 307–317 (Springer New York, 1998). 553
doi:10.1007/978-1-4612-0695-8_21. 554
49. Lodge, D. M. Herbivory on freshwater macrophytes. Aquat. Bot. 41, 195–224 555
(1991). 556
50. Piazzi, L., Ceccherelli, G. & Cinelli, F. Threat to macroalgal diversity: effects of 557
the introduced green alga Caulerpa racemosa in the Mediterranean. Mar. Ecol. 558
Prog. Ser. 210, 149–159 (2001). 559
51. Coley, P. D. Effects of plant growth rate and leaf lifetime on the amount and type 560
of anti-herbivore defense. Oecologia 74, 531–536 (1988). 561
52. Southwood, T. R. E., Brown, V. K. & Reader, P. M. Leaf palatability, life 562
expectancy and herbivore damage. Oecologia 70, 544–548 (1986). 563
53. Endara, M. J. & Coley, P. D. The resource availability hypothesis revisited: A 564
meta-analysis. Funct. Ecol. 25, 389–398 (2011). 565
54. Cronin, G. et al. Crayfish feeding preferences for freshwater macrophytes: The 566
influence of plant structure and chemistry. J. Crustac. Biol. 22, 708–718 (2002). 567
55. Vergés, A., Becerro, M. A., Alcoverro, T. & Romero, J. Variation in multiple 568
traits of vegetative and reproductive seagrass tissues influences plant-herbivore 569
interactions. Oecologia 151, 675–686 (2007). 570
56. Morrison, W. E. & Hay, M. E. Herbivore preference for native vs. exotic plants: 571
Generalist herbivores from multiple continents prefer exotic plants that are 572
Page 26
25
evolutionarily naïve. PLoS One 6, e17227 (2011). 573
57. Schultheis, E. H., Berardi, A. E. & Lau, J. A. No release for the wicked: Enemy 574
release is dynamic and not associated with invasiveness. Ecology 96, 2446–2457 575
(2015). 576
58. Paul, V., Arthur, K. E., Ritson-Williams, R., Ross, C. & Sharp, K. Chemical 577
defenses: from compounds to communities. Biol. Bull. 213, 226–251 (2007). 578
59. Box, A. et al. Seasonality of caulerpenyne content in native Caulerpa prolifera 579
and invasive C. taxifolia and C. racemosa var. cylindracea in the western 580
Mediterranean Sea. Bot. Mar. 53, 367–375 (2010). 581
60. Marco-Méndez, C., Ferrero-Vicente, L. M., Prado, P. & Sánchez-Lizaso, J. L. 582
Epiphytes and nutrient contents influence Sarpa salpa herbivory on Caulerpa 583
spp. vs. seagrass species in Mediterranean meadows. Estuar. Coast. Shelf Sci. 584
184, 54–66 (2017). 585
61. Hill, S. B. & Kotanen, P. M. Evidence that phylogenetically novel non-586
indigenous plants experience less herbivory. Oecologia 161, 581–590 (2009). 587
62. Pearse, I. S., Harris, D. J., Karban, R. & Sih, A. Predicting novel herbivore-plant 588
interactions. Oikos 122, 1554–1564 (2013). 589
63. Cox, G. W. Alien species and evolution: The evolutionary ecology of exotic 590
plants, animals, microbes, and interacting native species. (Island Press, 2004). 591
64. Brown, C. & Laland, K. N. Social learning in fishes: A review. Fish Fish. 4, 592
280–288 (2003). 593
65. Warburton, K. & Hughes, R. Learning of foraging skills by fish. in Fish 594
Cognition and Behavior (eds. Brown, C., Laland, K. N. & Krause, J.) 10–35 595
(Blackwell Publishing Ltd, 2011). doi:10.1002/9781444342536.ch2. 596
66. White, S. L. & Gowan, C. Social learning enhances search image acquisition in 597
Page 27
26
foraging brook trout. Environ. Biol. Fishes 97, 523–528 (2014). 598
67. Buñuel, X. et al. The dominant seagrass herbivore Sarpa salpa shifts its shoaling 599
and feeding strategies as they grow. Sci. Rep. 10, 106222 (2020). 600
68. Sundström, L. F., Petersson, E., Höjesjö, J., Johnsson, J. I. & Järvi, T. Hatchery 601
selection promotes boldness in newly hatched brown trout (Salmo trutta): 602
implications for dominance. Behav. Ecol. 15, 192–198 (2004). 603
69. Frost, A. J., Winrow-Giffen, A., Ashley, P. J. & Sneddon, L. U. Plasticity in 604
animal personality traits: Does prior experience alter the degree of boldness? 605
Proc. R. Soc. B Biol. Sci. 274, 333–339 (2007). 606
70. Allen, J. A. Frequency-dependent selection by predators. Philos. Trans. R. Soc. 607
Lond. B. Biol. Sci. 319, 485–503 (1988). 608
71. Klein, J. & Verlaque, M. The Caulerpa racemosa invasion: A critical review. 609
Mar. Pollut. Bull. 56, 205–225 (2008). 610
72. Katsanevakis, S., Tempera, F. & Teixeira, H. Mapping the impact of alien 611
species on marine ecosystems: The Mediterranean Sea case study. Divers. 612
Distrib. 22, 694–707 (2016). 613
73. Simberloff, D. & Gibbons, L. Now you see them, now you don’t! – population 614
crashes of established introduced species. Biol. Invasions 6, 161–172 (2004). 615
74. Santamaría, J. et al. The role of competition and herbivory in biotic resistance 616
against invaders: a synergistic effect. Ecology 102, e03440 (2021). 617
75. Hawkes, C. V. Are invaders moving targets? The generality and persistence of 618
advantages in size, reproduction, and enemy release in invasive plant species 619
with time since introduction. Am. Nat. 170, 832–843 (2007). 620
76. Strayer, D. L. Eight questions about invasions and ecosystem functioning. Ecol. 621
Lett. 15, 1199–1210 (2012). 622
Page 28
27
77. Lankau, R. A., Nuzzo, V., Spyreas, G. & Davis, A. S. Evolutionary limits 623
ameliorate the negative impact of an invasive plant. Proc. Natl. Acad. Sci. U. S. 624
A. 106, 15362–15367 (2009). 625
78. Méndez-Villamil, M., Lorenzo, J. M., Pajuelo, J. G., Ramos, A. & Coca, J. 626
Aspects of the life history of the salema, Sarpa salpa (Pisces, Sparidae), off the 627
Canarian archipelago (Central-East Atlantic). Environ. Biol. Fishes 63, 183–192 628
(2002). 629
79. Piazzi, L. et al. Invasion of Caulerpa racemosa var. cylindracea (Caulerpales, 630
Chlorophyta) in the Mediterranean Sea: An assessment of the spread. Cryptogam. 631
Algol. 26, 189–202 (2005). 632
80. Bulleri, F., Benedetti-Cecchi, L., Ceccherelli, G. & Tamburello, L. A few is 633
enough: A low cover of a non-native seaweed reduces the resilience of 634
Mediterranean macroalgal stands to disturbances of varying extent. Biol. 635
Invasions 19, 2291–2305 (2017). 636
81. Anton, A. et al. Global ecological impacts of marine exotic species. Nat. Ecol. 637
Evol. 3, 787–800 (2019). 638
82. García, M., Weitzmann, B., Pinedo, S., Cebrian, E. & Ballesteros, E. First report 639
on the distribution and impact of marine alien species in coastal benthic 640
assemblages along the Catalan coast. Handb. Environ. Chem. 43, 249–270 641
(2016). 642
83. Ruitton, S., Verlaque, M., Aubin, G. & Boudouresque, C. F. Grazing on 643
Caulerpa racemosa var. cylindracea (Caulerpales, Chlorophyta) in the 644
Mediterranean Sea by herbivorous fishes and sea urchins. Vie Milieu 56, 33–41 645
(2006). 646
84. Cebrian, E., Ballesteros, E., Linares, C. & Tomas, F. Do native herbivores 647
Page 29
28
provide resistance to Mediterranean marine bioinvasions? A seaweed example. 648
Biol. Invasions 13, 1397–1408 (2011). 649
85. Santamaría, J., Tomas, F., Ballesteros, E. & Cebrian, E. Herbivory on the 650
invasive alga Caulerpa cylindracea: The role of omnivorous fishes. Front. Mar. 651
Sci. 8, 1055 (2021). 652
86. Gianni, F. et al. Threats to large brown algal forests in temperate seas: the 653
overlooked role of native herbivorous fish. Sci. Rep. 7, 6012 (2017). 654
87. Tomas, F., Turon, X. & Romero, J. Seasonal and small-scale spatial variability of 655
herbivory pressure on the temperate seagrass Posidonia oceanica. Mar. Ecol. 656
Prog. Ser. 301, 95–107 (2005). 657
88. Bell, J. D. Effects of depth and marine reserve fishing restrictions on the structure 658
of a rocky reef fish assemblage in the North-Western Mediterranean Sea. J. Appl. 659
Ecol. 20, 357–369 (1983). 660
89. Reñones, O., Moranta, J., Coll, J. & Morales-Nin, B. Rocky bottom fish 661
communities of Cabrera Archipelago National Park (Mallorca, Western 662
Mediterranean). Sci. Mar. 61, 495–506 (1997). 663
90. Vergés, A., Tomas, F. & Ballesteros, E. Interactive effects of depth and marine 664
protection on predation and herbivory patterns. Mar. Ecol. Prog. Ser. 450, 55–65 665
(2012). 666
91. Cebrian, E. & Ballesteros, E. Temporal and spatial variability in shallow- and 667
deep-water populations of the invasive Caulerpa racemosa var. cylindracea in 668
the Western Mediterranean. Estuar. Coast. Shelf Sci. 83, 469–474 (2009). 669
92. Pons-Fàbregas, C., Sales, M., Canals, A. & Borràs, R. Primera cita de Caulerpa 670
racemosa var. cylindracea (Caulerpales, Clorophyta) a Menorca, Mediterrània 671
Occidental. Bolleti la Soc. d’Historia Nat. les Balear. 50, 21–26 (2007). 672
Page 30
29
93. Massutí, E. et al. Informe final 2010-2015. Convenio de colaboración para la 673
puesta en marcha y el desarrollo científico de la estación de investigación 674
‘Jaume Ferrer’ (La Mola, Menorca). (2015). 675
94. Cefalì, M. E. et al. Informe final 2016-2020. Convenio de colaboración para la 676
consolidación de la estación de investigación ‘Jaume Ferrer’ (La Mola, 677
Menorca). (2020). 678
95. Ballesteros, E., García, M. & Weitzmann, B. Informe: Detecció de Caulerpa 679
racemosa var. cylindracea a la costa de Vilanova i la Geltrú. (2008). 680
96. Sala, E. & Ballesteros, E. Partitioning of space and food resources by three fish 681
of the genus Diplodus (Sparidae) in a Mediterranean rocky infralittoral 682
ecosystem. Mar. Ecol. Prog. Ser. 152, 273–283 (1997). 683
97. Sala, E. The role of fishes in the organization of a Mediterranean sublittoral 684
community. II: Epifaunal communities. J. Exp. Mar. Bio. Ecol. 212, 45–60 685
(1997). 686
98. Peirano, A., Niccolai, I., Mauro, R. & Bianchi, C. N. Seasonal grazing and food 687
preference of herbivores in a Posidonia oceanica meadow. Sci. Mar. 65, 367–374 688
(2001). 689
99. Parker, J. D. & Hay, M. E. Biotic resistance to plant invasions? Native herbivores 690
prefer non-native plants. Ecol. Lett. 8, 959–967 (2005). 691
100. Ivlev, V. S. Experimental ecology of the feeding of fishes. (Yale University Press, 692
1961). 693
101. R Core Team. R: a language and environment for statistical computing. (2018). 694
102. Lenth, R. emmeans: Estimated Marginal Means, aka Least-Squares Means. R 695
package version 1.3.0. (2018). 696
103. Kruskal, W. H. & Wallis, W. A. Use of ranks in one-criterion variance analysis. 697
Page 31
30
J. Am. Stat. Assoc. 47, 583–621 (1952). 698
104. Dunn, O. J. Multiple comparisons using rank sums. Technometrics 6, 241–252 699
(1964). 700
105. Ogle, D. H., Wheeler, P. & Dinno, A. FSA: Fisheries Stock Analysis. (2020). 701
106. Benjamini, Y. & Hochberg, Y. Controlling the false discovery rate: a practical 702
and powerful approach to multiple testing. J. R. Stat. Soc. Ser. B 57, 289–300 703
(1995). 704
705
Acknowledgements 706
We thank the managers and rangers from the Cabrera Archipelago National Park for 707
sampling permissions and helping with field logistics and people at the Jaume Ferrer 708
Marine Station (Instituto Español de Oceanografía) for providing us with technical and 709
facility support. Funding for this Project was obtained from the Spanish Ministry 710
Project ANIMA (CGL2016-76341-R, MINECO/FEDER, UE), the European Union’s 711
EMFS Program, AFRIMED (No. EASME/EMFF/2017/1.2.1.12/S4/01/SI2.789059), 712
and the Spanish Autonomous Organism of National Parks through the project 713
BIGPARK (project 2017-2462). J.S. received the support of a fellowship from “La 714
Caixa” Foundation (ID 100010434) under agreement LCF/BQ/DE17/11600001, and 715
R.G benefitted from a pre-doctoral fellowship from the Spanish Ministry of Science 716
(ref. BES-2017-079907). This is a contribution from the Consolidated Research Group 717
“Medrecover; www.medrecover.org”; SGR2017-1521 (Govern de Catalunya). 718
Author contributions 719
J.S. and E.C. conceived the ideas and the experimental design; J.S., R.G., J.V., F.T., 720
E.B., and E.C. carried out the fieldwork experiments and collected the data; J.S. 721
Page 32
31
analyzed the data; J.S., T.A., R.A., and E.C. drafted the manuscript and all the authors 722
contributed substantially to revisions and accepted the final version before submission. 723
Competing interests 724
The authors declare that the research was conducted in the absence of any commercial 725
or financial relationship that could be construed as a potential conflict of interest. 726
Data availability 727
The raw data and R code supporting the conclusions of this article will be available on 728
the Zenodo repository. 729
Figure legends 730
Figure 1. Results from the preference assessment. Paired-choice feeding experiments 731
were performed at: A, B) locations that have been invaded by Caulerpa cylindracea for 732
more than 5 years (Old locations) and where the abundance of the invader in the 733
community was either A) high (dark gray bars) or B) low (light grey bars); and C, D) 734
locations that have been invaded by Caulerpa cylindracea for less than 5 years (Recent 735
locations) and where the abundance of the invader in the community was either C) high 736
(dark gray bars) or D) low (light grey bars). Bars represent the mean percentage of algae 737
consumed ± S.E.. The illustrations represent the algae species used in the experiments: 738
invasive species (Caulerpa cylindracea), native species (Cystoseira compressa and 739
Padina pavonica). Text on top of the bars refers to the number of replicates (n), 740
statistics from either paired Student T-tests (t) or Wilcoxon signed-ranks paired tests (z) 741
and the probability values for those statistics (p-value). P-values in bold highlight the 742
pairs where significant differences were detected. [Algae illustrations were obtained and 743
Page 33
32
modified from the IUCN, Henry Bradbury´s original illustration and Greville´s original 744
illustration (Algae Britannicae)]. 745
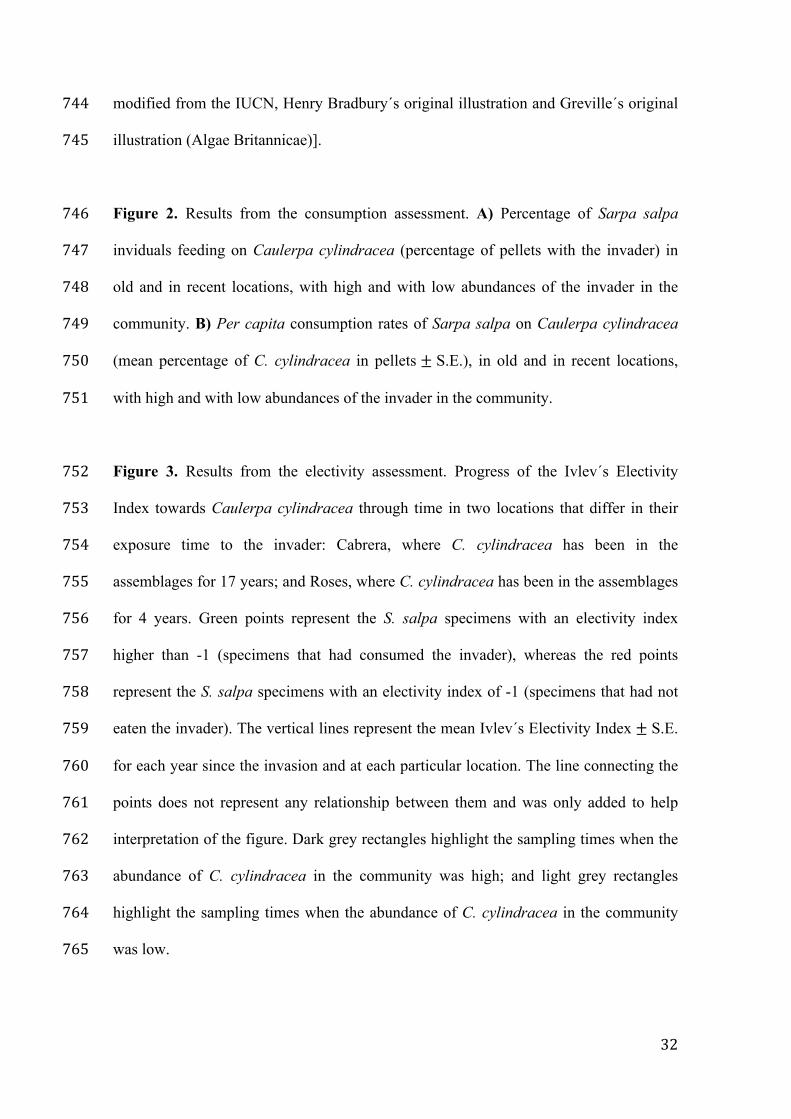
Figure 2. Results from the consumption assessment. A) Percentage of Sarpa salpa 746
inviduals feeding on Caulerpa cylindracea (percentage of pellets with the invader) in 747
old and in recent locations, with high and with low abundances of the invader in the 748
community. B) Per capita consumption rates of Sarpa salpa on Caulerpa cylindracea 749
(mean percentage of C. cylindracea in pellets ± S.E.), in old and in recent locations, 750
with high and with low abundances of the invader in the community. 751
Figure 3. Results from the electivity assessment. Progress of the Ivlev´s Electivity 752
Index towards Caulerpa cylindracea through time in two locations that differ in their 753
exposure time to the invader: Cabrera, where C. cylindracea has been in the 754
assemblages for 17 years; and Roses, where C. cylindracea has been in the assemblages 755
for 4 years. Green points represent the S. salpa specimens with an electivity index 756
higher than -1 (specimens that had consumed the invader), whereas the red points 757
represent the S. salpa specimens with an electivity index of -1 (specimens that had not 758
eaten the invader). The vertical lines represent the mean Ivlev´s Electivity Index ± S.E. 759
for each year since the invasion and at each particular location. The line connecting the 760
points does not represent any relationship between them and was only added to help 761
interpretation of the figure. Dark grey rectangles highlight the sampling times when the 762
abundance of C. cylindracea in the community was high; and light grey rectangles 763
highlight the sampling times when the abundance of C. cylindracea in the community 764
was low. 765
Page 34
33
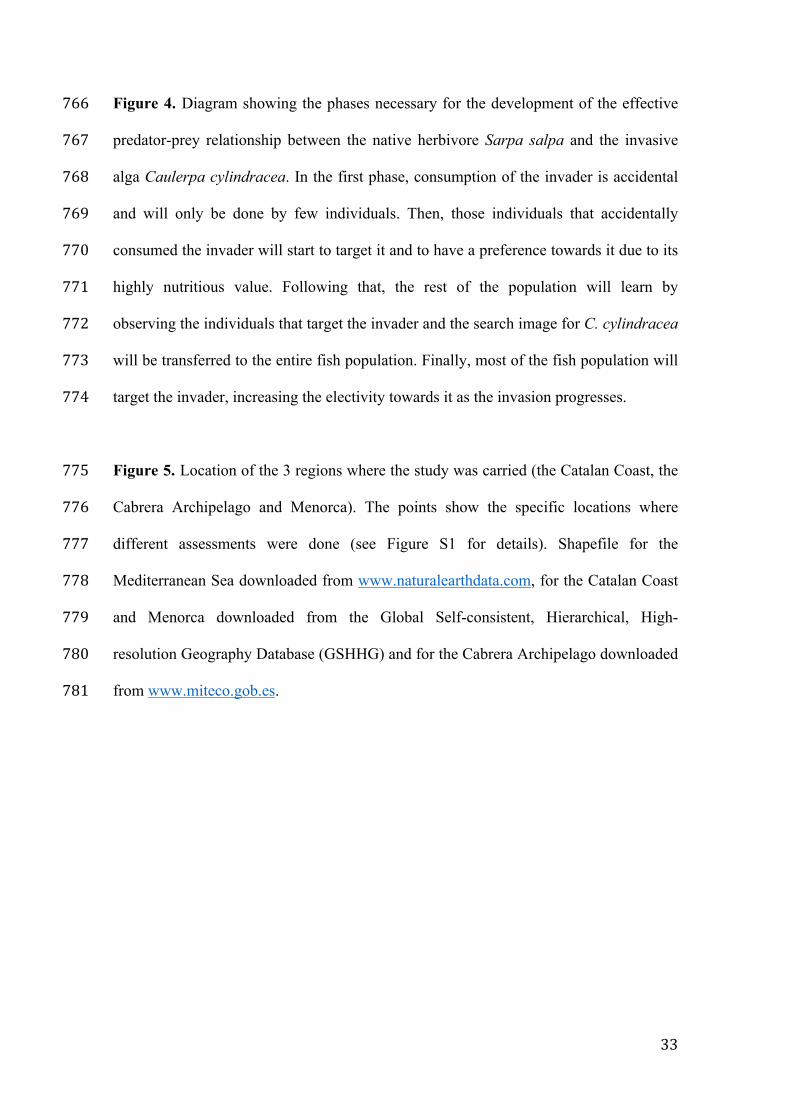
Figure 4. Diagram showing the phases necessary for the development of the effective 766
predator-prey relationship between the native herbivore Sarpa salpa and the invasive 767
alga Caulerpa cylindracea. In the first phase, consumption of the invader is accidental 768
and will only be done by few individuals. Then, those individuals that accidentally 769
consumed the invader will start to target it and to have a preference towards it due to its 770
highly nutritious value. Following that, the rest of the population will learn by 771
observing the individuals that target the invader and the search image for C. cylindracea 772
will be transferred to the entire fish population. Finally, most of the fish population will 773
target the invader, increasing the electivity towards it as the invasion progresses. 774
Figure 5. Location of the 3 regions where the study was carried (the Catalan Coast, the 775
Cabrera Archipelago and Menorca). The points show the specific locations where 776
different assessments were done (see Figure S1 for details). Shapefile for the 777
Mediterranean Sea downloaded from www.naturalearthdata.com, for the Catalan Coast 778
and Menorca downloaded from the Global Self-consistent, Hierarchical, High-779
resolution Geography Database (GSHHG) and for the Cabrera Archipelago downloaded 780
from www.miteco.gob.es. 781
Page 35
34
Figures 782
Figure 1 783
Figure 1. Results from the preference assessment. Paired-choice feeding experiments were performed at: 784A, B) locations that have been invaded by Caulerpa cylindracea for more than 5 years (Old locations) 785and where the abundance of the invader in the community was either A) high (dark gray bars) or B) low 786(light grey bars); and C, D) locations that have been invaded by Caulerpa cylindracea for less than 5 787years (Recent locations) and where the abundance of the invader in the community was either C) high 788(dark gray bars) or D) low (light grey bars). Bars represent the mean percentage of algae consumed ± 789S.E.. The illustrations represent the algae species used in the experiments: invasive species (Caulerpa 790cylindracea), native species (Cystoseira compressa and Padina pavonica). Text on top of the bars refers 791to the number of replicates (n), statistics from either paired Student T-tests (t) or Wilcoxon signed-ranks 792paired tests (z) and the probability values for those statistics (p-value). P-values in bold highlight the pairs 793where significant differences were detected. [Algae illustrations were obtained and modified from the 794IUCN, Henry Bradbury´s original illustration and Greville´s original illustration (Algae Britannicae)]. 795
0
10
20
30
40
50
60
70
80
90
100
Caulerpa - Cystoseira
Mean
perc
en
tag
e o
f alg
ae c
on
su
med
± S
.E
Species Caulerpa cylindracea
Old-High Old-Low
Caulerpa - Padina Caulerpa - Cystoseira Caulerpa - Padina
High LowAbundance of C. cylindracea in site
Cystoseira compressa Padina pavonica
n = 13
t = 5.87
p-value = < 0.001*
n = 14
t = 4.09
p-value = 0.001*
n = 14
t = 6.61
p-value = < 0.001*
n = 12
z = -2.03
p-value = 0.04*
0
10
20
30
40
50
60
70
80
90
100
Caulerpa - Cystoseira
Mean
perc
en
tag
e o
f alg
ae c
on
su
med
± S
.E
Recent-High Recent-Low
Caulerpa - Padina Caulerpa - Cystoseira Caulerpa - Padina
n = 5
t = -0.87
p-value = 0.44
n = 6
t = -0.78
p-value = 0.44
n = 16
z = -0.28
p-value = 0.78
n = 14
t = 0.61
p-value = 0.55
A B
C D
Page 36
35
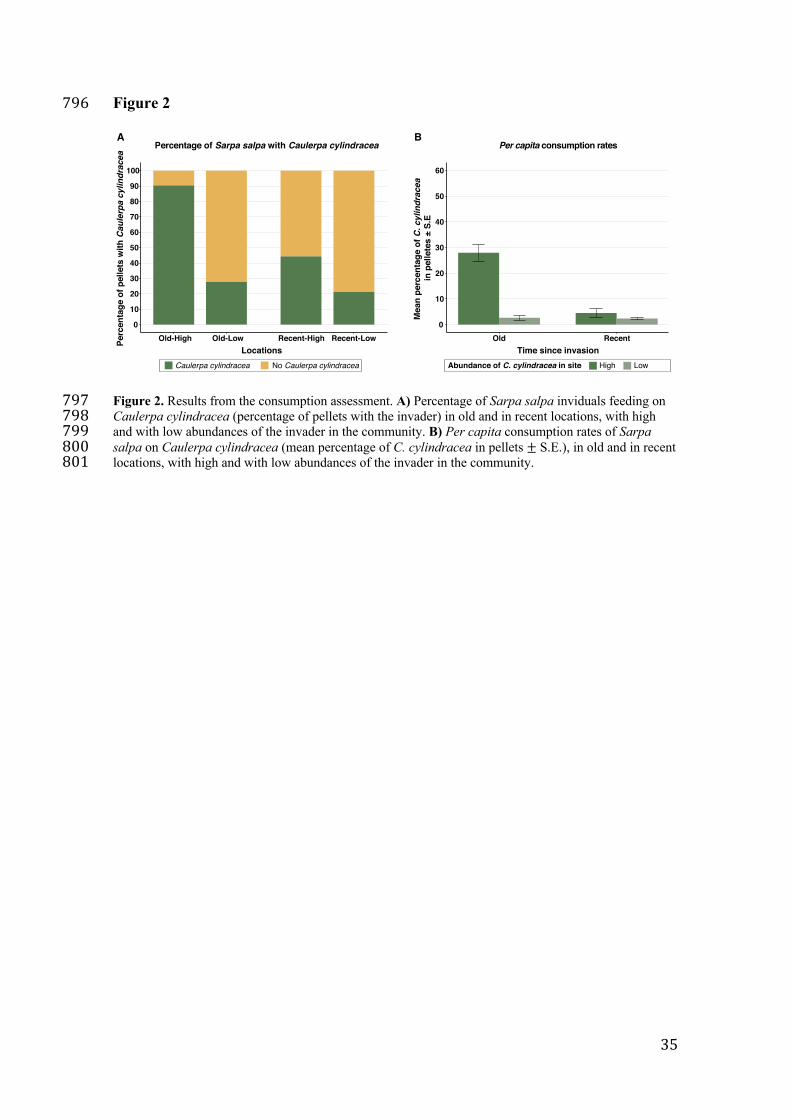
Figure 2796
Figure 2. Results from the consumption assessment. A) Percentage of Sarpa salpa inviduals feeding on 797Caulerpa cylindracea (percentage of pellets with the invader) in old and in recent locations, with high 798and with low abundances of the invader in the community. B) Per capita consumption rates of Sarpa 799salpa on Caulerpa cylindracea (mean percentage of C. cylindracea in pellets ± S.E.), in old and in recent 800locations, with high and with low abundances of the invader in the community. 801
0
10
20
30
40
50
60
70
80
90
100
Old-High Old-Low Recent-High Recent-Low
Perc
en
tag
e o
f p
ellets
wit
h C
au
lerp
a c
ylin
dra
cea
Locations
Caulerpa cylindracea
Percentage of Sarpa salpa with Caulerpa cylindracea
No Caulerpa cylindracea
0
10
20
30
40
50
60
Old Recent
Time since invasion
Mean
perc
en
tag
e o
f C
. cylin
dra
cea
in p
ellete
s ±
S.E
Abundance of C. cylindracea in site High Low
Per capita consumption rates A B
Page 37
36
Figure 3 802
Figure 3. Results from the electivity assessment. Progress of the Ivlev´s Electivity Index towards 803Caulerpa cylindracea through time in two locations that differ in their exposure time to the invader: 804Cabrera, where C. cylindracea has been in the assemblages for 17 years; and Roses, where C. cylindracea 805has been in the assemblages for 4 years. Green points represent the S. salpa specimens with an electivity 806index higher than -1 (specimens that had consumed the invader), whereas the red points represent the S. 807salpa specimens with an electivity index of -1 (specimens that had not eaten the invader). The vertical 808lines represent the mean Ivlev´s Electivity Index ± S.E. for each year since the invasion and at each 809particular location. The line connecting the points does not represent any relationship between them and 810was only added to help interpretation of the figure. Dark grey rectangles highlight the sampling times 811when the abundance of C. cylindracea in the community was high; and light grey rectangles highlight the 812sampling times when the abundance of C. cylindracea in the community was low. 813
Page 38
37
Figure 4 814
Figure 4. Diagram showing the phases necessary for the development of the effective predator-prey 815relationship between the native herbivore Sarpa salpa and the invasive alga Caulerpa cylindracea. In the 816first phase, consumption of the invader is accidental and will only be done by few individuals. Then, 817those individuals that accidentally consumed the invader will start to target it and to have a preference 818towards it due to its highly nutritious value. Following that, the rest of the population will learn by 819observing the individuals that target the invader and the search image for C. cylindracea will be 820transferred to the entire fish population. Finally, most of the fish population will target the invader, 821increasing the electivity towards it as the invasion progresses. 822
Page 39
38
Figure 5 823
Figure 5. Location of the 3 regions where the study was carried (the Catalan Coast, the Cabrera 824Archipelago and Menorca). The points show the specific locations where different assessments were done 825(see Figure S1 for details). Shapefile for the Mediterranean Sea downloaded from 826www.naturalearthdata.com, for the Catalan Coast and Menorca downloaded from the Global Self-827consistent, Hierarchical, High-resolution Geography Database (GSHHG) and for the Cabrera Archipelago 828downloaded from www.miteco.gob.es. 829
Page 40
Supplementary Files
This is a list of supplementary �les associated with this preprint. Click to download.
SupplementarymaterialLearningtakestime.pdf