107
Lecture 4 Electric Field Effect on Flames: Ionic wind and Joule heating Yiguang Ju Princeton University Princeton Combustion Summer School 2021.6.21
| Date post: | 19-Mar-2023 |
| Category: |
Documents |
| Upload: | khangminh22 |
| View: | 2 times |
| Download: | 0 times |
Lecture 4 Electric Field Effect on Flames: Ionic wind and Joule heating
Yiguang Ju
Princeton University
Princeton Combustion Summer School2021.6.21
+ - + - + -
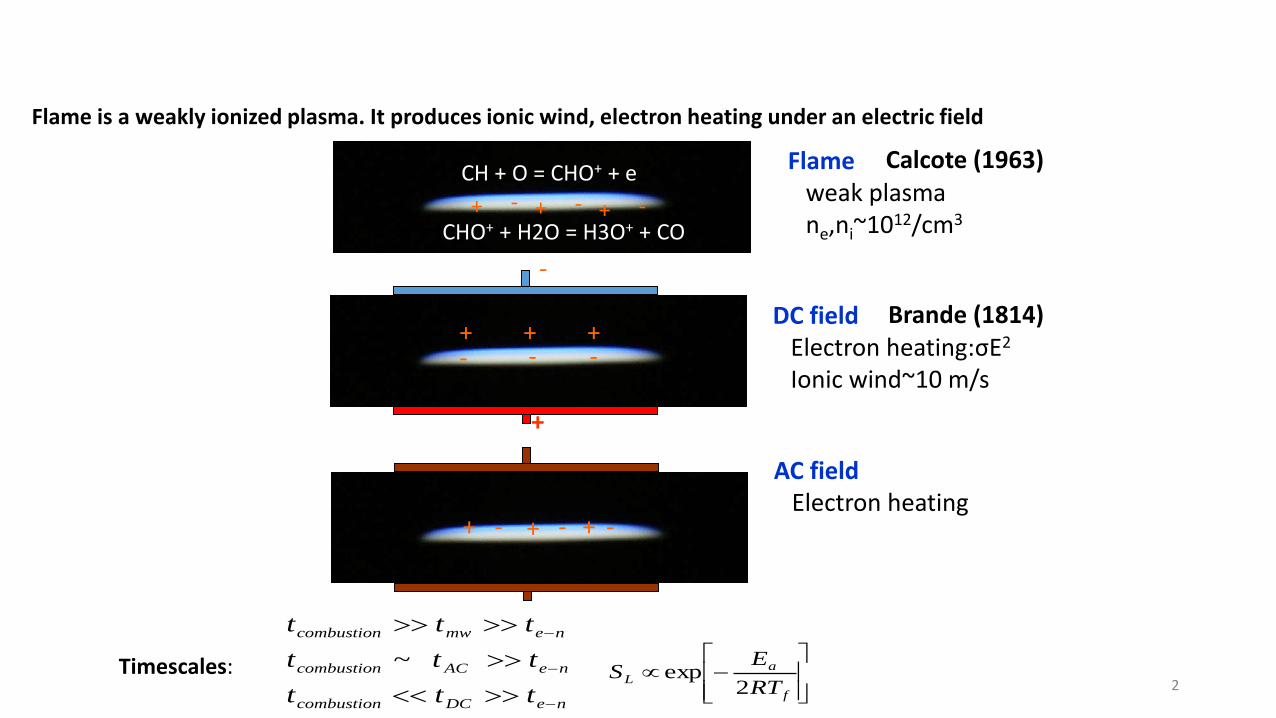
Flameweak plasmane,ni~1012/cm3
+-
+-
+-
DC fieldElectron heating:σE2
Ionic wind~10 m/s
-
+
Brande (1814)
Calcote (1963)
+ - + - + -
AC fieldElectron heating
CH + O = CHO+ + e
2
Flame is a weakly ionized plasma. It produces ionic wind, electron heating under an electric field
CHO+ + H2O = H3O+ + CO
f
aL
RT
ES
2exp
neDCcombustion
neACcombustion
nemwcombustion
ttt
ttt
ttt
~Timescales:
Ionic wind and Joule heating by an electric field
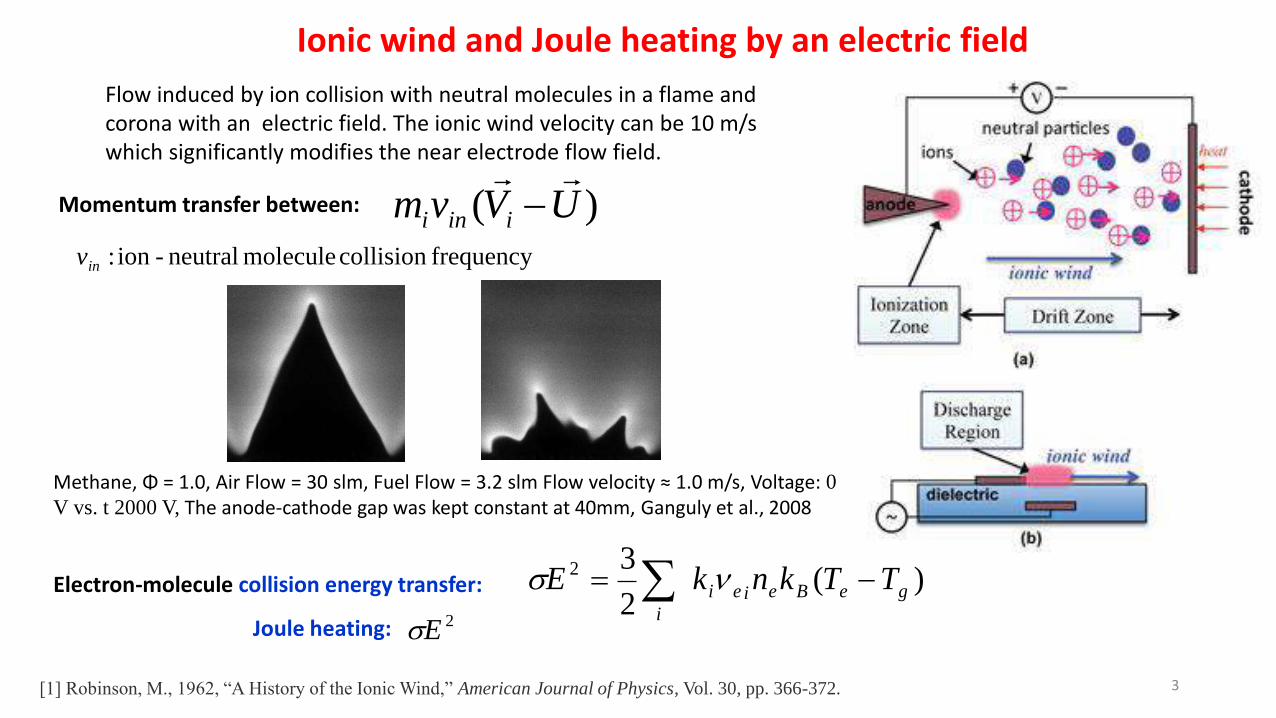
)( UVvm iini
[1] Robinson, M., 1962, “A History of the Ionic Wind,” American Journal of Physics, Vol. 30, pp. 366-372.
Flow induced by ion collision with neutral molecules in a flame and corona with an electric field. The ionic wind velocity can be 10 m/s which significantly modifies the near electrode flow field.
Momentum transfer between:
Electron-molecule collision energy transfer: )(2
32
geBeiei
i
TTknkE
Joule heating:
Methane, Φ = 1.0, Air Flow = 30 slm, Fuel Flow = 3.2 slm Flow velocity ≈ 1.0 m/s, Voltage: 0
V vs. t 2000 V, The anode-cathode gap was kept constant at 40mm, Ganguly et al., 2008
3
2E
frequencycollision molecule neutral-ion :inv
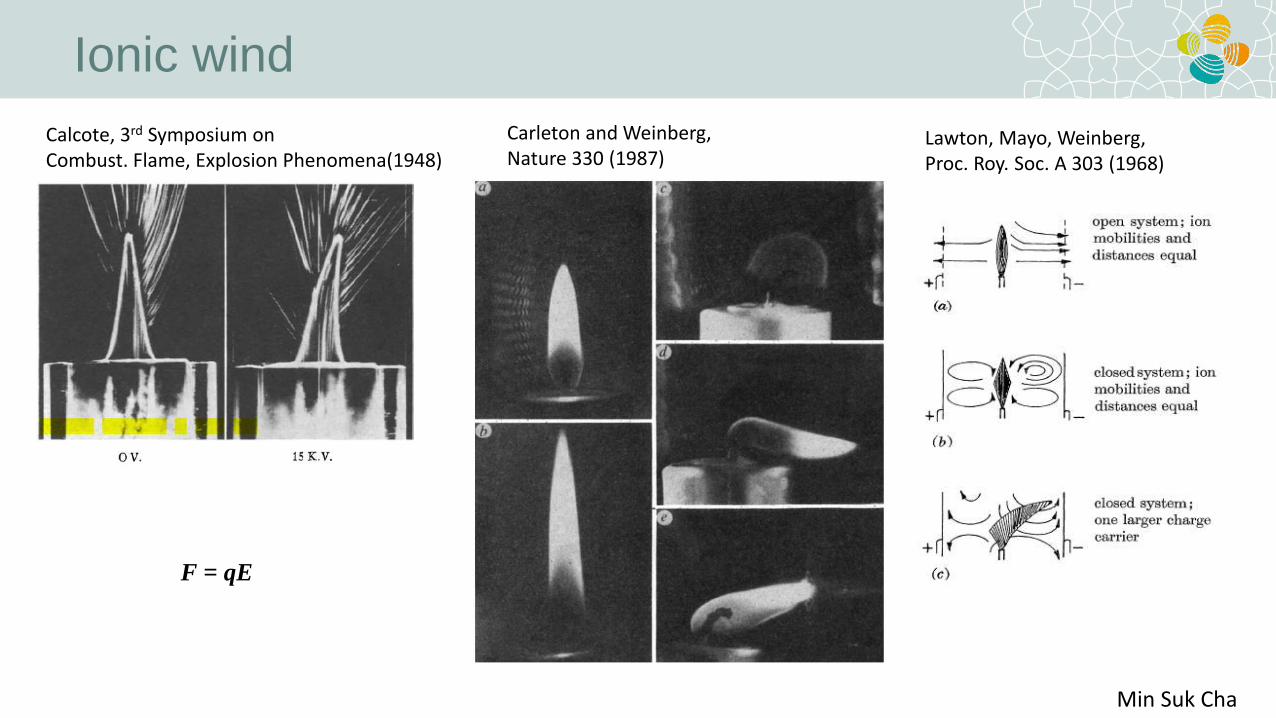
Ionic wind
Calcote, 3rd Symposium on Combust. Flame, Explosion Phenomena(1948)
Carleton and Weinberg, Nature 330 (1987)
Lawton, Mayo, Weinberg, Proc. Roy. Soc. A 303 (1968)
F = qE
Min Suk Cha
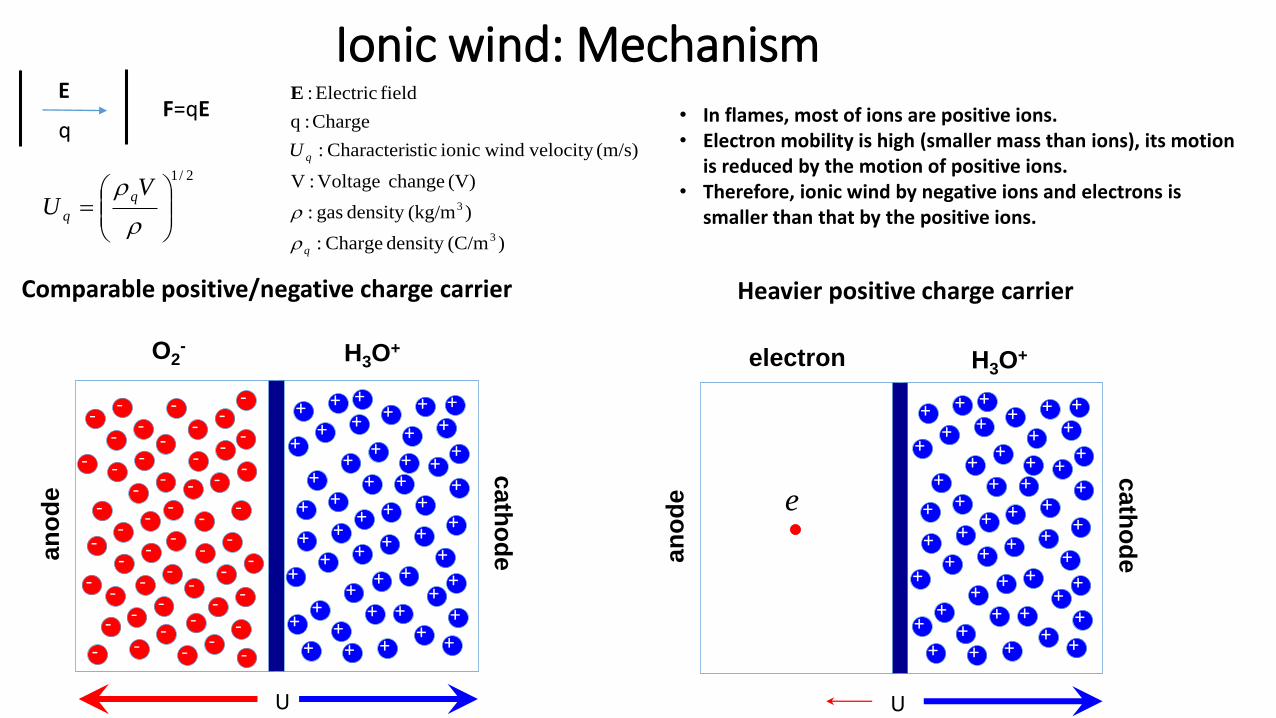
Ionic wind: Mechanism• In flames, most of ions are positive ions.• Electron mobility is high (smaller mass than ions), its motion
is reduced by the motion of positive ions.• Therefore, ionic wind by negative ions and electrons is
smaller than that by the positive ions.
e
an
od
e
ca
tho
de
++
++
++
++
++
++
++
++
++
++
++
++
+
+
++
++
++
+
+
+
+
+
+
+ +
+
+ +
+
+
+
+
+ +
+
e
electron H3O+
Heavier positive charge carrier
e
an
od
e
ca
tho
de
++
++
++
++
++
++
++
++
++
++
++
++
+
+
++
++
++
+
+
+
+
+
+
+ +
+
+ +
+
+
+
+
+ +
+
--
--
--
--
--
-
--
--
--
-
--
--
--
--
--
--
- --
-
--
--
-
-
-
--
-
---
-
-
-
-
-
O2- H3O
+
Comparable positive/negative charge carrier
U U
2/1
VU
q
q
)(C/mdensity Charge:
)(kg/mdensity gas:
(V) change Voltage :V
(m/s) velocity windionic sticCharacteri:
Charge :q
field Electric :
3
3
q
qU
EF=qE
E
q
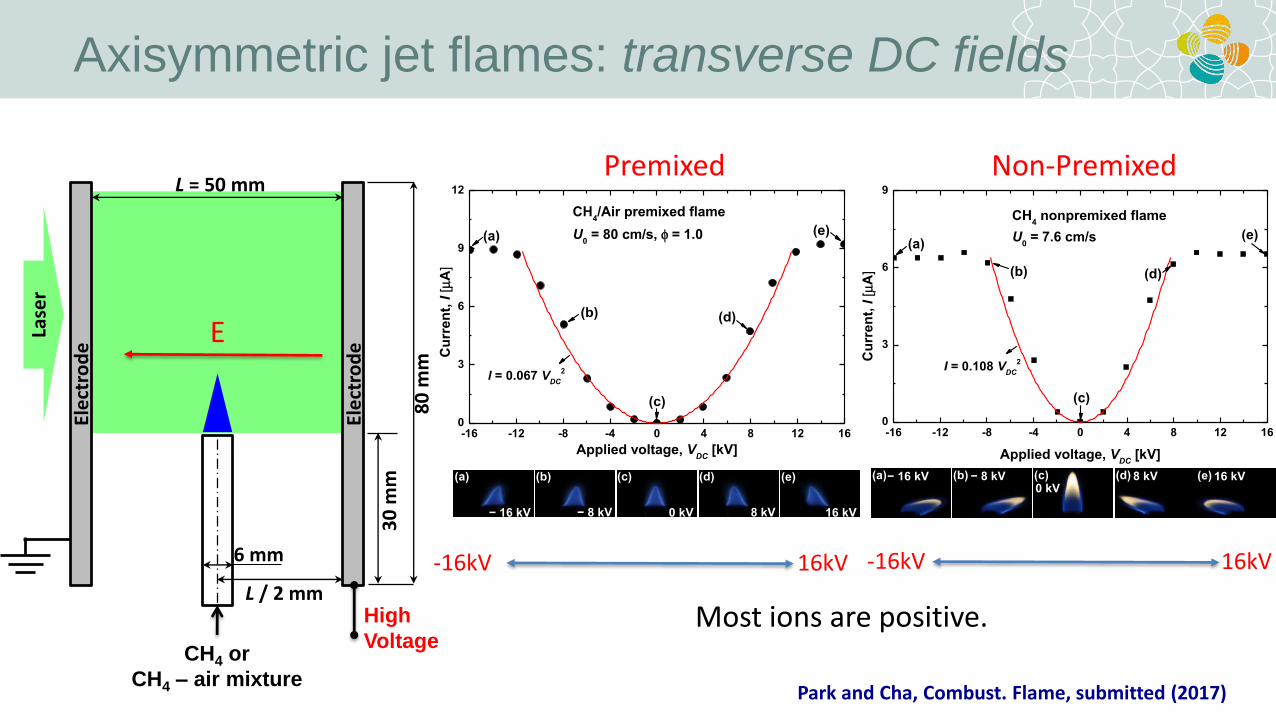
Axisymmetric jet flames: transverse DC fields
Park and Cha, Combust. Flame, submitted (2017)
EEl
ect
rod
e
Ele
ctro
de
L = 50 mm
80
mm
Lase
r
L / 2 mm
30
mm
6 mm
CH4 or
CH4 – air mixture
High
Voltage
Premixed Non-Premixed
16kV-16kV 16kV-16kV
Most ions are positive.
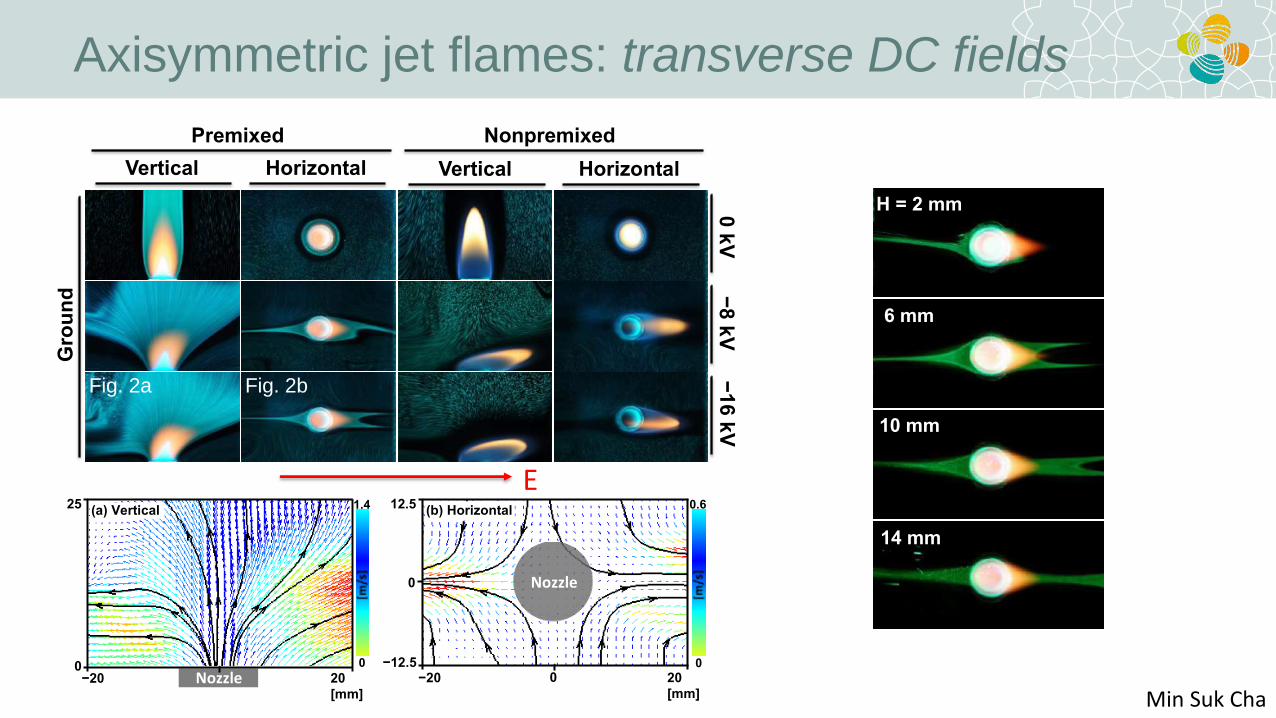
Axisymmetric jet flames: transverse DC fields
Premixed Nonpremixed
Vertical Horizontal Vertical Horizontal
Fig. 2a Fig. 2b
0 k
V
−8 k
V
−16
kV
Gro
un
d
H = 2 mm
6 mm
10 mm
14 mm
Nozzle
1.4
0 0 −20 20
[mm]
25 (a) Vertical
Nozzle
0.6
0
0 −20 20
[mm]
12.5
−12.5
0
(b) Horizontal
E
Min Suk Cha
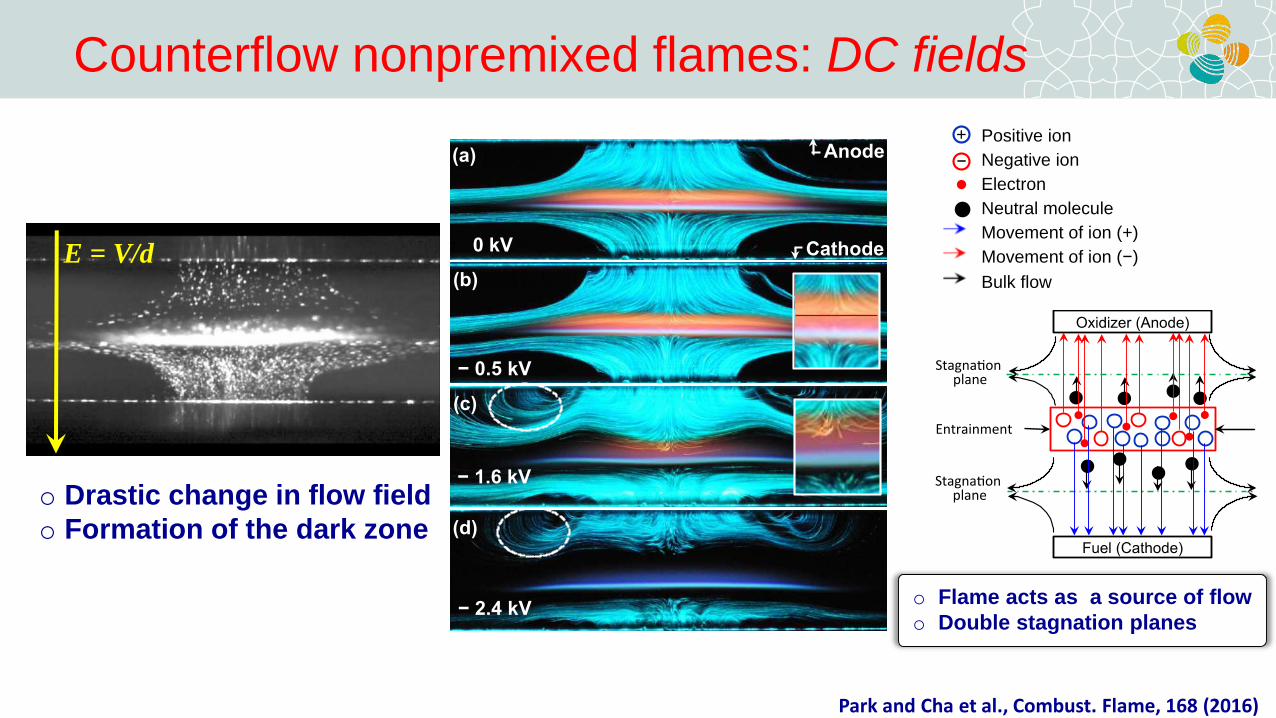
Counterflow nonpremixed flames: DC fields
Park and Cha et al., Combust. Flame, 168 (2016)
E = V/d
Fuel + N2
O2 + N2
o Drastic change in flow field
o Formation of the dark zone
0 kV
− 2.4 kV
(a)
(b)
(c)
(d)
− 1.6 kV
− 0.5 kV
Cathode
Anode
o Flame acts as a source of flow
o Double stagnation planes
Positive ion
Negative ion
Electron
Neutral molecule
Movement of ion (+)
Movement of ion (−)
Bulk flow
+
−
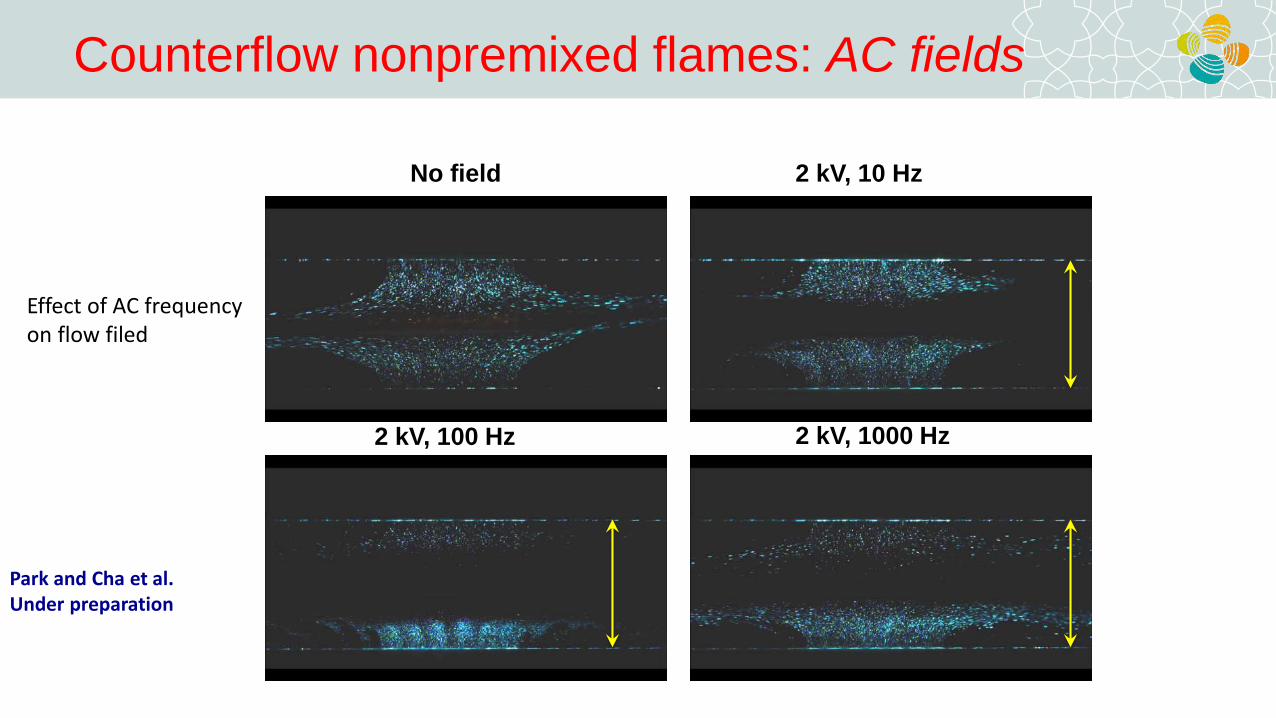
Counterflow nonpremixed flames: AC fields
No field 2 kV, 10 Hz
2 kV, 100 Hz 2 kV, 1000 Hz
Park and Cha et al.Under preparation
Effect of AC frequency on flow filed
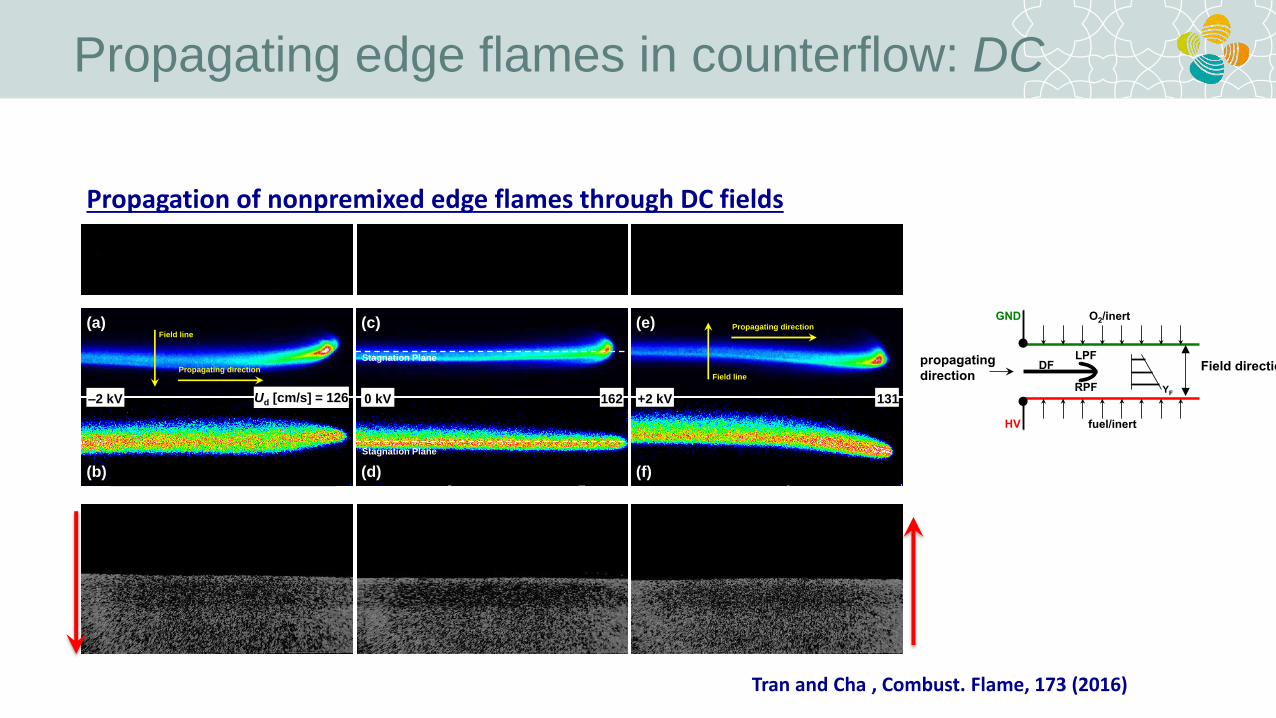
Propagating edge flames in counterflow: DC
Propagation of nonpremixed edge flames through DC fields
(c)
Stagnation Plane
162 kV
(d)
Stagnation Plane
(a)
Ud [cm/s] = 126–2 kV
Propagating direction
Field line
(b)
(e) Propagating direction
Field line
131+2 kV
(f)
Tran and Cha , Combust. Flame, 173 (2016)
fuel/inert
O2/inert
DF
RPF
LPF propagating
direction YF
GND
HV
Field direction
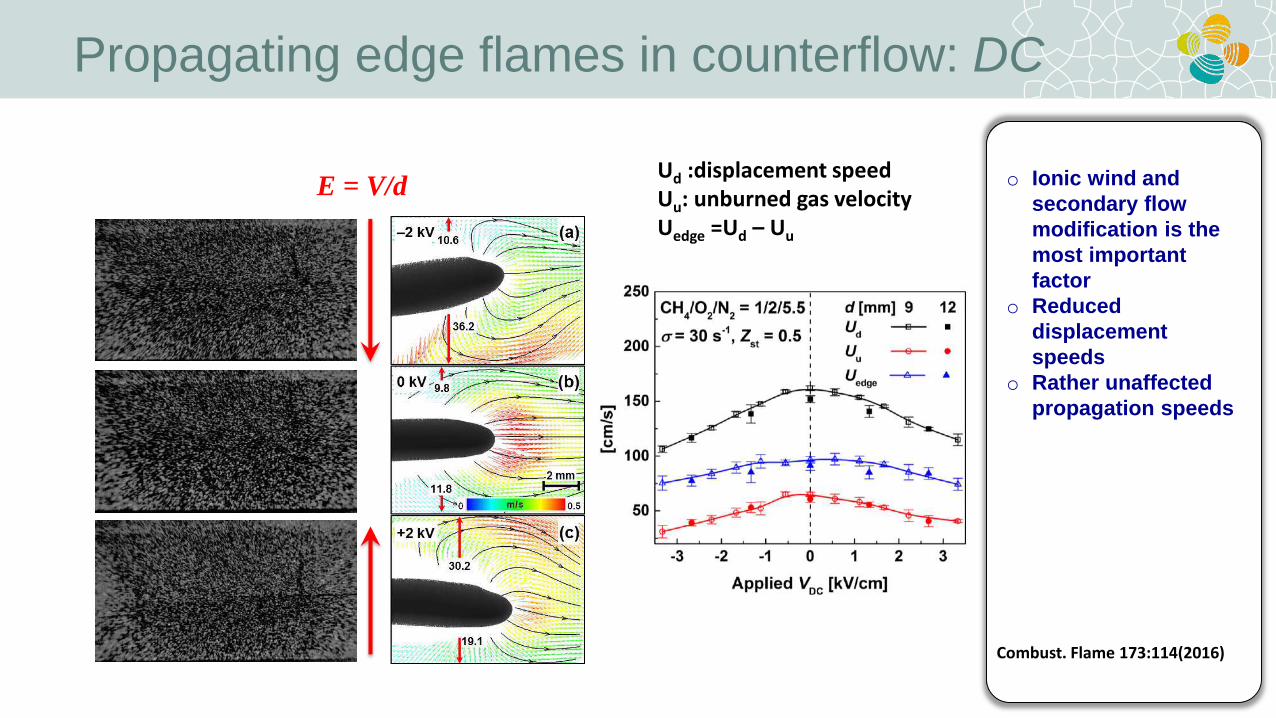
Propagating edge flames in counterflow: DC
o Ionic wind and
secondary flow
modification is the
most important
factor
o Reduced
displacement
speeds
o Rather unaffected
propagation speeds
Combust. Flame 173:114(2016)
E = V/dUd :displacement speedUu: unburned gas velocityUedge =Ud – Uu
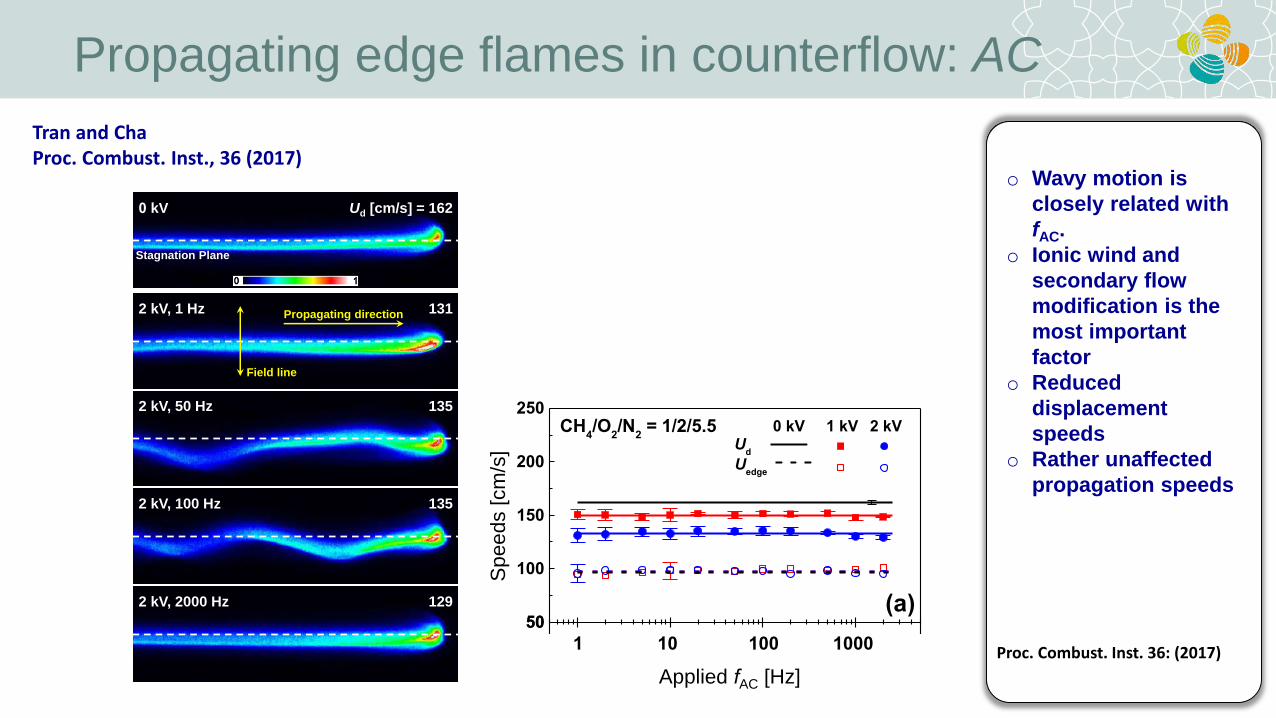
Propagating edge flames in counterflow: AC
o Wavy motion is
closely related with
fAC.
o Ionic wind and
secondary flow
modification is the
most important
factor
o Reduced
displacement
speeds
o Rather unaffected
propagation speeds
Proc. Combust. Inst. 36: (2017)
kV
Stagnation Plane
Ud [cm/s] = 162
2 kV, 50 Hz 135
2 kV, 100 Hz 135
2 kV, 2000 Hz 129
2 kV, 1 Hz 131Propagating direction
Field line
50
100
150
200
250
(a)
CH4/O
2/N
2 = 1/2/5.5
Uedge
Ud
0 kV 2 kV1 kV
50
100
150
200
250
(b)
C3H
8/O
2/N
2 = 1/5/14.3
[cm
/s]
1 10 100 100050
100
150
200
250
(c)CH4/O
2/CO
2 = 1/2/2.3
Applied fAC
[Hz]
Applied fAC [Hz]
Sp
ee
ds [
cm
/s]
1 10 100 1000
Tran and Cha Proc. Combust. Inst., 36 (2017)
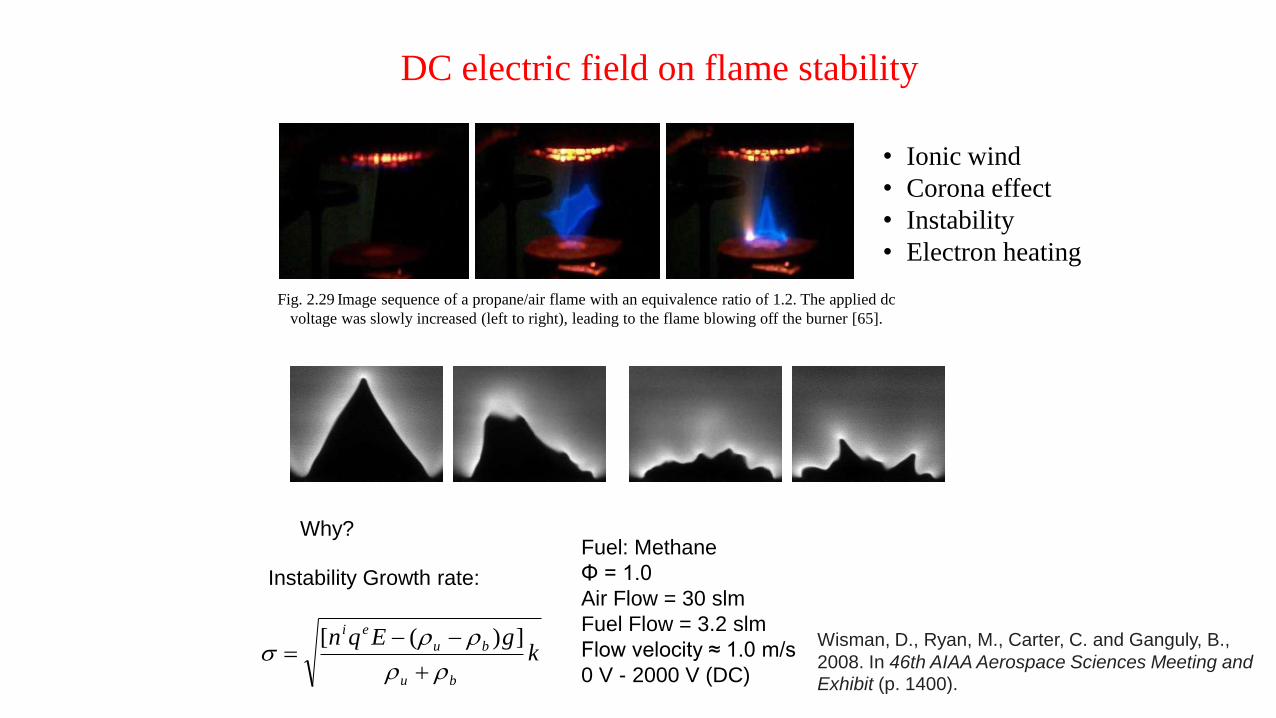
Fig. 2.29 Image sequence of a propane/air flame with an equivalence ratio of 1.2. The applied dc
voltage was slowly increased (left to right), leading to the flame blowing off the burner [65].
DC electric field on flame stability
• Ionic wind
• Corona effect
• Instability
• Electron heating
Fuel: Methane
Φ = 1.0
Air Flow = 30 slm
Fuel Flow = 3.2 slm
Flow velocity ≈ 1.0 m/s
0 V - 2000 V (DC)
Why?
kgEqn
bu
bu
ei
])([
Instability Growth rate:
Wisman, D., Ryan, M., Carter, C. and Ganguly, B.,
2008. In 46th AIAA Aerospace Sciences Meeting and
Exhibit (p. 1400).
Pri
nce
ton
Un
iver
sity
Combustion lab.
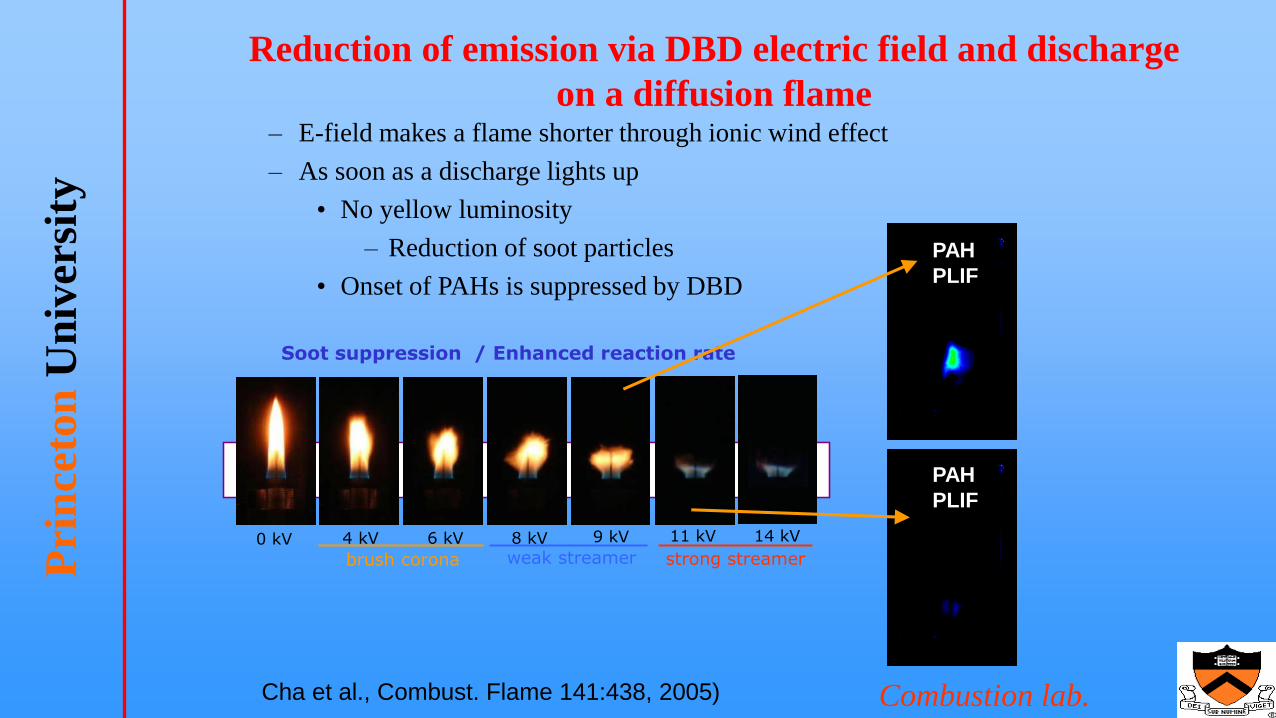
Reduction of emission via DBD electric field and discharge
on a diffusion flame – E-field makes a flame shorter through ionic wind effect
– As soon as a discharge lights up
• No yellow luminosity
– Reduction of soot particles
• Onset of PAHs is suppressed by DBD
0 kV 4 kV 6 kV 8 kV 9 kV 11 kV 14 kV
brush corona weak streamer strong streamer
Soot suppression / Enhanced reaction rate
PAH
PLIF
PAH
PLIF
Cha et al., Combust. Flame 141:438, 2005)
Pri
nce
ton
Un
iver
sity
Combustion lab.
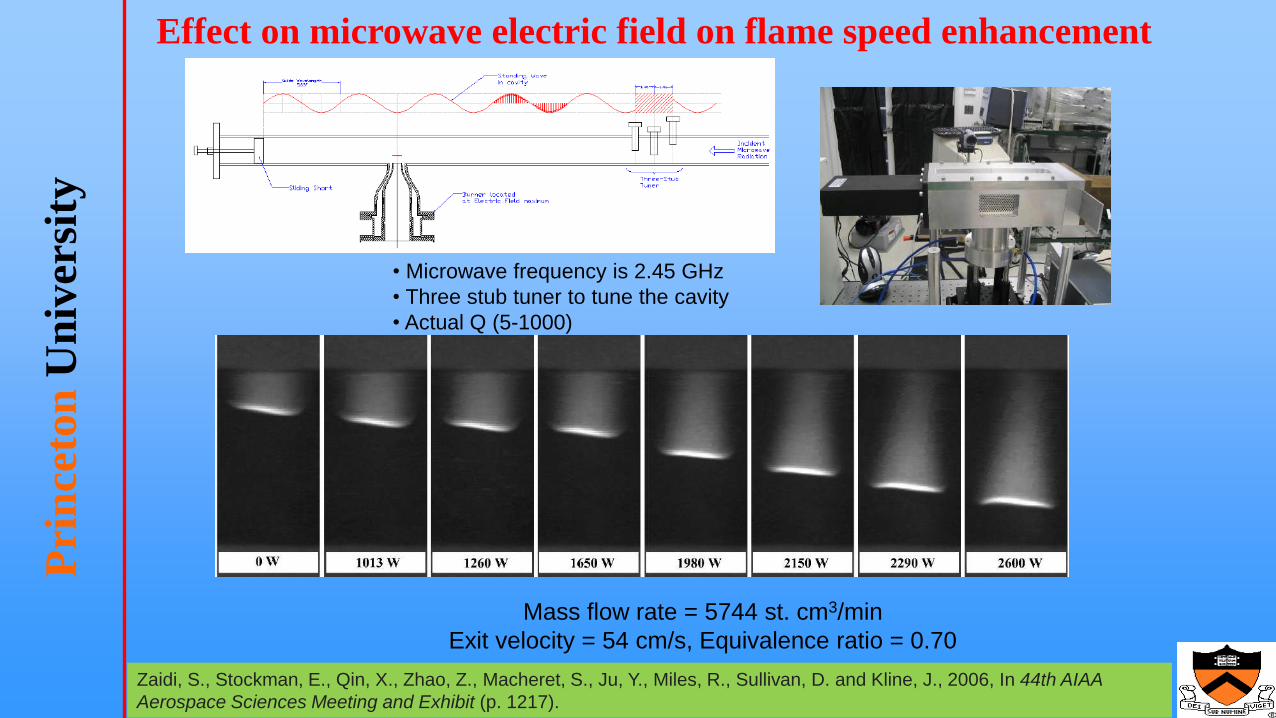
• Microwave frequency is 2.45 GHz
• Three stub tuner to tune the cavity
• Actual Q (5-1000)
Mass flow rate = 5744 st. cm3/min
Exit velocity = 54 cm/s, Equivalence ratio = 0.70
Effect on microwave electric field on flame speed enhancement
Zaidi, S., Stockman, E., Qin, X., Zhao, Z., Macheret, S., Ju, Y., Miles, R., Sullivan, D. and Kline, J., 2006, In 44th AIAA
Aerospace Sciences Meeting and Exhibit (p. 1217).
Pri
nce
ton
Un
iver
sity
Combustion lab.
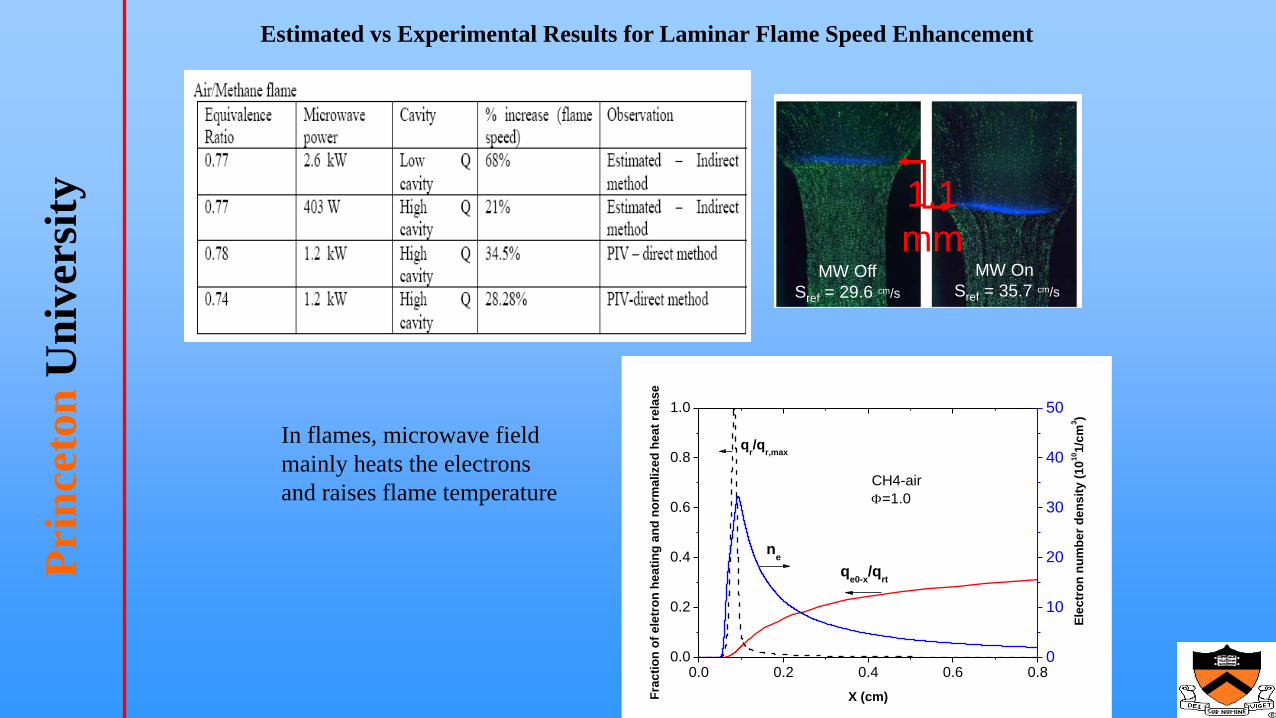
Estimated vs Experimental Results for Laminar Flame Speed Enhancement
0.0 0.2 0.4 0.6 0.80.0
0.2
0.4
0.6
0.8
1.0
qe0-x
/qrt
ne
Ele
ctr
on
nu
mb
er
de
ns
ity
(1
01
01
/cm
3)
X (cm)Fra
cti
on
of
ele
tro
n h
ea
tin
g a
nd
no
rma
lize
d h
ea
t re
las
e
qr/q
r,max
CH4-air
=1.0
0
10
20
30
40
50
MW Off
Sref = 29.6 cm/s
MW On
Sref = 35.7 cm/s
1.1
mm
In flames, microwave field
mainly heats the electrons
and raises flame temperature
Pri
nce
ton
Un
iver
sity
Combustion lab.
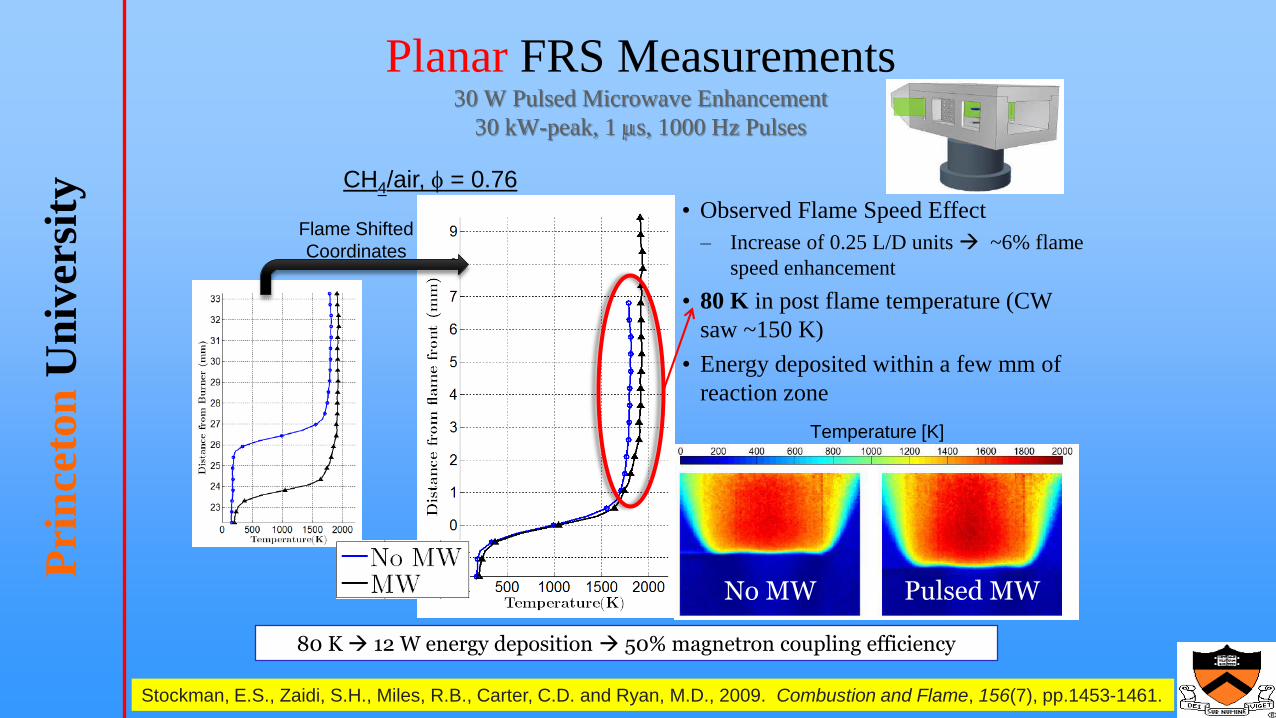
Planar FRS Measurements 30 W Pulsed Microwave Enhancement
30 kW-peak, 1 ms, 1000 Hz Pulses
17
No MW Pulsed MW
• Observed Flame Speed Effect
– Increase of 0.25 L/D units ~6% flame
speed enhancement
• 80 K in post flame temperature (CW
saw ~150 K)
• Energy deposited within a few mm of
reaction zone
Flame Shifted
Coordinates
CH4/air, f = 0.76
80 K 12 W energy deposition 50% magnetron coupling efficiency
Temperature [K]
Stockman, E.S., Zaidi, S.H., Miles, R.B., Carter, C.D. and Ryan, M.D., 2009. Combustion and Flame, 156(7), pp.1453-1461.
Pri
nce
ton
Un
iver
sity
Combustion lab.
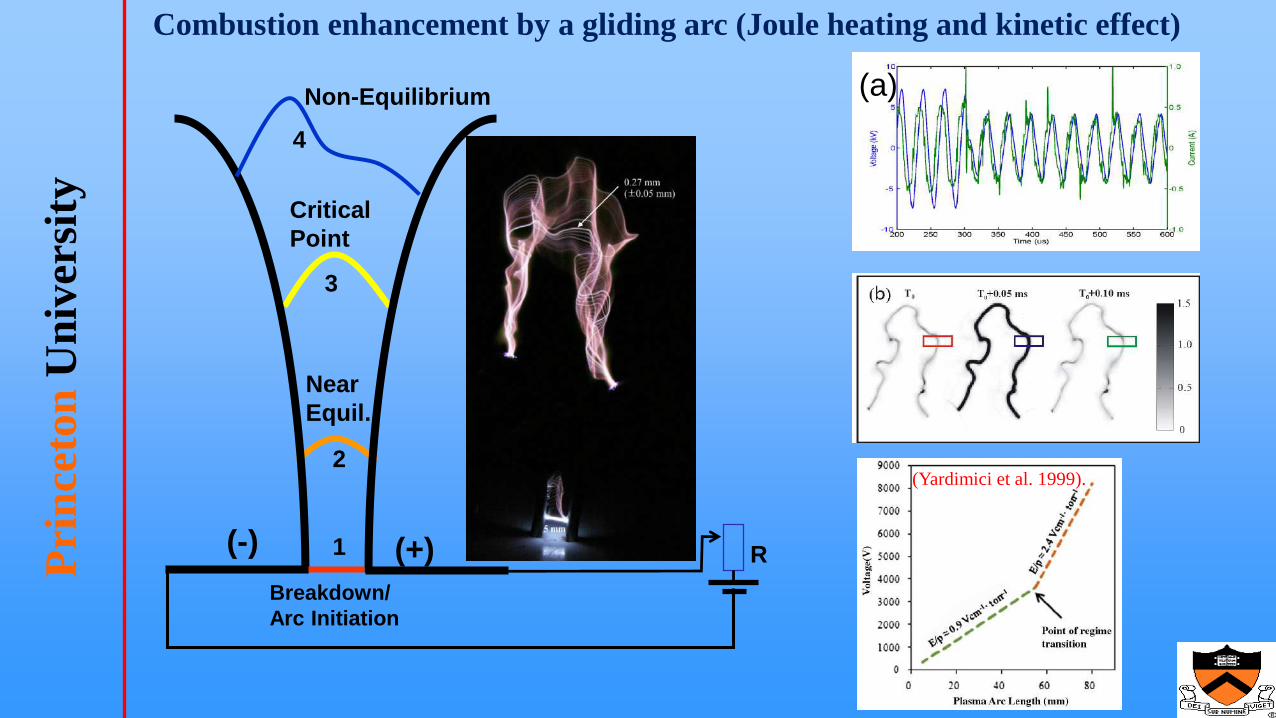
(-) (+)
Breakdown/
Arc Initiation
Non-Equilibrium
Critical
Point
Near
Equil.
R1
2
3
4
(a)
Combustion enhancement by a gliding arc (Joule heating and kinetic effect)
(Yardimici et al. 1999).
Pri
nce
ton
Un
iver
sity
Combustion lab.
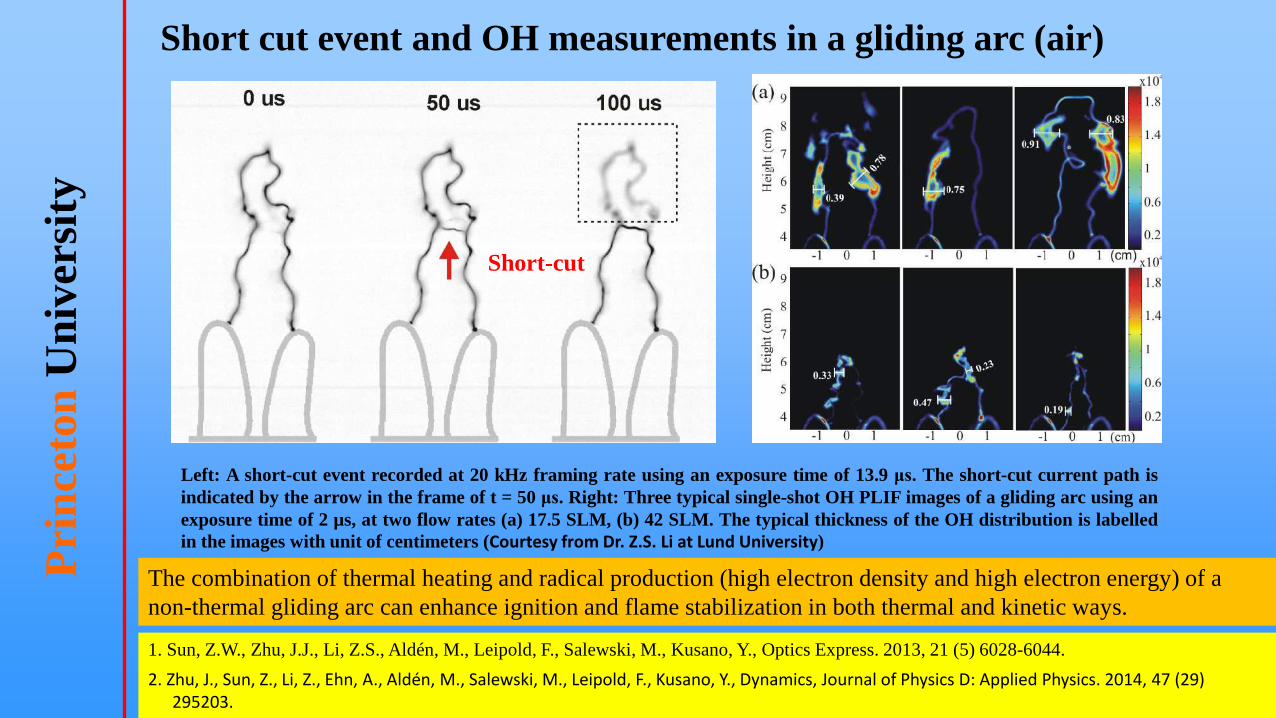
Short-cut
Left: A short-cut event recorded at 20 kHz framing rate using an exposure time of 13.9 μs. The short-cut current path is
indicated by the arrow in the frame of t = 50 μs. Right: Three typical single-shot OH PLIF images of a gliding arc using an
exposure time of 2 µs, at two flow rates (a) 17.5 SLM, (b) 42 SLM. The typical thickness of the OH distribution is labelled
in the images with unit of centimeters (Courtesy from Dr. Z.S. Li at Lund University)
1. Sun, Z.W., Zhu, J.J., Li, Z.S., Aldén, M., Leipold, F., Salewski, M., Kusano, Y., Optics Express. 2013, 21 (5) 6028-6044.
2. Zhu, J., Sun, Z., Li, Z., Ehn, A., Aldén, M., Salewski, M., Leipold, F., Kusano, Y., Dynamics, Journal of Physics D: Applied Physics. 2014, 47 (29) 295203.
Short cut event and OH measurements in a gliding arc (air)
The combination of thermal heating and radical production (high electron density and high electron energy) of a
non-thermal gliding arc can enhance ignition and flame stabilization in both thermal and kinetic ways.
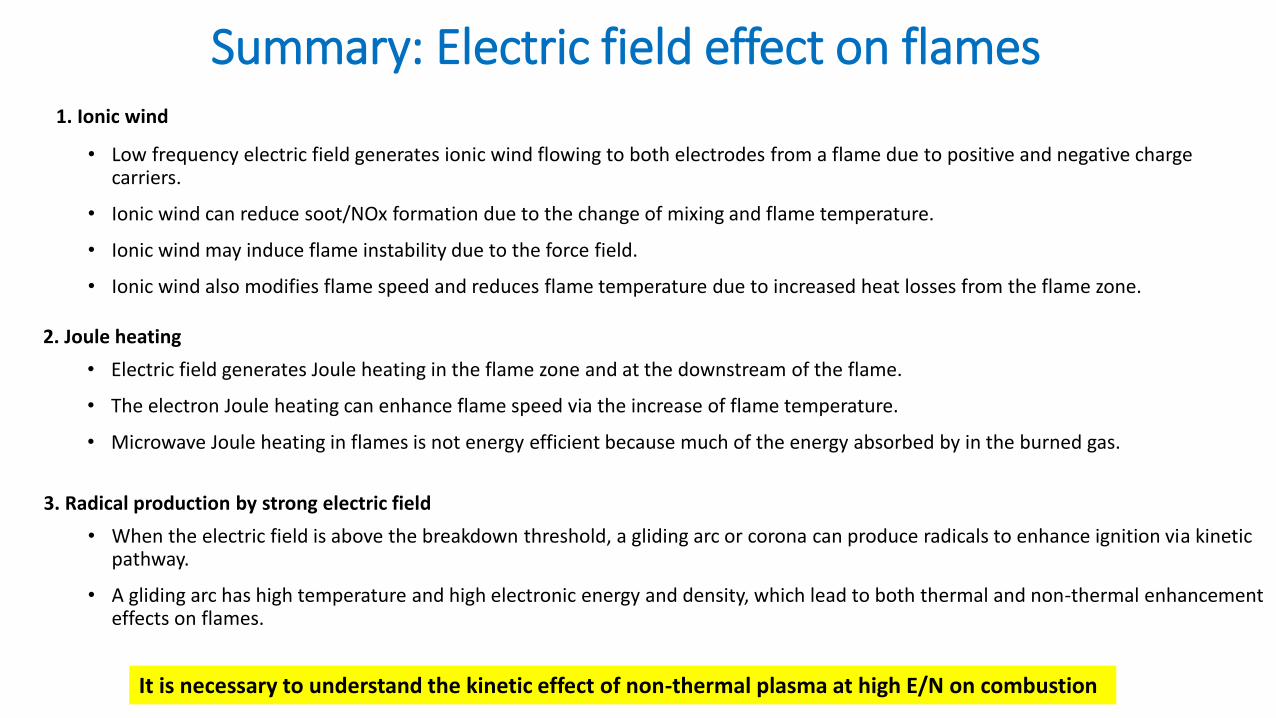
• Low frequency electric field generates ionic wind flowing to both electrodes from a flame due to positive and negative charge carriers.
• Ionic wind can reduce soot/NOx formation due to the change of mixing and flame temperature.
• Ionic wind may induce flame instability due to the force field.
• Ionic wind also modifies flame speed and reduces flame temperature due to increased heat losses from the flame zone.
Summary: Electric field effect on flames1. Ionic wind
2. Joule heating
• Electric field generates Joule heating in the flame zone and at the downstream of the flame.
• The electron Joule heating can enhance flame speed via the increase of flame temperature.
• Microwave Joule heating in flames is not energy efficient because much of the energy absorbed by in the burned gas.
3. Radical production by strong electric field
• When the electric field is above the breakdown threshold, a gliding arc or corona can produce radicals to enhance ignition via kinetic pathway.
• A gliding arc has high temperature and high electronic energy and density, which lead to both thermal and non-thermal enhancement effects on flames.
It is necessary to understand the kinetic effect of non-thermal plasma at high E/N on combustion
Lecture 5 Chemistry and Kinetic Studies of Plasma-Assisted Combustion
Yiguang Ju, Princeton University
• Important chain-initiation and branching reactions in combustion• Electron impact reactions• Electronically excited species (radical production and fast heating)• Vibrationally excited species (slow heating)• O3/NOx
• Plasma chemistry and timescales• Impact of plasma chemistry on combustion
Princeton Combustion Summer School2021.6.21
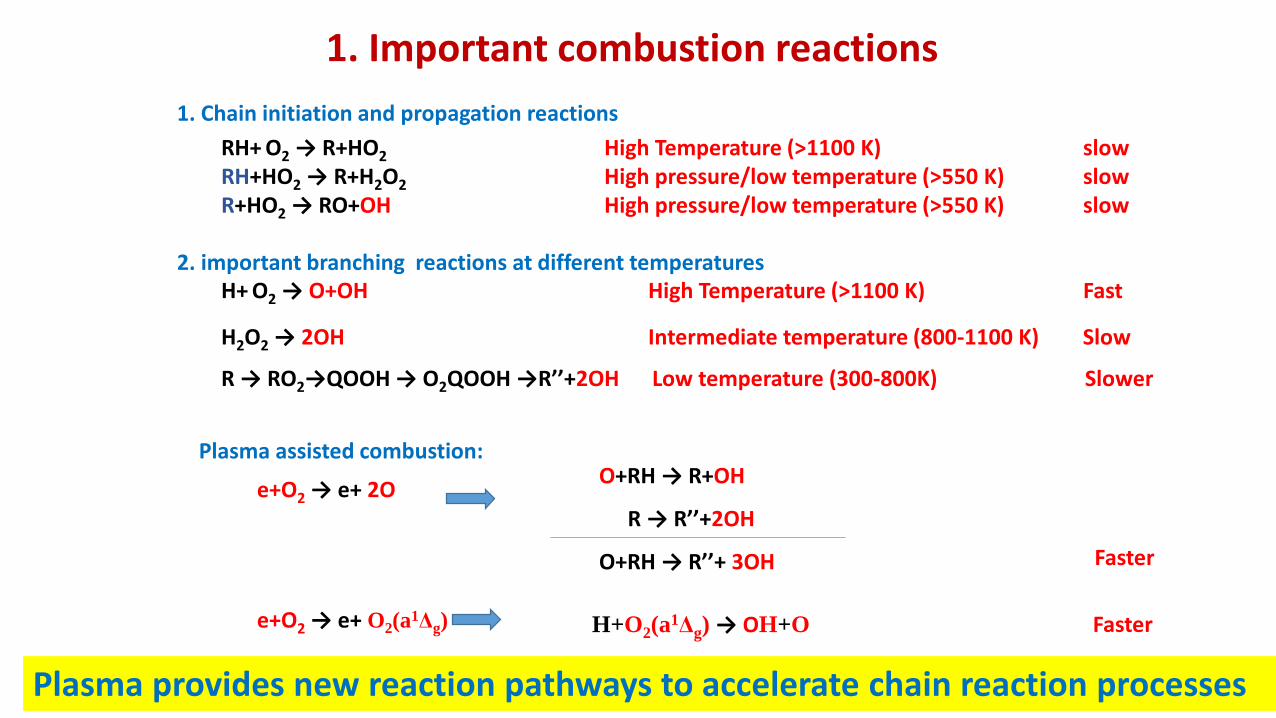
1. Important combustion reactions
O+RH → R+OH
R → R’’+2OH
O+RH → R’’+ 3OH
Plasma assisted combustion:
e+O2 → e+ 2O
Plasma provides new reaction pathways to accelerate chain reaction processes
RH+ O2 → R+HO2 High Temperature (>1100 K) slowRH+HO2 → R+H2O2 High pressure/low temperature (>550 K) slowR+HO2 → RO+OH High pressure/low temperature (>550 K) slow
1. Chain initiation and propagation reactions
R → RO2→QOOH → O2QOOH →R’’+2OH Low temperature (300-800K) Slower
H2O2 → 2OH Intermediate temperature (800-1100 K) Slow
H+ O2 → O+OH High Temperature (>1100 K) Fast2. important branching reactions at different temperatures
e+O2 → e+ O2(a1Δg) H+O2(a
1Δg) → OH+O Faster
Faster
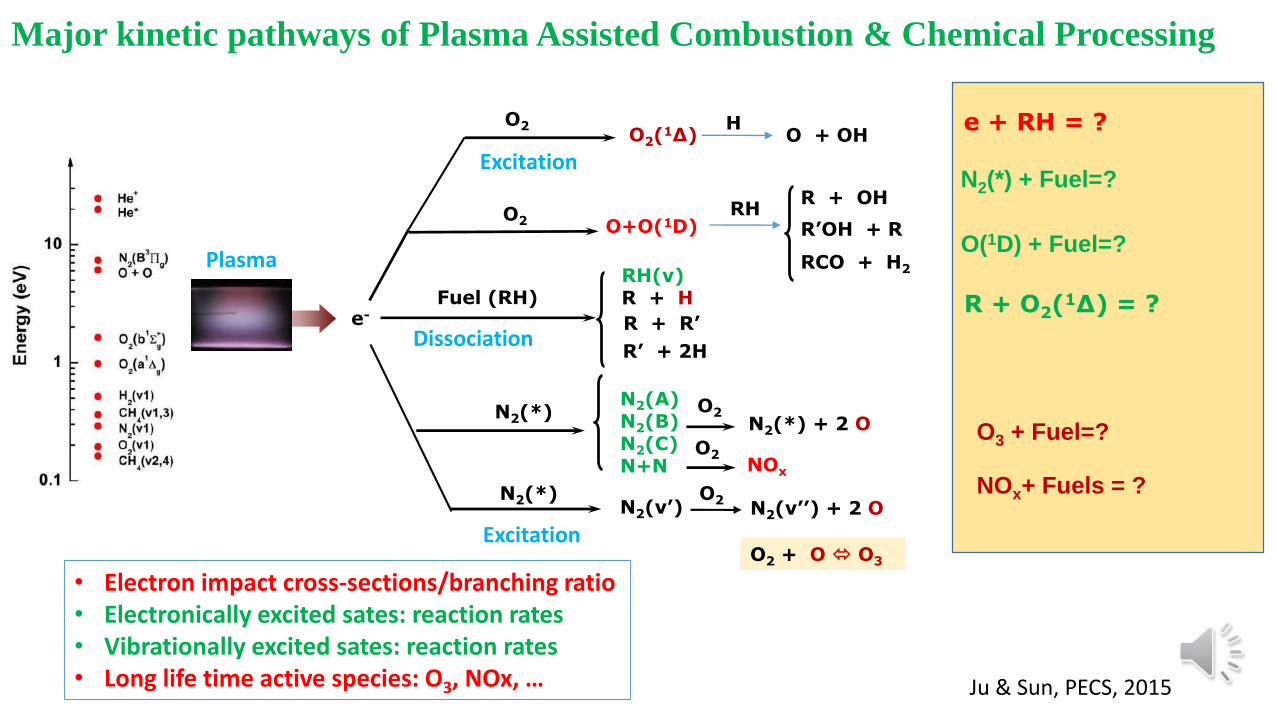
Major kinetic pathways of Plasma Assisted Combustion & Chemical Processing
e-
N2(A)N2(B)N2(C)N+N
O2N2(*)N2(*) + 2 O
O2 O+O(1D)
Fuel (RH)RH(v)R + H
R + R’
R’ + 2H
Hot flame
Cool flame
N-heptane/He
O2/He
O2 HO2(
1Δ) O + OH
N2(*)N2(v’)
O2N2(v’’) + 2 O
RHR + OH
RCO + H2
R’OH + R
O2 + O O3
R + O2(1Δ) = ?
N2(*) + Fuel=?
O3 + Fuel=?
O(1D) + Fuel=?Plasma
Excitation
Dissociation
Excitation
Ju & Sun, PECS, 2015
• Electron impact cross-sections/branching ratio• Electronically excited sates: reaction rates• Vibrationally excited sates: reaction rates• Long life time active species: O3, NOx, …
NOx+ Fuels = ?
O2NOx
e + RH = ?
4
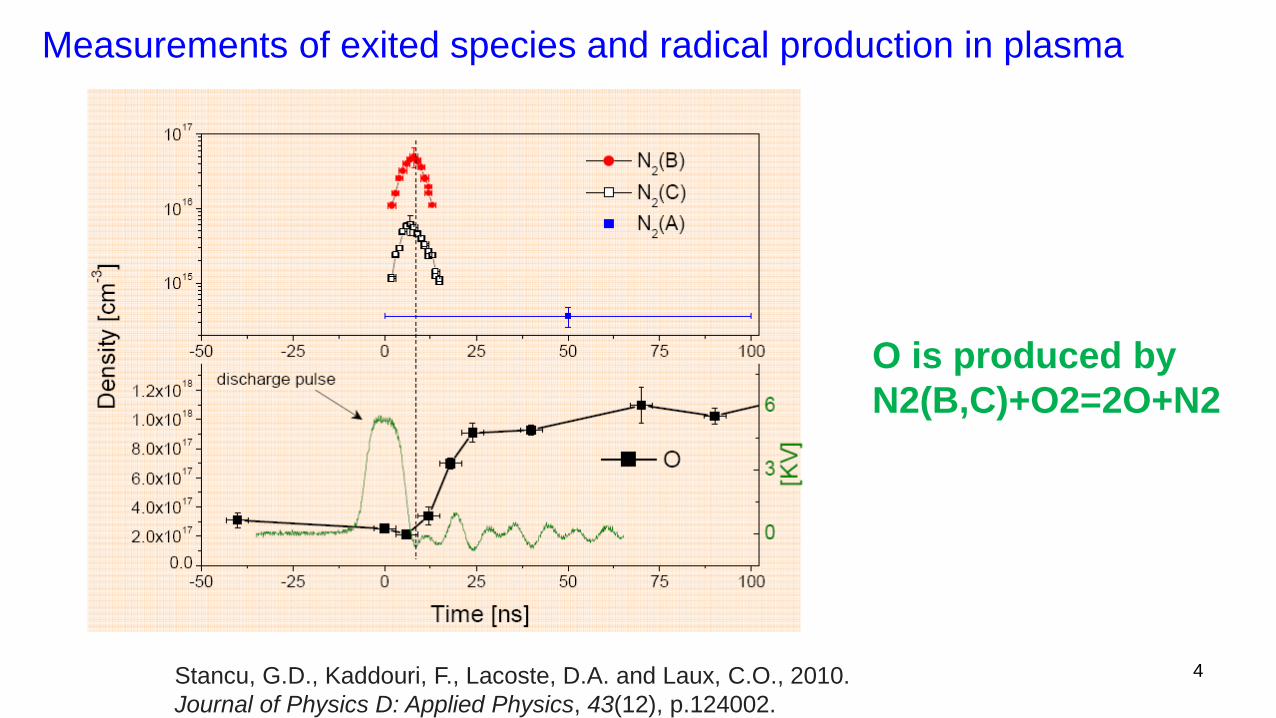
Measurements of exited species and radical production in plasma
O is produced by
N2(B,C)+O2=2O+N2
Stancu, G.D., Kaddouri, F., Lacoste, D.A. and Laux, C.O., 2010.
Journal of Physics D: Applied Physics, 43(12), p.124002.
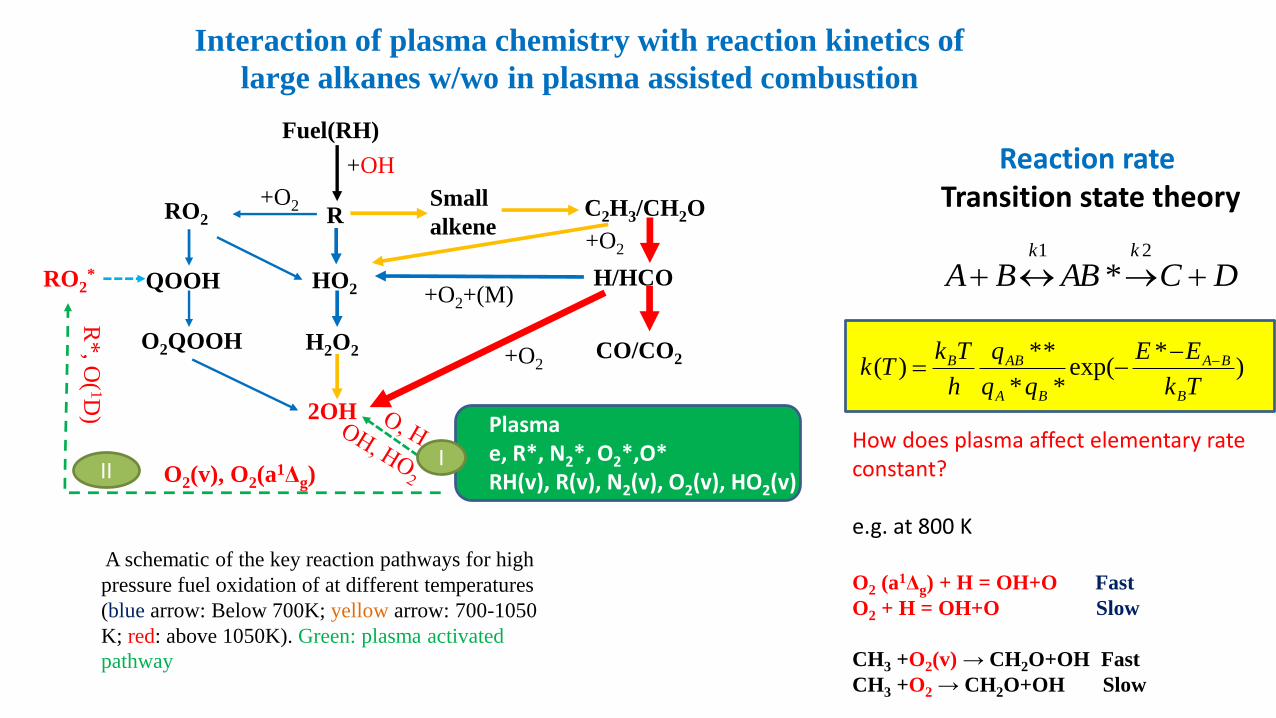
A schematic of the key reaction pathways for high
pressure fuel oxidation of at different temperatures
(blue arrow: Below 700K; yellow arrow: 700-1050
K; red: above 1050K). Green: plasma activated
pathway
Fuel(RH)
+OH
R+O2RO2
QOOH
O2QOOH
HO2
H2O2
2OH
Small
alkeneC2H3/CH2O
H/HCO+O2+(M)
Plasmae, R*, N2*, O2*,O*RH(v), R(v), N2(v), O2(v), HO2(v)
+O2
+O2
CO/CO2
R*, O
(1D
)
O2(v), O2(a1Δg)
RO2*
III
Interaction of plasma chemistry with reaction kinetics of
large alkanes w/wo in plasma assisted combustion
Reaction rate Transition state theory
DCABBAkk
21
*
)*
exp(**
**)(
Tk
EE
q
h
TkTk
B
BA
BA
ABB
How does plasma affect elementary rate constant?
e.g. at 800 K
O2 (a1Δg) + H = OH+O Fast
O2 + H = OH+O Slow
CH3 +O2(v) → CH2O+OH Fast
CH3 +O2 → CH2O+OH Slow
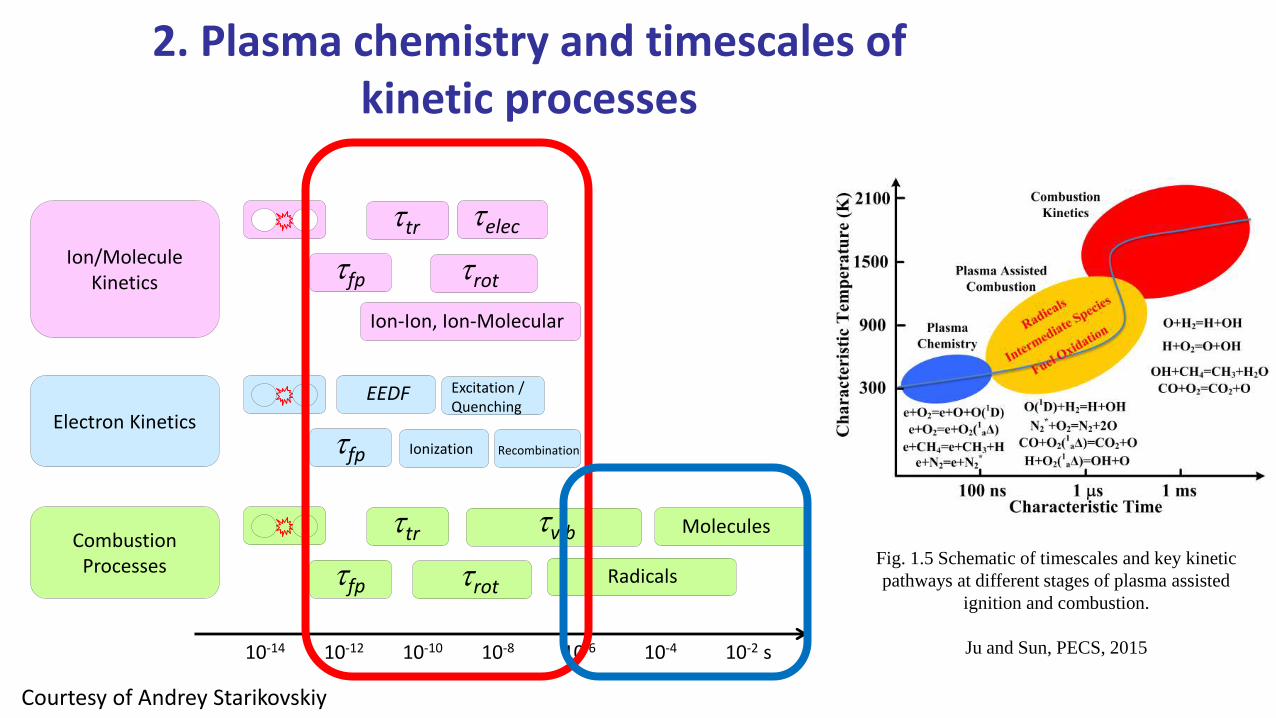
2. Plasma chemistry and timescales of kinetic processes
Electron Kineticstfp
EEDF
Ionization
Excitation / Quenching
Ion/Molecule Kinetics
tfp
ttr
trot
telec
Recombination
Combustion Processes tfp
ttr
trot
tvib
Ion-Ion, Ion-Molecular
Radicals
Molecules
10-14 10-12 10-10 10-8 10-6 10-4 10-2 s
Courtesy of Andrey Starikovskiy
Fig. 1.5 Schematic of timescales and key kinetic
pathways at different stages of plasma assisted
ignition and combustion.
Ju and Sun, PECS, 2015
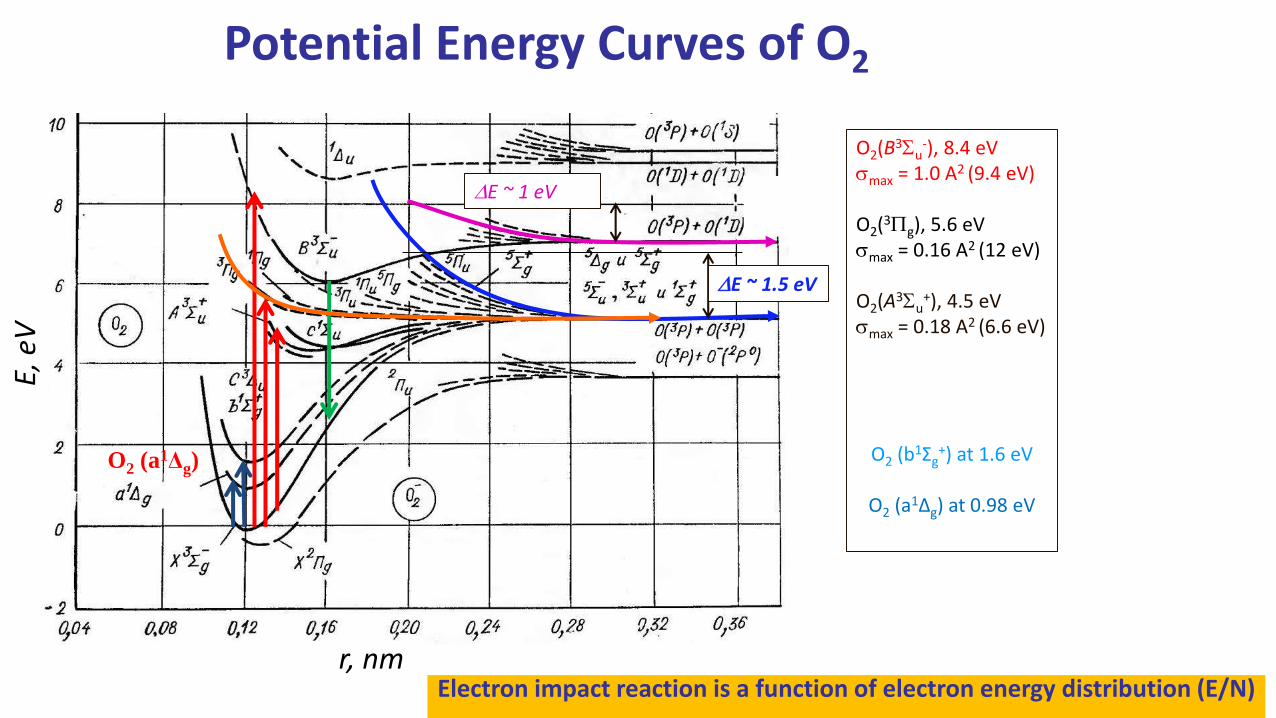
Potential Energy Curves of O2
O2(B3Su-), 8.4 eV
smax = 1.0 A2 (9.4 eV)
O2(3Pg), 5.6 eVsmax = 0.16 A2 (12 eV)
O2(A3Su+), 4.5 eV
smax = 0.18 A2 (6.6 eV)
O2 (b1Σg+) at 1.6 eV
O2 (a1Δg) at 0.98 eV
r, nm
E, e
V
DE ~ 1.5 eV
DE ~ 1 eV
O2 (a1Δg)
Electron impact reaction is a function of electron energy distribution (E/N)
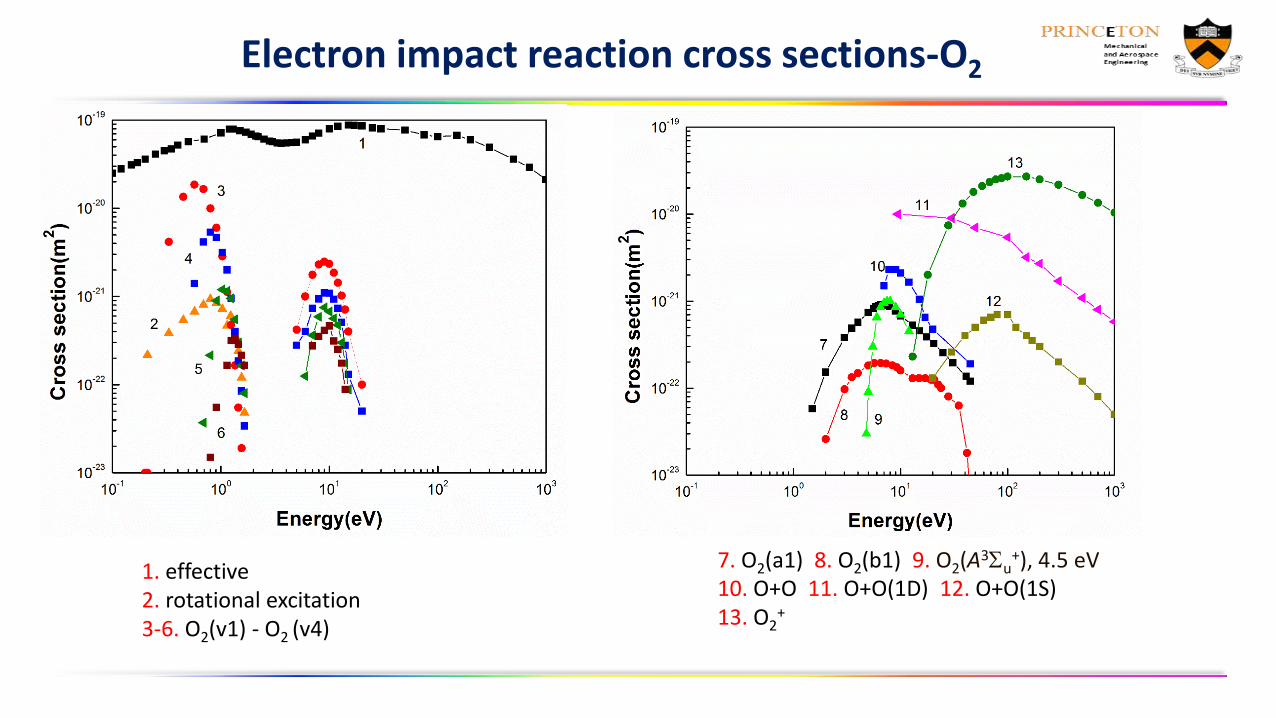
Electron impact reaction cross sections-O2
1. effective 2. rotational excitation3-6. O2(v1) - O2 (v4)
7. O2(a1) 8. O2(b1) 9. O2(A3Su+), 4.5 eV
10. O+O 11. O+O(1D) 12. O+O(1S)13. O2
+
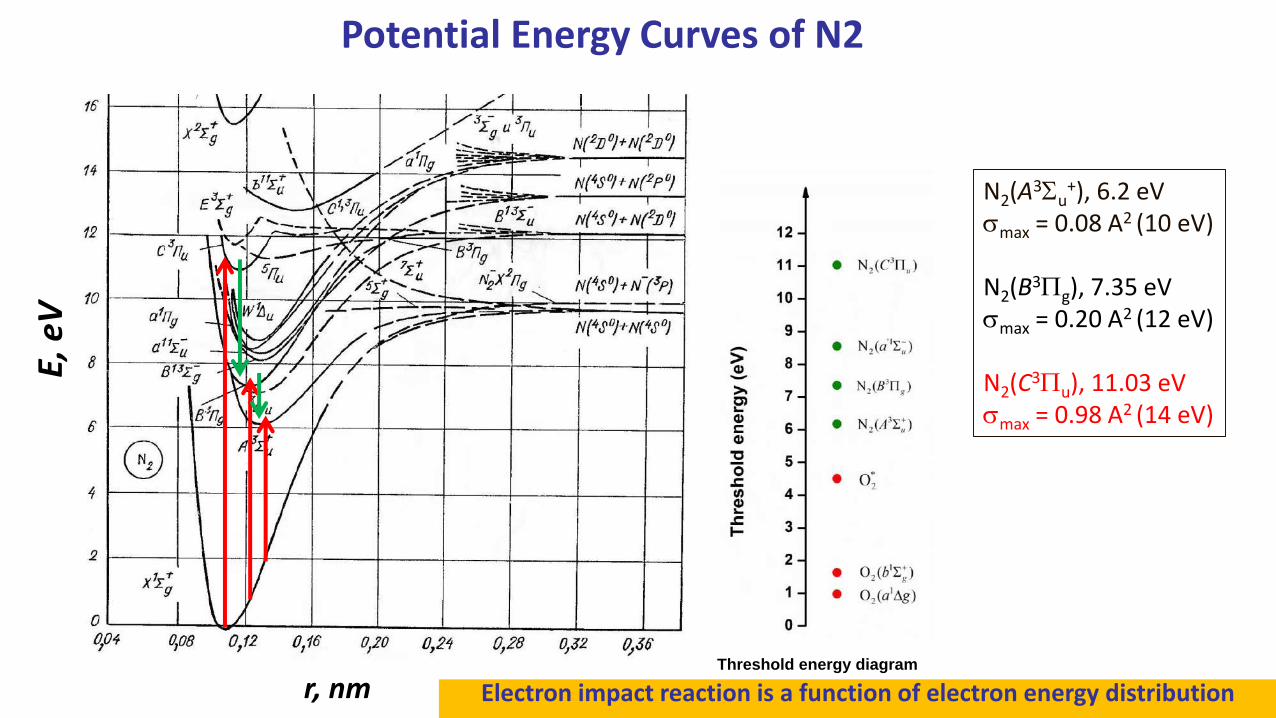
Potential Energy Curves of N2
N2(A3Su+), 6.2 eV
smax = 0.08 A2 (10 eV)
N2(B3Pg), 7.35 eVsmax = 0.20 A2 (12 eV)
N2(C3Pu), 11.03 eVsmax = 0.98 A2 (14 eV)
r, nm
E, e
V
Threshold energy diagram
Electron impact reaction is a function of electron energy distribution
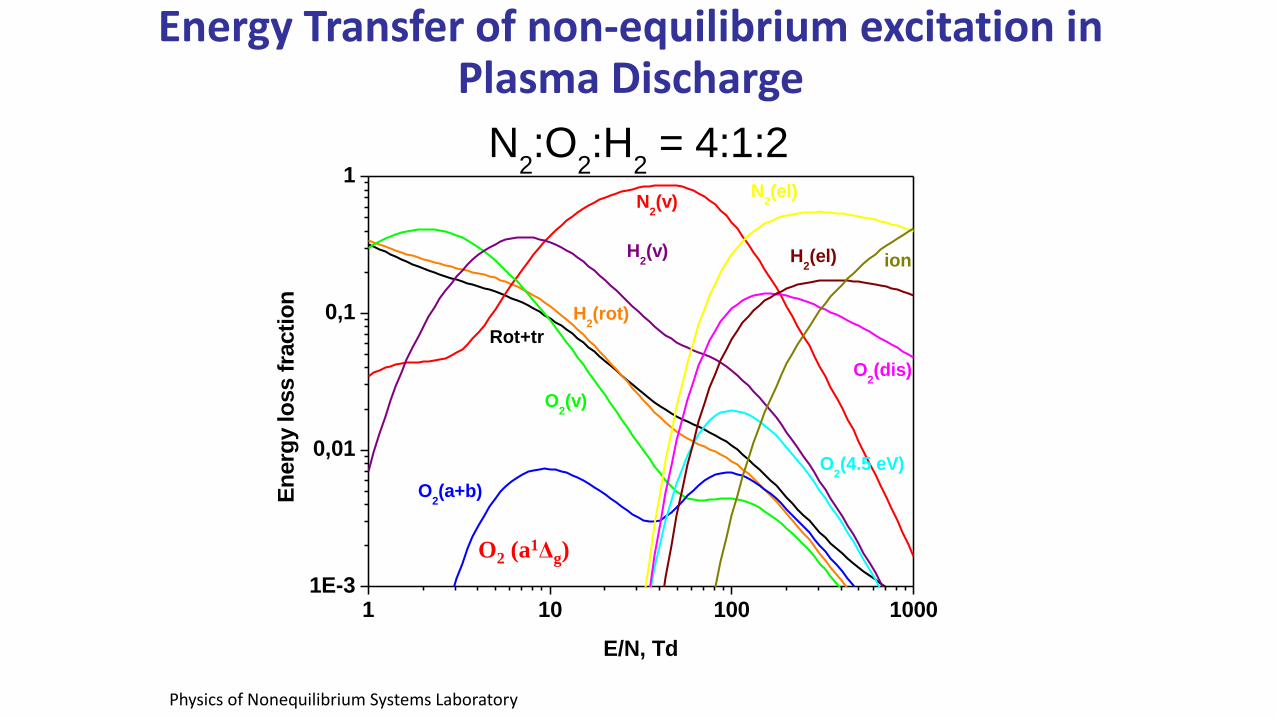
Energy Transfer of non-equilibrium excitation in Plasma Discharge
1 10 100 10001E-3
0,01
0,1
1
H2(rot)
O2(4.5 eV)
O2(dis)
H2(el)
Rot+tr
O2(a+b)
O2(v)
H2(v)
ion
N2(el)
N2(v)
N2:O
2:H
2 = 4:1:2
En
erg
y lo
ss f
racti
on
E/N, Td
Physics of Nonequilibrium Systems Laboratory
O2 (a1Δg)
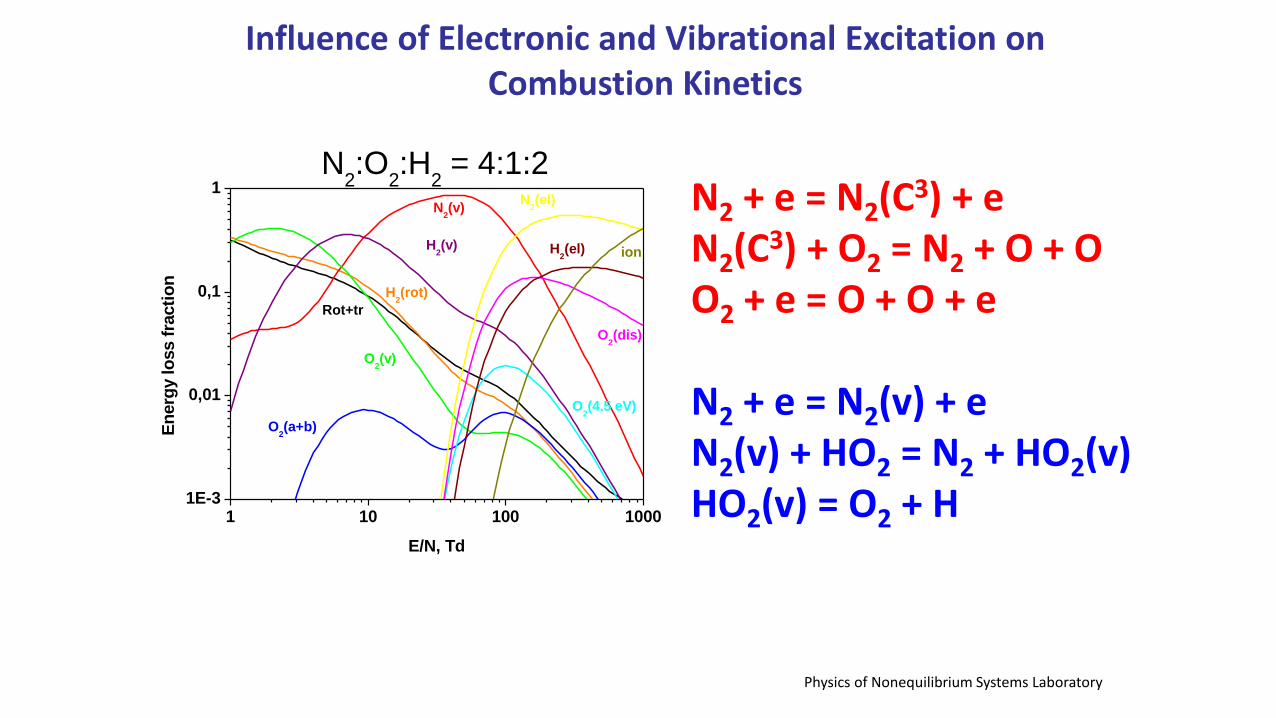
Influence of Electronic and Vibrational Excitation on Combustion Kinetics
N2 + e = N2(C3) + eN2(C3) + O2 = N2 + O + OO2 + e = O + O + e
N2 + e = N2(v) + eN2(v) + HO2 = N2 + HO2(v)HO2(v) = O2 + H1 10 100 1000
1E-3
0,01
0,1
1
H2(rot)
O2(4.5 eV)
O2(dis)
H2(el)
Rot+tr
O2(a+b)
O2(v)
H2(v)
ion
N2(el)
N2(v)
N2:O
2:H
2 = 4:1:2
En
erg
y lo
ss f
racti
on
E/N, Td
Physics of Nonequilibrium Systems Laboratory
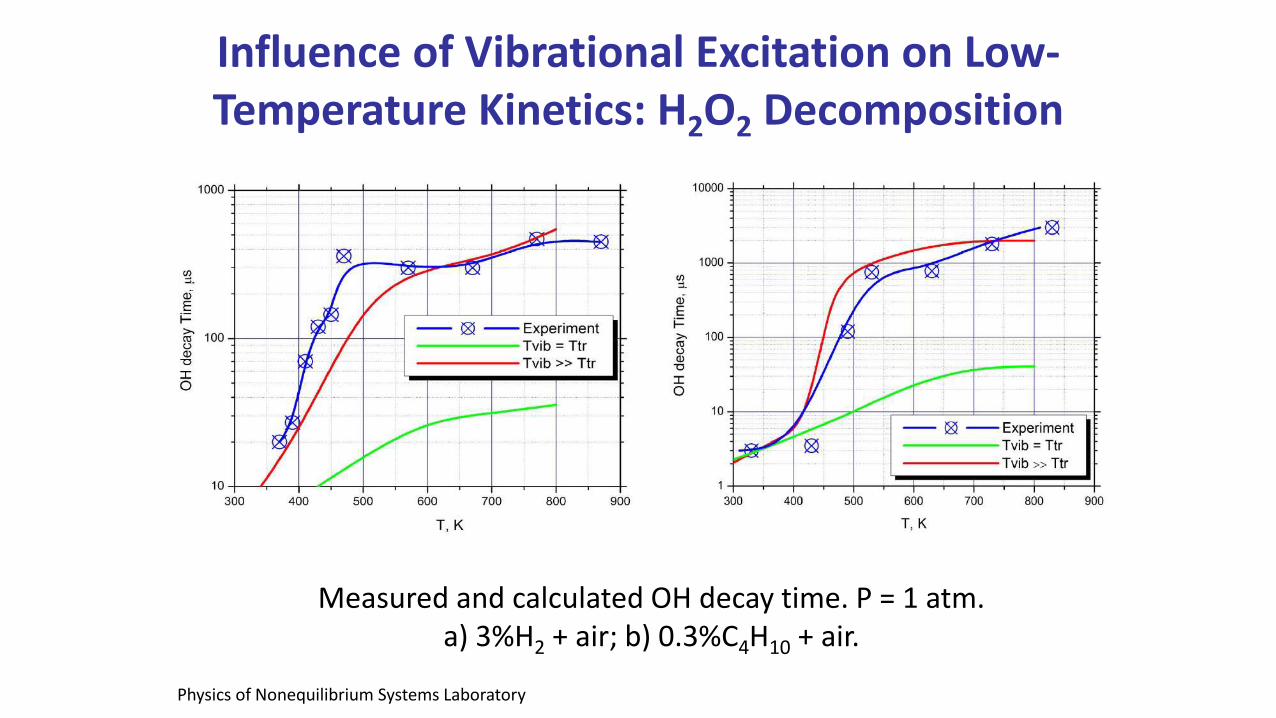
Influence of Vibrational Excitation on Low-Temperature Kinetics: H2O2 Decomposition
Measured and calculated OH decay time. P = 1 atm. a) 3%H2 + air; b) 0.3%C4H10 + air.
Physics of Nonequilibrium Systems Laboratory
Effect of “Hot” Atoms on Active Species Production in High-Voltage Pulsed Discharges
0,1 1
1
10
Cro
ss s
ecti
on
, 10
-16 c
m2
E, eV
[15]
[33]
[23]
This work
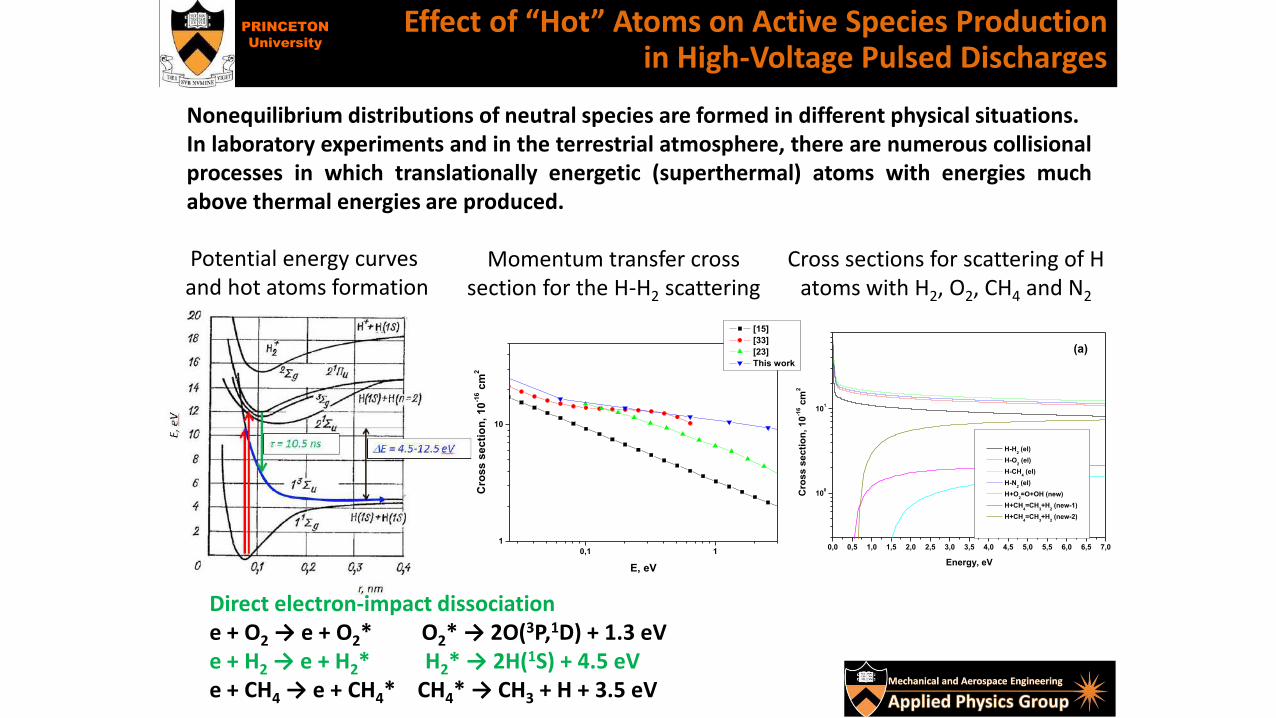
Potential energy curves and hot atoms formation
Momentum transfer cross section for the H-H2 scattering
Cross sections for scattering of H atoms with H2, O2, CH4 and N2
0,0 0,5 1,0 1,5 2,0 2,5 3,0 3,5 4,0 4,5 5,0 5,5 6,0 6,5 7,0
100
101
Cro
ss
se
cti
on
, 1
0-1
6 c
m2
Energy, eV
H-H2 (el)
H-O2 (el)
H-CH4 (el)
H-N2 (el)
H+O2=O+OH (new)
H+CH4=CH
3+H
2 (new-1)
H+CH4=CH
3+H
2 (new-2)
(a)
PRINCETON
University
Nonequilibrium distributions of neutral species are formed in different physical situations.In laboratory experiments and in the terrestrial atmosphere, there are numerous collisionalprocesses in which translationally energetic (superthermal) atoms with energies muchabove thermal energies are produced.
Direct electron-impact dissociatione + O2 → e + O2* O2* → 2O(3P,1D) + 1.3 eVe + H2 → e + H2* H2* → 2H(1S) + 4.5 eVe + CH4 → e + CH4* CH4* → CH3 + H + 3.5 eV
Effect of “Hot” Atoms on Active Species Production in High-Voltage Pulsed Discharges
0 10 20 30 40 50
10-1
100
CH4:O
2=1:2
CH4:O
2:N
2=1:2:8
H2:O
2=1:9
H2:O
2=2:1
En
erg
y, e
V
Number of collisions
(a)
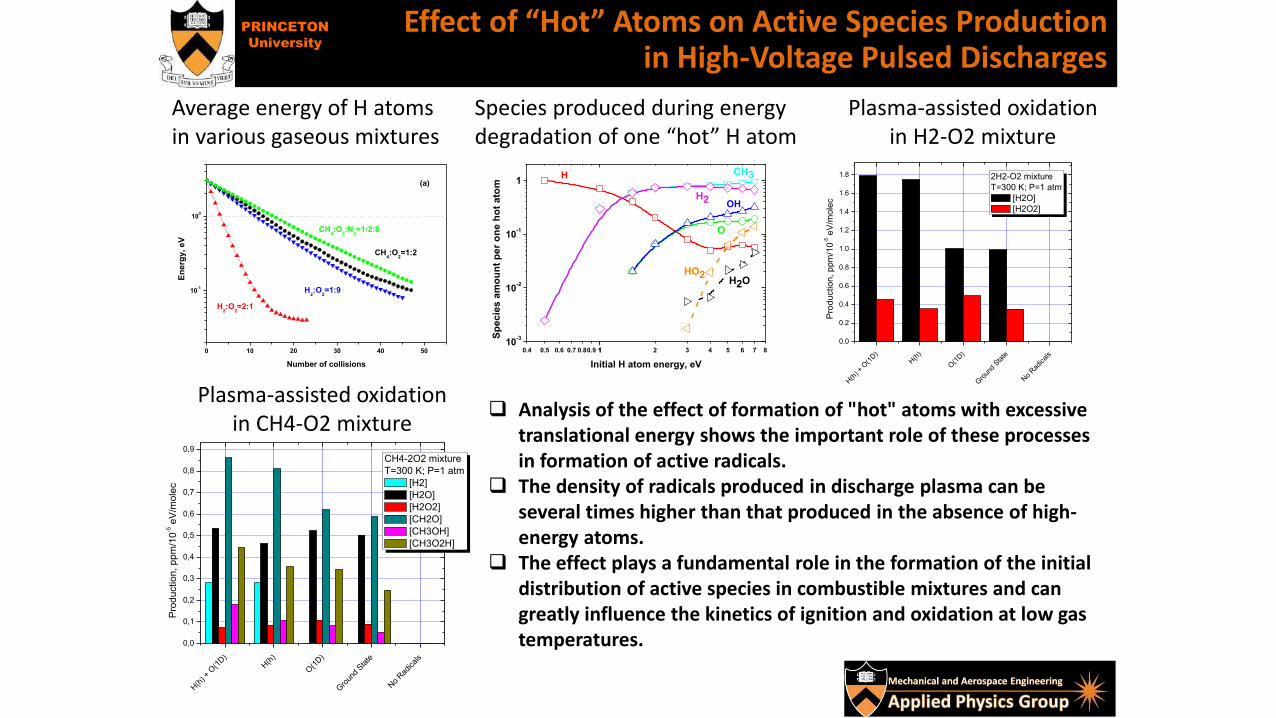
Average energy of H atoms in various gaseous mixtures
PRINCETON
University
0.4 0.5 0.6 0.7 0.80.9 11 2 3 4 5 6 7 810
-3
10-2
10-1
1
Sp
ecie
s a
mo
un
t p
er
on
e h
ot
ato
m
Initial H atom energy, eV
H CH3
H2 OH
O
HO2H2O
H(h
) + O
(1D)
H(h
)
O(1
D)
Gro
und
Sta
te
No
Rad
icals
0,0
0,1
0,2
0,3
0,4
0,5
0,6
0,7
0,8
0,9
Pro
du
ctio
n, p
pm
/10
-5 e
V/m
ole
c
CH4-2O2 mixture
T=300 K; P=1 atm
[H2]
[H2O]
[H2O2]
[CH2O]
[CH3OH]
[CH3O2H]
H(h
) + O
(1D)
H(h
)
O(1
D)
Gro
und
Sta
te
No
Rad
icals
0.0
0.2
0.4
0.6
0.8
1.0
1.2
1.4
1.6
1.8
Pro
du
ctio
n, p
pm
/10
-5 e
V/m
ole
c
2H2-O2 mixture
T=300 K; P=1 atm
[H2O]
[H2O2]
Analysis of the effect of formation of "hot" atoms with excessive translational energy shows the important role of these processes in formation of active radicals.
The density of radicals produced in discharge plasma can be several times higher than that produced in the absence of high-energy atoms.
The effect plays a fundamental role in the formation of the initial distribution of active species in combustible mixtures and can greatly influence the kinetics of ignition and oxidation at low gas temperatures.
Species produced during energy degradation of one “hot” H atom
Plasma-assisted oxidationin H2-O2 mixture
Plasma-assisted oxidationin CH4-O2 mixture
Fast Gas Heating
Slow Gas Heating
Electron-ion recombination
Ion-ion recombination
Collisional energy transfer Electronically-excited species
Hot atom and molecule
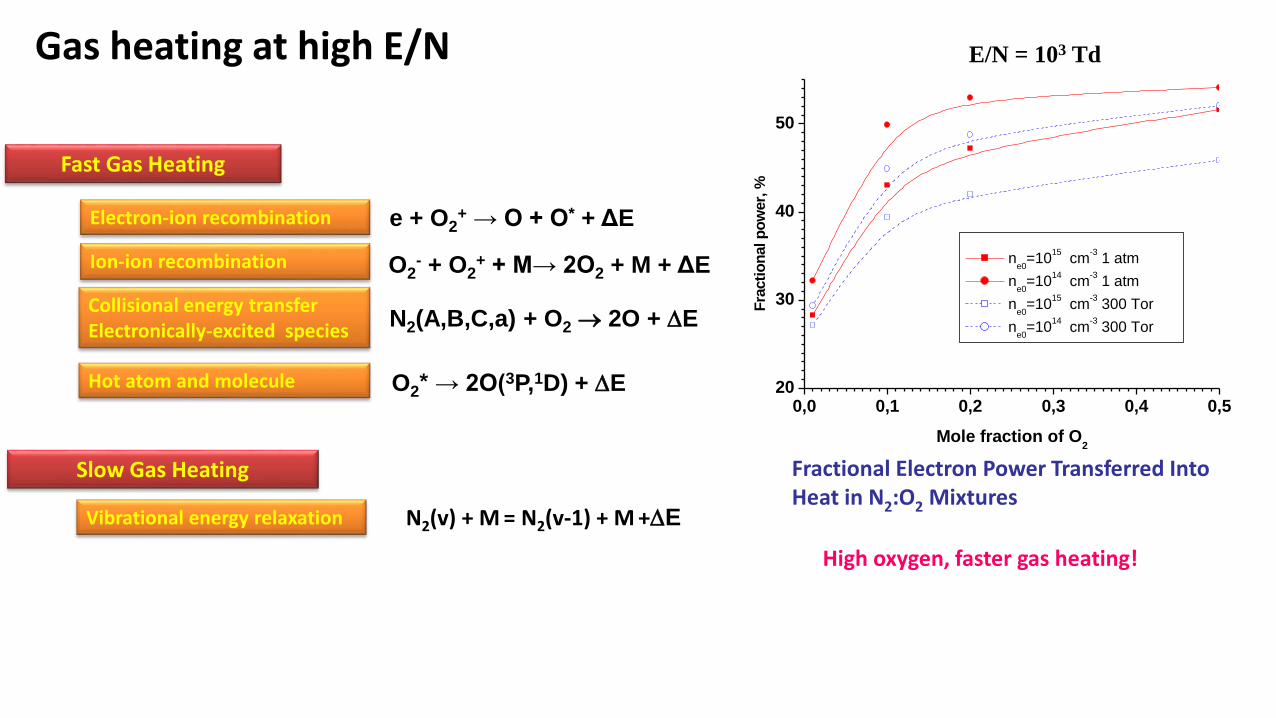
e + O2+ → O + O* + ΔE
N2(A,B,C,a) + O2 2O + DE
O2* → 2O(3P,1D) + DE
O2- + O2
+ + M→ 2O2 + M + ΔE
Vibrational energy relaxation N2(v) + M = N2(v-1) + M +DE
0,0 0,1 0,2 0,3 0,4 0,520
30
40
50
ne0
=1015
cm-3 1 atm
ne0
=1014
cm-3 1 atm
ne0
=1015
cm-3 300 Tor
ne0
=1014
cm-3 300 Tor
Fra
cti
on
al p
ow
er,
%
Mole fraction of O2
E/N = 103 Td
Fractional Electron Power Transferred Into Heat in N2:O2 Mixtures
High oxygen, faster gas heating!
Gas heating at high E/N
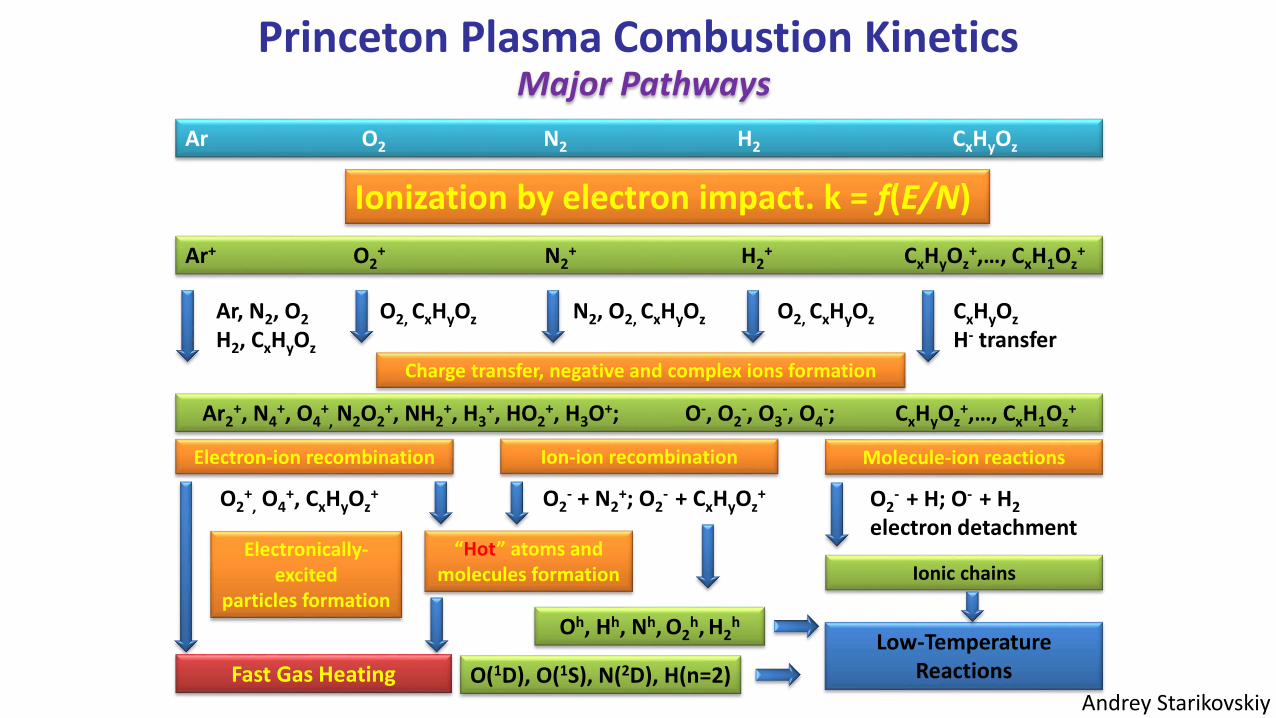
Princeton Plasma Combustion KineticsMajor Pathways
Ar O2 N2 H2 CxHyOz
Ar+ O2+ N2
+ H2+ CxHyOz
+,…, CxH1Oz+
Ar, N2, O2
H2, CxHyOz
Ar2+, N4
+, O4+
, N2O2+, NH2
+, H3+, HO2
+, H3O+; O-, O2-, O3
-, O4-; CxHyOz
+,…, CxH1Oz+
Charge transfer, negative and complex ions formation
O2, CxHyOz N2, O2, CxHyOz O2, CxHyOz
Electron-ion recombination
O2+
, O4+, CxHyOz
+
Ion-ion recombination
O2- + N2
+; O2- + CxHyOz
+
Molecule-ion reactions
O2- + H; O- + H2
electron detachment Electronically-
excited particles formation
Low-Temperature ReactionsFast Gas Heating
“Hot” atoms and molecules formation Ionic chains
CxHyOz
H- transfer
Oh, Hh, Nh, O2h, H2
h
Ionization by electron impact. k = f(E/N)
O(1D), O(1S), N(2D), H(n=2)Andrey Starikovskiy
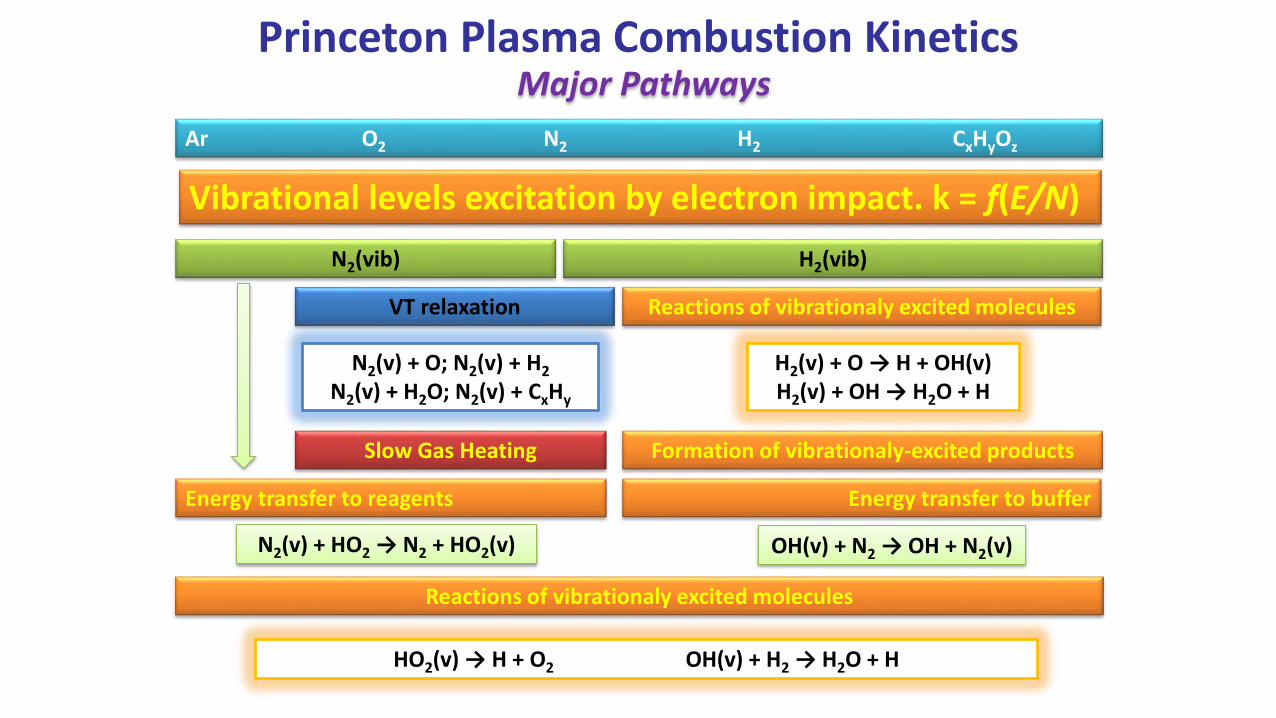
Princeton Plasma Combustion KineticsMajor Pathways
Ar O2 N2 H2 CxHyOz
N2(vib)
Energy transfer to buffer
Formation of vibrationaly-excited products
VT relaxation
Slow Gas Heating
Reactions of vibrationaly excited molecules
Vibrational levels excitation by electron impact. k = f(E/N)
H2(vib)
H2(v) + O → H + OH(v) H2(v) + OH → H2O + H
N2(v) + O; N2(v) + H2
N2(v) + H2O; N2(v) + CxHy
N2(v) + HO2 → N2 + HO2(v) OH(v) + N2 → OH + N2(v)
Reactions of vibrationaly excited molecules
HO2(v) → H + O2 OH(v) + H2 → H2O + H
Energy transfer to reagents
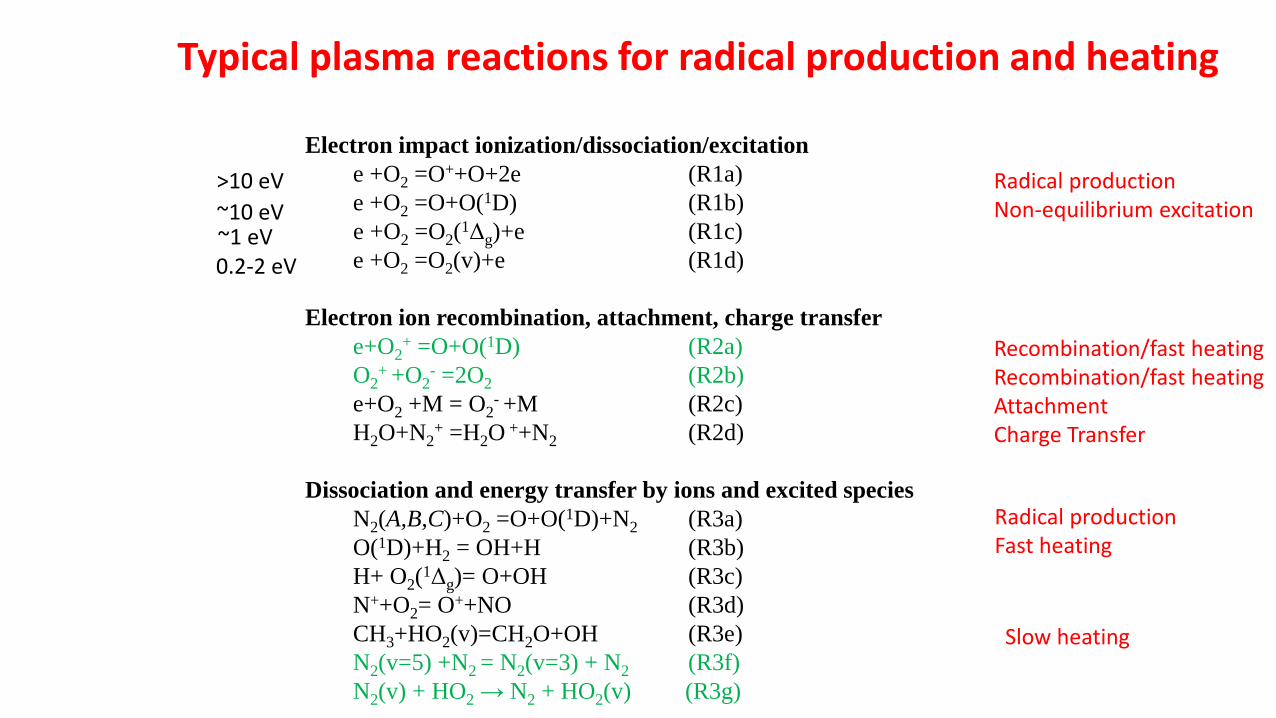
Electron impact ionization/dissociation/excitation
e +O2 =O++O+2e (R1a)
e +O2 =O+O(1D) (R1b)
e +O2 =O2(1Δg)+e (R1c)
e +O2 =O2(v)+e (R1d)
Electron ion recombination, attachment, charge transfer
e+O2+ =O+O(1D) (R2a)
O2+ +O2
- =2O2 (R2b)
e+O2 +M = O2- +M (R2c)
H2O+N2+ =H2O
++N2 (R2d)
Dissociation and energy transfer by ions and excited species
N2(A,B,C)+O2 =O+O(1D)+N2 (R3a)
O(1D)+H2 = OH+H (R3b)
H+ O2(1Δg)= O+OH (R3c)
N++O2= O++NO (R3d)
CH3+HO2(v)=CH2O+OH (R3e)
N2(v=5) +N2 = N2(v=3) + N2 (R3f)
N2(v) + HO2 → N2 + HO2(v) (R3g)
Typical plasma reactions for radical production and heating
Recombination/fast heatingRecombination/fast heatingAttachmentCharge Transfer
Radical productionNon-equilibrium excitation
Slow heating
>10 eV
~10 eV~1 eV0.2-2 eV
Radical productionFast heating
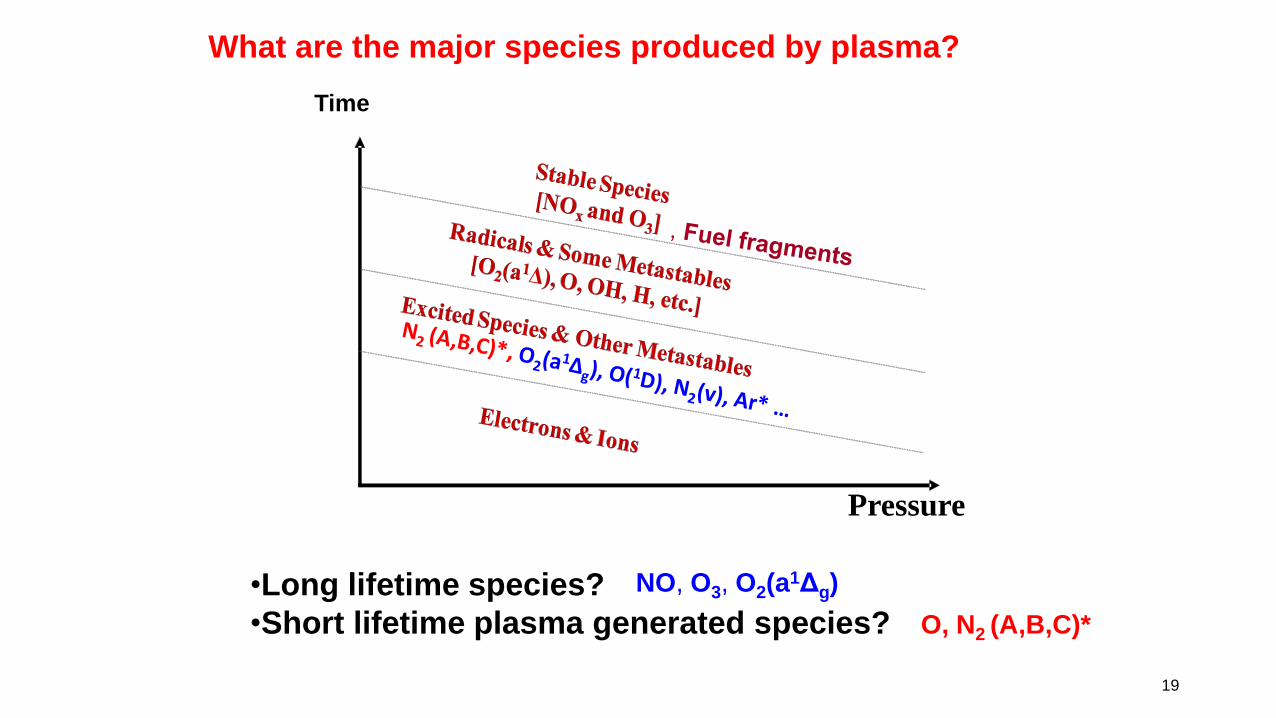
Pressure
Time
What are the major species produced by plasma?
•Long lifetime species?
•Short lifetime plasma generated species?
NO, O3, O2(a1Δg)
O, N2 (A,B,C)*
19
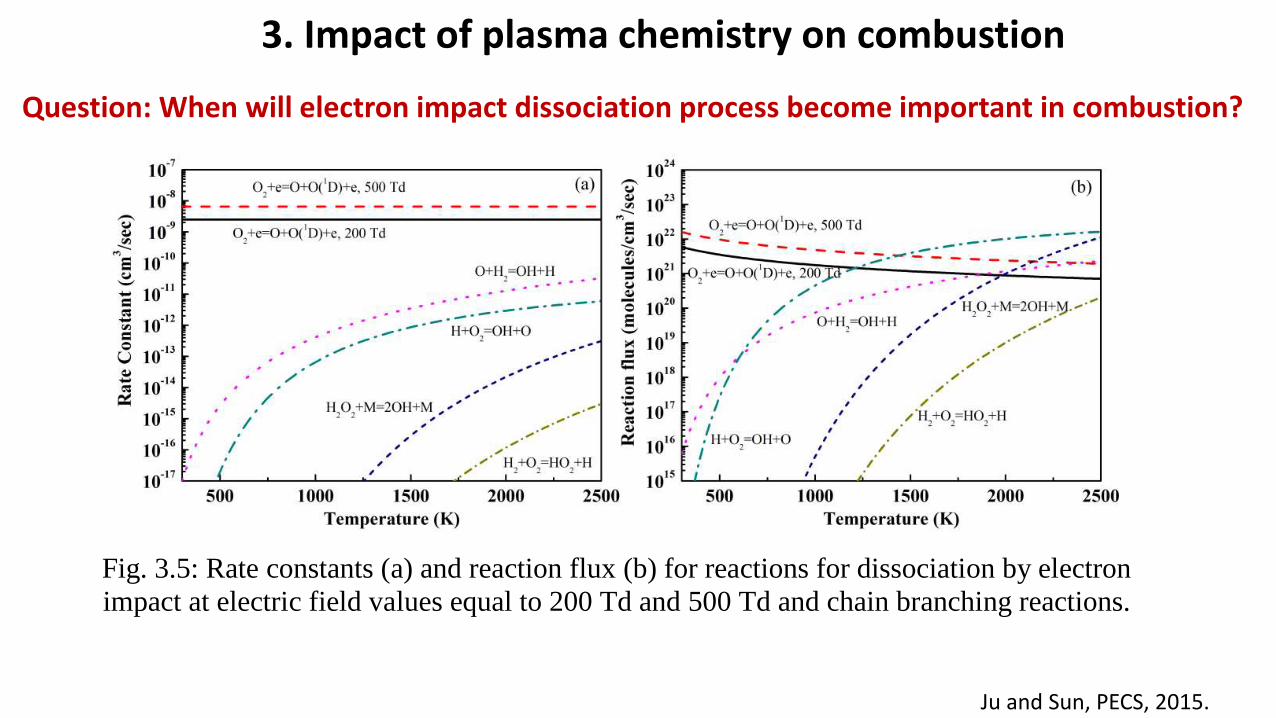
Fig. 3.5: Rate constants (a) and reaction flux (b) for reactions for dissociation by electron
impact at electric field values equal to 200 Td and 500 Td and chain branching reactions.
Ju and Sun, PECS, 2015.
Question: When will electron impact dissociation process become important in combustion?
3. Impact of plasma chemistry on combustion
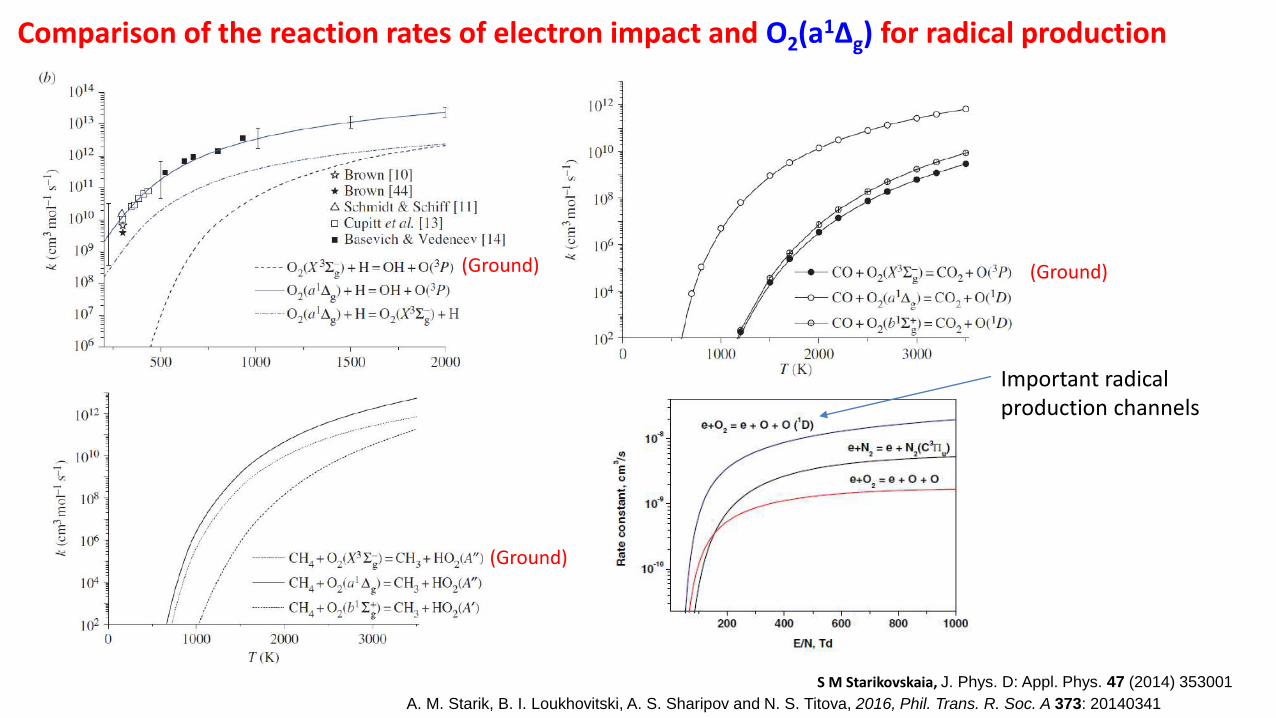
Comparison of the reaction rates of electron impact and O2(a1Δg) for radical production
A. M. Starik, B. I. Loukhovitski, A. S. Sharipov and N. S. Titova, 2016, Phil. Trans. R. Soc. A 373: 20140341
S M Starikovskaia, J. Phys. D: Appl. Phys. 47 (2014) 353001
Important radical production channels
(Ground)
(Ground)
(Ground)
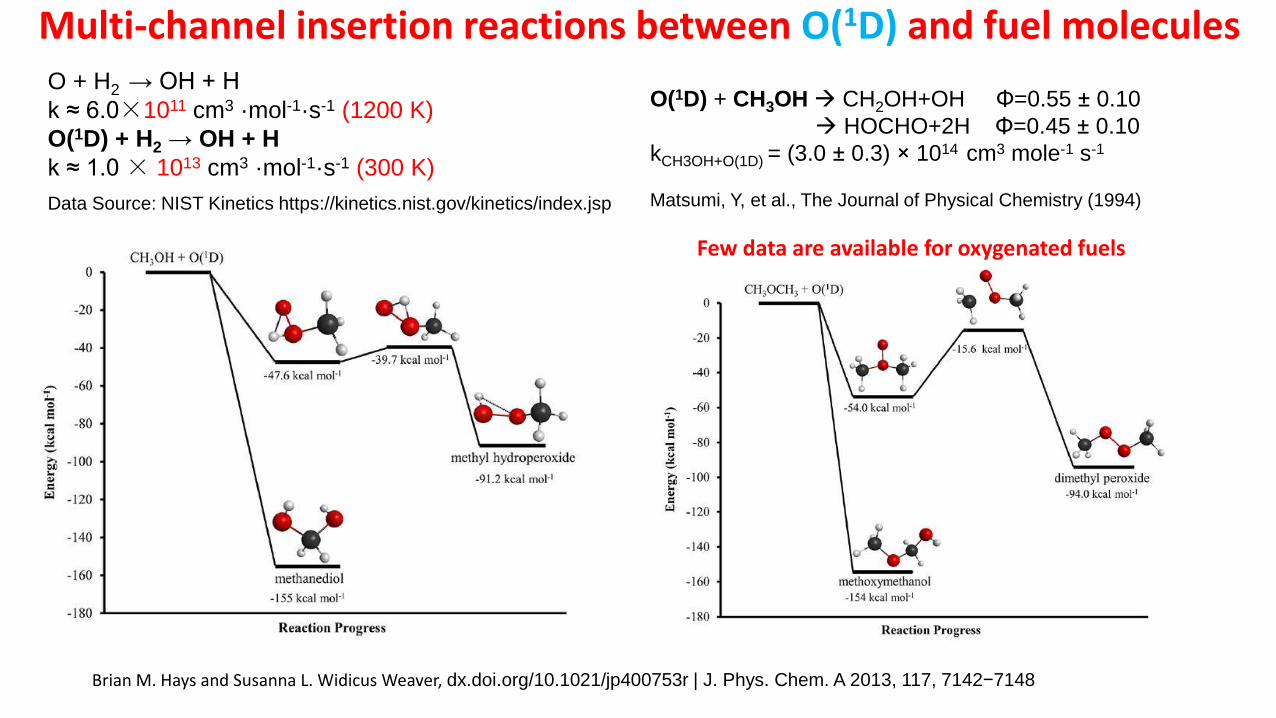
Multi-channel insertion reactions between O(1D) and fuel molecules
Brian M. Hays and Susanna L. Widicus Weaver, dx.doi.org/10.1021/jp400753r | J. Phys. Chem. A 2013, 117, 7142−7148
Data Source: NIST Kinetics https://kinetics.nist.gov/kinetics/index.jsp
O + H2 → OH + H
k ≈ 6.0×1011 cm3 ·mol-1·s-1 (1200 K)
O(1D) + H2 → OH + H
k ≈ 1.0 × 1013 cm3 ·mol-1·s-1 (300 K)
O(1D) + CH3OH CH2OH+OH Φ=0.55 ± 0.10
HOCHO+2H Φ=0.45 ± 0.10
kCH3OH+O(1D) = (3.0 ± 0.3) × 1014 cm3 mole-1 s-1
Matsumi, Y, et al., The Journal of Physical Chemistry (1994)
Few data are available for oxygenated fuels
23
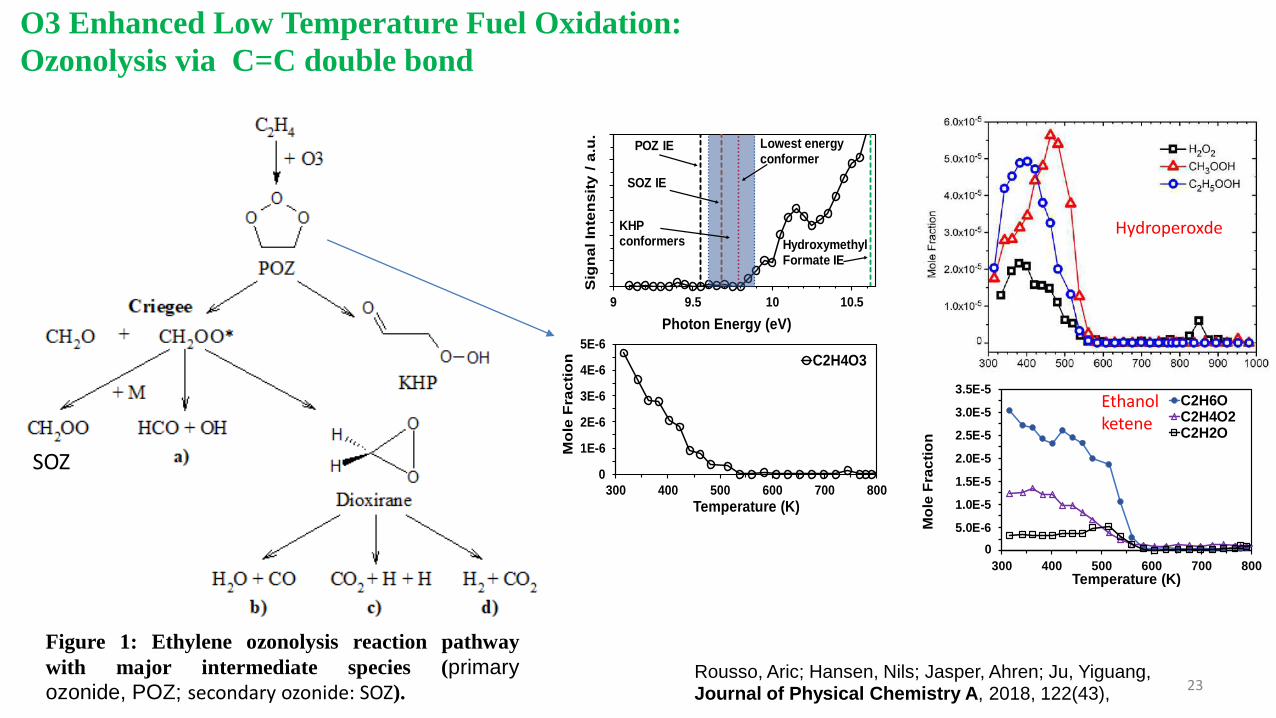
Figure 1: Ethylene ozonolysis reaction pathway
with major intermediate species (primary
ozonide, POZ; secondary ozonide: SOZ).
O3 Enhanced Low Temperature Fuel Oxidation:
Ozonolysis via C=C double bond
9 9.5 10 10.5
Sig
na
l In
ten
sit
y /
a.u
.
Photon Energy (eV)
POZ IE
SOZ IE
KHP conformers
Lowest energy conformer
Hydroxymethyl Formate IE
0E+0
1E-6
2E-6
3E-6
4E-6
5E-6
300 400 500 600 700 800
Mo
le F
rac
tio
n
Temperature (K)
C2H4O3
0
0.0E+0
2.5E-5
5.0E-5
7.5E-5
1.0E-4
1.3E-4
1.5E-4
300 400 500 600 700 800
Mo
le F
rac
tio
n
Temperature (K)
CH3OHC2H4OCH4O2C2H6O2
0
0.0E+0
5.0E-6
1.0E-5
1.5E-5
2.0E-5
2.5E-5
3.0E-5
3.5E-5
300 400 500 600 700 800
Mo
le F
rac
tio
n
Temperature (K)
C2H6OC2H4O2C2H2O
0
SOZ
Rousso, Aric; Hansen, Nils; Jasper, Ahren; Ju, Yiguang, Journal of Physical Chemistry A, 2018, 122(43),
Ethanolketene
Hydroperoxde
2424
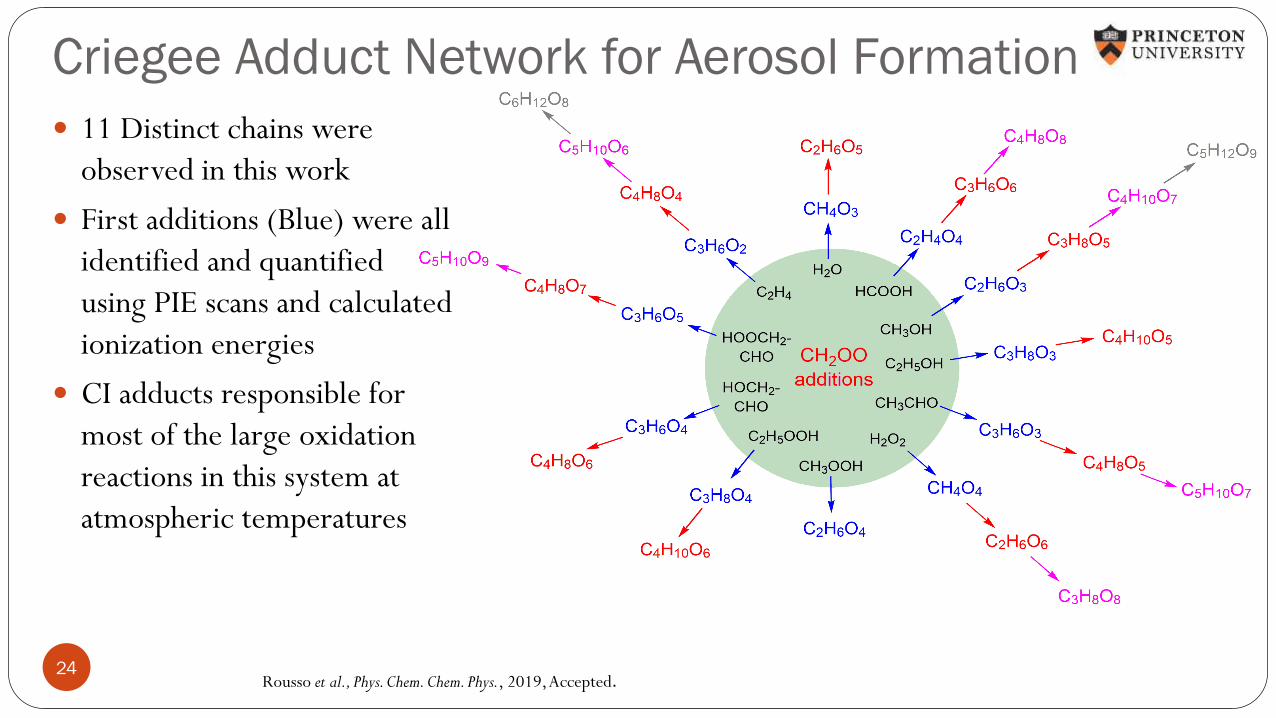
Criegee Adduct Network for Aerosol Formation
11 Distinct chains were
observed in this work
First additions (Blue) were all
identified and quantified
using PIE scans and calculated
ionization energies
CI adducts responsible for
most of the large oxidation
reactions in this system at
atmospheric temperatures
Rousso et al., Phys. Chem. Chem. Phys., 2019, Accepted.
25
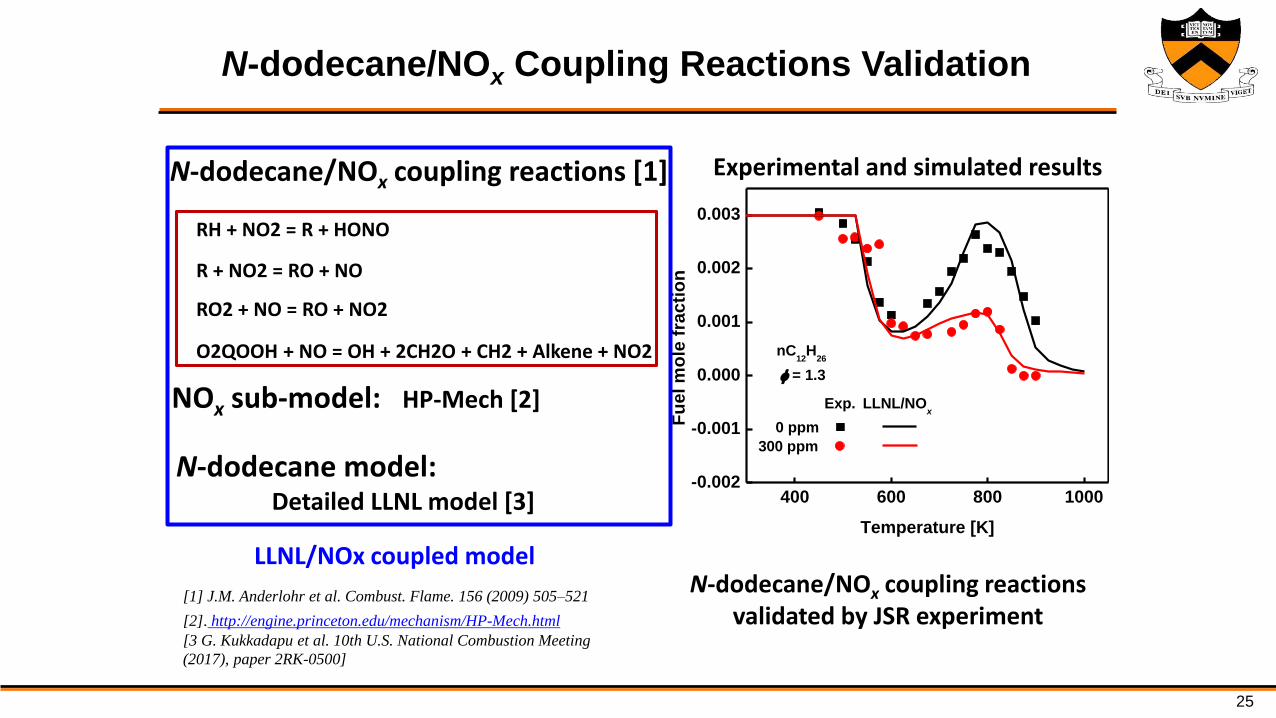
N-dodecane/NOx Coupling Reactions Validation
N-dodecane/NOx coupling reactions [1]
RH + NO2 = R + HONO
R + NO2 = RO + NO
O2QOOH + NO = OH + 2CH2O + CH2 + Alkene + NO2
RO2 + NO = RO + NO2
NOx sub-model: HP-Mech [2]
[1] J.M. Anderlohr et al. Combust. Flame. 156 (2009) 505–521
[2]. http://engine.princeton.edu/mechanism/HP-Mech.html
[3 G. Kukkadapu et al. 10th U.S. National Combustion Meeting
(2017), paper 2RK-0500]
400 600 800 1000-0.002
-0.001
0.000
0.001
0.002
0.003
0 ppm
300 ppm
LLNL/NOx
Fu
el
mo
le f
rac
tio
n
Temperature [K]
nC12
H26
= 1.3
Exp.
N-dodecane model: Detailed LLNL model [3]
N-dodecane/NOx coupling reactions validated by JSR experiment
Experimental and simulated results
LLNL/NOx coupled model
2021 AIAA SciTech Forum26
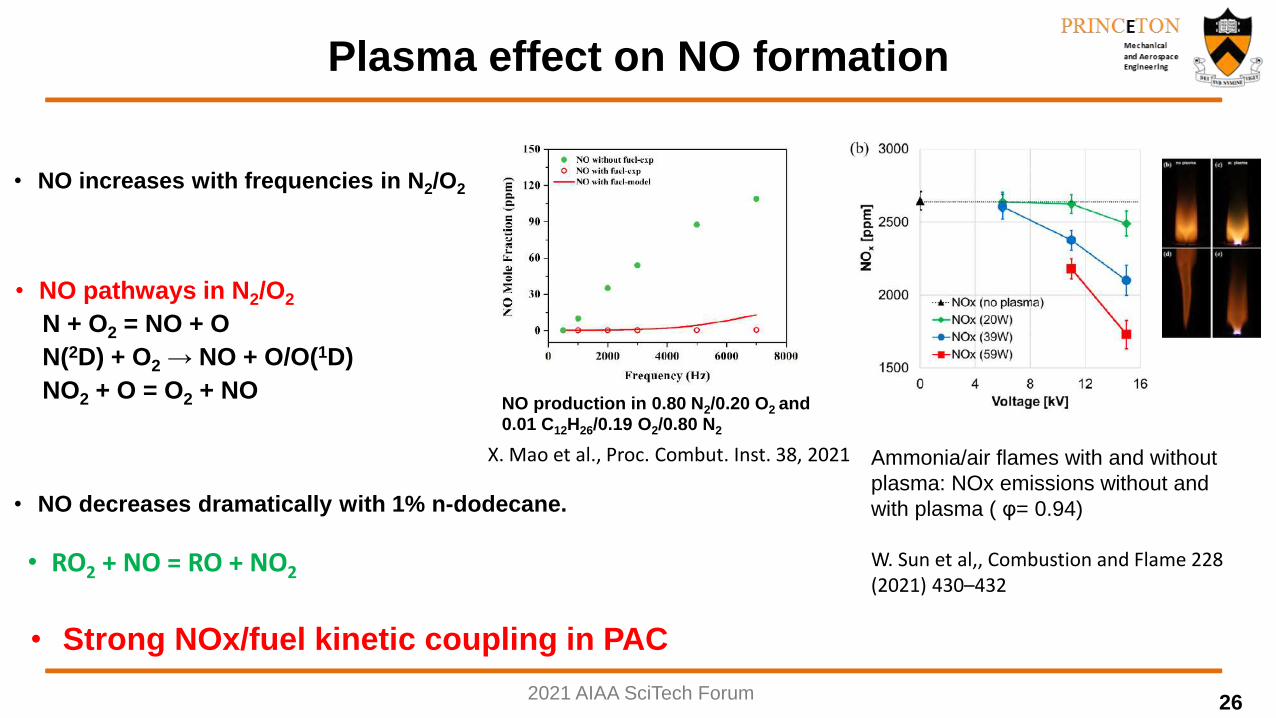
Plasma effect on NO formation
NO production in 0.80 N2/0.20 O2 and 0.01 C12H26/0.19 O2/0.80 N2
• NO increases with frequencies in N2/O2
• NO decreases dramatically with 1% n-dodecane.
• RO2 + NO = RO + NO2
• NO pathways in N2/O2
N + O2 = NO + O
N(2D) + O2 → NO + O/O(1D)
NO2 + O = O2 + NO
• Strong NOx/fuel kinetic coupling in PAC
Ammonia/air flames with and without
plasma: NOx emissions without and
with plasma ( φ= 0.94)
W. Sun et al,, Combustion and Flame 228 (2021) 430–432
X. Mao et al., Proc. Combut. Inst. 38, 2021
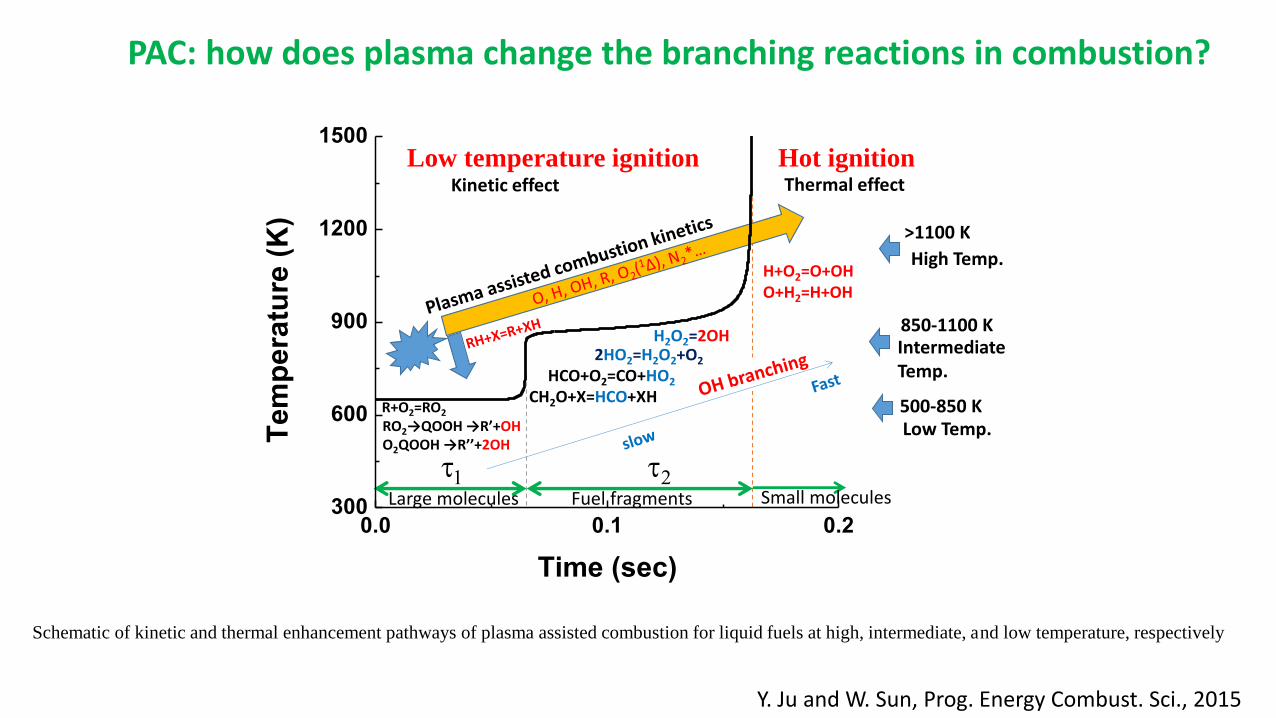
PAC: how does plasma change the branching reactions in combustion?
t1 t2
Hot ignitionLow temperature ignition
0.0 0.1 0.2300
600
900
1200
1500
Tem
pera
ture
(K
)
Time (sec)
R+O2=RO2
HCO+O2=CO+HO2
2HO2=H2O2+O2
H2O2=2OH
H+O2=O+OHO+H2=H+OH
RO2→QOOH →R’+OHO2QOOH →R’’+2OH
Thermal effectKinetic effect
500-850 K
850-1100 K
>1100 K
High Temp.
Intermediate Temp.
Low Temp.
Large molecules Fuel fragments Small molecules
CH2O+X=HCO+XH
Schematic of kinetic and thermal enhancement pathways of plasma assisted combustion for liquid fuels at high, intermediate, and low temperature, respectively
Y. Ju and W. Sun, Prog. Energy Combust. Sci., 2015
28
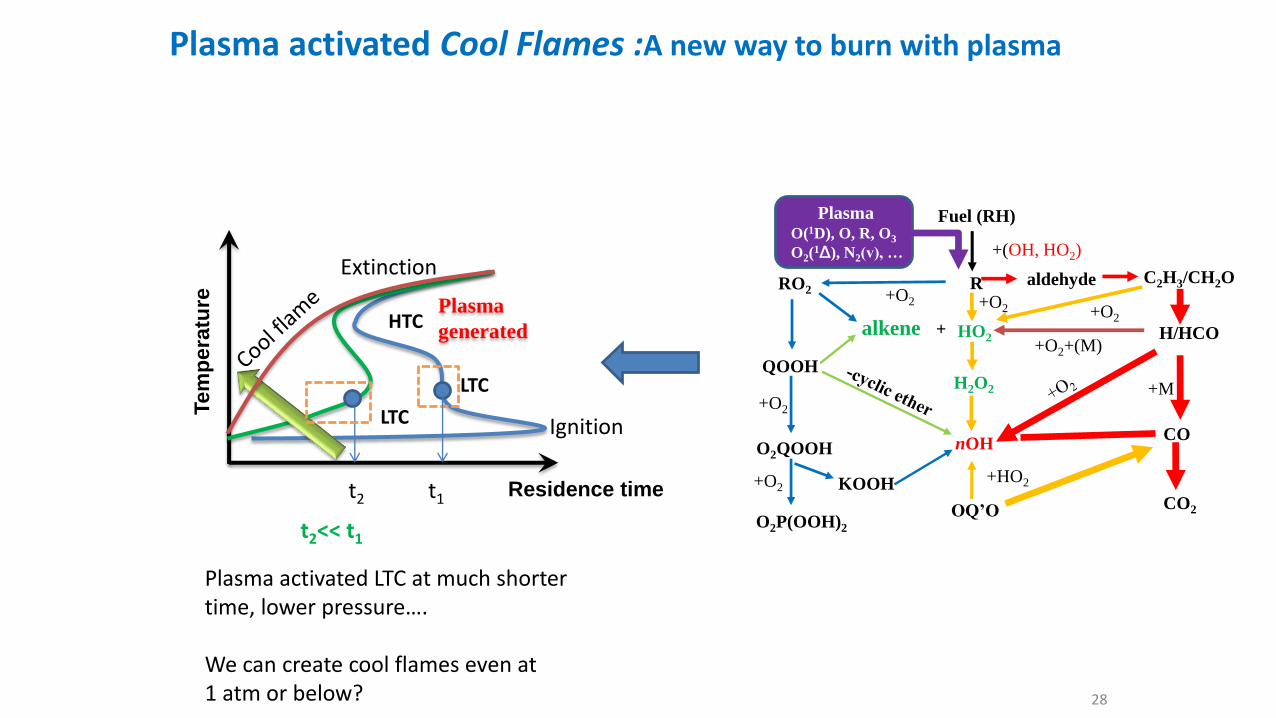
Plasma activated LTC at much shorter time, lower pressure….
We can create cool flames even at1 atm or below?
Plasma activated Cool Flames :A new way to burn with plasma
Residence time
Tem
pera
ture Plasma
generated
LTC
Ignition
Extinction
HTC
LTC
t2 t1
t2<< t1
Fuel (RH)
+(OH, HO2)
R
nOH
aldehyde C2H3/CH2O
H/HCO+O2+(M)
+M
+O2
CO2
CO
OQ’O
PlasmaO(1D), O, R, O3
O2(1Δ), N2(v), …
alkene +
+O2
RO2
QOOH
O2QOOH
+O2
KOOH +O2
O2P(OOH)2
H2O2
+O2
HO2
+HO2
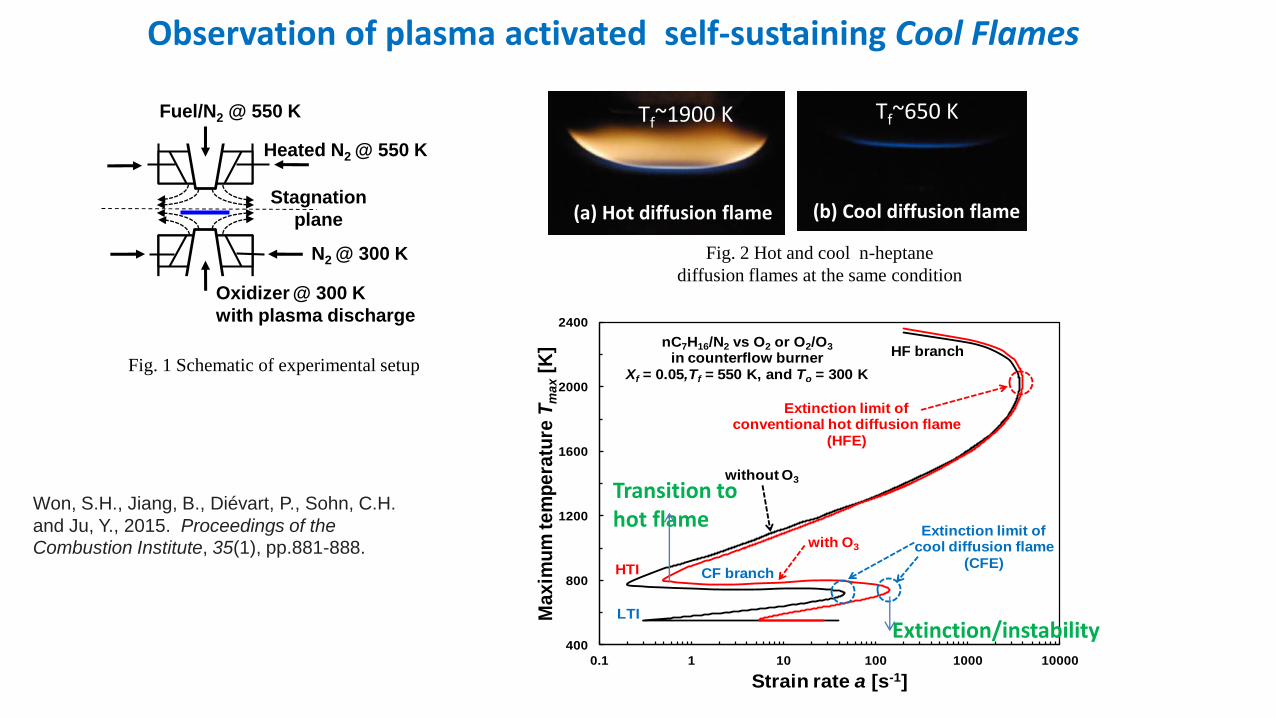
Observation of plasma activated self-sustaining Cool Flames
Heated N2 @ 550 K
N2 @ 300 K
Stagnation
plane
Oxidizer @ 300 K
with plasma discharge
Fuel/N2 @ 550 K
Fig. 1 Schematic of experimental setup
(a) Hot diffusion flame (b) Cool diffusion flame
Fig. 2 Hot and cool n-heptane
diffusion flames at the same condition
Tf~1900 K Tf~650 K
400
800
1200
1600
2000
2400
0.1 1 10 100 1000 10000
Ma
xim
um
te
mp
era
ture
Tm
ax
[K]
Strain rate a [s-1]
nC7H16/N2 vs O2 or O2/O3
in counterflow burnerXf = 0.05,Tf = 550 K, and To = 300 K
Extinction limit ofconventional hot diffusion flame
(HFE)
Extinction limit ofcool diffusion flame
(CFE)
without O3
with O3
HF branch
CF branchHTI
LTI
Extinction/instability
Transition to hot flame
Won, S.H., Jiang, B., Diévart, P., Sohn, C.H.
and Ju, Y., 2015. Proceedings of the
Combustion Institute, 35(1), pp.881-888.
6. Diagnostics of plasma physics and chemistry in PAC
1. Measurements of plasma properties and kinetic processes
2. Diagnostics methods of plasma produced active species and non-equilibrium
3. Multispecies diagnostics and kinetic model development of plasma assisted combustion
Yiguang Ju, Princeton University
Princeton Combustion Summer School2021.6.21
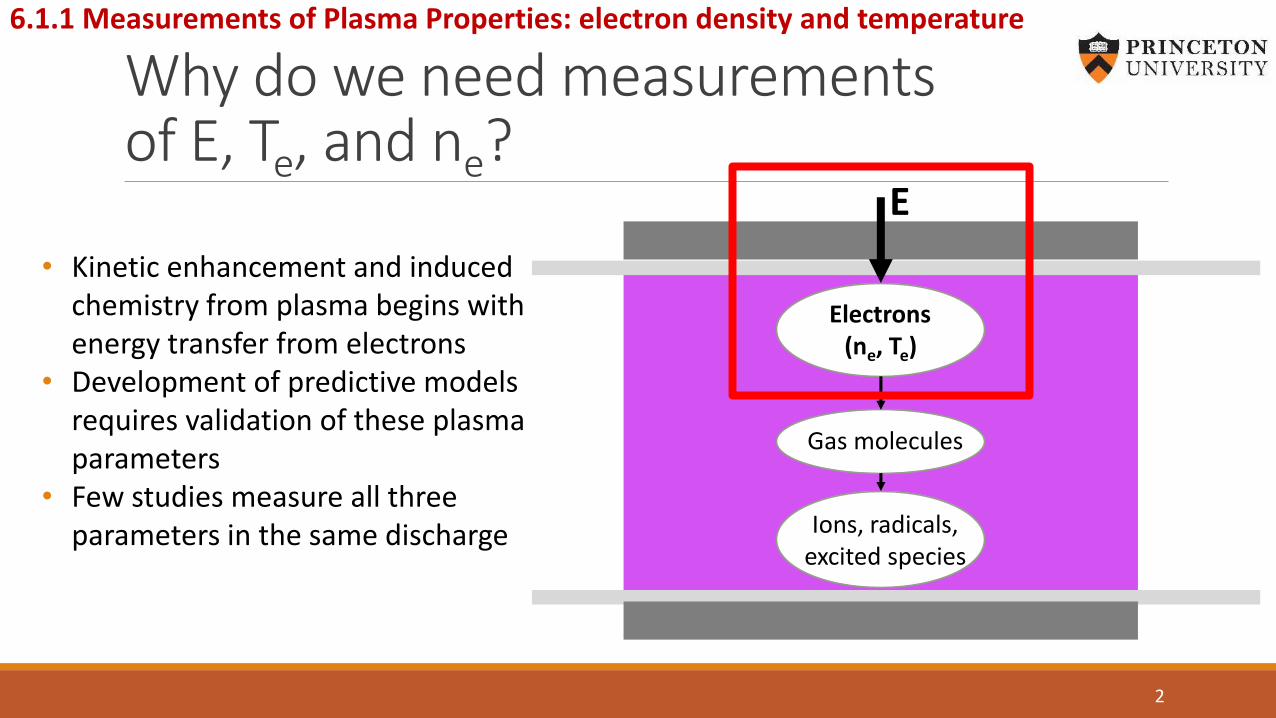
Why do we need measurements of E, Te, and ne?
• Kinetic enhancement and induced chemistry from plasma begins with energy transfer from electrons
• Development of predictive models requires validation of these plasma parameters
• Few studies measure all three parameters in the same discharge
2
Electrons(ne, Te)
Gas molecules
Ions, radicals, excited species
E
6.1.1 Measurements of Plasma Properties: electron density and temperature
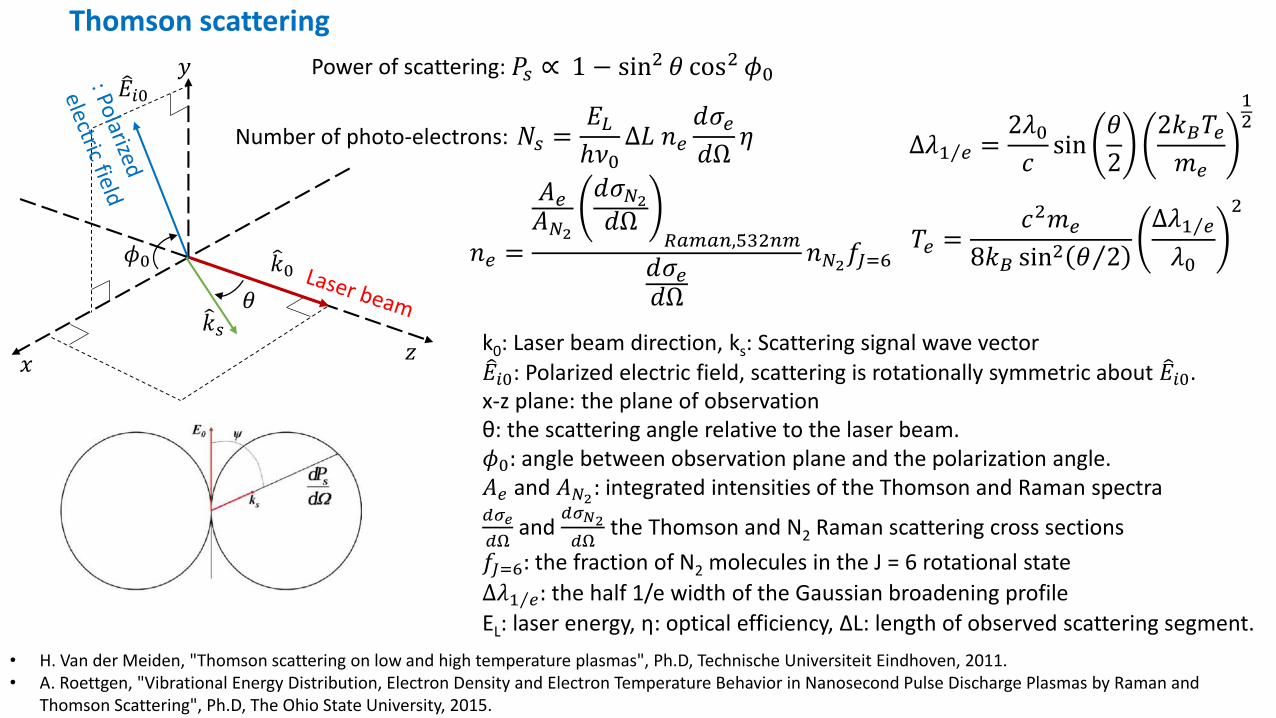
Thomson scattering
𝑃𝑠 ∝ 1 − sin2 𝜃 cos2 𝜙0
𝑁𝑠 =𝐸𝐿
ℎ𝜈0Δ𝐿 𝑛𝑒
𝑑𝜎𝑒
𝑑Ω𝜂
𝜃
𝜙0
𝐸𝑖0
𝑘𝑠
𝑘0
𝑧𝑥
𝑦
• H. Van der Meiden, "Thomson scattering on low and high temperature plasmas", Ph.D, Technische Universiteit Eindhoven, 2011.• A. Roettgen, "Vibrational Energy Distribution, Electron Density and Electron Temperature Behavior in Nanosecond Pulse Discharge Plasmas by Raman and
Thomson Scattering", Ph.D, The Ohio State University, 2015.
k0: Laser beam direction, ks: Scattering signal wave vector 𝐸𝑖0: Polarized electric field, scattering is rotationally symmetric about 𝐸𝑖0. x-z plane: the plane of observation θ: the scattering angle relative to the laser beam. 𝜙0: angle between observation plane and the polarization angle. 𝐴𝑒 and 𝐴𝑁2
: integrated intensities of the Thomson and Raman spectra𝑑𝜎𝑒
𝑑Ωand
𝑑𝜎𝑁2
𝑑Ωthe Thomson and N2 Raman scattering cross sections
𝑓𝐽=6: the fraction of N2 molecules in the J = 6 rotational state
Δ𝜆 1 𝑒: the half 1/e width of the Gaussian broadening profile
EL: laser energy, η: optical efficiency, ΔL: length of observed scattering segment.
𝑛𝑒 =
𝐴𝑒𝐴𝑁2
𝑑𝜎𝑁2
𝑑Ω𝑅𝑎𝑚𝑎𝑛,532𝑛𝑚
𝑑𝜎𝑒𝑑Ω
𝑛𝑁2𝑓𝐽=6
Δ𝜆 1 𝑒 =2𝜆0
𝑐sin
𝜃
2
2𝑘𝐵𝑇𝑒𝑚𝑒
12
𝑇𝑒 =𝑐2𝑚𝑒
8𝑘𝐵 sin2 𝜃 2
Δ𝜆 1 𝑒
𝜆0
2
Power of scattering:
Number of photo-electrons:
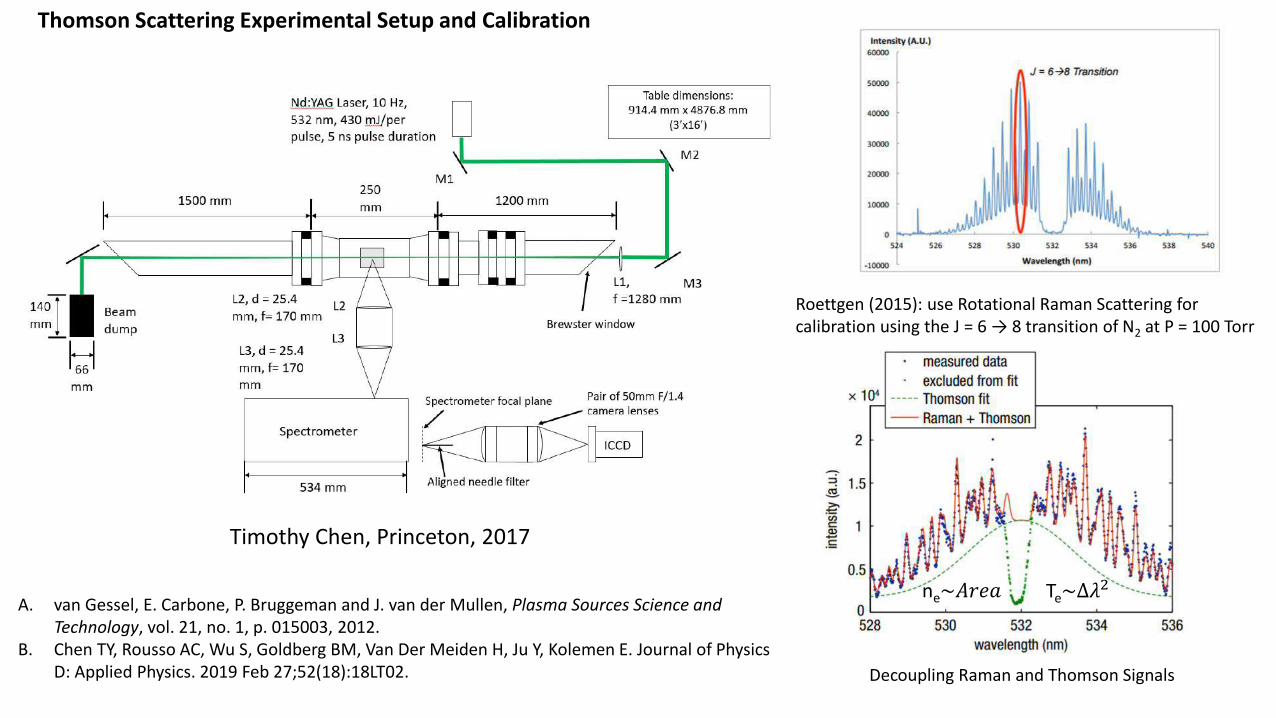
Roettgen (2015): use Rotational Raman Scattering for calibration using the J = 6 → 8 transition of N2 at P = 100 Torr
Thomson Scattering Experimental Setup and Calibration
Timothy Chen, Princeton, 2017
A. van Gessel, E. Carbone, P. Bruggeman and J. van der Mullen, Plasma Sources Science and Technology, vol. 21, no. 1, p. 015003, 2012.
B. Chen TY, Rousso AC, Wu S, Goldberg BM, Van Der Meiden H, Ju Y, Kolemen E. Journal of Physics D: Applied Physics. 2019 Feb 27;52(18):18LT02. Decoupling Raman and Thomson Signals
Te~Δ𝜆2ne~𝐴𝑟𝑒𝑎
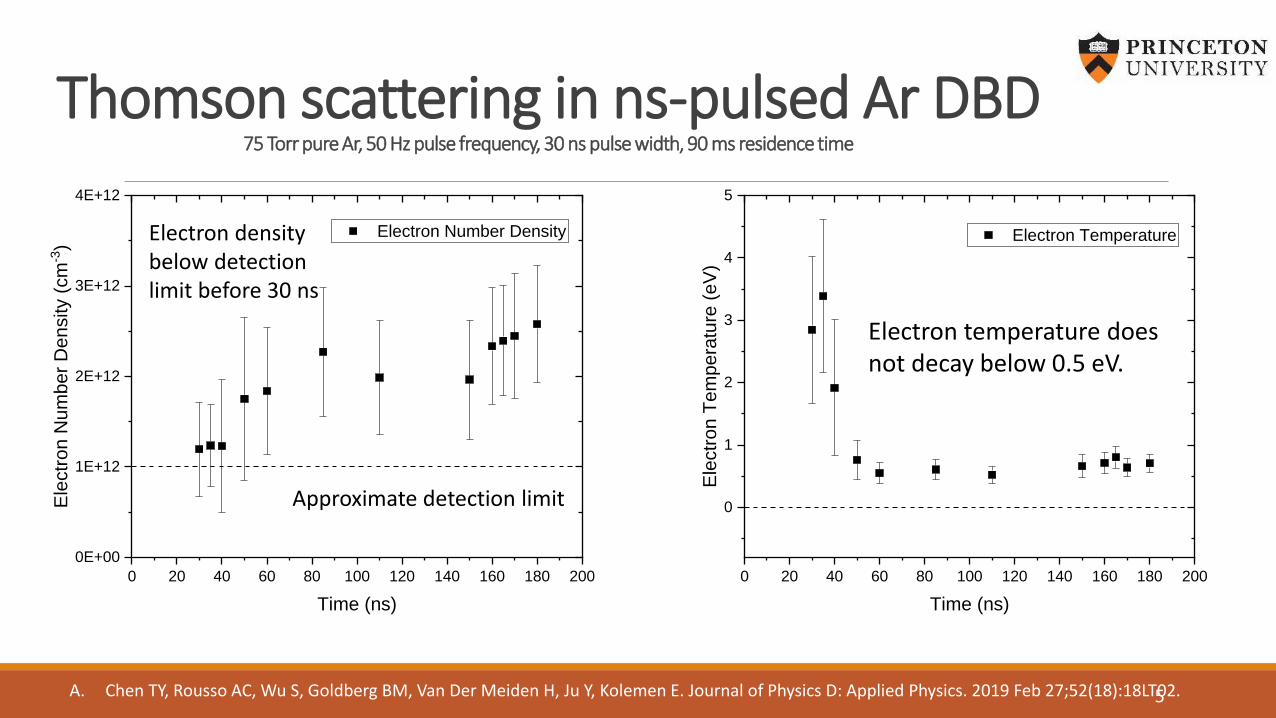
Thomson scattering in ns-pulsed Ar DBD75 Torr pure Ar, 50 Hz pulse frequency, 30 ns pulse width, 90 ms residence time
0 20 40 60 80 100 120 140 160 180 200
0E+00
1E+12
2E+12
3E+12
4E+12
Electron Number Density
Ele
ctr
on N
um
be
r D
en
sity (
cm
-3)
Time (ns)
5
Approximate detection limit
Electron density below detection limit before 30 ns
0 20 40 60 80 100 120 140 160 180 200
0
1
2
3
4
5
Electron Temperature
Ele
ctr
on T
em
pe
ratu
re (
eV
)
Time (ns)
Electron temperature does not decay below 0.5 eV.
A. Chen TY, Rousso AC, Wu S, Goldberg BM, Van Der Meiden H, Ju Y, Kolemen E. Journal of Physics D: Applied Physics. 2019 Feb 27;52(18):18LT02.
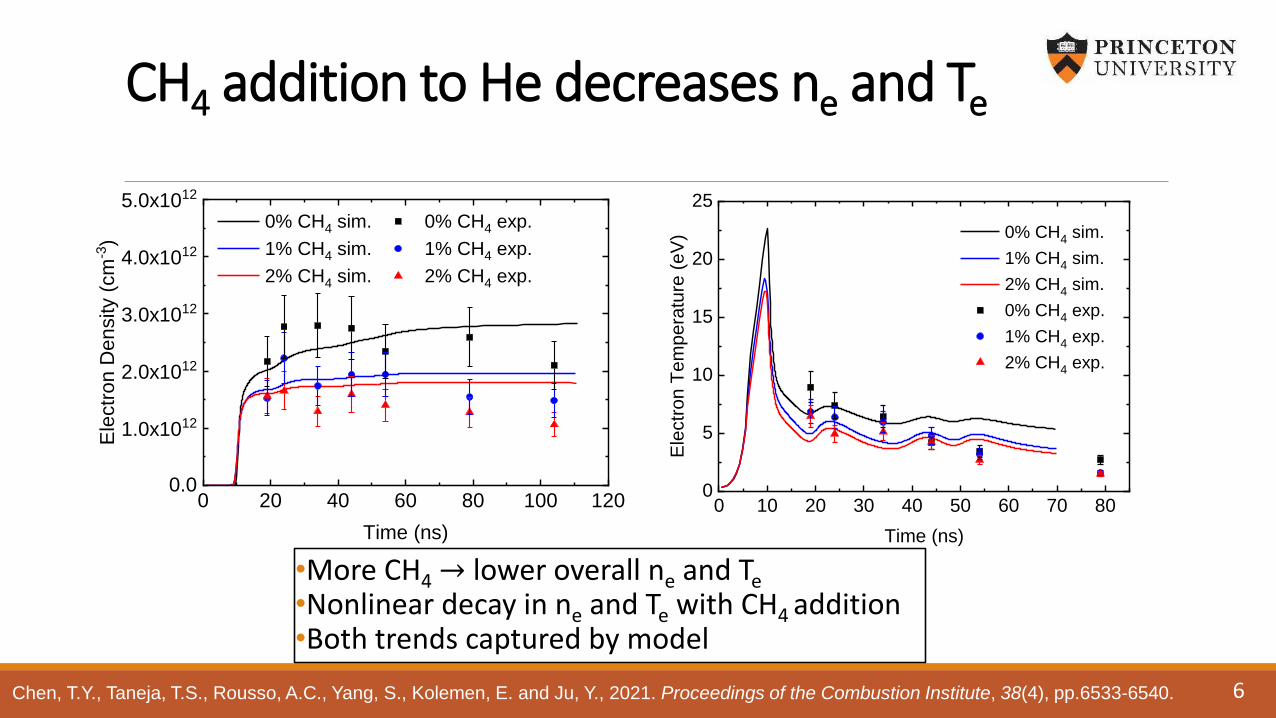
CH4 addition to He decreases ne and Te
0 20 40 60 80 100 1200.0
1.0x10¹²
2.0x10¹²
3.0x10¹²
4.0x10¹²
5.0x10¹²
0% CH4 sim. 0% CH4 exp.
1% CH4 sim. 1% CH4 exp.
2% CH4 sim. 2% CH4 exp.
Ele
ctr
on
De
nsity (
cm
-3)
Time (ns)
6
0 10 20 30 40 50 60 70 800
5
10
15
20
25
Ele
ctr
on T
em
pera
ture
(eV
) 0% CH4 sim.
1% CH4 sim.
2% CH4 sim.
0% CH4 exp.
1% CH4 exp.
2% CH4 exp.
Time (ns)
•More CH4 → lower overall ne and Te•Nonlinear decay in ne and Te with CH4 addition•Both trends captured by model
Chen, T.Y., Taneja, T.S., Rousso, A.C., Yang, S., Kolemen, E. and Ju, Y., 2021. Proceedings of the Combustion Institute, 38(4), pp.6533-6540.
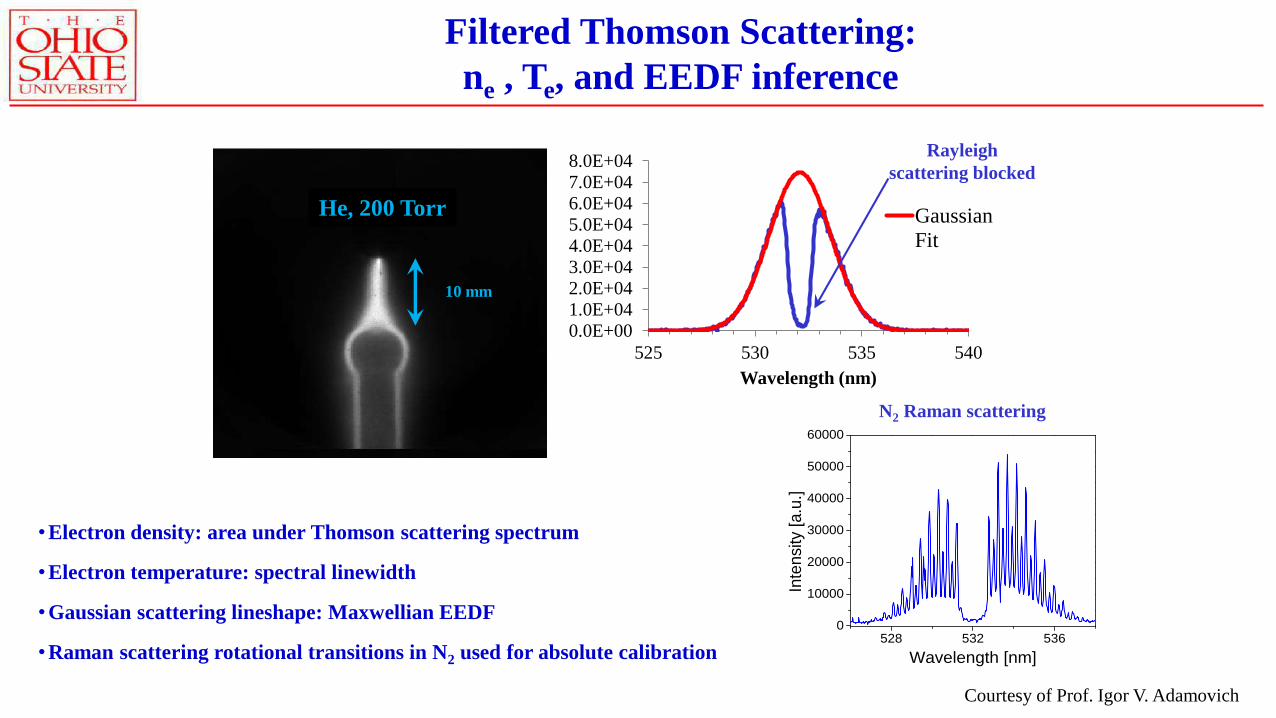
•Electron density: area under Thomson scattering spectrum
•Electron temperature: spectral linewidth
•Gaussian scattering lineshape: Maxwellian EEDF
•Raman scattering rotational transitions in N2 used for absolute calibration
Filtered Thomson Scattering:
ne , Te, and EEDF inference
0.0E+00
1.0E+04
2.0E+04
3.0E+04
4.0E+045.0E+04
6.0E+04
7.0E+04
8.0E+04
525 530 535 540
Wavelength (nm)
Gaussian
Fit
Rayleigh
scattering blocked
528 532 5360
10000
20000
30000
40000
50000
60000
Inte
nsity [a.u
.]
Wavelength [nm]
N2 Raman scattering
10 mm
He, 200 Torr
Courtesy of Prof. Igor V. Adamovich
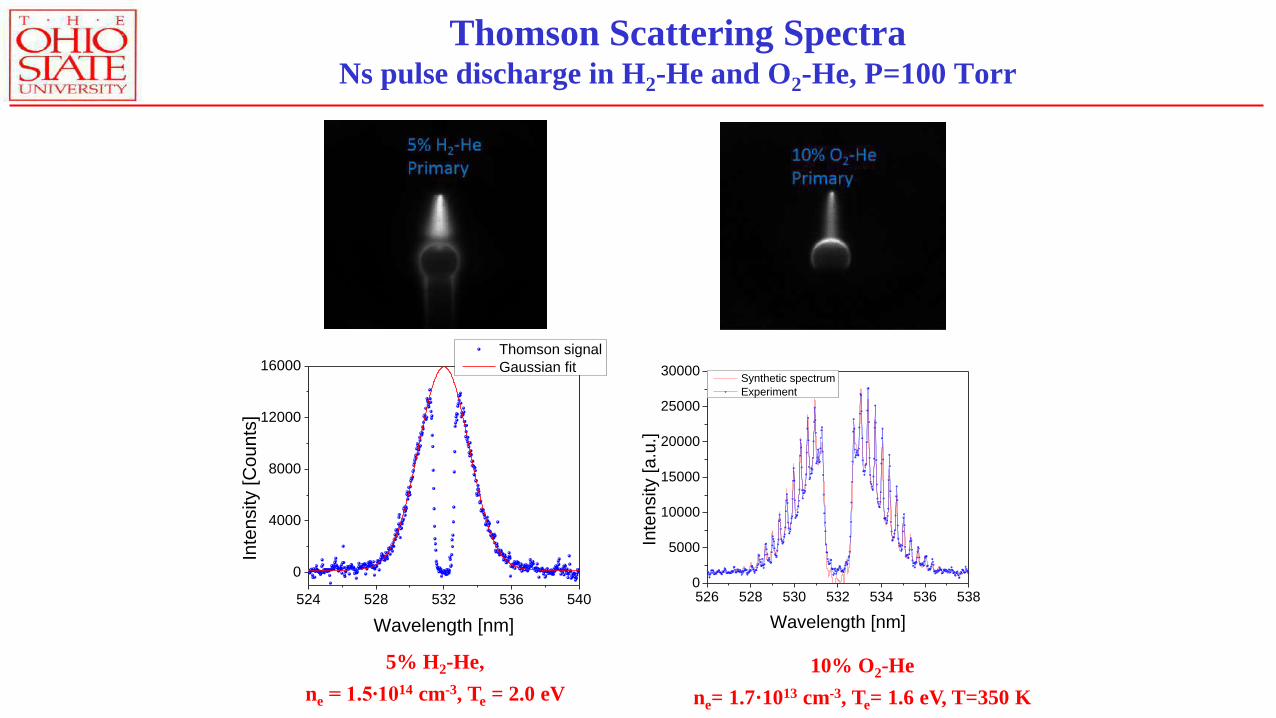
Thomson Scattering SpectraNs pulse discharge in H2-He and O2-He, P=100 Torr
10% O2-He
ne= 1.7·1013 cm-3, Te= 1.6 eV, T=350 K
524 528 532 536 540
0
4000
8000
12000
16000
Inte
nsity [C
oun
ts]
Wavelength [nm]
Thomson signal
Gaussian fit
526 528 530 532 534 536 5380
5000
10000
15000
20000
25000
30000
Inte
nsity [a
.u.]
Wavelength [nm]
Synthetic spectrum
Experiment
5% H2-He,
ne = 1.5∙1014 cm-3, Te = 2.0 eV
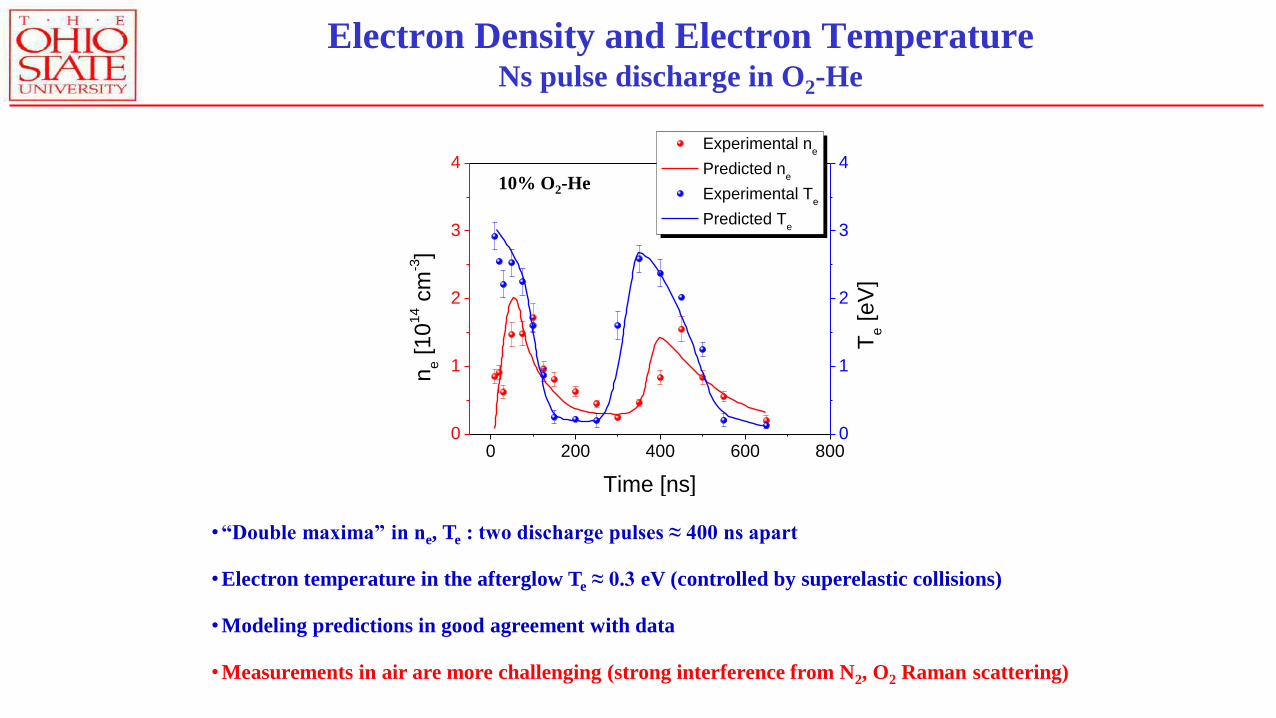
Electron Density and Electron TemperatureNs pulse discharge in O2-He
•“Double maxima” in ne, Te : two discharge pulses ≈ 400 ns apart
•Electron temperature in the afterglow Te ≈ 0.3 eV (controlled by superelastic collisions)
•Modeling predictions in good agreement with data
•Measurements in air are more challenging (strong interference from N2, O2 Raman scattering)
0 200 400 600 8000
1
2
3
4 Experimental n
e
Predicted ne
Experimental Te
Predicted Te
Time [ns]
ne [10
14 c
m-3]
0
1
2
3
4
Te [eV
]
10% O2-He
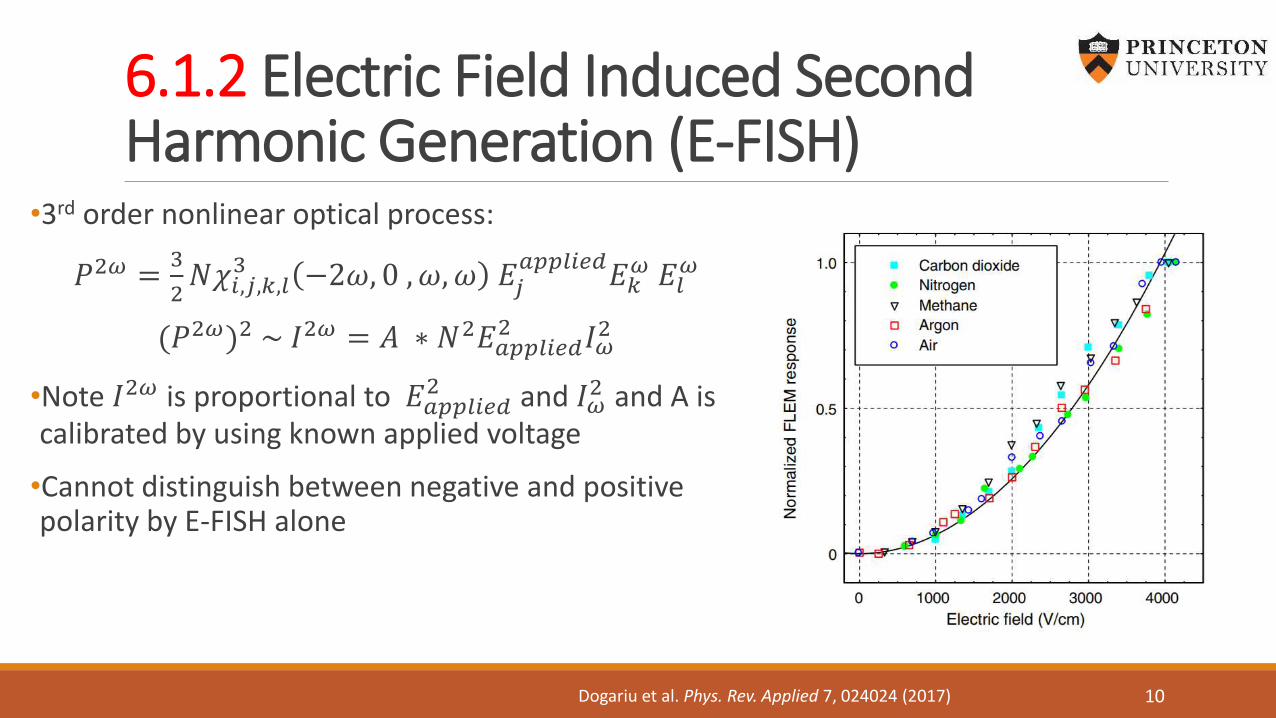
6.1.2 Electric Field Induced Second Harmonic Generation (E-FISH)
•3rd order nonlinear optical process:
𝑃2𝜔 =3
2𝑁𝜒𝑖,𝑗,𝑘,𝑙
3 −2𝜔, 0 ,𝜔, 𝜔 𝐸𝑗𝑎𝑝𝑝𝑙𝑖𝑒𝑑
𝐸𝑘𝜔 𝐸𝑙
𝜔
(𝑃2𝜔)2 ~ 𝐼2𝜔 = 𝐴 ∗ 𝑁2𝐸𝑎𝑝𝑝𝑙𝑖𝑒𝑑2 𝐼𝜔
2
•Note 𝐼2𝜔 is proportional to 𝐸𝑎𝑝𝑝𝑙𝑖𝑒𝑑2 and 𝐼𝜔
2 and A is calibrated by using known applied voltage
•Cannot distinguish between negative and positive polarity by E-FISH alone
Dogariu et al. Phys. Rev. Applied 7, 024024 (2017) 10
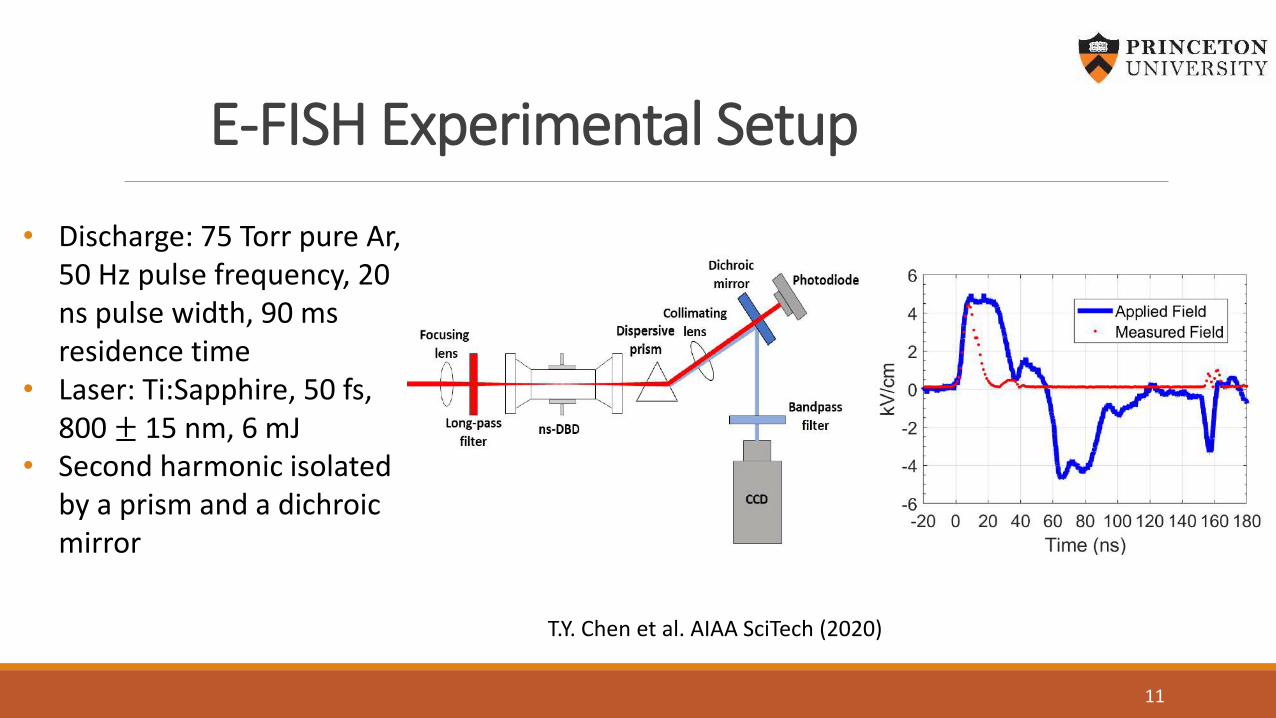
E-FISH Experimental Setup
• Discharge: 75 Torr pure Ar, 50 Hz pulse frequency, 20 ns pulse width, 90 msresidence time
• Laser: Ti:Sapphire, 50 fs, 800 ± 15 nm, 6 mJ
• Second harmonic isolated by a prism and a dichroic mirror
11
T.Y. Chen et al. AIAA SciTech (2020)
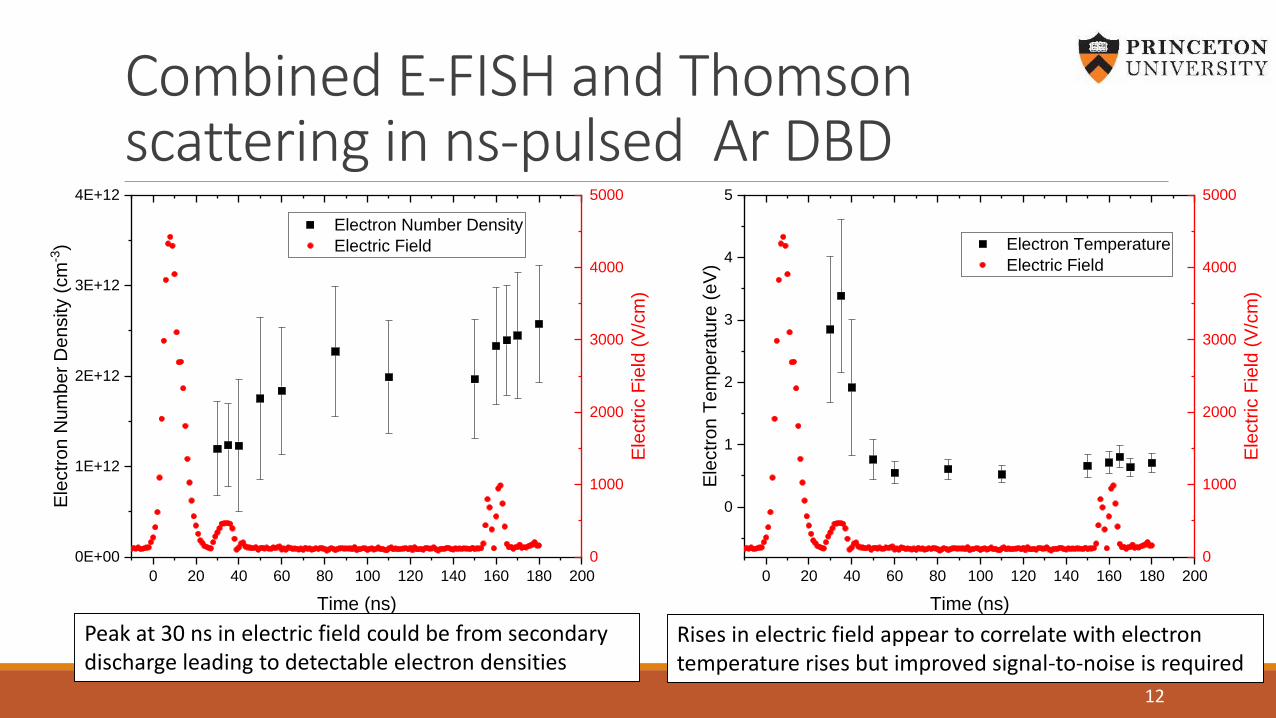
Combined E-FISH and Thomson scattering in ns-pulsed Ar DBD
0 20 40 60 80 100 120 140 160 180 200
0E+00
1E+12
2E+12
3E+12
4E+12
Electron Number Density
Electric Field
Ele
ctr
on
Num
be
r D
ensity (
cm
-3)
Time (ns)
0
1000
2000
3000
4000
5000
Ele
ctr
ic F
ield
(V
/cm
)
12
Peak at 30 ns in electric field could be from secondary discharge leading to detectable electron densities
0 20 40 60 80 100 120 140 160 180 200
0
1
2
3
4
5
Electron Temperature
Electric Field
Ele
ctr
on
Te
mp
era
ture
(e
V)
Time (ns)
0
1000
2000
3000
4000
5000
Ele
ctr
ic F
ield
(V
/cm
)
Rises in electric field appear to correlate with electron temperature rises but improved signal-to-noise is required
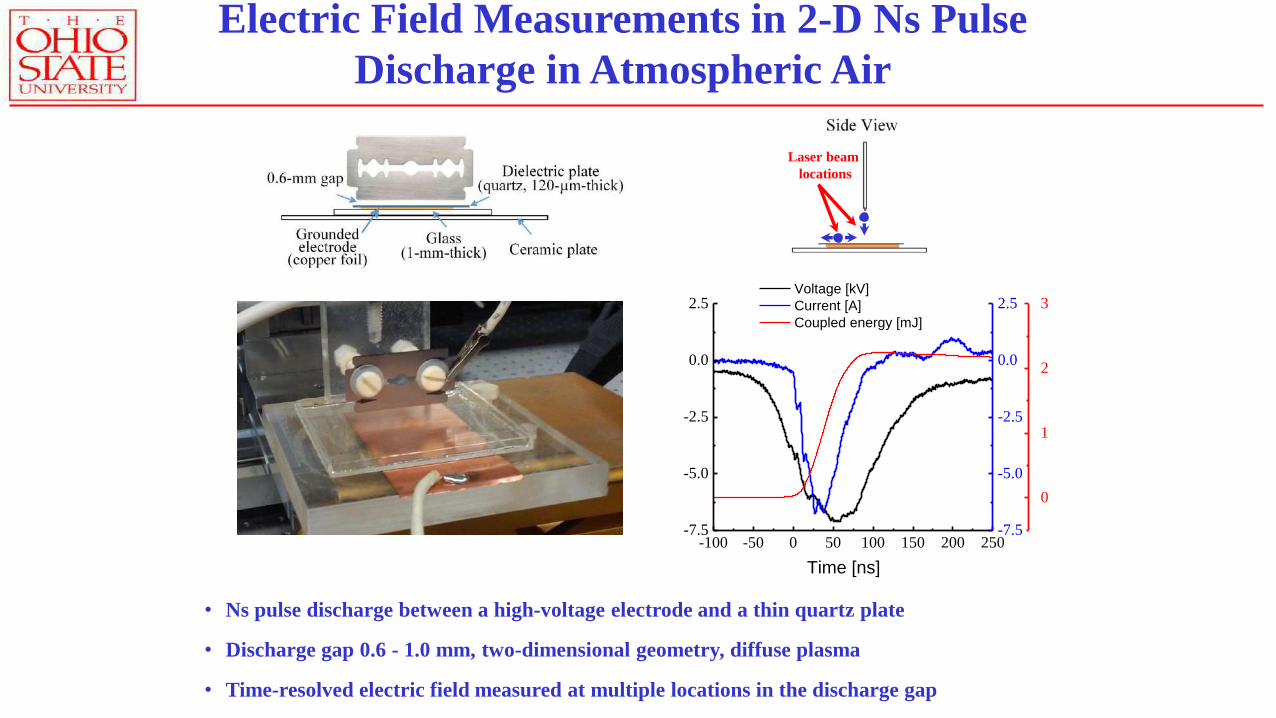
Electric Field Measurements in 2-D Ns Pulse
Discharge in Atmospheric Air
• Ns pulse discharge between a high-voltage electrode and a thin quartz plate
• Discharge gap 0.6 - 1.0 mm, two-dimensional geometry, diffuse plasma
• Time-resolved electric field measured at multiple locations in the discharge gap
-100 -50 0 50 100 150 200 250-7.5
-5.0
-2.5
0.0
2.5
Time [ns]
-7.5
-5.0
-2.5
0.0
2.5
0
1
2
3 Voltage [kV]
Current [A]
Coupled energy [mJ]
Laser beam
locations
Front view, 100 ns gate
Side view, 2 ns gateTop view, 2 ns gate
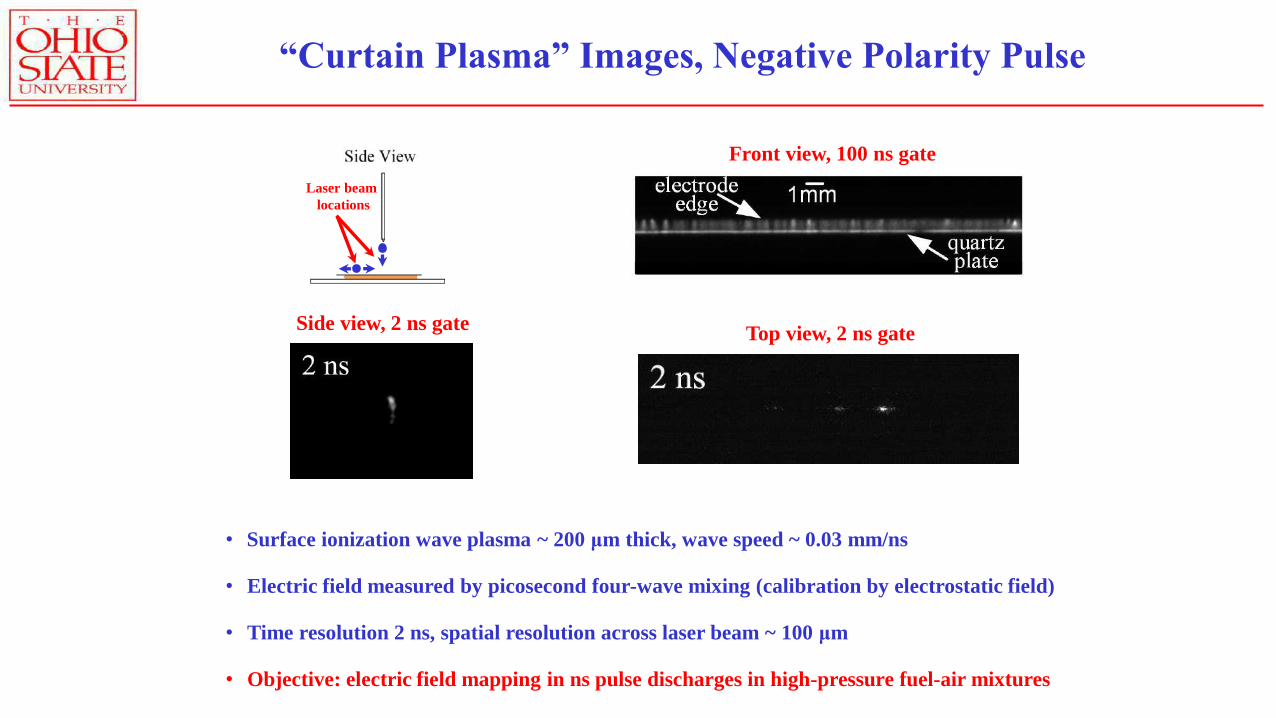
• Surface ionization wave plasma ~ 200 μm thick, wave speed ~ 0.03 mm/ns
• Electric field measured by picosecond four-wave mixing (calibration by electrostatic field)
• Time resolution 2 ns, spatial resolution across laser beam ~ 100 μm
• Objective: electric field mapping in ns pulse discharges in high-pressure fuel-air mixtures
“Curtain Plasma” Images, Negative Polarity Pulse
Laser beam
locations
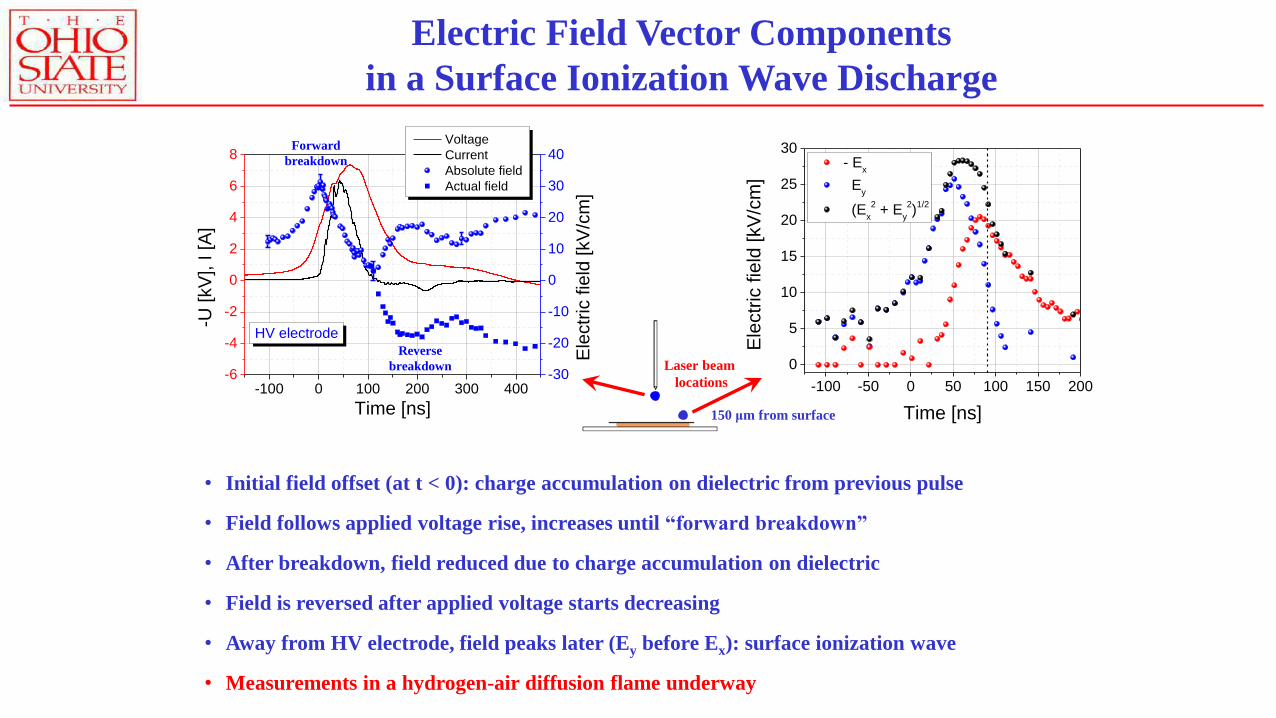
Electric Field Vector Components
in a Surface Ionization Wave Discharge
• Initial field offset (at t < 0): charge accumulation on dielectric from previous pulse
• Field follows applied voltage rise, increases until “forward breakdown”
• After breakdown, field reduced due to charge accumulation on dielectric
• Field is reversed after applied voltage starts decreasing
• Away from HV electrode, field peaks later (Ey before Ex): surface ionization wave
• Measurements in a hydrogen-air diffusion flame underway
Laser beam
locations-100 0 100 200 300 400-6
-4
-2
0
2
4
6
8 Voltage
Current
Absolute field
Actual field
Time [ns]
-U [
kV
], I [
A]
-30
-20
-10
0
10
20
30
40
Ele
ctr
ic f
ield
[kV
/cm
]
HV electrode
Forward
breakdown
Reverse
breakdown
-100 -50 0 50 100 150 200
0
5
10
15
20
25
30
- Ex
Ey
(Ex
2 + E
y
2)
1/2
Ele
ctr
ic f
ield
[kV
/cm
]
Time [ns]150 μm from surface
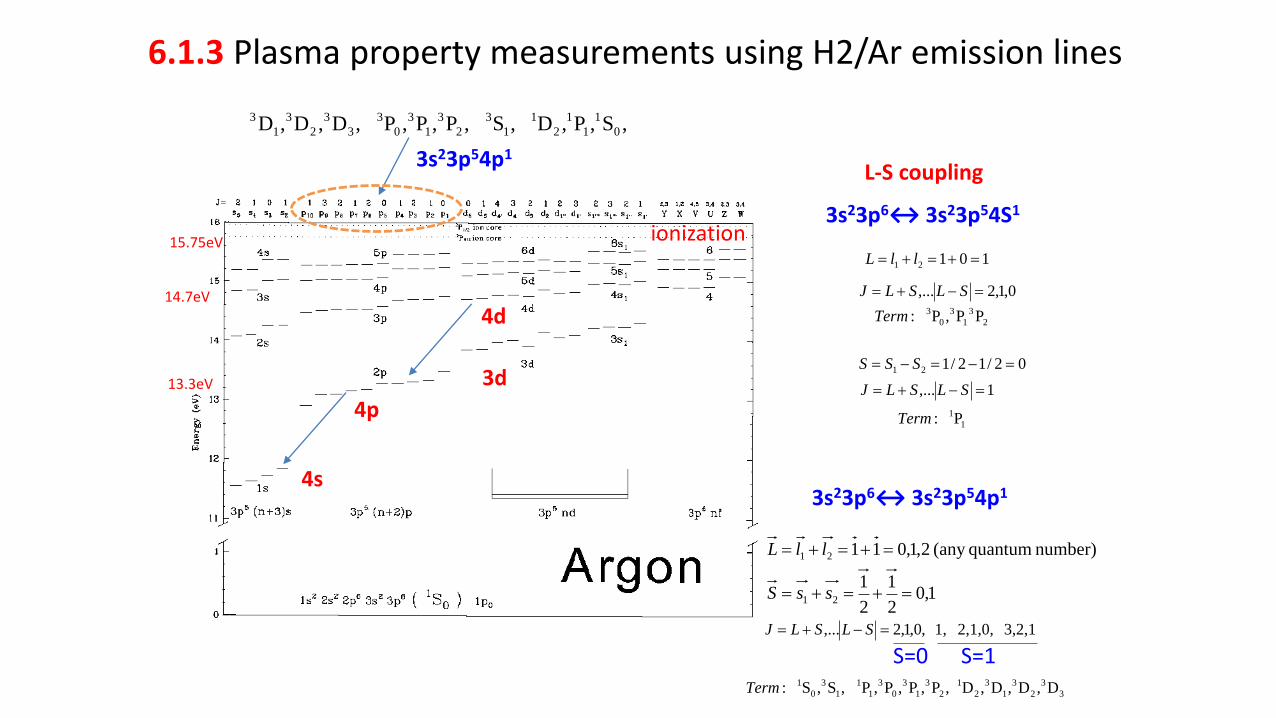
4s
4p
3d
ionization15.75eV
13.3eV
14.7eV
4d
3s23p6↔ 3s23p54S1
10121 llL
0,1,2,... SLSLJ
2
3
1
3
0
3 PP,P :Term
02/12/121 SSS
1,... SLSLJ
1
1P :Term
3s23p6↔ 3s23p54p1
1,02
1
2
1
number) quantum(any 2,1,011
21
21
ssS
llL
3
3
2
3
1
3
2
1
2
3
1
3
0
3
1
1
1
3
0
1 D,D,D,D ,P,P,P,P ,S,S :Term
3,2,1 2,1,0, 1, ,0,1,2,... SLSLJ
S=0 S=1
L-S coupling
,S,P,D ,S ,P,P,P ,D,D,D 0
1
1
1
2
1
1
3
2
3
1
3
0
3
3
3
2
3
1
3
3s23p54p1
6.1.3 Plasma property measurements using H2/Ar emission lines
17
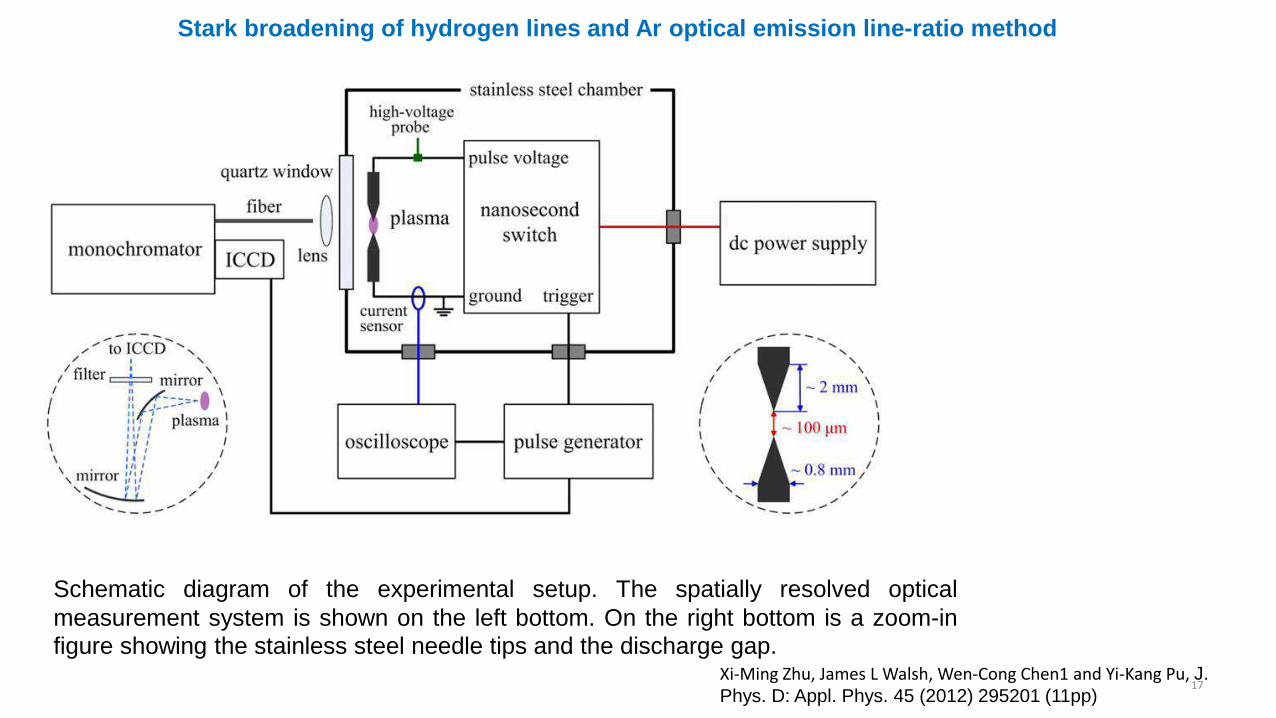
Stark broadening of hydrogen lines and Ar optical emission line-ratio method
Schematic diagram of the experimental setup. The spatially resolved optical
measurement system is shown on the left bottom. On the right bottom is a zoom-in
figure showing the stainless steel needle tips and the discharge gap.Xi-Ming Zhu, James L Walsh, Wen-Cong Chen1 and Yi-Kang Pu, J.
Phys. D: Appl. Phys. 45 (2012) 295201 (11pp)
18
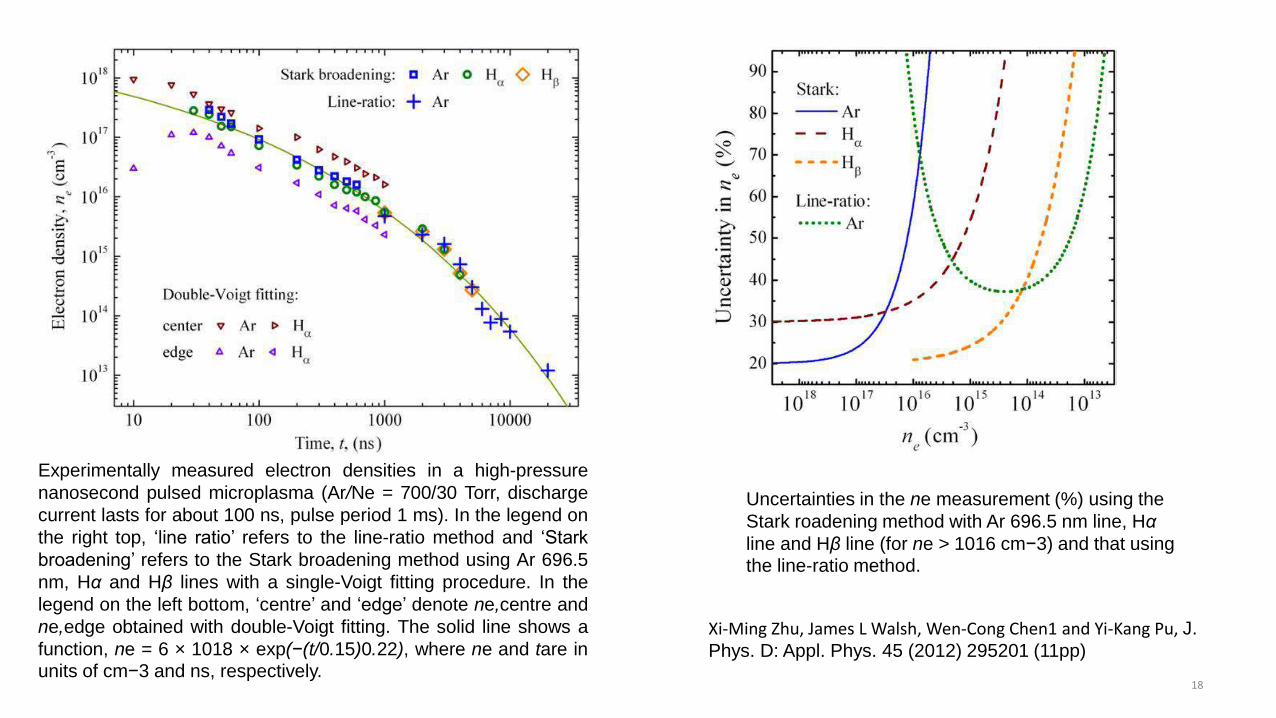
Experimentally measured electron densities in a high-pressure
nanosecond pulsed microplasma (Ar/Ne = 700/30 Torr, discharge
current lasts for about 100 ns, pulse period 1 ms). In the legend on
the right top, ‘line ratio’ refers to the line-ratio method and ‘Stark
broadening’ refers to the Stark broadening method using Ar 696.5
nm, Hα and Hβ lines with a single-Voigt fitting procedure. In the
legend on the left bottom, ‘centre’ and ‘edge’ denote ne,centre and
ne,edge obtained with double-Voigt fitting. The solid line shows a
function, ne = 6 × 10¹⁸ × exp(−(t/0.15)0.22), where ne and tare inunits of cm−3 and ns, respectively.
Uncertainties in the ne measurement (%) using the
Stark roadening method with Ar 696.5 nm line, Hα
line and Hβ line (for ne > 1016 cm−3) and that using the line-ratio method.
Xi-Ming Zhu, James L Walsh, Wen-Cong Chen1 and Yi-Kang Pu, J.
Phys. D: Appl. Phys. 45 (2012) 295201 (11pp)
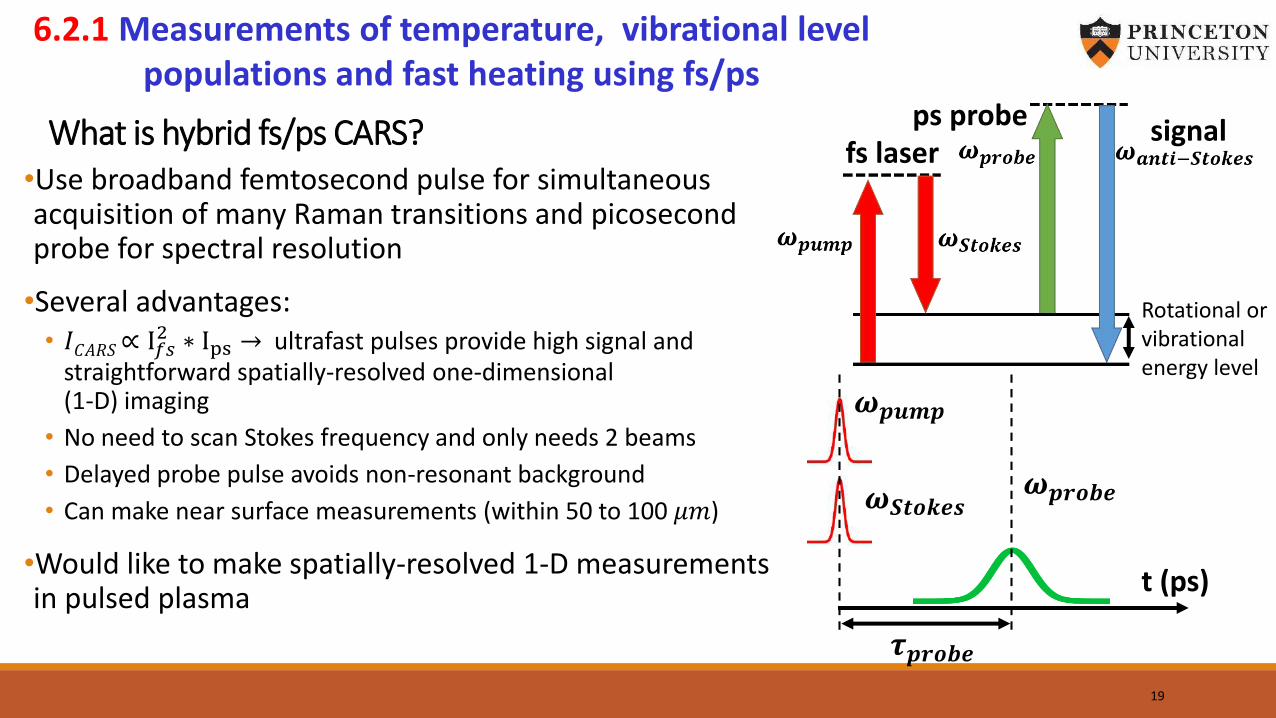
What is hybrid fs/ps CARS?•Use broadband femtosecond pulse for simultaneous acquisition of many Raman transitions and picosecond probe for spectral resolution
•Several advantages:• 𝐼𝐶𝐴𝑅𝑆 ∝ I𝑓𝑠
2 ∗ Ips → ultrafast pulses provide high signal and straightforward spatially-resolved one-dimensional (1-D) imaging
• No need to scan Stokes frequency and only needs 2 beams
• Delayed probe pulse avoids non-resonant background
• Can make near surface measurements (within 50 to 100 𝜇𝑚)
•Would like to make spatially-resolved 1-D measurements in pulsed plasma
𝝎𝒑𝒖𝒎𝒑
𝝎𝑺𝒕𝒐𝒌𝒆𝒔𝝎𝒑𝒓𝒐𝒃𝒆
t (ps)
𝝉𝒑𝒓𝒐𝒃𝒆
Rotational or vibrational energy level
19
fs laserps probe signal
6.2.1 Measurements of temperature, vibrational level populations and fast heating using fs/ps
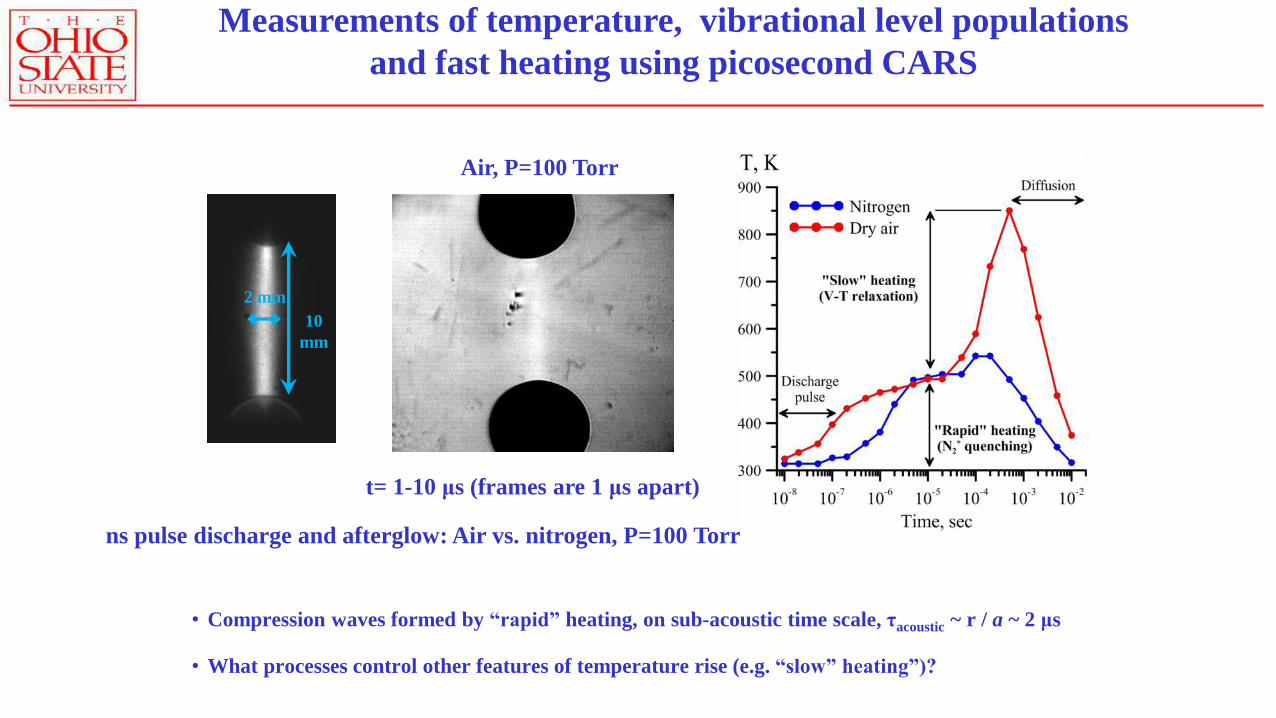
Measurements of temperature, vibrational level populations
and fast heating using picosecond CARS
• Compression waves formed by “rapid” heating, on sub-acoustic time scale, τacoustic ~ r / a ~ 2 μs
• What processes control other features of temperature rise (e.g. “slow” heating”)?
t= 1-10 μs (frames are 1 μs apart)
Air, P=100 Torr
10
mm
2 mm
ns pulse discharge and afterglow: Air vs. nitrogen, P=100 Torr
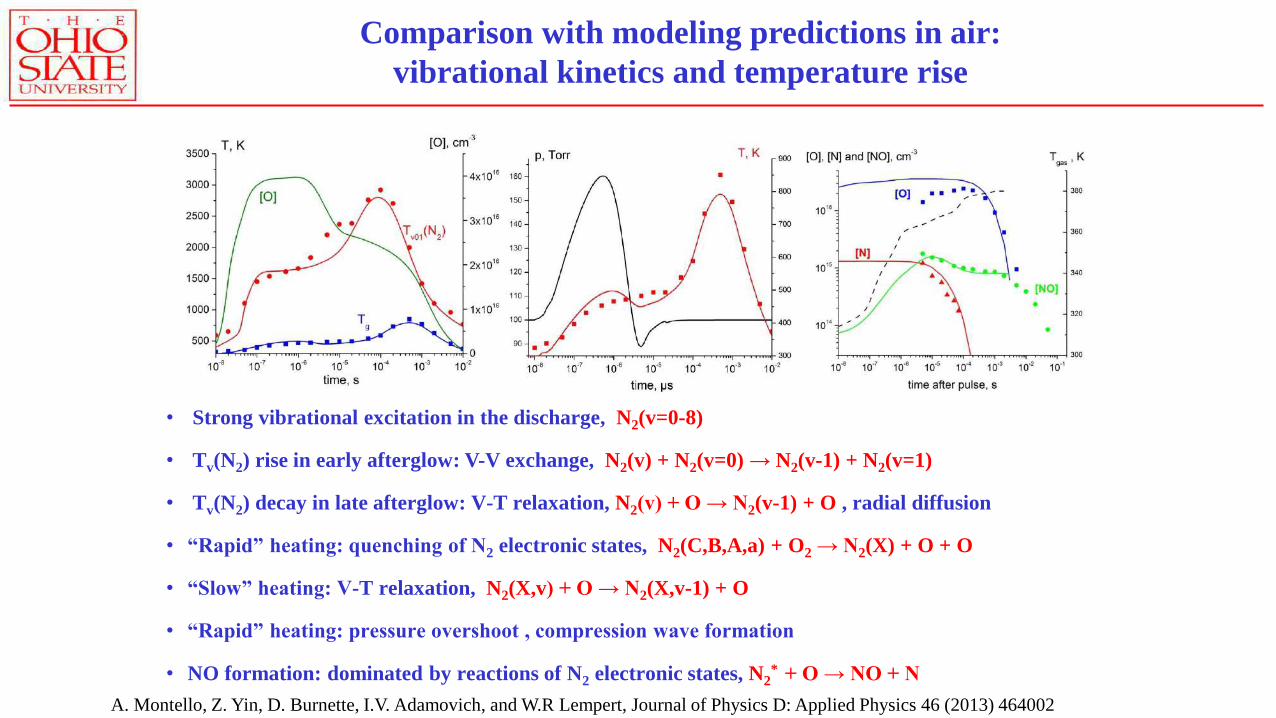
• Strong vibrational excitation in the discharge, N2(v=0-8)
• Tv(N2) rise in early afterglow: V-V exchange, N2(v) + N2(v=0) → N2(v-1) + N2(v=1)
• Tv(N2) decay in late afterglow: V-T relaxation, N2(v) + O → N2(v-1) + O , radial diffusion
• “Rapid” heating: quenching of N2 electronic states, N2(C,B,A,a) + O2 → N2(X) + O + O
• “Slow” heating: V-T relaxation, N2(X,v) + O → N2(X,v-1) + O
• “Rapid” heating: pressure overshoot , compression wave formation
• NO formation: dominated by reactions of N2 electronic states, N2* + O → NO + N
Comparison with modeling predictions in air:
vibrational kinetics and temperature rise
A. Montello, Z. Yin, D. Burnette, I.V. Adamovich, and W.R Lempert, Journal of Physics D: Applied Physics 46 (2013) 464002
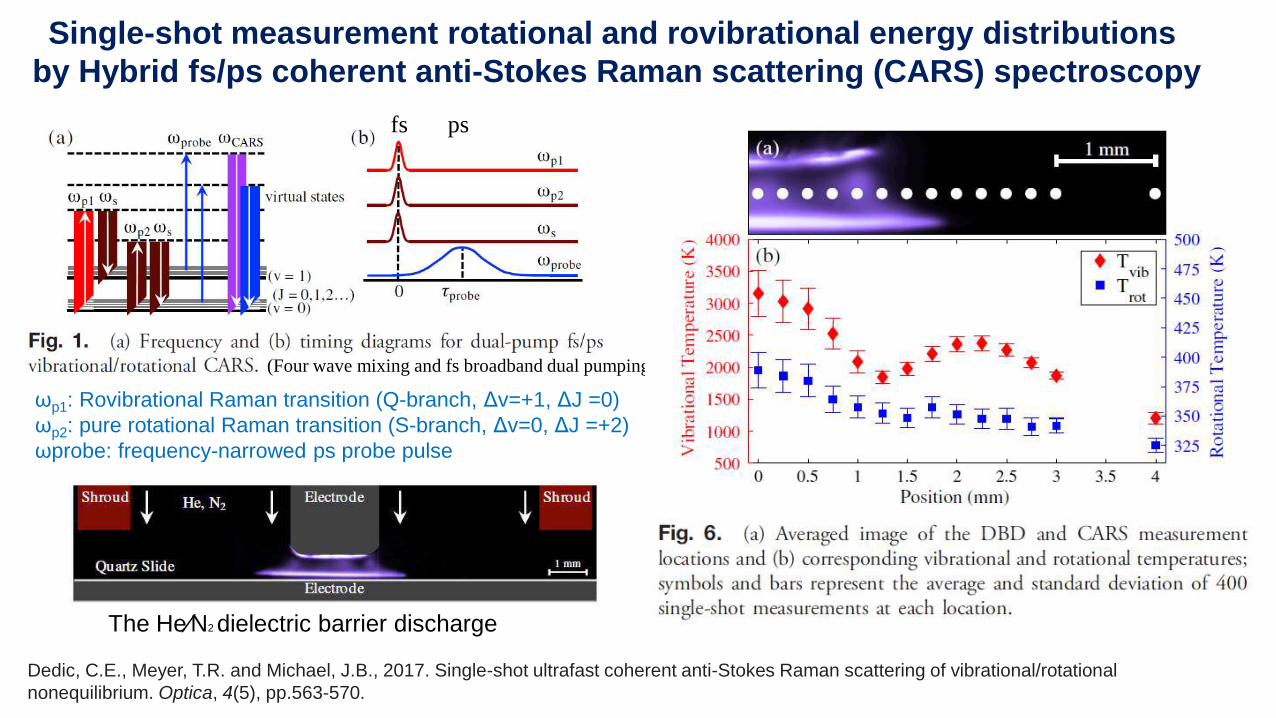
Single-shot measurement rotational and rovibrational energy distributions
by Hybrid fs/ps coherent anti-Stokes Raman scattering (CARS) spectroscopy
(Four wave mixing and fs broadband dual pumping)
fs ps
ωp1: Rovibrational Raman transition (Q-branch, Δv=+1, ΔJ =0)
ωp2: pure rotational Raman transition (S-branch, Δv=0, ΔJ =+2)
ωprobe: frequency-narrowed ps probe pulse
Dedic, C.E., Meyer, T.R. and Michael, J.B., 2017. Single-shot ultrafast coherent anti-Stokes Raman scattering of vibrational/rotational
nonequilibrium. Optica, 4(5), pp.563-570.
The He∕N2 dielectric barrier discharge
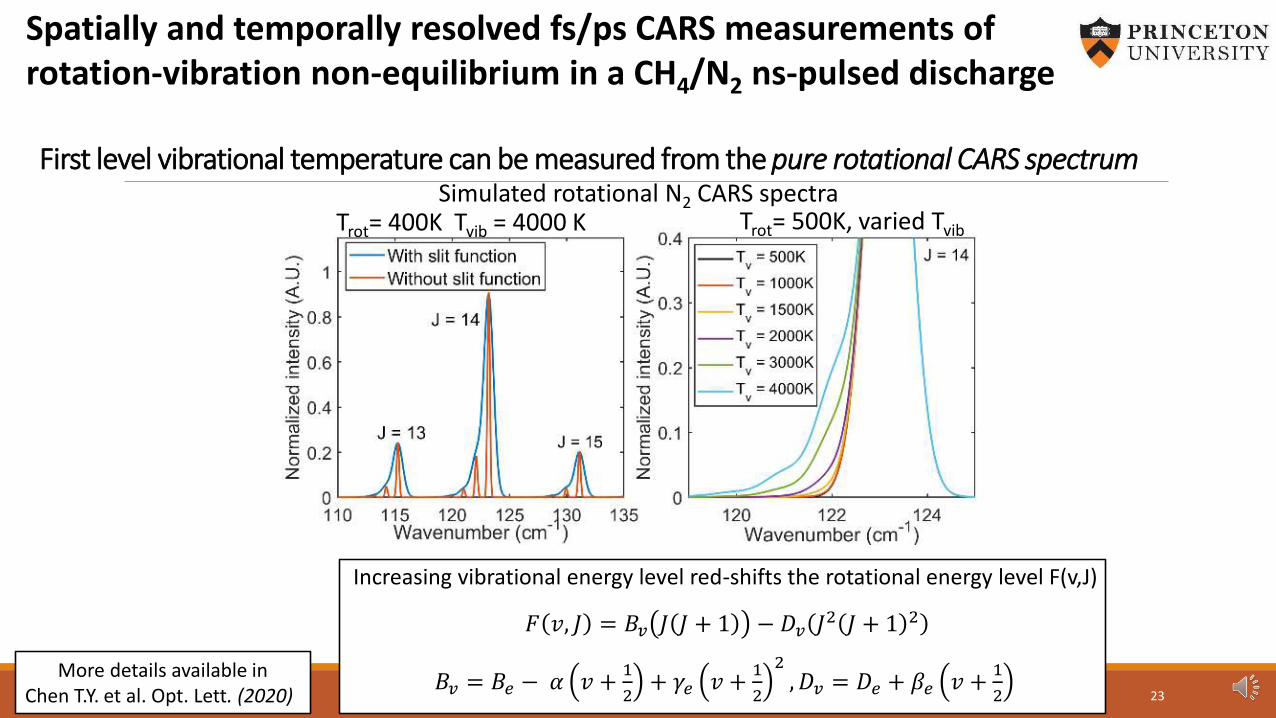
First level vibrational temperature can be measured from the pure rotational CARS spectrum
Increasing vibrational energy level red-shifts the rotational energy level F(v,J)
𝐹 𝑣, 𝐽 = 𝐵𝑣 𝐽 𝐽 + 1 − 𝐷𝑣 𝐽2 𝐽 + 1 2
𝐵𝑣 = 𝐵𝑒 − 𝛼 𝑣 +1
2+ 𝛾𝑒 𝑣 +
1
2
2, 𝐷𝑣 = 𝐷𝑒 + 𝛽𝑒 𝑣 +
1
2 23
Simulated rotational N2 CARS spectraTrot= 400K Tvib = 4000 K Trot= 500K, varied Tvib
More details available inChen T.Y. et al. Opt. Lett. (2020)
Spatially and temporally resolved fs/ps CARS measurements of rotation-vibration non-equilibrium in a CH4/N2 ns-pulsed discharge
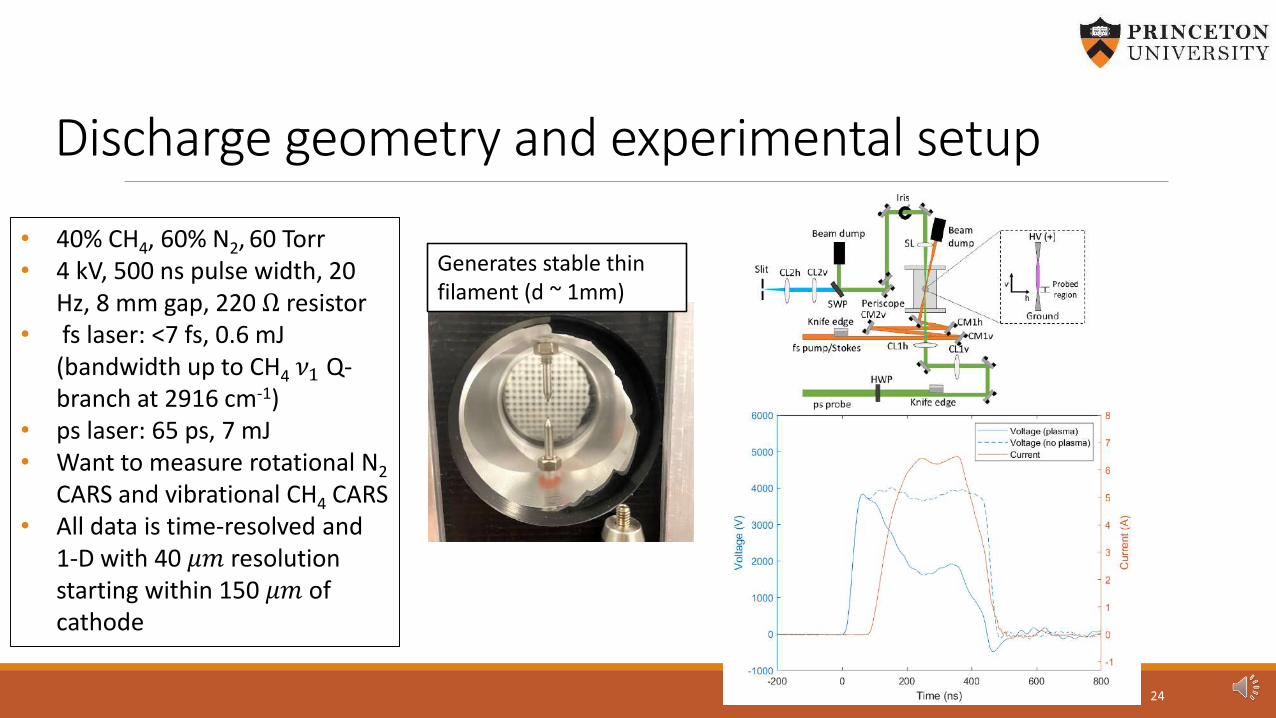
Discharge geometry and experimental setup
24
Generates stable thin filament (d ~ 1mm)
• 40% CH4, 60% N2, 60 Torr• 4 kV, 500 ns pulse width, 20
Hz, 8 mm gap, 220 Ω resistor• fs laser: <7 fs, 0.6 mJ
(bandwidth up to CH4 𝜈1 Q-branch at 2916 cm-1)
• ps laser: 65 ps, 7 mJ• Want to measure rotational N2
CARS and vibrational CH4 CARS• All data is time-resolved and
1-D with 40 𝜇𝑚 resolution starting within 150 𝜇𝑚 of cathode
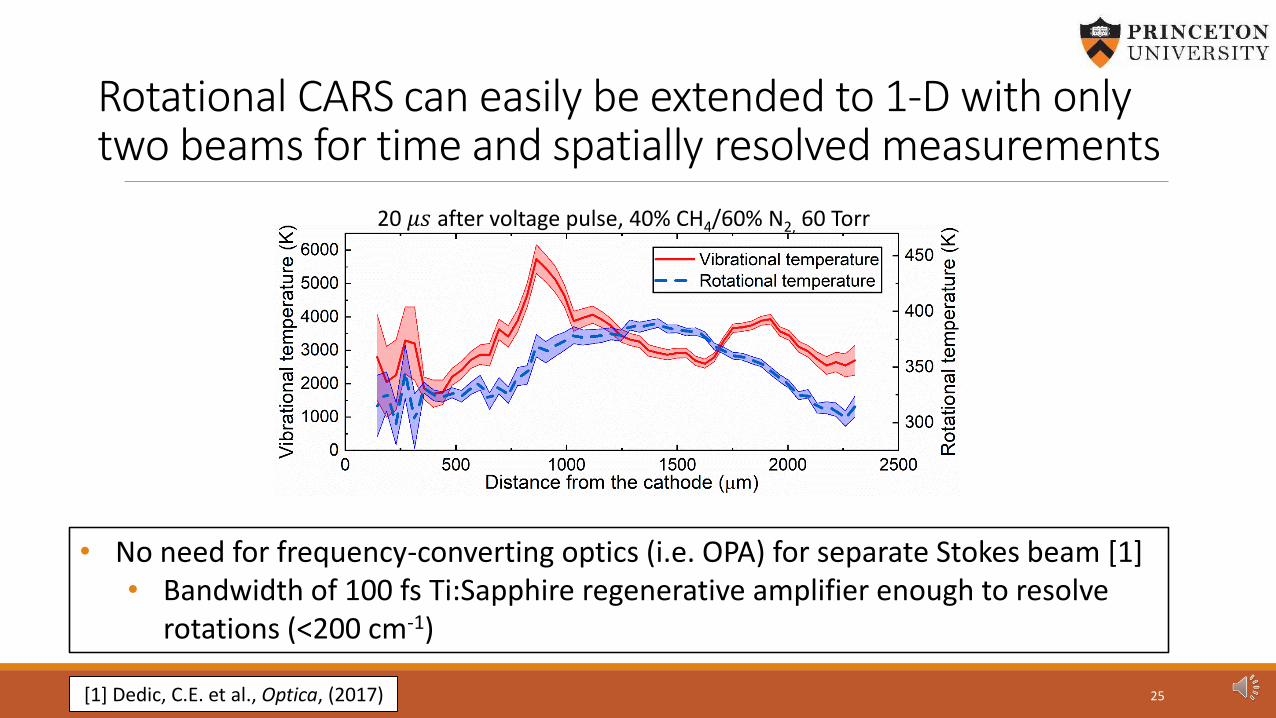
Rotational CARS can easily be extended to 1-D with only two beams for time and spatially resolved measurements
25
• No need for frequency-converting optics (i.e. OPA) for separate Stokes beam [1]• Bandwidth of 100 fs Ti:Sapphire regenerative amplifier enough to resolve
rotations (<200 cm-1)
20 𝜇𝑠 after voltage pulse, 40% CH4/60% N2, 60 Torr
[1] Dedic, C.E. et al., Optica, (2017)
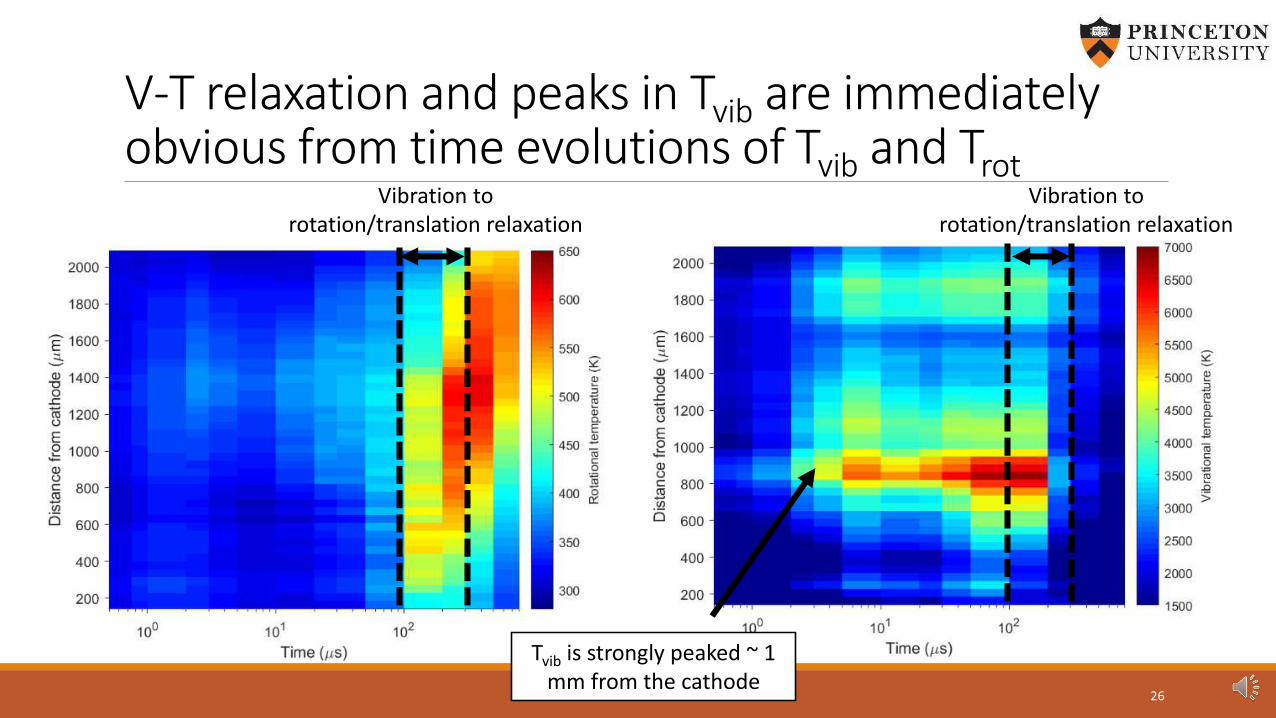
V-T relaxation and peaks in Tvib are immediately obvious from time evolutions of Tvib and Trot
Vibration to rotation/translation relaxation
Vibration to rotation/translation relaxation
26
Tvib is strongly peaked ~ 1 mm from the cathode
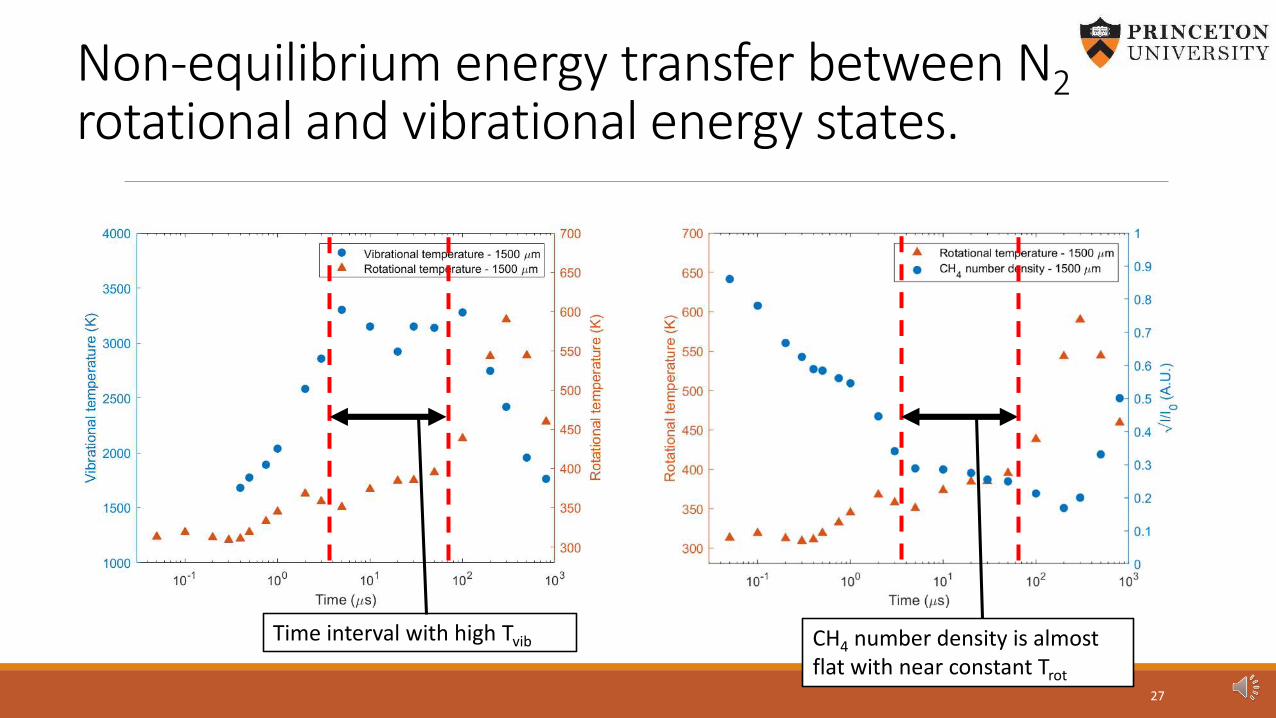
Non-equilibrium energy transfer between N2rotational and vibrational energy states.
27
CH4 number density is almost flat with near constant Trot
Time interval with high Tvib
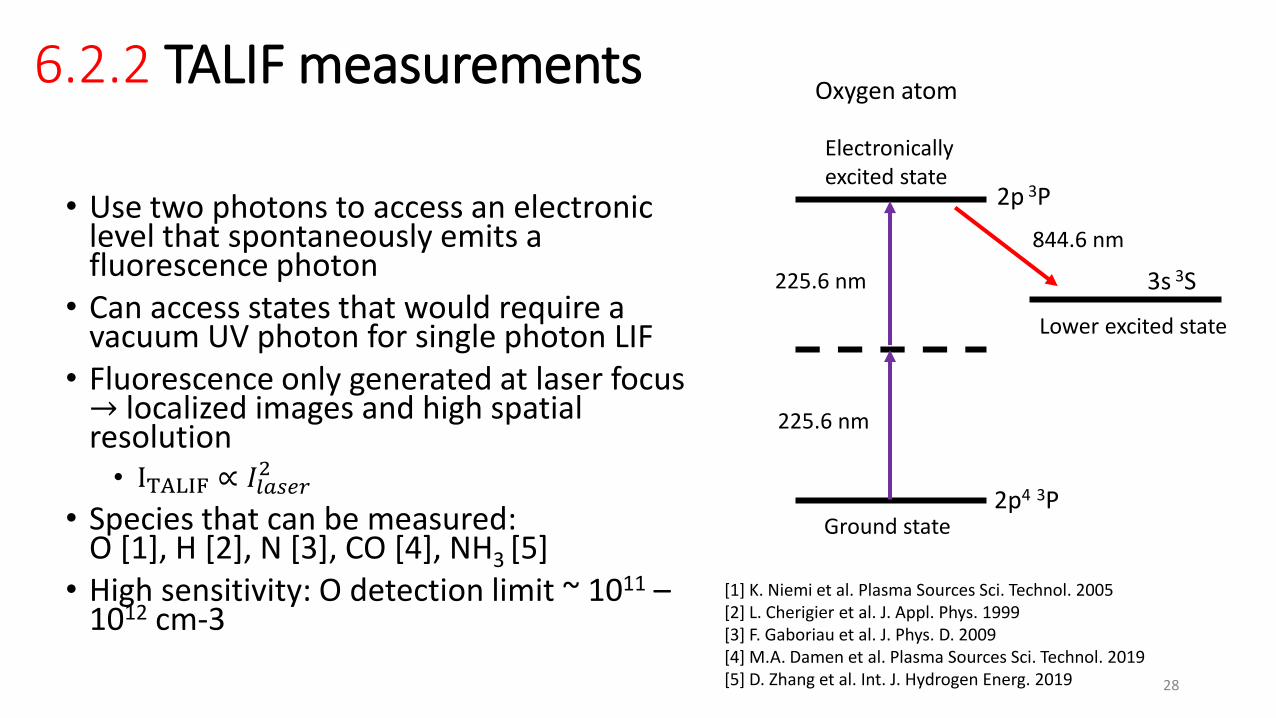
6.2.2 TALIF measurements
• Use two photons to access an electronic level that spontaneously emits a fluorescence photon
• Can access states that would require a vacuum UV photon for single photon LIF
• Fluorescence only generated at laser focus → localized images and high spatial resolution• ITALIF ∝ 𝐼𝑙𝑎𝑠𝑒𝑟
2
• Species that can be measured: O [1], H [2], N [3], CO [4], NH3 [5]
• High sensitivity: O detection limit ~ 1011 –1012 cm-3
Ground state
Electronically excited state
Lower excited state
225.6 nm
225.6 nm
Oxygen atom
2p 3P
3s 3S
2p4 3P
844.6 nm
[1] K. Niemi et al. Plasma Sources Sci. Technol. 2005[2] L. Cherigier et al. J. Appl. Phys. 1999[3] F. Gaboriau et al. J. Phys. D. 2009[4] M.A. Damen et al. Plasma Sources Sci. Technol. 2019[5] D. Zhang et al. Int. J. Hydrogen Energ. 2019 28
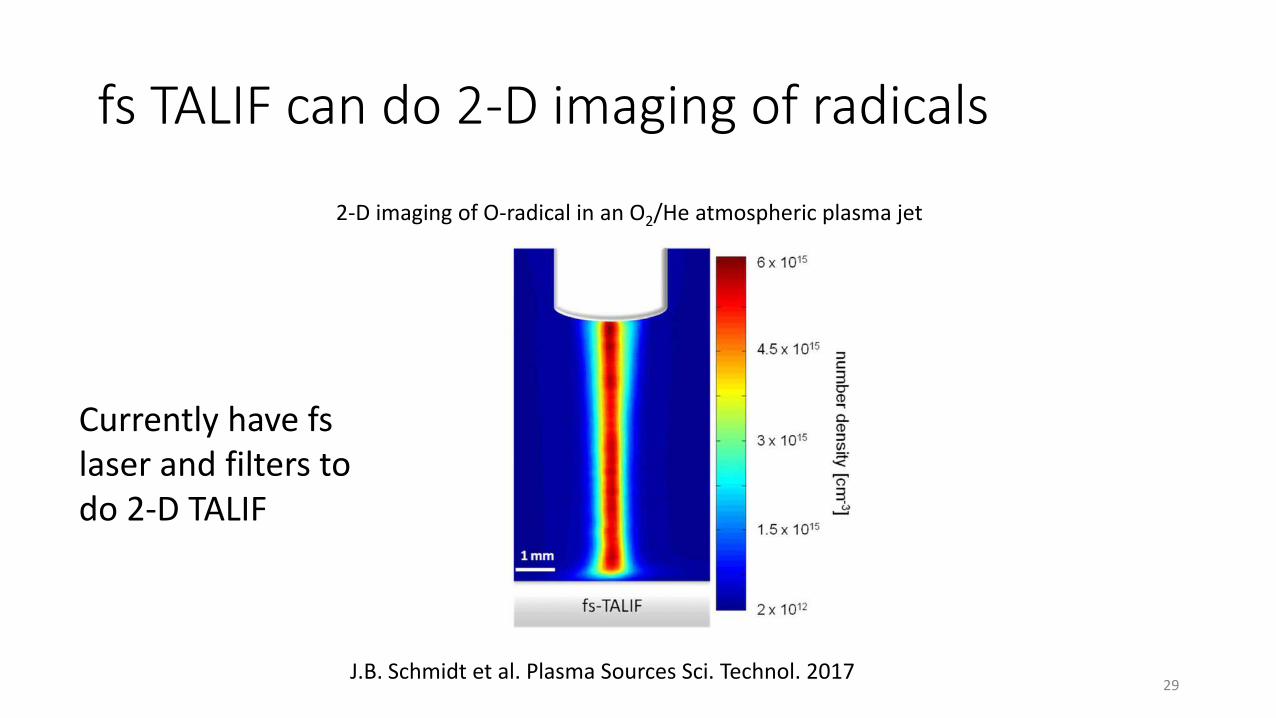
fs TALIF can do 2-D imaging of radicals
29
2-D imaging of O-radical in an O2/He atmospheric plasma jet
J.B. Schmidt et al. Plasma Sources Sci. Technol. 2017
Currently have fs laser and filters to do 2-D TALIF
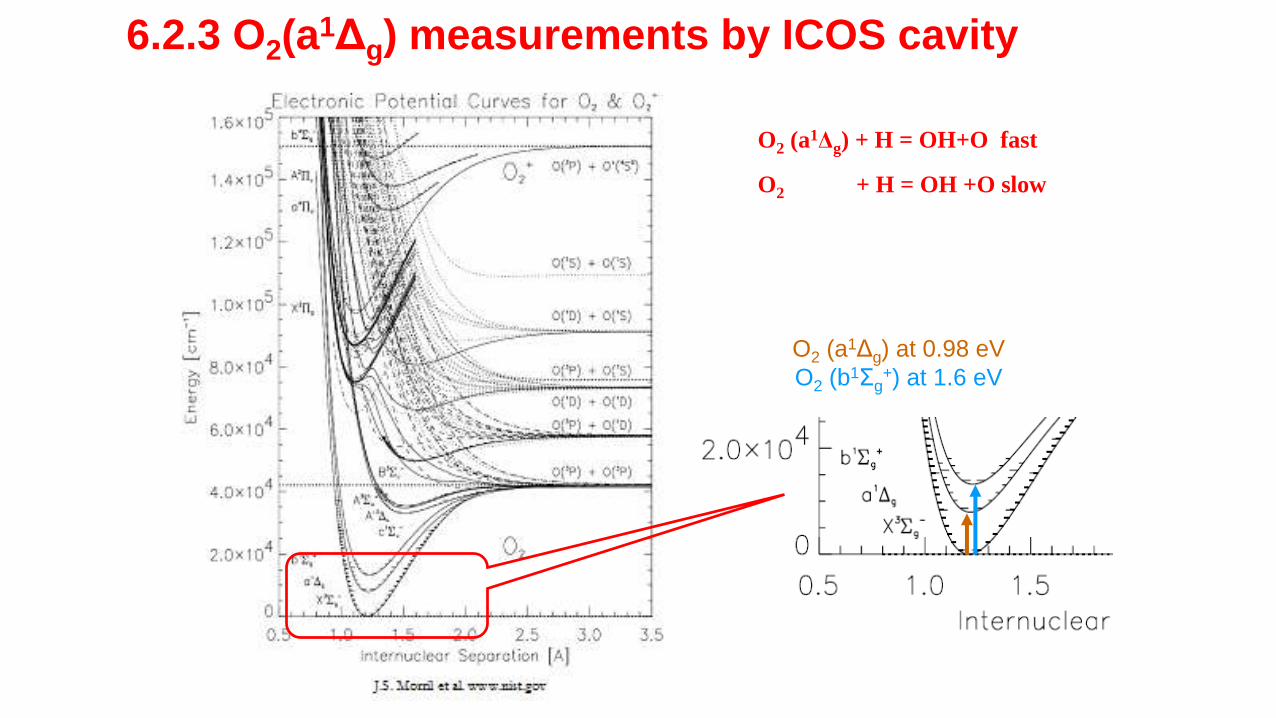
6.2.3 O2(a1Δg) measurements by ICOS cavity
O2 (a1Δg) at 0.98 eV
O2 (b1Σg+) at 1.6 eV
O2 (a1Δg) + H = OH+O fast
O2 + H = OH +O slow
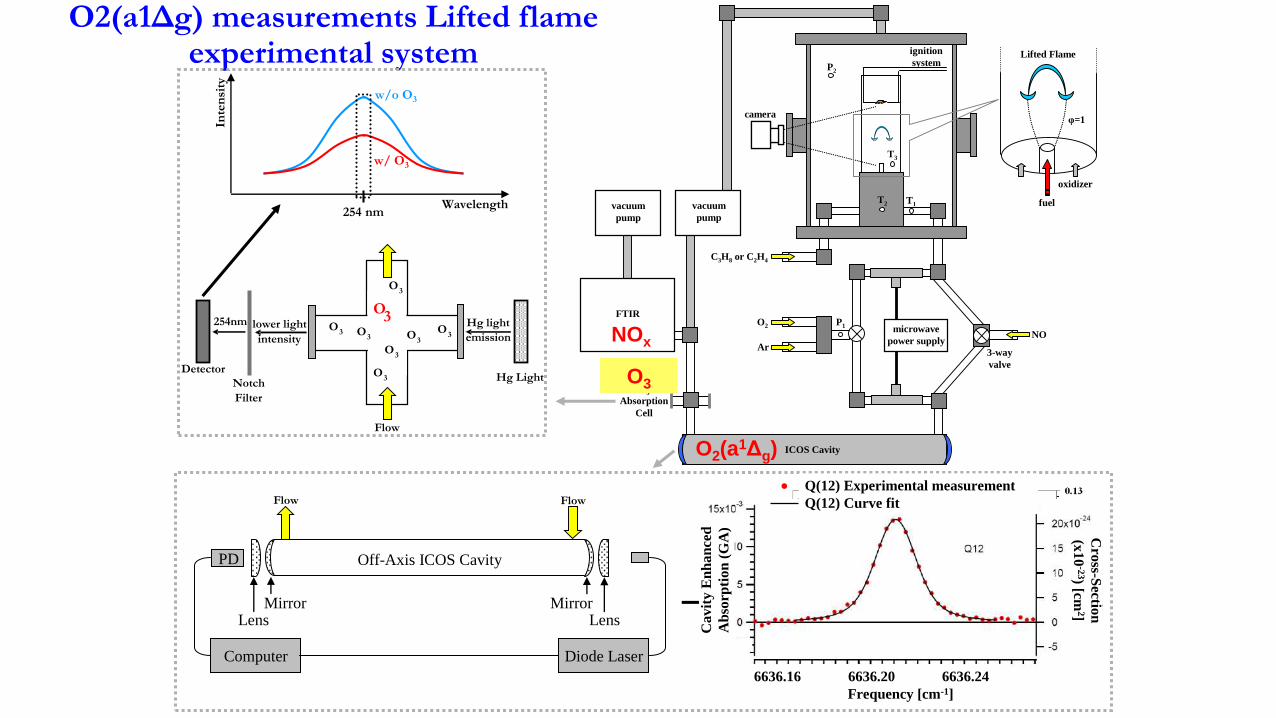
O2(a1Δg) measurements Lifted flame experimental system
microwave
power supply
T3
T2 T1 fuel
oxidizer
φ=1camera
O2
Ar
ignition
system
P1
P2
Lifted Flame
NO
ICOS Cavity
FTIR
C3H8 or C2H4
O3
Absorption
Cell
vacuum
pump
3-way
valve
vacuum
pumpIn
ten
sity
254 nmWavelength
w/o O3
w/ O3
Hg light
emissionlower light
intensity
254nm
Detector
Notch
Filter
Flow
Hg Light
O3
O3
O3
O3
O3
O3
O3
O3 O
3
Off-Axis ICOS Cavity
Diode LaserComputer
PD
LensMirror
LensMirror
Flow Flow
NOx
O3
O2(a1Δg)
6636.16 6636.20 6636.24
Frequency [cm-1]
Cro
ss-Sectio
n
(x1
0-2
3) [cm
2]
Ca
vit
y E
nh
an
ced
Ab
sorp
tio
n (
GA
)
Q(12) Experimental measurement
Q(12) Curve fit
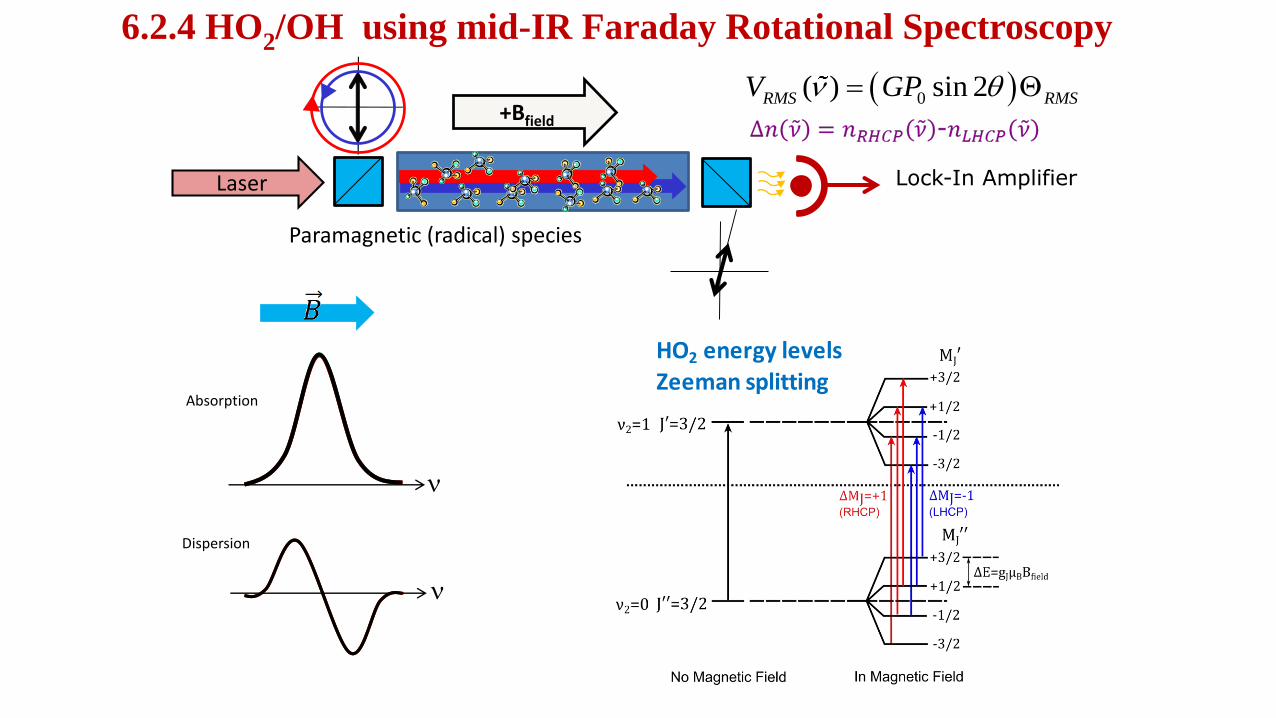
Paramagnetic (radical) species
Absorption
Dispersion
HO2 energy levelsZeeman splitting
6.2.4 HO2/OH using mid-IR Faraday Rotational Spectroscopy
Laser Lock-In Amplifier
+Bfield
0( ) sin 2RMS RMSV GP
Bremfield et al., 2013, JPC letters, 2013; Kurimoto et al. 2014
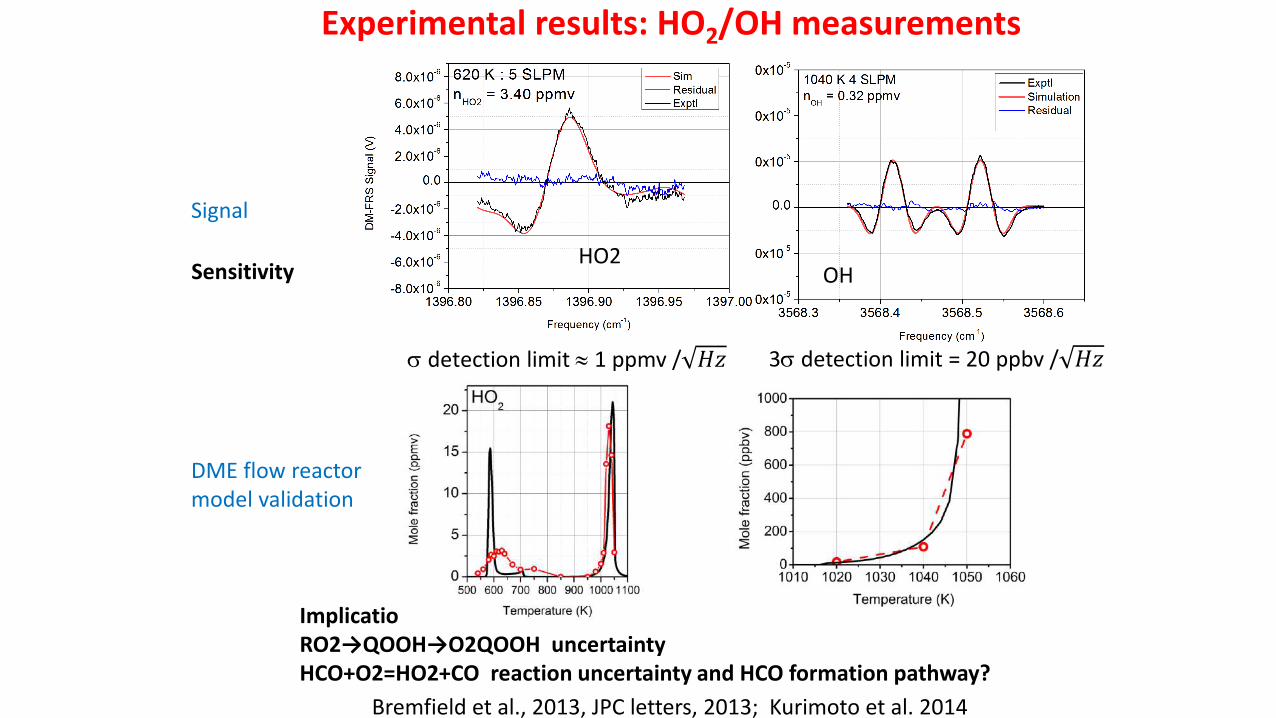
Experimental results: HO2/OH measurements
Implication:RO2→QOOH→O2QOOH uncertaintyHCO+O2=HO2+CO reaction uncertainty and HCO formation pathway?
Signal
DME flow reactormodel validation
Sensitivity OHHO2
3 detection limit = 20 ppbv / 𝐻𝑧 detection limit 1 ppmv / 𝐻𝑧
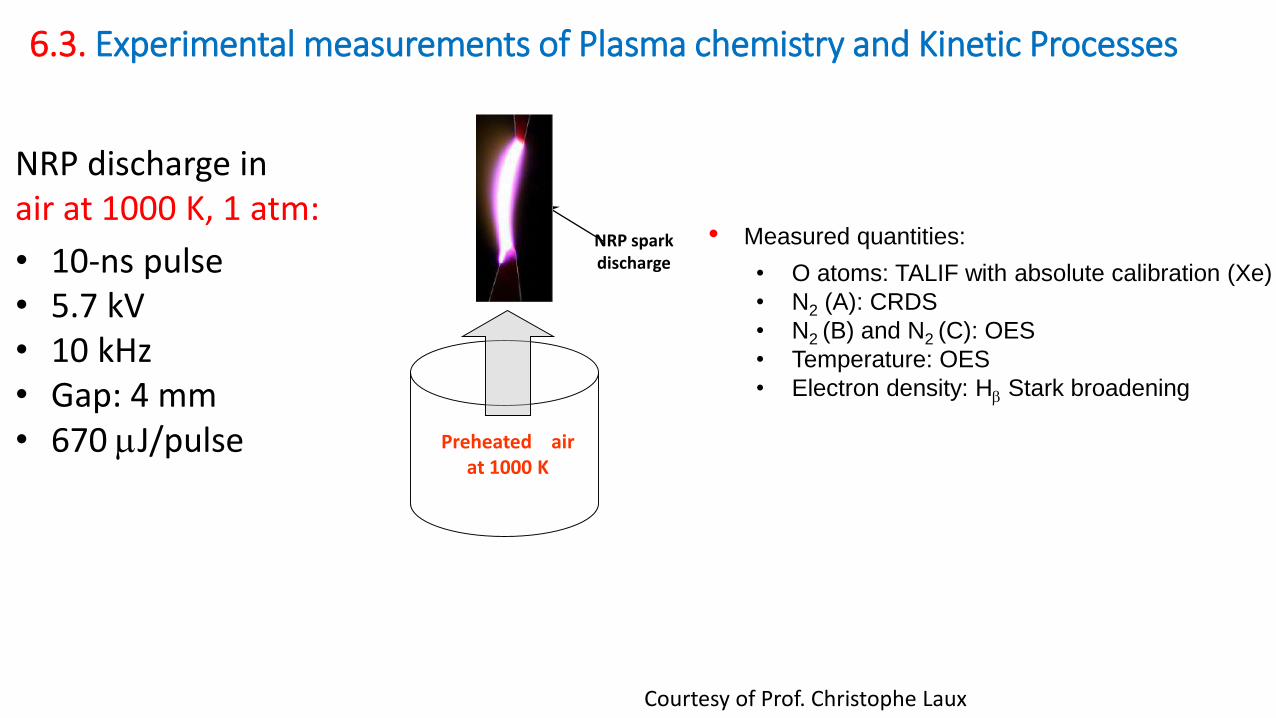
6.3. Experimental measurements of Plasma chemistry and Kinetic Processes
4.5 mm
NRP spark discharge
grounded electrode
Preheated air at 1000 K
NRP discharge in air at 1000 K, 1 atm:
• 10-ns pulse• 5.7 kV• 10 kHz• Gap: 4 mm• 670 mJ/pulse
• Measured quantities:
• O atoms: TALIF with absolute calibration (Xe)
• N2 (A): CRDS
• N2 (B) and N2 (C): OES
• Temperature: OES
• Electron density: Hb Stark broadening
Courtesy of Prof. Christophe Laux
-10 0 10 20 30 40 5010
12
1013
1014
1015
1016
1017
0
1
2
3
4
5
6
0
50
100
150
200
250
300
Time (ns)
N2(A)
N2(C)
Ab
so
lute
de
nsitie
s [
cm
-3]
N2(B)
02.0x10
17
4.0x10¹⁷
6.0x10¹⁷
8.0x10¹⁷
1.0x10¹⁸
1.2x10¹⁸
O (3P) density
1500
2000
2500 from N
2(C-B)
from N2(B-A)
Te
mp
era
ture
[K
]
Temperature
0
10
20
30
40
Cu
rre
nt [A
]
Vo
lta
ge
(V
)
V Iconduction
E/N
[T
d]
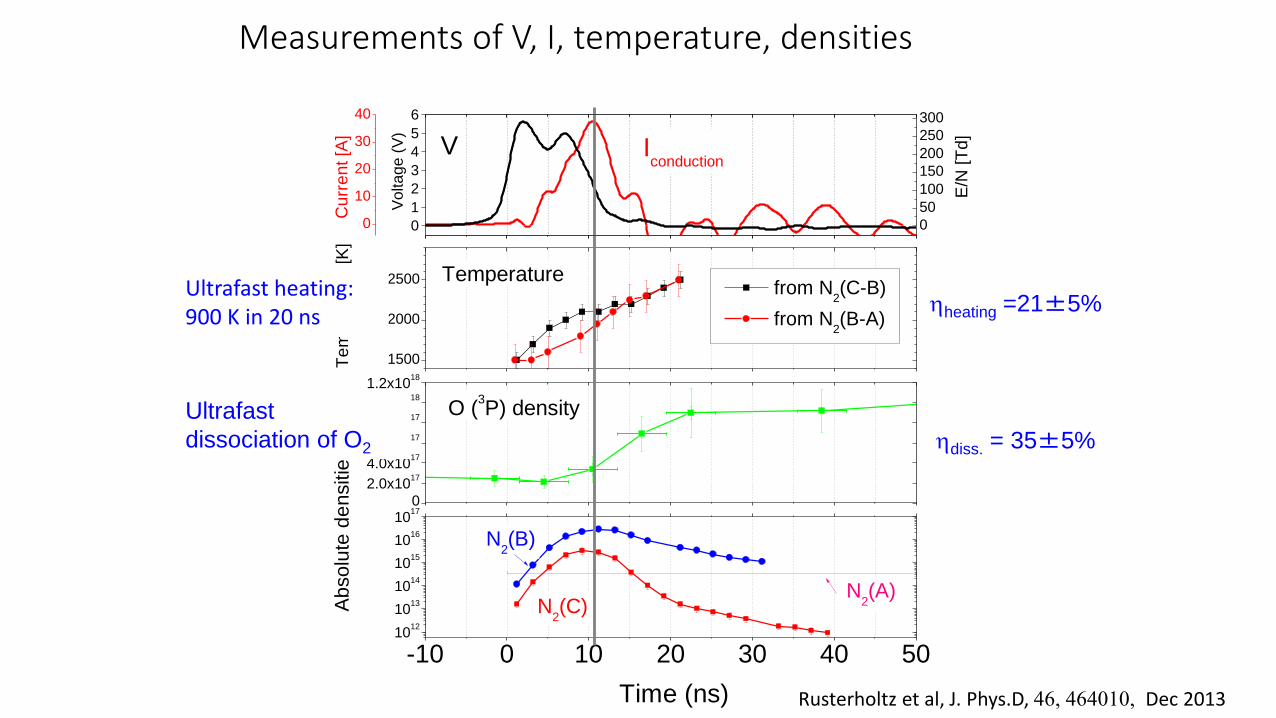
Measurements of V, I, temperature, densities
hheating =21±5%
hdiss. = 35±5%
Ultrafast heating:900 K in 20 ns
Ultrafast
dissociation of O2
Rusterholtz et al, J. Phys.D, 46, 464010, Dec 2013
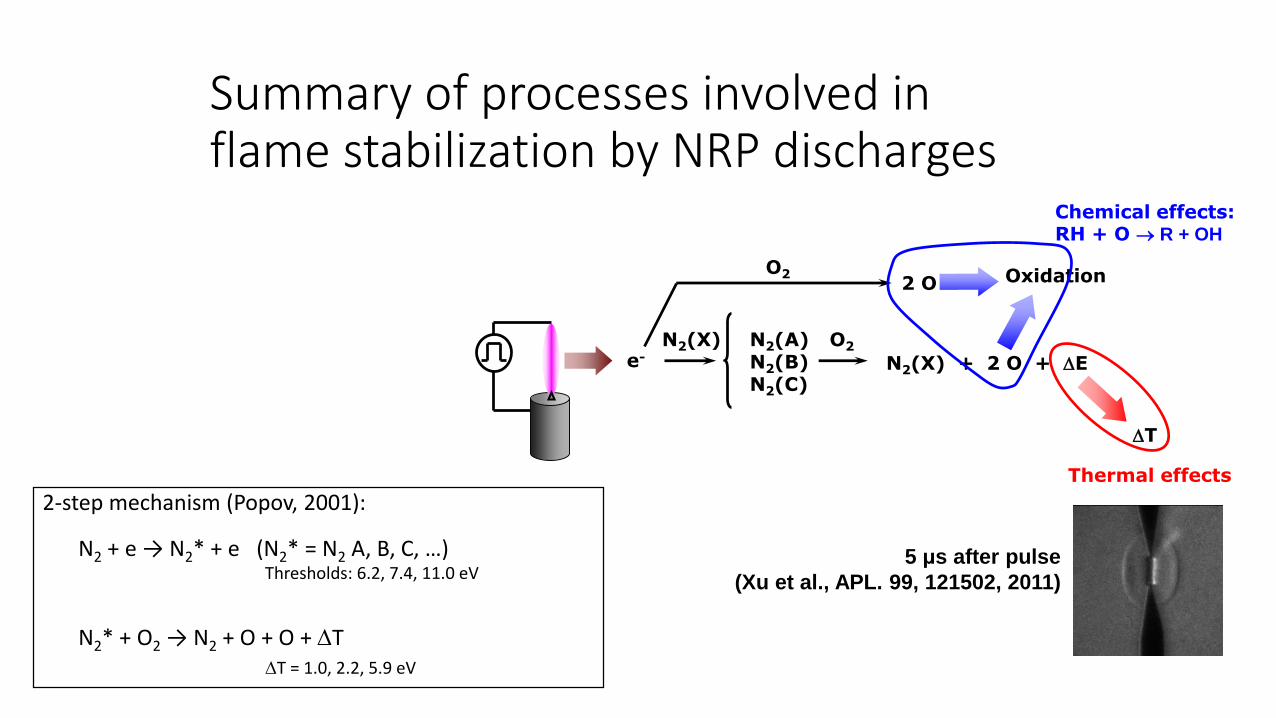
Summary of processes involved in flame stabilization by NRP discharges
e-
N2(A)N2(B)N2(C)
O2N2(X)
N2(X) + 2 O + E
T
Thermal effects
O22 O
Chemical effects: RH + O R + OH
Oxidation
5 μs after pulse
(Xu et al., APL. 99, 121502, 2011)
2-step mechanism (Popov, 2001):
N2 + e → N2* + e (N2* = N2 A, B, C, …) Thresholds: 6.2, 7.4, 11.0 eV
N2* + O2 → N2 + O + O + T T = 1.0, 2.2, 5.9 eV
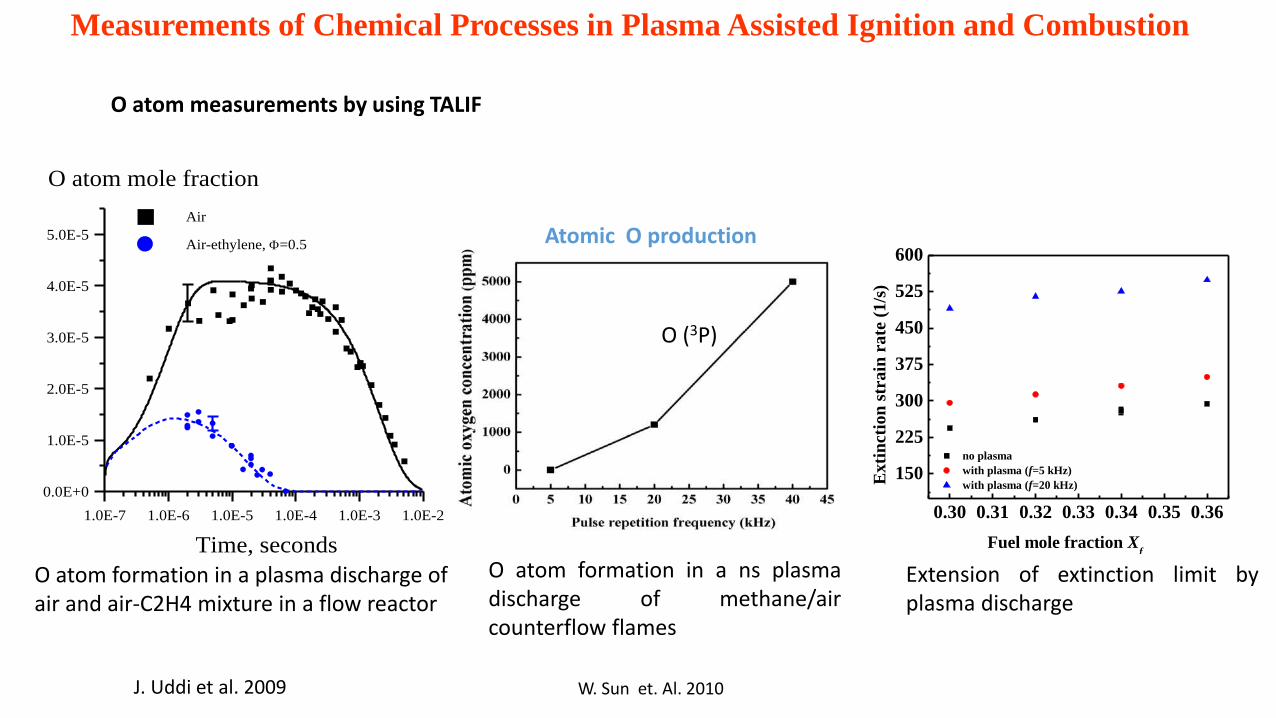
Measurements of Chemical Processes in Plasma Assisted Ignition and Combustion
0.30 0.31 0.32 0.33 0.34 0.35 0.36
150
225
300
375
450
525
600
no plasma
with plasma (f=5 kHz)
with plasma (f=20 kHz)Ex
tin
ctio
n s
tra
in r
ate
(1
/s)
Fuel mole fraction Xf
1.0E-7 1.0E-6 1.0E-5 1.0E-4 1.0E-3 1.0E-2
0.0E+0
1.0E-5
2.0E-5
3.0E-5
4.0E-5
5.0E-5
Time, seconds
O atom mole fraction
Air
Air-ethylene, =0.5
J. Uddi et al. 2009
Atomic O production
O (3P)
W. Sun et. Al. 2010
O atom measurements by using TALIF
O atom formation in a plasma discharge of air and air-C2H4 mixture in a flow reactor
O atom formation in a ns plasmadischarge of methane/aircounterflow flames
Extension of extinction limit byplasma discharge
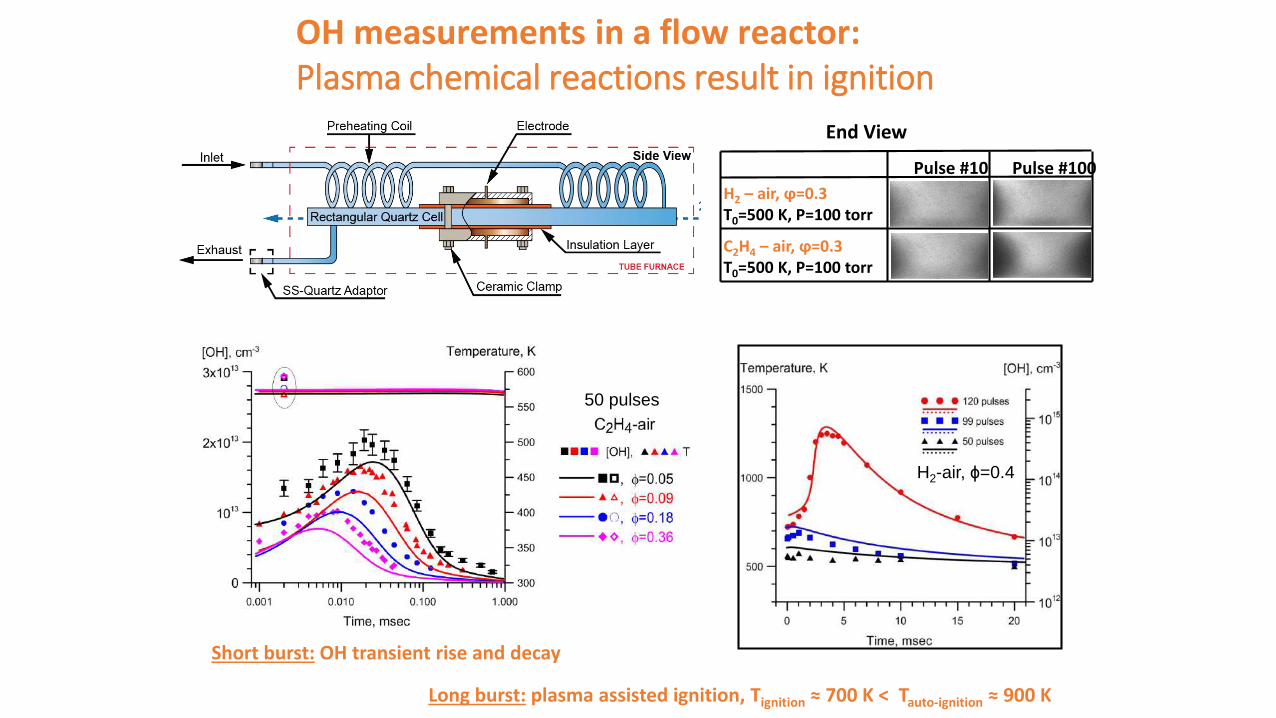
OH measurements in a flow reactor:Plasma chemical reactions result in ignition
H2 – air, ϕ=0.3T0=500 K, P=100 torr
C2H4 – air, ϕ=0.3T0=500 K, P=100 torr
Pulse #10 Pulse #100
End View
Long burst: plasma assisted ignition, Tignition ≈ 700 K < Tauto-ignition ≈ 900 K
H2-air, ϕ=0.4
50 pulses
Short burst: OH transient rise and decay
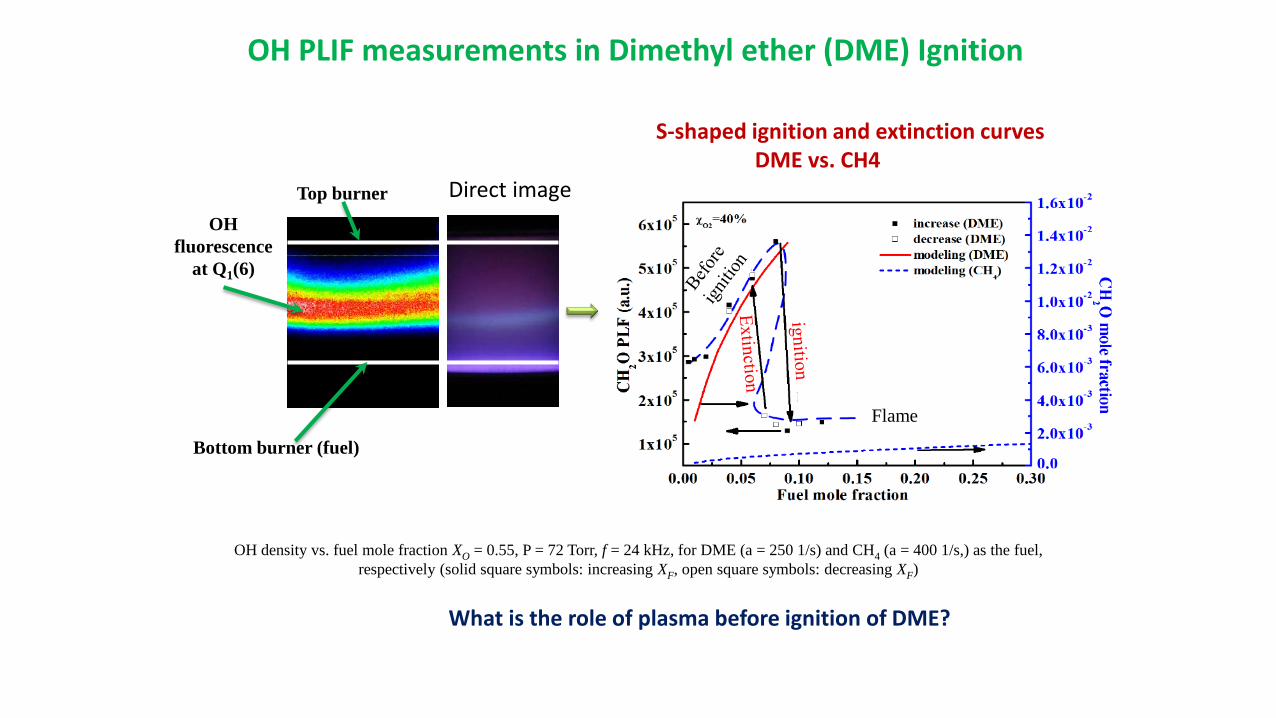
Top burner
Bottom burner (fuel)
OH
fluorescence
at Q1(6)
Direct image
OH PLIF measurements in Dimethyl ether (DME) Ignition
OH density vs. fuel mole fraction XO = 0.55, P = 72 Torr, f = 24 kHz, for DME (a = 250 1/s) and CH4 (a = 400 1/s,) as the fuel,
respectively (solid square symbols: increasing XF, open square symbols: decreasing XF)
What is the role of plasma before ignition of DME?
Flame
S-shaped ignition and extinction curvesDME vs. CH4
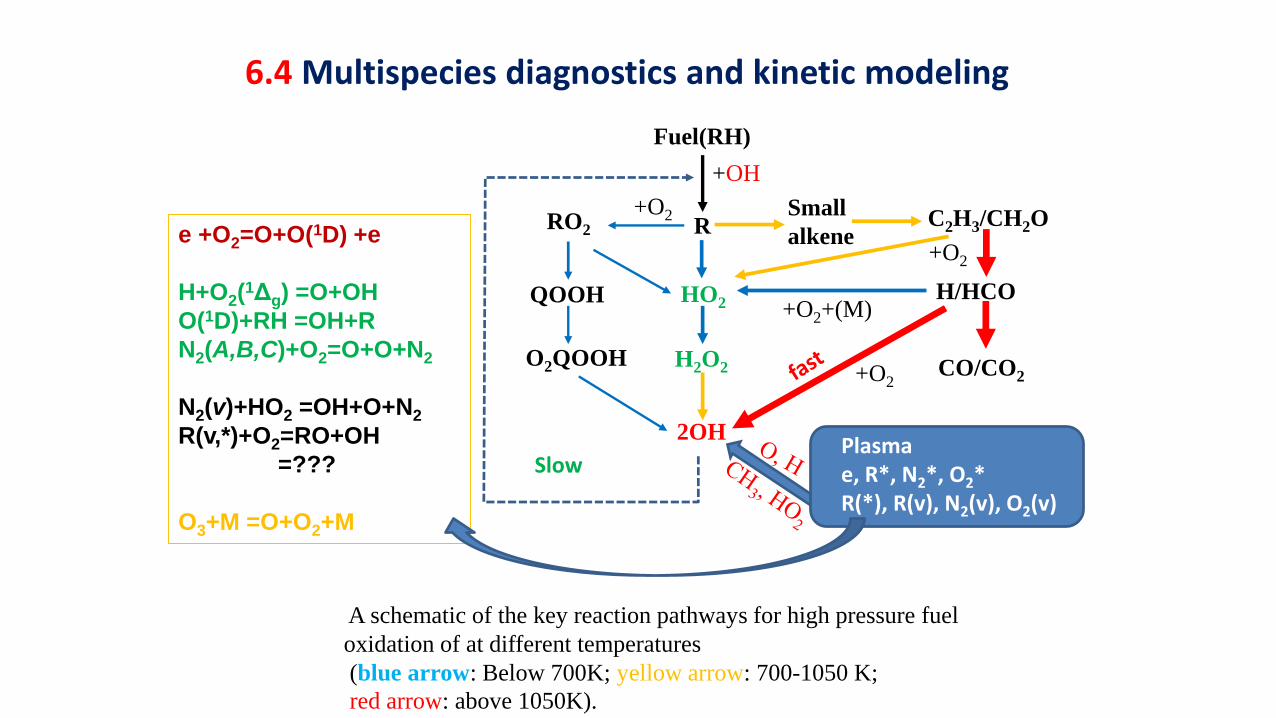
A schematic of the key reaction pathways for high pressure fuel
oxidation of at different temperatures
(blue arrow: Below 700K; yellow arrow: 700-1050 K;
red arrow: above 1050K).
Fuel(RH)
+OH
R+O2RO2
QOOH
O2QOOH
HO2
H2O2
2OH
Small
alkeneC2H3/CH2O
H/HCO+O2+(M)
Plasmae, R*, N2*, O2*R(*), R(v), N2(v), O2(v)
+O2
+O2
CO/CO2
e +O2=O+O(1D) +e
H+O2(1Δg) =O+OH
O(1D)+RH =OH+R
N2(A,B,C)+O2=O+O+N2
N2(v)+HO2 =OH+O+N2
R(v,*)+O2=RO+OH
=???
O3+M =O+O2+M
Slow
6.4 Multispecies diagnostics and kinetic modeling
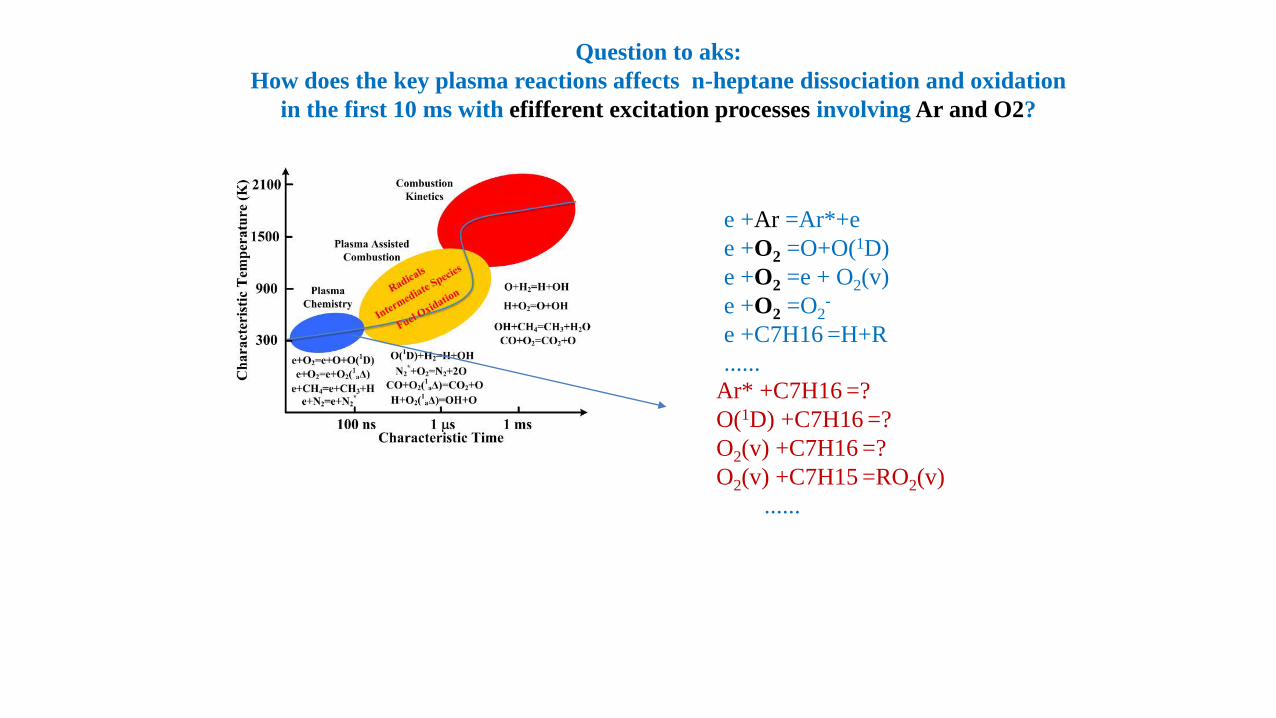
e +Ar =Ar*+e
e +O2 =O+O(1D)
e +O2 =e + O2(v)
e +O2 =O2-
e +C7H16 =H+R
......
Question to aks:
How does the key plasma reactions affects n-heptane dissociation and oxidation
in the first 10 ms with efifferent excitation processes involving Ar and O2?
Ar* +C7H16 =?
O(1D) +C7H16 =?
O2(v) +C7H16 =?
O2(v) +C7H15 =RO2(v)
......
42
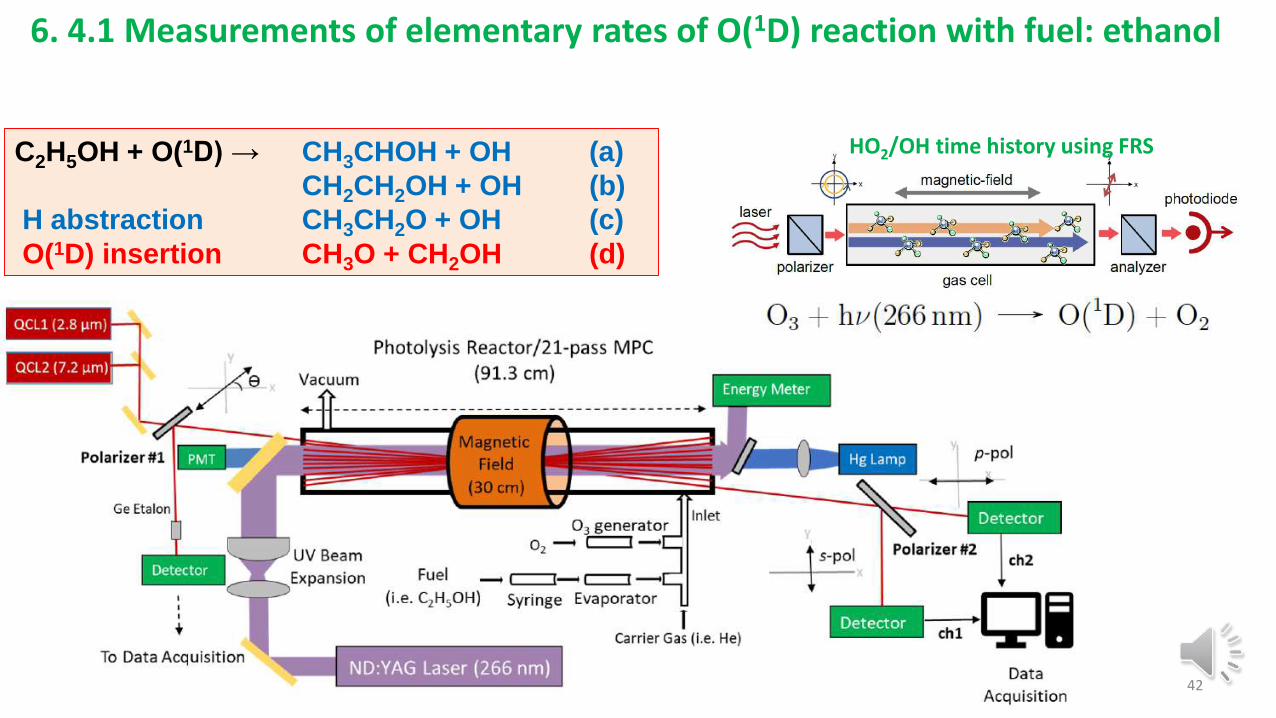
6. 4.1 Measurements of elementary rates of O(1D) reaction with fuel: ethanol
C2H5OH + O(1D) → CH3CHOH + OH (a)
CH2CH2OH + OH (b)
H abstraction CH3CH2O + OH (c)
O(1D) insertion CH3O + CH2OH (d)
HO2/OH time history using FRS
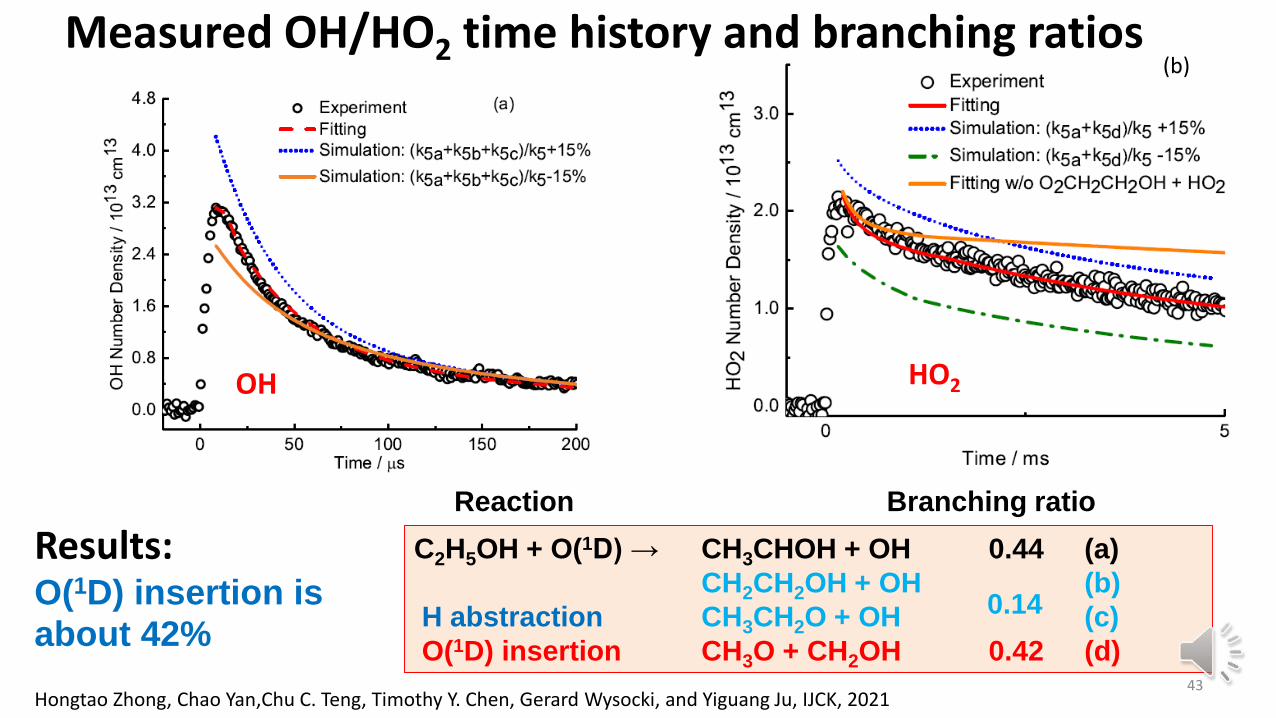
43
C2H5OH + O(1D) → CH3CHOH + OH 0.44 (a)
CH2CH2OH + OH (b)
H abstraction CH3CH2O + OH (c)
O(1D) insertion CH3O + CH2OH 0.42 (d)
0.14
Reaction Branching ratio
(b)Measured OH/HO2 time history and branching ratios
Hongtao Zhong, Chao Yan,Chu C. Teng, Timothy Y. Chen, Gerard Wysocki, and Yiguang Ju, IJCK, 2021
Results:O(1D) insertion is about 42%
OH HO2
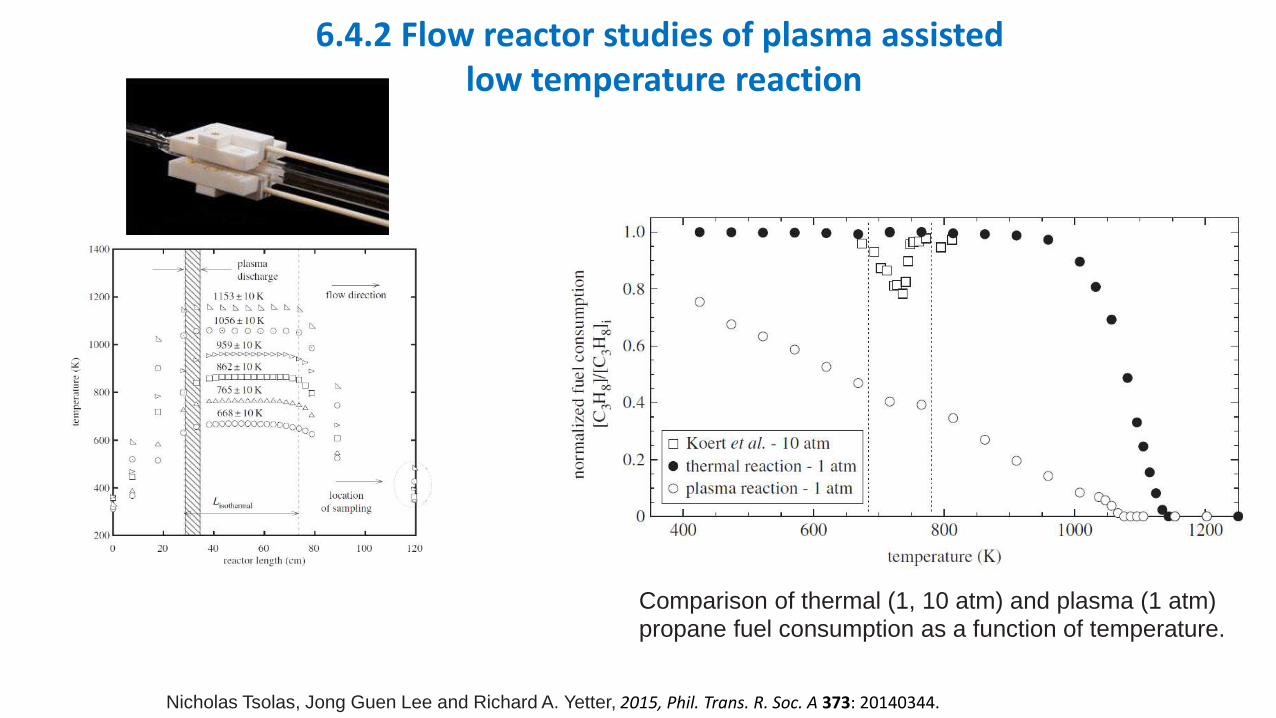
Comparison of thermal (1, 10 atm) and plasma (1 atm)
propane fuel consumption as a function of temperature.
Nicholas Tsolas, Jong Guen Lee and Richard A. Yetter, 2015, Phil. Trans. R. Soc. A 373: 20140344.
6.4.2 Flow reactor studies of plasma assistedlow temperature reaction
45
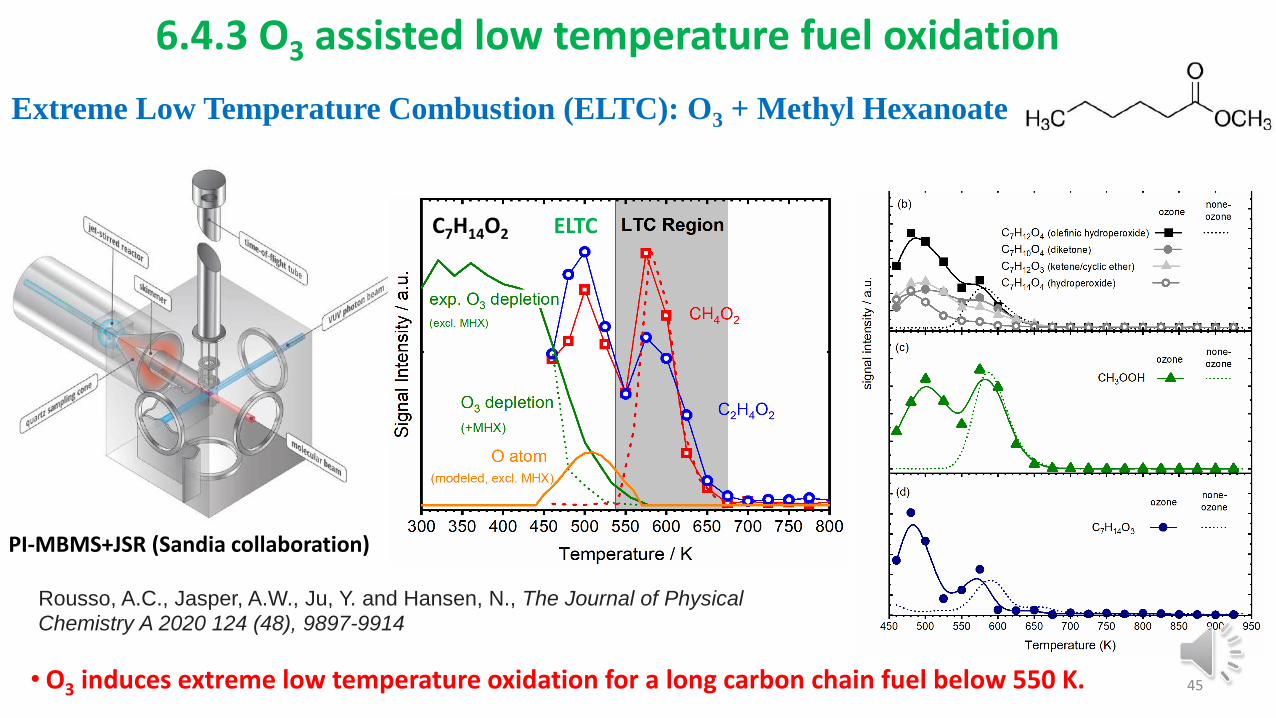
6.4.3 O3 assisted low temperature fuel oxidation
Extreme Low Temperature Combustion (ELTC): O3 + Methyl Hexanoate
PI-MBMS+JSR (Sandia collaboration)
ELTCC7H14O2
•O3 induces extreme low temperature oxidation for a long carbon chain fuel below 550 K.
Rousso, A.C., Jasper, A.W., Ju, Y. and Hansen, N., The Journal of Physical
Chemistry A 2020 124 (48), 9897-9914
46
400 600 800 1000-0.002
-0.001
0.000
0.001
0.002
0.003
0 ppm
300 ppm
LLNL/NOx
Fu
el
mo
le f
rac
tio
n
Temperature [K]
nC12
H26
= 1.3
Exp.
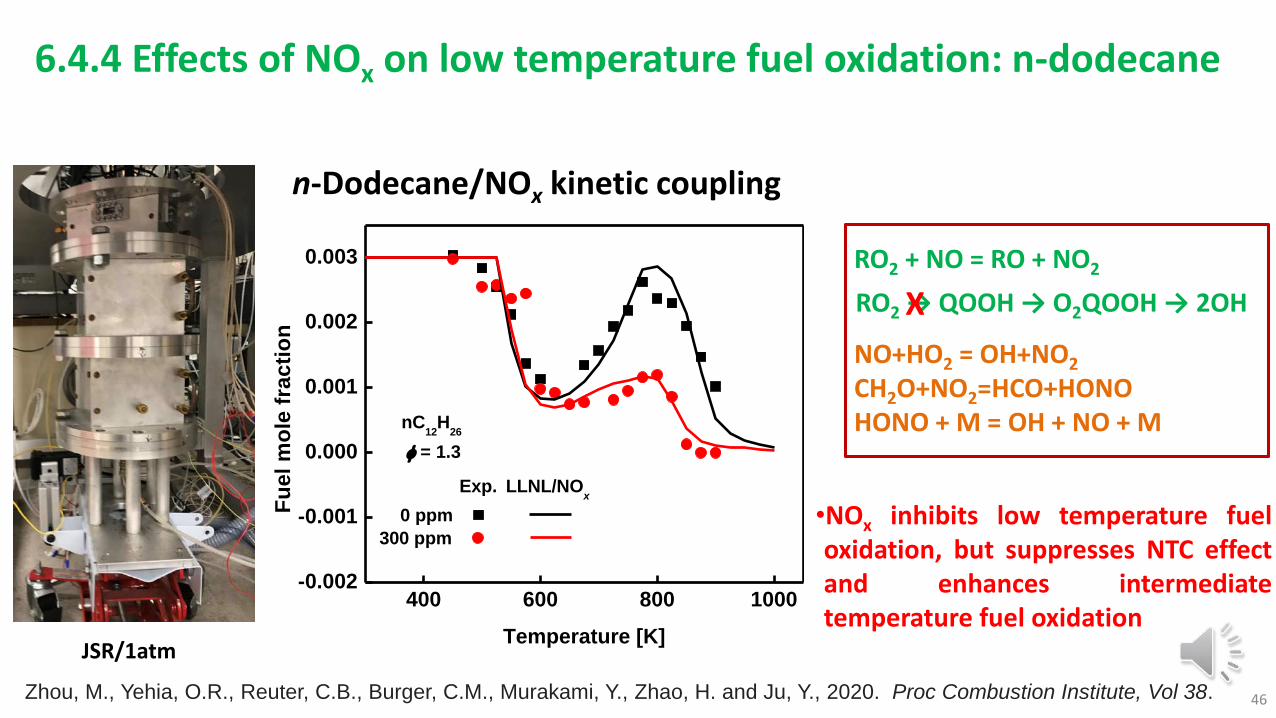
n-Dodecane/NOx kinetic coupling
RO2 + NO = RO + NO2
RO2 → QOOH → O2QOOH → 2OHX
NO+HO2 = OH+NO2
CH2O+NO2=HCO+HONOHONO + M = OH + NO + M
6.4.4 Effects of NOx on low temperature fuel oxidation: n-dodecane
JSR/1atm
Zhou, M., Yehia, O.R., Reuter, C.B., Burger, C.M., Murakami, Y., Zhao, H. and Ju, Y., 2020. Proc Combustion Institute, Vol 38.
•NOx inhibits low temperature fueloxidation, but suppresses NTC effectand enhances intermediatetemperature fuel oxidation
Ge Etalon
Reactor
Collimating
Lenses
Mirror
Flip Mirror
Quartz
Wall
Macor
Wall
Vacuum
Chamber
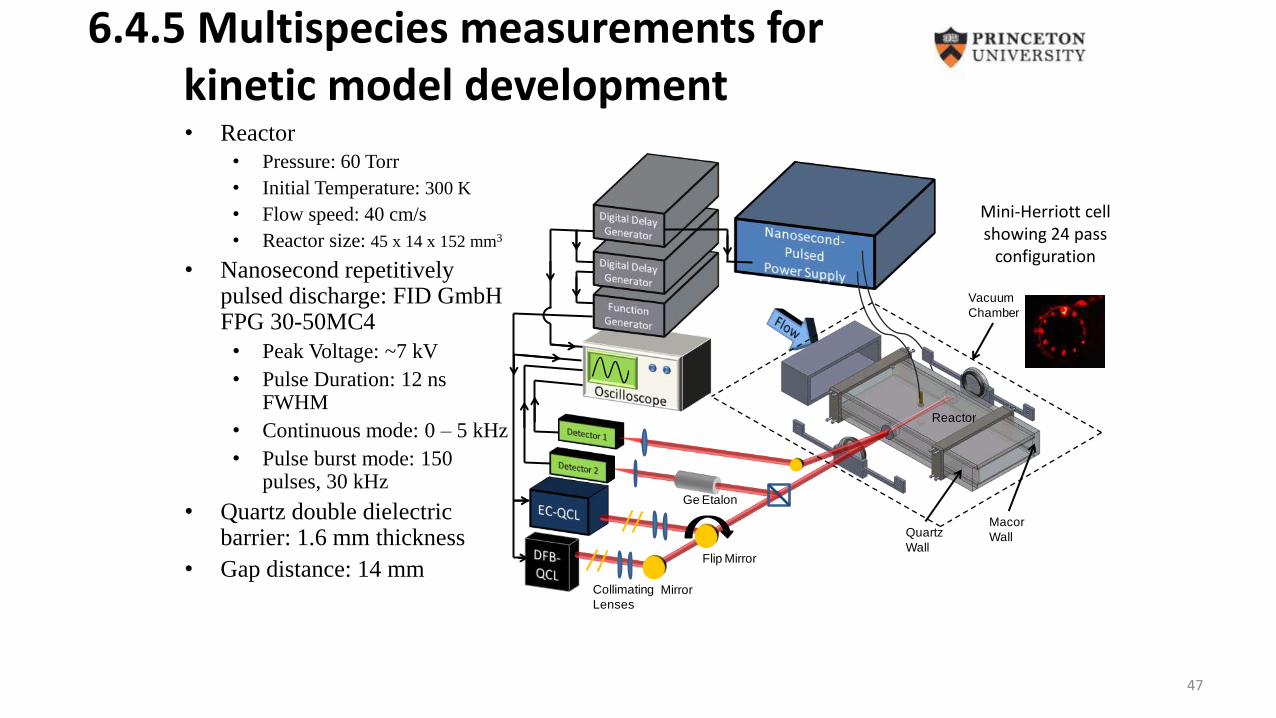
6.4.5 Multispecies measurements for kinetic model development
47
• Reactor
• Pressure: 60 Torr
• Initial Temperature: 300 K
• Flow speed: 40 cm/s
• Reactor size: 45 x 14 x 152 mm3
• Nanosecond repetitively pulsed discharge: FID GmbH FPG 30-50MC4
• Peak Voltage: ~7 kV
• Pulse Duration: 12 ns FWHM
• Continuous mode: 0 – 5 kHz
• Pulse burst mode: 150 pulses, 30 kHz
• Quartz double dielectric barrier: 1.6 mm thickness
• Gap distance: 14 mm
Mini-Herriott cell showing 24 pass
configuration
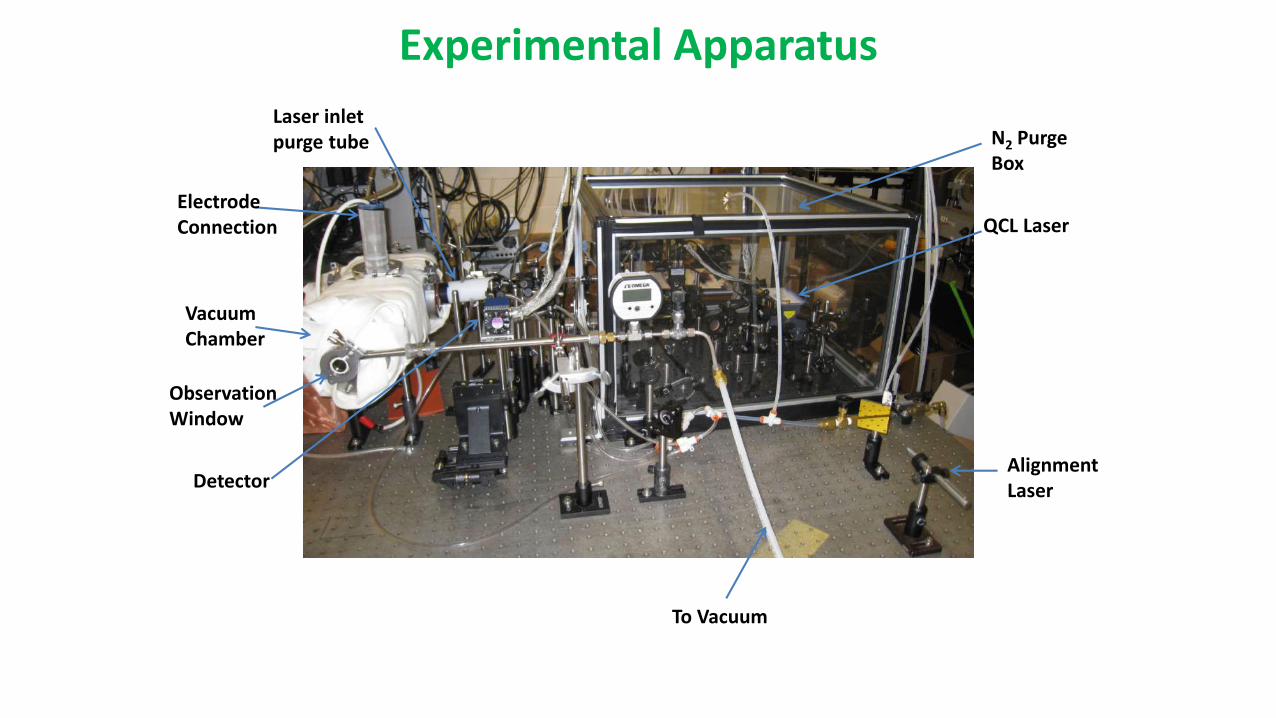
Experimental Apparatus
Vacuum Chamber
Detector
Electrode Connection
Alignment Laser
QCL Laser
N2 Purge Box
Laser inlet purge tube
To Vacuum
Observation Window
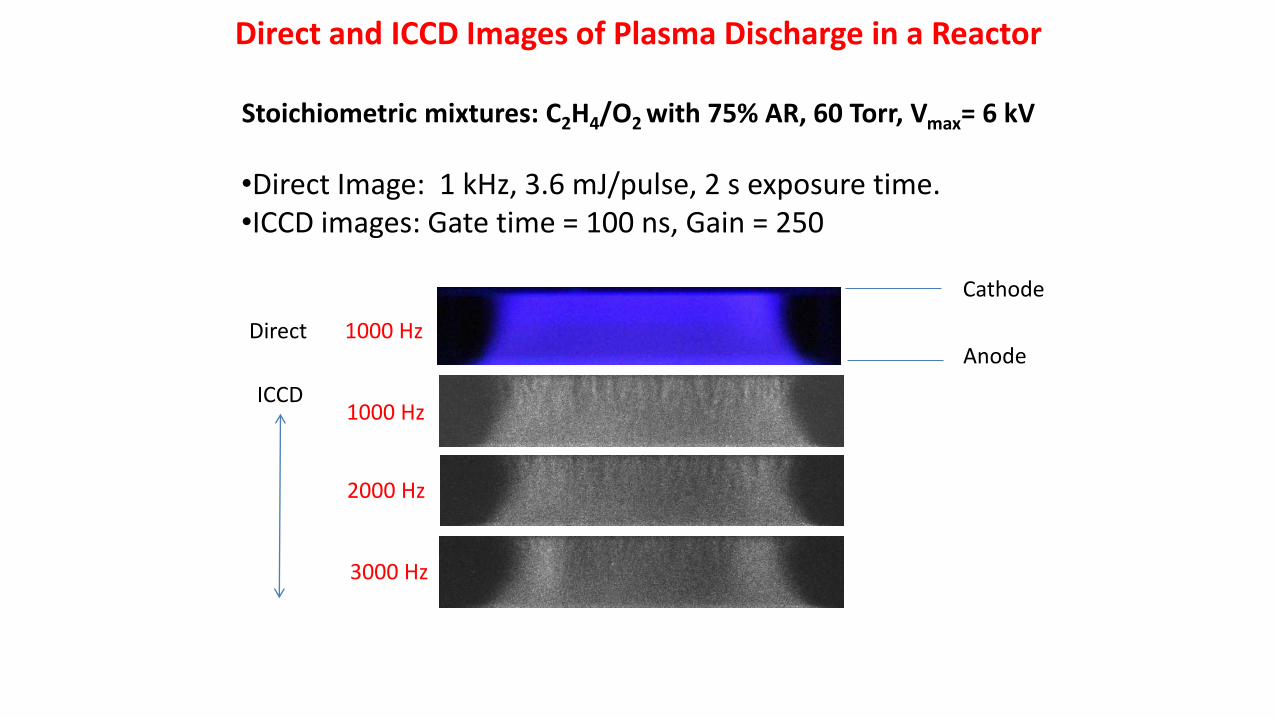
Direct and ICCD Images of Plasma Discharge in a Reactor
Stoichiometric mixtures: C2H4/O2 with 75% AR, 60 Torr, Vmax= 6 kV
•Direct Image: 1 kHz, 3.6 mJ/pulse, 2 s exposure time.•ICCD images: Gate time = 100 ns, Gain = 250
1000 Hz
2000 Hz
3000 Hz
1000 HzDirect
ICCD
Cathode
Anode
2021 AIAA SciTech Forum50
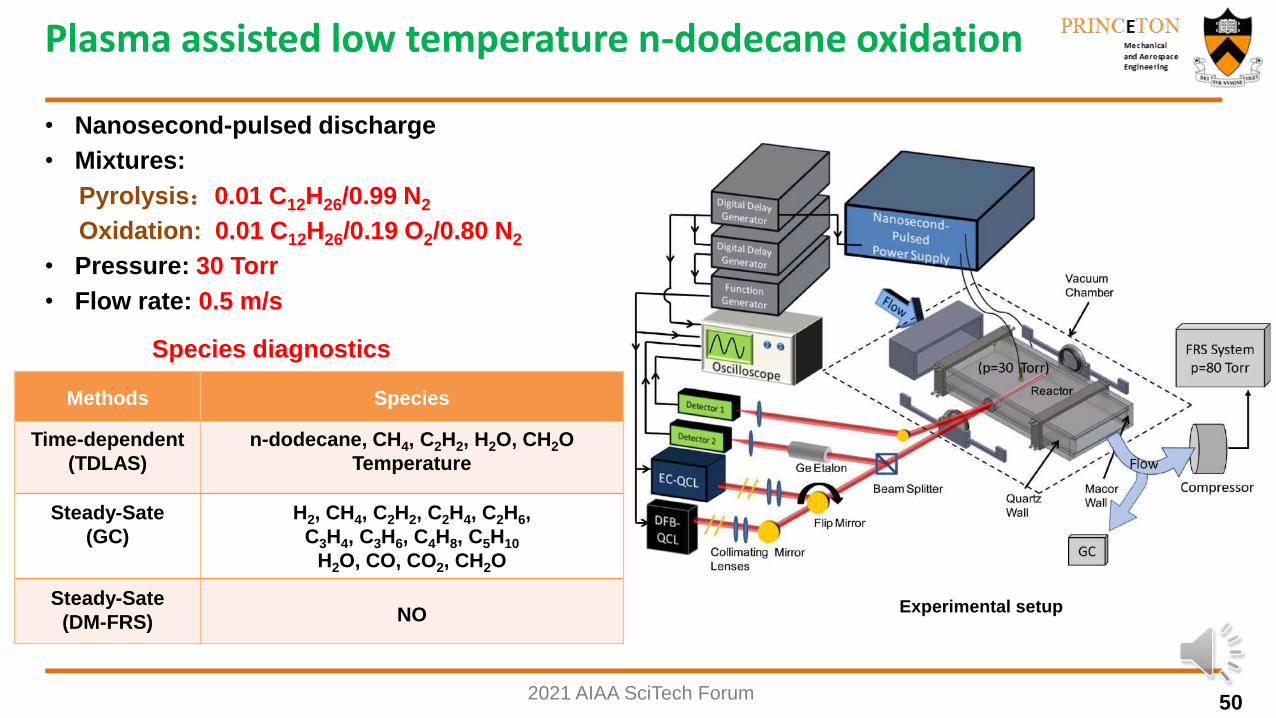
• Nanosecond-pulsed discharge
• Mixtures:
Pyrolysis:0.01 C12H26/0.99 N2
Oxidation: 0.01 C12H26/0.19 O2/0.80 N2
• Pressure: 30 Torr
• Flow rate: 0.5 m/s
Methods Species
Time-dependent
(TDLAS)
n-dodecane, CH4, C2H2, H2O, CH2O
Temperature
Steady-Sate
(GC)
H2, CH4, C2H2, C2H4, C2H6,
C3H4, C3H6, C4H8, C5H10
H2O, CO, CO2, CH2O
Steady-Sate
(DM-FRS) NO Experimental setup
Plasma assisted low temperature n-dodecane oxidation
Species diagnostics
2021 AIAA SciTech Forum51
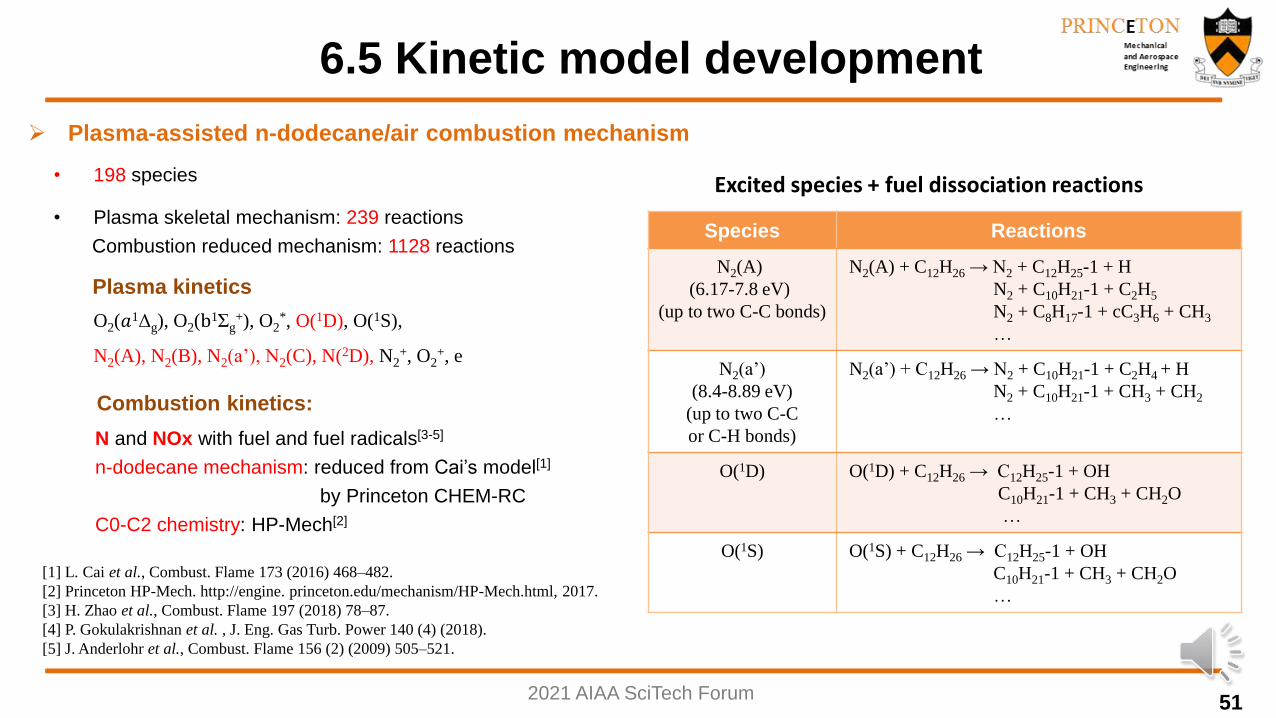
6.5 Kinetic model development
Plasma-assisted n-dodecane/air combustion mechanism
N and NOx with fuel and fuel radicals[3-5]
n-dodecane mechanism: reduced from Cai’s model[1]
by Princeton CHEM-RC
C0-C2 chemistry: HP-Mech[2]
[1] L. Cai et al., Combust. Flame 173 (2016) 468–482.
[2] Princeton HP-Mech. http://engine. princeton.edu/mechanism/HP-Mech.html, 2017.
[3] H. Zhao et al., Combust. Flame 197 (2018) 78–87.
[4] P. Gokulakrishnan et al. , J. Eng. Gas Turb. Power 140 (4) (2018).
[5] J. Anderlohr et al., Combust. Flame 156 (2) (2009) 505–521.
Plasma kinetics
O2(𝑎1Δg), O2(b
1Σg+), O2
*, O(1D), O(1S),
N2(A), N2(B), N2(a’), N2(C), N(2D), N2+, O2
+, e
• 198 species
• Plasma skeletal mechanism: 239 reactions
Combustion reduced mechanism: 1128 reactions
Combustion kinetics:
Species Reactions
N2(A)
(6.17-7.8 eV)
(up to two C-C bonds)
N2(A) + C12H26 → N2 + C12H25-1 + H
N2 + C10H21-1 + C2H5
N2 + C8H17-1 + cC3H6 + CH3
…
N2(a’)
(8.4-8.89 eV)
(up to two C-C
or C-H bonds)
N2(a’) + C12H26 → N2 + C10H21-1 + C2H4 + H
N2 + C10H21-1 + CH3 + CH2
…
O(1D) O(1D) + C12H26 → C12H25-1 + OH
C10H21-1 + CH3 + CH2O
…
O(1S) O(1S) + C12H26 → C12H25-1 + OH
C10H21-1 + CH3 + CH2O
…
Excited species + fuel dissociation reactions
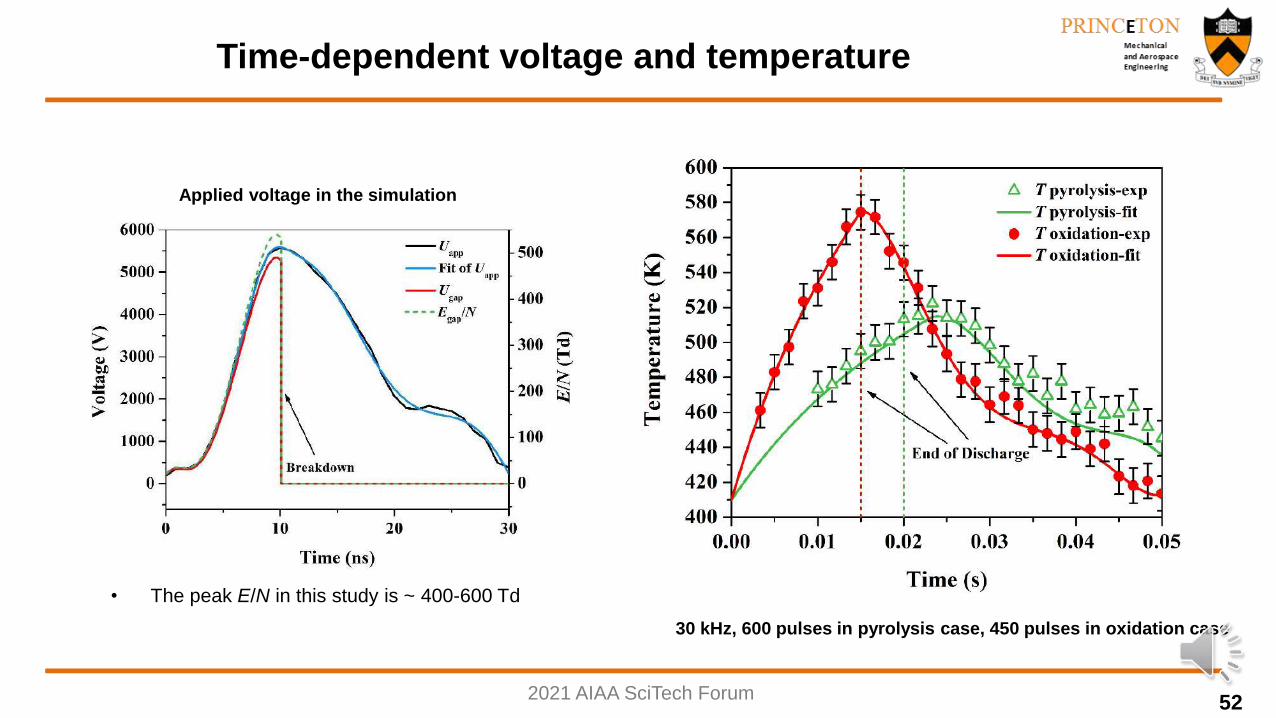
2021 AIAA SciTech Forum52
Time-dependent voltage and temperature
30 kHz, 600 pulses in pyrolysis case, 450 pulses in oxidation case
• The peak E/N in this study is ~ 400-600 Td
Applied voltage in the simulation

2021 AIAA SciTech Forum53
Plasma effect on NO formation
NO production in 0.80 N2/0.20 O2 and 0.01 C12H26/0.19 O2/0.80 N2
• NO increases with frequencies in N2/O2
• NO decreases dramatically with 1% n-dodecane.
• RO2 + NO = RO + NO2
• NO pathways in N2/O2
N + O2 = NO + O
N(2D) + O2 → NO + O/O(1D)
NO2 + O = O2 + NO
• Strong NOx/fuel kinetic coupling in PAC
Ammonia/air flames with and without
plasma: NOx emissions without and
with plasma ( φ= 0.94)
W. Sun et al,, Combustion and Flame 228 (2021) 430–432
X. Mao et al., Proc. Combut. Inst. 38, 2021
2021 AIAA SciTech Forum54
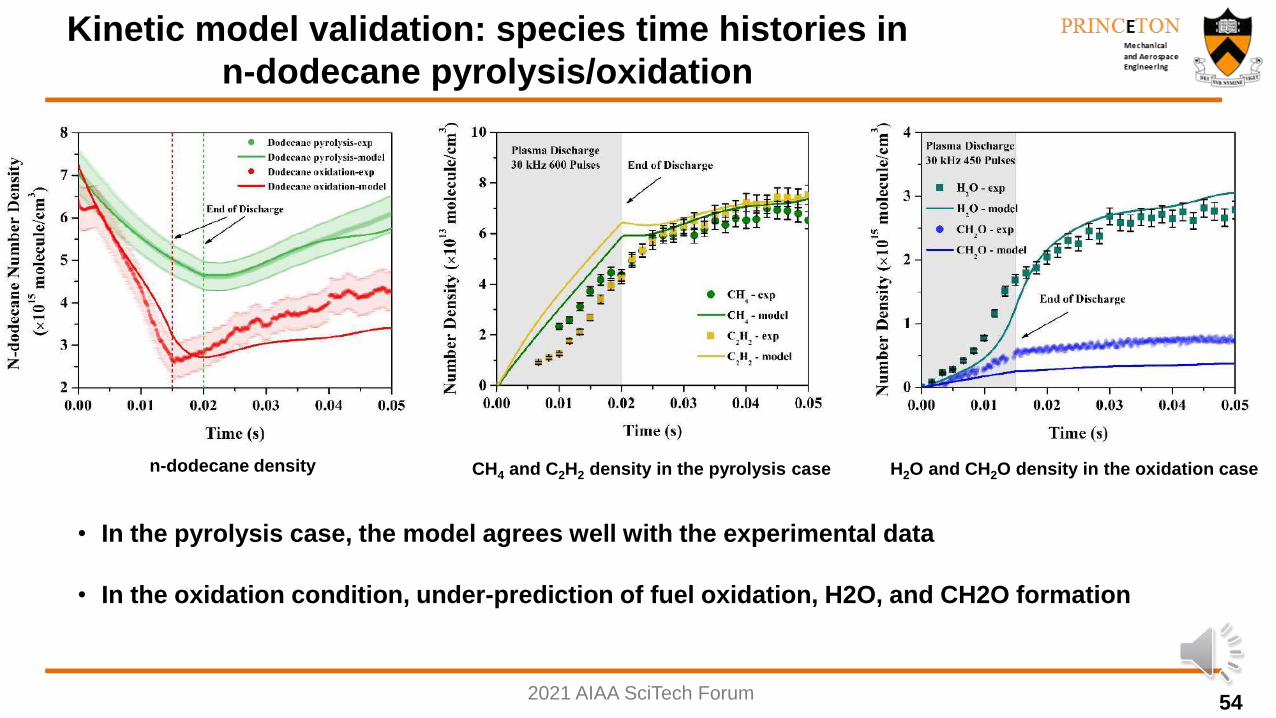
• In the oxidation condition, under-prediction of fuel oxidation, H2O, and CH2O formation
n-dodecane density CH4 and C2H2 density in the pyrolysis case H2O and CH2O density in the oxidation case
Kinetic model validation: species time histories in
n-dodecane pyrolysis/oxidation
• In the pyrolysis case, the model agrees well with the experimental data
2021 AIAA SciTech Forum55
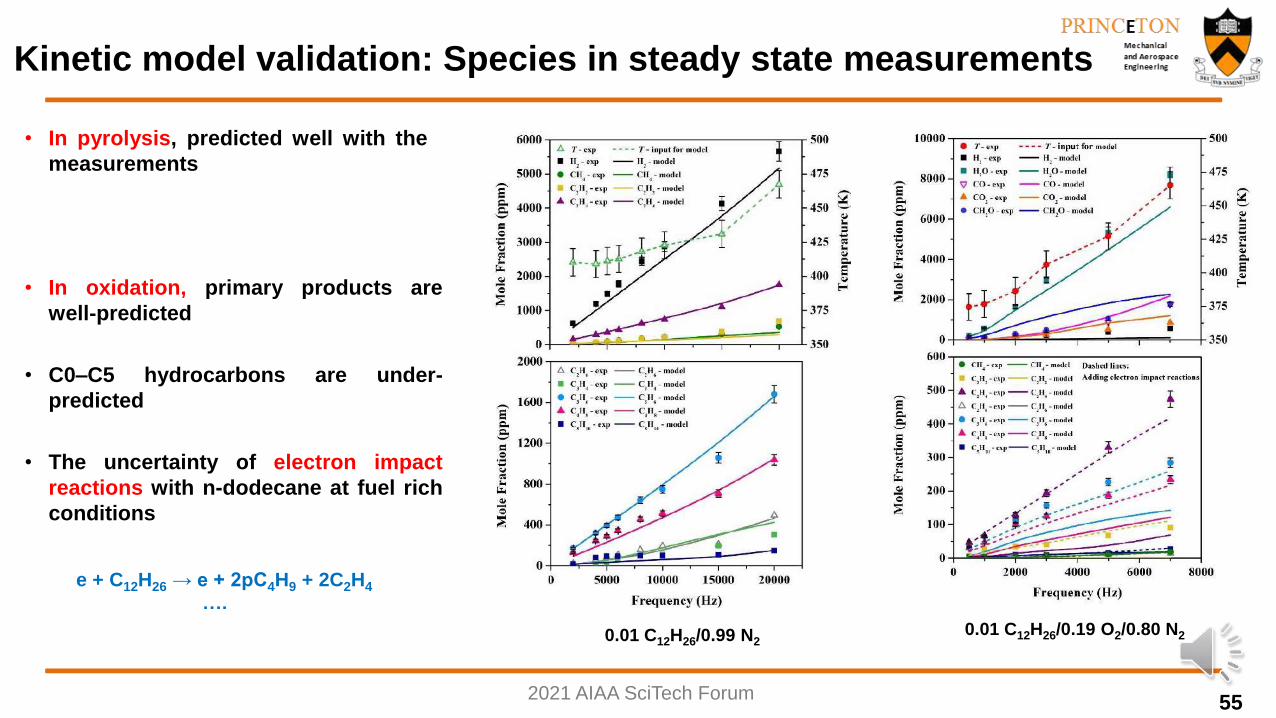
Kinetic model validation: Species in steady state measurements
• In oxidation, primary products are
well-predicted
• C0–C5 hydrocarbons are under-
predicted
• The uncertainty of electron impact
reactions with n-dodecane at fuel rich
conditions
e + C12H26 → e + 2pC4H9 + 2C2H4
….
0.01 C12H26/0.99 N20.01 C12H26/0.19 O2/0.80 N2
• In pyrolysis, predicted well with the
measurements
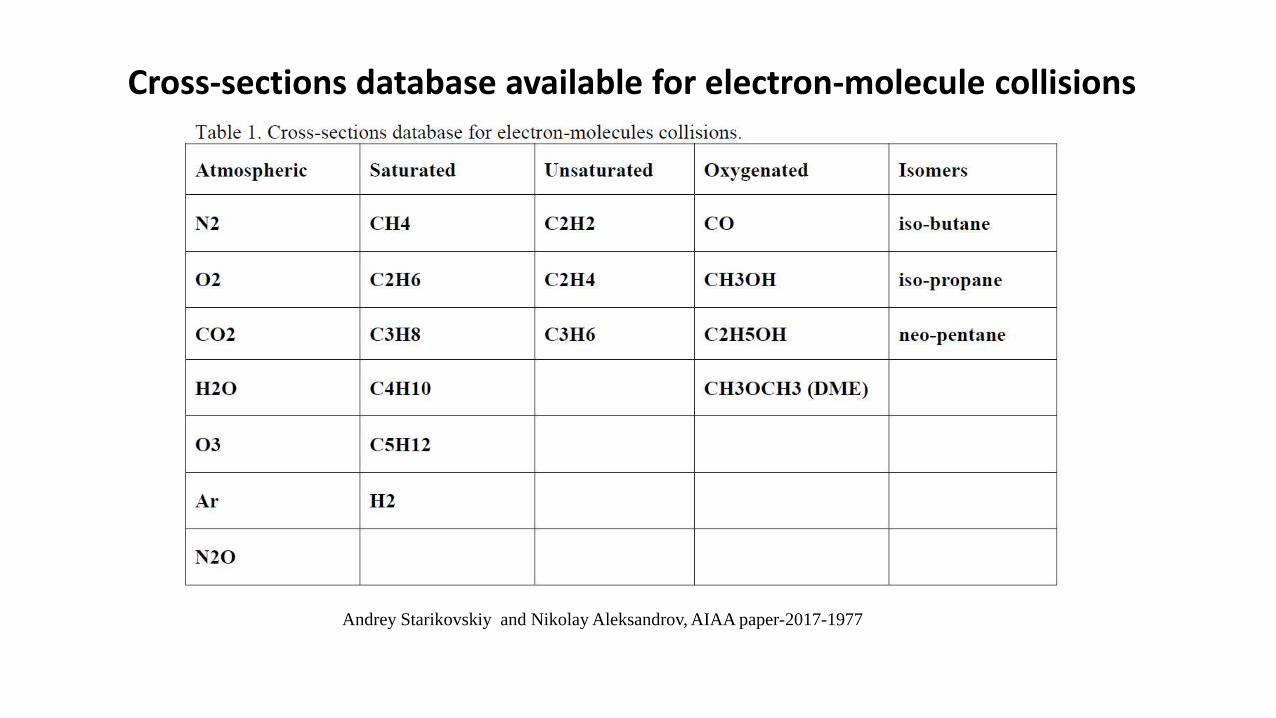
Andrey Starikovskiy and Nikolay Aleksandrov, AIAA paper-2017-1977
Cross-sections database available for electron-molecule collisions
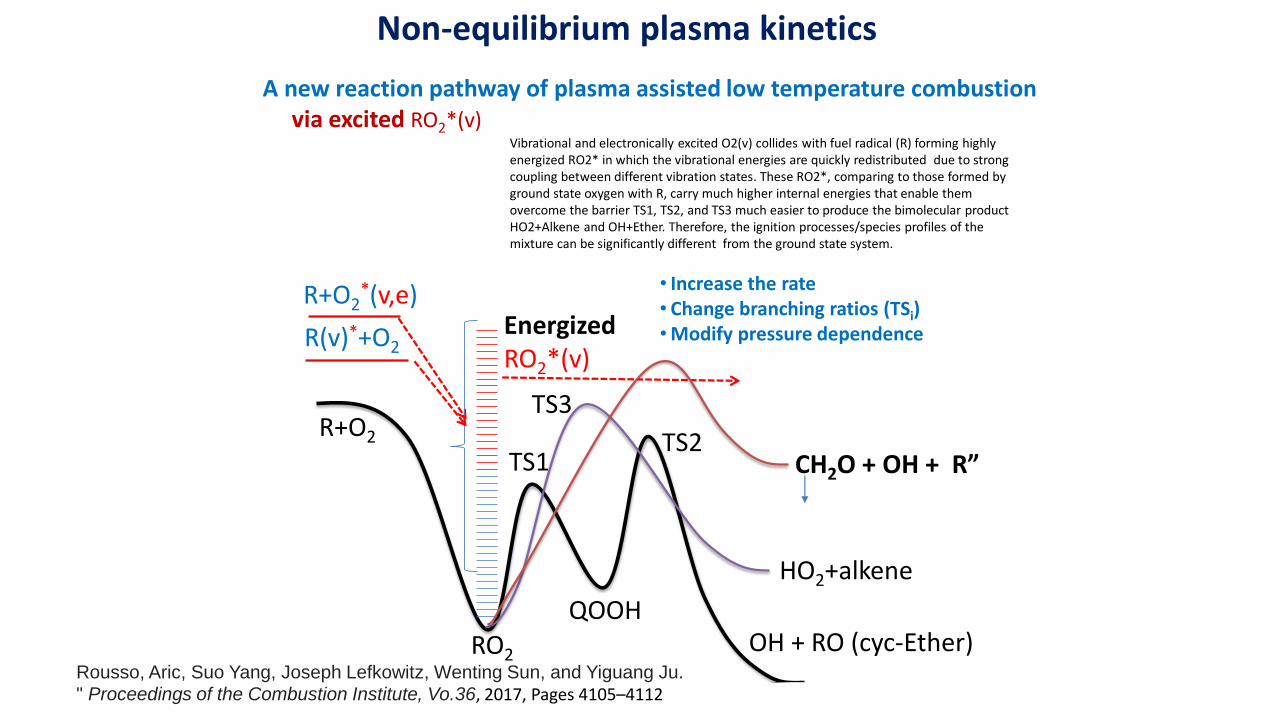
A new reaction pathway of plasma assisted low temperature combustionvia excited RO2*(v)
Vibrational and electronically excited O2(v) collides with fuel radical (R) forming highly energized RO2* in which the vibrational energies are quickly redistributed due to strong coupling between different vibration states. These RO2*, comparing to those formed by ground state oxygen with R, carry much higher internal energies that enable them overcome the barrier TS1, TS2, and TS3 much easier to produce the bimolecular product HO2+Alkene and OH+Ether. Therefore, the ignition processes/species profiles of the mixture can be significantly different from the ground state system.
R+O2
RO2OH + RO (cyc-Ether)
HO2+alkene
TS1
QOOH
TS2
TS3
R+O2*(v,e)
EnergizedRO2*(v)
• Increase the rate• Change branching ratios (TSi)•Modify pressure dependenceR(v)*+O2
CH2O + OH + R”
Non-equilibrium plasma kinetics
Rousso, Aric, Suo Yang, Joseph Lefkowitz, Wenting Sun, and Yiguang Ju. " Proceedings of the Combustion Institute, Vo.36, 2017, Pages 4105–4112
• Time-resolved, spatially-resolved, in-situ laser diagnostics of electric field, electron density, and electron temperature, excited and radical species greatly enhanced the understanding of plasma kinetic and chemical process in PAC.
• Production of O and O(1D), O2(singlet), N2(*), and N2(v) by the plasma is the major processes in kinetically enhancement of combustion.
• Fast and slow heating in PAC is important, but the energy transfer processes are very complicated.
• Plasma activated low temperature combustion pathways and enable cool flame formation, but existing mechanisms have large uncertainties, especially for large hydrocarbons.
• Electron impact reaction cross-sections of large alkanes and reaction rates involving O(1D) and non-equilibrium excitations are poorly known.
• The effect of vibrational species excitation on PAC is still poorly known.
Summary


